Embed Size (px)
Citation preview
University of Tennessee, Knoxville University of Tennessee, Knoxville
TRACE: Tennessee Research and Creative TRACE: Tennessee Research and Creative
Exchange Exchange
Masters Theses Graduate School
8-2018
Computational Fluid Dynamic Modeling of Catalytic Hydrous Computational Fluid Dynamic Modeling of Catalytic Hydrous
Pyrolysis of Biomass to Produce Refinery-Ready Bio-Crude Oil Pyrolysis of Biomass to Produce Refinery-Ready Bio-Crude Oil
Ross Wesley Houston University of Tennessee, [email protected]
Follow this and additional works at: https://trace.tennessee.edu/utk_gradthes
Recommended Citation Recommended Citation Houston, Ross Wesley, "Computational Fluid Dynamic Modeling of Catalytic Hydrous Pyrolysis of Biomass to Produce Refinery-Ready Bio-Crude Oil. " Master's Thesis, University of Tennessee, 2018. https://trace.tennessee.edu/utk_gradthes/5122
This Thesis is brought to you for free and open access by the Graduate School at TRACE: Tennessee Research and Creative Exchange. It has been accepted for inclusion in Masters Theses by an authorized administrator of TRACE: Tennessee Research and Creative Exchange. For more information, please contact [email protected].
To the Graduate Council:
I am submitting herewith a thesis written by Ross Wesley Houston entitled "Computational Fluid
Dynamic Modeling of Catalytic Hydrous Pyrolysis of Biomass to Produce Refinery-Ready Bio-
Crude Oil." I have examined the final electronic copy of this thesis for form and content and
recommend that it be accepted in partial fulfillment of the requirements for the degree of
Master of Science, with a major in Biosystems Engineering.
Nourredine H. Abdoulmoumine, Major Professor
We have read this thesis and recommend its acceptance:
Douglas G. Hayes, Nicole Labbe
Accepted for the Council:
Dixie L. Thompson
Vice Provost and Dean of the Graduate School
(Original signatures are on file with official student records.)
Computational Fluid Dynamic Modeling of Catalytic
Hydrous Pyrolysis of Biomass to Produce Refinery-Ready
Bio-Crude Oil
A Thesis Presented for the
Master of Science
Degree
The University of Tennessee, Knoxville
Ross Wesley Houston
August 2018

ii
Copyright © 2018 by Ross Wesley Houston
All rights reserved
iii
ACKNOWLEDGMENTS
I would like to thank my advisors Dr. Nourredine Abdoulmoumine and Dr. Nicole Labbé
for everything they have done to help me as I pursued my Master’s degree. Thank you to Dr.
Robert Burns, Dr. Neal Schrick, and Dr. Caula Beyl for encouraging me to pursue graduate school
and, in turn, helping start this journey. Thank you to the members of my research group with
special thanks to Oluwafemi Oyedeji for his continued support in the modeling aspect of my
project. Thank you also to Dr. Stuart Daw and his research group at the National Transportation
Research Center at ORNL for their collaboration with our group.
I also want to thank the United States Department of Agriculture (USDA) Agriculture and
Food Research Initiative for providing the funding for this research.
iv
ABSTRACT
The growing world population continually increases the demand for energy. Currently, the
main source of energy production is fossil fuels, which are harmful to the environment and are
finite. An exploration of renewable energy to supplement or replace fossil fuels is of great
importance. Modern techniques for producing renewable bio-oil consist of converting biomass
into bio-oil through pyrolysis, but unfortunately, pyrolysis oil has quality issues (e.g., high oxygen
content, viscosity, chemical instability). Therefore, upgrading is necessary to improve quality.
Hydropyrolysis is a state of the art technique to deoxygenate bio-oil during pyrolysis to produce
petroleum quality bio-oil. A major issue with hydropyrolysis is the expensive cost of hydrogen.
This project aimed to computationally model the hydrous pyrolysis of biomass coupled
with an in-situ hydrogen generation process. The kinetics of the water-gas shift (WGS) were
determined experimentally and modeled using an ordinary differential equation subroutine
coupled with a nonlinear regression. A computational fluid dynamic (CFD) model of biomass fast
pyrolysis was developed to simulate conventional fast pyrolysis. The final part of this project
adapted the CFD model to simulate hydrous pyrolysis and incorporate the determined WGS
kinetics. The bio-oil was deoxygenated via a global lumped hydrodeoxygenation (HDO) kinetic
scheme.
This WGS was determined to have an agreement with both an empirical power law and a
Langmuir-Hinselwood mechanism at conditions similar to that of pyrolysis. The CO conversion
reached a maximum value of 94% at higher temps and larger amounts of catalyst. The CFD model
of fast pyrolysis predicted a maximum bio-oil yield of 47%, but significantly under-predicted the
amount of water present in the oil. The hydrous pyrolysis simulations have not yet reached steady-
state and the HDO reactions are just beginning to take place. Further work is needed to explore

v
more detailed kinetic schemes for the secondary pyrolysis reactions as well as the
hydrodeoxygenation kinetics.
vi
TABLE OF CONTENTS
INTRODUCTION .......................................................................................................................... 1
Background ................................................................................................................................. 1
Problem statement ....................................................................................................................... 2
Research proposal and objectives ............................................................................................... 3
List of references......................................................................................................................... 5
CHAPTER 1 LITERATURE REVIEW ......................................................................................... 7
1.1. Introduction .......................................................................................................................... 7
1.2. Biomass fast pyrolysis ......................................................................................................... 8
1.3. Pyrolysis upgrading ............................................................................................................. 9
1.3.1. Zeolite cracking .......................................................................................................... 11
1.3.2. Hydrodeoxygenation ................................................................................................... 12
1.3.3. Hydropyrolysis ............................................................................................................ 13
1.3.3.1. Water-gas shift as a hydrogen source .................................................................. 15
1.4. Computational modeling of pyrolysis ................................................................................ 16
1.4.1. Eulerian-Eulerian ........................................................................................................ 17
1.4.2. Eulerian-Lagrangian ................................................................................................... 25
1.5. Computational modeling of upgrading processes .............................................................. 28
1.6. Conclusions ........................................................................................................................ 31
List of references....................................................................................................................... 32
CHAPTER 2 INTERMEDIATE TEMPERATURE WATER-GAS SHIFT KINETICS FOR
HYDROGEN PRODUCTION ..................................................................................................... 41
Abstract ..................................................................................................................................... 42
2.1. Introduction ........................................................................................................................ 43
2.2. Materials and experimental methodology .......................................................................... 45
2.2.1. Catalyst preparation and characterization ................................................................... 45
2.2.2. WGS experiments ....................................................................................................... 46
2.3. Kinetic analysis and modeling ........................................................................................... 49
2.3.1. Kinetic data analysis ................................................................................................... 49
2.3.2. Thermodynamic analysis ............................................................................................ 50
2.3.3. Kinetic models ............................................................................................................ 51
2.3.3.1. Langmuir-Hinshelwood mechanism and model .................................................. 51
2.3.3.2. Redox mechanism and model .............................................................................. 53
2.3.3.3. Reduced order model ........................................................................................... 54
2.3.4. Parameter estimation and model discrimination ......................................................... 54
vii
2.4. Results ................................................................................................................................ 56
2.4.1. Catalyst characterization ............................................................................................. 56
2.4.2. Mass transfer and diffusion limitations....................................................................... 58
2.4.3. Effect of temperature and catalyst weight on carbon monoxide conversion .............. 58
2.4.4. Kinetic model parameter optimization ........................................................................ 60
2.4.5. Model discrimination .................................................................................................. 62
2.5. Conclusions ........................................................................................................................ 67
List of references....................................................................................................................... 68
CHAPTER 3 DETAILED BIOMASS FAST PYROLYSIS KINETICS INTEGRATED INTO A
COMPUTATIONAL FLUID DYNAMICs (CFD) AND DISCRETE ELEMENT MODELING
FRAMEWORK............................................................................................................................. 73
Abstract ..................................................................................................................................... 74
3.1. Introduction ........................................................................................................................ 75
3.2. Methodology ...................................................................................................................... 77
3.2.1. Simulation setup and feedstock characteristics ........................................................... 78
3.2.2. Reaction scheme and kinetics ..................................................................................... 81
3.2.3. Governing equations ................................................................................................... 87
3.2.3.1. Gas phase ............................................................................................................. 87
3.2.3.2. Discrete particle phase ......................................................................................... 88
3.2.3.2.1. Contact force ................................................................................................. 88
3.2.3.2.2. Drag force ..................................................................................................... 89
3.2.3.2.3. Heat transfer .................................................................................................. 90
3.2.4. Computational conditions and assumptions................................................................ 90
3.3. Results and discussion ....................................................................................................... 91
3.3.1. Temperature, velocity, and void fraction .................................................................... 93
3.3.2. Solid particle residence time ....................................................................................... 97
3.3.3. Pyrolysis yields and composition................................................................................ 98
3.4. Conclusions ...................................................................................................................... 102
List of references..................................................................................................................... 104
CHAPTER 4 COMPUTATIONALLY MODELING BIOMASS HYDROUS PYROLYSIS
USING IN-SITU HYDROGEN GENERATION ....................................................................... 108
Abstract ................................................................................................................................... 109
4.1. Introduction ...................................................................................................................... 110
4.2. Modeling approach .......................................................................................................... 112
4.2.1. Reaction scheme and kinetics ................................................................................... 113
viii
4.2.3. Simulation analysis ................................................................................................... 116
4.2.3.1. Hydrodynamics .................................................................................................. 116
4.2.3.2. Product distribution ............................................................................................ 116
4.3. Results and discussion ..................................................................................................... 117
4.3.1. Hydrous pyrolysis hydrodynamics ........................................................................... 117
4.3.2. Hydrous pyrolysis selectivity .................................................................................... 119
4.3.3. Hydrous pyrolysis yields........................................................................................... 119
4.4. Conclusions ...................................................................................................................... 121
List of references..................................................................................................................... 123
CONCLUSION AND FUTURE WORK ................................................................................... 127
VITA ........................................................................................................................................... 129
ix
LIST OF TABLES
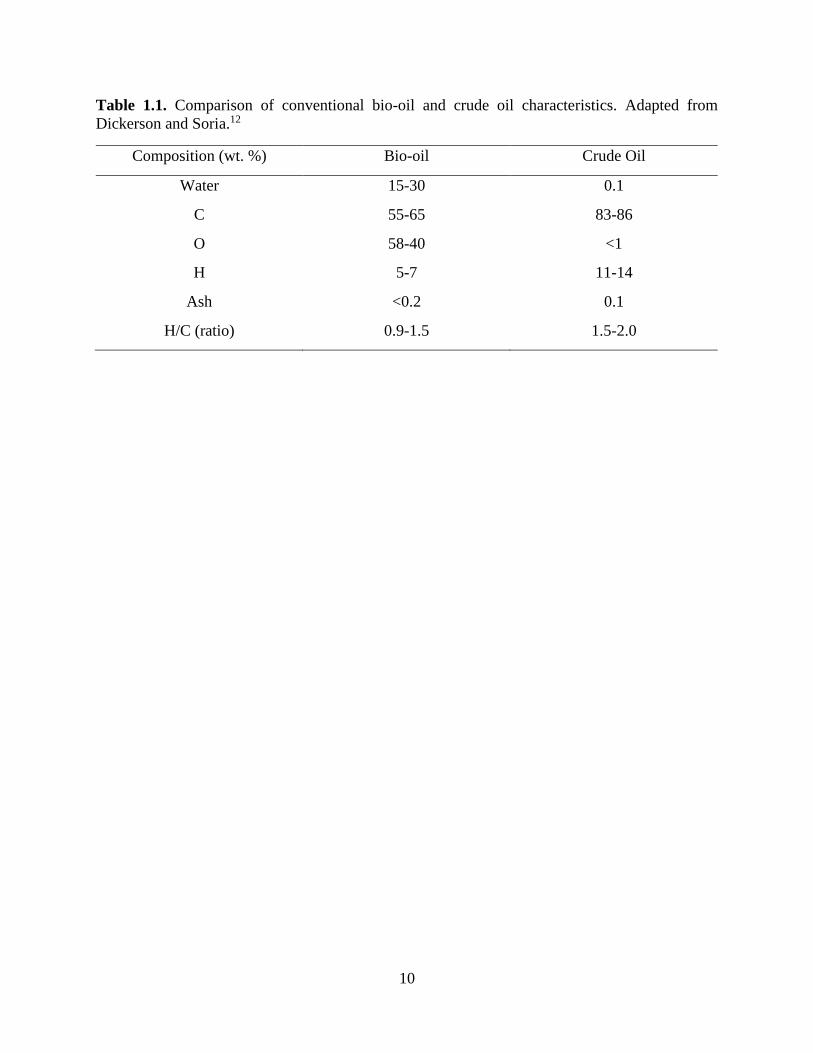
Table 1.1. Comparison of conventional bio-oil and crude oil characteristics. Adapted from
Dickerson and Soria.12 .................................................................................................................. 10 Table 1.2. Governing equation for each phase in Eulerian modeling. Adapted from Xiong et al.58
....................................................................................................................................................... 18 Table 1.3. Reactions present in the hydrodeoxygenation process. Adapted from Chu et al.120 ... 30
Table 2.1. Composition of the commercial Cu-based catalyst. .................................................... 57 Table 2.2. Catalyst characterization results. ................................................................................. 57 Table 2.3. Rate law expressions for each kinetic model tested. ................................................... 61 Table 2.4. Calculated parameters for WHSV #1, 6170 cm3/(min-g), for the proposed kinetic
models. .......................................................................................................................................... 63
Table 2.5. Calculated parameters for WHSV #2, 2036 cm3/(min-g), for the proposed kinetic
models. .......................................................................................................................................... 64
Table 2.6. Calculated parameters for WHSV #3, 1221 cm3/(min-g), for the proposed kinetic
models. .......................................................................................................................................... 65 Table 2.7. Goodness of fit results for kinetic models over each WHSV. .................................... 66 Table 3.1. Biomass feedstock composition according to ASTM standard and NREL protocol on
an extractive free basis. ................................................................................................................. 80 Table 3.2. Solid parameters and feeding rate for sand and biomass assumed in the simulation. 82 Table 3.3. Primary pyrolysis reactions used in the CFD model, values from 17. ......................... 85
Table 3.4. Secondary cracking reactions and kinetics of bio-oil vapors. Adapted from Blondeau
and Jeanmart19. .............................................................................................................................. 86
Table 3.5. Simulation boundary conditions ................................................................................. 92
Table 4.1. Kinetic rate constant parameters for the lumped HDO scheme.31 ............................ 115
x
LIST OF FIGURES
Figure 1.1. Illustration of the comprehensive pyrolysis “Ranzi” reaction scheme. Adapted from
Mellin et al83. (with permission from Elsevier for use in this thesis). Copyright 2014 Elsevier. . 24 Figure 2.1. Experimental catalytic reactor setup. 1. Carbon monoxide delivery lines; 2. Inert gas
(He) delivery line; 3. High-pressure syringe water pump; 4. Onboard steam generator with PID
controlled heaters; 5. Packed bed reactor with PID controller furnace heater; 6. Shell and tube heat
exchanger; 7. Liquid collection reservoir with bottom drain valve; 8. Overflow reservoir with a
bottom drain valve. ....................................................................................................................... 47 Figure 2.2. Results from the TPR of the commercial Cu-based catalyst showing derivate of mass
as a function of temperature. ......................................................................................................... 59 Figure 2.3 CO conversion (%) as a function of temperature (°C) over different WHSVs (WHSV
#1 = 1220 cm3/g-min, WHSV #2 = 2040 cm3/g-min, and WHSV #3 = 6110 cm3/g-min). ......... 59 Figure 2.4 CO conversion as a function of inverse WHSV (g-min/cm3) from 200-400 °C. ....... 61
Figure 3.1. Geometry of experimental and simulation bubbling fluidized bed reactor. .............. 79
Figure 3.2. Illustration of the comprehensive pyrolysis “Ranzi” reaction scheme with
stoichiometric coefficients. ........................................................................................................... 83 Figure 3.3. Temperature profile for the gas phase (left) and biomass (right) for 550 °C at 4.5 Umf
at 18s. ............................................................................................................................................ 94 Figure 3.4. Gas velocity streamlines for each fluidization condition at 550 °C. ......................... 95 Figure 3.5. Void fraction in the activated bed region (bottom fraction of reactor). .................... 96
Figure 3.6. Residence time distributions (RTD) with histograms for the 4.5Umf condition at 450
(left), 500 (middle), and 550°C (right). ........................................................................................ 99
Figure 3.7. Simulated fast pyrolysis yields of bio-oil, non-condensable gases (NCG) and char for
1.91Umf (top), 3Umf (left), and 4.5Umf (right) at 450, 500, and550 °C. .................................... 99
Figure 3.8. Steady-state bio-oil product composition at 550 °C. ............................................... 101 Figure 4.1. Residence time distribution for 500 °C at a velocity comparable to 3 Umf in pyrolysis.
..................................................................................................................................................... 118 Figure 4.2. Void fraction for the bottom half of the reactor for 0.786 m/s at 30 bar. ................ 118 Figure 4.3. Comparison of temperature profile for the pyrolysis and hydrous pyrolysis case at 500
°C and 3 Umf. ............................................................................................................................. 120
Figure 4.4. Mass fraction (per surface area) of summed oil, heavy fraction, and light fraction
products for 450 °C and 3Umf at three seconds. ........................................................................ 122
xi
ABBREVIATIONS AND SYMBOLS
H/C Hydrogen to carbon ratio
O/C Oxygen to carbon ratio
S/C Steam to CO molar ratio
CO2 Carbon dioxide
CO Carbon monoxide
Cu Copper
H2 Hydrogen
H2O Water
CH4 Methane
N2 Nitrogen
He Helium
CuO Copper oxide
ZnO Zinc oxide
Al2O3 Aluminum oxide
BET Brunauer-Emmett-Teller
TCD Thermal conductivity detector
FID Flame ionization detector
FPD Flame photometric detector
TAN Total acid number
CFP Catalytic fast pyrolysis
HDO Hydrodeoxygenation
GTI Gas Technology Institute
WGS Water-gas shift
CFD Computational fluid dynamics
NiMo Nickel-Molybdenum
CoMo/Al2O3 Cobalt-Molybdenum/Aluminum Oxide
TFM Two-fluid model
DEM Discrete element method
UDF User defined function
HTS High temperature shift
ITS Intermediate temperature shift
LTS Low temperature shift
LH Langmuir-Hinshelwood
ER Eley-Rideal
TPR Temperature programreduction
TGA Thermogravimetric analyzer
DTG Differential thermogravimetric
PFR Plug flow reactor
PID Proportional integral derivative
SV Space velocity
WHSV Weight hourly space velocity
ROM Reduced order model
RMSE Root mean squared error
MAE Mean absolute error
xii
FIT Goodness of fit
AIC Akaike Information Criterion 𝛼𝑔/𝛼𝑠𝑚 Gas/Solid phase volume fraction 𝜌𝑔/𝜌𝑠𝑚 Material density 𝑈𝑔 Gas velocity vector 𝑅𝑔/𝑅𝑠𝑚 Mass transfer source term 𝜏𝑔/𝜏𝑠𝑚 Stress tensor 𝑝 Pressure 𝛽𝑔𝑠𝑚 Gas-solid inter-phase momentum exchange coefficient 𝛽𝑠𝑙𝑚 Momentum exchange coefficient between solid phase l and m 𝑈𝑠𝑚/𝑈𝑠𝑙 Solid phase velocity 𝜓𝑔𝑠𝑚 Gas-solid momentum exchange due to mass transfer 𝑔 Gravity vector 𝐶𝑝𝑔/𝐶𝑝𝑠𝑚 Heat capacity 𝑇𝑔/𝑇𝑠𝑚 Temperature of the gas phase 𝑞𝑔/𝑞𝑠𝑚 Conductive heat flux ℎ𝑔𝑠𝑚 Gas-solid heat transfer coefficient ∆𝐻𝑔 Heat of reactions in the gas phase 𝑌𝑔𝑘/𝑌𝑠𝑚𝑘 Mass fraction of species k in the each phase 𝑅𝑔𝑘/𝑅𝑠𝑚𝑘 Reaction rate of species k in the each phase 𝑡 Time 𝑘 Reaction rate constant
𝑘0 Pre-exponential constant
𝐸𝑎 Activation energy
𝑅 Gas constant
𝑇 Temperature
𝑚𝑖 Mass of particle i
𝑣𝑖 Translational velocity of particle i
𝐹𝑖𝑗𝑐 Contact force acting on particle i by particle j or walls
𝐹𝑖𝑘𝑛𝑐 Non-contact force acting on particle i by particle k or other sources
𝐹𝑖𝑓 Particle-fluid interaction force on particle i
𝐹𝑖𝑔
Gravitational force
𝐼𝑖 Moment of inertia
𝜔𝑖 Angular velocity of particle i
𝑀𝑖𝑗 Torque acting on particle i by particle j or walls
𝜀𝑔 Gas volume fraction
𝜌𝑔 Gas density
𝜌𝑝 Particle density
𝑚𝑝 Mass of particle
𝑼𝑔 Gas velocity
𝑆𝑝 Mass source term
𝝉 Gas effective stress tensor
𝒈 Gravitational vector
𝑆𝑚 Momentum source term
𝐸 Energy
xiii
ℎ𝑠 Sensible energy
𝑝 Pressure
𝑆ℎ Reaction enthalpy source term
𝑆𝑝,ℎ Particle enthalpy source term
𝑆𝑟 Radiation source term
𝛼𝑒 Effective dynamic thermal diffusivity
𝑟𝐶𝑂𝑜𝑏𝑠 Observed reaction rate
𝜌𝑐 Catalyst density
𝑎′ Specific external surface area of catalyst
𝑘𝑓 Mass transfer coefficient
𝐶𝐶𝑂𝑏 CO concentration in the bulk phase
𝑅𝑝 Mean radius of the catalyst particle
𝐶𝐴𝑠 CO concentration at the catalyst surface
𝐷𝑒 Mass Diffusion Constant
D Diffusion coefficient
𝜑𝑝 Porosity of the catalyst particle
𝜎 Constriction factor
𝜏 Tortuosity
X Conversion of CO
𝑃𝑖𝑗 Partial pressure of species i, raised to j
𝛽𝑒 Approach to equilibrium
𝐾𝑒 Equilibrium constant
N Number of observations
k Number of parameters being optimized
𝑦𝑖 Experimental data
experimentalmax Maximum observed value
𝐹(𝑘, 𝑥𝑖) Values calculated by the model
CO0 Initial CO concentration
𝜃 Stoicheometric ratio between steam and CO 𝐾𝑖 Adsorption constant for species i
∆Hi Heat of adsorption for species i
𝑌𝑖 Chemical species mass fraction
𝑆𝑝,𝑌𝑖 Particle species source term
𝑆𝑌𝑖 Reaction Species Source
𝜇𝑔 Gas phase viscosity
𝜇𝑡 Turbulent viscosity
𝐼 Identity vector
𝜎 Turbulent dissipation rate
𝑘 Turbulent energy
𝐶𝜇 Empirically constant (Value used is 0.09)
𝛽 Moment exchange
𝑑𝑝 Particle diameter
𝑼𝑝 Particle velocity
𝜀𝑝 Solid volume fraction
xiv
𝐶𝑑 Drag coefficient
𝑅𝑒𝑝 Reynolds number
h Heat transfer constant
∝𝑝 Particle volume fraction
kg Thermal conductivity
𝑁𝑢𝑝 Nusselt number
𝑃𝑟 Prandtl number
𝐶𝑝𝑔 Gas heat capacity
𝐹𝑐𝑜𝑛𝑡𝑎𝑐𝑡 Total contact force on a particle
𝐹𝑛 Normal force on a particle
𝐹𝑡 Tangential force on a particle
1
INTRODUCTION
Background
The rapidly growing world population has resulted in a boom in energy demand while the
main source of energy, fossil fuels, is a finite resource and will be depleted in the future 1,2. Shaifee
et al., 3 derived a formula from the Klass4 model to project coal reserves to last until 2112. This
dilemma has recently motivated an ever-increasing interest in renewable energy to counter this
issue. In turn, interest has led to the exploration of alternative methods to produce fuel, energy,
and chemicals from lignocellulosic biomass. Lignocellulosic biomass is the most abundant
renewable resource in the U.S. with a net zero carbon dioxide (CO2) addition into the atmosphere.
These materials are readily available and come from a wide range of sources including forest
products, agricultural wastes, forest residues, and energy crops. There are several processes (e.g.,
pyrolysis, torrefaction, gasification, and combustion) available for biomass conversion that
produce a form of renewable energy. To maximize the production of bio-oil, pyrolysis is a low-
cost, efficient way to convert the biomass. Pyrolysis is the thermal decomposition of biomass by
heating in an oxygen-free environment to produce biochar, syngas, and bio-oil. Pyrolysis takes
place in one of two ways: slow or fast pyrolysis. Fast pyrolysis is more efficient at producing liquid
bio-oil, while slow pyrolysis is more useful for applications such as charcoal production.
Conventional fast pyrolysis does not produce liquid bio-oil of quality comparable to that of crude
oil, so the vapors must be further processed to improve quality. Catalytic fast pyrolysis (CFP) is
essentially conventional fast pyrolysis with the presence of a suitable catalyst. CFP can be designed
for in-situ or ex-situ upgrading to remove many of the reactive and oxidized components of the
pyrolysis vapors. This method tends to be expensive due to major issues with catalyst coking and
deactivation. Another advanced pyrolysis process that improves the quality of bio-oil is
2
hydropyrolysis. Hydropyrolysis combines pyrolysis with hydrodeoxygenation (HDO) to upgrade
pyrolysis vapors to a quality comparable to that of petroleum. Hydropyrolysis requires a HDO
catalyst and an adequate supply of hydrogen. Hydropyrolysis is the state-of-the-art advanced
pyrolysis process, which is very promising but there are issues that must be addressed.
Biomass fast pyrolysis is a very complex process due to the variable composition of
biomass as well as the typical fluidized bed reactor environment. The nature of the reaction makes
it difficult to monitor the transport phenomena occurring inside the fluidizied bed reactor.
Therefore, computational fluid dynamics (CFD) modelling has recently gained attention as an
avenue to investigate and understand the complex reaction environment. This research aims to
utilize CFD to model the hydropyrolysis of biomass to produce high quality bio-oil
Problem statement
Bio-oil produced from the pyrolysis of lignocellulosic biomass is not compatible for co-
processing in existing petroleum refineries. The bio-oil has several quality issues in comparison to
petroleum crude oil, such as high oxygen content, chemical instability, and high total acid number
(TAN)5. To be able to co-process the bio-oil in a petroleum refinery, pyrolysis bio-oil must
undergo further upgrading through either a downstream process or a more advanced pyrolysis
process such as catalytic fast pyrolysis or hydropyrolysis. The main issue associated with bio-oil
quality is the high oxygen content. Many of the other quality issues stem from the high oxygen
content. Oxygenated groups in the bio-oil tend to be more reactive and will gradually polymerize
and increase viscosity. The more oxygenated the bio-oil is, the less volatile it will be, which greatly
affects distillation and leads to coking. The two most common advanced pyrolysis processes for
decreasing bio-oil oxygen content are CFP and hydropyrolysis, which will be discussed in detail
later in the proposal. Both processes can remove a significant amount of oxygen from the bio-oil;
3
however, there are still issues present with each process. CFP has significant issues with catalyst
coking and deactivation. Hydropyrolysis is the most effective upgrading process; however, the
hydrogen requirement can significantly reduce the economic viability due to the high price of
hydrogen.
Research proposal and objectives
The goal of this research is to develop a one-pot solution to produce hydrogen using steam
and deoxygenate pyrolysis vapors simultaneously through a new process that will be coined as
“hydrous pyrolysis.” Current hydropyrolysis processes supply hydrogen to the system to
deoxygenate pyrolysis vapors. Hydrous pyrolysis integrates water-gas shift (WGS),
hydrodeoxygenation (HDO), and fast pyrolysis with the goal of oxygen removal and hydrocarbon-
rich biocrude production. Concretely, an integrated hydrous pyrolysis process in a fluidized bed
reactor predominantly employs steam for fluidization as well as to produce hydrogen in-situ using
carbon monoxide generated by fast pyrolysis. The hydrogen produced in-situ is subsequently used
to carry out HDO. At the end, water generated through HDO and unreacted steam are separated
and recycled thus creating a net-zero water process. The central hypothesis is that steam and the
most abundant non-condensable pyrolysis vapor, CO, will produce sufficient hydrogen to
deoxygenate condensable pyrolysis vapors in the presence of a hydrodeoxygenation catalyst
(sulfided CoMo/Al2O3) at high pressures. The overall goal of this research will be accomplished
through the following three objectives:
Objective 1. To determine the kinetics of hydrogen production on commonly used
commercial water-gas shift (WGS) shift catalyst at pyrolysis operating conditions;
Objective 2. To model fast pyrolysis using constitutive pyrolysis kinetic model integrated
into a discrete element (DEM) framework.
4
Objective 3. To integrate hydrodeoxygenation (HDO) reaction kinetics and operating
conditions to the fast pyrolysis DEM framework.
Our research objectives are supported by several hypotheses which will guide our experimental
approaches and our numerical simulations. These hypotheses are as follow:
Hypothesis 1 (Objective 1): I hypothesize that the WGS is sufficient enough to produce
adequate hydrogen for hydrous pyrolysis using carbon monoxide (CO), the most abundant
noncondensable gas product of biomass pyrolysis.
Hypothesis 2. (Objective 2): I hypothesize that a computational fluid dynamic model, with
a discrete element method, (CFD-DEM) incorporating an extensive reaction scheme is able
to model biomass pyrolysis in a bubbling fluidized bed reactor.
Hypothesis 3 (Objective 3): I hypothesize that including the kinetics derived in Objective
1 and secondary HDO kinetics into the CFD-DEM from Objective 2 will model a one-pot
hydrous pyrolysis reactor to produce refinery-ready bio-oil.

5
List of references
6
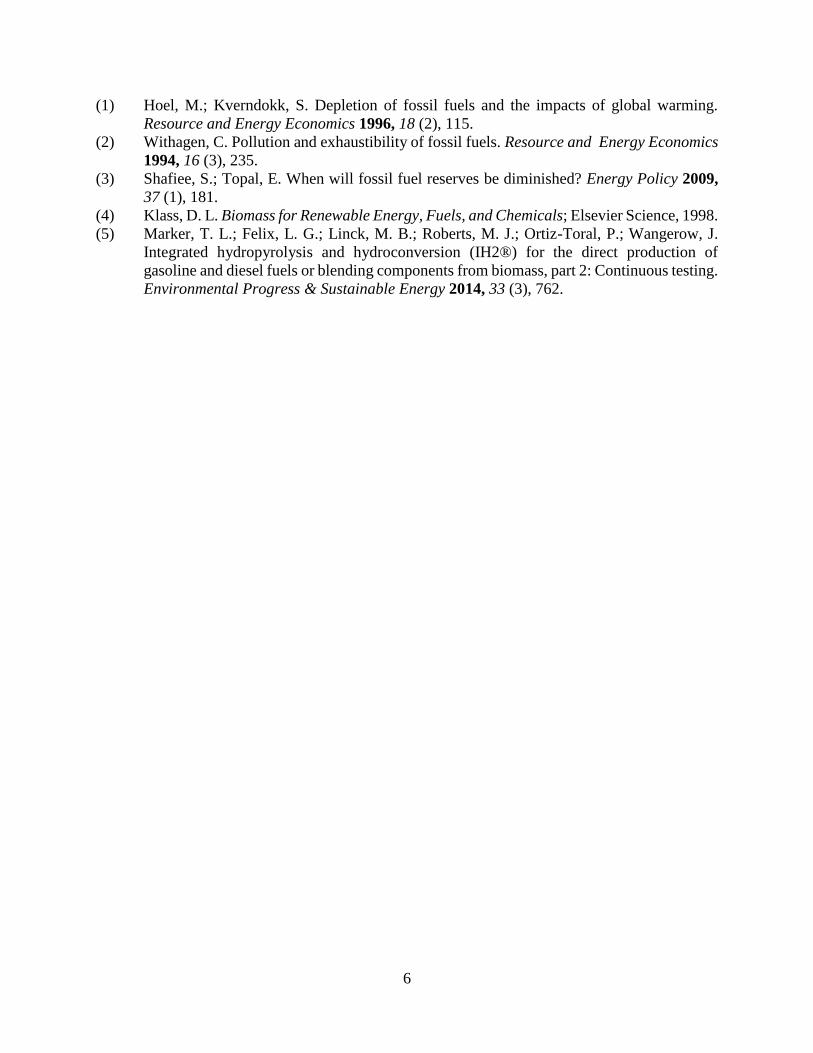
(1) Hoel, M.; Kverndokk, S. Depletion of fossil fuels and the impacts of global warming.
Resource and Energy Economics 1996, 18 (2), 115.
(2) Withagen, C. Pollution and exhaustibility of fossil fuels. Resource and Energy Economics
1994, 16 (3), 235.
(3) Shafiee, S.; Topal, E. When will fossil fuel reserves be diminished? Energy Policy 2009,
37 (1), 181.
(4) Klass, D. L. Biomass for Renewable Energy, Fuels, and Chemicals; Elsevier Science, 1998.
(5) Marker, T. L.; Felix, L. G.; Linck, M. B.; Roberts, M. J.; Ortiz-Toral, P.; Wangerow, J.
Integrated hydropyrolysis and hydroconversion (IH2®) for the direct production of
gasoline and diesel fuels or blending components from biomass, part 2: Continuous testing.
Environmental Progress & Sustainable Energy 2014, 33 (3), 762.
7
CHAPTER 1 LITERATURE REVIEW
1.1. Introduction
Adequate energy supply continues to be of great importance due to the increasing
population and energy consumption throughout the world. Currently, most of the energy
consumption worldwide is from fossil fuels, which contribute to greenhouse gas emissions.
Therefore, sustainable, renewable energy sources are being investigated to reduce our dependence
on fossil fuels, meet increasing energy demands, and help mitigate the anthropogenic contribution
to climate change. Biomass has been viewed as an attractive renewable alternative to fossil fuels
and is the most widely used type of renewable energy. Biomass sources contribute to
approximately 10% of the global energy demand1,2. There are two main types of biomass
conversion techniques to produce energy: biochemical and thermochemical. Biochemical
conversion uses biological agents to breakdown the biomass or biomass intermediates into various
products at mild temperatures. Examples of biochemical conversion processes include anaerobic
digestion to produce biogas that can be burned for heat, and fermentation of biomass derived sugars
to produce either ethanol or butanol3. In contrast, thermochemical conversion uses high
temperatures with or without a catalyst to convert biomass into intermediates with higher energy
density4. The primary thermochemical conversion techniques are combustion, gasification, and
pyrolysis. These processes differ by their operating temperature range and oxygen requirements.
Fast pyrolysis is carried out at moderate temperatures (400-600 °C) in the absence of oxygen;
gasification occurs at higher temperatures (650-1000 °C) in a sub-stoichiometric amount of
oxygen, and combustion takes places at very high temperatures (>1100 °C) with oxygen in
stoichiometric excess. Fast pyrolysis is the most efficient of the thermochemical conversion
8
processes and is seen as the most attractive biomass conversion technique because of the potential
to directly produce a liquid transportation fuel with typical yields between 50-70 wt. %5-7.
1.2. Biomass fast pyrolysis
Fast pyrolysis is simply the decomposition of organic materials at moderate temperatures
in the absence of oxygen. It is characterized by high heating rates, carefully controlled
temperatures in the range of 400-600 °C, atmospheric pressures, and rapid cooling of the vapors
to produce liquid bio-oil, which is the primary product from fast pyrolysis. Typical product yields
are 60-75 wt. % bio-oil, 15-25 wt. % char, and 10-20 wt. % non-condensable gases8. Generally,
bio-oil is made up organic and aqueous fractions. One of the most important characteristics of fast
pyrolysis is its vapor residence time, generally requiring a short residence time of fewer than two
seconds (< 2 s). For lignocellulosic biomass, comprised of lignin, cellulose, and hemicellulose, the
rate and extent of decomposition is dependent on the process parameters, such as temperature and
residence time9. The product yield of liquid bio-oil is reliant on the extent of secondary reactions,
which primarily depends on the residence time. The longer the vapors stay in the reactor, the more
they are subject to secondary cracking to produce smaller, non-condensable gases and reduce the
overall liquid bio-oil yield. The optimum residence time to maximize bio-oil production was found
to be 0.2-0.6 s for most biomass materials10. Temperature is also an important parameter to control
when optimizing the bio-oil yield. Organic liquid oil yields are maximized in the temperature range
of 400-500 °C9.
Biomass fast pyrolysis can be carried out in several reactor configurations such as a
bubbling fluidized bed reactor (BFBR), circulating fluidized bed reactor (CFBR), ablative reactor,
and an auger reactor11. Fluidized bed reactors provide stable temperature control, efficient heat
transfer to the biomass particles, and produce high liquid bio-oil yields. However, regardless of
9
the reactor configuration, fast pyrolysis always produces three products: char, non-condensable
gases, and liquid bio-oil.
Bio-oil produced from fast pyrolysis is typically a dark brown liquid with a strong, smoky
smell. While it is considered a bio-based alternative to crude petroleum, its chemical composition
is significantly different leading to substantial differences in properties and characteristics. For
example, unlike crude petroleum which is composed mainly of paraffins and aromatics, bio-oil is
made up of highly oxygenated compounds, such as hydroxyaldehydes, phenolics, and acids.6,12 Its
most abundant component is water with concentrations of 15-30 wt. %13. However, the most
problematic issue with bio-oil is the presence of oxygen14. Oxygen can be found within almost all
of the different components of bio-oil, which is the primary reason for the significant differences
between bio-oil and petroleum properties. These differences such as high oxygen content,
chemical instability, a high total acid number (TAN) make it very difficult to co-process bio-oil
alongside crude petroleum 15. Table 1.1 shows a comparison of the characteristics of conventional
bio-oil and crude oil, which further shows the disparity between fast pyrolysis bio-oil and crude
oil.
1.3. Pyrolysis upgrading
Due to the issues associated with the bio-oil produced through conventional fast pyrolysis,
catalytic fast pyrolysis (CFP) has been looked at to upgrade the pyrolysis vapors using a suitable
catalyst. The main purpose of CFP is to remove the oxygen from the pyrolysis vapors as oxygen
leads to most of the main issues associated with bio-oil16. Catalytic fast pyrolysis can be carried
out either in-situ (catalyst is mixed in directly with the biomass feedstock) or ex-situ (catalyst is
only in contact with the hot pyrolysis vapors)17. Testing conventional and catalytic fast pyrolysis
side by side has shown catalytic fast pyrolysis to produce more aromatic hydrocarbons and reduce
10
Table 1.1. Comparison of conventional bio-oil and crude oil characteristics. Adapted from
Dickerson and Soria.12
Composition (wt. %) Bio-oil Crude Oil
Water 15-30 0.1
C 55-65 83-86
O 58-40 <1
H 5-7 11-14
Ash <0.2 0.1
H/C (ratio) 0.9-1.5 1.5-2.0
11
the oxygen content to less than 15 wt. %15,18. Yildiz et al. found using a catalyst during fast
pyrolysis significantly improved the oxygen removal from bio-oil compared to conventional fast
pyrolysis; however, CFP also decreased the total yield of liquid bio-oil and increased the
production of char and gas19. Due to the complex composition of pyrolysis bio-oil, the necessary
upgrading is difficult to achieve in a single technique. The two main pathways for catalytic
upgrading are zeolite cracking and hydrodeoxygenation (HDO).
1.3.1. Zeolite cracking
Zeolites are porous oxide structures with a defined pore structure due to high crystallinity.
H-ZSM5 is an established zeolite catalyst used to deoxygenate bio-oil20. Zeolite cracking is used
to remove oxygen from bio-oil to produce hydrocarbons. Cracking breaks the carbon-carbon bonds
and releases oxygen in the form of carbon dioxide (CO2) and water (H2O) through dehydration,
decarboxylation, and decarbonylation.21,22 An overall, empirical reaction for zeolite cracking of
bio-oil can be represented by23:
𝐶6𝐻8𝑂4 → 4.6𝐶𝐻1.2 + 1.4𝐶𝑂2 + 1.2𝐻2𝑂
Zeolite cracking produces aromatics from the oxygenated bio-oil compounds. Due to the aromatic
nature of the oil, cracking produces a product with a lower heating value than HDO12. The oil is
generally thought to have more potential as a chemical feedstock than that produced by HDO23.
Typical operating temperatures for zeolite cracking range from 350-600 °C. One of the advantages
of zeolite cracking is there is no hydrogen requirement as it is carried out at atmospheric pressures.
However, there are major issues associated with zeolite cracking. Cracking leads to excessive coke
formation on the catalyst site, which then leads to catalyst deactivation24. The overall bio-oil yields
are drastically reduced upon zeolite cracking. Actual yields from zeolite cracking range from
15-23%25.
12
1.3.2. Hydrodeoxygenation
In HDO, hydrogen is introduced to the system at high pressure (up to 200 bar) and the
process takes place at moderate temperatures (300-600 °C). Oxygen is removed in the form of
H2O, and occasionally CO2. Hydrodeoxygenation consists of several different types of reactions
such as hydrogenation, cracking, and decarboxylation26. However, the most prominent reaction is
described by22,27:
(𝐶𝐻2𝑂) + 𝐻2 → (𝐶𝐻2) + 𝐻2𝑂
Significant work has been done on development and testing of catalysts for HDO. Transition metal
sulfides have shown to provide good results when used as the active catalyst, with Ni-Mo and
Co-Mo supported on Al2O3 are the most widely used catalysts in HDO27-29. Due to the sulfur
component of these catalysts, sulfur stripping occurs during HDO and leads to catalyst
deactivation30. Bio-oil has a large oxygen content that could contribute to accelerated catalyst
deactivation compared to other HDO applications31.
Compared to the oil upgraded through zeolite cracking, HDO treated oil has more of a
naphtha-like composition and is more energy dense12. Water is produced during HDO, which leads
to the final liquid product consisting of two phases: aqueous and organic. The O/C ratio in the
organic phase after HDO is much lower than the O/C of pyrolysis bio-oil32. The organic and
aqueous phases are easy to separate upon full hydrodeoxygenation. The maximum liquid yield that
can be produced from the complete deoxygenation of pyrolysis oil, based off stoichiometry, is 56-
58%25,33. However, complete deoxygenation is not always achieved due to the inherit complexity
of the HDO process. The extent of deoxygenation is dependent on the residence time inside the
reactor. Longer residence times leads to higher degrees of deoxygenation32,34. The overall yield of
bio-oil from HDO is related to the degree of deoxygenation. Research on HDO over a Co-
13
MoS2/Al2O3 catalyst showed a decrease in organic liquid yield from 55% to 30% when the degree
of deoxygenation increased from 78% to 100%35.
There are still disadvantages associated with hydrodeoxygenation of bio-oil. Hydrogen is
an expensive feedstock to use in an upgrading process. A cheaper source of hydrogen will make
HDO an even more attractive pathway for bio-oil upgrading. Another issue with HDO is the high
operating pressures. Fast pyrolysis typically takes place at atmospheric pressure. Coupled with
HDO, there is a stark pressure difference (70-200 bar), which introduces safety and economic
concerns. Catalyst coking and deactivation is another problem frequently encountered with HDO.
At increasing residence time and temperature, deoxygenation increases; however, so does catalyst
coking12.
1.3.3. Hydropyrolysis
To mitigate the issues associated with conventional bio-oil upgrading techniques, more
advanced processes are needed. Hydropyrolysis is a more recent conversion process that is shown
to produce liquid bio-oil with a lower oxygen content than fast pyrolysis. It was first used for
increasing the yield from coal liquefaction36,37. Hydropyrolysis is similar to the process for
conventional and catalytic fast pyrolysis, due to the organic matter quickly degrading under high
heating rates and the similar reactor configurations. Unlike pyrolysis, however, hydropyrolysis is
carried out under moderately high hydrogen pressure. Hydropyrolysis combines fast pyrolysis and
HDO into a single step.
The process can be performed with or without a catalyst; however, hydropyrolysis without
a catalyst has not shown a significant difference in the oxygen content of the oil21,37,38. Catalytic
hydropyrolysis introduces a catalyst for additional upgrading. Catalytic hydropyrolysis removes
oxygen in the form of H2O, CO2, and CO and eliminates several of the issues concerning
14
polymerization and coking. Once the oxygen is removed, hydrogen is added to the hydrocarbon
chain 39. Hydropyrolysis has also been coupled with secondary hydrotreating reactors to further
increase the degree of deoxygenation of the bio-oil15,39-41. Hydropyrolysis, similar to HDO,
produces two liquid phases: an organic phase and an aqueous phase that are readily separable. The
H/C ratio of the treated oil increases compared to fast pyrolysis oil while the O/C ratio decreases
for various biomass feedstocks42. The chemical composition of the organic products from
hydropyrolysis contains more aromatic hydrocarbons and is significantly different than that of fast
pyrolysis. The product yield and oil composition from hydropyrolysis vary greatly depending on
reaction conditions such as reactor configuration, operating conditions, and catalyst
composition37,43,44. Increasing reaction temperature and the partial pressure of hydrogen typically
decreases the organic oil yield. However, the oxygen content decreases at higher tempertures37. A
significant difference, in terms of fuel quality, is the total acid number (TAN) of the hydropyrolysis
oil. Oak Ridge National Lab found that hydropyrolysis drastically reduces the TAN from 119 to
14 for wood when compared to fast pyrolysis45. Hydropyrolysis coupled with secondary
hydrotreating has been shown to drastically reduced the average molecular weight39.
Several studies have explored catalytic hydropyrolysis without any further ex-situ
upgrading downstream. Overall, catalytic hydropyrolysis was found to significantly increase the
amount of deoxygenation of the liquid bio-oil and results in oxygen levels as low as 4%37. The
main issue with catalytic hydropyrolysis without ex-situ upgrading is achieving the maximum
amount of deoxygenation while still maintaining the highest decomposition of lignin.
Hydrogenation is an exothermic reaction, so it is not favorable at higher temperatures. The
optimum temperature found for hydrogenation is 300°C. This temperature allows for the
hydrogenation of the aromatic hydrocarbons, such as benzene. However, it must be run at higher
15
temperatures (400°C) to prevent low decomposition rates for lignin 44. These issues make it very
difficult to achieve full decomposition of the biomass while simultaneously fully deoxygenating
the bio-oil in a one-pot solution; therefore, secondary HDO reactors have been investigated to
increase the degrees of deoxygenation.
Catalytic hydropyrolysis coupled with a secondary hydrodeoxygenation reactor has been
reported to produce oil with composition closer to that of gasoline and diesel than conventional
pyrolysis oil15. The Gas Technology Institute (GTI) developed a state-of-the-art process, known
as IH2, which combines catalytic hydropyrolysis with a secondary hydrotreating reactor. The IH2
process produced high quality oil with an oxygen content of less than 0.4 wt. % that met or
exceeded several gasoline standard specifications15. An initial proof of concept study found that
most of the deoxygenation occurred in the hydropyrolysis step, decreasing the oxygen content to
less than 10% and the secondary reactor served to further reduce the oxygen content to that of
petroleum quality. The specifics of the study such as catalyst composition and liquid product
composition was not reported; but this work provides promising results on the potential utility of
this advanced process.
1.3.3.1. Water-gas shift as a hydrogen source
Hydropyrolysis requires an adequate supply of hydrogen to optimize the hydrogenation of
the product vapors. Hydrogen is an expensive material to bring in from an outside source.
Therefore, it is more economical and efficient to produce hydrogen on site using readily available
starting materials. Several well-documented reactions yield hydrogen as the main product, such as
steam methane reforming, partial oxidation, and water-gas shift (WGS). GTI’s IH2 process makes
use of steam reforming to convert the light gases from hydropyrolysis to produce the hydrogen
supplied to the system15,46. Steam reforming takes place at high temperatures (700-1000°C) 47.
16
Methane reacts with steam in the presence of a catalyst to produce hydrogen and CO. It has been
determined that two reactions are involved in methane reforming. The primary steam reforming
reaction involved methane reacting with steam to produce CO. The CO produced is further reacted
with steam and is known as the water-gas shift (WGS) reaction.
𝐶𝐻4 + 𝐻2𝑂 ↔ 3𝐻2 + 𝐶𝑂
𝐶𝑂 + 𝐻2𝑂 ↔ 𝐻2 + 𝐶𝑂2
CO is reacted with steam (at a 1:1 stoichiometric ratio) in the presence of a catalyst to
produce hydrogen and CO2. In a stand-alone reaction, WGS takes place at lower temperatures than
methane reforming (200-500 °C), which is closer to the operating conditions of hydropyrolysis 48.
The WGS reaction allows for the overall process temperature for hydrogen production and
hydropyrolysis to be much closer and more easily integrated into a single process.
1.4. Computational modeling of pyrolysis
Conventional and advanced pyrolysis processes are very complex systems especially upon
scaling up beyond the Pyro-GC/MS scale. Pyrolysis inside a fluidized bed reactor (FBR)
introduces additional complexity to the pyrolysis system. The pyrolysis environment is made up
of three phases: sand, biomass, and a gas/vapor phase. Inside an FBR, biomass and an inert bed
material (sand) is fluidized by an inert gas entering at the bottom of the reactor. The sand in an
FBR provides efficient and controlled heat transfer to the biomass particles as they mix together
in the reactor. The interactions and forces between the three phases, coupled with the complex
chemistry of pyrolysis complicates the overall understanding of pyrolysis by experimentation.
Experimentally testing fast pyrolysis requires a significant time and financial investment.
Numerical simulation and modeling have recently been seen as a potential avenue to strengthen
the understanding of the phenomena that occur during pyrolysis and complement experimental
17
testing. Computational fluid dynamics (CFD) is a numerical simulation technique that directly
solves partial differential equations, such as the Navier Stokes and governing transport equations,
to analyze complex problems involving fluid flows49.
There are multiple mathematical methods that have been adopted to simulate pyrolysis
inside a fluidized bed reactor. The two main methods are Eulerian-Eulerian, also known as a
two-fluid model (TFM) or multi-fluid model (MFM), and Eulerian-Lagrangian, or a discrete
element method (DEM). The numerical method chosen for a simulation determines how the
transport equations and governing conservation equations will be solved. This chapter looks at
work using both methods for comprehensive modeling for pyrolysis as well as simulations
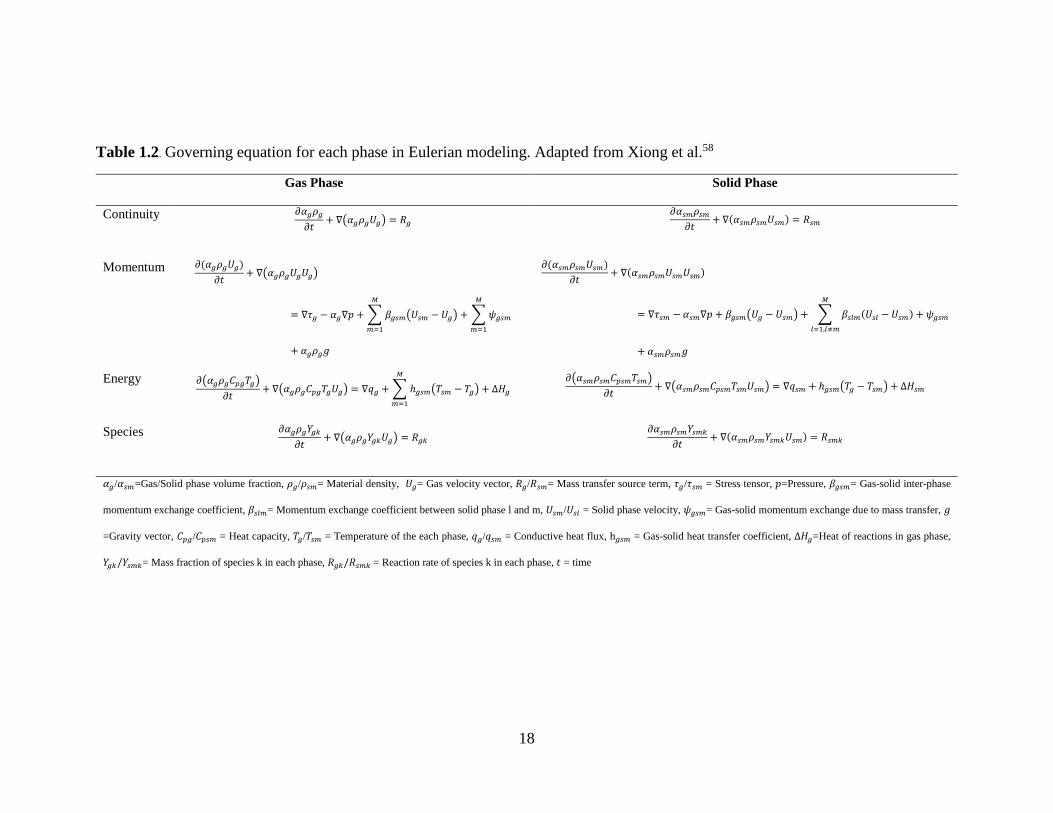
pertaining to advanced pyrolysis processes.
1.4.1. Eulerian-Eulerian
The Eulerian-Eulerian method treats all phases, regardless of whether it is a gas or solid,
as continua. The individual phases can contain any number of chemical species. Pyrolysis
simulations have one or two solid phases, depending on whether the sand and biomass are treated
as separate phases. The MFM, expanded from the TFM proposed by Ishii and Mashima, solves
the governing conservation equations for mass, momentum, energy for each chemical species and
phase and accounts for the interdependence of the phases by incorporating source terms into the
equations50. The governing conservation equations are listed in Table 1.2. Lathouwers and Bellan
were the first to develop Eulerian-Eulerian method to model biomass fast pyrolysis in a FBR51.
This model was then used to simulate and analyze the scaling up of pyrolysis to a pilot and
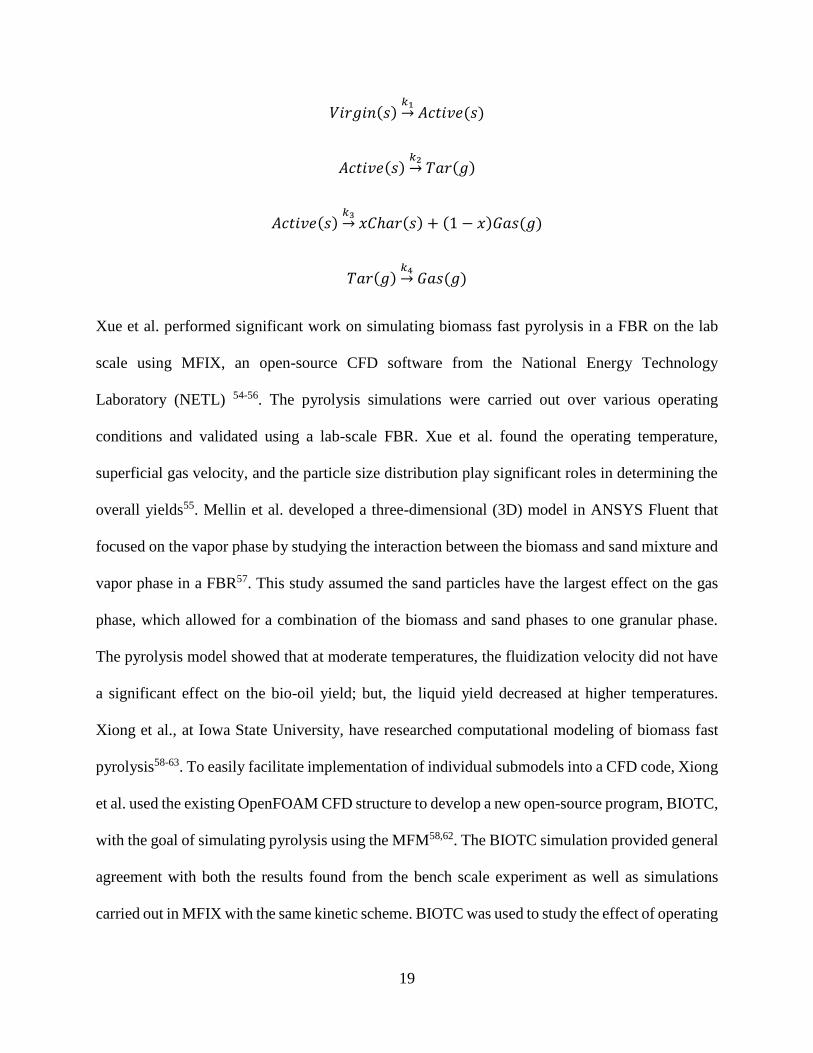
commercial scale52. The pyrolysis reaction scheme adopted was that of Miller and Bellan, which
is based on superimposed reactions, shown below, for each biomass major component: cellulose,
hemicellulose, and lignin53.
18
Table 1.2. Governing equation for each phase in Eulerian modeling. Adapted from Xiong et al.58
Gas Phase Solid Phase
Continuity 𝜕𝛼𝑔𝜌𝑔
𝜕𝑡+ ∇(𝛼𝑔𝜌𝑔𝑈𝑔) = 𝑅𝑔
𝜕𝛼𝑠𝑚𝜌𝑠𝑚𝜕𝑡
+ ∇(𝛼𝑠𝑚𝜌𝑠𝑚𝑈𝑠𝑚) = 𝑅𝑠𝑚
Momentum 𝜕(𝛼𝑔𝜌𝑔𝑈𝑔)
𝜕𝑡+ ∇(𝛼𝑔𝜌𝑔𝑈𝑔𝑈𝑔)
= ∇𝜏𝑔 − 𝛼𝑔∇𝑝 + ∑ 𝛽𝑔𝑠𝑚(𝑈𝑠𝑚 −𝑈𝑔)
𝑀
𝑚=1
+ ∑ 𝜓𝑔𝑠𝑚
𝑀
𝑚=1
+ 𝛼𝑔𝜌𝑔𝑔
𝜕(𝛼𝑠𝑚𝜌𝑠𝑚𝑈𝑠𝑚)
𝜕𝑡+ ∇(𝛼𝑠𝑚𝜌𝑠𝑚𝑈𝑠𝑚𝑈𝑠𝑚)
= ∇𝜏𝑠𝑚 − 𝛼𝑠𝑚∇𝑝 + 𝛽𝑔𝑠𝑚(𝑈𝑔 − 𝑈𝑠𝑚) + ∑ 𝛽𝑠𝑙𝑚(𝑈𝑠𝑙 −𝑈𝑠𝑚)
𝑀
𝑙=1,𝑙≠𝑚
+ 𝜓𝑔𝑠𝑚
+ 𝛼𝑠𝑚𝜌𝑠𝑚𝑔
Energy 𝜕(𝛼𝑔𝜌𝑔𝐶𝑝𝑔𝑇𝑔)
𝜕𝑡+ ∇(𝛼𝑔𝜌𝑔𝐶𝑝𝑔𝑇𝑔𝑈𝑔) = ∇𝑞𝑔 + ∑ ℎ𝑔𝑠𝑚(𝑇𝑠𝑚 − 𝑇𝑔)
𝑀
𝑚=1
+ ∆𝐻𝑔 𝜕(𝛼𝑠𝑚𝜌𝑠𝑚𝐶𝑝𝑠𝑚𝑇𝑠𝑚)
𝜕𝑡+ ∇(𝛼𝑠𝑚𝜌𝑠𝑚𝐶𝑝𝑠𝑚𝑇𝑠𝑚𝑈𝑠𝑚) = ∇𝑞𝑠𝑚 + ℎ𝑔𝑠𝑚(𝑇𝑔 − 𝑇𝑠𝑚) + ∆𝐻𝑠𝑚
Species 𝜕𝛼𝑔𝜌𝑔𝑌𝑔𝑘
𝜕𝑡+ ∇(𝛼𝑔𝜌𝑔𝑌𝑔𝑘𝑈𝑔) = 𝑅𝑔𝑘
𝜕𝛼𝑠𝑚𝜌𝑠𝑚𝑌𝑠𝑚𝑘𝜕𝑡
+ ∇(𝛼𝑠𝑚𝜌𝑠𝑚𝑌𝑠𝑚𝑘𝑈𝑠𝑚) = 𝑅𝑠𝑚𝑘
𝛼𝑔/𝛼𝑠𝑚=Gas/Solid phase volume fraction, 𝜌𝑔/𝜌𝑠𝑚= Material density, 𝑈𝑔= Gas velocity vector, 𝑅𝑔/𝑅𝑠𝑚= Mass transfer source term, 𝜏𝑔/𝜏𝑠𝑚 = Stress tensor, 𝑝=Pressure, 𝛽𝑔𝑠𝑚= Gas-solid inter-phase
momentum exchange coefficient, 𝛽𝑠𝑙𝑚= Momentum exchange coefficient between solid phase l and m, 𝑈𝑠𝑚/𝑈𝑠𝑙 = Solid phase velocity, 𝜓𝑔𝑠𝑚= Gas-solid momentum exchange due to mass transfer, 𝑔
=Gravity vector, 𝐶𝑝𝑔/𝐶𝑝𝑠𝑚 = Heat capacity, 𝑇𝑔/𝑇𝑠𝑚 = Temperature of the each phase, 𝑞𝑔/𝑞𝑠𝑚 = Conductive heat flux, h𝑔𝑠𝑚 = Gas-solid heat transfer coefficient, ∆𝐻𝑔=Heat of reactions in gas phase,
𝑌𝑔𝑘/𝑌𝑠𝑚𝑘= Mass fraction of species k in each phase, 𝑅𝑔𝑘/𝑅𝑠𝑚𝑘 = Reaction rate of species k in each phase, 𝑡 = time
19
𝑉𝑖𝑟𝑔𝑖𝑛(𝑠)𝑘1→ 𝐴𝑐𝑡𝑖𝑣𝑒(𝑠)
𝐴𝑐𝑡𝑖𝑣𝑒(𝑠)𝑘2→ 𝑇𝑎𝑟(𝑔)
𝐴𝑐𝑡𝑖𝑣𝑒(𝑠)𝑘3→ 𝑥𝐶ℎ𝑎𝑟(𝑠) + (1 − 𝑥)𝐺𝑎𝑠(𝑔)
𝑇𝑎𝑟(𝑔)𝑘4→ 𝐺𝑎𝑠(𝑔)
Xue et al. performed significant work on simulating biomass fast pyrolysis in a FBR on the lab
scale using MFIX, an open-source CFD software from the National Energy Technology
Laboratory (NETL) 54-56. The pyrolysis simulations were carried out over various operating
conditions and validated using a lab-scale FBR. Xue et al. found the operating temperature,
superficial gas velocity, and the particle size distribution play significant roles in determining the
overall yields55. Mellin et al. developed a three-dimensional (3D) model in ANSYS Fluent that
focused on the vapor phase by studying the interaction between the biomass and sand mixture and
vapor phase in a FBR57. This study assumed the sand particles have the largest effect on the gas
phase, which allowed for a combination of the biomass and sand phases to one granular phase.
The pyrolysis model showed that at moderate temperatures, the fluidization velocity did not have
a significant effect on the bio-oil yield; but, the liquid yield decreased at higher temperatures.
Xiong et al., at Iowa State University, have researched computational modeling of biomass fast
pyrolysis58-63. To easily facilitate implementation of individual submodels into a CFD code, Xiong
et al. used the existing OpenFOAM CFD structure to develop a new open-source program, BIOTC,
with the goal of simulating pyrolysis using the MFM58,62. The BIOTC simulation provided general
agreement with both the results found from the bench scale experiment as well as simulations
carried out in MFIX with the same kinetic scheme. BIOTC was used to study the effect of operating
20
conditions and different interphase transport coefficients on pyrolysis using the Miller and Bellan
reaction scheme61,63. The submodel used for the particle drag force had a much larger effect on the
bio-oil yield than the heat transfer submodel used. Based on the results from the previous work, a
validation study was performed to simulate a BFBR located at an Agricultural Research Service
(ARS) laboratory of the United States Department of Agriculture (USDA)63,64. The validated case
served as a reference state for simulations investigating the effects of operating conditions such as
reactor temperature, particle diameter, and fluidizing gas velocity. Temperature for both the reactor
and fluidizing gas had the largest effect on the product yield distribution. Xue and Fox incorporated
a quadrature based moment method (QBMM) to account for the particle size distribution (PSD)
and variable particle density into a MFM CFD model56. Simulations with a PSD showed slightly
higher yields than a single size while overall product yields were comparable to lab scale
experimental results. Xiong et al. investigated the effect of hydrodynamics on the bio-oil vapors
at the outlet of the reactor60. Due to the hydrodynamic instability of a FBR, operating conditions
will not only affect the product yield but will also cause fluctuations at the outlet. Increased
fluidizing gas velocity, bed particle size, and bed height increased the bio-oil yield while also
increasing the amount of fluctuation. The Miller and Bellan kinetic scheme and the CFD works
mentioned above assume the kinetics proceed through an Arrhenius reaction rate:
𝑘 = 𝑘0𝑒−𝐸𝑎𝑅𝑇
Xiong et al. adapted their existing MFM CFD model to incorporate a distributed activation energy
model (DAEM) to account for the diverse nature of biomass. The DAEM predicted higher bio-oil
yields and fluctuations compared to conventional single-value kinetics due to the diversity of the
activation energies within the DAEM. One of the disadvantages of an Eulerian-Eulerian approach
is it is difficult to account for transport on the particle scale. Dong et al. aimed to use a MFM
21
approach to account for intra-particle heat conduction between particles while modeling the fast
pyrolysis of corn stalks65. The reaction rates for each step (i.e. biomass to active) were modified
to take the heat penetration rate into account. The heat penetration model was found to be valid for
modeling conduction; but, more work is needed to improve product yield predictions.
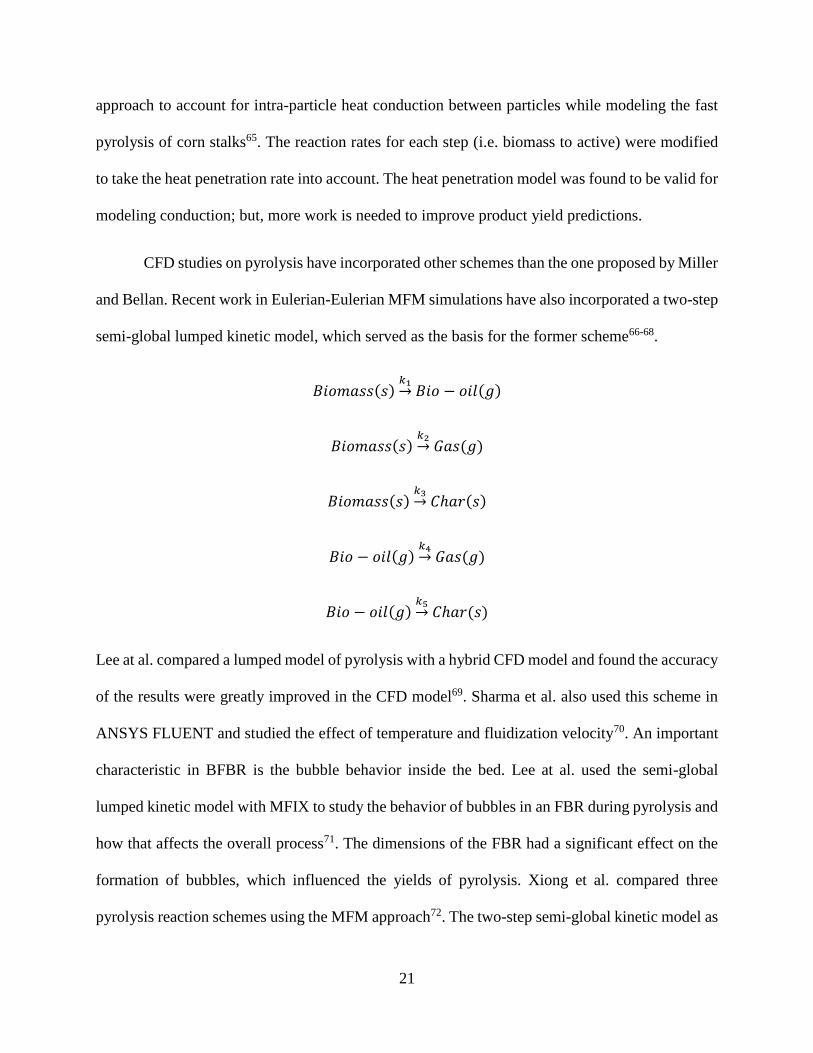
CFD studies on pyrolysis have incorporated other schemes than the one proposed by Miller
and Bellan. Recent work in Eulerian-Eulerian MFM simulations have also incorporated a two-step
semi-global lumped kinetic model, which served as the basis for the former scheme66-68.
𝐵𝑖𝑜𝑚𝑎𝑠𝑠(𝑠)𝑘1→𝐵𝑖𝑜 − 𝑜𝑖𝑙(𝑔)
𝐵𝑖𝑜𝑚𝑎𝑠𝑠(𝑠)𝑘2→ 𝐺𝑎𝑠(𝑔)
𝐵𝑖𝑜𝑚𝑎𝑠𝑠(𝑠)𝑘3→ 𝐶ℎ𝑎𝑟(𝑠)
𝐵𝑖𝑜 − 𝑜𝑖𝑙(𝑔)𝑘4→ 𝐺𝑎𝑠(𝑔)
𝐵𝑖𝑜 − 𝑜𝑖𝑙(𝑔)𝑘5→ 𝐶ℎ𝑎𝑟(𝑠)
Lee at al. compared a lumped model of pyrolysis with a hybrid CFD model and found the accuracy
of the results were greatly improved in the CFD model69. Sharma et al. also used this scheme in
ANSYS FLUENT and studied the effect of temperature and fluidization velocity70. An important
characteristic in BFBR is the bubble behavior inside the bed. Lee at al. used the semi-global
lumped kinetic model with MFIX to study the behavior of bubbles in an FBR during pyrolysis and
how that affects the overall process71. The dimensions of the FBR had a significant effect on the
formation of bubbles, which influenced the yields of pyrolysis. Xiong et al. compared three
pyrolysis reaction schemes using the MFM approach72. The two-step semi-global kinetic model as
22
well as the Miller and Bellan model were compared. The third model only considered the primary
(first three) reactions of the semi-global scheme and did not account for secondary cracking
reactions. The Miller and Bellan scheme provided the closest product predictions to experimental
results; but, the choice of scheme did not appear to have a significant effect on the hydrodynamics
of the process.
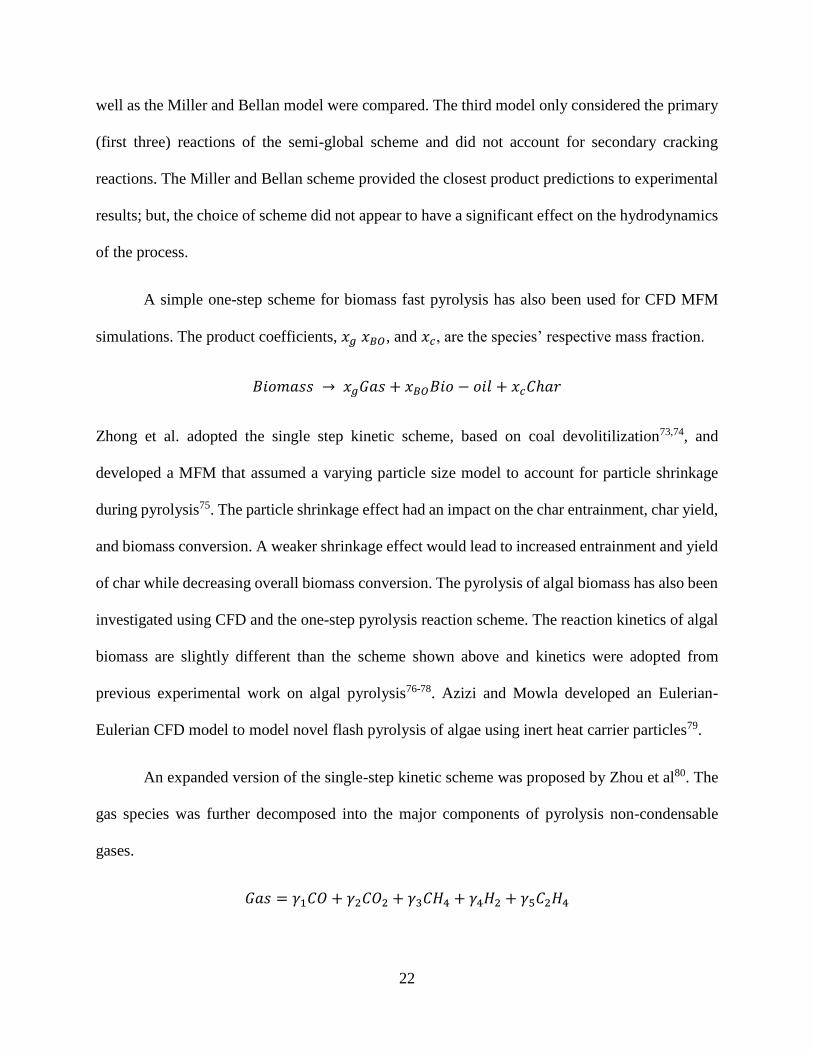
A simple one-step scheme for biomass fast pyrolysis has also been used for CFD MFM
simulations. The product coefficients, 𝑥𝑔 𝑥𝐵𝑂, and 𝑥𝑐, are the species’ respective mass fraction.
𝐵𝑖𝑜𝑚𝑎𝑠𝑠 → 𝑥𝑔𝐺𝑎𝑠 + 𝑥𝐵𝑂𝐵𝑖𝑜 − 𝑜𝑖𝑙 + 𝑥𝑐𝐶ℎ𝑎𝑟
Zhong et al. adopted the single step kinetic scheme, based on coal devolitilization73,74, and
developed a MFM that assumed a varying particle size model to account for particle shrinkage
during pyrolysis75. The particle shrinkage effect had an impact on the char entrainment, char yield,
and biomass conversion. A weaker shrinkage effect would lead to increased entrainment and yield
of char while decreasing overall biomass conversion. The pyrolysis of algal biomass has also been
investigated using CFD and the one-step pyrolysis reaction scheme. The reaction kinetics of algal
biomass are slightly different than the scheme shown above and kinetics were adopted from
previous experimental work on algal pyrolysis76-78. Azizi and Mowla developed an Eulerian-
Eulerian CFD model to model novel flash pyrolysis of algae using inert heat carrier particles79.
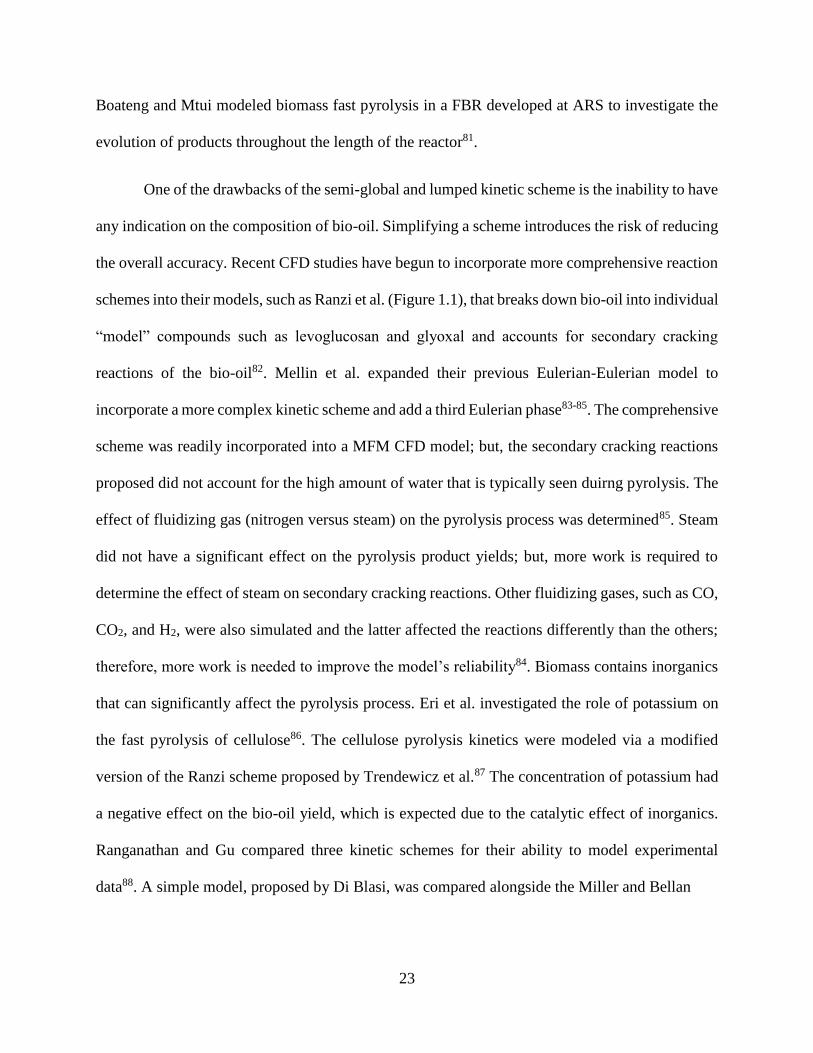
An expanded version of the single-step kinetic scheme was proposed by Zhou et al80. The
gas species was further decomposed into the major components of pyrolysis non-condensable
gases.
𝐺𝑎𝑠 = 𝛾1𝐶𝑂 + 𝛾2𝐶𝑂2 + 𝛾3𝐶𝐻4 + 𝛾4𝐻2 + 𝛾5𝐶2𝐻4
23
Boateng and Mtui modeled biomass fast pyrolysis in a FBR developed at ARS to investigate the
evolution of products throughout the length of the reactor81.
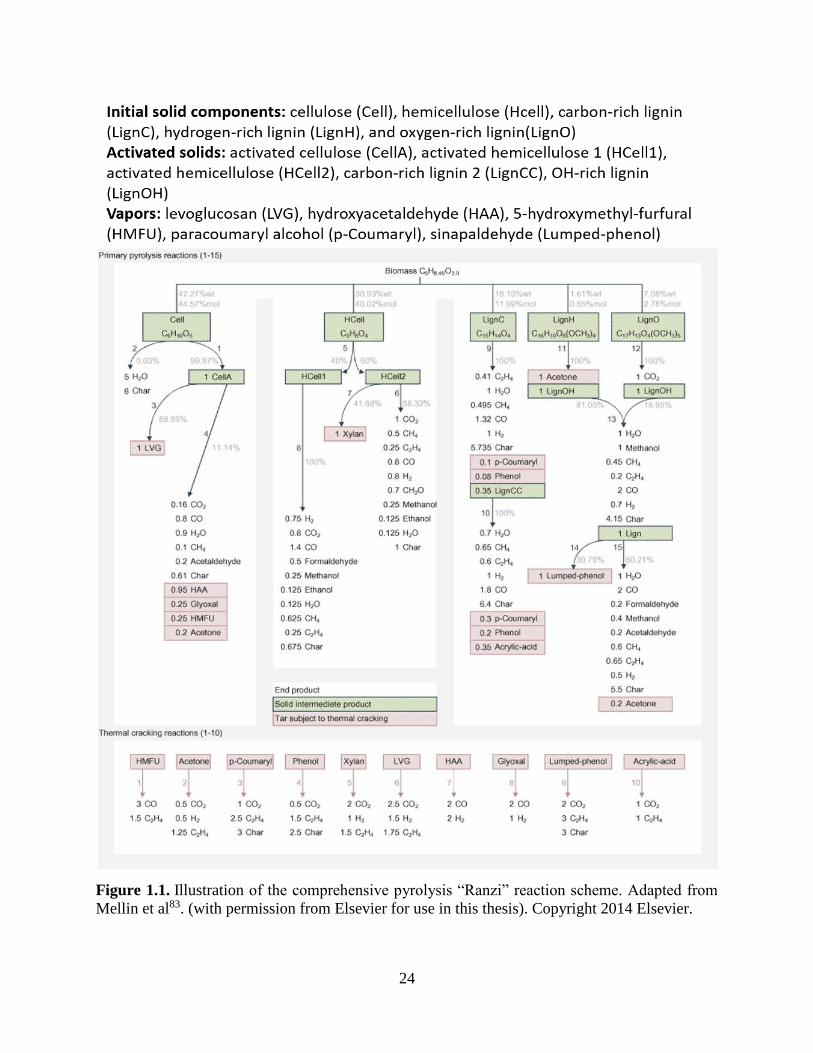
One of the drawbacks of the semi-global and lumped kinetic scheme is the inability to have
any indication on the composition of bio-oil. Simplifying a scheme introduces the risk of reducing
the overall accuracy. Recent CFD studies have begun to incorporate more comprehensive reaction
schemes into their models, such as Ranzi et al. (Figure 1.1), that breaks down bio-oil into individual
“model” compounds such as levoglucosan and glyoxal and accounts for secondary cracking
reactions of the bio-oil82. Mellin et al. expanded their previous Eulerian-Eulerian model to
incorporate a more complex kinetic scheme and add a third Eulerian phase83-85. The comprehensive
scheme was readily incorporated into a MFM CFD model; but, the secondary cracking reactions
proposed did not account for the high amount of water that is typically seen duirng pyrolysis. The
effect of fluidizing gas (nitrogen versus steam) on the pyrolysis process was determined85. Steam
did not have a significant effect on the pyrolysis product yields; but, more work is required to
determine the effect of steam on secondary cracking reactions. Other fluidizing gases, such as CO,
CO2, and H2, were also simulated and the latter affected the reactions differently than the others;
therefore, more work is needed to improve the model’s reliability84. Biomass contains inorganics
that can significantly affect the pyrolysis process. Eri et al. investigated the role of potassium on
the fast pyrolysis of cellulose86. The cellulose pyrolysis kinetics were modeled via a modified
version of the Ranzi scheme proposed by Trendewicz et al.87 The concentration of potassium had
a negative effect on the bio-oil yield, which is expected due to the catalytic effect of inorganics.
Ranganathan and Gu compared three kinetic schemes for their ability to model experimental
data88. A simple model, proposed by Di Blasi, was compared alongside the Miller and Bellan
24
Figure 1.1. Illustration of the comprehensive pyrolysis “Ranzi” reaction scheme. Adapted from
Mellin et al83. (with permission from Elsevier for use in this thesis). Copyright 2014 Elsevier.
25
model as well as the primary Ranzi scheme53,82,89. The Ranzi scheme resulted in an improved
prediction of the yield of products.
Typically, CFD models are difficult to incorporate into macroscopic, large scale process
simulations. Trendewicz et al. developed a one-dimensional (1D) CFD model using the Ranzi
scheme, without the secondary cracking reactions, that can be used with existing biorefinery
process models90. The 1D model is seen as attractive due to the relative agreement between existing
two-dimensional (2D) models. Humbird et al. created a 1D fast pyrolysis reactor model to be
incorporated into an overall pyrolysis process model using Aspen Plus (Aspen Technology,
Bedford, MA, USA) with the hope of facilitating future development through modeling and
optimization91.
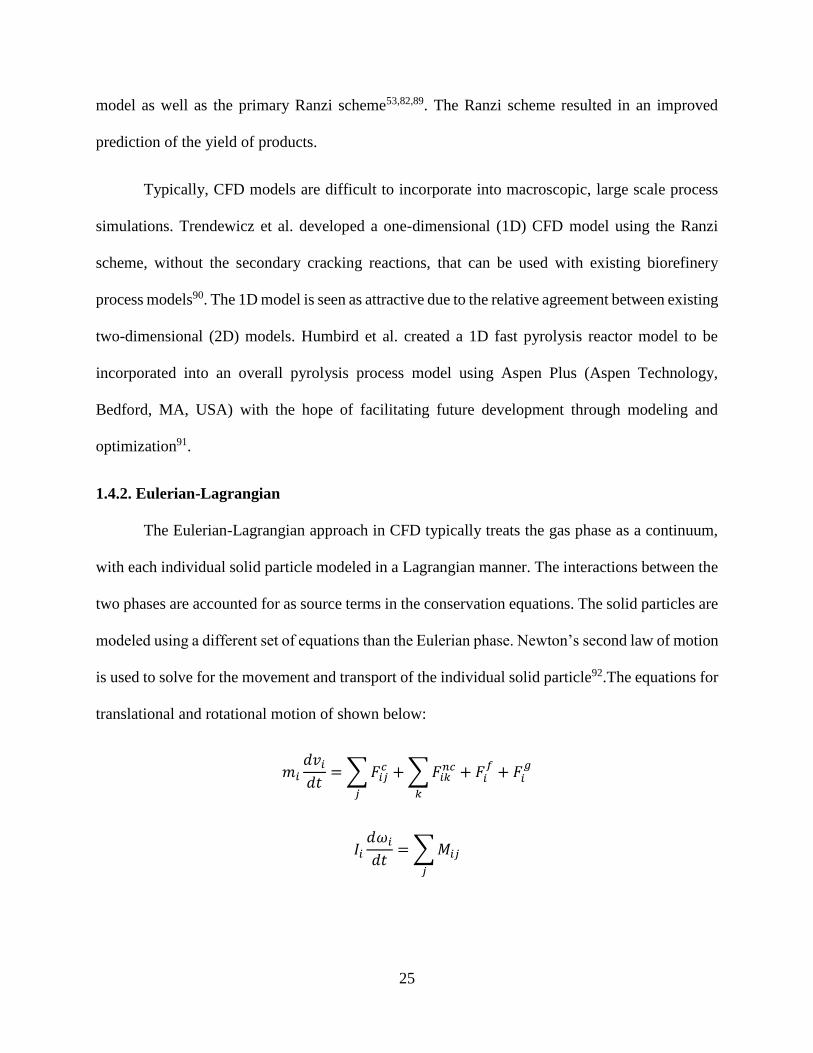
1.4.2. Eulerian-Lagrangian
The Eulerian-Lagrangian approach in CFD typically treats the gas phase as a continuum,
with each individual solid particle modeled in a Lagrangian manner. The interactions between the
two phases are accounted for as source terms in the conservation equations. The solid particles are
modeled using a different set of equations than the Eulerian phase. Newton’s second law of motion
is used to solve for the movement and transport of the individual solid particle92.The equations for
translational and rotational motion of shown below:
𝑚𝑖
𝑑𝑣𝑖𝑑𝑡
=∑𝐹𝑖𝑗𝑐
𝑗
+∑𝐹𝑖𝑘𝑛𝑐
𝑘
+ 𝐹𝑖𝑓+ 𝐹𝑖
𝑔
𝐼𝑖𝑑𝜔𝑖𝑑𝑡
=∑𝑀𝑖𝑗
𝑗
26
where 𝑚𝑖 is the mass of the particle, 𝑣𝑖 is the translational velocity of particle i, 𝐹𝑖𝑗𝑐 is the contact
force acting on the particle by another particle or the wall, 𝐹𝑖𝑘𝑛𝑐 is the non-contact force on the
particle from particle k or other sources, 𝐹𝑖𝑓is the particle-fluid interaction force on the particle,
𝐹𝑖𝑔
is the gravitational force, 𝜔𝑖 is the angular velocity of particle i, 𝐼𝑖 is the moment of inertia, and
𝑀𝑖𝑗 is the torque on particle i by particle k or walls92. Sub models are used to calculate specific
parameters that can be incorporated into a DEM simulation compared to a MFM, such as a particle
shrinkage model, the drag force, and the contact force acting on a particle. Depending on the
simulation setup, the DEM may need to simulate over a million individual particles. The DEM
approach provides more detailed information about the process than the MFM approach but
requires higher computational costs. Due to the large particle tracking requirement, DEM is not
practical for modeling industrial scale applications, but can be very useful on the lab scale.
Initial work on Eulerian-Lagrangian modeling of biomass pyrolysis focused on different
reactor setups, such as an entrained flow reactor, a drop tube reactor, and a vortex reactor93-103.
Fluidized bed reactors introduce additionally complexity to a CFD-DEM simulation. Fluidized
bed reactors add another solid phase, which if simulated using Lagrangian methods greatly
increases computational costs.
Papadikis et al. modeled pyrolysis in a FBR using CFD-DEM104-111. For the initial model,
a single cellulose particle was modeled in a fluidized bed located in Aston University using a
Broido-Shafizadeh kinetic scheme112.
𝐶𝑒𝑙𝑙𝑢𝑙𝑜𝑠𝑒𝑘1→ 𝐴𝑐𝑡𝑖𝑣𝑒 𝐶𝑒𝑙𝑙𝑢𝑙𝑜𝑠𝑒
𝐴𝑐𝑡𝑖𝑣𝑒 𝐶𝑒𝑙𝑙𝑢𝑙𝑜𝑠𝑒𝑘2→ 𝐶ℎ𝑎𝑟 𝑎𝑛𝑑 𝐺𝑎𝑠
27
𝐴𝑐𝑡𝑖𝑣𝑒 𝐶𝑒𝑙𝑙𝑢𝑙𝑜𝑠𝑒𝑘3→ 𝑉𝑎𝑝𝑜𝑢𝑟𝑠 𝑎𝑛𝑑 𝑊𝑎𝑡𝑒𝑟
𝑉𝑎𝑝𝑜𝑢𝑟𝑠 𝑎𝑛𝑑 𝑊𝑎𝑡𝑒𝑟𝑘4→ 𝐺𝑎𝑠
The effect of sand was not accounted for in the simulation and the fluidizing gas was the only
source of heat transfer to the particle. Following up on the preliminary CFD-DEM model, a two-
part study to develop a complete model of biomass fast pyrolysis of a single biomass particle using
in ANSYS Fluent107,111. In Part A, the heat and momentum transfer of a single particle in both 2D
and 3D setups were compared, while Part B incorporated reaction pyrolysis reaction kinetics to
develop a complete model of pyrolysis on a single biomass particle in a FBR. The sand phase was
modeled as a second Eulerian phase with only the biomass particle being tracked in a discrete
manner. Pyrolysis reaction kinetics were represented using the two-stage semi-global mechanism
described earlier66-68. The single particle CFD model produced yields similar to that of previous
single particle models. The simulations assumed that the biomass particle was perfectly spherical
and did not account for any particle shrinkage due to drying and volatilization. Particle shrinkage
has been shown to have a significant effect on pyrolysis reactions113. Papadikis et al. investigated
the effect of different particle shrinkage parameters during pyrolysis106. Lagrangian particle
tracking was able to calculate the positions of a particle throughout the reactor, which allowed for
analysis of char entrainment in the reactor. Various particle sizes were simulated to visualize how
size affects flow behavior108. Particle size also had significant impact on heat transfer to the
biomass during pyrolysis with smaller particles typically being preferred for pyrolysis in a FBR109.
Rabinovich et al. also found the size of the biomass particle was inversely proportional to the
biomass conversion achieved with larger particles114. Biomass particles were assumed to have a
sphericity of one in CFD-DEM simulations. Simulations carried out with different particle shape
28
(cubical and tetrahedral) found that particle shape significantly affected flow behavior and
residence time in the reactor110. Bruchmüller et al. incorporated the Miller and Bellan pyrolysis
scheme into a CFD-DEM model that simulated more than just a single particle115,116. Segregation
was seen to occur at lower fluidization velocities, leading to poorer mixing and heat transfer.
Mixing and heat transfer both affected the overall oil yield and quality from biomass pyrolysis116.
Much of the CFD-DEM work involving biomass pyrolysis in a FBR assumed sand behaved
as an Eulerian phase. The number of biomass particles in a FBR are orders of magnitude smaller
than the number of sand particles. Individually tracking the sand particles greatly increases the
computation cost for modeling of pyrolysis. Modeling the sand as a continuous phase reduces the
computational cost at the expense of more detailed information of biomass-sand particle
interactions.
1.5. Computational modeling of upgrading processes
Advances in computational power have made it possible to model biomass fast pyrolysis
with increasing accuracy. However, fast pyrolysis modeling does not account for the bio-oil
upgrading that is required to produce a useful fuel. Hydrodeoxygenation has been experimentally
tested in several ways; but, there is little literature available on the numerical modeling of HDO.
Gollakota et al. was one of the first to simulate HDO of bio-oil using CFD-MFM117. The effect of
the catalyst type on HDO was investigated over several operating conditions. A lumped kinetic
approach was adopted in the model, for which “heavy” non-volatiles (HNV) are deoxygenated to
“light” non-volatiles (LNV), alkanes and aromatics through five reactions118.
𝐻𝑁𝑉 𝑘1→ 𝐿𝑁𝑉
𝐻𝑁𝑉 𝑘2→ 𝐴𝑙𝑘𝑎𝑛𝑒 + 𝐴𝑟𝑜𝑚𝑎𝑡𝑖𝑐
29
𝐿𝑁𝑉 𝑘3→ 𝑃ℎ𝑒𝑛𝑜𝑙
𝑃ℎ𝑒𝑛𝑜𝑙 𝑘4→ 𝐴𝑙𝑘𝑎𝑛𝑒 + 𝐴𝑟𝑜𝑚𝑎𝑡𝑖𝑐
𝐴𝑙𝑘𝑎𝑛𝑒 + 𝐴𝑟𝑜𝑚𝑎𝑡𝑖𝑐 𝑘5→ 𝐶𝑜𝑘𝑒 +𝑊𝑎𝑡𝑒𝑟 𝑉𝑎𝑝𝑜𝑟 + 𝐺𝑎𝑠𝑒𝑠
The catalyst was shown to have a significant effect on phase behavior and product evolution.
Subramanyam et al. used the same reactor geometry to simulate the HDO of pyrolytic oil over a
Pt/Al2O3 catalyst119. Of the varied operating conditions, an increase of pressure was shown to
produce the greatest increases of production for the favorable products (alkanes and aromatics).
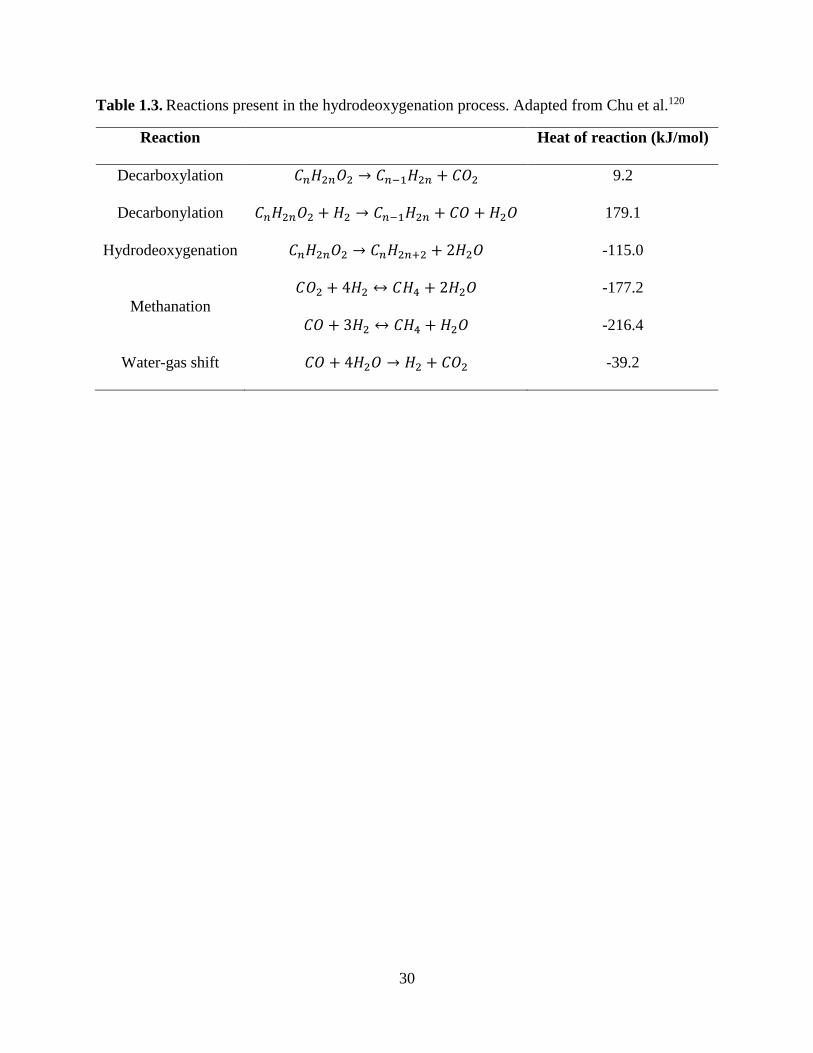
Numerical models have been explored as ways to simulate the HDO of bio-oil. Chu et al. modeled
the HDO process applied to camelina, carinata, and used cooking oil to produce renewable jet
fuel120. Conversion reactions were modeled using Microsoft Excel using HDO reactions from
Snåre et al. (Table 1.3) 121. The process energy requirements for the HDO process were also
calculated using Aspen Plus.
To the best of my knowledge there is no literature available dealing with CFD modeling of
biomass hydropyrolysis. Hydropyrolysis was initially employed for converting coal into valuable
compounds, and Ma et al. developed a CFD-DEM model to simulate hydropyrolysis of coal in a
rotating plasma reactor122. The results from this novel model compared well with experimental
testing and can serve as the groundwork for further optimization of the process.
There is a gap in the literature pertaining to modeling of advanced pyrolysis processes,
mainly the CFD modeling of hydropyrolysis. There is promising progress being made in modeling
fast pyrolysis. The complexity of HDO kinetics for bio-oil upgrading makes implementation into
a numerical model difficult. CFD modeling of these advanced pyrolysis processes have the
30
Table 1.3. Reactions present in the hydrodeoxygenation process. Adapted from Chu et al.120
Reaction Heat of reaction (kJ/mol)
Decarboxylation 𝐶𝑛𝐻2𝑛𝑂2 → 𝐶𝑛−1𝐻2𝑛 + 𝐶𝑂2 9.2
Decarbonylation 𝐶𝑛𝐻2𝑛𝑂2 + 𝐻2 → 𝐶𝑛−1𝐻2𝑛 + 𝐶𝑂 + 𝐻2𝑂 179.1
Hydrodeoxygenation 𝐶𝑛𝐻2𝑛𝑂2 → 𝐶𝑛𝐻2𝑛+2 + 2𝐻2𝑂 -115.0
Methanation
𝐶𝑂2 + 4𝐻2 ↔ 𝐶𝐻4 + 2𝐻2𝑂 -177.2
𝐶𝑂 + 3𝐻2 ↔ 𝐶𝐻4 + 𝐻2𝑂 -216.4
Water-gas shift 𝐶𝑂 + 4𝐻2𝑂 → 𝐻2 + 𝐶𝑂2 -39.2
31
potential to play an integral role moving forward in the optimization of high-quality bio-oil
production.
1.6. Conclusions
Pyrolysis of biomass produces a bio-oil that, after significant deoxygenation, can serve as
a renewable alternative to petroleum fuels. Advanced pyrolysis processes, such as catalytic fast
pyrolysis and hydropyrolysis, have been explored to develop an optimized, one-step process to
deoxygenate pyrolysis vapors to produce high quality fuels. The complexity of pyrolysis makes it
hard to analyze the behavior of the reaction environment. Therefore, computational modeling has
become an increasingly popular tool to help understand and optimize the process to maximize the
yield and quality of bio-oil. Both MFM and DEM approaches have been taken to simulate pyrolysis
in a FBR. DEM provides a more detailed description of the phenomena occurring at the particle
scale; but, the computational cost makes it very difficult to model larger scale problems. Work
continues to be done on improving the CFD modeling of biomass fast pyrolysis; however, little
literature is available for CFD modeling of the advanced pyrolysis processes. CFD modeling of
both pyrolysis and hydropyrolysis will play an important part of understanding the process and
designing future reactors.

32
List of references
33
(1) Mathioudakis, V.; Gerbens-Leenes, P. W.; Van der Meer, T. H.; Hoekstra, A. Y. The water
footprint of second-generation bioenergy: A comparison of biomass feedstocks and
conversion techniques. Journal of Cleaner Production 2017, 148, 571.
(2) Khan, A. A.; de Jong, W.; Jansens, P. J.; Spliethoff, H. Biomass combustion in fluidized
bed boilers: Potential problems and remedies. Fuel Processing Technology 2009, 90 (1),
21.
(3) Cheng, J.; Boca Raton : CRC Press: Boca Raton, 2010.
(4) Pandey, A.; Bhaskar, T.; Stöcker, M.; Sukumaran, R. Recent Advances in Thermochemical
Conversion of Biomass; Elsevier, 2015.
(5) Kan, T.; Strezov, V.; Evans, T. J. Lignocellulosic biomass pyrolysis: A review of product
properties and effects of pyrolysis parameters. Renewable and Sustainable Energy Reviews
2016, 57, 1126.
(6) Czernik, S.; Bridgwater, A. V. Overview of applications of biomass fast pyrolysis oil.
Energy & Fuels 2004, 18 (2), 590.
(7) Bridgwater, A. V. Review of fast pyrolysis of biomass and product upgrading. Biomass
Bioenergy 2012, 38, 68.
(8) Mohan, D.; Pittman, C. U.; Steele, P. H. Pyrolysis of Wood/Biomass for Bio-oil: A Critical
Review. Energy & Fuels 2006, 20 (3), 848.
(9) Bridgwater, A. V.; Meier, D.; Radlein, D. An overview of fast pyrolysis of biomass.
Organic Geochemistry 1999, 30 (12), 1479.
(10) Scott, D. S.; Majerski, P.; Piskorz, J.; Radlein, D. A second look at fast pyrolysis of
biomass—The RTI process. Journal of Analytical and Applied Pyrolysis 1999, 51 (1–2),
23.
(11) Venderbosch, R. H.; Prins, W. Fast pyrolysis technology development. Biofuels,
Bioproducts and Biorefining 2010, 4 (2), 178.
(12) Dickerson, T.; Soria, J. Catalytic fast pyrolysis: A review. Energies 2013, 6 (1), 514.
(13) Westerhof, R. J. M.; Kuipers, N. J. M.; Kersten, S. R. A.; van Swaaij, W. P. M. Controlling
the Water Content of Biomass Fast Pyrolysis Oil. Industrial & Engineering Chemistry
Research 2007, 46 (26), 9238.
(14) Talmadge, M. S.; Baldwin, R. M.; Biddy, M. J.; McCormick, R. L.; Beckham, G. T.;
Ferguson, G. A.; Czernik, S.; Magrini-Bair, K. A.; Foust, T. D.; Metelski, P. D.et al. A
perspective on oxygenated species in the refinery integration of pyrolysis oil. Green
Chemistry 2014, 16 (2), 407.
(15) Marker, T. L.; Felix, L. G.; Linck, M. B.; Roberts, M. J.; Ortiz-Toral, P.; Wangerow, J.
Integrated hydropyrolysis and hydroconversion (IH2®) for the direct production of
gasoline and diesel fuels or blending components from biomass, part 2: Continuous testing.
Environmental Progress & Sustainable Energy 2014, 33 (3), 762.
(16) Ruddy, D. A.; Schaidle, J. A.; Ferrell Iii, J. R.; Wang, J.; Moens, L.; Hensley, J. E. Recent
advances in heterogeneous catalysts for bio-oil upgrading via "ex situ catalytic fast
pyrolysis": Catalyst development through the study of model compounds. Green Chemistry
2014, 16 (2), 454.
(17) Liu, C.; Wang, H.; Karim, A. M.; Sun, J.; Wang, Y. Catalytic fast pyrolysis of
lignocellulosic biomass. Chemical Society Reviews 2014, 43 (22), 7594.
(18) Zhang, H.; Xiao, R.; Huang, H.; Xiao, G. Comparison of non-catalytic and catalytic fast
pyrolysis of corncob in a fluidized bed reactor. Bioresource Technology 2009, 100 (3),
1428.
34
(19) Yildiz, G.; Ronsse, F.; Prins, W.; Assink, D.; Gerritsen, L.; van Duren, R.; Rosso-Vasic,
M. 19th European Biomass Conference and Exhibition, Berlin, Germany, 2011; p 1145.
(20) Imran, A.; Bramer, E.; Seshan, K.; Brem, G. Catalytic Flash Pyrolysis of Biomass Using
Different Types of Zeolite and Online Vapor Fractionation. Energies 2016, 9 (3), 187.
(21) Thangalazhy-Gopakumar, S.; Adhikari, S.; Gupta, R. B.; Tu, M.; Taylor, S. Production of
hydrocarbon fuels from biomass using catalytic pyrolysis under helium and hydrogen
environments. Bioresource Technology 2011, 102 (12), 6742.
(22) Gollakota, A. R. K.; Reddy, M.; Subramanyam, M. D.; Kishore, N. A review on the
upgradation techniques of pyrolysis oil. Renewable and Sustainable Energy Reviews 2016,
58, 1543.
(23) Bridgwater, A. V. Catalysis in thermal biomass conversion. Applied Catalysis A: General
1994, 116 (1), 5.
(24) Williams, P. T.; Horne, P. A. The influence of catalyst regeneration on the composition of
zeolite-upgraded biomass pyrolysis oils. Fuel 1995, 74 (12), 1839.
(25) Bridgwater, A. V. Production of high grade fuels and chemicals from catalytic pyrolysis of
biomass. Catalysis Today 1996, 29 (1), 285.
(26) Bulushev, D. A.; Ross, J. R. H. Catalysis for conversion of biomass to fuels via pyrolysis
and gasification: A review. Catalysis Today 2011, 171 (1), 1.
(27) Furimsky, E. Catalytic hydrodeoxygenation. Applied Catalysis A: General 2000, 199 (2),
147.
(28) Topsøe, H.; Clausen, B. S.; Massoth, F. E. In Catalysis: Science and Technology;
Anderson, J. R.;Boudart, M., Eds.; Springer Berlin Heidelberg: Berlin, Heidelberg, 1996.
(29) Şenol, O. İ.; Viljava, T. R.; Krause, A. O. I. Hydrodeoxygenation of methyl esters on
sulphided NiMo/γ-Al2O3 and CoMo/γ-Al2O3 catalysts. Catalysis Today 2005, 100 (3),
331.
(30) Gutierrez, A.; Kaila, R. K.; Honkela, M. L.; Slioor, R.; Krause, A. O. I.
Hydrodeoxygenation of guaiacol on noble metal catalysts. Catalysis Today 2009, 147 (3),
239.
(31) Şenol, O. İ.; Ryymin, E. M.; Viljava, T. R.; Krause, A. O. I. Reactions of methyl heptanoate
hydrodeoxygenation on sulphided catalysts. Journal of Molecular Catalysis A: Chemical
2007, 268 (1), 1.
(32) Venderbosch, R. H.; Ardiyanti, A. R.; Wildschut, J.; Oasmaa, A.; Heeres, H. J.
Stabilization of biomass‐derived pyrolysis oils. Journal of Chemical Technology &
Biotechnology 2010, 85 (5), 674.
(33) Mortensen, P. M.; Grunwaldt, J. D.; Jensen, P. A.; Knudsen, K. G.; Jensen, A. D. A review
of catalytic upgrading of bio-oil to engine fuels. Applied Catalysis A: General 2011, 407
(1), 1.
(34) Elliott, D. C. Historical Developments in Hydroprocessing Bio-oils. Energy & Fuels 2007,
21 (3), 1792.
(35) Samolada, M. C.; Baldauf, W.; Vasalos, I. A. Production of a bio-gasoline by upgrading
biomass flash pyrolysis liquids via hydrogen processing and catalytic cracking. Fuel 1998,
77 (14), 1667.
(36) Ladelfa, C. J.; Greene, M. I. Economic evaluation of synthetic natural gas production by
short residence time hydropyrolysis of coal. Fuel Processing Technology 1978, 1 (3), 187.
(37) Dayton, D. C.; Carpenter, J.; Farmer, J.; Turk, B.; Gupta, R. Biomass hydropyrolysis in a
pressurized fluidized bed reactor. Energy & Fuels 2013, 27 (7), 3778.
35
(38) Venkatakrishnan, V. K.; Degenstein, J. C.; Smeltz, A. D.; Delgass, W. N.; Agrawal, R.;
Ribeiro, F. H. High-pressure fast-pyrolysis, fast-hydropyrolysis and catalytic
hydrodeoxygenation of cellulose: production of liquid fuel from biomass. Green Chemistry
2014, 16 (2), 792.
(39) Marker, T. L.; Felix, L. G.; Linck, M. B.; Roberts, M. J. Integrated hydropyrolysis and
hydroconversion (IH2®) for the direct production of gasoline and diesel fuels or blending
components from biomass, part 1: Proof of principle testing. Environmental Progress &
Sustainable Energy 2012, 31 (2), 191.
(40) Venkatakrishnan, V. K.; Delgass, W. N.; Ribeiro, F. H.; Agrawal, R. Oxygen removal from
intact biomass to produce liquid fuel range hydrocarbons via fast-hydropyrolysis and
vapor-phase catalytic hydrodeoxygenation. Green Chemistry 2015, 17 (1), 178.
(41) Melligan, F.; Hayes, M. H. B.; Kwapinski, W.; Leahy, J. J. A study of hydrogen pressure
during hydropyrolysis of Miscanthus x giganteus and online catalytic vapour upgrading
with Ni on ZSM-5. Journal of Analytical and Applied Pyrolysis 2013, 103, 369.
(42) Balagurumurthy, B.; Oza, T. S.; Bhaskar, T.; Adhikari, D. K. Renewable hydrocarbons
through biomass hydropyrolysis process: challenges and opportunities. Journal of Material
Cycles and Waste Management 2013, 15 (1), 9.
(43) He, S.; Boom, J.; van der Gaast, R.; Seshan, K. Hydro-pyrolysis of lignocellulosic biomass
over alumina supported Platinum, Mo2C and WC catalysts. Frontiers of Chemical Science
and Engineering 2018, 12 (1), 155.
(44) Resende, F. L. P. Recent advances on fast hydropyrolysis of biomass. Catalysis Today
2016, 269, 148.
(45) Roberts, M.; Marker, T.; Ortiz-Toral, P.; Linck, M.; Felix, L.; Wangerow, J.; Swanson, D.;
McLeod, C.; Del Paggio, A.; Urade, V.et al. “Refinery Upgrading of Hydropyrolysis Oil
From Biomass,”; Gas Technology Institute, Des Plaines, IL (United States), 2015.
(46) Tan, E. C. D.; Marker, T. L.; Roberts, M. J. Direct production of gasoline and diesel fuels
from biomass via integrated hydropyrolysis and hydroconversion process—A techno‐
economic analysis. Environmental Progress & Sustainable Energy 2014, 33 (2), 609.
(47) Dicks, A. L.; Pointon, K. D.; Siddle, A. Intrinsic reaction kinetics of methane steam
reforming on a nickel/zirconia anode. Journal of Power Sources 2000, 86 (1–2), 523.
(48) Grenoble, D. C.; Estadt, M. M.; Ollis, D. F. The chemistry and catalysis of the water gas
shift reaction. Journal of Catalysis 1981, 67 (1), 90.
(49) Cummings, R. M.; Mason, W. H.; Morton, S. A.; McDaniel, D. R. Applied Computational
Aerodynamics: A Modern Engineering Approach; Cambridge University Press, 2015.
(50) Ishii, M.; Mishima, K. Two-fluid model and hydrodynamic constitutive relations. Nuclear
Engineering and Design 1984, 82 (2), 107.
(51) Lathouwers, D.; Bellan, J. Modeling of dense gas–solid reactive mixtures applied to
biomass pyrolysis in a fluidized bed. International Journal of Multiphase Flow 2001, 27
(12), 2155.
(52) Lathouwers, D.; Bellan, J. Yield Optimization and Scaling of Fluidized Beds for Tar
Production from Biomass. Energy & Fuels 2001, 15 (5), 1247.
(53) Miller, R. S.; Bellan, J. A Generalized Biomass Pyrolysis Model Based on Superimposed
Cellulose, Hemicelluloseand Liqnin Kinetics. Combustion Science and Technology 1997,
126 (1-6), 97.
(54) Xue, Q.; Heindel, T. J.; Fox, R. O. A CFD model for biomass fast pyrolysis in fluidized-
bed reactors. Chemical Engineering Science 2011, 66 (11), 2440.
36
(55) Xue, Q.; Dalluge, D.; Heindel, T. J.; Fox, R. O.; Brown, R. C. Experimental validation and
CFD modeling study of biomass fast pyrolysis in fluidized-bed reactors. Fuel 2012, 97,
757.
(56) Xue, Q.; Fox, R. O. Computational Modeling of Biomass Thermochemical Conversion in
Fluidized Beds: Particle Density Variation and Size Distribution. Industrial & Engineering
Chemistry Research 2015, 54 (16), 4084.
(57) Mellin, P.; Zhang, Q.; Kantarelis, E.; Yang, W. An Euler–Euler approach to modeling
biomass fast pyrolysis in fluidized-bed reactors – Focusing on the gas phase. Applied
Thermal Engineering 2013, 58 (1), 344.
(58) Xiong, Q.; Kong, S.-C.; Passalacqua, A. Development of a generalized numerical
framework for simulating biomass fast pyrolysis in fluidized-bed reactors. Chemical
Engineering Science 2013, 99, 305.
(59) Xiong, Q.; Zhang, J.; Xu, F.; Wiggins, G.; Stuart Daw, C. Coupling DAEM and CFD for
simulating biomass fast pyrolysis in fluidized beds. Journal of Analytical and Applied
Pyrolysis 2016, 117, 176.
(60) Xiong, Q.; Xu, F.; Ramirez, E.; Pannala, S.; Daw, C. S. Modeling the impact of bubbling
bed hydrodynamics on tar yield and its fluctuations during biomass fast pyrolysis. Fuel
2016, 164, 11.
(61) Xiong, Q.; Kong, S.-C. Modeling effects of interphase transport coefficients on biomass
pyrolysis in fluidized beds. Powder Technology 2014, 262, 96.
(62) Xiong, Q.; Aramideh, S.; Passalacqua, A.; Kong, S.-C. BIOTC: An open-source CFD code
for simulating biomass fast pyrolysis. Computer Physics Communications 2014, 185 (6),
1739.
(63) Xiong, Q.; Aramideh, S.; Kong, S.-C. Modeling Effects of Operating Conditions on
Biomass Fast Pyrolysis in Bubbling Fluidized Bed Reactors. Energy & Fuels 2013, 27
(10), 5948.
(64) Boateng, A. A.; Daugaard, D. E.; Goldberg, N. M.; Hicks, K. B. Bench-Scale Fluidized-
Bed Pyrolysis of Switchgrass for Bio-Oil Production. Industrial & Engineering Chemistry
Research 2007, 46 (7), 1891.
(65) Dong, N. H.; Luo, K. H.; Wang, Q. Modeling of biomass pyrolysis in a bubbling fluidized
bed reactor: Impact of intra-particle heat conduction. Fuel Processing Technology 2017,
161, 199.
(66) Chan, W.-C. R.; Kelbon, M.; Krieger, B. B. Modelling and experimental verification of
physical and chemical processes during pyrolysis of a large biomass particle. Fuel 1985,
64 (11), 1505.
(67) Di Blasi, C. Analysis of Convection and Secondary Reaction Effects Within Porous Solid
Fuels Undergoing Pyrolysis. Combustion Science and Technology 1993, 90 (5-6), 315.
(68) Liden, A. G.; Berruti, F.; Scott, D. S. A kinetic model for the production of liquids from
the flash pyrolysis of biomass. Chemical Engineering Communications 1988, 65 (1), 207.
(69) Lee, Y. R.; Choi, H. S.; Park, H. C.; Lee, J. E. A numerical study on biomass fast pyrolysis
process: A comparison between full lumped modeling and hybrid modeling combined with
CFD. Computers & Chemical Engineering 2015, 82, 202.
(70) Sharma, A.; Wang, S.; Pareek, V.; Yang, H.; Zhang, D. Multi-fluid reactive modeling of
fluidized bed pyrolysis process. Chemical Engineering Science 2015, 123, 311.
37
(71) Lee, J. E.; Park, H. C.; Choi, H. S. Numerical Study on Fast Pyrolysis of Lignocellulosic
Biomass with Varying Column Size of Bubbling Fluidized Bed. ACS Sustainable
Chemistry & Engineering 2017, 5 (3), 2196.
(72) Xiong, Q.; Aramideh, S.; Kong, S. C. Assessment of devolatilization schemes in predicting
product yields of biomass fast pyrolysis. Environmental Progress & Sustainable Energy
2014, 33 (3), 756.
(73) Armstrong, L. M.; Gu, S.; Luo, K. H.; Mahanta, P. Multifluid Modeling of the
Desulfurization Process within a Bubbling Fluidized Bed Coal Gasifier. AIChE Journal
2013, 59 (6), 1952.
(74) Zhou, W.; Zhao, C. S.; Duan, L. B.; Qu, C. R.; Chen, X. P. Two-dimensional computational
fluid dynamics simulation of coal combustion in a circulating fluidized bed combustor.
Chemical Engineering Journal 2011, 166 (1), 306.
(75) Zhong, H.; Zhang, J.; Zhu, Y.; Liang, S. Multi-fluid Modeling Biomass Fast Pyrolysis in
the Fluidized-Bed Reactor Including Particle Shrinkage Effects. Energy & Fuels 2016, 30
(8), 6440.
(76) Gai, C.; Zhang, Y.; Chen, W.-T.; Zhang, P.; Dong, Y. Thermogravimetric and kinetic
analysis of thermal decomposition characteristics of low-lipid microalgae. Bioresource
Technology 2013, 150, 139.
(77) Kim, S.-S.; Ly, H. V.; Choi, G.-H.; Kim, J.; Woo, H. C. Pyrolysis characteristics and
kinetics of the alga Saccharina japonica. Bioresource Technology 2012, 123, 445.
(78) López-González, D.; Fernandez-Lopez, M.; Valverde, J. L.; Sanchez-Silva, L. Pyrolysis of
three different types of microalgae: Kinetic and evolved gas analysis. Energy 2014, 73, 33.
(79) Azizi, S.; Mowla, D. In International Journal of Chemical Reactor Engineering, 2016;
Vol. 14.
(80) Zhou, H.; Jensen, A. D.; Glarborg, P.; Jensen, P. A.; Kavaliauskas, A. Numerical modeling
of straw combustion in a fixed bed. Fuel 2005, 84 (4), 389.
(81) Boateng, A. A.; Mtui, P. L. CFD modeling of space-time evolution of fast pyrolysis
products in a bench-scale fluidized-bed reactor. Applied Thermal Engineering 2012, 33-
34, 190.
(82) Ranzi, E.; Cuoci, A.; Faravelli, T.; Frassoldati, A.; Migliavacca, G.; Pierucci, S.;
Sommariva, S. Chemical kinetics of biomass pyrolysis. Energy & Fuels 2008, 22 (6), 4292.
(83) Mellin, P.; Kantarelis, E.; Yang, W. Computational fluid dynamics modeling of biomass
fast pyrolysis in a fluidized bed reactor, using a comprehensive chemistry scheme. Fuel
2014, 117, Part A, 704.
(84) Mellin, P.; Yu, X.; Yang, W.; Blasiak, W. Influence of Reaction Atmosphere (H2O, N2,
H2, CO2, CO) on Fluidized-Bed Fast Pyrolysis of Biomass Using Detailed Tar Vapor
Chemistry in Computational Fluid Dynamics. Industrial & Engineering Chemistry
Research 2015, 54 (33), 8344.
(85) Mellin, P.; Kantarelis, E.; Zhou, C.; Yang, W. Simulation of Bed Dynamics and Primary
Products from Fast Pyrolysis of Biomass: Steam Compared to Nitrogen as a Fluidizing
Agent. Industrial & Engineering Chemistry Research 2014, 53 (30), 12129.
(86) Eri, Q.; Zhao, X.; Ranganathan, P.; Gu, S. Numerical simulations on the effect of potassium
on the biomass fast pyrolysis in fluidized bed reactor. Fuel 2017, 197, 290.
(87) Trendewicz, A.; Evans, R.; Dutta, A.; Sykes, R.; Carpenter, D.; Braun, R. Evaluating the
effect of potassium on cellulose pyrolysis reaction kinetics. Biomass and Bioenergy 2015,
74, 15.
38
(88) Ranganathan, P.; Gu, S. Computational fluid dynamics modelling of biomass fast pyrolysis
in fluidised bed reactors, focusing different kinetic schemes. Bioresource Technology
2016, 213, 333.
(89) Di Blasi, C. Kinetic and Heat Transfer Control in the Slow and Flash Pyrolysis of Solids.
Industrial & Engineering Chemistry Research 1996, 35 (1), 37.
(90) Trendewicz, A.; Braun, R.; Dutta, A.; Ziegler, J. One dimensional steady-state circulating
fluidized-bed reactor model for biomass fast pyrolysis. Fuel 2014, 133, 253.
(91) Humbird, D.; Trendewicz, A.; Braun, R.; Dutta, A. One-Dimensional Biomass Fast
Pyrolysis Model with Reaction Kinetics Integrated in an Aspen Plus Biorefinery Process
Model. ACS Sustainable Chemistry & Engineering 2017, 5 (3), 2463.
(92) Zhu, H. P.; Zhou, Z. Y.; Yang, R. Y.; Yu, A. B. Discrete particle simulation of particulate
systems: Theoretical developments. Chemical Engineering Science 2007, 62 (13), 3378.
(93) Miller, R. S.; Bellan, J. Numerical Simulation of Vortex Pyrolysis Reactors for
Condensable Tar Production from Biomass. Energy & Fuels 1998, 12 (1), 25.
(94) Brown, A. L.; Dayton, D. C.; Nimlos, M. R.; Daily, J. W. Design and Characterization of
an Entrained Flow Reactor for the Study of Biomass Pyrolysis Chemistry at High Heating
Rates. Energy & Fuels 2001, 15 (5), 1276.
(95) Simone, M.; Biagini, E.; Galletti, C.; Tognotti, L. Evaluation of global biomass
devolatilization kinetics in a drop tube reactor with CFD aided experiments. Fuel 2009, 88
(10), 1818.
(96) Ren, B.; Zhong, W.; Jin, B.; Yuan, Z.; Lu, Y. Computational Fluid Dynamics (CFD)–
Discrete Element Method (DEM) Simulation of Gas–Solid Turbulent Flow in a Cylindrical
Spouted Bed with a Conical Base. Energy & Fuels 2011, 25 (9), 4095.
(97) Ku, X.; Li, T.; Løvås, T. Effects of Particle Shrinkage and Devolatilization Models on
High-Temperature Biomass Pyrolysis and Gasification. Energy & Fuels 2015, 29 (8),
5127.
(98) Li, T.; Wang, L.; Ku, X.; Güell, B. M.; Løvås, T.; Shaddix, C. R. Experimental and
Modeling Study of the Effect of Torrefaction on the Rapid Devolatilization of Biomass.
Energy & Fuels 2015, 29 (7), 4328.
(99) Wagenaar, B. M.; Prins, W.; van Swaaij, W. P. M. Pyrolysis of biomass in the rotating
cone reactor: modelling and experimental justification. Chemical Engineering Science
1994, 49 (24, Part 2), 5109.
(100) Tchapda, A. H.; Pisupati, S. V. Characterization of an entrained flow reactor for pyrolysis
of coal and biomass at higher temperatures. Fuel 2015, 156, 254.
(101) Johansen, J. M.; Gadsbøll, R.; Thomsen, J.; Jensen, P. A.; Glarborg, P.; Ek, P.; De Martini,
N.; Mancini, M.; Weber, R.; Mitchell, R. E. Devolatilization kinetics of woody biomass at
short residence times and high heating rates and peak temperatures. Applied Energy 2016,
162, 245.
(102) Ku, X.; Li, T.; Løvås, T. Eulerian–Lagrangian Simulation of Biomass Gasification
Behavior in a High-Temperature Entrained-Flow Reactor. Energy & Fuels 2014, 28 (8),
5184.
(103) Papadikis, K.; Gu, S.; Bridgwater, A. V.; Gerhauser, H. Application of CFD to model fast
pyrolysis of biomass. Fuel Processing Technology 2009, 90 (4), 504.
(104) Papadikis, K.; Gerhauser, H.; Bridgwater, A. V.; Gu, S. CFD modelling of the fast
pyrolysis of an in-flight cellulosic particle subjected to convective heat transfer. Biomass
and Bioenergy 2009, 33 (1), 97.
39
(105) Papadikis, K.; Gu, S.; Fivga, A.; Bridgwater, A. V. Numerical Comparison of the Drag
Models of Granular Flows Applied to the Fast Pyrolysis of Biomass. Energy & Fuels 2010,
24 (3), 2133.
(106) Papadikis, K.; Gu, S.; Bridgwater, A. V. CFD modelling of the fast pyrolysis of biomass
in fluidised bed reactors: Modelling the impact of biomass shrinkage. Chemical
Engineering Journal 2009, 149 (1), 417.
(107) Papadikis, K.; Gu, S.; Bridgwater, A. V. CFD modelling of the fast pyrolysis of biomass
in fluidised bed reactors. Part B: Heat, momentum and mass transport in bubbling fluidised
beds. Chemical Engineering Science 2009, 64 (5), 1036.
(108) Papadikis, K.; Gu, S.; Bridgwater, A. V. A CFD approach on the effect of particle size on
char entrainment in bubbling fluidised bed reactors. Biomass and Bioenergy 2010, 34 (1),
21.
(109) Papadikis, K.; Gu, S.; Bridgwater, A. V. Computational modelling of the impact of particle
size to the heat transfer coefficient between biomass particles and a fluidised bed. Fuel
Processing Technology 2010, 91 (1), 68.
(110) Papadikis, K.; Gu, S.; Bridgwater, A. V. 3D simulation of the effects of sphericity on char
entrainment in fluidised beds. Fuel Processing Technology 2010, 91 (7), 749.
(111) Papadikis, K.; Bridgwater, A. V.; Gu, S. CFD modelling of the fast pyrolysis of biomass
in fluidised bed reactors, Part A: Eulerian computation of momentum transport in bubbling
fluidised beds. Chemical Engineering Science 2008, 63 (16), 4218.
(112) Bradbury, A. G. W.; Sakai, Y.; Shafizadeh, F. A kinetic model for pyrolysis of cellulose.
Journal of Applied Polymer Science 1979, 23 (11), 3271.
(113) Babu, B. V.; Chaurasia, A. S. Heat transfer and kinetics in the pyrolysis of shrinking
biomass particle. Chemical Engineering Science 2004, 59 (10), 1999.
(114) Rabinovich, O. S.; Borodulya, V. A.; Vinogradov, L. M.; Korban, V. V. Fast pyrolysis of
an ensemble of biomass particles in a fluidized bed. Journal of Engineering Physics and
Thermophysics 2010, 83 (4), 742.
(115) Bruchmüller, J.; van Wachem, B. G. M.; Gu, S.; Luo, K. H.; Brown, R. C. Modeling the
thermochemical degradation of biomass inside a fast pyrolysis fluidized bed reactor.
AIChE Journal 2012, 58 (10), 3030.
(116) Bruchmüller, J.; Luo, K. H.; van Wachem, B. G. M. Tar formation variations during
fluidised bed pyrolytic biomass conversion. Proceedings of the Combustion Institute 2013,
34 (2), 2373.
(117) Gollakota, A. R. K.; Subramanyam, M. D.; Kishore, N.; Gu, S. CFD simulations on the
effect of catalysts on the hydrodeoxygenation of bio-oil. RSC Advances 2015, 5 (52),
41855.
(118) Sheu, Y.-H. E.; Anthony, R. G.; Soltes, E. J. Kinetic studies of upgrading pine pyrolytic
oil by hydrotreatment. Fuel Processing Technology 1988, 19 (1), 31.
(119) Subramanyam, M. D.; Gollakota, A. R. K.; Kishore, N. CFD simulations of catalytic
hydrodeoxygenation of bio-oil using Pt/Al2O3 in a fixed bed reactor. RSC Advances 2015,
5 (110), 90354.
(120) Chu, P. L.; Vanderghem, C.; MacLean, H. L.; Saville, B. A. Process modeling of
hydrodeoxygenation to produce renewable jet fuel and other hydrocarbon fuels. Fuel 2017,
196, 298.

40
(121) Snåre, M.; Kubičková, I.; Mäki-Arvela, P.; Eränen, K.; Murzin, D. Y. Heterogeneous
Catalytic Deoxygenation of Stearic Acid for Production of Biodiesel. Industrial &
Engineering Chemistry Research 2006, 45 (16), 5708.
(122) Ma, J.; Zhang, M.; Su, B.; Wen, G.; Yang, Y.; Yang, Q.; Ren, Q. Numerical simulation of
the entrained flow hydropyrolysis of coal in magnetically rotating plasma reactor. Energy
Conversion and Management 2017, 148, 431.
41
CHAPTER 2 INTERMEDIATE TEMPERATURE WATER-GAS
SHIFT KINETICS FOR HYDROGEN PRODUCTION
42
This chapter has been prepared as a manuscript for submission to an academic journal upon
completion of the thesis.
I am the lead author on this manuscript. I was responsible for design and conducting the
experimental kinetic testing. I was responsible for interpreting the experimental data and fitting
the results to existing kinetic models. The other authors on this work are Drs. Nourredine
Abdoulmoumine and Nicole Labbé.
Abstract
Biomass pyrolysis vapors have limited applications due chiefly to the high oxygen content.
Hydrodeoxygenation has shown to be an efficient method to remove oxygen from pyrolysis vapors
without sacrificing carbon. The goal of this chapter is to investigate hydrogen production for
deoxygenation via the water-gas shift (WGS) reaction using carbon monoxide (CO), one of the
significant non-condensable gases of pyrolysis, and steam, a by-product of hydrodeoxygenation,
as reactants. The WGS reaction is typically carried out as a low-temperature shift (LTS;150-
300 °C) or a high-temperature shift (HTS; 300-500 °C) with each shift using a different catalyst.
In this chapter, the WGS experiments were performed at an intermediate temperature range of
200-400 °C over a copper (Cu) based catalyst using a bench-scale catalytic plug flow reactor (PFR)
in a CO-lean environment (70 vol. % steam, 20 vol. % He, and 10 vol. % CO). The experimental
temperatures were tested over three different weight hourly space velocities (WHSV =1220, 2040,
and 6110 cm3/g-min). Our results show that CO conversion increases with increasing temperature
and catalyst weight, with a maximum CO conversion of 94% for temperatures >300 °C.
Experimental conversion data were fitted to three proposed mechanistic models, two Langmuir-
Hinshelwood (LH) and one redox mechanism, as well as a reduced order empirical power law
model (ROM). The second LH model provided the best fit for each WHSV with apparent
43
activation energy between 45 and 65 kJ/mol. The ROM yielded activation energies between 20
and 41 kJ/mol.
2.1. Introduction
Over the past few decades, increasing environmental concern about climate change
coupled with the energy and fuel demand of emerging economies, the forecasted depletion of crude
petroleum reserves and the continuous instabilities in major oil-producing regions encouraged the
development of sustainable and renewable energy systems1,2. In this regard, the production of bio-
oil or biocrude through pyrolysis is attractive as an alternative to crude petroleum3-5. In general,
when bio-oil is produced through conventional pyrolysis, it contains high oxygen content (~40-50
wt. %) while crude petroleum oil contains less than 1 wt. % 6,7. The high oxygen content of bio-
oil presents a problem for co-processing it with crude petroleum in existing refineries. Thus, bio-
oil deoxygenation is vital to unlock its potential and leverage the capital already invested in
existing refineries. It is presently carried out through hydrodeoxygenation (HDO) via either ex-
situ on condensed bio-oil8-10 or in-situ on vapors through advanced pyrolysis processes like
hydropyrolysis11,12. In these advanced hydropyrolysis processes, external hydrogen is commonly
introduced into the pyrolysis reactor at moderate pressures (20-40 bar) in the presence of an HDO
catalyst to upgrade bio-oil vapors in-situ13,14. The derived bio-oil reportedly has significantly less
oxygen content than conventional bio-oil with reported values as low as 0.4 wt. % 15. The main
drawback of these advanced processes is their hydrogen demand which at the moment is met by
reforming natural gas and light hydrocarbons generated during pyrolysis11,16. Of these two sources
of hydrogen, the former reduces the overall sustainability of the process by introducing a fossil-
based fuel in the process, and the latter is not sufficient alone to meet the total hydrogen demand.
Hydrous pyrolysis addresses this dilemma by integrating catalytic fast pyrolysis with the water-gas
44
shift (WGS) reaction to produce additional hydrogen and HDO for oxygen removal in one-pot.
This article is the first of a series that explores the feasibility of this concept through a combination
of experimental and computational fluid dynamics coupled with discrete element modeling
(CFD/DEM).
The WGS reaction, shown below, is widely used in several industrial applications to
generate hydrogen as shown below. Carbon monoxide (CO) reacts with steam (H2O) in the
presence of a catalyst to produce carbon dioxide and hydrogen. This reaction is especially fitting
in the context of pyrolysis since carbon monoxide is the most abundant non-condensable gas
product during fast pyrolysis and water is produced during HDO.17
𝐶𝑂 + 𝐻2𝑂 ↔ 𝐻2 + 𝐶𝑂2
When using syngas with a high concentration of carbon monoxide as observed in fast pyrolysis
syngas (>50 vol. %)17, the reaction is usually separated into two stages for increased conversion:
high-temperature shift (HTS) and low-temperature shift (LTS)18. The high- and low-temperature
shift are characterized by the reaction temperature as well as the catalyst used. The HTS takes
place above 300 °C, and the most common catalyst used is an iron/chromium oxide 19,20. The LTS
occurs in the range of 150 to 300 °C and typically utilizes a copper-based catalyst21. Multiple
kinetic models, such as the Langmuir-Hinshelwood (LH) and Eley-Rideal (ER), are available to
calculate the rate of reaction for WGS22. The kinetics of the WGS reaction have been heavily
investigated, however, there is still not a clear consensus on the kinetic model that best describes
the kinetics23,24. In previous studies, Langmuir-Hinshelwood type models have been shown to
provide the best experimental fit for the LTS over a Cu-based catalyst22,25,26. However, these types
of models are not well-suited to be incorporated in computationally expensive pyrolysis process
45
models (i.e., CFD and DEM models). Furthermore, processes, like hydrous pyrolysis that are better
represented by intermediate temperature shift (ITS) that covers both LTS and HTS temperature
domains, must rely on several kinetic models to cover their reaction conditions space. This study
looks to explore the middle ground between the LTS and HTS by developing mechanistic kinetics
for WGS at intermediate temperatures (200-400 °C) approaching that of biomass pyrolysis and
generating a unified reduced order model more easily and inexpensively integrated into hydrous
pyrolysis reactor process models.
2.2. Materials and experimental methodology
2.2.1. Catalyst preparation and characterization
A commercial copper based, low-temperature WGS catalyst (HiFUEL® W220) was
obtained from Alfa Aesar (Haverhill, MA, USA) and used for this study. The catalyst was first
size reduced by a mortar and pestle and sieved to particle sizes between 0.425 and 0.595 mm (30-
40 mesh). The catalyst was then characterized by physisorption of N2 for surface area and pore
volume. A Beckman Coulter surface area analyzer was used to determine the catalyst’s Brunauer-
Emmett-Teller (BET) surface area and total pore volume using nitrogen (N2) as an adsorbate. The
catalyst samples were outgassed for 60 min at 120 °C27. Additionally, the catalyst was tested for
the optimal reduction temperature using a temperature program reduction (TPR) by a
thermogravimetric analyzer (TGA) (Perkin Elmer, Pyris 1, Waltham, MA, USA)28-30.
Approximately 30 mg of catalyst were placed on the sample pan to undergo TPR. The sample was
then outgassed by heating to 105 °C at 25 °C/min, under a flow of helium, and maintained for 45
min to remove any adsorbate present in and on the catalyst. The outgassed sample was then heated
from 105 to 400 °C at a rate of 2 °C/min while a reducing gas (90% N2, 10% H2) was flowed
through the system. Upon completion, the sample’s differential thermogravimetric curve was
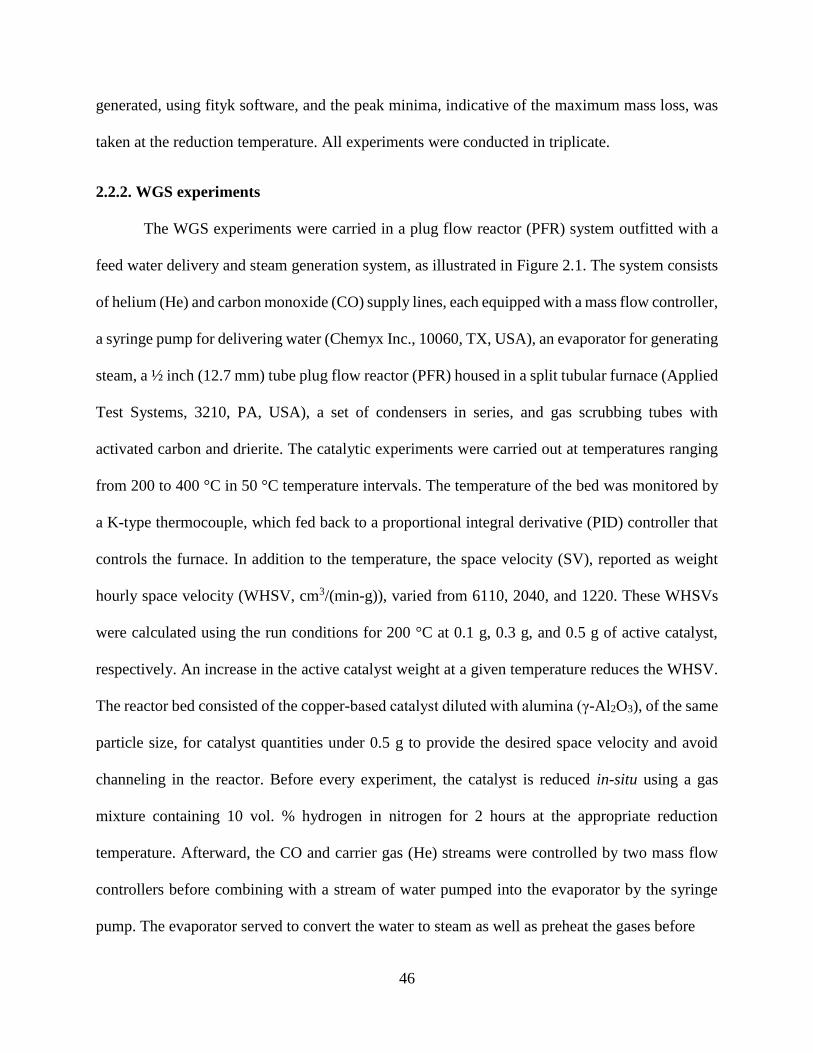
46
generated, using fityk software, and the peak minima, indicative of the maximum mass loss, was
taken at the reduction temperature. All experiments were conducted in triplicate.
2.2.2. WGS experiments
The WGS experiments were carried in a plug flow reactor (PFR) system outfitted with a
feed water delivery and steam generation system, as illustrated in Figure 2.1. The system consists
of helium (He) and carbon monoxide (CO) supply lines, each equipped with a mass flow controller,
a syringe pump for delivering water (Chemyx Inc., 10060, TX, USA), an evaporator for generating
steam, a ½ inch (12.7 mm) tube plug flow reactor (PFR) housed in a split tubular furnace (Applied
Test Systems, 3210, PA, USA), a set of condensers in series, and gas scrubbing tubes with
activated carbon and drierite. The catalytic experiments were carried out at temperatures ranging
from 200 to 400 °C in 50 °C temperature intervals. The temperature of the bed was monitored by
a K-type thermocouple, which fed back to a proportional integral derivative (PID) controller that
controls the furnace. In addition to the temperature, the space velocity (SV), reported as weight
hourly space velocity (WHSV, cm3/(min-g)), varied from 6110, 2040, and 1220. These WHSVs
were calculated using the run conditions for 200 °C at 0.1 g, 0.3 g, and 0.5 g of active catalyst,
respectively. An increase in the active catalyst weight at a given temperature reduces the WHSV.
The reactor bed consisted of the copper-based catalyst diluted with alumina (γ-Al2O3), of the same
particle size, for catalyst quantities under 0.5 g to provide the desired space velocity and avoid
channeling in the reactor. Before every experiment, the catalyst is reduced in-situ using a gas
mixture containing 10 vol. % hydrogen in nitrogen for 2 hours at the appropriate reduction
temperature. Afterward, the CO and carrier gas (He) streams were controlled by two mass flow
controllers before combining with a stream of water pumped into the evaporator by the syringe
pump. The evaporator served to convert the water to steam as well as preheat the gases before
47
Figure 2.1. Experimental catalytic reactor setup. 1. Carbon monoxide delivery lines; 2. Inert gas
(He) delivery line; 3. High-pressure syringe water pump; 4. Onboard steam generator with PID
controlled heaters; 5. Packed bed reactor with PID controller furnace heater; 6. Shell and tube heat
exchanger; 7. Liquid collection reservoir with bottom drain valve; 8. Overflow reservoir with a
bottom drain valve.
48
reaching the reactor. Upon entering the reactor, the CO and steam reacted with the catalyst to
produce hydrogen and carbon monoxide. The product gases were sent to a condenser to remove
any excess steam from the product stream. In this chapter, the WGS experiments were carried out
in a CO-lean environment (70 vol. % water, 20 vol. % He, and 10 vol. % CO) with a steam to
carbon monoxide ratio (S/C) ranging from 5 to 7. This setup favors higher CO conversion due to
CO acting as the limiting reactant.
At the outlet of the reactor, a slip stream of the effluent gas was continuously delivered to
a 6 port actuating valve with a 1 ml sampling loop connected to a SRI TCD/FID/FPD gas
chromatograph (GC) (SRI Instruments Inc., 8610C CA, USA) where the gas composition is
analyzed continuously while the rest is vented to the exhaust. The thermal conductivity detector
(TCD), with helium as the eluent, was used to analyze the products on a two-column system. The
first column, a molecular sieve 13x column, analyzes a majority of the products, mainly H2 and
CO, while the second column, Hayesep-N column, is used to separate the CO2.The temperature
program was set with an initial temperature of 40 °C and is held for 10 minutes before ramping to
80 °C with a rate of 20 °C/min. The only peak of interest was the CO peak. Before each experiment,
the GC was calibrated by using a calibration gas cylinder with the following concentrations: 5 vol.
% CO, 5 vol. % CO2, 5 vol. % N2, 4 vol. % oxygen (O2), 4 vol. % methane (CH4), 4 vol. % H2,
and balance helium. The GC sampling loop was flushed with the calibration gas and the analysis
was repeated at least three times. The area under the CO peaks was averaged to generate a single
point calibration curve. Before starting each experiment, the initial flowrates of CO and He were
sent to the GC to determine the initial concentration of the CO entering the reactor. The product
stream was analyzed in the GC and the final CO concentration and conversion was determined for
each experimental condition.
49
2.3. Kinetic analysis and modeling
2.3.1. Kinetic data analysis
Using well-documented WGS reaction mechanisms and data obtained from the laboratory
scale experiments, kinetic parameters, such as the reaction order, rate constant, and activation
energy, were derived 31. Preliminary screening was carried out to test for external mass transfer
and diffusion limitations for the proposed operating conditions. The mass transfer coefficient is
inversely proportional to the boundary layer thickness. At lower velocities, the boundary layer is
thick and the mass transfer rate limits the overall reaction rate while at higher velocities, reactants
and products diffuse across the boundary layer quickly and mass transfer no longer limits the
reaction31. If there are external mass transfer limitations, the higher gas velocities will lead to a
higher conversion of CO.
External mass transfer limitations were assessed using the Carberry number (Ca)32. Ca is a
ratio of the observed reaction rate to the maximum external mass transfer rate, shown below
𝐶𝑎 = (−𝑟𝐶𝑂
𝑜𝑏𝑠)𝜌𝑐
𝑎′𝑘𝑓𝐶𝐶𝑂𝑏 < 0.05
where −𝑟𝐶𝑂𝑜𝑏𝑠 is the observed reaction rate, 𝜌𝑐 is the density of the catalyst particle, 𝑎′ is the specific
external surface area of the catalyst particle, 𝑘𝑓 is the mass transfer coefficient, and 𝐶𝐶𝑂𝑏 is the CO
concentration in the bulk phase33. Furthermore, internal diffusion limitations tests were carried out
using the Weisz-Prater criterion.
(−𝑟𝐶𝑂𝑜𝑏𝑠𝜌𝑐𝑅𝑝
2)
(𝐷𝑒𝐶𝐴𝑠)≪ 1
50
where 𝑅𝑝 is the mean radius of the catalyst particle (m), 𝐷𝑒 is the effective diffusivity of CO in the
catalyst (m2/s), and 𝐶𝐴𝑠 is the CO concentration on the catalyst surface. The effective diffusivity is
calculated value using properties of the catalyst
𝐷𝑒 =D𝜑𝑝𝜎
𝜏
where D is the diffusion coefficient of CO in steam, 𝜑𝑝 is the porosity of the catalyst particle that
is the product of the pore volume and the effective particle density and has a typical value of 0.4
for a catalyst pellet. 𝜎 is the constriction factor with a typical value of 0.8, and 𝜏 is the tortuosity
with a typical value of 3.034,35. If the criteria are satisfied, there is no external or internal diffusion
limitation.
A nonlinear regression analysis was run on the data for each rate law tested. Model
discrimination was carried out by applying multiple statistical tests, such as an F test, root mean
squared error (RMSE), mean absolute error (MAE), a goodness of fit (FIT), and the Akaike
Information Criterion (AIC). The optimum parameters were determined by minimizing the RMSE,
MAE, and FIT.
2.3.2. Thermodynamic analysis
The WGS reaction is a reversible, exothermic reaction and thermal equilibrium is more
rapidly achieved at higher temperatures20. Due to the exothermic nature of the reaction, the
equilibrium constant as well as the carbon monoxide tend to decrease as temperature increases36
𝐾𝑒𝑞 = [𝐻2]𝑒𝑞[𝐶𝑂2]𝑒𝑞[𝐶𝑂]𝑒𝑞[𝐻2𝑂]𝑒𝑞
51
The equilibrium conversion of CO depends on the molar ratio of steam to CO supplied to the
system. Therefore, the equilibrium constant can be rewritten
𝐾𝑒𝑞 = 𝑋2
(1 − 𝑋)(𝑆𝐶 − 𝑋)
where X is the conversion of CO and S/C is the molar ratio of steam to CO (>1)18. A Matlab code
was developed to determine the theoretical equilibrium constant and equilibrium conversion.
2.3.3. Kinetic models
Multiple kinetic models have been explored to determine the reaction kinetics and rate of
reaction for the WGS reaction22. The mechanism of the WGS is primarily believed to proceed via
one of two pathways: an associative mechanism or a redox mechanism. At lower temperatures
(150-300 °C), the associative mechanism is accepted as prevalent at lower temperatures; however,
the prevalent mechanism at high temperature (300-500 °C) is still debated with no consensus yet
reached37,38. In the case of ITS, there are no proposed mechanisms specifically for the temperature
range between LTS and HTS. Therefore, the kinetic mechanisms investigated were the ones that
have shown to fit either the LTS or HTS. Three mechanistic models and one empirical model were
proposed to fit the experimental results. In all models, the Arrhenius equation was used to model
the temperature dependence of rate constants.
𝑘 = 𝐴0𝑒−𝐸𝐴𝑅𝑇
2.3.3.1. Langmuir-Hinshelwood mechanism and model
Armstrong and Hilditch proposed a model based on the Langmuir-Hinshelwood (LH)
mechanism, which is of the associative form, in 192039 where CO and H2O undergo adsorption
52
onto the catalyst surface to produce intermediates that desorb off the catalyst into the products of
CO2 and H240. Researchers have tried to prove the exact form of the intermediates on the catalyst
surface, such as formates36,41. Eight possible LH mechanisms with different active sites and
intermediate formation steps were looked at for WGS kinetic modeling of the LTS and two
associative mechanisms were shown to give the best fit25. Each LH mechanism was derived
through the elementary reactions of the WGS. The first LH mechanism (LH1) is described by the
following general reactions, where S represents a vacant adsorbing site on the catalyst and S* is
indicative of an adsorbed species (note: the S* bonds are not true covalent bonds, therefore, the
octet rule is not violated25,40:
𝐶𝑂 + 𝑆 ↔ 𝐶𝑂 ∗ 𝑆
𝐻2𝑂 + 𝑆 ↔ 𝐻2𝑂 ∗ 𝑆
𝐶𝑂 ∗ 𝑆 + 𝐻2𝑂 ∗ 𝑆 ↔ 𝐶𝑂2 ∗ 𝑆 + 𝐻2 ∗ 𝑆
𝐻2 ∗ 𝑆 ↔ 𝐻2 + 𝑆
𝐶𝑂2 ∗ 𝑆 ↔ 𝐶𝑂2 + 𝑆
For the LH1, the rate-limiting step (RLS) is the reaction between adsorbed species. The second
LH mechanism (LH2) undergoes the same initial reactions of CO and H2O adsorbing onto an
active site. The differences between the two mechanisms occur from the adsorbed species reacting
to form the intermediate and are carried on through the formation of CO2 and H2.
𝐶𝑂 + 𝑆 ↔ 𝐶𝑂 ∗ 𝑆
𝐻2𝑂 + 𝑆 ↔ 𝐻2𝑂 ∗ 𝑆
53
𝐶𝑂 ∗ 𝑆 + 𝐻2𝑂 ∗ 𝑆 ↔ 𝐶𝑂𝑂𝐻 ∗ 𝑆 + 𝐻 ∗ 𝑆
𝐶𝑂𝑂𝐻 ∗ 𝑆 ↔ 𝐶𝑂2 + 𝐻 ∗ 𝑆
2𝐻 ∗ 𝑆 ↔ 𝐻2 + 2𝑆
The RLS for the second mechanism is also the surface reaction between the adsorbed species;
however, this time to produce a formate intermediate and adsorbed hydrogen.
2.3.3.2. Redox mechanism and model
In 1949, Kulkova and Temkin hypothesized that the WGS proceeded through a series of
reduction and oxidation reactions where water disassociated onto the catalyst surface to produce
hydrogen, and then CO reduced the catalyst surface to produce CO2.
𝐻2𝑂 +∗ ↔ 𝐻2 + 𝑂 ∗
𝐶𝑂 + 𝑂 ∗ ↔ 𝐶𝑂2 + ∗
where * represents a vacant active site similar to in the associate mechanism42. The RLS for the
proposed reduction mechanism consists of water adsorbing on an active site and releasing
hydrogen while oxidizing the vacant site26. The regenerative, or reduction, mechanism provides a
better fit for the HTS experiments rather than the LTS43. While the LH mechanisms have a
consensus for being the mechanism for the LTS, the predominant mechanism is still up for debate.
The HTS is typically thought to proceed through either a redox mechanism or an LH
mechanism44,45. The intermediate nature of these experiments requires looking at models that have
been proposed for both LTS and HTS.
54
2.3.3.3. Reduced order model
In addition to the mechanistic models, the experimental data were fit to a reduced order
model (ROM) to better facilitate incorporation of the derived WGS kinetics into pyrolysis process
models. ROMs are not dependent on specific reaction mechanism and are limited to specific
operating conditions24,40. Consequently, the rate expression is based on experimental data and
provides a simpler expression that is computationally lighter than the mechanistic expressions46.
The rate expression for the empirical power law is represented by
−𝑟𝐶𝑂 = 𝑘𝑃𝐶𝑂𝑎 𝑃𝐻2𝑂
𝑏 𝑃𝐻2𝑐 𝑃𝐶𝑂2
𝑑 (𝛽)
where 𝑎, 𝑏, 𝑐, and 𝑑 are the reaction orders for CO, H2O, H2, and CO2, respectively. 𝑃𝑖 is the partial
pressure of each species. The approach to equilibrium, 𝛽, is described below.
𝛽 = 1 −𝑃𝐻2𝑃𝐶𝑂2𝑃𝐶𝑂𝑃𝐻2𝑂
1
𝐾𝑒
2.3.4. Parameter estimation and model discrimination
A numerical optimization method was adopted for estimating the parameters of both the
mechanistic models and the empirical power law. A Matlab code was developed that utilizes an
ordinary differential equation (ODE) subroutine and non-linear regression analysis, using the non-
linear least squares solver function (lsqcurvefit), which has been used previously for kinetic
studies. The code was used to fit the experimental data to the proposed kinetic models47. The
lsqcurvefit function solves for parameters by minimizing the sum of squared residuals. Initial
guesses for parameters were taken from existing kinetic studies on the LTS WGS25,26,40.
Minimizing the RMSE, MAE, FIT, and AIC was the criteria for determining the optimum
parameters.
55
𝑅𝑀𝑆𝐸 = √1
𝑁∑(𝑦𝑖 − 𝐹(𝑘, 𝑥𝑖))
2𝑁
𝑖=1
𝑀𝐴𝐸 = 1
𝑁∑|𝑦𝑖 − 𝐹(𝑘, 𝑥𝑖)|
𝑁
𝑖=1
𝐹𝐼𝑇 = 100∑
(𝑦𝑖 − 𝐹(𝑘, 𝑥𝑖))2
𝑁2𝑁𝑖=1
𝑒𝑥𝑝𝑒𝑟𝑖𝑚𝑒𝑛𝑡𝑎𝑙𝑚𝑎𝑥
𝐴𝐼𝐶 = 𝑁 ∗ 𝑙𝑜𝑔 (∑(𝑦𝑖 − 𝐹(𝑘, 𝑥𝑖))
2
𝑁) + 2𝑘
where 𝐹(𝑘, 𝑥𝑖) are the values calculated by the model, k is the number of parameters being
optimized, N is the number of observations, and 𝑦𝑖 is the experiental data, and experimentalmax is
the maximum observed value48,49. Conversion data from the GC is only available for every 13
minutes. Therefore, data points for the range of CO conversion were interpolated using a piecewise
cubic Hermite interpolating polynomial (PCHIP) function. After interpolating, 100 data points
were used for parameter optimization.
Model discrimination was carried out through comparison of the results of all the statistical
tests. The AIC50 takes the number of parameters and the sample size and the residual sum of
squares into account. This model allows for discrimination of different models with varying
numbers of parameters. A low AIC value correlates to a good statistical fit for the model.
Therefore, the model with the lowest AIC was determined to fit the data best.
56
2.4. Results
2.4.1. Catalyst characterization
The composition of the WGS catalyst used in this study is shown in Table 2.1. It is
comprised of copper (II) oxide, zinc oxide, aluminum oxide, and carbon in a weight percent ratio
of 52:30:17:1, respectively. Cu-based catalysts have been studied extensively for low-temperature
WGS reactions; however, the chemical composition of the oxide components can differ greatly.
Previous studies have used similar catalysts containing CuO/ZnO/Al2O3, but with a lower CuO
content24,25,36. Others impregnated copper onto a supported metal oxide with a maximum loading
of 20 wt. %21,51,52. The results of the BET surface area analysis are shown in Table 2.2. Gines et
al. characterized several CuO/ZnO/Al2O3 catalysts for BET surface area with compositions
relatively comparable to the catalyst in this study and found them to have slightly lower surface
areas (50-55 m2/g), which can be attributed to the difference in CuO/ZnO wt. % ratio53. Ayastuy
et al. reported a BET surface area of 92 m2/g and a pore volume of 0.29 cm3/g but used a catalyst
with a significant difference in elemental composition as well (24.9/43.7/31.4 wt. %
CuO/ZnO/Al2O3)25. Shen et al. used a CuO/ZnO/Al2O3 catalyst with a BET surface area of 77
m2/g, which is closer to what has been measured here54.
Additionally, the catalyst was tested for the optimal reduction temperature using
temperature program reduction (TPR). TPR produced a thermogravimetric (TG) curve mapping
the mass loss of the sample versus temperature. The TG data were then converted to a differential
thermogravimetric (DTG) curve, which showed the rate of mass loss versus temperature, and fit
to a curve using fityk software. A peak for the derivative of mass loss is indicative of reduction
because the catalyst is initially oxidized. As hydrogen is flown over the catalyst at increasing
temperatures, hydrogen will reduce the catalyst and remove the oxygen present in the oxide
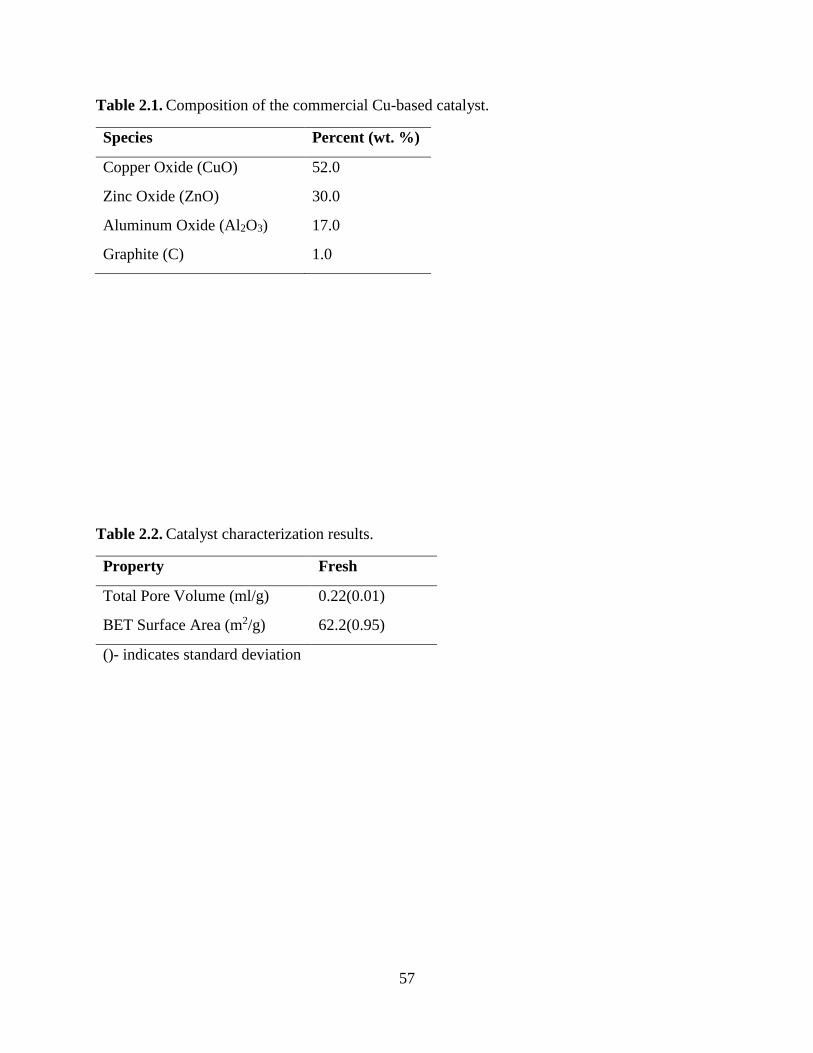
57
Table 2.1. Composition of the commercial Cu-based catalyst.
Species Percent (wt. %)
Copper Oxide (CuO) 52.0
Zinc Oxide (ZnO) 30.0
Aluminum Oxide (Al2O3) 17.0
Graphite (C) 1.0
Table 2.2. Catalyst characterization results.
Property Fresh
Total Pore Volume (ml/g) 0.22(0.01)
BET Surface Area (m2/g) 62.2(0.95)
()- indicates standard deviation
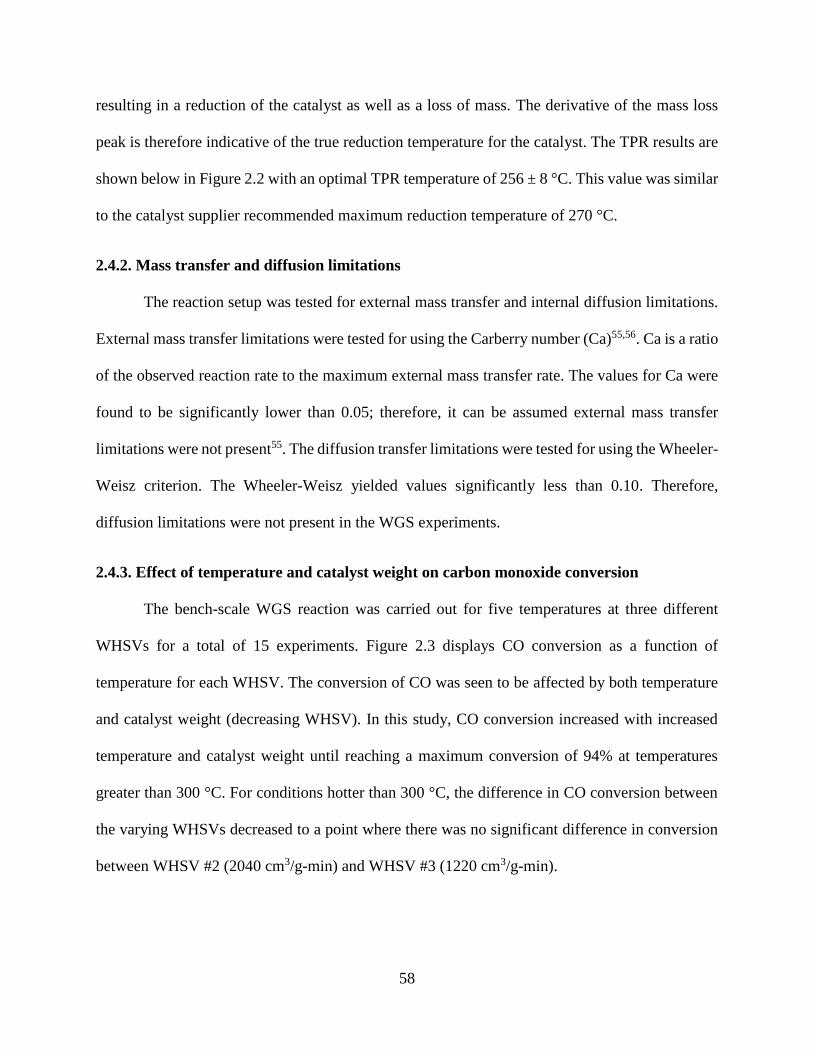
58
resulting in a reduction of the catalyst as well as a loss of mass. The derivative of the mass loss
peak is therefore indicative of the true reduction temperature for the catalyst. The TPR results are
shown below in Figure 2.2 with an optimal TPR temperature of 256 ± 8 °C. This value was similar
to the catalyst supplier recommended maximum reduction temperature of 270 °C.
2.4.2. Mass transfer and diffusion limitations
The reaction setup was tested for external mass transfer and internal diffusion limitations.
External mass transfer limitations were tested for using the Carberry number (Ca)55,56. Ca is a ratio
of the observed reaction rate to the maximum external mass transfer rate. The values for Ca were
found to be significantly lower than 0.05; therefore, it can be assumed external mass transfer
limitations were not present55. The diffusion transfer limitations were tested for using the Wheeler-
Weisz criterion. The Wheeler-Weisz yielded values significantly less than 0.10. Therefore,
diffusion limitations were not present in the WGS experiments.
2.4.3. Effect of temperature and catalyst weight on carbon monoxide conversion
The bench-scale WGS reaction was carried out for five temperatures at three different
WHSVs for a total of 15 experiments. Figure 2.3 displays CO conversion as a function of
temperature for each WHSV. The conversion of CO was seen to be affected by both temperature
and catalyst weight (decreasing WHSV). In this study, CO conversion increased with increased
temperature and catalyst weight until reaching a maximum conversion of 94% at temperatures
greater than 300 °C. For conditions hotter than 300 °C, the difference in CO conversion between
the varying WHSVs decreased to a point where there was no significant difference in conversion
between WHSV #2 (2040 cm3/g-min) and WHSV #3 (1220 cm3/g-min).
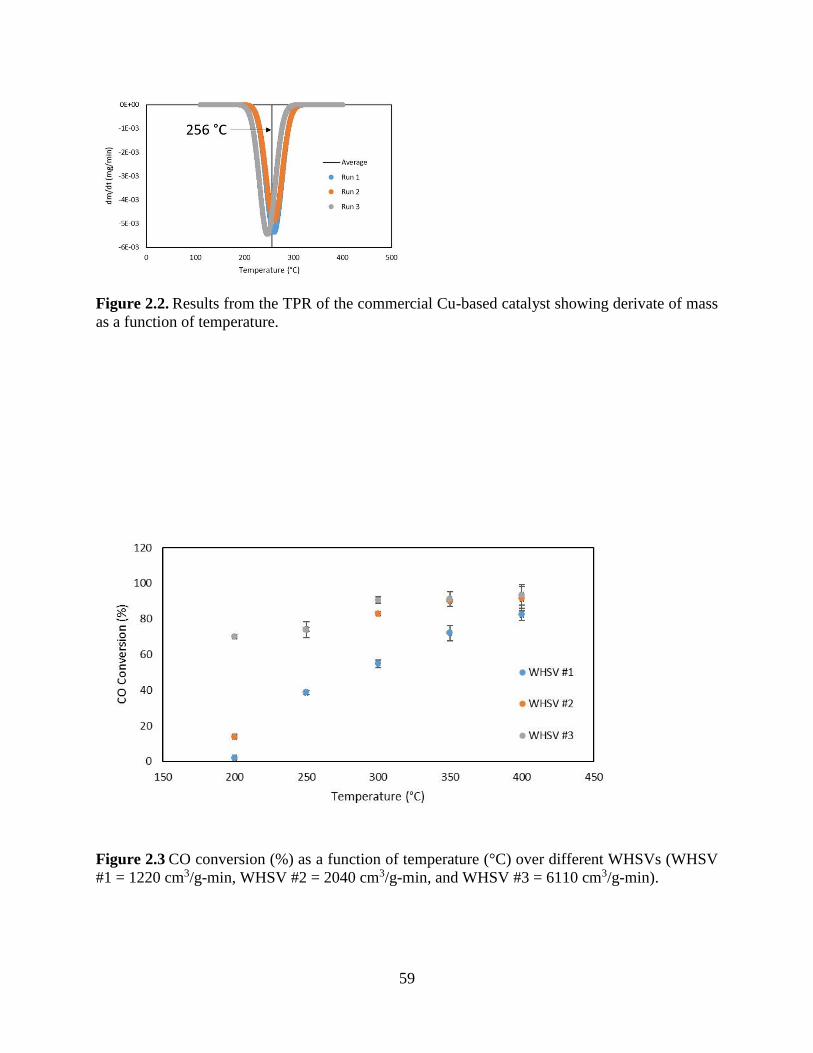
59
Figure 2.2. Results from the TPR of the commercial Cu-based catalyst showing derivate of mass
as a function of temperature.
Figure 2.3 CO conversion (%) as a function of temperature (°C) over different WHSVs (WHSV
#1 = 1220 cm3/g-min, WHSV #2 = 2040 cm3/g-min, and WHSV #3 = 6110 cm3/g-min).
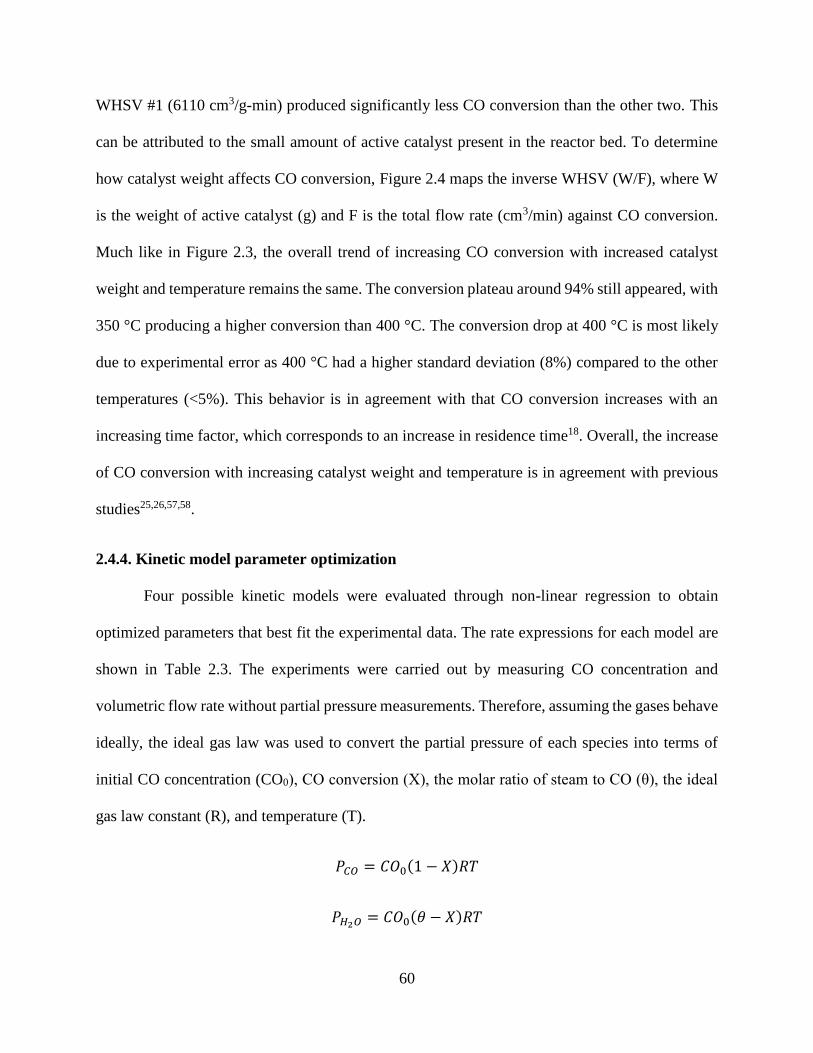
60
WHSV #1 (6110 cm3/g-min) produced significantly less CO conversion than the other two. This
can be attributed to the small amount of active catalyst present in the reactor bed. To determine
how catalyst weight affects CO conversion, Figure 2.4 maps the inverse WHSV (W/F), where W
is the weight of active catalyst (g) and F is the total flow rate (cm3/min) against CO conversion.
Much like in Figure 2.3, the overall trend of increasing CO conversion with increased catalyst
weight and temperature remains the same. The conversion plateau around 94% still appeared, with
350 °C producing a higher conversion than 400 °C. The conversion drop at 400 °C is most likely
due to experimental error as 400 °C had a higher standard deviation (8%) compared to the other
temperatures (<5%). This behavior is in agreement with that CO conversion increases with an
increasing time factor, which corresponds to an increase in residence time18. Overall, the increase
of CO conversion with increasing catalyst weight and temperature is in agreement with previous
studies25,26,57,58.
2.4.4. Kinetic model parameter optimization
Four possible kinetic models were evaluated through non-linear regression to obtain
optimized parameters that best fit the experimental data. The rate expressions for each model are
shown in Table 2.3. The experiments were carried out by measuring CO concentration and
volumetric flow rate without partial pressure measurements. Therefore, assuming the gases behave
ideally, the ideal gas law was used to convert the partial pressure of each species into terms of
initial CO concentration (CO0), CO conversion (X), the molar ratio of steam to CO (θ), the ideal
gas law constant (R), and temperature (T).
𝑃𝐶𝑂 = 𝐶𝑂0(1 − 𝑋)𝑅𝑇
𝑃𝐻2𝑂 = 𝐶𝑂0(𝜃 − 𝑋)𝑅𝑇
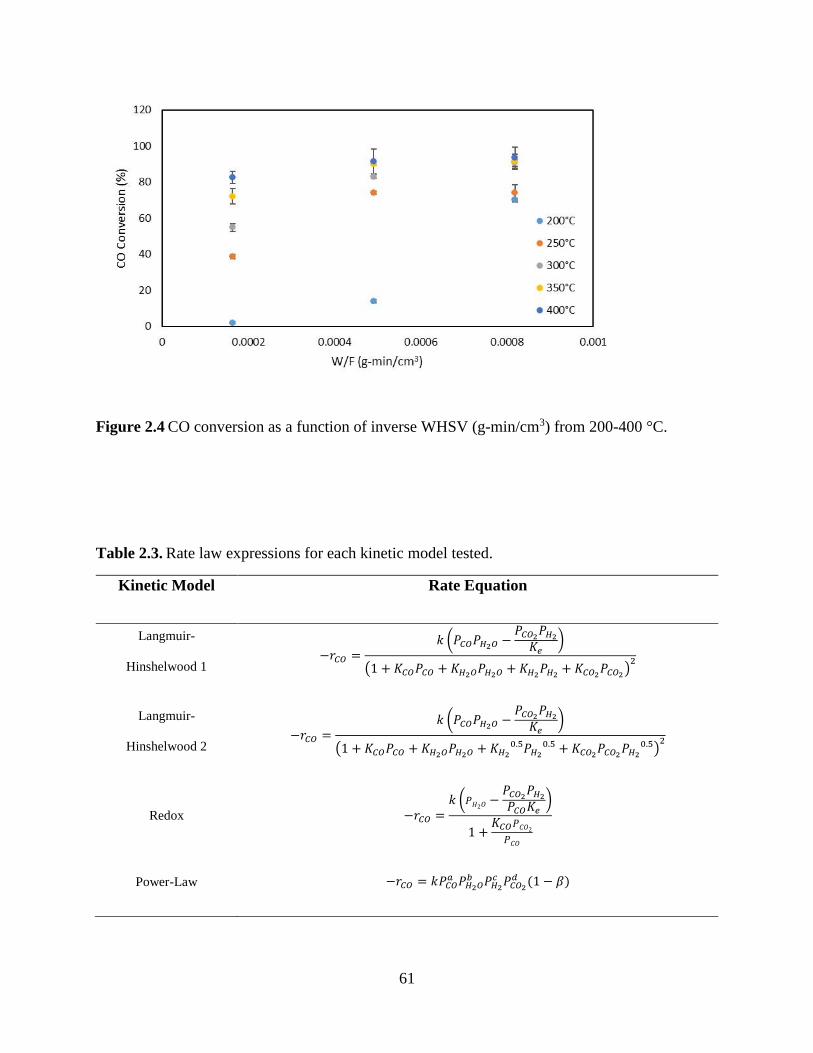
61
Figure 2.4 CO conversion as a function of inverse WHSV (g-min/cm3) from 200-400 °C.
Table 2.3. Rate law expressions for each kinetic model tested.
Kinetic Model Rate Equation
Langmuir-
Hinshelwood 1 −𝑟𝐶𝑂 =
𝑘 (𝑃𝐶𝑂𝑃𝐻2𝑂 −𝑃𝐶𝑂2𝑃𝐻2𝐾𝑒
)
(1 + 𝐾𝐶𝑂𝑃𝐶𝑂 + 𝐾𝐻2𝑂𝑃𝐻2𝑂 + 𝐾𝐻2𝑃𝐻2 + 𝐾𝐶𝑂2𝑃𝐶𝑂2)2
Langmuir-
Hinshelwood 2 −𝑟𝐶𝑂 =
𝑘 (𝑃𝐶𝑂𝑃𝐻2𝑂 −𝑃𝐶𝑂2𝑃𝐻2𝐾𝑒
)
(1 + 𝐾𝐶𝑂𝑃𝐶𝑂 + 𝐾𝐻2𝑂𝑃𝐻2𝑂 + 𝐾𝐻20.5𝑃𝐻2
0.5 + 𝐾𝐶𝑂2𝑃𝐶𝑂2𝑃𝐻20.5)
2
Redox −𝑟𝐶𝑂 =𝑘 (𝑃𝐻2𝑂 −
𝑃𝐶𝑂2𝑃𝐻2𝑃𝐶𝑂𝐾𝑒
)
1 +𝐾𝐶𝑂𝑃𝐶𝑂2𝑃𝐶𝑂
Power-Law −𝑟𝐶𝑂 = 𝑘𝑃𝐶𝑂𝑎 𝑃𝐻2𝑂
𝑏 𝑃𝐻2𝑐 𝑃𝐶𝑂2
𝑑 (1 − 𝛽)
62
𝑃𝐻2 = 𝑃𝐶𝑂2 = 𝐶𝑂0(𝑋)𝑅𝑇
The first associate mechanism proposed, LH1, did not provide a good fit for several of the
experimental conditions and was eliminated on that basis (AIC = -226 and FIT = 1.49). LH2 has
ten parameters to be optimized while the redox mechanism has four, and the power law has five.
Kinetic parameters were determined for each WHSV over the range from 200-400 °C, and the
results are shown in Table 2.4, Table 2.5, and Table 2.6. For all models, the activation energy
decreased as the catalyst weight was increased. The estimated activation energy for the LH2, power
law, and redox models ranged from 45-65 kJ/mol, 20-41 kJ/mol, and 73-76 kJ/mol, respectively,
depending on the WHSV. For the power law, the reaction order with respect to carbon monoxide
and steam was shown to be the most sensitive to experimental conditions fluctuating between
0.467-1.029 and 0.472-0.634 respectively, whereas the reaction orders for the others remained
relatively constant.
2.4.5. Model discrimination
The mean absolute error (MAE), root mean squared error (RMSE), and goodness of fit
(FIT) analyses were used to compare how well each model fit the experimental data. Further
discrimination of the models was accomplished using the Akaike information criterion (AIC). This
allowed for comparison between models with a different number of parameters.The results of each
statistical test are shown in Table 2.7. All of the tests are negatively-oriented, therefore lower
values indicate a better fit. Upon comparison of the three tests, the three models give similar values.
However, the LH2 model provided the best overall fit to the experimental data over each WHSV
for averaged conditions between 200-400 °C. The empirical power law is the second best fit to the
experimental data over each WHSV. An associative mechanism as well as an empirical power law
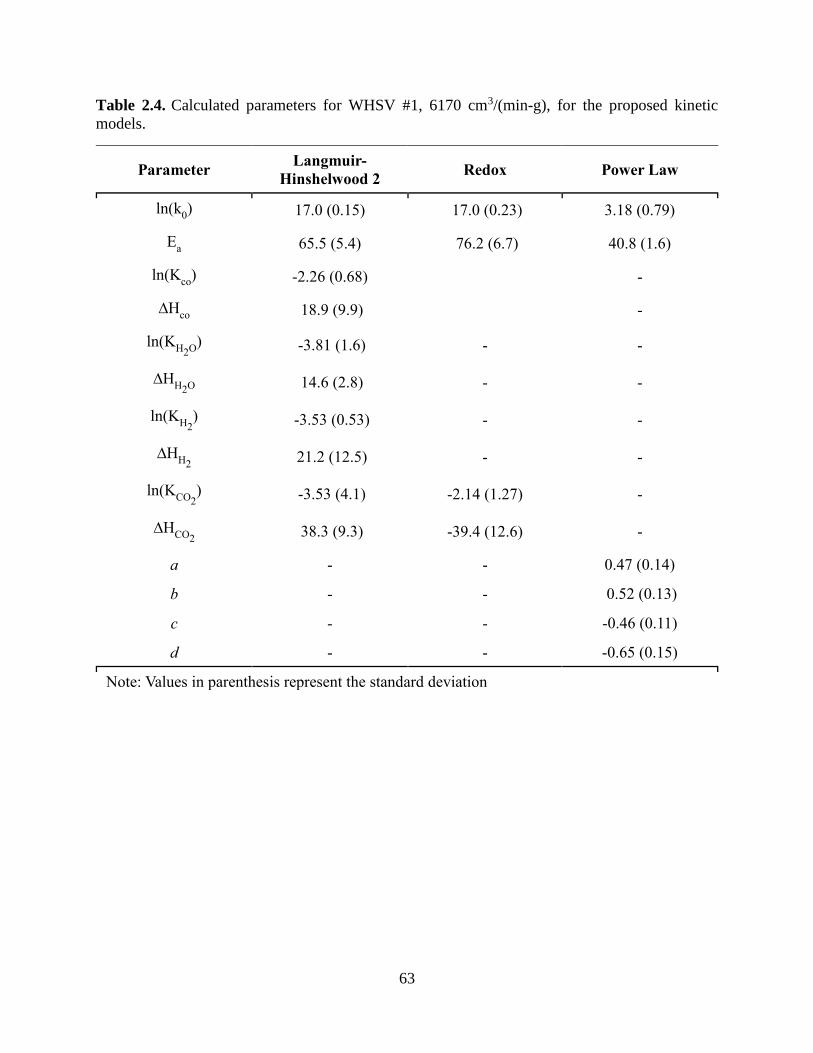
63
Table 2.4. Calculated parameters for WHSV #1, 6170 cm3/(min-g), for the proposed kinetic
models.
Parameter Langmuir-
Hinshelwood 2 Redox Power Law
ln(k0) 17.0 (0.15) 17.0 (0.23) 3.18 (0.79)
Ea 65.5 (5.4) 76.2 (6.7) 40.8 (1.6)
ln(Kco
) -2.26 (0.68) -
∆Hco 18.9 (9.9) -
ln(KH2O
) -3.81 (1.6) - -
∆HH2O
14.6 (2.8) - -
ln(KH2
) -3.53 (0.53) - -
∆HH2
21.2 (12.5) - -
ln(KCO2
) -3.53 (4.1) -2.14 (1.27) -
∆HCO2
38.3 (9.3) -39.4 (12.6) -
a - - 0.47 (0.14)
b - - 0.52 (0.13)
c - - -0.46 (0.11)
d - - -0.65 (0.15)
Note: Values in parenthesis represent the standard deviation
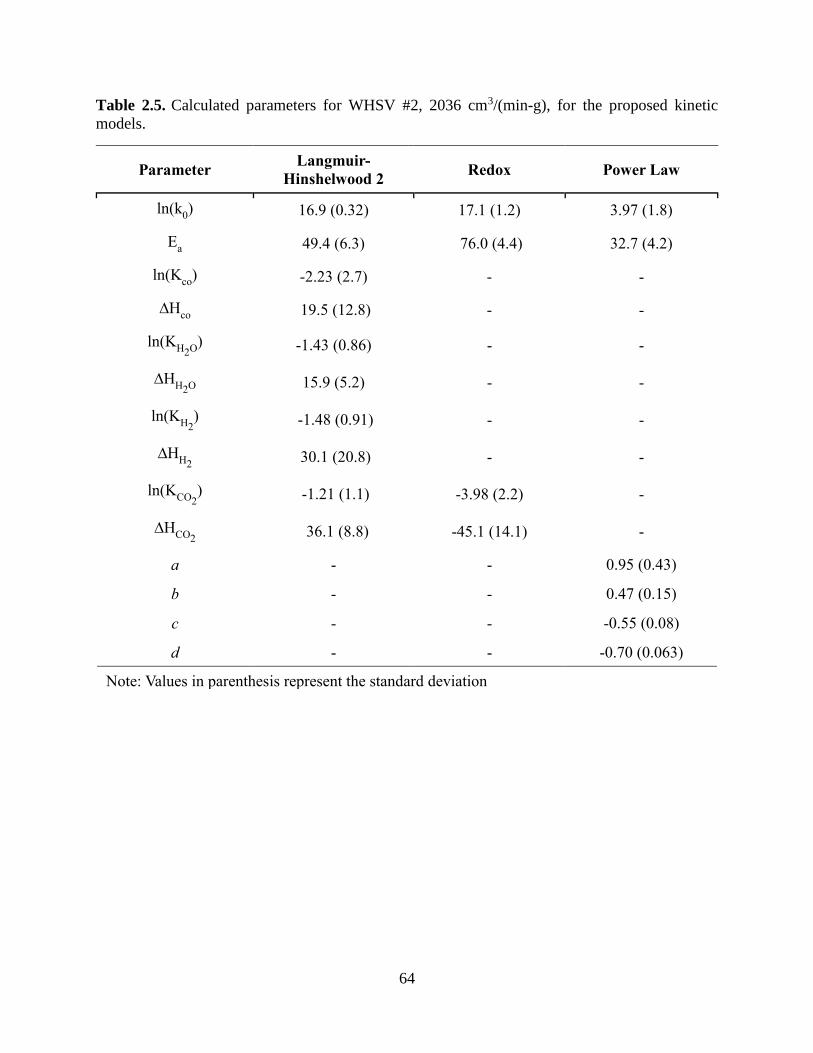
64
Table 2.5. Calculated parameters for WHSV #2, 2036 cm3/(min-g), for the proposed kinetic
models.
Parameter Langmuir-
Hinshelwood 2 Redox Power Law
ln(k0) 16.9 (0.32) 17.1 (1.2) 3.97 (1.8)
Ea 49.4 (6.3) 76.0 (4.4) 32.7 (4.2)
ln(Kco
) -2.23 (2.7) - -
∆Hco 19.5 (12.8) - -
ln(KH2O
) -1.43 (0.86) - -
∆HH2O
15.9 (5.2) - -
ln(KH2
) -1.48 (0.91) - -
∆HH2
30.1 (20.8) - -
ln(KCO2
) -1.21 (1.1) -3.98 (2.2) -
∆HCO2
36.1 (8.8) -45.1 (14.1) -
a - - 0.95 (0.43)
b - - 0.47 (0.15)
c - - -0.55 (0.08)
d - - -0.70 (0.063)
Note: Values in parenthesis represent the standard deviation

65
Table 2.6. Calculated parameters for WHSV #3, 1221 cm3/(min-g), for the proposed kinetic
models.
Parameter Langmuir-
Hinshelwood 2 Redox Power Law
ln(k0) 17.3 (1.0) 16.8 (0.19) 1.42 (0.60)
Ea 44.7 (1.7) 73.4 (4.0) 20.2 (2.1)
ln(Kco
) 0.491 (0.84) - -
∆Hco 26.6 (4.5) - -
ln(KH2O
) -2.25 (1.1) - -
∆HH2O
14.1 (3.9) - -
ln(KH2
) -3.23 (2.8) - -
∆HH2
18.8 (5.0) - -
ln(KCO2
) -0.954 (0.57) -5.46 (2.9) -
∆HCO2
40.3 (5.4) -47.8 (8.6) -
a - - 1.03 (0.22)
b - - 0.63 (0.14)
c - - -0.50 (0.015)
d - - -0.67 (0.040)
Note: Values in parenthesis represent the standard deviation
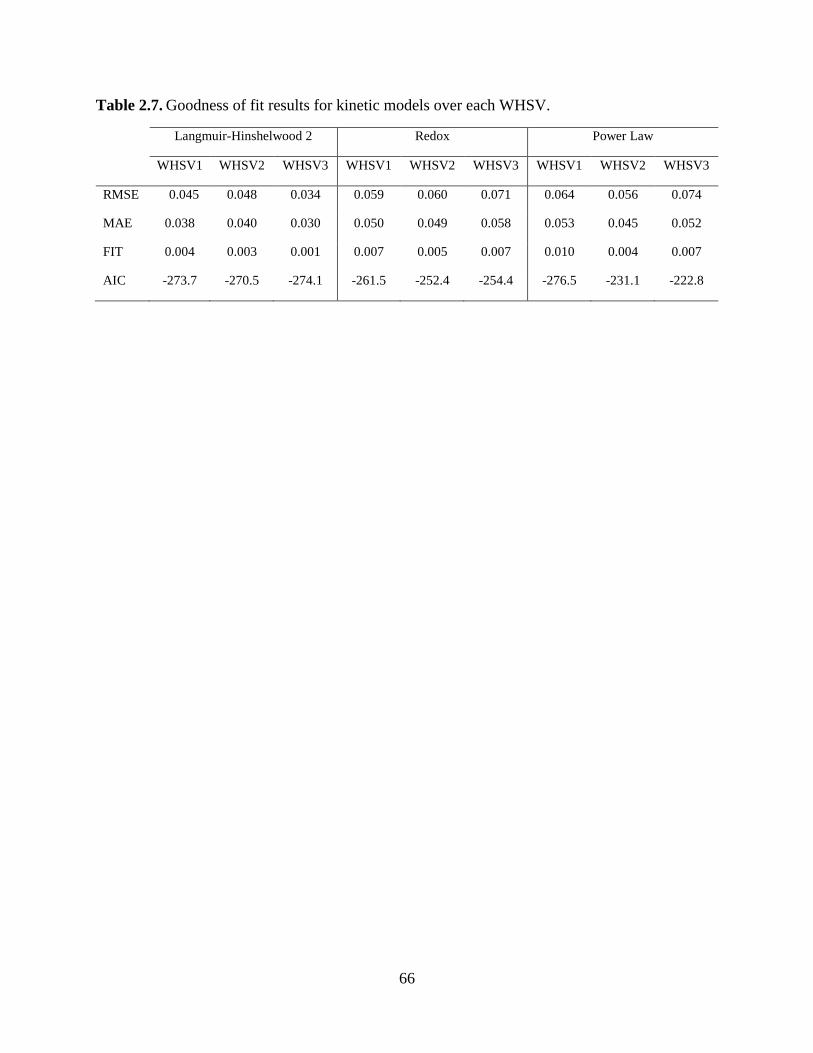
66
Table 2.7. Goodness of fit results for kinetic models over each WHSV.
Langmuir-Hinshelwood 2 Redox Power Law
WHSV1 WHSV2 WHSV3 WHSV1 WHSV2 WHSV3 WHSV1 WHSV2 WHSV3
RMSE 0.045 0.048 0.034 0.059 0.060 0.071 0.064 0.056 0.074
MAE 0.038 0.040 0.030 0.050 0.049 0.058 0.053 0.045 0.052
FIT 0.004 0.003 0.001 0.007 0.005 0.007 0.010 0.004 0.007
AIC -273.7 -270.5 -274.1 -261.5 -252.4 -254.4 -276.5 -231.1 -222.8
67
have been shown to provide the best fits in several previous works25,26,41. The power law provides
a simpler kinetic expression than the LH2 mechanism and makes for a lighter computational load
when incorporated into a process simulation. Moving forward, the empirical power law will be the
most useful for determining the amount of hydrogen that can be generated from the non-
condensable gases, mainly CO, produced during biomass pyrolysis while still maintaining kinetic
accuracy.
2.5. Conclusions
The kinetics of the water-gas shift reaction over a Cu-based catalyst at intermediate
conditions, near hydrous pyrolysis operating temperatures, were explored. At temperatures from
200-400°C, three WHSVs, two mechanistic kinetic models, and an empirical power law were fit
to the experimental data. Comparing goodness of fit tests and the AIC, the associated Langmuir-
Hinshelwood mechanism was shown to be the best fit. The LH2 model yielded apparent activation
energy between 45-65 kJ/mol over varying WHSVs whereas the power law yielded activation
energies between 20-41. The reaction order for CO2, H2, and H2O remained stable over all WHSVs
while the exponents for CO fluctuated from 0.46-1.00. The next step in this research is to use the
CO concentration in pyrolysis vapors to determine the amount of hydrogen that will be available
for hydrous pyrolysis.

68
List of references
69
(1) Klass, D. L. Biomass for Renewable Energy, Fuels, and Chemicals; Elsevier Science, 1998.
(2) Abas, N.; Kalair, A.; Khan, N. Review of fossil fuels and future energy technologies.
Futures 2015, 69, 31.
(3) Blin, J.; Volle, G.; Girard, P.; Bridgwater, T.; Meier, D. Biodegradability of biomass
pyrolysis oils: Comparison to conventional petroleum fuels and alternatives fuels in current
use. Fuel 2007, 86 (17), 2679.
(4) Safana, A.; Idowu, I. I.; Saadu, I.; Adamu, B.; Musa, I. M.; Habibu, S. Potential Application
of Pyrolysis Bio-Oil as a Substitute for Diesel and Petroleum Fuel. Journal of Petroleum
Engineering & Technology 2018, 7 (3), 19.
(5) Makarfi Isa, Y.; Ganda, E. T. Bio-oil as a potential source of petroleum range fuels.
Renewable and Sustainable Energy Reviews 2018, 81, 69.
(6) Oasmaa, A.; Czernik, S. Fuel oil quality of biomass pyrolysis oils-State of the art for the
end users. Energy & Fuels 1999, 13 (4), 914.
(7) Dayton, D. C.; Carpenter, J.; Farmer, J.; Turk, B.; Gupta, R. Biomass hydropyrolysis in a
pressurized fluidized bed reactor. Energy & Fuels 2013, 27 (7), 3778.
(8) Lee, H.; Kim, H.; Yu, M. J.; Ko, C. H.; Jeon, J.-K.; Jae, J.; Park, S. H.; Jung, S.-C.; Park,
Y.-K. Catalytic Hydrodeoxygenation of Bio-oil Model Compounds over Pt/HY Catalyst.
Scientific Reports 2016, 6, 28765.
(9) Cheng, S.; Wei, L.; Julson, J.; Rabnawaz, M. Upgrading pyrolysis bio-oil through
hydrodeoxygenation (HDO) using non-sulfided Fe-Co/SiO2 catalyst. Energy Conversion
and Management 2017, 150, 331.
(10) Shemfe, M. B.; Gu, S.; Ranganathan, P. Techno-economic performance analysis of biofuel
production and miniature electric power generation from biomass fast pyrolysis and bio-
oil upgrading. Fuel 2015, 143, 361.
(11) Marker, T. L.; Felix, L. G.; Linck, M. B.; Roberts, M. J. Integrated hydropyrolysis and
hydroconversion (IH2) for the direct production of gasoline and diesel fuels or blending
components from biomass, part 1: Proof of principle testing. Environmental Progress &
Sustainable Energy 2012, 31 (2), 191.
(12) Balagurumurthy, B.; Oza, T. S.; Bhaskar, T.; Adhikari, D. K. Renewable hydrocarbons
through biomass hydropyrolysis process: challenges and opportunities. Journal of Material
Cycles and Waste Management 2013, 15 (1), 9.
(13) Resende, F. L. P. Recent advances on fast hydropyrolysis of biomass. Catalysis Today
2016, 269, 148.
(14) Balagurumurthy, B.; Singh, R.; Oza, T. S.; Shiva Kumar, K. L. N.; Saran, S.; Bahuguna,
G. M.; Chauhan, R. K.; Bhaskar, T. Effect of pressure and temperature on the
hydropyrolysis of cotton residue. Journal of Material Cycles and Waste Management
2014, 16 (3), 442.
(15) Marker, T. L.; Felix, L. G.; Linck, M. B.; Roberts, M. J.; Ortiz-Toral, P.; Wangerow, J.
Integrated hydropyrolysis and hydroconversion (IH2®) for the direct production of
gasoline and diesel fuels or blending components from biomass, part 2: Continuous testing.
Environmental Progress & Sustainable Energy 2014, 33 (3), 762.
(16) Linck, M.; Felix, L.; Marker, T.; Roberts, M. Integrated biomass hydropyrolysis and
hydrotreating: a brief review. Wiley Interdisciplinary Reviews: Energy and Environment
2014, 3 (6), 575.
70
(17) Mante, O. D.; Agblevor, F. A.; Oyama, S. T.; McClung, R. The influence of recycling non-
condensable gases in the fractional catalytic pyrolysis of biomass. Bioresource Technology
2012, 111, 482.
(18) Chein, R. Y.; Lin, Y. H.; Chen, Y. C.; Chyou, Y. P.; Chung, J. N. Study on water–gas shift
reaction performance using Pt-based catalysts at high temperatures. International Journal
of Hydrogen Energy 2014, 39 (33), 18854.
(19) Rhodes, C.; Peter Williams, B.; King, F.; Hutchings, G. J. Promotion of Fe3O4/Cr2O3
high temperature water gas shift catalyst. Catalysis Communications 2002, 3 (8), 381.
(20) LeValley, T. L.; Richard, A. R.; Fan, M. The progress in water gas shift and steam
reforming hydrogen production technologies – A review. International Journal of
Hydrogen Energy 2014, 39 (30), 16983.
(21) Grenoble, D. C.; Estadt, M. M.; Ollis, D. F. The chemistry and catalysis of the water gas
shift reaction. Journal of Catalysis 1981, 67 (1), 90.
(22) Podolski, W. F.; Kim, Y. G. Modeling the Water-Gas Shift Reaction. Industrial &
Engineering Chemistry Process Design and Development 1974, 13 (4), 415.
(23) Fujita, S.-I.; Usui, M.; Takezawa, N. Mechanism of the reverse water gas shift reaction
over Cu/ZnO catalyst. Journal of Catalysis 1992, 134 (1), 220.
(24) Salmi, T.; Hakkarainen, R. Kinetic Study of the Low-Temperature Water-Gas Shift
Reaction over a Cu—ZnO Catalyst. Applied Catalysis 1989, 49 (2), 285.
(25) Ayastuy, J. L.; Gutiérrez-Ortiz, M. A.; González-Marcos, J. A.; Aranzabal, A.; González-
Velasco, J. R. Kinetics of the Low-Temperature WGS Reaction over a CuO/ZnO/Al2O3
Catalyst. Industrial & Engineering Chemistry Research 2005, 44 (1), 41.
(26) Mendes, D.; Chibante, V.; Mendes, A.; Madeira, L. M. Determination of the Low-
Temperature Water−Gas Shift Reaction Kinetics Using a Cu-Based Catalyst. Industrial &
Engineering Chemistry Research 2010, 49 (22), 11269.
(27) Li, S.; Lu, Y.; Guo, L.; Zhang, X. Hydrogen production by biomass gasification in
supercritical water with bimetallic Ni–M/γAl2O3 catalysts (M = Cu, Co and Sn).
International Journal of Hydrogen Energy 2011, 36 (22), 14391.
(28) Bhatia, S.; Beltramini, J.; Do, D. D. Temperature programmed analysis and its applications
in catalytic systems. Catalysis Today 1990, 7 (3), 309.
(29) Umegaki, T.; Kojima, Y.; Omata, K. Effect of Oxide Coating on Performance of Copper-
Zinc Oxide-Based Catalyst for Methanol Synthesis via Hydrogenation of Carbon Dioxide.
Materials 2015, 8 (11), 5414.
(30) Zhang, C.-H.; Yang, Y.; Teng, B.-T.; Li, T.-Z.; Zheng, H.-Y.; Xiang, H.-W.; Li, Y.-W.
Study of an iron-manganese Fischer–Tropsch synthesis catalyst promoted with copper.
Journal of Catalysis 2006, 237 (2), 405.
(31) Fogler, H. S. Essentials of Chemical Reaction Engineering; Prentice Hall, 2011.
(32) Carberry, J. J. In Catalysis: Science and Technology; Anderson, J. R.;Boudart, M., Eds.;
Springer Berlin Heidelberg: Berlin, Heidelberg, 1987, DOI:10.1007/978-3-642-93278-6_3
10.1007/978-3-642-93278-6_3.
(33) Hanefeld, U.; Lefferts, L. Catalysis: An Integrated Textbook for Students; Wiley, 2017.
(34) Prasad, V.; Karim, A. M.; Arya, A.; Vlachos, D. G. Assessment of Overall Rate
Expressions and Multiscale, Microkinetic Model Uniqueness via Experimental Data
Injection: Ammonia Decomposition on Ru/γ-Al2O3 for Hydrogen Production. Industrial
& Engineering Chemistry Research 2009, 48 (11), 5255.
(35) Fogler, H. S. Elements of Chemical Reaction Engineering; Prentice Hall PTR, 2006.
71
(36) Rhodes, C.; Hutchings, G. J.; Ward, A. M. Water-gas shift reaction: finding the mechanistic
boundary. Catalysis Today 1995, 23 (1), 43.
(37) Smirniotis, P.; Gunugunuri, K. Water Gas Shift Reaction: Research Developments and
Applications; Elsevier Science, 2015.
(38) Zhu, M.; Wachs, I. E. Iron-Based Catalysts for the High-Temperature Water–Gas Shift
(HT-WGS) Reaction: A Review. ACS Catalysis 2016, 6 (2), 722.
(39) Armstrong, E.; Hilditch, T. A Study of Catalytic Actions at Solid Surfaces. IV. The
Interaction of Carbon Monoxide and Steam as Conditions by Iron Oxide and by Copper.
Proceedings of the Royal Society of London. Series A, Containing Papers of a
Mathematical and Physical Character (1905-1934) 1920, 97 (684), 265.
(40) Mohammady Maklavany, D.; Shariati, A.; Roozbehani, B.; Khosravi Nikou, M. R. Kinetic
Modeling of Low Temperature Water-Gas Shift Reaction using gPROMS. American
Journal of Oil and Chemical Technologies 2016, 4 (2).
(41) Choi, Y.; Stenger, H. G. Water gas shift reaction kinetics and reactor modeling for fuel cell
grade hydrogen. Journal of Power Sources 2003, 124 (2), 432.
(42) Kulkova, N. V.; Temkin, M. I. J. Zhurnal Fizicheskoi Khimii 1949, 23, 695.
(43) Salmi, T.; Lindfors, L. E.; Boström, S. Modelling of the high temperature water gas shift
reaction with stationary and transient experiments. Chemical Engineering Science 1986,
41 (4), 929.
(44) Lei, Y.; Cant, N. W.; Trimm, D. L. Kinetics of the water–gas shift reaction over a rhodium-
promoted iron–chromium oxide catalyst. Chemical Engineering Journal 2005, 114 (1), 81.
(45) Keiski, R. L.; Salmi, T.; Niemistö, P.; Ainassaari, J.; Pohjola, V. J. Stationary and transient
kinetics of the high temperature water-gas shift reaction. Applied Catalysis A: General
1996, 137 (2), 349.
(46) Gökaliler, F.; Önsan, Z. I.; Aksoylu, A. E. Power-law type rate expression for WGS
reaction over Au–Re/CeO2 catalyst under realistic fuel processor conditions. Catalysis
Communications 2013, 39 (Supplement C), 70.
(47) Castaño, P.; Arandes, J. M.; Pawelec, B.; Fierro, J. L. G.; Gutiérrez, A.; Bilbao, J. Kinetic
Model Discrimination for Toluene Hydrogenation over Noble-Metal-Supported Catalysts.
Industrial & Engineering Chemistry Research 2007, 46 (23), 7417.
(48) Oyedeji, O.; Daw, C. S.; Labbe, N.; Ayers, P.; Abdoulmoumine, N. Kinetics of the release
of elemental precursors of syngas and syngas contaminants during devolatilization of
switchgrass. Bioresource Technology 2017, 244 (Part 1), 525.
(49) Granada, E.; Eguía, P.; Comesaña, J. A.; Patiño, D.; Porteiro, J.; Miguez, J. L.
Devolatilization behaviour and pyrolysis kinetic modelling of Spanish biomass fuels.
Journal of Thermal Analysis and Calorimetry 2013, 113 (2), 569.
(50) Akaike, H. A new look at the statistical model identification. IEEE Transactions on
Automatic Control 1974, 19 (6), 716.
(51) Yahiro, H.; Murawaki, K.; Saiki, K.; Yamamoto, T.; Yamaura, H. Study on the supported
Cu-based catalysts for the low-temperature water–gas shift reaction. Catalysis Today 2007,
126 (3), 436.
(52) Jeong, D.-W.; Jang, W.-J.; Shim, J.-O.; Han, W.-B.; Roh, H.-S.; Jung, U. H.; Yoon, W. L.
Low-temperature water–gas shift reaction over supported Cu catalysts. Renewable Energy
2014, 65, 102.
72
(53) Ginés, M. J. L.; Amadeo, N.; Laborde, M.; Apesteguía, C. R. Activity and structure-
sensitivity of the water-gas shift reaction over CuZnAl mixed oxide catalysts. Applied
Catalysis A: General 1995, 131 (2), 283.
(54) Shen, J.-P.; Song, C. Influence of preparation method on performance of Cu/Zn-based
catalysts for low-temperature steam reforming and oxidative steam reforming of methanol
for H2 production for fuel cells. Catalysis Today 2002, 77 (1), 89.
(55) Yuan, G.; Keane, M. A. Liquid phase catalytic hydrodechlorination of 2,4-dichlorophenol
over carbon supported palladium: an evaluation of transport limitations. Chemical
Engineering Science 2003, 58 (2), 257.
(56) Pérez-Ramı́rez, J.; Berger, R. J.; Mul, G.; Kapteijn, F.; Moulijn, J. A. The six-flow reactor
technology: A review on fast catalyst screening and kinetic studies. Catalysis Today 2000,
60 (1), 93.
(57) Kumar, P.; Idem, R. A Comparative Study of Copper-Promoted Water−Gas-Shift (WGS)
Catalysts. Energy & Fuels 2007, 21 (2), 522.
(58) Ginés, M. J. L.; Marchi, A. J.; Apesteguía, C. R. Kinetic study of the reverse water-gas
shift reaction over CuO/ZnO/Al2O3 catalysts. Applied Catalysis A: General 1997, 154 (1),
155.
73
CHAPTER 3 DETAILED BIOMASS FAST PYROLYSIS
KINETICS INTEGRATED INTO A COMPUTATIONAL FLUID
DYNAMICS (CFD) AND DISCRETE ELEMENT MODELING
FRAMEWORK
74
This chapter has been prepared as a manuscript for submission to an academic journal upon
completion of the thesis.
I am the primary author on this manuscript. I was responsible for development of the
computational model using existing models as a framework. I monitored the simulations
throughout the run time. I analyzed and interpreted the results of the simulations and compared the
results to other reports in literature. The other authors on this manuscript are Oluwafemi Oyedeji,
Dr. Nourredine Abdoulmoumine, and Dr. Nicole Labbé.
Abstract
Biomass has been seen as an attractive alternative to help reduce the global dependence on
petroleum fuels as it can be converted into a liquid biocrude, i.e. bio-oil, through fast pyrolysis.
Fast pyrolysis is an intricate process due to the variability and anisotropy of biomass and the
complicated chemistry and physics at play during conversion in a bubbling fluidized bed reactor
(BFBR). The complexity of biomass fast pyrolysis lends itself well to computational fluid
dynamics (CFD) and discrete element (DEM) analysis which helps to reduce experimental time
and, thus, its associated cost.
This chapter investigates switchgrass fast pyrolysis simulated by computational fluid
dynamics coupled with discrete element method to track individual reacting biomass particles
throughout a BFBR reactor that geometrically matches an existing bench-scale unit for validation
of resulting simulations. Additionally, fast pyrolysis chemistry is incorporated in this chapter
through a mechanistic reaction scheme with secondary cracking reactions and this chapter assesses
the impact of operational conditions on the steady state yields of liquid bio-oil, non-condensable
gases (NCG), and char. Temperatures were varied from 450 to 550 °C and fluidization velocities,
reported as ratio to the minimum fluidization velocity (Umf) were tested at 1.91, 3, and 4.5 Umf.
75
At higher fluidization velocities, biomass particle’s residence time ranged between 7 and
14 s. The simulations reached steady-state after 8 s. At steady-state, the maximum bio-oil yield of
47 wt. % was achieved at 500 °C and 3 Umf and was validated at the bench-scale. Levoglucosan
is the primary bio-oil component, derived from cellulose, the major constituent of switchgrass.
The simulated bio-oil only contained approximately 5-9 wt. % water, which is significantly lower
than seen experimentally. The predicted bio-oil yield increased to 54 wt. % when the secondary
cracking reactions were turned off during the simulations suggesting that the vapor residence time
is too long. Another possible explanation is the secondary cracking scheme does not adequately
account for the formation of water during pyrolysis.
3.1. Introduction
As the world population continues to increase, the demand for energy also increases. Fossil
fuels, the predominant current energy source, is finite and introduces greenhouse gases (GHGs), a
major source of environmental concerns1. As a result, greater emphasis has been devoted to
developing alternative, renewable energy technology to reduce the dependence on fossil fuels. In
that regard, biomass is an attractive source of alternative energy due to its abundance, ubiquity and
availability for year-round supply2. Several conversion technologies are being actively developed
to transform biomass into bio-fuels, bio-energy, and bio-materials. Fast pyrolysis is one such
technology and has the merit of producing a biocrude, also known as bio-oil, analogous to crude
petroleum. Biomass conversion through fast pyrolysis is very complicated for several reasons.
Biomass has a complex composition that differs between feedstocks, and during fast pyrolysis,
biomass decomposes according to complex reaction pathways. In addition, bubbling fluidized bed
reactors, commonly used in biomass fast pyrolysis, further complicate the process due to the
76
multiphase nature that arises as a result of the interactions between the gas and solid phases inside
the reactor. These complications lead to more difficult transport and hydrodynamic equations.
Currently, the common approach of determining a biomass feedstock and reactor’s
performance during fast pyrolysis is to carry out time and cost intensive experiments over varying
operating conditions. However, this approach is ill-suited to future biorefineries which are
predicted to rely on a portfolio of feedstocks with inherent variability in properties. Furthermore,
often, laboratory scale experiments are not necessarily scalable directly to industrial scale systems.
Thus, accurate, numerical models to simulate pyrolysis are needed to reduce the time and cost
associated with experiments and generate scalable results. Until recently, most of the
computational fluid dynamics (CFD) simulations of fast pyrolysis focused on specific aspects of
the pyrolysis process, such as reaction kinetics, particle shrinkage, and effect of biomass
composition3,4. More recent works aimed to incorporate all of these aspects into a comprehensive
CFD model. These works adopted an Eulerian-Eulerian method, which modeled both the gas and
multiple solid phases as continua5,6. This approach is chosen when the biomass is assumed not to
be large enough to have a significant effect on the other phases (sand and gas).
This chapter is the second of a series that explores the feasibility of hydrous pyrolysis, a
concept that integrates catalytic fast pyrolysis with the water-gas shift (WGS) reaction to produce
additional hydrogen for hydrodeoxygenation (HDO) of vapors in one-pot. This chapter aims to
develop a computational fluid dynamics model integrating a comprehensive mechanistic pyrolysis
reaction scheme with a discrete element modeling (DEM) framework to simulate switchgrass fast
pyrolysis. Switchgrass was chosen as the feedstock to more closely reflect the operating conditions
on the experimental bench-scale system. By developing a comprehensive CFD-DEM model for
fast pyrolysis, it lays the foundation for integrating the kinetics of the WGS (Chapter II) with HDO
77
(Chapter IV) reactions to assess the feasibility of hydrous pyrolysis. Additionally, this chapter aims
to assess the effect of select operating conditions on the important outputs, e.g. yields, quality of
bio-oil, and residence time distributions for the reactor. Finally, selected operating conditions were
validated on a bench-scale reactor geometrically similar to the simulated reactor.
The DEM framework is synonymous with using a Lagrangian approach for modeling both
the biomass and the sand particles. An Eulerian-Lagrangian approach has been used before for
modeling fast pyrolysis in a fluidized bed reactor4,7. However, these models utilized a simple
lumped kinetic scheme as opposed to the comprehensive scheme used in this chapter8,9.
3.2. Methodology
This chapter based the simulation setup after a fast pyrolysis bench-scale bubbling
fluidized bed reactor available to the investigators and located in the Center for Renewable Carbon
(CRC) at the University of Tennessee. The reactor geometry used in the simulations is identical to
that of the aforementioned bench-scale reactor and its details are presented in next sections.
Additionally, an Eulerian-Lagrangian approach was adopted and implemented in OpenFOAM, an
open-source CFD software, with the intention of public release upon validation. In this
implementation, the fluid phase is modeled as a continuum by solving the Navier-Stokes equations,
while the solid phase, i.e. biomass, biochar, and sand, is modeled using the discrete element
method, i.e. the Lagrangian approach, characterized by Newton’s laws of motion. This approach
enables tracking of each reacting and unreacting solid particle, which increases the ability to
capture the physics of individual particles10. All of the simulations were carried out on the Joint
Institute for Computational Sciences (JICS) High-Performance Computer (HPC) to significantly
decrease the computational time.
78
The raw results from the simulations were exported and were post-processed in ParaView
(Kitware Inc., Clifton Park, NY, USA) for visualization. Gas phase data at the outlet of the reactor
were exported to determine the yield of the bio-oil vapors and non-condensable gases (NCG) and
char yield was determined by difference. Solid biomass particle residence time analysis was
performed using the statistical software R. Physical properties for both the gas and solid phases
were analyzed for each simulation. Also, total product distributions for the pyrolysis process were
investigated as well as the individual composition of the liquid bio-oil.
3.2.1. Simulation setup and feedstock characteristics
The simulated reactor geometry is identical in diameter, overall length as well as gas and
solid entry to the bench-scale reactor proposed for validation of simulation results. Its dimensions
are as follow: inner diameter of 38.1 mm (1.5 in.), height of 749.3 mm (29.5 in.) and height of
biomass injection of 188 mm ( 7.4 in.). A schematic of the reactor geometry is shown in Figure
3.1. The biomass feedstock used in both the simulation and experimental validation is switchgrass
with a moisture content of 10 wt. %, wet basis. The chemical composition of the feedstock was
determined according to ASTM standards (E1768-01)11 using the procedures for biomass
carbohydrates set out by the National Renewable Energy Laboratory (NREL)12. Figure 3.1 lists
the values input in the simulation. The biomass is reported as a mixture of cellulose, hemicellulose
and lignin. The lignin is further subclassified as hydrogen-rich(LigninH), carbon-rich (LigninC),
and oxygen-rich (LigninO) lignin. A biomass feeding rate of 10 g/min was used in both the
simulation and experiments. This feeding rate represents a theoretical maximum feeding rate for
the bench-scale reactor. Each simulation or experiment used 200 g of sand as bed material with
uniform particle size of 500 μm. The envelope density of the biomass and sand is 650 and 2,650
kg/m3, respectively. The operating conditions are at atmospheric pressure over three different
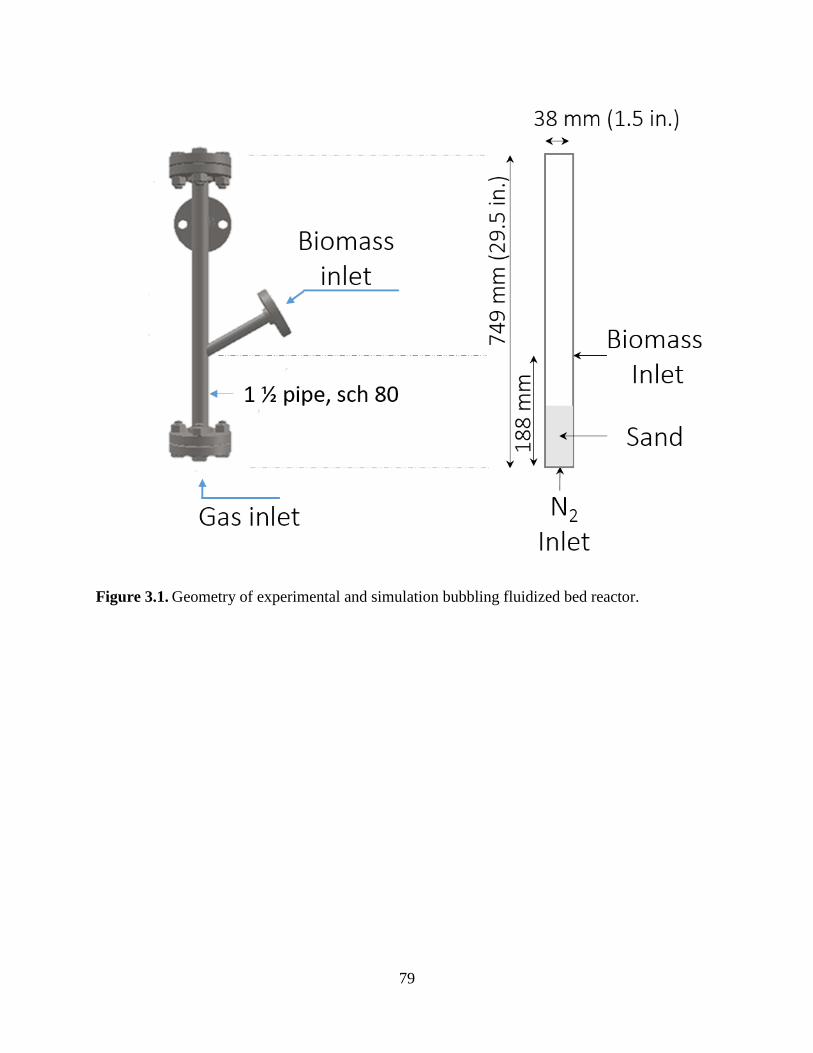
79
Figure 3.1. Geometry of experimental and simulation bubbling fluidized bed reactor.
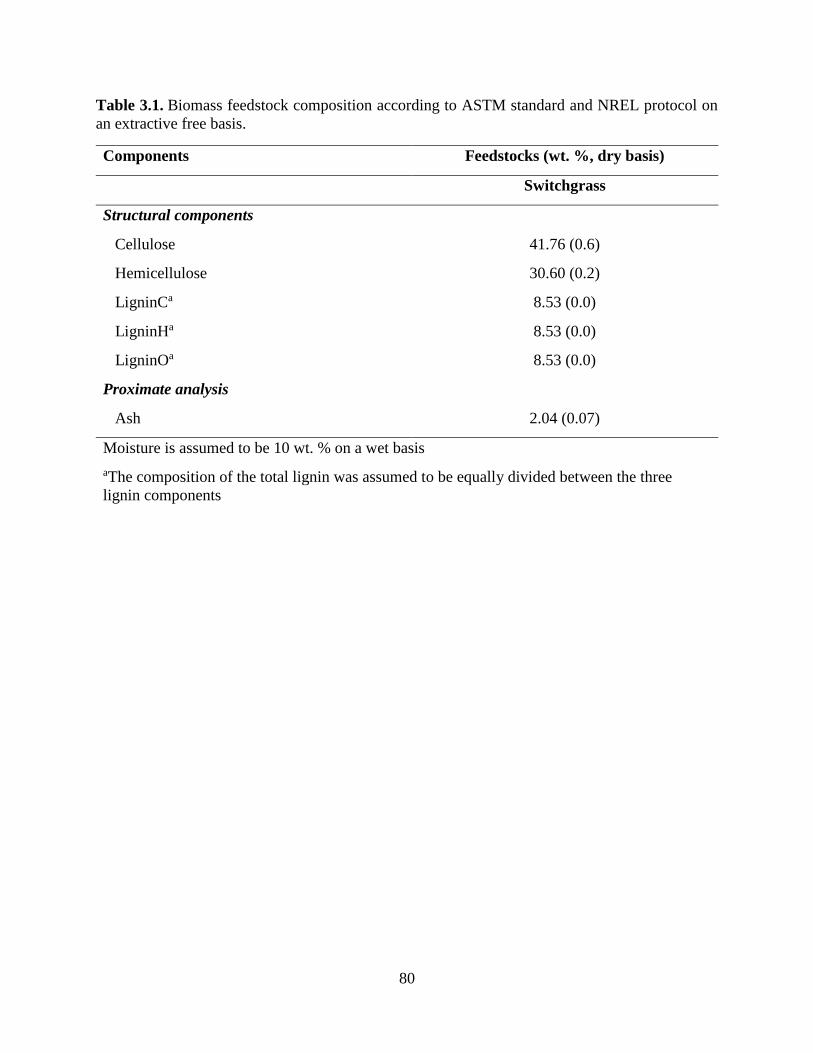
80
Table 3.1. Biomass feedstock composition according to ASTM standard and NREL protocol on
an extractive free basis.
Components Feedstocks (wt. %, dry basis)
Switchgrass
Structural components
Cellulose 41.76 (0.6)
Hemicellulose 30.60 (0.2)
LigninCa 8.53 (0.0)
LigninHa 8.53 (0.0)
LigninOa 8.53 (0.0)
Proximate analysis
Ash 2.04 (0.07)
Moisture is assumed to be 10 wt. % on a wet basis
aThe composition of the total lignin was assumed to be equally divided between the three
lignin components
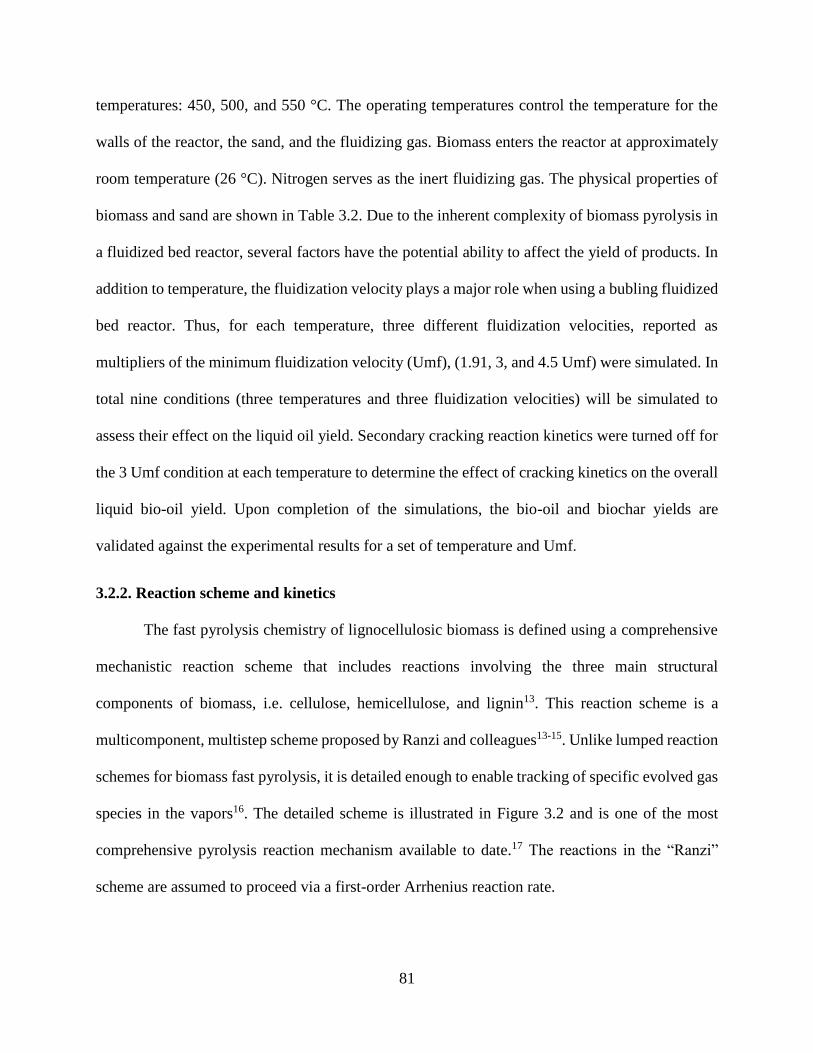
81
temperatures: 450, 500, and 550 °C. The operating temperatures control the temperature for the
walls of the reactor, the sand, and the fluidizing gas. Biomass enters the reactor at approximately
room temperature (26 °C). Nitrogen serves as the inert fluidizing gas. The physical properties of
biomass and sand are shown in Table 3.2. Due to the inherent complexity of biomass pyrolysis in
a fluidized bed reactor, several factors have the potential ability to affect the yield of products. In
addition to temperature, the fluidization velocity plays a major role when using a bubling fluidized
bed reactor. Thus, for each temperature, three different fluidization velocities, reported as
multipliers of the minimum fluidization velocity (Umf), (1.91, 3, and 4.5 Umf) were simulated. In
total nine conditions (three temperatures and three fluidization velocities) will be simulated to
assess their effect on the liquid oil yield. Secondary cracking reaction kinetics were turned off for
the 3 Umf condition at each temperature to determine the effect of cracking kinetics on the overall
liquid bio-oil yield. Upon completion of the simulations, the bio-oil and biochar yields are
validated against the experimental results for a set of temperature and Umf.
3.2.2. Reaction scheme and kinetics
The fast pyrolysis chemistry of lignocellulosic biomass is defined using a comprehensive
mechanistic reaction scheme that includes reactions involving the three main structural
components of biomass, i.e. cellulose, hemicellulose, and lignin13. This reaction scheme is a
multicomponent, multistep scheme proposed by Ranzi and colleagues13-15. Unlike lumped reaction
schemes for biomass fast pyrolysis, it is detailed enough to enable tracking of specific evolved gas
species in the vapors16. The detailed scheme is illustrated in Figure 3.2 and is one of the most
comprehensive pyrolysis reaction mechanism available to date.17 The reactions in the “Ranzi”
scheme are assumed to proceed via a first-order Arrhenius reaction rate.
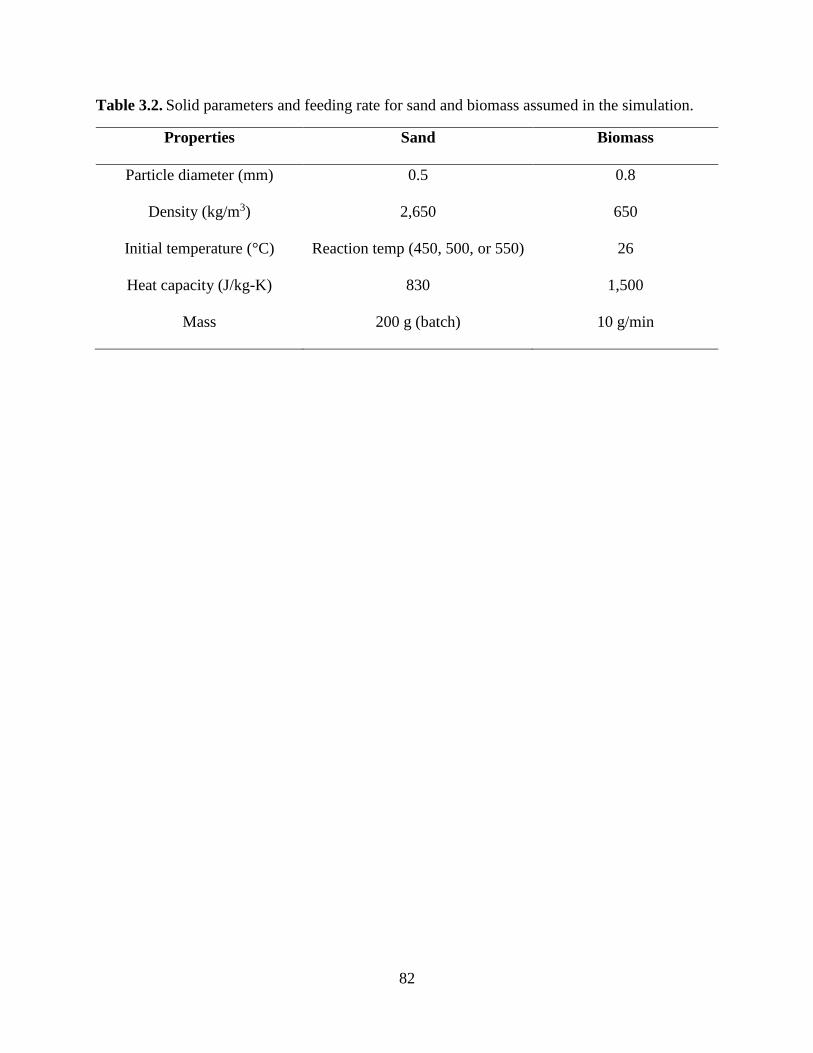
82
Table 3.2. Solid parameters and feeding rate for sand and biomass assumed in the simulation.
Properties Sand Biomass
Particle diameter (mm) 0.5 0.8
Density (kg/m3) 2,650 650
Initial temperature (°C) Reaction temp (450, 500, or 550) 26
Heat capacity (J/kg-K) 830 1,500
Mass 200 g (batch) 10 g/min
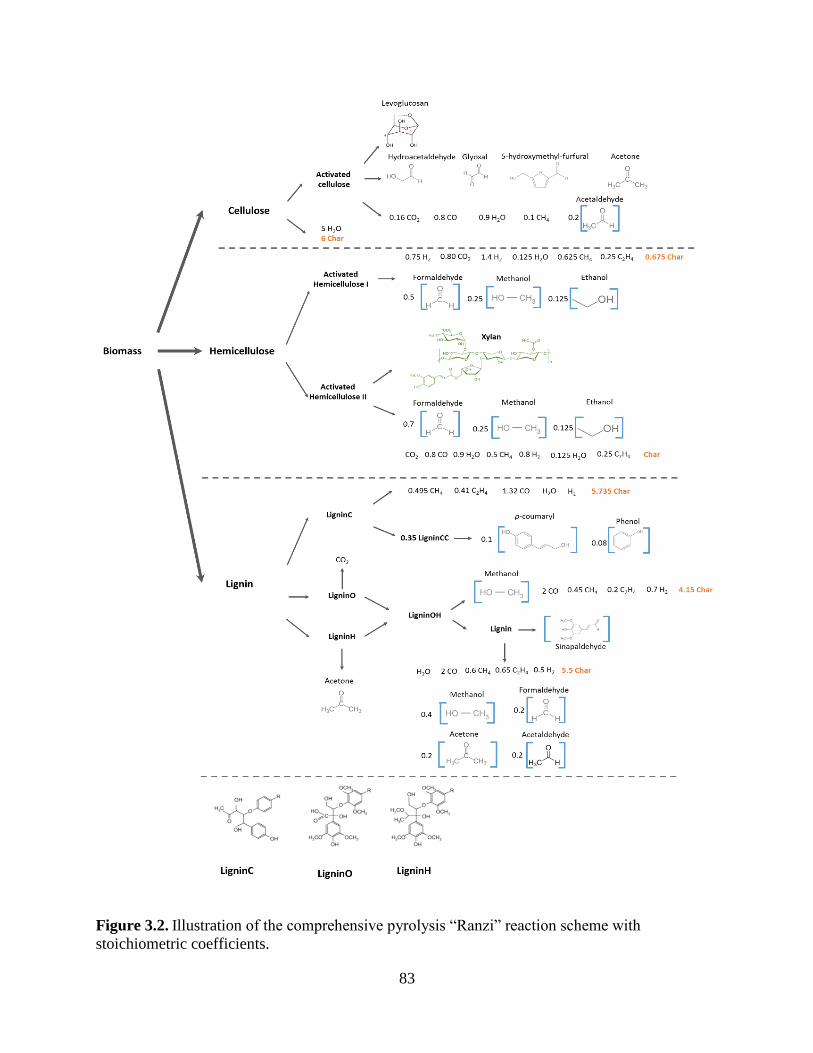
83
Figure 3.2. Illustration of the comprehensive pyrolysis “Ranzi” reaction scheme with
stoichiometric coefficients.
84
In addition of the structural components, the scheme considers the biomass as a mixture of
moisture and ash. However, the impact of ash on kinetics is not yet accounted in the scheme and
is not evaluated in this study. Lignin is further subdivided as a combination of three reference
components with different degrees of methoxylation: hydrogen (LigninH), oxygen (LigninO) and
carbon (LigninC) rich lignin, respectively18. The reaction mechanism assumes that the initial
structural components become “activated” through an initial reaction before undergoing a range
of homogeneous and heterogeneous secondary pyrolysis reactions to produce the primary
pyrolysis products. The reactions and the specific rate constant relationships are summarized in
Table 3.3. Similarly to previous pyrolysis modeling work, this scheme does not include the gases
that are thought to be produced inside the biomass particle and desorbed later but instead assumes
they are immediately released to the vapor phase5,6,17. The larger gaseous molecules produced
during the primary pyrolysis reactions further undergo secondary cracking reactions as they
proceed along the length of the reactor. The longer the vapor residence time, the greater the amount
of secondary reactions that take place. Secondary cracking reaction mechanisms and kinetics for
select bio-oil compounds are shown in Table 3.419. The reaction rates for the secondary reaction
kinetics are based on a lumped kinetic model proposed by Di Blasi that assumes that bio-oil further
reacts to produce gas resulting in identical pre-exponential factor and reaction rates for all cracking
reaction16,20. The implementation of the fast pyrolysis chemistry in this study omits the water
evaporation step in the kinetics of the scheme13. Instead, an existing built-in water evaporation
model in OpenFOAM was used in this work.
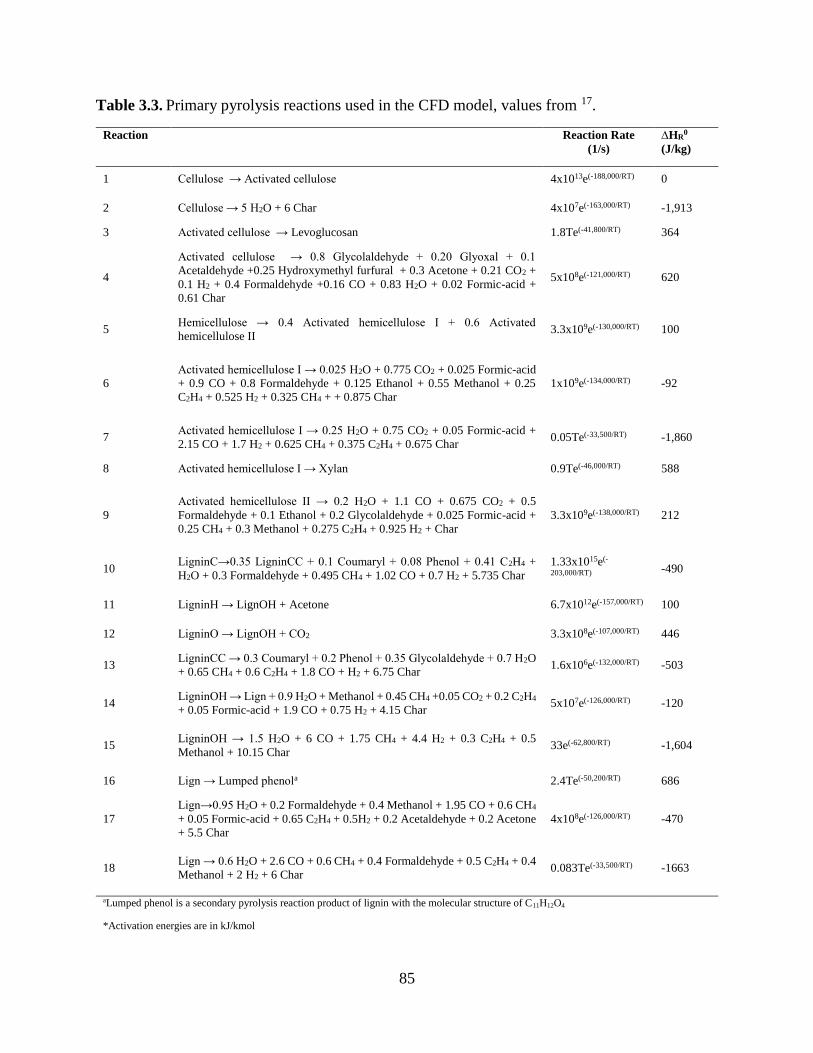
85
Table 3.3. Primary pyrolysis reactions used in the CFD model, values from 17.
Reaction Reaction Rate
(1/s)
∆HR0
(J/kg)
1 Cellulose → Activated cellulose 4x10¹³e(-188,000/RT) 0
2 Cellulose → 5 H2O + 6 Char 4x10⁷e(-163,000/RT) -1,913
3 Activated cellulose → Levoglucosan 1.8Te(-41,800/RT) 364
4
Activated cellulose → 0.8 Glycolaldehyde + 0.20 Glyoxal + 0.1
Acetaldehyde +0.25 Hydroxymethyl furfural + 0.3 Acetone + 0.21 CO2 +
0.1 H2 + 0.4 Formaldehyde +0.16 CO + 0.83 H2O + 0.02 Formic-acid +
0.61 Char
5x10⁸e(-121,000/RT) 620
5 Hemicellulose → 0.4 Activated hemicellulose I + 0.6 Activated
hemicellulose II 3.3x10⁹e(-130,000/RT) 100
6
Activated hemicellulose I → 0.025 H2O + 0.775 CO2 + 0.025 Formic-acid
+ 0.9 CO + 0.8 Formaldehyde + 0.125 Ethanol + 0.55 Methanol + 0.25
C2H4 + 0.525 H2 + 0.325 CH4 + + 0.875 Char
1x10⁹e(-134,000/RT) -92
7 Activated hemicellulose I → 0.25 H2O + 0.75 CO2 + 0.05 Formic-acid +
2.15 CO + 1.7 H2 + 0.625 CH4 + 0.375 C2H4 + 0.675 Char 0.05Te(-33,500/RT) -1,860
8 Activated hemicellulose I → Xylan 0.9Te(-46,000/RT) 588
9
Activated hemicellulose II → 0.2 H2O + 1.1 CO + 0.675 CO2 + 0.5
Formaldehyde + 0.1 Ethanol + 0.2 Glycolaldehyde + 0.025 Formic-acid +
0.25 CH4 + 0.3 Methanol + 0.275 C2H4 + 0.925 H2 + Char
3.3x10⁹e(-138,000/RT) 212
10 LigninC→0.35 LigninCC + 0.1 Coumaryl + 0.08 Phenol + 0.41 C2H4 +
H2O + 0.3 Formaldehyde + 0.495 CH4 + 1.02 CO + 0.7 H2 + 5.735 Char
1.33x10¹⁵e(-
203,000/RT) -490
11 LigninH → LignOH + Acetone 6.7x10¹²e(-157,000/RT) 100
12 LigninO → LignOH + CO2 3.3x10⁸e(-107,000/RT) 446
13 LigninCC → 0.3 Coumaryl + 0.2 Phenol + 0.35 Glycolaldehyde + 0.7 H2O
+ 0.65 CH4 + 0.6 C2H4 + 1.8 CO + H2 + 6.75 Char 1.6x10⁶e(-132,000/RT) -503
14 LigninOH → Lign + 0.9 H2O + Methanol + 0.45 CH4 +0.05 CO2 + 0.2 C2H4
+ 0.05 Formic-acid + 1.9 CO + 0.75 H2 + 4.15 Char 5x10⁷e(-126,000/RT) -120
15 LigninOH → 1.5 H2O + 6 CO + 1.75 CH4 + 4.4 H2 + 0.3 C2H4 + 0.5
Methanol + 10.15 Char 33e(-62,800/RT) -1,604
16 Lign → Lumped phenola 2.4Te(-50,200/RT) 686
17
Lign→0.95 H2O + 0.2 Formaldehyde + 0.4 Methanol + 1.95 CO + 0.6 CH4
+ 0.05 Formic-acid + 0.65 C2H4 + 0.5H2 + 0.2 Acetaldehyde + 0.2 Acetone
+ 5.5 Char
4x10⁸e(-126,000/RT) -470
18 Lign → 0.6 H2O + 2.6 CO + 0.6 CH4 + 0.4 Formaldehyde + 0.5 C2H4 + 0.4
Methanol + 2 H2 + 6 Char 0.083Te(-33,500/RT) -1663
aLumped phenol is a secondary pyrolysis reaction product of lignin with the molecular structure of C11H12O4
*Activation energies are in kJ/kmol
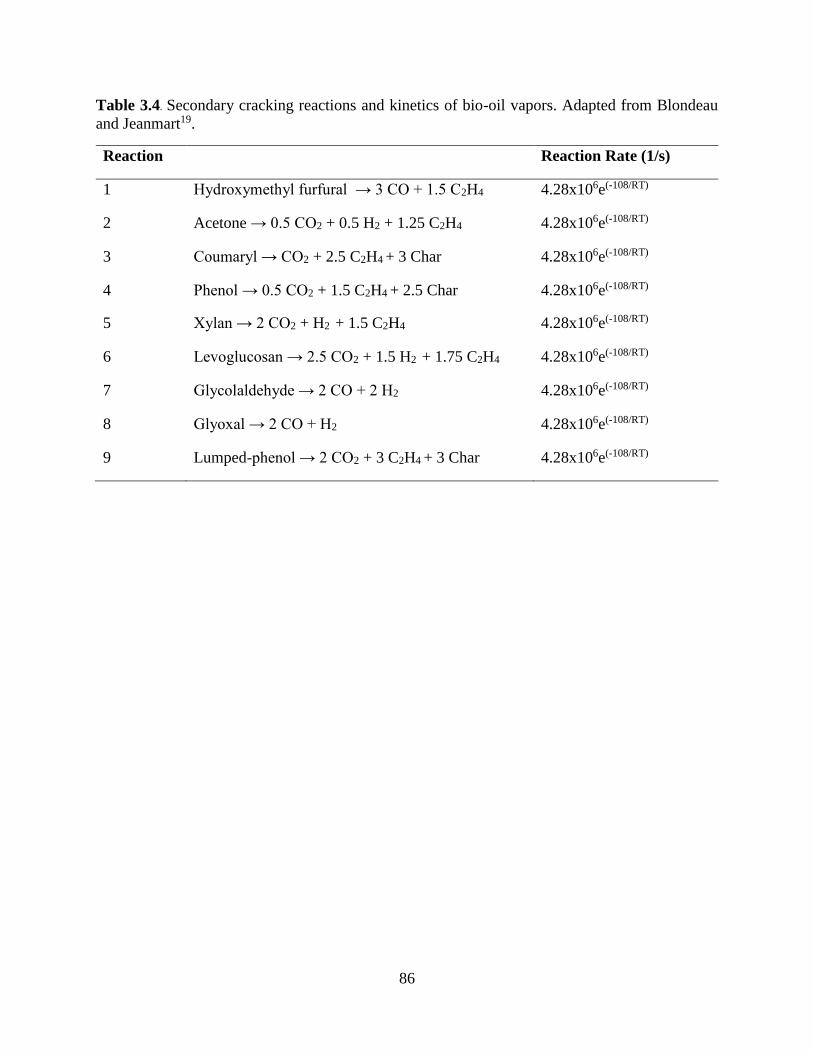
86
Table 3.4. Secondary cracking reactions and kinetics of bio-oil vapors. Adapted from Blondeau
and Jeanmart19.
Reaction Reaction Rate (1/s)
1 Hydroxymethyl furfural → 3 CO + 1.5 C2H4 4.28x10⁶e(-108/RT)
2 Acetone → 0.5 CO2 + 0.5 H2 + 1.25 C2H4 4.28x10⁶e(-108/RT)
3 Coumaryl → CO2 + 2.5 C2H4 + 3 Char 4.28x10⁶e(-108/RT)
4 Phenol → 0.5 CO2 + 1.5 C2H4 + 2.5 Char 4.28x10⁶e(-108/RT)
5 Xylan → 2 CO2 + H2 + 1.5 C2H4 4.28x10⁶e(-108/RT)
6 Levoglucosan → 2.5 CO2 + 1.5 H2 + 1.75 C2H4 4.28x10⁶e(-108/RT)
7 Glycolaldehyde → 2 CO + 2 H2 4.28x10⁶e(-108/RT)
8 Glyoxal → 2 CO + H2 4.28x10⁶e(-108/RT)
9 Lumped-phenol → 2 CO2 + 3 C2H4 + 3 Char 4.28x10⁶e(-108/RT)
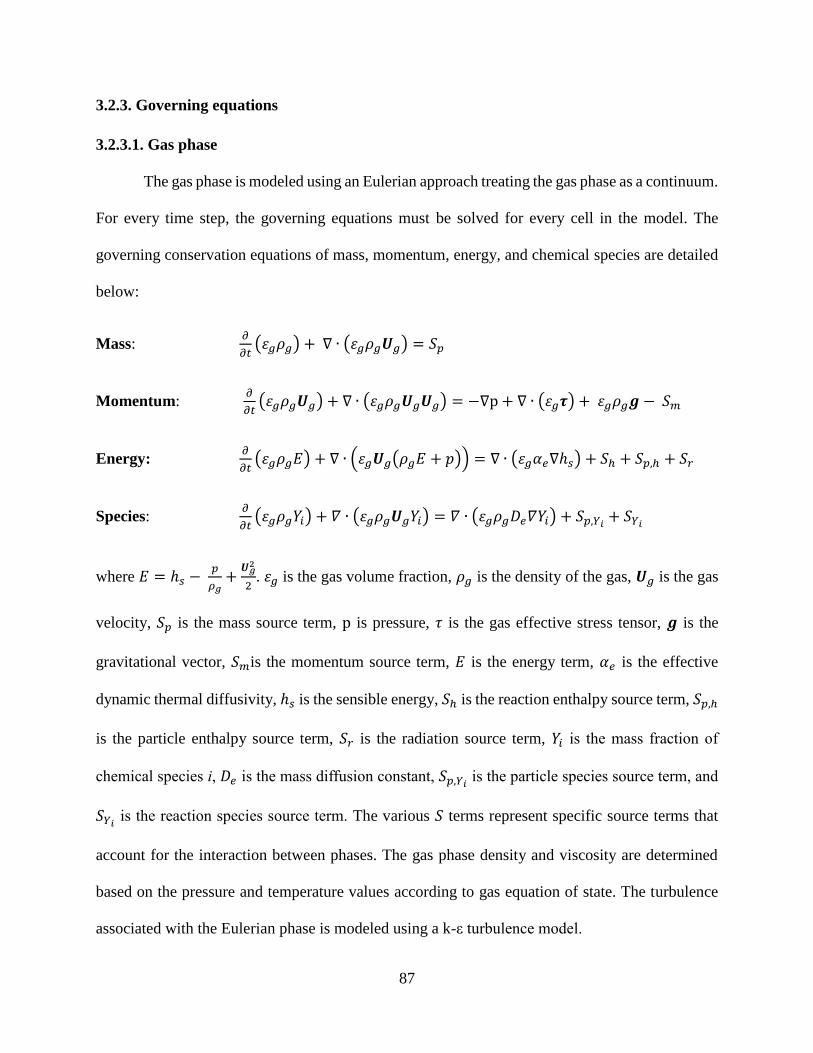
87
3.2.3. Governing equations
3.2.3.1. Gas phase
The gas phase is modeled using an Eulerian approach treating the gas phase as a continuum.
For every time step, the governing equations must be solved for every cell in the model. The
governing conservation equations of mass, momentum, energy, and chemical species are detailed
below:
Mass: 𝜕
𝜕𝑡(𝜀𝑔𝜌𝑔) + ∇ ∙ (𝜀𝑔𝜌𝑔𝑼𝑔) = 𝑆𝑝
Momentum: 𝜕
𝜕𝑡(𝜀𝑔𝜌𝑔𝑼𝑔) + ∇ ∙ (𝜀𝑔𝜌𝑔𝑼𝑔𝑼𝑔) = −∇p + ∇ ∙ (𝜀𝑔𝝉) + 𝜀𝑔𝜌𝑔𝒈 − 𝑆𝑚
Energy: 𝜕
𝜕𝑡(𝜀𝑔𝜌𝑔𝐸) + ∇ ∙ (𝜀𝑔𝑼𝑔(𝜌𝑔𝐸 + 𝑝)) = ∇ ∙ (𝜀𝑔𝛼𝑒∇ℎ𝑠) + 𝑆ℎ + 𝑆𝑝,ℎ + 𝑆𝑟
Species: 𝜕
𝜕𝑡(𝜀𝑔𝜌𝑔𝑌𝑖) + 𝛻 ∙ (𝜀𝑔𝜌𝑔𝑼𝑔𝑌𝑖) = 𝛻 ∙ (𝜀𝑔𝜌𝑔𝐷𝑒𝛻𝑌𝑖) + 𝑆𝑝,𝑌𝑖 + 𝑆𝑌𝑖
where 𝐸 = ℎ𝑠 − 𝑝
𝜌𝑔+𝑼𝑔2
2. 𝜀𝑔 is the gas volume fraction, 𝜌𝑔 is the density of the gas, 𝑼𝑔 is the gas
velocity, 𝑆𝑝 is the mass source term, p is pressure, 𝜏 is the gas effective stress tensor, 𝒈 is the
gravitational vector, 𝑆𝑚is the momentum source term, 𝐸 is the energy term, 𝛼𝑒 is the effective
dynamic thermal diffusivity, ℎ𝑠 is the sensible energy, 𝑆ℎ is the reaction enthalpy source term, 𝑆𝑝,ℎ
is the particle enthalpy source term, 𝑆𝑟 is the radiation source term, 𝑌𝑖 is the mass fraction of
chemical species i, 𝐷𝑒 is the mass diffusion constant, 𝑆𝑝,𝑌𝑖 is the particle species source term, and
𝑆𝑌𝑖 is the reaction species source term. The various 𝑆 terms represent specific source terms that
account for the interaction between phases. The gas phase density and viscosity are determined
based on the pressure and temperature values according to gas equation of state. The turbulence
associated with the Eulerian phase is modeled using a k-ε turbulence model.
88
3.2.3.2. Discrete particle phase
Each solid particle is accounted for in the CFD-DEM simulations. The Lagrangian
approach solves Newton’s equations of motion for each particle at each time step. To accurately
model the biomass-sand interactions, such as particle-particle and particle-wall, multiple modes
must be incorporated into the framework. This also means that certain assumptions about the
discrete particles must be made. The particles are assumed to be perfectly spherical, and particle
shrinkage occurs through a mass-proportional shrinkage model. As the mass of the particle, 𝑚𝑝,
shrinks due to pyrolysis reactions, the diameter of the particle, 𝑑𝑝, shrinks proportionally.
𝑑𝑝 = (6𝑚𝑝
𝜋𝜌𝑝)
0.333
For simulations where inter-particle (Van der Waals, electrostactic) forces are negligible, the
dominant forces affecting the Lagrangian phase include the contact forces from interactions
(particle-particle and particle-wall) and the drag force21. The relevant models used to calculate
these forces are discussed below.
3.2.3.2.1. Contact force
The boundary conditions for the reactor were set to a no-slip condition on the reactor walls.
Therefore, the contact forces present between the particles and the walls of the reactor are
calculated using a no-slip, elastic contact model. The particle contact model is also responsible for
solving the behavior of particle-particle interactions. The Hertz-Mindlin is a Hertzian variation of
the linear spring-dashpot model that deals with particles of a spherical shape. Hertz’s theory
applies to contact in the normal direction while Mindlin and Deresiewicz accounted for the
tangential direction22,23. The total contact force acting on each particle is equal to the sum of the
normal force, 𝐹𝑛, and the tangential force, 𝐹𝑡, applied to the particle.
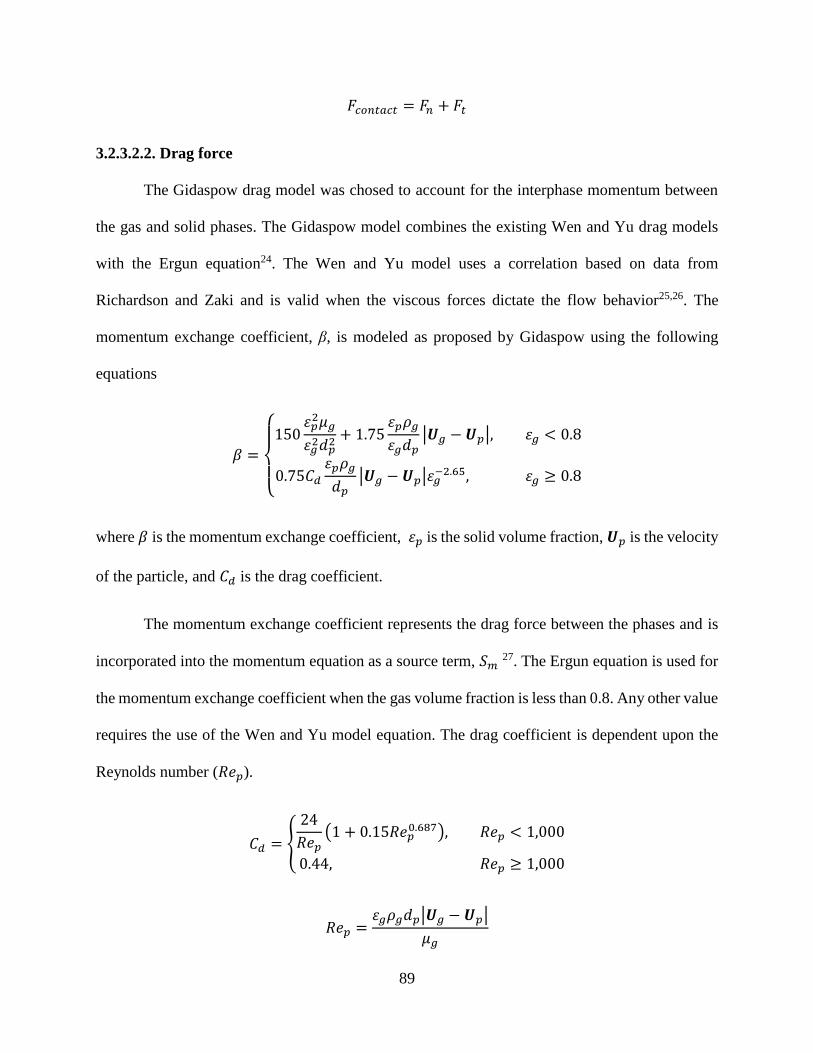
89
𝐹𝑐𝑜𝑛𝑡𝑎𝑐𝑡 = 𝐹𝑛 + 𝐹𝑡
3.2.3.2.2. Drag force
The Gidaspow drag model was chosed to account for the interphase momentum between
the gas and solid phases. The Gidaspow model combines the existing Wen and Yu drag models
with the Ergun equation24. The Wen and Yu model uses a correlation based on data from
Richardson and Zaki and is valid when the viscous forces dictate the flow behavior25,26. The
momentum exchange coefficient, β, is modeled as proposed by Gidaspow using the following
equations
𝛽 =
{
150
𝜀𝑝2𝜇𝑔
𝜀𝑔2𝑑𝑝2+ 1.75
𝜀𝑝𝜌𝑔
𝜀𝑔𝑑𝑝|𝑼𝑔 −𝑼𝑝|, 𝜀𝑔 < 0.8
0.75𝐶𝑑𝜀𝑝𝜌𝑔
𝑑𝑝|𝑼𝑔 − 𝑼𝑝|𝜀𝑔
−2.65, 𝜀𝑔 ≥ 0.8
where 𝛽 is the momentum exchange coefficient, 𝜀𝑝 is the solid volume fraction, 𝑼𝑝 is the velocity
of the particle, and 𝐶𝑑 is the drag coefficient.
The momentum exchange coefficient represents the drag force between the phases and is
incorporated into the momentum equation as a source term, 𝑆𝑚 27. The Ergun equation is used for
the momentum exchange coefficient when the gas volume fraction is less than 0.8. Any other value
requires the use of the Wen and Yu model equation. The drag coefficient is dependent upon the
Reynolds number (𝑅𝑒𝑝).
𝐶𝑑 = {
24
𝑅𝑒𝑝(1 + 0.15𝑅𝑒𝑝
0.687), 𝑅𝑒𝑝 < 1,000
0.44, 𝑅𝑒𝑝 ≥ 1,000
𝑅𝑒𝑝 =𝜀𝑔𝜌𝑔𝑑𝑝|𝑼𝑔 − 𝑼𝑝|
𝜇𝑔
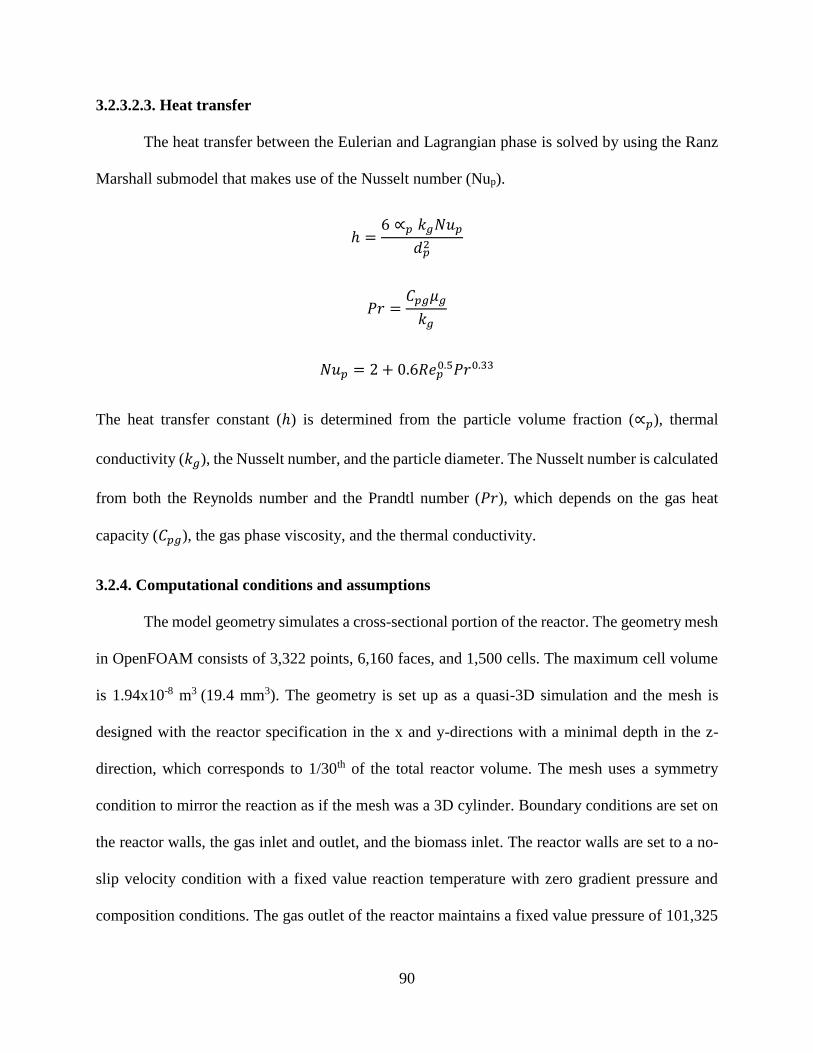
90
3.2.3.2.3. Heat transfer
The heat transfer between the Eulerian and Lagrangian phase is solved by using the Ranz
Marshall submodel that makes use of the Nusselt number (Nup).
ℎ =6 ∝𝑝 𝑘𝑔𝑁𝑢𝑝
𝑑𝑝2
𝑃𝑟 =𝐶𝑝𝑔𝜇𝑔
𝑘𝑔
𝑁𝑢𝑝 = 2 + 0.6𝑅𝑒𝑝0.5𝑃𝑟0.33
The heat transfer constant (ℎ) is determined from the particle volume fraction (∝𝑝), thermal
conductivity (𝑘𝑔), the Nusselt number, and the particle diameter. The Nusselt number is calculated
from both the Reynolds number and the Prandtl number (𝑃𝑟), which depends on the gas heat
capacity (𝐶𝑝𝑔), the gas phase viscosity, and the thermal conductivity.
3.2.4. Computational conditions and assumptions
The model geometry simulates a cross-sectional portion of the reactor. The geometry mesh
in OpenFOAM consists of 3,322 points, 6,160 faces, and 1,500 cells. The maximum cell volume
is 1.94x10⁻⁸ m3 (19.4 mm3). The geometry is set up as a quasi-3D simulation and the mesh is
designed with the reactor specification in the x and y-directions with a minimal depth in the z-
direction, which corresponds to 1/30th of the total reactor volume. The mesh uses a symmetry
condition to mirror the reaction as if the mesh was a 3D cylinder. Boundary conditions are set on
the reactor walls, the gas inlet and outlet, and the biomass inlet. The reactor walls are set to a no-
slip velocity condition with a fixed value reaction temperature with zero gradient pressure and
composition conditions. The gas outlet of the reactor maintains a fixed value pressure of 101,325
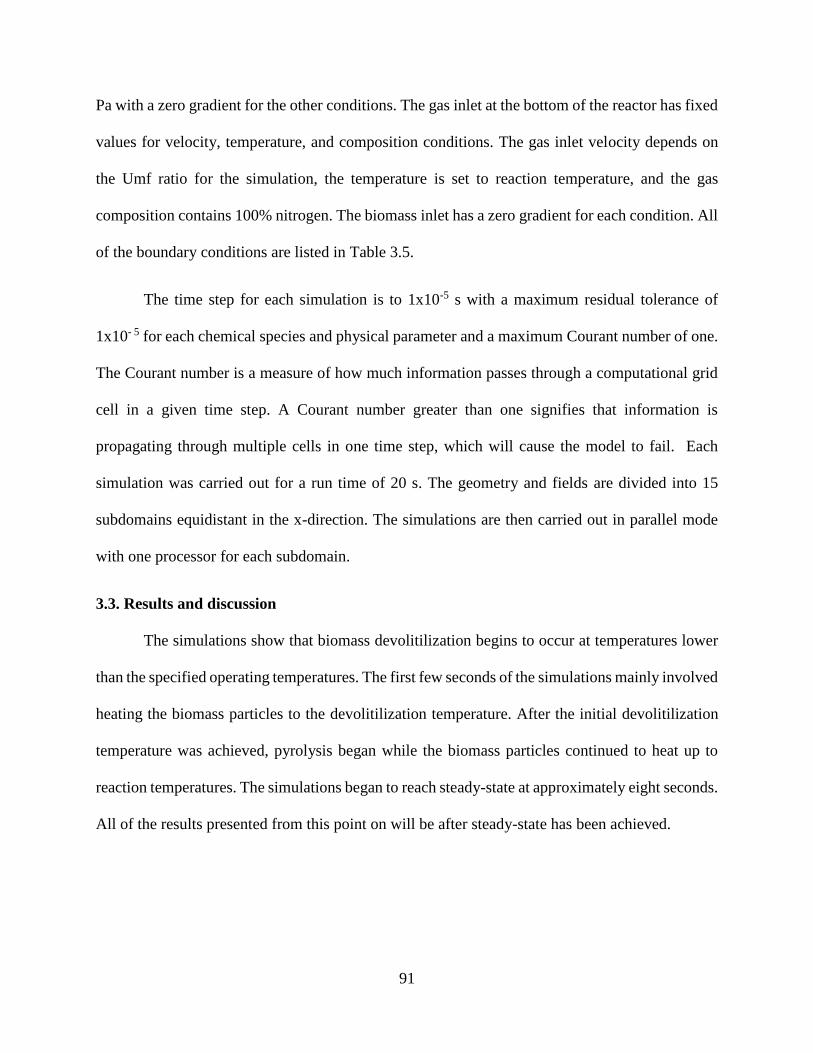
91
Pa with a zero gradient for the other conditions. The gas inlet at the bottom of the reactor has fixed
values for velocity, temperature, and composition conditions. The gas inlet velocity depends on
the Umf ratio for the simulation, the temperature is set to reaction temperature, and the gas
composition contains 100% nitrogen. The biomass inlet has a zero gradient for each condition. All
of the boundary conditions are listed in Table 3.5.
The time step for each simulation is to 1x10⁻⁵ s with a maximum residual tolerance of
1x10- 5 for each chemical species and physical parameter and a maximum Courant number of one.
The Courant number is a measure of how much information passes through a computational grid
cell in a given time step. A Courant number greater than one signifies that information is
propagating through multiple cells in one time step, which will cause the model to fail. Each
simulation was carried out for a run time of 20 s. The geometry and fields are divided into 15
subdomains equidistant in the x-direction. The simulations are then carried out in parallel mode
with one processor for each subdomain.
3.3. Results and discussion
The simulations show that biomass devolitilization begins to occur at temperatures lower
than the specified operating temperatures. The first few seconds of the simulations mainly involved
heating the biomass particles to the devolitilization temperature. After the initial devolitilization
temperature was achieved, pyrolysis began while the biomass particles continued to heat up to
reaction temperatures. The simulations began to reach steady-state at approximately eight seconds.
All of the results presented from this point on will be after steady-state has been achieved.

92
Table 3.5. Simulation boundary conditions
Boundary Velocity Temperature Pressure Gas Volume
Fraction
Chemical
Species
Gas Inlet Fixed value Fixed value Zero gradient Fixed value Fixed value
Walls No slip Fixed value Zero gradient Zero gradient Zero gradient
Biomass Inlet Zero gradient Zero gradient Zero gradient Zero gradient Zero gradient
Gas Outlet Zero gradient Zero gradient Fixed value Zero gradient Zero gradient
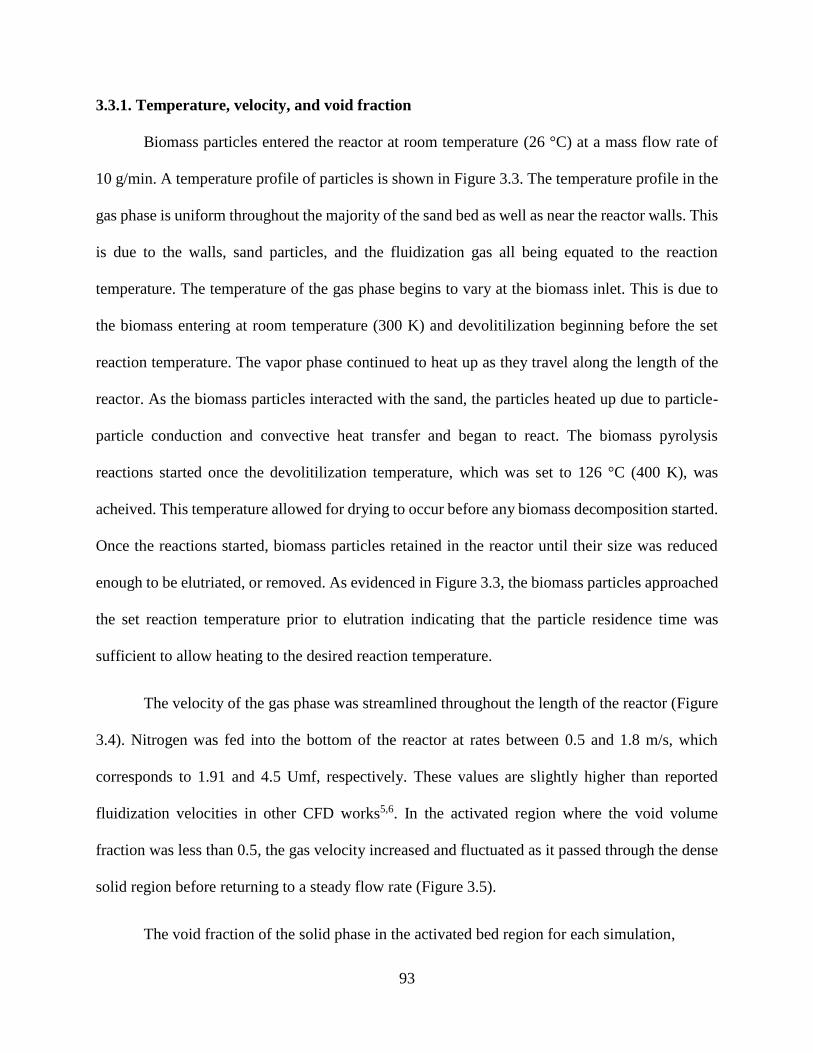
93
3.3.1. Temperature, velocity, and void fraction
Biomass particles entered the reactor at room temperature (26 °C) at a mass flow rate of
10 g/min. A temperature profile of particles is shown in Figure 3.3. The temperature profile in the
gas phase is uniform throughout the majority of the sand bed as well as near the reactor walls. This
is due to the walls, sand particles, and the fluidization gas all being equated to the reaction
temperature. The temperature of the gas phase begins to vary at the biomass inlet. This is due to
the biomass entering at room temperature (300 K) and devolitilization beginning before the set
reaction temperature. The vapor phase continued to heat up as they travel along the length of the
reactor. As the biomass particles interacted with the sand, the particles heated up due to particle-
particle conduction and convective heat transfer and began to react. The biomass pyrolysis
reactions started once the devolitilization temperature, which was set to 126 °C (400 K), was
acheived. This temperature allowed for drying to occur before any biomass decomposition started.
Once the reactions started, biomass particles retained in the reactor until their size was reduced
enough to be elutriated, or removed. As evidenced in Figure 3.3, the biomass particles approached
the set reaction temperature prior to elutration indicating that the particle residence time was
sufficient to allow heating to the desired reaction temperature.
The velocity of the gas phase was streamlined throughout the length of the reactor (Figure
3.4). Nitrogen was fed into the bottom of the reactor at rates between 0.5 and 1.8 m/s, which
corresponds to 1.91 and 4.5 Umf, respectively. These values are slightly higher than reported
fluidization velocities in other CFD works5,6. In the activated region where the void volume
fraction was less than 0.5, the gas velocity increased and fluctuated as it passed through the dense
solid region before returning to a steady flow rate (Figure 3.5).
The void fraction of the solid phase in the activated bed region for each simulation,
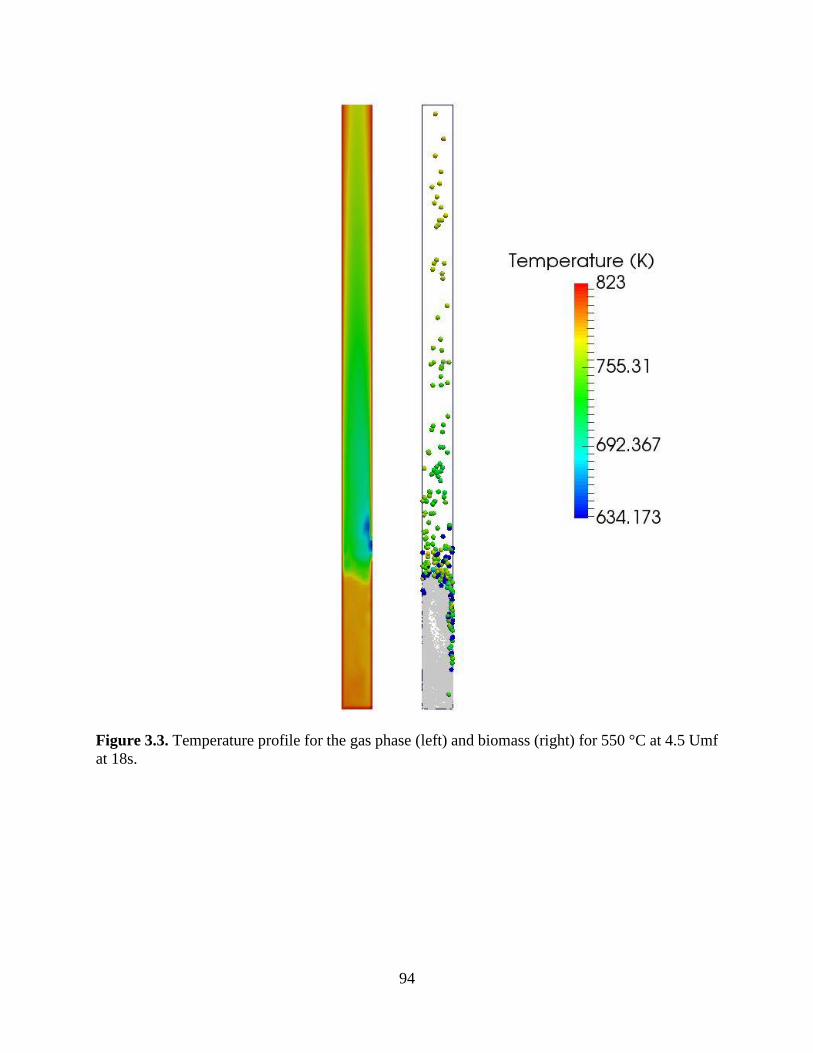
94
Figure 3.3. Temperature profile for the gas phase (left) and biomass (right) for 550 °C at 4.5 Umf
at 18s.
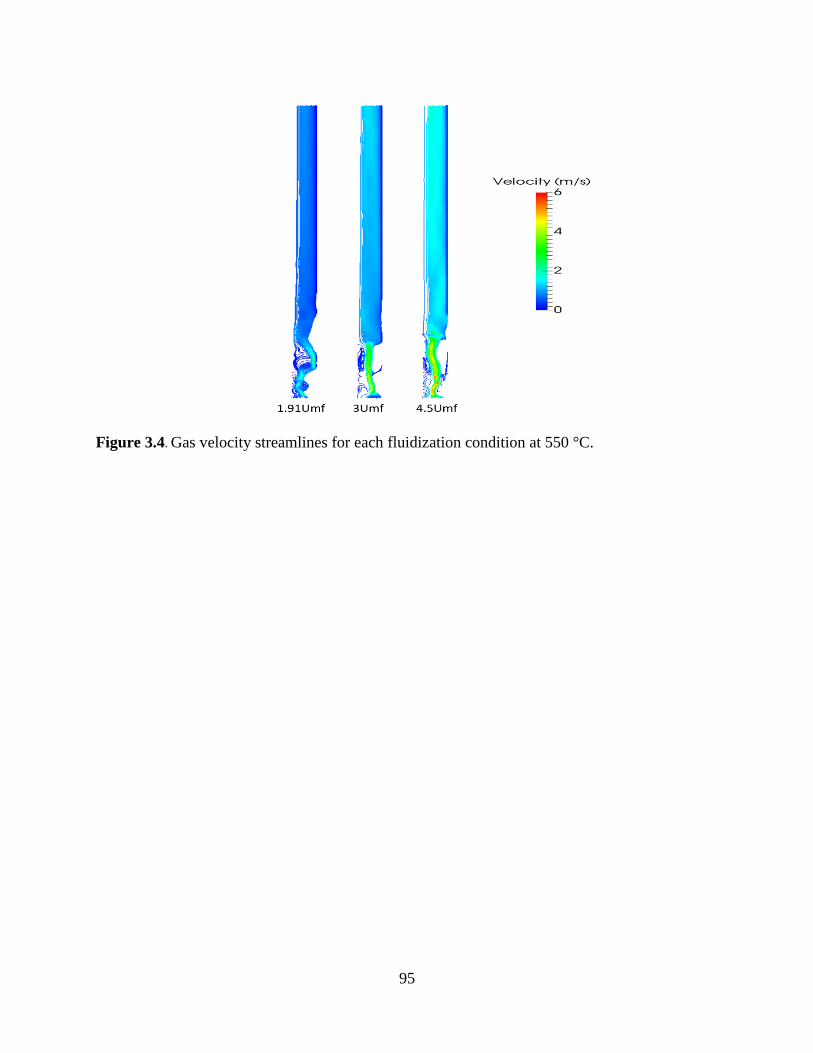
95
Figure 3.4. Gas velocity streamlines for each fluidization condition at 550 °C.
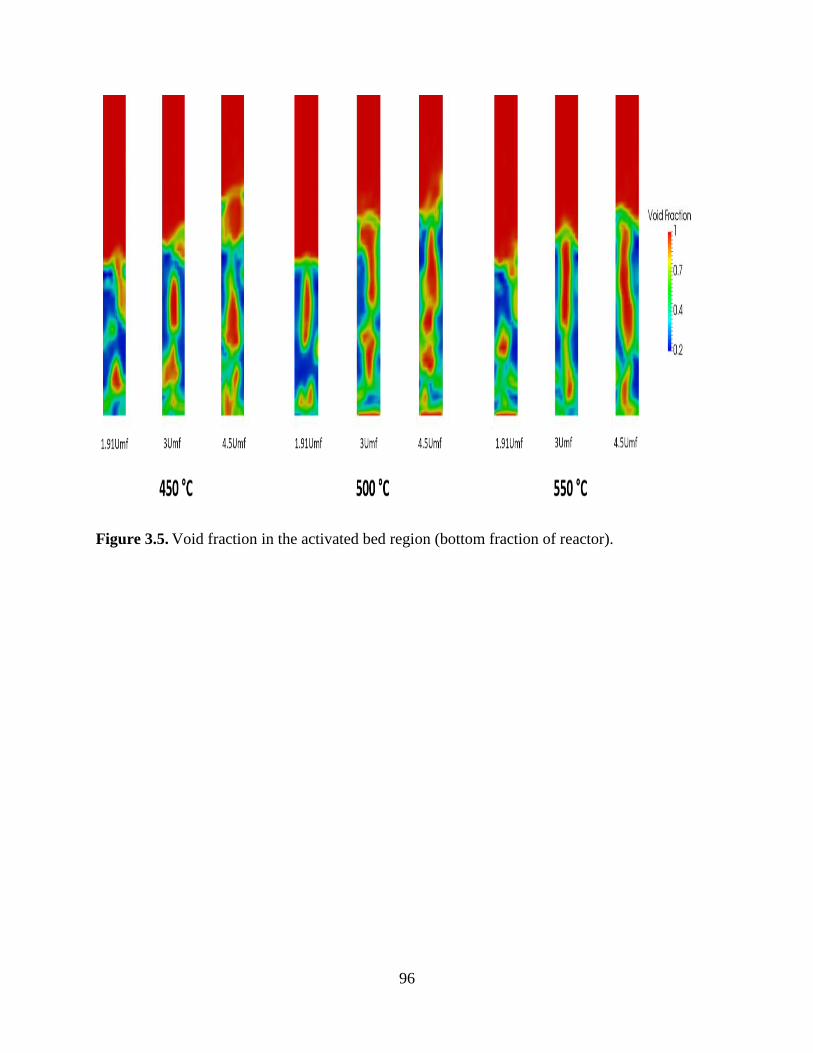
96
Figure 3.5. Void fraction in the activated bed region (bottom fraction of reactor).
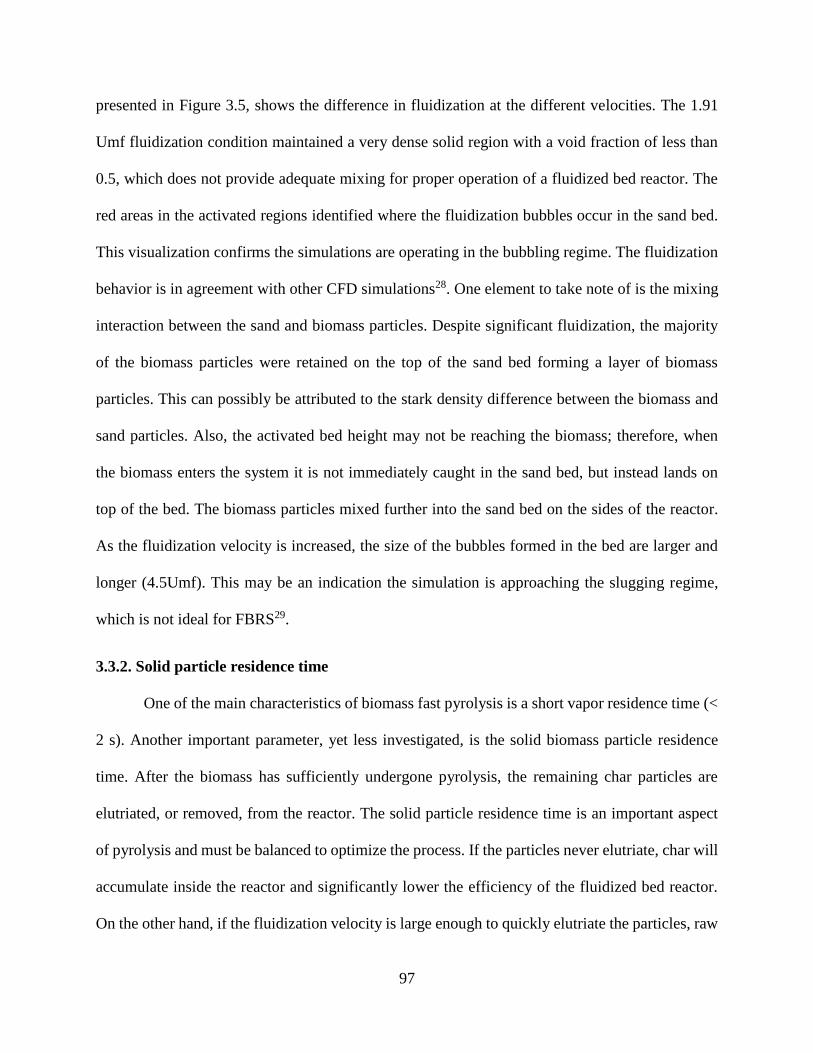
97
presented in Figure 3.5, shows the difference in fluidization at the different velocities. The 1.91
Umf fluidization condition maintained a very dense solid region with a void fraction of less than
0.5, which does not provide adequate mixing for proper operation of a fluidized bed reactor. The
red areas in the activated regions identified where the fluidization bubbles occur in the sand bed.
This visualization confirms the simulations are operating in the bubbling regime. The fluidization
behavior is in agreement with other CFD simulations28. One element to take note of is the mixing
interaction between the sand and biomass particles. Despite significant fluidization, the majority
of the biomass particles were retained on the top of the sand bed forming a layer of biomass
particles. This can possibly be attributed to the stark density difference between the biomass and
sand particles. Also, the activated bed height may not be reaching the biomass; therefore, when
the biomass enters the system it is not immediately caught in the sand bed, but instead lands on
top of the bed. The biomass particles mixed further into the sand bed on the sides of the reactor.
As the fluidization velocity is increased, the size of the bubbles formed in the bed are larger and
longer (4.5Umf). This may be an indication the simulation is approaching the slugging regime,
which is not ideal for FBRS29.
3.3.2. Solid particle residence time
One of the main characteristics of biomass fast pyrolysis is a short vapor residence time (<
2 s). Another important parameter, yet less investigated, is the solid biomass particle residence
time. After the biomass has sufficiently undergone pyrolysis, the remaining char particles are
elutriated, or removed, from the reactor. The solid particle residence time is an important aspect
of pyrolysis and must be balanced to optimize the process. If the particles never elutriate, char will
accumulate inside the reactor and significantly lower the efficiency of the fluidized bed reactor.
On the other hand, if the fluidization velocity is large enough to quickly elutriate the particles, raw
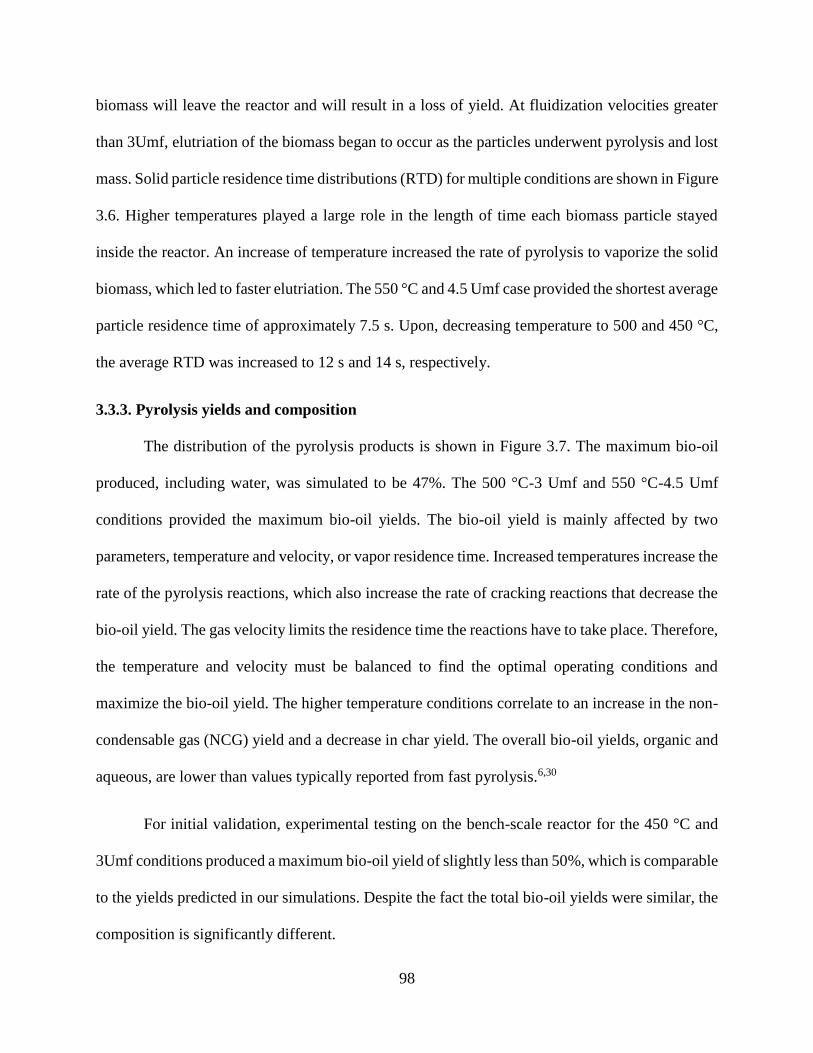
98
biomass will leave the reactor and will result in a loss of yield. At fluidization velocities greater
than 3Umf, elutriation of the biomass began to occur as the particles underwent pyrolysis and lost
mass. Solid particle residence time distributions (RTD) for multiple conditions are shown in Figure
3.6. Higher temperatures played a large role in the length of time each biomass particle stayed
inside the reactor. An increase of temperature increased the rate of pyrolysis to vaporize the solid
biomass, which led to faster elutriation. The 550 °C and 4.5 Umf case provided the shortest average
particle residence time of approximately 7.5 s. Upon, decreasing temperature to 500 and 450 °C,
the average RTD was increased to 12 s and 14 s, respectively.
3.3.3. Pyrolysis yields and composition
The distribution of the pyrolysis products is shown in Figure 3.7. The maximum bio-oil
produced, including water, was simulated to be 47%. The 500 °C-3 Umf and 550 °C-4.5 Umf
conditions provided the maximum bio-oil yields. The bio-oil yield is mainly affected by two
parameters, temperature and velocity, or vapor residence time. Increased temperatures increase the
rate of the pyrolysis reactions, which also increase the rate of cracking reactions that decrease the
bio-oil yield. The gas velocity limits the residence time the reactions have to take place. Therefore,
the temperature and velocity must be balanced to find the optimal operating conditions and
maximize the bio-oil yield. The higher temperature conditions correlate to an increase in the non-
condensable gas (NCG) yield and a decrease in char yield. The overall bio-oil yields, organic and
aqueous, are lower than values typically reported from fast pyrolysis.6,30
For initial validation, experimental testing on the bench-scale reactor for the 450 °C and
3Umf conditions produced a maximum bio-oil yield of slightly less than 50%, which is comparable
to the yields predicted in our simulations. Despite the fact the total bio-oil yields were similar, the
composition is significantly different.
99
Figure 3.6. Residence time distributions (RTD) with histograms for the 4.5Umf condition at 450
(left), 500 (middle), and 550°C (right).
Figure 3.7. Simulated fast pyrolysis yields of bio-oil, non-condensable gases (NCG) and char for
1.91Umf (top), 3Umf (left), and 4.5Umf (right) at 450, 500, and550 °C.
100
In our simulations, there is significantly less water produced than expected. The simulated
bio-oil produced has a water content (wt. %) of less than 7% compared to 20-30% observed
experimentally, both on our bench-scale and in previous experimental work31. The original
pyrolysis scheme includes a reaction step for liquid water to be converted into water vapor;
however, this work made use of an existing water evaporation model built-in to OpenFOAM. This
could be one of the reasons as to why the water content differs from other work done using this
scheme. As mentioned in earlier studies, the secondary reaction scheme for each bio-oil species
was based on a lumped pyrolysis model with kinetic parameters for each cracking reaction being
the same19,20,32.
The simulation results were further probed in this section to assess the impact of operating
conditions of the oil quality and contrast the simulation findings with other works. The comparison
between simulations and validation is possible because the fast pyrolysis reaction scheme allows
for the determination of specific “model” components and their respective concentration in the
bio-oil. The steady state breakdown of the bio-oil components for the 550 °C simulations is shown
in Figure 3.8. The main component for each condition is levoglucosan with a weight percent
between 39 and 50 wt. %. This large amount of levoglucosan can be somewhat expected since
levoglucosan is the main bio-oil product from the cellulose branch of reactions in the scheme. This,
coupled with the fact that cellulose is the largest component in switchgrass and levoglucosan has
a higher density than other bio-oil components, lends to the bio-oil having a large fraction of
levoglucosan. Reported experimental results differ with simulations and show levoglucosan yields
ranging from 5 to 33 wt. % of the bio-oil33-35. The reason for this discrepancy is most likely due to
the limitations of the kinetic scheme. While the comprehensive scheme is one of the most detailed
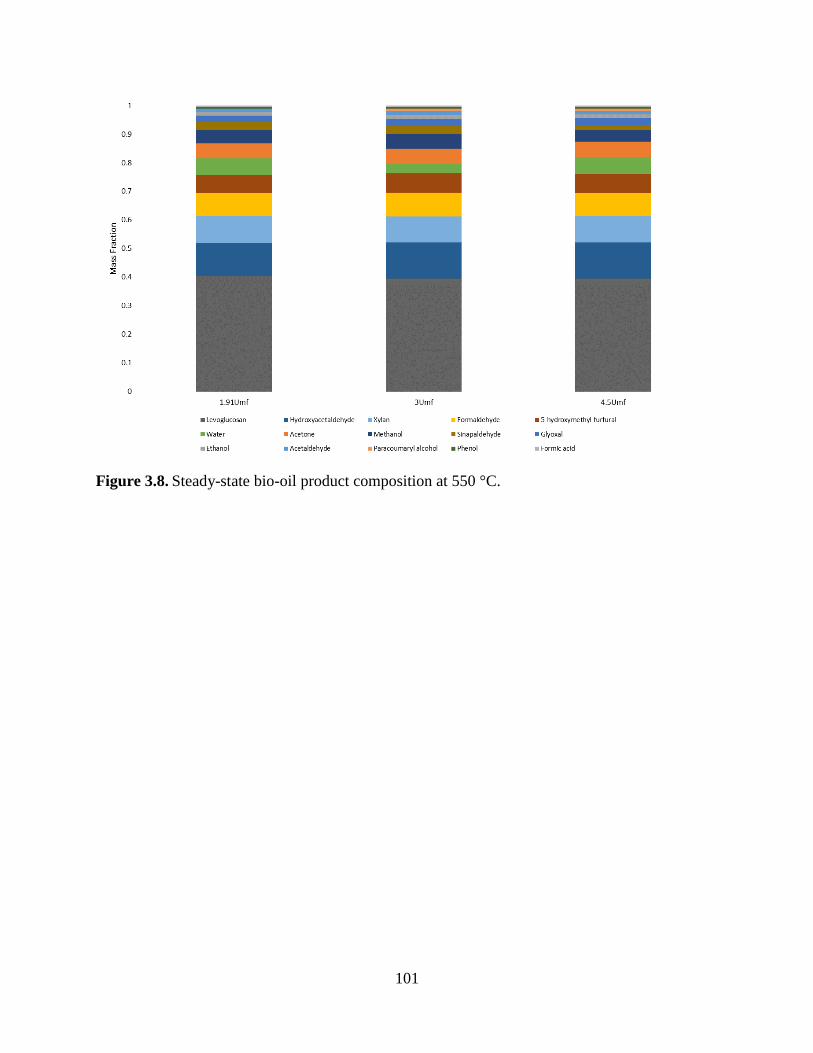
101
Figure 3.8. Steady-state bio-oil product composition at 550 °C.
102
schemes to date, it still utilizes the main “model” bio-oil compounds and does not fully capture
the hundreds of bio-oil compounds that are observed experimentally. The simulated findings in
this study on the yield of levoglucosan are larger than those reported by others where levoglucosan
yields range from 22 to 40 wt. %6,36. The cellulose content used in this simulation is slightly higher
than in other CFD models using the same pyrolysis scheme. Levoglucosan is a highly oxygenated
compound which would necessitate downstream deoxygenation. The fluidization velocity does not
appear to have a significant effect on the levoglucosan content of the bio-oil. This can be attributed
to secondary cracking reactions all having the same kinetics; therefore, all reactions has the same
reaction rate constant at each operating condition. As reaction temperature is increased, the
levoglucosan content decreased. This trend can most likely be attributed to the rate of product
formation in the primary pyrolysis kinetics and not the cracking reactions.
Simulated product yields predicted considerably more NCGs (25-40 wt. %) than is
typically reported for biomass fast pyrolysis5,6,37. Simulations were carried out at 550 °C and 3Umf
without the secondary cracking reactions and the bio-oil yield increased by approximately 10
wt. %. Apart from the overall bio-oil yield, the lack of secondary reactions had no real effect on
the moisture content of the bio-oil. Previous work has shown that water is produced primarily from
the secondary cracking reactions38,39. Therefore, the secondary cracking reactions in the
simulations are not accounting for adequate water formation. Further work needs to be conducted
to account for more water production in the kinetic scheme as well as a more robust experimental
validation for the hydrodynamics and product yields of the simulations.
3.4. Conclusions
The present study outlines the findings of a computational fluid dynamics and discrete
element modeling study of switchgrass fast pyrolysis in a bubbling fluidized bed reactor. The
103
model included a detailed fast pyrolysis reaction scheme and its associated kinetics. The
simulations produced results comparable to yields observed experimentally on an identical bench-
scale system. The main difference between the simulation, the experimental results and previous
work is the moisture content of bio-oil, which was 20-25 wt. % less than previous CFD studies
and experimental work. Levoglucosan was the primary component of the predicted bio-oil ranging
between 39 and 50 wt. %. At higher temperatures and higher fluidization velocities, solid biomass
particles began to elutriate from the reactor. Lower temperatures resulted in high residence time
and, as the temperature was reduced from 550 to 450 °C, the biomass particle RTD increased from
7.5 to 14 s, respectively. The secondary reactions have a significant effect on the bio-oil yield at
550 °C and 3Umf leading to a 10 wt. % increase in yield. The bio-oil is almost entirely made up
on the organic fraction with a small moisture content. Future work needs to be done to investigate
the discrepancy between the amount of water of the simulation and experimental pyrolysis tests.

104
List of references
105
(1) Cheng, J. Biomass to Renewable Energy Processes, Second Edition; CRC Press, 2017.
(2) Tidball, R. B., J. ; Rodriguez, N.; Knoke, S. . Cost and Performance Assumptions for
Modeling Electricity Generation Technologies. 2010.
(3) Dupont, C.; Chen, L.; Cances, J.; Commandre, J.-M.; Cuoci, A.; Pierucci, S.; Ranzi, E.
Biomass pyrolysis: Kinetic modelling and experimental validation under high temperature
and flash heating rate conditions. Journal of Analytical and Applied Pyrolysis 2009, 85 (1),
260.
(4) Papadikis, K.; Gu, S.; Bridgwater, A. V. CFD modelling of the fast pyrolysis of biomass
in fluidised bed reactors: Modelling the impact of biomass shrinkage. Chemical
Engineering Journal 2009, 149 (1), 417.
(5) Ranganathan, P.; Gu, S. Computational fluid dynamics modelling of biomass fast pyrolysis
in fluidised bed reactors, focusing different kinetic schemes. Bioresource Technology
2016, 213, 333.
(6) Mellin, P.; Kantarelis, E.; Yang, W. Computational fluid dynamics modeling of biomass
fast pyrolysis in a fluidized bed reactor, using a comprehensive chemistry scheme. Fuel
2014, 117, Part A, 704.
(7) Sharma, A.; Wang, S.; Pareek, V.; Yang, H.; Zhang, D. Multi-fluid reactive modeling of
fluidized bed pyrolysis process. Chemical Engineering Science 2015, 123, 311.
(8) Bradbury, A. G. W.; Sakai, Y.; Shafizadeh, F. A kinetic model for pyrolysis of cellulose.
Journal of Applied Polymer Science 1979, 23 (11), 3271.
(9) Di Blasi, C. Analysis of Convection and Secondary Reaction Effects Within Porous Solid
Fuels Undergoing Pyrolysis. Combustion Science and Technology 1993, 90 (5-6), 315.
(10) Zhu, H. P.; Zhou, Z. Y.; Yang, R. Y.; Yu, A. B. Discrete particle simulation of particulate
systems: Theoretical developments. Chemical Engineering Science 2007, 62 (13), 3378.
(11) ASTM, 2015; Vol. E1758-01.
(12) Sluiter, A.; Hames, B.; Ruiz, R.; Scarlata, C.; Sluiter, J.; Templeton, D.; Crocker, D.
Determination of structural carbohydrates and lignin in biomass. Laboratory analytical
procedure 2008, 1617, 1.
(13) Corbetta, M. P., S.; Ranzi, E.; Bennadji, H.; Fisher, E. M. XXXVI Meeting of the Italian
Section of the Combustion Institute, 2013.
(14) Ranzi, E.; Cuoci, A.; Faravelli, T.; Frassoldati, A.; Migliavacca, G.; Pierucci, S.;
Sommariva, S. Chemical kinetics of biomass pyrolysis. Energy & Fuels 2008, 22 (6), 4292.
(15) Ranzi, E.; Debiagi, P. E. A.; Frassoldati, A. Mathematical Modeling of Fast Biomass
Pyrolysis and Bio-Oil Formation. Note I: Kinetic Mechanism of Biomass Pyrolysis. ACS
Sustainable Chemistry & Engineering 2017, 5 (4), 2867.
(16) Di Blasi, C.; Russo, G. In Advances in Thermochemical Biomass Conversion; Bridgwater,
A. V., Ed.; Springer Netherlands: Dordrecht, 1993, DOI:10.1007/978-94-011-1336-6_70
10.1007/978-94-011-1336-6_70.
(17) Humbird, D.; Trendewicz, A.; Braun, R.; Dutta, A. One-Dimensional Biomass Fast
Pyrolysis Model with Reaction Kinetics Integrated in an Aspen Plus Biorefinery Process
Model. ACS Sustainable Chemistry & Engineering 2017, 5 (3), 2463.
(18) Faravelli, T.; Frassoldati, A.; Migliavacca, G.; Ranzi, E. Detailed kinetic modeling of the
thermal degradation of lignins. Biomass and Bioenergy 2010, 34 (3), 290.
(19) Blondeau, J.; Jeanmart, H. Biomass pyrolysis at high temperatures: Prediction of gaseous
species yields from an anisotropic particle. Biomass and Bioenergy 2012, 41, 107.
106
(20) Park, W. C.; Atreya, A.; Baum, H. R. Experimental and theoretical investigation of heat
and mass transfer processes during wood pyrolysis. Combustion and Flame 2010, 157 (3),
481.
(21) Di Renzo, A.; Di Maio, F. P. Comparison of contact-force models for the simulation of
collisions in DEM-based granular flow codes. Chemical Engineering Science 2004, 59 (3),
525.
(22) Hertz, H. Uber die Beruhrung fester elastischer Korper (On the contact of elastic solids).
Journal fur die reine und angewandte Mathematik 1882, 92, 156.
(23) Mindlin, R. D. D., H. Elastic spheres in contact under varying oblique forces. Journal of
Applied Mechanics 1953, 20, 327.
(24) Gidaspow, D. Multiphase Flow and Fluidization: Continuum and Kinetic Theory
Descriptions; Academic Press, 1994.
(25) Lundberg, J. H., B.M. Proc. 49th Scand. Conf. Simulation and Modeling, Oslo, Norway,
2008.
(26) Richardson, J. F. Z., W. N. Sedimentation and fluidization: Part I. Transactions of the
American Institute of Chemical Engineers 1954, 32, 35.
(27) Benzarti, S.; Mhiri, H.; Bournot, H. Drag models for simulation gas–solid flow in the
bubbling fluidized bed of FCC particles. World Academy of Science, Engineering and
Technology 2012, 61, 1138.
(28) Papadikis, K.; Gu, S.; Fivga, A.; Bridgwater, A. V. Numerical Comparison of the Drag
Models of Granular Flows Applied to the Fast Pyrolysis of Biomass. Energy & Fuels 2010,
24 (3), 2133.
(29) Ramirez, E.; Finney, C. E. A.; Pannala, S.; Daw, C. S.; Halow, J.; Xiong, Q. Computational
study of the bubbling-to-slugging transition in a laboratory-scale fluidized bed. Chemical
Engineering Journal 2017, 308, 544.
(30) Kan, T.; Strezov, V.; Evans, T. J. Lignocellulosic biomass pyrolysis: A review of product
properties and effects of pyrolysis parameters. Renewable and Sustainable Energy Reviews
2016, 57, 1126.
(31) Bridgwater, A. V.; Meier, D.; Radlein, D. An overview of fast pyrolysis of biomass.
Organic Geochemistry 1999, 30 (12), 1479.
(32) Miller, R. S.; Bellan, J. A Generalized Biomass Pyrolysis Model Based on Superimposed
Cellulose, Hemicelluloseand Liqnin Kinetics. Combustion Science and Technology 1997,
126 (1-6), 97.
(33) Mullen, C. A.; Boateng, A. A. Chemical Composition of Bio-oils Produced by Fast
Pyrolysis of Two Energy Crops. Energy & Fuels 2008, 22 (3), 2104.
(34) Bennett, N. M.; Helle, S. S.; Duff, S. J. B. Extraction and hydrolysis of levoglucosan from
pyrolysis oil. Bioresource Technology 2009, 100 (23), 6059.
(35) Li, L. I. N.; Zhang, H. Preparing Levoglucosan Derived from Waste Material by Pyrolysis.
Energy Sources 2004, 26 (11), 1053.
(36) Mellin, P.; Kantarelis, E.; Zhou, C.; Yang, W. Simulation of Bed Dynamics and Primary
Products from Fast Pyrolysis of Biomass: Steam Compared to Nitrogen as a Fluidizing
Agent. Industrial & Engineering Chemistry Research 2014, 53 (30), 12129.
(37) Trendewicz, A.; Braun, R.; Dutta, A.; Ziegler, J. One dimensional steady-state circulating
fluidized-bed reactor model for biomass fast pyrolysis. Fuel 2014, 133, 253.
(38) Morf, P.; Hasler, P.; Nussbaumer, T. Mechanisms and kinetics of homogeneous secondary
reactions of tar from continuous pyrolysis of wood chips. Fuel 2002, 81 (7), 843.

107
(39) Zhang, X.; Yang, W.; Blasiak, W. Thermal decomposition mechanism of levoglucosan
during cellulose pyrolysis. Journal of Analytical and Applied Pyrolysis 2012, 96, 110.
108
CHAPTER 4 COMPUTATIONALLY MODELING BIOMASS
HYDROUS PYROLYSIS USING IN-SITU HYDROGEN
GENERATION
109
This chapter has been prepared as a manuscript for submission to an academic journal upon
completion of the thesis.
I am the primary author on this work. My responsibilities included finding existing kinetics
reported for hydrodeoxygenation in literature. I also modified the simulation from Chapter 3 to
simulate hydrous pyrolysis. I combined the reported kinetics as well as the determined kinetics
from Chapter 2 into the new simulation. The other authors on this manuscript are Oluwafemi
Oyedeji, Dr. Nourredine Abdoulmoumine, and Dr. Nicole Labbé.
Abstract
A computation fluid dynamics (CFD) model was developed with the intention of modeling
biomass hydrous pyrolysis to produce refinery-ready bio-crude oil. The hydrous pyrolysis process
replaces nitrogen with steam as the fluidizing gas to facilitate in-situ hydrogen generation to fulfill
the hydrogen requirement of hydrous pyrolysis. This chapter combines experimentally derived
water-gas shift kinetics from Chapter 2 with a CFD model of conventional biomass fast pyrolysis
from Chapter 3. Hydrous pyrolysis simulations were carried out from 300 to 500 °C at 30 bar using
a comprehensive pyrolysis scheme coupled with a global, lumped HDO kinetic scheme. Individual
bio-oil components from pyrolysis were summed together in one lumped “Oil” component. The
HDO scheme deoxygenizes the “Oil” component to produce either a heavy or light fraction of
deoxygenated bio-oil. Simulations have proceeded for approximately sevon seconds of simulation
time. The change in operating conditions increased the temperature uniformity in the reactor as
well as increased the speed of particle elutriation. The simulations have not reached steady-state,
therefore we are unable to conclude on the final product yields. But, the selectivity of the HDO
kinetics appears to significantly favor production of the heavy oil fraction.
110
4.1. Introduction
Conventional fast pyrolysis is one of the few technologies that give us the opportunity to
engineer in minutes what takes millions of years in nature – thermolytic (~400-600 ˚C) conversion
of biological materials into an energy dense biocrude oil. This bio-based crude oil is commonly
referred to as bio-oil and is regarded as a potential replacement for crude petroleum in refineries.
In general, when bio-oil is produced through conventional fast pyrolysis, it contains high oxygen
content (~40-50 wt. %), is immiscible with conventional hydrocarbon fuels, and has high acidity
(pH 2–3 and total acid number (TAN) of 100–200)1. In contrast, crude petroleum oil contains less
than 1 wt. % oxygen2,3. Indeed, while crude petroleum oils are composed mainly of hydrocarbons,
bio-oils are primarily composed of oxygenates with reactive functional groups such as carboxylic
acid, aldehydes, and ketones leading to polymerization reactions, which increases the viscosity
over time.2,4,5 The presence and higher proportion of these reactive compounds in bio-oils result
in poor stability and lower temperatures (~ -20°C) are required to prevent these polymerization
reactions.6 Additionally, the high TAN limits the ability to process bio-oil in existing
petrochemical refining infrastructures which require TANs less than 2 to avoid corrosion to
construction materials used in transport vessels and refinery conversion equipment1. All of the
aforementioned shortcomings effectively make bio-oil a low-value feedstock with little demand 7.
Over the past decades, there has been a concerted research effort aimed at improving bio-
oil’s chemical and physical properties. In particular, catalytic fast pyrolysis in the presence of a
catalyst, usually zeolite catalysts, has been extensively investigated with the goal of producing
hydrocarbons from biomass.4,8-10 Through dehydration, decarboxylation, and decarbonylation
reactions, catalytic fast pyrolysis vapors are partially stripped of their oxygen through release of
water, carbon dioxide or carbon monoxide. Catalytic fast pyrolysis has been able to produce
111
stabilized bio-oil.11 However, significant challenges remain. The oxygen content is reduced but it
still remains high around 20 wt. %.4 Furthermore, at best, only 20–30% of the carbon in the
biomass ends up in the liquid product and approximately 30% of the carbon forms into coke,
causing catalyst deactivation.10 After decades of intense catalytic fast pyrolysis research, it has
become evident that lignocellulosic biomass’s low hydrogen density cannot sustain bio-oil
deoxygenation without additional hydrogen input. Bio-oil can be upgraded to have a lower oxygen
content through hydrotreating. Hydrotreating of bio-oil involves re-evaporating and reacting bio-
oil vapors with hydrogen gas over sulfide cobalt or nickel molybdenum catalysts (sulfide CoMo
and NiMo, respectively) at very high pressures (100–170 bar), 310–375 °C 12, and low space
velocities (0.1–0.2 LHSV) 13,14 . However, this approach has significant drawbacks: including i)
low liquid yield (26–30 wt. % of the biomass)1,15, and ii) formation of large quantities of coke,
leading to rapid catalyst deactivation and reactor clogging 12 and a slow and overall expensive
process. The shortcomings of catalytic fast pyrolysis and hydrotreating motivate exploration of
biomass pyrolytic decomposition under hydrogen environments, an idea initially successfully
tested for coal16-18. Biomass pyrolysis approaches under hydrogen environments have been labeled
hydropyrolysis 1,7,19 or reactive catalytic pyrolysis, depending on the process hydrogen pressure
requirement20. In these approaches, the reducing hydrogen gas is speculated to generate hydrogen
radicals which react with pyrolysis volatiles, commonly in the presence of a catalyst, to remove
oxygen, released in the form of water (H2O), carbon monoxide (CO), and carbon dioxide (CO2),
and while yielding hydrocarbons. It is also speculated that many of the reactive pyrolysis volatile
intermediates, which would otherwise undergo polymerization, leading to bio-oil instability as
well as yield reduction and catalyst coking, are quenched by the hydrogen radicals14,21. Fast
pyrolysis under hydrogen environments present several advantages including i) lower pressure
112
requirements when compared to hydrotreating (80 % less) 7,19, and ii) lower energy demand due
to the process exothermicity 7.
Since 2010, experimental research efforts in this area have focused on developing
continuous processes with conditions analogous to fast pyrolysis, with the main difference being
the presence of a hydrogen atmosphere22-27. One of the obstacles for hydrogen assisted pyrolysis
is the hydrogen requirement to maximize the hydrogenation of vapors. Hydrogen is an expensive
material to supply from an outside source. Therefore, it is potentially more economical and
efficient to produce hydrogen on site using readily available starting materials. In this chapter, the
WGS kinetics were combined with the CFD pyrolysis model and HDO bio-oil chemistry to
computationally model a one-pot biomass hydrous pyrolysis bubbling fluidized bed system.
4.2. Modeling approach
Our catalytic fast hydrous pyrolysis model incorporates the previous fast pyrolysis model
developed using OpenFOAM, an open-source C++ software. The catalytic fast hydrous pyrolysis
(CFHP) model uses the same modeling approach outlined in detail in Chapter 3, section 2. CFHP
is simulated at temperatures from 300 to 500 °C, a pressure of 30 bar, and two different fluidization
velocities. Furthermore, our boundary conditions (BC) remain largely unchanged from the fast
pyrolysis simulations with changes only coming in reaction pressure, temperature, and fluidization
gas composition. The reaction pressure is set at the reactor outlet BC to 30 bar from atmospheric.
Based on hydropyrolysis, we assume that the reaction temperatures for CFHP are typically lower
than that for fast pyrolysis, so the reaction temperature (wall and gas inlet BCs) are set to lower
temperatures, 300-500 °C. Whereas our fast pyrolysis simulations used 100 % nitrogen as an inert
fluidizing gas, we replaced nitrogen with steam (with 1% nitrogen) while maintaining the same
fluidization velocities as the fast pyrolysis simulations. The two velocities used in the simulations
113
correspond to the same velocities for the 3 and 4.5 Umf pyrolysis conditions. The biomass
feedstock used is switchgrass with a 10% moisture content, see Chapter 3 for biomass composition.
4.2.1. Reaction scheme and kinetics
The hydrous pyrolysis maintains the same comprehensive pyrolysis reaction scheme used
in Chapter 3, section 2.2. The reaction scheme and kinetics proceed through a first-order Arrhenius
reaction rate that does not take pressure into account28. Previous studies have shown a hydrogen
environment and moderate pressures do not greatly affect the composition of the bio-oil, and the
decrease in overall yield is attributed to cracking reactions29,30. Therefore, it is assumed that the
pyrolysis kinetics from Chapter 3 are applicable to the hydrous pyrolysis model. In Chapter 3,
section 2.2, the individual components of biomass, i.e. cellulose, hemicellulose, ligninH, ligninC,
and ligninO, undergo reactions to produce char, non-condensable gases (CO, CO2, H2, CH4, C2H4),
and bio-oil. The bio-oil is comprised of several different “model” bio-oil compounds, e.g.
levoglucosan, glyoxal, and hydroxyl methyl furfural (HMFU). This work combines a
comprehensive, detailed pyrolysis scheme with a global, lumped kinetic model for HDO. In order
to incorporate the global, lumped model, the detailed pyrolysis compounds are summed into one
“oil” species to undergo the HDO reactions. The hydrous pyrolysis simulation does not account
for the secondary cracking kinetics that were in the fast pyrolysis simulations of Chapter 3 as it is
hypothesized that in a one-pot process, cracking reactions are replaced by HDO reactions. By
assuming the pyrolysis cracking reactions have a negligible impact on the overall reaction, the
hydrous pyrolysis simulations will model ideal process conditions that minimize the occurrence of
secondary cracking reactions and maximize the amount of pyrolysis oil produced. The oil will then
undergo HDO reactions to produce light and heavy fractions of deoxygenated bio oil as well as
more non-condensable gases and char.31,32
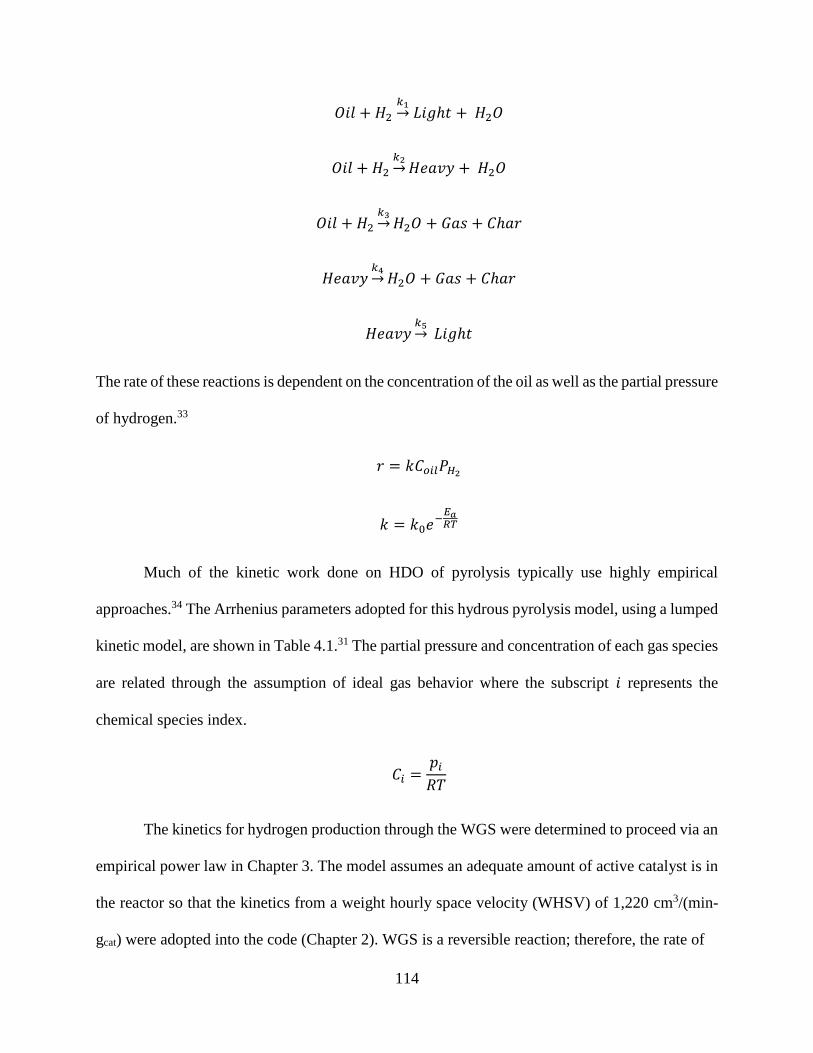
114
𝑂𝑖𝑙 + 𝐻2𝑘1→ 𝐿𝑖𝑔ℎ𝑡 + 𝐻2𝑂
𝑂𝑖𝑙 + 𝐻2𝑘2→𝐻𝑒𝑎𝑣𝑦 + 𝐻2𝑂
𝑂𝑖𝑙 + 𝐻2𝑘3→𝐻2𝑂 + 𝐺𝑎𝑠 + 𝐶ℎ𝑎𝑟
𝐻𝑒𝑎𝑣𝑦𝑘4→𝐻2𝑂 + 𝐺𝑎𝑠 + 𝐶ℎ𝑎𝑟
𝐻𝑒𝑎𝑣𝑦𝑘5→ 𝐿𝑖𝑔ℎ𝑡
The rate of these reactions is dependent on the concentration of the oil as well as the partial pressure
of hydrogen.33
𝑟 = 𝑘𝐶𝑜𝑖𝑙𝑃𝐻2
𝑘 = 𝑘0𝑒−𝐸𝑎𝑅𝑇
Much of the kinetic work done on HDO of pyrolysis typically use highly empirical
approaches.34 The Arrhenius parameters adopted for this hydrous pyrolysis model, using a lumped
kinetic model, are shown in Table 4.1.31 The partial pressure and concentration of each gas species
are related through the assumption of ideal gas behavior where the subscript 𝑖 represents the
chemical species index.
𝐶𝑖 =𝑝𝑖𝑅𝑇
The kinetics for hydrogen production through the WGS were determined to proceed via an
empirical power law in Chapter 3. The model assumes an adequate amount of active catalyst is in
the reactor so that the kinetics from a weight hourly space velocity (WHSV) of 1,220 cm3/(min-
gcat) were adopted into the code (Chapter 2). WGS is a reversible reaction; therefore, the rate of

115
Table 4.1. Kinetic rate constant parameters for the lumped HDO scheme.31
Parameters k1 k2 k3 k4 k5
𝑘0 35.8 367 16.0 0.07 4180
𝐸𝑎 (kJ/mol) 64.8 75.4 66.3 27.9 97.1

116
hydrogen production is dependent on the partial pressure of each species involved in the reaction
(CO, H2O, H2, and CO2). The 𝛽 term represents the approach to equilibrium.35
𝑟 = 1.424𝑒−20.208𝑅𝑇 𝑃𝐶𝑂
1.029𝑃𝐻2𝑂0.634𝑃𝐶𝑂2
−0.498𝑃𝐻2−0.669(1 − 𝛽)
𝛽 = 𝑃𝐶𝑂2𝑃𝐻2𝑃𝐶𝑂𝑃𝐻2𝑂
4.2.3. Simulation analysis
4.2.3.1. Hydrodynamics
In the original fast pyrolysis simulations (Chapter 3), the fluidization velocity and reactor
temperature had a large effect on the elutriation and solid residence time distribution. CFHP
simulations replace the fluidizing gas species as well as increase the reaction pressure from
atmospheric to moderate hydrogen pressure (30 bar). The effects of these variable on the solid
particle residence time (RTD) as well as velocity and temperature profiles were investigated.
4.2.3.2. Product distribution
The final bio-oil can be classified into three subgroups: deoxygenated light fraction oil,
deoxygenated heavy fraction oil, and oxygenated pyrolysis oil (unreacted oil). Due to the use of a
lumped kinetic model for HDO reactions, a detailed analysis of the bio-oil composition cannot be
achieved directly. Analysis will also be done to visualize where in the reactors, HDO begins to
occur.
The maximum bio-oil yield from the fast pyrolysis simulations with and without secondary
cracking reactions was 47% and 55%, respectively. This chapter aims to determine the effects of
hydrous pyrolysis conditions on the overall yield of bio-oil. The bio-oil will be comprised of
deoxygenated oil (light and heavy fractions) as well as the bio-oil that did not undergo HDO.
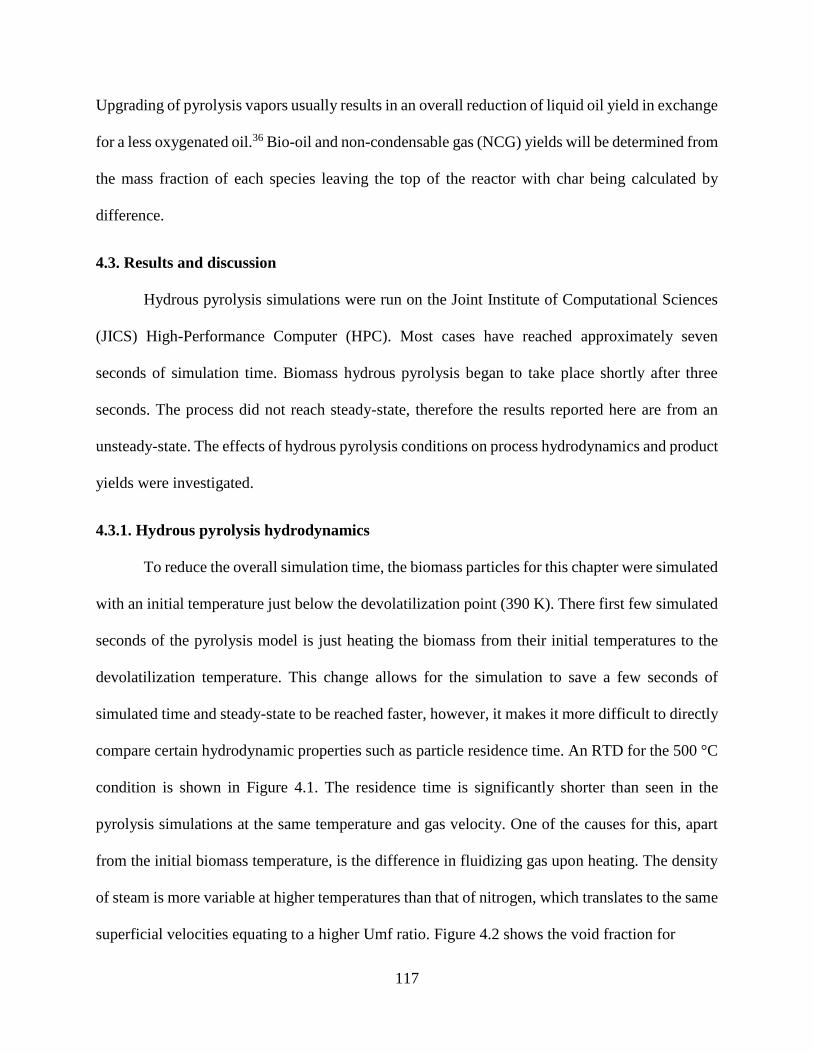
117
Upgrading of pyrolysis vapors usually results in an overall reduction of liquid oil yield in exchange
for a less oxygenated oil.36 Bio-oil and non-condensable gas (NCG) yields will be determined from
the mass fraction of each species leaving the top of the reactor with char being calculated by
difference.
4.3. Results and discussion
Hydrous pyrolysis simulations were run on the Joint Institute of Computational Sciences
(JICS) High-Performance Computer (HPC). Most cases have reached approximately seven
seconds of simulation time. Biomass hydrous pyrolysis began to take place shortly after three
seconds. The process did not reach steady-state, therefore the results reported here are from an
unsteady-state. The effects of hydrous pyrolysis conditions on process hydrodynamics and product
yields were investigated.
4.3.1. Hydrous pyrolysis hydrodynamics
To reduce the overall simulation time, the biomass particles for this chapter were simulated
with an initial temperature just below the devolatilization point (390 K). There first few simulated
seconds of the pyrolysis model is just heating the biomass from their initial temperatures to the
devolatilization temperature. This change allows for the simulation to save a few seconds of
simulated time and steady-state to be reached faster, however, it makes it more difficult to directly
compare certain hydrodynamic properties such as particle residence time. An RTD for the 500 °C
condition is shown in Figure 4.1. The residence time is significantly shorter than seen in the
pyrolysis simulations at the same temperature and gas velocity. One of the causes for this, apart
from the initial biomass temperature, is the difference in fluidizing gas upon heating. The density
of steam is more variable at higher temperatures than that of nitrogen, which translates to the same
superficial velocities equating to a higher Umf ratio. Figure 4.2 shows the void fraction for
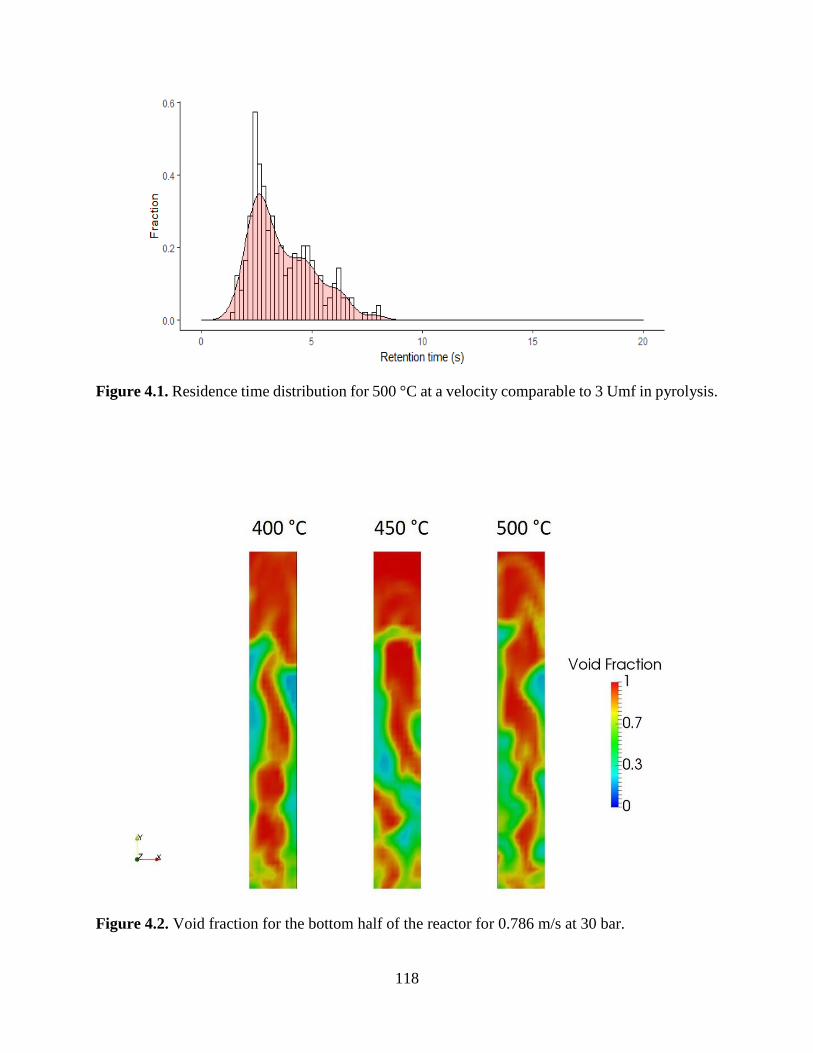
118
Figure 4.1. Residence time distribution for 500 °C at a velocity comparable to 3 Umf in pyrolysis.
Figure 4.2. Void fraction for the bottom half of the reactor for 0.786 m/s at 30 bar.
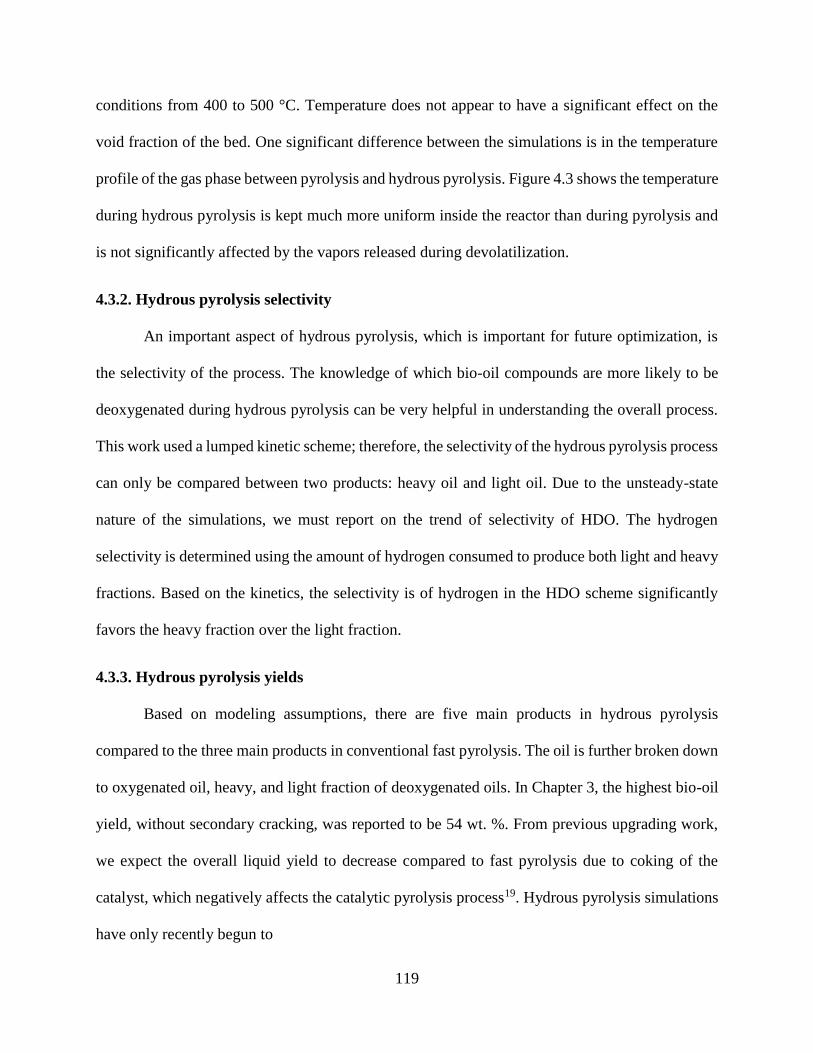
119
conditions from 400 to 500 °C. Temperature does not appear to have a significant effect on the
void fraction of the bed. One significant difference between the simulations is in the temperature
profile of the gas phase between pyrolysis and hydrous pyrolysis. Figure 4.3 shows the temperature
during hydrous pyrolysis is kept much more uniform inside the reactor than during pyrolysis and
is not significantly affected by the vapors released during devolatilization.
4.3.2. Hydrous pyrolysis selectivity
An important aspect of hydrous pyrolysis, which is important for future optimization, is
the selectivity of the process. The knowledge of which bio-oil compounds are more likely to be
deoxygenated during hydrous pyrolysis can be very helpful in understanding the overall process.
This work used a lumped kinetic scheme; therefore, the selectivity of the hydrous pyrolysis process
can only be compared between two products: heavy oil and light oil. Due to the unsteady-state
nature of the simulations, we must report on the trend of selectivity of HDO. The hydrogen
selectivity is determined using the amount of hydrogen consumed to produce both light and heavy
fractions. Based on the kinetics, the selectivity is of hydrogen in the HDO scheme significantly
favors the heavy fraction over the light fraction.
4.3.3. Hydrous pyrolysis yields
Based on modeling assumptions, there are five main products in hydrous pyrolysis
compared to the three main products in conventional fast pyrolysis. The oil is further broken down
to oxygenated oil, heavy, and light fraction of deoxygenated oils. In Chapter 3, the highest bio-oil
yield, without secondary cracking, was reported to be 54 wt. %. From previous upgrading work,
we expect the overall liquid yield to decrease compared to fast pyrolysis due to coking of the
catalyst, which negatively affects the catalytic pyrolysis process19. Hydrous pyrolysis simulations
have only recently begun to
120
Figure 4.3. Comparison of temperature profile for the pyrolysis and hydrous pyrolysis case at 500
°C and 3 Umf.
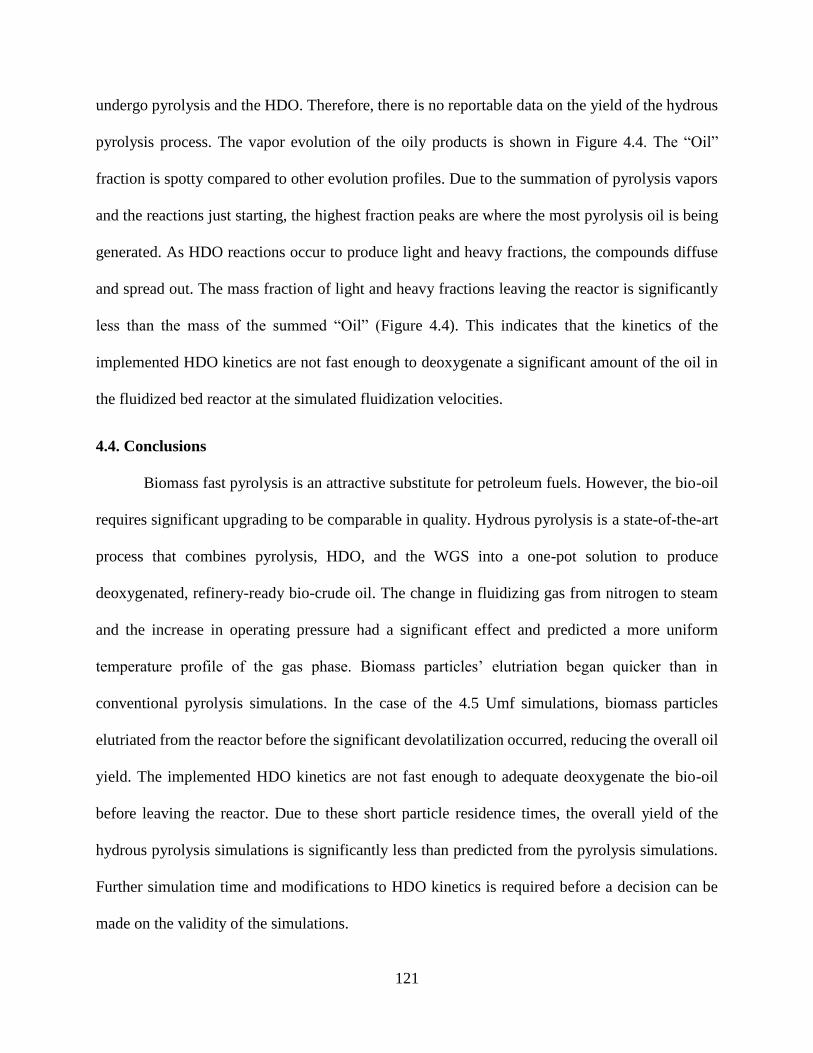
121
undergo pyrolysis and the HDO. Therefore, there is no reportable data on the yield of the hydrous
pyrolysis process. The vapor evolution of the oily products is shown in Figure 4.4. The “Oil”
fraction is spotty compared to other evolution profiles. Due to the summation of pyrolysis vapors
and the reactions just starting, the highest fraction peaks are where the most pyrolysis oil is being
generated. As HDO reactions occur to produce light and heavy fractions, the compounds diffuse
and spread out. The mass fraction of light and heavy fractions leaving the reactor is significantly
less than the mass of the summed “Oil” (Figure 4.4). This indicates that the kinetics of the
implemented HDO kinetics are not fast enough to deoxygenate a significant amount of the oil in
the fluidized bed reactor at the simulated fluidization velocities.
4.4. Conclusions
Biomass fast pyrolysis is an attractive substitute for petroleum fuels. However, the bio-oil
requires significant upgrading to be comparable in quality. Hydrous pyrolysis is a state-of-the-art
process that combines pyrolysis, HDO, and the WGS into a one-pot solution to produce
deoxygenated, refinery-ready bio-crude oil. The change in fluidizing gas from nitrogen to steam
and the increase in operating pressure had a significant effect and predicted a more uniform
temperature profile of the gas phase. Biomass particles’ elutriation began quicker than in
conventional pyrolysis simulations. In the case of the 4.5 Umf simulations, biomass particles
elutriated from the reactor before the significant devolatilization occurred, reducing the overall oil
yield. The implemented HDO kinetics are not fast enough to adequate deoxygenate the bio-oil
before leaving the reactor. Due to these short particle residence times, the overall yield of the
hydrous pyrolysis simulations is significantly less than predicted from the pyrolysis simulations.
Further simulation time and modifications to HDO kinetics is required before a decision can be
made on the validity of the simulations.
122
Figure 4.4. Mass fraction (per surface area) of summed oil, heavy fraction, and light fraction
products for 450 °C and 3Umf at three seconds.

123
List of references
124
(1) Tan, E. C.; Marker, T. L.; Roberts, M. J. Direct production of gasoline and diesel fuels
from biomass via integrated hydropyrolysis and hydroconversion process—A techno‐
economic analysis. Environmental Progress & Sustainable Energy 2014, 33 (2), 609.
(2) Oasmaa, A.; Czernik, S. Fuel Oil Quality of Biomass Pyrolysis OilsState of the Art for the
End Users. Energy & Fuels 1999, 13 (4), 914.
(3) Dayton, D. C.; Carpenter, J.; Farmer, J.; Turk, B.; Gupta, R. Biomass Hydropyrolysis in a
Pressurized Fluidized Bed Reactor. Energy & Fuels 2013, 27 (7), 3778.
(4) Agblevor, F. A.; Beis, S.; Mante, O.; Abdoulmoumine, N. Fractional catalytic pyrolysis of
hybrid poplar wood. Industrial & Engineering Chemistry Research 2010, 49 (8), 3533.
(5) Bridgwater, A. V. Renewable fuels and chemicals by thermal processing of biomass.
Chemical Engineering Journal 2003, 91 (2), 87.
(6) Diebold, J. P. “A review of the chemical and physical mechanisms of the storage stability
of fast pyrolysis bio-oils,” National Renewable Energy Lab., Golden, CO (US), 1999.
(7) Marker, T. L.; Felix, L. G.; Linck, M. B.; Roberts, M. J. Integrated hydropyrolysis and
hydroconversion (IH2) for the direct production of gasoline and diesel fuels or blending
components from biomass, part 1: Proof of principle testing. Environmental Progress &
Sustainable Energy 2012, 31 (2), 191.
(8) French, R.; Czernik, S. Catalytic pyrolysis of biomass for biofuels production. Fuel
Processing Technology 2010, 91 (1), 25.
(9) Mullen, C. A.; Boateng, A. A. Catalytic pyrolysis-GC/MS of lignin from several sources.
Fuel Processing Technology 2010, 91 (11), 1446.
(10) Agblevor, F. A.; Mante, O.; Abdoulmoumine, N.; McClung, R. Production of stable
biomass pyrolysis oils using fractional catalytic pyrolysis. Energy & Fuels 2010, 24 (7),
4087.
(11) Thangalazhy-Gopakumar, S.; Adhikari, S.; Gupta, R. B.; Tu, M.; Taylor, S. Production of
hydrocarbon fuels from biomass using catalytic pyrolysis under helium and hydrogen
environments. Bioresource Technology 2011, 102 (12), 6742.
(12) Elliott, D. C. Historical Developments in Hydroprocessing Bio-oils. Energy & Fuels 2007,
21 (3), 1792.
(13) Huber, G. W.; Iborra, S.; Corma, A. Synthesis of transportation fuels from biomass:
chemistry, catalysts, and engineering. Chemical reviews 2006, 106 (9), 4044.
(14) Thangalazhy-Gopakumar, S.; Adhikari, S.; Gupta, R. B. Catalytic pyrolysis of biomass
over H+ ZSM-5 under hydrogen pressure. Energy & Fuels 2012, 26 (8), 5300.
(15) Bridgwater, A. Production of high grade fuels and chemicals from catalytic pyrolysis of
biomass. Catalysis Today 1996, 29 (1-4), 285.
(16) Snape, C.; Bolton, C.; Dosch, R.; Stephens, H. P. High liquid yields from bituminous coal
via hydropyrolysis with dispersed catalysts. Energy & Fuels 1989, 3 (3), 421.
(17) Canel, M.; Mısırlıogˇlu, Z.; Sınagˇ, A. Hydropyrolysis of a Turkish lignite (Tunçbilek) and
effect of temperature and pressure on product distribution. Energy Conversion and
Management 2005, 46 (13), 2185.
(18) Steinberg, M. The flash hydropyrolysis and methanolysis of coal with hydrogen and
methane. International Journal of Hydrogen Energy 1987, 12 (4), 251.
(19) Marker, T. L.; Felix, L. G.; Linck, M. B.; Roberts, M. J.; Ortiz-Toral, P.; Wangerow, J.
Integrated hydropyrolysis and hydroconversion (IH2®) for the direct production of
gasoline and diesel fuels or blending components from biomass, part 2: Continuous testing.
Environmental Progress & Sustainable Energy 2014, 33 (3), 762.
125
(20) Wang, K.; Dayton, D. C.; Peters, J. E.; Mante, O. D. Reactive catalytic fast pyrolysis of
biomass to produce high-quality bio-crude. Green Chemistry 2017.
(21) Melligan, F.; Hayes, M. H. B.; Kwapinski, W.; Leahy, J. J. A study of hydrogen pressure
during hydropyrolysis of Miscanthus x giganteus and online catalytic vapour upgrading
with Ni on ZSM-5. Journal of Analytical and Applied Pyrolysis 2013, 103 (Supplement
C), 369.
(22) Resende, F. L. P. Recent advances on fast hydropyrolysis of biomass. Catalysis Today
2016, 269 (Supplement C), 148.
(23) Balagurumurthy, B.; Bhaskar, T. Hydropyrolysis of lignocellulosic biomass: state of the
art review. Biomass Conversion and Biorefinery 2014, 4 (1), 67.
(24) Balagurumurthy, B.; Oza, T. S.; Bhaskar, T.; Adhikari, D. K. Renewable hydrocarbons
through biomass hydropyrolysis process: challenges and opportunities. Journal of Material
Cycles and Waste Management 2013, 15 (1), 9.
(25) Stummann, M. Z.; Høj, M.; Schandel, C. B.; Hansen, A. B.; Wiwel, P.; Gabrielsen, J.;
Jensen, P. A.; Jensen, A. D. Hydrogen assisted catalytic biomass pyrolysis. Effect of
temperature and pressure. Biomass and Bioenergy 2018, 115, 97.
(26) He, S.; Boom, J.; van der Gaast, R.; Seshan, K. Hydro-pyrolysis of lignocellulosic biomass
over alumina supported Platinum, Mo2C and WC catalysts. Frontiers of Chemical Science
and Engineering 2018, 12 (1), 155.
(27) Gamliel, D. P.; Bollas, G. M.; Valla, J. A. Two-stage catalytic fast hydropyrolysis of
biomass for the production of drop-in biofuel. Fuel 2018, 216, 160.
(28) Corbetta, M. P., S.; Ranzi, E.; Bennadji, H.; Fisher, E. M. XXXVI Meeting of the Italian
Section of the Combustion Institute, 2013.
(29) Resende, F. L. P. Recent advances on fast hydropyrolysis of biomass. Catalysis Today
2016, 269, 148.
(30) Venkatakrishnan, V. K.; Degenstein, J. C.; Smeltz, A. D.; Delgass, W. N.; Agrawal, R.;
Ribeiro, F. H. High-pressure fast-pyrolysis, fast-hydropyrolysis and catalytic
hydrodeoxygenation of cellulose: production of liquid fuel from biomass. Green Chemistry
2014, 16 (2), 792.
(31) Zhang, S.; Yan, Y.; Li, T.; Ren, Z. Lumping Kinetic Model for Hydrotreating of Bio-oil
from the Fast Pyrolysis of Biomass. Energy Sources, Part A: Recovery, Utilization, and
Environmental Effects 2009, 31 (8), 639.
(32) Bridgwater, A. V. Production of high grade fuels and chemicals from catalytic pyrolysis of
biomass. Catalysis Today 1996, 29 (1), 285.
(33) Bykova, M. V.; Zavarukhin, S. G.; Trusov, L. I.; Yakovlev, V. A. Guaiacol
hydrodeoxygenation kinetics with catalyst deactivation taken into consideration. Kinetics
and Catalysis 2013, 54 (1), 40.
(34) Chaudhari, R. V.; Torres, A.; Jin, X.; Subramaniam, B. Multiphase Catalytic
Hydrogenolysis/Hydrodeoxygenation Processes for Chemicals from Renewable
Feedstocks: Kinetics, Mechanism, and Reaction Engineering. Industrial & Engineering
Chemistry Research 2013, 52 (44), 15226.
(35) Ayastuy, J. L.; Gutiérrez-Ortiz, M. A.; González-Marcos, J. A.; Aranzabal, A.; González-
Velasco, J. R. Kinetics of the Low-Temperature WGS Reaction over a CuO/ZnO/Al2O3
Catalyst. Industrial & Engineering Chemistry Research 2005, 44 (1), 41.
(36) Marker, T. L.; Felix, L. G.; Linck, M. B.; Roberts, M. J. Integrated hydropyrolysis and
hydroconversion (IH2®) for the direct production of gasoline and diesel fuels or blending

126
components from biomass, part 1: Proof of principle testing. Environmental Progress &
Sustainable Energy 2012, 31 (2), 191.
127
CONCLUSION AND FUTURE WORK
This research developed a computational fluid dynamics model to simulate biomass
hydrous pyrolysis in a bubbling fluidized bed reactor. Hydrous pyrolysis combines biomass fast
pyrolysis with hydrodeoxygenation for upgrading and the water-gas shift for hydrogren
generation. Hydrous pyrolysis has the potential to be a single reactor solution to producing a drop-
in bio-crude replacement to petroleum fuels. The overall goal was broken down and achieved
through three objectives. The first consisted of deriving experimental water-gas shift kinetics over
a commercial catalyst at operating conditions close to hydrous pyrolysis. A Langmuir-
Hinshelwood model and an empirical power law model provided the best first to the experimental
data. In the power law, as the catalyst weight was increased, the overall conversion increased and
the activation energy required decreased. The power law was adopted for the subsequent
objectives.
The second objective consisted of developing a computational fluid dynamics model for
conventional biomass fast pyrolysis in a bubbling fluidized bed reactor. The model adopted an
Eulerian-Lagrangian approach for individual particle tracking as well as a comprehensive kinetic
scheme for pyrolysis. Simulations were carried out from 450 to 550 °C and at three fluidization
velocities (1.91, 3, and 4.5 Umf). The fluidization velocity had a significant effect on biomass
particle residence time and particle elutriation. The largest bio-oil yield, with and without
secondary cracking, was 47 and 54 wt. %, respectively. The water content in the bio-oil was
significantly lower than the 20-25 wt. % seen from experimental pyrolysis regardless if the
secondary cracking reactions were incorporated into the simulation or not. Further work needs to
be done on the kinetics of the secondary cracking reactions to account to produce more water.
128
The third and final objective consisted of combining the work from the previous two
objectives to create a model for biomass hydrous pyrolysis. The change of fluidizing gas from
nitrogen to steam as well as the increased reactor pressure in the hydrous pyrolysis simulations
influenced the temperature profile as well as particle dynamics. These changes caused the particles
to elutriate much faster than in the fast pyrolysis simulations while using the same superficial gas
velocity. The quicker elutriation reduced the overall yield of bio-oil due to the lack of
devolatilization. The selectivity of hydrogen significantly favored the production of the heavy
fraction over the light fraction (90 %) in the HDO scheme. The pyrolysis vapors did not undergo
significant amounts of deoxygenation before leaving the reactor; therefore, the HDO kinetics are
assumed to be too slow to significantly deoxygenate the pyrolysis vapors. Without the simulations
being completed, we cannot determine if the hydrous pyrolysis model is adequate to simulate the
one-step pyrolysis and deoxygenation of bio-oil.
Overall, this is a good first step towards modeling and understanding the hydrous pyrolysis
process. However, there is still significant work needed in this area to accurately model biomass
hydrous pyrolysis. The kinetics of the HDO scheme have been altered to increase the speed of
deoxygenation reactions to determine the effect of the new kinetics. Moving forward, experimental
work will be performed to develop individual HDO kinetics for the model compounds of the
comprehensive pyrolysis scheme and remove the model’s dependence on a global, lumped HDO
model. Additionally, the simulations assume all biomass particles have a uniform particle size.
Simulations will be carried out using different particle sizes, with differing physical properties, as
well as hopefully incorporating a particle size distribution.
129
VITA
Ross Houston was born in Sweetwater, TN on August 17, 1993. He graduated with a
Bachelor of Science in Chemical Engineering from The University of Alabama in December of
2015 with Summa Cum Laude honors. He is currently finishing his Master of Science degree at
The University of Tennessee, Knoxville in the Biosystems Engineering Program and plans to
graduate in August 2018.