Embed Size (px)
Citation preview
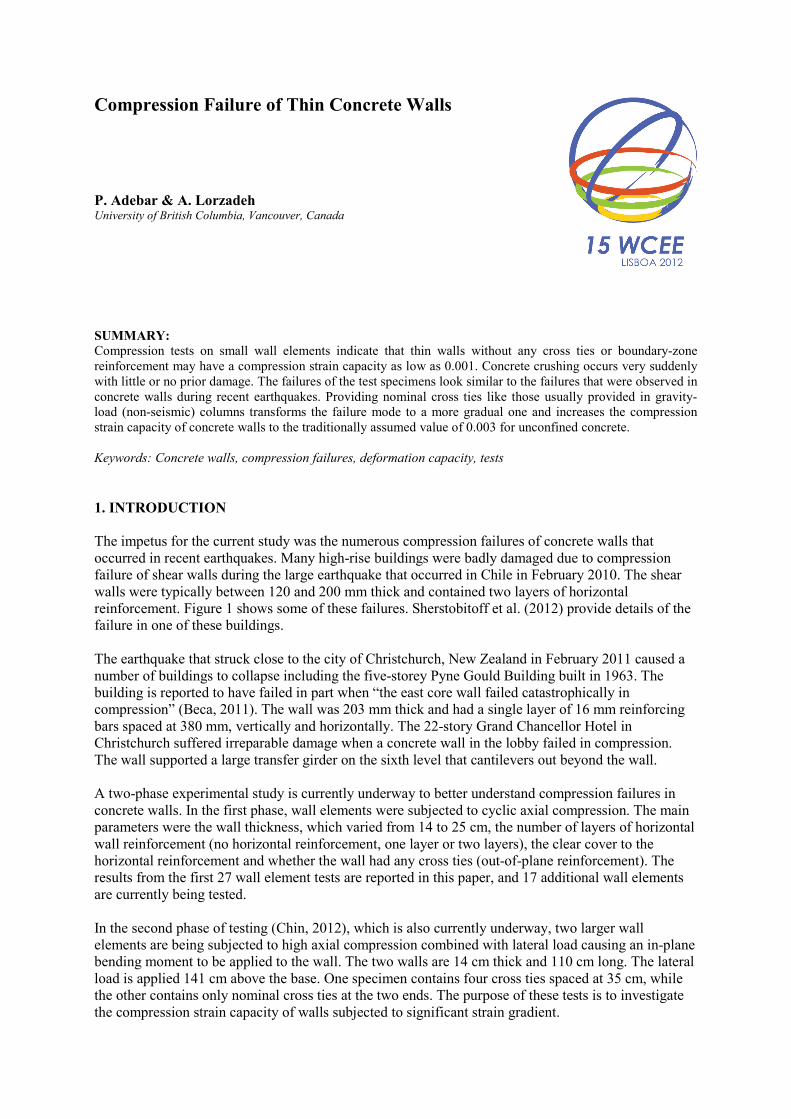
Compression Failure of Thin Concrete Walls
Blank line 11 pt P. Adebar & A. Lorzadeh University of British Columbia, Vancouver, Canada Blank Line 9 pt A.B. Author& C.D. Other (11pt) University) Blank Line 9 pt A.B. Author
(11pt) University of Pavia, Italy (9 pt) Blank line 11 lank line 11 SUMMARY: Compression tests on small wall elements indicate that thin walls without any cross ties or boundary-zone reinforcement may have a compression strain capacity as low as 0.001. Concrete crushing occurs very suddenly with little or no prior damage. The failures of the test specimens look similar to the failures that were observed in concrete walls during recent earthquakes. Providing nominal cross ties like those usually provided in gravity-load (non-seismic) columns transforms the failure mode to a more gradual one and increases the compression strain capacity of concrete walls to the traditionally assumed value of 0.003 for unconfined concrete. Blank line 10 pt Keywords: Concrete walls, compression failures, deformation capacity, tests Blank line 11 pt Blank line 11 pt 1. INTRODUCTION Blank line 11 pt The impetus for the current study was the numerous compression failures of concrete walls that occurred in recent earthquakes. Many high-rise buildings were badly damaged due to compression failure of shear walls during the large earthquake that occurred in Chile in February 2010. The shear walls were typically between 120 and 200 mm thick and contained two layers of horizontal reinforcement. Figure 1 shows some of these failures. Sherstobitoff et al. (2012) provide details of the failure in one of these buildings. The earthquake that struck close to the city of Christchurch, New Zealand in February 2011 caused a number of buildings to collapse including the five-storey Pyne Gould Building built in 1963. The building is reported to have failed in part when “the east core wall failed catastrophically in compression” (Beca, 2011). The wall was 203 mm thick and had a single layer of 16 mm reinforcing bars spaced at 380 mm, vertically and horizontally. The 22-story Grand Chancellor Hotel in Christchurch suffered irreparable damage when a concrete wall in the lobby failed in compression. The wall supported a large transfer girder on the sixth level that cantilevers out beyond the wall. A two-phase experimental study is currently underway to better understand compression failures in concrete walls. In the first phase, wall elements were subjected to cyclic axial compression. The main parameters were the wall thickness, which varied from 14 to 25 cm, the number of layers of horizontal wall reinforcement (no horizontal reinforcement, one layer or two layers), the clear cover to the horizontal reinforcement and whether the wall had any cross ties (out-of-plane reinforcement). The results from the first 27 wall element tests are reported in this paper, and 17 additional wall elements are currently being tested. In the second phase of testing (Chin, 2012), which is also currently underway, two larger wall elements are being subjected to high axial compression combined with lateral load causing an in-plane bending moment to be applied to the wall. The two walls are 14 cm thick and 110 cm long. The lateral load is applied 141 cm above the base. One specimen contains four cross ties spaced at 35 cm, while the other contains only nominal cross ties at the two ends. The purpose of these tests is to investigate the compression strain capacity of walls subjected to significant strain gradient.
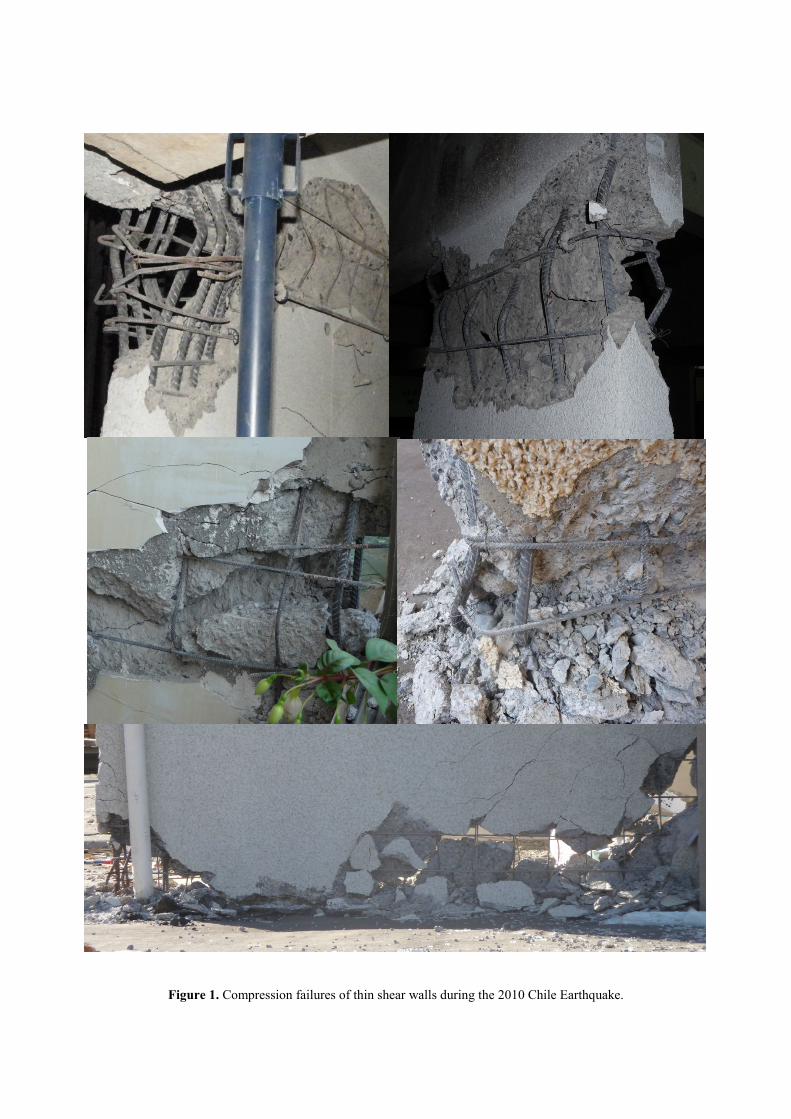
Figure 1. Compression failures of thin shear walls during the 2010 Chile Earthquake.
2. EXPERIMENTAL STUDY The approach used in the current study to investigate the compression failure of thin concrete walls subjected to uniform compression strain was to test small wall elements that are full-scale (thickness of wall elements equal to thickness of actual wall); but the elements are a small piece of an actual wall. Small elements were used because the objective was to subject the walls to uniform compression strain similar to what would occur in a long wall subjected to a small strain gradient. It would not be possible to test full-length walls in a laboratory, particularly considering the large number of different reinforcement arrangements and wall thicknesses that were included in the study. The small full-scale elements provide valuable information about the fundamental behaviour of an element of such a wall – not the response of a complete wall. The wall elements were either 61 or 91 cm high. The thickness of the walls elements varied from 14 to 25 cm, while the length of the elements (longer horizontal dimension) varied from 20 to 30 cm. A schematic diagram of the four different types of specimen cross sections are shown in Fig. 2(a), while the details of each specimen are summarized in Table 2.1. All vertical reinforcing bars in all specimens had a nominal diameter of 10 mm (nominal cross sectional area of 100 mm2). The horizontal reinforcing bars had a diameter of 9.5, 10, 15 or 20 mm as given in Table 2.1.
Figure 2. Test specimens: (a) cross sections showing the arrangement of horizontal reinforcement in the four types of specimens, (b) elevation of specimen during testing.
Type 1 specimens had a single layer of horizontal reinforcement and usually a single vertical reinforcing bar. Specimens 10 and 11 had a single layer of horizontal reinforcement at the middle of the wall with 180 hooks on the two ends and two vertical bars within each hook. All other specimens had the single layer of horizontal reinforcement with no hooks at the ends as shown in Fig. 2(a). The single layer of horizontal reinforcement had the clear cover reported in Table 2.1. Type 2 specimens had two layers of horizontal reinforcement and two or four vertical reinforcing bars.
(a) (b)

The clear cover to the horizontal reinforcing bars is given in Table 2.1. Type 3 specimens also had two layers of horizontal reinforcing bars; but these bars were hooked around the ends of the walls. Specimens 1 to 4 and 22 had seismic hooks (with embedment into the core) at the ends of the horizontal reinforcing bars as shown in Fig. 2, while Specimens 5 and 6 had 90 deg hooks in the cover. Specimen 21 is a unique Type 3 element that had U-shaped horizontal reinforcement that went around three sides of the specimen to simulate an element from the end of a wall. Finally, two specimens did not contain any horizontal reinforcement and these are called Type 4. All specimens were cast in wooden forms in the same position as they were tested – vertical bars in the vertical position. Two batches of ready-mix concrete were used to cast the specimens. Specimens 1 to 11 were cast and tested in 2010, while the remaining specimens were cast in 2011. The 28-day cylinder compression strength of the concrete determined from moist-cured cylinders was found to be 30.3 MPa and 30.5 MPa for the two batches of concrete cast one year apart. The 28-day compression strength determined from field-cured specimens was 25 MPa. The wall elements were tested between 30 days and 6 months after casting. At 6 months after casting, the concrete compression strength had only increased to 32 MPa based on moist-cured cylinders and 26 MPa based on field-cured cylinders. Table 2.1 Summary of Experimental Program
Typ. Thick. (cm)
Horiz. Bars Cover (cm)
No. Vt. Bars
Ht. (cm)
fc-max (MPa)
fc-max /fc'
Strain Cap.
Strain at Fail.
Dia. (cm)
V. Sp. (cm)
1 3 14.0 9.5 14 2.0 4 61 31.7 1.05 0.0035 0.0043 2 3 14.0 9.5 14 2.0 4 61 33.4 1.10 0.0035 0.0043 3 3 14.0 9.5 14 2.0 4 61 31.3 1.03 0.0035 0.0044 4 3 14.0 9.5 14 2.0 4 61 30.0 0.99 0.0035 0.0046 5 3 14.0 9.5 14 2.0 4 61 32.2 1.06 0.0035 0.0039 6 3 14.0 9.5 14 2.0 4 61 30.8 1.02 0.0035 0.0039 7 2 14.0 10 14 2.0 4 61 26.4 0.87 0.0015 0.0017 8 2 14.0 10 14 2.0 4 61 26.9 0.89 0.0010 0.0013 9 4 14.0 -- -- 3.0 4 61 33.4 1.10 0.0033 0.0033 10 1 14.0 10 14 6.0 4 61 30.8 1.02 0.0035 0.0037 11 1 14.0 10 14 6.0 4 61 32.3 1.07 0.0020 0.0023 12 1 15.2 15 15 2.0 1 61 33.6 1.10 0.0028 0.0029 13 1 15.2 15 15 6.0 1 61 33.8 1.11 0.0030 0.0031 14 1 20.3 20 15 2.0 1 61 33.5 1.10 0.0035 0.0039 15 1 20.3 20 15 5.0 1 61 33.7 1.11 0.0033 0.0034 16 1 20.3 20 15 8.0 1 61 33.9 1.11 0.0028 0.0030 17 2 20.3 15 15 2.0 2 61 33.2 1.09 0.0035 0.0039 18 2 20.3 15 30 2.0 2 91 30.0 0.98 0.0015 0.0016 19 2 20.3 15 15 4.0 2 61 31.8 1.04 0.0025 0.0026 20 2 20.3 15 30 4.0 2 91 33.1 1.09 0.0023 0.0026 21 3 20.3 10 20 2.0 2 91 30.1 0.99 0.0035 0.0038 22 3 20.3 10 20 2.0 4 91 31.6 1.04 0.0030 0.0031 23 2 25.4 15 15 2.0 2 61 32.9 1.08 0.0030 0.0032 24 2 25.4 15 30 2.0 2 91 31.6 1.04 0.0018 0.0020 25 2 25.4 15 15 4.0 2 61 32.4 1.06 0.0035 0.0038 26 2 25.4 15 30 4.0 2 91 33.1 1.08 0.0020 0.0023 27 4 20.3 --- --- 4.0 4 91 26.8 0.88 0.0015 0.0017
The specimens were loaded under pseudo strain control, i.e., the load was increased until the target average strain was reached. The standard protocol involved five cycles to each strain level. The first target strain level was 0.0005 and the subsequent strain targets were 0.00025 higher than the previous one. Thus a specimen loaded using the standard protocol to a maximum strain of 0.0035 was loaded a total of 65 cycles – five cycles to each of 13 strain levels: 0.0005, 0.00075, 0.001, 0.00125 … 0.0035. Two of the specimens (1 and 4) were subjected to different protocols to study the influence of additional load cycles. The wall elements were subjected to concentric axial compression in a universal testing machine. To prevent failure of the ends of the specimens and ensure uniform stress, the concrete wall elements were grouted within confining steel angles attached to thick loading plates (see Fig. 2b). Four displacement transducers were used to measure the average strain over a gauge length of 46 cm on the 61 cm high specimens and over a length of 76 cm on the 91 cm high specimens. In some tests, no effort was made to ensure the specimen was subjected to uniform strain; however the strain gradient was recorded. During most tests, the location of the specimen was shifted in the test frame to change the point of load application as needed to maintain uniform compression strain. This simple procedure was very effective for maintaining relatively uniform compression strain on all four sides of the specimen during the tests. 3. EXPERIMENTAL RESULTS The last four columns in Table 2.1 summarize the main experimental results. The measured vertical strain at failure was used to estimate the compression force resisted by the vertical reinforcement. The net compression force resisted by the concrete and net cross sectional area of concrete was used to calculate the maximum concrete compression stress (fc-max in Table 2.1). The ratio of this maximum concrete compression stress to the 28-day compression strength based on moist-cured cylinders is shown in the adjacent column. The strain capacity (Strain. Cap.) shown in Table 2.1 is the largest target strain level to which the specimen was load 5 times without crushing. The strain at failure (Strain at Fail.) is the maximum recorded compression strain prior to failure. Figure 3 shows two typical recorded load-deformation relationships. The load is expressed as a ratio of fc'Ag and the deformation is expressed as the average compression strain measured by the four displacement transducers. Specimen 21 shown in Fig. 3(b) is typical of many specimens that had a strain capacity of at least 0.0035. As described above, the specimen is labelled as a Type 3; but actually had U-shaped horizontal reinforcement that went around three sides of the specimen to simulate an element from the end of a wall. The maximum compression force was applied to the specimen at a strain of about 0.002. As the specimen was pushed to higher compression strains, the maximum compression force during each load cycle reduced and increasing damage was observed. Specimen 18, on the other hand, is a good example of a specimen with low compression strain capacity. The specimen was identical to Specimen 21 except the arrangement of horizontal reinforcement. The 20 cm thick wall specimen had two parallel layers of 15 mm horizontal bars that were not inter-connected in any way. This specimen represents an element of a wall away from the end where there are no cross ties. After cycling the load five times to a compression strain demand of 0.0015 with no visible damage, the specimen suddenly “exploded” when loaded to a compression strain of 0.0016 (see Fig. 3a). The photograph of the failed specimen in Fig. 3(c) suggests that the failure was influenced by the placement of the horizontal reinforcement. The failure is very reminiscent of many failures observed in thin concrete shear walls in Chile after the 2010 earthquake.

4. DISCUSSION OF RESULTS 4.1 The Purpose of Minimum Column Ties Lateral ties are provided in columns for a number of reasons including to act as transverse shear reinforcement, to prevent buckling of vertical reinforcement and to confine concrete. Large amounts of ties are needed to effectively confine concrete so that it will have a significant increase in compression strength or compression strain capacity. Preventing buckling of vertical reinforcement under reverse cyclic loading requires the ties supporting the vertical bars to be spaced at no more than about 6 times the diameter of the smallest vertical bar.
Figure 3. Typical experimental results: (a) Load-deformation response of Specimen 18, (b) Load-deformation response of Specimen 21, (c) Photograph of Specimen 18 after failure.
It is generally thought that minimum column ties are provided in gravity-load columns primarily to reduce the possibility of local buckling of vertical reinforcement under monotonic loading. Column ties are provided at spacings not exceeding 16 times the diameter of the smallest vertical bar (but also not more than 48 tie diameters, or the least dimension of the member). The 1956 ACI Code required that column ties be arranged so that every vertical bar has lateral support provided by a corner of a tie. In the 1963 and subsequent editions of the ACI Code, this requirement was relaxed so that only every other vertical bar must be supported by a tie as long as the unsupported vertical bars are located within
Specimen 18
(a)
(b) (c)
15 cm from a tied bar. Column ties are normally not provided in concrete walls presumably because it is believed that the concrete in a wall is able to stabilize the lower amounts of vertical reinforcement provided in walls. According to the ACI Code, the vertical reinforcement in walls need not be enclosed by lateral ties if the area of vertical reinforcement is not greater than 1% of the gross concrete area, or where vertical reinforcement is not required as compression reinforcement. Walls rarely have more than 1% vertical reinforcement. The Canadian Concrete Code (CSA A23.3 2004) limit for when lateral ties are required in walls is 0.5% vertical reinforcement plus a maximum vertical bar size of 20M; but ties are again not required if the vertical reinforcement is not required as compression reinforcement. The requirements for minimum column ties are based in part on the results of column tests conducted by Pfister (1964). The commentary to ACI 318 states that Pfister’s tests “showed no appreciable difference between ultimate strengths of columns with full tie requirements and no ties at all.” In fact, Pfister observed a maximum reduction in concrete capacity of only 11% between columns with full ties and columns with no ties; but he also observed a very significant difference in the failure modes. Pfister (1964) observed that in columns with ties, “the failure mode of the concrete was similar to that observed in 6 x 12 in. concrete cylinders tested in the standard manner so that crushing of the concrete and formation of ‘shear cones’ occurs, which is in accord with findings in earlier column tests. In the columns without ties, however, longitudinal splitting was observed over an abnormal length of each column before failure occurred. The actual failure occurred so suddenly that it was difficult to observe the sequence of events as failure progressed. This is the type of failure which occurs in a test cylinder when its ends are treated so as to greatly reduce the friction between its ends and the platens of the testing machine, thus reducing the lateral restraint at the ends of the cylinders. This treatment can result in a reduction in strength of up to 20 percent as compared with the strength of an identical cylinder tested in the standard manner.” A longitudinal splitting crack similar to that described by Pfister can be seen in the photograph of the failed wall element without ties in Fig. 3(c). 4.2 Maximum Concrete Compression Stress Since the 1934 tests by Richart and Brown, the maximum concrete compressive stress in tied columns has been taken as 0.85 fc'. The 0.85 factor has been attributed to the difference in size and shape between a reinforced concrete column and concrete cylinders, to the difference in concrete casting, vibration, curing and difference in the rate of loading – columns are typically loaded much more slowly than cylinders (Collins, Mitchell, MacGregor, 1993). The maximum concrete compression stress in Pfister’s column tests varied from 72 to 85% of the cylinder compression strength, which was 30 MPa similar to the current study. The cylinders were field cured and tested on the same day as the columns at either 7 or 14 days after casting. In the current wall element tests, the maximum concrete compression stress varied from 87 to 111% of the 28-day compression strength based on moist-cured cylinders (see Table 2.1). The specimens were tested at between 30 days and 6 months of age; but using the field-cured cylinder strengths at time of testing (e.g., 26 MPa at 6 months) would increase the ratios further. There are a number of possible explanations for the large difference between the maximum concrete compression stress in the current study and the previous column tests. The current wall element specimens had a maximum height of 91 cm, while Pfister’s column specimens were 183 cm high. The minimum dimension of the columns was 20, 25 and 30 cm. It is interesting to note that many of these column specimens are actually very similar to full-scale wall elements (except for the large quantity of vertical reinforcement).
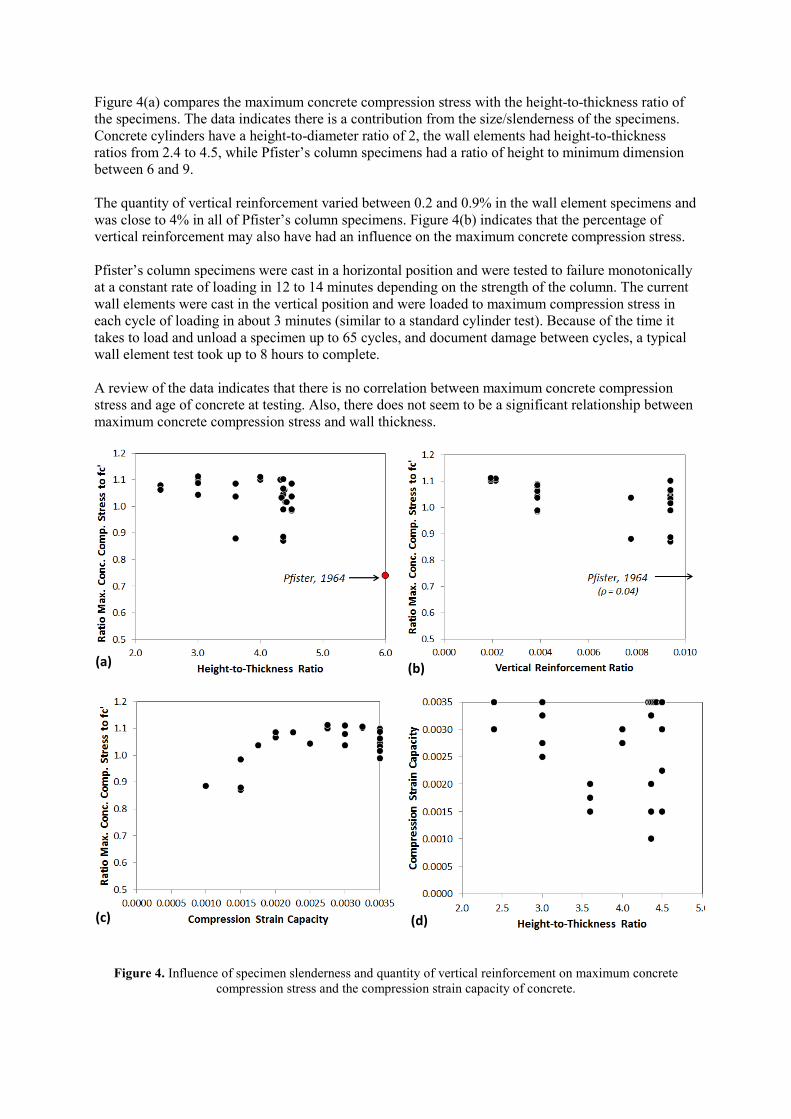
Figure 4(a) compares the maximum concrete compression stress with the height-to-thickness ratio of the specimens. The data indicates there is a contribution from the size/slenderness of the specimens. Concrete cylinders have a height-to-diameter ratio of 2, the wall elements had height-to-thickness ratios from 2.4 to 4.5, while Pfister’s column specimens had a ratio of height to minimum dimension between 6 and 9. The quantity of vertical reinforcement varied between 0.2 and 0.9% in the wall element specimens and was close to 4% in all of Pfister’s column specimens. Figure 4(b) indicates that the percentage of vertical reinforcement may also have had an influence on the maximum concrete compression stress. Pfister’s column specimens were cast in a horizontal position and were tested to failure monotonically at a constant rate of loading in 12 to 14 minutes depending on the strength of the column. The current wall elements were cast in the vertical position and were loaded to maximum compression stress in each cycle of loading in about 3 minutes (similar to a standard cylinder test). Because of the time it takes to load and unload a specimen up to 65 cycles, and document damage between cycles, a typical wall element test took up to 8 hours to complete. A review of the data indicates that there is no correlation between maximum concrete compression stress and age of concrete at testing. Also, there does not seem to be a significant relationship between maximum concrete compression stress and wall thickness.
Figure 4. Influence of specimen slenderness and quantity of vertical reinforcement on maximum concrete compression stress and the compression strain capacity of concrete.
(a) (b)
(d) (c)
4.3 Compression Strain Capacity of Concrete Figures 4(c) indicates that there is a correlation between the maximum concrete compression stress and the compression strain capacity of the concrete. The specimens that failed suddenly at a small compression strain generally resisted a lower level of maximum compression stress. All wall elements that contained column ties joining the two layers of horizontal reinforcement had a compression strain capacity of at least 0.003 and all but one of these had a compression strain capacity of at least 0.0035. These are the numerous data points shown along the axis in Fig. 4(c). Some of the wall elements without column ties also had a compression strain capacity of 0.003. Nine wall elements without column ties – only parallel horizontal reinforcement – had compression strain capacities significantly less than 0.003. Four of these had compression strain capacities significantly less than 0.002 – three had a strain capacity of 0.0015 and one had a strain capacity as low as 0.001. The wall element with the lowest strain capacity was 14 cm thick and had two layers of 10 mm diameter horizontal reinforcement. This is very similar to many of the walls that failed during the recent large earthquake in Chile. There is a strong relationship between the height-to-thickness ratio of the wall elements and the compression strain capacity as shown in Figure 4(d). This is consistent with Pfister’s observations that failure in columns without ties are similar to the failures in test cylinders with the ends treated so as to reduce the friction between the concrete and the platens of the testing machine, thereby reducing the lateral restraint to the ends of the cylinders. The more slender wall elements have less restraint to longitudinal cracking. It is important to note that the most slender wall elements had a height-to-length ratio of only 4.5. Actual walls will typically be much more slender. Many of the shear walls that failed in Chile had height-to-length ratios of 16. Additional tests are needed to examine the axial compression capacity of such slender walls subjected to concentric loading. 5. CONCLUSIONS About 50 years ago, James Pfister conducted tests on concrete columns without any lateral ties. In many ways, these specimens were similar to concrete wall elements tested as part of the current study – the only exception is the large percentage of vertical reinforcement. Based on the results of his tests, Pfister concluded that “buckling of the longitudinal reinforcing bars occurred after failure of concrete” and “the primary function of ties in an axially loaded tied column is to provide lateral restraint for the concrete. The lateral restraint causes the column to fail in a more gradual manner than would be the case if ties were not provided. It also enables the concrete to develop a larger resistance to compression at ultimate strength of the column.” The observations made during the course of the current investigation to better understand recent compression failures of concrete walls in earthquakes are very similar to Pfister’s. Concrete walls usually do not have lateral ties and thus the concrete may fail very suddenly at compression strains around 0.0015. While it is commonly thought that the primary role of minimum column ties is to prevent buckling of vertical reinforcement, this reinforcement, spaced at not more than the minimum member dimension, provides a low-degree of confinement that causes the member to fail in a more gradual manner than is the case when these ties are not provided and enables the concrete to develop a larger compression resistance. Most importantly, such ties would likely prevent the complete crushing of concrete walls and this in turn may influence whether a structure collapses or suffers irreparable damage. Important concrete walls, such as the wall in the lobby of the Grand Chancellor Hotel in Christchurch that supported a large transfer girder five stories above, should be provided with minimum column ties to help prevent exactly the type of failure that occurred in February 2011. The ends of shear walls should also contain minimum column ties to prevent the type of flexural compression failures that
were observed in many high-rise concrete buildings in Chile after the February 2010 earthquake. REFERENCES ACI Committee 318. (1956), “Building Code Requirements for Reinforced Concrete (ACI318-56),” ACI
JOURNAL, Proceedings, V. 52, No. 9, May, pp. 913-986. ACI Committee 318. (1963), “Building Code Requirements for Reinforced Concrete (ACI318-56),” American
Concrete Institute, Detroit, 144 pp. Adebar, P. (2012). Compression Failure of Thin Concrete Shear Walls in 2010 Chile Earthquake, Canadian
Journal of Civil Engineering. Beca Carter Hollings & Ferner Ltd (Beca). 2011. Investigation into the collapse of the Pyne Gould Corporation
Building on 22nd February 2011, Report, 46 pp. Chin, H. (2012). “Deformation Capacity of Gravity-Load Columns and Walls,” MASc thesis, Dept. of Civil
Engineering, University of British Columbia. Collins, M.P., Mitchell, D. and MacGregor, J.G. (1993). “Structural design considerations for high-strength
concrete,” Concrete International, May, pp. 27-34. CSA. (2004), Design of concrete structures. Standard CSA-A23.3–04, Canadian Standards Association,
Mississauga, Ont. Lorzadeh, A. (2012). “Axial Compression Tests on Thin Concrete Wall Elements,” MASc thesis, Dept. of Civil
Engineeirng, University of British Columbia. Pfister, J. F. (1964). “Influence of Ties on the Behavior of Reinforced Concrete Columns,” ACI JOURNAL,
Proceedings, V. 61, No. 5, May, pp. 521-537. Sherstobitoff, J., Cajiao, P. and Adebar, P. (2012). “Analysis and Repair of an Earthquake-Damaged High-rise
Building in Santiago, Chile,” 15th World Conference on Earthquake Engineering, Lisbon.