Embed Size (px)
Citation preview
EI JR
14-078
Municipal Council of Maputo Republic of Mozambique
Comprehensive Urban Transport Master Plan for the Greater Maputo
Final Report
Executive Summary
March 2014
JAPAN INTERNATIONAL COOPERATION AGENCY
PADECO Co., Ltd. Nippon Koei Co., Ltd.

Exchange Rate used in this Report: 1 USD = 30.25 MT 1 USD =100 JPY (September 2013)
Comprehensive Urban Transport Master Plan for the Greater Maputo Executive Summary
i
Contents
Abbreviations ....................................................................................................................................... v PART I Master Plan
E.1 Introduction ...................................................................................................................... 1
E.2 Existing Urban Transport Issues ....................................................................................... 3
E.3 Development Framework ............................................................................................... 14
E.4 Land Use Development Patterns/Transport Scenarios ................................................... 18
E.5 Urban Transport Development Strategies ...................................................................... 23
E.6 Future Traffic Demand and Evaluation of Transport Development Scenarios ............... 26
E.7 Road Network Improvement Plan .................................................................................. 29
E.8 Public Transport Improvement Plan ............................................................................... 30
E.9 Improvement Plan for Traffic Control, Management, and Safety .................................. 31
E.10 Estimated Cost ................................................................................................................ 33
E.11 Economic, Social, and Environmental Evaluation ......................................................... 34
E.12 Institutional Improvement and Capacity Development .................................................. 35
E.13 Summary: Proposed Master Plan Programs and Priority Projects ................................. 35
PART II Pre-Feasibility Study on the Prioritized BRT Project
E.14 Selection of BRT Project for Pre-Feasibility Study ........................................................ 40
E.15 Existing Conditions of the Project Area ......................................................................... 41
E.16 Traffic Demand Forecast ................................................................................................ 42
E.17 Alternative Plans ............................................................................................................ 46
E.18 Preliminary Design ......................................................................................................... 48
E.19 Operation Plan ................................................................................................................ 55
E.20 Preliminary Cost Estimates ............................................................................................ 60
E.21 Construction Implementation Plan ................................................................................. 63
E.22 Implementation, Operation, and Maintenance Scheme .................................................. 65
E.23 Economic and Financial Analyses .................................................................................. 69
E.24 Natural and Social Environmental Analysis ................................................................... 72
E.25 Recommendations .......................................................................................................... 74
Comprehensive Urban Transport Master Plan for the Greater Maputo Executive Summary
ii
Figures Figure 1 Study Area ............................................................................................................ 2 Figure 2 Master Plan Development Process ......................................................................... 3 Figure 3 Summary of Key Road Network Issues ................................................................. 4 Figure 4 Existing Arterial Road Network and Ongoing Road Projects in Greater
Maputo ................................................................................................................. 5 Figure 5 Chapa Routes in Maputo ....................................................................................... 6 Figure 6 Long Queue at Bus Stop ........................................................................................ 7 Figure 7 Dilapidated Chapa Vehicles ................................................................................... 7 Figure 8 TPM Bus Routes in Greater Maputo ...................................................................... 8 Figure 9 Existing Railway Routes in Greater Maputo .......................................................... 9 Figure 10 Central Area Traffic Signals (April 2012) ............................................................ 10 Figure 11 Greater Maputo Cordon Survey and Household Interview Survey ........................ 11 Figure 12 Locations of Cordon and Screenline Surveys ....................................................... 12 Figure 13 “A” and “B” Locations of Screenline Surveys ..................................................... 13 Figure 14 Results of Travel Speed Surveys .......................................................................... 14 Figure 15 Existing Trips by Purpose (2012) ......................................................................... 14 Figure 16 Existing Modal Split (2012) ................................................................................ 14 Figure 17 Population Projection in Urban and Rural Area in Mozambique ........................... 15 Figure 18 Growth in Population, Economy and Traffic Demand, 2012–2035 ....................... 18 Figure 19 Existing Land Use ............................................................................................... 19 Figure 20 Growth Centers ................................................................................................... 20 Figure 21 Urban Development Scenarios for Greater Maputo 2035 ..................................... 21 Figure 22 Compact Corridor Development Pattern (Scenario C) .......................................... 22 Figure 23 Scenario C Greater Maputo Socio-Economic Distribution in 2035 ....................... 22 Figure 24 Scenario C Maputo CBD Socio-Economic Distribution in 2035........................... 23 Figure 25 Alternative Land Use Scenarios ........................................................................... 24 Figure 26 Scenario C Schematic Transport Network for 2035 .............................................. 25 Figure 27 Flow for Development of Master Plan Transport Network ................................... 26 Figure 28 Growth of Traffic Demand in Greater Maputo, 2012–2035 .................................. 27 Figure 29 Desire Lines in 2035 (All Modes, Land Use Pattern A [Existing Trend]) .............. 27 Figure 30 Assignment of 2035 Traffic with No Additional Investment ................................. 28 Figure 31 Assignment of 2035 Traffic on Scenario C Network ............................................ 28 Figure 32 Preferred Transport Network under Scenario C .................................................... 29 Figure 33 Proposed Road Network in 2035 ......................................................................... 30 Figure 34 Mass Transit Network for 2035 ........................................................................... 31 Figure 35 Role of the Traffic Control, Management and Safety Improvement Plan
within the Urban Transport Development Vision and Strategy ............................. 31 Figure 36 Master Plan Project Expenditures ........................................................................ 33 Figure 37 Master Plan Project Detail ................................................................................... 33 Figure 38 Map of Priority Projects ...................................................................................... 39 Figure 39 Proposed BRT Route along N1 ............................................................................ 40 Figure 40 Industrial and Commercial Development in Greater Maputo ................................ 42 Figure 41 Number of Passengers on BRT by Section (Case-1) ............................................. 45
Comprehensive Urban Transport Master Plan for the Greater Maputo Executive Summary
iii
Figure 42 BRT N1 Route..................................................................................................... 46 Figure 43 Congestion Degree With/Without N1 Bypass in 2035 .......................................... 48 Figure 44 N1 Bypass Route Plan ......................................................................................... 48 Figure 45 Proposed Standard Cross-Section of BRT N1 Line .............................................. 49 Figure 46 Station Distance and Access Time of Pedestrians ................................................. 50 Figure 47 Types of BRT Stations ......................................................................................... 50 Figure 48 Alignment Plan of BRT N1 Line.......................................................................... 50 Figure 49 Cross-Section of N1 Line .................................................................................... 51 Figure 50 Standard Intersection Design Including BRT, allocating Bus Station on Both
Sides at the Cross Intersection ............................................................................. 52 Figure 51 Cross-Section for Bridge Widening ..................................................................... 52 Figure 52 Location of Stations and Terminals of N1 Line .................................................... 53 Figure 53 General Layout of Zimpeto Terminal & Depot ..................................................... 54 Figure 54 Plan of BRT 25 Setembro East Line..................................................................... 55 Figure 55 Standard Cross-section of N1 Bypass .................................................................. 55 Figure 56 Articulated 20 m Unit for BRT ............................................................................ 56 Figure 57 Passengers Transported per Hour (Direction: Zimpeto–Center) ............................ 57 Figure 58 Passengers Transported per Day – Phase II (2035); Direction: Zimpeto–
Center ................................................................................................................. 60 Figure 59 Development of BRT N1 Line by Section (Phase II) ............................................ 64 Figure 60 Structure with the GMMTA as the Executing Agency, Project Management
Units, and Implementing Agencies ...................................................................... 66 Figure 61 BRT N1 Investment Schedule .............................................................................. 67 Figure 62 Net Benefit Stream (USD Million Per Annum) .................................................... 70 Figure 63 Estimated Expenditures and Financing Plan......................................................... 71 Figure 64 Funding as Percent of Real GDP ......................................................................... 71 Figure 65 Bus Station with PV Panel ................................................................................... 75
Tables Table 1 Study Task List...................................................................................................... 2 Table 2 Chapa Fare ............................................................................................................ 7 Table 3 Trip Rates ........................................................................................................... 11 Table 4 Results of Cordon and Screenline Traffic Counts ................................................. 13 Table 5 Projected Employment Growth Rate (%) in Project Area (2012–2035) ................ 15 Table 6 GDP/GRDP Growth Projection (2012–2035) ....................................................... 16 Table 7 Percentage Structure of GDP by Industry in Mozambique (2009–2035) (%) ........ 17 Table 8 GDP by Industry in Mozambique (2009–2035, Constant Price in 2003)
(Million MT) ....................................................................................................... 17 Table 9 Population and Average Density by City/District in Greater Maputo .................... 19 Table 10 Summary of Road Development Projects ............................................................. 29 Table 11 Summary of Public Transport Development Projects ........................................... 30 Table 12 Overview of Traffic Control and Management Measures (including Short-,
Medium-, and Long-Term Measures) ................................................................... 32 Table 13 Estimated Capital Cost of Master Plan Projects ................................................... 34
Comprehensive Urban Transport Master Plan for the Greater Maputo Executive Summary
iv
Table 14 Master Plan Programs with Proposed Phasing ..................................................... 36 Table 15 List of Priority Projects ....................................................................................... 37 Table 16 Proposed Development of BRT N1 Line .............................................................. 40 Table 17 Comparison of Present and Future Person Trip OD .............................................. 43 Table 18 Fare Table for Chapas (Unit: MT) ........................................................................ 44 Table 19 Estimated Ridership of N1 BRT .......................................................................... 44 Table 20 Proposed Alternative Routes as Maputo Station Access ....................................... 46 Table 21 Design Standard for BRT and N1 ........................................................................ 49 Table 22 Location Outline of Stations and Terminals of the BRT N1 Line .......................... 53 Table 23 Bus Bays (Zimpeto Terminal) .............................................................................. 54 Table 24 Model Operational Data (2020) ........................................................................... 57 Table 25 Trunk Routes for Phase II .................................................................................... 58 Table 26 Feeder Routes ..................................................................................................... 58 Table 27 Operational Data, Fleet and Mileage .................................................................... 59 Table 28 Estimated Civil Works Cost ................................................................................. 60 Table 29 Total Cost of Station Structure ............................................................................. 61 Table 30 Summary of BRT Facilities Costs ........................................................................ 61 Table 31 BRT vs. Non-BRT Fleet ...................................................................................... 62 Table 32 Summary of BRT Fleet Requirements and Costs .................................................. 62 Table 33 Estimated Total Project Cost ................................................................................ 63 Table 34 Expected Project Implementation Schedule ......................................................... 65 Table 35 Phase II BRT Annual Funding Requirement Detail .............................................. 65 Table 36 BRT N1 Operating Cash Flow ............................................................................. 67 Table 37 Value of Time in 2013 Prices for the Study Area as a Whole ................................ 69 Table 38 Results of Sensitivity Analysis ............................................................................. 70 Table 39 Potential Social / Environmental Impacts and Mitigation Measures for the
Proposed BRT Project ......................................................................................... 72
Comprehensive Urban Transport Master Plan for the Greater Maputo Executive Summary
v
Abbreviations
ANE Administração Nacional de Estradas (National Roads Administration)
ASC Adaptive Signal Control
BCR Benefit Cost Ratio
BRT Bus Rapid Transit
B-Zone This zoning level is adequate to examine the arterial traffic network. B-zones were set using the “bairro”, the smallest unit used for the population census data. Some areas of the suburbs were zoned in a way that consolidated a few bairros. The number of B-Zones within the study area was 40.
CBD Central Business District
CCO Control Centre for Operation
CFM Caminhos de Ferro de Moçambique (Mozambique Ports and Railways Company)
CO2 Carbon Dioxide
C-Zone Zones identified for HIS and transport modeling purposes. Based on Bairros (urban areas) where census data is available
DCF Discounted Cash Flow
DMTT Direcção Municipal de Transportes e Transito (Directorate of Transport and Traffic)
EIA Environmental Impact Assessment
EIRR Economic Internal Rate of Return
EMTPM Expresso da Empresa Municipal de Transportes Públicos de Maputo (Maputo Road Transport Municipal Company)
FIA Fundo de Iniciativa Autárquica (Municipal Initiative Fund)
FIRR Financial Internal Rate of Return
F/S Feasibility Study
GDP Gross Domestic Product
GIS Geographic Information System
GMMTA Greater Maputo Metropolitan Transport Agency
HDM Highway Design and Management
HIS Household Interview Survey
HOV High-Occupancy Vehicle
IA Implementing Agency
IMF International Monetary Fund
Comprehensive Urban Transport Master Plan for the Greater Maputo Executive Summary
vi
INE Instituto Nacional de Estatística (National Institute of Statistics)
IRP Initial Resettlement Plan
ITS Intelligent Transport System
JICA Japan International Cooperation Agency
LRT Light Rail Transit
M/P Master Plan
MT Metical
MTFF Medium-term Fiscal Framework
NOx Nitrogen Oxides
NPV Net Present Value
OD Origin and Destination
O&M Operation and Maintenance
PAP Project-Affected Person
PEUCM Plano de Estrutura Urbana da Cidade da Matola (Urban Structure Planning of City of Matola)
PEUMM Plano de Estrutura Urbana do Municipio de Maputo (Urban Structure Planning of City of Maputo)
PMU Project Management Unit
PPP Public Private Partnership
PQ Pre-Qualification
RAP Resettlement Action Plan
ROW Right of Way
SEA Strategic Environmental Assessment
SP Stated Preference
STRADA System for Traffic Demand Analysis
TDM Traffic Demand Management
TOD Transit-Oriented Development
TPM Transportes Públicos de Maputo (Maputo Bus Company)
VCR Volume-Capacity Ratio
VOC Vehicle Operating Costs
VOT Value of Time
Comprehensive Urban Transport Master Plan for the Greater Maputo Executive Summary
1
PART I Master Plan E.1 Introduction E.1.1 Introduction The capital of Mozambique, Maputo, has a population of approximately 1.2 million people (2009) and is the political and industrial center of the country. It is also the entrance of the Maputo Corridor which is the busiest trunk road within the Southern African Development Community (SADC). The economy in Mozambique has been robust during the past decade. With the expected inflow of investments and returns from projects, economic growth is expected to be accelerating in the medium term. In recent years, residential and industrial development has spread to Maputo’s neighboring city and district of Matola, Boane and Marracuene creating a Greater Maputo metropolitan area and its population is expected to increase from 2.2 million in 2012 to 3.7 million in 2035. Urban and economic development has brought about more movement of passengers and goods; as a result the traffic conditions in this area by buses and private vehicles are getting worse. The Government of Mozambique had adopted ProMaputo, the development program for Maputo, which serves as an “Urban Plan” for Maputo and Matola. They have also adopted a land use plan and infrastructure development policy. In addition, they also have aspirations for a Bus Rapid Transit (BRT) system for Maputo, and a Light Railway Transit (LRT) system that connects Maputo and Matola. However, there has not been any progress to deliver these plans due to a lack of financial support and a concrete, long-term vision for urban transport, thereby making it difficult to make investment decisions. Under these circumstances, the Government of Mozambique requested the Government of Japan for assistance in formulating a “Project for the Comprehensive Urban Transport Master Plan for the Greater Maputo (the Study)”. This examines the expanding Greater Maputo urban area and includes formulating a comprehensive transport master plan to address the lack of policy and plans for a public transport network and road improvements, and subsequently include the pre-feasibility study for priority projects that are identified in the master plan. The Study commenced in February 2012, followed by the submission of Progress Report in July 2012. This Final Report summarizes the past achievements and the process leading to the Master Plan (M/P) with the target year of 2035, including priority projects, and a pre-feasibility (Pre-F/S) report. E.1.2 Study Objectives The key objective of the Study is to create a comprehensive urban transport master plan for Greater Maputo for 2035, and conduct a pre-feasibility study (Pre-F/S) for the priority projects. In addition, the Study will ensure the effective use of the study outputs and facilitate the implementation of urban transport plans, and will also provide suggestions to strengthen the implementation structure and support capacity development of the agencies involved in urban transport. E.1.3 Study Area The Study area is “Greater Maputo”, which was discussed and agreed at the Steering Committee meeting on 22 February 2012. The area includes the followings:
Maputo City, except for Inhaca Island Matola City the southern area of Marracuene District the Eastern area of Boane City, including Mozal and Boane
Comprehensive Urban Transport Master Plan for the Greater Maputo Executive Summary
2
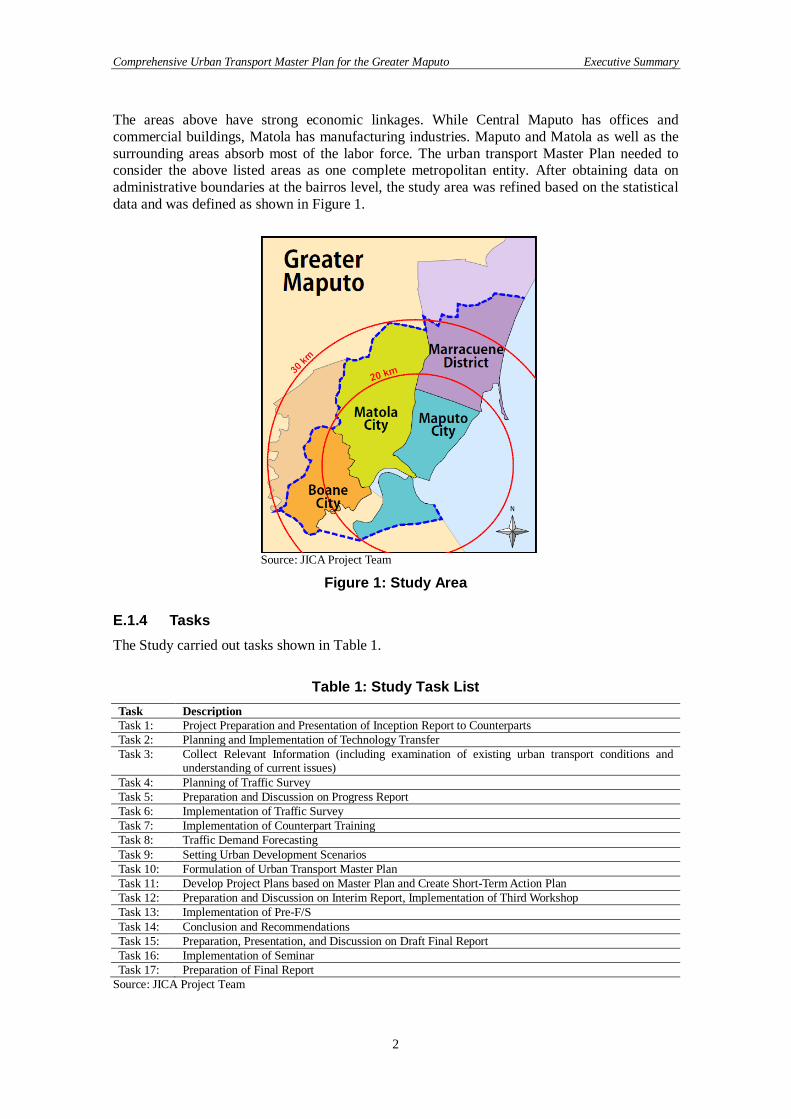
The areas above have strong economic linkages. While Central Maputo has offices and commercial buildings, Matola has manufacturing industries. Maputo and Matola as well as the surrounding areas absorb most of the labor force. The urban transport Master Plan needed to consider the above listed areas as one complete metropolitan entity. After obtaining data on administrative boundaries at the bairros level, the study area was refined based on the statistical data and was defined as shown in Figure 1.
Source: JICA Project Team
Figure 1: Study Area E.1.4 Tasks The Study carried out tasks shown in Table 1.
Table 1: Study Task List Task Description Task 1: Project Preparation and Presentation of Inception Report to Counterparts Task 2: Planning and Implementation of Technology Transfer Task 3: Collect Relevant Information (including examination of existing urban transport conditions and
understanding of current issues) Task 4: Planning of Traffic Survey Task 5: Preparation and Discussion on Progress Report Task 6: Implementation of Traffic Survey Task 7: Implementation of Counterpart Training Task 8: Traffic Demand Forecasting Task 9: Setting Urban Development Scenarios Task 10: Formulation of Urban Transport Master Plan Task 11: Develop Project Plans based on Master Plan and Create Short-Term Action Plan Task 12: Preparation and Discussion on Interim Report, Implementation of Third Workshop Task 13: Implementation of Pre-F/S Task 14: Conclusion and Recommendations Task 15: Preparation, Presentation, and Discussion on Draft Final Report Task 16: Implementation of Seminar Task 17: Preparation of Final Report
Source: JICA Project Team
Comprehensive Urban Transport Master Plan for the Greater Maputo Executive Summary
3
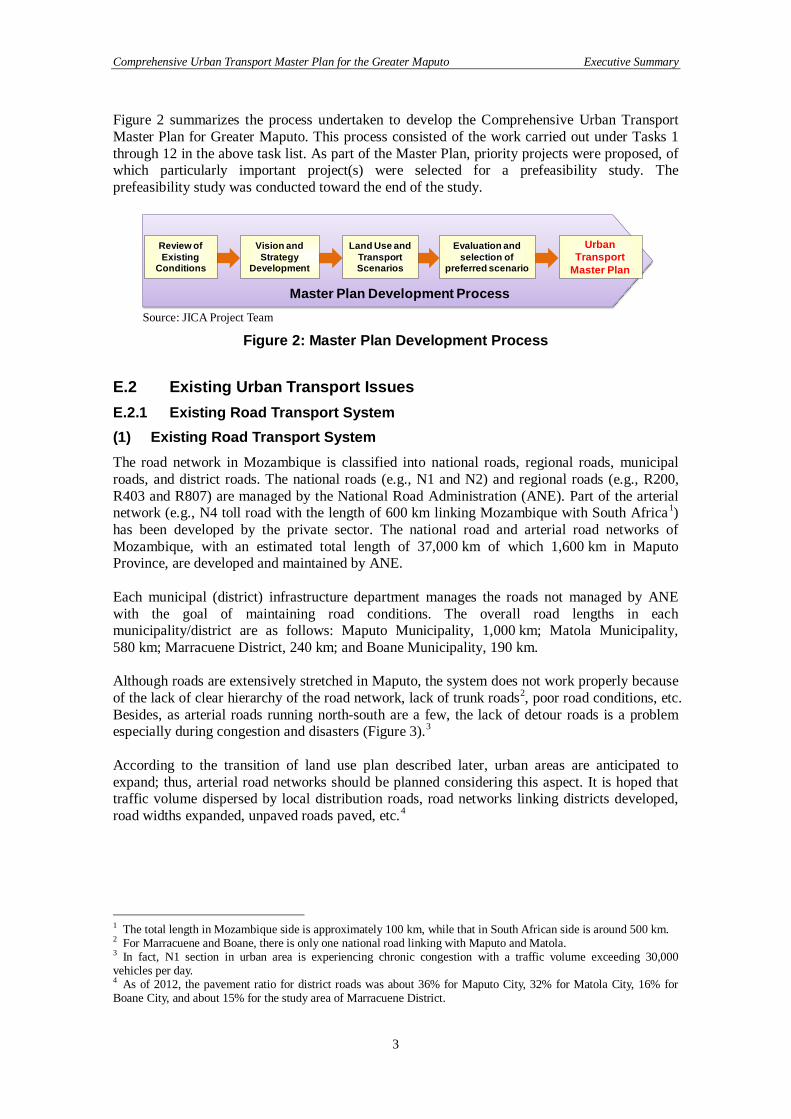
Figure 2 summarizes the process undertaken to develop the Comprehensive Urban Transport Master Plan for Greater Maputo. This process consisted of the work carried out under Tasks 1 through 12 in the above task list. As part of the Master Plan, priority projects were proposed, of which particularly important project(s) were selected for a prefeasibility study. The prefeasibility study was conducted toward the end of the study.
Source: JICA Project Team
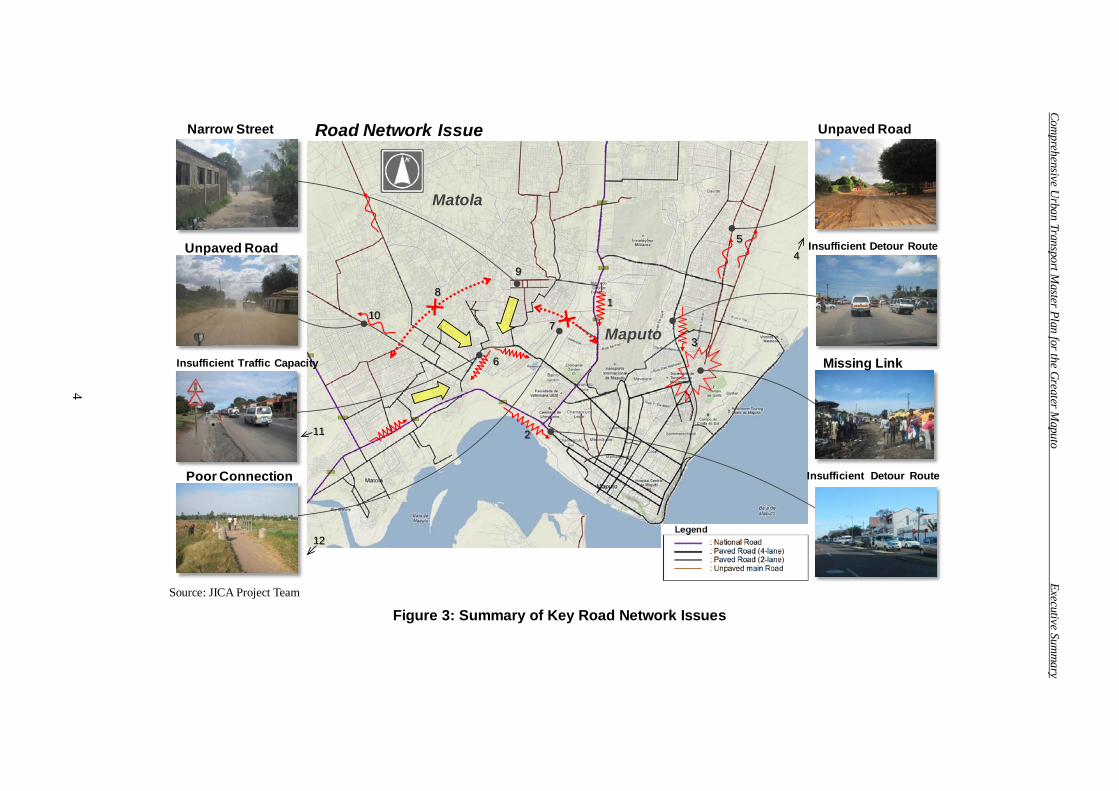
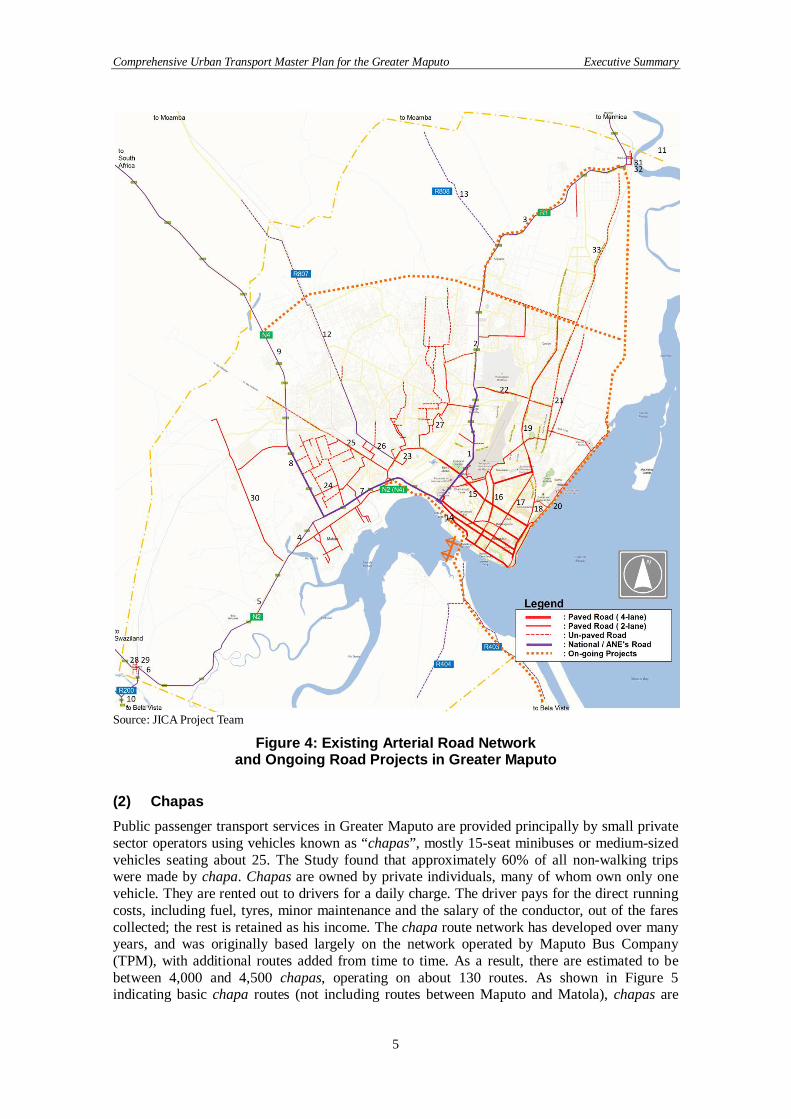
Figure 2: Master Plan Development Process E.2 Existing Urban Transport Issues E.2.1 Existing Road Transport System (1) Existing Road Transport System The road network in Mozambique is classified into national roads, regional roads, municipal roads, and district roads. The national roads (e.g., N1 and N2) and regional roads (e.g., R200, R403 and R807) are managed by the National Road Administration (ANE). Part of the arterial network (e.g., N4 toll road with the length of 600 km linking Mozambique with South Africa1) has been developed by the private sector. The national road and arterial road networks of Mozambique, with an estimated total length of 37,000 km of which 1,600 km in Maputo Province, are developed and maintained by ANE. Each municipal (district) infrastructure department manages the roads not managed by ANE with the goal of maintaining road conditions. The overall road lengths in each municipality/district are as follows: Maputo Municipality, 1,000 km; Matola Municipality, 580 km; Marracuene District, 240 km; and Boane Municipality, 190 km. Although roads are extensively stretched in Maputo, the system does not work properly because of the lack of clear hierarchy of the road network, lack of trunk roads2, poor road conditions, etc. Besides, as arterial roads running north-south are a few, the lack of detour roads is a problem especially during congestion and disasters (Figure 3).3 According to the transition of land use plan described later, urban areas are anticipated to expand; thus, arterial road networks should be planned considering this aspect. It is hoped that traffic volume dispersed by local distribution roads, road networks linking districts developed, road widths expanded, unpaved roads paved, etc.4
1 The total length in Mozambique side is approximately 100 km, while that in South African side is around 500 km. 2 For Marracuene and Boane, there is only one national road linking with Maputo and Matola. 3 In fact, N1 section in urban area is experiencing chronic congestion with a traffic volume exceeding 30,000 vehicles per day. 4 As of 2012, the pavement ratio for district roads was about 36% for Maputo City, 32% for Matola City, 16% for Boane City, and about 15% for the study area of Marracuene District.
Land Use and Transport Scenarios
Evaluation and selection of
preferred scenario
Urban Transport
Master Plan
Vision and Strategy
Development
Review of Existing
Conditions
Master Plan Development Process
Comprehensive U
rban Transport Master Plan for the G
reater Maputo
Executive Summ
ary
4
Source: JICA Project Team
Figure 3: Summary of Key Road Network Issues
Road Network Issue
Maputo
Matola
Missing Link
Poor Connection
Narrow Street
Unpaved Road Insufficient Detour Route
Insufficient Detour Route
Insufficient Traffic Capacity
Unpaved Road
1
2
3
45
6
7
8
9
10
11
12
Comprehensive Urban Transport Master Plan for the Greater Maputo Executive Summary
5
Source: JICA Project Team
Figure 4: Existing Arterial Road Network and Ongoing Road Projects in Greater Maputo
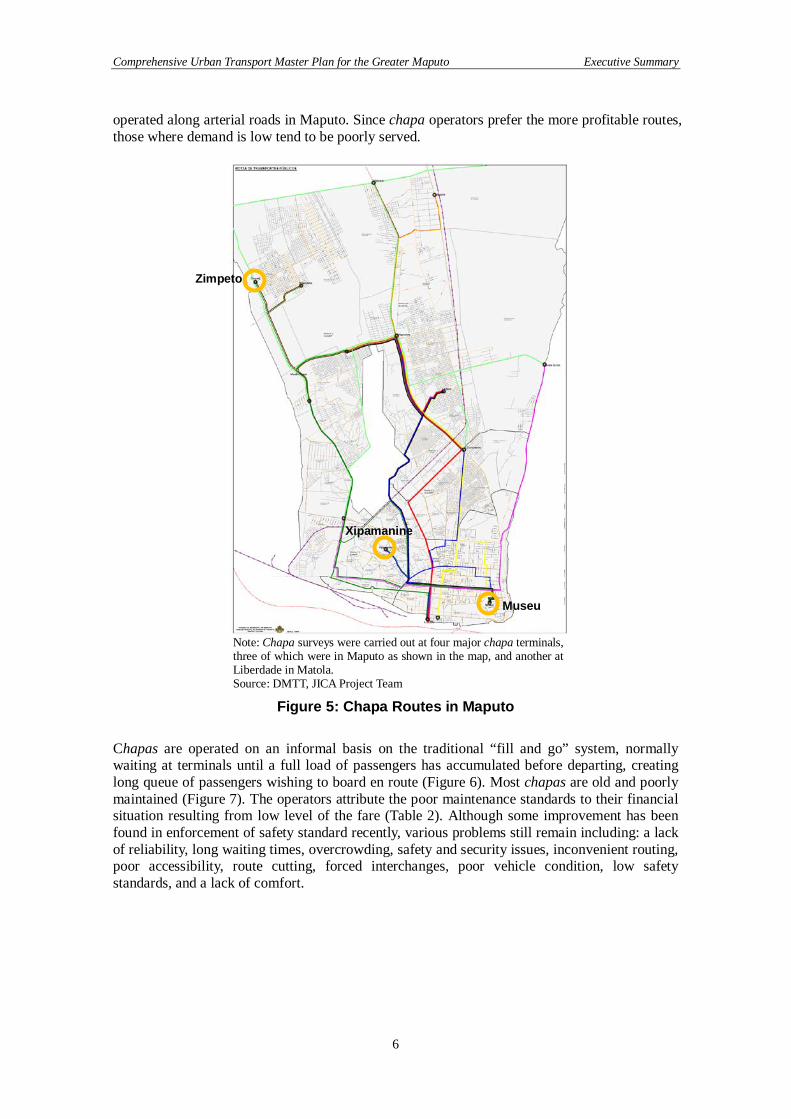
(2) Chapas Public passenger transport services in Greater Maputo are provided principally by small private sector operators using vehicles known as “chapas”, mostly 15-seat minibuses or medium-sized vehicles seating about 25. The Study found that approximately 60% of all non-walking trips were made by chapa. Chapas are owned by private individuals, many of whom own only one vehicle. They are rented out to drivers for a daily charge. The driver pays for the direct running costs, including fuel, tyres, minor maintenance and the salary of the conductor, out of the fares collected; the rest is retained as his income. The chapa route network has developed over many years, and was originally based largely on the network operated by Maputo Bus Company (TPM), with additional routes added from time to time. As a result, there are estimated to be between 4,000 and 4,500 chapas, operating on about 130 routes. As shown in Figure 5 indicating basic chapa routes (not including routes between Maputo and Matola), chapas are
Comprehensive Urban Transport Master Plan for the Greater Maputo Executive Summary
6
operated along arterial roads in Maputo. Since chapa operators prefer the more profitable routes, those where demand is low tend to be poorly served.
Note: Chapa surveys were carried out at four major chapa terminals, three of which were in Maputo as shown in the map, and another at Liberdade in Matola. Source: DMTT, JICA Project Team
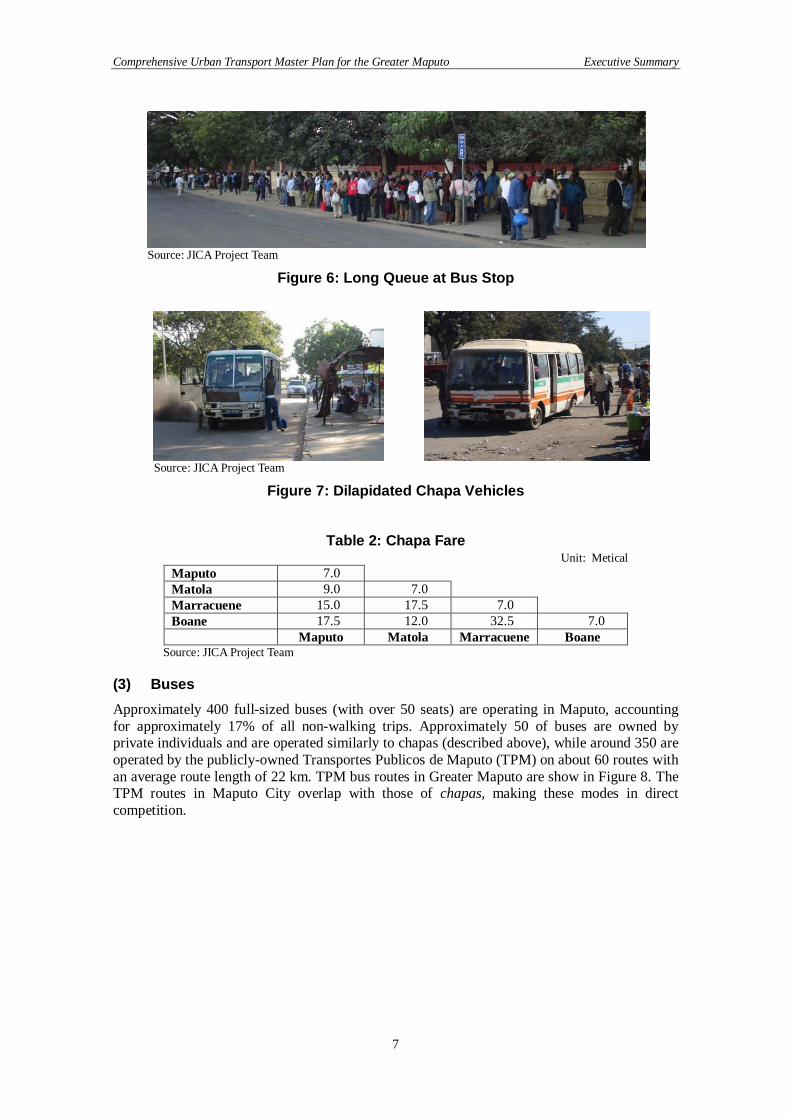
Figure 5: Chapa Routes in Maputo Chapas are operated on an informal basis on the traditional “fill and go” system, normally waiting at terminals until a full load of passengers has accumulated before departing, creating long queue of passengers wishing to board en route (Figure 6). Most chapas are old and poorly maintained (Figure 7). The operators attribute the poor maintenance standards to their financial situation resulting from low level of the fare (Table 2). Although some improvement has been found in enforcement of safety standard recently, various problems still remain including: a lack of reliability, long waiting times, overcrowding, safety and security issues, inconvenient routing, poor accessibility, route cutting, forced interchanges, poor vehicle condition, low safety standards, and a lack of comfort.
Museu
Zimpeto
Xipamanine
Comprehensive Urban Transport Master Plan for the Greater Maputo Executive Summary
7
Source: JICA Project Team
Figure 6: Long Queue at Bus Stop
Source: JICA Project Team
Figure 7: Dilapidated Chapa Vehicles
Table 2: Chapa Fare Unit: Metical
Maputo 7.0 Matola 9.0 7.0 Marracuene 15.0 17.5 7.0 Boane 17.5 12.0 32.5 7.0
Maputo Matola Marracuene Boane Source: JICA Project Team
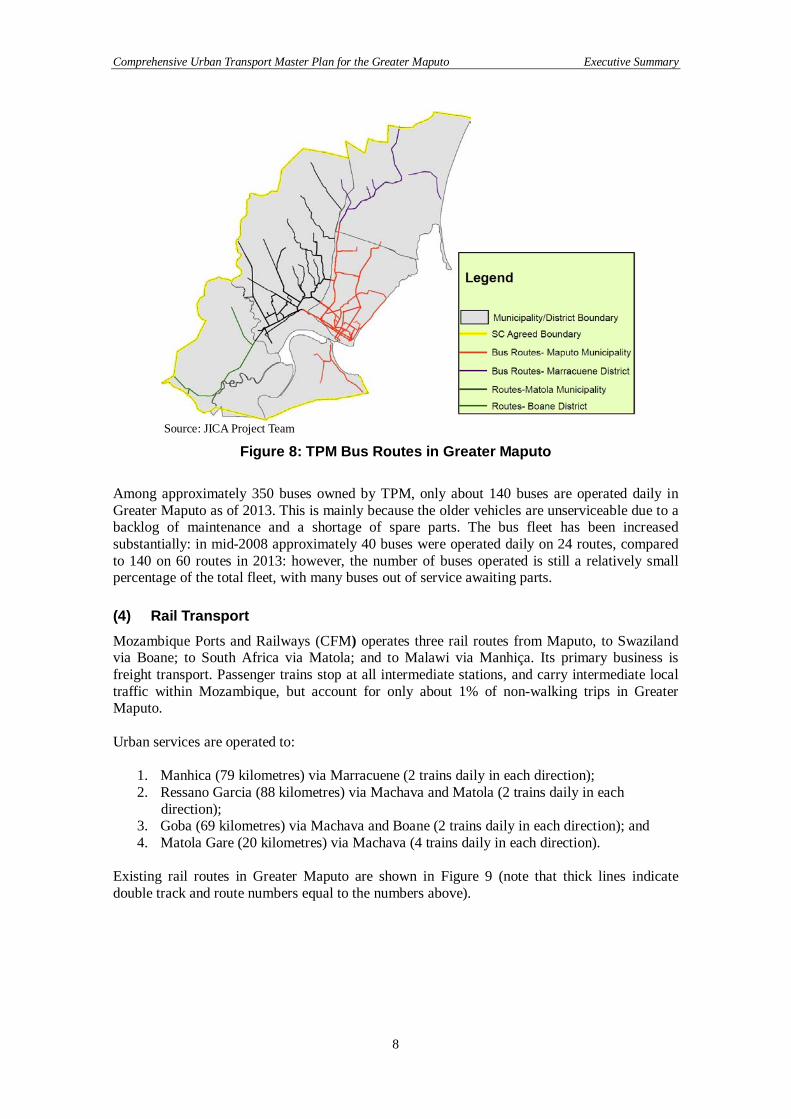
(3) Buses Approximately 400 full-sized buses (with over 50 seats) are operating in Maputo, accounting for approximately 17% of all non-walking trips. Approximately 50 of buses are owned by private individuals and are operated similarly to chapas (described above), while around 350 are operated by the publicly-owned Transportes Publicos de Maputo (TPM) on about 60 routes with an average route length of 22 km. TPM bus routes in Greater Maputo are show in Figure 8. The TPM routes in Maputo City overlap with those of chapas, making these modes in direct competition.
Comprehensive Urban Transport Master Plan for the Greater Maputo Executive Summary
8
Source: JICA Project Team
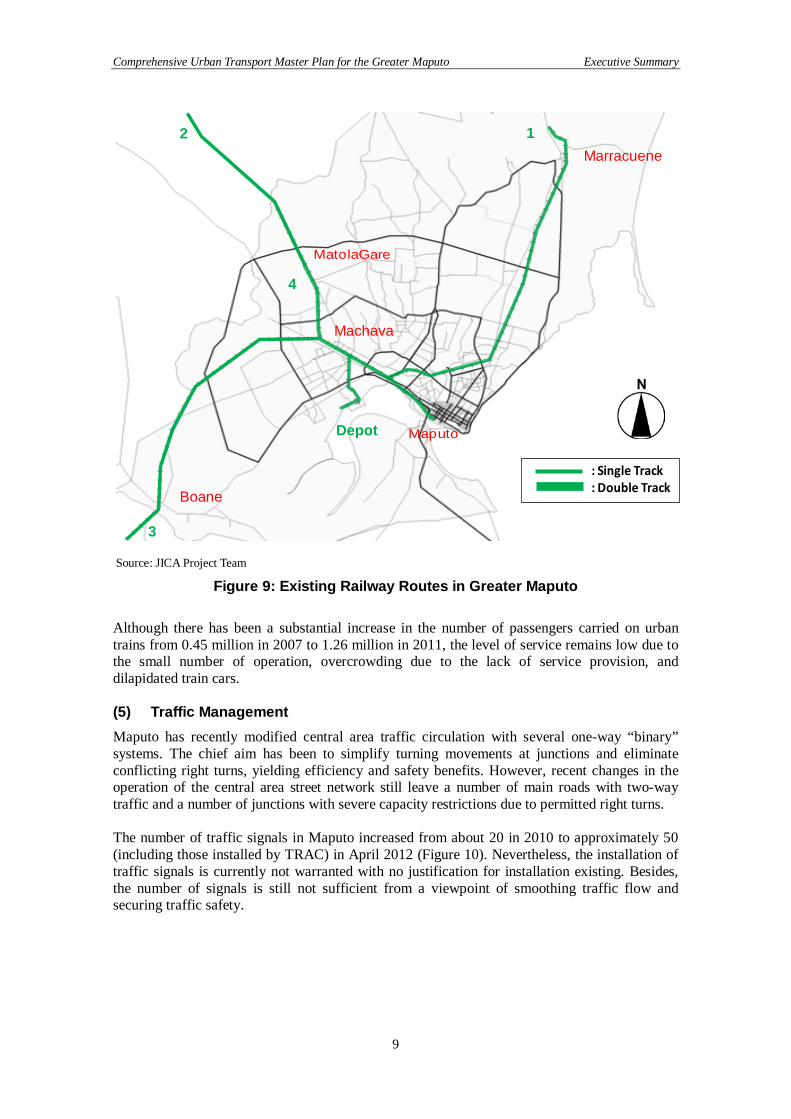
Figure 8: TPM Bus Routes in Greater Maputo Among approximately 350 buses owned by TPM, only about 140 buses are operated daily in Greater Maputo as of 2013. This is mainly because the older vehicles are unserviceable due to a backlog of maintenance and a shortage of spare parts. The bus fleet has been increased substantially: in mid-2008 approximately 40 buses were operated daily on 24 routes, compared to 140 on 60 routes in 2013: however, the number of buses operated is still a relatively small percentage of the total fleet, with many buses out of service awaiting parts. (4) Rail Transport Mozambique Ports and Railways (CFM) operates three rail routes from Maputo, to Swaziland via Boane; to South Africa via Matola; and to Malawi via Manhiça. Its primary business is freight transport. Passenger trains stop at all intermediate stations, and carry intermediate local traffic within Mozambique, but account for only about 1% of non-walking trips in Greater Maputo. Urban services are operated to:
1. Manhica (79 kilometres) via Marracuene (2 trains daily in each direction); 2. Ressano Garcia (88 kilometres) via Machava and Matola (2 trains daily in each
direction); 3. Goba (69 kilometres) via Machava and Boane (2 trains daily in each direction); and 4. Matola Gare (20 kilometres) via Machava (4 trains daily in each direction).
Existing rail routes in Greater Maputo are shown in Figure 9 (note that thick lines indicate double track and route numbers equal to the numbers above).
Comprehensive Urban Transport Master Plan for the Greater Maputo Executive Summary
9
Source: JICA Project Team
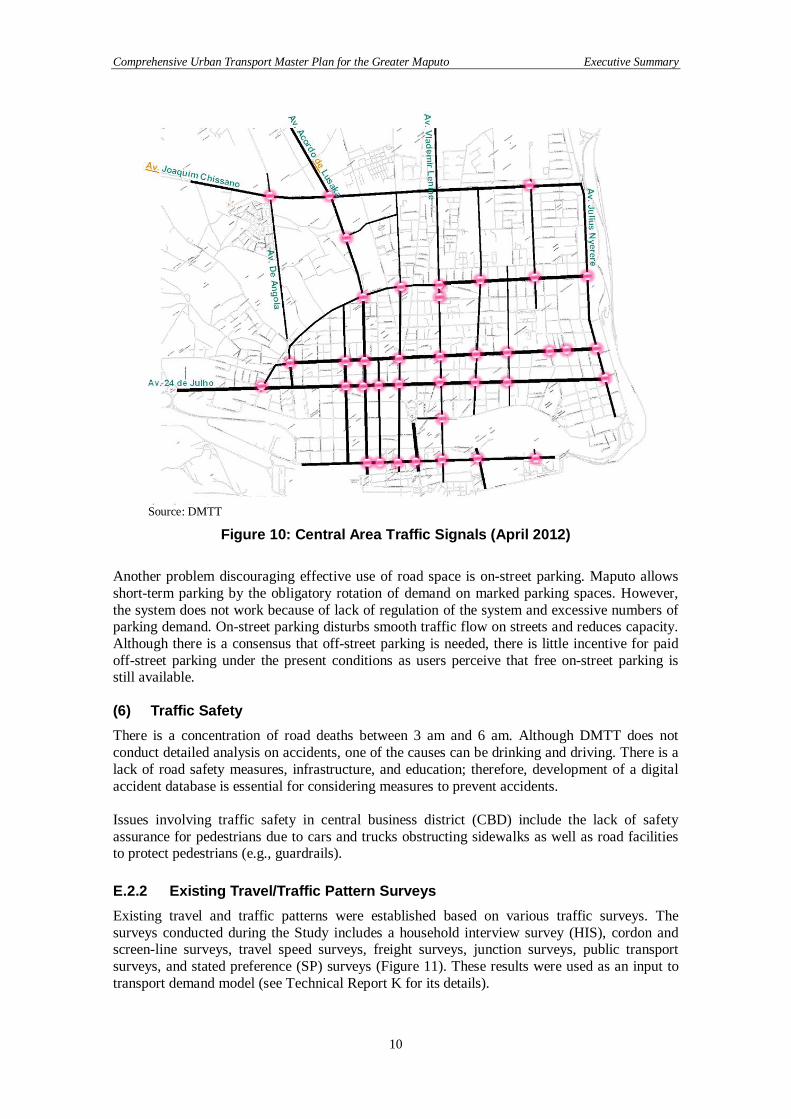
Figure 9: Existing Railway Routes in Greater Maputo Although there has been a substantial increase in the number of passengers carried on urban trains from 0.45 million in 2007 to 1.26 million in 2011, the level of service remains low due to the small number of operation, overcrowding due to the lack of service provision, and dilapidated train cars. (5) Traffic Management Maputo has recently modified central area traffic circulation with several one-way “binary” systems. The chief aim has been to simplify turning movements at junctions and eliminate conflicting right turns, yielding efficiency and safety benefits. However, recent changes in the operation of the central area street network still leave a number of main roads with two-way traffic and a number of junctions with severe capacity restrictions due to permitted right turns. The number of traffic signals in Maputo increased from about 20 in 2010 to approximately 50 (including those installed by TRAC) in April 2012 (Figure 10). Nevertheless, the installation of traffic signals is currently not warranted with no justification for installation existing. Besides, the number of signals is still not sufficient from a viewpoint of smoothing traffic flow and securing traffic safety.
Maputo
MatolaGare
1 2
3
4
: Single Track: Double Track
Depot
Marracuene
Machava
Boane
Comprehensive Urban Transport Master Plan for the Greater Maputo Executive Summary
10
Source: DMTT
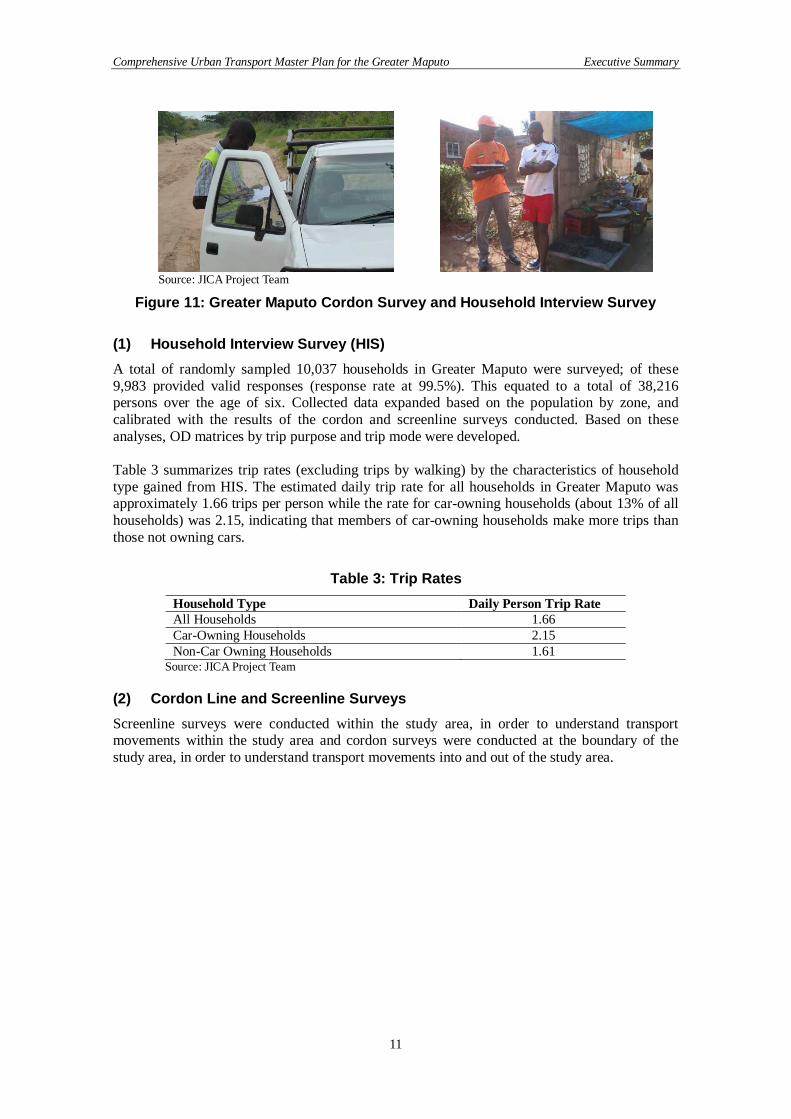
Figure 10: Central Area Traffic Signals (April 2012) Another problem discouraging effective use of road space is on-street parking. Maputo allows short-term parking by the obligatory rotation of demand on marked parking spaces. However, the system does not work because of lack of regulation of the system and excessive numbers of parking demand. On-street parking disturbs smooth traffic flow on streets and reduces capacity. Although there is a consensus that off-street parking is needed, there is little incentive for paid off-street parking under the present conditions as users perceive that free on-street parking is still available. (6) Traffic Safety There is a concentration of road deaths between 3 am and 6 am. Although DMTT does not conduct detailed analysis on accidents, one of the causes can be drinking and driving. There is a lack of road safety measures, infrastructure, and education; therefore, development of a digital accident database is essential for considering measures to prevent accidents. Issues involving traffic safety in central business district (CBD) include the lack of safety assurance for pedestrians due to cars and trucks obstructing sidewalks as well as road facilities to protect pedestrians (e.g., guardrails). E.2.2 Existing Travel/Traffic Pattern Surveys Existing travel and traffic patterns were established based on various traffic surveys. The surveys conducted during the Study includes a household interview survey (HIS), cordon and screen-line surveys, travel speed surveys, freight surveys, junction surveys, public transport surveys, and stated preference (SP) surveys (Figure 11). These results were used as an input to transport demand model (see Technical Report K for its details).
Comprehensive Urban Transport Master Plan for the Greater Maputo Executive Summary
11
Source: JICA Project Team
Figure 11: Greater Maputo Cordon Survey and Household Interview Survey (1) Household Interview Survey (HIS) A total of randomly sampled 10,037 households in Greater Maputo were surveyed; of these 9,983 provided valid responses (response rate at 99.5%). This equated to a total of 38,216 persons over the age of six. Collected data expanded based on the population by zone, and calibrated with the results of the cordon and screenline surveys conducted. Based on these analyses, OD matrices by trip purpose and trip mode were developed. Table 3 summarizes trip rates (excluding trips by walking) by the characteristics of household type gained from HIS. The estimated daily trip rate for all households in Greater Maputo was approximately 1.66 trips per person while the rate for car-owning households (about 13% of all households) was 2.15, indicating that members of car-owning households make more trips than those not owning cars.
Table 3: Trip Rates Household Type Daily Person Trip Rate All Households 1.66 Car-Owning Households 2.15 Non-Car Owning Households 1.61
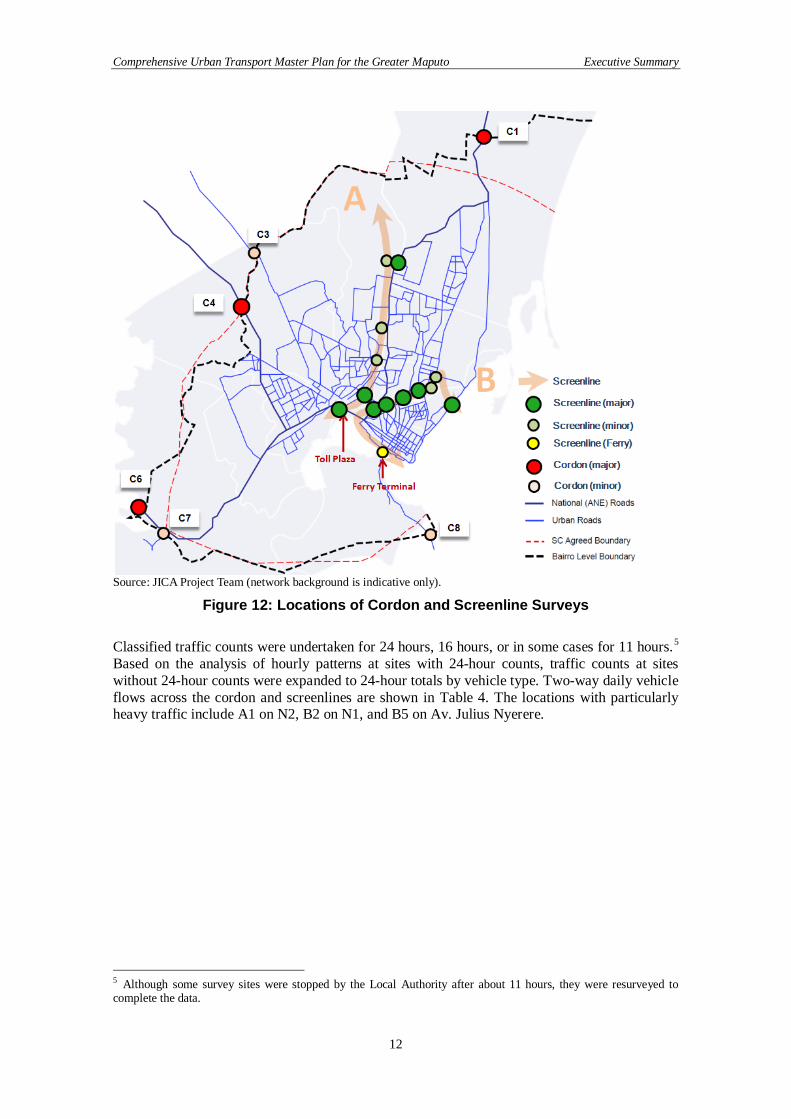
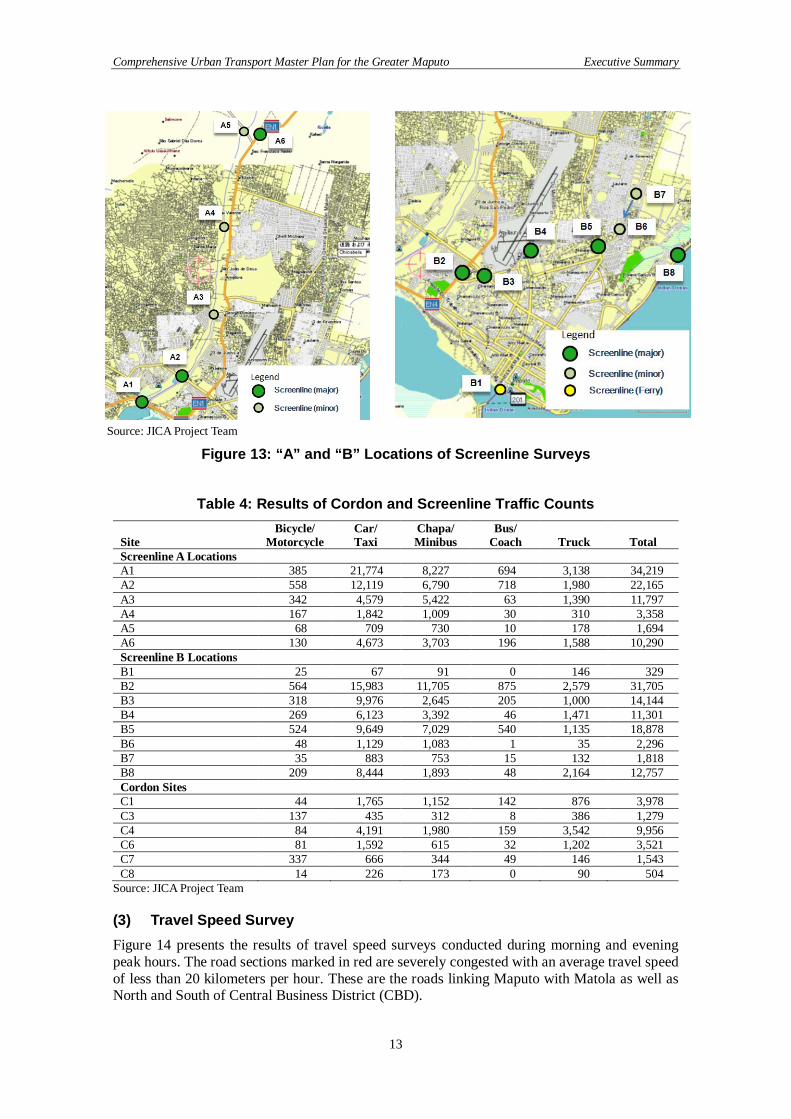
Source: JICA Project Team (2) Cordon Line and Screenline Surveys Screenline surveys were conducted within the study area, in order to understand transport movements within the study area and cordon surveys were conducted at the boundary of the study area, in order to understand transport movements into and out of the study area.
Comprehensive Urban Transport Master Plan for the Greater Maputo Executive Summary
12
Source: JICA Project Team (network background is indicative only).
Figure 12: Locations of Cordon and Screenline Surveys Classified traffic counts were undertaken for 24 hours, 16 hours, or in some cases for 11 hours.5 Based on the analysis of hourly patterns at sites with 24-hour counts, traffic counts at sites without 24-hour counts were expanded to 24-hour totals by vehicle type. Two-way daily vehicle flows across the cordon and screenlines are shown in Table 4. The locations with particularly heavy traffic include A1 on N2, B2 on N1, and B5 on Av. Julius Nyerere.
5 Although some survey sites were stopped by the Local Authority after about 11 hours, they were resurveyed to complete the data.
Comprehensive Urban Transport Master Plan for the Greater Maputo Executive Summary
13
Source: JICA Project Team
Figure 13: “A” and “B” Locations of Screenline Surveys
Table 4: Results of Cordon and Screenline Traffic Counts
Site Bicycle/
Motorcycle Car/ Taxi
Chapa/ Minibus
Bus/ Coach Truck Total
Screenline A Locations A1 385 21,774 8,227 694 3,138 34,219 A2 558 12,119 6,790 718 1,980 22,165 A3 342 4,579 5,422 63 1,390 11,797 A4 167 1,842 1,009 30 310 3,358 A5 68 709 730 10 178 1,694 A6 130 4,673 3,703 196 1,588 10,290 Screenline B Locations B1 25 67 91 0 146 329 B2 564 15,983 11,705 875 2,579 31,705 B3 318 9,976 2,645 205 1,000 14,144 B4 269 6,123 3,392 46 1,471 11,301 B5 524 9,649 7,029 540 1,135 18,878 B6 48 1,129 1,083 1 35 2,296 B7 35 883 753 15 132 1,818 B8 209 8,444 1,893 48 2,164 12,757 Cordon Sites C1 44 1,765 1,152 142 876 3,978 C3 137 435 312 8 386 1,279 C4 84 4,191 1,980 159 3,542 9,956 C6 81 1,592 615 32 1,202 3,521 C7 337 666 344 49 146 1,543 C8 14 226 173 0 90 504
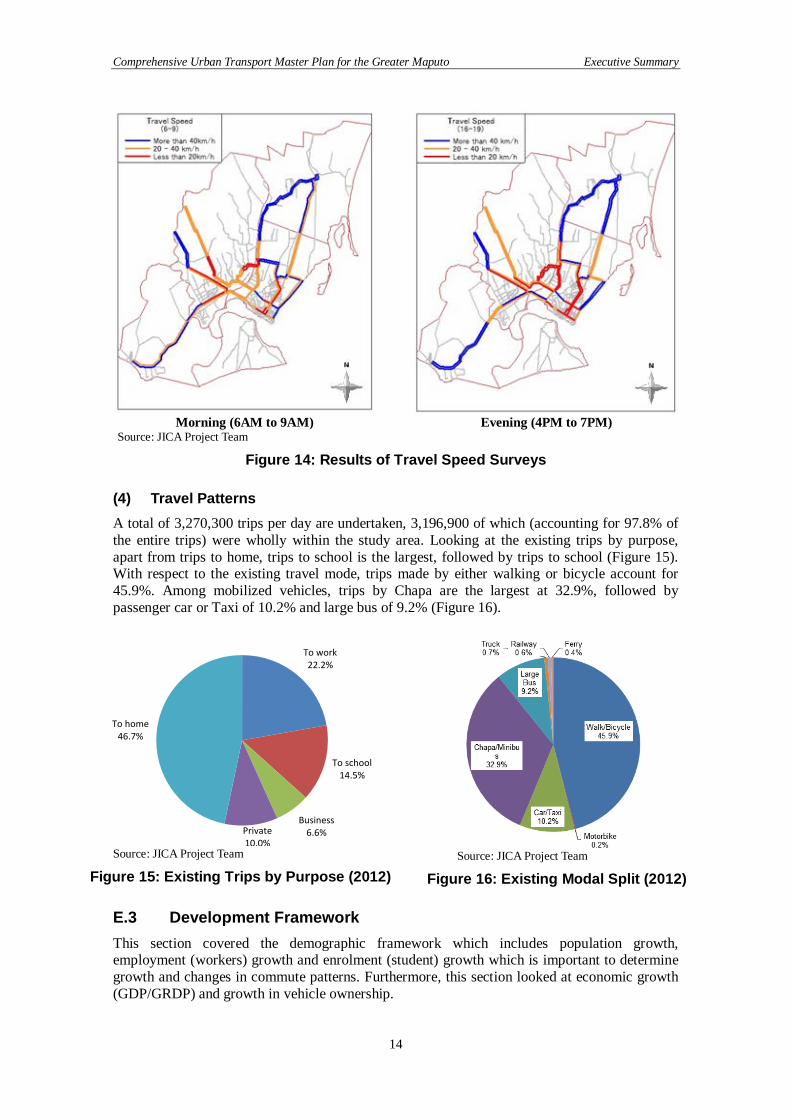
Source: JICA Project Team (3) Travel Speed Survey Figure 14 presents the results of travel speed surveys conducted during morning and evening peak hours. The road sections marked in red are severely congested with an average travel speed of less than 20 kilometers per hour. These are the roads linking Maputo with Matola as well as North and South of Central Business District (CBD).
Comprehensive Urban Transport Master Plan for the Greater Maputo Executive Summary
14
Morning (6AM to 9AM)
Evening (4PM to 7PM)
Source: JICA Project Team
Figure 14: Results of Travel Speed Surveys (4) Travel Patterns A total of 3,270,300 trips per day are undertaken, 3,196,900 of which (accounting for 97.8% of the entire trips) were wholly within the study area. Looking at the existing trips by purpose, apart from trips to home, trips to school is the largest, followed by trips to school (Figure 15). With respect to the existing travel mode, trips made by either walking or bicycle account for 45.9%. Among mobilized vehicles, trips by Chapa are the largest at 32.9%, followed by passenger car or Taxi of 10.2% and large bus of 9.2% (Figure 16).
Source: JICA Project Team
Figure 15: Existing Trips by Purpose (2012)
Source: JICA Project Team
Figure 16: Existing Modal Split (2012) E.3 Development Framework This section covered the demographic framework which includes population growth, employment (workers) growth and enrolment (student) growth which is important to determine growth and changes in commute patterns. Furthermore, this section looked at economic growth (GDP/GRDP) and growth in vehicle ownership.
To work22.2%
To school14.5%
Business6.6%Private
10.0%
To home46.7%
Comprehensive Urban Transport Master Plan for the Greater Maputo Executive Summary
15
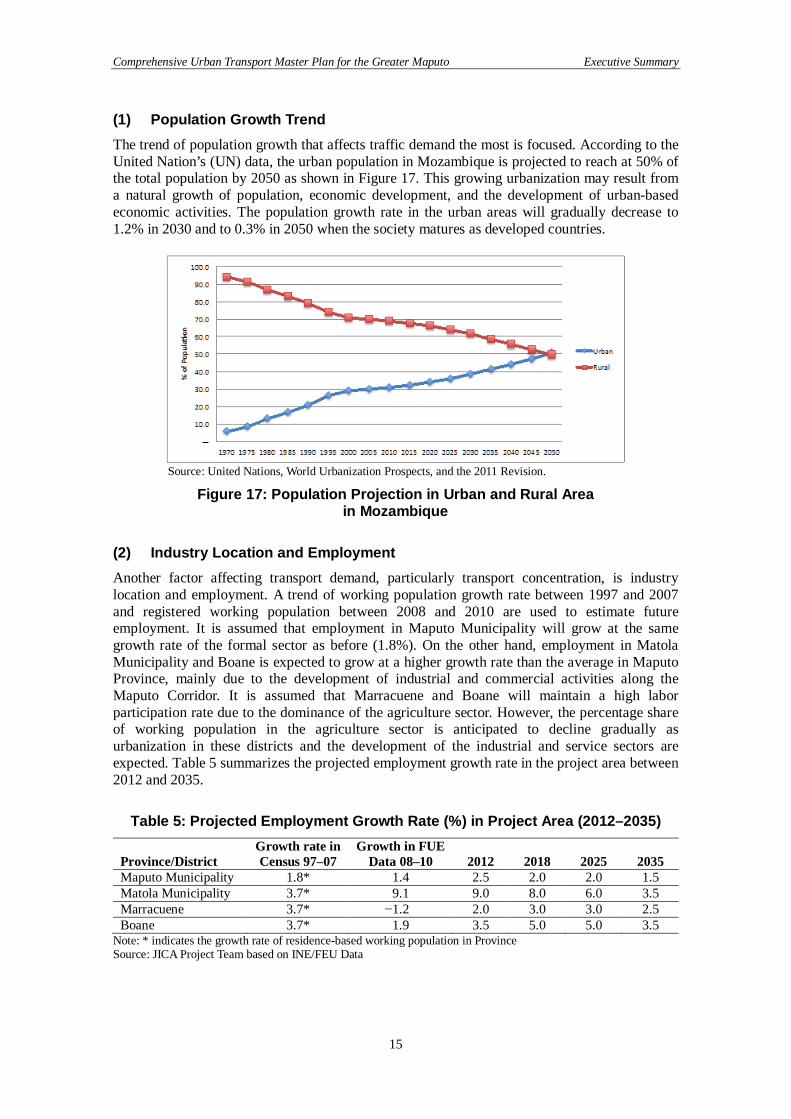
(1) Population Growth Trend The trend of population growth that affects traffic demand the most is focused. According to the United Nation’s (UN) data, the urban population in Mozambique is projected to reach at 50% of the total population by 2050 as shown in Figure 17. This growing urbanization may result from a natural growth of population, economic development, and the development of urban-based economic activities. The population growth rate in the urban areas will gradually decrease to 1.2% in 2030 and to 0.3% in 2050 when the society matures as developed countries.
Source: United Nations, World Urbanization Prospects, and the 2011 Revision.
Figure 17: Population Projection in Urban and Rural Area in Mozambique
(2) Industry Location and Employment Another factor affecting transport demand, particularly transport concentration, is industry location and employment. A trend of working population growth rate between 1997 and 2007 and registered working population between 2008 and 2010 are used to estimate future employment. It is assumed that employment in Maputo Municipality will grow at the same growth rate of the formal sector as before (1.8%). On the other hand, employment in Matola Municipality and Boane is expected to grow at a higher growth rate than the average in Maputo Province, mainly due to the development of industrial and commercial activities along the Maputo Corridor. It is assumed that Marracuene and Boane will maintain a high labor participation rate due to the dominance of the agriculture sector. However, the percentage share of working population in the agriculture sector is anticipated to decline gradually as urbanization in these districts and the development of the industrial and service sectors are expected. Table 5 summarizes the projected employment growth rate in the project area between 2012 and 2035.
Table 5: Projected Employment Growth Rate (%) in Project Area (2012–2035)
Province/District Growth rate in Census 97–07
Growth in FUE Data 08–10 2012 2018 2025 2035
Maputo Municipality 1.8* 1.4 2.5 2.0 2.0 1.5 Matola Municipality 3.7* 9.1 9.0 8.0 6.0 3.5 Marracuene 3.7* −1.2 2.0 3.0 3.0 2.5 Boane 3.7* 1.9 3.5 5.0 5.0 3.5
Note: * indicates the growth rate of residence-based working population in Province Source: JICA Project Team based on INE/FEU Data
Comprehensive Urban Transport Master Plan for the Greater Maputo Executive Summary
16
(3) Expected Economic Growth INE provides the official statistical data on GDP and GRDP by province up to 2009. The Ministry of Planning and Development (MPD) is responsible for the estimation and projection of GDP in Mozambique, which is available between 2010 and 2025. However, the projection for the long-term economic growth is not available. The projection of GRDP growth rate is also not available, hence the study team consulted with MPD and relevant stakeholders regarding the economic growth in Maputo City and Maputo Province and set the growth rate up to 2035. The latest GDP structure data by industry is available from INE and is used for the projection of GDP structure by industry. There is no data on GRDP structure by industry in Maputo City and Maputo Province, and thus a national level projection of GDP structure by industry will be performed. For the purpose of the transport demand forecast modeling, the GDP/GRDP growth projection for Greater Maputo summarized in Table 6 is used.
Table 6: GDP/GRDP Growth Projection (2012–2035) 2012 2035 2035/2012 Growth rate
Population (1,000) 2,169 3,697 1.7 2.2% GRDP (mil MT) 80,820 325,091 4.0 6.0% GRDP/Capita (USD) 1,379 3,137 2.3 3.5% Annual Income (USD) 683 1,554 2.3 3.5%
Source: JICA Project Team (4) GDP Structure by Industry The extractive sector in Mozambique is expected to grow rapidly in the medium term. Mozambique’s natural resource reserves (coal, natural gas, and mineral sands) have not been fully explored. According to the preliminary estimate of IMF, the mega projects in Mozambique can directly contribute up to 18% of total value added by 2016, of which the coal extraction may consist of around 9% of the total GDP. The tertiary (service) sector has grown at an average rate of 7% in the past decade, and is expected to continue to grow at a similar growth rate mainly due to the gradual urbanization as well as the development of the transport sector. At the same time, however, the boost of the extractive sector may decelerate the growth in the service sector. The primary industry is expected to decline the percentage share of GDP, mainly due to the gradual population movement between rural-urban areas. These potential trends were taken into account for the GDP projection by industry until 2025. From 2026 on, since a great deal of uncertainty is involved in the projection of economic structure, it is assumed for projection purposes that the GDP structure by industry in 2026–2035 will remain the same as that during 2021–2025. Table 7 and Table 8 summarize the current and future GDP by industry in Mozambique between 2009 and 2035.
Comprehensive Urban Transport Master Plan for the Greater Maputo Executive Summary
17
Table 7: Percentage Structure of GDP by Industry in Mozambique (2009–2035) (%)
Primary Industry
Secondary Industry Tertiary Industry Total
Extractive Industry
Manufac- turing
Electricity/Water
Construc- tion
2009 25.2 22.3 1.1 12.8 4.9 3.4 43.6 2010 25.1 21.8 1.2 12.4 4.8 3.4 44.1 2011 24.9 21.3 1.3 11.9 4.8 3.3 44.0 2012 24.3 21.8 1.9 11.5 5.1 3.3 48.1 2013 23.7 22.3 3.0 11.0 5.0 3.3 44.5 2014 22.8 23.2 5.0 10.5 4.5 3.2 44.7 2015 20.8 25.4 8.0 10.2 4.0 3.2 44.5 2016 20.4 25.6 9.0 10.0 3.5 3.1 44.7 2017 17.9 28.3 12.0 10.0 3.2 3.1 44.5 2018–2020* 15.7 30.7 15.0 9.8 2.9 3.0 44.3 2021–2025* 14.7 31.6 16.0 9.8 2.8 3.0 44.4 2026–2030* 14.7 31.6 16.0 9.8 2.8 3.0 44.4 2031–2035* 14.7 31.6 16.0 9.8 2.8 3.0 44.4
Source: Actual data from INE (2009), estimation and projection by MPD (2010–2013), and JICA Project Team Note: *indicate the average figures.
Table 8: GDP by Industry in Mozambique (2009–2035, Constant Price in 2003) (Million MT)
Primary Industry
Secondary Sector of Industry Tertiary Industry Total
Extractive Ind.
Manufac- turing
Electricity/ Water
Construc-tion
2009 43,252 38,170 1,910 21,910 8,420 5,920 74,450 2010 46,130 40,170 2,150 22,890 8,900 6,240 80,510 2011 49,690 42,090 2,500 23,570 9,490 6,530 85,250 2012 51,600 46,230 4,090 24,390 10,720 7,030 102,140 2013 54,550 51,330 7,010 25,320 11,570 7,590 102,370 2014 56,520 57,570 12,410 26,050 11,170 7,940 110,970 2015 55,730 67,940 21,400 27,280 10,700 8,560 118,940 2016 58,850 73,890 25,980 28,860 10,100 8,950 129,040 2017 56,040 88,380 37,470 31,230 9,990 9,680 138,830 2018–2020* 57,270 112,520 55,150 35,900 10,480 10,990 162,500 2021–2025* 74,990 161,200 81,620 49,990 14,280 15,300 226,490 2026–2030* 107,800 231,740 117,340 71,870 20,530 22,000 325,610 2031–2035* 143,990 309,530 156,720 95,990 27,430 29,390 434,900
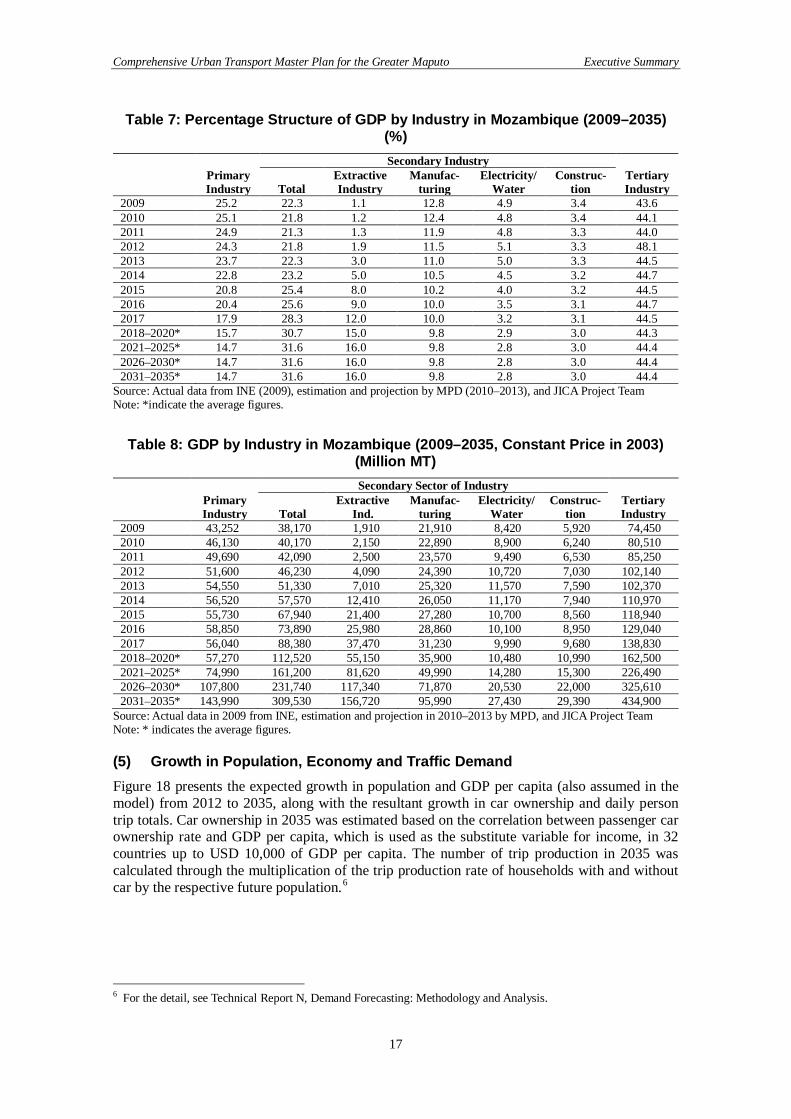
Source: Actual data in 2009 from INE, estimation and projection in 2010–2013 by MPD, and JICA Project Team Note: * indicates the average figures. (5) Growth in Population, Economy and Traffic Demand Figure 18 presents the expected growth in population and GDP per capita (also assumed in the model) from 2012 to 2035, along with the resultant growth in car ownership and daily person trip totals. Car ownership in 2035 was estimated based on the correlation between passenger car ownership rate and GDP per capita, which is used as the substitute variable for income, in 32 countries up to USD 10,000 of GDP per capita. The number of trip production in 2035 was calculated through the multiplication of the trip production rate of households with and without car by the respective future population.6
6 For the detail, see Technical Report N, Demand Forecasting: Methodology and Analysis.
Comprehensive Urban Transport Master Plan for the Greater Maputo Executive Summary
18
Source: JICA Project Team
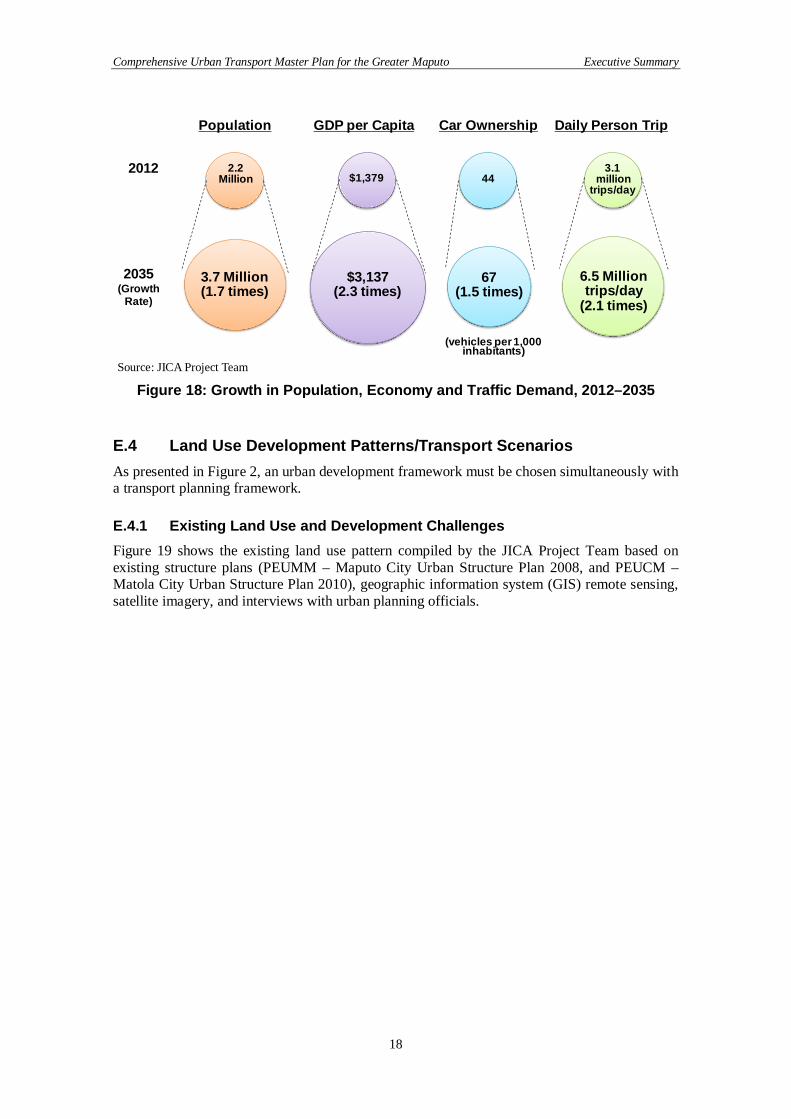
Figure 18: Growth in Population, Economy and Traffic Demand, 2012–2035 E.4 Land Use Development Patterns/Transport Scenarios As presented in Figure 2, an urban development framework must be chosen simultaneously with a transport planning framework. E.4.1 Existing Land Use and Development Challenges Figure 19 shows the existing land use pattern compiled by the JICA Project Team based on existing structure plans (PEUMM – Maputo City Urban Structure Plan 2008, and PEUCM – Matola City Urban Structure Plan 2010), geographic information system (GIS) remote sensing, satellite imagery, and interviews with urban planning officials.
Daily Person Trip
2012
2035(Growth
Rate)
2.2 Million
3.7 Million(1.7 times)
Population GDP per Capita
$1,379
$3,137(2.3 times)
3.1million
trips/day
6.5 Million trips/day
(2.1 times)
44
67(1.5 times)
Car Ownership
(vehicles per 1,000 inhabitants)
Comprehensive Urban Transport Master Plan for the Greater Maputo Executive Summary
19
Source: JICA Project Team
Figure 19: Existing Land Use Commercial and office areas are concentrated in the southern part of Maputo City where a central business district (CBD) has been formed. Residential areas in Maputo City that has a population of about 1.2 million (Table 9) are expanding toward the north in addition to the southern and central parts of the city. The population density in Maputo City is substantially higher than other cities/districts in Greater Maputo.
Table 9: Population and Average Density by City/District in Greater Maputo
City/District Area (ha) 2012
Population Average Density
(persons/ha) Maputo 26,961 1,188,612 44 Matola 38,079 827,475 22 Marracuene 30,490 88,309 3 Boane 25,238 64,698 3 TOTAL 120,767 2,169,094 18
Source: JICA Project Team
Comprehensive Urban Transport Master Plan for the Greater Maputo Executive Summary
20
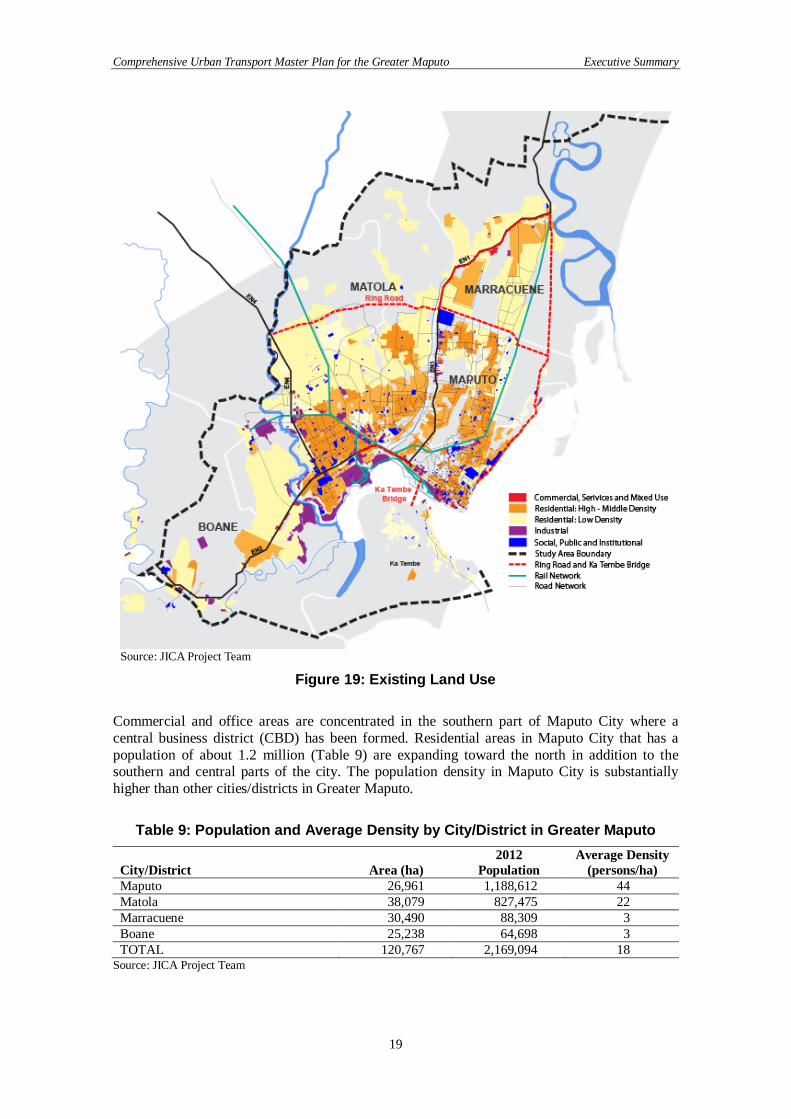
The population in Greater Maputo is also expanding toward the west with about 830,000 people living in Matola City that is undergoing industrial development. Much of the land in Marracuene District and Boane City is currently agricultural and natural areas, and significant population growth has not taken place yet. There is not much room for further development in Maputo CBD, and it is expected that the development in surrounding areas will accelerate. Based on information collected from the existing urban structure plans and interviews with stakeholders including planning officers of the municipalities and districts, national government agencies, donors, developers, and consultants, the JICA Project Team identified areas for urbanization/growth centers (Figure 20), and confirmed or committed development projects in Greater Maputo.
Source: JICA Project Team based on PEUMM, PEUCM, and interviews with City, District, National Government Agencies, as well as with consultants, in June 2012
Figure 20: Growth Centers E.4.2 Urban Development Vision and Strategies Although an urban structure plan for Maputo City and another for Matola City exist, there is no effective urban structure plan targeting the entire area of Greater Maputo. It was therefore necessary to set out urban development strategies and scenarios for Greater Maputo as one of the bases for urban transport master planning. The urban development vision and strategies set forth and agreed by the Steering Committee for this study are as follows: (1) Urban Development Vision for Greater Maputo The agreed vision is: “socially and environmentally sustainable urban transport systems facilitating the international gateway capital”. The vision itself represents a long-term and final goal to which all initiatives need to be targeted. Achieving this vision may take several decades but it provides a general framework for the development of strategies.
Comprehensive Urban Transport Master Plan for the Greater Maputo Executive Summary
21
(2) Urban Development Strategies The following urban development strategies have been developed.
Multiple-core urban structure: Shift functions from the Central Business District (CBD) to poly-centers to alleviate congestion, formalize and density housing developments around them.
Sustainable economic capital: Use existing assets (Maputo/Matola Ports, Maputo Economic Corridor, and Free Economic Zones), strategically upgrade urban infrastructure to enhance private sector investments, and encourage a diverse and sustainable economic structure to encourage employment.
International capital for culture: Utilize and enhance cultural assets, including historical, green and open spaces, coastal areas, and provide for the improvement of urban health, sanitation, and safety.
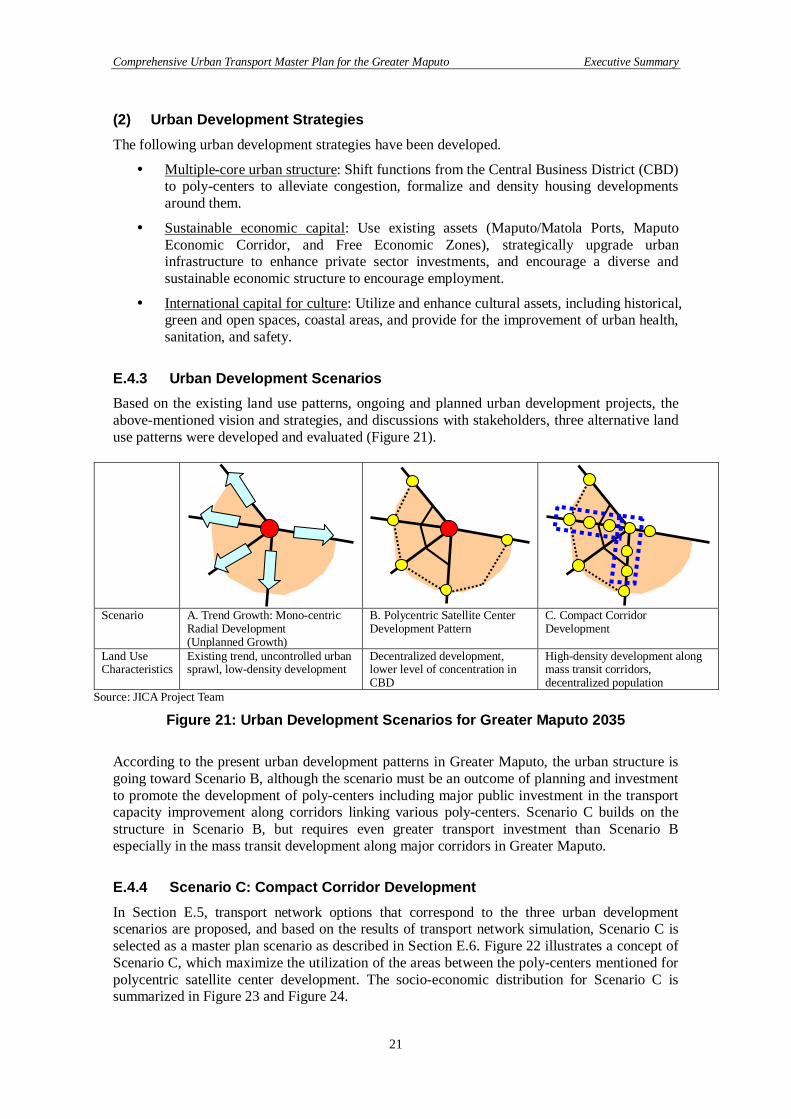
E.4.3 Urban Development Scenarios Based on the existing land use patterns, ongoing and planned urban development projects, the above-mentioned vision and strategies, and discussions with stakeholders, three alternative land use patterns were developed and evaluated (Figure 21).
Scenario A. Trend Growth: Mono-centric
Radial Development (Unplanned Growth)
B. Polycentric Satellite Center Development Pattern
C. Compact Corridor Development
Land Use Characteristics
Existing trend, uncontrolled urban sprawl, low-density development
Decentralized development, lower level of concentration in CBD
High-density development along mass transit corridors, decentralized population
Source: JICA Project Team
Figure 21: Urban Development Scenarios for Greater Maputo 2035 According to the present urban development patterns in Greater Maputo, the urban structure is going toward Scenario B, although the scenario must be an outcome of planning and investment to promote the development of poly-centers including major public investment in the transport capacity improvement along corridors linking various poly-centers. Scenario C builds on the structure in Scenario B, but requires even greater transport investment than Scenario B especially in the mass transit development along major corridors in Greater Maputo.
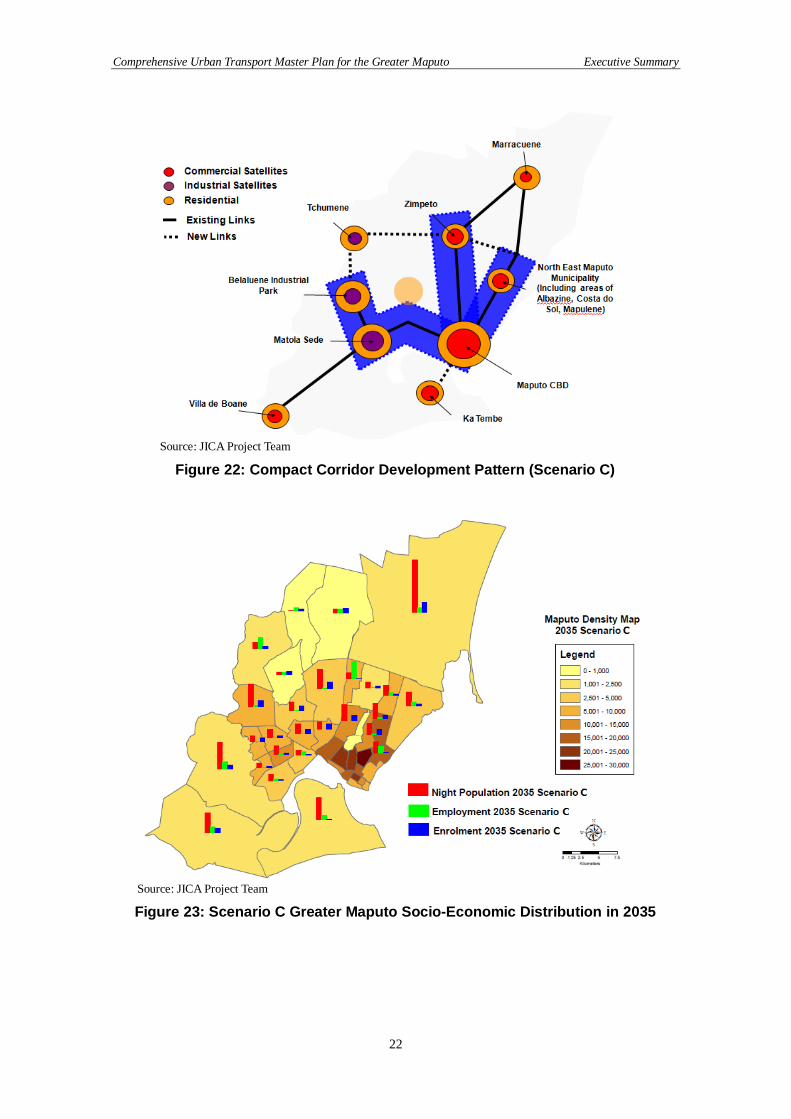
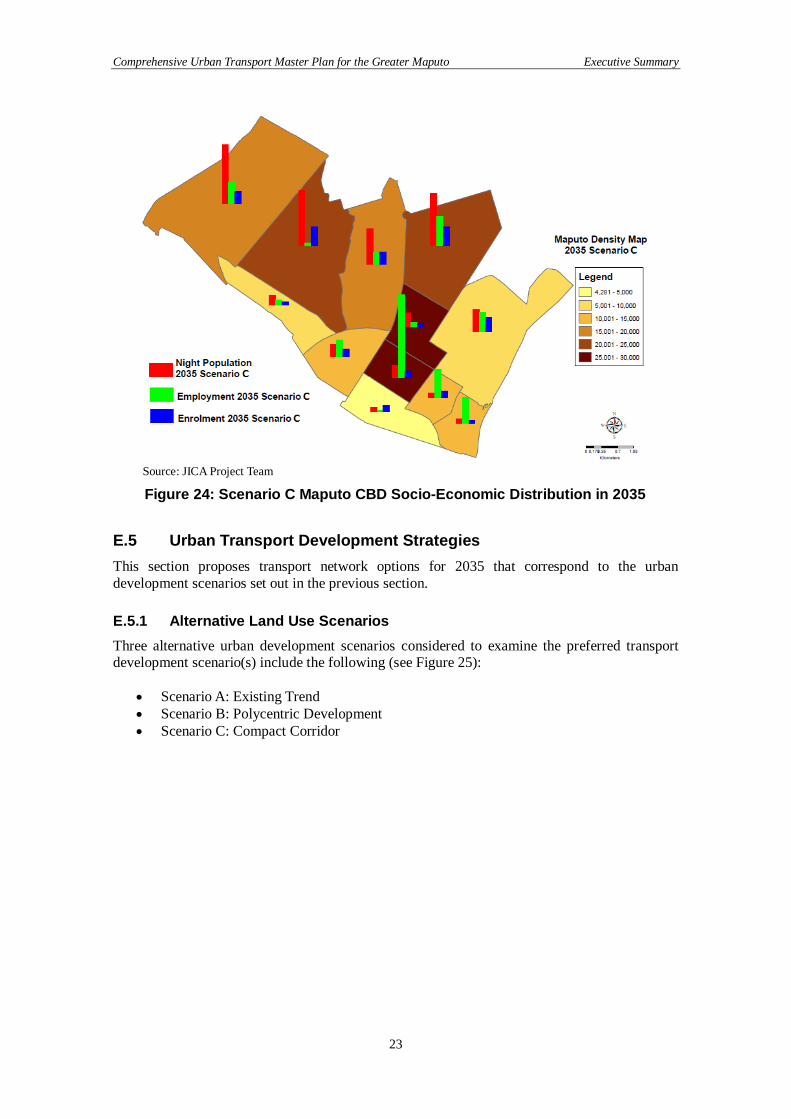
E.4.4 Scenario C: Compact Corridor Development In Section E.5, transport network options that correspond to the three urban development scenarios are proposed, and based on the results of transport network simulation, Scenario C is selected as a master plan scenario as described in Section E.6. Figure 22 illustrates a concept of Scenario C, which maximize the utilization of the areas between the poly-centers mentioned for polycentric satellite center development. The socio-economic distribution for Scenario C is summarized in Figure 23 and Figure 24.
Comprehensive Urban Transport Master Plan for the Greater Maputo Executive Summary
22
Source: JICA Project Team
Figure 22: Compact Corridor Development Pattern (Scenario C)
Source: JICA Project Team
Figure 23: Scenario C Greater Maputo Socio-Economic Distribution in 2035
Comprehensive Urban Transport Master Plan for the Greater Maputo Executive Summary
23
Source: JICA Project Team
Figure 24: Scenario C Maputo CBD Socio-Economic Distribution in 2035 E.5 Urban Transport Development Strategies This section proposes transport network options for 2035 that correspond to the urban development scenarios set out in the previous section. E.5.1 Alternative Land Use Scenarios Three alternative urban development scenarios considered to examine the preferred transport development scenario(s) include the following (see Figure 25):
• Scenario A: Existing Trend • Scenario B: Polycentric Development • Scenario C: Compact Corridor

Comprehensive Urban Transport Master Plan for the Greater Maputo Executive Summary
24
A:Existing Trend (Sprawl)
B:Poly-Centric Multi Core
C:Compact Corridor (Transit Oriented Development)
Source: JICA Project Team
Figure 25: Alternative Land Use Scenarios E.5.2 Urban Transport Development Vision and Strategy Urban transport development vision and strategy were examined jointly by the JICA Project Team and stakeholders in order to achieve the urban development vision and strategy that were set out. The transport development vision agreed by the Steering Committee for the study is as follows: Greater Maputo with “Socially and Environmentally Sustainable Urban Transport Systems facilitating the International Gateway Capital.” To achieve this vision, the following development strategies were agreed upon:
• Increase mobility/accessibility by improving public transport systems (related to Public Transport)
• Road network development with consideration to functions/hierarchy (related to Road Network)
• Better use of road space and improve vehicle/pedestrian environment (related to Traffic Management)
Comprehensive Urban Transport Master Plan for the Greater Maputo Executive Summary
25
E.5.3 Urban Transport Network Options Alternative scenarios for transport network development in Greater Maputo were developed based on the following considerations:
• Develop scenarios that correspond to the land use scenarios • Improve public transport systems significantly based on the urban transport
development strategies • Include scenarios with mass transit systems development along heavily congested
routes/sections (e.g., commuter rail, LRT, BRT) • Expand transport capacity significantly along the Maputo–Matola Axis (East-West
Axis) and the North-South Axis • Improve suburb-to-suburb transport, e.g., between central/northern Maputo
Municipality and Matola/Machava, the demand for which is relatively high and is expected to grow rapidly
Three transport network options proposed are as follows:
• Scenario A: “Do Minimum” in terms of transport network development (though ongoing and already committed projects are included). Scenario A corresponds to Land Use Pattern A [Existing Trend].
• Scenario B: Development of mass transit systems, i.e., Bus Rapid Transit (BRT) network with reform of buses and chapas. Scenario B corresponds to Land Use Pattern B [Polycentric Development] that would entail major public investment in the transport capacity improvement along corridors linking various poly-centers.
• Scenario C: Development of mass transit systems including commuter rail in addition to BRT, with bus and chapas networks restructured accordingly. Scenario C corresponds to Land Use Pattern C [Compact Corridor] that is considered to require even greater transport investment than Scenario B along key transit corridors.
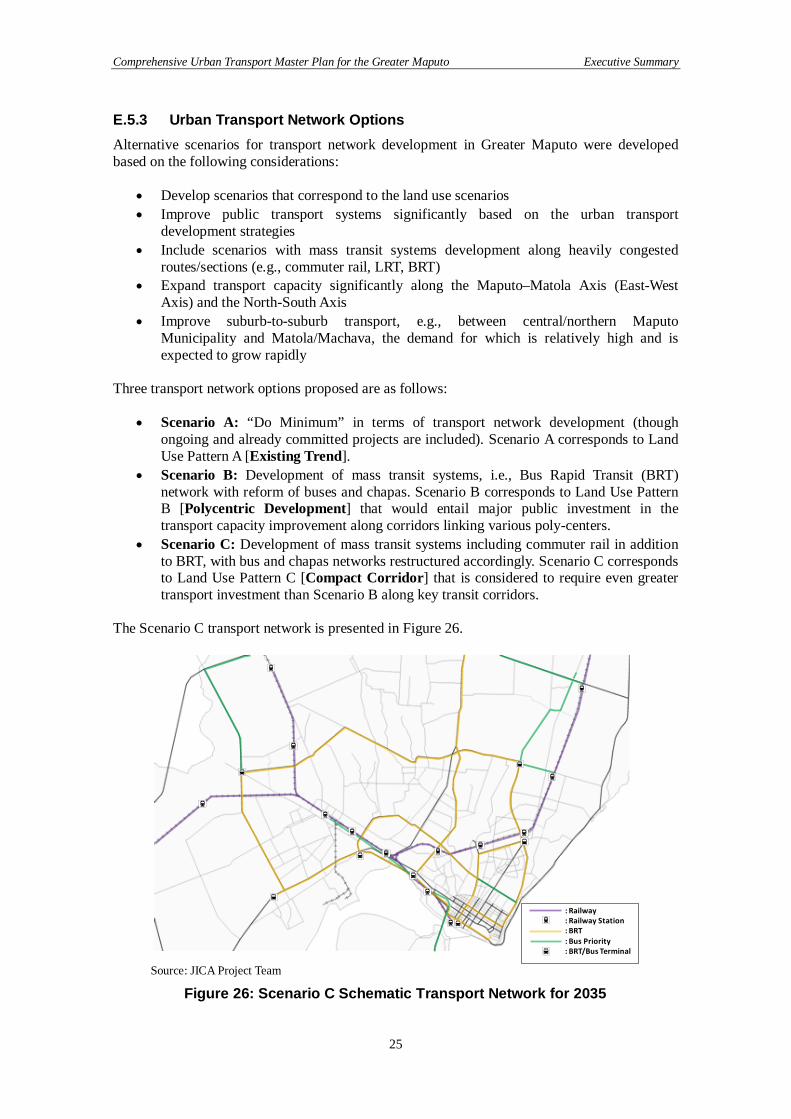
The Scenario C transport network is presented in Figure 26.
Source: JICA Project Team
Figure 26: Scenario C Schematic Transport Network for 2035
: Railway: Railway Station: BRT: Bus Priority: BRT/Bus Terminal
Comprehensive Urban Transport Master Plan for the Greater Maputo Executive Summary
26
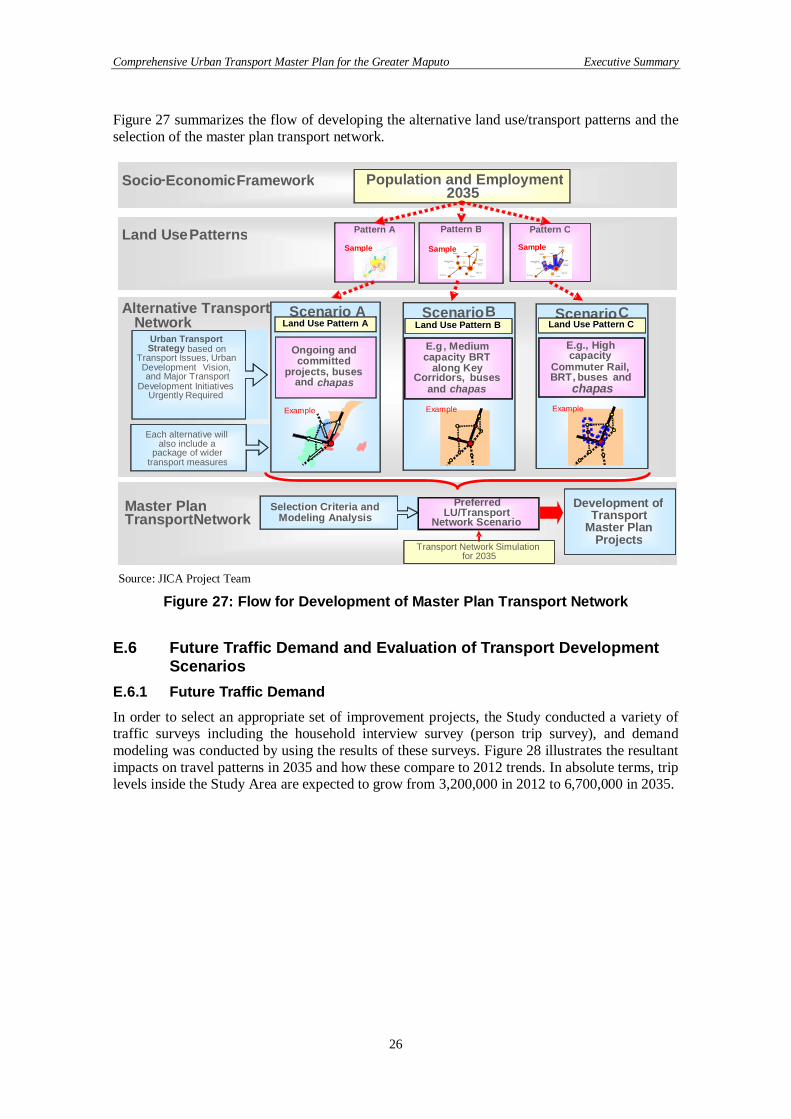
Figure 27 summarizes the flow of developing the alternative land use/transport patterns and the selection of the master plan transport network.
Source: JICA Project Team
Figure 27: Flow for Development of Master Plan Transport Network E.6 Future Traffic Demand and Evaluation of Transport Development
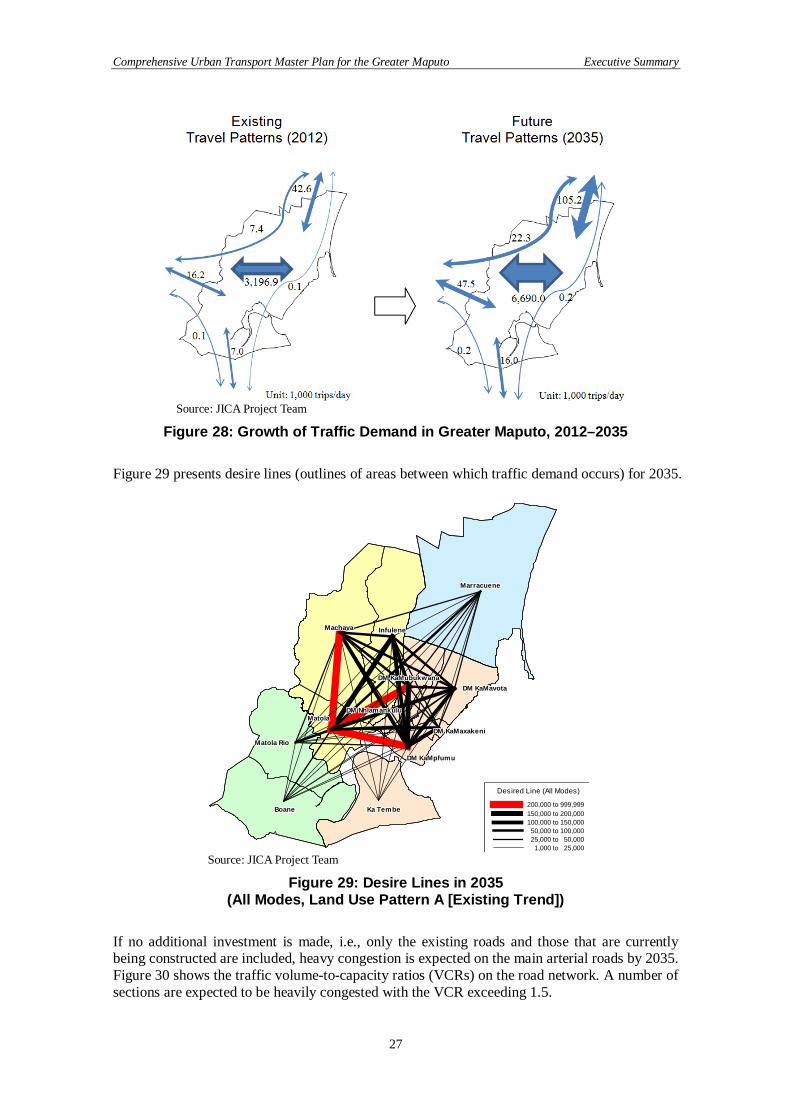
Scenarios E.6.1 Future Traffic Demand In order to select an appropriate set of improvement projects, the Study conducted a variety of traffic surveys including the household interview survey (person trip survey), and demand modeling was conducted by using the results of these surveys. Figure 28 illustrates the resultant impacts on travel patterns in 2035 and how these compare to 2012 trends. In absolute terms, trip levels inside the Study Area are expected to grow from 3,200,000 in 2012 to 6,700,000 in 2035.
Population and Employment
2035
Socio
- Economic
Framework
Alternative Transport
Network
Master Plan
Transport
Network
Development of
Transport
Master Plan
Projects
Scenario A
Ongoing and
committed
projects, buses
and
chapas
Scenario
B
E.g
, Medium
capacity BRT
along Key
Corridors,
buses
and
chapas
Selection Criteria and
Modeling Analysis
Scenario
C
E.g., High
capacity
Commuter Rail,
BRT
, buses
and
chapas
Each alternative will also include a
package of wider
transport measures
Preferred
LU/Transport
Network Scenario
Transport Network Simulation for 2035
Urban Transport
Strategy
based
on
Transport Issues,
Urban
Development
Vision,
and Major Transport
Development Initiatives
Urgently Required Example
Example
Example
Land Use Patterns
Pattern B Pattern A Pattern C Sample Sample Sample
Land Use Pattern B Land Use Pattern C Land Use Pattern A
Comprehensive Urban Transport Master Plan for the Greater Maputo Executive Summary
27
Source: JICA Project Team
Figure 28: Growth of Traffic Demand in Greater Maputo, 2012–2035 Figure 29 presents desire lines (outlines of areas between which traffic demand occurs) for 2035.
Source: JICA Project Team
Figure 29: Desire Lines in 2035 (All Modes, Land Use Pattern A [Existing Trend])
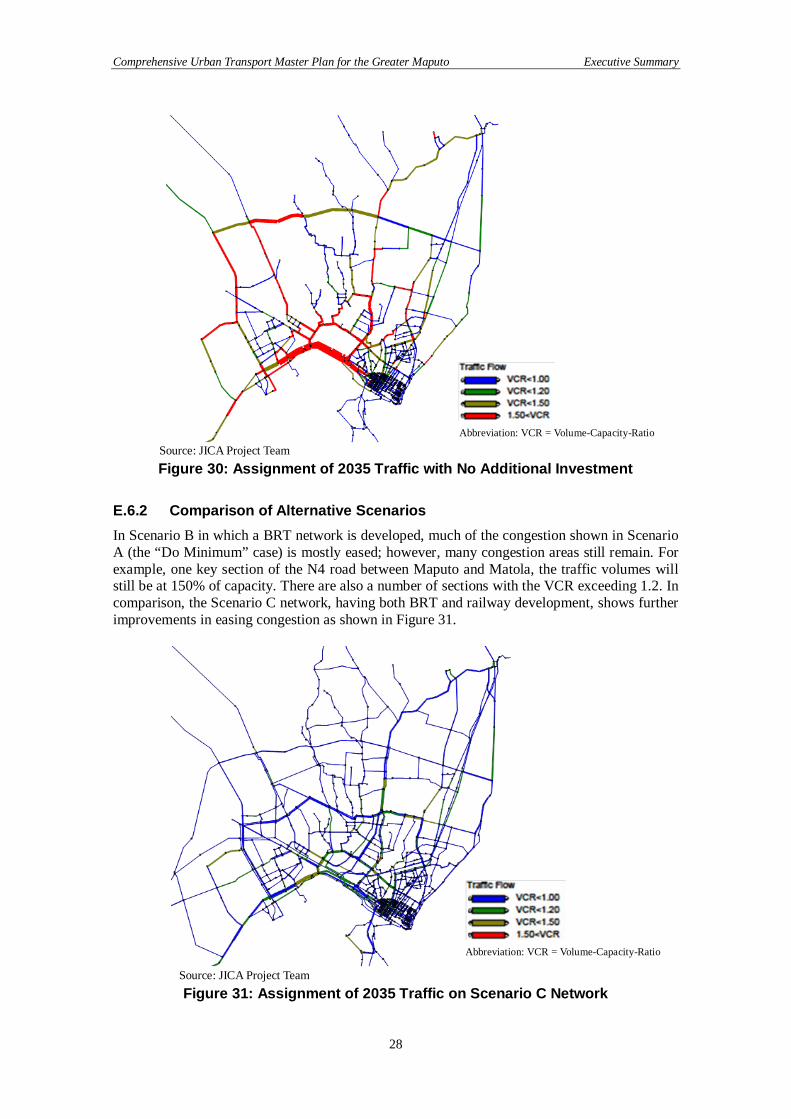
If no additional investment is made, i.e., only the existing roads and those that are currently being constructed are included, heavy congestion is expected on the main arterial roads by 2035. Figure 30 shows the traffic volume-to-capacity ratios (VCRs) on the road network. A number of sections are expected to be heavily congested with the VCR exceeding 1.5.
DM KaMubukwanaDM KaMubukwanaDM KaMubukwanaDM KaMubukwanaDM KaMubukwanaDM KaMubukwanaDM KaMubukwanaDM KaMubukwanaDM KaMubukwanaDM KaMavotaDM KaMavotaDM KaMavotaDM KaMavotaDM KaMavotaDM KaMavotaDM KaMavotaDM KaMavotaDM KaMavota
DM KaMaxakeniDM KaMaxakeniDM KaMaxakeniDM KaMaxakeniDM KaMaxakeniDM KaMaxakeniDM KaMaxakeniDM KaMaxakeniDM KaMaxakeni
BoaneBoaneBoaneBoaneBoaneBoaneBoaneBoaneBoane Ka TembeKa TembeKa TembeKa TembeKa TembeKa TembeKa TembeKa TembeKa Tembe
MatolaMatolaMatolaMatolaMatolaMatolaMatolaMatolaMatolaDM NhlamankuluDM NhlamankuluDM NhlamankuluDM NhlamankuluDM NhlamankuluDM NhlamankuluDM NhlamankuluDM NhlamankuluDM Nhlamankulu
Matola RioMatola RioMatola RioMatola RioMatola RioMatola RioMatola RioMatola RioMatola Rio
DM KaMpfumuDM KaMpfumuDM KaMpfumuDM KaMpfumuDM KaMpfumuDM KaMpfumuDM KaMpfumuDM KaMpfumuDM KaMpfumu
InfuleneInfuleneInfuleneInfuleneInfuleneInfuleneInfuleneInfuleneInfuleneMachavaMachavaMachavaMachavaMachavaMachavaMachavaMachavaMachava
MarracueneMarracueneMarracueneMarracueneMarracueneMarracueneMarracueneMarracueneMarracuene
Desired Line (All Modes)
200,000 to 999,999150,000 to 200,000100,000 to 150,00050,000 to 100,00025,000 to 50,0001,000 to 25,000
Comprehensive Urban Transport Master Plan for the Greater Maputo Executive Summary
28
Source: JICA Project Team Figure 30: Assignment of 2035 Traffic with No Additional Investment
E.6.2 Comparison of Alternative Scenarios In Scenario B in which a BRT network is developed, much of the congestion shown in Scenario A (the “Do Minimum” case) is mostly eased; however, many congestion areas still remain. For example, one key section of the N4 road between Maputo and Matola, the traffic volumes will still be at 150% of capacity. There are also a number of sections with the VCR exceeding 1.2. In comparison, the Scenario C network, having both BRT and railway development, shows further improvements in easing congestion as shown in Figure 31.
Source: JICA Project Team Figure 31: Assignment of 2035 Traffic on Scenario C Network
Abbreviation: VCR = Volume-Capacity-Ratio
Abbreviation: VCR = Volume-Capacity-Ratio
Comprehensive Urban Transport Master Plan for the Greater Maputo Executive Summary
29
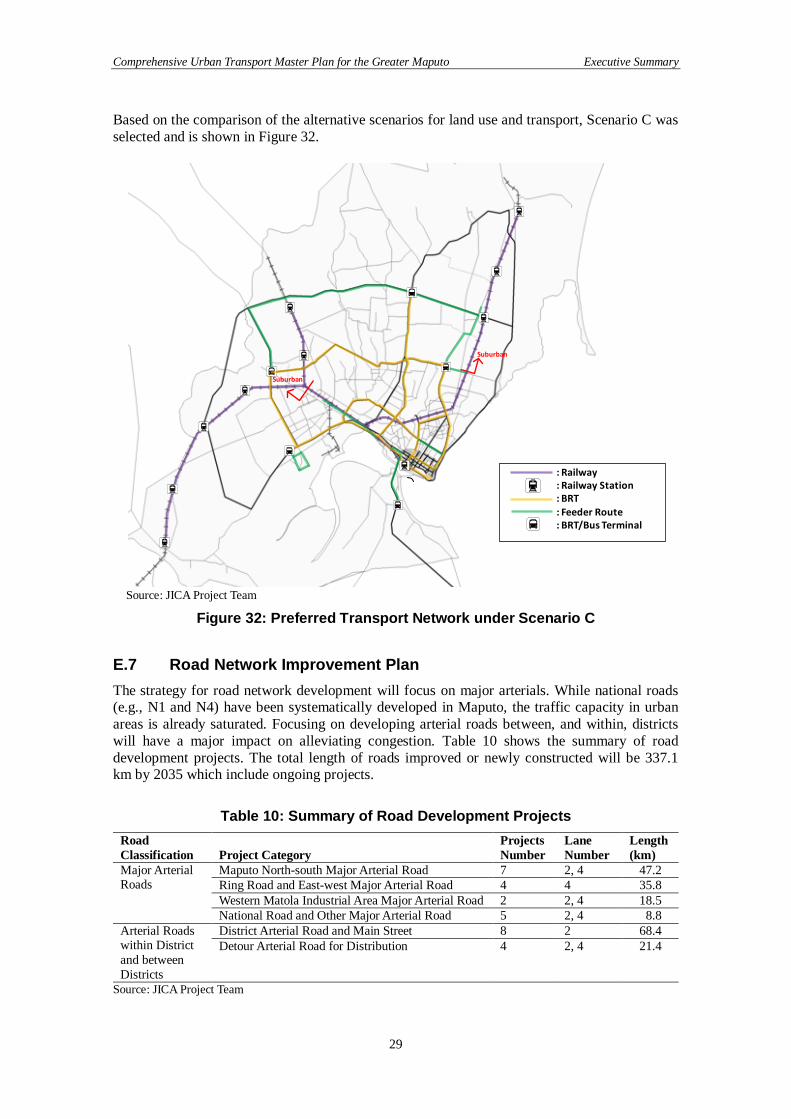
Based on the comparison of the alternative scenarios for land use and transport, Scenario C was selected and is shown in Figure 32.
Source: JICA Project Team
Figure 32: Preferred Transport Network under Scenario C E.7 Road Network Improvement Plan The strategy for road network development will focus on major arterials. While national roads (e.g., N1 and N4) have been systematically developed in Maputo, the traffic capacity in urban areas is already saturated. Focusing on developing arterial roads between, and within, districts will have a major impact on alleviating congestion. Table 10 shows the summary of road development projects. The total length of roads improved or newly constructed will be 337.1 km by 2035 which include ongoing projects.
Table 10: Summary of Road Development Projects Road Classification Project Category
Projects Number
Lane Number
Length (km)
Major Arterial Roads
Maputo North-south Major Arterial Road 7 2, 4 47.2 Ring Road and East-west Major Arterial Road 4 4 35.8 Western Matola Industrial Area Major Arterial Road 2 2, 4 18.5 National Road and Other Major Arterial Road 5 2, 4 8.8
Arterial Roads within District and between Districts
District Arterial Road and Main Street 8 2 68.4 Detour Arterial Road for Distribution 4 2, 4 21.4
Source: JICA Project Team
Suburban
Suburban
: Railway: Railway Station: BRT: Feeder Route: BRT/Bus Terminal

Comprehensive Urban Transport Master Plan for the Greater Maputo Executive Summary
30
Figure 33 shows the proposed road network and improved congestion levels in 2035.
Source: JICA Project Team
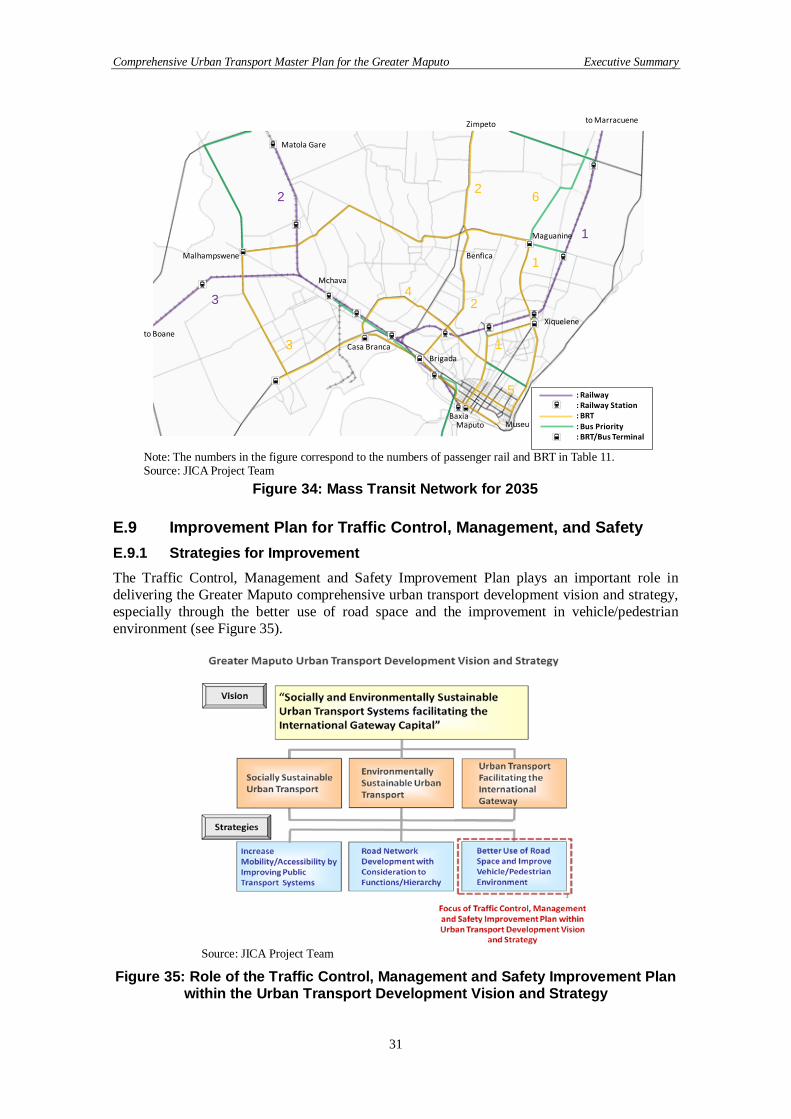
Figure 33: Proposed Road Network in 2035 E.8 Public Transport Improvement Plan Table 11 summarizes public transport development projects and Figure 34 shows the proposed mass transit network.
Table 11: Summary of Public Transport Development Projects Category Projects/Measure Length (km) Passenger Rail 1.Maputo–Matola Gare Line 20
2.Maputo–Marracuene Line 35 3.Machava–Boane Line 27
Bus Rapid Transit (BRT)
4.Baixa–Maguanine via Xiquelene, Praca dos Herois 12.9 5.Zimpeto–Benfica–Brigada--Maputo Station 19.1 6.Malhampswene–Ceres–Baixa 21.2 7.Casa Branca–Joaquim Chissano–J. Nyerere 13 8.Xiquelene–Museu–Baixa 10 9.Albasine–via Cardeal A Santo (BRT1 extension) –
Conventional Bus Improvement
Restructuring of public transport industry – Capacity building for bus sector – Bus Network Design (including feeder services) – Bus Fleet Renewal –
Supporting infrastructure and measures
Intermodal stops, hubs and interchange – Integrated walking and cycling network – Complementary measures (information, marketing, ticketing) –
Source: JICA Project Team
: Major Arterial Roads
: Other Arterial Roads
: Railway
Comprehensive Urban Transport Master Plan for the Greater Maputo Executive Summary
31
Note: The numbers in the figure correspond to the numbers of passenger rail and BRT in Table 11. Source: JICA Project Team
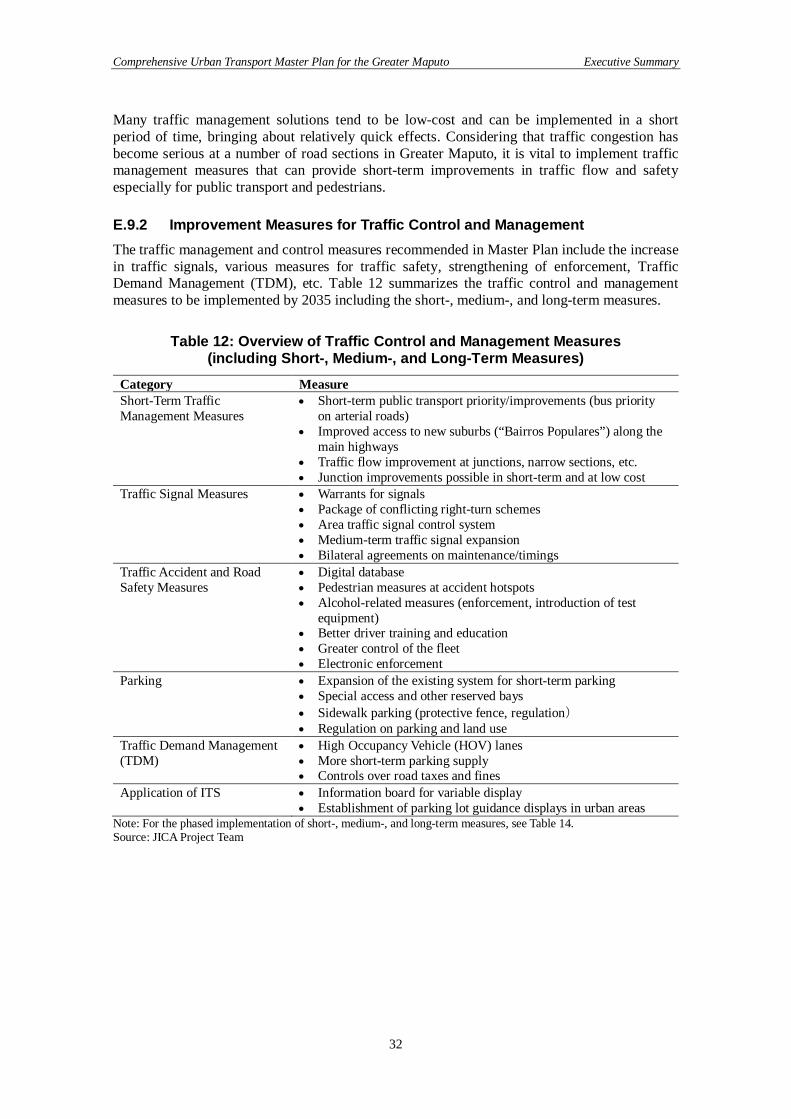
Figure 34: Mass Transit Network for 2035 E.9 Improvement Plan for Traffic Control, Management, and Safety E.9.1 Strategies for Improvement The Traffic Control, Management and Safety Improvement Plan plays an important role in delivering the Greater Maputo comprehensive urban transport development vision and strategy, especially through the better use of road space and the improvement in vehicle/pedestrian environment (see Figure 35).
Source: JICA Project Team
Figure 35: Role of the Traffic Control, Management and Safety Improvement Plan within the Urban Transport Development Vision and Strategy
: Railway: Railway Station: BRT: Bus Priority: BRT/Bus Terminal
1
2
3
1
2
Maguanine
Zimpeto
Brigada
Museu
to Boane
to Marracuene
Matola Gare
Mchava
Maputo
Xiquelene
Benfica
Baxia
Casa Branca
4
1
2
Malhampswene
3
5
6
Comprehensive Urban Transport Master Plan for the Greater Maputo Executive Summary
32
Many traffic management solutions tend to be low-cost and can be implemented in a short period of time, bringing about relatively quick effects. Considering that traffic congestion has become serious at a number of road sections in Greater Maputo, it is vital to implement traffic management measures that can provide short-term improvements in traffic flow and safety especially for public transport and pedestrians. E.9.2 Improvement Measures for Traffic Control and Management The traffic management and control measures recommended in Master Plan include the increase in traffic signals, various measures for traffic safety, strengthening of enforcement, Traffic Demand Management (TDM), etc. Table 12 summarizes the traffic control and management measures to be implemented by 2035 including the short-, medium-, and long-term measures.
Table 12: Overview of Traffic Control and Management Measures (including Short-, Medium-, and Long-Term Measures)
Category Measure Short-Term Traffic Management Measures
• Short-term public transport priority/improvements (bus priority on arterial roads)
• Improved access to new suburbs (“Bairros Populares”) along the main highways
• Traffic flow improvement at junctions, narrow sections, etc. • Junction improvements possible in short-term and at low cost
Traffic Signal Measures • Warrants for signals • Package of conflicting right-turn schemes • Area traffic signal control system • Medium-term traffic signal expansion • Bilateral agreements on maintenance/timings
Traffic Accident and Road Safety Measures
• Digital database • Pedestrian measures at accident hotspots • Alcohol-related measures (enforcement, introduction of test
equipment) • Better driver training and education • Greater control of the fleet • Electronic enforcement
Parking • Expansion of the existing system for short-term parking • Special access and other reserved bays • Sidewalk parking (protective fence, regulation) • Regulation on parking and land use
Traffic Demand Management (TDM)
• High Occupancy Vehicle (HOV) lanes • More short-term parking supply • Controls over road taxes and fines
Application of ITS • Information board for variable display • Establishment of parking lot guidance displays in urban areas
Note: For the phased implementation of short-, medium-, and long-term measures, see Table 14. Source: JICA Project Team
Comprehensive Urban Transport Master Plan for the Greater Maputo Executive Summary
33
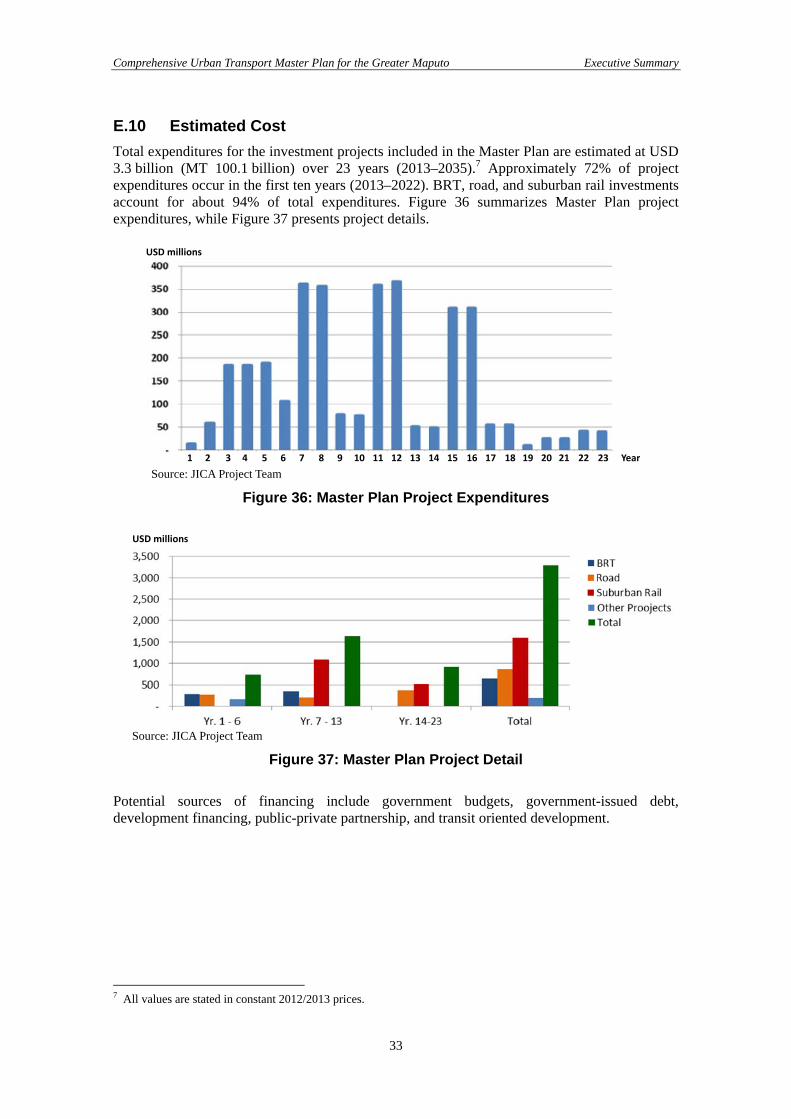
E.10 Estimated Cost Total expenditures for the investment projects included in the Master Plan are estimated at USD 3.3 billion (MT 100.1 billion) over 23 years (2013–2035).7 Approximately 72% of project expenditures occur in the first ten years (2013–2022). BRT, road, and suburban rail investments account for about 94% of total expenditures. Figure 36 summarizes Master Plan project expenditures, while Figure 37 presents project details.
Source: JICA Project Team
Figure 36: Master Plan Project Expenditures
Source: JICA Project Team
Figure 37: Master Plan Project Detail Potential sources of financing include government budgets, government-issued debt, development financing, public-private partnership, and transit oriented development.
7 All values are stated in constant 2012/2013 prices.
USD millions
1 2 3 4 5 6 7 8 9 10 11 12 13 14 15 16 17 18 19 20 21 22 23 Year
USD millions

Comprehensive Urban Transport Master Plan for the Greater Maputo Executive Summary
34
Table 13: Estimated Capital Cost of Master Plan Projects No. Transport Projects Description Timinga
Estimated Cost (millions)
1. Highway/Road (8 projects)
New construction of ring roads, arterial roads and connector roads, widening of and improvements to existing roads
Years 2–23 MT 26,130/ USD 857
2. Suburban Rail (3 projects)
Double tracking of high volume areas in central Maputo vicinity, depot construction, rolling stock investments
Years 7–16 MT 48,939/ USD 1,605
3. Bus Rapid Transit (three phases)
Network optimization, vehicle and infrastructure investment, capacity building, ITS, management systems
Years 3–13 MT 19,296/ USD 633
4. Conventional Bus (5 projects)
Capacity building, network design, fleet and infrastructure, industry restructuring
Years 1–5 MT 3,984/ USD 131
5. Traffic Management (14 projects)
Traffic flow improvements (one-way reversible, bus only, HOV), adaptive signal control systems, traffic control and accident database software, enforcement programs, training
Years 1–23 MT 1,786/ USD 58
Total MT 100,134/ USD 3,283
Abbreviations: HOV = high-occupancy vehicle, ITS = intelligent transport system(s) Note: a Assumes 1 April 2013 commencement. Source: JICA Project Team E.11 Economic, Social, and Environmental Evaluation E.11.1 Economic Evaluation As stated in E.6.3, the preferred scenario carried forward for economic evaluation was Land Use Scenario C and Transport Network C. An economic analysis using discounted cash flows for costs and benefits was run through 2035, with the following results:
• Economic Internal Rate of Return (EIRR) = 11.5% • Net Present Value (NPV) at a 6% discount rate = MT 41,952 million • Net Present Value (NPV) at a 9% discount rate = MT 12,520 million • Net Present Value (NPV) at a 12% discount rate = Negative MT 1,855 million
E.11.2 Strategic Environmental Assessment Strategic Environmental Assessment (SEA) was conducted in line with the JICA Guidelines. In the Study, the SEA approach was applied in three steps. Firstly, three potential urban development vision statements were developed and they were compared in terms of their environmental and social implications. The vision with the highest score was selected as the development vision of Greater Maputo. Secondly, three alternative scenarios for transport development scenarios were developed and compared to select the one which can minimize negative impacts on the environment and society. Lastly, the potential environmental and social impacts of this master plan were identified and potential mitigation measures were also identified. The most significant impact among all will be caused by involuntary resettlement. Although the exact number of project-affected persons (PAPs) should be assessed by a more detailed study, it is estimated to exceed 2,000 households. Involuntary resettlement of this scale would require the preparation of Resettlement Action Plan (RAP) according to the JICA Environmental and Social Guidelines.
Comprehensive Urban Transport Master Plan for the Greater Maputo Executive Summary
35
E.12 Institutional Improvement and Capacity Development Successful implementation of the proposed projects and occasional updating of the master plan requires the presence of appropriate institutional arrangements and capacity/capability of the organizations and individuals involved. As part of institutional and capacity development programs, the establishment of a Greater Maputo Metropolitan Transport Agency (GMMTA) and Institute for Transport and Traffic Studies are recommended. The proposed GMMTA will mainly be a recommendatory and coordination body with some exceptions.8 All modes and aspects of transport including railway, waterborne transport, roads and road transport, bridges, and traffic management, in the Greater Maputo Metropolitan Area will be addressed by the agency. The proposed Institute for Transport and Traffic Studies can be established within an existing higher education institution. Graduates of the proposed institute would work in central/local governments, state-owned enterprises, transport operating companies, and private consulting firms. E.13 Summary: Proposed Master Plan Programs and Priority Projects The proposed Master Plan is summarized in Table 14 with the proposed projects grouped into four broad categories (called “programs” in the table). These programs are major areas where development should be undertaken in the coming twenty years, including: (i) Maputo–Matola (East-West Axis) Transport Development; (ii) North-South Axis Transport Development; (iii) Traffic Management and Related Measures in and around CBD; and (iv) Capacity/Institutional Development. Table 15 lists the priority projects, which are grouped according to the four programs mentioned above. The location of the priority road, rail, and BRT projects is illustrated in Figure 38. Note also that the project numbers indicated in the “short-term” column of Table 14 (e.g., #1, #2) correspond to the numbers of the priority projects listed in Table 15.
8 It is proposed that the Traffic Management Division should have an implementing capability to achieve standardized traffic management measures throughout the metropolitan area, and to cope with the shortage of skilled staff in local administrative bodies other than Maputo City.
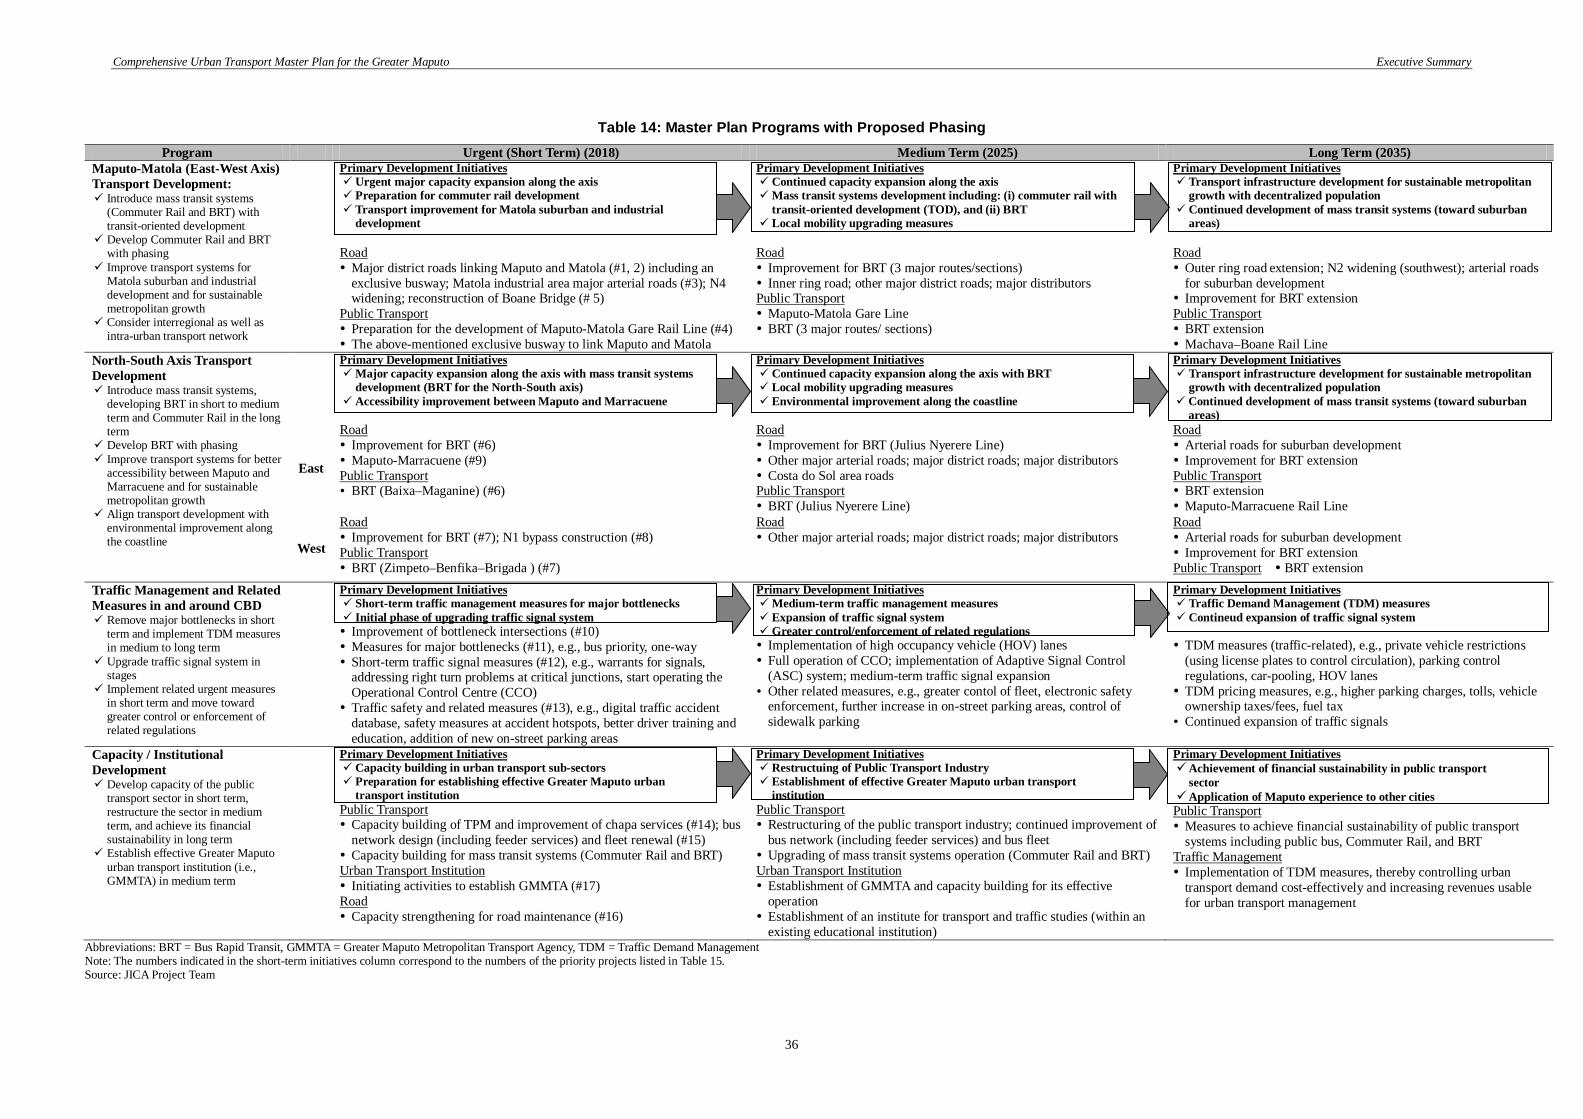
Comprehensive Urban Transport Master Plan for the Greater Maputo Executive Summary
36
Table 14: Master Plan Programs with Proposed Phasing Program Urgent (Short Term) (2018) Medium Term (2025) Long Term (2035)
Maputo-Matola (East-West Axis) Transport Development: Introduce mass transit systems
(Commuter Rail and BRT) with transit-oriented development
Develop Commuter Rail and BRT with phasing
Improve transport systems for Matola suburban and industrial development and for sustainable metropolitan growth
Consider interregional as well as intra-urban transport network
Primary Development Initiatives Urgent major capacity expansion along the axis Preparation for commuter rail development Transport improvement for Matola suburban and industrial
development Road Major district roads linking Maputo and Matola (#1, 2) including an
exclusive busway; Matola industrial area major arterial roads (#3); N4 widening; reconstruction of Boane Bridge (# 5)
Public Transport Preparation for the development of Maputo-Matola Gare Rail Line (#4) The above-mentioned exclusive busway to link Maputo and Matola
Primary Development Initiatives Continued capacity expansion along the axis Mass transit systems development including: (i) commuter rail with
transit-oriented development (TOD), and (ii) BRT Local mobility upgrading measures Road Improvement for BRT (3 major routes/sections) Inner ring road; other major district roads; major distributors Public Transport Maputo-Matola Gare Line BRT (3 major routes/ sections)
Primary Development Initiatives Transport infrastructure development for sustainable metropolitan
growth with decentralized population Continued development of mass transit systems (toward suburban
areas) Road Outer ring road extension; N2 widening (southwest); arterial roads
for suburban development Improvement for BRT extension Public Transport BRT extension Machava–Boane Rail Line
North-South Axis Transport Development Introduce mass transit systems,
developing BRT in short to medium term and Commuter Rail in the long term
Develop BRT with phasing Improve transport systems for better
accessibility between Maputo and Marracuene and for sustainable metropolitan growth
Align transport development with environmental improvement along the coastline
Primary Development Initiatives Major capacity expansion along the axis with mass transit systems
development (BRT for the North-South axis) Accessibility improvement between Maputo and Marracuene
Primary Development Initiatives Continued capacity expansion along the axis with BRT Local mobility upgrading measures Environmental improvement along the coastline
Primary Development Initiatives Transport infrastructure development for sustainable metropolitan
growth with decentralized population Continued development of mass transit systems (toward suburban
areas)
East
Road Improvement for BRT (#6) Maputo-Marracuene (#9) Public Transport BRT (Baixa–Maganine) (#6)
Road Improvement for BRT (Julius Nyerere Line) Other major arterial roads; major district roads; major distributors Costa do Sol area roads Public Transport BRT (Julius Nyerere Line)
Road Arterial roads for suburban development Improvement for BRT extension Public Transport BRT extension Maputo-Marracuene Rail Line
West
Road Improvement for BRT (#7); N1 bypass construction (#8) Public Transport BRT (Zimpeto–Benfika–Brigada ) (#7)
Road Other major arterial roads; major district roads; major distributors
Road Arterial roads for suburban development Improvement for BRT extension Public Transport BRT extension
Traffic Management and Related Measures in and around CBD Remove major bottlenecks in short
term and implement TDM measures in medium to long term
Upgrade traffic signal system in stages
Implement related urgent measures in short term and move toward greater control or enforcement of related regulations
Primary Development Initiatives Short-term traffic management measures for major bottlenecks Initial phase of upgrading traffic signal system Improvement of bottleneck intersections (#10) Measures for major bottlenecks (#11), e.g., bus priority, one-way Short-term traffic signal measures (#12), e.g., warrants for signals,
addressing right turn problems at critical junctions, start operating the Operational Control Centre (CCO) Traffic safety and related measures (#13), e.g., digital traffic accident
database, safety measures at accident hotspots, better driver training and education, addition of new on-street parking areas
Primary Development Initiatives Medium-term traffic management measures Expansion of traffic signal system Greater control/enforcement of related regulations Implementation of high occupancy vehicle (HOV) lanes Full operation of CCO; implementation of Adaptive Signal Control
(ASC) system; medium-term traffic signal expansion Other related measures, e.g., greater contol of fleet, electronic safety
enforcement, further increase in on-street parking areas, control of sidewalk parking
Primary Development Initiatives Traffic Demand Management (TDM) measures Contineud expansion of traffic signal system TDM measures (traffic-related), e.g., private vehicle restrictions
(using license plates to control circulation), parking control regulations, car-pooling, HOV lanes TDM pricing measures, e.g., higher parking charges, tolls, vehicle
ownership taxes/fees, fuel tax Continued expansion of traffic signals
Capacity / Institutional Development Develop capacity of the public
transport sector in short term, restructure the sector in medium term, and achieve its financial sustainability in long term
Establish effective Greater Maputo urban transport institution (i.e., GMMTA) in medium term
Primary Development Initiatives Capacity building in urban transport sub-sectors Preparation for establishing effective Greater Maputo urban
transport institution Public Transport Capacity building of TPM and improvement of chapa services (#14); bus
network design (including feeder services) and fleet renewal (#15) Capacity building for mass transit systems (Commuter Rail and BRT) Urban Transport Institution Initiating activities to establish GMMTA (#17) Road Capacity strengthening for road maintenance (#16)
Primary Development Initiatives Restructuing of Public Transport Industry Establishment of effective Greater Maputo urban transport
institution Public Transport Restructuring of the public transport industry; continued improvement of
bus network (including feeder services) and bus fleet Upgrading of mass transit systems operation (Commuter Rail and BRT) Urban Transport Institution Establishment of GMMTA and capacity building for its effective
operation Establishment of an institute for transport and traffic studies (within an
existing educational institution)
Primary Development Initiatives Achievement of financial sustainability in public transport
sector Application of Maputo experience to other cities Public Transport Measures to achieve financial sustainability of public transport
systems including public bus, Commuter Rail, and BRT Traffic Management Implementation of TDM measures, thereby controlling urban
transport demand cost-effectively and increasing revenues usable for urban transport management
Abbreviations: BRT = Bus Rapid Transit, GMMTA = Greater Maputo Metropolitan Transport Agency, TDM = Traffic Demand Management Note: The numbers indicated in the short-term initiatives column correspond to the numbers of the priority projects listed in Table 15. Source: JICA Project Team
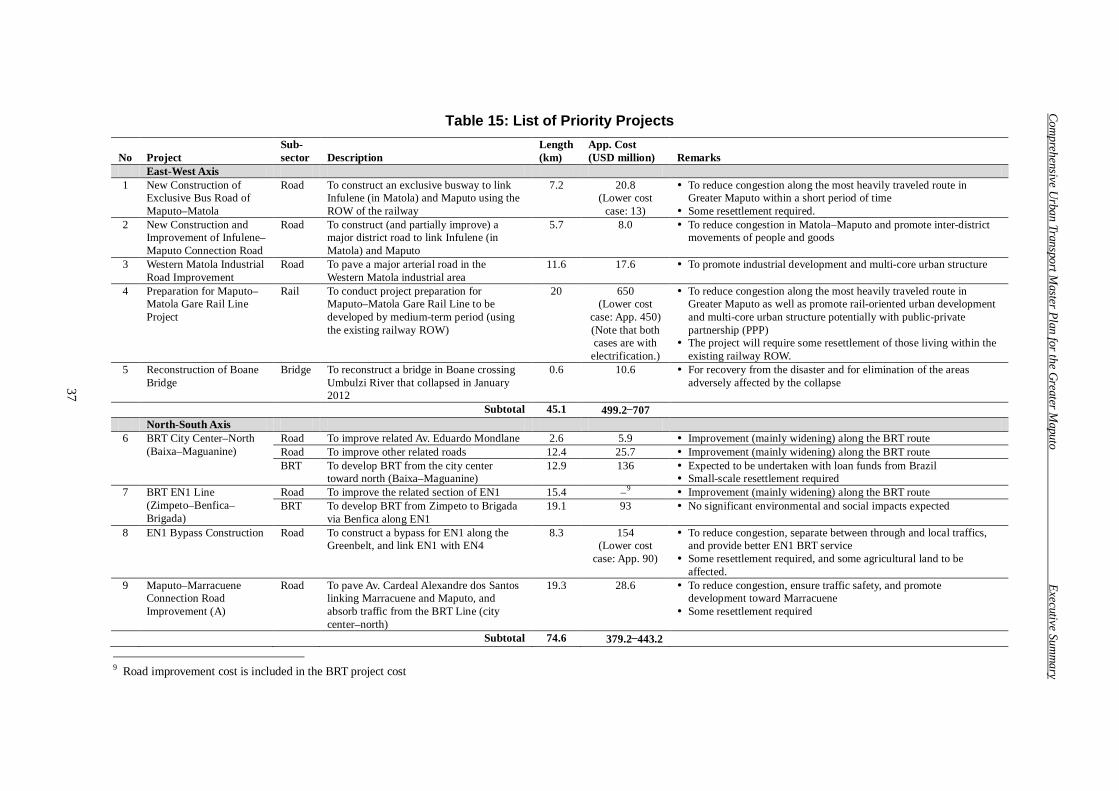
Comprehensive U
rban Transport Master Plan for the G
reater Maputo
Executive Summ
ary
37
Table 15: List of Priority Projects
No Project Sub- sector Description
Length (km)
App. Cost (USD million) Remarks
East-West Axis 1 New Construction of
Exclusive Bus Road of Maputo–Matola
Road To construct an exclusive busway to link Infulene (in Matola) and Maputo using the ROW of the railway
7.2 20.8 (Lower cost
case: 13)
To reduce congestion along the most heavily traveled route in Greater Maputo within a short period of time
Some resettlement required. 2 New Construction and
Improvement of Infulene– Maputo Connection Road
Road To construct (and partially improve) a major district road to link Infulene (in Matola) and Maputo
5.7 8.0 To reduce congestion in Matola–Maputo and promote inter-district movements of people and goods
3 Western Matola Industrial Road Improvement
Road To pave a major arterial road in the Western Matola industrial area
11.6 17.6 To promote industrial development and multi-core urban structure
4 Preparation for Maputo– Matola Gare Rail Line Project
Rail To conduct project preparation for Maputo–Matola Gare Rail Line to be developed by medium-term period (using the existing railway ROW)
20 650 (Lower cost
case: App. 450) (Note that both cases are with
electrification.)
To reduce congestion along the most heavily traveled route in Greater Maputo as well as promote rail-oriented urban development and multi-core urban structure potentially with public-private partnership (PPP)
The project will require some resettlement of those living within the existing railway ROW.
5 Reconstruction of Boane Bridge
Bridge To reconstruct a bridge in Boane crossing Umbulzi River that collapsed in January 2012
0.6 10.6 For recovery from the disaster and for elimination of the areas adversely affected by the collapse
Subtotal 45.1 499.2−707 North-South Axis
6 BRT City Center–North (Baixa–Maguanine)
Road To improve related Av. Eduardo Mondlane 2.6 5.9 Improvement (mainly widening) along the BRT route Road To improve other related roads 12.4 25.7 Improvement (mainly widening) along the BRT route BRT To develop BRT from the city center
toward north (Baixa–Maguanine) 12.9 136 Expected to be undertaken with loan funds from Brazil
Small-scale resettlement required 7 BRT EN1 Line
(Zimpeto–Benfica–Brigada)
Road To improve the related section of EN1 15.4 –9 Improvement (mainly widening) along the BRT route BRT To develop BRT from Zimpeto to Brigada
via Benfica along EN1 19.1 93 No significant environmental and social impacts expected
8 EN1 Bypass Construction Road To construct a bypass for EN1 along the Greenbelt, and link EN1 with EN4
8.3 154 (Lower cost
case: App. 90)
To reduce congestion, separate between through and local traffics, and provide better EN1 BRT service
Some resettlement required, and some agricultural land to be affected.
9 Maputo–Marracuene Connection Road Improvement (A)
Road To pave Av. Cardeal Alexandre dos Santos linking Marracuene and Maputo, and absorb traffic from the BRT Line (city center–north)
19.3 28.6 To reduce congestion, ensure traffic safety, and promote development toward Marracuene
Some resettlement required
Subtotal 74.6 379.2−443.2
9 Road improvement cost is included in the BRT project cost
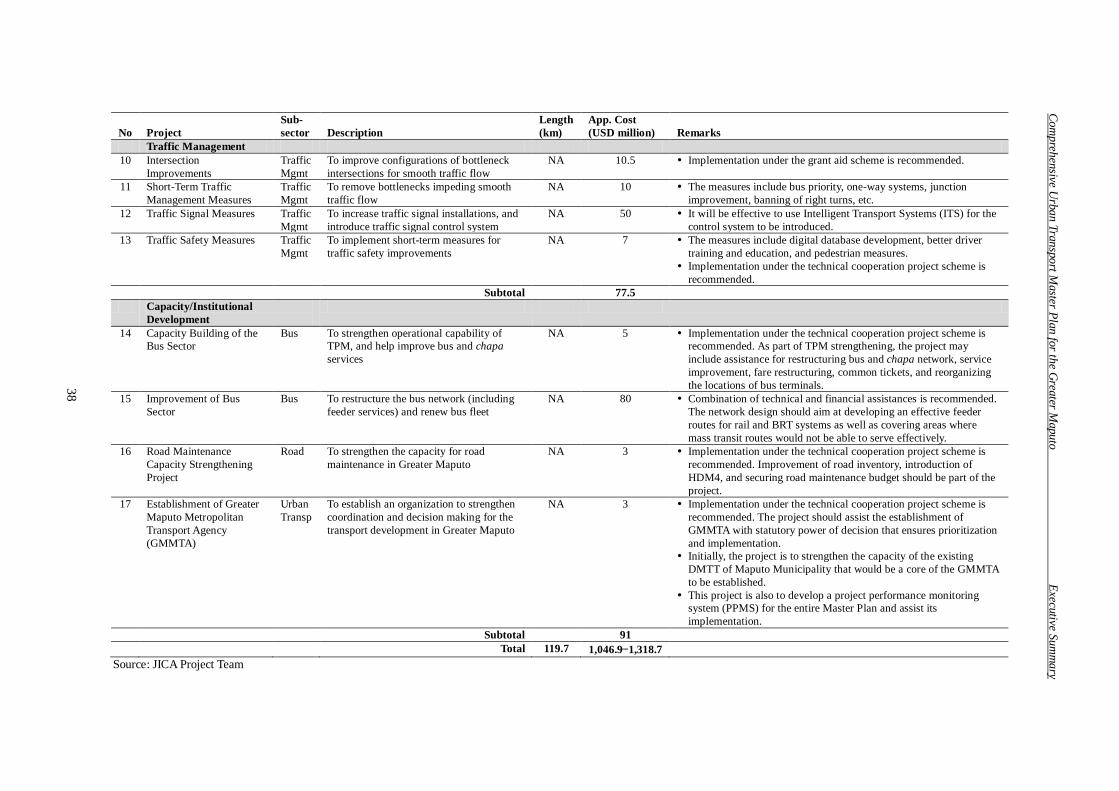
Comprehensive U
rban Transport Master Plan for the G
reater Maputo
Executive Summ
ary
38
No Project Sub- sector Description
Length (km)
App. Cost (USD million) Remarks
Traffic Management 10 Intersection
Improvements Traffic Mgmt
To improve configurations of bottleneck intersections for smooth traffic flow
NA 10.5 Implementation under the grant aid scheme is recommended.
11 Short-Term Traffic Management Measures
Traffic Mgmt
To remove bottlenecks impeding smooth traffic flow
NA 10 The measures include bus priority, one-way systems, junction improvement, banning of right turns, etc.
12 Traffic Signal Measures Traffic Mgmt
To increase traffic signal installations, and introduce traffic signal control system
NA 50 It will be effective to use Intelligent Transport Systems (ITS) for the control system to be introduced.
13 Traffic Safety Measures Traffic Mgmt
To implement short-term measures for traffic safety improvements
NA 7 The measures include digital database development, better driver training and education, and pedestrian measures.
Implementation under the technical cooperation project scheme is recommended.
Subtotal 77.5 Capacity/Institutional
Development
14 Capacity Building of the Bus Sector
Bus To strengthen operational capability of TPM, and help improve bus and chapa services
NA 5 Implementation under the technical cooperation project scheme is recommended. As part of TPM strengthening, the project may include assistance for restructuring bus and chapa network, service improvement, fare restructuring, common tickets, and reorganizing the locations of bus terminals.
15 Improvement of Bus Sector
Bus To restructure the bus network (including feeder services) and renew bus fleet
NA 80 Combination of technical and financial assistances is recommended. The network design should aim at developing an effective feeder routes for rail and BRT systems as well as covering areas where mass transit routes would not be able to serve effectively.
16 Road Maintenance Capacity Strengthening Project
Road To strengthen the capacity for road maintenance in Greater Maputo
NA 3 Implementation under the technical cooperation project scheme is recommended. Improvement of road inventory, introduction of HDM4, and securing road maintenance budget should be part of the project.
17 Establishment of Greater Maputo Metropolitan Transport Agency (GMMTA)
Urban Transp
To establish an organization to strengthen coordination and decision making for the transport development in Greater Maputo
NA 3 Implementation under the technical cooperation project scheme is recommended. The project should assist the establishment of GMMTA with statutory power of decision that ensures prioritization and implementation.
Initially, the project is to strengthen the capacity of the existing DMTT of Maputo Municipality that would be a core of the GMMTA to be established.
This project is also to develop a project performance monitoring system (PPMS) for the entire Master Plan and assist its implementation.
Subtotal 91 Total 119.7 1,046.9−1,318.7
Source: JICA Project Team
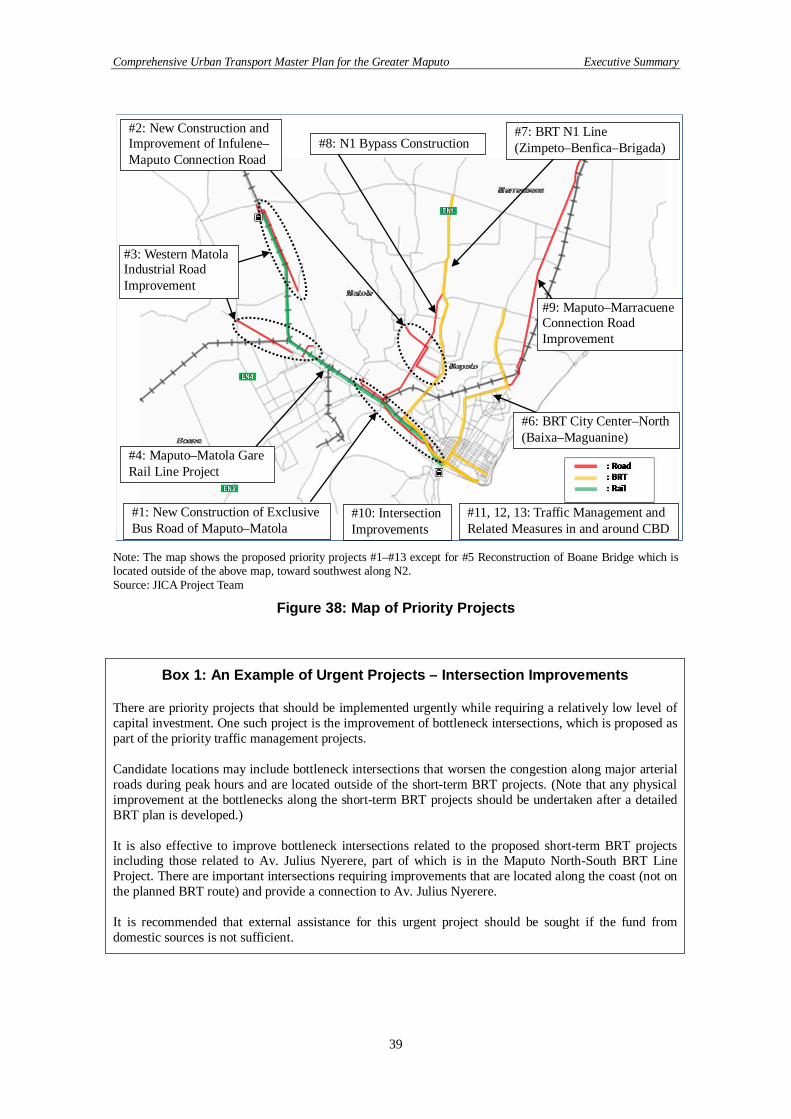
Comprehensive Urban Transport Master Plan for the Greater Maputo Executive Summary
39
Note: The map shows the proposed priority projects #1–#13 except for #5 Reconstruction of Boane Bridge which is located outside of the above map, toward southwest along N2. Source: JICA Project Team
Figure 38: Map of Priority Projects
Box 1: An Example of Urgent Projects – Intersection Improvements There are priority projects that should be implemented urgently while requiring a relatively low level of capital investment. One such project is the improvement of bottleneck intersections, which is proposed as part of the priority traffic management projects. Candidate locations may include bottleneck intersections that worsen the congestion along major arterial roads during peak hours and are located outside of the short-term BRT projects. (Note that any physical improvement at the bottlenecks along the short-term BRT projects should be undertaken after a detailed BRT plan is developed.) It is also effective to improve bottleneck intersections related to the proposed short-term BRT projects including those related to Av. Julius Nyerere, part of which is in the Maputo North-South BRT Line Project. There are important intersections requiring improvements that are located along the coast (not on the planned BRT route) and provide a connection to Av. Julius Nyerere. It is recommended that external assistance for this urgent project should be sought if the fund from domestic sources is not sufficient.
#9: Maputo–Marracuene Connection Road Improvement
#6: BRT City Center–North (Baixa–Maguanine)
#7: BRT N1 Line (Zimpeto–Benfica–Brigada)
#4: Maputo–Matola Gare Rail Line Project
#1: New Construction of Exclusive Bus Road of Maputo–Matola
#2: New Construction and Improvement of Infulene–Maputo Connection Road
#8: N1 Bypass Construction
#11, 12, 13: Traffic Management and Related Measures in and around CBD
#3: Western Matola Industrial Road Improvement
#10: Intersection Improvements
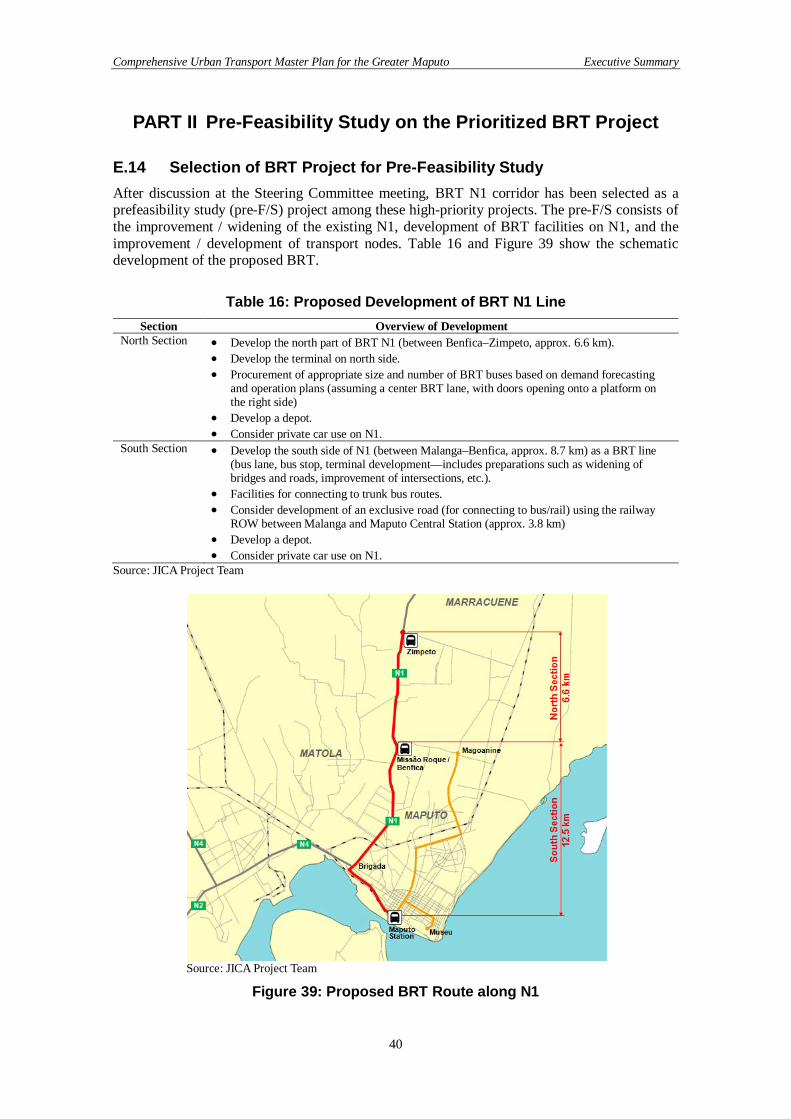
Comprehensive Urban Transport Master Plan for the Greater Maputo Executive Summary
40
PART II Pre-Feasibility Study on the Prioritized BRT Project E.14 Selection of BRT Project for Pre-Feasibility Study After discussion at the Steering Committee meeting, BRT N1 corridor has been selected as a prefeasibility study (pre-F/S) project among these high-priority projects. The pre-F/S consists of the improvement / widening of the existing N1, development of BRT facilities on N1, and the improvement / development of transport nodes. Table 16 and Figure 39 show the schematic development of the proposed BRT.
Table 16: Proposed Development of BRT N1 Line Section Overview of Development
North Section
• Develop the north part of BRT N1 (between Benfica–Zimpeto, approx. 6.6 km). • Develop the terminal on north side. • Procurement of appropriate size and number of BRT buses based on demand forecasting
and operation plans (assuming a center BRT lane, with doors opening onto a platform on the right side)
• Develop a depot. • Consider private car use on N1.
South Section
• Develop the south side of N1 (between Malanga–Benfica, approx. 8.7 km) as a BRT line (bus lane, bus stop, terminal development—includes preparations such as widening of bridges and roads, improvement of intersections, etc.).
• Facilities for connecting to trunk bus routes. • Consider development of an exclusive road (for connecting to bus/rail) using the railway
ROW between Malanga and Maputo Central Station (approx. 3.8 km) • Develop a depot. • Consider private car use on N1.
Source: JICA Project Team
Source: JICA Project Team
Figure 39: Proposed BRT Route along N1
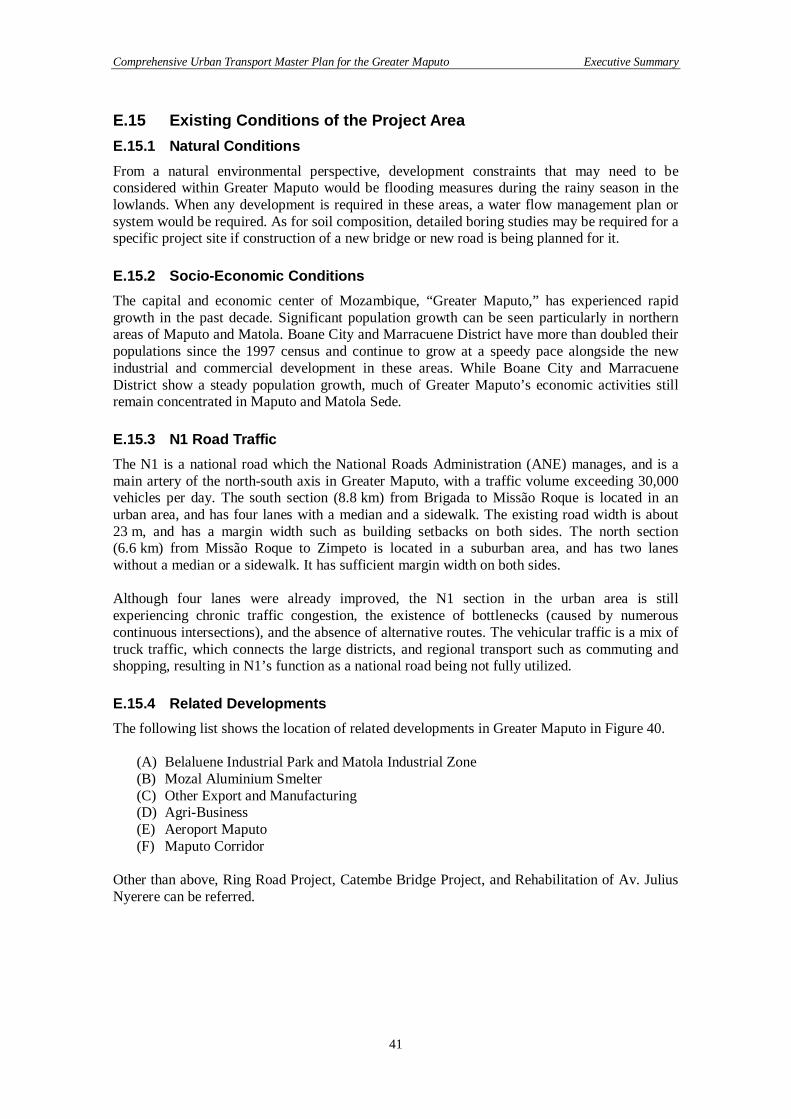
Comprehensive Urban Transport Master Plan for the Greater Maputo Executive Summary
41
E.15 Existing Conditions of the Project Area E.15.1 Natural Conditions From a natural environmental perspective, development constraints that may need to be considered within Greater Maputo would be flooding measures during the rainy season in the lowlands. When any development is required in these areas, a water flow management plan or system would be required. As for soil composition, detailed boring studies may be required for a specific project site if construction of a new bridge or new road is being planned for it. E.15.2 Socio-Economic Conditions The capital and economic center of Mozambique, “Greater Maputo,” has experienced rapid growth in the past decade. Significant population growth can be seen particularly in northern areas of Maputo and Matola. Boane City and Marracuene District have more than doubled their populations since the 1997 census and continue to grow at a speedy pace alongside the new industrial and commercial development in these areas. While Boane City and Marracuene District show a steady population growth, much of Greater Maputo’s economic activities still remain concentrated in Maputo and Matola Sede. E.15.3 N1 Road Traffic The N1 is a national road which the National Roads Administration (ANE) manages, and is a main artery of the north-south axis in Greater Maputo, with a traffic volume exceeding 30,000 vehicles per day. The south section (8.8 km) from Brigada to Missão Roque is located in an urban area, and has four lanes with a median and a sidewalk. The existing road width is about 23 m, and has a margin width such as building setbacks on both sides. The north section (6.6 km) from Missão Roque to Zimpeto is located in a suburban area, and has two lanes without a median or a sidewalk. It has sufficient margin width on both sides. Although four lanes were already improved, the N1 section in the urban area is still experiencing chronic traffic congestion, the existence of bottlenecks (caused by numerous continuous intersections), and the absence of alternative routes. The vehicular traffic is a mix of truck traffic, which connects the large districts, and regional transport such as commuting and shopping, resulting in N1’s function as a national road being not fully utilized. E.15.4 Related Developments The following list shows the location of related developments in Greater Maputo in Figure 40.
(A) Belaluene Industrial Park and Matola Industrial Zone (B) Mozal Aluminium Smelter (C) Other Export and Manufacturing (D) Agri-Business (E) Aeroport Maputo (F) Maputo Corridor
Other than above, Ring Road Project, Catembe Bridge Project, and Rehabilitation of Av. Julius Nyerere can be referred.
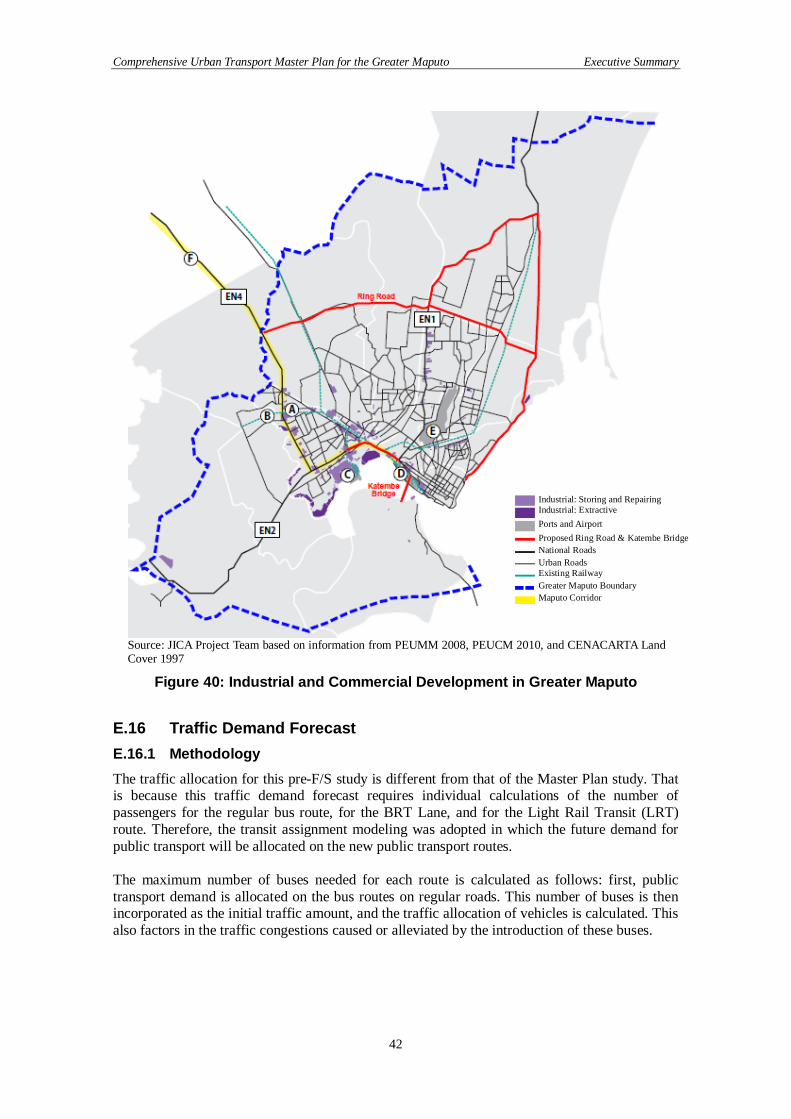
Comprehensive Urban Transport Master Plan for the Greater Maputo Executive Summary
42
Source: JICA Project Team based on information from PEUMM 2008, PEUCM 2010, and CENACARTA Land Cover 1997
Figure 40: Industrial and Commercial Development in Greater Maputo E.16 Traffic Demand Forecast E.16.1 Methodology The traffic allocation for this pre-F/S study is different from that of the Master Plan study. That is because this traffic demand forecast requires individual calculations of the number of passengers for the regular bus route, for the BRT Lane, and for the Light Rail Transit (LRT) route. Therefore, the transit assignment modeling was adopted in which the future demand for public transport will be allocated on the new public transport routes. The maximum number of buses needed for each route is calculated as follows: first, public transport demand is allocated on the bus routes on regular roads. This number of buses is then incorporated as the initial traffic amount, and the traffic allocation of vehicles is calculated. This also factors in the traffic congestions caused or alleviated by the introduction of these buses.
Industrial: Storing and Repairing Industrial: Extractive Ports and Airport Proposed Ring Road & Katembe Bridge National Roads Urban Roads Existing Railway Greater Maputo Boundary Maputo Corridor
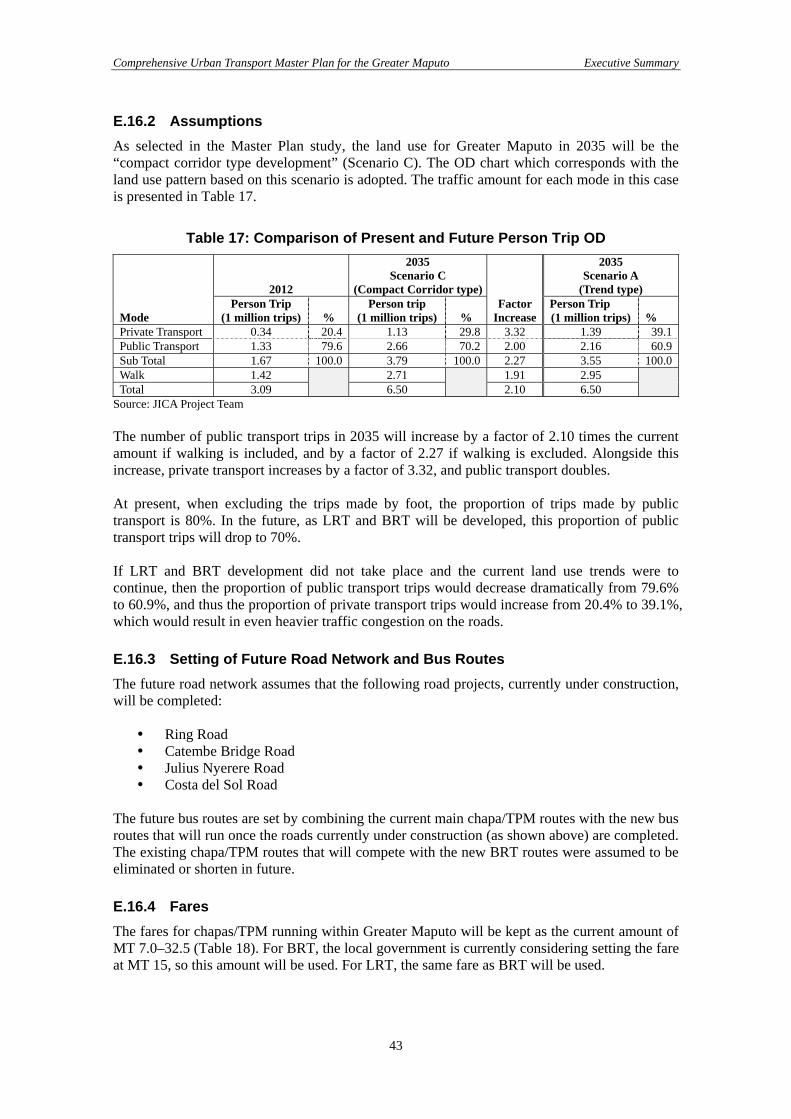
Comprehensive Urban Transport Master Plan for the Greater Maputo Executive Summary
43
E.16.2 Assumptions As selected in the Master Plan study, the land use for Greater Maputo in 2035 will be the “compact corridor type development” (Scenario C). The OD chart which corresponds with the land use pattern based on this scenario is adopted. The traffic amount for each mode in this case is presented in Table 17.
Table 17: Comparison of Present and Future Person Trip OD
Mode
2012
2035 Scenario C
(Compact Corridor type)Factor
Increase
2035 Scenario A
(Trend type) Person Trip
(1 million trips) % Person trip
(1 million trips) % Person Trip (1 million trips) %
Private Transport 0.34 20.4 1.13 29.8 3.32 1.39 39.1Public Transport 1.33 79.6 2.66 70.2 2.00 2.16 60.9Sub Total 1.67 100.0 3.79 100.0 2.27 3.55 100.0Walk 1.42 2.71 1.91 2.95 Total 3.09 6.50 2.10 6.50
Source: JICA Project Team The number of public transport trips in 2035 will increase by a factor of 2.10 times the current amount if walking is included, and by a factor of 2.27 if walking is excluded. Alongside this increase, private transport increases by a factor of 3.32, and public transport doubles. At present, when excluding the trips made by foot, the proportion of trips made by public transport is 80%. In the future, as LRT and BRT will be developed, this proportion of public transport trips will drop to 70%. If LRT and BRT development did not take place and the current land use trends were to continue, then the proportion of public transport trips would decrease dramatically from 79.6% to 60.9%, and thus the proportion of private transport trips would increase from 20.4% to 39.1%, which would result in even heavier traffic congestion on the roads. E.16.3 Setting of Future Road Network and Bus Routes The future road network assumes that the following road projects, currently under construction, will be completed:
Ring Road Catembe Bridge Road Julius Nyerere Road Costa del Sol Road
The future bus routes are set by combining the current main chapa/TPM routes with the new bus routes that will run once the roads currently under construction (as shown above) are completed. The existing chapa/TPM routes that will compete with the new BRT routes were assumed to be eliminated or shorten in future. E.16.4 Fares The fares for chapas/TPM running within Greater Maputo will be kept as the current amount of MT 7.0–32.5 (Table 18). For BRT, the local government is currently considering setting the fare at MT 15, so this amount will be used. For LRT, the same fare as BRT will be used.
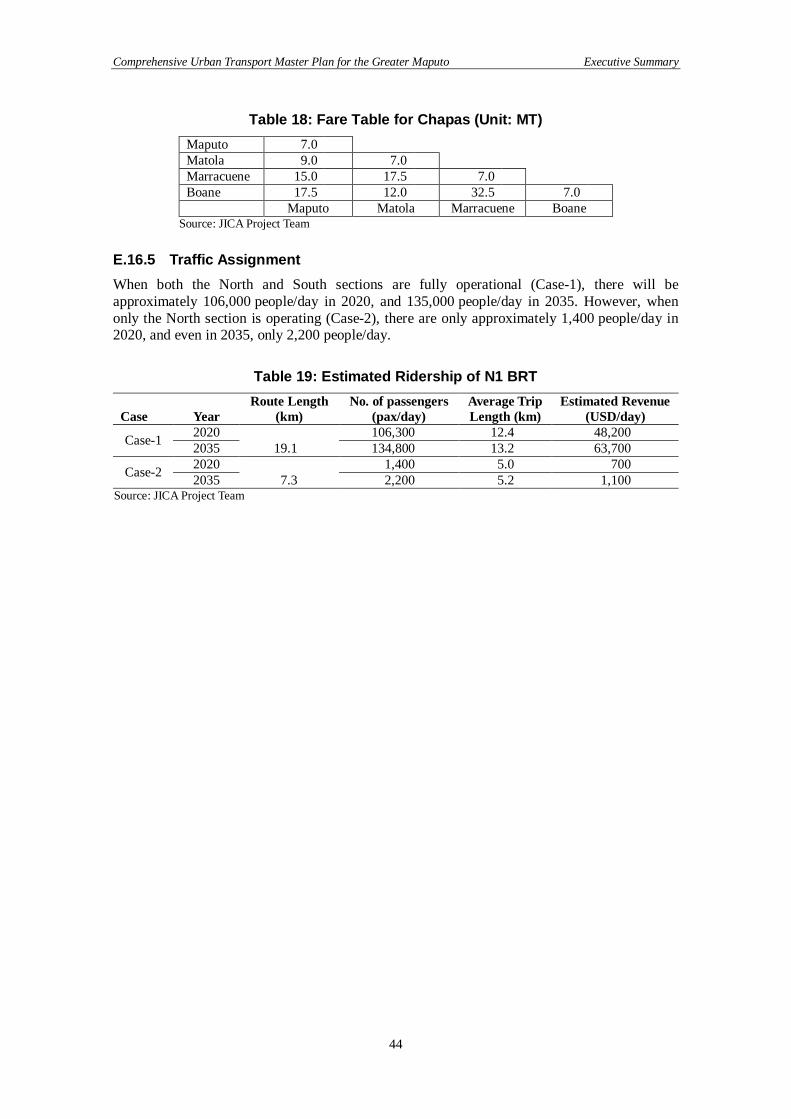
Comprehensive Urban Transport Master Plan for the Greater Maputo Executive Summary
44
Table 18: Fare Table for Chapas (Unit: MT) Maputo 7.0 Matola 9.0 7.0 Marracuene 15.0 17.5 7.0 Boane 17.5 12.0 32.5 7.0 Maputo Matola Marracuene Boane
Source: JICA Project Team E.16.5 Traffic Assignment When both the North and South sections are fully operational (Case-1), there will be approximately 106,000 people/day in 2020, and 135,000 people/day in 2035. However, when only the North section is operating (Case-2), there are only approximately 1,400 people/day in 2020, and even in 2035, only 2,200 people/day.
Table 19: Estimated Ridership of N1 BRT
Case Year Route Length
(km) No. of passengers
(pax/day) Average Trip Length (km)
Estimated Revenue (USD/day)
Case-1 2020 19.1
106,300 12.4 48,200 2035 134,800 13.2 63,700
Case-2 2020 7.3
1,400 5.0 700 2035 2,200 5.2 1,100
Source: JICA Project Team
Comprehensive Urban Transport Master Plan for the Greater Maputo Executive Summary
45
(Case-1 in 2020) (Case-1 in 2035) Source: JICA Project Team
Figure 41: Number of Passengers on BRT by Section (Case-1)
(Unit: 000pax/day) (Unit: 000pax/day)

Comprehensive Urban Transport Master Plan for the Greater Maputo Executive Summary
46
E.17 Alternative Plans E.17.1 Proposed Route for BRT N1 Line The proposed BRT N1 route starts from the Brigada intersection with N4, then runs northward along N1, goes through Missão Roque, and ends at Zimpeto. The proposed BRT N1 route is depicted in Figure 42.
Source: JICA Project Team
Figure 42: BRT N1 Route E.17.2 Assessment of the Alternative Route The N1 Line should be connected to the Maputo central urban area via a smooth transportation network for an effective BRT. Alternatives were proposed, including the abovementioned route option, considering the safety, convenience, and efficiency of operation.
Table 20: Proposed Alternative Routes as Maputo Station Access Alternative 1
Railway Side Route Alternative 2 24 Julho Route
Alternative 32)
Airport South Route
Length1): 19.1 km Length: 18.9 km (19.9 km) Length: 14.5 km (19.1 km)
Note 1): “Length” indicates the distance from Zimpeto to Maputo Central Station (Alternative 1) and to Brazil-assisted BRT line (Alternative 2 and 3), being equivalent to the distance of red lines. Distance in parentheses expresses the total BRT distance from Zimpeto to Maputo Central Station via each route. Note 2): Alternative 3 is a low cost option considered in Technical Report F: Public Transport Improvement. Source: JICA Project Team
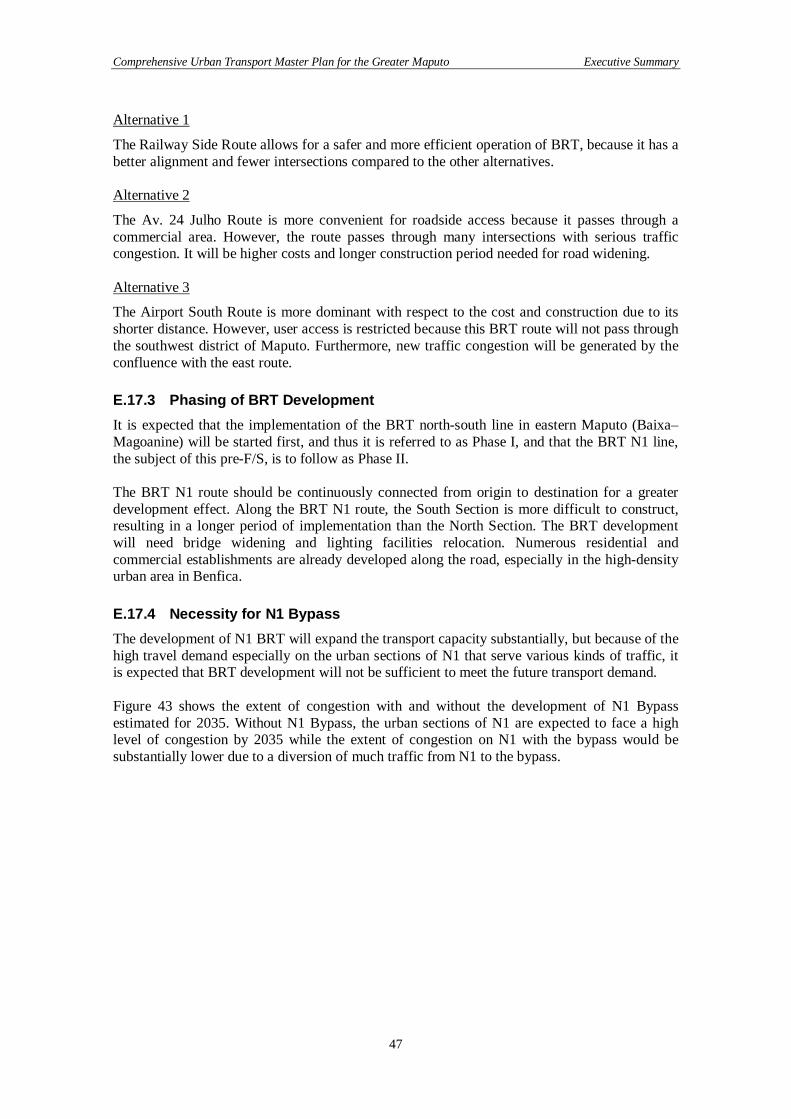
Comprehensive Urban Transport Master Plan for the Greater Maputo Executive Summary
47
Alternative 1
The Railway Side Route allows for a safer and more efficient operation of BRT, because it has a better alignment and fewer intersections compared to the other alternatives. Alternative 2
The Av. 24 Julho Route is more convenient for roadside access because it passes through a commercial area. However, the route passes through many intersections with serious traffic congestion. It will be higher costs and longer construction period needed for road widening. Alternative 3
The Airport South Route is more dominant with respect to the cost and construction due to its shorter distance. However, user access is restricted because this BRT route will not pass through the southwest district of Maputo. Furthermore, new traffic congestion will be generated by the confluence with the east route. E.17.3 Phasing of BRT Development It is expected that the implementation of the BRT north-south line in eastern Maputo (Baixa–Magoanine) will be started first, and thus it is referred to as Phase I, and that the BRT N1 line, the subject of this pre-F/S, is to follow as Phase II. The BRT N1 route should be continuously connected from origin to destination for a greater development effect. Along the BRT N1 route, the South Section is more difficult to construct, resulting in a longer period of implementation than the North Section. The BRT development will need bridge widening and lighting facilities relocation. Numerous residential and commercial establishments are already developed along the road, especially in the high-density urban area in Benfica. E.17.4 Necessity for N1 Bypass The development of N1 BRT will expand the transport capacity substantially, but because of the high travel demand especially on the urban sections of N1 that serve various kinds of traffic, it is expected that BRT development will not be sufficient to meet the future transport demand. Figure 43 shows the extent of congestion with and without the development of N1 Bypass estimated for 2035. Without N1 Bypass, the urban sections of N1 are expected to face a high level of congestion by 2035 while the extent of congestion on N1 with the bypass would be substantially lower due to a diversion of much traffic from N1 to the bypass.
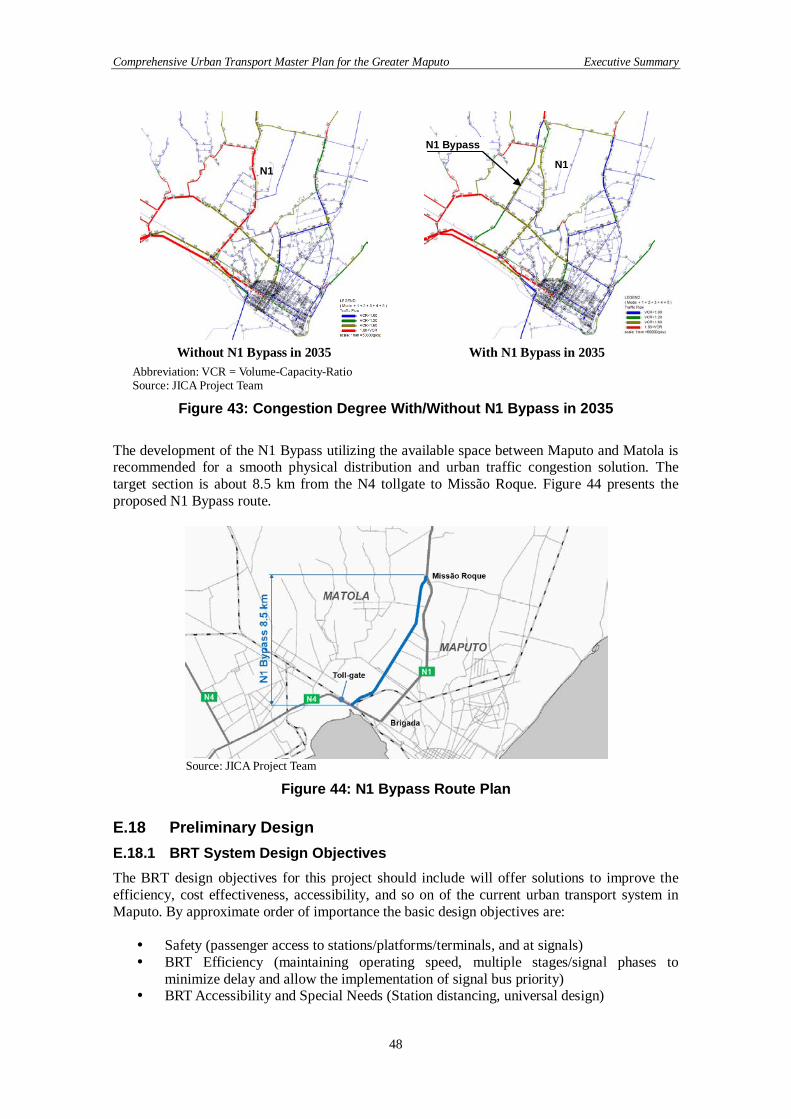
Comprehensive Urban Transport Master Plan for the Greater Maputo Executive Summary
48
Without N1 Bypass in 2035 With N1 Bypass in 2035
Abbreviation: VCR = Volume-Capacity-Ratio Source: JICA Project Team
Figure 43: Congestion Degree With/Without N1 Bypass in 2035 The development of the N1 Bypass utilizing the available space between Maputo and Matola is recommended for a smooth physical distribution and urban traffic congestion solution. The target section is about 8.5 km from the N4 tollgate to Missão Roque. Figure 44 presents the proposed N1 Bypass route.
Source: JICA Project Team
Figure 44: N1 Bypass Route Plan E.18 Preliminary Design E.18.1 BRT System Design Objectives The BRT design objectives for this project should include will offer solutions to improve the efficiency, cost effectiveness, accessibility, and so on of the current urban transport system in Maputo. By approximate order of importance the basic design objectives are: Safety (passenger access to stations/platforms/terminals, and at signals) BRT Efficiency (maintaining operating speed, multiple stages/signal phases to
minimize delay and allow the implementation of signal bus priority) BRT Accessibility and Special Needs (Station distancing, universal design)
N1 Bypass
N1 N1
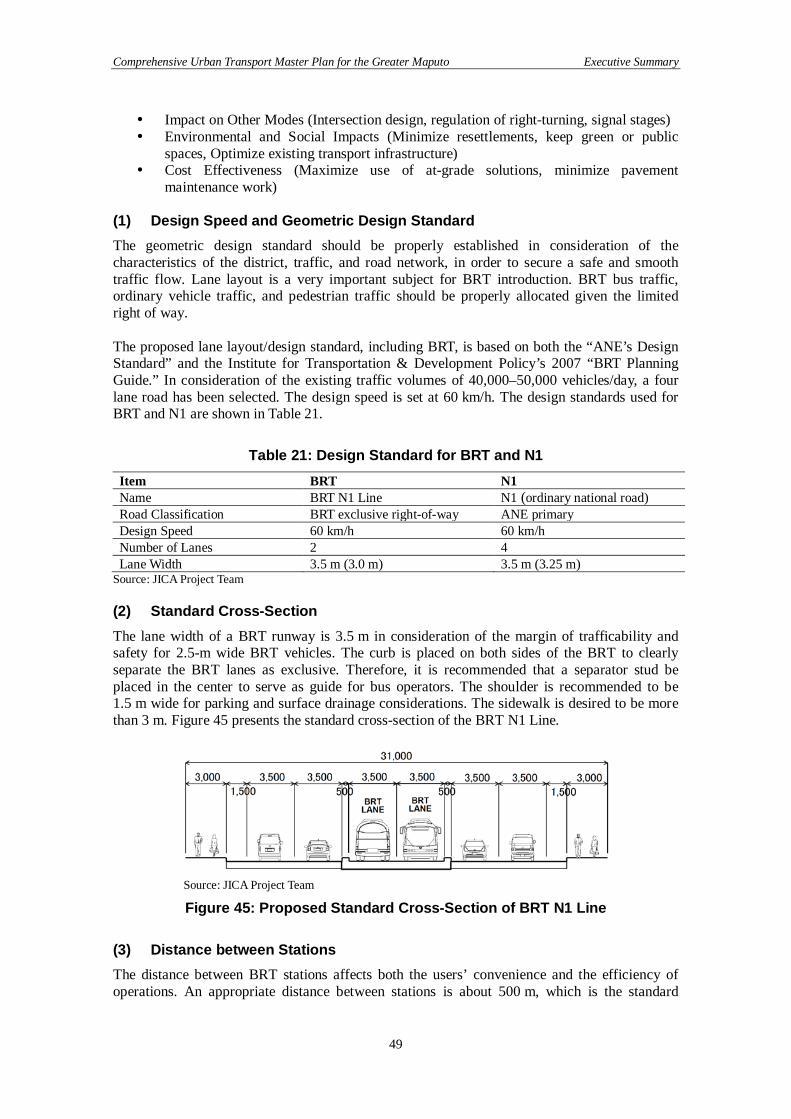
Comprehensive Urban Transport Master Plan for the Greater Maputo Executive Summary
49
Impact on Other Modes (Intersection design, regulation of right-turning, signal stages) Environmental and Social Impacts (Minimize resettlements, keep green or public
spaces, Optimize existing transport infrastructure) Cost Effectiveness (Maximize use of at-grade solutions, minimize pavement
maintenance work) (1) Design Speed and Geometric Design Standard The geometric design standard should be properly established in consideration of the characteristics of the district, traffic, and road network, in order to secure a safe and smooth traffic flow. Lane layout is a very important subject for BRT introduction. BRT bus traffic, ordinary vehicle traffic, and pedestrian traffic should be properly allocated given the limited right of way. The proposed lane layout/design standard, including BRT, is based on both the “ANE’s Design Standard” and the Institute for Transportation & Development Policy’s 2007 “BRT Planning Guide.” In consideration of the existing traffic volumes of 40,000–50,000 vehicles/day, a four lane road has been selected. The design speed is set at 60 km/h. The design standards used for BRT and N1 are shown in Table 21.
Table 21: Design Standard for BRT and N1 Item BRT N1 Name BRT N1 Line N1 (ordinary national road) Road Classification BRT exclusive right-of-way ANE primary Design Speed 60 km/h 60 km/h Number of Lanes 2 4 Lane Width 3.5 m (3.0 m) 3.5 m (3.25 m)
Source: JICA Project Team (2) Standard Cross-Section The lane width of a BRT runway is 3.5 m in consideration of the margin of trafficability and safety for 2.5-m wide BRT vehicles. The curb is placed on both sides of the BRT to clearly separate the BRT lanes as exclusive. Therefore, it is recommended that a separator stud be placed in the center to serve as guide for bus operators. The shoulder is recommended to be 1.5 m wide for parking and surface drainage considerations. The sidewalk is desired to be more than 3 m. Figure 45 presents the standard cross-section of the BRT N1 Line.
Source: JICA Project Team
Figure 45: Proposed Standard Cross-Section of BRT N1 Line (3) Distance between Stations The distance between BRT stations affects both the users’ convenience and the efficiency of operations. An appropriate distance between stations is about 500 m, which is the standard
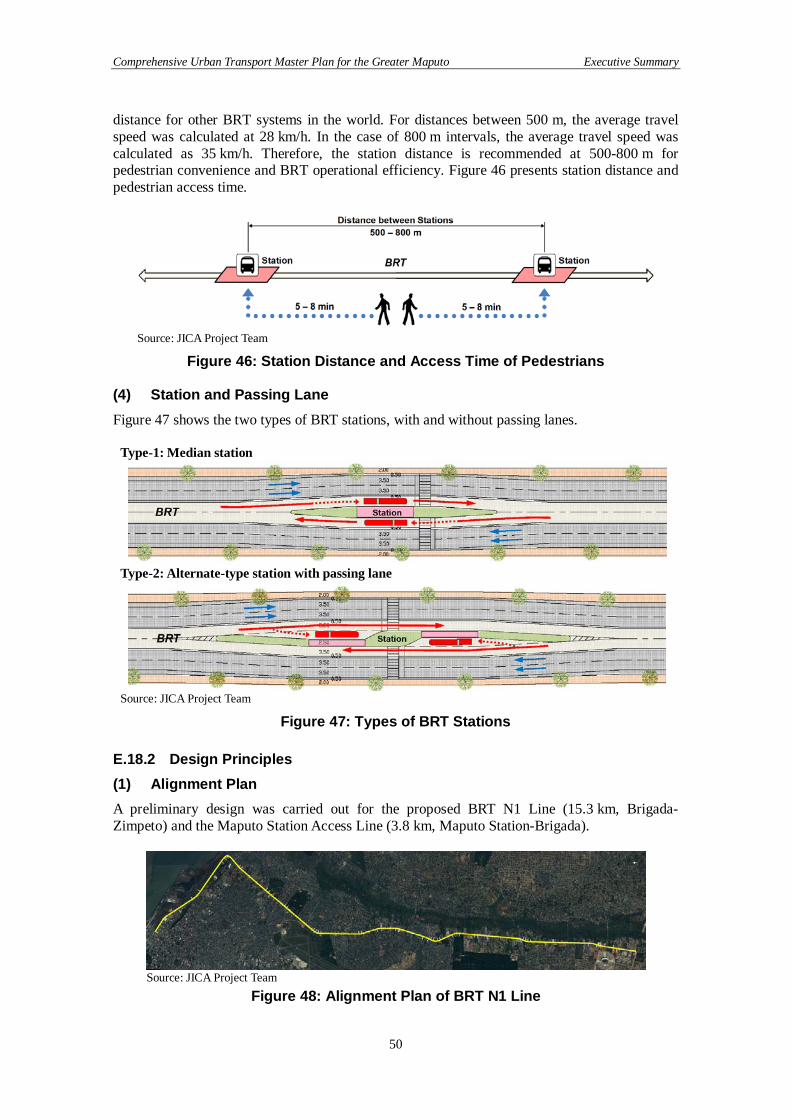
Comprehensive Urban Transport Master Plan for the Greater Maputo Executive Summary
50
distance for other BRT systems in the world. For distances between 500 m, the average travel speed was calculated at 28 km/h. In the case of 800 m intervals, the average travel speed was calculated as 35 km/h. Therefore, the station distance is recommended at 500-800 m for pedestrian convenience and BRT operational efficiency. Figure 46 presents station distance and pedestrian access time.
Source: JICA Project Team
Figure 46: Station Distance and Access Time of Pedestrians (4) Station and Passing Lane Figure 47 shows the two types of BRT stations, with and without passing lanes.
Type-1: Median station
Type-2: Alternate-type station with passing lane
Source: JICA Project Team
Figure 47: Types of BRT Stations E.18.2 Design Principles (1) Alignment Plan A preliminary design was carried out for the proposed BRT N1 Line (15.3 km, Brigada-Zimpeto) and the Maputo Station Access Line (3.8 km, Maputo Station-Brigada).
Source: JICA Project Team
Figure 48: Alignment Plan of BRT N1 Line
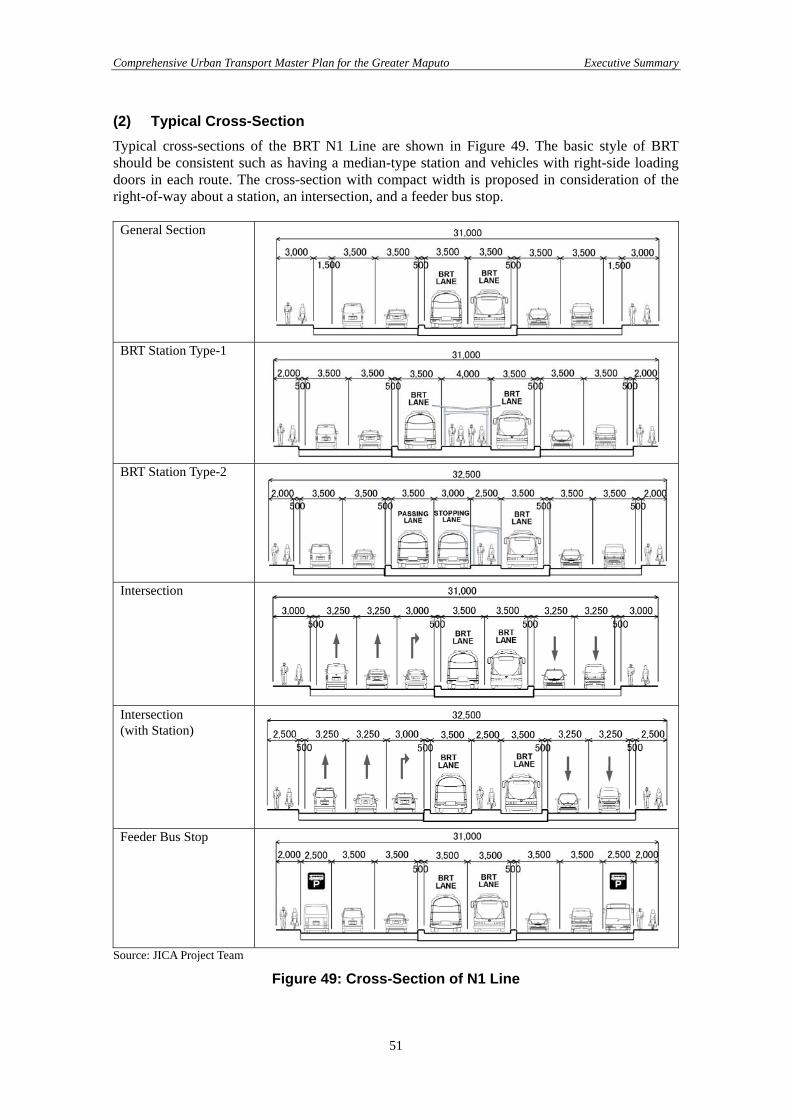
Comprehensive Urban Transport Master Plan for the Greater Maputo Executive Summary
51
(2) Typical Cross-Section Typical cross-sections of the BRT N1 Line are shown in Figure 49. The basic style of BRT should be consistent such as having a median-type station and vehicles with right-side loading doors in each route. The cross-section with compact width is proposed in consideration of the right-of-way about a station, an intersection, and a feeder bus stop.
General Section
BRT Station Type-1
BRT Station Type-2
Intersection
Intersection (with Station)
Feeder Bus Stop
Source: JICA Project Team
Figure 49: Cross-Section of N1 Line

Comprehensive Urban Transport Master Plan for the Greater Maputo Executive Summary
52
(3) Cross Intersection At intersections where BRT lanes cross, right-turning lanes should be excluded or not allowed as much as possible for safety and operational efficiency. Right-turning vehicles can reach their destination by going through neighborhood streets as a substitute. Figure 50 presents the standard intersections including BRT with regulation of right turn traffic.
Cross Intersection
Source: JICA Project Team
Figure 50: Standard Intersection Design Including BRT, allocating Bus Station on Both Sides at the Cross Intersection
(4) Bridge Widening Design The south section of the BRT N1 Line has an overpass which crosses the railway line going to Marracuene. The existing bridge has a record indicating that it was previously widened from two lanes to four lanes. However, as it does not have any additional margin available, bridge widening is necessary for BRT development. Although widening was considered for both sides, the bridge has unsuitable horizontal alignment, because of bends in both directions. Therefore, a single-sided widening plan, on the bridge’s west side, is proposed in consideration of the alignment issues and ease of construction.
Source: JICA Project Team
Figure 51: Cross-Section for Bridge Widening
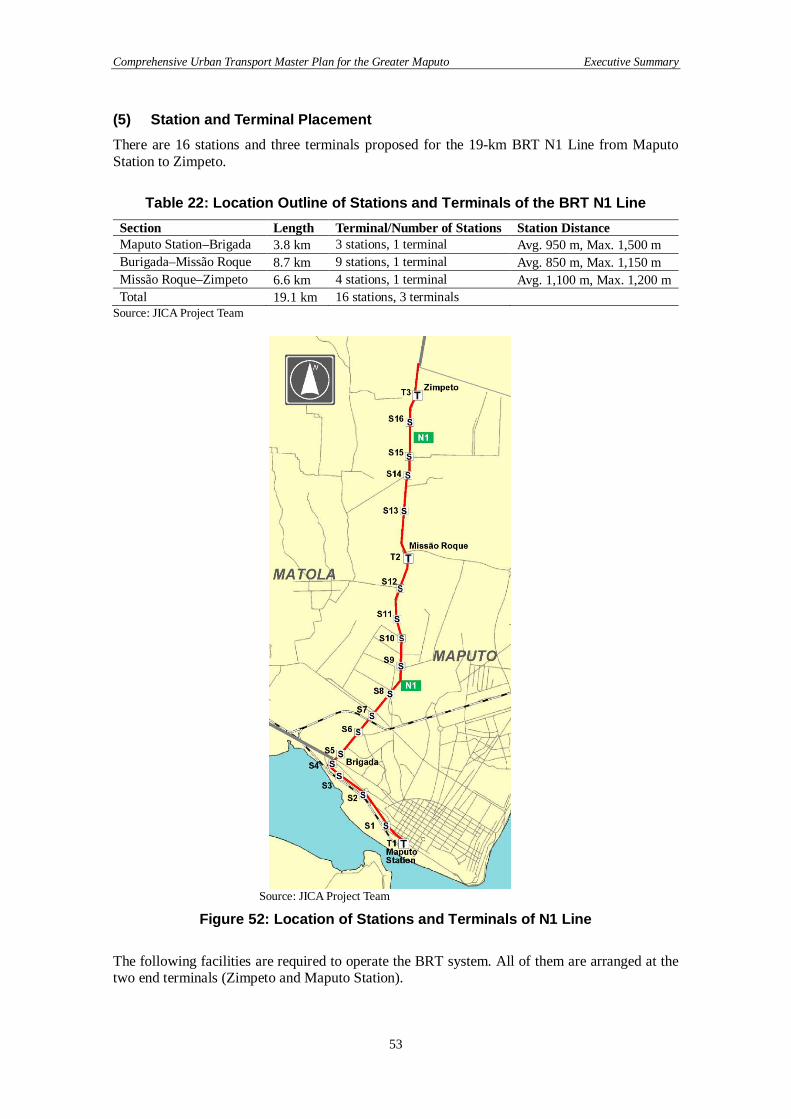
Comprehensive Urban Transport Master Plan for the Greater Maputo Executive Summary
53
(5) Station and Terminal Placement There are 16 stations and three terminals proposed for the 19-km BRT N1 Line from Maputo Station to Zimpeto.
Table 22: Location Outline of Stations and Terminals of the BRT N1 Line Section Length Terminal/Number of Stations Station Distance Maputo Station–Brigada 3.8 km 3 stations, 1 terminal Avg. 950 m, Max. 1,500 m Burigada–Missão Roque 8.7 km 9 stations, 1 terminal Avg. 850 m, Max. 1,150 m Missão Roque–Zimpeto 6.6 km 4 stations, 1 terminal Avg. 1,100 m, Max. 1,200 m Total 19.1 km 16 stations, 3 terminals
Source: JICA Project Team
Source: JICA Project Team
Figure 52: Location of Stations and Terminals of N1 Line The following facilities are required to operate the BRT system. All of them are arranged at the two end terminals (Zimpeto and Maputo Station).
Comprehensive Urban Transport Master Plan for the Greater Maputo Executive Summary
54
Repair & maintenance Car wash Petrol station Parking spaces Office (including ticket office) Waiting room/space Other facilities as necessary
Zimpeto Terminal (T3) has the largest area among three terminals because of the main depot. Missão Roque Terminal (T2) is a transfer terminal, and thus no buildings and facilities are arranged. Maputo Station Terminal (T1) will be arranged carefully as it is located in the central area of Maputo City.
Source: JICA Project Team
Figure 53: General Layout of Zimpeto Terminal & Depot Zimpeto Terminal is arranged to face the “Zimpeto Market”, one of the biggest local markets in Maputo. There are two office buildings in the terminal, including offices and a staff waiting room, arranged to the southeast and southwest near the market. The bus bays are covered with roofs for passengers. The amount of bus bays planned at the terminal are sufficient to handle the projected 32,000 passengers/day in 2020.
Table 23: Bus Bays (Zimpeto Terminal) Name Number Length (m) Width (m) Remarks BRT bus 8 35 3.5 20 m articulated bus Feeder bus 16 15 3.5 10 m bus
Source: JICA Project Team
Comprehensive Urban Transport Master Plan for the Greater Maputo Executive Summary
55
(6) BRT 25 Setembro East Line Extension Route Due to future expansion of business district in the southern area of existing CBD and to cover the traffic to/from such expansion area, the BRT expansion from Maputo Central Station on 25 Setembro East Line was also considered. Figure 54 presents the plan of the BRT 25 Setembro East Line.
Source: JICA Project Team
Figure 54: Plan of BRT 25 Setembro East Line (7) N1 Bypass As aforementioned, the section of N1 bypass is about 8.5 km from the N4 tollgate to Missão Roque were considered. The purpose of a bypass is to secure a smooth physical distribution of traffic and a comfortable urban condition. In consideration of traffic volumes of about 35,000 vehicles/day by 2035, a four-lane road is proposed with a design speed of 80 km/h.
Source: JICA Project Team
Figure 55: Standard Cross-section of N1 Bypass E.19 Operation Plan E.19.1 Bus Operation Plan Much will depend on the implementation and lessons learnt from Phase I, which is supported by Brazil, as many of the same elements will have to be used in Phase II, the subject of this prefeasibility study. The electronic ticketing and revenue system will have to be the same. The station elements will also have to be the same in terms of bus door access as will the doors and
Comprehensive Urban Transport Master Plan for the Greater Maputo Executive Summary
56
internal platform height of the bus fleet as well as the operational characteristics of the terminals, system image in signaling and the color coding of visual elements, logos, etc. (1) Fleet Characteristics For the purposes of this study the bus units considered for trunk routes are all 20 m articulated units: Motor – Position: central, front or rear; Minimum power 310 HP (1550 Nm) Euro 4;
Turbo-powered Transmission – Automatic Suspension – Pneumatic Dimensions – Length 20.3 meters, width 2.5 meters. Doors – 3, installed on the right side of the vehicle, electro-pneumatic, with a
unobstructed width of 1,100 mm (minimum).
Source: Marco Polo Ltd., Brazil
Figure 56: Articulated 20 m Unit for BRT (2) Fare Collection System The electronic ticketing system is a set of software and hardware that manages travel credits to be used by users in public transportation. This has proven to be a powerful instrument for combating illegal transportation, gratuities and fleet monitoring. Contactless smartcard technology has consolidated its position in the market due to reductions in price, increased transaction security, and simplicity of operation. The major benefits offered with the deployment of the system are:
Revenue control Reduction of costs Reduction of revenue evasion Control of off peak discounts Generation of operating statistics Better working conditions for system operators Reduction in the use of cash on-board and the associated risks of robbery Future possibility of integration of the lines of the mass transit systems as the use of
card allows the user to transfer between lines over a given time period (Temporal Integration)
Allows recharging of credit at various points Allows the refund of credits in the case of loss or theft of the card for registered users
Comprehensive Urban Transport Master Plan for the Greater Maputo Executive Summary
57
(3) Operational Data The basic operational plan is based on the model data obtained for the BRT systems (Phases I and II) in the base year of 2020. Cordon line counts were used to establish the peak load factor as well as the directional loadings. The node with highest daily flow was N813 with 45,839 trips/day in the morning peak. This corresponds to the Benfica region, towards the City Center. In the opposite direction the highest daily flow was at node N814 – also in the Benfica zone – with 42,553 trips. The model predicts the data shown in Table 24:
Table 24: Model Operational Data (2020) Max daily load on directional link 45,839 Peak hour factor 10% AM peak hour directional flow 4,584 Total daily passenger boardings 106,314
Source: JICA Project Team The model also clearly shows that the corridor has two main levels of demand: from the Center to Missão Roque and a reduced level from Missão Roque to Zimpeto, as shown in Figure 57:
Source: JICA Project Team
Figure 57: Passengers Transported per Hour (Direction: Zimpeto–Center) E.19.2 BRT Operation The demand levels to the south of Missão Roque (Benfica) and to the north (Zimpeto) require different service levels and, as such, there is a turnaround at Missão Roque for the trunk route ending at this point and separate platforms for the Zimpeto and Missão Roque Routes. During peak hours, it is expected that the demand for through services will be significant enough for additional through routes: Zimpeto–CFM (stopping at Missão Roque – direct) Missão Roque–CFM (direct)
Table 25 summarizes BRT route and services
Zimpeto Benfica Junta Brigada MaputoStation
Comprehensive Urban Transport Master Plan for the Greater Maputo Executive Summary
58
Table 25: Trunk Routes for Phase II Route Service Type Zimpeto–CFM stopping at all stations
direct, one stop at Missão Roque Missão Roque–CFM stopping at all stations
direct (no stops) Source: JICA Project Team
The amount of trunk fleet needed is determined by the number of units needed to carry the peak hour load on the highest loaded stretch. A BRT speed of 25 kph has been used – a value slightly higher than in some Brazilian cities but significantly lower than some more modern systems (the more direct route of the Transoeste in Rio, for example, operates at 48 kph). E.19.3 Feeder Bus Fleet Dimensioning At this design stage a basic network of four feeder routes at each terminal has been established, as shown in Table 26.
Table 26: Feeder Routes Feeders Zimpeto Ext. km Feeder 1 Ring Road West 15.0 Feeder 2 Ring Road East 15.0 Feeder 3 N1 10.0 Feeder 4 Local 8.0 Feeders Missão Roque Ext. km Feeder 1 West 8.0 Feeder 2 East 8.0 Feeder 3 North N1 8.0 Feeder 4 Local 8.0
Source: JICA Project Team Table 27 summarizes whole operation plan including BRT and feeder services.
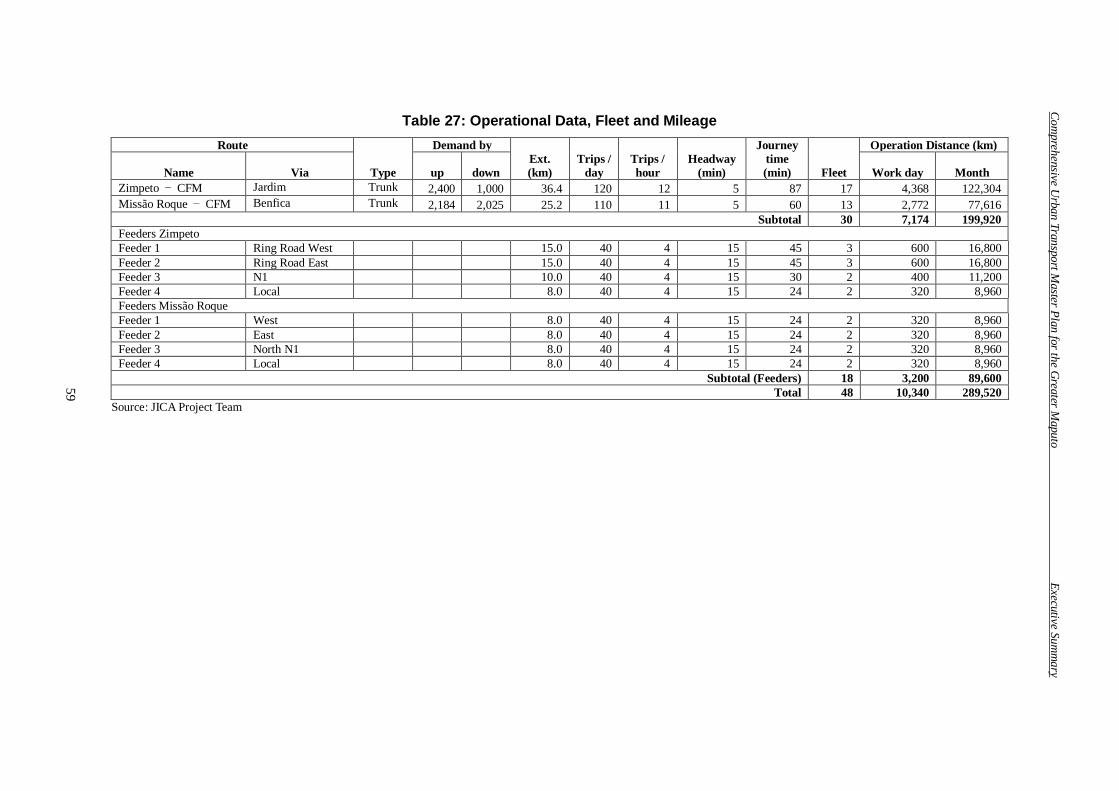
Comprehensive U
rban Transport Master Plan for the G
reater Maputo
Executive Summ
ary
59
Table 27: Operational Data, Fleet and Mileage Route
Type
Demand by Ext. (km)
Trips / day
Trips / hour
Headway (min)
Journey time (min) Fleet
Operation Distance (km)
Name Via up down Work day Month Zimpeto − CFM Jardim Trunk 2,400 1,000 36.4 120 12 5 87 17 4,368 122,304 Missão Roque − CFM Benfica Trunk 2,184 2,025 25.2 110 11 5 60 13 2,772 77,616
Subtotal 30 7,174 199,920 Feeders Zimpeto Feeder 1 Ring Road West 15.0 40 4 15 45 3 600 16,800 Feeder 2 Ring Road East 15.0 40 4 15 45 3 600 16,800 Feeder 3 N1 10.0 40 4 15 30 2 400 11,200 Feeder 4 Local 8.0 40 4 15 24 2 320 8,960 Feeders Missão Roque Feeder 1 West 8.0 40 4 15 24 2 320 8,960 Feeder 2 East 8.0 40 4 15 24 2 320 8,960 Feeder 3 North N1 8.0 40 4 15 24 2 320 8,960 Feeder 4 Local 8.0 40 4 15 24 2 320 8,960
Subtotal (Feeders) 18 3,200 89,600 Total 48 10,340 289,520
Source: JICA Project Team
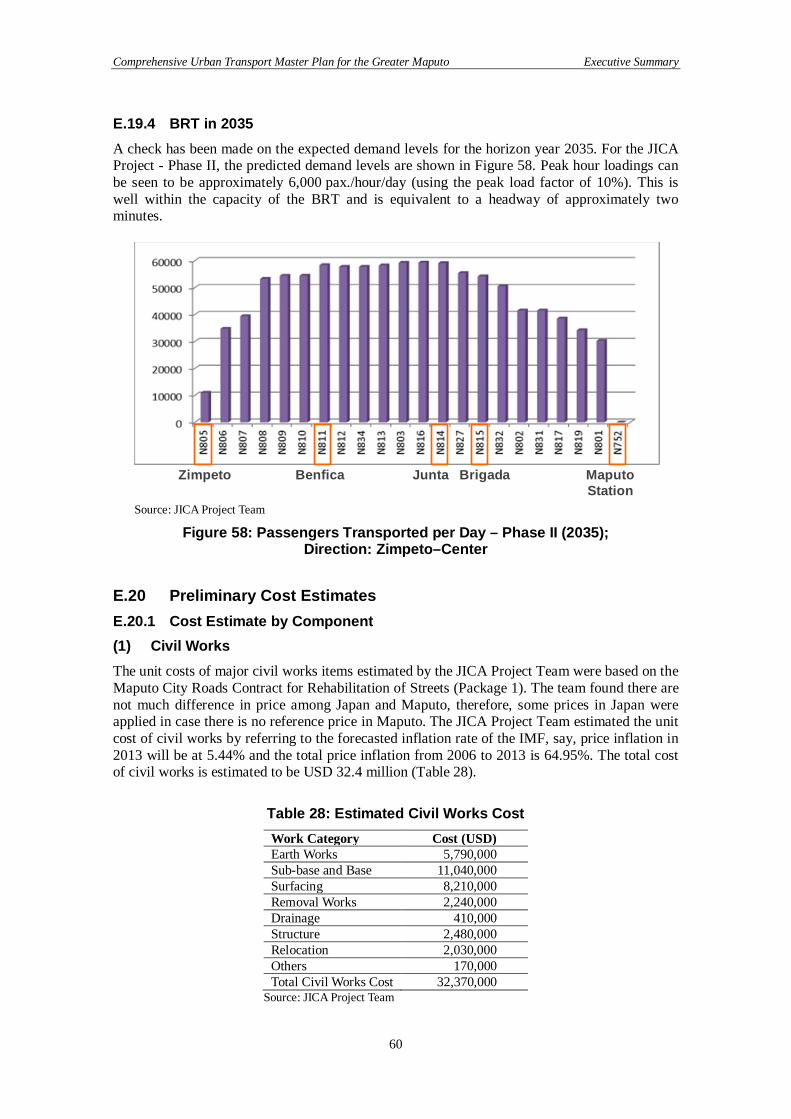
Comprehensive Urban Transport Master Plan for the Greater Maputo Executive Summary
60
E.19.4 BRT in 2035 A check has been made on the expected demand levels for the horizon year 2035. For the JICA Project - Phase II, the predicted demand levels are shown in Figure 58. Peak hour loadings can be seen to be approximately 6,000 pax./hour/day (using the peak load factor of 10%). This is well within the capacity of the BRT and is equivalent to a headway of approximately two minutes.
Source: JICA Project Team
Figure 58: Passengers Transported per Day – Phase II (2035); Direction: Zimpeto–Center
E.20 Preliminary Cost Estimates E.20.1 Cost Estimate by Component (1) Civil Works The unit costs of major civil works items estimated by the JICA Project Team were based on the Maputo City Roads Contract for Rehabilitation of Streets (Package 1). The team found there are not much difference in price among Japan and Maputo, therefore, some prices in Japan were applied in case there is no reference price in Maputo. The JICA Project Team estimated the unit cost of civil works by referring to the forecasted inflation rate of the IMF, say, price inflation in 2013 will be at 5.44% and the total price inflation from 2006 to 2013 is 64.95%. The total cost of civil works is estimated to be USD 32.4 million (Table 28).
Table 28: Estimated Civil Works Cost Work Category Cost (USD) Earth Works 5,790,000 Sub-base and Base 11,040,000 Surfacing 8,210,000 Removal Works 2,240,000 Drainage 410,000 Structure 2,480,000 Relocation 2,030,000 Others 170,000 Total Civil Works Cost 32,370,000
Source: JICA Project Team
Zimpeto Benfica Junta Brigada MaputoStation
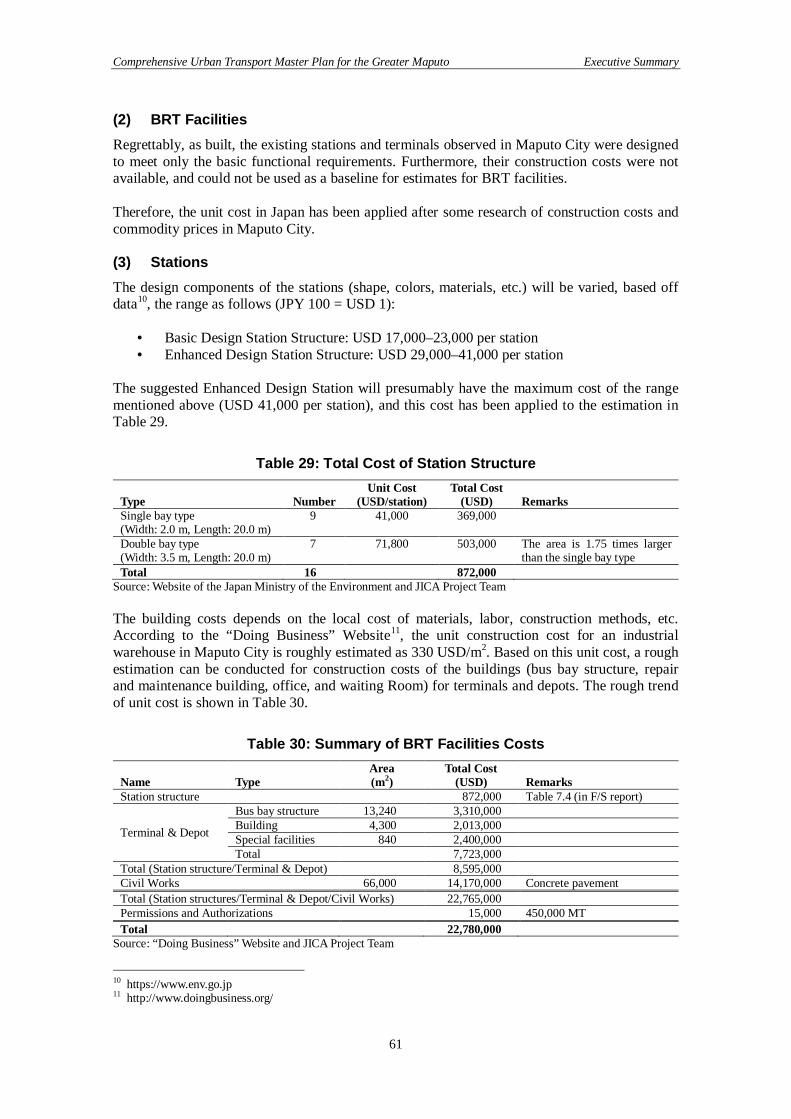
Comprehensive Urban Transport Master Plan for the Greater Maputo Executive Summary
61
(2) BRT Facilities Regrettably, as built, the existing stations and terminals observed in Maputo City were designed to meet only the basic functional requirements. Furthermore, their construction costs were not available, and could not be used as a baseline for estimates for BRT facilities. Therefore, the unit cost in Japan has been applied after some research of construction costs and commodity prices in Maputo City. (3) Stations The design components of the stations (shape, colors, materials, etc.) will be varied, based off data10, the range as follows (JPY 100 = USD 1): Basic Design Station Structure: USD 17,000–23,000 per station Enhanced Design Station Structure: USD 29,000–41,000 per station
The suggested Enhanced Design Station will presumably have the maximum cost of the range mentioned above (USD 41,000 per station), and this cost has been applied to the estimation in Table 29.
Table 29: Total Cost of Station Structure
Type Number Unit Cost
(USD/station) Total Cost
(USD) Remarks Single bay type (Width: 2.0 m, Length: 20.0 m)
9 41,000 369,000
Double bay type (Width: 3.5 m, Length: 20.0 m)
7 71,800 503,000 The area is 1.75 times larger than the single bay type
Total 16 872,000 Source: Website of the Japan Ministry of the Environment and JICA Project Team The building costs depends on the local cost of materials, labor, construction methods, etc. According to the “Doing Business” Website11, the unit construction cost for an industrial warehouse in Maputo City is roughly estimated as 330 USD/m2. Based on this unit cost, a rough estimation can be conducted for construction costs of the buildings (bus bay structure, repair and maintenance building, office, and waiting Room) for terminals and depots. The rough trend of unit cost is shown in Table 30.
Table 30: Summary of BRT Facilities Costs
Name Type Area (m2)
Total Cost (USD) Remarks
Station structure 872,000 Table 7.4 (in F/S report)
Terminal & Depot
Bus bay structure 13,240 3,310,000 Building 4,300 2,013,000 Special facilities 840 2,400,000 Total 7,723,000
Total (Station structure/Terminal & Depot) 8,595,000 Civil Works 66,000 14,170,000 Concrete pavement Total (Station structures/Terminal & Depot/Civil Works) 22,765,000 Permissions and Authorizations 15,000 450,000 MT Total 22,780,000
Source: “Doing Business” Website and JICA Project Team
10 https://www.env.go.jp 11 http://www.doingbusiness.org/

Comprehensive Urban Transport Master Plan for the Greater Maputo Executive Summary
62
(4) BRT Fleet BRT requires a specialized set of fleet, and cannot reuse or recommission existing standard buses for its operations. This is mostly a consideration of function, in that these specialized buses greatly improve capacity and operational efficiency, but is also a factor of heightening the overall image or attractiveness of the BRT system. In general, the key fleet characteristics of BRT as compared to non-BRT are as shown in Table 31.
Table 31: BRT vs. Non-BRT Fleet BRT Fleet Non-BRT Fleet 20.3 m long 10 m long 3 doors (front, middle, back) 2 doors (front, back) Articulated units Single unit 160 pax. (as per demand model) 60–80 pax. Off-board fare collection On-board fare collection
Source: JICA Project Team The unit cost of a BRT bus is USD 280,000. The import duties could be waived for the BRT fleet, but for this analysis a 5% import duty was nevertheless included. A fleet of 30 units is required to meet the demand for this project. However, at a minimum, a 10% reserve fleet must be kept on hand to fill in for running fleet in cases of maintenance, accident repair, etc. For this project, a spare fleet of four units will be kept on reserve, two each for the North and South BRT segments. Fleet requirements and costs are summarized in Table 32.
Table 32: Summary of BRT Fleet Requirements and Costs Units Unit Cost (USD) Cost (USD) Base Fleet 30 280,000 8,400,000 Spares 4 280,000 1,120,000 Subtotal 34 9,520,000 Import Duty 5% 476,000 Import Cost 1% 95,200 Total 10,091,000
Source: JICA Project Team (5) Other Costs The engineering service cost is set for topographic survey, route survey, boring survey
consulting services in basic design and detailed design and consulting services in construction supervision.
In addition, some 20% of the cost of civil works and BRT facilities has been budgeted as “miscellaneous expenses” or Contingency.
E.20.2 Total Project Cost The total project cost is USD 88,965,000 (excluding Capacity Building), and the construction cost (which is the total of civil works and miscellaneous expenses) is approximately USD 400,000/lane-km. Compared with the general cost of road construction in Mozambique (approximately USD 350,000–400,000/lane-km), this cost is considered reasonable. The estimated total project cost is summarized in Table 33.
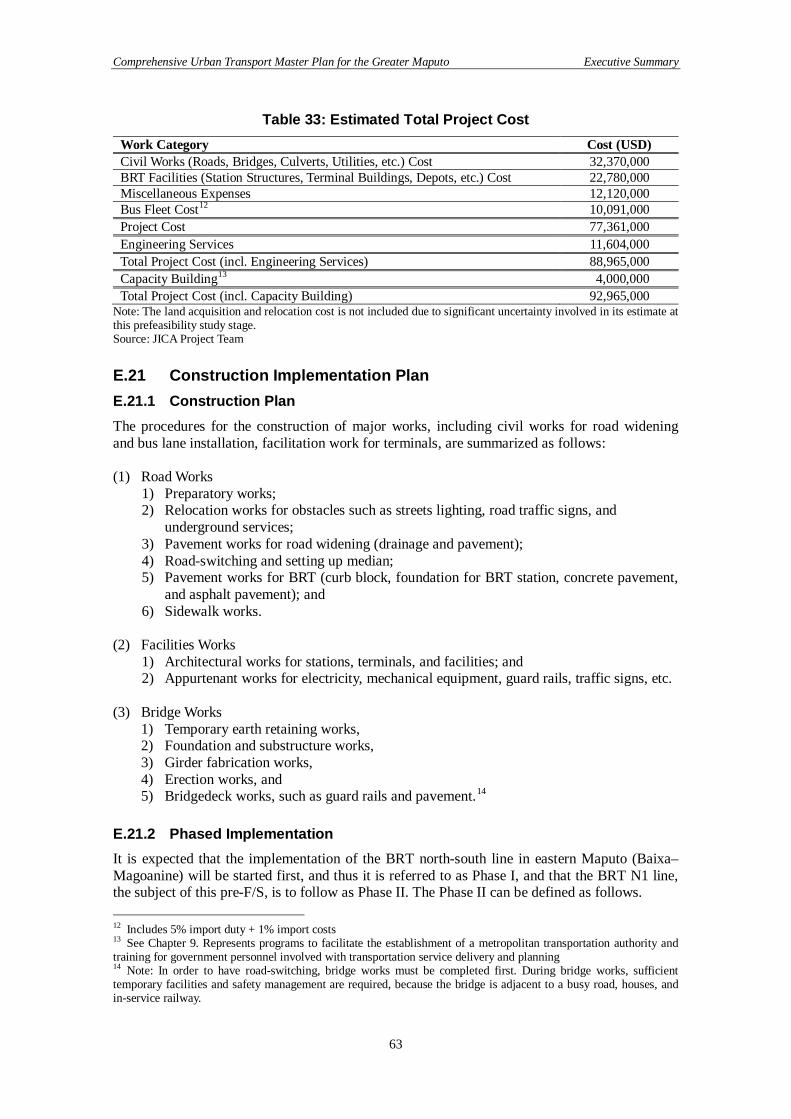
Comprehensive Urban Transport Master Plan for the Greater Maputo Executive Summary
63
Table 33: Estimated Total Project Cost Work Category Cost (USD) Civil Works (Roads, Bridges, Culverts, Utilities, etc.) Cost 32,370,000 BRT Facilities (Station Structures, Terminal Buildings, Depots, etc.) Cost 22,780,000 Miscellaneous Expenses 12,120,000 Bus Fleet Cost12 10,091,000 Project Cost 77,361,000 Engineering Services 11,604,000 Total Project Cost (incl. Engineering Services) 88,965,000 Capacity Building13 4,000,000 Total Project Cost (incl. Capacity Building) 92,965,000
Note: The land acquisition and relocation cost is not included due to significant uncertainty involved in its estimate at this prefeasibility study stage. Source: JICA Project Team E.21 Construction Implementation Plan E.21.1 Construction Plan The procedures for the construction of major works, including civil works for road widening and bus lane installation, facilitation work for terminals, are summarized as follows: (1) Road Works
1) Preparatory works; 2) Relocation works for obstacles such as streets lighting, road traffic signs, and
underground services; 3) Pavement works for road widening (drainage and pavement); 4) Road-switching and setting up median; 5) Pavement works for BRT (curb block, foundation for BRT station, concrete pavement,
and asphalt pavement); and 6) Sidewalk works.
(2) Facilities Works
1) Architectural works for stations, terminals, and facilities; and 2) Appurtenant works for electricity, mechanical equipment, guard rails, traffic signs, etc.
(3) Bridge Works
1) Temporary earth retaining works, 2) Foundation and substructure works, 3) Girder fabrication works, 4) Erection works, and 5) Bridgedeck works, such as guard rails and pavement.14
E.21.2 Phased Implementation It is expected that the implementation of the BRT north-south line in eastern Maputo (Baixa–Magoanine) will be started first, and thus it is referred to as Phase I, and that the BRT N1 line, the subject of this pre-F/S, is to follow as Phase II. The Phase II can be defined as follows. 12 Includes 5% import duty + 1% import costs 13 See Chapter 9. Represents programs to facilitate the establishment of a metropolitan transportation authority and training for government personnel involved with transportation service delivery and planning 14 Note: In order to have road-switching, bridge works must be completed first. During bridge works, sufficient temporary facilities and safety management are required, because the bridge is adjacent to a busy road, houses, and in-service railway.
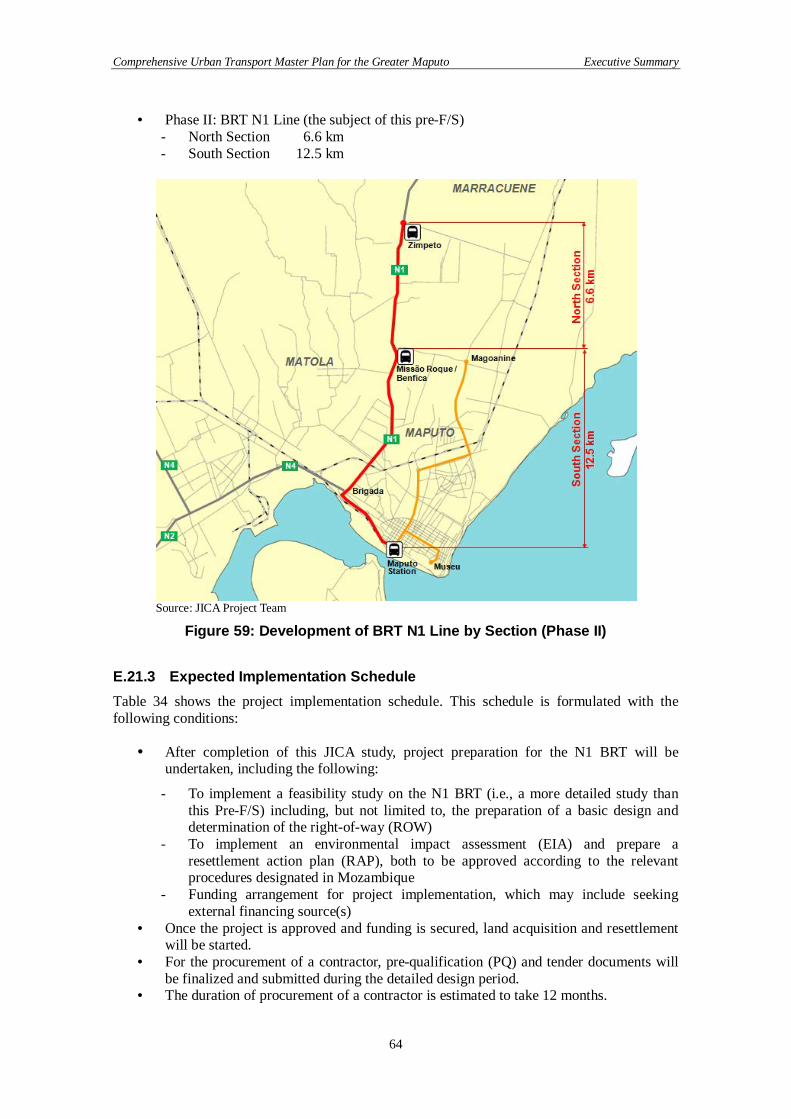
Comprehensive Urban Transport Master Plan for the Greater Maputo Executive Summary
64
Phase II: BRT N1 Line (the subject of this pre-F/S) - North Section 6.6 km - South Section 12.5 km
Source: JICA Project Team
Figure 59: Development of BRT N1 Line by Section (Phase II) E.21.3 Expected Implementation Schedule Table 34 shows the project implementation schedule. This schedule is formulated with the following conditions: After completion of this JICA study, project preparation for the N1 BRT will be
undertaken, including the following:
- To implement a feasibility study on the N1 BRT (i.e., a more detailed study than this Pre-F/S) including, but not limited to, the preparation of a basic design and determination of the right-of-way (ROW)
- To implement an environmental impact assessment (EIA) and prepare a resettlement action plan (RAP), both to be approved according to the relevant procedures designated in Mozambique
- Funding arrangement for project implementation, which may include seeking external financing source(s)
Once the project is approved and funding is secured, land acquisition and resettlement will be started.
For the procurement of a contractor, pre-qualification (PQ) and tender documents will be finalized and submitted during the detailed design period.
The duration of procurement of a contractor is estimated to take 12 months.
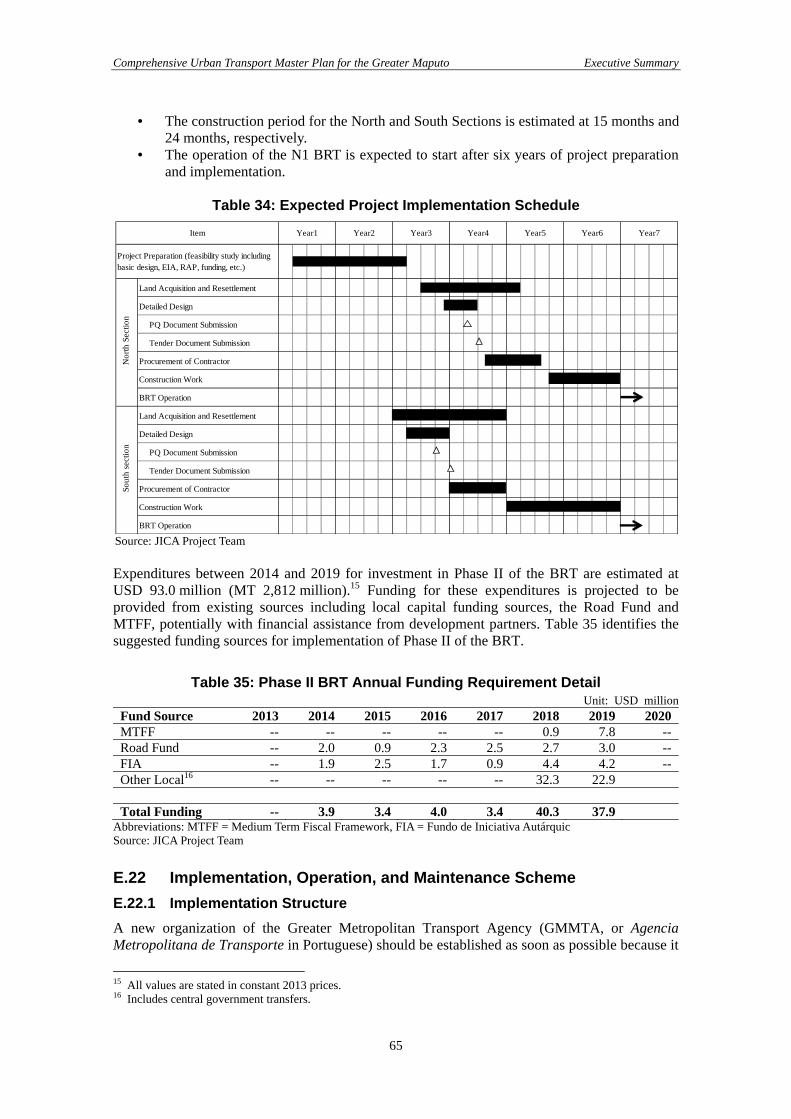
Comprehensive Urban Transport Master Plan for the Greater Maputo Executive Summary
65
The construction period for the North and South Sections is estimated at 15 months and 24 months, respectively.
The operation of the N1 BRT is expected to start after six years of project preparation and implementation.
Table 34: Expected Project Implementation Schedule
Source: JICA Project Team Expenditures between 2014 and 2019 for investment in Phase II of the BRT are estimated at USD 93.0 million (MT 2,812 million).15 Funding for these expenditures is projected to be provided from existing sources including local capital funding sources, the Road Fund and MTFF, potentially with financial assistance from development partners. Table 35 identifies the suggested funding sources for implementation of Phase II of the BRT.
Table 35: Phase II BRT Annual Funding Requirement Detail Unit: USD million
Fund Source 2013 2014 2015 2016 2017 2018 2019 2020MTFF -- -- -- -- -- 0.9 7.8 --Road Fund -- 2.0 0.9 2.3 2.5 2.7 3.0 --FIA -- 1.9 2.5 1.7 0.9 4.4 4.2 --Other Local16 -- -- -- -- -- 32.3 22.9 Total Funding -- 3.9 3.4 4.0 3.4 40.3 37.9
Abbreviations: MTFF = Medium Term Fiscal Framework, FIA = Fundo de Iniciativa Autárquic Source: JICA Project Team E.22 Implementation, Operation, and Maintenance Scheme E.22.1 Implementation Structure A new organization of the Greater Metropolitan Transport Agency (GMMTA, or Agencia Metropolitana de Transporte in Portuguese) should be established as soon as possible because it
15 All values are stated in constant 2013 prices. 16 Includes central government transfers.
Land Acquisition and Resettlement
Detailed Design
PQ Document Submission
Tender Document Submission
Procurement of Contractor
Construction Work
BRT Operation
Land Acquisition and Resettlement
Detailed Design
PQ Document Submission
Tender Document Submission
Procurement of Contractor
Construction Work
BRT Operation
Year6 Year7
Nor
th S
ectio
nSo
uth
sect
ion
Project Preparation (feasibility study includingbasic design, EIA, RAP, funding, etc.)
Item Year1 Year2 Year3 Year4 Year5
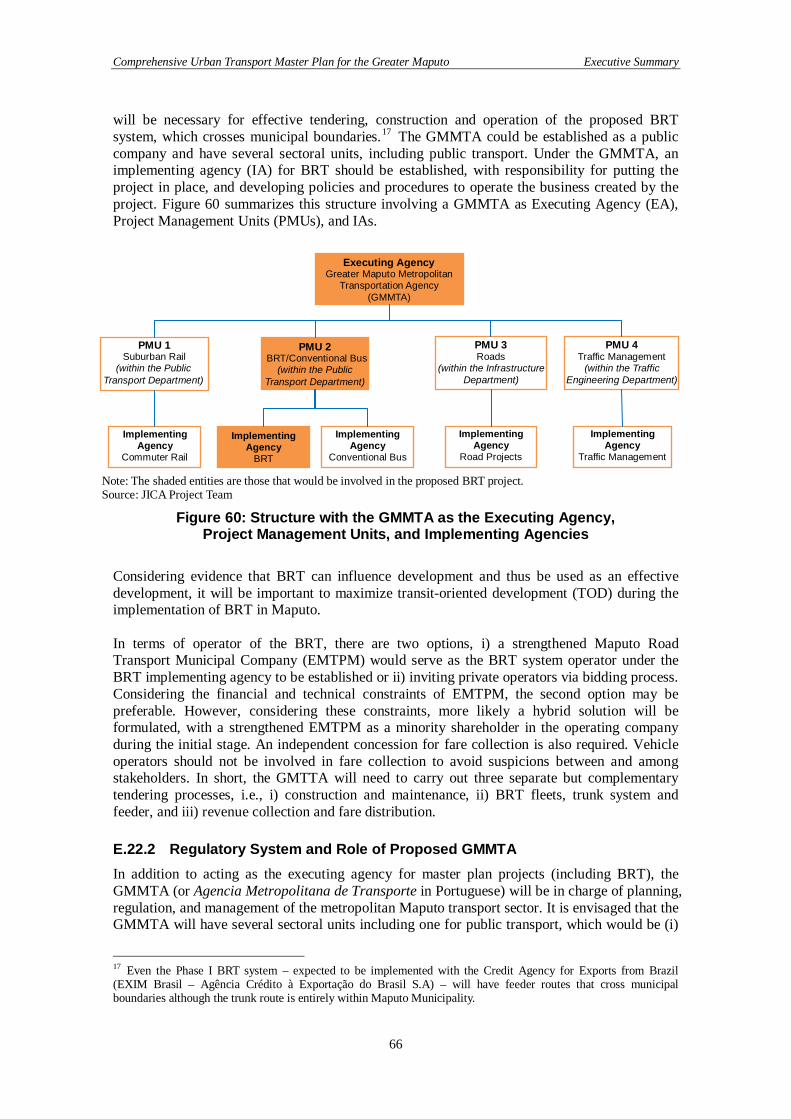
Comprehensive Urban Transport Master Plan for the Greater Maputo Executive Summary
66
will be necessary for effective tendering, construction and operation of the proposed BRT system, which crosses municipal boundaries.17 The GMMTA could be established as a public company and have several sectoral units, including public transport. Under the GMMTA, an implementing agency (IA) for BRT should be established, with responsibility for putting the project in place, and developing policies and procedures to operate the business created by the project. Figure 60 summarizes this structure involving a GMMTA as Executing Agency (EA), Project Management Units (PMUs), and IAs.
Note: The shaded entities are those that would be involved in the proposed BRT project. Source: JICA Project Team
Figure 60: Structure with the GMMTA as the Executing Agency, Project Management Units, and Implementing Agencies
Considering evidence that BRT can influence development and thus be used as an effective development, it will be important to maximize transit-oriented development (TOD) during the implementation of BRT in Maputo. In terms of operator of the BRT, there are two options, i) a strengthened Maputo Road Transport Municipal Company (EMTPM) would serve as the BRT system operator under the BRT implementing agency to be established or ii) inviting private operators via bidding process. Considering the financial and technical constraints of EMTPM, the second option may be preferable. However, considering these constraints, more likely a hybrid solution will be formulated, with a strengthened EMTPM as a minority shareholder in the operating company during the initial stage. An independent concession for fare collection is also required. Vehicle operators should not be involved in fare collection to avoid suspicions between and among stakeholders. In short, the GMTTA will need to carry out three separate but complementary tendering processes, i.e., i) construction and maintenance, ii) BRT fleets, trunk system and feeder, and iii) revenue collection and fare distribution. E.22.2 Regulatory System and Role of Proposed GMMTA In addition to acting as the executing agency for master plan projects (including BRT), the GMMTA (or Agencia Metropolitana de Transporte in Portuguese) will be in charge of planning, regulation, and management of the metropolitan Maputo transport sector. It is envisaged that the GMMTA will have several sectoral units including one for public transport, which would be (i)
17 Even the Phase I BRT system – expected to be implemented with the Credit Agency for Exports from Brazil (EXIM Brasil – Agência Crédito à Exportação do Brasil S.A) – will have feeder routes that cross municipal boundaries although the trunk route is entirely within Maputo Municipality.
Executing Agency Greater Maputo Metropolitan
Transportation Agency (GMMTA)
PMU 1 Suburban Rail
(within the Public Transport Department)
PMU 2 BRT/Conventional Bus
(within the Public Transport Department)
PMU 3 Roads
(within the Infrastructure Department)
PMU 4 Traffic Management
(within the Traffic Engineering Department)
Implementing Agency
Commuter Rail
Implementing Agency
BRT
Implementing Agency
Conventional Bus
Implementing Agency
Road Projects
Implementing Agency
Traffic Management
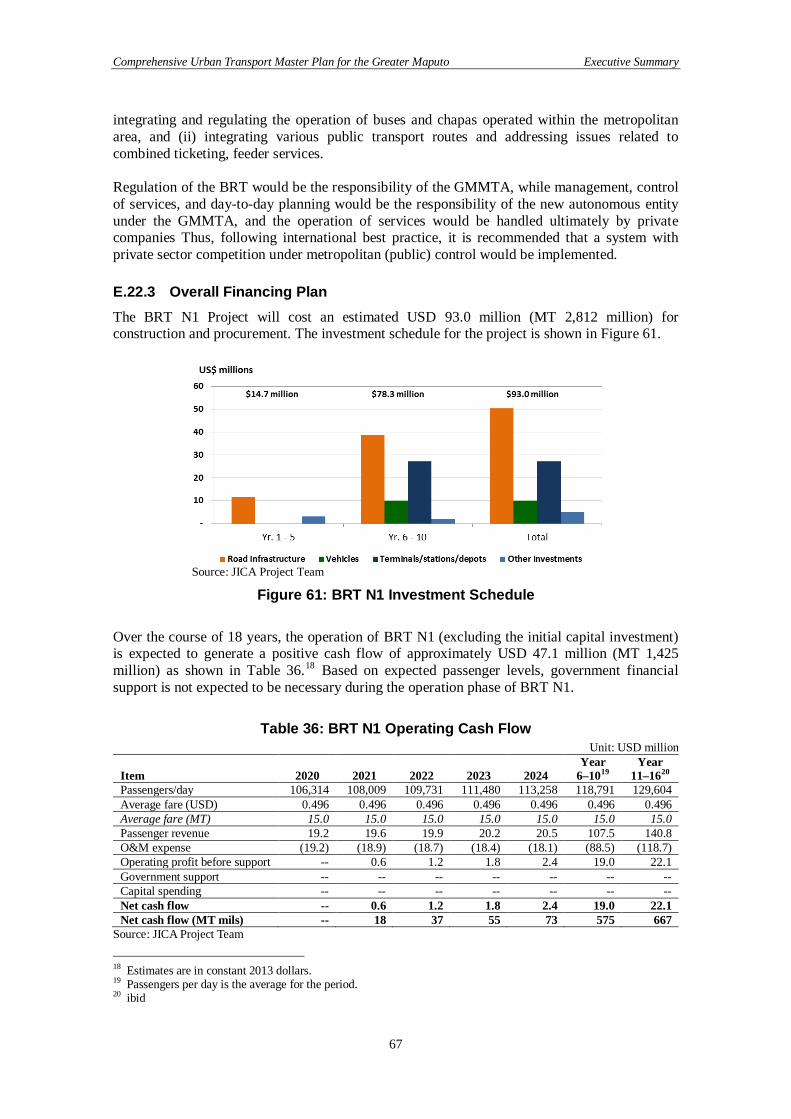
Comprehensive Urban Transport Master Plan for the Greater Maputo Executive Summary
67
integrating and regulating the operation of buses and chapas operated within the metropolitan area, and (ii) integrating various public transport routes and addressing issues related to combined ticketing, feeder services. Regulation of the BRT would be the responsibility of the GMMTA, while management, control of services, and day-to-day planning would be the responsibility of the new autonomous entity under the GMMTA, and the operation of services would be handled ultimately by private companies Thus, following international best practice, it is recommended that a system with private sector competition under metropolitan (public) control would be implemented. E.22.3 Overall Financing Plan The BRT N1 Project will cost an estimated USD 93.0 million (MT 2,812 million) for construction and procurement. The investment schedule for the project is shown in Figure 61.
Source: JICA Project Team
Figure 61: BRT N1 Investment Schedule Over the course of 18 years, the operation of BRT N1 (excluding the initial capital investment) is expected to generate a positive cash flow of approximately USD 47.1 million (MT 1,425 million) as shown in Table 36.18 Based on expected passenger levels, government financial support is not expected to be necessary during the operation phase of BRT N1.
Table 36: BRT N1 Operating Cash Flow Unit: USD million
Item 2020 2021 2022 2023 2024 Year
6–1019 Year
11–1620 Passengers/day 106,314 108,009 109,731 111,480 113,258 118,791 129,604 Average fare (USD) 0.496 0.496 0.496 0.496 0.496 0.496 0.496 Average fare (MT) 15.0 15.0 15.0 15.0 15.0 15.0 15.0 Passenger revenue 19.2 19.6 19.9 20.2 20.5 107.5 140.8 O&M expense (19.2) (18.9) (18.7) (18.4) (18.1) (88.5) (118.7) Operating profit before support -- 0.6 1.2 1.8 2.4 19.0 22.1 Government support -- -- -- -- -- -- -- Capital spending -- -- -- -- -- -- -- Net cash flow -- 0.6 1.2 1.8 2.4 19.0 22.1 Net cash flow (MT mils) -- 18 37 55 73 575 667
Source: JICA Project Team
18 Estimates are in constant 2013 dollars. 19 Passengers per day is the average for the period. 20 ibid

Comprehensive Urban Transport Master Plan for the Greater Maputo Executive Summary
68
This operating cash flow, however, produces a Financial Internal Rate of Return (FIRR) of negative 2.9% and a net present value of negative USD 43.7 million with the initial investment added to the cash flow. Considering the size of the investment required for BRT and LRT developments, it is highly recommended that external financing source(s) be sought in order to reduce the fiscal burden. A public private partnership structure is also considered for financing the BRT N1 project. As indicated by the negative FIRR estimated for the BRT N1, government sources will still be needed for about 70% of the initial investment in order to produce a return that may attract private investment. E.22.4 Project Risks Projects risks and potential mitigation measures include the following: Delay of establishing GMMTA (the metropolitan transport agency) considering that
legal establishment of the authority may take up two years and more time will be required for full implementation.
Inadequate capacity of EMTPM, in case the EMTPM is selected to serve as BRT system (part) operator for a transitional period, it will have inadequate capacity to serve as the BRT system manager and operator )
Inadequate capacity of private operators, when the BRT operation is concessioned to the private sector. To mitigate this risk, potential local operators may discuss partnerships with experienced international BRT operators.
Informal appeals of chapa operators, fearing for their livelihoods, offering adequate compensation to operators, including the opportunity to own shares in newly established vehicle operating companies.
Incompatibility with new technology, which does not operate/fit as planned. Inadequate fare setting,
Economic and financial risks to the BRT Phase II project include: Implementation cost overruns: Failure to achieve projected passenger levels (there is a risk that the actual level of
passengers will not be achieved or will take longer to reach the forecasted levels) Failure to achieve projected O&M expense (O&M expenses are estimated over the
forecast horizon.) Based on this analysis, passenger demand is the key driver of financial results, due to its potential to significantly impact revenue and O&M expenses. This ties up investment capital in unproductive assets, and strains the budget for the Phase II BRT. E.22.5 Capacity Development Plan Proposed capacity development measures include the following: Technical assistance for the establishment of the GMMTA Technical assistance for the EMTPM, including new skills in BRT technology and
planning, etc; capacity building for integrated public transit expansion, design, and operation; and capacity building for developing catalytic transit neighborhoods.
It is recommended to seek assistance from foreign development financing organizations to facilitate capacity building.
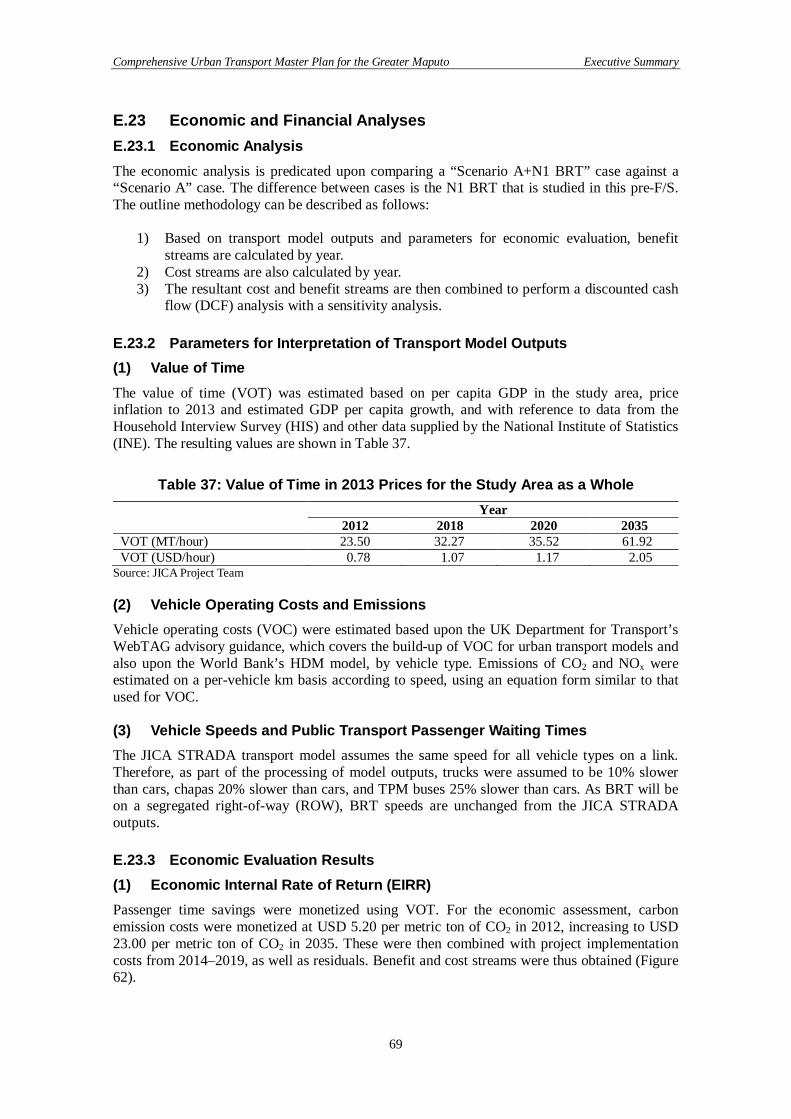
Comprehensive Urban Transport Master Plan for the Greater Maputo Executive Summary
69
E.23 Economic and Financial Analyses E.23.1 Economic Analysis The economic analysis is predicated upon comparing a “Scenario A+N1 BRT” case against a “Scenario A” case. The difference between cases is the N1 BRT that is studied in this pre-F/S. The outline methodology can be described as follows:
1) Based on transport model outputs and parameters for economic evaluation, benefit streams are calculated by year.
2) Cost streams are also calculated by year. 3) The resultant cost and benefit streams are then combined to perform a discounted cash
flow (DCF) analysis with a sensitivity analysis. E.23.2 Parameters for Interpretation of Transport Model Outputs (1) Value of Time The value of time (VOT) was estimated based on per capita GDP in the study area, price inflation to 2013 and estimated GDP per capita growth, and with reference to data from the Household Interview Survey (HIS) and other data supplied by the National Institute of Statistics (INE). The resulting values are shown in Table 37.
Table 37: Value of Time in 2013 Prices for the Study Area as a Whole
Year
2012 2018 2020 2035 VOT (MT/hour) 23.50 32.27 35.52 61.92 VOT (USD/hour) 0.78 1.07 1.17 2.05
Source: JICA Project Team (2) Vehicle Operating Costs and Emissions Vehicle operating costs (VOC) were estimated based upon the UK Department for Transport’s WebTAG advisory guidance, which covers the build-up of VOC for urban transport models and also upon the World Bank’s HDM model, by vehicle type. Emissions of CO2 and NOx were estimated on a per-vehicle km basis according to speed, using an equation form similar to that used for VOC. (3) Vehicle Speeds and Public Transport Passenger Waiting Times The JICA STRADA transport model assumes the same speed for all vehicle types on a link. Therefore, as part of the processing of model outputs, trucks were assumed to be 10% slower than cars, chapas 20% slower than cars, and TPM buses 25% slower than cars. As BRT will be on a segregated right-of-way (ROW), BRT speeds are unchanged from the JICA STRADA outputs. E.23.3 Economic Evaluation Results (1) Economic Internal Rate of Return (EIRR) Passenger time savings were monetized using VOT. For the economic assessment, carbon emission costs were monetized at USD 5.20 per metric ton of CO2 in 2012, increasing to USD 23.00 per metric ton of CO2 in 2035. These were then combined with project implementation costs from 2014–2019, as well as residuals. Benefit and cost streams were thus obtained (Figure 62).
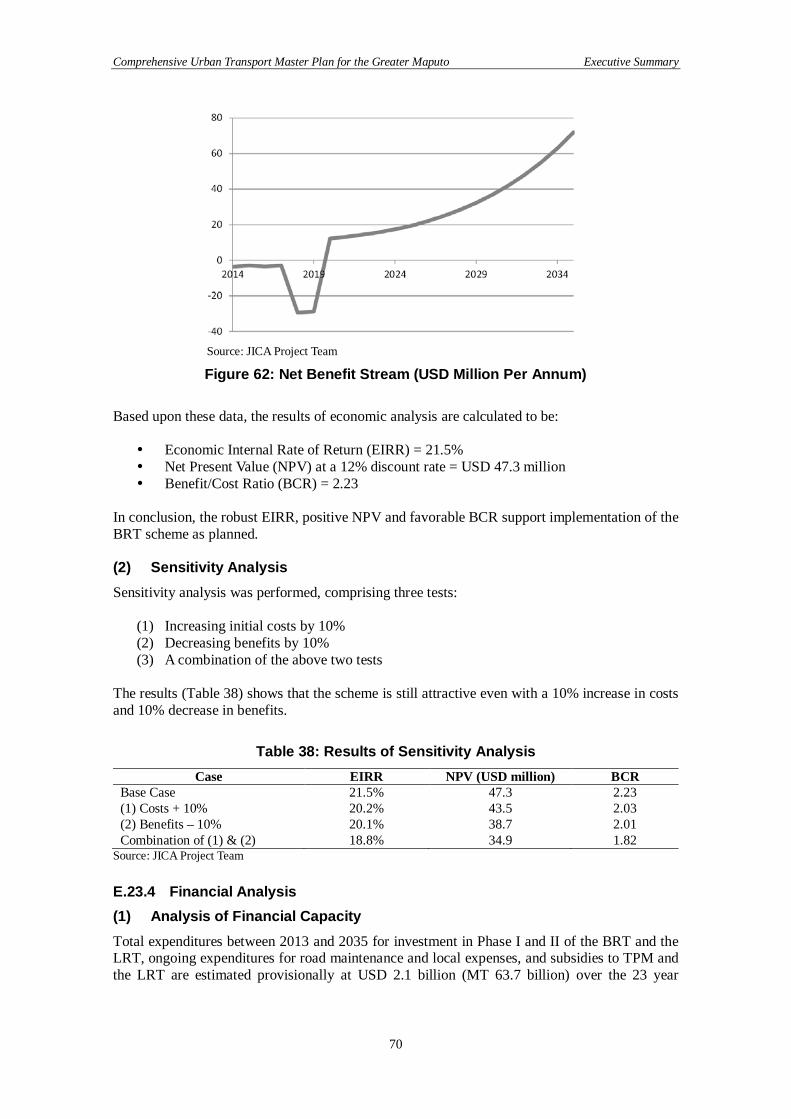
Comprehensive Urban Transport Master Plan for the Greater Maputo Executive Summary
70
Source: JICA Project Team
Figure 62: Net Benefit Stream (USD Million Per Annum) Based upon these data, the results of economic analysis are calculated to be: Economic Internal Rate of Return (EIRR) = 21.5% Net Present Value (NPV) at a 12% discount rate = USD 47.3 million Benefit/Cost Ratio (BCR) = 2.23
In conclusion, the robust EIRR, positive NPV and favorable BCR support implementation of the BRT scheme as planned. (2) Sensitivity Analysis Sensitivity analysis was performed, comprising three tests:
(1) Increasing initial costs by 10% (2) Decreasing benefits by 10% (3) A combination of the above two tests
The results (Table 38) shows that the scheme is still attractive even with a 10% increase in costs and 10% decrease in benefits.
Table 38: Results of Sensitivity Analysis Case EIRR NPV (USD million) BCR
Base Case 21.5% 47.3 2.23 (1) Costs + 10% 20.2% 43.5 2.03 (2) Benefits – 10% 20.1% 38.7 2.01 Combination of (1) & (2) 18.8% 34.9 1.82
Source: JICA Project Team E.23.4 Financial Analysis (1) Analysis of Financial Capacity Total expenditures between 2013 and 2035 for investment in Phase I and II of the BRT and the LRT, ongoing expenditures for road maintenance and local expenses, and subsidies to TPM and the LRT are estimated provisionally at USD 2.1 billion (MT 63.7 billion) over the 23 year
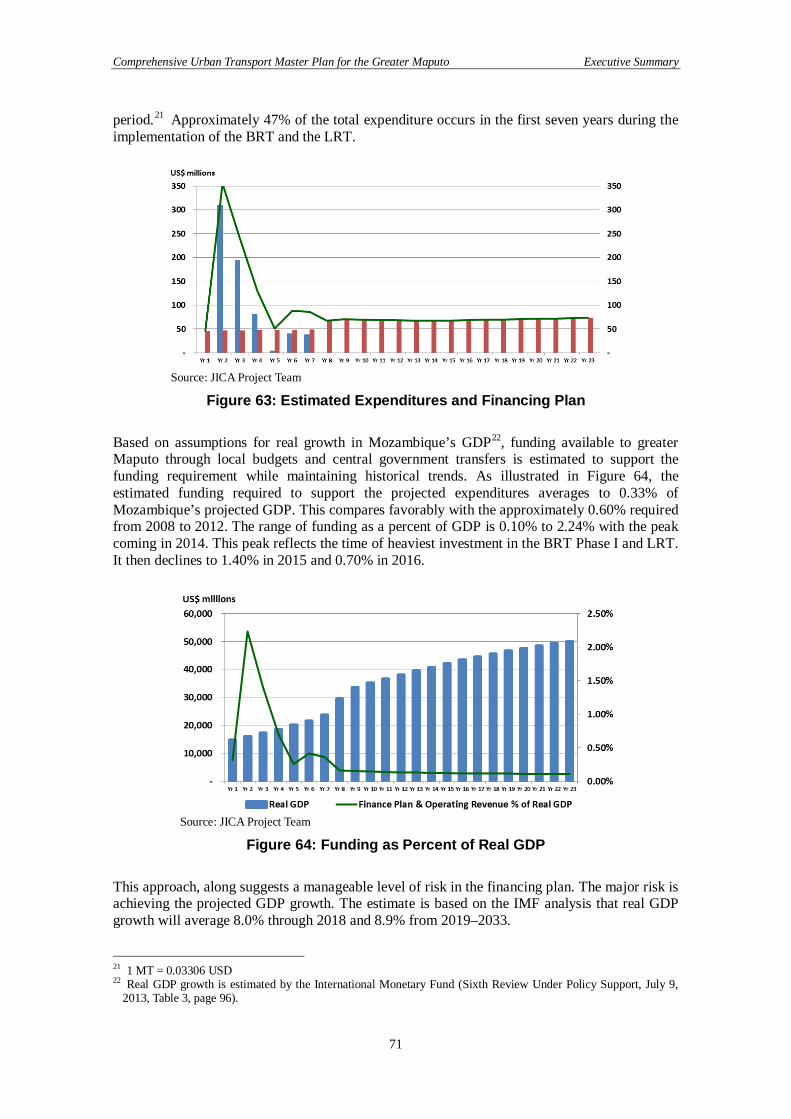
Comprehensive Urban Transport Master Plan for the Greater Maputo Executive Summary
71
period.21 Approximately 47% of the total expenditure occurs in the first seven years during the implementation of the BRT and the LRT.
Source: JICA Project Team
Figure 63: Estimated Expenditures and Financing Plan Based on assumptions for real growth in Mozambique’s GDP22, funding available to greater Maputo through local budgets and central government transfers is estimated to support the funding requirement while maintaining historical trends. As illustrated in Figure 64, the estimated funding required to support the projected expenditures averages to 0.33% of Mozambique’s projected GDP. This compares favorably with the approximately 0.60% required from 2008 to 2012. The range of funding as a percent of GDP is 0.10% to 2.24% with the peak coming in 2014. This peak reflects the time of heaviest investment in the BRT Phase I and LRT. It then declines to 1.40% in 2015 and 0.70% in 2016.
Source: JICA Project Team
Figure 64: Funding as Percent of Real GDP This approach, along suggests a manageable level of risk in the financing plan. The major risk is achieving the projected GDP growth. The estimate is based on the IMF analysis that real GDP growth will average 8.0% through 2018 and 8.9% from 2019–2033. 21 1 MT = 0.03306 USD 22 Real GDP growth is estimated by the International Monetary Fund (Sixth Review Under Policy Support, July 9,
2013, Table 3, page 96).
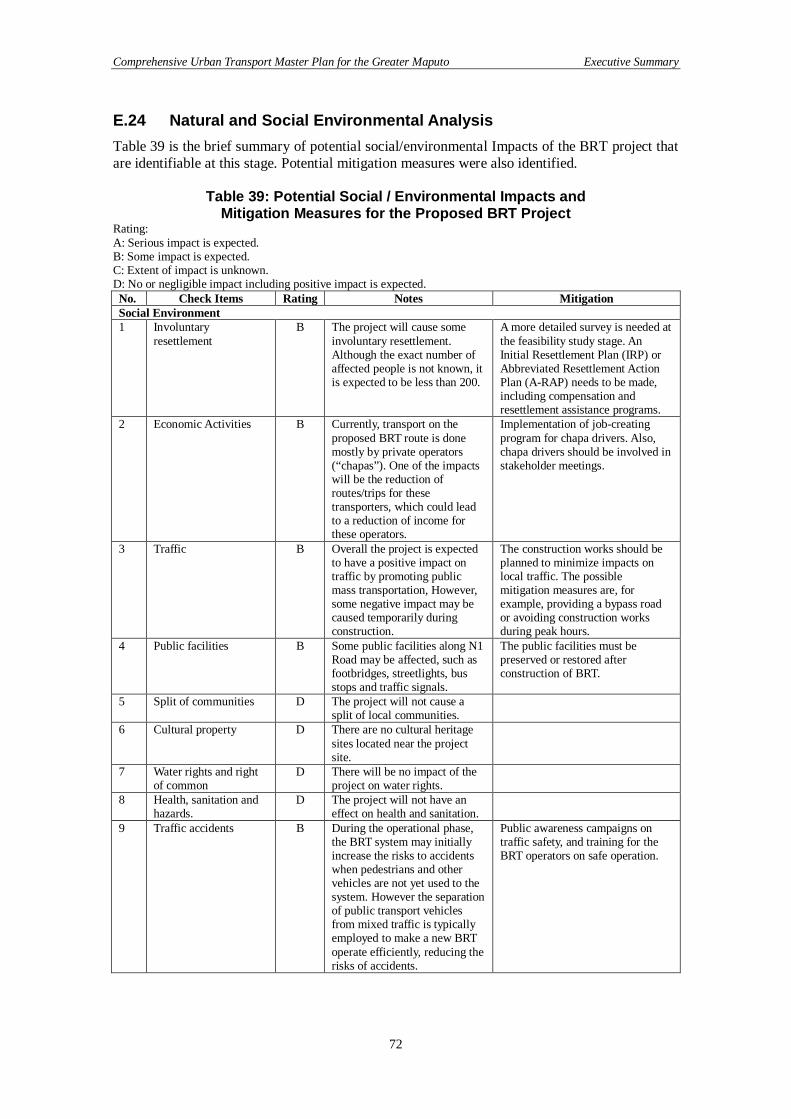
Comprehensive Urban Transport Master Plan for the Greater Maputo Executive Summary
72
E.24 Natural and Social Environmental Analysis Table 39 is the brief summary of potential social/environmental Impacts of the BRT project that are identifiable at this stage. Potential mitigation measures were also identified.
Table 39: Potential Social / Environmental Impacts and Mitigation Measures for the Proposed BRT Project
Rating: A: Serious impact is expected. B: Some impact is expected. C: Extent of impact is unknown. D: No or negligible impact including positive impact is expected. No. Check Items Rating Notes Mitigation Social Environment 1 Involuntary
resettlement B The project will cause some
involuntary resettlement. Although the exact number of affected people is not known, it is expected to be less than 200.
A more detailed survey is needed at the feasibility study stage. An Initial Resettlement Plan (IRP) or Abbreviated Resettlement Action Plan (A-RAP) needs to be made, including compensation and resettlement assistance programs.
2 Economic Activities B Currently, transport on the proposed BRT route is done mostly by private operators (“chapas”). One of the impacts will be the reduction of routes/trips for these transporters, which could lead to a reduction of income for these operators.
Implementation of job-creating program for chapa drivers. Also, chapa drivers should be involved in stakeholder meetings.
3 Traffic B Overall the project is expected to have a positive impact on traffic by promoting public mass transportation, However, some negative impact may be caused temporarily during construction.
The construction works should be planned to minimize impacts on local traffic. The possible mitigation measures are, for example, providing a bypass road or avoiding construction works during peak hours.
4 Public facilities B Some public facilities along N1 Road may be affected, such as footbridges, streetlights, bus stops and traffic signals.
The public facilities must be preserved or restored after construction of BRT.
5 Split of communities D The project will not cause a split of local communities.
6 Cultural property D There are no cultural heritage sites located near the project site.
7 Water rights and right of common
D There will be no impact of the project on water rights.
8 Health, sanitation and hazards.
D The project will not have an effect on health and sanitation.
9 Traffic accidents B During the operational phase, the BRT system may initially increase the risks to accidents when pedestrians and other vehicles are not yet used to the system. However the separation of public transport vehicles from mixed traffic is typically employed to make a new BRT operate efficiently, reducing the risks of accidents.
Public awareness campaigns on traffic safety, and training for the BRT operators on safe operation.
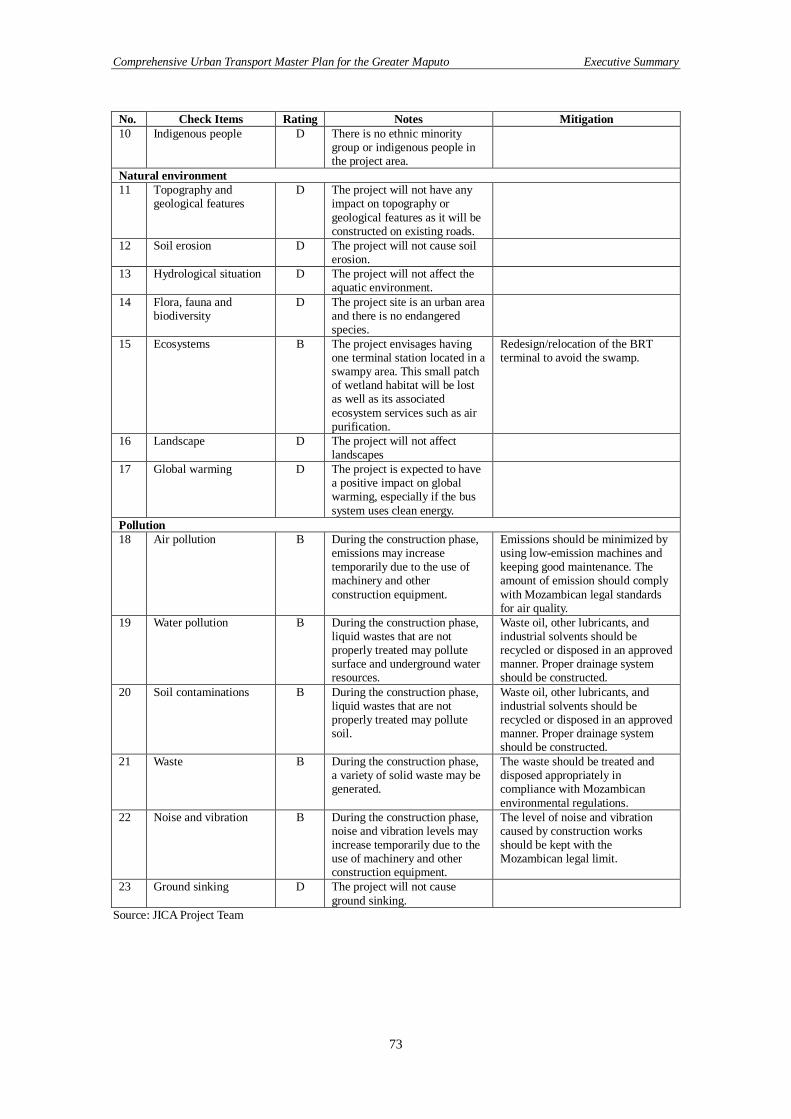
Comprehensive Urban Transport Master Plan for the Greater Maputo Executive Summary
73
No. Check Items Rating Notes Mitigation 10 Indigenous people D There is no ethnic minority
group or indigenous people in the project area.
Natural environment 11 Topography and
geological features D The project will not have any
impact on topography or geological features as it will be constructed on existing roads.
12 Soil erosion D The project will not cause soil erosion.
13 Hydrological situation D The project will not affect the aquatic environment.
14 Flora, fauna and biodiversity
D The project site is an urban area and there is no endangered species.
15 Ecosystems B The project envisages having one terminal station located in a swampy area. This small patch of wetland habitat will be lost as well as its associated ecosystem services such as air purification.
Redesign/relocation of the BRT terminal to avoid the swamp.
16 Landscape D The project will not affect landscapes
17 Global warming D The project is expected to have a positive impact on global warming, especially if the bus system uses clean energy.
Pollution 18 Air pollution B During the construction phase,
emissions may increase temporarily due to the use of machinery and other construction equipment.
Emissions should be minimized by using low-emission machines and keeping good maintenance. The amount of emission should comply with Mozambican legal standards for air quality.
19 Water pollution B During the construction phase, liquid wastes that are not properly treated may pollute surface and underground water resources.
Waste oil, other lubricants, and industrial solvents should be recycled or disposed in an approved manner. Proper drainage system should be constructed.
20 Soil contaminations B During the construction phase, liquid wastes that are not properly treated may pollute soil.
Waste oil, other lubricants, and industrial solvents should be recycled or disposed in an approved manner. Proper drainage system should be constructed.
21 Waste B During the construction phase, a variety of solid waste may be generated.
The waste should be treated and disposed appropriately in compliance with Mozambican environmental regulations.
22 Noise and vibration B During the construction phase, noise and vibration levels may increase temporarily due to the use of machinery and other construction equipment.
The level of noise and vibration caused by construction works should be kept with the Mozambican legal limit.
23 Ground sinking D The project will not cause ground sinking.
Source: JICA Project Team
Comprehensive Urban Transport Master Plan for the Greater Maputo Executive Summary
74
E.25 Recommendations E.25.1 Public Transport (1) Bus and Chapas The public transport system in Greater Maputo at present is primarily road-based. There is an extensive network of routes operated by minibuses, known as “chapas”, and some full-sized buses, mostly owned by public sector companies (EMTPM) operating on certain routes. Even after the completion of the BRT network recommended by the Master Plan, the role of conventional bus system remains crucial for passenger transport service in Greater Maputo. The following are recommendations for bus and chapas in relation to the N1 BRT Line: The conventional bus system should serve as a trunk system to supplement the BRT
system past its terminal points, in areas not densely populated enough to warrant BRT operations.
The bus system should also play a role as a feeder service to both the BRT and the commuter railway system.
The number of large-size buses should be increased to improve services and connectivity to BRT.
Chapas should be gradually replaced by large-size buses. Mini-size buses can be used as feeders in densely-populated suburban areas. A reorganization of bus route network should occur alongside the BRT implementation.
(2) BRT Bus Rapid Transit (BRT) is a bus system with priority over other traffic in order to provide adequate capacity where passenger volumes are very high. BRT is a term generally used to refer to a high-capacity bus system in which buses operate on tracks which are segregated from other traffic for all or part of the route. For the N1 BRT project the following is recommended: Buses and stations should be kept clean all the times. The safety of bus use should be maintained. Full accessibility to the entire system with a single ticket should be guaranteed in the
future. Electronic ticketing, such as currently used in Japan, should be introduced. Modern, high-efficiency, buses with high comfort levels should be used to attract
demand from a significant portion of the middle class. E.25.2 BRT Operation and Management If EMTPM is selected to serve as BRT system (part) operator for a transitional period,
targeted capacity development should be provided, including new skills in BRT technology and planning, accounting, labor/management relations, and customer service. Local chapa operators should be brought on board early on.
Measures should be taken to reduce the risk of using new technology, e.g., by not opting for exotic power plants, and instead choosing proven suppliers and technologies for intelligent transport systems, by seeking a guarantee of bus support from bus suppliers, and by requiring suppliers to provide performance bonds.23
Considering the risk that the payment of per km costs may not be met by fares and/or the contracted subsidy, it will be useful to have the ability to vary the passenger fare in line with inflation/costs to cover increased per km payments.
23 HSBC, How Banks Look at Bus Rapid Transit (BRT) Projects (and What Cities Can Learn from Them), 1 March 2010.
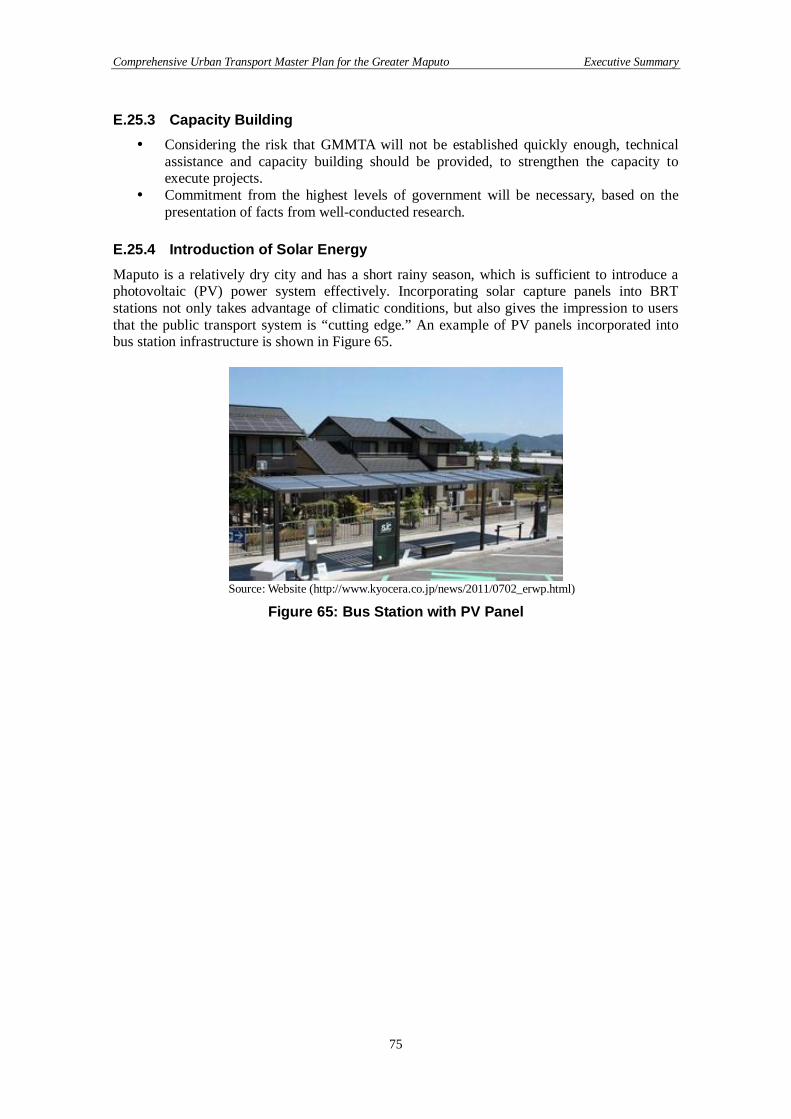
Comprehensive Urban Transport Master Plan for the Greater Maputo Executive Summary
75
E.25.3 Capacity Building Considering the risk that GMMTA will not be established quickly enough, technical
assistance and capacity building should be provided, to strengthen the capacity to execute projects.
Commitment from the highest levels of government will be necessary, based on the presentation of facts from well-conducted research.
E.25.4 Introduction of Solar Energy Maputo is a relatively dry city and has a short rainy season, which is sufficient to introduce a photovoltaic (PV) power system effectively. Incorporating solar capture panels into BRT stations not only takes advantage of climatic conditions, but also gives the impression to users that the public transport system is “cutting edge.” An example of PV panels incorporated into bus station infrastructure is shown in Figure 65.
Source: Website (http://www.kyocera.co.jp/news/2011/0702_erwp.html)
Figure 65: Bus Station with PV Panel