Embed Size (px)
Citation preview
JUN 5
SANDIA REPORTSAND2000-1280Unlimited ReleasePrinted May 2000/^
Comprehensive Testing to Measure theResponse of Butyl Rubber to Hanford
Waste Simulant
Prepared by /Sandia National LaboratoriesAlbuquerque, New Mexico 87185 and Livermore, California 94550
Sandia is a multiprogram laboratory operated by Sandia Corporation,a Lockheed Martin-Company, for the United States Department ofEnergy under'ContracTDE-AC04-94AL85000.
Approved for public release; further dissemination unlimited.
Sandia National Laboratories
Issued by Sandia National Laboratories, operated for the United StatesDepartment of Energy by Sandia Corporation.
NOTICE: This report was prepared as an account of work sponsored by anagency of the United States Government. Neither the United States Government,nor any agency thereof, nor any of their employees, nor any of their contractors,subcontractors, or their employees, make any warranty, express or implied, orassume any legal liability or responsibility for the accuracy, completeness, orusefulness of any information, apparatus, product, or process disclosed, orrepresent that its use would not infringe privately owned rights. Reference hereinto any specific commercial product, process, or service by trade name,trademark, manufacturer, or otherwise, does not necessarily constitute or implyits endorsement, recommendation, or favoring by the United States Government,any agency thereof, or any of their contractors or subcontractors. The views andopinions expressed herein do not necessarily state or reflect those of the UnitedStates Government, any agency thereof, or any of their contractors.
Printed in the United States of America. This report has been reproduced directlyfrom the best available copy.
Available to DOE and DOE contractors fromU.S. Department of EnergyOffice of Scientific and Technical InformationP.O. Box 62Oak Ridge, TN 37831
Telephone: (865)576-8401Facsimile: (865)576-5728E-Mail: [email protected] ordering: http://www.doe.gov/bridge
Available to the public fromU.S. Department of CommerceNational Technical Information Service5285 Port Royal RdSpringfield, VA 22161
Telephone: (800)553-6847Facsimile: (703)605-6900E-Mail: [email protected] order: http://www.ntis.gov/ordering.htm
DISCLAIMER
Portions of this document may be illegiblein electronic Image products. Images areproduced from the best available original
document
SAND2000-1280Unlimited ReleasePrinted May 2000
Comprehensive Testing to Measure theResponse of Butyl Rubber
to Hanford Tank Waste Simulant
P. J. NigreyTransportation Safety & Security Analysis Department
Sandia National LaboratoriesP.O. Box 5800
Albuquerque, NM 87185-0718
Abstract
This report presents the findings of the Chemical Compatibility Programdeveloped to evaluate plastic packaging components that may be incorporated inpackaging mixed-waste forms for transportation. Consistent with themethodology outlined in this report, we performed the second phase of thisexperimental program to determine the effects of simulant Hanford tank mixedwastes on packaging seal materials. That effort involved the comprehensivetesting of five plastic liner materials in an aqueous mixed-waste simulant. Thetesting protocol involved exposing the materials to -143,286, 571, and 3,670 kradof gamma radiation and was followed by 7-, 14-, 28-, 180-day exposures to thewaste simulant at 18, 50, and 60°C. Butyl rubber samples subjected to the sameprotocol were then evaluated by measuring seven material properties: specificgravity, dimensional changes, mass changes, hardness, compression set, vaportransport rates, and tensile properties. From the analyses, we determined thatbutyl rubber has relatively good resistance to radiation, this simulant, and acombination of these factors. These results suggest that butyl rubber is arelatively good seal material to withstand aqueous mixed wastes having similarcomposition to the one used in this study.
ACKNOWLEDGMENTS
The support of our sponsor, the U.S. Department of Energy, Office of Transportation (EM-24), isgratefully appreciated. Specifically, the encouragement provided by Arnie Justice and MonaWilliams in the DOE National Transportation Program Office is acknowledged. The technicalassistance provided by Tatianna G. Dickens was responsible for the timely completion of thiswork.
CONTENTS
ACKNOWLEDGMENTS 2
INTRODUCTION 7
TEST DESCRIPTION 11Materials 11Simulant Preparation 11Sample Preparation 11Sample Quantities 12Sample Irradiation 13Sample Exposure to Simulant 13Experimental Approach 14
RESULTS 17Specific Gravity 17Dimensional Properties 18Hardness Properties 20Compression Set 22Vapor Transport Rates 26Tensile Properties 28
Tensile Strength 29Elongation at Break or Ultimate Elongation 31Tensile Stress or 100% Modulus 34
DISCUSSION 39
CONCLUSIONS 43
REFERENCES 45
APPENDIX A. BUTYL RUBBER MATERIAL INFORMATION 47
APPENDDC B. BUTYL RUBBER SPECIFIC GRAVITY DATA 48
APPENDLX C. BUTYL RUBBER MASS DATA 49
APPENDIX D. BUTYL RUBBER DIMENSIONAL DATA 50
APPENDIX E. BUTYL RUBBER HARDNESS DATA 52
APPENDIX F. BUTYL RUBBER COMPRESSION SET DATA 53
APPENDIX G. BUTYL RUBBER VAPOR TRANSPORT RATE DATA 54
APPENDIX H. BUTYL RUBBER TENSILE STRENGTH DATA 55
APPENDIX I. BUTYL RUBBER ULTIMATE ELONGATION DATA 56
APPENDIX J. BUTYL RUBBER TENSILE STRESS DATA 57
LIST OF FIGURES
1. Comprehensive Seal Testing Strategy 16
2. Specific gravity (S. G.) changes in butyl rubber after exposure to ~0, 143, 286, 571, and3,670 krad of gamma radiation followed by exposure for 7 days (a), 14 days (b), 28 days(c), and 180 days (d) to the aqueous simulant waste at 18, 50, and 60°C 17
3. Mass changes in butyl rubber after exposure to ~0,143, 286, 571, and 3,670 krad ofgamma radiation followed by exposure for 7 days (a), 14 days (b), 28 days (c), and 180days (d) to the aqueous simulant waste at 18, 50, and 60°C 19
4. Volume (Vol.) changes in EPDM after exposure to ~0,143, 286, 571, and 3,670 krad ofgamma radiation followed by exposure for 7 days (a), 14 days (b), 28 days (c), and 180days (d) to the aqueous simulant waste at 18, 50, and 60°C 21
5. Hardness (Hard.) changes in butyl rubber after exposure to ~0, 143,286, 571, and 3,670krad of gamma radiation followed by exposure for 7 days (a), 14 days (b), 28 days (c),and 180 days (d) to the aqueous simulant waste at 18, 50, and 60°C 22
6. Compression set fixture, (a) A partly assembled fixture with the 4.5 mm spacer bars andbutyl rubber samples, (b) An assembled fixture with butyl rubber samples 23
7. Compression set (C. S.) changes in butyl rubber after exposure to -143, 286, 571, and3,670 krad of gamma radiation followed by exposure for 7 days (a), 14 days (b), 28 days(c), and 180 days (d) at 18, 50, and 60°C 24
8. Compression set (C. S.) changes in butyl rubber after exposure to ~0,143, 286, 571, and3,670 krad of gamma radiation followed by exposure for 7 days (a), 14 days (b), 28 days(c), and 180 days (d) to the aqueous simulant waste at 18, 50, and 60°C 25
9. Vapor Transmission Rate cells 27
10. VTR for butyl rubber after exposure to -0, 143, 286, 571, and 3,670 krad of gammaradiation followed by exposure for 7 days (a), 14 days (b), 28 days (c), and 180 days (d)to the aqueous simulant waste at 18, 50, and 60°C 28
11. Tensile strength (T. S.) changes in butyl rubber after exposure to -143, 286, 571, and3,670 krad of gamma radiation followed by exposure for 7 days (a), 14 days (b), 28 days(c), and 180 days (d) at 18, 50, and 60°C 30
12. Tensile strength (T. S.) changes in butyl rubber after exposure to -0,143, 286, 571, and3,670 krad of gamma radiation followed by exposure for 7 (a), 14 (b), 28 (c), and 180days (d) to the aqueous simulant waste at 18, 50, and 60°C 32
13. Ultimate elongation (U. EL.) changes in butyl rubber after exposure to -143,286, 571,and 3,670 krad of gamma radiation followed by exposure for 7 days (a), 14 days (b), 28days (c), and 180 days (d) at 18, 50, and 60°C 33
14. Ultimate elongation (U. EL.) changes in butyl rubber after exposure to ~0,143,286, 571,and 3,670 krad of gamma radiation followed by exposure for 7 (a), 14 (b), 28 (c), and 80days (d) to the aqueous simulant waste at 18, 50, and 60°C 34
15. Tensile stress (T. ST.) changes in butyl rubber after exposure to -143, 286, 571, and3,670 krad of gamma radiation followed by exposure for 7 (a), 14 (b), 28 (c), and 180days (d) at 18, 50, and 60°C 36
16. Tensile stress (T. ST.) changes in EPDM after exposure to -0 , 143, 286, 571, and 3,670krad of gamma radiation followed by exposure for 7 (a), 14 (b), 28 (c), and 180 days (d)to the aqueous simulant waste at 18,50, and 60°C 37

This page intentionally left blank.
INTRODUCTION
Hazardous and radioactive materials packaging is designed to facilitate the transport and storingof materials without posing a threat to the health or property of the general public. U.S.regulations establish general design requirements for such packagings. While no regulationshave been written specifically for mixed waste packaging, regulations for the constituents ofmixed wastes, that is, hazardous and radioactive substances, have been codified by the U.S.Department of Transportation (U.S. DOT, 49 CFR 173) and the U.S. Nuclear RegulatoryCommission (NRC, 10 CFR 71). The packaging materials and contents must be chemicallycompatible. Furthermore, Type A [49 CFR 173.412 (g)] and Type B (10 CFR 71.43) packagingdesign requirements stipulate that there be no significant chemical, galvanic, or other reactionbetween the materials and contents of the package.
Based on the federal requirements, a Chemical Compatibility Testing Program was developed inthe Transportation Technology Department at Sandia National Laboratories/New Mexico(SNL/NM). The program attempts to assure any regulatory body that the issue of certainpackaging material compatibility towards hazardous and radioactive materials has beenaddressed. This program was detailed in a 1993 milestone report1 submitted to the Departmentof Energy (DOE). The results of this program were reported to the DOE in various unpublishedmilestone documents and in a number of externally published papers.2"6
The milestone report Chemical Compatibility Test Plan and Procedure Report (CCTP&PR)describes a program to evaluate plastic transportation packaging components that may be usedin transporting mixed waste forms. Consistent with the methodology in the CCTP&PR, the firstphase of this experimental program has been completed. This effort involved screening tenplastic materials in four simulant mixed waste types.7 All materials that include "rubber" intheir names are used as seals; the others are used as liners. These plastics were as follows:
Sealsbutadiene-acrylonitrile copolymer rubber (Nitrile),epichlorohydrin rubber (EPI)isobutylene-isoprene copolymer rubber (Butyl),ethylene-propylene rubber (EPDM),fluorocarbon (FKM) rubber, andstyrene-butadiene rubber (SBR)
Linerscross-linked polyethylene (XLPE),high-density polyethylene (HDPE),fluorocarbon (Kel-F™)polytetrafluoroethylene (Generically PTFE or Teflon®),polypropylene (PP).
7

The selected simulant mixed wastes were
(1) an aqueous alkaline mixture of sodium nitrate and sodium nitrite;(2) a chlorinated hydrocarbon mixture;
(3) a simulant liquid scintillation fluid; and(4) a mixture of ketones.
The first phase of testing protocol involved exposing the materials to 286,000 rad (290 Krad) ofgamma radiation followed by 14-day exposures to the waste types at 60 °C. After radiation andchemical exposure, the seal materials or rubbers were tested using Vapor Transport Rate (VTR)measurements, while the liner materials were tested using specific gravity. For these tests,screening criteria of about 1 g/hr/m2 for VTR and a specific gravity change of 10% were used.Materials that failed to meet these criteria for all four waste types were judged to have failed thescreening tests and were excluded in the next phase of this experimental program. Based on thiswork, it was concluded that while all seal materials passed exposure to the aqueous simulantmixed waste, EPDM and SBR had the lowest VTRs. In the chlorinated hydrocarbon simulantmixed waste, only FKM rubber passed the screening tests. This means that only FKM rubberwould be selected for further testing in the chlorinated hydrocarbon simulant. In both thesimulant scintillation fluid mixed waste and the ketone mixture simulant mixed waste, none ofthe seal materials met the screening criteria. For specific gravity testing of liner materials, thedata showed that while all materials passed the screening criteria in the aqueous simulant, Kel-
F™, HDPE, and XLPE were found to offer the greatest resistance to the combination of radiationand chemicals.
Following the completion of these screening tests, the next phase of this program (i.e., thecomprehensive testing of liner materials in the aqueous simulant mixed waste) began. Sincescreening tests showed that all liner materials met the screening criteria when exposed to theaqueous simulant mixed waste, the five liner materials were subjected to comprehensive testing.The five materials evaluated consisted of HDPE, XLPE, PP, Kel-F™, and Teflon®. The testingprotocol involved exposing the respective materials to approximately 143, 286, 571, and 3,670krad of gamma radiation followed by 7-, 14-, 28-, 180-day exposures, respectively to the wastesimulant at 18, 50, and 60 °C. The radiation exposure values were calculated based on y-ray doserate data available to us for the components of a pump submerged in a specific storage tank atWestinghouse Hanford Company. These data indicate a maximum y-ray dose rate in the range of750 to 850 R/hour. The maximum dose rate of 850 rad/hour was used in calculating the dosethat container materials will receive from a 60Co source at Sandia National Laboratories. Usingthis dose rate, the four doses described above were calculated for 7-, 14-, 28-, 180-day exposures,respectively. From the data analyses, the fluorocarbon Kel-F™ was identified as having thegreatest chemical durability after exposure to gamma radiation followed by exposure to theHanford Tank simulant mixed waste. The most striking observation was the extremely poorperformance of PTFE when exposed to the higher radiation doses. Even at lower radiationexposures, PTFE exhibited significant losses in performance. These results were reported as aSandia Report8 to the DOE.
In this report, we present another part of the second-phase testing. Since all seal materials passedthe screening tests in the aqueous simulant mixed waste, all seal materials would be subjected tocomprehensive testing. While earlier studies investigated the response of EPDM rubber, thissecond-phase study involved the comprehensive testing of butyl rubber. The results ofcomprehensive testing of EPDM and butyl rubber have been reported to the DOE. A synopsis ofthe comprehensive test results for EPDM and butyl rubber was presented at the Fourth BiennialMixed Waste Symposium9 and at PATRAM '98. The comprehensive testing protocol involved
exposing butyl rubber to a matrix of four gamma radiation doses (-143, 286, 571, and 3,670Krad), three temperatures (18, 50, and 60 °C), four exposure times (7, 14, 28, and 180 days), andthe aqueous Hanford Tank simulant. It should be mentioned that while some butyl rubbersamples were exposed to only the simulant, other samples were only irradiated, and still otherswere irradiated and then exposed to the simulant to mimic the action of mixed wastes. Followingexposure to these conditions, the butyl rubber samples were evaluated by measuring sevenmaterial properties. These properties included specific gravity, dimensional changes, masschanges, hardness, compression set, VTR, and tensile properties.

This page intentionally left blank.
10

TEST DESCRIPTION
In this section, we describe the experimental aspects of the comprehensive phase of this testingprogram for elastomeric materials.
Materials
The selected material, butyl rubber, is an elastomer with known chemical resistance to hydraulicfluids, silicone fluids, and ketones. Butyl rubber is made by co-polymerizing isobutylene andjust enough isoprene to obtain the desired degree of unsaturation necessary for vulcanization.Appendix A provides additional information on this material including its initial properties.
Simulant Preparation
The simulant mixed waste form used in this testing phase was an aqueous alkaline Hanford tankwaste simulant. It was prepared by dissolving 179 g (2.10 moles) of sodium nitrate and 50 g(0.73 moles) sodium nitrite in deionized water (600 mL) using a 4-L beaker. After these saltshad completely dissolved, 82 g (2.05 moles) of sodium hydroxide were stirred into the solutionand slightly heated with a magnetic hotplate (Corning, Model PC-320). To this hot (~70°C),stirred solution, 17 g (0.107 moles) cesium chloride and 16 g (0.0952) strontium chloride wereadded. Finally, 32 g (0.301 moles) of sodium carbonate were added to the solution, resulting inthe formation of a copious amount of white precipitate. Due to its insolubility, this precipitatewas believed to be strontium carbonate. To the resulting mixture another 400 mL of deionizedwater was added to bring the total volume of water used to 1 L. After cooling to near ambienttemperature, the stirred mixture was stored in amber glass bottles (Fisher Scientific, #03-327-6).It should be mentioned that the procedure described above was scaled up threefold to give 3-Lbatches of the simulant. All chemicals used in the preparation of the waste simulant wereAmerican Chemical Society reagent grade chemicals. The above composition produced amixture with the following chemical concentrations:
2.1 Molar (M) sodium nitrate0.7 M sodium nitrite2.1 M sodium hydroxide0.3 M sodium carbonate0.1 M cesium chloride0.1 M strontium chloride
Sample Preparation
Standardized test methods were used to cut, condition, and test the materials. The geometry ofthe material samples was specified by the test method. The samples were cut using an expulsionpress (Part # 22-16-00) and dies manufactured by Testing Machines Inc., Amityville, NY. Forexample, the rectangular (1" x 2" x 0.125", 2.5 cm x 5.0 cm x 0.318 cm) samples required forspecific gravity and hardness measurements were cut in the expulsion press fitted with anexpulsion straight-edge die (Part #23-10-06). Rectangular (1" x 3" x 0.125", 2.5 cm x 7.6 cmx 0.318 cm) samples required for dimensional and mass measurements were cut in the expulsionpress fitted with an expulsion straight-edge die (Part #23-10-07). Circular discs (0.5" diameter x0.125" thick, 1.3 cm diameter x 0.318 cm thick) discs required for compression set
11

measurements were cut in the expulsion press fitted with a custom circular cutter from CCSInstruments, Akron, OH. Larger circular discs (2.69" diameter x 0.125" thick, 6.83 cm diameterx 0.318 cm thick) required for VTR measurements were cut in the expulsion press fitted with anexpulsion die (Part #23-00-00) specifically designed for the American Society for Testing andMaterials ASTM D 814 standard testing method." Similarly, the Type C tensile samplesrequired for tensile testing were cut in the expulsion press fitted with an expulsion die (Part # 23-14-08) specifically designed for use in the ASTM D 412-Method A.12
The use of a press and dies permitted the cutting of multiple samples having uniform dimensions.For identification of samples, an identification code was developed to uniquely indicate the testtype, sample number, and testing conditions. The black butyl rubber samples were individuallylabeled using indelible ink marking pens. As recommended by ASTM D 1349,13 the plasticswere conditioned at a standard temperature of 73.4T (23°C) and relative humidity of 50% for atleast 24 hours prior to the testing process. This was done by storing the cut samples in adesiccator filled with magnesium nitrate hexahydrate (500 g) saturated with water. Ahumidity/temperature sensor was used to monitor the conditions in the desiccator. Proceduresfor generating this constant relative humidity environment are described in ASTM E 104.14
During conditioning, the samples were stacked and separated from each other with -1/16" (-0.16cm) thick metal pins. The required number of samples for each test was bundled together usingplastic cable ties by procedures described in a subsequent section.
Sample Quantities
Some butyl rubber samples were exposed to gamma radiation alone, some to the simulant(chemicals) alone, and some to a combination of radiation followed by exposure to the simulant.Since radiation was expected to have the greatest effect on the compression set and tensileproperties of butyl rubber, we prepared specific samples for radiation exposure alone. Thesesamples were referred to as Rad Only samples. The purpose of exposing certain samples to onlygamma radiation, while other samples received exposure to both radiation and chemicals, was todifferentiate the effects of radiation alone from those when two environmental conditions(radiation and simulant) were applied.
For Rad Only compression set measurements, 48 samples (two specimens per test) were cut forthe matrix of four radiation doses, four exposure times, and three exposure temperatures for atotal of 96 samples. The exposure times for Rad Only samples represent the time periods (7, 14,28, and 180 days) that the samples were held at the respective temperatures. Tensile propertymeasurements (five specimens per test) for Rad Only samples required the preparation of 240samples. For these two measurements, 336 samples were needed for these two measurements.In view of the perceived effect of radiation on compression set and tensile propertymeasurements, the material properties of butyl rubber were measured prior to exposure to eitherradiation and temperature. These measurements required the preparation of an additional7 samples.
Simulant Only samples, referred to as 0 krad samples (OK in the appendices) in subsequentdiscussions, were required for each of the seven measurements. For specific gravity andhardness measurements, a total of 12 samples was required. Dimensional and massmeasurements (three per test) required the preparation of 9 samples. For VTR measurements(three per test), 9 samples were needed. Compression set measurements required 24 samples.Finally, tensile property measurements required 60 samples. Thus, a total of 114 samples were
12
required for all 7 Simulant Only tests. These samples were exposed to the aqueous simulant forthe four time periods at the three temperatures.
We now turn to the samples required for exposure to the combination of radiation and chemicals.For specific gravity and hardness measurements, 48 samples were cut out for the combination ofthree temperatures, four radiation doses, and four time periods for the specific gravity andhardness measurements. For dimensional and mass measurements, 36 samples were prepared.Compression set measurements involved 96 samples. VTR measurements involved 36 samples,and tensile testing involved 240 samples. Thus for all seven measurements, 456 samples wereprepared for exposure to the three temperatures and four radiation doses. For nondestructivetests such as specific gravity, dimensional, mass, hardness, and VTR measurements, the samesamples were reused for the other exposure times (i.e., one sample set was used for 7-, 14-, 28-,and 180-day exposures at each temperature and for each radiation dose).
A total of 913 butyl rubber samples were used to perform the various measurements.
Sample Irradiation
The elastomer samples were irradiated by an underwater 60Co gamma source at SNL/NM. Thesesamples were loaded into a metal basket in the same configuration that was used to condition thesamples (i.e., the samples were stacked and separated by a metal spiral or by metal pins). Thebasket was then inserted into a water-tight stainless steel canister (volume ~4 L). The canisterwas sealed and lowered into the pool to a depth of 6 feet, purged with slow steady flow(-30 mL/min) of dry air, and allowed to come to thermal equilibrium at either ambient (-32), 50,or 60°C.15 Once thermal equilibrium was attained within the canister immersed in the pool ofwater, the canister was lowered into its irradiation location in the pool and exposure was begunto obtain the desired radiation dosage. The highest dose rate currently available at the LowIntensity Cobalt Array (LICA) Facility is -730 krad/hr. The array used for irradiating thesesamples had dose rates of-95 krad/hr. Thus when a gamma-ray dose of 143 krad was required,the samples were exposed for approximately 1.5 hours. For doses of 286, 571, and 3,670 krad(3.67 Mrad), the corresponding longer exposure times were needed. After the samples receivedthe calculated radiation dosage, the canister was removed from the pool, and the samples wereagain placed in the conditioning chambers. No more than 24 hours typically elapsed between thetime that the samples had been exposed to radiation and when they were exposed to the simulantwaste or the test temperatures.
Sample Exposure to Simulant
The general exposure protocol for specific gravity samples involved placing four specimens ofthe butyl rubber into a container and exposing them to the aqueous simulant at three temperaturesand four time periods. The four specimens were bundled together using 7-1/2" (19 cm) nyloncable ties. Within each bundle, the specimens were separated by -1/16" (0.16 cm) metal pinsused as spacers. This allowed the waste of simulant ready access to all surfaces of eachspecimen. A 2-L glass bottle or 2-L plastic container was loaded with the four bundled testspecimens and then filled with 1,600 mL of the test solution. Care was taken to ensure thatsufficient simulant waste was present to expose the entire surface area of all the samples. Afteradding the liquid simulant waste, the plastic lid was attached to the jar and tightened. The jarswere placed in respective environmental chambers maintained at 18, 50, and 60°C. The jars werekept in these environmental chambers for 7, 14, 28, and 180 days. Similar procedures were
13
followed for each of the other four testing procedures (i.e., dimensional testing, hardness testing,compression set tests, and tensile tests). In the case of VTR measurements, each of three 1/2 pint(-236 mL) Mason jars (Kerr Group, Inc., Los Angeles, CA, Part # 70610-3) was filled withapproximately 200 mL of the test solution. The butyl rubber discs were loosely attached to thejars with metal bands. The jars were placed in an upright configuration (butyl rubber and bandfacing up) into the respective environmental chambers. The jars were held at the respective testtemperatures for one hour to equilibrate. After sealing and weighing them, the jars were placedin the chambers again in an inverted position and held at the specific test temperature for therequired time period.
Experimental Approach
The material properties that should be evaluated to assess the suitability of potential elastomericmaterials in mixed waste packaging designs are specific gravity changes, dimensional changes(including mass and dimensional measurements), hardness, compression set, VTR, and tensileproperty changes (tensile strength, tensile stress, and ultimate elongation). Since measuring allthe material properties was expected to be costly and time consuming, screening tests withrelatively severe exposure conditions such as high temperatures and high radiation levels wereimplemented to quickly reduce the number of possible materials for full evaluation. It isgenerally recognized that polymeric materials are susceptible to degradation due to hightemperature and high radiation doses. The results of these screening studies have beenpreviously at several technical conferences,2'6 and in a SAND Report.7 From the screening studyit was found that all of the selected seal materials had passed the screening criteria in the aqueoussimulant mixed waste. This then necessitated testing six materials by exposure to a matrix offour radiation doses, three temperatures, and four exposure times in the simulant waste. In viewof the extensive number of materials and exposure conditions, this second phase of the programwas referred to as Comprehensive Testing Phase.
Because of budget constraints imposed on this program, testing was subdivided intocomprehensive testing on liner materials and seal materials. The order of testing for theindividual elastomers was established by the degree of response in the aqueous simulant. Inother words, the best elastomer was evaluated first while the worst elastomer was evaluated last.From the data given in a previously published SAND report,7 the best-to-worst materials in theaqueous simulant were determined to be EPDM, Butyl, SBR, Nitrile, Viton®, and EPI rubber.Accordingly, the first material evaluated was EPDM rubber.16 The next elastomer to beevaluated was butyl rubber.
The evaluation parameters used in this comprehensive testing phase consisted of measuring thespecific gravity, dimensions, mass, hardness, compression set, VTR, and tensile properties of theseal materials. Tensile properties for elastomers included tensile strength, ultimate elongation,and tensile stress. These parameters were evaluated using standardized test methods developedby the ASTM. For specific gravity measurements, ASTM D 79217 was used. In measuringdimensions and mass, ASTM D 54318 was used. For hardness measurements, ASTM D 224019
was used. In evaluating compression set, ASTM D 395 - Method B20 was used. However, inusing ASTM D 395, two samples, each of 0.125" (3.17 mm) thickness were held at ambienttemperature with a spacer bar thickness of 4.5 mm. For VTR measurements, ASTM D 814 wasused, and, for evaluating tensile properties, ASTM D412 - Method A was used.
14
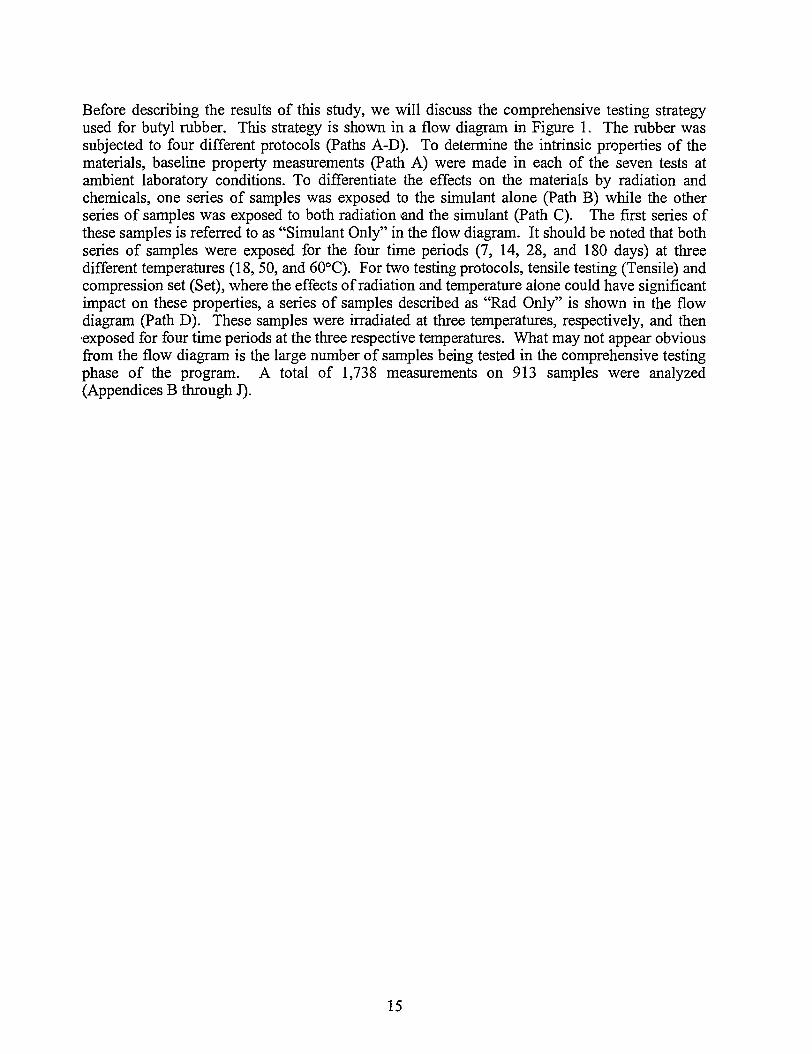
Before describing the results of this study, we will discuss the comprehensive testing strategyused for butyl rubber. This strategy is shown in a flow diagram in Figure 1. The rubber wassubjected to four different protocols (Paths A-D). To determine the intrinsic properties of thematerials, baseline property measurements (Path A) were made in each of the seven tests atambient laboratory conditions. To differentiate the effects on the materials by radiation andchemicals, one series of samples was exposed to the simulant alone (Path B) while the otherseries of samples was exposed to both radiation -and the simulant (Path C). The first series ofthese samples is referred to as "Simulant Only" in the flow diagram. It should be noted that bothseries of samples were exposed for the four time periods (7, 14, 28, and 180 days) at threedifferent temperatures (18, 50, and 60°C). For two testing protocols, tensile testing (Tensile) andcompression set (Set), where the effects of radiation and temperature alone could have significantimpact on these properties, a series of samples described as "Rad Only" is shown in the flowdiagram (Path D). These samples were irradiated at three temperatures, respectively, and then•exposed for four time periods at the three respective temperatures. What may not appear obviousfrom the flow diagram is the large number of samples being tested in the comprehensive testingphase of the program. A total of 1,738 measurements on 913 samples were analyzed(Appendices B through J).
15
Path A
PathB
Exposure to Simulant
4 Times at 3 Temperatures
"Simulant Only"(AH Tests)
- "Baseline'
Seal Material
Butyl Rubber
Gamma Irradiation
4 Doses at 3 Temperatures
PathC
Exposure to Simulant
4 Times at 3 Temperatures
"Radiation and Simulant"
Testing
7 Tests
Data Analysis
1738 Measurements
Database Development
PathD
Temperature Exposure
4 Times at 3 Temperatures
"Rad Only"
iTesting
2 Tests(Tensile, Set)
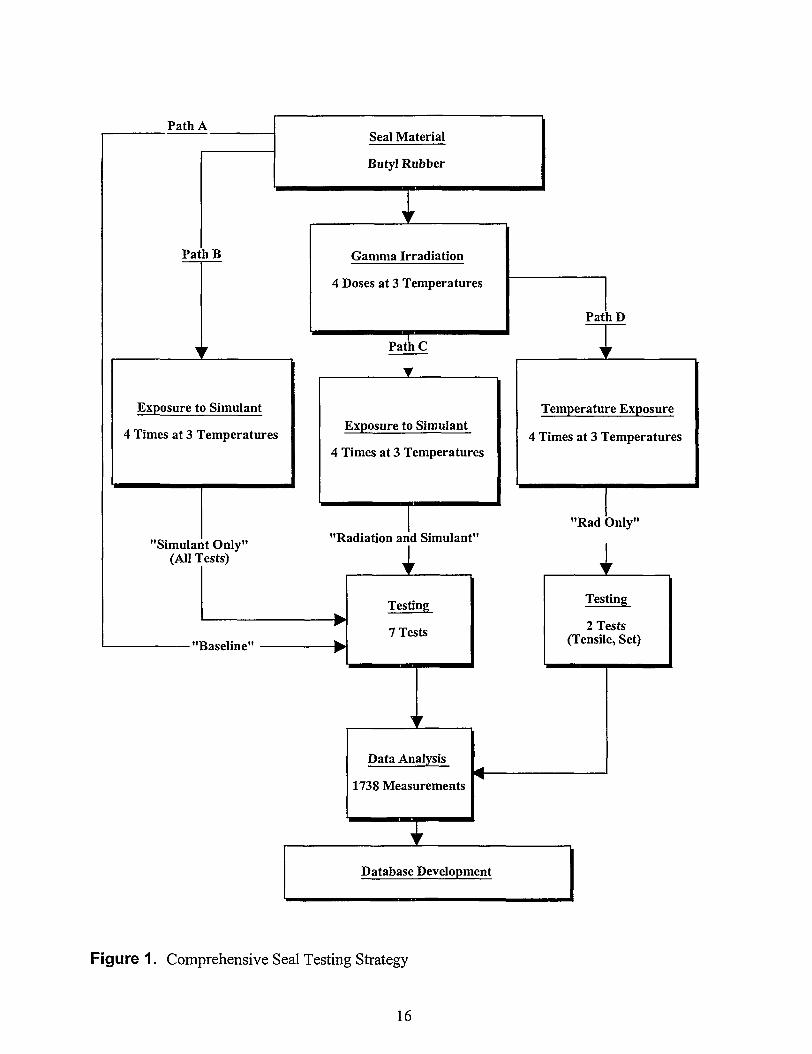
Figure 1. Comprehensive Seal Testing Strategy
16

RESULTS
Specific Gravity
Specific gravity measurements, also known as relative density measurements, measure thedensities of materials that have been exposed to different conditions. A decrease in density ofthe material can indicate leaching or swelling, and swelling can lead to increases in permeability.Such indications of increases in permeability in the material will also be confirmed by VTRmeasurements. Increases in density are caused by absorption of the test liquid, indicating higherpermeability of the test liquid.
In Figure 2, the effects of exposure time, gamma radiation dose, and exposure temperature of theaqueous simulant on butyl rubber are shown.
TEMPERATURE
143 286 .
RADIATION DOSE (krad)
60 C
5 0 0 TEMPERATURE
u 143 •»a2 3 6 57' 3.670
RADIATION DOSE (krad)
(a) (b)
S.G. CHANGE
60 C
5 0 0 TEMPERATURE
RADIATION DOSE (krad)
TEMPERATURE
(c) (d)
Figure 2. Specific gravity (S.G.) changes in butyl rubber after exposure to ~0,143, 286, 571,and 3,670 krad of gamma radiation followed by exposure for (a) 7 days, (b) 14 days, (c) 28days, and (d) 180 days to the aqueous simulant waste at 18, 50, and 60°C.
17
These three-dimensional bar graphs provide a plot of radiation dose, exposure temperature, andthe average percent specific gravity change in the x, y, z directions, respectively. Where theradiation dose is indicated as 0 krad, the samples received no gamma radiation and were onlyexposed to the simulant (i.e., these samples are the "Simulant Only" samples discussed earlier).It should be noted that the scale for these specific changes is rather small (e.g., from 0 to 1%, andeither positive or negative). In Figure 2 and all subsequent figures, negative changes can berecognized by the dark bar tops in the x-y plane. These bars project into the negative portion ofthe graph. The sign of the specific gravity indicates whether specific gravity has increased ordecreased when compared-to the virgin material (i.e., the specific gravity of butyl rubber atambient conditions). Therefore, changes in the magnitude and the sign of specific gravity valuesindicate changes in this property. The greater the absolute values of the changes, the more thematerials are affected by the specific set of environmental conditions. Since properly engineeredpackaging components are not expected to be affected by the contents of the package, such asaqueous mixed wastes, elastomers exhibiting the smallest change in specific gravity should beselected as packaging components.
From an overall perspective, the data in Figure 2 show that the temperature of the simulant, theradiation dose, and the exposure time have effects on the specific gravity of butyl rubber. Withincreased temperatures and longer exposure times, increased specific gravity changes wereobserved. Radiation exposure appears not to exhibit a demonstrable effect on butyl rubber.However, since these changes are only at the 1% levels, the results are consistent with the knownchemical resistance of this elastomer and demonstrate that butyl rubber is a suitable elastomer foruse under these conditions, if specific gravity is the determining package design criterion. Whilethe exact specific gravity values are not obvious from the data in the previous figure, their precisevalues can be found in Appendix B of this report.
In the following section, we present the results of the effects of only the simulant waste and acombination of radiation and the simulant on the dimensional properties of butyl rubber.
Dimensional Properties
Similar to specific gravity measurements, dimensional property measurements can provideimportant information about the effects of different environmental conditions on materials.Specifically, increases or decreases in the dimensions of the material may indicate materialswelling or component leaching. The dimensional properties measured and reported in thissection include changes in length, width, and thickness of the material. Since the standard testmethod ASTM D 543 is used to measure dimensional properties and includes the determinationof mass as part of the test, mass was also measured. Dimensional changes are described byevaluating volume, length x width x thickness. The technical justification for using thisapproach is that, while length and width changes have generally been much smaller thanthickness changes, the product of these changes encompasses individual components into onegeneral dimensional property, the volume of the materials. The effects of the differentenvironment conditions on the mass changes will be presented first.
18
UAS3CHAN0E
TEMPERATURE
RAHATIOH DOSE (krad)
MASS CHANGE
3t2-
^ •
-1
-2
-3
RADIATION DOSE (krad)
.
i
. y~ ~ I:"'C TEMPERATURE
"-. --*..-" 7 18 C
3.S70
(a) (b)
MASSCHANOE
<*)MASS CHANGE
0 143
RADIATION DOSE (krod) RADIATION DOSE (krari)
(c) (d)
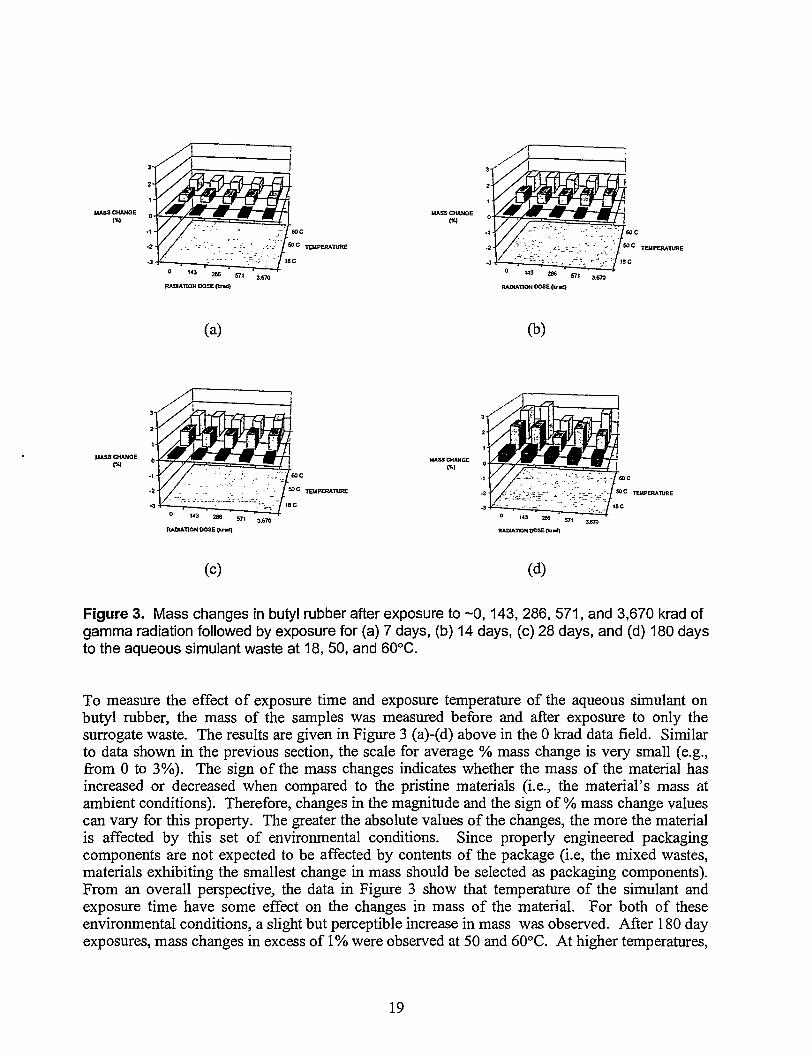
Figure 3. Mass changes in butyl rubber after exposure to ~0,143, 286, 571, and 3,670 krad ofgamma radiation followed by exposure for (a) 7 days, (b) 14 days, (c) 28 days, and (d) 180 daysto the aqueous simulant waste at 18, 50, and 60°C.
To measure the effect of exposure time and exposure temperature of the aqueous simulant onbutyl rubber, the mass of the samples was measured before and after exposure to only thesurrogate waste. The results are given in Figure 3 (a)-(d) above in the 0 krad data field. Similarto data shown in the previous section, the scale for average % mass change is very small (e.g.,from 0 to 3%). The sign of the mass changes indicates whether the mass of the material hasincreased or decreased when compared to the pristine materials (i.e., the material's mass atambient conditions). Therefore, changes in the magnitude and the sign of % mass change valuescan vary for this property. The greater the absolute values of the changes, the more the materialis affected by this set of environmental conditions. Since properly engineered packagingcomponents are not expected to be affected by contents of the package (i.e, the mixed wastes,materials exhibiting the smallest change in mass should be selected as packaging components).From an overall perspective, the data in Figure 3 show that temperature of the simulant andexposure time have some effect on the changes in mass of the material. For both of theseenvironmental conditions, a slight but perceptible increase in mass was observed. After 180 dayexposures, mass changes in excess of 1% were observed at 50 and 60°C. At higher temperatures,
19

the larger mass changes are observed. While the exact mass values are not obvious from the datain the previous figure, their precise values can be found in Appendix C of this report.
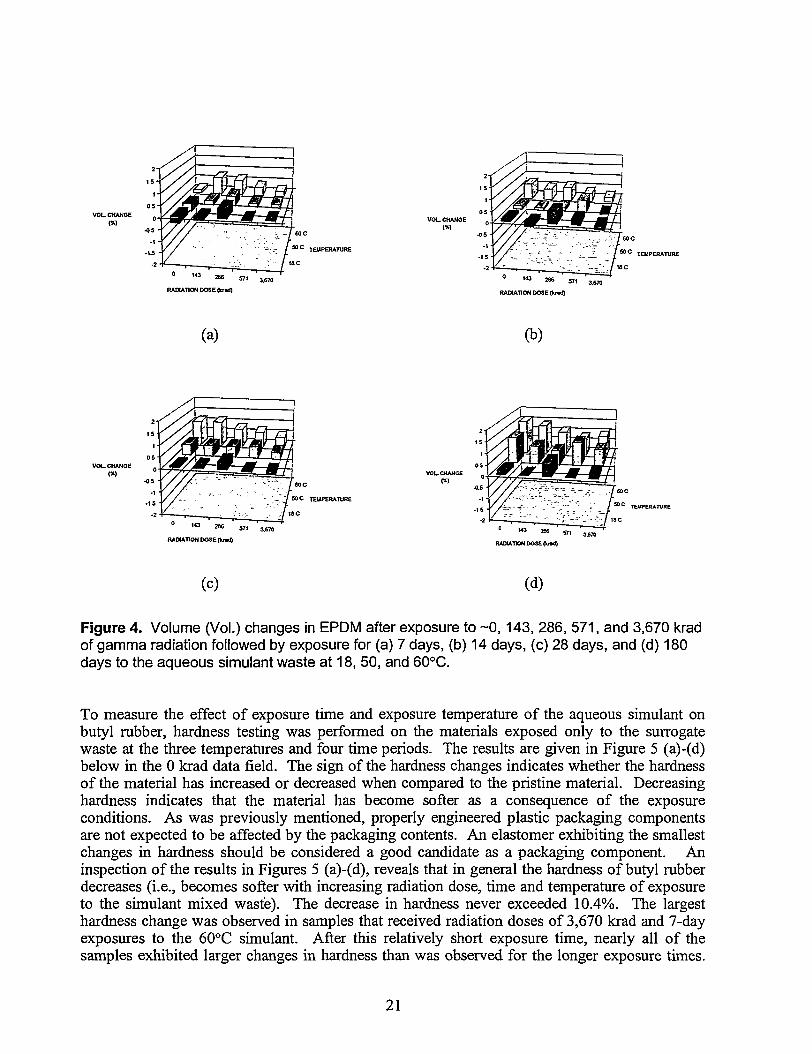
In Figure 4 (a)-(d), the average % volume changes of butyl rubber exposed to the four gammaradiation doses followed by exposure to the aqueous simulant waste at 18, 50, and 60°C for 7,14, 28, and 180 days are given. Butyl rubber had volume changes of less than -1.4% under theseconditions. In many cases the volume changes were even smaller (i.e., in the -0.5% range). Incertain instances, there were small negative volume changes, recognized by the darkly coloredtop surface of the bar graph. With increased exposure time and exposure temperature, there is aslight increase in the sample volume (i.e., butyl rubber appears to swell when exposed to theseenvironmental conditions). A general trend suggests that with increasing exposure time most ofthe butyl rubber samples expanded. The greatest volume changes can be seen in Figure 4 (d),where butyl rubber exhibited the greatest changes in volume at 50 and 60°C. It should be noted,however, that these changes are only at the 1 - 1.5% level. While the exact volume values arenot obvious from the data in the previous figure, their precise values can be found in Appendix Dof this report.
Hardness Properties
The measurement of changes in the hardness of materials can provide important clues about theeffects of environmental conditions on the material; that is, if the hardness of the material hasdecreased, the material may have swelled, or the polymeric constituents of the elastomer mayhave substantially degraded. Conversely, if the hardness of the material has increased, additionalpolymer cross-linking may have resulted. These measurements, in addition to providingimportant data, may complement other measurements such as specific gravity, dimensional, andtensile properties.
A standard instrument manufactured by Shore Instrument Company, known as a Shoredurometer, is used to measure hardness. The degree of hardness that the plastic material exhibitswill dictate the type of durometer used. For elastomers, which in relative terms tend to be rathersoft, a type A durometer is used. Similar to the approach used for the previously describedproperty measurements, the initial hardness values (65 Shore A hardness points) weredetermined for pristine samples (i.e., samples not exposed to anything). Using these initialhardness values, % hardness changes were measured for samples exposed to the simulant alone(see 0 krad data field in Fig. 5 (a)-(d) at the three temperatures and four exposure times) and to acombination of radiation and simulant at these temperatures and exposure times. We will nowpresent the results of these measurements.
20
V O L CHANGEVOL. CHANGE
TO
TEUPERATURE
RADIATION DOS E (krad)571 3.670
RADIATION DOSE <to*l)
(a) (b)
VOL. CHANCE
TEMPERATURE
RADIATION DOSE (knd)RAOtADON DOSE {krad)
(c) (d)
Figure 4. Volume (Vol.) changes in EPDM after exposure to ~0,143, 286, 571, and 3,670 kradof gamma radiation followed by exposure for (a) 7 days, (b) 14 days, (c) 28 days, and (d) 180days to the aqueous simulant waste at 18, 50, and 60°C.
To measure the effect of exposure time and exposure temperature of the aqueous simulant onbutyl rubber, hardness testing was performed on the materials exposed only to the surrogatewaste at the three temperatures and four time periods. The results are given in Figure 5 (a)-(d)below in the 0 krad data field. The sign of the hardness changes indicates whether the hardnessof the material has increased or decreased when compared to the pristine material. Decreasinghardness indicates that the material has become softer as a consequence of the exposureconditions. As was previously mentioned, properly engineered plastic packaging componentsare not expected to be affected by the packaging contents. An elastomer exhibiting the smallestchanges in hardness should be considered a good candidate as a packaging component. Aninspection of the results in Figures 5 (a)-(d), reveals that in general the hardness of butyl rubberdecreases (i.e., becomes softer with increasing radiation dose, time and temperature of exposureto the simulant mixed waste). The decrease in hardness never exceeded 10.4%. The largesthardness change was observed in samples that received radiation doses of 3,670 krad and 7-dayexposures to the 60°C simulant. After this relatively short exposure time, nearly all of thesamples exhibited larger changes in hardness than was observed for the longer exposure times.
21
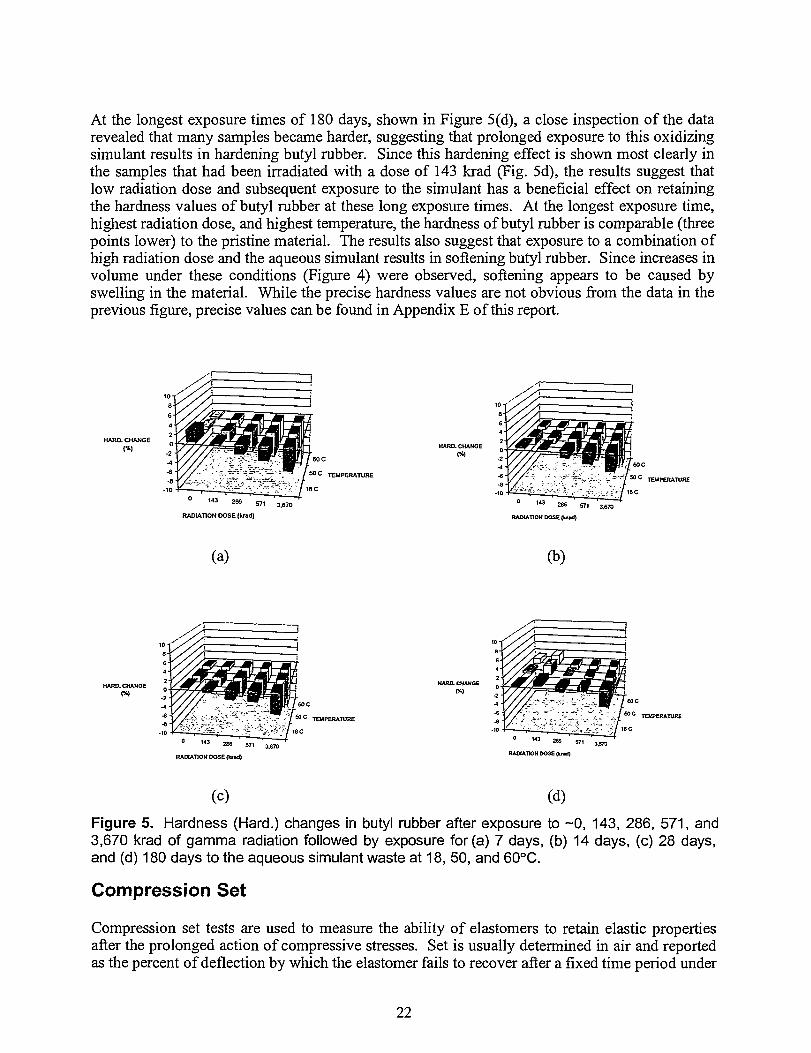
At the longest exposure times of 180 days, shown in Figure 5(d), a close inspection of the datarevealed that many samples became harder, suggesting that prolonged exposure to this oxidizingsimulant results in hardening butyl rubber. Since this hardening effect is shown most clearly inthe samples that had been irradiated with a dose of 143 krad (Fig. 5d), the results suggest thatlow radiation dose and subsequent exposure to the simulant has a beneficial effect on retainingthe hardness values of butyl rubber at these long exposure times. At the longest exposure time,highest radiation dose, and highest temperature, the hardness of butyl rubber is comparable (threepoints lower) to the pristine material. The results also suggest that exposure to a combination ofhigh radiation dose and the aqueous simulant results in softening butyl rubber. Since increases involume under these conditions (Figure 4) were observed, softening appears to be caused byswelling in the material. While the precise hardness values are not obvious from the data in theprevious figure, precise values can be found in Appendix E of this report.
HARD. CHANGE
1%) HARD. CHANGE
TEMPERATURETEMPERATURE
571 3.670RADIATION DOSE (krad) RADIATION DOSE (ki»d)
(a) (b)
HARD. CHANGE HARD. CHANCE
TEMPERATURE
143
RADIATION DOSE (lend)
TEMPERATURE
--_•- ~ : ,.?;„ h~ -/ •, ,fj 1BC
RADIATION DOSE (fcr*d)
(C) (d)
Figure 5. Hardness (Hard.) changes in butyl rubber after exposure to -0 , 143, 286, 571, and3,670 krad of gamma radiation followed by exposure for (a) 7 days, (b) 14 days, (c) 28 days,and (d) 180 days to the aqueous simulant waste at 18, 50, and 60°C.
Compression Set
Compression set tests are used to measure the ability of elastomers to retain elastic propertiesafter the prolonged action of compressive stresses. Set is usually determined in air and reportedas the percent of deflection by which the elastomer fails to recover after a fixed time period under
22
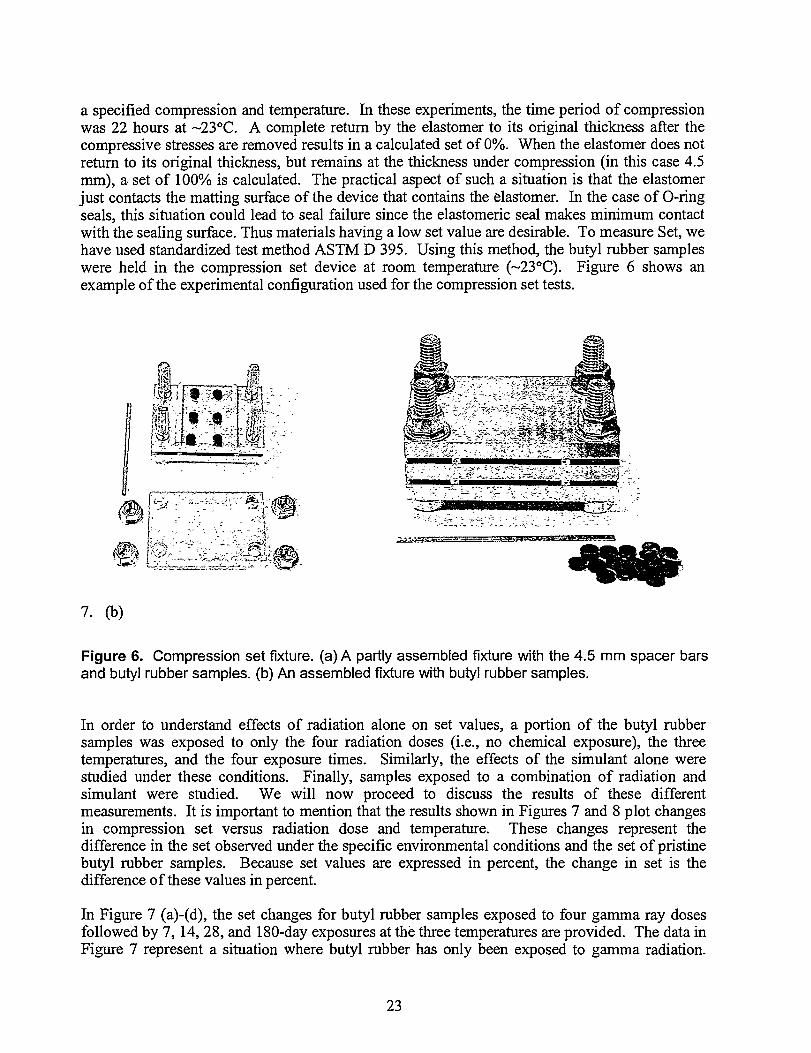
a specified compression and temperature. In these experiments, the time period of compressionwas 22 hours at ~23°C. A complete return by the elastomer to its original thickness after thecompressive stresses are removed results in a calculated set of 0%. When the elastomer does notreturn to its original thickness, but remains at the thickness under compression (in this case 4.5mm), a set of 100% is calculated. The practical aspect of such a situation is that the elastomerjust contacts the matting surface of the device that contains the elastomer. In the case of O-ringseals, this situation could lead to seal failure since the elastomeric seal makes minimum contactwith the sealing surface. Thus materials having a low set value are desirable. To measure Set, wehave used standardized test method ASTM D 395. Using this method, the butyl rubber sampleswere held in the compression set device at room temperature (~23°C). Figure 6 shows anexample of the experimental configuration used for the compression set tests.
7. (b)
Figure 6. Compression set fixture, (a) A partly assembled fixture with the 4.5 mm spacer barsand butyl rubber samples, (b) An assembled fixture with butyl rubber samples.
In order to understand effects of radiation alone on set values, a portion of the butyl rubbersamples was exposed to only the four radiation doses (i.e., no chemical exposure), the threetemperatures, and the four exposure times. Similarly, the effects of the simulant alone werestudied under these conditions. Finally, samples exposed to a combination of radiation andsimulant were studied. We will now proceed to discuss the results of these differentmeasurements. It is important to mention that the results shown in Figures 7 and 8 plot changesin compression set versus radiation dose and temperature. These changes represent thedifference in the set observed under the specific environmental conditions and the set of pristinebutyl rubber samples. Because set values are expressed in percent, the change in set is thedifference of these values in percent.
In Figure 7 (a)-(d), the set changes for butyl rubber samples exposed to four gamma ray dosesfollowed by 7, 14, 28, and 180-day exposures at the three temperatures are provided. The data inFigure 7 represent a situation where butyl rubber has only been exposed to gamma radiation.
23
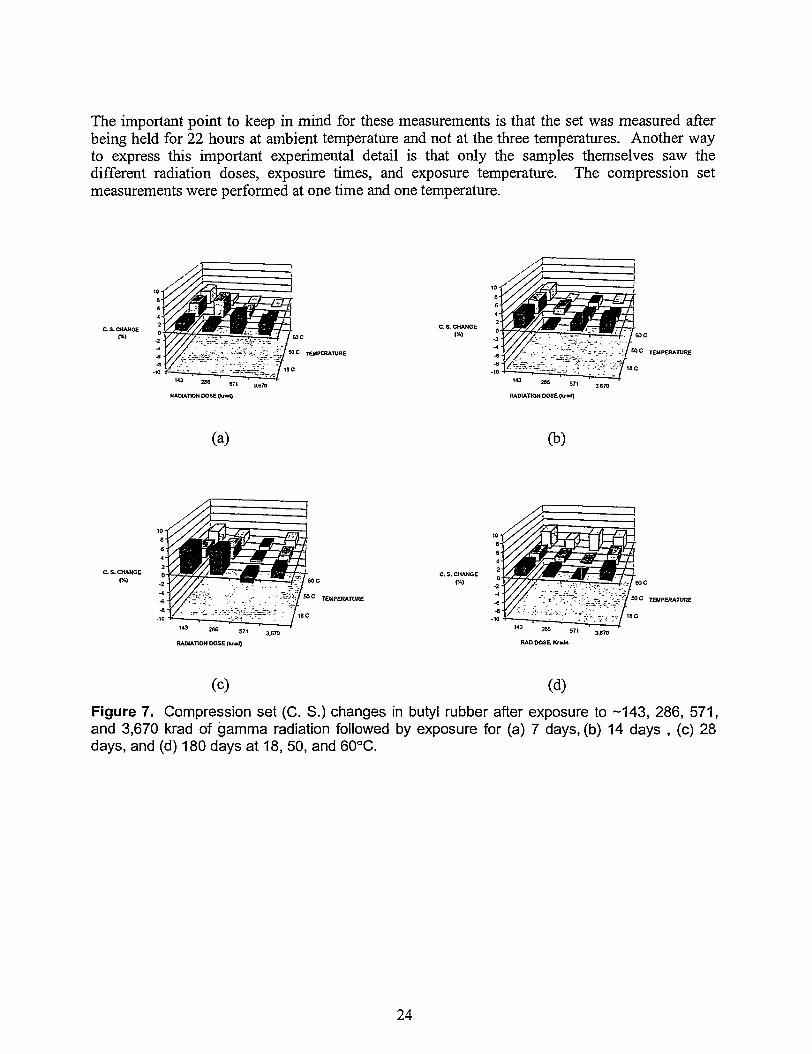
The important point to keep in mind for these measurements is that the set was measured afterbeing held for 22 hours at ambient temperature and not at the three temperatures. Another wayto express this important experimental detail is that only the samples themselves saw thedifferent radiation doses, exposure times, and exposure temperature. The compression setmeasurements were performed at one time and one temperature.
C.S. CHANGE(X)
C S. CHANGE
' « 286
RADIATION DOSE
TEMPERATURE
RADIATION DOSE Ojadj
(a) (b)
C. S. CHANCE
TO 60O
• ; S S j ; 7 S 0 C TEMPERATURE
C. S. CHANGE
TO
571
RADIATION DOSE (kracQ
TEMPERATURE
(c) (d)
Figure 7. Compression set (C. S.) changes in butyl rubber after exposure to -143, 286, 571,and 3,670 krad of gamma radiation followed by exposure for (a) 7 days, (b) 14 days , (c) 28days, and (d) 180 days at 18, 50, and 60°C.
24
C. S. CHAHOE. CHANGE
eoc
5 0 C TEMPERATURE
ISC
RADIATION DOSE (krad)
GOC
8 ) 0 TEMPERATURE
1 4 3 2 W 571
RADIATION DOSE {krad)
(a) (b)
TEMPERATURE
RADIATION DOSE [knd] RADIATION DOSE (fcnd)
(C) (d)
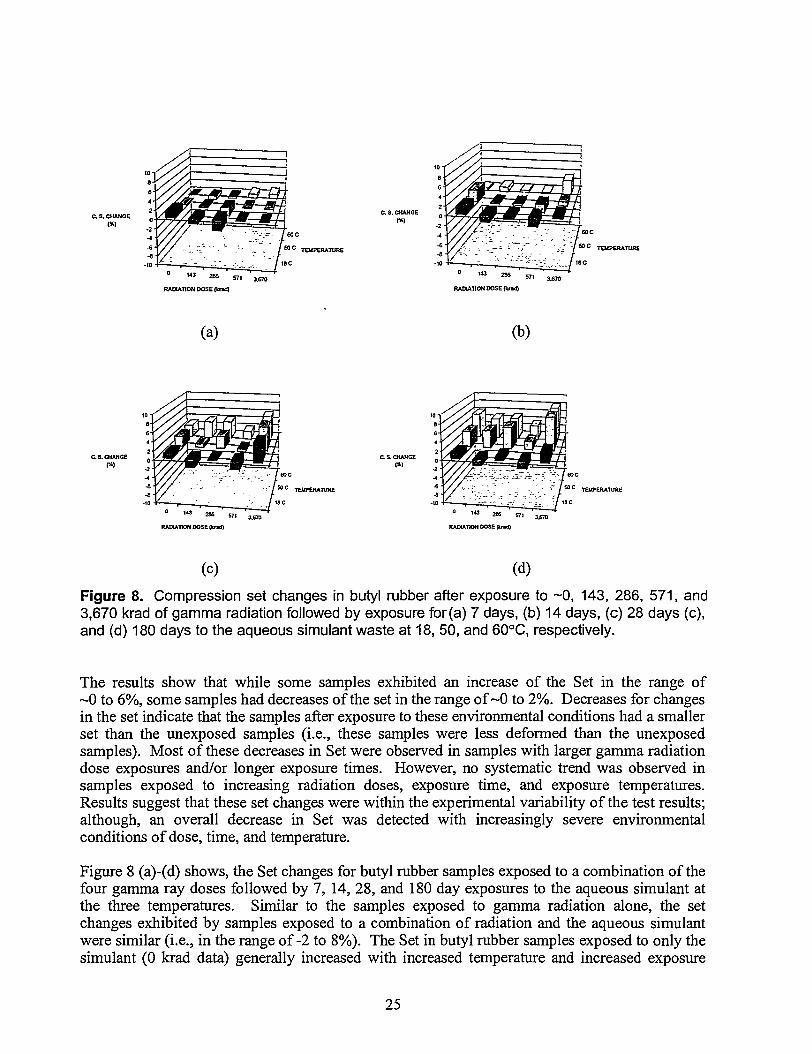
Figure 8. Compression set changes in butyl rubber after exposure to ~0, 143, 286, 571, and3,670 krad of gamma radiation followed by exposure for(a) 7 days, (b) 14 days, (c) 28 days (c),and (d) 180 days to the aqueous simulant waste at 18, 50, and 60°C, respectively.
The results show that while some samples exhibited an increase of the Set in the range of~0 to 6%, some samples had decreases of the set in the range of ~0 to 2%. Decreases for changesin the set indicate that the samples after exposure to these environmental conditions had a smallerset than the unexposed samples (i.e., these samples were less deformed than the unexposedsamples). Most of these decreases in Set were observed in samples with larger gamma radiationdose exposures and/or longer exposure times. However, no systematic trend was observed insamples exposed to increasing radiation doses, exposure time, and exposure temperatures.Results suggest that these set changes were within the experimental variability of the test results;although, an overall decrease in Set was detected with increasingly severe environmentalconditions of dose, time, and temperature.
Figure 8 (a)-(d) shows, the Set changes for butyl rubber samples exposed to a combination of thefour gamma ray doses followed by 7, 14, 28, and 180 day exposures to the aqueous simulant atthe three temperatures. Similar to the samples exposed to gamma radiation alone, the setchanges exhibited by samples exposed to a combination of radiation and the aqueous simulantwere similar (i.e., in the range of-2 to 8%). The Set in butyl rubber samples exposed to only thesimulant (0 krad data) generally increased with increased temperature and increased exposure
25

time. The combination of radiation followed by exposure to the simulant had an adverse effectthat resulted in higher compression sets (i.e., the samples became more deformed). The greatestretention of deformation was noted in samples exposed to 3,670 krad and the simulant for 28 and180 days at 50 and 60°C.
To summarize, butyl rubber is not affected greatly by radiation, the simulant, or a combination ofthese two environmental conditions when exposure times were kept below 14 days. While theprecise values are not clear from the data in the previous figure, these values can be found inAppendix F of this report.
Vapor Transport Rates (VTR)
VTR measurements provide a measure of the permeability of various chemical agents inelastomers. The rate of transmission of a liquid through an elastomer that acts as a barrier isimportant in elastomer seal performance. This transmission is referred to as vapor transmissionsince the liquid diffuses through the elastomer in a molecular sense and escapes into thesurrounding atmosphere in vapor form. This type of testing provides a steady-state measure ofthe rate of vapor and liquid transmission through relatively thin elastomers. While the calculatedvalues of VTR cannot be directly converted to traditional permeability values, the VTR valuescan be used to provide an indication of permeability. The VTR measurements were taken atthree temperatures and four exposure times. In these experiments, one set of butyl rubbersamples was exposed to only the simulant aqueous waste while the remaining samples wereexposed to a combination of radiation and the simulant. To measure VTR, we used thestandardized test method ASTM D 814. Using this method, the butyl rubber samples were sealedto a ground-glass surface with a metal screw band. It should be noted that VTR experimentsperformed with this method on butyl rubber samples exposed to only gamma radiation are notpossible since the testing method requires the presence of a chemical agent. Figure 9 shows a setcells used for VTR measurements.
26
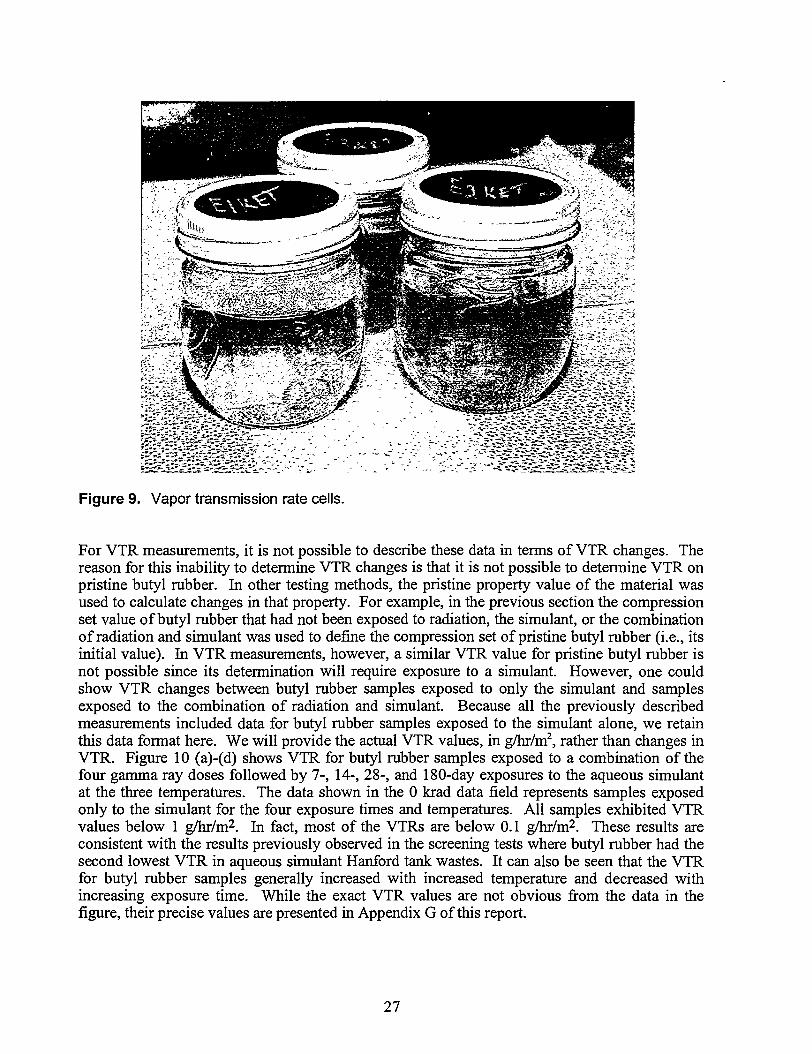
Figure 9. Vapor transmission rate cells.
For VTR measurements, it is not possible to describe these data in terms of VTR changes. Thereason for this inability to determine VTR changes is that it is not possible to determine VTR onpristine butyl rubber. In other testing methods, the pristine property value of the material wasused to calculate changes in that property. For example, in the previous section the compressionset value of butyl rubber that had not been exposed to radiation, the simulant, or the combinationof radiation and simulant was used to define the compression set of pristine butyl rubber (i.e., itsinitial value). In VTR measurements, however, a similar VTR value for pristine butyl rubber isnot possible since its determination will require exposure to a simulant. However, one couldshow VTR changes between butyl rubber samples exposed to only the simulant and samplesexposed to the combination of radiation and simulant. Because all the previously describedmeasurements included data for butyl rubber samples exposed to the simulant alone, we retainthis data format here. We will provide the actual VTR values, in g/hr/m2, rather than changes inVTR. Figure 10 (a)-(d) shows VTR for butyl rubber samples exposed to a combination of thefour gamma ray doses followed by 7-, 14-, 28-, and 180-day exposures to the aqueous simulantat the three temperatures. The data shown in the 0 krad data field represents samples exposedonly to the simulant for the four exposure times and temperatures. All samples exhibited VTRvalues below 1 g/hr/m2. In fact, most of the VTRs are below 0.1 g/hr/m2. These results areconsistent with the results previously observed in the screening tests where butyl rubber had thesecond lowest VTR in aqueous simulant Hanford tank wastes. It can also be seen that the VTRfor butyl rubber samples generally increased with increased temperature and decreased withincreasing exposure time. While the exact VTR values are not obvious from the data in thefigure, their precise values are presented in Appendix G of this report.
27

5 " 3.670RADIATION DOSE (bad) RADIATION DOSE (bad)
(a) (b)
RADIATION DOSE (bad)RADIATION DOSE (bad)
(C) (d)
Figure 10. VTR for butyl rubber after exposure to ~0, 143, 286, 571, and 3,670 krad of gammaradiation followed by exposure for (a) 7 days, (b) 14 days, (c) 28 days, and (d) 180 days to theaqueous simulant waste at 18, 50, and 60°C.
Tensile Properties
Tensile properties, also known as mechanical properties, are the properties associated with amaterial's response to mechanical forces. A quantity more useful than force is the engineeringstress (CT), which is the ratio of the magnitude of a force to the magnitude of the originallyundeformed area of the body upon which it is acting. True stress is therefore defined as a= F/Awhere A is the cross-sectional area at the time that the force (F) is applied. The most commonengineering units of stress are pounds of force per square inch (lb/in.2 or psi). These units maybe converted to the corresponding SI unit, the pascal (newton/meter), by multiplying the psivalue by 6,895. However, since we are always calculating the % changes in properties, the unitsare irrelevant. The actual values in mega pascal (MPa) are reported in Appendix.
Another important tensile property to consider is strain. A stressed material undergoesdeformation or strain (s), defined quantitatively as either the incremental deformation divided bythe initial dimension or the percent of the original dimension. Since strain is a dimensionlessquantity, the precise choice of units is not important. In this study, a 1-in. gage length was used,
28
and the units of strain are therefore in./in. Two fundamentally different types of strain areobserved. The first type is elastic strain, or elastic deformation, where strain is recoverable uponthe release of stress. In other words, when a causal stress is removed, the resultant strainvanishes and the original dimensions of the body are recovered. A practical example of this typeof strain is the stretching of a rubber band. Since butyl rubber is a specific type of rubber, itexhibits the same type of strain. The second type of strain is plastic strain. This occurs whenstress is increased and a value is eventually reached where permanent deformation of the bodyhas occurred. An example of this property is the bending of wire with the fingers. Note that theterm "plastic strain" does not necessarily mean that the deformed material is a plastic.
For many plastic materials, which might be suitable as packaging components such as seals andliners, high strengths and high strains are expected. The strains exhibited should also be elasticin nature. In certain instances, however, other specific tensile properties are desirable (i.e., highstrength and low strain). It was the purpose of this study to determine the tensile properties ofthe pristine material and then determine the effects of radiation alone, the simulant alone, and acombination of these environmental conditions on the tensile properties of butyl rubber.
Tensile Strength
The tensile or ultimate strength of a material is calculated by dividing the observed maximumload placed on the material during the tensile test by the original cross-sectional area of thematerial. While many polymeric materials exhibit stress-strain curves having an initialmaximum followed by lower stresses, this is not the case for elastomers. The maximum loadvalue in elastomers is typically observed at the break point of the material.
The measurement of tensile properties involves the use of tensile testing equipment that canapply controlled tensile loads to test specimens. The equipment is capable of varying the speedof load (stress) and accurately measuring the forces (strains) and elongation applied to thespecimens. In this study, an Applied Test System, Inc. Universal Testing Machine, Series 1400was used. This computer-controlled testing equipment was able to perform the required testswith user-developed methods. These methods prescribe strain rates, breaking points, and manyother experimentally important variables. The selection of these experimental variables wasbased on standard test method ASTM D 412. For the determination of the tensile strength ofelastomers, the use of a high elongation extensometer and high rates of grip separation(50 mm/min, 20"/min) were used. The acquired data were analyzed with software that calculatesnumerous tensile properties and that was developed by the same manufacturer. The datadiscussed in this subsection required a determination of tensile strength calculated as describedpreviously, using peak loads and a cross-sectional area. In addition, the software also calculatedultimate elongation and tensile stress values. In this subsection, tensile strength values are ofinterest.
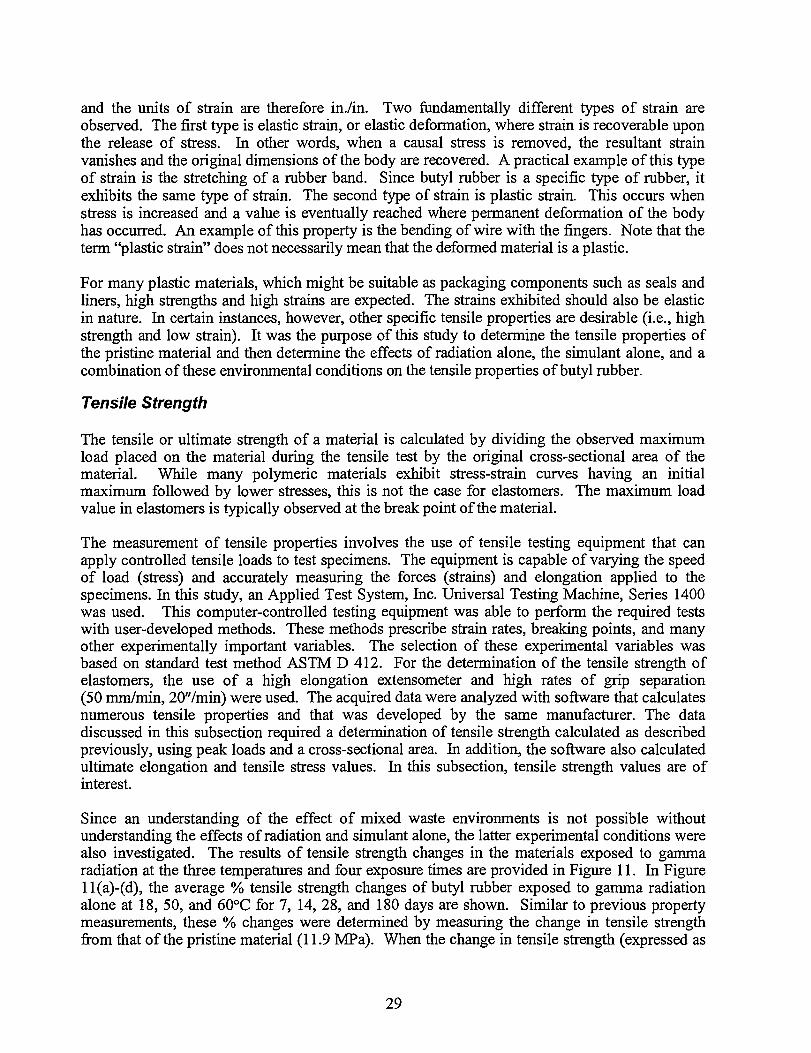
Since an understanding of the effect of mixed waste environments is not possible withoutunderstanding the effects of radiation and simulant alone, the latter experimental conditions werealso investigated. The results of tensile strength changes in the materials exposed to gammaradiation at the three temperatures and four exposure times are provided in Figure 11. In Figurell(a)-(d), the average % tensile strength changes of butyl rubber exposed to gamma radiationalone at 18, 50, and 60°C for 7, 14, 28, and 180 days are shown. Similar to previous propertymeasurements, these % changes were determined by measuring the change in tensile strengthfrom that of the pristine material (11.9 MPa). When the change in tensile strength (expressed as
29
a percentage) is a positive value, the material tensile strength had increased under the specificexposure conditions. Negative values indicate decreases in tensile strength.
From a general perspective, Figure 11 shows no significant effect on tensile strength for mostradiation doses, exposure times, and exposure temperatures tested. An exception is butyl rubbersamples exposed to 3,670 krad and higher temperatures. Under these conditions, the changes intensile strength for these samples were in the range of 10% to 20%. However, for most of theother exposure conditions, many of these changes appear to be in the range of ± 1 to 6%. At thelongest exposure time (180 days) and highest radiation doses, the tensile strength of butyl rubberappears to have decreased considerably (20%).
T. S. CHANGE
1")
TEMPERATURE
RADIATION DOSE (trad)
571
RADIATION DOSE (krad)
(a) (b)
T. S. CHANGE T. S. CHANGE
(X)
TEMPERATURE
RADIATION DOSE (krad]
571
RADIATION DOSE (krad)
(C) (d)
Figure 11. Tensile strength (T. S.) changes in butyl rubber after exposure to -143, 286, 571,and 3,670 krad of gamma radiation followed by exposure for (a) 7 days, (b) 14 days, (c) 28days, and (d) 180 days at 18, 50, and 60°C.
30
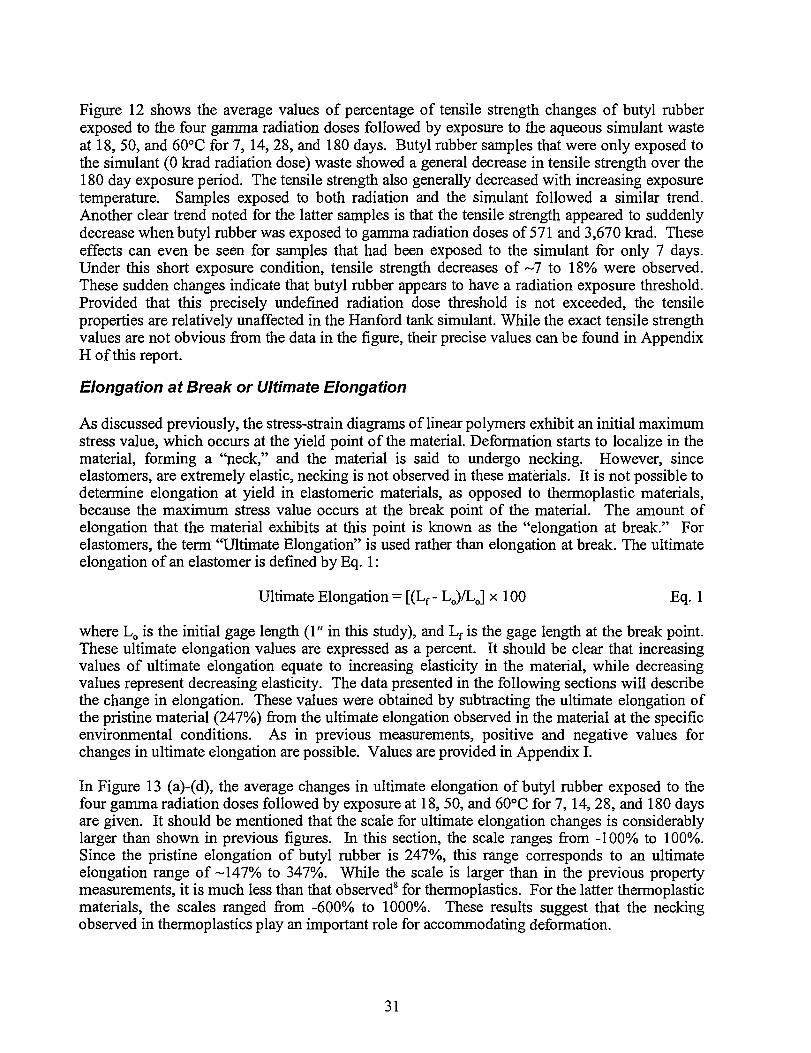
Figure 12 shows the average values of percentage of tensile strength changes of butyl rubberexposed to the four gamma radiation doses followed by exposure to the aqueous simulant wasteat 18, 50, and 60°C for 7, 14, 28, and 180 days. Butyl rubber samples that were only exposed tothe simulant (0 krad radiation dose) waste showed a general decrease in tensile strength over the180 day exposure period. The tensile strength also generally decreased with increasing exposuretemperature. Samples exposed to both radiation and the simulant followed a similar trend.Another clear trend noted for the latter samples is that the tensile strength appeared to suddenlydecrease when butyl rubber was exposed to gamma radiation doses of 571 and 3,670 krad. Theseeffects can even be seen for samples that had been exposed to the simulant for only 7 days.Under this short exposure condition, tensile strength decreases of ~7 to 18% were observed.These sudden changes indicate that butyl rubber appears to have a radiation exposure threshold.Provided that this precisely undefined radiation dose threshold is not exceeded, the tensileproperties are relatively unaffected in the Hanford tank simulant. While the exact tensile strengthvalues are not obvious from the data in the figure, their precise values can be found in AppendixH of this report.
Elongation at Break or Ultimate Elongation
As discussed previously, the stress-strain diagrams of linear polymers exhibit an initial maximumstress value, which occurs at the yield point of the material. Deformation starts to localize in thematerial, forming a "neck," and the material is said to undergo necking. However, sinceelastomers, are extremely elastic, necking is not observed in these materials. It is not possible todetermine elongation at yield in elastomeric materials, as opposed to thermoplastic materials,because the maximum stress value occurs at the break point of the material. The amount ofelongation that the material exhibits at this point is known as the "elongation at break." Forelastomers, the term "Ultimate Elongation" is used rather than elongation at break. The ultimateelongation of an elastomer is defined by Eq. 1:
Ultimate Elongation = [(Lf - Lo)/Lo] x 100 Eq. 1
where Lo is the initial gage length (1" in this study), and Lf is the gage length at the break point.These ultimate elongation values are expressed as a percent. It should be clear that increasingvalues of ultimate elongation equate to increasing elasticity in the material, while decreasingvalues represent decreasing elasticity. The data presented in the following sections will describethe change in elongation. These values were obtained by subtracting the ultimate elongation ofthe pristine material (247%) from the ultimate elongation observed in the material at the specificenvironmental conditions. As in previous measurements, positive and negative values forchanges in ultimate elongation are possible. Values are provided in Appendix I.
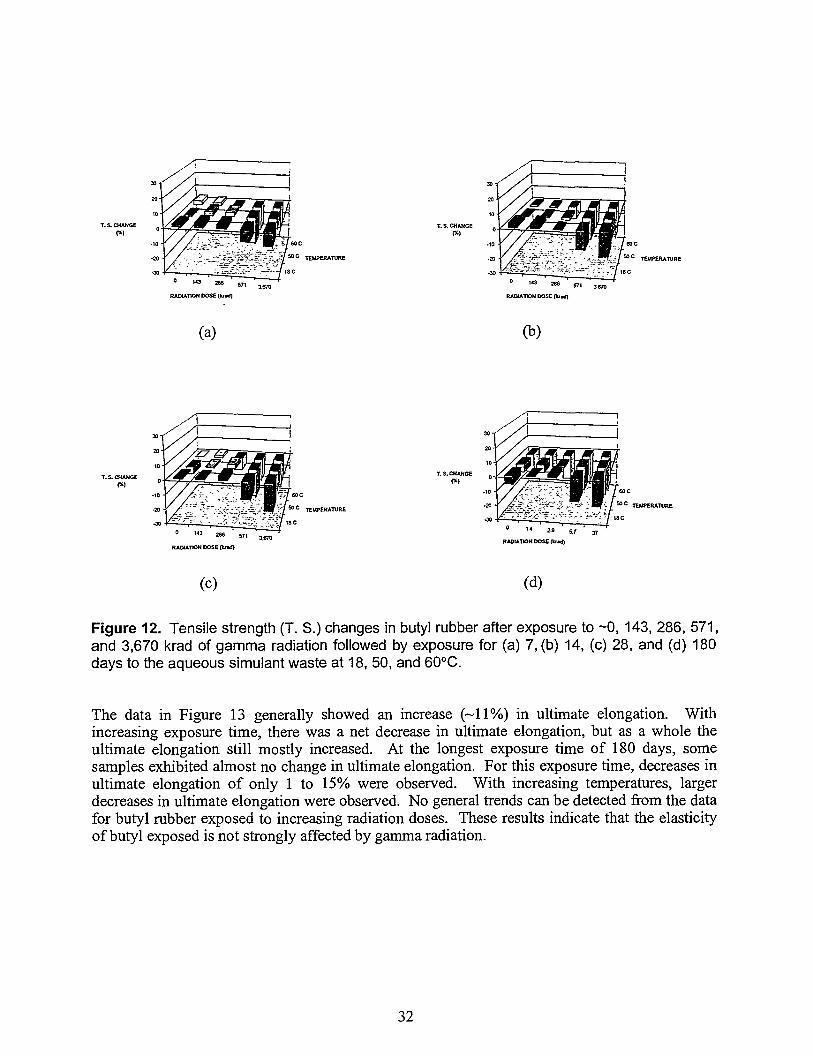
In Figure 13 (a)-(d), the average changes in ultimate elongation of butyl rubber exposed to thefour gamma radiation doses followed by exposure at 18, 50, and 60°C for 7,14, 28, and 180 daysare given. It should be mentioned that the scale for ultimate elongation changes is considerablylarger than shown in previous figures. In this section, the scale ranges from -100% to 100%.Since the pristine elongation of butyl rubber is 247%, this range corresponds to an ultimateelongation range of -147% to 347%. While the scale is larger than in the previous propertymeasurements, it is much less than that observed8 for thermoplastics. For the latter thermoplasticmaterials, the scales ranged from -600% to 1000%. These results suggest that the neckingobserved in thermoplastics play an important role for accommodating deformation.
31
T.S. CHANGE T.S. CHANGE
(*)
143 2S6
RADIATION DOSE (krad)
286 57,
RADIATION DOSE (bad)
(a) (b)
RADIATION DOSE (krad)
30-
20-
10-
-10
•20
-30
//>
!
1
SSA
0 M ^ ' '
RADIATION DOSE (krad)
Off•FTeocmfi ISSC TIMPEBATURE
'"yz "I jsc
37
(c) (d)
Figure 12. Tensile strength (T. S.) changes in butyl rubber after exposure to ~0, 143, 286, 571,and 3,670 krad of gamma radiation followed by exposure for (a) 7, (b) 14, (c) 28, and (d) 180days to the aqueous simulant waste at 18, 50, and 60°C.
The data in Figure 13 generally showed an increase (-11%) in ultimate elongation. Withincreasing exposure time, there was a net decrease in ultimate elongation, but as a whole theultimate elongation still mostly increased. At the longest exposure time of 180 days, somesamples exhibited almost no change in ultimate elongation. For this exposure time, decreases inultimate elongation of only 1 to 15% were observed. With increasing temperatures, largerdecreases in ultimate elongation were observed. No general trends can be detected from the datafor butyl rubber exposed to increasing radiation doses. These results indicate that the elasticityof butyl exposed is not strongly affected by gamma radiation.
32
U. EL CHANGE
' « 285
RADIATION DOSE (krad)
U. EL CHANCE
TEUPERATURE TEMPERATURE
S71
RADIATION DOSE (trad)
(a) (b)
U.ELCHANOE» C
5 0 c TEMPERATURE
J. E L CHANCE
TEMPERATURE
RADIATION DOSE (krftd)
1 4 3 2B6
RADIATION DOSE (b id )
(c) (d)
Figure 13. Ultimate elongation (U. EL.) changes in butyl rubber after exposure to -143, 286,571, and 3,670 krad of gamma radiation followed by exposure for(a) 7 days, (b) 14 days, (c) 28days, and (d) 180 days at 18, 50, and 60°C.
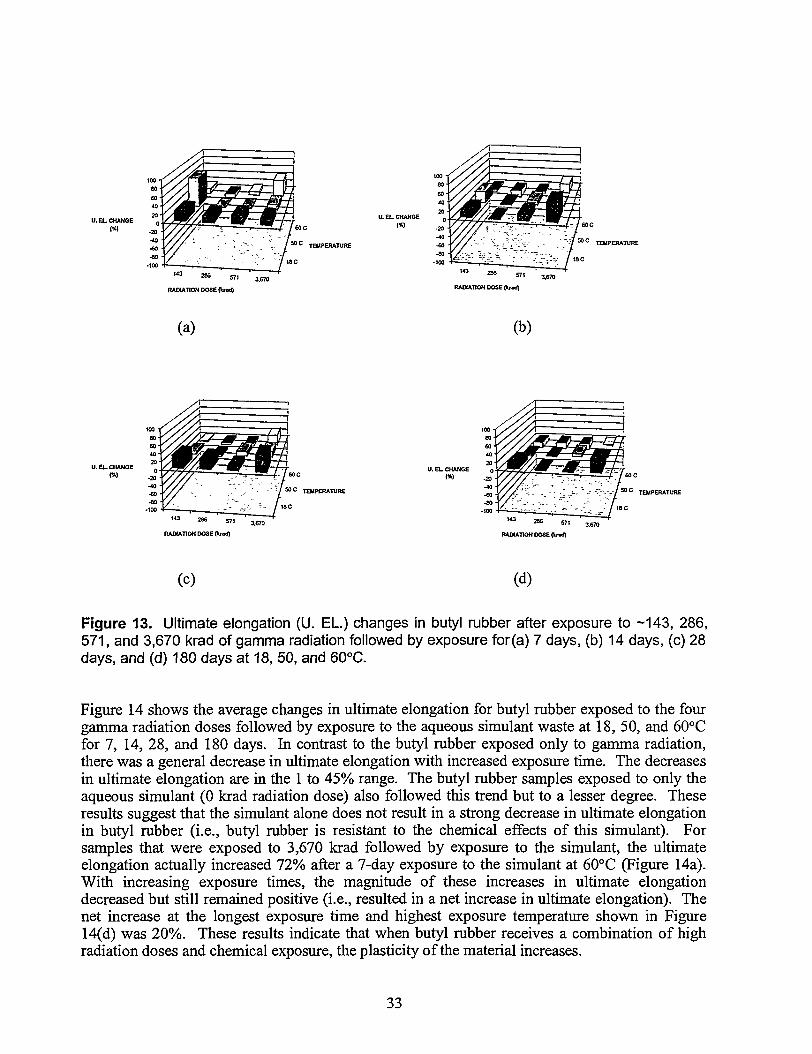
Figure 14 shows the average changes in ultimate elongation for butyl rubber exposed to the fourgamma radiation doses followed by exposure to the aqueous simulant waste at 18, 50, and 60°Cfor 7, 14, 28, and 180 days. In contrast to the butyl rubber exposed only to gamma radiation,there was a general decrease in ultimate elongation with increased exposure time. The decreasesin ultimate elongation are in the 1 to 45% range. The butyl rubber samples exposed to only theaqueous simulant (0 krad radiation dose) also followed this trend but to a lesser degree. Theseresults suggest that the simulant alone does not result in a strong decrease in ultimate elongationin butyl rubber (i.e., butyl rubber is resistant to the chemical effects of this simulant). Forsamples that were exposed to 3,670 krad followed by exposure to the simulant, the ultimateelongation actually increased 72% after a 7-day exposure to the simulant at 60°C (Figure 14a).With increasing exposure times, the magnitude of these increases in ultimate elongationdecreased but still remained positive (i.e., resulted in a net increase in ultimate elongation). Thenet increase at the longest exposure time and highest exposure temperature shown in Figure14(d) was 20%. These results indicate that when butyl rubber receives a combination of highradiation doses and chemical exposure, the plasticity of the material increases.
33
U. EL CHANCE U. E L CHANGE
RADIATION DOSE (kr*d)
2 8 6 571 3,670
RADIATION DOSE (krarf)
(a) (b)
60 C
5 0 0 TEMPERATURE
RADIATION DOSE (bad)
U. EL CHANGE
(*]
100 Y
80-
6 0 '
40
0
•20
-40
-60
-100
S / / \
^//A f=rX^/-4&\¥$v^t jffwM-4
RADIATION DOSE (fearf)
1
1
3T3
5 0 0 TEMPERATURE
8C
(c) (d)
Figure 14. Ultimate elongation (U. EL.) changes in butyl rubber after exposure to ~0, 143, 286,571, and 3,670 krad of gamma radiation followed by exposure for(a) 7, (b) 14, (c) 28, and (d)180 days to the aqueous simulant waste at 18, 50, and 60°C.
However, it should be recalled that the tensile strength decreased and that the compression setincreased under these conditions. These results suggest that butyl rubber has become less elasticand more plastic. The actual ultimate elongation values are provided in Appendix I of thisreport.
Tensile Stress or 100% Modulus
For most materials, the initial portion of a stress-strain diagram is linear. This implies that strainis proportional to stress. The proportionality constant (slope of this linear region) is called themodulus of elasticity. The modulus of elasticity, or Young's modulus, is a property of thestressed material. In fact, the magnitude of the modulus can be related to the nature of thechemical bonds existing in the material. Therefore, the modulus provides a measure of thebonding strength in the material being investigated. High values of modulus indicate that strongbonding is present in the material. As one might surmise from the previous discussion, materialshaving strong covalent bonding have the highest modulus values. Thus, the larger the value for
34
modulus, the stronger the bonding is expected to be in the material. Modulus has the same unitsas stress (psi or MPa). The rubber industry also refers to the modulus of a compound and gives ita specific designation such as 100% or 300% modulus because the value generated is not anengineering modulus, as mentioned previously, but is the stress required to obtain a given strain.Therefore, the 100% modulus, is simply the stress (a) required to elongate the elastomer to twiceits reference gage length. Rather than representing the slope of a region in a stress-strain curve,the 100% modulus represents a single data point on the curve. The 100% modulus or tensilestress of an elastomer has identical units as the engineering modulus. Since we are interested inmeasuring changes in the tensile stress of the exposed material from that of unexposed or pristinematerial (3.96 MPa), we will discuss the % change in tensile stress of the materials. This iscalculated from the relationship given in Eq. 2:
% Change in Tensile Stress = (crf - a0)/ a 0 x 100 Eq. 2
where o> is the measured tensile stress under the specific environmental conditions at 100%elongation, and CT0 is the tensile stress of the pristine material at 100% elongation. The 100%modulus changes can be a positive or negative in value depending on the magnitude of either af
or a0. Positive changes in % tensile stress indicate that the material of interest required greaterapplication of stress to elongate the elastomer to 100% than for pristine material. Negativevalues indicate that the material of interest required less application of stress than the pristinematerial. Appendix J provides the precise tensile stress values of butyl rubber under the differentenvironmental conditions along with the % change.
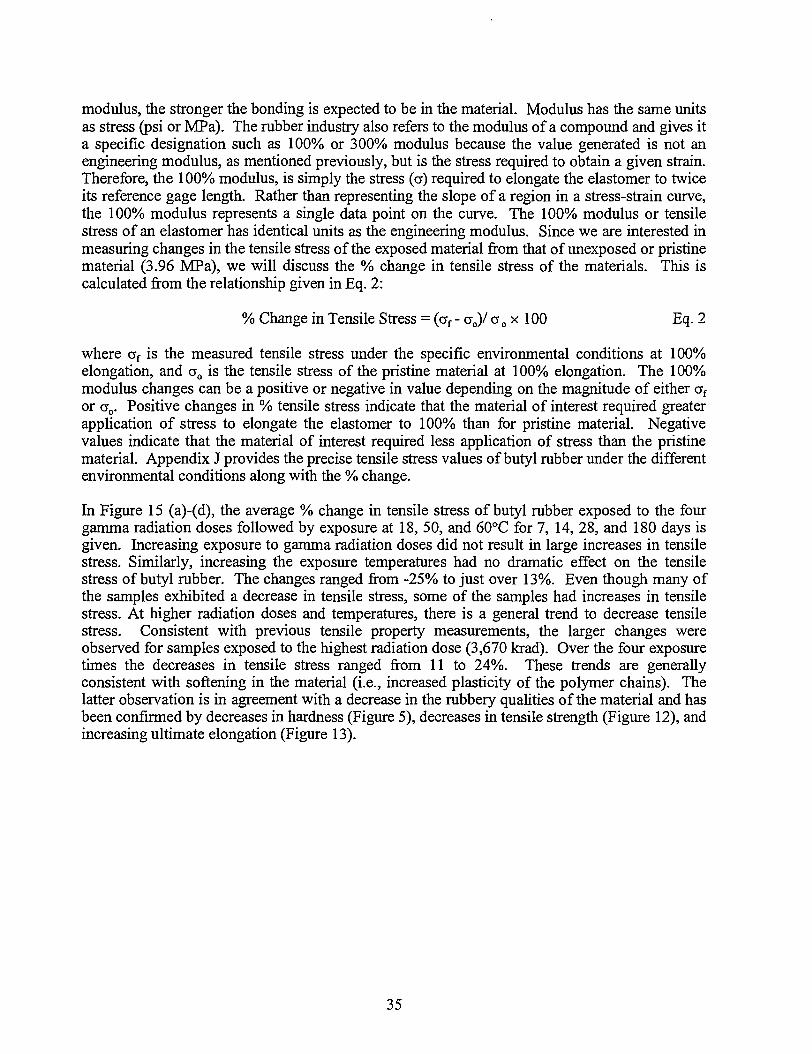
In Figure 15 (a)-(d), the average % change in tensile stress of butyl rubber exposed to the fourgamma radiation doses followed by exposure at 18, 50, and 60°C for 7, 14, 28, and 180 days isgiven. Increasing exposure to gamma radiation doses did not result in large increases in tensilestress. Similarly, increasing the exposure temperatures had no dramatic effect on the tensilestress of butyl rubber. The changes ranged from -25% to just over 13%. Even though many ofthe samples exhibited a decrease in tensile stress, some of the samples had increases in tensilestress. At higher radiation doses and temperatures, there is a general trend to decrease tensilestress. Consistent with previous tensile property measurements, the larger changes wereobserved for samples exposed to the highest radiation dose (3,670 krad). Over the four exposuretimes the decreases in tensile stress ranged from 11 to 24%. These trends are generallyconsistent with softening in the material (i.e., increased plasticity of the polymer chains). Thelatter observation is in agreement with a decrease in the rubbery qualities of the material and hasbeen confirmed by decreases in hardness (Figure 5), decreases in tensile strength (Figure 12), andincreasing ultimate elongation (Figure 13).
35
T. ST. CHANGET. ST. CHANGE
TEMPERATURE
RADIATION DOSE (bad) RADIATION DOSE (krad)
(a) (b)
T. ST. CHANGE T. ST. O U N C ETO
RADIATION DOSE (bad)
571
RADIATION DOSE (barf)
(c) (d)
Figure 15. Tensile stress (T. ST.) changes in butyl rubber after exposure to -143, 286, 571,and 3,670 krad of gamma radiation followed by exposure for (a) 7, (b) 14, (c) 28, and (d) 180days at 18, 50, and 60°C.
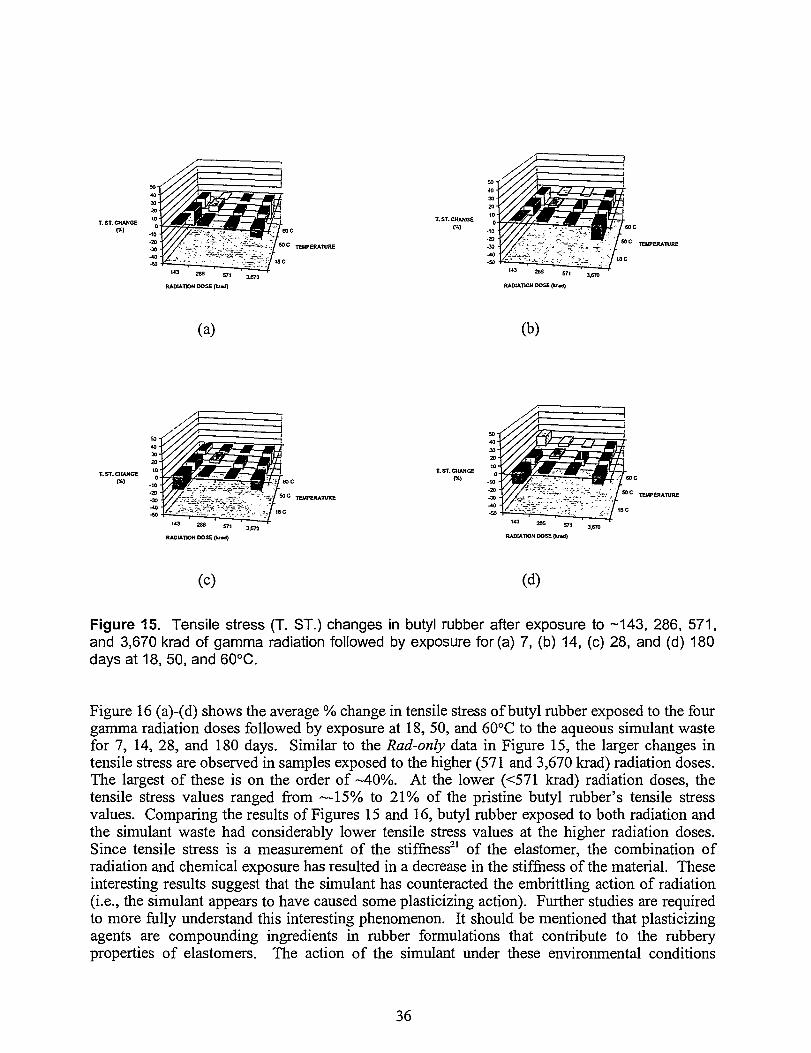
Figure 16 (a)-(d) shows the average % change in tensile stress of butyl rubber exposed to the fourgamma radiation doses followed by exposure at 18, 50, and 60°C to the aqueous simulant wastefor 7, 14, 28, and 180 days. Similar to the Rad-only data in Figure 15, the larger changes intensile stress are observed in samples exposed to the higher (571 and 3,670 krad) radiation doses.The largest of these is on the order of -40%. At the lower (<571 krad) radiation doses, thetensile stress values ranged from —15% to 21% of the pristine butyl rubber's tensile stressvalues. Comparing the results of Figures 15 and 16, butyl rubber exposed to both radiation andthe simulant waste had considerably lower tensile stress values at the higher radiation doses.Since tensile stress is a measurement of the stiffness21 of the elastomer, the combination ofradiation and chemical exposure has resulted in a decrease in the stiffness of the material. Theseinteresting results suggest that the simulant has counteracted the embrittling action of radiation(i.e., the simulant appears to have caused some plasticizing action). Further studies are requiredto more fully understand this interesting phenomenon. It should be mentioned that plasticizingagents are compounding ingredients in rubber formulations that contribute to the rubberyproperties of elastomers. The action of the simulant under these environmental conditions
36

appears to have resulted in plasticization of butyl rubber. With increasing exposure time, thetensile stress values appeared to decrease somewhat. This again points to a loss in stiffness ofthe elastomer. For virtually all the exposure times, the tensile stress changes were similar forbutyl rubber samples exposed to only the simulant and for those samples having been exposed toboth environmental conditions. The results in Figure 16 also show that increased exposuretemperatures led to generally slight increases in tensile stress at low radiation doses. It appearsthat butyl rubber was remarkably resistant to the effects of low radiation doses, the simulant, andboth environmental conditions. However, at the higher radiation doses of 571 and 3,670 krad,loss of tensile properties in butyl rubber were evident.
50-1
40-
30'
20
10T. ST. CHANCE Q
-20
-30
-40
•60
y\y y\
'//A
* n 286 CT1 3 ^
RADMTIOH DOSE (krad]
i
j
-SMmB t 6 0 0
Jf, / 50C TEMPERATURE
/ i S C/
70
50-I
40 •
30 '
20-
10'T. ST. CHANGE Q
•10
•20
-30
-W
-50
/ i
O-O^j •
RADIATION DOSE (kradj
j|I_TT
iXJ1"•• f.670
(a) (b)
50-
4 0 -
30-
20'
10'T.ST.CHANOE Q
-10 •
•20
-30
-to-50
/^y—
/ ^ ^ ^ ; ;
//' • 7s/ . . - . - . - • - - " - /
i—-,—^=—^_i-<--n "
T. ST. CHANCE
TEMPERATURE
M ' « 28S 57,
RADIATION DOSE (krad) RADIATION DOSE Ckimd)
(c) (d)
Figure 16. Tensile stress (T. ST.) changes in EPDM after exposure to ~0, 143, 286, 571, and3,670 krad of gamma radiation followed by exposure for (a) 7,(b) 14, (c) 28, and (d) 180 days tothe aqueous simulant waste at 18, 50, and 60°C.
37
This page intentionally left blank.
38
DISCUSSION
The purpose of the Chemical Interaction Project, previously referred to as the ChemicalCompatibility Program, is to provide a scientifically defensible methodology for measuring thechemical interactions of polymeric liner and seal materials with hazardous wastes. The change inprogram names reflects an evolution in programmatic emphasis by the U.S. DOE. Thesepolymeric materials are those which may be used in current and future container designs for thetransportation of hazardous and mixed wastes throughout the DOE complex.
With the completion of the screening phase of the program several years ago, the comprehensivephase of this program has been in progress. Since all seal and liner materials passed thescreening tests after exposure to the simulant Hanford tank waste, ten materials needed to besubjected to the test matrix resulting in an extremely large sample and test set. hi view ofmanpower and budget constraints, the comprehensive testing phase of the program wassubdivided into the testing of liner materials and seal materials; the results of liner testing werethe subject of a previous SAND Report.8 Also because of funding constraints, thecomprehensive testing of seal materials was subdivided into the testing of individual elastomers.In previously published reports,16'22 we discussed the results of testing of the elastomeric sealmaterials, EPDM and FKM rubber. This report describes the testing results of the nextelastomeric seal material, butyl rubber. A subsequent report will discuss the testing results forthe remaining elastomer, SBR exposed to simulant Hanford tank waste. The results obtained foreach of the properties measured starting with specific gravity and ending with tensile stress ofbutyl rubber will be discussed.
From an overall perspective, the specific gravity data show that simulant temperature, radiationdose, and exposure time have some effect on the specific gravity of butyl rubber. After morethan 14 day exposures (i.e., 28 days and 180 days, specific gravity changes in excess of 0.2%were observed). These results are consistent with the known chemical resistance of this elastomerand demonstrate that butyl rubber is suitable for use under these conditions if specific gravity isthe determining design criterion for selection of packaging seal components. Increasingexposure times, radiation doses, and exposure temperatures generally caused increases in specificgravity of slightly greater than 1%. The greatest changes were noted for the samples exposed tothe most extreme exposure conditions (i.e., 180 days, 3,670 krad, and 60°C). The butyl rubbersamples that were not irradiated sometimes displayed smaller increases in specific gravity thansamples exposed to both radiation and the simulant. However, at longest exposure times, similarvalues in specific gravity were observed. These results indicated that butyl rubber may beaffected to a greater extent by the combination of radiation and chemical exposure and lessresistant to radiation exposure.
The mass of butyl rubber increased slightly after exposure to the simulant or the combination ofradiation and simulant at increasing exposure times and exposure temperatures. These increaseswere more noticeable after more than 14-day exposures. For these conditions, mass increases ofmore than 0.6% were observed at 50°C; the largest increases in mass of -2.5% were observedafter 180-day exposures. Since the mass increases were not very substantial, the slight increasesin specific gravity noted earlier must have been caused by slight changes in dimensions.Specifically, the volume of the butyl rubber must decrease with a slight increase in mass,resulting in a net increase in specific gravity, and this was observed. For most sample volumes,smaller volume changes were observed. These combined results point to a slight swelling of thematerial ~0 to 2%. Furthermore, it should be recalled that volume changes were calculated from
39
changes in the length, width, and thickness of the sample. Since these property changes are notisotropic in the rectangular geometry of the samples, large changes in one of the sampledimensions may dominate changes in volume. In actual packaging, seals are in the form of O-rings, which may exhibit more isotropic behavior. Thus the relatively small anisotropic changesin dimension may be even smaller in O-rings where isotropic behavior is expected. The practicalimplication of these results are that butyl rubber O-rings, even when directly exposed to aHanford tank waste under similar conditions as used in this study, are not expected to expandsignificantly.
As was previously discussed for dimensional property changes, the hardness of butyl rubberdecreased with increasing exposure to both radiation and the simulant. For samples exposed toonly the simulant, the hardness did not change significantly. Additionally, certain radiationlevels appeared to exert a beneficial effect on the retention of hardness by butyl rubber. This wasfound to be especially true for the case where butyl rubber was exposed for 180 days. Underthese conditions, most of the butyl rubber samples for all radiation doses became harder afterpreviously becoming softer at the lower exposure times. Since butyl rubber swelled slightlyunder these conditions, the observed hardening of the material at these severe conditions cannotbe ascribed purely to a swelling phenomenon. Hardening in the presence of swelling could bedue to chain cross-linking in the polymer, but confirmation of this process will require additionaltests. The observation that radiation in combination with chemical exposure may have abeneficial effect on hardness suggests that the cross-linking and chain-scission processes areoccurring simultaneously. Possibly the combination of processes leads to a polymeric structurehaving generally shorter polymer segments that are cross-linked by radiation and chemicalreactions.
Compression set measures the retention of elastic properties of material after exposure tocompressive stresses. When butyl rubber samples were exposed to only gamma radiation, setchanges in the range of -2 to 6% were found. For samples exposed to both radiation and thesimulant, the compression set range of values increased slightly from -2 to 8%. The combinedeffects of radiation and chemical exposure resulted in increased compression sets (i.e., thematerial has become more deformed). These deformations are most pronounced in samplesexposed for more than 14 days to the simulant at 50° and 60°C. Based on the hardness results,the butyl rubber became slightly harder at the longest exposure time. Its elastic properties,however, appeared to have suffered under these conditions. As previously discussed, perhaps thecompetition between cross-linking and chain-scission reactions could offer an explanation.However, other factors such as the interaction of the other constituents of elastomers (i.e., oils,vulcanizing aids, fillers, etc.) at these environmental conditions would need to be considered.
The VTR of butyl rubber changed very little when exposed to radiation and the aqueous simulantand were less than 0.1 g/hr/m2. These results are not unexpected since the permeation of watermolecules through this polymeric network is expected to be slow. That this process istemperature dependent is confirmed by the results. As temperature is increased, the VTRs alsoincreased. The interesting aspect of the results is that the VTRs appeared to decrease withincreased exposure time. A possible explanation is that the presence of the inorganic salts,especially the precipitate found in the simulant, may clog microscopic pores in butyl rubber,thereby reducing the transport of water vapor.
The tensile strength of butyl rubber also exhibited minimal changes when exposed to radiation,the simulant, and both radiation and simulant, provided that radiation dose levels, exposuretemperatures, and exposure times were low. Many of the samples decreased less than 7% in
40
tensile strength. The combination of high radiation doses (>286 krad) and chemical exposureresulted in up to 20% decreases in tensile strength. At the highest radiation dose, the scission ofpolymeric chains may dominate as the determining process that leads to lower strength. Whilethe material's strength may be retained at the less severe environmental conditions, the materialselasticity be decreasing. This is supported by the data for ultimate elongation discussed below.
The elastic property of materials can be measured by evaluating their degree of ultimateelongation. For butyl rubber samples exposed to only gamma radiation, a general decrease inelongation was observed with increased exposure time. These results indicate that the material isbecoming more elastic at lower exposure times. However, because most butyl rubber sampleswere still rather elastic (i.e., stretching more than -200% , a change of-10% still results in ratherelastic material). Butyl rubber exposed to both radiation and simulant, while general decreasingin elongation, still retained elasticity compared with samples only exposed to radiation. Theseresults again point to the plasticizing effects of the simulant.
Tensile stress or 100% modulus measurements provide a measure of the stiffness of theelastomer. A greater tensile stress value indicates that the elastomer is more likely to recoverfrom localized forces and thereby resist extrusion. The effect of radiation on the tensile stressvalues of butyl rubber did not increase by more than 14%, nor did they decrease by more than25% (i.e., tensile stress increases of 14% and decreases of 25% were observed). The effects ofradiation on butyl rubber resulted in slightly stiffer material. For samples exposed to either onlythe simulant or to a combination of both radiation and simulant, decreases in tensile stress of upto 18% and 40%, respectively, were observed. These results suggest that the simulantcounteracted somewhat the effect of radiation to reduce the stiffness, acting as a plasticizingagent. Alternatively, the combination of radiation and simulant exposure resulted in butyl rubberbecoming less elastic and assuming a more plastic character. Hardness, tensile strength, andtensile stress decreased, while compression set and ultimate elongation increased, suggesting thatbutyl rubber lost some of its elastic properties and became more plastic. Butyl rubber exposed tohigher radiation doses may exhibit increased plasticity (i.e., the material's original dimensionsunder an applied load are not recovered when the load is removed).
In summary, the measurement of changes in specific gravity, mass, volume, hardness,compression set, vapor transmission rates indicated that butyl rubber is remarkably resistant tothe effects of radiation and the aqueous simulant at the temperatures and exposure times tested.From the tensile testing results, consisting of tensile strength, ultimate elongation, and tensilestress measurements, butyl rubber appears to be more susceptible to the effects of radiation andthe aqueous simulant. When compared to the previously obtained tensile testing results forEPDM rubber, butyl rubber does not have comparable resistance to these environmentalconditions. The beneficial effect of both radiation and the simulant in helping to reduce thechanges in some material properties was noted. These results suggest that the type of aqueousmixed wastes used in this study have relatively small effects on butyl rubber.
41
This page intentionally left blank.
42
CONCLUSIONS
Sandia has developed a program for studying the chemical interactions of plastic packagingcomponents that may be used in packaging for transporting mixed waste forms. Consistent withthe methodology outlined in this report, the second phase of this experimental program wasperformed to determine the effects of simulant Hanford tank mixed wastes on butyl rubber, apackaging seal material. This effort involved the comprehensive testing of butyl rubber with anaqueous mixed waste simulant. The testing protocol involved exposing the respective materialsto -143, 286, 571, and 3,670 krad of gamma radiation followed by 7, 14, 28, 180-day exposuresto the waste simulant at 18, 50, and 60°C. From the analyses performed, we determined thatbutyl rubber rubber has relatively good resistance to radiation, the simulant, and a combination ofthese environmental factors. These results suggest that butyl rubber is a relatively good sealmaterial to withstand aqueous mixed wastes having similar composition to the one used in thisstudy. However, butyl rubber appears to be less satisfactory based on tensile testing results whencompared to the previously studied rubber, EPDM.
43
This page intentionally left blank.
44

REFERENCES
1. P. J. Nigrey, "Chemical Compatibility Test Plan & Procedure Report," September 29,1993, Sandia National Laboratories, Albuquerque, NM, unpublished (1993).
2. P. J. Nigrey, M. Conroy, and L. B. Blalock, "Mixed Waste Chemical Compatibility withPackaging Components," in the Proc. of SPECTRUM '94, Nuclear and Hazardous WasteManagement International Topical Meeting, Vol.1, pp. 386 - 391, American NuclearSociety, La Grange Park, Illinois (1994).
3. P. J. Nigrey and T. G. Dickens, "Effects of Mixed Waste Simulants on TransportationPackaging Plastic Components," Paper 95-TP-68.02, presented at the 88th AnnualMeeting & Exhibition of the Air & Waste Management Association San Antonio, TX(1995).
4. P. J. Nigrey, "Mixed Waste Chemical Compatibility: A Testing Program for PlasticPackaging Components," in the Proc. of PATRAM '95, The 11th International Symposiumon the Packaging and Transportation of Radioactive Materials, Vol. HI, pp. 1372 - 1379(1996).
5. P. J. Nigrey and T. G. Dickens, "Effects of Hanford Tank Simulant Waste on PlasticPackaging Components," in the Proc. of PATRAM '95, The 11th International Symposiumon the Packaging and Transportation of Radioactive Materials, Vol. El, pp. 1210 - 1216(1996).
6. P. J. Nigrey and T. G. Dickens, "Chemical Compatibility Screening Results of PlasticPackaging Components to Mixed Waste Simulants," in the Proc. of PATRAM '95, The11th International Symposium on the Packaging and Transportation of RadioactiveMaterials, Vol. m, pp. 1202 - 1209 (1996).
7. P. J. Nigrey and T. G. Dickens. Chemical Compatibility Screening Test Results, SAND97-3104, Sandia National Laboratories, Albuquerque, NM (1997).
8. P. J. Nigrey and T. G. Dickens. Comprehensive Testing to Measure the Response of LinerMaterials to Hanford Tank Waste Simulant, SAND99-0419, Sandia National Laboratories,Albuquerque, NM (1999).
9. P. J. Nigrey and T. G. Dickens. "A Testing Program to Evaluate the Effects of SimulantMixed Wastes on Plastic Transportation Packaging Components," Technology: Journal ofthe Franklin Institute, Vol. 334A, pp. 337-349 (1997).
10. P. J. Nigrey and T. G. Dickens. "Effects of Simulant Mixed Waste on EPDM and ButylRubber," in Proc. of PATRAM '98, The 12th International Symposium on the Packagingand Transportation of Radioactive Materials, Vol. 1, pp. 423-428 (1998).
11. ASTM D 814-86, Standard Test Method for Rubber Property - Vapor Transmission ofVolatile Liquids in Tension, American Society for Testing and Materials, Philadelphia,PA (1991).
45
12. ASTM D 412-87, Standard Test Method for Rubber Properties in Tension, AmericanSociety for Testing and Materials, Philadelphia, PA (1987).
13. ASTM D 1349-87, Standard Practice for Rubber - Standard Temperatures for Testing,American Society for Testing and Materials, Philadelphia, PA (1987).
14. ASTM E-104-85, Standard Practice for Maintaining Constant Relative Humidity byMeans of Aqueous Solutions, American Society for Testing and Materials, Philadelphia,PA (1991).
15. K. T. Gillen, R. L. Clough, and L. H. Jones, Investigation of Cable Deterioration in theContainment Building of Savannah River Nuclear Reactor, Sandia National LaboratoriesReport, SAND 81-2613 (1982).
16. P. J. Nigrey,. " Response of Ethylene Propylene Rubber (EPDM) to Simulant HanfordTank Waste," SAND2000-0466, Sandia National Laboratories, Albuquerque, NM (2000).
17. ASTM D 792-91, Standard Test Method for Density and Specific Gravity (RelativeDensity) of Plastics by Displacement, American Society for Testing and Materials,Philadelphia, PA (1991).
18. ASTM D 543-87, Standard Test Method for Resistance of Plastics to Chemical Reagents,American Society for Testing and Materials, Philadelphia, PA (1987).
19. ASTM D 2240-91, Standard Test Method for Rubber Property - Durometer Hardness,American Society for Testing and Materials, Philadelphia, PA (1991).
20. ASTM D 395-89, Standard Test Method for Rubber Property - Compression Set,American Society for Testing and Materials, Philadelphia, PA (1989).
21. R. J. Del Vecchio. "Tensile Testing of Elastomers," in Tensile Testing (P. Han, ed.), ASMInternational, The Materials Information Society, Materials Park, Ohio (1992), pp. 136-146.
22. P. J. Nigrey and D. L. Bolton,. " Comprehensive Testing to Measure the Response ofFluorocarbon Rubber (FKM) to Hanford Tank Waste Simulant", SAND2000-0325,Sandia National Laboratories, Albuquerque, NM (2000).
46
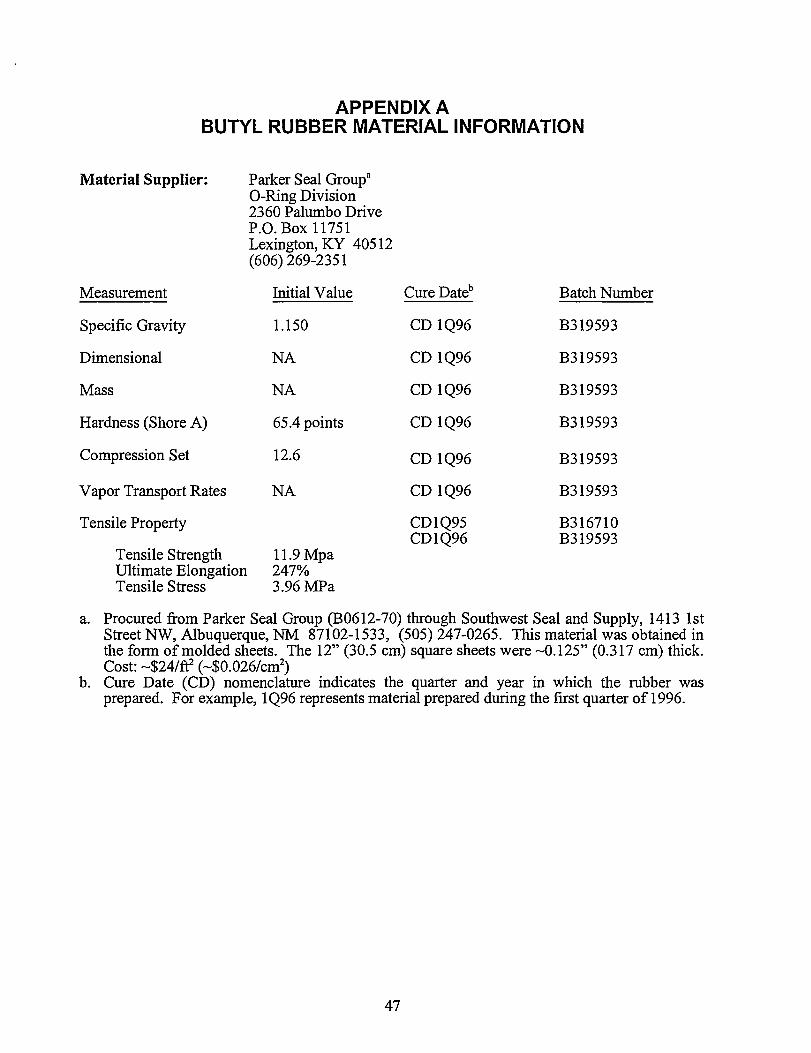
APPENDIX ABUTYL RUBBER MATERIAL INFORMATION
Material Supplier:
Measurement
Specific Gravity
Dimensional
Mass
Hardness (Shore A)
Compression Set
Vapor Transport Rates
Tensile Property
Tensile StrengthUltimate ElongationTensile Stress
Parker Seal Group3
O-Ring Division2360 Palumbo DriveP.O. Box 11751Lexington, KY 40512(606)269-2351
Initial Value
1.150
NA
NA
65.4 points
12.6
NA
11.9 Mpa247%3.96 MPa
Cure Dateb
CD 1Q96
CD 1Q96
CD 1Q96
CD 1Q96
CD 1Q96
CD 1Q96
CD1Q95CD1Q96
Batch Number
B319593
B319593
B319593
B319593
B319593
B319593
B316710B319593
a. Procured from Parker Seal Group (B0612-70) through Southwest Seal and Supply, 1413 1stStreet NW, Albuquerque, NM 87102-1533, (505) 247-0265. This material was obtained inthe form of molded sheets. The 12" (30.5 cm) square sheets were -0.125" (0.317 cm) thick.Cost: ~$24/ff (~$0.026/cm2)
b. Cure Date (CD) nomenclature indicates the quarter and year in which the rubber wasprepared. For example, 1Q96 represents material prepared during the first quarter of 1996.
47
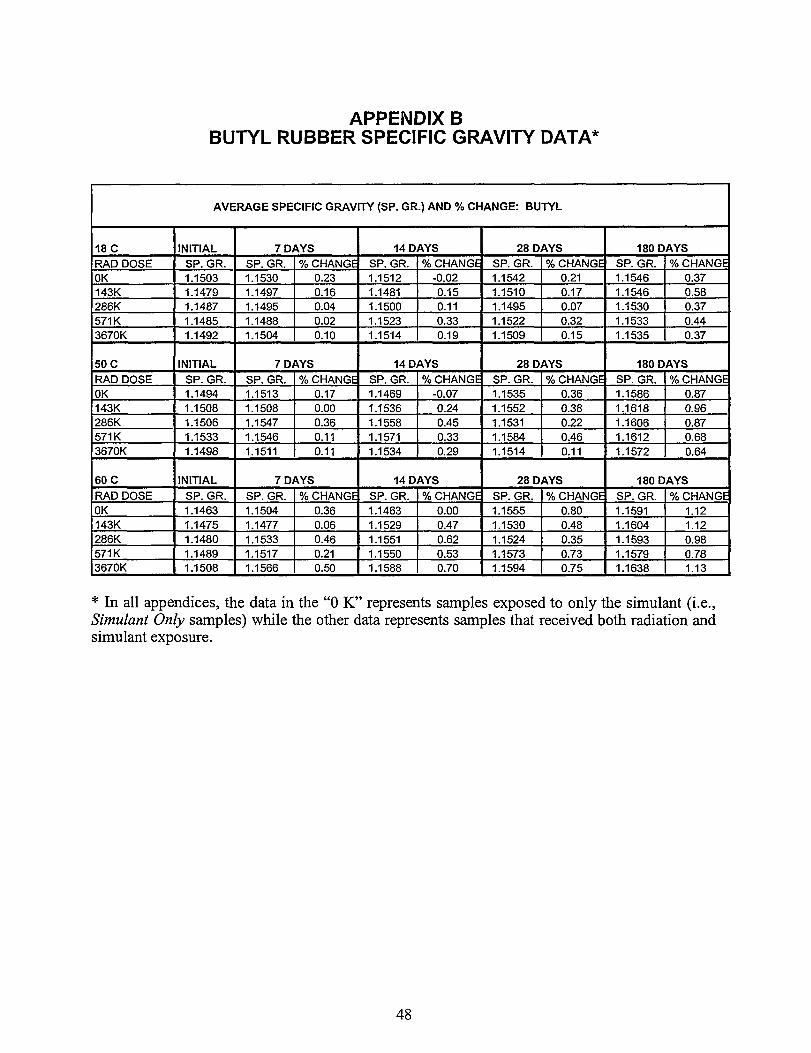
APPENDIX BBUTYL RUBBER SPECIFIC GRAVITY DATA*
AVERAGE SPECIFIC GRAVITY (SP. GR.) AND % CHANGE: BUTYL
18 CRAD DOSEOK143K286K571K3670K
50 CRAD DOSEOK143K286K571K3670K
60 C
RAD DOSEOK143K286K571K3670K
INITIALSP. GR.1.15031.14791.14871.14851.1492
INITIALSP. GR.1.14941.15081.15061.15331.1498
INITIAL
SP. GR.1.14631.14751.14801.14891.1508
7 DAYSSP. GR.1.15301.14971.14951.14881.1504
% CHANGE0.230.160.040.020.10
7 DAYSSP. GR.1.15131.15081.15471.15461.1511
% CHANGE0.170.000.360.110.11
7 DAYS
SP. GR.1.15041.14771.15331.15171.1566
% CHANGE0.360.060.460.210.50
14 DAYSSP. GR.1.15121.14811.15001.15231.1514
% CHANGE-0.020.150.110.330.19
14 DAYSSP. GR.1.14691.15361.15581.15711.1534
% CHANGE-0.070.240.450.330.29
14 DAYSSP. GR.1.14631.15291.15511.15501.1588
% CHANGE0.000.470.620.530.70
28 DAYSSP. GR.1.15421.15101.14951.15221.1509
% CHANGE0.210.170.070.320.15
28 DAYSSP. GR.1.15351.15521.15311.15841.1514
% CHANGE0.360.380.220.460.11
28 DAYSSP. GR.1.15551.15301.15241.15731.1594
% CHANGE0.800.480.350.730.75
180 DAYSSP. GR.1.15461.15461.15301.15331.1535
% CHANGE0.370.580.370.440.37
180 DAYSSP. GR.1.15861.16181.16061.16121.1572
% CHANGE0.870.960.870.680.64
180 DAYS
SP. GR.1.15911.16041.15931.15791.1638
% CHANGE1.121.120.980.781.13
* In all appendices, the data in the "0 K" represents samples exposed to only the simulant (i.e.,Simulant Only samples) while the other data represents samples that received both radiation andsimulant exposure.
48
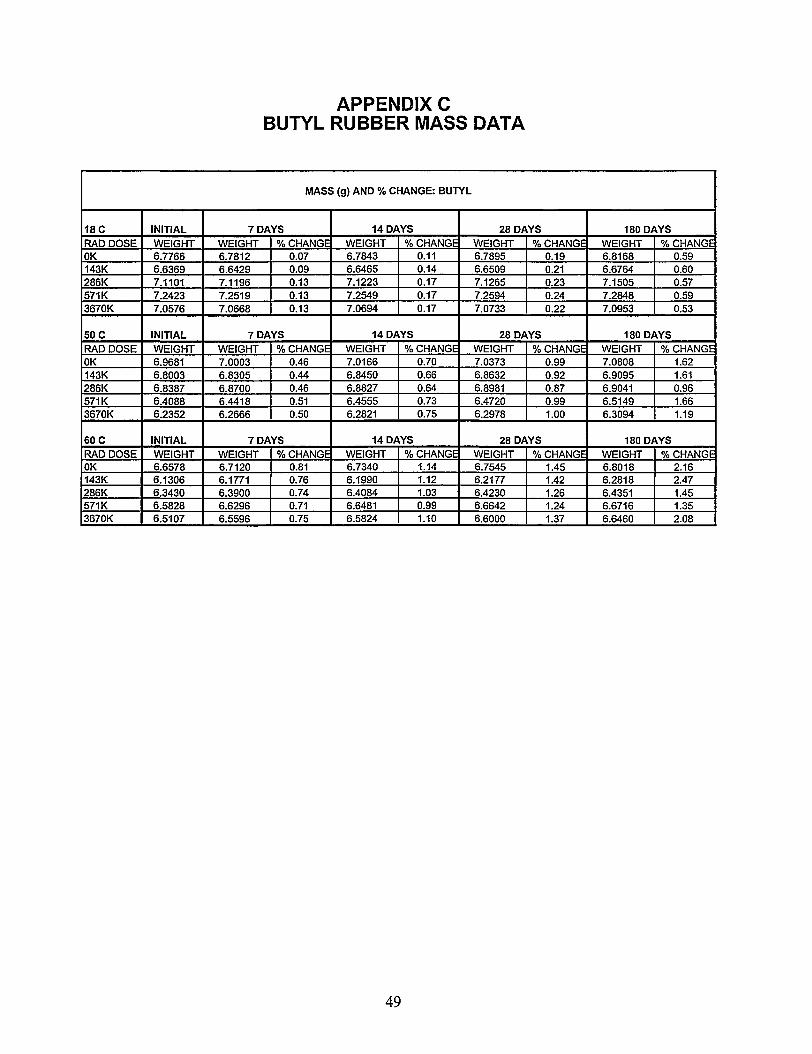
APPENDIX CBUTYL RUBBER MASS DATA
MASS (g) AND % CHANGE: BUTYL
18 CRAD DOSEOK143K286K571K3670K
SOCRAD DOSEOK143K286K571K3670K
60 CRAD DOSEOK143K286K571K3670K
INITIALWEIGHT6.77666.63697.11017.24237.0576
INITIALWEIGHT6.96816.80036.83876.40886.2352
INITIALWEIGHT6.65786.13066.34306.58286.5107
7 DAYSWEIGHT6.78126.64297.11967.25197.0668
% CHANGE0.070.090.130.130.13
7 DAYSWEIGHT7.00036.83056.87006.44186.2666
% CHANGE0.460.440.460.510.50
7 DAYSWEIGHT6.71206.17716.39006.62966.5596
% CHANGE0.810.760.740.710.75
14 DAYSWEIGHT6.78436.64657.12237.25497.0694
% CHANGE0.110.140.170.170.17
14 DAYSWEIGHT7.01666.84506.88276.45556.2821
% CHANGE0.700.660.640.730.75
14 DAYSWEIGHT6.73406.19906.40846.64816.5824
% CHANGE1.141.121.030.991.10
28 DAYSWEIGHT6.78956.65097.12657.25947.0733
% CHANGE0.190.210.230.240.22
28 DAYSWEIGHT7.03736.86326.89816.47206.2978
% CHANGE0.990.920.870.991.00
28 DAYSWEIGHT6.75456.21776.42306.66426.6000
% CHANGE1.451.421.261.241.37
180 DAYSWEIGHT6.81686.67647.15057.28487.0953
% CHANGE0.590.600.570.590.53
180 DAYSWEIGHT7.08086.90956.90416.51496.3094
% CHANGE1.621.610.961.661.19
180 DAYSWEIGHT6.80186.28186.43516.67166.6460
% CHANGE2.162.471.451.352.08
49
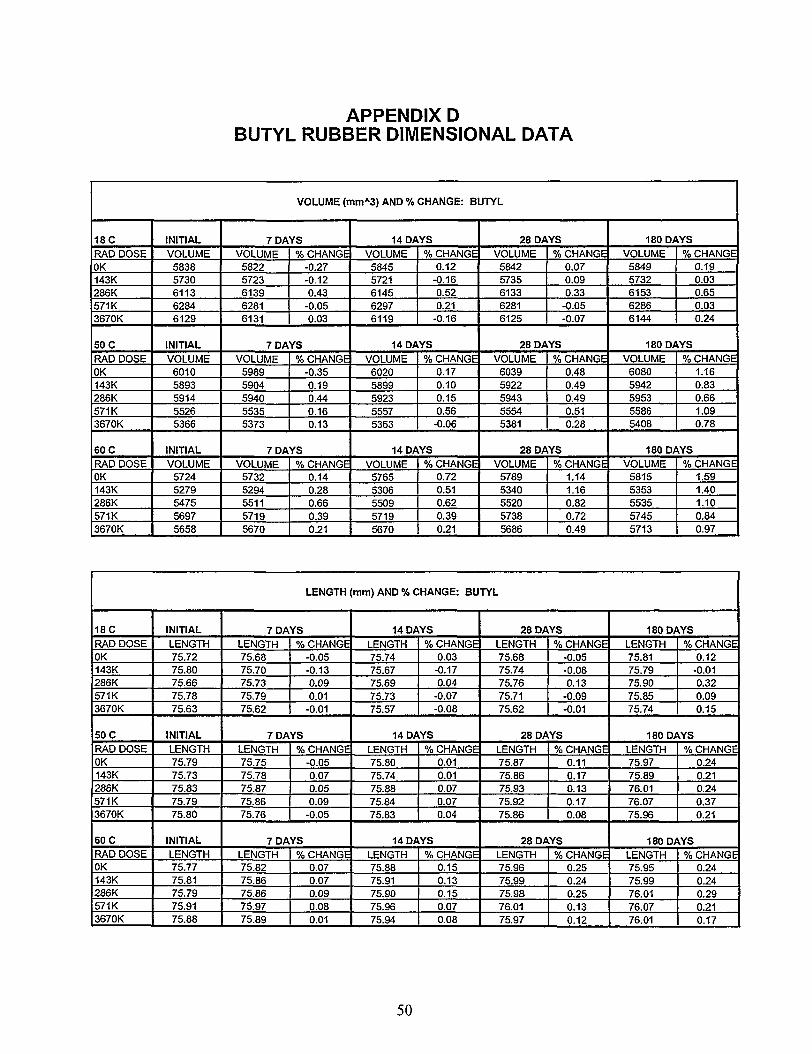
APPENDIX DBUTYL RUBBER DIMENSIONAL DATA
VOLUME (mmA3) AND % CHANGE: BUTYL
18CRAD DOSEOK143K286K571K3670K
50 CRAD DOSEOK143K286K571K3670K
60 CRAD DOSEOK143K286K571K3670K
INITIALVOLUME
58385730611362846129
INITIALVOLUME
60105893591455265366
INITIALVOLUME
57245279547556975658
7 DAYSVOLUME
58225723613962816131
% CHANGE-0.27-0.120.43
-0.050.03
7 DAYSVOLUME
59895904594055355373
% CHANGE-0.350.190.440.160.13
7 DAYSVOLUME
57325294551157195670
% CHANGE0.140.280.660.390.21
14 DAYSVOLUME58455721614562976119
% CHANGE0.12
-0.160.520.21
-0.16
14 DAYSVOLUME60205899592355575363
% CHANGE0.170.100.150.56
-0.06
14 DAYSVOLUME
57655306550957195670
% CHANGE0.720.510.620.390.21
28 DAYSVOLUME58425735613362816125
% CHANGE0.070.090.33
-0.05-0.07
28 DAYSVOLUME
60395922594355545381
% CHANGE0.480.490.490.510.28
28 DAYSVOLUME
57895340552057385686
% CHANGE1.141.160.820.720.49
180 DAYSVOLUME
58495732615362866144
% CHANGE0.190.030.650.030.24
180 DAYSVOLUME
60805942595355865408
% CHANGE1.160.830.661.090.78
180 DAYSVOLUME
58155353553557455713
% CHANGE1.591.401.100.840.97
LENGTH (mm) AND % CHANGE: BUTYL
18CRAD DOSEOK143K286K571K3670K
50 CRAD DOSEOK143K286K571K3670K
60 CRAD DOSEOK143K286K571K3670K
INITIALLENGTH75.7275.8075.6675.7875.63
INITIALLENGTH75.7975.7375.8375.7975.80
INITIALLENGTH75.7775.8175.7975.9175.88
7 DAYSLENGTH75.6875.7075.7375.7975.62
% CHANGE-0.05-0.130.090.01
-0.01
7 DAYSLENGTH75.7575.7875.8775.8675.76
% CHANGE-0.050.070.050.09
-0.05
7 DAYSLENGTH75.8275.8675.8675.9775.89
% CHANGE0.070.070.090.080.01
14 DAYSLENGTH75.7475.6775.6975.7375.57
% CHANGE0.03-0.170.04
-0.07-0.08
14 DAYSLENGTH75.8075.7475.8875.8475.83
% CHANGE0.010.010.070.070.04
14 DAYSLENGTH75.8875.9175.9075.9675.94
% CHANGE0.150.130.150.070.08
28 DAYSLENGTH75.6875.7475.7675.7175.62
% CHANGE!-0.05-0.080.13
-0.09-0.01
28 DAYSLENGTH75.8775.8675.9375.9275.86
% CHANGE0.110.170.130.170.08
28 DAYSLENGTH75.9675.9975.9876.0175.97
% CHANGE0.250.240.250.130.12
180 DAYSLENGTH75.8175.7975.9075.8575.74
% CHANGE0.12-0.010.320.090.15
180 DAYSLENGTH75.9775.8976.0176.0775.96
% CHANGE0.240.210.240.370.21
180 DAYSLENGTH75.9575.9976.0176.0776.01
% CHANGE0.240.240.290.210.17
50
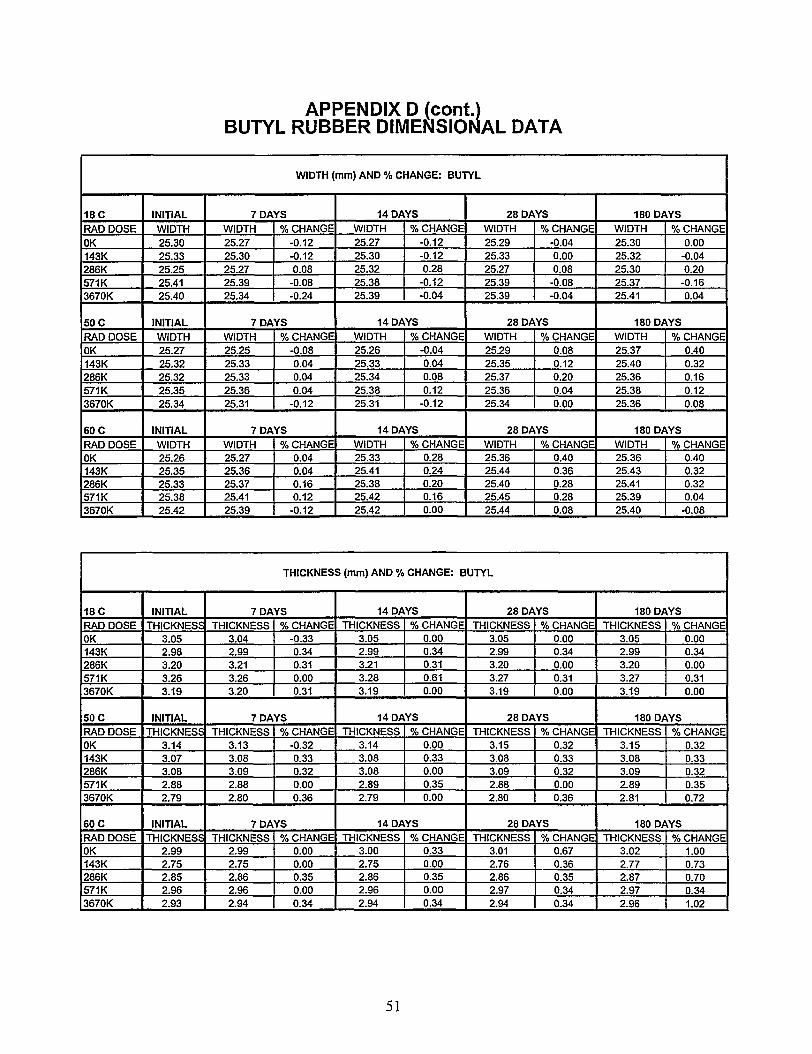
APPENDIX DBUTYL RUBBER DIMENSIONAL DATA
WIDTH (mm) AND % CHANGE: BUTYL
18CRAD DOSEOK143K286K571K3670K
50 CRAD DOSEOK143K286K571K3670K
60 CRAD DOSEOK143K286K571K3670K
INITIALWIDTH25.3025.3325.2525.4125.40
INITIALWIDTH25.2725.3225.3225.3525.34
INITIALWIDTH25.2625.3525.3325.3825.42
7 DAYSWIDTH25.2725.3025.2725.3925.34
% CHANGE-0.12-0.120.08
-0.08-0.24
7 DAYSWIDTH25.2525.3325.3325.3625.31
% CHANGE-0.080.040.040.04
-0.12
7 DAYSWIDTH25.2725.3625.3725.4125.39
% CHANGE0.040.040.160.12
-0.12
14 DAYSWIDTH25.2725.3025.3225.3825.39
% CHANGE-0.12-0.120.28
-0.12-0.04
14 DAYSWIDTH25.2625.3325.3425.3825.31
% CHANGE-0.040.040.080.12
-0.12
14 DAYSWIDTH25.3325.4125.3825.4225.42
% CHANGE0.280.240.200.160.00
28 DAYSWIDTH25.2925.3325.2725.3925.39
% CHANGE-0.040.000.08
-0.08-0.04
28 DAYSWIDTH25.2925.3525.3725.3625.34
% CHANGE0.080.120.200.040.00
28 DAYSWIDTH25.3625.4425.4025.4525.44
% CHANGE0.400.360.280.280.08
180 DAYSWIDTH25.3025.3225.3025.3725.41
% CHANGE0.00
-0.040.20
-0.160.04
180 DAYSWIDTH25.3725.4025.3625.3825.36
% CHANGE0.400.320.160.120.08
180 DAYSWIDTH25.3625.4325.4125.3925.40
% CHANGE0.400.320.320.04
-0.08
THICKNESS (mm) AND % CHANGE: BUTYL
18 CRAD DOSEOK143K286K571K3670K
50 CRAD DOSEOK143K286K571K3670K
60 CRAD DOSEOK143K286K571K3670K
INITIALTHICKNESS
3.052.983.203.263.19
INITIALTHICKNESS
3.143.073.082.882.79
INITIALTHICKNESS
2.992.752.852.962.93
7 DAYSTHICKNESS
3.042.993.213.263.20
% CHANGE-0.330.340.310.000.31
7 DAYSTHICKNESS
3.133.083.092.882.80
% CHANGE-0.320.330.320.000.36
7 DAYSTHICKNESS
2.992.752.862.962.94
% CHANGE0.000.000.350.000.34
14 DAYSTHICKNESS
3.052.993.213.283.19
% CHANGE0.000.340.310.610.00
14 DAYSTHICKNESS
3.143.083.082.892.79
% CHANGE0.000.330.000.350.00
14 DAYSTHICKNESS
3.002.752.862.962.94
% CHANGE0.330.000.350.000.34
28 DAYSTHICKNESS
3.052.993.203.273.19
% CHANGE0.000.340.000.310.00
28 DAYSTHICKNESS
3.153.083.092.882.80
% CHANGE0.320.330.320.000.36
28 DAYSTHICKNESS
3.012.762.862.972.94
% CHANGE0.670.360.350.340.34
180 DAYSTHICKNESS
3.052.993.203.273.19
% CHANGE0.000.340.000.310.00
180 DAYSTHICKNESS
3.153.083.092.892.81
% CHANGE0.320.330.320.350.72
180 DAYSTHICKNESS
3.022.772.872.972.96
% CHANGE1.000.730.700.341.02
51
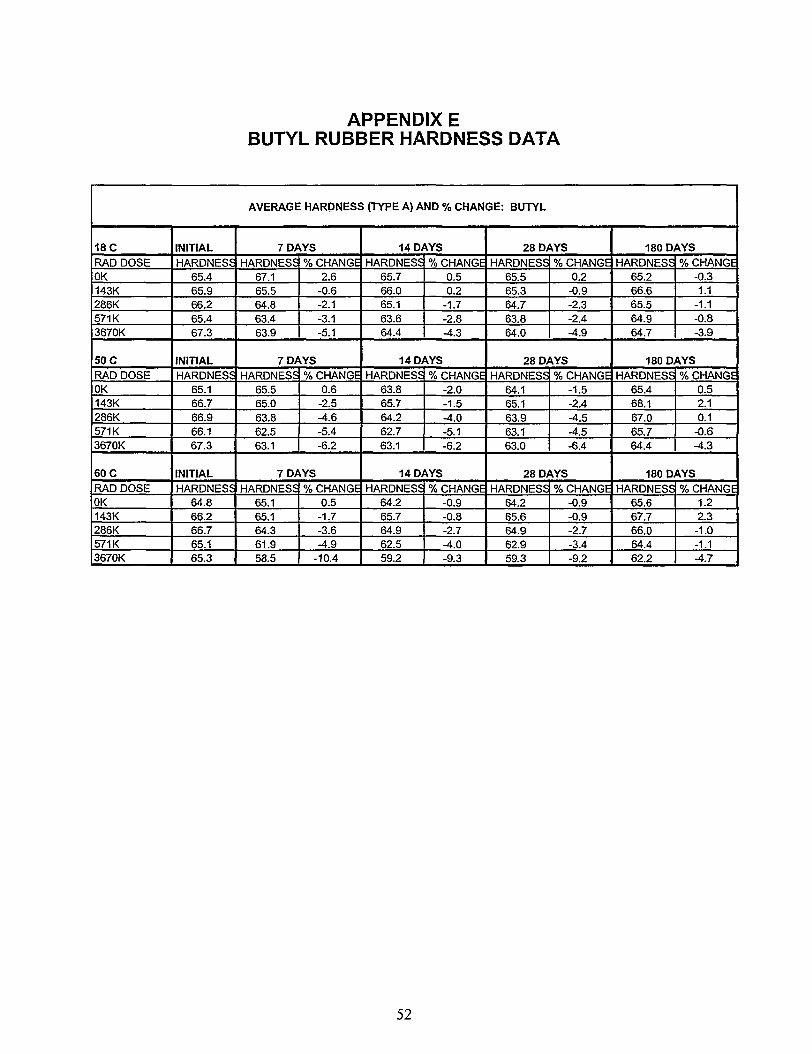
APPENDIX EBUTYL RUBBER HARDNESS DATA
AVERAGE HARPNESS (TYPE A) AND % CHANGE: BUTYL
18CRAD DOSEOK143K286K571K3670K
50 CRAD DOSEOK143K286K571K3670K
60 CRAD DOSEOK143K286K571K3670K
INITIALHARDNESS
65.465.966.265.467.3
INITIALHARDNESS
65.166.766.966.167.3
INITIALHARDNESS
64.866.266.765.165.3
7 DAYSHARDNESS
67.165.564.863.463.9
% CHANGE2.6
-0.6-2.1-3.1-5.1
7 DAYSHARDNESS
65.565.063.862.563.1
% CHANGE0.6
-2.5-4.6-5.4-6.2
7 DAYSHARDNESS
65.165.164.361.958.5
% CHANGE0.5
-1.7-3.6-4.9
-10.4
14 DAYSHARDNESS
65.766.065.163.664.4
% CHANGE0.50.2
-1.7-2.8-4.3
14 DAYSHARDNESS
63.865.764.262.763.1
% CHANGE-2.0-1.5-4.0-5.1-6.2
14 DAYSHARDNESS
64.265.764.962.559.2
% CHANGE-0.9-0.8-2.7-4.0-9.3
28 DAYSHARDNESS
65.565.364.763.864.0
% CHANGE0.2
-0.9-2.3-2.4-4.9
28 DAYSHARDNESS
64.165.163.963.163.0
% CHANGE-1.5-2.4-4.5-4.5-6.4
28 DAYSHARDNESS
64.265.664.962.959.3
% CHANGE-0.9-0.9-2.7-3.4-9.2
180 DAYSHARDNESS
65.266.665.564.964.7
% CHANGE-0.31.1
-1.1-0.8-3.9
180 DAYSHARDNESS
65.468.167.065.764.4
% CHANGE0.52.10.1
-0.6-4.3
180 DAYSHARDNESS
65.667.766.064.462.2
% CHANGE1.22.3-1.0-1.1-4.7
52
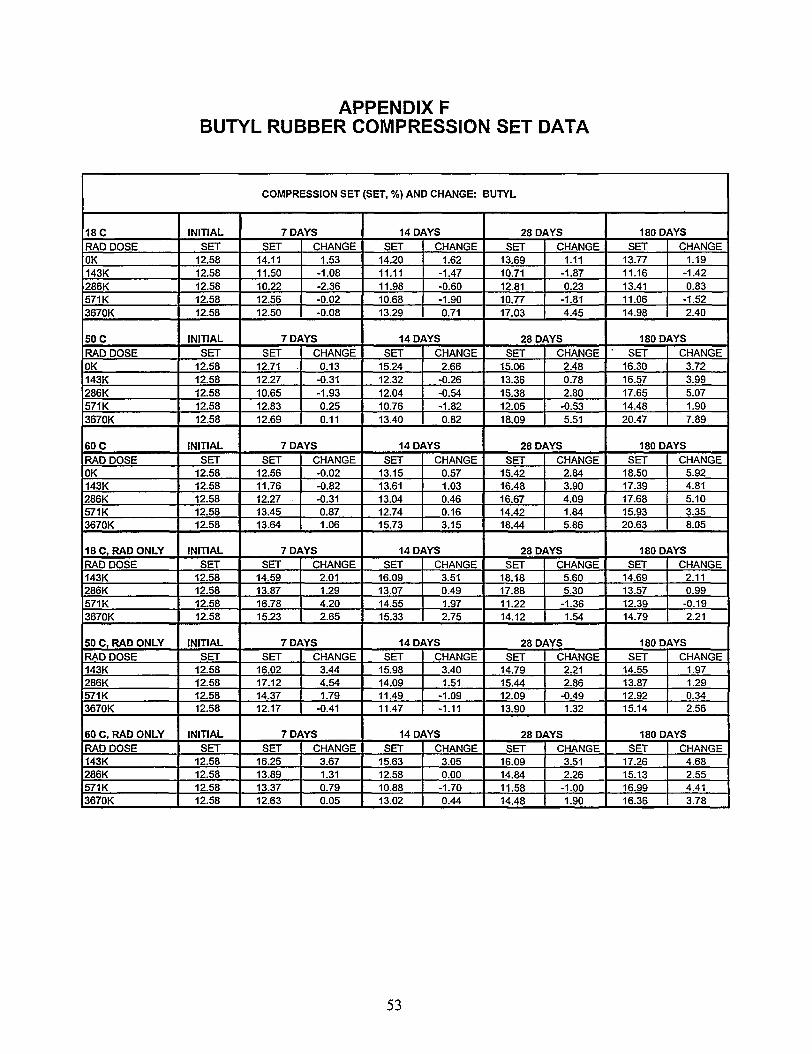
APPENDIX FBUTYL RUBBER COMPRESSION SET DATA
COMPRESSION SET (SET, %) AND CHANGE: BUTYL
18 CRAD DOSEOK143K286K571K3670K
50 CRAD DOSEOK143K286K571K3670K
60 CRAD DOSEOK143K286K571K3670K
18 C, RAD ONLYRAD DOSE143K286K571K3670K
50 C, RAD ONLYRAD DOSE143K286K571K3670K
60 C, RAD ONLYRAD DOSE143K286K571K3670K
INITIALSET
12.5812.5812.5812.5812.58
INITIALSET
12.5812.5812.5812.5812.58
INITIALSET
12.5812.5812.5812.5812.58
INITIALSET
12.5812.5812.5812.58
INITIALSET
12.5812.5812.5812.58
INITIALSET
12.5812.5812.5812.58
7 DAYSSET
14.1111.5010.2212.5612.50
CHANGE1.53
-1.08-2.36-0.02-0.08
7 DAYSSET
12.71 .12.2710.6512.8312.69
CHANGE0.13
-0.31-1.930.250.11
7 DAYSSET
12.5611.7612.2713.4513.64
CHANGE-0.02-0.82-0.310.871.06
7 DAYSSET
14.5913.8716.7815.23
CHANGE2.011.294.202.65
7 DAYSSET
16.0217.1214.3712.17
CHANGE3.444.541.79
-0.41
7 DAYSSET
16.2513.8913.3712.63
CHANGE3.671.310.790.05
14 DAYSSET
14.2011.1111.9810.6813.29
CHANGE1.62
-1.47-0.60-1.900.71
14 DAYSSET
15.2412.3212.0410.7613.40
CHANGE2.66
-0.26-0.54-1.820.82
14 DAYSSET
13.1513.6113.0412.7415.73
CHANGE0.571.030.460.163.15
14 DAYSSET
16.0913.0714.5515.33
CHANGE3.510.491.972.75
14 DAYSSET
15.9814.0911.4911.47
CHANGE3.401.51
-1.09-1.11
14 DAYSSET
15.6312.5810.8813.02
CHANGE3.050.00
-1.700.44
28 DAYSSET
13.6910.7112.8110.7717.03
CHANGE1.11
-1.870.23
-1.814.45
28 DAYSSET
15.0613.3615.3812.0518.09
CHANGE2.480.782.80
-0.535.51
28 DAYSSET
15.4216.4816.6714.4218.44
CHANGE2.843.904.091.845.86
28 DAYSSET
18.1817.8811.2214.12
CHANGE5.605.30-1.361.54
28 DAYSSET
14.7915.4412.0913.90
CHANGE2.212.86
-0.491.32
28 DAYSSET
16.0914.8411.5814.48
CHANGE3.512.26
-1.001.90
180 DAYSSET
13.7711.1613.4111.0614.98
CHANGE1.19
-1.420.83
-1.522.40
180 DAYS• SET
16.3016.5717.6514.4820.47
CHANGE3.723.995.071.907.89
180 DAYSSET
18.5017.3917.6815.9320.63
CHANGE5.924.815.103.358.05
180 DAYSSET
14.6913.5712.3914.79
CHANGE2.110.99-0.192.21
180 DAYSSET
14.5513.8712.9215.14
CHANGE1.971.290.342.56
180 DAYSSET
17.2615.1316.9916.36
CHANGE4.682.554.413.78
53
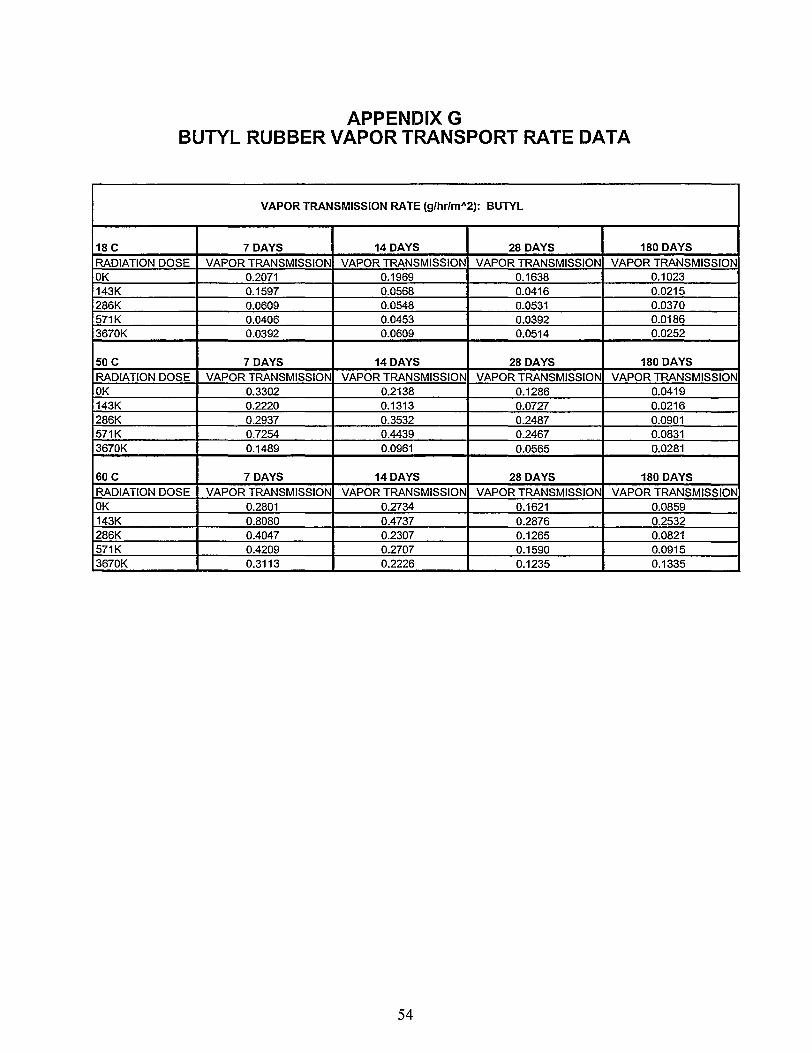
APPENDIX GBUTYL RUBBER VAPOR TRANSPORT RATE DATA
VAPOR TRANSMISSION RATE (g/hr/mA2): BUTYL
18 CRADIATION DOSEOK143K286K571K3670K
50 CRADIATION DOSEOK143K286K571K3670K
60 CRADIATION DOSEOK143K286K571K3670K
7 DAYSVAPOR TRANSMISSION
0.20710.15970.06090.04060.0392
7 DAYSVAPOR TRANSMISSION
0.33020.22200.29370.72540.1489
7 DAYSVAPOR TRANSMISSION
0.28010.80800.40470.42090.3113
14 DAYSVAPOR TRANSMISSION
0.19690.05680.05480.04530.0609
14 DAYSVAPOR TRANSMISSION
0.21380.13130.35320.44390.0961
14 DAYSVAPOR TRANSMISSION
0.27340.47370.23070.27070.2226
28 DAYSVAPOR TRANSMISSION
0.16380.04160.05310.03920.0514
28 DAYSVAPOR TRANSMISSION
0.12860.07270.24870.24670.0565
28 DAYSVAPOR TRANSMISSION
0.16210.28760.12650.15900.1235
180 DAYSVAPOR TRANSMISSION
0.10230.02150.03700.01860.0252
180 DAYSVAPOR TRANSMISSION
0.04190.02160.09010.08310.0281
180 DAYSVAPOR TRANSMISSION
0.08590.25320.08210.09150.1335
54
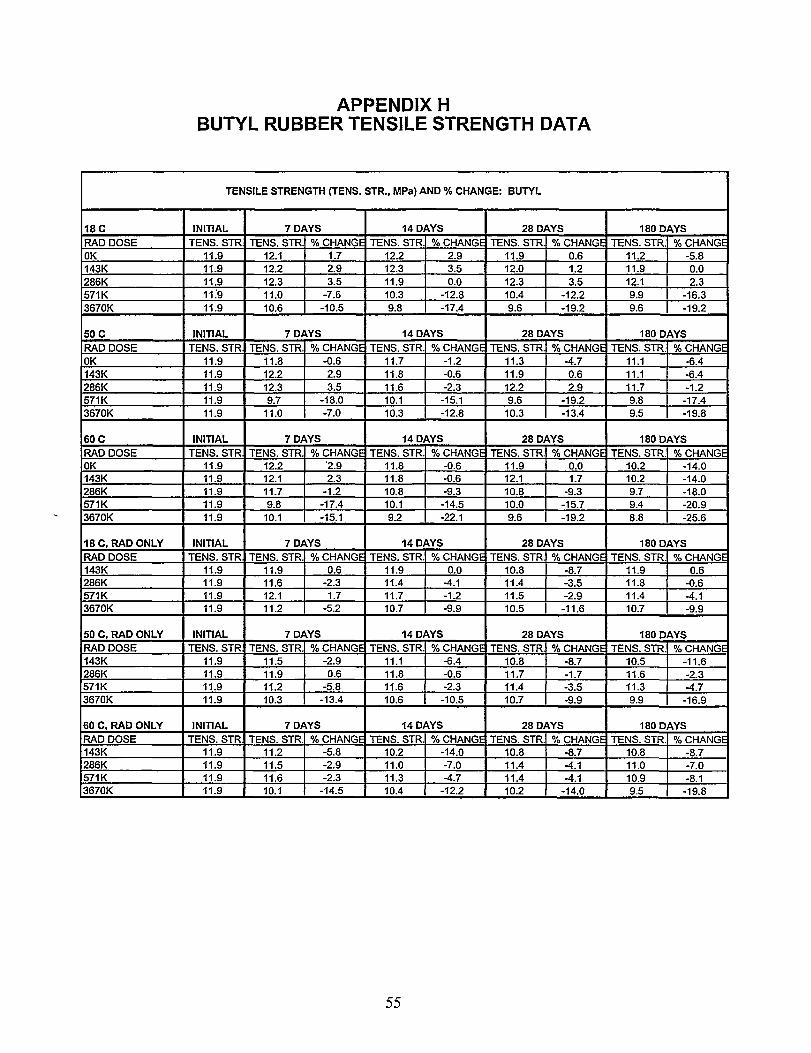
APPENDIX HBUTYL RUBBER TENSILE STRENGTH DATA
TENSILE STRENGTH (TENS. STR., MPa) AND % CHANGE: BUTYL
18 CRAD DOSEOK143K286K571K3670K
50 CRAD DOSEOK143K286K571K3670K
60 CRAD DOSEOK143K286K571K3670K
18 C, RAD ONLYRAD DOSE143K286K571K3670K
50 C, RAD ONLYRAD DOSE143K286K571K3670K
60 C, RAD ONLYRAD DOSE143K286K571K3670K
INITIALTENS. STR
11.911.911.911."911.9
INITIALTENS. STR
11.911.911.911.911.9
INITIALTENS. STR
11.911.911.911.911.9
INITIALTENS. STR
11.911.911.911.9
INITIALTENS. STR
11.911.911.911.9
INITIALTENS. STR.
11.911.911.911.9
7 DAYSTENS. STR.
12.112.212.311.010.6
% CHANGE1.72.93.5
-7.6-10.5
7 DAYSTENS. STR.
11.812.212.39.7
11.0
% CHANGE-0.62.93.5
-18.0-7.0
7 DAYSTENS. STR.
12.212.111.79.8
10.1
% CHANGE2.92.3
-1.2-17.4-15.1
7 DAYSTENS. STR.
11.911.612.111.2
% CHANGE0.6
-2.31.7
-5.2
7 DAYSTENS. STR.
11.511.911.210.3
% CHANGE-2.90.6
-5.8-13.4
7 DAYSTENS. STR.
11.211.511.610.1
% CHANGE-5.8-2.9-2.3
-14.5
14 DAYSTENS. STR.
12.212.311.910.39.8
% CHANGE2.93.50.0
-12.8-17.4
14 DAYSTENS. STR.
11.711.811.610.110.3
% CHANGE-1.2-0.6-2.3-15.1-12.8
14 DAYSTENS. STR.
11.811.810.810.19.2
% CHANGE-0.6-0.6-9.3-14.5-22.1
14 DAYSTENS. STR.
11.911.411.710.7
% CHANGE0.0
-4.1-1.2-9.9
14 DAYSTENS. STR.
11.111.811.610.6
% CHANGE-6.4-0.6-2.3-10.5
14 DAYSTENS. STR.
10.211.011.310.4
% CHANGE-14.0-7.0-4.7
-12.2
28 DAYSTENS. STR.
11.912.012.310.49.6
% CHANGE0.61.23.5
-12.2-19.2
28 DAYSTENS. STR.
11.311.912.29.6
10.3
% CHANGE-4.70.62.9
-19.2-13.4
28 DAYSTENS. STR.
11.912.110.810.09.6
% CHANGE0.01.7
-9.3-15.7-19.2
28 DAYSTENS. STR.
10.811.411.510.5
% CHANGE-8.7-3.5-2.9-11.6
28 DAYSTENS. STR.
10.811.711.410.7
% CHANGE-8.7-1.7-3.5-9.9
28 DAYSTENS. STR.
10.811.411.410.2
% CHANGE-8.7-4.1-4.1
-14.0
180 DAYSTENS. STR.
11.211.912.19.99.6
% CHANGE-5.80.02.3
-16.3-19.2
180 DAYSTENS. STR.
11.111.111.79.89.5
% CHANGE-6.4-6.4-1.2-17.4-19.8
180 DAYSTENS. STR.
10.210.29.79.48.8
% CHANGE-14.0-14.0-18.0-20.9-25.6
180 DAYSTENS. STR.
11.911.811.410.7
% CHANGE0.6
-0.6-4.1-9.9
180 DAYSTENS. STR.
10.511.611.39.9
% CHANGE-11.6-2.3-4.7-16.9
180 DAYSTENS. STR.
10.811.010.99.5
% CHANGE-8.7-7.0-8.1
-19.8
55
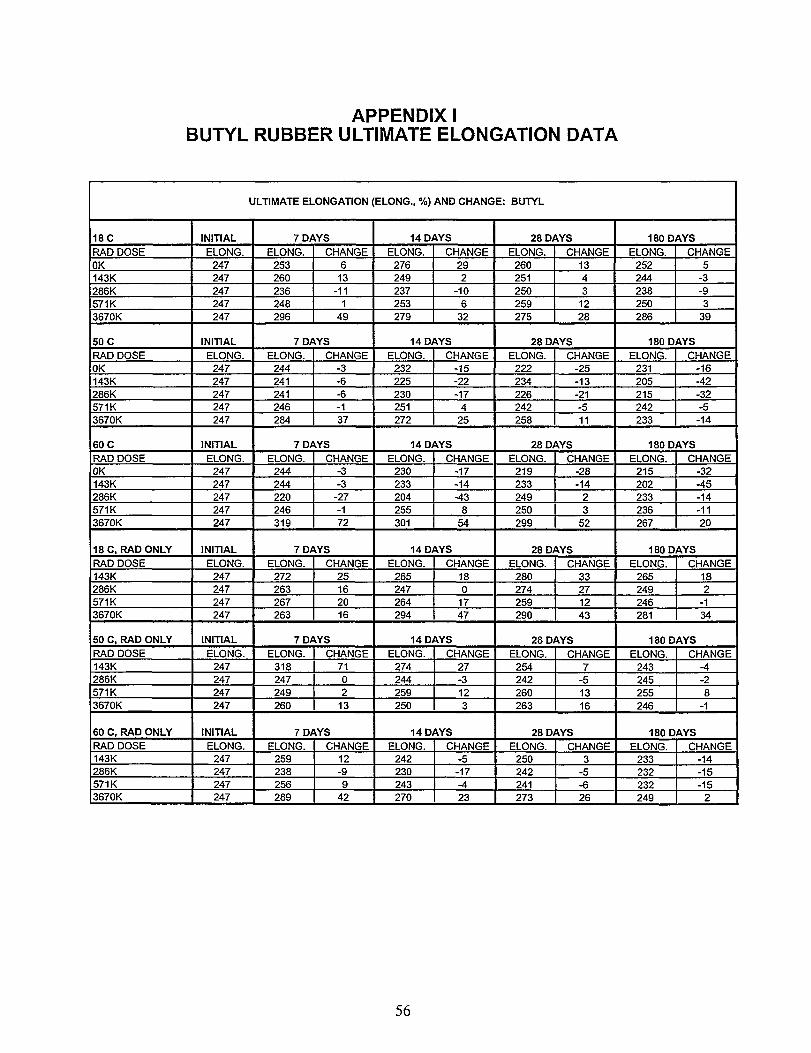
APPENDIX IBUTYL RUBBER ULTIMATE ELONGATION DATA
ULTIMATE ELONGATION (ELONG., %) AND CHANGE: BUTYL
1 8 CRAD DOSEOK143K286K571K3670K
50 CRAD DOSEOK143K286K571K3670K
60 CRAD DOSEOK143K286K571K3670K
18 C, RAD ONLYRAD DOSE143K286K571K3670K
50 C, RAD ONLYRAD DOSE143K286K571K3670K
60 C, RAD ONLYRAD DOSE143K286K571K3670K
INITIALELONG.
247247247247247
INITIALELONG.
247247247247247
INITIALELONG.
247247247247247
INITIALELONG.
247247247247
INITIALELONG.
247247247247
INITIALELONG.
247247247247
7 DAYSELONG.
253260236248296
CHANGE6
13-11
149
7 DAYSELONG.
244241241246284
CHANGE-3-6-6-137
7 DAYSELONG.
244244220246319
CHANGE-3-3
-27-172
7 DAYSELONG.
272263267263
CHANGE25162016
7 DAYSELONG.
318247249260
CHANGE7102
13
7 DAYSELONG.
259238256289
CHANGE12-99
42
14 DAYSELONG.
276249237253279
CHANGE292
-106
32
14 DAYSELONG.
232225230251272
CHANGE-15-22-17
425
14 DAYSELONG.
230233204255301
CHANGE-17-14-43
854
14 DAYSELONG.
265247264294
CHANGE180
1747
14 DAYSELONG.
274244259250
CHANGE27-3123
14 DAYSELONG.
242230243270
CHANGE-5
-17-423
28 DAYSELONG.
260251250259275
CHANGE1343
1228
28 DAYSELONG.
222234226242258
CHANGE-25-13-21-511
28 DAYSELONG.
219233249250299
CHANGE-28-14
23
52
28 DAYSELONG.
280274259290
CHANGE33271243
28 DAYSELONG.
254242260263
CHANGE7
-51316
28 DAYSELONG.
250242241273
CHANGE3
-5-626
180 DAYSELONG.
252244238250286
CHANGE5
-3-93
39
180 DAYSELONG.
231205215242233
CHANGE-16-42-32-5
-14
180 DAYSELONG.
215202233236267
CHANGE-32-45-14-1120
180 DAYSELONG.
265249246281
CHANGE182
-134
180 DAYSELONG.
243245255246
CHANGE-4-28
-1
180 DAYSELONG.
233232232249
CHANGE-14-15-15
2
56
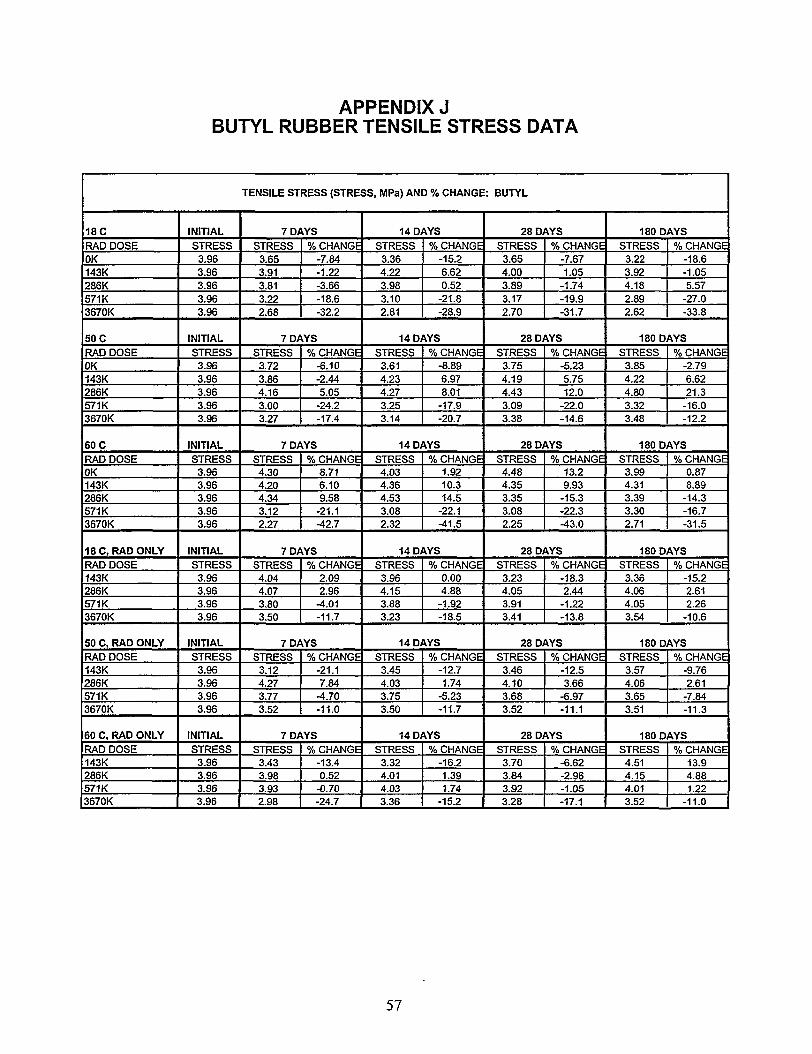
APPENDIX JBUTYL RUBBER TENSILE STRESS DATA
TENSILE STRESS (STRESS, MPa) AND % CHANGE: BUTYL
18CRAD DOSEOK143K286K571K3670K
50 CRAD DOSEOK143K286K571K3670K
60 CRAD DOSEOK143K286K571K3670K
18 C, RAD ONLYRAD DOSE143K286K571K3670K
50 C, RAD ONLYRAD DOSE143K286K571K3670K
60 C, RAD ONLYRAD DOSE143K286K571K3670K
INITIALSTRESS
3.963.963.963.963.96
INITIALSTRESS
3.963.963.963.963.96
INITIALSTRESS3.963.963.963.963.96
INITIALSTRESS3.963.963.963.96
INITIALSTRESS
3.963.963.963.96
INITIALSTRESS
3.963.963.963.96
7 DAYSSTRESS
3.653.913.813.222.68
% CHANGE-7.84-1.22-3.66-18.6-32.2
7 DAYSSTRESS3.723.864.163.003.27
% CHANGE-6.10-2.445.05
-24.2-17.4
7 DAYSSTRESS4.304.204.343.122.27
% CHANGE8.716.109.58
-21.1-42.7
7 DAYSSTRESS4.044.073.803.50
% CHANGE2.092.96
-4.01-11.7
7 DAYSSTRESS3.124.273.773.52
% CHANGE-21.17.84
-4.70-11.0
7 DAYSSTRESS
3.433.983.932.98
% CHANGE-13.40.52
-0.70-24.7
14 DAYSSTRESS
3.364.223.983.102.81
% CHANGE-15.26.620.52
-21.8-28.9
14 DAYSSTRESS3.614.234.273.253.14
% CHANGE-8.896.978.01
-17.9-20.7
14 DAYSSTRESS4.034.364.533.082.32
% CHANGE1.9210.314.5
-22.1-41.5
14 DAYSSTRESS3.964.153.883.23
% CHANGE0.004.88
-1.92-18.5
14 DAYSSTRESS3.454.033.753.50
% CHANGE-12.71.74
-5.23-11.7
14 DAYSSTRESS
3.324.014.033.36
% CHANGE-16.21.391.74
-15.2
28 DAYSSTRESS3.654.003.893.172.70
% CHANGE-7.671.05
-1.74-19.9-31.7
28 DAYSSTRESS3.754.194.433.093.38
% CHANGE-5.235.7512.0
-22.0-14.6
28 DAYSSTRESS4.484.353.353.082.25
% CHANGE13.29.93
-15.3-22.3-43.0
28 DAYSSTRESS3.234.053.913.41
% CHANGE-18.32.44-1.22-13.8
28 DAYSSTRESS3.464.103.683.52
% CHANGE-12.53.66
-6.97-11.1
28 DAYSSTRESS
3.703.843.923.28
% CHANGE-6.62-2.96-1.05-17.1
180 DAYSSTRESS
3.223.924.182.892.62
% CHANGE-18.6-1.055.57
-27.0-33.8
180 DAYSSTRESS3.854.224.803.323.48
% CHANGE-2.796.6221.3
-16.0-12.2
180 DAYSSTRESS3.994.313.393.302.71
% CHANGE0.878.89
-14.3-16.7-31.5
180 DAYSSTRESS3.364.064.053.54
% CHANGE-15.22.612.26
-10.6
180 DAYSSTRESS
3.574.063.653.51
% CHANGE-9.762.61
-7.84-11.3
180 DAYSSTRESS4.514.154.013.52
% CHANGE13.94.881.22
-11.0
57
DISTRIBUTION
1 U.S. Department of EnergyOffice of Transportation, EmergencyManagement, and Analytical ServicesEM-70, Cloverleaf Building19901 Germantown RoadGermantown, MD 20874-1290
Attn: M. Keane
3 U.S. Department of EnergyAlbuquerque Field OfficeMail Stop 1396P.O. Box 5400Albuquerque, NM 87185-1396
Attn: A. JusticeA. KapoorS. Hamp
2 U.S. Department of TransportationOffice of Hazardous Materials Technology, DHM-23Research and Special Programs Administration400 Seventh Street, S.W.Washington, D.C. 20590-001
Attn: R. BoyleJ. O'Steen
1 Mr. William LakeU.S. Department of EnergyRW-431Forrestal Building1000 Independence Avenue SWWashington, DC 20585
1 Mr. Ronald PopeInternational Atomic Energy AgencyWagramerstrasse 5P.O. 100A-1400 ViennaAUSTRIA
1 Mr. Richard RawlMS 6495Oak Ridge National LaboratoryP.O. Box 2008Oak Ridge, TN 37831-6495
58
1 Mr. Phil C. GregoryWaste Isolation DivisionWestinghouse Electric Corp.P.O. Box 2078Carlsbad, NM 88221-2078
1 Mr. Floyd HenryGeneral Plastics Manufacturing Co.4910 Burlington WayTacoma, WA 98409
1 Prof. Donald RileySchool of EngineeringWalla Walla College111 SW 3rdCollege Place, WA 99324
1 Mr. Alan B. RothmanET DivisionArgonne National Laboratory9700 S. Cass AvenueArgonne, IL 60439
1 Dr. Stan KosiewiczCST-7, MS J534Los Alamos National LaboratoryLos Alamos, NM 87545
1 Mr. Thomas M. ShanleyMS C931Los Alamos National LaboratoryLos Alamos, NM 87545
5 Waste Management Nuclear ServicesNorthwest Operations345 Hills StreetRichland, WA 99352
Attn: J. Greg FieldD. McCallJ. C. McCoyJ. R. McFaddenR. J. Smith, P. E.
1 Mr. Erich W. GrotheerAllied Signal - Kansas City Division2000 East 95th StreetKansas City, MO 64131
1 Mr. Charles TemusPORTEMUS Engineering Inc.9614 86th Ave. EastPuyallup, WA 98373-1334
59
101110111211
MSMSMSMSMSMSMSMSMSMS
0717071707180718071807661407089990180612
TTC Library, 6142G. F. Hohnstreiter, 6142D. Ammerman, actg., 6141P. J. Nigrey, 6141H.R. Yoshimura, 6141P. B. Davies, 6100M.R. Keenan, 1824Technical Library, 9616Central Tech Files, 8940-2Review & Approval Desk, 9612ForDOE/OSTI
60