Embed Size (px)
Citation preview

A COMPREHENSIVE MEASURE OF BUSINESS PERFORMANCE: A STUDY OF THE COMMERCIAL BANKING INDUSTRY IN ETHIOPIA
by
ASSEFA WOREDE TESFAY
Submitted in accordance with the requirements
for the degree of
Doctor of Business Leadership
at the
UNIVERSITY OF SOUTH AFRICA
SUPERVISOR: DR L PADAKANTI
DECEMBER, 2016
i
DECLARATION
I declare that, „A Comprehensive Measure of Business Performance: A study of the
Commercial Banking Industry in Ethiopia‟ is my own work and that all the sources
that I have used or quoted have been indicated and acknowledged by means of
complete references.
By: Assefa Worede Tesfay
__________________________
Degree: Doctor of Business Leadership

ii
ACKNOWLEDGEMENTS
I am very candid to express my sincere appreciation to my supervisor, Dr L
Padakanti, for his constant support and guidance throughout the whole research and
thesis write up. His expertise in the field has been so beneficial.
It is also my pleasure to express my gratitude to the management of Mekelle
University, the Ministry of Education, and UNISA for all the support given to me
during my studies. I would also extend my thanks to the branch managers of the
banks involved in the study, the employees and customers of the banks involved in
responding to the questionnaires, my colleagues in the CBE, MU, the Department of
Accounting & Finance, and those colleague who worked together with me in the data
collection. I am so indebted to those who generally assisted me directly or indirectly
in providing their suggestions, support, and data collection.
Finally, the moral support given by my wife Eleni Abadi and my children Meadi
Assefa, Liya Assefa, Tewodros Assefa and Nahom Assefa was a source of strength
and determination in my studies. Their sacrifice, patience, understanding, warmth
and love have made this research study a meaningful endeavour. My thanks are
also extended to my family in general but special respect goes to my brother L/Gen.
Tadesse worede whose contribution to the completion of this thesis was so
immense.

iii
ACRONYMS
AB = Abyssinia Bank
AIB = Awash International Bank
AS = Assurance
BSC = Balanced Scorecard
C.B.E. = Commercial Bank of Ethiopia
CAMEL = Capital; Asset; Management; Earning; and Liquidity
CBE = College of Business and Economics
CL = Customer Loyalty
CRD = Career & Development
CS = Customer satisfaction observed variables
CSI = Customer satisfaction index
CUSAT = Customer satisfaction latent variables
DB = Dashen Bank
EM = Empathy
EMSAT = Employee satisfaction latent variables
ERG = Existence-Relatedness-Growth (ERG) Theory
ES = Employee satisfaction observed variables
GDP = Gross Domestic Product
JDI = Job Descriptive Index
LIB = Lion International Bank
MBO = Management by objective
MSQ = Minnesota Satisfaction Questionnaire
MU = Mekelle University
NIB = Nib International Bank
RLS = Relation with supervisor
RLW = Relation with workers
REL = Reliability
RES = Responsiveness
RI = Residual income

iv
ROA = Return on Assets
ROE = Return on Equity
SERVQUAL = Service Quality
SB = Salary & benefits
SPC = Service-profit chain Model
SPSS = Statistical package for scientific studies
SQ = Service Quality
TAN = Tangibles
TSR = Theeory of self regulation
UB = United Bank
UNISA = University of South Africa
USA = United States of America
WB = Wegagen Bank
WE = Work environment
WC = Work content
WTO = World Trade Organisation
IAS = International Accounting Standards
IMF = International Monetary Fund
KMO = Kaiser-Meyer-Olkin
PCA = Principal Component Analysis
PMS = Performance Measurement Systems
VIF = Variance Inflation Factor
WTO = World Trade Organization

v
CONTENTS DECLARATION ........................................................................................................................................... i
ACKNOWLEDGEMENTS .......................................................................................................................... ii
ACRONYMS .............................................................................................................................................. iii
CONTENTS ................................................................................................................................................ v
LIST OF TABLES ...................................................................................................................................... xi
LIST OF FIGURES .................................................................................................................................. xiii
ABSTRACT ............................................................................................................................................. xiv
CHAPTER 1 ................................................................................................................................................ 1
OVERVIEW OF THE RESEARCH ............................................................................................................. 1
1.1. Introduction..................................................................................................................................... 1
1.2. Background of the Study .............................................................................................................. 1
1.3. Statement of the Problem ............................................................................................................ 4
1.4. Research Questions ..................................................................................................................... 5
1.4.1. General Question ................................................................................................. 5
1.4.2. Specific Questions .................................................................................................... 5
1.5. Objectives of the Study.................................................................................................................... 6
1.5.1. General Objective: .................................................................................................... 6
1.5.2. Specific Objectives of the Study: .............................................................................. 6
1.6. The Research Hypothesis: .......................................................................................................... 6
1.7. Significance of the Study:................................................................................................................ 7
1.8. Scope of the Study ........................................................................................................................... 7
1.9. The Structure of the Study .............................................................................................................. 8
1.10. Summary of the Chapter ............................................................................................................... 8
CHAPTER 2 ................................................................................................................................................ 9
THE THEORETICAL BASIS OF THE STUDY .......................................................................................... 9
2.1. Introduction ........................................................................................................................................ 9
2.2. Liberalization and the Contemporary Banking Business Environment in Ethiopia ................ 9
2.3. The Rational for Performance Measurement ............................................................................. 11
2.4. The Definition and Design of Performance Measurement....................................................... 12
vi
2.5. Theoretical Foundation of the Research..................................................................................... 14
2.5.1. The Strategic Management Theory ....................................................................... 14
2.5.2. Management Theory .............................................................................................. 23
2.6. The Performance Measurement Frameworks/Models: ............................................................ 35
2.6.1. The Balanced Scorecard Model:........................................................................... 36
A. Leading Indicators ........................................................................................................ 40
B. Lagging Indicators ........................................................................................................ 40
C. Relationship between Leading and Lagging Indicators .............................................. 41
2.6.2. The Service Profit Chain Model ............................................................................. 44
2.7. Summary of the Chapter ............................................................................................................... 48
CHAPTER 3 .............................................................................................................................................. 49
The EMPIRICAL LITERATURE REVIEW ............................................................................................... 49
3.1. Introduction ...................................................................................................................................... 49
3.2. General Overview ........................................................................................................................... 49
3.3. Empirical Studies on Measures of Profitability........................................................................... 50
3.4. Empirical Studies on the Non-Financial Measures of Performance....................................... 53
3.4.1. Internal internal-service quality .............................................................................. 56
3.4.2. Employees‟ Job Satisfaction .................................................................................. 58
3.4.3. Customer Service Quality....................................................................................... 60
3.4.4. Customer Satisfaction ............................................................................................ 63
3.4.5. Customer Loyalty.................................................................................................... 64
3.5. Hypotheses Development ............................................................................................................. 65
3.5.1. The Relationship between Internal Service Quality and Employee Job
Satisfaction: .................................................................................................................... 65
3.5.2. The Relationship between Employee Satisfaction and Customer Service
Quality (Internal Business Process Perspective) ....................................................... 69
3.5.3. The Relationship between Employee Satisfaction and Customer Satisfaction .... 72
3.5.4. The Relationship between Customer Service Quality and Customer Satisfaction 74
vii
3.5.5 The Relationship between Customer Satisfaction and Customer Loyalty: ............ 78
3.5.6 The Relationship between Customer Loyalty and Profitability: .............................. 80
3.6. Summary of the Chapter ............................................................................................................... 82
CHAPTER 4 .............................................................................................................................................. 84
METHODOLOGY ..................................................................................................................................... 84
4.1. Introduction ...................................................................................................................................... 84
4.2. Research hypotheses .................................................................................................................... 84
4.3 The Research Design ..................................................................................................................... 84
4.4 The Population and the Unit of Analysis ...................................................................................... 85
4.5 Sample Size Determination ........................................................................................................... 86
4.6 Data Source and methods of data collection .............................................................................. 89
4.6.1 Measurement Instruments for Primary Data Source .............................................. 89
4.6.2 Secondary data source ........................................................................................... 92
4.7. Methods of data analysis............................................................................................................... 92
4.8. Chapter summary ........................................................................................................................... 96
CHAPTER 5 .............................................................................................................................................. 97
DATA ANALYSIS ..................................................................................................................................... 97
5.1. Introduction ...................................................................................................................................... 97
5.2 Demographic Characteristics of Employees of the Sampled Commercial Banks: ............... 98
5.3. Demographic Characteristics of Customers of the Sampled Commercial Banks ..............100
5.4. Descriptive Statistics of the Dimensions ...................................................................................101
5.5. Customer Service Quality Expectations and Perceptions – The GAP Score
Analysis:.................................................................................................................................................103
5.6. Testing Validity and Reliability....................................................................................................104
5.7. Factor Analysis and Validity of Measures.................................................................................105
5.7.1. Factor analysis of internal service quality/Employee job satisfaction ..................106
5.7.2 Factor Analysis of Customer Service Quality Based on the Difference between
Perceptions and Expectations (Gap scores)...................................................................109
5.7.3. Factor Analysis of Customer Satisfaction and Customer Loyalty ........................111
viii
5.7.4 Goodness-of-fit Measures ......................................................................................112
5.8. Reliability Analysis – Cronbach Alpha Test Results ...............................................................112
5.9 Correlation and Multiple Regression Analysis ..........................................................................115
5.9.1. The Framework for Linking Employee Satisfaction, Customer Service Quality,
Customer Satisfaction, Customer Loyalty and Profitability .............................................117
5.9.2 Testing the Fundamental Assumptions of Multiple Regression Analysis ..............119
5.10. Testing the Hypotheses of the Study ......................................................................................122
5.11 Comparative Tests Using Multiple Regression Analysis of Public and Private
Banks: ....................................................................................................................................................146
5.12 Summary and Key Findings.......................................................................................................150
CHPTER 6 .............................................................................................................................................. 153
CONCLUSIONS, IMPLICATIONS, AND AREAS OF FUTURE RESEARCH...................................... 153
6.1. Conclusions ...................................................................................................................................153
Bibliography .......................................................................................................................................... 160
Appendices:........................................................................................................................................... 196
Appendix 1: Bank employees‟ satisfaction Survey (English Version)..........................................196
Appendix 2: Bank employees‟ satisfaction Survey (Amharic Version) ........................................201
Appendix 3: Bank service quality survey (English Version) ..........................................................205
Appendix 4: Bank service quality survey (Amharic Version) .........................................................211
Appendix 5: Emplyee Satisfiction Regression standardized Residual (EMST) .........................218
Appendix 6: Normal P -P Plot of regression statndardized residual Observed Cum
Prob (EMST) .........................................................................................................................................219
Appendix 7: Scatterplot regression standardized predicted value (EMST) ................................220
Appendix 8: Histogram Regression Standardized Residual (SER_QUAL) ................................221
Appendix 9: Normal P –P plot of regression standardized residual Observed cub
prob (SER_QUAL) ...............................................................................................................................222
Appendix 10: Scatterplot Regression Standardization Predicted value (SER_QUAL) .............223
Appendix 11 Histogram Regression Standardized Residual (CU_SATISFACTION) ...............224

ix
Appendix 12: Normal P –P plot of regression standardized residual Observed cub
prob (CU_SATISFACTION)................................................................................................................225
Appendix 13: Scatterplot Regression Standardizaed Predicted value
(CU_SATISFACTION) .........................................................................................................................226
Appendix 14: Histogram Regression Standardized Residual (CU_SATISFACTION) ..............227
Appendix 15: Normal P –P plot of regression standardized residual Observed cub
prob (CU_SATISFACTION)................................................................................................................228
Appendix 16: Scatterplot Regression Standardized Predicted value
(CU_SATISFACTION) .........................................................................................................................229
Appendix 17: Histogram Regression Standardized Residual (CU_LOYALITY) ........................230
Appendix 18: Normal P –P plot of regression standardized residual Observed cub
prob (CU_LOYALITY)..........................................................................................................................231
Appendix 19: Scatterplot Regression Standardized Predicted value (CU_LOYALITY) ...........232
Appendix 20: List of Banks in Ethiopia .............................................................................................233
Appendix 21: Summary of the inter item correlations of internal marketing attributes
and the correlation of internal marketing attributes with employee job satisfaction:
(N=180) ..................................................................................................................................................234
Appendix 22: Summary of the correlations of internal service quality
attributes/employee satisfaction and customer service quality:(N=180) .....................................234
Appendix 23: Summary of the correlations of internal service quality
attributes/employee satisfaction and customer satisfaction: (N=180) .........................................235
Appendix 24: Summary of the inter-item correlations of customer service quality
dimensions and the correlation of customer service quality with customer
satisfaction: (N=180) ............................................................................................................................235
Appendix 25: Summary of the correlation of customer service quality dimensions
with customer loyalty: (N=180)...........................................................................................................236
Appendix 26: Summary of the correlation of customer satisfaction dimensions with
customer loyalty:(N=180) ....................................................................................................................236
Appendix 27: Multiple regression analysis of internal service quality dimensions and
employee satisfaction in public and private banks:.........................................................................237

x
Appendix 28: Multiple regression analysis showing internal service quality
dimensions and customer service quality in public and private banks: .......................................238
Appendix 29: Multiple regression analysis showing internal service quality
dimensions and customer satisfaction in public and private banks: ............................................239
Appendix 30: Multiple regression analysis table showing customer service quality
dimensions and customer satisfaction in public and private banks: ............................................240
Appendix 31: Multiple regression analysis table showing customer service quality
dimensions and customer loyalty in public and private banks: .....................................................241
Appendix 32: Multiple regression analysis table showing customer satisfaction
dimensions and customer loyalty in public and private banks: .....................................................242
Appendix 33: Multiple regression analysis table showing customer loyalty
dimensions and profitability in public and private banks:...............................................................243
xi
LIST OF TABLES TABLE 4. 1: SUMMARY OF SAMPLE BANKS AND BRANCHES OF THE COMMERCIAL BANKS IN
ETHIOPIA. ................................................................................................................................................................... 88
TABLE 5. 1: SUMMARY OF EMPLOYEE DEMOGRAPHIC STATISTICS (N= 180) .................................... 99
TABLE 5. 2: SUMMARY OF THE DEMOGRAPHIC STATISTICS OF CUSTOMERS (N= 180) ............ 101
TABLE 5. 3:: DESCRIPTIVE STATISTICS FOR THE DIMENSIONS EMPLOYEE JOB SATISFACTION
....................................................................................................................................................................................... 101
TABLE 5. 4: DESCRIPTIVE STATISTICS FOR CUSTOMER SATISFACTION ........................................... 102
TABLE 5. 5: DESCRIPTIVE STATISTICS FOR CUSTOMER LOYALTY........................................................ 102
TABLE 5. 6: SERVICE GAP FOR THE DIMENSION OF SERVICE QUALITY IN THE COMMERCIAL
BANKS IN ETHIOPIA ........................................................................................................................................... 104
TABLE 5. 7: SUMMARY OF TOTAL VARIANCE EXPLAINED OF INTERNAL SERVICE QUALITY
DIMENSIONS ........................................................................................................................................................... 107
TABLE 5. 8: TOTAL VARIANCE EXPLAINED OF CUSTOMER SERVICE QUALITY GAP SCORES110
TABLE 5. 9: SUMMARY OF TOTAL VARIANCE EXPLAINED OF CUSTOMER SATISFACTION AND
CUSTOMER LOYALTY DIMENSIONS .......................................................................................................... 111
TABLE 5. 10: RELIABILITY COEFFICIENT OF EMPLOYEE SATISFACTION DIMENSIONS
(CRONBACH'S ALPHA) ITEM-TOTAL STATISTICS .............................................................................. 113
TABLE 5. 11: RELIABILITY COEFFICIENT OF CUSTOMER SERVICE QUALITY DIMENSIONS
(CRONBACH'S ALPHAS) ITEM-TOTAL STATISTICS ........................................................................... 114
TABLE 5. 12: RELIABILITY COEFFICIENT OF CUSTOMER SATISFACTION AND CUSTOMER
LOYALTY DIMENSIONS (CRONBACH'S ALPHAS) ITEM-TOTAL STATISTICS ........................ 115
TABLE 5. 13: A MODEL SUMMARY, ANOVA AND DETERMINATION OF MULTIPLE REGRESSION
EQUATION FOR HYPOTHESIS 1 SHOWING INTERNAL MARKETING DIMENSIONS AND
EMPLOYEE SATISFACTION: (N180). ........................................................................................................... 124
TABLE 5. 14: MODEL SUMMARY, ANOVA AND DETERMINATION OF MULTIPLE REGRESSION
EQUATION FOR HYPOTHESIS 2 SHOWING INTERNAL MARKETING DIMENSIONS AND
CUSTOMER SERVICE QUALITY: (N180).................................................................................................... 128
TABLE 5. 15: MODEL SUMMARY, ANOVA AND DETERMINATION OF MULTIPLE REGRESSION
EQUATION FOR HYPOTHESIS 3 SHOWING INTERNAL SERVICE QUALITY DIMENSIONS
AND CUSTOMER SATISFACTION: (N180). ............................................................................................... 131
TABLE 5. 16: MODEL SUMMARY, ANOVA AND DETERMINATION OF MULTIPLE REGRESSION
EQUATION FOR HYPOTHESIS 4 SHOWING CUSTOMER SERVICE QUALITY DIMENSIONS
AND CUSTOMER SATISFACTION: (N180). ............................................................................................... 133
TABLE 5. 17: MODEL SUMMARY, ANOVA AND DETERMINATION OF MULTIPLE REGRESSION
EQUATION FOR CUSTOMER SERVICE QUALITY DIMENSIONS AND CUSTOMER
LOYALTY: (N180). ................................................................................................................................................. 137

xii
TABLE 5. 18: MODEL SUMMARY, ANOVA AND DETERMINATION OF MULTIPLE REGRESSION
EQUATION FOR HYPOTHESIS SHOWING CUSAT ATTRIBUTES AND CL: (N180)................ 139
TABLE 5. 19: MODEL SUMMARY, ANOVA AND DETERMINATION OF MULTIPLE REGRESSION
EQUATION FOR HYPOTHESIS 7 SHOWING CUSTOMER LOYALTY ATTRIBUTES AND
OVERALL PROFITABILITY: ............................................................................................................................. 142
TABLE 5. 20: PROFITABILITY INDICATORS OF COMMERCIAL BANKS (2009-2013):........................ 143
xiii
LIST OF FIGURES FIGURE 2. 1 : A FRAMEWORK FOR ANALYSING RESOURCES AND CAPABILITIES ......................... 16
FIGURE 2. 2 : MASLOW’S HIERARCHY OF NEEDS .............................................................................................. 26
FIGURE 2. 3 : THE GENERIC STRUCTURE OF THE BALANCED SCORECARD....................................... 37
FIGURE 2. 4 : THE GENERIC STRUCTURE OF THE SERVICE-PROFIT CHAIN MODEL ........................ 44
FIGURE 3. 1: PATH MODEL OF MULTIPLE REGRESSION ANALYSIS ON THE EFFECT OF
INTERNAL SERVICE QUALITY DIMENSIONS ON EMPLOYEE SATISFACTION. ...................... 68
FIGURE 3. 2: PATH MODEL OF MULTIPLE REGRESSION ANALYSIS OF THE EFFECT OF
INTERNAL SERVICE QUALITY DIMENSIONS OF SERVICE QUALITY. ......................................... 71
FIGURE 3. 3: THE PATH MODEL OF MULTIPLE REGRESSION ANALYSIS ON THE EFFECT OF
EMPLOYEE SATISFACTION ON CUSTOMER SATISFACTION: ........................................................ 74
FIGURE 3. 4: THE PATH MODEL OF MULTIPLE REGRESSION ANALYSIS ON THE EFFECT OF
SERVICE QUALITY ON CUSTOMER SATISFACTION:........................................................................... 77
FIGURE 3. 5: THE PATH MODEL OF MULTIPLE REGRESSION ANALYSIS ON THE EFFECT OF
CUSTOMER SATISFACTION ON CUSTOMER LOYALTY: ................................................................... 80
FIGURE 3. 6: THE PATH MODEL OF MULTIPLE REGRESSION ANALYSIS ON THE EFFECT OF
CUSTOMER LOYALTY ON PROFITABILITY: ............................................................................................... 82
Figure 5. 1: An Integrated Research Model - linking ISQ, ES, ESQ, CS, CL, & and
profitability:………………………………………………………………………………………. 118

xiv
ABSTRACT
The purpose of the study was to identify a comprehensive measure of performance
by assessing the relationship between employee satisfaction and customer
satisfaction on the profitability of the commercial banking industry in Ethiopia. The
study adopted unidimensional path models, multivariate approach and factor
analysis in predicting the dependent variable, determining the independent variables
and the sample size and justifying the objectives of the sturdy. Primary data were
obtained through structured questionnaires from valid sample responses of 180
employees and customers selected on convenient sampling method. Profitability
(ROA & ROE) was measured based on the average data from the financial
statements of 2007/8-2001/12 of the banks. Variant of empirical studies and
theoretical frameworks, drawn from motivational, psychological and behavioural
theories, were used to formulate the hypothesis and establish the relationship
between internal service quality, employee satisfaction, customer service quality,
customer satisfaction, customer loyalty and profitability. Results of the study
indicated internal marketing influenced employee job satisfaction which in turn
partially influenced customer service quality and customer satisfaction; customer
service quality influenced customer satisfaction which then influenced customer
loyalty. But, no relationship was observed between customer loyalty and profitability.
However, due to the timing gap of the data on profitability and the data on customer
satisfaction and customer loyalty, the relationship is apparently realizable in the long
run. Therefore, due emphasis is required by the management of the banks to exert
the necessary strategic effort on employee satisfaction, customer service quality,
and customer satisfaction because of their implicit effects on profitability. Finally, the
relevance of the research to the literature on performance measurement is
demonstrated by contextualizing comprehensive models in the context of
commercial banking industry in Ethiopia.
Key Words: comprehensive, performance, social exchange theory, attitude theory,
emotional contagion theory, BSC Model, SPC Model, internal service quality,
employee satisfaction, customer service quality, customer satisfaction, customer
loyalty, profitability, commercial bank, Ethiopia.

1
CHAPTER 1
OVERVIEW OF THE RESEARCH
1.1. Introduction
This chapter provided an overview of the study. It briefly discussed the
background of the study, the statement of the problem, the research
questions, the objectives, the hypothesis, the significance, the scope and the
structure of the study. Finally, the summary of the chapter was presented.
1.2. Background of the Study
A bank, as part of the financial system, involves the provision of maturity
intermediation, risk reduction via diversification, reduction of information processing
costs, and provision of payment functions (Faboze, Modigliani & Jones, 2005). A
bank is believed to significantly contribute to the dynamic development of a country‟s
economy. Therefore, the prevalence of profitable bank that can generate sufficient
funds for economic growth is a requirement. Efficiency in the banking system depicts
improved profitability, ensures stability, and enhances public confidence. Besides, it
increases the volume of funds intermediated, allocates resources efficiently, induces
liquidity, and facilitates better quality services for customers (Sufian & Chong, 2008).
Profitability is the bottom line of efficiency of banks. But profitability can be achieved
through internal marketing that creates satisfied employees, which in turn builds
satisfied customers through quality services. Satisfied customers lead to loyal
customers, thereby expected to serve as the basis for improved profitability of the
banks. Therefore, performance measurement systems need to motivate employees
to achieve organizational goals and enable managers to make better decisions.
With the objective of building an efficient financial system, governments have been
undertaking reform measures to liberalise the sector. The reform measures have

2
generally attracted private investment in the sector and created a competitive
environment that address the need for the broader financial services in the economy.
The ultimate effect is an opportunity for the increase in the number, size and breadth
of the financial system.
Consequently, researchers, practitioners, and policy makers in the banking and
finance area have long been inspired to focus on the activities and performance of
banks (Athanasoglou, Brissimis & Delis, 2008). Performance measurement, as a
component of the management control process, plays a significant role in
organizational effectiveness (Slater & Olson, 2002). However, it is imperative to put
in effective, reliable performance measurement that evaluates the success or failure
of a bank, assess the bank‟s current status and predict its future health (Al Sawalqa,
Holloway & Allan, 2011). This requires adopting appropriate performance measures
that enhances the competitive environment of the banking industry.
Prior studies indicate the dominance of financial measures in evaluating
performance of organizations. However, empirical evidence suggests that
dependence of organizations only on financial performance measures may lead to a
perceptual bias (DeBusk, Killough & Brown, 2003). Besides, using financial
measures was criticized as short term focused and dependent only on historical
data. This led researchers to pay their attention to the need for a comprehensive
measure of performance.
The use of non-financial measures along with financial measures was believed to be
forward looking (Slater & Olson, 2002; Ittner & Larcker, 2003). The changing needs
of customers, the increased concern of shareholders on their investment, the
advancement in technological development and the need to win a competitive edge
in the market (Ghosh & Mukherjee, 2006) is among the factors pushing
organisations to shift their strategic priorities from low-cost production to
differentiation. This has diverted the focus on being unique in terms of quality, short
lead time and dependable delivery, which is a shift of external marketing approach to
create satisfaction to the customers (Al Sawalqa, et al. 2011). But, to sustain in such
an environment requires motivated work force which focuses on internal service

3
marketing. All these dynamics have revealed further the limitations of traditional
performance measures that focused only on financial measures.
Designing and implementing performance measurement frameworks that blend
financial as well as non-financial indicators is a key to maintaining a healthy and
stable banking system. A large number of performance measurement frameworks
have been designed, of which the Service-Profit Chain (SPC) framework (Heskett,
Jones, Loveman, Sasser & Schlesinger, 2008; 1994) and the Balanced Scorecard
(BSC) framework (Kaplan & Norton, 1996) have been more widely accepted (Xu &
Goedegebuure, 2005). These approaches were developed out of the need to focus
on non-financial measures and achieve the ultimate financial objectives.
The BSC lays emphasis on the impacts of non-financial measures such as employee
satisfaction through internal marketing, product/service quality, and customer
satisfaction on financial measures. It further stresses on the notion of linking
performance measures on associated cause-and-effect relationships (Bisbe & Otley,
2004). It is a model that keeps managers from focusing too much on improving one
measure at the expense of others (Hoque & James, 2000; Al Sawalqa, et al. 2011).
The Service Profit Chain Model (SPC) interlinks performance starting from internal
service quality up to an organization‟s financial performance. It is a framework that
examines how employee satisfaction variables are related to customer satisfaction
variables and how they ultimately result in profit (Xu & Goedegebuure, 2005).
According to Reichheld, (2000), customers and employees are the two main
energizing force that could show the various relationships in the SPC model (Cohen
& Olsen, 2013).
In view of the above discussions, this research study is inspired to examine the
impacts of the non-financial variables (employee satisfaction, service quality,
customer satisfaction and customer loyalty) on the profitability of the commercial
banks in Ethiopia.

4
1.3. Statement of the Problem
The performance measures that are currently used by the Commercial Banks in
Ethiopia are based on traditional financial measures of profitability. Tools such as
Return on Assets (ROA) and Return on Equity (ROE) are used as measures of
performance. The National Bank of Ethiopia as a regulator of the banking industry
uses the CAMEL rating system to evaluate and rank the commercial banks in
Ethiopia by reflecting the level of risk taken by banks and the risk-taking efficiency of
those banks.
However, the literature on performance evaluation designates the growing need to
supplement the financial performance measures with non-financial performance
measures so as to evaluate the long term profitability and sustainability of the banks.
Various theories have been developed in view of the resounding and dynamic nature
of the field of study. Many classical and modern theories have been referred to deal
with behavioural, psychological, and sociological (Payne, 2006, 2013, 2014) issues
for practical and academic purposes. Theories such equity theory, expectancy
theory, resource based theory, social exchange theory, attitude theory, and
emotional contagion theory were among them.
Kaplan & Norton (1996) postulate a shift from the industrial to the information age
demanding new capabilities for competitive success and where the contribution of
the intangible resources to an efficient financial performance is recognized.
Employee satisfaction, customer satisfaction and service quality are the triple
components that need to be addressed to achieve the objective of profitability.
Empirical studies indicate that significant studies have been conducted on the impact
of employee satisfaction and customer satisfaction on profitability of a business.
Studies conducted by Bhaskar & Khera (2013), Kim, Kim, & Wachter (2013),
Grigoroudis, Tsitsiridi & Zopounidis (2013), Homburg & Stock (2004), and
Kamakura, Mittal, De Rosa & Mazzon (2002) indicate a positive relationship between
the constructs. Heskett, et al. (1994; 2008) hypothesize that satisfied and motivated
employees are productive and leading to increased customer satisfaction; satisfied
5
customers are consequently expected to dispose for more purchase, thus increasing
the loyalty of customers (Odunlami, 2014), revenue and profits of the organisation
(Hassan, 2012; Xu & Goedegebuure, 2005; Gelade & Young, 2005). Bernhardt,
Donthu and Kennett, (2000), Heskett et al. (1997), and Hallowell (1996) reveals in
their studies on the relationship between financial performance and either of
customer or employee dimensions and find a positive relationship. Awan, Hassan, &
Shahid (2014) discover employee‟s motivators as compensation, working
environment, job design, and Performance Management System.
However, in spite of the increasing empirical studies incorporating non-financial
measures and the endeavour in the development of different theories, there are gaps
in the identification of indicators that measure the multiple constructs Austin,(2013).
In addition, the studies on relationships between non-financial and financial
performance measures have revealed mixed results which stimulate for further
studies. Therefore, this thesis is directed towards the assessment of the relationship
of non-financial and financial performance based on broad empirical and theoretical
underpinning for a comprehensive measure of performance of the Commercial
Banks in Ethiopia.
1.4. Research Questions
To address the statement of the problem, the following major and specific research
questions were posed.
1.4.1. General Question
What is the link between the financial and non-financial indicators in the
assessement of a comprehensive measure of performance of the banking industry in
Ethiopia?
1.4.2. Specific Questions
I. What is the association of internal service quality with employee
satisfaction in the commercial banks in Ethiopia?
6
II. What is the relationship of employee satisfaction on customer service-
quality of the commercial banks in Ethiopia?
III. What is the effect of customer service quality on customer satisfaction in
the commercial banks in Ethiopia?
IV. What is the power of customer satisfaction on the profitability of the
commercial banks in Ethiopia?
1.5. Objectives of the Study
1.5.1. General Objective:
The general objective of the study was to identify a comprehensive measure of
performance of the banking industry in Ethiopia by assessing the link between the
financial and non-financial indicators.
1.5.2. Specific Objectives of the Study:
a. To measure the scope of association of internal service quality on employee
satisfaction in the commercial banks in Ethiopia.
b. To evaluate the relationship of employee satisfaction with customer service-
quality of commercial banks in Ethiopia
c. To identify the effect of customer service quality on the satisfaction of
customers of commercial banks in Ethiopia.
d. To find out the power of customer satisfaction on the profitability in the
commercial banks in Ethiopia.
1.6. The Research Hypothesis:
To address the above identified research questions and objectives, the following
research hypothesis were formulated to be tested based on previous studies which
have provided some empirical support and theoretical backing on the relationship of
financial and non-financial performance measurement variables. The variables used
for testing the hypothesis were within the bounds of the service-profit chain (SPC)
and the Balanced Scorecard (BSC) frameworks which are presented as follows.

7
H1. There is a significant relationship between internal service quality dimensions
and employee satisfaction in the commercial banks in Ethiopia.
H2. There is a significant association between internal service quality/employee
satisfaction dimensions and customer service quality in the commercial banks in
Ethiopia.
H3. There is a significant relationship between internal service quality/employee job
satisfaction dimensions and customer satisfaction in the commercial banks in
Ethiopia.
H4. Customer satisfaction in the commercial banks in Ethiopia is significantly
affected by customer service quality.
H5. An enhancement in the satisfaction of customers significantly improves customer
loyalty in the commercial banks in Ethiopia. .
H6. Improvement in customer loyalty significantly improves the financial performance
of the commercial banks in Ethiopia.
1.7. Significance of the Study:
The relationships between non-financial and financial performance measures have
been claimed, but academic studies have shown diverse results. Consequently,
researchers have argued that more studies of these relationships are needed.
Therefore, this study adds value to the literature by empirically linking a more
comprehensive performance measurement in the context of the commercial banking
industry in Ethiopia on based on the relationship of financial and nonfinancial
performance measures. The study can ultimately induce the management of the
banking industry to pay due attention on the motivational, psychological and
behavioural aspects of employees and customers and set policies and strategies
that could meet the eventual goal of their respective banks.
1.8. Scope of the Study
The scope of this research was delimited to the relationship of internal service
quality, employee job satisfaction, service quality, customer satisfaction, customer

8
loyalty and profitability in a specific country and a specific area of study, which is the
commercial banking industry in Ethiopia as well as the banks in Tigrai region.
1.9. The Structure of the Study
.
The next chapter discusses on the theoretical foundation of the study. Chapter three
covers the empirical literature of the study while chapter four deals with the research
methodology. Chapter five involves analysis of the data and summary of the
research findings. Lastly, chapter six covers the overall conclusions that are drawn
from the research study and in relation to the research questions and closes with
recommendations and highlighting an area for a possible further research.
1.10. Summary of the Chapter
The chapter highlighted the performance measurement that blends financial as well
as non-financial indicators. The study was intended to advance comprehensive
business performance measures in the context of the commercial banks in Ethiopia
based on the Service-Profit Chain (SPC) and the Balanced Scorecard (BSC)
frameworks. These models lay emphasis on the effects of non-financial measures
such as employee satisfaction and customer satisfaction on profitability. The
rationale for the study, the research objectives and hypotheses were discussed.
Finally, the chapter concluded with the structure of the study.
.
9
CHAPTER 2
THE THEORETICAL BASIS OF THE STUDY
2.1. Introduction
This chapter discussed regarding the liberalisation of the financial system and the
banking business environment in Ethiopia, the rational for performance
measurement, the definition and characterisation of performance measurement, the
theoretical basis of performance measurement, and the performance measurement
frameworks.
2.2. Liberalization and the Contemporary Banking Business Environment
in Ethiopia
Financial liberalisation has been taken a measure to move from the repressive
regime of monetary and financial controls to a more relaxed financial sector (Beim &
Charles, 2001). It involves a mixture of the relaxation of controls such as elimination
of interest rate controls, lowering of bank reserve, limiting government intervention in
bank lending decisions, enhancing competition through entry of private investors in
the industry, and easing of restrictions on the capital account
Consequent to the policy change from a command to a market economy, the
Ethiopian government took Structural Adjustment and Economic Recovery Program
measures to liberalize the economy since 1994. As part of this broader reform policy
and given the importance of the banking industry in the economy, financial sector
reform policy measures have been undertaken by the government to develop the
sector and permit private domestic investors to engage in the business of banking
and finance. Consequently, the Monetary and Banking Proclamation No. 83/1994
and the Licensing and Supervision of Banking Business No. 84/1994 laid down the
legal basis for private sector investment opportunity in the banking sector. This has
given the opportunity for the emergence of a new era of competitive environment,
the abolition of the monopoly of the public banks (commercial Bank of Ethiopia and

10
Business Bank and Development bank of Ethiopia) and establishment of 16 private
banks (Abay Bank S.C., Addis International Bank, Awash International Bank, Bank
of Abyssinia, Berhan International Bank, Bunna International Bank, Cooperative
Bank of Oromia, Dashen Bank, Debub Global Bank, Enat Bank, Lion International
Bank, Nib International Bank, Oromia International Bank, United Bank, Wegagen
Bank, and Zemen Bank). Therefore, this has obviously created a competitive
atmosphere in the sector (NBE, 2013).
In the comparative study of financial sector liberalisation of four sub-Saharan African
countries conducted by Kiyota, Peitsch & Stern (2007), they concluded that the
Ethiopian economy would benefit from further liberalization of the financial sector
and entry of foreign banks in the business. Alemayehu (2006) also stress the need
for further liberalization, including foreign entry so as to help in technology transfer
and enhance the efficiency of the financial sector in general and the banking sector
in particular. However, Alemayehu stands for the strategy of gradualism alike with
the government policy and argues that the overall reform direction is encouraging
given the emerging development of the financial sector in the country, the
competitive capacity of the existing financial institutions in the global environment,
and the prevailing supervisory and regulatory capacities in the country to deal with
the complexities in the financial dynamics.
The National Bank of Ethiopia, as a regulator of the financial system, is entrusted by
law to monitor the financial health of the sector and build the trust of customers and
the public at large. The NBE uses CAMEL method, which is based on accounting or
financial reports to evaluate the degree of riskiness‟ of the banks. The CAMEL
framework stands for groups of performance measures such as Capital adequacy,
Asset quality, Management quality, Earning, and Liquidity. However, banks are
increasingly becoming subject to immense pressure from their stakeholders to
improve performance. This is consequently compelling management to reconsider
their traditional strategic management control methods, improve the quality of their
balance sheet items, initiate cost efficiency measures, take actions that improve
internal service quality and focus on customer satisfaction through product/service
quality (Lapavitsas & Santos 2008; Munir, Perera, & Baird, 2011). Consequently,
there is an increasing need to introduce changes to performance measurement

11
systems (PMSs) in order to develop and adopt contemporary and comprehensive
approaches for management controls, new databases and new analytical ways to
carefully assess the costs, benefits and risks (Guerreiro, Alberto & Frezatti 2006;
Munir, et al., 2011). Banks are also being encouraged to adopt internal accounting
tools, such as customer profitability analysis, profit chain management and combined
PMSs (Khiaonarong & Liebena 2009; Munir, et al., 2011).
Therefore, with the ultimate strategic objective of attaining the goal of profitability, a
comprehensive performance measurement approach that includes the non-financial
variables that affect the financial performance becomes a necessity.
2.3. The Rational for Performance Measurement
When you can measure what you are speaking about and express it in numbers, you know something about it.
Otherwise, your knowledge is inadequate; it may be the beginning of knowledge, b ut you have scarcely in
thought advanced to the stage of science (Lord Kelvin, 1824-1907).
A firm is just like a complex organism that seeks to survive in its competitive
environment. Once a firm becomes large enough and goes beyond the oversight of a
single manager, then emerges the need for use of performance measurement and
control systems as a tool of a manager.
Performance measurement system serves a firm as a key factor in alignment to
strategies, goals and objectives (Teeratansirikool, Siengthai, Badir, & Charoenngam,
2013). Performance measurement frameworks are designed in response to the ever-
changing business environment within which a firm operates. Yet performance
measurement systems must be effective so as to be able to accurately reflect a
business situation and gear employees towards the right directions that help achieve
organisational objectives. Neely (1999) argues the need for measures of
performance as emerging due to: the changing nature of work; the increasing
competitive business environment; the development of innovative initiates; national
and international quality requirements; changing organisational roles; changing
external demands; and the development of information technology.
12
Ifeoma and Ijeoma (2012) identify the reasons for organisations to use performance
measurement systems as to:
1) Monitor and control,
2) Drive improvement,
3) Improve the effectiveness,
4) Align goals with objectives and strategies, and
5) Reward and discipline.
Kellen (2003), views business performance measurement as a tool to balance within
the firm for:
a) Profit, growth and control;
b) Comparison of short term results with future capabilities and growth
opportunities;
c) Comparison of actual performance with planned performance;
d) Opportunities and attention; and
e) Motives of human behaviour.
2.4. The Definition and Design of Performance Measurement
The significance of performance measurement has long been recognized by
researchers and practitioners of various disciplinary backgrounds (Neely, Gregory, &
Platts, 2005). As a management control tool, performance measurement is
concerned with data collection, setting procedures related to the formation of a firm‟s
core competency and supporting managers to put strategy into operation (Theriou,
Loukas, Maditinos, & Theriou, 2007). But, what is performance measurement?, and
how is performance measured?
The literature on performance measurement identifies different definitions for
performance dimension and these differences have facilitated to the development of
a large number performance measure. Besides, the literature indicates some of the
difficulties in the selection of performance measures that are appropriate for
academics and practitioners. DeBusk, Brown, & Killough, (2003) state that the mix

13
and number of performance measurements used differ from one organization to
another due to the differences in the strategies adopted by different organisations.
Neely, et al. (2005) define a performance measurement system as a concise set of
financial and/or non-financial metrics that supports management in their course of
decision-making processes of an organisation by gathering, processing and
analysing quantified data about its performance and presenting it in the form of a
concise summary.
Performance measures can also be defined as the course of measuring the
efficiency and effectiveness of accomplishment quantitatively (Neely, et al., 2005,
Lisiecka & Czyż-Gwiazda, 2013). They referred effectiveness as the extent to which
customer expectations are met and efficiency as a measure of how economically the
firm‟s resources are utilized to customers‟ level of satisfaction. Gimbert, Bisbe and
Mendoza, (2010) suggest performance measurement as the use of multi-
dimensional and causal-oriented set of performance measures.
Franco-Santos, Kennerley, Micheli, Martinz, Mason, Marr, Gray, & Neely (2007),
based on the Social Science Citation Index; Scopus and Google Scholar databases,
make citation analysis of the approaches of Atkinson (1998), Atkinson, Waterhouse
& Wells (1997), Bititci, Carrie & Mcdevitt (1997), Bourne, Neely, Mills & Platts,
(2003), Forza & Salvador (2000), Gates, (1999), Ittner, Larcker & Randall, (2003),
Kaplan & Norton, (1984), Kerssens-van Drongelen & Fisscher (2003), Lebas, (1995),
Lynch & Cross, (1991 ), Maisel (2001), McGee, (1992), Neely, Gregory & Plat,
(2005), Rogers (1990), and Otley (1999) in order to identify the key characteristics
that researchers might include as necessary and sufficient conditions when defining
performance measurement systems.
On the basis of the definitions given by various scholars cited by above, the basics of
performance measurement system are features, roles, and processes (Franco-
Santos et al. 2007). Features of a performance measurement system are properties
which make up the performance measurement system. Roles are the functions that
are performed by the performance measurement system, and processes are the

14
series actions that combine together to constitute the performance measurement
systems.
From the perspective of the content analysis of Franco-Santos et al. (2007),
performance metrics considered provision of improved information system, properly
designed data capturing system, and using relevant data as the necessary condition
of the measurement process. They also classified performance measures as
objective or subjective; financial or non-financial; leading or lagging, complete or
incomplete, responsive or non-responsive; critical or key performance indicators;
tangible or intangible; etc.
2.5. Theoretical Foundation of the Research
Business performance measurement is a dynamic research agenda of academics
and practitioners. In spite of the growing need in the drivers of sustainable
performance measures in the operational domain, there is a growing concern over
the robustness of the theoretical foundations of measuring and managing
performance within the academic community. According to Franco-Santos et al.,
(2012), while there is abundant research within specific disciplines, such as
management accounting, production and operations management, strategic
management, human resource management, marketing and organisational
behaviour, a unified theory for performance measurement and management has
failed to emerge. This is due to the multidisciplinary nature of the field.
The purpose of this sub-topic is, thus, to assemble the contributions that
conceptualise the theoretical basis of performance measurement from, among the
others the the strategic, motivational, behavioural and accounting perspectives.
2.5.1. The Strategic Management Theory
The link among workers‟ satisfaction, product/service quality, customer pleasure,
customer loyalty and profitability has long been considered as strategic and
comprehensive interest in managerial decisions. The literature on service quality

15
suggests a link between employee satisfaction and customer satisfaction (Sageer,
Rafat, & Agarwal, 2012, Hong, Liao, Hu, & Jiang, 2013; Hur, Moon, & Jung, 2015).
The relationship between employee satisfaction and service quality will be stronger
in business undertakings based on the activity of individual employees who serve
customers directly. In other words, the relationship between employee satisfaction
and service quality will be stronger in service firms than manufacturing firms. In
service organizations, employee satisfaction, customer satisfaction and service
quality are the triple components that need to be addressed to achieve the objective
of profitability.
Strategic management is an approach of specifying an organisation‟s objectives,
strategic policies and plans to achieve and attain the goals (Grant, 2016). It is a
combination of strategy formulation, implementation, and evaluation. Within in the
strategic management theory, the profit-maximizing and competition-based, the
resource-based, the human resource based, the survival based, and the contingency
theories are discussed as follows.
2.5.1.1 The Profit-Maximizing and Competition-Based Theory
This theory is based on the maximisation of long term profitability of a business
organization through building sustainable competitive advantage over competitor in
the external business environment. The theory stems from the industrial-organization
(I/O) perspective which views excellence in the external competitive environment as
a classic for assessing competition within an industry (Raduan, Jegak, Haslinda, &
Alimin, 2009).
The external environment in the context of this study is considered in terms of
regulation, technological environment, and economic conditions. In this regard, all
banks do not use internally developed technological input, but adopt externally
acquired technologies which all have equal opportunities and capacities. The
regulatory regime correspondingly applies its policies and monitoring systems on all
banks. The sampled banks operate in the same region with similar economic
environment. Therefore, the regulatory, technological and economic factors are
assumed to be the same for all and will not have an impact on differences in financial

16
performance. However, the market and the customers are the core determinant
factors from the perspective of external environment where banks have to compete
for and maintain competitive excellence. Therefore, customer behaviour is taken as
component factor in the development of the measure of performance.
On the other hand, the resource-based theory which is discussed below views
internal resources and capabilities have the potential to generate competitive
advantage and eventually superior firm performance (Raduan, et al., 2009).
2.5.1.2 The Resource-Based Theory of Competitive Advantage of the Firm
The primary stage in strategy formulation is to define a firm‟s identity and purpose
which takes the form of a mission statement. This involves broadly articulating what
the business is, who the customers are, and which of their needs is intended to be
addressed. But in situations where customer demand is ever changing, the RBV
considers an internally focussed strategy as much more stable in defining the identity
and formulating the strategy of a firm.
Strategy
Competitive Advantage
Capabilities
rm
Resource
Source: Grant (2002)
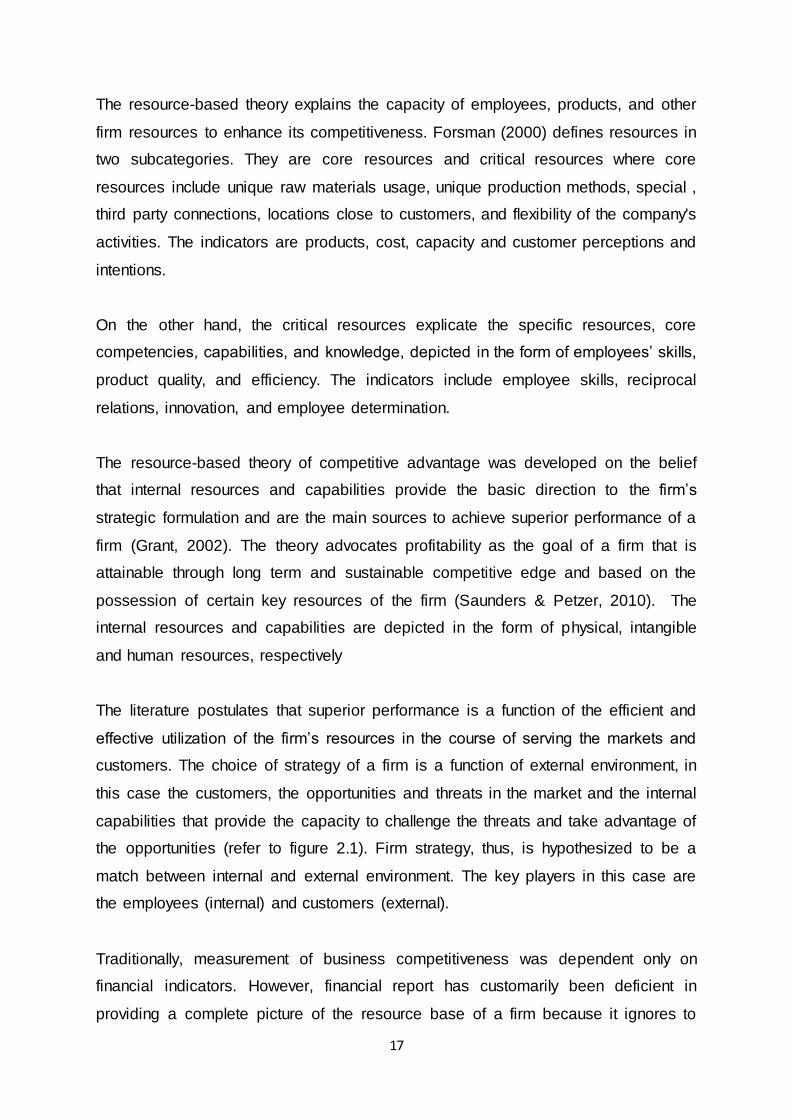
Figure 2. 1: A framework for analysing resources and capabilities
4. Select a strategy which best exploits the
f irm‟s resources and capabilities relative
to opportunities.
5. Identif y resource gaps
which need to be f illed, Inv est
in replenishing.
Augmenting and upgrading the
f irm‟s resource base.
3. Appraise the rent-generating
potential of resources and
capabilities in terms of :
A. their potential f or sustainable
competitiv e adv antage, and
B. the appropriability of their
returns 2. Identif y the f irm‟s capabilities:
What can the f irm do more
ef f ectively than its riv als? Identify
the resources inputs to each
capability , and the complexity of
eachcapability .
1. Identif y and classify the f irm‟s
resources. Appraise strengths
and weaknesses relativ e to competitors. Identif y opportunities
f or better utilization of resources
17
The resource-based theory explains the capacity of employees, products, and other
firm resources to enhance its competitiveness. Forsman (2000) defines resources in
two subcategories. They are core resources and critical resources where core
resources include unique raw materials usage, unique production methods, special ,
third party connections, locations close to customers, and flexibility of the company's
activities. The indicators are products, cost, capacity and customer perceptions and
intentions.
On the other hand, the critical resources explicate the specific resources, core
competencies, capabilities, and knowledge, depicted in the form of employees‟ skills,
product quality, and efficiency. The indicators include employee skills, reciprocal
relations, innovation, and employee determination.
The resource-based theory of competitive advantage was developed on the belief
that internal resources and capabilities provide the basic direction to the firm‟s
strategic formulation and are the main sources to achieve superior performance of a
firm (Grant, 2002). The theory advocates profitability as the goal of a firm that is
attainable through long term and sustainable competitive edge and based on the
possession of certain key resources of the firm (Saunders & Petzer, 2010). The
internal resources and capabilities are depicted in the form of physical, intangible
and human resources, respectively
The literature postulates that superior performance is a function of the efficient and
effective utilization of the firm‟s resources in the course of serving the markets and
customers. The choice of strategy of a firm is a function of external environment, in
this case the customers, the opportunities and threats in the market and the internal
capabilities that provide the capacity to challenge the threats and take advantage of
the opportunities (refer to figure 2.1). Firm strategy, thus, is hypothesized to be a
match between internal and external environment. The key players in this case are
the employees (internal) and customers (external).
Traditionally, measurement of business competitiveness was dependent only on
financial indicators. However, financial report has customarily been deficient in
providing a complete picture of the resource base of a firm because it ignores to

18
incorporate the intangible assets (human knowledge and skill, reputation) which are
the most strategically important resources of a firm. The resource base theory does
not undermine the prominence financial indicators, but includes operational
indicators in the performance measurement. Financial performance measures
provide accounting based measures of profitability while operational performance
measures are based on nonfinancial performance indicators (Pun & White, 2005).
Thus, the resource-based view classifies performance measurement into subjective
(nonfinancial, leading, incomplete, non-responsive, output, non-critical, intangible)
and objective (financial, lagging, complete, responsive, inputs, critical, tangible)
measures.
Therefore, in line with the objectives of the study and drawing from the discussions
on resource based theory, the internal resources and capabilities are basic
contributory elements to validate the visualised comprehensive performance of the
commercial banks in Ethiopia
Kotler & Armstrong (2012) state that customer satisfaction will be obtained if the
performance of the firm offering meets its customer expectations; on the contrary
customers will be disappointed when the performance is lower than customers‟
expectation. Kuusik (2007) argues that customer loyalty is a function of the share in
total purchases. The indicators are purchasing frequency, purchasing behaviour,
effort to obtain information and alternative evaluation. (Tseng, Lan, Wang, Chiu, &
Cheng, 2011).
2.5.1.3 The Survival- Based Theory
The survival-based theory was originally developed by Herbert Spencer (Herbert.
1946; Miesing & Preble, 1985). Herbert Spencer blended Darwin‟s theory of
evolution and natural selection with Adam Smith‟s invisible hands to come up with
the idea of Social Darwinism. This theory assumes the laws of biological systems
can be applied in a competitive environment where inefficient competitors are
marginalized in the market in the best interest of the public. Social Darwinism
assumed normal for competition to behave in decadent ways to produce the fittest
19
business, which survives, prospers, and becomes the most efficient economic unit
by successfully adapting to its environment.
However, opponents of Social Darwinism called Neo-Darwinism emerged and
assumed that competition and cooperation are interconnected and competition will
force business to be more cooperative. Hence, qualities and values of doing good
and ethical business were encouraged in order to survive in the competitive market
(Klein, 2003, Mohammad & Abdullah, 2010). Healthy competition is desirable for the
development of the financial system. In the course of competition, there are areas
where banks could exchange information for mutual advantage for example. In this
regard, the N.B.E., as regulator of the financial system, facilitates the ground for
competitive environment, but also monitors the incidence of unhealthy competition.
The survival-based view in strategic management emphasized on the assumptions
that in order to survive, organizations have to adapt strategies that should be
focused on running a very efficient operation and respond rapidly to the changing
competitive environment (Mohammad & Abdullah, 2010). In other words, the
survival-based theory centres on the concept that organization needs to continuously
adapt to its competitive environment in order to survive.
2.5.1.4 The Contingency Theory
The contingency theory overhauled the whole idea of the classical management
theory which stated that there is always one best way of doing things. Contingency
theory is one of the theories which helped to analyse in what way performance
measurement system (PMS) fits in the organization's environment (Gimzauskiene &
Kloviene, 2008, 2009). Thus, the basic paradigm of contingency theory is that an
organization seeks effectiveness and efficiency by fitting the qualities of the
organization with the contingencies that indicate its situations (Donaldson, 2001).
Contingency theory suggests that there is no one size fits all system (example
management accounting system) to manage or control people in every situation
(Gimžauskienė & Klovienė, 2009) but is dictated on the strategies and objectives set
by the organization after careful analysis of internal and external environment
(Thompson, Strickland & Gamble, 2005). Thus, to understand the factors that

20
influence the choice of performance measures, it is necessary to understand the
relationship between organizational strategy and the environment in which the firm
operates. Further, the theory considers the internal and external environment as
important contingency variables and source of competitive advantage for a firm when
aligned with its strategy (Athanasoglou et al., 2008, Fatih, 2012, Ahokpossi, 2013).
The relevance of the contingency theory in the accounting literature was recognised
in the mid-1970s. Thus, the structural contingency theory was developed based on
the premises that survival, effectiveness and high performance are related to the
fitness of contingencies such as organizational size (Child, 1975), technological level
(Gerwin, 1993), strategy (Chandler, 1962), and environment (Hambrick, 1981). A
firm‟s accounting system is an important component of organisational structure and
the particular features of this system are affected by the contingencies that a firm
encounters. Consequently, changes in circumstances (contingencies) require an
adjustment to the structure so as to improve the fit condition and lead to higher
performance.
Change is an inevitable development and to be compatible with the emerging
changes, management is expected to identify areas where the firm‟s strategy is
successful and where it needs for improvement. The areas that demand
improvement undoubtedly require a change, among others in the human resource
capability, the service quality, performance measurement system that track non-
financial measures, and set of new competitive strategies (Kaplan & Norton, 1992).
Drucker, (2000) states the contemporary test of management is becoming to be a
change leader. Drucker realised that management has to envisage change as an
opportunity rather than a challenge. Besides, there is a need to understand how
make change effective both inside and outside the organization. Further, Drucker
notes that an organization needs to make its workforce see change as a means of
motivation to develop new products, services, and processes in response to the
needs for change. Kotter (1995) also developed an eight-step process for
implementation of change including:
a. Assessment of environmental realities and Identifying challenges and
opportunities,

21
b. Forming a group inspired to work as a team with sufficient power to lead the
change.
c. Creating a vision and developing strategies to help meet the change and the
vision,
d. Selling the change vision internally,
e. Empowering employees to act on the vision.
f. Planning for visible performance measurements along with incentives for
employees involved in the improvements, and
g. Taking measures to improve systems, policies, and structures that could
align with the emerging changes; and hire, promote, and train employees to
achieve the desired vision for change.
Kaplan & Norton (1992) noted that the steps stated above can be applied both to the
implementation of the Balanced Scorecard and the changes identified by the
Balanced Scorecard during its implementation.
However, from the perspective of the critics of the structural contingency theory,
such as Child (1972), it was not necessarily structure that follows a change in
contingencies, but changes in structure could also lead to changes in contingencies).
But, in an attempt to challenge the critics of this theory, Donaldson (2001) develops
what he called the Neo-contingency theory or the Theory of Performance-Driven
Change.
Generally, contingency theory accepts the need for the employment of non-financial
controls in supplement to financial controls. Since the purpose of this study is to
validate a comprehensive measure of performance based on a diverse set of
financial and non-financial measures of performance, the contingency theory is
among the theories where the study is constructed
Open-Book Management:
Open-Book Management began to be widely used as management concept and
developed by Case (1995). The concept of the open-book management stems from
the belief that employee satisfaction and retention would be built through increasing
22
employee engagement, motivation and innovation; entrusting employees with vital
information about the organization‟s financial and operational health, and considering
workers as valued partners and stakeholders in their organizations.
In other words, the basis of open-book management rests in considering employees
as core stakeholders. Thus, the information conveyed to the employees need not
only be limited on tactical operations that could help them do their jobs effectively,
but also in strategic aspects so as to help them understand how the company sets its
goals leading to improved profitability and enhanced team work. This is expected to
further lead to increased job satisfaction, reduced turnover and improved profitability.
These basic fundamentals of open communication and the engagement of
employees through incentive-based pay are values that are shared by BSC and SPC
models. Beyond this, both models integrate the four-perspective postulating a cause
and effect relationships of the perspectives. Heskett et al (1994) were in congruence
with Kaplan‟s BSC model except that additional, uncontrollable factors are
considered in developing the service- profit chain (SPC) model.
Customer Value Discipline:
The „Customer Value-Discipline‟ as a model was initiated by Treacy & Wiersema
(1993) based on Porter‟s strategic ideals of „Cost leadership, Segmentation and
Differentiation‟. However, they make a difference in that Tracey and Wiersema
focused on customer value accounting for the difference between the total benefits
and total cost of the customers.
The model proposes three different value disciplines (Cardoso, Viaene, & Costa,
2009) including:
a. Operational excellence – that involves the provision of reliable products or
services at competitive prices and with minimum inconvenience for delivery.
b. Product leadership – that involves the provision of unique products/ services
that consistently enhances the customer‟s repeated use of the
product/service, and

23
c. Customer intimacy – that focus on being flexible to meet the requirements of
customers.
The SPC and the BSC models have drawn from the value discipline concepts
presented by Treacy et al. (1993).
2.5.2. Management Theory
Management theory offers the conceptual framework for guiding organisations
towards achieving their objectives. Management theory is dynamic in that it is
responsive and adaptive to the environmental needs and operational requirements of
organisations. Consequently, different approaches of management theories have
evolved over time which among them include the classical approach and the human
resource approach. The objective of this research is to assess the relevant literature
and based on empirical evidences identify a comprehensive performance model for
the banks in Ethiopia. Therefore, pertinent management theories are discussed as a
general background theoretical basis.
2.5.2.1 The Classical Management Theory
The classical school of management thought emphasizes on organizational design,
workers training for efficiency, chains of command, division of labour, planning of
work, the technical requirements of the organisation, and the principles of
management. The classical theory is basically categorised into scientific
management and administrative management (Cole, 2004).
Scientific management involves the application of scientific methods to increase
individual workers‟ productivity. The development of scientific management is
attributed mainly to Taylor, Gantt and Frank and Lillian Gilbreth. Frederic Taylor
(1856-1915), considered as the pioneer of scientific management, introduced the
need for careful selection of workers, training the worker, equal division of work
between management and workers, and breaking the work scientifically into tasks
and jobs as the basic elements that could help increase productivity. Taylor
24
introduced the concept of time and motion study targeted to develop work standards
to measure efficiency (Taylor, 1991).
Administrative management was concerned with the use of management principles
in the organising and managing of an organization. Fayol (1841-1925) is attributed to
his initial attempt to describe the broad principles of management. Fayol (1916/1999)
in his work, Administration industrielle et générale, advanced the fourteen principles
of management involving, among others, initiative, equity, remuneration of personnel
and stability and tenure of employees. Drucker‟s Management by Objectives and
Fayol‟s planning, organising, leading and controlling functions of management were
the basis in influencing the balanced performance of Kaplan and Norton (1992) in his
introduction of the concept of the balanced scorecard.
2.5.2.2. The Motivational and Human Resource Behaviour Based Theories
The human behaviour school of thought believes that work is accomplished though
people and lays emphasis on the interactions of individuals, their motivations, and
their influence on organizational performance. Elton Mayo‟s Hawthorne studies
(1924-1932; 1960), McGregor‟s Theory X and Theory Y (1960), and Maslow‟s (1962;
2013) hierarchy of the human needs theory are considered as the major theoretical
nitty-gritties to the development of the motivation and human resource behaviour
theories. Elton‟s Hawthorn effect was the first psychological research that laid
emphasis on the importance of human interaction and drive for productivity. The
theories such as strategic management theory, generally place emphasis on the
psychological needs of the human nature.
A. Douglas McGregor, Theory X and Y:
Douglas McGregor (1960) introduces a philosophical attitude with his Theory X and
Theory Y. He classifies the hierarchy of needs into lower-order needs (Theory X) and
higher-order needs (Theory Y) and proposed to use either set of needs to motivate
employees in their jobs.

25
Theory X is based on the assumption that people have an inherent dislike for work
and avoid it whenever possible. They have little ambition and have no desire to be
responsible and accountable; but seek security above all Therefore, the theory
proposes that people need to be forced, controlled, directed, punished where
necessary to achieve the organizational objectives;. Then, this theory assumes that
the role of management is to coerce and control employees.
On the other hand, Theory Y is based on the ground that people have the innovative
potential; and can assume responsibility if they are committed to the objectives. The
theory emphasizes that people need to be rewarded for their achievements; learn to
accept and seek responsibility; and have the ability to solve an organizational
problem. Therefore, the role of management is believed to develop the creative
intellectual capabilities in employees and inspire them to release that potential
towards common goals.
McGregor was very much inclined towards the more humanistic Theory Y
assumptions. Further, Theory Y served as a basis for the development of the
presumptions of multiple performance measures.
B. The Theories of Motivation:
Following the Hawthorne Study results, many theories of motivation have been
developed to study the factors that instigate employees to improve performance and
satisfaction in their jobs. In spite of the complexities and difficulties of determining
the behaviour of people, these theories have served in providing a framework to
address the problem of how best to influence the behaviour and performance of
employees.
The pioneering scholars of motivation such as Maslow (1962), Vroom (1964), and
Herzberg et al. (1957; 1959) have served as a foundation for many of the
contemporary and subsequent studies. These classic theories have helped
specifically in the advancement of investigations on employee job satisfaction and in
the construct of a new lens for academic study. Researchers on behavioural studies

26
have divided the theories of motivation mainly into two major schools: the content
theories of motivation and the process theories of motivation (Mullins, 2010).
1. The Content or Intrinsic Theories
Content or intrinsic theories of motivation to focus on factors internal to the individual
that invigorate and direct behaviour. These theories regard motivation as internally
driven stimuli that compel an individual to act or move toward the satisfaction of
individual needs. The content theories of motivation are largely based on early
theories of motivation. Major content theories of motivation include Maslow‟s
Hierarchy of Needs Theory (1962), Herzberg.‟s Motivator-Hygiene Theory (1957;
1959), and Aldefer‟s Existence-Relatedness-Growth (ERG) Theory (1969). These
classic theories are discussed as follows.
a) Maslow’s Hierarchy of Needs Theory:
Abraham Maslow (1962; 2013) developed the Hierarchy of Needs demonstrated in
the form of a pyramid with the most fundamental needs at the bottom and the need
for self-actualization at the top of the pyramid
.
Source: Adapted from Maslow, A. 2013. „A Theory of Motivation’..
Figure 2. 2: Maslow’s hierarchy of needs
Self actualisation
Esteem
Love
Safety
Physiological
27
The hierarchy includes the basic physiological needs (food, shelter, clothing and
other basic material want); safety needs (the need for security from physical and
mental obliteration); social or psychological needs (the need for affection, concern,
belongingness and friendship with others); self-esteem (recognition); and self-
actualization need (to have those rights which a person deserves). Maslow suggests
the hierarchy is not necessarily a fixed order and asserts that a satisfied need is no
longer a motivator but stimulate for advancing need.
Applications of the hierarchy of needs to management and the workplace are clear in
that individuals must have their lower level needs satisfied, for example, safe
working environment, adequate pay to maintain basic needs, and job security before
they will be motivated by increased job responsibilities, status, and challenging work
assignments. Yet, in spite of the ease of application of the theory to a work setting,
this theory has not been supported by empirical studies.
b) Alderfer's ERG Theory
Alderfer's ERG Theory (1969) condensed Maslow‟s five human needs into three and
divulged that man is motivated by the core need for Existence(the need for basic
needs, like physiological and safety needs), psychological and self-esteem (the need
for love, relationship with others, social status and recognition), and Growth(the need
for personal development, including creative and meaningful work). The theory is
traced from its outgrowth of Maslow‟s Hierarchy of Needs in an effort to further
understand and expand its implications.
Alderfer's ERG Theory has been considered a construct applicable to the study of
human motivation in the workplace and a tool to understand what constitutes job
satisfaction, identify incentives and improve performance in the workplace
(Ivancevich, Konopaske, & Matteson, 2007). This theory was also regarded as a
more valid version of the need hierarchy (Robbins, 1998) and has elicited more
support from contemporary researchers on motivation in the work situation. In this
respect, Arnolds & Boshoff (2002) investigated the causal relationships between
need satisfaction and employee job satisfaction. Their study showed the linkage of
respect gained from the status gained in the community and working in the

28
organisation exerts a significant influence on the job performance and satisfaction of
employees. They concluded their study suggesting to management to devise
strategies to address the motivational needs of the front line employees in order to
improve their job performance and build the reputation from the customers.
c) Herzberg’s Two Factor Theory:
Motivation is seen as an inner force that drives individuals to attain personal and
organizational goals. Herzberg, Mausner, Peterson, and Capwell (1957; 1959)
categorized motivation into two separate but complementary sets of factors called
motivators and hygiene.
Motivators (satisfiers) are the dimensions of the job that are capable of inspiring
people to perform and provide people with satisfaction while Hygiene factors
(dissatisfiers) are features incapable of providing motivation or job satisfaction but
which can minimize dissatisfaction. Motivators lead to intrinsic satisfaction of
employees on their jobs and include the work-itself (the nature of the job),
achievement (achievement in the work), recognition, advancement and growth
(promotion opportunities as well as chances for personal growth and recognition).
Hygiene factors or extrinsic factors denote to issues such as one‟s working position,
interpersonal relationships, salary, status, job security, supervision, company
policies, work conditions or work environment and personal life (Herzberg et al.,
1959). Hackman & Oldham (1975, 2010) also identify work environment dimensions
(skill variety, task identity, task significance, autonomy, working conditions,
interpersonal matters, organizational policies and so on) to be associated
significantly with job satisfaction and workers‟ motivation.
2. The Process Theories or Extrinsic Theories:
The process or cognitive theories of motivation attempt to focus on the relationship
between effort and performance. These are value theories of motivation that attempt
to describe the level of effort people perceive they put into work for the rewards they
receive. Adam‟s Equity theory (1963, 1965), Vroom‟s Expectancy Theory (1964),
29
and Lock‟s Goal Theory (1968) are value theories that attempt to identify the
variables that influence employee job satisfaction
1) Social Exchange and Equity Theory:
Social Exchange Theory focuses on a relationship that is demonstrated in terms of
maximising benefits and minimising costs. It is based on mutual exchange of
rewards between partners like employer and employee and the costs of being in the
relationship which may take in the form of time and effort among others. Blau, 1964;
Thibaut & Kelley (1959) believed people will look to see how rewarding a relationship
is and then how much it costs to be in the relationship. If there is a profit (rewards –
costs = profit), then people may inspire to continue the relationship, whereas a loss
may motivate them to end the relationship. A relationship is maintained if profit is
perceived in both the interacting partners.
Social exchange theory may be put in force to validate for the relationships between
organizational policies, worker‟s delight, and customer satisfaction. Within the
context of social exchange theory, the organization is devoted to building a
relationship of long-term employment with the personnel through the provision of an
affluent working environment, opportunities for development, management support
and so forth. In reciprocity, the personnel are predicted to commit to their
organization. The temperament to build a long term relationship between the
employer and employees is one of the key features of a social exchange theory.
The social exchange theory posits that employees who perceive that operating
conditions are better will feel more satisfied with their job and in return be loyal to
their organization. Furthermore, loyal employees are more service oriented and
willing to supply a higher degree of quality services that meet the necessities of the
customers. Social exchange theory also draws the expectancy of the presence of
relationships among employee satisfaction, perceived service quality, customer
satisfaction loyalty, and profitability. Within the perspective of social exchange, the
customer would be more loyal to the organization when the latter is committed to
develop a protracted-time period of relationship with the former by offering services
of a high level of quality to meet the customer‟s desires. The willingness of the

30
organization for maintaining a long-standing relationship with the customer is
confirmed by means of the management‟s efforts to provide superb services to the
customer and keep the employees happy and satisfied. Loyalty of customers is
manifested through the intention and actual repeat purchase. This is ultimately
anticipated to increase the firm‟s profits.
On the basis of social exchange theory, it is probable that customers who perceive a
higher level of quality within the services they received are likely to be more satisfied
with the services. Besides, customers who perceive employees‟ satisfaction are
expected to feel more satisfied. Furthermore, satisfied customers have the tendency
to be loyal to the service provider. Loyalty is highly probable to be demonstrated in
increased volume of sales through repeat purchases in addition to recommending
the service provider to another customer and ultimately increase profitability
(Heskett, et al. 1997).
Equity theory was developed by John Stacy Adams in 1963. The theory posits that
motivation, attitudes and behaviours can be affected through an individual's
perception of fair treatment in social exchanges. In other words, Equity theory is
associated with social exchange theory and they both emphasize the reciprocal
nature of workplace relationship (Adams, 1965).
Equity Theory perceives individuals as motivated to achieve fairness in relationships
and to feel dissatisfied with inequity (unfairness). According to equity theory,
perceived inequity comes from social comparisons (Redmond, 2010). The fact that
Equity Theory deals with social relationships and fairness/unfairness is also known
as The Social Comparisons Theory or Inequity Theory (Jost & Kay, 2010). The
concept of equity theory focuses on the notion of equal pay for equal contribution in
the work and put an effort to minimize any sense of emerging unfairness. Thus the
theory has a range of implications on employee motivation, performance, and
turnover.
Equity theory can be applied in almost any exchange situations. It is based on a ratio
of inputs to outcomes. Inputs include the value and magnitude of the employee‟s
31
contributions to his or her work where as outcomes are the contributions that an
individual acquires for his or her inputs. Inputs can include time, abilities, skill, effort,
performance, loyalty, hard Work, commitment, tolerance, trust in superiors, support
from co-workers and other attributes. On the other hand outcomes include pay,
benefits, job security, esteem, recognition, reputation, responsibility, sense of
achievement, praise, and other intrinsic rewards. Individuals calculate the ratio of
their respective subjective value of inputs to outcomes and then compare it to others‟
ratios in order to determine if it is equitable (Adams, 1964, Swinton, 2006).
Equity Theory suggests that it is not just one person's input to outcome ratio, but it is
when the ratio of one‟s input to outcomes is compared with others' input/outcome
(Baxamusa, 2012). Adams hypothesizes that employees demand fairness in
matching efforts and the results gained in comparison to fellow colleagues. In other
words, the theory implies that employees are inspired by a desire to be treated
equitably with their companions at work and when they perceive getting judicious
incentives and remuneration in proportion to their effort (Baxamusa, 2012).
Relationships where individuals put in more than they receive are inequitable,
leading to dissatisfaction and possible engagement in disruptive behaviours, Adams,
1964; Swinton, 2006) including among others in decreased productivity, theft,
increased breaks, or absenteeism. Although management can do a lot to prevent
perceptions of inequity, the assessment of inputs and outcomes will remain based on
an individual‟s subjective perception (Adams, 1963). Thus, there needs to be a
balance between the inputs and outputs received.
2) Expectancy Theory:
This theory was promoted by Victor (1964) with the new concepts of Valence,
Instrumentality and Expectancy. The theory combines the work itself, the resources
available to perform the work, and the reward system considered to motivate the
work force. Therefore, the degree of motivation is directly related to the expectation
of receiving a reward and the overall perceived attractiveness of the reward. Vroom
(1964) states in his research that personal characteristics and work environment
contributed to job satisfaction.

32
This theory assumes that employee effort leads to performance and performance
leads to rewards. These rewards can be positive or negative. The positive rewards
lead to a more positive employee who is highly motivated. The negative rewards
lead to obviously a less motivated employee.
Spector (1997; 1985) describes job satisfaction as the feeling about the job or an
attitude towards one‟s job which could be measured by the dimensions of: (1) Pay -
amount and fairness or equity of salary; (2) Promotion –the chance and equity for
personal development; (3) Relations with supervision –support and competence
supervisors; (4) Fringe benefits - health, insurance, education, retirement, and other
benefits; (5) Contingent rewards - sense of respect, recognition, and appreciation;
(6) Policies and procedures - implementation of policies, procedures, and rules; (7)
Relations with co-workers - perceived competence and pleasantness of one‟s
colleagues; (8) Nature of work - enjoyment obtained from the work itself; and (9)
Communication – the flow of information within the organization. Ellickson and
Logsdon‟s (2001) reinforced Spector‟s earlier research work suggesting that job
satisfaction was significantly influenced by perceptions of employee satisfaction in
terms of salary, career development, and relationships with supervisors, employees‟
performance evaluation and management systems, and fringe benefits.
The expectancy theory and equity theory represent both a cognitive approach to
motivation. In both cases, it is about dealing with individuals‟ motivation when they
perceive their efforts will lead to the reward they expect. It is about the valence of
rewards - if employees do perceive their efforts will pay off (effort – reward
relationship), they will be more inclined to adjust their behaviour positively.
However, the equity theory goes on to evaluate the outcome-to-input ratio
comparison process and the cognitive and behavioural mechanisms to restore
perceptions of equity (Stecher & Rosse, 2007). It also looks at ways to reduce
inequity by such means as employees changing their inputs to a level that matches
their outcomes and attempting to change their outcome to a level that matches their
inputs. There is evidence that supports the theory's prediction that people respond to
33
inequity by reducing work effort or increase effort to match the outcome (Stecher &
Rosse, 2007).
3) Goal-Setting Theory:
In industrial and organisational psychology, Locke‟s (1968) Goal Setting Theory also
known as Workplace Theory has acknowledged wide acceptance. The theory
postulates that goals lead towards improvement in employee performance and
considered satisfacton as the difference between an employee‟s perception and
expectation in a job (Khan & Mansoor, 2013). Locke (1976) claimed that employees
are satisfied with their jobs when they are positively influenced by the work content,
the work itself, salary, recognition, achievement and a sense of opportunities for
success of the job.
Empirical studies on motivational factors of employees revealed monetary reward as
the most important motivator for employees (Gupta & Shaw, 2014). Khan & Mansoor
(2013); and Fuhrmann (2006) further considered salary, advancement, and
involvement in decision making as the factors that motivate employees in their job.
Danish & Usman (2010) concluded in their research on private sector employees of
Pakistan that rewards and recognition have a positive impact on employee
motivation while Manzoor (2006) revealed empowerment and recognition to have
significant impact on employee motivation and job satisfaction. In the works of
Bosompem, Kwarteng, & Obeng-Mensah (2012), findings indicated that the best
determinant of employee motivation and job satisfaction were recognition and
working conditions. Job satisfaction is considered as vital to any work environment
because of its impact on outcome variables such as work performance and
organizational commitment, absenteeism, inefficiency, negative attitude and
intentions to switch (Ngoc, 2014, Yücel, 2012)
4) Theory of self-regulation:
Bagozzi, Yi, & Phillip (1992) in his theory of self-regulation (TSR) claimed that to
understand intentions, motivational processes have to be included in the models of
attitude-behaviour relationships and suggested that a motivational based variable

34
such as desire be included in attitude theory as an antecedent of intentions. Leone et
al. (1999) conducted a research to ascertain the predictive power of past behaviour
on intention and behaviour and the research results were that past behaviour is a
weaker predictor of intention in the TSR models. The TSR establishes that desire is
a close cause of intentions, whereas attitudes are a distant cause whose influence is
totally mediated by desire. In the TSR Bagozzi et al. (1992) provided some rationale
for the role of desire. The researcher claimed that attitudes are usually conceived as
evaluative appraisals and if evaluations are strong enough, attitudes will lead to
intentions to perform or not to perform the target act. However, evaluative appraisals
do not imply motivational commitment and intentions cannot arise without any
motivational push (desire). Desires are based on urges, while attitudes are based on
reasons and apply to a wide range of behaviours (Davis, 1984). Attitudes can
stimulate desires since both are based on reasons: for instance, one can have a
positive attitude toward exercising because it is healthy and this attitude can lead to
a desire to exercise. Hence a moderate to high association between attitudes and
desires is to be expected, since the former influences intentions through the latter.
Bagozzi et al. (1992) argued that intention implies desire, but that desire does not
necessarily imply intention. The researcher also addressed the processes linking
desires and intentions. Once a desire is present, an outcome-desire appraisal takes
place based on comparisons of the desire and possible end states. Appraisals
related to different end states lead to emotional reactions and coping responses as
intentions. The TSR claims that desire is a necessary antecedent of intention
because attitudes, subjective norms and perceived behavioural control are not able
to capture broad motivational processes (desire-outcome appraisals) that lead to an
intention to perform a behaviour (Bagozzi, et al., 1992). Since Bagozzi et al. 1992)
states that attitudes can stimulate desires and that both constructs are based on
reasons, desire was a strong predictor of intention. The TSR claims that the effects
of desires on intentions are due to the outcome-desire appraisals that lead to
emotional and motivational processes. Services, however, are delivered through
employees, who are at the frontline and form the interface between customers and
firms (Sureshchandar et al., 2001). As such, employee emotional and motivational
processes are critical to efficient service processes (service quality) and outcomes
(customer satisfaction).

35
5) Emotional Contagion Theory:
The emotional contagion theory was advanced by Hatfield, Cacioppo and Rapson
(1994) which explains a situation where one person's emotions are related to the
emotions and behaviours of another. This theory elucidates how the emotions of two
people are conveyed reciprocally via facial expressions or gestures and ultimately
affect the outcome of the interaction. The theory explicates the linkages between
employees‟ internal stimuli (cognitions, emotions, mental states, etc) and the
responses that arise in their work environment in the form of performance,
organizational commitment, and job satisfaction (Wegge, van Dick, Fisher, West &
Dawson, 2006). The theory further proposes that behaviours are explained by
employee mood and emotions, while cognitive-based behaviours are the best
predictors of job satisfaction.
This theory has also been used to explain how the communication of employees
affects customer response leading to a better performance (e.g., Homburg & stock
2004, and Pugh 2001). The emotional contagion theory postulates that the
communication is reciprocal which takes place from employee to customer and from
customer to the employee with the outcome being better performance in terms of
satisfaction or burnout of either party/both leading to dissatisfaction.
2.6. The Performance Measurement Frameworks/Models:
A variety of performance measurement frameworks from a variety of origins have
evolved over time to measure business performance. Lisiecka and Czyż-Gwiazda
(2013) analysed the literature and presented among others the models developed for
a large number of organisations. Some of the models have gone through some
empirical testing while the others have gone through theoretical development.
The BSC and SPC are performance models that link leadership, employees,
customers and financial results. The BSC is a holistic model of organizational
performance that starts with the end in mind. The typical scorecard incorporates four
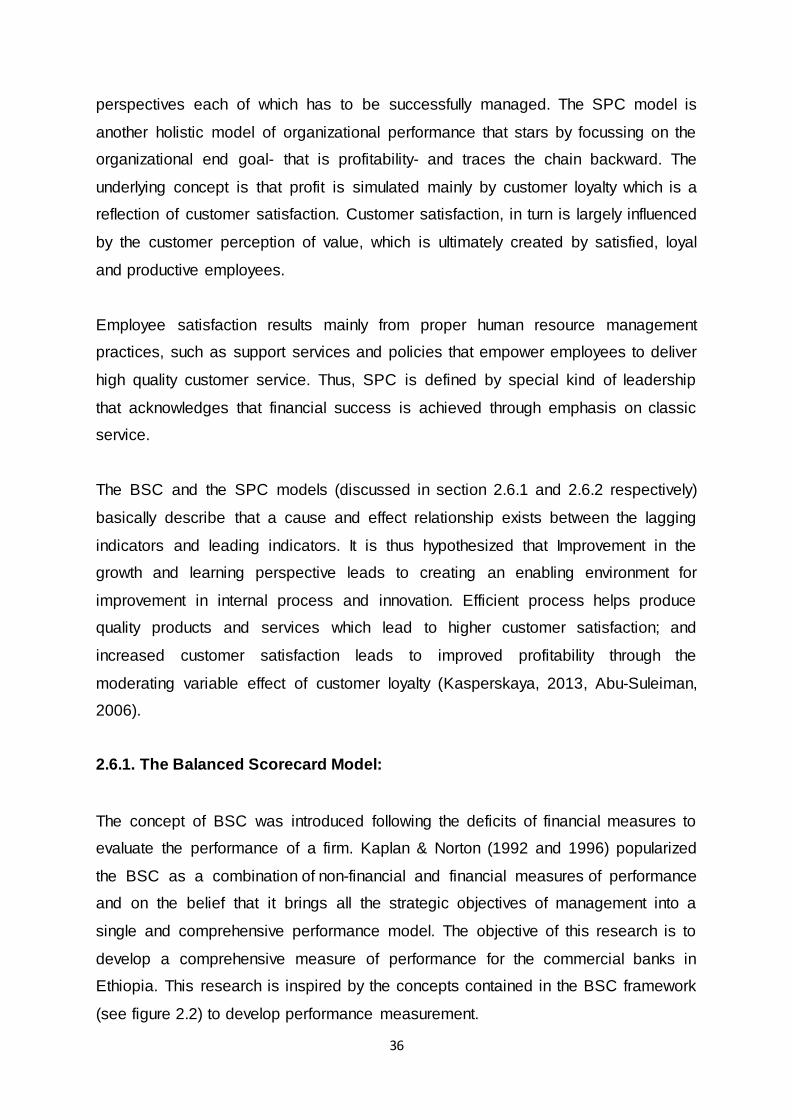
36
perspectives each of which has to be successfully managed. The SPC model is
another holistic model of organizational performance that stars by focussing on the
organizational end goal- that is profitability- and traces the chain backward. The
underlying concept is that profit is simulated mainly by customer loyalty which is a
reflection of customer satisfaction. Customer satisfaction, in turn is largely influenced
by the customer perception of value, which is ultimately created by satisfied, loyal
and productive employees.
Employee satisfaction results mainly from proper human resource management
practices, such as support services and policies that empower employees to deliver
high quality customer service. Thus, SPC is defined by special kind of leadership
that acknowledges that financial success is achieved through emphasis on classic
service.
The BSC and the SPC models (discussed in section 2.6.1 and 2.6.2 respectively)
basically describe that a cause and effect relationship exists between the lagging
indicators and leading indicators. It is thus hypothesized that Improvement in the
growth and learning perspective leads to creating an enabling environment for
improvement in internal process and innovation. Efficient process helps produce
quality products and services which lead to higher customer satisfaction; and
increased customer satisfaction leads to improved profitability through the
moderating variable effect of customer loyalty (Kasperskaya, 2013, Abu-Suleiman,
2006).
2.6.1. The Balanced Scorecard Model:
The concept of BSC was introduced following the deficits of financial measures to
evaluate the performance of a firm. Kaplan & Norton (1992 and 1996) popularized
the BSC as a combination of non-financial and financial measures of performance
and on the belief that it brings all the strategic objectives of management into a
single and comprehensive performance model. The objective of this research is to
develop a comprehensive measure of performance for the commercial banks in
Ethiopia. This research is inspired by the concepts contained in the BSC framework
(see figure 2.2) to develop performance measurement.
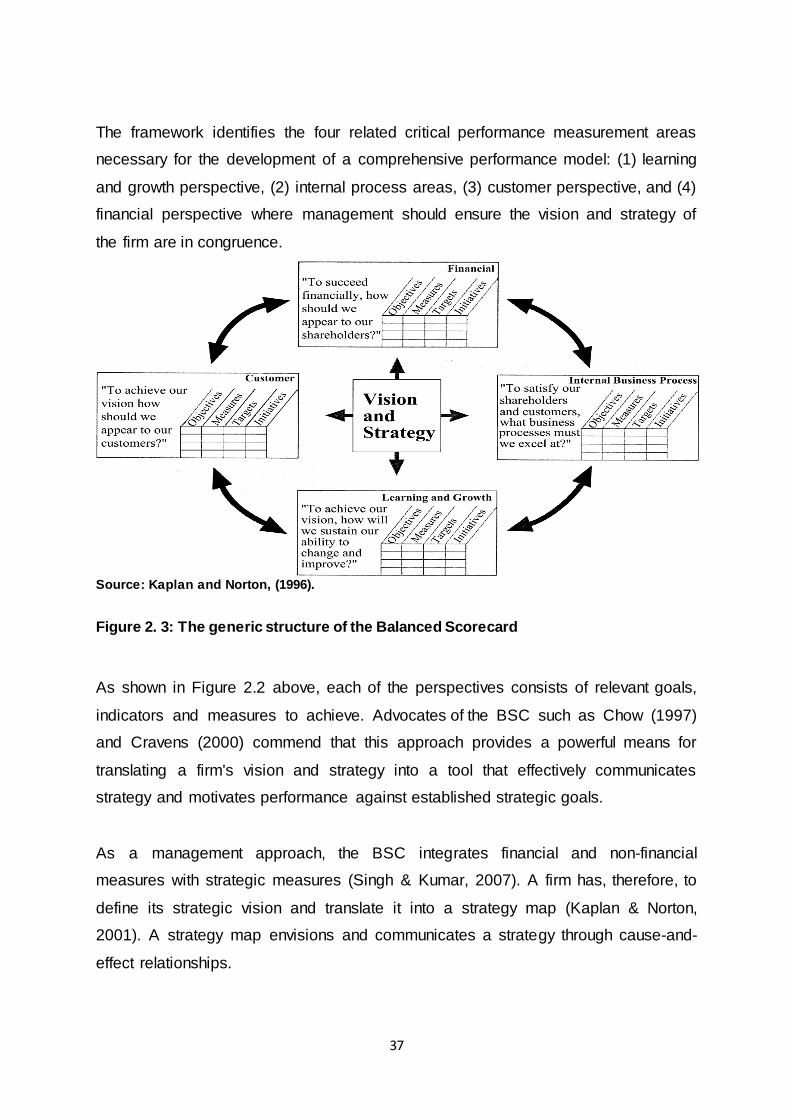
37
The framework identifies the four related critical performance measurement areas
necessary for the development of a comprehensive performance model: (1) learning
and growth perspective, (2) internal process areas, (3) customer perspective, and (4)
financial perspective where management should ensure the vision and strategy of
the firm are in congruence.
Source: Kaplan and Norton, (1996).
Figure 2. 3: The generic structure of the Balanced Scorecard
As shown in Figure 2.2 above, each of the perspectives consists of relevant goals,
indicators and measures to achieve. Advocates of the BSC such as Chow (1997)
and Cravens (2000) commend that this approach provides a powerful means for
translating a firm's vision and strategy into a tool that effectively communicates
strategy and motivates performance against established strategic goals.
As a management approach, the BSC integrates financial and non-financial
measures with strategic measures (Singh & Kumar, 2007). A firm has, therefore, to
define its strategic vision and translate it into a strategy map (Kaplan & Norton,
2001). A strategy map envisions and communicates a strategy through cause-and-
effect relationships.

38
Nonfinancial indicators such as employee satisfaction, quality service, and customer
satisfaction are used to represent intangible factors of learning and growth, internal
business process, and customer perspectives respectively. Return on equity (ROE),
and return on assets (ROA) are taken as measures of the financial perspectives. The
indicators are associated with a cause and-effect relationship where some of them
serve as driving indicators while others serve as the outcome indicators
(Kasperskaya, 2013).
According to Norton and Kaplan (1996) a cause and effect relationship exists among
the perspectives of BSC in a sequential manner. This shows that improved
performance in Learning and Growth will result in improved performance in Internal
Business which will positively affect Customers and this will eventually influence
Financial Performance.
The typical Balanced Scorecard Model has four perspectives hypothesized in a
causal relationship between the perspectives. These perspectives are basically
designed to balance the financial and non-financial measures of performance
(Bento, Bento & White 2012). Each of the perspectives is discussed below.
2.6.1.1. Financial perspective
The Financial performance perspective of the BSC describes the tangible outcomes
of a strategy in traditional financial terms (Chenhall, 2005; Hoque, 2004). The
financial objectives represent the long-term objectives of organisations and are the
outcomes of other non- financial factors. The financial perspective describes the
measures of a firm‟s strategic outcome in financial terms such return on equity
(ROE), return on assets (ROA), Net Interest Margin, market share residual income,
economic value added, revenue growth etc. (Murthy & Sree, 2003; Alexandru et al.,
2008, Atkinson, 2006). In other words, the financial objectives are set as a firm‟s
goals depicting the long-term objectives of the organisations.
Financial statements have long served as important tools to measure the financial
performance of organisations and as the source of information for all stakeholders in
their respective decisions. The Ethiopian Commercial Code No. 166 of 1960, Article

39
63 and Proclamation No. 592/2008, article 23 of the Federal Democratic Republic of
Ethiopia gives the National Bank Ethiopia the power to direct banks to prepare and
issue audited financial statements in accordance with the international standards.
Limitations of Financial Measures of Performance
Some of the limitations of financial measures of performance include that:
1. Traditional financial measures were designed to compare previous periods
based on internal standards of performance.
2. Financial measures provide an excellent review of past performance and
events in the organisation but fail to have a predictive power for the future.
3. The traditional financial measurement systems have no way to calculate the
true value or cost of the synergy of where many functional areas come
together to solve pressing problems and create value.
4. Sacrifice long-term thinking. Cost reduction efforts often targeted the long-
term value-creating activities of the firm such as research and development,
associate development, and customer relationship management. This focus
on short-term gains at the expense of long-term value creation may lead to
sub-optimization of the organization's resources.
5. Financial measures are not relevant to many levels of the organization. When
we roll up financial statements throughout the organization, we are compiling
information at a higher level and it is almost unrecognizable and useless in
the decision making of most managers and employees. Employees at all
levels of the organization need performance data they can act on.
In spite of the limitations of financial performance measures, financial statements will
remain an important tool for organizations since they ultimately determine whether
improvements in customer satisfaction, quality, on-time delivery, and innovation are
leading to improved financial performance and wealth creation for shareholders.
What we need is a method of balancing the accuracy and integrity of our financial
measures with the drivers of future financial performance of the organisation (Kumar
& Chandra, 2006).
40
Financial performance analysis of commercial banks has long been of great interest
to academic research. A large number of researchers have developed a variety of
performance measures to deal with the limitations of solely depending on financial
metrics. Effectiveness, efficiency, productivity, quality of product/service, quality of
work life, innovation and profitability were promoted as performance criteria of an
organization. The diversity of performance measures has created a complexity in
understanding which particular approach is appropriate to adopt. Kaplan & Norton
(1996) emerged with a balanced score of measures which they thought could
overcome the problem. Kaplan & Norton (1996) developed the concept of a
balanced scorecard to evaluate performance of an organization from the financial,
learning and growth, internal business process and customer perspectives. Kaplan &
Norton (1996) classify these perspectives as leading and lagging indicators.
A. Leading Indicators
Leading indicator refers to anything that happens in the process of operation and
that has an effect on the service and/or product provided to the customer, which in
turn affects the perception of the customer on the organization. For instance, internal
business operations are the causes of the customer perception and the indicators
relating to internal process are, therefore, referred to as leading indicators or driving
metrics (Norreklit, 2000).
B. Lagging Indicators
A lagging indicator is something that happens in the end. The end results of the
operations of an organization are the service and/or products provided to the
customer of the organization (Norreklit, 2000).These are affected by the perception
of the customer and the indicators relating to customer perception, such as on-time
delivery, customer complaints, etc. To a business organization, the end results are
measured in terms of profitability. Financial measures, based on historical data, are
basically considered as lagging indicators which are preceded by the lead indicators
that are mostly of qualitative nature.
41
C. Relationship between Leading and Lagging Indicators
The idea to convert strategy into a set of credible and sound causal relationships
between leading and lagging indicators constitutes the core of the BSC model.
Managers are, therefore, expected to understand the strategic objectives of their
organization and the manner of their realisation (Kasperskaya, 2013). Norreklit
(2000) also stresses the need for the existence of both leading and lagging
indicators to have a good balanced scorecard.
Although, the leading and lagging indicators are believed to have cause- and-effect
relationships, one can also argue for the prevalence of circular relationships instead
of linear relationships. For example, the positive influence of employee satisfaction
with internal business processes could result in customer satisfaction and ultimately
in increased profitability. The positive influence of financial measures can also help
in increasing future investments that could boost further employee satisfaction which
in effect is a circular relationship. In this case, the final effect becomes a cause for
the first cause in the multiple relationships.
2.6.1.2. Customer perspective (Customer Satisfaction/Customer Performance)
Customer perspective defines the value proposition used to generate revenue and
loyalty from targeted customers. This is to say that, the core of any business
strategy, that makes it unique from its competitors, is the customer-value proposition
(Kaplan & Norton, 2001). Customer satisfaction refers to a person‟s feelings of
pleasure or disappointment resulting from comparing service perceptions with
expectations.
In a broad sense, customer perspective focuses on achieving customer satisfaction,
customer retention, customer acquisition, increase in market and account share, and
customer profitability (Tapanya, 2004). Tapanya considered staff availability, speed
and responsiveness, skill and competence, appearance and friendliness, and
empathy of the employee perspective as helpful towards customer satisfaction
survey measures. The customer perspective in turn helps organisations to improve

42
their financial results by connecting the business processes with customers (Al
Sawalqa, et al., 2011).
In sum, the customer perspective focuses on the perceptions and expectations of
customers on the products and services acquired and consumed. Positive gap
ultimately leads at least to a modest financial performance of an organization. On the
contrary, poor performance in customer satisfaction would be a leading indicator of
financial decline of a firm.
2.6.1.3. Internal business process perspective
The Internal Business Process intends to measure the key business processes by
which an organization meets the expectations of customers and ultimately
shareholders. It identifies the critical processes, skills, competencies and
technologies that add value to the expectation of customers and the success of the
firm (Atkinson, 2006). In other words, the critical business processes enable an
organisation to deliver values that will satisfy, attract and retain customers in
targeted market segments and address shareholders‟ expectations of high financial
results (Kaplan & Norton, 1996, Norreklit, 2003 and Cohen, Thiraios, & Kandilorou,
2008). The internal business process should ensure that the firm‟s products and
services are meeting customer needs, and is considered the most critical for the
success of an organization.
In relation to manufacturing industry, customer satisfaction is expected to be
measured through production volume, labour productivity, manufacturing cycle time,
product defects, product/service innovation, improvement in response time to
customers (Chow & Van der Stede, 2006), number of new facilities, the percentage
of equipment maintained, Research & Development costs and improvement in space
utilization (Ahmed, Razzaque, & Ramzan, 2011).

43
2.6.1.4. Learning and growth perspective (Employee Satisfaction):
Learning and growth dimension of the BSC emphasizes on creativity, competence
and capability of human capital, innovation in the information system, and the
organizational environment (organizational capital) that is supportive towards the
achievement of organizational strategy and objectives (Atkinson, 2006; Cohen, et al.,
2008). Learning and Growth focuses on people and their attitude, knowledge,
development and ability to learn and improve. Therefore, people, systems, and
organizational capital represent the frame that any organisation must set up in order
to create value to the stakeholders and maintain long-term success. This requires to
pay due attention towards the investment that enhances employee satisfaction,
capability and ultimately win competitive frontier of the organisation. Improvement in
the learning and growth perspective can be measured through customer satisfaction
on employees‟ encounter which is a fundamental factor that determines profitability.
Having a holistic approach of the perspectives, the balanced scorecard as a
performance measurement and management tool, has gained widespread
acceptance by researchers and practitioners (Gumbus, 2005). However, the BSC
was criticized among others, for its lack of specific guidelines for successful
implementation (Pun & White, 2005), lack of formal methodology, focusing on short
term financial measures (Kanji & Moura, 2002), and dominated by a top down
approach (Malina & Selto, 2001).
The model was also criticized for the time lag of the events and their respective
chain-effect relationship between the perspectives and the doubt on its ability to test
the reliability of the basic hypotheses of BSC causal relationships (Norreklit, 2003;
Abu-Suleiman, 2006). Besides, Ittner, et al., (1997) find no evidence of improvement
and connections between the managers' job and business objectives on the basis of
the scorecard approach. Khan, Halabi, & Masud, (2010) identify the reasons
for the failure of the BSC concept as a result of: (1) incorrect identification of non-
financial measures as primary drivers; (2) setting arbitrary goals rather than based
on requirements that most of the employees need; (3) non-existence of a
deployment system that breaks the goals where actual improvement activities reside;
(4) absence of the cause-and-effect relationships between non-financial and financial

44
results. To overcome these problems and reinforce the measurement system
requires a systematic approach of execution, communication and enhancement
process.
2.6.2. The Service Profit Chain Model
Each business has its unique process to deliver its value and generate a financial
return. The generic service profit chain model hypothesises on the linkage of
employee satisfaction, quality service, customer satisfaction and profitability (refer to
figure 2-3). It is a conceptual framework that helps in the analysis of a firm‟s value
chain. The Service-Profit Chain model shares on previous studies and proposes a
comprehensive model of causal linking of internal service quality, employee
satisfaction, external service quality (values), customer satisfaction, customer loyalty
and profitability (Heskett et al., 1994; Malhotra & Mukherjee, 2004; Duncan & Elliott,
2004; Xu & Goedegebuure, 2005; Ishtiaq, I.M., 2011; Boukis, Kaminakis, Siampos,
& Kostopoulos, 2015).
Source: Heskett et al. (1994)
Figure 2. 4: The generic structure of the Service-Profit Chain Model
The model was also adopted with some modifications by Kamakura, et al. (2002);
Acheampong & Asamoah (2013). The service profit chain postulates that satisfied
Internal service qulity
Employee satisfaction
customer service quality
Customer satisfaction
Proftiability

45
employees are productive, and through the moderating effects of service quality lead
to satisfied customers, customer loyalty and increase in revenue and profits of a firm
(Gelade & Young, 2005). Based on the service profit chain model, perceptions of
internal customers about quality ultimately influence the quality of services offered to
external customers and generate more profits for organizations (Heskett et al.,
1997). Further, Heskett, et al. (2010) and Reichheld (2000) considered customer and
employee as the main stimulating forces that create different links in the service-
profit chain model.
The research questions and the research objectives set in chapter 1 and the
relations existing between the variables are the focus areas that are in the service
profit chain model and subsequently in this study. Therefore, the service profit chain
model (Figure 2.3) is relevant to the present study of developing a comprehensive
measure of performance model in that it integrates the five components of the
current study (the relationships of internal marketing, employee satisfaction, external
service quality, customer satisfaction, customer loyalty, and profitability).
Employee variables consist of employee perception of internal service quality which
the bank provides for the satisfaction of employees thereby leading to service
quality. Service Customer variables comprise the customer‟s perception of the
quality of the service delivered by employees, customer satisfaction, and customer
loyalty. The model provides an integrative framework for understanding how
employee variables are related to customer variables regarding the perception of the
service and intended behaviour, and how these ultimately translate into profit
(Fazlzadeh, Faryabi, Darabi, & Zahedi, 2012). The SPC model considers operational
factors, customer behaviour intentions, and customer loyalty as the drivers of an
organization‟s profitability which are discussed as follows.
2.6.2.1. Operational Attributes
Operational attributes of the SPC include all factors of the internal operations that
enable an organization to provide services to the customers. Heskett et al., (1994)
looked at these attributes inside the organization as employee satisfaction and

46
employee retention. To Roth & Jackson (1995) operational attributes can be referred
to as the potential setting within an organization to be used in providing quality
services. To Rucci, Kirn, & Quinn, (1998), employee behaviour and employee
retention were used to refer to operational attributes.
Kamakura et al., (2002) divide interventions in operational attributes into two broad
categories, namely, personnel efforts and equipment/material efforts. Personnel
efforts include all sorts of HRM initiatives undertaken within the organization to
improve employee related activities such as the quality work, training opportunities,
reward and recognition, work design, and any other efforts that could improve the
levels of employee motivation and satisfaction.
Equipment/material efforts are mediations and investments made in equipment or
material, like more and better tools or equipment, increased branch locations, more
ATMs, expansion of an electronic banking system, etc. so as to enhance the
satisfaction of customers. In sum, these attributes can be related to the learning and
growth perspective of the balanced scorecard by Kaplan & Norton (1992).
2.6.2.2. Customer Perceptions
Zeithaml, Wilson & Bitner (2008) state quality as an essential element in the
formation of the image and perception of the customers. From the perspective of
SPC, there are two approaches to customer perception: perceptions of the
customers on the personnel and perception of other attributes of the organisation.
Courteousness, helpfulness, knowledge, and ability to answer questions are among
the facets of perceptions a customer may have to the personnel of an organisation.
The quality of the office building, equipment, sufficient space for parking, displays or
leaflets used are some of the indicators of perception of materials used. Besides,
convenience of time and locations and ease of access to service are perceptions of
the quality of service delivery.

47
2.6.2.3. Customer Intentions
Customer‟s intention is considered as a component of the SPC since it is closely
linked to the behaviour of customers. Intentions are based on the perceptions of the
service received. Perceived service quality is devoted to an attribute of performance-
perception and is used as a predictor of overall satisfaction of customers. In other
words, customers develop some intentions regarding their future relationship with an
organisation based on their perceptions and the overall satisfaction levels of the
service they obtained from (Kamakura et al., 2002).
2.6.2.4. Customer Loyalty
Customer loyalty links the current performance to the future prospects. Customer
loyalty can be captured as retention rates and referrals (Heskett et al., 1994).
Customer retention and customer acquisition that emanate from referrals are
measured through customer loyalty which is likely to ultimately generate greater
profitability in the long run.
The balanced scorecard (Kaplan & Norton, 1992) merges all of the above three
components of the SPC – customer perceptions, behavioural intentions and
customer loyalty into one – the customer perspective.
2.6.2.5. Profitability
This component of the SPC can be equated to the financial perspective of the
balanced scorecard of Kaplan & Norton (1992). Increase in customer retention and
customer acquisition rates have been claimed to have a significant positive effect on
profits (Reichheld & Sasser, 1990, Rust & Oliver, 1993, Johnson, 1998). Customer
retention and acquisition lead to surplus if expenses remain constant. In a nut shell,
the surplus perspective of the SPC underscores that greater customer satisfaction
and customer loyalty leads to a significant influence of an organization‟s long term
financial performance. Drucker (1954) also maintains customer satisfaction as a
driving force for revenue enhancement. Since then, customer satisfaction has served
48
as a means to enhance revenue. Given the profit as the goal of a business,
customer satisfaction as a concept has been a topic of attention in the marketing
literature (Drucker, 1973).
In sum, service quality is an antecedent of customer perceptions (Kamakura et al.,
2002) and efforts exerted in the provision of quality service/product will have no
effect on the behaviour of the customers and ultimately on the revenues of an
organisation as long as customers fail to perceive the difference in the added value
of quality. Therefore, installation of additional ATMs, the change in the efficiency of
the counter-service employees, and the ultimate achievement of efficient services
have to be perceived by the customers as having an effect on their satisfaction and
subsequent intention.
2.7. Summary of the Chapter
This chapter started its discussions with the structural measures that have been
undertaken by the government to liberalize the financial sector after the demise of
the military regime. The chapter then continued with the discussion on the definition
and justification for performance measurement. The theoretical foundations of
performance measurement were discussed in detail sub classifications under the
basic classifications of strategic theory, management theory, and behavioural theory.
The need to integrate non-financial measures of performance with the financial
measures of performance was underscored by focussing on the conceptual
frameworks for performance measurement related to the study. The BSC and SPC
frameworks were taken as inspiring models for the study and are discussed above in
detail.
49
CHAPTER 3
The EMPIRICAL LITERATURE REVIEW
3.1. Introduction
This chapter presented the discourse on the empirical studies of the research and
the consequent formulation of the hypothesis. It covered empirical studies based on
financial measures of profitability and the multiple approaches of performance.
Further the factors involving internal service marketing, employee job satisfaction,
customer service quality, customer satisfaction, customer loyalty, and profitability
were discussed in the construction of the hypothesis.
3.2. General Overview
Performance measurement is important to assess the soundness of the banking
sector and build confidence of the public in the financial system of a country. A
sound performance of the sector depends on the soundness of individual bank (the
contagious effect). Therefore, when evaluating the performance of the banks, due
consideration has to be given to both their profitability and the environmental factors
affecting profitability, so as to avoid misleading conclusions.
Based on the contingency theory the business environment is dynamic and the
literature demonstrates that the banks have to adapt their performance
measurement system and strategies to fit with the ongoing changes of their business
environment. Changes in the business environment have an impact on the survival
and stability of organisations (Siti-Nabiha & Scapens, 2005). Then, changes in
circumstances (contingencies) require an adjustment to the structure so as to
improve the fit condition and lead to higher performance. As discussed in chapter
two and according to Drucker (2000), management must be change leader, look at
change as an opportunity and not a challenge, understand how to make change
effective both inside and outside the organization, inspire the workforce to see
change as an opportunity, and be able to develop new products or services to

50
address the market needs for change. Therefore, in response to the dynamics of the
internal and external environment, it‟s necessary to make continuous and timely
scanning of the environment and respond appropriately by modifying their
performance measurement systems and strategies that suit the change.
Therefore, given the different approaches used to evaluate the performance of the
commercial banks, this study focuses on the relevant literature on measures of
profitability and the non-financial factors affecting profitability.
3.3. Empirical Studies on Measures of Profitability
Financial measures have traditionally been used to evaluate the efficiency and
effectiveness of a firm and its management in maximizing the wealth of
shareholders. Besides, financial measures have been used as a source of
information to the stakeholders of organisations for their respective decisions
through multiple interim and annual financial reports. The balance sheets and
income statements have been used as a source of data to measure the overall
effectiveness and efficiency of a bank by various stakeholders. Profitability measures
have also served as the bottom line of financial reports.
The literature on measures of profitability validates internal and external
environmental factors as determinants for studying bank profitability (Bourke, 1989).
Internal factors originate from bank balance sheets and income statement accounts
which are bank specific determinants of profitability. Accounting provides different
types of traditional financial measures of profitability such as return on assets (ROA),
return on capital employed (ROCE), sales growth, capital structure (equity/assets),
credit risk (loan loss provisions/total loan), operating expenses capability (operating
expenses/total assets), and ownership structure (Atkinson, 2006) as internal
determinants of profitability. These measures are profit measures used to evaluate
the historical performance of a firm (soumadi & Aldaibat, 2012).
Empirical studies on profitability analysis cover either of cross-country or individual
countries‟ banking systems or on developed or emerging market economies. Studies

51
that focused mainly on cross-country analysis include that of Grigorian and Manole
(2002) who estimate indicators of commercial bank efficiency by applying a version
of the Data Envelopment Analysis (DEA) to bank-level data from a wide range of
developed countries. Their analyses include a variety of macroeconomic, prudential,
institutional, and bank-specific variables. Similar studies were also performed by
Manandhar & Tang (2002); Bonin, Hasan, & Wachtel (2005); and Zhang & Daly
(2013). .
Molyneux & Thornton (1992), Williams (2003), Athanasoglou, et al., 2008), Heffernan
& Fu (2008), and Trujillo-Ponce (2013) apply a General Methods of Moments (GMM)
technique in their studies of a single country‟s panel data. These authors examine
the effect of bank-specific, industry-specific, and macroeconomic determinants of
bank profitability.
The findings of the studies conducted on individual emerging country‟s bank by
Tarawneh (2006), Sufian & Chong (2008), Idris, Asari, Mustaffa, & Jusoff (2011),
Khan, Rehman, Rehman, Safwan, & Ahmad (2011), Gul, Irshad, & Zaman (2011)
Ali, Akhtar, & Ahmed et al. (2011), Naceur & Omran, (2011), Almazari (2011) and
Belanesh (2011) indicate that bank-specific determinant variables and external
determinant factors have in combination an impact on the profitability of banks.
Bank-specific determinant variables include, among others bank size, capitalisation,
asset utilization ratio, operating efficiency ratio, credit risk, management of
expenses, non-interest income, profit to asset ratio, loan growth, overhead
expenses, insider lending, non-performing loans, and efficiency of asset
management. External determinant factors consist of inflation, taxation, economic
growth, bank regulation, and macroeconomic determinants. However, in spite of the
prevalence of some common elements for classification, the empirical results vary
due to the differences of both internal and external determinants‟ datasets and
environments of the specific banks in the study.
On the other hand, ownership structure has also become a popular variable
employed by researchers in China and in this regard Lin & Zhang (2009), Berger,

52
Hasan, & Zhou (2009) suggest that ownership is associated significantly with
improved efficiency.
Besides, globalization has developed recently as a measure to investigate bank
performance. For instance, García-Herrero & Santabárbara (2008) find empirical
evidence to suggest that the Chinese banking sector benefits from the globalization
process through higher profitability and increase of the efficiency of the banking
system.
Nevertheless, in spite of its effect on the free flow of services, capital, technology,
and labour, globalization is also likely to aggravate the gap between developed and
developing countries by creating a lobal financial crisis, causing political and cultural
problems, and leading to environmental degradation. With respect to this, Lensink,
Meesters, & Naaborg (2008) find that globalization negatively affects bank
performance. But, the researcher believes that a country will not be immune in one
way or the other from the impact of globalization. Although not a resolution for the
financial development of the country, the banking business in Ethiopia is not yet
open to foreign entry in view of the challenges the regulator would face and the
capacity of the domestic banks to withstand the possible global competitive
environment.
In sum, the above studies have measured performance based on accounting
methods of evaluating profitability. Yet, the traditional financial measure has been
criticized for many of its limitations. Critics such as Johnson & Kaplan (1987), and
Hayes & Abernathy (1980) suggest that financial measures are not consistent with
today‟s business environment. The most pronounced limitations are that financial
measures are: backward looking, lack predictive power, not relevant to many levels
of the organization, prone to reward short-term or incorrect behaviour, deficient on
the provision of sufficient information on solutions to problems, not strategically
focused, and not bold enough in creating sufficient linkage into the long-term
performance (Smith, 2006; Zhang & Pan, 2009; and Al Sawalqa, et al., 2011).
53
The limitations of traditional financial measures, the need to supplement the financial
measures with non-financial performance measures and the desire to capture the
scope of organisational objectives has led to the development of measurement
frameworks designed to help organisations implement balanced sets of measures.
Accordingly, the performance measurement matrix (PMM) of Keegan, Eiler & Jones
in Pistoni & Songini (2015), the SMART pyramid of Lynch & Cross in Oh, Johnson,
Lucianetti, & Youn (2015), the results–determinants framework of Fitzgerald,
Johnston, Brignall, Silvestro, & Voss in Pistoni, & Songini (2015), the input–process–
output–outcome framework of Brown in Anderson & McAdam (2004), the Balanced
Scorecard of Kaplan & Norton (1992) are developed as new state of the art of
performance measure that combine financial and non-financial measures. The most
popular of the performance measurement frameworks has been the balanced
scorecard, proposed by Kaplan & Norton (1992). The balanced scorecard identifies
and integrates four different perspectives in terms of looking at performance from
financial, customer, internal business, and innovation and learning perspectives.
Therefore, from the perspective of addressing the objectives of this research,
subsequent discussion basically focuses on the empirical studies involving multiple
unidimesional and moderating factors in the measures of performance relevant to
the research study.
3.4. Empirical Studies on the Non-Financial Measures of Performance
The Balanced Scorecard (BSC) and Service-Profit Chain (SPC) models have been
developed by Kaplan & Norton (1992) and Heskett et al., (1994) respectively to
measure in combination the relationship of performance measures involving
financial, customer, learning and growth, and internal business processes
perspectives. The kernel of the models has been based on the notion that the orderly
Improvements in the growth and learning perspective, internal process and
innovation, and customer satisfaction ultimately lead to improved profitability thereby
achieving the banks‟ objectives, strategies and goals. Various researchers have
been engaged in conducting their research by incorporating the long-term
perspective of performance evaluation of Balanced Scorecard so as to provide a
broader view of performance of a bank

54
The balanced scorecard developed by Kaplan & Norton (1992) looks at the
relationship between strategy and performance by integrating the measures of
performance of the financial, customer, learning and growth, and internal business
processes perspectives. The Improvement in the growth and learning perspective
(employee satisfaction, employee retention, employee skill development and the
extent of knowledge management) leads to creating enabling environment for
enhancement in internal process and innovation ( number of in time deliveries,
number of unattended queries reported by customers, produce quality products and
services) which leads to higher customer satisfaction (market share, customer
retention, customer acquisition) and increase in customer satisfaction leads to
improved profitability thereby achieving the banks‟ objectives, strategies and goals.
However, empirical studies reveal that there have been increasing debate on the
validity of the proposition of BSC and its implementation.
A survey of medium and large Australian manufacturing organisations reveals the
use of varying forms of scorecards and managers who perceive their scorecard
measures are linked to strategy and affect each other in a causal manner perceive a
higher level of effectiveness of the BSC. However, the study also suggests that
strategic use of BSC is not as widespread as might be expected (Yu, Perera, &
Crowe 2008). Kumar & Chander (2006) propose that the BSC may be used to
measure long term outlook of the banks besides the CAMEL rating model. The study
of Cohen, et al. (2008) indicates that the leading indicators of the BSC are positively
correlated with one another at a statistically significant level in an orderly manner.
Besides, the findings show that the companies that improve their financial
performance during the analysis period have indications of improvements in their
efforts towards advancing the learning and growth perspective more than those
whose ROE and ROA values decrease (Cohen, et al. 2008). The findings of Ong,
Lau, & Wong (2010) indicate that organizations respond positively to BSC measures
and believe the cause and-effect relationship of the BSC leads to improved business
efficiency and profitability. Ahmed, et al. (2011) conducted their study at the
managers‟ level in the commercial banks in Pakistan using a five point scale
questionnaire. Results indicate that customer, financial, internal process, and
learning and growth perspectives of the BSC are sequentially important predictors.
55
Devie, Tarigan, & Widjaja (2012) in their studies of employees and customers in
restaurants and cafés in Surabaya-Indonesia conclude a positive relationship among
the BSC variables.
On the other hand, there are also researchers whose findings indicate incomplete
relationships among the BSC variables. Al Sawalqa, et al. (2011) analysed the state
of implementation of the balanced scorecard (BSC) performance measurement
techniques from the Jordanian perspective. A quantitative survey of 168 companies
was conducted and results show that 35.1% of the surveyed companies use the
BSC approach. But, results reveal some inconsistency in the types and numbers of
BSC perspectives used. Kasperskaya (2013) performed a correlation analysis in
order to produce evidence about the statistical relationship among the BSC
perspectives. The findings indicate little correlation between the perspectives of the
firms under consideration. Yet, the result shows that profitability depends on a limited
number of the perspective variables such as the sales variation (customer) and
training expenses (employees‟ skills).
The BSC approach has also its critics. Speckbacher, Bischof, & Pfeiffer (2003), Ittner
et al. (2003), Davis & Albright (2004), and Nørreklit & Mitchell (2007) reveal the
deficiency of the model in testing the cause-and-effect relationships. Pandey (2005)
criticises the failure of the BSC model to consider the time lag of an occurrence of
one dimension and its effect on another dimension. A study conducted by Ittner et al.
(2003), for example, reveal that 77% of companies using BSC give little or no
attention to causal models. Further, Speckbacher et al. (2003) find that half of their
sample companies using BSC are not able to formulate cause-and-effect
relationships among the different objectives and measures. A further study of Finnish
companies by Malmi (2001) show that most companies appear to have scorecards in
which the resulting measures and perspectives are fairly independent waning the
claim of cause-and effect interconnections. Lastly, Norreklit (2000) criticizes that the
BSC proposition does not provide a sufficient narrative of the assumed causal
relationships between the BSC perspectives and suggest that this relationship
cannot be characterized as causal but logical
56
In spite of the mixed and conflicting findings, the BSC and SPC frameworks depict
that a relationship exists among the lagging indicators (financial perspectives) and
leading indicators (customer, learning and growth, and internal business processes
perspectives). This addresses the need for further research in the relationship of the
non-financial performance measures with the financial performance measures of
internal service quality, employee satisfaction, service quality, customer satisfaction
and profitability.
In today‟s rapidly volatile and complex business environment, awareness of the
effects of non-financial measures have become popular in measuring and guiding
performance of organisations. Verbeeten & Boons (2009) define non-financial
performance measures as operational measures that provide performance
information in non-monetary terms such as internal service quality/marketing,
employee job satisfaction, customer service quality, customer satisfaction, and
customer loyalty.
Medori & Steeple (2000) emphasise that non-financial performance measures not
only overcome the limitations of financial measures, but are also:
1) More timely than financial ones,
2) Meaningful to the workforce in the need for continued advancement,
3) Consistent with company goals and strategies, and
4) More flexible in that they can change and vary over time as market needs
change.
Al Sawalqa et al., (2011) further notes that non-financial measures are used more
frequently for operational and strategic decisions, evaluation of managerial
performance and communication of strategy. The non-financial measures are
discussed within the perspectives of internal marketing, employee job satisfaction,
customer service quality, customer satisfaction and customer loyalty.
3.4.1. Internal-service quality
The notion of internal-service quality was first proposed by Sasser & Arbeit (1976)
and define it as a means of achieving employees‟ satisfaction by treating them like
57
customers and offering them the job as an internal product that will permit the quality
of service to be improved. Sasser and Arbeit consider employees as a source of
competitive advantage, deserving to be communicated, educated, developed and
motivated in order to achieve the organizational goals. Internal service quality is
given adequate attention by researchers in the development of the service profit
chain framework by establishing and exploring various relationships and
associations such as between internal service quality (ISQ) and external service
quality (SQ), customer satisfaction, employee retention and satisfaction and
profitability (Chang & Chen, 1998, Khan, Anuar, Choo, & Khan, 2011).
Heskette et al. (2008) and Lee & Lings (2008) denote internal marketing as the
attitude and perception that employees have towards their jobs and the application of
a marketing strategy that could motivate employees to be customer focussed, be
aware of customers‟ needs and requirements, and possess a marketing mindset.
Thus, satisfied and motivated employees of service organizations are believed to be
the basis of customer satisfaction. This is so, because it is the front-line employees
of the service organization who interact with the external customers (Lee and Chen,
2005). In other words, it is believed that gratifying employees‟ needs is expected to
increase their motivation and commitment and thereby enhance the satisfaction of
customers (Mishra, 2010).
From the perspective of Parasuraman, Zeithaml, & Berry (1988), Parasuraman and
Berry (1991) internal marketing is considered as marketing orientation at internal
level to achieve the satisfaction of front-line employees, and to attract, develop,
motivate, and retain employees. This is achievable by designing the job itself in a
way it meets the quality requirements of the internal customers. Rafiq & Ahmed
(2000) view internal marketing as a planned effort of using a marketing-like approach
within an organisation in order to align, motivate, coordinate and integrate customer
oriented employees towards the effective implementation of organisational strategies
drawn to meet customer satisfaction. Mittal & Kamakura (2001) argue that the effort
exerted by organizations to provide their internal customers with better customer
service ultimately accrues in higher customer quality service. Therefore, designing
jobs as internal products is ultimately meant to improve customer service quality
(Lee & Chen, 2005) and improve customer satisfaction (Lings & Greenly, 2005).

58
In summary, empirical studies on internal marketing generally consider pay, training
and development, incentives and motivation for development, empowerment,
relations with co-workers, relations with supervisors, working conditions, job security,
promotional aspects, nature of work, work design, job specification, fairness,
recognition, feedback, employee recruitment and selection, and vision of the
organization as dimensions of internal marketing that can influence employee job
satisfaction (Hoppock, 1935, Herzberg et al, 1959, Heskett et al., 1994, Hallowell,
1996, Lages & Piercy, 2012, Mansor, Noor, & Hassan, 2012, Bader, Hashim, &
Zaharim, 2013, Papageorgiou, Giorgalli, & Petrou, 2013, Al-Hawary, Al-Qudah,
Abutayeh, & Al-Zyadat, 2013).
3.4.2. Employees’ Job Satisfaction
The concept of employees‟ job satisfaction was first coined by Hoppock (1935) in
terms of the physical and metal emotional feelings exhibited by employees in
response to their respective work environment. Since then, considerable attention
has been given from the academics and practitioners.
Employee job satisfaction is defined as the pleasurable emotional response of a
person towards his/her job or work experiences (Locke & Schweiger, 1979; Suzuki,
Itomine, Kanoya, Katuski, Horii, & Sato, 2006). Tadeka, Ibaraki, Yokoyama, Miyake,
& Qhida (2005) stated that employee job satisfaction is derived from the mental and
physical satisfaction they experience in the environment they work in and from the
work itself. Employee job satisfaction has also been regarded as a positive emotional
state that emerges from the judgment of all aspects of a working relationship within
the employees (Cheng, Lai, & Wu, 2010). Kaliski (2010) viewed employee job
satisfaction as a vital constituent that leads to recognition, income, promotion, and
the achievement of other goals that lead to a feeling of fulfilment.
Hoppock (1935) considered financial (salary and benefits), economic and social
status, relationships with supervisors and associates on the job, work situations,
including the nature of work, working conditions-earnings, hour of work, facilities,
opportunities for advancement, variety in work, delight in the work, job security, and
ability to adjust oneself to unpleasant circumstances as factors that influence job

59
satisfaction. To Smith, Kendall & Hulin (1969), job satisfaction is the result of a
worker‟s explanation of the distinctive nature of his/her job based on a thorough
measurement, such as the comparison of jobs, comparison with colleagues, and the
previous work experiences possessed by a worker. Bader et al. (2013) revealed
work-itself, promotions, pay and benefits, working conditions, relations with
supervisors and co-workers as factors that contribute significantly to employees' job
satisfaction of bank employees in eastern Libya. Factors such as gender, age and
type of occupation had no significant effects on the level of job satisfaction while
marital status, education level, and the duration of the work showed significant
effects. Similarly, Papageorgiou et al. (2013) identified work environment, salary,
possibility for growth, relationship with co-workers, and interesting work as factors
perceived most important job satisfaction motivators by employees of banks in
Cyprus. Mansor et al. (2012) found confirmatory evidence that motivational factors
such a rewards system, supervision, working environment, and competition
influenced job satisfaction levels among bankers in the eastern region of Malaysia.
Kamal & Hanif (2005) found that job satisfaction is significantly dependent upon pay,
promotion opportunities, rewards, and one‟s relationship with boss and co-workers.
Job satisfaction has been measured mainly with specific aspects of a job such as job
security, co-workers, working conditions, company policies, and opportunities for
achievement, accomplishment, and advancement (Weiss, Dawis, England, &
Lofquist, 1967). Luddy (2005) identified status, supervision, co-worker relationships,
job content, remuneration and extrinsic rewards, promotion and physical conditions
of the work environment, as well as an organizational structure as causes of job
satisfaction. Challenging jobs, an equitable reward system, including salary and
promotional opportunities, good co-worker relationships, and supportive working
environment were acknowledged as factors to affect job satisfaction (Schermerhorn,
Hunt, Osborn, & Uhl-Bein, 2011). In the studies of Kovach (1987,1995), ten
employee job motivational factors were presented that include: 1) interesting work, 2)
full appreciation of work done, 3) feelings of being in on things, 4) job security, 5)
good wages, 6) promotion and growth in the organization, 7) good working
conditions, 8) personal loyalty to employees, 9) tactful discipline, and 10)
sympathetic help with personal problems.

60
Shrivastava and Purang (2009) examined the job satisfaction levels of public sector
and private sector bank employees in India and found that private sector bank
employees perceived greater satisfaction with pay, social, and growth aspects of the
job as compared to public sector bank employees. On the other hand, public sector
bank employees expressed greater satisfaction with job security as compared to
private sector bank employees. In a study of the bank staff in Pakistan, employee
satisfaction is viewed as an important constituent that can augment companies‟
performance and productivity (Christina, & Gursoy,2009; Matzler & Renzl, 2007).
Employees who are satisfied with their jobs are more likely to be committed to their
organizations, reduce the intention for turnover, focus on the production of quality
goods or service, exercise all efforts towards customers‟ satisfaction, and increase
customers‟ loyalty (Christina & Gursoy, 2009; Yee, Yeung, & Edwin Cheng, 2010).
3.4.3. Customer Service Quality
In an increasingly growing competitive environment, customers have emerged to be
more demanding and judges of quality. As a result, organizations have started to
focus on service quality as a strategic component of their marketing plan. This shift
of attitude has developed on the perception that organizations could maintain their
competitive advantage through service quality and the mediating effect of customer
satisfaction. Kheng, Mahamad, Ramayah, & Mosahab, (2010) considered delivery of
quality service to customers as a core necessity to the success and survival in
today‟s competitive world. Banks do business with the customer‟s money and the
more satisfied customers are with a bank‟s service quality, the more secure business
and its profitability. Failure to deliver the proper customer service could result in loss
of customers and ultimately decrease in profitability because of the poor customer
service. Therefore, providing service quality is not an option but an essential strategy
for success and survival of an organization. But, what is service quality?
The service marketing literature defined service quality as the overall assessment of
a service by the customer (Eshghi, Haughton, & Topi, 2007). Kotler and Armstrong
(2012) defined service as an intangible product produced by facilities supported by
capacity, skill and knowledge of the service provider. Parasuraman, et al. (1988);
Zeithaml, Berry, & Parasuraman (1996); Caruana (2002); Kheng, et al., (2010)
61
defines service quality as the difference between customers‟ expectations and their
perceptions of the service. Perception is referred to as consumer‟s beliefs relating to
the received service while expectation is the desire or want of the consumer about
the service (Parasuraman, Zeithaml & Berry 1994). Customer‟s expectation serves
as a base for evaluating service quality, because quality is higher when performance
exceeds expectation and low when performance does not meet their expectations.
Perceived service is the outcome of the consumer‟s view of the service dimensions.
Therefore, it is worth noting that service quality is not only assessed as the end
result, but also on how it is delivered during service process and its ultimate effect on
consumer‟s perceptions (Duncan et al., 2004).
Ladhari (2009) considered service quality as an important tool for a firm‟s struggle to
differentiate itself from its competitors and further identified the features of service
quality as:
a. Intangibility – Service cannot be counted, measured, tested, verified and
inventoried in advance of sale.
b. Inseparability – there is simultaneous production and consumption of
services.
c. Variability (or heterogeneity) - An unavoidable consequence of simultaneous
production and consumption is variability in the performance of a service. The
quality of the service may vary depending on who provides it, as well as when
and how it is provided.
d. Perishability - Services cannot be stored for later sales or use.
Service quality is viewed as a multi-dimensional concept in the researches. Based
on satisfied employees as input resource, Sasser, Olsen, & Wyckoff (1978) identified
six dimensions of service quality which involve:
a) Security- confidence as well as physical safety;
b) Consistency- receiving the same each time;
c) Attitude- politeness and social manners;
d) Completeness- ancillary services available;
e) Condition- of facilities or equipment; and
f) Availability - access, location and frequency, and training.

62
Gronroos (1988) classified service quality in three dimensions: technical quality of
the outcome; the functional quality of the encounter and the corporate image. On the
hand, Rust & Oliver (1993) proposed a model in which the overall perception of
service quality is based on a customer‟s evaluation of the three dimensions of the
service encounter:
1) The customer-employee interaction (i.e. Functional or process quality),
2) The service environment, and;
3) The outcome (i.e. Technical quality).
Parasuraman, Berry, & Zeithaml, (1985) developed the SERVQUAL model to
measure service quality dimensions. They suggested ten dimensions by which
consumers could make decisions on their expectations and perceptions of the
delivered service. Included are: tangibles, reliability, responsiveness,
communication, credibility, security, competency, courtesy, understanding or
knowing the customer, and access. These dimensions were subsequently
condensed into five dimensions of SERVQUAL:
1. Tangibles (include the appearance of physical facilities, equipment, supplies,
and appearance of the employees),
2. .Reliability (includes the ability to provide service that is accurate, timely,
satisfactory, and reliable),
3. Responsiveness (comprises the ability to assist customers by giving out the
right service, fast, and be responsive in providing services needed by the
customer),
4. Assurance (includes the ability or knowledge, courtesy and trustworthiness of
staff, so as to inspire trust and confidence on the quality of services provided),
and
5. Empathy (involves the effort to find out and understand individual customer
needs by providing excellent communication, caring attitude and attention to
customers). Friendly customer service pleases customers when they walk into
a bank. The purpose of this dimension is to retain customers to keep using the
bank service.
Quantitatively, service quality was demonstrated by Khan, Tabassum & Jahan
(2014) using the following equation.
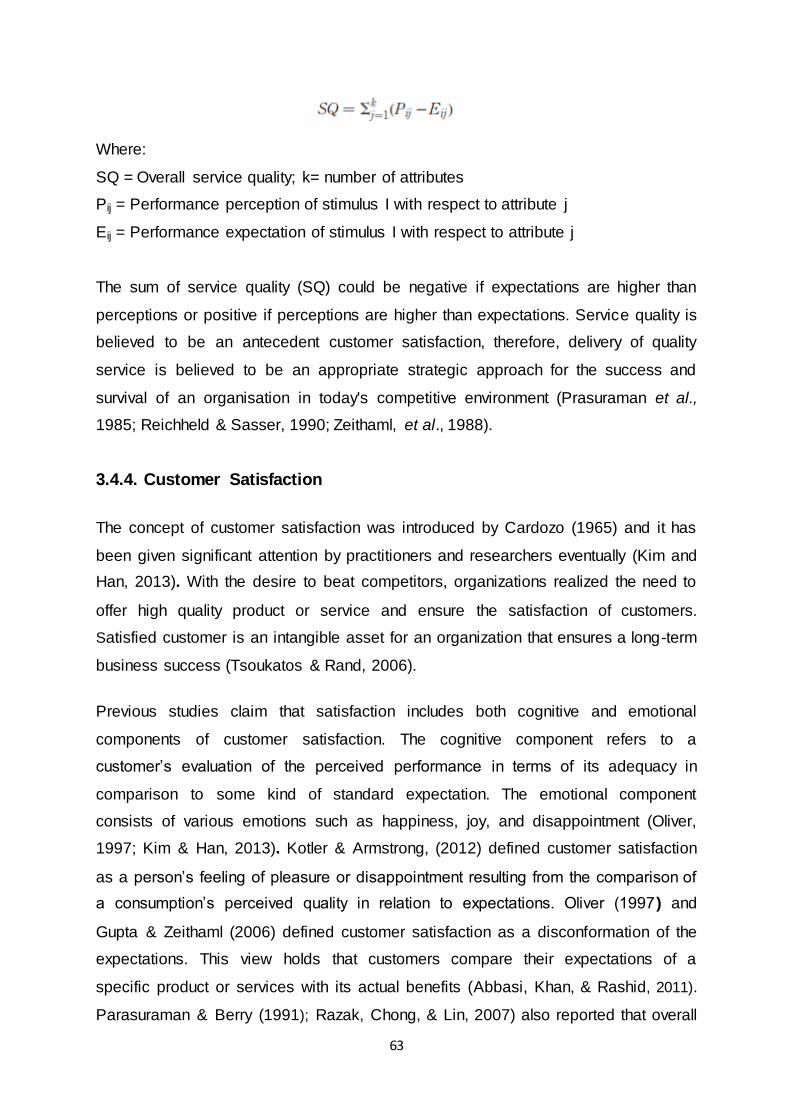
63
Where:
SQ = Overall service quality; k= number of attributes
Pij = Performance perception of stimulus I with respect to attribute j
Eij = Performance expectation of stimulus I with respect to attribute j
The sum of service quality (SQ) could be negative if expectations are higher than
perceptions or positive if perceptions are higher than expectations. Service quality is
believed to be an antecedent customer satisfaction, therefore, delivery of quality
service is believed to be an appropriate strategic approach for the success and
survival of an organisation in today's competitive environment (Prasuraman et al.,
1985; Reichheld & Sasser, 1990; Zeithaml, et al., 1988).
3.4.4. Customer Satisfaction
The concept of customer satisfaction was introduced by Cardozo (1965) and it has
been given significant attention by practitioners and researchers eventually (Kim and
Han, 2013). With the desire to beat competitors, organizations realized the need to
offer high quality product or service and ensure the satisfaction of customers.
Satisfied customer is an intangible asset for an organization that ensures a long-term
business success (Tsoukatos & Rand, 2006).
Previous studies claim that satisfaction includes both cognitive and emotional
components of customer satisfaction. The cognitive component refers to a
customer‟s evaluation of the perceived performance in terms of its adequacy in
comparison to some kind of standard expectation. The emotional component
consists of various emotions such as happiness, joy, and disappointment (Oliver,
1997; Kim & Han, 2013). Kotler & Armstrong, (2012) defined customer satisfaction
as a person‟s feeling of pleasure or disappointment resulting from the comparison of
a consumption‟s perceived quality in relation to expectations. Oliver (1997) and
Gupta & Zeithaml (2006) defined customer satisfaction as a disconformation of the
expectations. This view holds that customers compare their expectations of a
specific product or services with its actual benefits (Abbasi, Khan, & Rashid, 2011).
Parasuraman & Berry (1991); Razak, Chong, & Lin, 2007) also reported that overall

64
satisfaction is the outcome of the customer‟s evaluation of a set of experiences that
are linked to the specific service provider.
Bagozzi et al. (1992) propose the existence of reciprocity in customer-firm
relationships. In other words, the satisfaction of a customer on a service organisation
could motivate the customer to utilise the organisation‟s product or services again. In
this context, satisfaction is defined as a feeling of pleasure of having or achieving a
need, desire, demand or expectation (Magesh, 2010).
Various constructs of customer satisfaction are divided into outcomes and processes
(Yi, 2000). Outcomes refer to the emotional reaction to an accumulated experience
of purchase transactions while processes refer to the assessment that a given
consumption is perceived to have met or exceeded some priori comparative
standard of comparison (Spreng, MacKenzie, & Olshavsky 1996). Cronin, Brady, &
Hult (2000); Mittal & Kamakura (2001) stated that customer satisfaction leads to a
customer‟s personal decision in future consumption and share their positive
experiences with others. In contrast, the combined effect of negative word-of-mouth,
switching and reduced consumption will adversely affect the performance of the
bank. Therefore, organizations have to exert continuous effort to meet or exceed the
expectation of customers and ultimately promote their satisfaction and loyalty.
3.4.5. Customer Loyalty
Customer loyalty has been a real concern in banking to professionals because of
serious rivalry and higher client expectations (Wasif, Sajid, Shahid, & Ahmad, 2015.).
Customer loyalty was defined from the behavioural and attitudinal perspectives. The
behavioural dimension of customer loyalty was characterized in terms of the
consumption probability, repeat purchase behaviour, and recommend to relatives
and friends (Dick & Basu, 1994; Zeithaml, et al., 1996; Reichheld, 2000; Pritchard &
Silvestro, 2005; Eshghi et al., 2007).
However, researchers indicated a problem with the behaviour-based loyalty measure
when actual repurchase conduct is not an outcome of an emotional commitment to a
product or service. For example, purchase behaviour may be affected as a result of

65
restrictions imposed in the market or absence of a supplier (Caruana, 2002). Dick &
Basu (1994) also asserted that loyalty built on false behavioural disposition fades
away in the event an alternative offers a better deal. Therefore, according to this
point of view, loyal behaviour cannot offer an eternal cause of loyalty.
The attitudinal perspective believes that customer loyalty is an attitude that inspires
behaviour towards repeated and steady purchases of a product or service in spite of
the potential contending marketing influences which might give rise to change
behaviour. Among the factors that influence customer loyalty are image (Tu, Wang &
Chang, 2012), trust, and service quality (Boohene & Agyapong, 2011). The
attitudinal approach assumes customer loyalty from the point of psychological
association (cognitive and emotional association) towards particular products or
services (Jahanshahi et al., 2011). Liu-Thompkins & Tam (2013) defined attitudinal
loyalty as a favourable evaluation that is held with sufficient strength and stability to
promote a repeatedly favourable response towards a product/service. In other
words, attitudinal loyalty reflects the psychological bond towards the product or
service of a company. Hence, attitudinal loyalty signifies both higher repurchase
intention and refusal to shift or have a negative intention towards a brand or service.
3.5. Hypotheses Development:
Previous studies have provided some empirical support and theoretical backing that
profitability, customer loyalty, customer satisfaction, service quality, and employee
satisfaction are likely to be associated with one another. This was tested among
others in the works of Yee, Yeung, & Cheng (2011). Then, the relevant theories and
empirical studies on the interrelationships of internal-service quality, employees‟ job
satisfaction, quality service, customer satisfaction, customer loyalty and profitability
are discussed as follows to formulate the hypotheses.
3.5.1. The Relationship between Internal Service Quality and Employee
Job Satisfaction:
The relationship between internal service quality/marketing and employee job
satisfaction is grounded on the contributions of various theories such as Alderfer's
66
ERG Theory (1969), Adam‟s Equity theory (1963, 1965), Vroom‟s Expectancy
Theory (1964), and Lock‟s Goal Theory (1968) and the Social Exchange Theory
(Blau, 1964, Cropanzano & Mitcchell, 2005).
Alderfer's ERG Theory (1969) condensed Maslow‟s Maslow‟s Hierarchy of Needs
into three basic needs (Existence, psychological and self-esteem, and Growth). The
theory considered the human motivation in the workplace to understand what
constitutes job satisfaction, identify incentives and improve performance in the
workplace (Ivancevich, et al., 2007). Arnolds & Boshoff (2002) concluded their study
suggesting to management to devise strategies to address the motivational needs of
the front line employees in order to improve their job performance and build the
reputation from the customers.
Adam‟s Equity theory (1963, 1965), Vroom‟s Expectancy Theory (1964), and Lock‟s
Goal Theory (1968) are cognitive theories or value theories of motivation that
attempt to describe the level of effort people perceive they put into work for the
rewards they receive as well as other variables that influence employee job
satisfaction
Equity Theory perceives satisfaction or dissatisfaction as a consequence of the
feeling of fairness or inequity in relationships (Adams, 1965) and this emerges from
social comparisons (Redmond, 2010). Vroom (1964) states personal characteristics
and work environment contribute to job satisfaction. This theory assumes that
employee effort leads to performance and performance leads to rewards. Spector
(1997; 1985) describes job satisfaction as the feeling about the job or an attitude
towards one‟s job which could be measured by the dimensions of equity in
compensation, promotion, relations with supervision, policies and procedures,
relations with co-workers, nature of work, and communication
The expectancy theory and equity theory represent both a cognitive approach to
motivation. In both cases, it is about dealing with individuals‟ motivation when they
perceive their efforts will lead to the reward they expect. It is about the valence of
67
rewards - if employees do perceive their efforts will pay off (effort – reward
relationship), they will be more inclined to adjust their behaviour positively.
Locke‟s (1968) Goal Setting Theory states that goals lead towards improvement in
employee performance and considered satisfaction as the difference between an
employee‟s perception and expectation in a job (Khan & Mansoor, 2013). Locke
(1976) claimed that employees are satisfied with their jobs when they are positively
influenced by the work content, the work itself, salary, recognition, achievement and
a sense of opportunities for success of the job.
The Social Exchange Theory emerged as a concept for understanding workplace
behaviour and is known for connecting such disciplines as social psychology
(Cropanzano & Mitcchell, 2005; Smith, Mackie, & Claypool, 2015) and sociology
(Blau, 1964). The social exchange theory involves a sequence of interactions that
generate obligations and these interactions are usually seen as interdependent and
contingent on the actions of another person. Besides, the theory emphasizes that the
interdependence of transactions has the potential to generate high-quality
relationships among the participants involved (Cropanzano & Mitchell, 2005).
The Social Exchange Theory asserts that the employer strives to setup constructive
relations with employees with an anticipated reciprocal positive contribution of the
employees to the firm. In other words, customer service quality is believed to
improve if employees are kept satisfied. Therefore, it is important for policy makers
and managers to focus their attention to maintain the job satisfaction of their
employees.
The SPC advocates that employee satisfaction with the job leads to employees
remaining in their job for longer (Heskett et al., 1997; Parish et al., 2008).and Heskett
et al. (1994) noted that satisfaction in the job marks the intention to remain in the job
and that these intentions impact behaviour, employee retention or loyalty.
Various studies have been carried out on the relationship of internal service quality
on employee satisfaction, but there is a diversity of opinion on the dimensions of
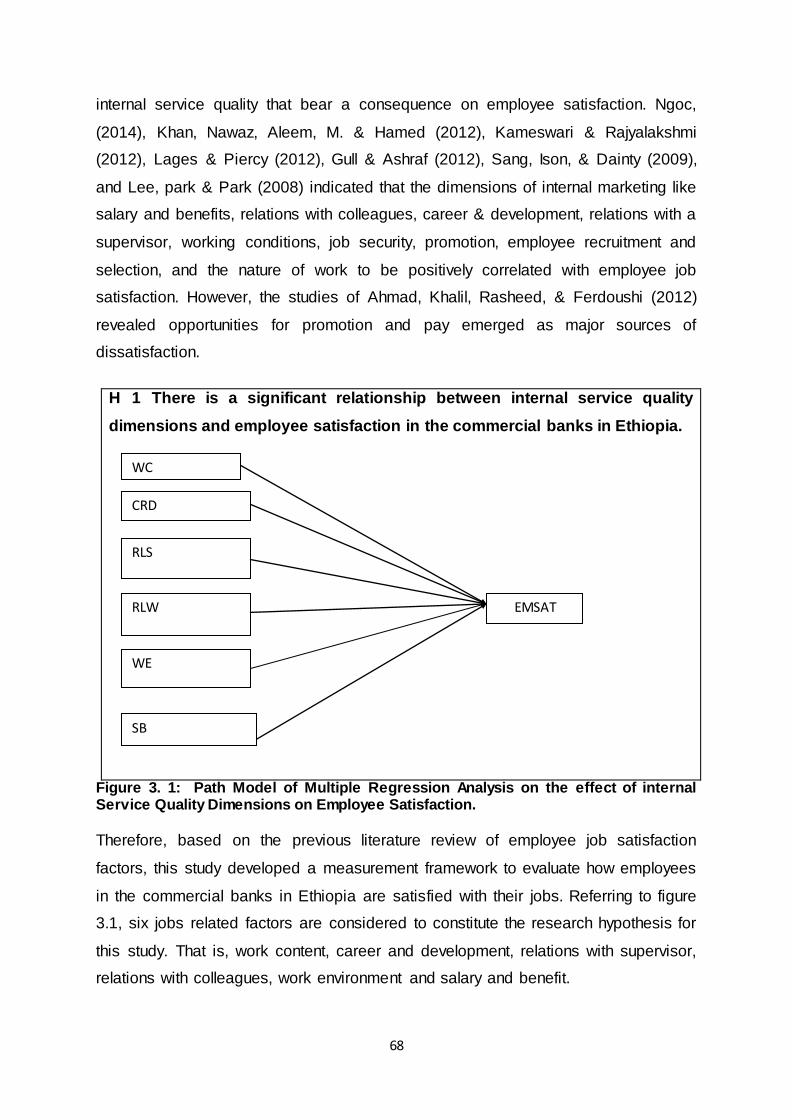
68
internal service quality that bear a consequence on employee satisfaction. Ngoc,
(2014), Khan, Nawaz, Aleem, M. & Hamed (2012), Kameswari & Rajyalakshmi
(2012), Lages & Piercy (2012), Gull & Ashraf (2012), Sang, Ison, & Dainty (2009),
and Lee, park & Park (2008) indicated that the dimensions of internal marketing like
salary and benefits, relations with colleagues, career & development, relations with a
supervisor, working conditions, job security, promotion, employee recruitment and
selection, and the nature of work to be positively correlated with employee job
satisfaction. However, the studies of Ahmad, Khalil, Rasheed, & Ferdoushi (2012)
revealed opportunities for promotion and pay emerged as major sources of
dissatisfaction.
H 1 There is a significant relationship between internal service quality
dimensions and employee satisfaction in the commercial banks in Ethiopia.
Figure 3. 1: Path Model of Multiple Regression Analysis on the effect of internal Service Quality Dimensions on Employee Satisfaction.
Therefore, based on the previous literature review of employee job satisfaction
factors, this study developed a measurement framework to evaluate how employees
in the commercial banks in Ethiopia are satisfied with their jobs. Referring to figure
3.1, six jobs related factors are considered to constitute the research hypothesis for
this study. That is, work content, career and development, relations with supervisor,
relations with colleagues, work environment and salary and benefit.
WC
CRD
RLS
RLW EMSAT
WE
SB
69
Further, the following sub hypotheses were drawn based on the Social Exchange
Theory and the established relationship from the literature between the various
internal marketing dimensions and employee job satisfaction:
H 1-2 Career & development (CRD) has a significant effect on service quality.
H 1-3 Relationship with supervisors (RLS) has a significant effect on employee
satisfaction.
H 1-4 Relationship with co-workers (RLW) has a significant effect on employee
satisfaction.
H 1-5 Workplace environment (WE) has a significant effect on employee satisfaction.
H 1-6 Salary and benefits (SB) have a significant effect on employee satisfaction.
3.5.2. The Relationship between Employee Satisfaction and Customer
Service Quality (Internal Business Process Perspective)
Consequent to the changes in the global economy from the industrial–based to
knowledge–based industries, quality has become a major competitive advantage of
the industries and employees have been acknowledged since then as the key
resource and players in the production of quality products or services.
The fundamental assumption of equity in social exchanges is that people expect
social justice or equity to prevail in interpersonal transactions (Cropanzano, Rupp, &
Byrne, 2003). The social exchange theory posits that an employer takes care of
employees through provision of conducive working environment that make its service
employees satisfied and reciprocally be committed to achieve the objectives of the
organization (Flynn, 2005; Cropanzano & Mitchell, 2005) leading to a higher level of
service quality. Reciprocal interdependence emphasizes on contingent interpersonal
transactions, whereby an action by one party leads to a response by another. In
other words, interdependence exists because an exchange requires a bidirectional
transaction. Reciprocal relationships evolve over time into trust, loyalty, and joint
commitments from both the employer and employees (Cropanzano & Mitchell 2005).
70
Empirical studies suggest that employee satisfaction plays a key role in improving
employee retention, enhancing productivity, increasing customer satisfaction,
reducing turnover, recruiting, and training costs (Meena & Dangayach, 2012). The
rational for this argument is based on the assumption that employees taken care of
by their organization will reciprocally take care of the customers. As discussed on
earlier (sub heading 3.5.1. Internal marketing) taking care of employees can be
defined as providing among others better compensation, training and development,
and making employees feel secure.
The survey, conducted by Gull & Ashraf (2012) showed moderately positive impact
of internal marketing on service quality. Satisfaction with work and work environment
induces employees to be committed to their organizations, lower the intent for
withdrawal; and engage in all means for provision of quality goods or services for
their customers (Christina and Gursoy, 2009; Steven and Lam, 2008; Yee, et al.,
2008; Yee, et al., 2010). Factors such as the work content, co-workers, work
environment, management, opportunities for career and development, and salary
and benefits can broadly influence positively or negatively employee job satisfaction
(George, Louw, and Badenhorst, 2008; Kim and Han, 2013). However, the findings
of Kim and Han (2013) indicated that performance assessments, relationships with
co-workers, and pay had significant effects on service quality, whereas supervisor
relationships, job content, and workplace environments had no significant effects.
Yet, their studies concluded that job dissatisfaction leads to loss of loyalty, increased
absenteeism, and increase the number of accidents while the reverse leads to
employee satisfaction.
The learning and growth dimension of the BSC emphasises on employee
satisfaction as a necessary condition for the prevalence of quality services/products,
customer satisfaction, customer loyalty and attainment of ultimate organizational
goals (Cohen, Gan, Yong, & Chong, 2007). In other words, the notion behind
satisfying the needs of internal customers emanates from the desire of the firm to
deliver quality products/services and satisfy external customers. This perspective
intends to measure the key aspects by which an organization meets the expectations
of customers and shareholders. It identifies the critical processes, skills,
71
competencies and technologies that will add value to the expectation of the
employees and the ultimate success of the firm through customer satisfaction.
H2: There is a significant association between internal service
quality/employee satisfaction dimensions and customer service quality in
the commercial banks in Ethiopia.
Figure 3. 2: Path Model of Multiple Regression Analysis of the effect of internal Service Quality Dimensions of Service Quality.
Customer service employees are the key actors who are faced with the challenges
posed by customer interaction. Therefore, employees‟ perceptions of service delivery
should receive more attention as they are the ones that can judge the quality of
service that they deliver. In this regard, Lages & Piercy (2012), Sergeant & Frenkel
(2000), Malhotra & Mukherjee (2004) focussed their study on investigating the
drivers of employee initiatives in the service development process. The results of
their study indicated the ability to comprehend the needs of customers,
organizational commitment and job satisfaction as the source of front line employee
innovative approach to produce quality products or services.
Thus, based on the principle of reciprocity in the social exchange theory and the
empirical studies, the major hypothesis H-2 depicted on the model in figure 3-2, the
following sub hypotheses were established to be tested.
WC
CRD
RLS
RLW SQ
WE
SB
72
H 2-1: Satisfaction with supervisors has a significant positive effect on service
quality.
H 2-2: Satisfaction with career & development has a significant positive effect on
service quality.
H 2-3: Satisfaction with co-workers has a significant positive effect on service quality.
H 2-4: Satisfaction with job content has a significant positive effect on service quality.
H 2-5: Satisfaction with pay and benefits has a significant positive effect on service
quality.
H 2-6: Satisfaction with workplace environments has a significant positive effect on
service quality.
3.5.3. The Relationship between Employee Satisfaction and Customer
Satisfaction
The quality of services provided to customers is determined by the attitude and
behaviours of the employees. In this regard, the theory of emotional contagion has
been used in marketing research to explain the link between employee job
satisfaction and customer satisfaction (Homburg & Stock, 2004). Emotional
contagion is defined as the tendency of a person to automatically mimic and
correspond expressions, postures, and communication with another person and
consequently bond emotionally (Hatfield, et al., 1994). The theory explains the
linkages between employees‟ internal stimuli (cognitions, emotions, mental states,
etc) and the responses reflected in their work environment, thereby leading to a
better performance (e.g., Wangenheim et al 2007; Homburg & stock 2004, and Pugh
2001). The emotional contagion theory claims that the reciprocal relationship from
employee to customer and from customer to the employee with the outcome
expected in terms of satisfaction or dissatisfaction. When the employers are aware of
and respond to the needs of their employees, customers will ultimately be satisfied
consequent with the emotional responses of the employees (Zeithaml et al., 1988).
Loyal customers sustain an emotional connection with the organization via the
service encounters. Satisfied and loyal employees are necessary for better customer
73
service quality and maintain an emotional connection with the organization for which
they work (Christina & Gursoy, 2009).
In the studies carried out in the area of employee-customer satisfaction, the service-
profit chain model (Heskett, et al., 1994; 1997) is a popular conceptualization which
holds several relationships between employee satisfaction, customer loyalty and
company performance. Heskett, et al., 1994 proposed the idea of the service profit
chain that underscores the significance of employee commitment to deliver high
levels of service quality to satisfy customers, and in turn increase organizations
performance. Studies of Matzler & Renzl (2007); Yee, et al., 2010) showed a positive
relationship between employee satisfaction and customer satisfaction that could lead
to a productive and profitable relationship. That is, employees who are willing to work
together, able to work beyond expectations, and put themselves loyal to the
organization tend to work more efficiently, provide better services and, therefore,
create higher customer satisfaction thereby leading to customer loyalty.
Employee satisfaction has also been found to be influential on customers‟
satisfaction and customers‟ satisfaction has been found to be positively related to
financial performance (Christina & Gursoy, 2009, Koys, 2001, Steven & Lam, 2008,
Tornow & Wiley, 1991; Yee, et al., 2008).
Put the other way, Homburg & Stock (2004) found in their study that the level of job
stress as negatively correlated to the employee's job satisfaction. Thus, a highly
dissatisfied employee exhibits a high level of emotional tension expressed through
different observable behaviours. Such tension affects the perception of customers
(Yee et al., 2011) which ultimately leads to customer dissatisfaction.
Therefore, hypothesis H-3 was formulated based on the theoretical approach,
empirical findings and the model in figure 3:3. In other words, the hypothesis was
based on the emotional contagion theory, attitude theory, social exchange theory
and the empirical studies, the following sub hypotheses were established to be
tested.

74
H 3-1: Satisfaction with supervisors has a significant positive effect on service
quality.
H 3-2: Satisfaction with career & development has a significant positive effect on
service quality.
H 3-3: Satisfaction with co-workers has a significant positive effect on service quality.
H 3-4: Satisfaction with job content has a significant positive effect on service quality.
H 3-5: Satisfaction with pay and benefits has a significant positive effect on service
quality.
H 3-6: Satisfaction with workplace environments has a significant positive effect on
service quality.
H3: H3. There is a significant relationship between internal service
quality/employee job satisfaction dimensions and customer satisfaction in
the commercial banks in Ethiopia.
Figure 3. 3: The Path Model of Multiple Regression Analysis on the effect of employee satisfaction on Customer Satisfaction:
3.5.4. The Relationship between Customer Service Quality and Customer
Satisfaction
Service quality is a service that can meet the needs or expectations of the customer.
In other words, service quality is characterized in terms quality processes and quality
WC
CRD
RLS
RLW
Customer satisfaction
WE
SB
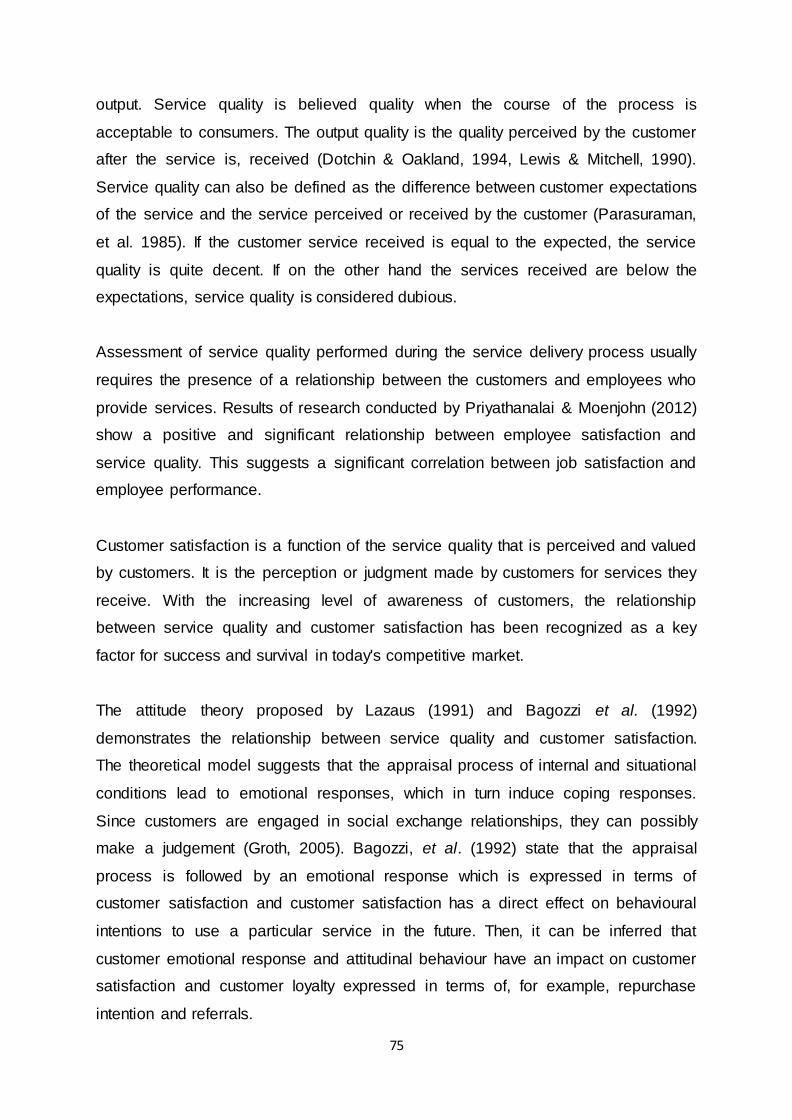
75
output. Service quality is believed quality when the course of the process is
acceptable to consumers. The output quality is the quality perceived by the customer
after the service is, received (Dotchin & Oakland, 1994, Lewis & Mitchell, 1990).
Service quality can also be defined as the difference between customer expectations
of the service and the service perceived or received by the customer (Parasuraman,
et al. 1985). If the customer service received is equal to the expected, the service
quality is quite decent. If on the other hand the services received are below the
expectations, service quality is considered dubious.
Assessment of service quality performed during the service delivery process usually
requires the presence of a relationship between the customers and employees who
provide services. Results of research conducted by Priyathanalai & Moenjohn (2012)
show a positive and significant relationship between employee satisfaction and
service quality. This suggests a significant correlation between job satisfaction and
employee performance.
Customer satisfaction is a function of the service quality that is perceived and valued
by customers. It is the perception or judgment made by customers for services they
receive. With the increasing level of awareness of customers, the relationship
between service quality and customer satisfaction has been recognized as a key
factor for success and survival in today's competitive market.
The attitude theory proposed by Lazaus (1991) and Bagozzi et al. (1992)
demonstrates the relationship between service quality and customer satisfaction.
The theoretical model suggests that the appraisal process of internal and situational
conditions lead to emotional responses, which in turn induce coping responses.
Since customers are engaged in social exchange relationships, they can possibly
make a judgement (Groth, 2005). Bagozzi, et al. (1992) state that the appraisal
process is followed by an emotional response which is expressed in terms of
customer satisfaction and customer satisfaction has a direct effect on behavioural
intentions to use a particular service in the future. Then, it can be inferred that
customer emotional response and attitudinal behaviour have an impact on customer
satisfaction and customer loyalty expressed in terms of, for example, repurchase
intention and referrals.

76
A large number of researchers have hypothesized that service quality leads to
customer satisfaction (Parasuraman et al., 1988, Cronin & Taylor, 1992, Oliver,
1999, Anderson and Sullivan, 1994, Heskett, et al., 1994, 1997, Babakus, Bienstock,
& Scotter, 2004, Steven & Lam, 2008, Christina & Gursoy, 2009, Yee, et al., 2010,
Cheng & Abdul Rashid, 2013, Abd-El-Salam, Shawky, & El-Nahas, 2013) and
conclude as the success of marketing strategy (Wong, Rexha, & Phau, 2008).
The most pronounced SERVQUAL model was developed by Parasuraman et al,
(1988) designed to measure customer service quality dimensions of tangibles,
reliability, responsiveness, assurance and empathy. They believe that customer
satisfaction is the result of customers‟ evaluation and judgement of prior
expectations and actual use. The SERVQUAL is advanced in line with the underlying
psychological state of understanding customer satisfaction. An individual‟s prior
expectation of quality may vary, but as long as the psychological judgment of
satisfaction exists, it can be measured through systematic methods.
The customer perspective of the BSC model also emphasises on the perception of
quality products and services that meet the expectations of customers and ultimately
lead to the financial performance of an organization (Al Sawalqa, et al., 2011). The
customer-value propositions represented by quality product/service are the core of
any business strategy that makes the difference from its competitors (Kaplan &
Norton, 2001).
Empirical studies have shown the relationship of service quality dimensions to
customer satisfaction. Khan & Fasih (2014) conducted their studies on the difference
in the impact of service quality on customer satisfaction between public and private
banks in Pakistan. Results indicate that all dimensions of service quality have a
significant and positive association with customer satisfaction on both public and
private banks. However, studies of Gorji & Sargolzaee (2011) show a significant
difference in the relationship between service quality and customer satisfaction in the
public and private sector. To Naeem, Akram, & Saif, (2011) service quality is a
strong predictor of customer satisfaction in case of the foreign banks compared to
the public sector banks.

77
H 4: customer service quality in commercial banks in Ethiopia positively
affects customer satisfaction.
Figure 3. 4: The Path Model of Multiple Regression Analysis on the effect of Service Quality on Customer Satisfaction:
Wilson, Zeithaml, Binter, & Gremle (2008) state that service quality is a focused
evaluation that reflects the customer‟s perception of reliability, assurance,
responsiveness, empathy and tangibility while satisfaction is more inclusive and it is
influenced by perceptions of service quality, product price situational factors and
personal factors. Karim & Chowdhury (2014); Lau & Lam (2013); and Ojo (2010)
conducted their studies on the interrelationships between service quality and
customer satisfaction in the banking sector in Bangladesh, and Hong Kong
respectively and Mobile Telecommunication Network in Nigeria. The results of their
studies indicated a positive relationship between the five SERVQUAL dimensions
(tangibility, reliability, responsiveness, assurance and empathy) and customer
satisfaction. Further, the studies indicated that the SERVQUAL model could be
adopted in different countries and different service organizations. Yet, Kim and Han
(2013) show only tangibility and reliability among the dimensions of service quality
which have positive effects on customer satisfaction.
Then, on the basis of the empirical studies, the theoretical arguments, and the major
hypothesis in the conceptual framework on figure 3:4, the following sub hypotheses
TANGIBLES
RELIABILITY
RESPONSIVNESS
CUSTOMER SATISFACTION
ASSURANCE
EMPATHY

78
were formulated on the premises that quality dimensions affect customer
satisfaction.
H 4-1: Empathy (EM) has a positive effect on customer satisfaction.
H 4-2: Responsiveness (RES) has a positive effect on customer satisfaction.
H 4-3: Tangibility (TA) has a positive effect on customer satisfaction.
H 4-4: Reliability (REL) has a positive effect on customer satisfaction.
H 4-5: Assurance (AS) has a positive effect on customer satisfaction
3.5.5 The Relationship between Customer Satisfaction and Customer
Loyalty:
Customer loyalty was characterized from the behavioural and attitudinal stances.
The behavioural dimension of customer loyalty was characterized in terms of the
consumption probability, repeat purchase behaviour, and recommend to relatives
and friends (Dick & Basu, 1994; Zeithaml, et al., 1996; Reichheld, 2000; Eshghi et
al., 2007).
The service management and marketing literature have given rise to the impression
that satisfied customers are loyal customers. Loyalty arises when a customer‟s
perception of the service is valued more than the expectation (Heskett et al., 1994;
Zeithaml et al., 1996). In this regard, Lin & Wang (2006) state loyalty of customers as
a key factor in maintaining competitive advantage and Chen & Hu (2010) stress the
need to comprehend customer desires as a necessary condition for adopting
strategic policies that could help in winning customer loyalty. Customer loyalty is
reflected in behaviours such as continuing relationship, repeat purchases, and
recommendation.
Early empirical studies have recognised a positive causal relationship between
customer satisfaction and customer loyalty (Reichheld & Sasser, 1990, Fornell,
1992, Siddiqi, 2011, Abd-El-Salam e al., 2013, Cheng & Abdul Rashid, 2013, Khan
et al., 2012, Mohsan, Nawaz, Khan, Shaukat, & Aslam, 2011, & Pan, Sheng & Xie,
2011) claim a strong relationships between customer satisfaction and loyalty and
conclude that a firm can develop long lasting and profitable relationship with

79
customers by building loyalty of customers. Khan et al., (2012) conclude satisfied
customers tend to repurchase and further recommend new customers consequent to
their satisfaction with the goods or services. Siddiqi (2011) identifies the most
important drivers of customer loyalty and the interrelationships between service
quality, customer satisfaction, corporate image, customer value and customer loyalty
in the retail banking sector in Bangladesh. Siddiqi concludes customer satisfaction
as the most important driver of customer loyalty and a means of retaining existing
customers in the retail banking sector in Bangladesh. This implies that unsatisfied
customers would not be expected to have long run relationships with a firm.
On the contrary, other studies indicate that high customer satisfaction does not
always indicate high loyalty (Bae, 2012, Oliver 1999, Seiders, Berry, & Gresham,
2000). In other words, customers‟ satisfaction is not necessarily sufficient to
guarantee for loyalty (Mohsan, et al., 2011, Reichheld 1996, Kamakura et al. 2002).
That is, a positive relationship between customer satisfaction and loyalty applies in
some situations, but not for all conditions. Consequently, satisfied customers may
defect as the case may be (Reichheld, 1996).
Service quality is also a commonly cited as an antecedent to loyalty (Caruana,
2002). The findings of Kheng et al. (2010) indicate that reliability, empathy, and
assurance have a significant effect on customer loyalty. Interpersonal relationships
between employees and customers are also considered as important factors for the
development of customer loyalty (Gremler & Brown, 1996, and Peter, 2014). Gremler
and Brown define interpersonal relationship as the degree to which customers
perceive having a personal and sociable relationship with customer service
employees, including customer feelings of familiarity, care, friendship,
understanding, and trust. Switching cost is also considered by many researchers as
an important determinant of customer loyalty (Beerli, Martin, & Quintana, 2004, &
Deng, Lu, Wei, & Zhang, 2010). Therefore, having a loyal customer base indicates
an opportunity to be tapped as it is less costly to retain and serve loyal customers
than to attract new ones.
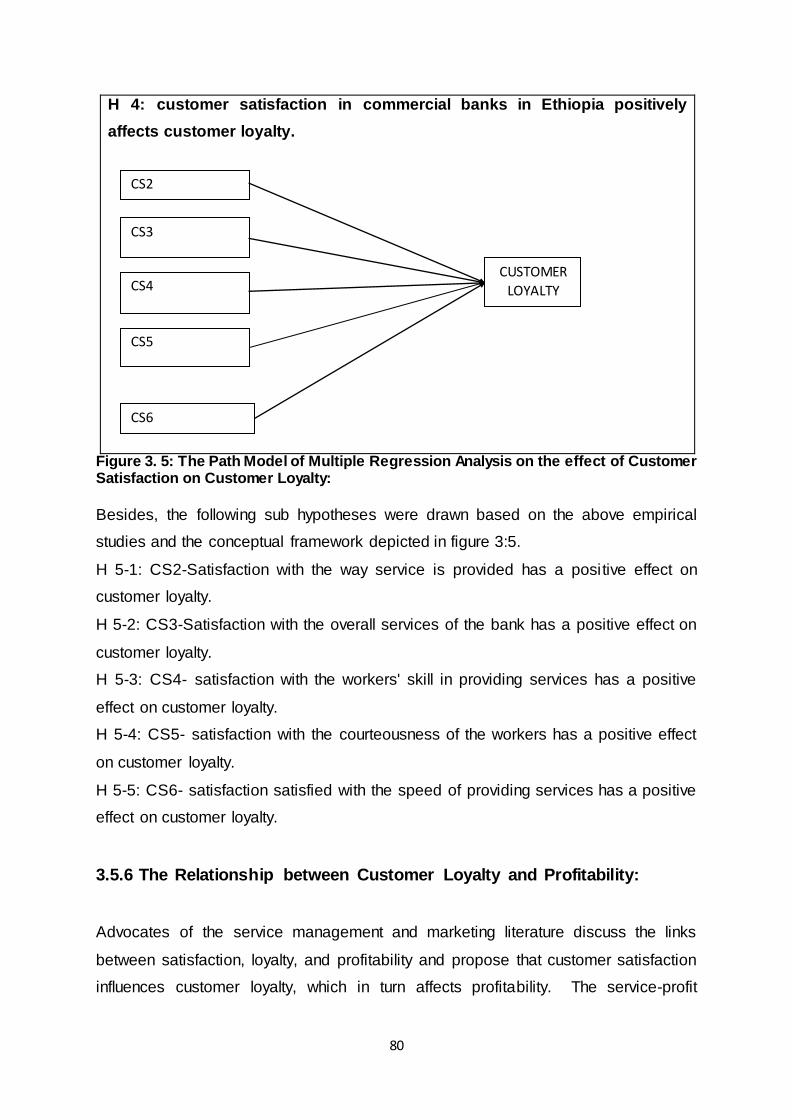
80
H 4: customer satisfaction in commercial banks in Ethiopia positively
affects customer loyalty.
Figure 3. 5: The Path Model of Multiple Regression Analysis on the effect of Customer Satisfaction on Customer Loyalty:
Besides, the following sub hypotheses were drawn based on the above empirical
studies and the conceptual framework depicted in figure 3:5.
H 5-1: CS2-Satisfaction with the way service is provided has a positive effect on
customer loyalty.
H 5-2: CS3-Satisfaction with the overall services of the bank has a positive effect on
customer loyalty.
H 5-3: CS4- satisfaction with the workers' skill in providing services has a positive
effect on customer loyalty.
H 5-4: CS5- satisfaction with the courteousness of the workers has a positive effect
on customer loyalty.
H 5-5: CS6- satisfaction satisfied with the speed of providing services has a positive
effect on customer loyalty.
3.5.6 The Relationship between Customer Loyalty and Profitability:
Advocates of the service management and marketing literature discuss the links
between satisfaction, loyalty, and profitability and propose that customer satisfaction
influences customer loyalty, which in turn affects profitability. The service-profit
CS2
CS3
CS4 CUSTOMER
LOYALTY
CS5
CS6

81
chain model (Heskett et al., 1997) establishes the relationships between a firm‟s
profitability and customer loyalty.
Anderson & Sullivan. (1994), Heskett et al. (1994), Reicheld & Sasser (1990), Rust,
& Zahorik (1993), and Zeithaml et al., (1996) find customer satisfaction as an
antecedent of customer loyalty significantly and positively influences profitability.
Nelson et al. (1992) establish the relationship of customer satisfaction to profitability
among hospitals. Zafar, et al (2012), Rust & Zahorik (1993) analysed the impact of
customer satisfaction on customer loyalty and ultimately profitability in the context of
the banking sector. Chi & Gursoy, (2009), Zhang & Pan (2009), and Xu &
Goedegebuure (2005) also establish a positive and significant relationship between
customer satisfaction, customer loyalty, and profitability. Studies of Nadem &
Ekpenyong (2013) reveal a strong relationship between customer behaviour and
customer profitability; modest links between repurchase intentions and subsequent
behaviour; and a weak and non-significant direct link between customer satisfaction
and customer profitability. Gupta and Zeithaml (2006) disclose a strong impact of
customer satisfaction on financial performance. Fornell, Johnson, Anderson, Cha,
and Bryant. (1996) state the relationship of customer satisfaction to the market value
of equity. Yee, Yeung, and Cheng (2010) examined the relationships among
employee satisfaction, service quality, customer satisfaction, and firm profitability.
The findings indicate the significant role of employee satisfaction in improving
service quality and customer satisfaction, while customer satisfaction in turn
influences a firm‟s profitability. They also found that firm profitability has a modera te
effect on employee satisfaction. On the contrary, Tornow & Wiley (1991) found a
negative correlation between customer satisfaction and gross profits.
82
H 6. Improvement in customer loyalty significantly improves the financial
performance of the commercial banks in Ethiopia.
Figure 3. 6: The Path Model of Multiple Regression Analysis on the effect of Customer Loyalty on Profitability:
On the other hand, the researchers also suggest the uncertainty in the direct link
between customer satisfaction and a firm‟s profitability (Eccles & Pyburn, 1992).
Bernhardt et al., (2000) observe no significant relationship between customer
satisfaction and financial performance in their studies on consumer and employee
responses on services of the restaurant. However, the researchers conclude the
impact of an increase in customer satisfaction on profits is likely to be significantly
positive in the long run even if it is obscured in the short run. Expressed differently,
past satisfaction has a positive effect on current profitability, and past profitability
affects current satisfaction (Rust, Moorman & Dickson, 2002, Guo, Kumar, &
Jiraporn, 2004).
Therefore, the mixed results in the above discussion induced the need for further
study based on the hypothesis framed in figure 3:6.
3.6. Summary of the Chapter
The chapter covered the empirical studies on profitability and the multiple
antecedents of measures of performance. Having an overview of the impacts of non-
financial variables on performance measures, the conceptual definitions of internal
service quality, employee satisfaction, customer service quality, customer
satisfaction and customer loyalty were debated in depth. In the course of
investigating the interrelationships among the variables, the appropriate theoretical
grounds and empirical studies were referred to in order to draw the dimensions for
CUSTOMER LOYALTY PROFITABILITY

83
the frameworks. The chapter finally culminated by formulating the hypotheses of the
study to be tested.

84
CHAPTER 4
METHODOLOGY
4.1. Introduction
This chapter covered the research methods used to empirically test the theoretical
frameworks. The chapter outlined the research design, the methods of data
collection, the population and unit of analysis, sample size determination, the
sampling frame, source of data, instruments used in the data collection, method of
data analysis and the procedures that were used to measure the validity and
reliability of the research hypothesis.
4.2. Research hypotheses
Based on empirical findings and variant of theoretical grounds, the research
hypotheses of the present study are presented as follows:
H1. There is a significant relationship between employee satisfaction and customer
service quality in the commercial banks in Ethiopia.
H2. Customer satisfaction in the commercial banks in Ethiopia is significantly
affected by customer service quality.
H3. Improvement in customer loyalty significantly improves the financial performance
of the commercial banks in Ethiopia.
4.3 The Research Design
The research took an epistemological stance in dealing with the social phenomena
which are employee satisfaction from the perspectives of employees; and service
quality and customer satisfaction from the customers‟ point of view. The study used
cross sectional data and adopted a multivariate approach for data analysis.

85
Quantitative analysis provides objective results and ensures a lack of bias
(Creswell, 2004).
4.4 The Population and the Unit of Analysis
The data from the National Bank of Ethiopia ending June, 2013 indicated a total
number of 19 licensed banks with a network of 2,002 branches across the country
(see table 4:1). This includes three public Banks, and 16 private banks (NBE, 2013).
All the banks are specialized banks; however, the Development Bank of Ethiopia and
the Business and Construction Bank (both public banks) do not fall under the
category of commercial banks as they are set up to address specific objectives that
are not dealt with the other commercial banks. However, customers close to these
banks had the possibility being addressed in the sampling frame in the survey.
Zemen Bank, Abay Bank S.C, Addis International Bank, Berhan International Bank,
Bunna International Bank, Cooperative Bank of Oromia, Debub Global Bank, Enat
Bank, and Oromia International Bank are not within the latitude the study since they
all had no branch in the sampling area, in Tigai Region during the study period.
In order to assess the performance of any sort of financial institutions, a minimum
duration of being in operation has to be given due consideration. In this regard, the
study considered five years as an ample period for analysis of the commercial banks
in Ethiopia. Consequently, six of the private banks are not within the scope of the
study because these banks have not yet attained the minimum five years threshold
of the study period.
The banks are within a similar business environment to compete among themselves
for new customers and retention of long-standing customers. The banks are
engaged in the provision of similar service/products, operate under the same
banking regulations and protected from foreign entry in the market. Therefore, this
study focuses on perceptions of employees and customers of the banks.

86
This study addressed mainly two sectors of stakeholders (employees and
customers) believed to have a major concern with the banking sector. Therefore, the
target unit of analysis of the study is based on employees and customers from the
sample of commercial banks (Refer to appendix 4:2).
The details on the sampling frame of the employees and customers were not known.
Therefore, consequent to the difficulty of easily locating the addresses of the sample
frame, the researcher was not able to randomly select the sample respondents.
Consequently, a convenient sampling technique was employed to distribute the
survey questionnaires. The commercial banks have their respective strategies and
policies with respect to human resource policies, and customer value. This called for
adequate representation of employees and customers from each bank.
4.5 Sample Size Determination
Since the statistical population was unlimited, after reviewing available literature on
sample size determination, the researcher has identified certain scientific procedures
to determine the sample size. There are five major indicator variables in the
proposed study viz:
1) Internal marketing ,
2) Employee satisfaction,
3) Service quality,
4) Customer satisfaction,
5) Customer loyalty, and
6) Profitability.
Tabachnick & Fidell (2007) state that N should ideally be 50 + 8(k) for testing a full
regression model or 104 + k when testing individual predictors.
Where n = the lower bound sample size
r = the ratio of indicators of latent variables
k = the number of latent variables
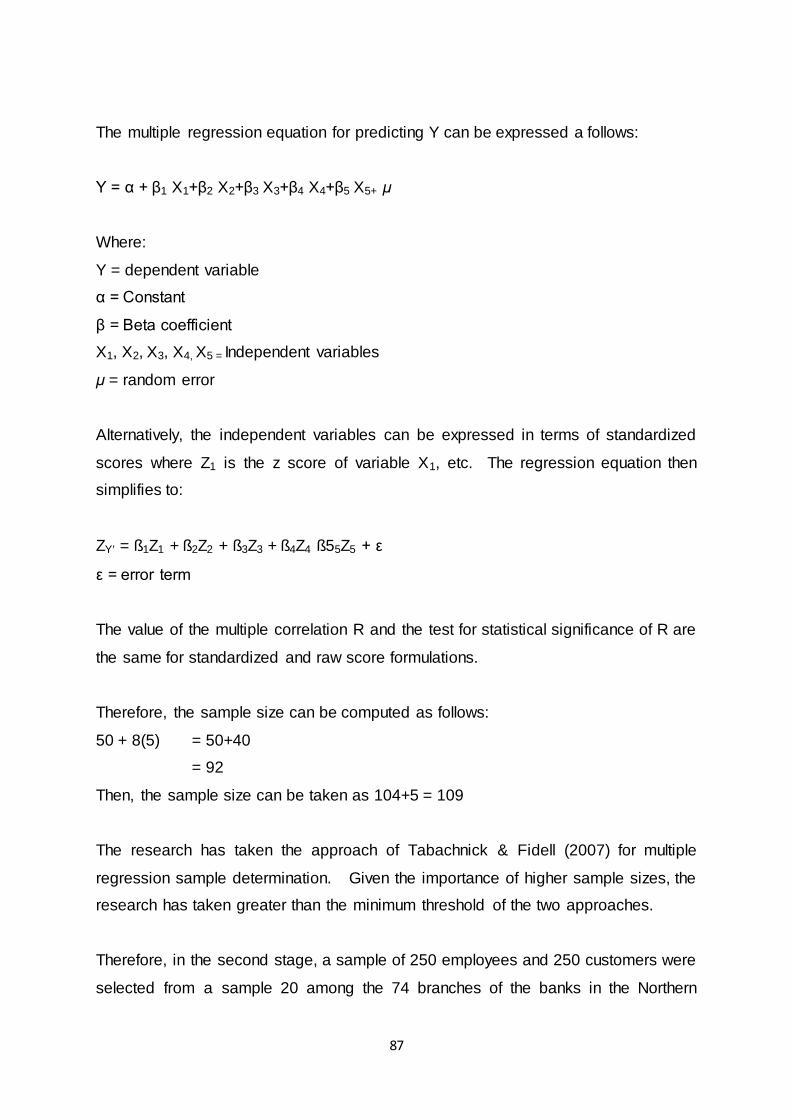
87
The multiple regression equation for predicting Y can be expressed a follows:
Y = α + β1 X1+β2 X2+β3 X3+β4 X4+β5 X5+ μ
Where:
Y = dependent variable
α = Constant
β = Beta coefficient
X1, X2, X3, X4, X5 = Independent variables
μ = random error
Alternatively, the independent variables can be expressed in terms of standardized
scores where Z1 is the z score of variable X1, etc. The regression equation then
simplifies to:
ZY = ß1Z1 + ß2Z2 + ß3Z3 + ß4Z4 ß55Z5 + ε
ε = error term
The value of the multiple correlation R and the test for statistical significance of R are
the same for standardized and raw score formulations.
Therefore, the sample size can be computed as follows:
50 + 8(5) = 50+40
= 92
Then, the sample size can be taken as 104+5 = 109
The research has taken the approach of Tabachnick & Fidell (2007) for multiple
regression sample determination. Given the importance of higher sample sizes, the
research has taken greater than the minimum threshold of the two approaches.
Therefore, in the second stage, a sample of 250 employees and 250 customers were
selected from a sample 20 among the 74 branches of the banks in the Northern

88
Region in Tigrai using the convenience sampling method. The region is also an area
where all banks that could have been sampled at country level are in operation.
Therefore, the banks are all represented. The limitation of the sampling area to Tigrai
Region is also due to the funding and time constraints as well as owing to the
proximity and convenience of the researcher.
Table 4. 1: Summary of sample banks and branches of the commercial banks in Ethiopia.
Item
Name of bank Number of branches
Number of sampled branches
1 C.B.E. 45 10
2 Dashen Bank 5 2 3 AIB 2 1
4 LIB 8 2 5 NIB 2 1
6 United Bank 3 1 7 Abyssinia Bank 3 1
8 Wegagen Bank 8 2
Total 74 20
In view of this, a minimum of 20 employees and 20 customers were taken from each
bank. The sample employees and customers of each bank were taken in proportion
to the total number of branches considered in the study area. The variation in the
position of the sampled employees was offset within the 20 branches. With respect
to sample branch managers, it was automatically determined by selection of the
sample branches.
The branch managers of the sample branches were highly collaborative in
distributing the questionnaires to the employees. The customer respondents were
selected from the bank customers who visited the sampling locations during the
chosen time intervals and period of study. This helped to eliminate the sampling
errors and to ensure the representation of the population under study in the sample
units. To reduce any potential bias, the questionnaires were distributed during
various working hours of the working days of the banks.
Respondents were approached at each of the sample bank‟s branches po litely and
the purpose of the study was explained. Then, they were asked if they were
prepared to voluntarily fill in the questionnaire. Once they agreed to participate, they
89
then were handed over with the questionnaire to be answered either in English or in
Amharic according to their preferences. The researcher/research assistants then
refrained from any sort of interference with the respondent in order to avoid any
potential bias.
4.6 Data Source and methods of data collection
Primary data and secondary/archival data sources were used in this study for the
purpose of analysis, testing the hypothesis and answering the research questions.
Survey research through questionnaires was mainly used for collecting data on
those variables for which information is inaccessible from public sources and treated
as first hand data. Archival research was used for collecting data that tend to be
publicly available in the financial statements of the commercial banks under
consideration.
The variables and data instruments that were used to measure perceptions of
employee satisfaction, service quality, customer satisfaction, and profitability were
drawn through the well-established instruments adopted in human resources
management, psychology organisational behaviour, and organisational management
research.
4.6.1 Measurement Instruments for Primary Data Source
Likert scale (Likert, 1932) instruments were used to capture data related to the
attitudes, behaviours, and opinions of respondents. The measurement instruments
were based on the questions used to operationalise the concepts and variables
relevant to the framework models constructed and the hypotheses developed from
the literature. The instruments comprising the measurement questions for the study
appear in appendix A, provided in both English and Amharic. The primary data for
employee satisfaction (internal marketing), service quality, customer satisfaction and
customer loyalty were obtained through structured questionnaires.

90
4.6.1.1 Employee Job satisfaction measures:
Two approaches are mainly used in the literature of measuring job satisfaction. The
first one is a comprehensive approach that involves only one item in asking the
respondent directly about his or her overall feeling about the job while the second is
an approach that involves a respondent to answer on several aspects of the job that
determine the overall degree of job satisfaction. The Job Descriptive Index (Smith,
Kendall & Hulin, 1969) and the Minnesota Satisfaction Questionnaire (Weiss et al.,
1967) are most popular in using the second approach.
Smith et al., (1969) present the employee satisfaction factor in their method called
Job Descriptive Index (JDI). The Job Descriptive Index was first introduced in 1969
as a scale with five dimensions of employee job satisfaction measures, namely: the
nature of the work itself, the relationship with supervisors, opportunities for
development, relationship with co-workers, and salary and benefits. Description
Index (JDI) involve: 1) intrinsic factors involving the work-itself and advancement
opportunities, and 2) extrinsic factors including the level of compensation/salary,
supervisory support, and co-worker relations (Smith et al., 1969).
The Minnesota Satisfaction Questionnaire (Weiss et al., 1967) has also been widely
used to evaluate the degree to which employees are satisfied with their job. The
Minnesota Satisfaction Questionnaire (MSQ) is a popular measure of employee
satisfaction that conceptualizes satisfaction as being related to their job. The MSQ is
self-reported measure, suitable for individuals of all levels that can be administrated
separately or individually. The MSQ has been in use for over 30 years in a wide
range of jobs, including factory/production work, management, education (primary,
secondary, college), health care (including nurses, physicians, and mental health
workers), and banks (Hirschfeld, 2000; Yee, et el. 2011). In relation to this study,
therefore, the MSQ, is adopted as the research instrument.
The MSQ survey instrument addressed to the employees of the commercial banks
comprised two major sections with an introductory letter clarifying the purposes of
the study. The first section contained questions about the personal and demographic
profiles of the respondents such as gender, educational level, age, occupation and
91
other relevant variables. The second section gathered information about perceptions
of the employees on their job.
The instrument evaluates 36 items of job satisfaction and 6 latent variables: work
content; career and development; relationship with managers/supervisors;
relationship with co-workers; working environment; and salary and benefits. Each
item represents 1 of the 6 dimensions of latent variables. Respondents were asked
to rate their satisfaction with various aspects of their work along a 5-point Likert-type
scale, ranging from 1 = not satisfied to 5 = extremely satisfied. The Likert Scales
were used on the assumption that Likert scales produce interval data and justify a
wide range of statistical calculations, including averages, correlations, and so on.
4.6.1.2 Service quality
The survey instrument addressed to the customers comprised three major sections
with an introductory letter clarifying the purposes of the study. The first section
contained questions about the personal and demographic profiles of the respondents
such as gender, educational level, age, occupation and other relevant variables. The
second section gathers information about expectations of customers. The third
section of the customer questionnaire is meant to collect data about the perceptions
of customers.
.
The measurement of service quality within commercial banks was built on the
seminal work of Zeithaml et al. (1988) construct of the SERVQUAL model. The
SERVQUAL is a multiple-item scale for measuring consumer expectations and
perceptions of service quality (Parasuraman, et al., 1988). The gap between
expected and perceived quality is measured using a 22-item SERVQUAL scale
adapted to the banking industry. This scale has five components:
I. Tangibles,
II. Reliability,
III. Responsiveness,
IV. Assurance, and
V. Empathy.

92
The SERVQUAL questionnaires were designed on a five-point Likert - scale
anchored at 1 = totally disagree and 5 = totally agree.
.
4.6.1.3 Customer satisfaction, customer loyalty, and profitability
perception:
The survey instrument used to measure customer satisfaction involved seven items
adapted from Anber & Shireen (2011). To measure customer satisfaction, the
instrument used a five-point Likert scale anchored at 1 = very dissatisfied and 5 =
extremely satisfied. The survey instrument used to measure customer loyalty
involved four items adapted from Zeithmal et al. (1996). To measure customer
loyalty, the instrument used a five-point Likert scale anchored at 1 = very dissatisfied
and 5 = extremely satisfied. Finally, to measure profitability perception three items
were adapted from Yee, Young, & Cheng (2010) anchored on a five point Likert
scale at 1 = very high and 5 = very low.
4.6.2 Secondary data source
Secondary data were obtained from the audited financial statements of the
commercial banks involved in the study to measure profitability. Besides, journals,
periodicals, and books were used as secondary sources.
4.7. Methods of data analysis
Employee satisfaction, service quality and customers‟ satisfaction are realities that
exist outside the researcher‟s mind. Taking positivist view, the objects of
investigation (the respondents) are independent from each other and they are
investigated without being influenced by the researcher. The interaction with the
respondents is limited to mere handing of the questionnaires to respondents so as to
make the findings fully dependent on the respondents.
93
This research is a snapshot or cross-sectional and explanatory in nature because
the data were collected on the behavioural aspects of a specific period of time.
Behavioural responses are likely to change over time in either positive or negative
direction as the case may be. Besides, a significant number studies have been
conducted in a similar manner on subjects that relate to service quality, employee
satisfaction and customer satisfaction.
Multiple regression analysis is a popular statistical method used to understand how
one or more predictor variables influence the independent variable (Beckstead,
2012; Bonett & Wright, 2011). Researchers use multiple regression analysis to
understand the extent that the independent variables affect the prediction of the
dependent variable (Tonidandel & LeBreton, 2011). Researchers use other statistical
tests such as ANOVA and t-tests to test for correlation between variables (Levine,
Ramsey, & Smidt, 2001). However, regression analysis is an appropriate statistical
test to use if the goal is to assess the influence of one or more predictor variables on
the response variable (Levine et al., 2001)
To address the research, the researcher has used six models with different
dependents and explanatory variables
Model specification
The basic regression model is written as follows;
yn = α + βxn + εn (1)
Where, y denotes a dependent variable and α denotes intercept term, X represents
explanatory variables while β is regression coefficient. The basic functional form of
study models and the respective regression models are shown as follows:
Model I:
Employee satisfaction = f (Work content, Relations with supervisor, Relations with
workers, Salary& benefits, and Career & Development) (2)

94
EMSATn= α+ β1WCn+ β2RLSn+ β3RLWn + β4SBn + β3CRDn + εn (3)
Where,
EMSAT represents employee satisfaction, WC denotes work content, RLS
represents relations with supervisors, RLW is relations with workers, SB shows
salary & benefits, and CRD reflects career and development while ε is the error term.
Model II:
Service Quality satisfaction = f (Work content, Relations with supervisor, Relations
with workers, Salary & benefits, and Career & Development) (4)
SQn= α+ β1WCn+ β2RLSn+ β3RLWn + β4SBn + β3CRDn + εn (5)
Where,
SQ denotes service quality, WC represents work content, RLS depicts relations with
supervisors, RLW shows relations with workers, SB is salary & benefits, and CRD
indicates career and development while ε is the error term.
Model III:
Customer satisfaction = f (Work Content, Relations with Supervisor, Relations with
Workers, Salary & Benefits, and Career & Development) (4)
CUSATn= α+ β1WCn+ β2RLSn+ β3RLWn + β4SBn + β3CRDn + εn (5)
CS 2 (satisfaction with the way the service is provided) is a strong predictor of
customer loyalty and highest correlation is shown between between CS 3
(satisfaction with the easy access to the services of the bank) and CS 6 (satisfaction
with the speed of providing services).

95
Model IV:
Customer satisfaction = f (tangibles, reliability, responsivness, assurance and
empathy) (6)
CUSATn= α+ β1TAN+ β2RELn + β3RRESn + β4ASSn + β5EMn + εn (7)
Where,
CUSAT signifies customer satisfaction, TAN denotes tangibles, REL is reliability,
RES indicates responsiveness, ASS replicate assurance and EM designates
empathy while ε is the error term.
Model V:
Customer satisfaction = f (satisfaction in dealing with the bank, satisfaction with the
way service is provided, satisfaction with the easy access to the services of the
bank, satisfaction with the workers‟ skills in providing services, satisfaction with
courteousness of workers, satisfaction with the speed of providing services, and
satisfaction with the facilities and materials the bank provides). (8)
CUSATn= α+ β1CS1n+ β2CS2n+ β3CS3n + β4CS4n +......+ β7CS7n + εn (9)
Where,
CUSAT signifies customer satisfaction, CS1 denotes satisfaction in dealing with the
bank, CS2 indicates satisfaction with the way service is provided, CS3 portays
satisfaction with the easy access to the services of the bank, CS4 deals with
satisfaction with the workers skills in providing services, CS5 shows satisfaction with
courteousness of workers, CS6 denotes satisfaction with the speed of providing
services, and CS7 identifies satisfaction with the facilities and materials the bank
provides) while ε is the error term

96
Model VI:
Profitability = f (satisfaction with the over all service of the bank, saying good things
about the bank, continue using service of the bank, and recommend the bank to
relatives and friends) (10)
PPn= α+ β1CL1n+ β2CL2n+ β3CLn + β4CLn + εn (11)
Where,
PPn represents overall profitability, CL1 denotes satisfaction with the over all service
of the banks, CL2 denotes to say good things about the bank, CL3 indicates
continue using service of the bank, and CL4 signifies recommending the bank to
relatives and friends whereas ε is the error term.
4.8. Chapter summary
This chapter extensively discussed on the epistemological approach of the study, the
population and unit of analysis, sample size determination, sampling frame, data
source measurement instruments, and method of data analysis. The research
was based on a survey and archival data. A sample frame of 250 customers, 250
employees and 8 commercial banks located in Tigrai Region was used. A total of
180 valid research questionnaires was collected from each customer and employee
respondents. The annual reports were used as the source of the financial data (ROA
& ROE) of the banks.

97
CHAPTER 5
DATA ANALYSIS
5.1. Introduction
Data analysis for this study was undertaken in two steps; the preliminary analysis
and the main analysis. The preliminary analysis involved mainly descriptive statistics
summarizing the demographic characteristics of the respondents. Statistical
Package for Social Sciences (SPSS) software program version 16 was used for
processing the data.
Data on the various multi-items constructs representing the different components of
internal service quality, employee satisfaction, customer service quality, customer
satisfaction, customer loyalty and profitability were first tested for reliability by
computing Cronbach‟s alpha values. Cronbach‟s alpha ranges between 0 (denoting
no internal reliability) and 1 (denoting perfect internal reliability). A reliability
coefficient above 0.70 is considered sufficient for exploratory studies (Cronbach,
1951; Nunnally, 2010; Cavana, Delahaye, & Sekaran, 2001).
Construct validity was adopted as validity measurement and factor analysis were
used to measure the construct validity (Cavana et al., 2001). Based on Hair, Black,
Babin, Anderson,and Tatham (2006), Tabachnick and Fidell (2007), and Thompson
(2004) factor analysis was conducted for the research to summarise the original
information into a smaller set of variables or factors and establish underlying
dimensions between measured variables and latent constructs.
Correlation Analysis was done to check the strength of the relationship between the
dimensions of internal service quality, employees‟ satisfaction, service quality,
customer satisfaction, customer loyalty, and profitability. Further, in order to test the
mutual relationship of variables as well as the direction of the relationship, Linear
Regression Analysis (Bivariate) was performed. Regression and ANOVA were used
to test the hypothesis with target statistical significance alpha levels of .05 which is

98
typical in most researches. Wilcoxon Signed Ranks Test and Kruskal-Wallis Analysis
of Variance was also used to test the effect of categorical demographic factors on
interval variables.
The unit of analysis were employees and customers of the commercial banks in
Ethiopia. 250 questionnaires were distributed to each of the employee and customer
categories of the commercial banks. Of the 250 distributed questionnaires, a total of
180 employees‟ and 180 customers‟ questionnaires were found valid for analysis.
The degree of response rate is an important indicator in evaluating the significance
of the research findings. When responses are obtained from a non-random group
that differs from the population in terms of the variables of interest, it is possible for
such differences to cause distortion of the „true‟ effects (Schalm & Kelloway, 2001).
There is a lack of consistency across the literature as to what rate of responses
should be considered acceptable. However, Fowler (2013) suggested 60%, and De
Vaus (2013) argued for 80% as a minimal level for response rate. Baruch and
Holtom (2008) conducted a summary analysis of a comprehensive range of
academic studies in 17 referred management and behavioural sciences journals
published in the years 2000 and 2005. The findings indicate an average response
rate of 52.7% for data collected by individuals while the average response rate of
35.7% for data collected by organizations. Therefore, drawing from the works of
Fowler (2013), De Vaus (2013) and Baruch and Holtom (2008), the response rate in
the context of this research study is 72% which is acceptable
5.2 Demographic Characteristics of Employees of the Sampled
Commercial Banks:
The descriptive analysis of the data on the demographic characteristics of the
sampled employees of the commercial banks in Ethiopia is shown in table 5:1.
Based on the analysis of the data, 56 (31.11%) and 124 (68.89%) of the 180 valid
employee respondents were drawn from public and private banks respectively.
Moreover, 57 (31.67%) and 123 (68.33%) of the employee respondents were

99
females and males respectively. Out of these, 36 female and 88 male respondents
were employees of private banks while 21 female and 35 male respondents were
from the public banks. This reflected the prevalence of male dominance in both the
private and public banks. With reference to age classification, 106 (58.9%) were in
the category of 20-30 years and 62 (34.4%) were in the age category of 31-40 years.
With respect to the service period of the employees, 59.44% of them were within a
period of 1-5 years while 26.67% were within the period of 5-10. Only 14.89% of the
respondents had a service period of above 10 years.
Table 5. 1: Summary of employee demographic statistics (N= 180)
Variable Valid Private banks Public banks Total
Cumulative
Frequency Percent Frequency Percent Frequency Percent
Gender Female 36 29.0 21 37.5 57 31.7 31.7 Male 88 71.0 35 62.5 123 68.3 100.0 Age From 20-30
year 70 56.5 36 64.3
106 58.9 58.9
From 31-40 years
45 36.3 17 30.3 62 34.4 93.3
Above 41 years old
9 7.2 3 5.4 12 6.7 100
Ed. Level Diploma & below
44 35.5 18 32.14 62 34.44 31.1
First degree & above
80 64.5 38 67.85 118 65.56 100
Job profile
Management 25 20.2 15 26.8 40 22.2 22.2
Clerical 73 58.9 29 51.8 102 56.7 82.2 Non-clerical 26 21.0 12 21.4 38 21.1 100.0
Bank ownership
Private 123 68.9 124 68.9 69.5 Public 57 31.1
56 31.1 100.0
Ser year From 1- 5 years
74 59.7 33 58.9 107 59.4 59.4
From 6-10 years
35 28.2 13 23.2 48 26.7 86.1
From 11-15 years
9 7.3 4 7.1 13 7.2 93.3
>15 years 6 4.8 6 10.7 12 6.7 100.0
Source: computed & complied from the SPSS 16 output.
The age category and the tenure of employees in both public and private banks
indicated that the majority of the staffs were in the generation of young age which
revealed an energetic workforce of the industry. Related to this, 85% of the
respondents‟ term in office did not exceed 10 years. This seems to be due to the
horizontal and vertical expansion of the banking business after the liberalization of
the economy and its impact on creating employment opportunity.

100
Regarding the educational level of qualification, 118 (65.56%) were first degree and
masters holders, while 62 (34.44%) were at the level of diploma and below. This
proportion of the employees‟ qualification indicated that the banking industry, mainly
required intellectual resources in the provision of its service operations. The
similarities between the private and public banks also indicated the degree in which
the banks intended to maintain a higher mix of intellectual staff. This was also due to
the inducements that banks generally offered to subsidize the tuition of their staff in
the course of furthering their academic career. Besides, it might also have been as
the result of the increased higher level educational opportunities have been
promoted in the country.
Finally, the job profile of the respondents indicated that 40 (22.22%), 102 (56.67%),
and 38 (21.11%) were from management, clerical, and non-clerical employees
respectively. The mix of employees‟ respondents indicated that all levels of job
designations were fairly represented in the study.
5.3. Demographic Characteristics of Customers of the Sampled
Commercial Banks
The descriptive analysis of the data on the demographic profiles of the
sampled customers of the commercial banks in Ethiopia is shown in table 5.2.
Accordingly, 43 (23.9%) and 137(76.1%) of the respondents were female and male
respectively, indicating the higher opportunity of the male to the exposure of banking
services. This may indicate the economic dominance of male over female. In terms
of age, 32 (17.8%) were in the category of 20-30 years, 48 (26.7%) in the age
category of 31-40 years and the majority of the respondents 100 (55.6 %) were
above the age of 40 years. On the issue of educational qualification, 104 (57.8%)
obtained their first degree and second degrees while 76 (42.2%) were at the level of
diploma and below.

101
Regarding the job profile, 136 (75.6%) of the respondents, were from trade &
commerce while the remaining 44 (24.4%) were employees in the private and
government sector.
Table 5. 2: Summary of the demographic statistics of customers (N= 180) Private banks Public banks Total Variable Valid Frequency Percent Frequency Percent Freq. Percent Cumulative
percent
Gender Female 27 22.1 15 26.8 43 23.9 23.9 Male 95 79.1 41 73.2 137 76.1 100.0 Age From 20-30
year 24 19.2
8 14.3 32 17.8 17.8
From 31-40 years
31 25.0 17 30.4 48 26.7
44.4
Above 40 years
69 55.6 31 55.4 100 55.6
100
Ed. Level Diploma & below
53 42.7 24 42.9 76 42.2
42.2
First degree & above
71 57.3 32 57.1 104 57.8
100
Job profile Private & government employees
20 16.1 24 42.9 44 24.4
24.4
Trade & commerce
104 83.9 32 57.1 136 75.6
100
Ownership Private 124 68.9 68.9
Public 56 31.1 100.0 Source: computed & complied from the SPSS 16 output.
5.4. Descriptive Statistics of the Dimensions
Descriptive statistics in the form of arithmetic means and standard deviations for
respondents were computed for the various dimensions of employee job satisfaction,
customer service quality, customer satisfaction, and customer loyalty.
Table 5. 3:: Descriptive statistics for the dimensions employee job satisfaction
Dimension Variables N Mean SD
WC (w ork content) 180 4.06 .859
CRD (Career & Development)
180 3.96 .922
RLS (Relations w ith supervisor)
180 4.18 .792
RLW (Relations w ith
Co-w orkers
180 4.28 .621
SB (Salary & benefits 180 3.54 .858
Source: computed and complied from the SPSS 16 output.
Table 5.3 above provided the descriptive statistics of the dimensions of internal
marketing, as independent variables, had an impact on the dependent variable of
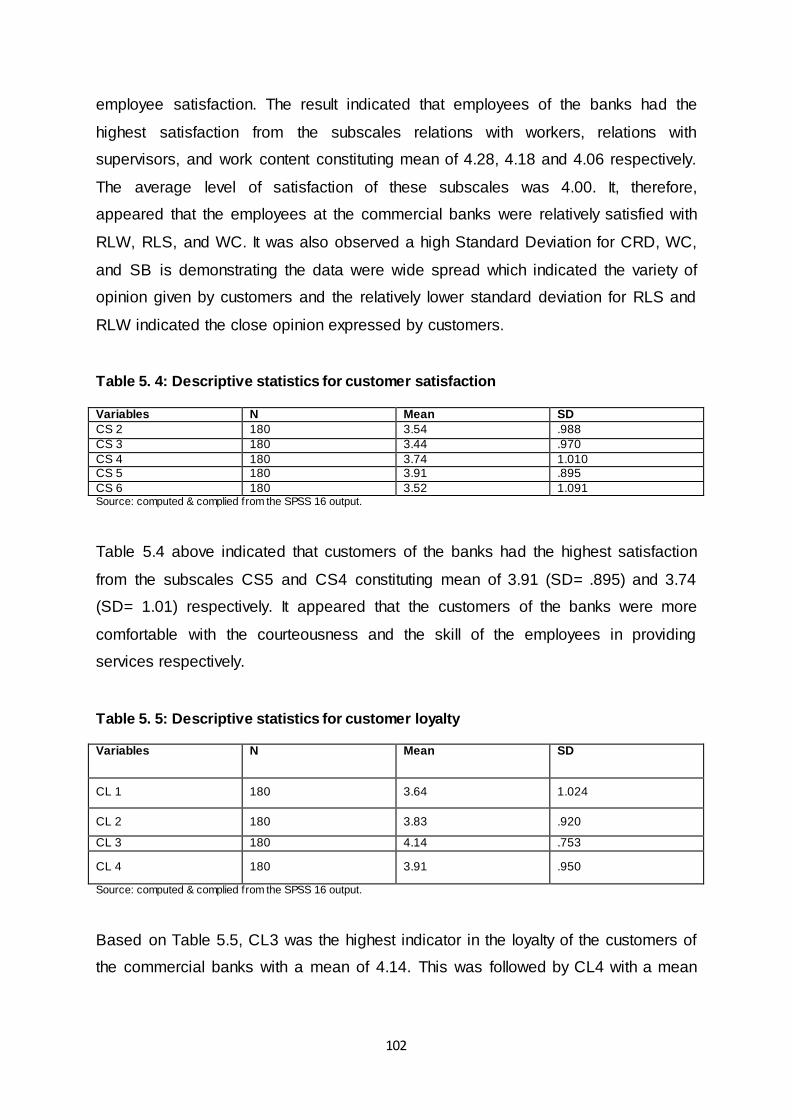
102
employee satisfaction. The result indicated that employees of the banks had the
highest satisfaction from the subscales relations with workers, relations with
supervisors, and work content constituting mean of 4.28, 4.18 and 4.06 respectively.
The average level of satisfaction of these subscales was 4.00. It, therefore,
appeared that the employees at the commercial banks were relatively satisfied with
RLW, RLS, and WC. It was also observed a high Standard Deviation for CRD, WC,
and SB is demonstrating the data were wide spread which indicated the variety of
opinion given by customers and the relatively lower standard deviation for RLS and
RLW indicated the close opinion expressed by customers.
Table 5. 4: Descriptive statistics for customer satisfaction
Variables N Mean SD
CS 2 180 3.54 .988
CS 3 180 3.44 .970
CS 4 180 3.74 1.010 CS 5 180 3.91 .895
CS 6 180 3.52 1.091 Source: computed & complied from the SPSS 16 output.
Table 5.4 above indicated that customers of the banks had the highest satisfaction
from the subscales CS5 and CS4 constituting mean of 3.91 (SD= .895) and 3.74
(SD= 1.01) respectively. It appeared that the customers of the banks were more
comfortable with the courteousness and the skill of the employees in providing
services respectively.
Table 5. 5: Descriptive statistics for customer loyalty
Variables N Mean SD
CL 1 180 3.64 1.024
CL 2 180 3.83 .920
CL 3 180 4.14 .753
CL 4 180 3.91 .950
Source: computed & complied from the SPSS 16 output.
Based on Table 5.5, CL3 was the highest indicator in the loyalty of the customers of
the commercial banks with a mean of 4.14. This was followed by CL4 with a mean
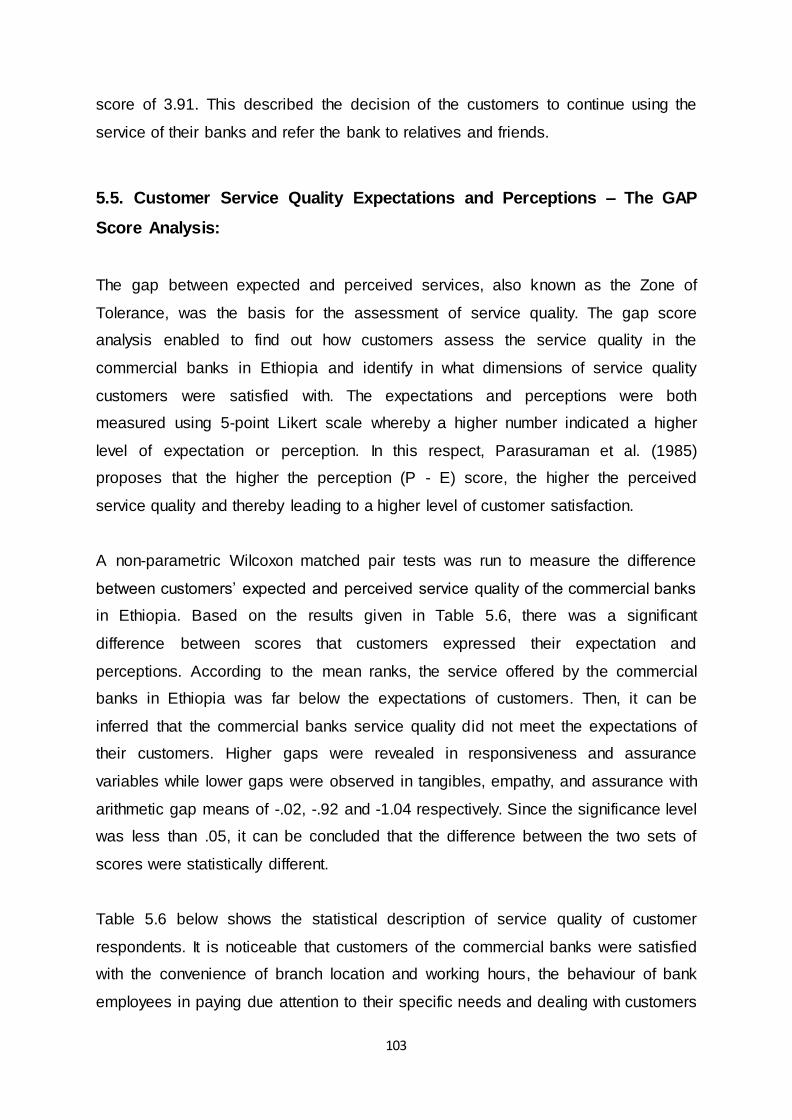
103
score of 3.91. This described the decision of the customers to continue using the
service of their banks and refer the bank to relatives and friends.
5.5. Customer Service Quality Expectations and Perceptions – The GAP
Score Analysis:
The gap between expected and perceived services, also known as the Zone of
Tolerance, was the basis for the assessment of service quality. The gap score
analysis enabled to find out how customers assess the service quality in the
commercial banks in Ethiopia and identify in what dimensions of service quality
customers were satisfied with. The expectations and perceptions were both
measured using 5-point Likert scale whereby a higher number indicated a higher
level of expectation or perception. In this respect, Parasuraman et al. (1985)
proposes that the higher the perception (P - E) score, the higher the perceived
service quality and thereby leading to a higher level of customer satisfaction.
A non-parametric Wilcoxon matched pair tests was run to measure the difference
between customers‟ expected and perceived service quality of the commercial banks
in Ethiopia. Based on the results given in Table 5.6, there was a significant
difference between scores that customers expressed their expectation and
perceptions. According to the mean ranks, the service offered by the commercial
banks in Ethiopia was far below the expectations of customers. Then, it can be
inferred that the commercial banks service quality did not meet the expectations of
their customers. Higher gaps were revealed in responsiveness and assurance
variables while lower gaps were observed in tangibles, empathy, and assurance with
arithmetic gap means of -.02, -.92 and -1.04 respectively. Since the significance level
was less than .05, it can be concluded that the difference between the two sets of
scores were statistically different.
Table 5.6 below shows the statistical description of service quality of customer
respondents. It is noticeable that customers of the commercial banks were satisfied
with the convenience of branch location and working hours, the behaviour of bank
employees in paying due attention to their specific needs and dealing with customers
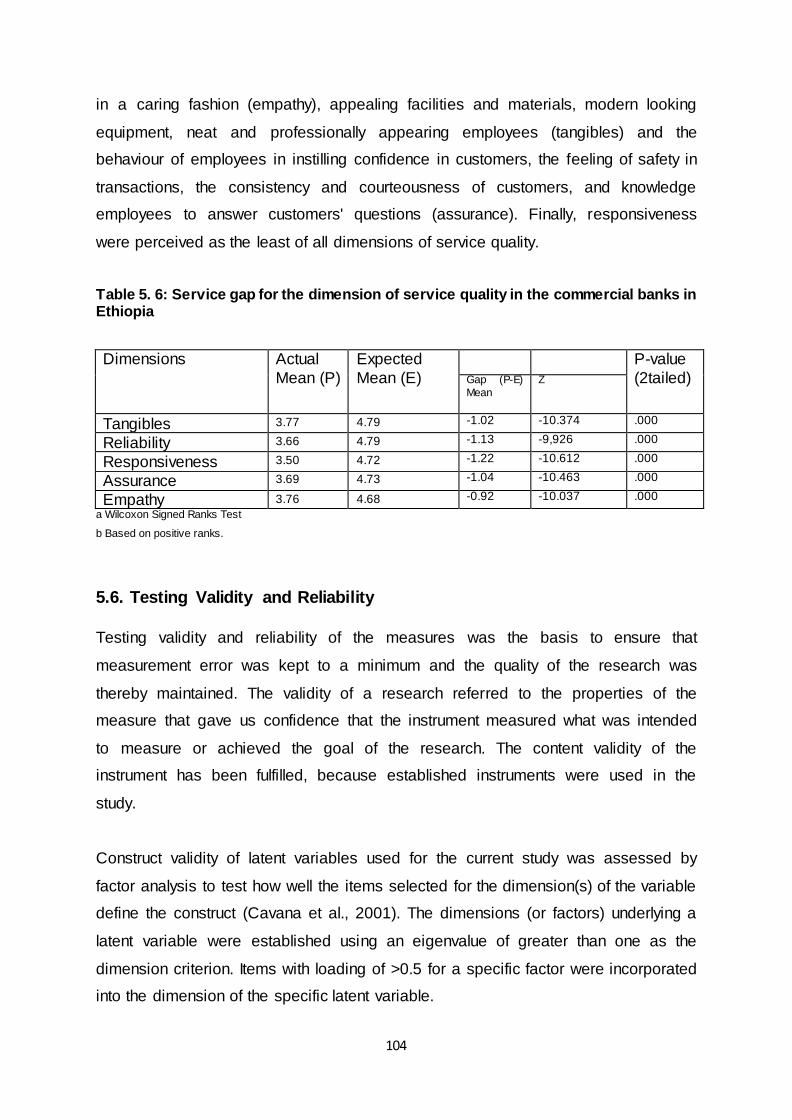
104
in a caring fashion (empathy), appealing facilities and materials, modern looking
equipment, neat and professionally appearing employees (tangibles) and the
behaviour of employees in instilling confidence in customers, the feeling of safety in
transactions, the consistency and courteousness of customers, and knowledge
employees to answer customers' questions (assurance). Finally, responsiveness
were perceived as the least of all dimensions of service quality.
Table 5. 6: Service gap for the dimension of service quality in the commercial banks in Ethiopia
Dimensions Actual
Mean (P)
Expected
Mean (E)
P-value
(2tailed) Gap (P-E)
Mean
Z
Tangibles 3.77 4.79 -1.02 -10.374 .000
Reliability 3.66 4.79 -1.13 -9,926 .000
Responsiveness 3.50 4.72 -1.22 -10.612 .000
Assurance 3.69 4.73 -1.04 -10.463 .000
Empathy 3.76 4.68 -0.92 -10.037 .000
a Wilcoxon Signed Ranks Test
b Based on positive ranks.
5.6. Testing Validity and Reliability
Testing validity and reliability of the measures was the basis to ensure that
measurement error was kept to a minimum and the quality of the research was
thereby maintained. The validity of a research referred to the properties of the
measure that gave us confidence that the instrument measured what was intended
to measure or achieved the goal of the research. The content validity of the
instrument has been fulfilled, because established instruments were used in the
study.
Construct validity of latent variables used for the current study was assessed by
factor analysis to test how well the items selected for the dimension(s) of the variable
define the construct (Cavana et al., 2001). The dimensions (or factors) underlying a
latent variable were established using an eigenvalue of greater than one as the
dimension criterion. Items with loading of >0.5 for a specific factor were incorporated
into the dimension of the specific latent variable.

105
5.7. Factor Analysis and Validity of Measures
.
Factor analysis is a multivariate statistical procedure used to validate the construct of
dependent and independent variables by reducing a large number of variables into a
smaller set of variables or factors. Besides it is used to establish underlying
dimensions between measured variables and latent constructs, thereby allowing the
formation and refinement of theory and provide, construct validity evidence of self-
reporting scales (Hair et al. 2006; Tabachnick & Fidell, 2007).
Confirmatory factor analysis seeks to determine if the number of factors and the
loadings of measured (indicator) variables on them conform to what is expected on
the basis of pre-established theory. Indicator variables were selected on the basis of
prior theory and factor analysis was used to see if they load as predicted on the
expected number of factors. The principal axis factoring (PAF), also called common
factor analysis was used for purposes of confirmatory factor analysis in structural
equation modelling. PAF is generally used when the research purpose is to identify
latent variables which contribute to the common variance of the set of measured
variables, excluding variable-specific (unique) variance.
Exploratory factor analysis seeks to uncover the underlying structure of a relatively
large set of variables. The researcher's à priori assumption is that any indicator may
be associated with any factor. There was no prior theory and factor loadings were
used to perceive the factor structure of the data. The most common type of factor
analysis in this case, exploratory factor analysis, is principal components analysis
(PCA). PCA is generally used when the research purpose is meant to reduce the
data in many measured variables into a smaller set of components.
This study adopted an exploratory factor analysis, through a principal component
analysis (PCA). Several methods could be applied for a rotation such as Quartimax,
Oblimin and Varimax. A Varimax procedure in orthogonal rotation, widely used by
previous researchers among others, such as Buchanan, McCubbin, & Adesope

106
(2016), Dubey, Singh, Samar Ali, Venkatesh, & Gupta (2014), Hammedi,
Kandampully, Zhang, & Bouquiaux (2015), Martins & Proença (2012), and Mittal,
Gera, & Batra (2015) was adopted to test the construct validity of questionnaire
items. Principal components analysis (PCA) seeks a linear combination of variables
such that the maximum variance is extracted from the variables. It then removes this
variance and tries to find for a second linear combination which explains the
maximum proportion of the remaining variance, and so on. This is called the principal
axis method and results in orthogonal (uncorrelated) factors. PCA analysis was
undertaken as a method of extraction in using statistical software packages of SPSS
(Costello & Osborne, 2005; Courtney & Gordon, 2013; Ha, N.P.N., 2014; Sanda,
M.A. and Kuada, J., 2016)
To investigate whether the items of each factor were significantly related to each
other, a correlation matrix using the criteria of at least 0.3 of correlation was
prepared based on Hair et al. (2006) for each factor before conducting factor
analysis.
The Bartlett‟s test of sphericity (Bartlett, 1954) and the Kaiser-Meyer-Olkin (KMO),
(Kaiser, 1974) generated by SPSS, were used as pre-analysis mechanism for testing
the validity and suitability of the responses collected to the problem being addressed
through the study. Bartlett‟s test of sphericity should be significant (p < .05) for the
factor analysis to be appropriate. The KMO index ranges from 0 to 1, with 0.6
suggested as the minimum value for a good factor analysis (Pallant, 2010). The
factors of employee satisfaction, customer service quality, customer satisfaction, and
customer loyalty were identified based on factor loadings.
5.7.1. Factor analysis of internal service quality/Employee job
satisfaction
Exploratory factor analysis was conducted to validate the internal marketing
construct and identify the number of factors of employees‟ job satisfaction (refer
table 5.7).
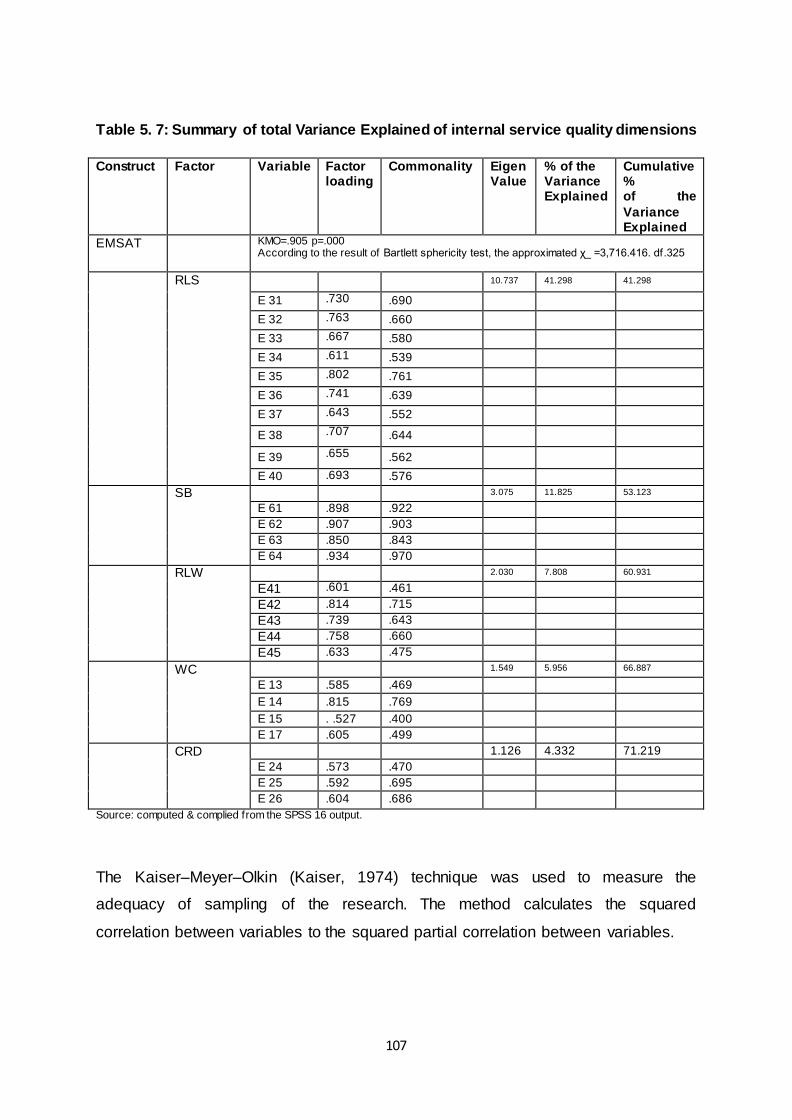
107
Table 5. 7: Summary of total Variance Explained of internal service quality dimensions
Construct Factor Variable
Factor loading
Commonality
Eigen Value
% of the Variance Explained
Cumulative % of the
Variance Explained
EMSAT KMO=.905 p=.000 According to the result of Bartlett sphericity test, the approximated χ_ =3,716.416. df.325
RLS 10.737 41.298 41.298
E 31 .730 .690 E 32 .763 .660 E 33 .667 .580 E 34 .611 .539 E 35 .802 .761 E 36 .741 .639 E 37 .643 .552
E 38 .707 .644
E 39 .655 .562
E 40 .693 .576
SB 3.075 11.825 53.123
E 61 .898 .922 E 62 .907 .903 E 63 .850 .843 E 64 .934 .970
RLW 2.030 7.808 60.931
E41 .601 .461
E42 .814 .715
E43 .739 .643
E44 .758 .660
E45 .633 .475
WC 1.549 5.956 66.887
E 13 .585 .469
E 14 .815 .769
E 15 . .527 .400 E 17 .605 .499
CRD
1.126 4.332 71.219
E 24 .573 .470 E 25 .592 .695 E 26 .604 .686
Source: computed & complied from the SPSS 16 output.
The Kaiser–Meyer–Olkin (Kaiser, 1974) technique was used to measure the
adequacy of sampling of the research. The method calculates the squared
correlation between variables to the squared partial correlation between variables.

108
The KMO value varies between 0 and 1. A value of 0 indicates that the factor
analysis would be inappropriate, whereas a value close to 1 indicates that the factor
analysis is reliable. Kaiser (1974) recommends a KMO = 0.5 to be the main
acceptable value, whilst values 0.5 < KMO < 0.7 to be mediocre, 0.7 < KMO < 0.8 to
be good, and KMO > 0.8 to be excellent (Hutcheson and Sofroniou, 1999). The KMO
for the current research was equal to 0.905 which was within the range of being
excellent for the five internal service quality dimensions. Therefore, the factor
analysis could confidently be specified as an appropriate method for data analysis.
Bartlett‟s test of sphericity and the anti-image correlation and covariance metrics
provided similar information on the relationship between correlation and covariance,
shown in Table 5.7 (Field, 2005). The KMO values for each attribute were generated
on the diagonal of the anti-image correlation matrix. All values were above the bare
minimum 0.5 which was good. The rest of anti-image correlation matrix, the off-
diagonal elements represented the partial correlations between attributes (variables).
The majority of these correlations were very small. For this study, the Bartlett‟s test
was highly significant (P, 0.001; df 0.325), and therefore based on the anti-image
correlation and covariance metrics the factor analysis was appropriate. The
diagonals of the anti-image correlation matrix were all over the acceptable limit of .5
(Pallant, 2010) thereby supporting the inclusion of each item in the factor analysis.
Hence Factor technique for further analysis of the data was appropriate.
The factor extraction part of factor analysis assesses the eigenvalues that determine
the linear components within the data set. The eigenvalue is a measure for
discovering whether predictors are dependent or otherwise.
Table 5.7 represented eigenvalues associated with each linear factor (component)
before extraction, after extraction and after rotation. On the basis of the extraction,
five linear components were identified within the data set. The eigenvalues with each
factor represented the variance explained by that particular linear component and
using the SPSS tool. Eigenvalue was achieved in terms of the percentage of the
variance (for instance, attribute RLS explains 43.209% of total variance). Some
attributes explained relatively larger amounts of variance (especially RLS) while

109
subsequent attributes explained relatively smaller amounts of variance. In the
Extraction Sums of Squared Loadings column, the attributes with eigenvalues
greater than 1 were extracted. Thus, less than 1.0 eigenvalues indicated that specific
factor exposed less evidence compared with an individual item that would have
explained.
In the final part of the table and based on the principal components analysis and
VARIMAX procedure in orthogonal rotation, the results of the dimensions of job
satisfaction with eigenvalues > 1 included RLS, SB, RLW, WC, and CRD ranging
from the lowest, 1.126 (CRD) to the highest of, 10.737 (RLS). The rotation has the
effect of optimising the structure and the consequence is that the relative importance
of the factors is equalised. Before rotation, attribute RLS accounted for considerably
more variance than the remaining four (43.209%) and the cumulative percentage of
the cumulative variance explained for the independent variables was 71.219%.
5.7.2 Factor Analysis of Customer Service Quality Based on the
Difference between Perceptions and Expectations (Gap scores)
The exploratory factor analysis conducted to validate and identify the number of
factors of customer service quality is shown in Table 5.8. Eigenvalues were used to
measure the total variance explained. Table 5.8 depicted eigenvalues > 1 ranging
from the highest 3.354 (empathy) to the lower 2172 (reliability).
Kaiser-Meyer-Olkin (Kaiser, 1974) and Bartlett‟s Test of Sphericity (Bartlett, 1954)
was used for testing the sampling adequacy and the suitability of the sample for
factor analysis. Al-Hawary, Alhamali and Alghanim (2011) recommended the value
of the Kaiser-Meyer-Olkin measure be used to assess the suitability of the sample
for each unifactorial determination.
The KMO values found in Table 5.8 were generally considered acceptable. Each of
the unifactorial test accounted for tangibles, reliability, assurance, empathy, and
responsiveness showed 75.16%, 72.41%, 64.89%, 69.31%, and 67.08% of the
variance respectively. A larger amount of the total variance for each group of

110
variables indicated its association with the causes of the factor itself while only a
small amount of the total variance for each group of variables was associated with
causes other than the factor itself. The Bartlet tests of sphericity were significant, (p
= 0.000) indicating the suitability of the sample for factor analysis
Table 5. 8: Total Variance Explained of Customer Service Quality GAP scores
Factor Variab
le
Factor
loading
Commonality
Eigen value
% of the Varianc
e Explained
Cumulative %
of the Variance Explaine
d
Cronbach
Alpha
Number of
Itmes
TANGIBLES 2.255 75.160 75.160 .832 3
GT21 .842 .708
GT22 .925 .856
GT23 .831 .690
KMO=..651 p=.000 According to the result of Bartlett sphericity test, the approximated χ_ = 233.325..df. 3
RELIABILITY
RL21 RL22 RL23
.827
.894.
.830
.684
.799
.690
2.172 72.414 72.414 .808 3
KMO=..685 p=.000 According to the result of Bartlett sphericity test, the approximated χ_ =185.038. df.3
RESPONSIVNES
RS21
RS22 RS23 RS24
.715
.868
.882
.738
.512
.753
.778
.544
2.588 64.888 64.8888 .810 4
KMO= .748 p=.000 According to the result of Bartlett sphericity test, the approximated χ_ = 280.582. df.6
ASSURANCE AS21
AS22 AS23 AS24
.809
.786
.890
.842
.654
.618
.791
.709
2.722 69.307 69.307 .851 4
KMO=.805 p=.000
According to the result of Bartlett sphericity test, the approximated χ_ = 310.781. df. 6
EMPATHY EM21 EM22
EM23 EM24 EM25
.850 .735
.877
.793
.832
.723 .540
.768
.630 693
3.354 67.083 67.083 .870 5
KMO=.854 p=.000
According to the result of Bartlett sphericity test, the approximated χ_ = 448.627. df. 10
Source: computed & compiled from the SPSS output.
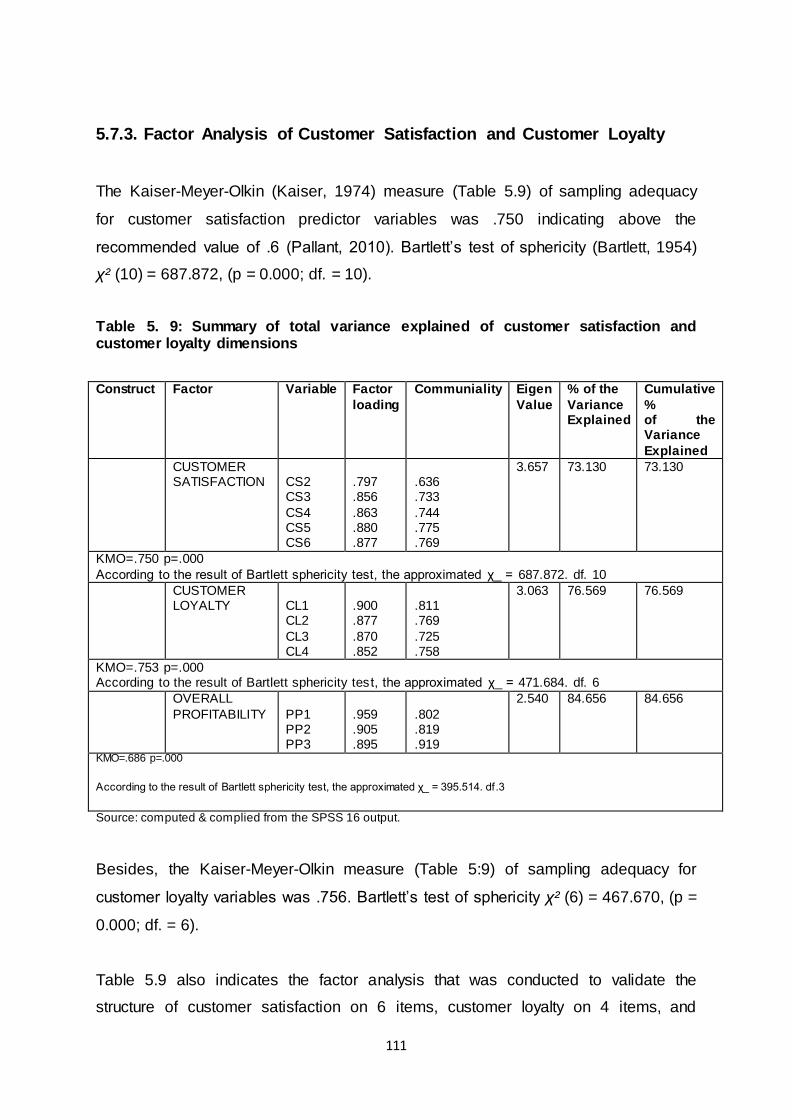
111
5.7.3. Factor Analysis of Customer Satisfaction and Customer Loyalty
The Kaiser-Meyer-Olkin (Kaiser, 1974) measure (Table 5.9) of sampling adequacy
for customer satisfaction predictor variables was .750 indicating above the
recommended value of .6 (Pallant, 2010). Bartlett‟s test of sphericity (Bartlett, 1954)
χ² (10) = 687.872, (p = 0.000; df. = 10).
Table 5. 9: Summary of total variance explained of customer satisfaction and customer loyalty dimensions
Construct Factor Variable Factor
loading
Communiality
Eigen
Value
% of the
Variance Explained
Cumulative
% of the Variance
Explained
CUSTOMER SATISFACTION
CS2 CS3
CS4 CS5 CS6
.797 .856
.863
.880
.877
.636 .733
.744
.775
.769
3.657 73.130 73.130
KMO=.750 p=.000
According to the result of Bartlett sphericity test, the approximated χ_ = 687.872. df. 10
CUSTOMER LOYALTY
CL1 CL2
CL3 CL4
.900 .877
.870
.852
.811 .769
.725
.758
3.063 76.569 76.569
KMO=.753 p=.000 According to the result of Bartlett sphericity tes t, the approximated χ_ = 471.684. df. 6
OVERALL
PROFITABILITY
PP1 PP2 PP3
.959
.905
.895
.802
.819
.919
2.540 84.656 84.656
KMO=.686 p=.000
According to the result of Bartlett sphericity test, the approximated χ_ = 395.514. df.3
Source: computed & complied from the SPSS 16 output.
Besides, the Kaiser-Meyer-Olkin measure (Table 5:9) of sampling adequacy for
customer loyalty variables was .756. Bartlett‟s test of sphericity χ² (6) = 467.670, (p =
0.000; df. = 6).
Table 5.9 also indicates the factor analysis that was conducted to validate the
structure of customer satisfaction on 6 items, customer loyalty on 4 items, and

112
profitability on 3 items with orthogonal rotation (varimax). An initial analysis was run
to obtain eigenvalues for each component in the data. The result of the factor
analysis indicated the existence of one dimension for each of customer satisfaction,
customer loyalty and overall profitability items with eigenvalues greater than one.
The cumulative percentage of the variance explained for customer satisfaction was
73.130%, for customer loyalty was 76.569% and for overall profitability was
84.656%. All items had factor loadings exceeding 0.5, indicating sufficient validity.
5.7.4 Goodness-of-fit Measures
In this study, two item scales of MSQ (items E11 and E12), six item scales (3 x 2) of
SERVQUAL (items C111- C11, C124-C24, and C125-C25, and two item scales of
customer satisfaction (item CS1 and CS7) were removed in order to increase their
related Cronbach‟s alphas (Cronbach, 1951) and the remaining values with less than
their respective final alpha values were found to be reliable.
Items E16, E21, E22, E23, E51, E52, and E53 were dropped because their loadings
were below the cut-off point of .50. Item E54 of internal service quality/employee job
satisfaction was dropped in the interpretation because of its meaningful loading in
more than one component. The remaining data were run using the internal
consistency test to assess the reliability between the dimensions of the internal
service quality, external customer service quality, and customer satisfaction
variables based on the Cronbach‟s alpha coefficient. As discussed earlier, factors
with eigenvalues greater than 1.0 and factor loadings equal to or greater than 0.50
were retained. Accordingly, 26; 19; 5; and 4 items loading under five dimensions of
internal service quality and SERVQUAL and one dimension of each of customer
satisfaction and customer loyalty were extracted from the analysis.
5.8. Reliability Analysis – Cronbach Alpha Test Results
Reliability test is essential to validate the degree of dependability or freedom from
error of the variable measures and whether an instrument can be interpreted
consistently across different situations (Hair et al., 2006). The reliability of the
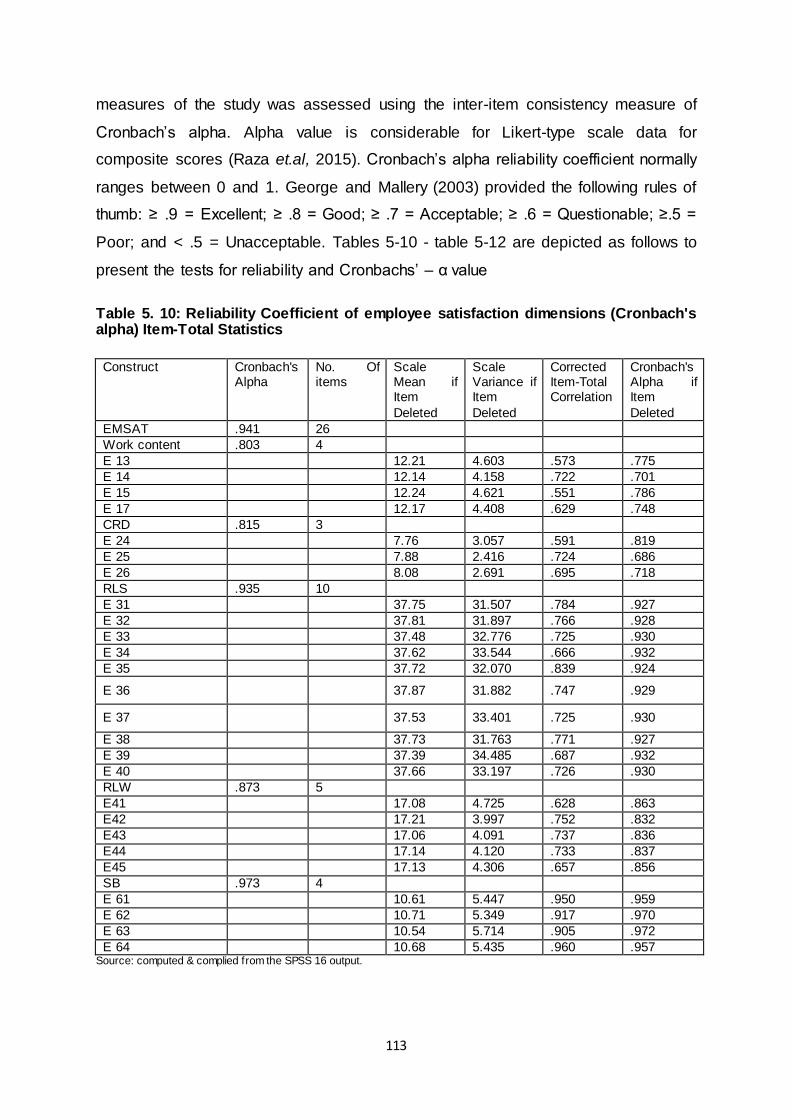
113
measures of the study was assessed using the inter-item consistency measure of
Cronbach‟s alpha. Alpha value is considerable for Likert-type scale data for
composite scores (Raza et.al, 2015). Cronbach‟s alpha reliability coefficient normally
ranges between 0 and 1. George and Mallery (2003) provided the following rules of
thumb: ≥ .9 = Excellent; ≥ .8 = Good; ≥ .7 = Acceptable; ≥ .6 = Questionable; ≥.5 =
Poor; and < .5 = Unacceptable. Tables 5-10 - table 5-12 are depicted as follows to
present the tests for reliability and Cronbachs‟ – α value
Table 5. 10: Reliability Coefficient of employee satisfaction dimensions (Cronbach's alpha) Item-Total Statistics
Construct Cronbach's
Alpha No. Of items
Scale Mean if Item
Deleted
Scale Variance if Item
Deleted
Corrected Item-Total Correlation
Cronbach's Alpha if Item
Deleted
EMSAT .941 26
Work content .803 4
E 13 12.21 4.603 .573 .775
E 14 12.14 4.158 .722 .701
E 15 12.24 4.621 .551 .786
E 17 12.17 4.408 .629 .748
CRD .815 3
E 24 7.76 3.057 .591 .819
E 25 7.88 2.416 .724 .686
E 26 8.08 2.691 .695 .718
RLS .935 10
E 31 37.75 31.507 .784 .927
E 32 37.81 31.897 .766 .928
E 33 37.48 32.776 .725 .930
E 34 37.62 33.544 .666 .932
E 35 37.72 32.070 .839 .924
E 36 37.87 31.882 .747 .929
E 37 37.53 33.401 .725 .930
E 38 37.73 31.763 .771 .927
E 39 37.39 34.485 .687 .932
E 40 37.66 33.197 .726 .930
RLW .873 5
E41 17.08 4.725 .628 .863
E42 17.21 3.997 .752 .832
E43 17.06 4.091 .737 .836
E44 17.14 4.120 .733 .837
E45 17.13 4.306 .657 .856
SB .973 4
E 61 10.61 5.447 .950 .959
E 62 10.71 5.349 .917 .970
E 63 10.54 5.714 .905 .972
E 64 10.68 5.435 .960 .957 Source: computed & complied from the SPSS 16 output.
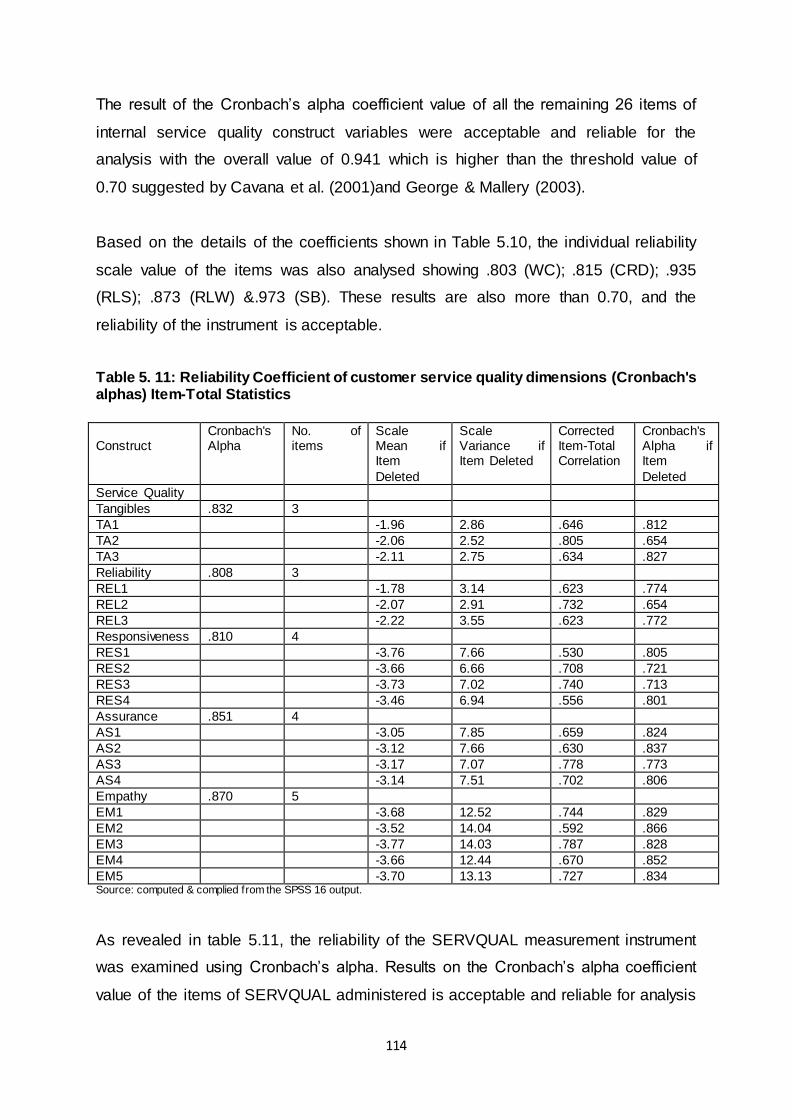
114
The result of the Cronbach‟s alpha coefficient value of all the remaining 26 items of
internal service quality construct variables were acceptable and reliable for the
analysis with the overall value of 0.941 which is higher than the threshold value of
0.70 suggested by Cavana et al. (2001)and George & Mallery (2003).
Based on the details of the coefficients shown in Table 5.10, the individual reliability
scale value of the items was also analysed showing .803 (WC); .815 (CRD); .935
(RLS); .873 (RLW) &.973 (SB). These results are also more than 0.70, and the
reliability of the instrument is acceptable.
Table 5. 11: Reliability Coefficient of customer service quality dimensions (Cronbach's alphas) Item-Total Statistics
Construct
Cronbach's Alpha
No. of items
Scale Mean if Item
Deleted
Scale Variance if Item Deleted
Corrected Item-Total Correlation
Cronbach's Alpha if Item
Deleted
Service Quality
Tangibles .832 3
TA1 -1.96 2.86 .646 .812
TA2 -2.06 2.52 .805 .654
TA3 -2.11 2.75 .634 .827
Reliability .808 3
REL1 -1.78 3.14 .623 .774
REL2 -2.07 2.91 .732 .654
REL3 -2.22 3.55 .623 .772
Responsiveness .810 4
RES1 -3.76 7.66 .530 .805
RES2 -3.66 6.66 .708 .721
RES3 -3.73 7.02 .740 .713
RES4 -3.46 6.94 .556 .801
Assurance .851 4
AS1 -3.05 7.85 .659 .824
AS2 -3.12 7.66 .630 .837
AS3 -3.17 7.07 .778 .773
AS4 -3.14 7.51 .702 .806
Empathy .870 5
EM1 -3.68 12.52 .744 .829
EM2 -3.52 14.04 .592 .866
EM3 -3.77 14.03 .787 .828
EM4 -3.66 12.44 .670 .852
EM5 -3.70 13.13 .727 .834 Source: computed & complied from the SPSS 16 output.
As revealed in table 5.11, the reliability of the SERVQUAL measurement instrument
was examined using Cronbach‟s alpha. Results on the Cronbach‟s alpha coefficient
value of the items of SERVQUAL administered is acceptable and reliable for analysis
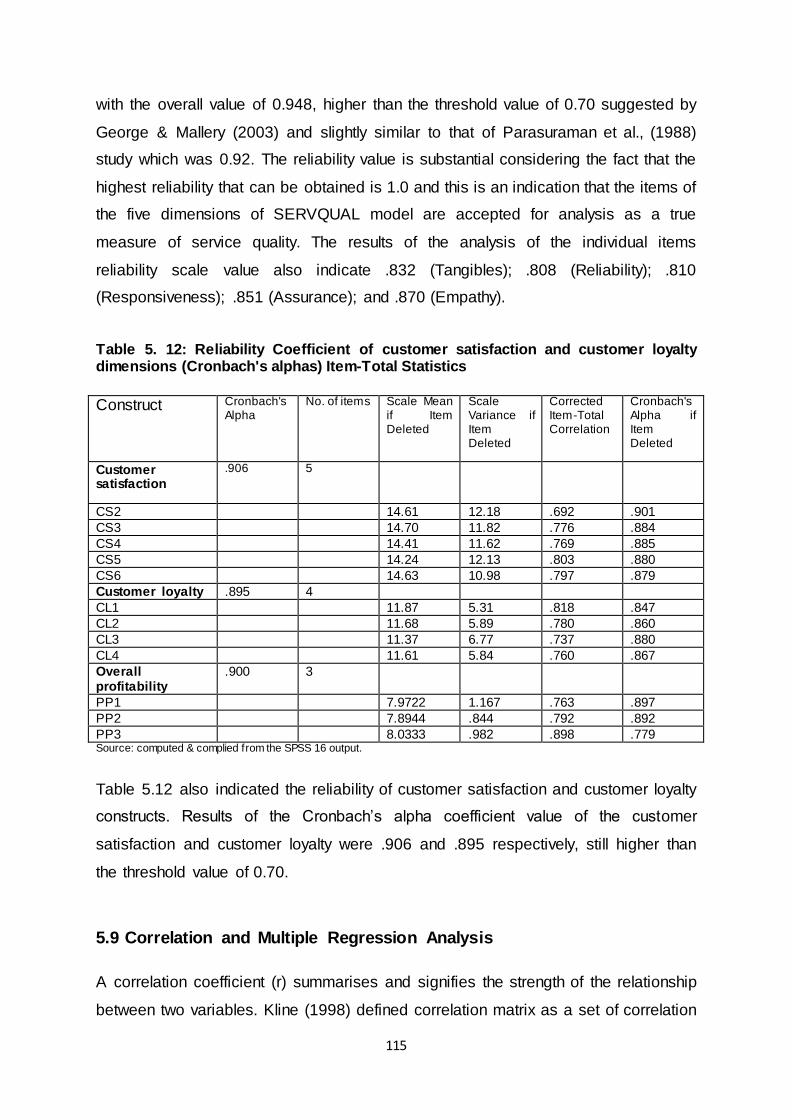
115
with the overall value of 0.948, higher than the threshold value of 0.70 suggested by
George & Mallery (2003) and slightly similar to that of Parasuraman et al., (1988)
study which was 0.92. The reliability value is substantial considering the fact that the
highest reliability that can be obtained is 1.0 and this is an indication that the items of
the five dimensions of SERVQUAL model are accepted for analysis as a true
measure of service quality. The results of the analysis of the individual items
reliability scale value also indicate .832 (Tangibles); .808 (Reliability); .810
(Responsiveness); .851 (Assurance); and .870 (Empathy).
Table 5. 12: Reliability Coefficient of customer satisfaction and customer loyalty dimensions (Cronbach's alphas) Item-Total Statistics
Construct Cronbach's Alpha
No. of items Scale Mean if Item Deleted
Scale Variance if Item Deleted
Corrected Item-Total Correlation
Cronbach's Alpha if Item Deleted
Customer satisfaction
.906 5
CS2 14.61 12.18 .692 .901
CS3 14.70 11.82 .776 .884
CS4 14.41 11.62 .769 .885
CS5 14.24 12.13 .803 .880
CS6 14.63 10.98 .797 .879
Customer loyalty .895 4
CL1 11.87 5.31 .818 .847
CL2 11.68 5.89 .780 .860
CL3 11.37 6.77 .737 .880
CL4 11.61 5.84 .760 .867
Overall profitability
.900 3
PP1 7.9722 1.167 .763 .897
PP2 7.8944 .844 .792 .892
PP3 8.0333 .982 .898 .779 Source: computed & complied from the SPSS 16 output.
Table 5.12 also indicated the reliability of customer satisfaction and customer loyalty
constructs. Results of the Cronbach‟s alpha coefficient value of the customer
satisfaction and customer loyalty were .906 and .895 respectively, still higher than
the threshold value of 0.70.
5.9 Correlation and Multiple Regression Analysis
A correlation coefficient (r) summarises and signifies the strength of the relationship
between two variables. Kline (1998) defined correlation matrix as a set of correlation

116
coefficients between two variables. The value of the coefficient ranges from +1 to -1,
where +1 indicates perfect positive correlation, -1 indicates perfect negative
correlation and 0 indicates no correlation. Based on the suggestion of Pallant (2010),
the interpretation of r-value indicating the strength of the relationship between two
variables is as follows:
r = .10 to .29 or r = -.10 to -.29 weak
r = .30 to .49 or r = -.30 to -.49 Medium
r = .50 to 1.0 or r = -.50 to -1.0 High
Although the correlation coefficient helps to show the strength of the relationship
between two variables, it cannot show the rate of change in the dependent variable
when it is concurrently influenced from several independent variables. Therefore,
multiple regression analysis helps to know how much of the variance in the
dependent variable is explained by several independent sets of predictors (Hair,
Anderson, Tatham, and Black, 1998). Multiple regression analysis, with SPSS 16,
was used in this research to test the following hypothesis.
H1. There is a positive correlation between internal service quality and employee
satisfaction in the commercial banks in Ethiopia.
H2. There is a positive correlation between employee satisfaction and customer
service quality in the commercial banks in Ethiopia.
H3. Customer satisfaction in the commercial banks in Ethiopia is positively
influenced by employee satisfaction.
H4. There is a positive correlation between customer service quality and customer
satisfaction in the commercial banks in Ethiopia.
H5: There is a positive correlation between customer service quality and customer
loyalty
H6. There is a positive correlation between customer satisfaction and customer
loyalty in the commercial banks in Ethiopia.
H7. There is a positive correlation between customer loyalty and overall profitability
in the commercial banks in Ethiopia.
117
H8. There is a positive correlation between demographic variables (number of
branches, age of bank, and bank type) and overall profitability of the commercial
banks in Ethiopia?
The relevant dependent and independent variables in each of the formulated
hypothesis are presented as follows.
1) Employee satisfaction (dependent variable) versus internal service quality
dimensions (the independent variables).
2) Customer service quality (the dependent variable) versus internal service
quality/employee satisfaction (the independent variables).
3) Customer satisfaction (the dependent variable) versus internal service
quality/employee satisfaction (the independent variable).
4) Customer satisfaction (the dependent variable) versus customer service
quality dimensions (the independent variables).
5) Customer loyalty is the dependent variable and customer satisfaction (the
independent variable).
6) Profitability (the dependent variable) versus customer loyalty (the independent
variable).
7) Lastly, profitability is the dependent variable while the demographic variables
(number of branches, age of bank, and bank type) are the independent
variables.
5.9.1. The Framework for Linking Employee Satisfaction, Customer
Service Quality, Customer Satisfaction, Customer Loyalty and
Profitability
Regression analyses are usually driven by a theoretical or conceptual model that can
be drawn in the form of a path diagram. A path diagram provides the model for
setting the regression and what statistics to examine. The literature review and many
of the empirical studies have examined each concept considered in this study.
However, this study has considered an integrated model in order to analyse all
concepts in an integrative manner. Therefore, as shown in Figure 5.12, the model is
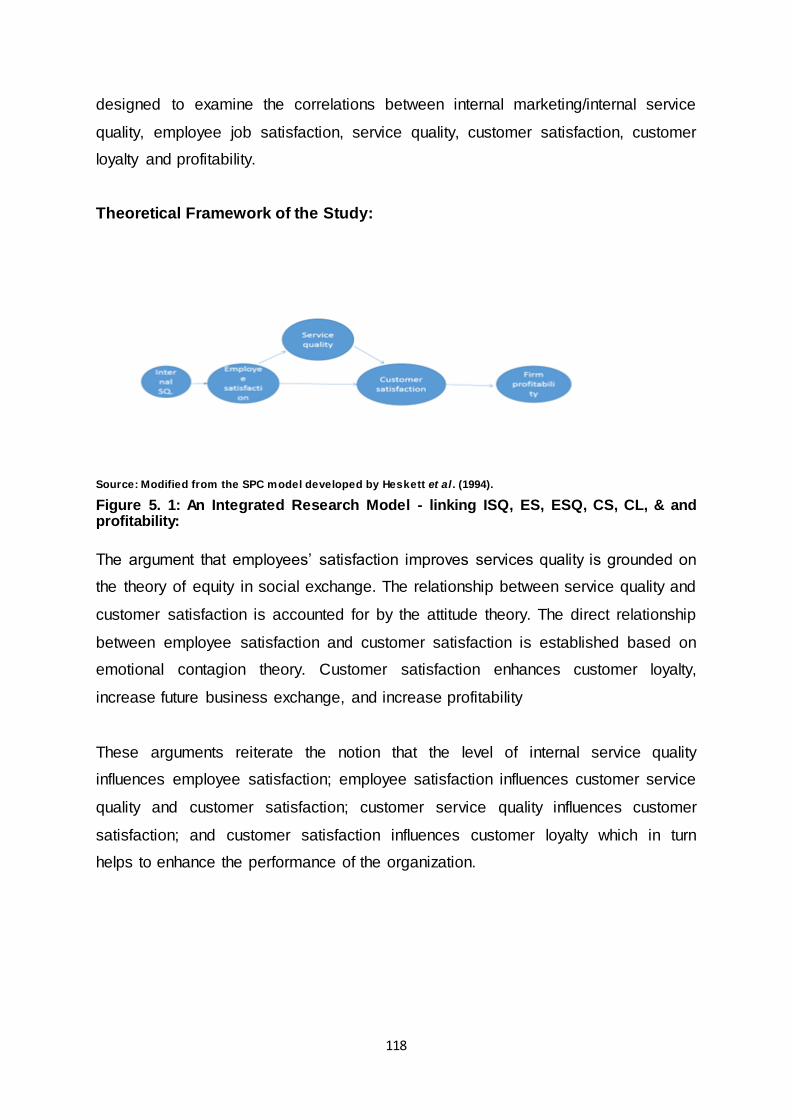
118
designed to examine the correlations between internal marketing/internal service
quality, employee job satisfaction, service quality, customer satisfaction, customer
loyalty and profitability.
Theoretical Framework of the Study:
Source: Modified from the SPC model developed by Heskett et al . (1994).
Figure 5. 1: An Integrated Research Model - linking ISQ, ES, ESQ, CS, CL, & and profitability:
The argument that employees‟ satisfaction improves services quality is grounded on
the theory of equity in social exchange. The relationship between service quality and
customer satisfaction is accounted for by the attitude theory. The direct relationship
between employee satisfaction and customer satisfaction is established based on
emotional contagion theory. Customer satisfaction enhances customer loyalty,
increase future business exchange, and increase profitability
These arguments reiterate the notion that the level of internal service quality
influences employee satisfaction; employee satisfaction influences customer service
quality and customer satisfaction; customer service quality influences customer
satisfaction; and customer satisfaction influences customer loyalty which in turn
helps to enhance the performance of the organization.
119
5.9.2 Testing the Fundamental Assumptions of Multiple Regression
Analysis
Multiple regression analysis makes a number of assumptions about the data which
include linearity, homoscedasticity, normality, multicollinearity and residual
independence and outliers. These assumptions have to be tested in order to make a
conclusion about the population. When the assumptions of regression are met, the
likelihood that the model obtained from a sample of being the same as the
population of interest (the coefficients and parameters of the regression equation are
said to be unbiased) is increased.
5.9.2.1 Collinearity or Multicollinearity Test
Two or more variables can be strongly correlated in a regression model. In this case
(multicollinearity), it becomes impossible to obtain accurate estimates of the
regression coefficients because there are an infinite number of combinations of
coefficients that would work equally well. Three methods were used in this study to
test for multicollinearity or collinearity. The first measure of multicollinearity test was
an examination of the correlation matrix for the independent variables. The presence
of high correlation, for example over 0.90 is an indicator of a multicollinearity problem
(Hair et al., 2006). As shown in the correlation analysis, the correlation coefficients
were within the acceptable range.
Tolerance value (1-R) and the VIF value (1/ 1-R) presented in the coefficients tables
were also used as a second method to trace the problems of multicollinearity.
According to Menard (1995), a tolerance value less than 0.2 indicate a serious
collinearity problem.Moreover, a VIF value greater than 10 is a cause for concern
(Myers, 1990; Bowerman & O‟Connel, 1990).
In these data set, the average and in all the Tolerance and VIF values (refer to the
tables of multiple regression) are within the acceptable range of cutoff points of
multicollinearity. In other words, the tolerance values were greater than .10 (Menard,
120
1995) and the VIF values were below 10 (Bowerman & O‟Connel, 1990). Therefore,
the multicollinearity assumption was not violated in both situations.
5.9.2.2 Outlier Analysis
Tabachnick & Fidell (2007) define outliers as cases that have a standardised
residual (as displayed in the scatter plot) of more than 3.3 or less than –3.3. In
relation to this study (appendix 7), the residuals are roughly rectangularly distributed
in the Scatter plot of the standardised residuals, with most of the scores
concentrated in the centre (along the 0 point). However, based on the literature, it is
also found unnecessary to take any action for outliers‟ residuals that may commonly
be found in a number a large sample study.
The Cook‟s Distance was also used to check the presence of outliers. Therefore, no
strange cases were identified having an undue influence on the results for the model
as a whole. According to Field (2005), cases with values larger than 1 are potential
problems. The acceptable value for Cook's Distance value is when it is less than 1
(Hair et al., 2006). In this situation, the analysis result of the Cook's Distance is within
the desired range, suggesting no major problem.
5.9.2.3 Assessment of Normality
The presence of outliers can also be checked by inspecting the Normal Probability
Plot (P-P) of the Regression Standardised Residual and the Scatter plot helps to
identify the presence of outliers. The residuals displayed in the Scatterplot were
roughly rectangularly distributed (along the 0 point) indicating no violation of the
assumption.
The Normal Probability Plot (P-P) of the Regression Standardised Residual and the
Scatter plot requested as part of the analysis are used to detect outliers. Referring to
appendix 7-14, the points in the Normal P-P Plot lie in a reasonably straight diagonal
line from bottom left to top right implying no major deviations from normality. The

121
histogram also appears to be normal, indicating that normality assumption is not a
real issue of concern.
5.9.2.4 Independence of Residuals or Independence Test
The sample for the current study has been chosen randomly and thus it satisfies the
independence assumption. Each person or case is counted only once and did not
appear in more than one category or group. Consequently, the data from one subject
cannot influence the data from another.
The exception to this is the repeated measures techniques (Wilcoxon Signed Rank
Test), where the same participants were retested on expectations and perceptions of
service quality of the banks under consideration.
The Durbin–Watson test is used to check the independence of residuals. In this
case, the computed Durbin-Watson values are in between [1.568 - 2.065] thereby
indicating of being within the acceptable range of 1-3 (Field, 2005).
5.9.2.5 Linearity:
Examination of the residual plots and scatter plots (SPSS output) helps to identify
the presence of linear relationships between the dependent variable and the
independent variables. The plotted points on appendix 6 depict a straight line
stretching diagonally from the bottom left to the top right. Therefore, linearity in this
situation is not a major cause of concern.
8.9.2.6 Homoscedasticity
The presence of homoscedasticity can be checked visually by plotting the ZRESID
(Y- axis of the SPSS dialog box) against ZPRED (X- axis of the SPSS dialog box).
That is, the statistical software scatter plots of residuals with independent variables
are considered as a method to examine this assumption. Appendices show that the
assumptions of homoscedasticity have been met.

122
5.10. Testing the Hypotheses of the Study
The hypothesis testing was undertaken in two stages. The first stage considered
testing the mediating effects of the dimensions in the commercial banks in Ethiopia
in general. In the second stage, comparative test result of public and private banks
were taken into consideration.
The hypotheses in this study were aimed at investigating the effect of the
independent variables on the dependent variable. Pearson's correlation analysis was
performed to assess the nature of the relationship between the dependent variable
and independent variables. Various summaries of the correlations among the factors
considered in the study are presented and discussed below indicating the strength of
relationships among the variables considered in the questionnaires. The formulated
hypotheses were further tested using multiple regression and ANOVA.
Hypothesis 1:
H 1.0: There is no correlation between internal marketing/internal service quality and
employee job satisfaction in the commercial banks in Ethiopia.
H 1.1: There is a positive correlation between internal marketing/internal service
quality and employee satisfaction in commercial banks in Ethiopia.
EMSAT = Employee satisfaction
WC = Work content
RLS = Relations with supervisor
RLW = Relations with workers
SB = salary& benefits
CRD = Career & Development
The above hypothesis were grounded based on the theoretical frameworks of
Alderfer's ERG Theory (1969), Adam‟s Equity theory (1963, 1965), Vroom‟s
Expectancy Theory (1964), and Lock‟s Goal Theory (1968) and the Social Exchange
Theory (Blau, 1964, Cropanzano & Mitcchell, 2005).

123
Correlation analysis:
Bivariate Correlations were used to know the nature, direction and significance of the
bivariate relationship of the variables of this study.A correlation matrix was
constructed using the variables in the questionnaire to show the strength of
relationships among the variables considered in the questionnaire. According to
Kline (1998), correlation matrix is defined as a set of correlation coefficients between
a number of variables.
Appendix 21 demonstrated the inter-item correlations for the internal marketing
dimensions of RLS, SB, WC and CRD. All these dimensions were positively
correlated at ≤ 0.01 (two-tailed) level of significance. It can thus be inferred that the
satisfaction of employees with the dimensions of internal marketing enhances
employee job satisfaction.
The highest coefficient correlation between internal marketing dimensions (RLW and
SB) was .52 which was below the cutoff point of .90 indicating that the data was not
affected by a collinearity problem. These correlations were also a sign of validity and
reliability of measurement scales used in this research (Hair et al., 1998).
The correlation matrix also indicated that four internal service quality dimensions
were positively and strongly or highly correlated with employee job satisfaction.
Accordingly, the coefficient of correlation of RLS and employee satisfaction was very
strong and significant positive relationship (r = 0.89, n = 180, p (two tailed) ≤ 0.01).
Besides, positive and strong correlation prevails between WC and employee job
satisfaction; SB and employee job satisfaction; and RLW and employee satisfaction
with p ≤0.01; n =180; r= 0.73, 0.66, and 0.64 respectively. In summary, the results of
the correlation analysis depicted higher level of internal service quality showing
higher levels of positive responses towards employee job satisfaction. Therefore, this
reinforces in favour of H1.

124
Multiple regression analysis
A stepwise multiple regression analysis was conducted in order to determine which
of the independent predictors make a meaningful contribution to the prediction of the
overall employee job satisfaction. Regression results indicated that the variable CRD
had no significant predicting power on employee job satisfaction and was dropped
from the model. The multiple correlation co-efficient (R) was found to be 0.992,
which demonstrated that there was good correlation between the dependent variable
and the set of independent variables.
Table 5. 13: A Model summary, ANOVA and determination of multiple regression equation for hypothesis 1 showing internal marketing dimensions and employee satisfaction: (N180).
Variable Coefficient Std. error
Beta T Sig. Correlations Collinearity Statistics
Zero-order
Partial Part Tolerance VIF
(Constant) -1.409 1.184 -1.189 .236
RLS 1.119 .026 .539 42.570 .000 .889 .955 .413 .588 1.701 SB 1.199 .048 .284 25.083 .000 .664 .885 .243 .736 1.359
WC 1.190 .058 .247 20.512 .000 .727 .840 .199 .651 1.536
RLW 1.112 .059 .215 18.726 .000 .638 .817 .182 .717 1.395
R .992a
R Square .984
Adjusted R Square
.983
Probability
.000
Std. Er. of the Estimate
1.760
F 2,611.954
Durbin-Watson
1.960
a. Predictors: (Constant),RLS, SB, WC, RLW; b. Dependent Variable: EMSAT
Table 5.13 shows how much of the variance in the dependent variable (EMSAT) was
explained by the model, which includes in combination the variables of RLS, SB,
WC, and RLW. In this case, the R2 value of 0.984 meant 98.4% of the variance in
the employee job satisfaction was explained by internal marketing or service quality
variables. This strengthened the results of correlation analysis confirming that a
positive relationship between internal service quality dimensions and employee job
satisfaction.
125
The proposed model was adequate as the F-statistics (p-value = 0.000) was
significant at the (p ≤ 0.01) level of significance. Since F (4, 175) = 2,611.954; R2 =
0.984; P< .01 level of significance, the alternative hypothesis H1:1 is accepted and
conclude that internal service quality has effect on employee job satisfaction
The ubstadardized coefficients indicated how much the dependent variable varies
with an independent variable, when other independent variables are held constant.
In other words, the β coefficient indicated how and to what extent the internal service
quality dimensions such as RLS, SB, WC, & RLW influence employee satisfaction of
the commercial banks. Results showed a positive relationship between internal
service quality and employee job satisfaction. This affirmed that the higher the level
of these variables, the higher its significance on employee job satisfaction. The data
on table 5:14 further displayed which of the variables included in the model
contributed to the prediction of the dependent variable. It has been found that the
variables RLS (β = 1.119; t = 42.570; P <.01); SB (β = 1.199; t = 25.083; P <.01);
WC (β = 1.190; t = 20.512; P <.01); and RLW (β = 1.112; t = 18.726) were
significantly independent predictors of employee job satisfaction. This implies that
effective supervision, salary & benefits, the work itself and the cohesive relationship
with co-workers have significant impact on employee job satisfaction.
Then the fitted Regression Model for measuring employee job satisfaction level in
general is as follows:
Y = α + β1x1+β2x2+β3x3+β4x4+e
Where:
Y = Value of the Dependent variable or what is being predicted or explained
(EMSAT)
α = Constant or intercept
βi = the slope (Beta coefficient) for X i
X1 = relations with supervision (RLS)
X2 = salary &benefits (SB)
X3 = work content (WC)
X4 = career & development (RLW)

126
Y= -1.409 + .539 RLS+ .284 SB + .247 WC + .215 RLW
.
The intercept of employee job satisfaction score, as the predicted value of the
dependent variable when all of the independent internal service quality variables
have a value of 0, is -1.409.
The beta coefficients depicted the relationship between EMSAT and each predictor.
If the value is positive, there is a positive relationship between the predictor and the
outcome, whereas a negative coefficient represents a negative relationship. For
these data, all four predictors have positive beta coefficients indicating positive
relationships. Therefore, with the increase in the values of RLS, SB, WC, and RLW,
EMSAT increases. That is, EMSAT level is higher as and when the values of these
variables are increased. In this case, coefficient value of RLS (relations with
supervisors) is the highest (.539) followed by SB (salary & benefits) which is also
equal to .284. The empirical statistics reveal that in order to increase Y (EMSAT level
in general), the levels of RLS, SB, WC, and RLW need to be given weight in an
orderly manner. Results indicated that employees gave the highest priority to RLS
(Relations with supervisor) and followed by SB (Salary & Benefits).
Taking the data of the commercial banks in general, four dimensions of internal
service quality were independently significant predictors of employee job satisfaction.
In other words, supervision (RLS), salary & benefits (SB), conditions related to work
(WC), and interpersonal relations (RLW) were the driving factors that enhance job
satisfaction of the bank employees in Ethiopia. I.e. RLS, SB, WC, and RLW had to-
value of > 2. Hence, the alternative hypothesis (H: 1) was supported.
The result of the linear regression analyses was in congruence with the works of
Yee, Yeung, & Cheng (2011) and the relevant theories on the relationships of
internal-service quality and employee satisfaction. In addition, the results of the study
were consistent with the findings of Rose, Kumar, & Pak, 2011; Ahmed, et al., 2011;
Ahmad et al., 2012; Tsai & Wu, 2011; Tsai & Tang, 2008; Heskett, et al., 1997, 2008;
Pritchard & Silvestro, 2005; Lee & Park, 2008; and Rafiq & Ahmed, 2000, in that
there is a positive and significant correlation between internal-service quality and
employees; job satisfaction

127
Hypothesis 2:
H 2.0: There is no correlation between internal service quality and customer service
quality in the commercial banks in Ethiopia.
H 2.1: There is a positive correlation between internal service quality and customer
service quality in commercial banks in Ethiopia.
SQ = Service Quality
Correlation analysis:
As indicated in appendix 22, there was a positive correlation between internal
marketing variables/employee satisfaction and customer service quality (SQ). The
correlation between CRD and SQ was r = .229; p≤ .05 and the correlation between
WC and SQ is r = .220; p ≤ .05 which in both cases was weak but positive. However,
no significant correlation was observed between RLS, RLW, SB and customer
service quality.
Multiple regression analysis
To evaluate how well internal service quality variables predicted customer service
quality, a multiple correlation co-efficient (R) was 0.326. This displayed that there
was a moderate correlation between the dependent variable and the set of
independent variables. Table 5.14 shows a model summary of the linear combination
of the independent variables (CRD, RLW, SB, WC & RLS) and customer service
quality. The R2 value is 0.106 and expressed as a percentage, the model explains
10.6% of the variance in customer service quality. According to Cohen (1988), R 2
between 1.0 and 5.9 % is considered as small, between 5.9 and 13.8 % is medium,
and above 13.8 % is large.
The proposed model was adequate as the F-statistics (p-value = 0.000) was
significant at the 5 % level (p ≤ 0.05). This indicated that overall model was
statistically significant with F (5, 174) = 4.132; R2 = 0.106; P<.05. Therefore, the
alternative hypothesis H.2:1 is accepted concluding that internal service quality has

128
an effect on customer service quality. The table further shows which of the variables
included in the model contributed to the prediction of the dependent variable.
Table 5. 14: Model summary, ANOVA and determination of multiple regression equation for hypothesis 2 showing internal marketing dimensions and customer service quality: (N180).
Variable Coefficient Std.
error Beta T Sig. Correlations Collinearity
Statistics
Zero-
order
Partial Part Tolerance VIF
(Constant) -29.991 9.849 -3.045 .003
RLS -.507 .230 -.218 -2.202 .029 .015 -.165 -.158 .526 1.90
0
SB -.394 .415 -.083 -.948 .344 .077 -.072 -.068 .670 1.493
RLW -.250 .497 -.043 -.503 .616 .034 -.038 -.036 .703 1.423
WC 1.189 .495 .220 2.403 .017 .220 .179 .172 .614 1.629
CRD 1.870 .626 .301 2.987 .003 .229 .221 .214 .507 1.97
1 R .326a
R Square .106
Adjusted R
Square .080
Probability
.000
Std. Er. of the Estimate
14.242
F 4.132
Durbin-Watson
1.923
a. Dependent Variable: SQ*
b. Predictors: (Constant), RLS,, SB, WC, RLW, CRD
The βeta values were used to compare the contribution of each independent variable
to the prediction of the dependent variable. The higher the absolute value of Beta,
the more important is the variable in predicting the customer service quality. The
result indicated that CRD with a beta coefficient of 1.870 had the strongest unique
contribution to explaining the dependent variable (customer service quality).The βeta
coefficient of WC was 1.189 indicating significant contribution. Besides, RLS
indicated a beta coefficient of -.507. Therefore, CRD (β = 1.870; t = 2.987; P <.01)
and WC (β = 1.189; t = 2.403; P <.05) were found to have a significant and positive
effect on customer service quality while RLS (β = -0.507; t = -2.202; P <.05), was
found to have a significant and negative effect on customer service quality. Since the
Sig. Value of RLW and SB is greater than .05, the study failed to observe significant
unique contribution of these variables to the prediction of the dependent variable
(customer service quality).
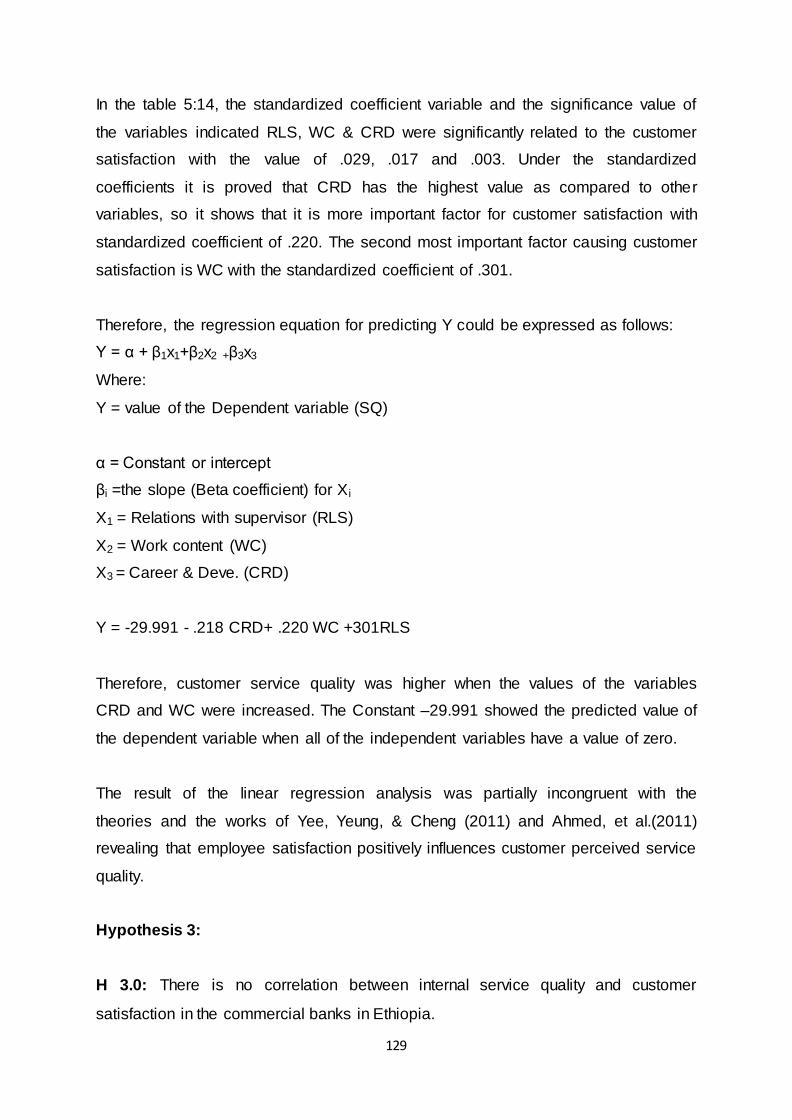
129
In the table 5:14, the standardized coefficient variable and the significance value of
the variables indicated RLS, WC & CRD were significantly related to the customer
satisfaction with the value of .029, .017 and .003. Under the standardized
coefficients it is proved that CRD has the highest value as compared to other
variables, so it shows that it is more important factor for customer satisfaction with
standardized coefficient of .220. The second most important factor causing customer
satisfaction is WC with the standardized coefficient of .301.
Therefore, the regression equation for predicting Y could be expressed as follows:
Y = α + β1x1+β2x2 +β3x3
Where:
Y = value of the Dependent variable (SQ)
α = Constant or intercept
βi =the slope (Beta coefficient) for X i
X1 = Relations with supervisor (RLS)
X2 = Work content (WC)
X3 = Career & Deve. (CRD)
Y = -29.991 - .218 CRD+ .220 WC +301RLS
Therefore, customer service quality was higher when the values of the variables
CRD and WC were increased. The Constant –29.991 showed the predicted value of
the dependent variable when all of the independent variables have a value of zero.
The result of the linear regression analysis was partially incongruent with the
theories and the works of Yee, Yeung, & Cheng (2011) and Ahmed, et al.(2011)
revealing that employee satisfaction positively influences customer perceived service
quality.
Hypothesis 3:
H 3.0: There is no correlation between internal service quality and customer
satisfaction in the commercial banks in Ethiopia.

130
H 3.1: There is a positive correlation between internal service quality and customer
satisfaction in the commercial banks in Ethiopia.
CUSAT = Customer satisfaction
The theory of emotional contagion has been used in marketing research to explain
the relationship between employee job satisfaction and customer satisfaction
(Homburg & Stock, 2004). Yi & Gong (2008) argued that communication between
service employees and customers is a reciprocal process. Accordingly, the above
hypotheses were drawn to investigate the relationship between employee job
satisfaction and customer satisfaction in the commercial banks in Ethiopia.
Correlation analysis:
As depicted in Appendix 23, there was a weak positive correlation between WC and
CUSAT, r = .179; p ≤.05. Besides, a weak positive correlation was registered
between CRD and CUSAT, r = .188; p ≤.05. The correlation of RLS, RLW, and SB
with CUSAT was not significant.
Multiple regression analysis
The regression model summary showed how much of the variance in the dependent
variable (CUSAT) was explained in combination by the model, including the
variables RLS, SB, RLW, CRD, & WC. The R2 value was .081 indicating that the
model explained 8.1% of the variance in the customer satisfaction.
The internal service quality independent variables in combination indicated a
significant predictor of customer satisfaction. This meant that the proposed model
was adequate as the F-statistics (p-value = 0.000) was significant at the 5 % level (p
≤ 0.05). This indicated that overall model was statistically significant with F (5, 174) =
F (5, 174) = 3.066; P<.05), and thus the alternative hypotheses H 3.1: was accepted
thereby concluding that internal service quality has an effect on customer
satisfaction. CRD (β = 0.467; t = 2.561; P <.05) and WC (β = 0.298; t = 2.066; P

131
<.05) were the factors with the largest beta coefficients and with the strongest unique
contribution explaining the dependent variable- customer satisfaction.
Table 5. 15: Model summary, ANOVA and determination of multiple regression equation for hypothesis 3 showing internal service quality dimensions and customer satisfaction: (N180).
Variable Coefficient Std. Error
Beta T Sig. Correlations Collinearity Statistics
Zero-order
Partial Part Tolerance
VIF
(Constant) 15.069 2.871 5.249 .000 RLS -.110 .067 -.164 -1.637 .103 .026 -.123 -.119 .526 1.900
SB -.225 .121 -.165 -1.858 .065 -.005 -.139 -.135 .670 1.493
RLW .022 .145 .013 .151 .880 .075 .011 .011 .703 1.423
WC .298 .144 .192 2.066 .040 .179 .155 .150 .614 1.629
CRD .467 .182 .261 2.561 .011 .188 .191 .186 .507 1.971
R .285a
R Square .081
Adjusted R Square
.055
Probability . 011b
Std. Error
of the Estimate
4.118
F 3.066
Durbin-Watson
1.891
a. Predictors: (Constant), RLS, SB, RLW, WC, CRD
The standardized coefficient variable and the significance value of the variables
indicated CRD & WC were significantly related to the customer satisfaction with the
value of .011 & .40 respectively. Thus, under the standardized coefficients CRD
recorded the highest value as compared to WC.
Therefore, the fitted regression equation for predicting Y could be expressed as
follows:
Y = α + β1x1+β2x2
Where:
Y = value of the Dependent variable (CUSAT)
α = Constant or intercept
βi = the slope (Beta coefficient) for X i
X1 = work content (WC)
X2= Career & Dev. (CRD)
Y = 15.069 + .192 WC + .261 CRD
132
Therefore, customer satisfaction is higher when the values of the variables CRD and
WC are increased. The result of the linear regression analyses were partially
incongruent with the theories and the works of Yee, Yeung, & Cheng (2011) and
Ahmed, et al. (2011) revealing that employee satisfaction positively influences
customer perceived service quality. Besides, the results of the study are in line with
the works of Bernard, Donthu & Kennett (2000), who found a strong relationship
between employee satisfaction and customer satisfaction.
Hypothesis 4:
H 4.0: There is no correlation between customer service quality and customer
satisfaction in the commercial banks in Ethiopia.
H 4.1: There is a positive correlation between customer service quality and customer
satisfaction.
The hypothesis was based on attitude theory proposed by Lazaus (1991) and Bagozzi
et al. (1992). The theoretical model suggests that the appraisal process of internal and
situational conditions lead to emotional responses, which, in turn, induce coping
responses. The appraisal process is followed by an emotional response which is
expressed in terms of customer satisfaction (Bagozzi et al., 1992).
CUSAT = customer satisfaction
TA = Tangibles
REL = Reliability
RES = Responsiveness
AS = Assurance
EM = Empathy
Correlation analysis:
Appendix 24 demonstrated the inter item correlations for the customer service quality
dimensions of tangibles, reliability, responsiveness, assurance, and empathy. All the

133
dimensions were positively correlated at the 0.01 level of significance. The highest
correlation between customer service quality dimensions was .846 which was below
the cut-off point of .90 indicating no problem of multi-collinearity.
Besides, the correlation matrix depicted a high and positive correlation of service
quality dimensions with customer satisfaction. The coefficient of correlation between
AS and customer satisfaction depicted the highest significant positive relationship (r
= 0.831, n = 180, p ≤ 0.01). This was followed by the correlation between EM and
customer satisfaction(r = 0.821, n = 180, p ≤ 0.01) RES, REL and TAN with
customer satisfaction with p ≤0.01; n =180; r= 0.81, 0.67, and 0.59 respectively.
Multiple regression analysis
A multiple regression analysis conducted to evaluate the predicting power of
customer service quality variables on the dependent variable of customer
satisfaction indicated no serious multi-collinearity problem. Therefore, the
assumptions required to ensure validity of the significance test of the study are met.
Table 5. 16: Model summary, ANOVA and determination of multiple regression equation for hypothesis 4 showing customer service quality dimensions and customer satisfaction: (N180).
Variable Coefficient
Std. Error
Beta T Sig. Correlations Collinearity Statistics
Zero-order
Partial Part Tolerance VIF
(Constant) 23.095 .271 85.26 .000
TA -.088 .092 -.049 -.960 .338 .592 -.073 -.034 .465 2.151
REL .172 .080 .122 2.158 .032 .674 .161 .075 .380 2.630
RES .407 .079 .330 5.153 .000 .806 .364 .180 .298 3.361
AS .198 .100 .167 1.981 .049 .831 .148 .069 .172 5.816
EM .379 .065 .401 5.830 .000 .821 .404 .204 .259 3.860
R .887a
R Square .787
Adjusted R Square
.781
Probability .000
Std. Error
of the Estimate
1.981
F 128.78
Durbin-Watson
1.8014
a. Predictors: (Constant), EMPATHY*, TANGIBLES*, RELIABILITY*, RESPONSI *, ASSURANCE*
b. Dependent Variable: CUSAT
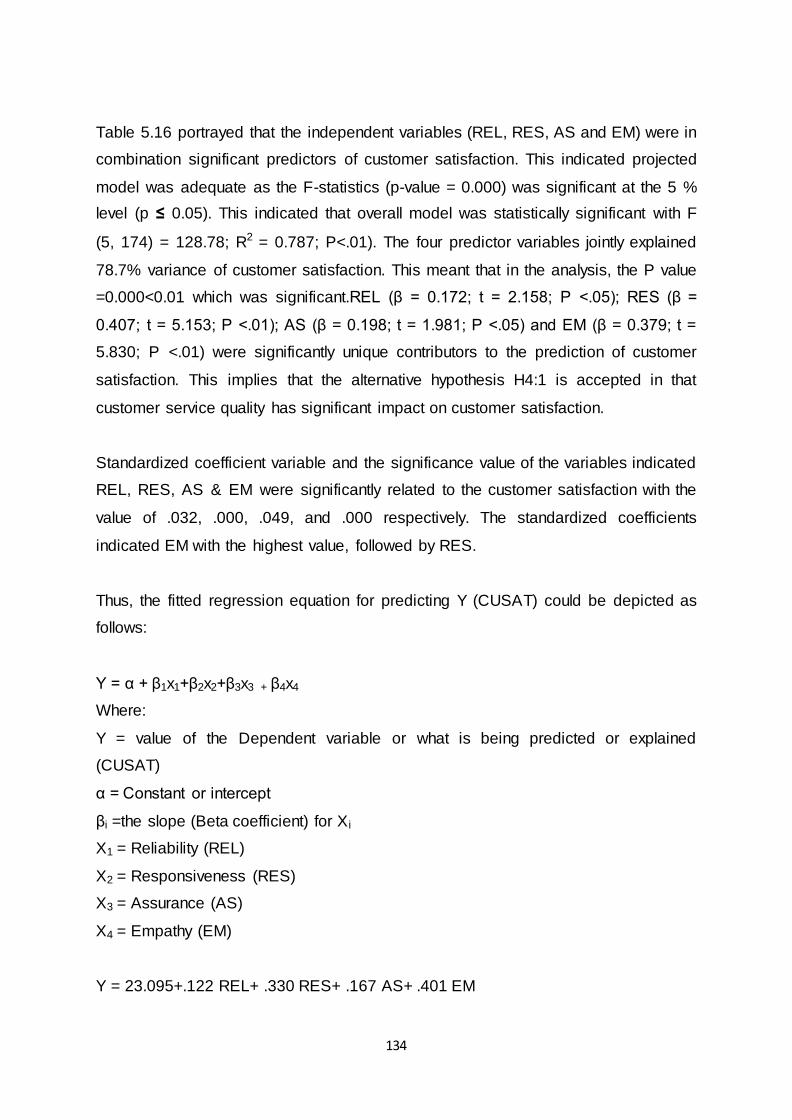
134
Table 5.16 portrayed that the independent variables (REL, RES, AS and EM) were in
combination significant predictors of customer satisfaction. This indicated projected
model was adequate as the F-statistics (p-value = 0.000) was significant at the 5 %
level (p ≤ 0.05). This indicated that overall model was statistically significant with F
(5, 174) = 128.78; R2 = 0.787; P<.01). The four predictor variables jointly explained
78.7% variance of customer satisfaction. This meant that in the analysis, the P value
=0.000<0.01 which was significant.REL (β = 0.172; t = 2.158; P <.05); RES (β =
0.407; t = 5.153; P <.01); AS (β = 0.198; t = 1.981; P <.05) and EM (β = 0.379; t =
5.830; P <.01) were significantly unique contributors to the prediction of customer
satisfaction. This implies that the alternative hypothesis H4:1 is accepted in that
customer service quality has significant impact on customer satisfaction.
Standardized coefficient variable and the significance value of the variables indicated
REL, RES, AS & EM were significantly related to the customer satisfaction with the
value of .032, .000, .049, and .000 respectively. The standardized coefficients
indicated EM with the highest value, followed by RES.
Thus, the fitted regression equation for predicting Y (CUSAT) could be depicted as
follows:
Y = α + β1x1+β2x2+β3x3 + β4x4
Where:
Y = value of the Dependent variable or what is being predicted or explained
(CUSAT)
α = Constant or intercept
βi =the slope (Beta coefficient) for X i
X1 = Reliability (REL)
X2 = Responsiveness (RES)
X3 = Assurance (AS)
X4 = Empathy (EM)
Y = 23.095+.122 REL+ .330 RES+ .167 AS+ .401 EM

135
The hypotheses test confirmed that REL, RES, AS, and EM attributes were positively
correlated with customer satisfaction. The slope of RES is .407 which means that for
every one unit increase in RES, the predicted customer satisfaction increases by the
same units, after controlling for REL, AS and EM.
The model further depicted which of the variables have a significant impact on
customers‟ satisfaction. The Regression Analysis shows that tangibles had no
significant impact on customer satisfaction and this result was similar to the findings
of Kheng et al. (2010).
Generally, the linear regression analysis of the relationship of service quality with
customer satisfaction is in line with the theoretical model of Lazaus (1991) and
Bagozzi et al. (1992) and the works of Zeithaml & Bitner (2003), Kheng et al. (2010)
Yee, et al. (2011), Siddiqui (2011), and Mahmoodifar, et al. (2014).
Hypothesis 5:
H 5.0: There is no correlation between customer service quality and customer loyalty
in the commercial banks in Ethiopia.
H 5.1: There is a positive correlation between customer service quality and customer
loyalty in the commercial banks in Ethiopia.
CL = Customer loyalty
The theoretical model proposed by Lazarus (1991) and Bagozzi et al. (1992) suggest
that the appraisal process of internal and situational conditions lead to customer
emotional response that has an impact on customer satisfaction and customer
loyalty.
The marketing literature also gives the impression that satisfied customers are loyal
customers. Service quality is commonly considered as antecedent to loyalty, but
through the mediated effect of customer satisfaction. Customer satisfaction is also
suggested as the leading determinant of customer loyalty (Heskett et al., 1994).
136
Therefore, on the basis the empirical and theoretical grounds, the above hypothesis
was formulated to investigate the relationship between service quality and customer
loyalty.
Correlation analysis:
The correlation matrix (Refer to appendix 25) revealed service quality components
were positively and strongly correlated with customer loyalty. Accordingly, the
coefficient of correlation between assurance and customer loyalty indicated a high
positive relationship (r = 0.70, n =180, p ≤ 0.01). Further, strong positive correlation
existed between EM and customer loyalty; RES and customer loyalty; REL and
customer loyalty; and TAN and customer loyalty with p ≤0.01; n =180; r= 0.69, 0.68,
0.66, and 0.62 respectively and p < .01. The coefficients of correlation between
service quality dimensions and customer loyalty are all below the cut-off of 0.90 for
the collinearity problem. Therefore, multi-collinearity problem does not occur in this
part of the research (Hair et al., 1998). The correlations are also evidence of validity
and reliability of measurement scales used in this research (Barclay et al., 1995; Hair
et al., 1998).
Multiple regression analysis
The result in table 5.17 demonstrated that the independent variables (TA, REL, RES,
AS, and EM) were in combination significant predictors of customer loyalty. Further,
the P value = 0.000<0.01 which was significant. This indicated that overall model
was statistically significant with F (5, 174) = 51.751; R2 = 0.598; P<.01). The
predictor variables jointly explained 59.8% variance of customer loyalty. TA (β =
0.197; t = 2.072; P<.05); REL (β = 0.239; t = 2.886; P <.01); and Empathy (β =
0.196; t = 2.899; P <.01) were significantly the independent predictors of customer
loyalty. Therefore, the alternative hypothesis 5:1 is accepted in that customer
service quality has significant impact on customer loyalty.

137
Table 5. 17: Model summary, ANOVA and determination of multiple regression equation for customer service quality dimensions and customer loyalty: (N180).
Variable Coe-
fficient
Std.
error
Beta T Sig. Correlations Collinearity
Statistics
Zero-order
Partial
Part Tole-rance
VIF
Constant 19.001 .281 67.563 .000
TA .197 .095 .146 2.072 .040 .617 .155 .100 .465 2.151
REL .239 .083 .225 2.886 .004 .656 .214 .139 .380 2.630
RES .139 .082 .150 1.701 .091 .679 .128 .082 .298 3.376
AS .090 .104 .100 .863 .389 .704 .065 .041 .172 5.782
EM .196 .068 .274 2.899 .004 .687 .215 .139 .259 3.761
R .773
a
R Square .598
Adju. R
Square .586
P .000
Std. Error of the Estimate
2.057
F 51.751
Durbin-
Watson 1.885
Source: compiled from spss 16 output
After the standardization of coefficients, the highest beta is 0.274 (EM) which
revealed to be the most important variable towards customer satisfaction. Thus,
regression equation based on standardized coefficients of beta values for predicting
Y could be expressed as follows:
Y = α + β1x1+β2x2 +β3x3
Where:
Y = value of the Dependent variable (CL)
α = Constant or intercept
βi =the slope (Beta coefficient) for X i
X1 = Tangibles (TAN)
X2 = Reliability (REL)
X3 = Empathy (EM)
Y = 19.001+ .146 TAN + .150 RES + .225 REL + .274 EM

138
The regression coefficient value of EM (Empathy) level is high which is equal to .274.
Hence, to increase customer loyalty, it requires due emphasis on EM and then on
the other factors. The Constant is 19.001 when all of the independent variables have
zero value. The hypothesis test confirms that tangibles, responsiveness, and
empathy were positively correlated with customer loyalty. The findings of the study
indicated customer service quality dimensions have significant impact on customer
loyalty. This result is in line with the theoretical model proposed by Lazarus (1991)
and Bagozzi et al. (1992) and the findings of Sureshchandar et al., (2003), Siddiqi
(2011), Glaveli et al., (2006), and Ndubisi (2006).
Hypothesis: 6.
H 6.0: There is no correlation between customer satisfaction and customer loyalty in
the commercial banks in Ethiopia.
H 6.1: There is a positive correlation between customer satisfaction and customer
loyalty in the commercial banks in Ethiopia.
The sixth hypotheses was formulated to investigate the relationship between
customer satisfaction and customer loyalty in the commercial banks in Ethiopia. The
hypotheses was developed based on the service management and marketing
literature and based on the findings among others of Siddiqi (2011).
Correlation analysis:
Based on appendix 26, the correlation matrix disclosed positive and strong
correlation between CS2 (satisfaction with the way the service is provided) and CL
with coefficient correlation r =.795 at p < 0.00 level. The correlation between CS3
(satisfaction with the easy access to the services of the bank) and CL, indicated that
there was a significant correlation between two variables with coefficient correlation r
= .612 at p < 0.00 level. Similarly the correlation between CS 4 (satisfaction with the
workers' skill in providing services) & CL, CS5 (satisfaction with the courteousness of
the workers) and CL and CS6 (satisfaction with the speed of providing services) and
CL showed that there were a significant correlation between two variables with
coefficient correlation r =.610 at p < 0.00 level, r =.661 at p < 0.00 level, and r =.606
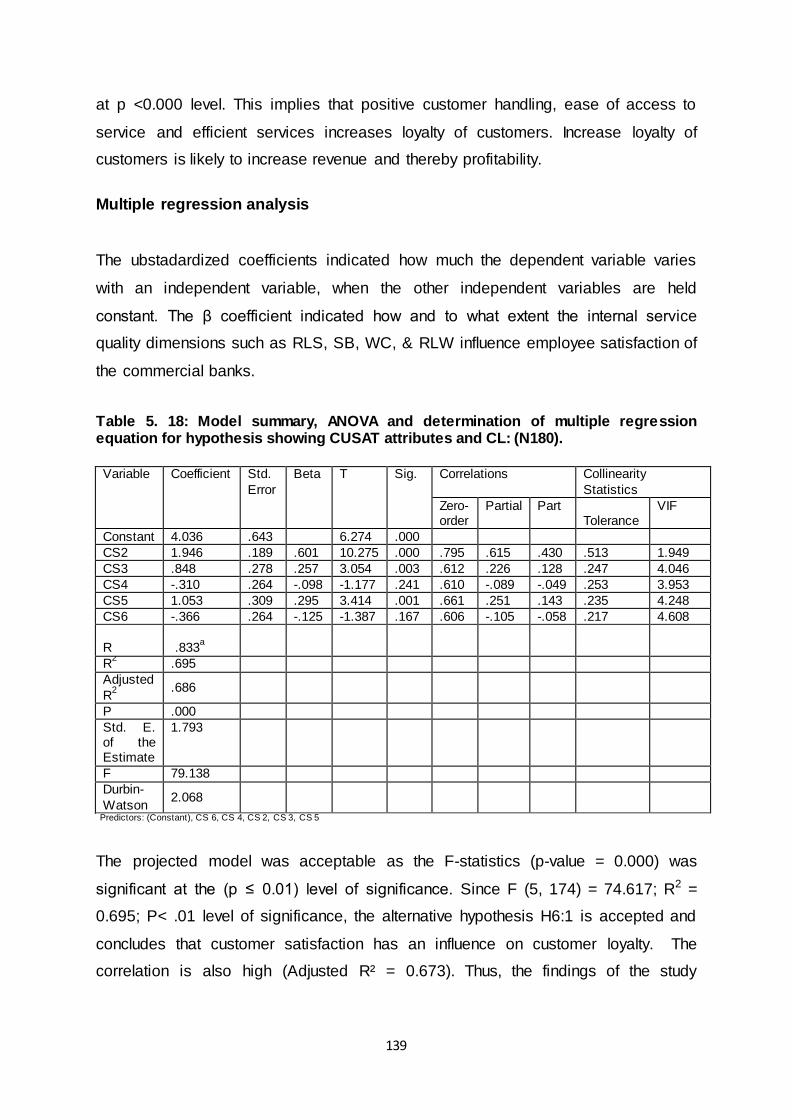
139
at p <0.000 level. This implies that positive customer handling, ease of access to
service and efficient services increases loyalty of customers. Increase loyalty of
customers is likely to increase revenue and thereby profitability.
Multiple regression analysis
The ubstadardized coefficients indicated how much the dependent variable varies
with an independent variable, when the other independent variables are held
constant. The β coefficient indicated how and to what extent the internal service
quality dimensions such as RLS, SB, WC, & RLW influence employee satisfaction of
the commercial banks.
Table 5. 18: Model summary, ANOVA and determination of multiple regression equation for hypothesis showing CUSAT attributes and CL: (N180).
Variable Coefficient Std.
Error
Beta T Sig. Correlations Collinearity
Statistics
Zero-order
Partial Part Tolerance
VIF
Constant 4.036 .643 6.274 .000
CS2 1.946 .189 .601 10.275 .000 .795 .615 .430 .513 1.949
CS3 .848 .278 .257 3.054 .003 .612 .226 .128 .247 4.046
CS4 -.310 .264 -.098 -1.177 .241 .610 -.089 -.049 .253 3.953
CS5 1.053 .309 .295 3.414 .001 .661 .251 .143 .235 4.248
CS6 -.366 .264 -.125 -1.387 .167 .606 -.105 -.058 .217 4.608
R .833
a
R2 .695
Adjusted
R2
.686
P .000
Std. E. of the Estimate
1.793
F 79.138
Durbin-
Watson 2.068
Predictors: (Constant), CS 6, CS 4, CS 2, CS 3, CS 5
The projected model was acceptable as the F-statistics (p-value = 0.000) was
significant at the (p ≤ 0.01) level of significance. Since F (5, 174) = 74.617; R2 =
0.695; P< .01 level of significance, the alternative hypothesis H6:1 is accepted and
concludes that customer satisfaction has an influence on customer loyalty. The
correlation is also high (Adjusted R² = 0.673). Thus, the findings of the study
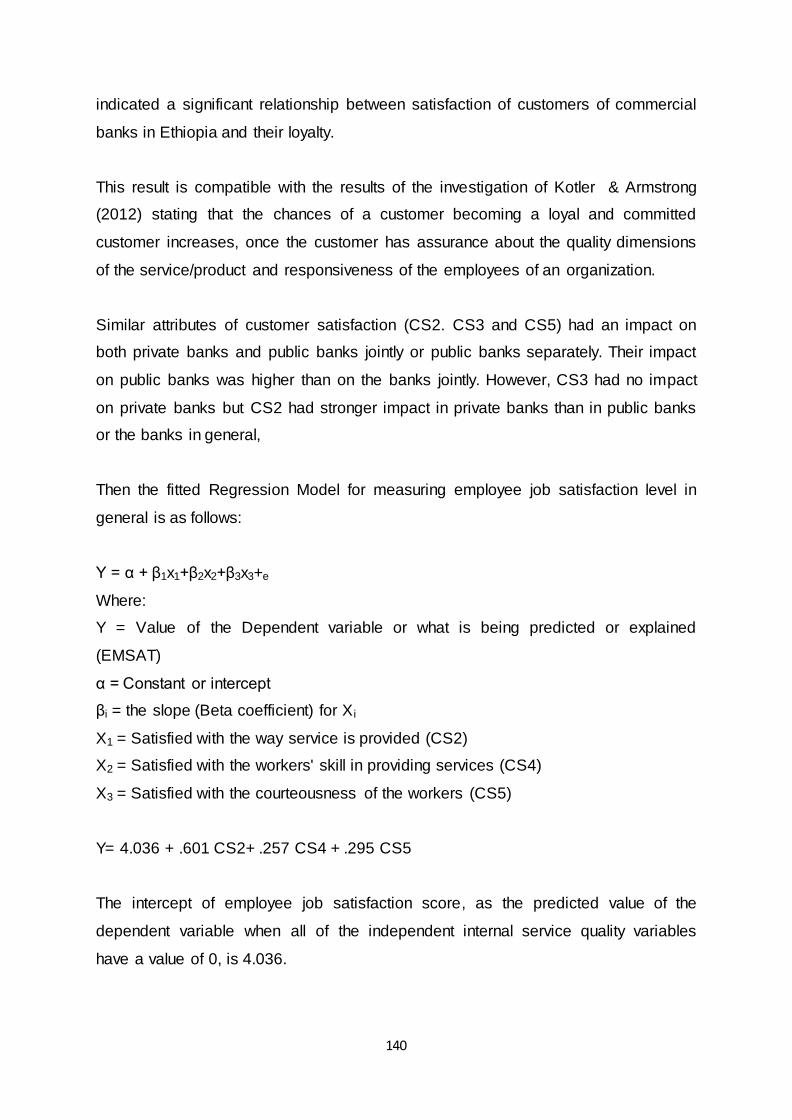
140
indicated a significant relationship between satisfaction of customers of commercial
banks in Ethiopia and their loyalty.
This result is compatible with the results of the investigation of Kotler & Armstrong
(2012) stating that the chances of a customer becoming a loyal and committed
customer increases, once the customer has assurance about the quality dimensions
of the service/product and responsiveness of the employees of an organization.
Similar attributes of customer satisfaction (CS2. CS3 and CS5) had an impact on
both private banks and public banks jointly or public banks separately. Their impact
on public banks was higher than on the banks jointly. However, CS3 had no impact
on private banks but CS2 had stronger impact in private banks than in public banks
or the banks in general,
Then the fitted Regression Model for measuring employee job satisfaction level in
general is as follows:
Y = α + β1x1+β2x2+β3x3+e
Where:
Y = Value of the Dependent variable or what is being predicted or explained
(EMSAT)
α = Constant or intercept
βi = the slope (Beta coefficient) for X i
X1 = Satisfied with the way service is provided (CS2)
X2 = Satisfied with the workers' skill in providing services (CS4)
X3 = Satisfied with the courteousness of the workers (CS5)
Y= 4.036 + .601 CS2+ .257 CS4 + .295 CS5
The intercept of employee job satisfaction score, as the predicted value of the
dependent variable when all of the independent internal service quality variables
have a value of 0, is 4.036.
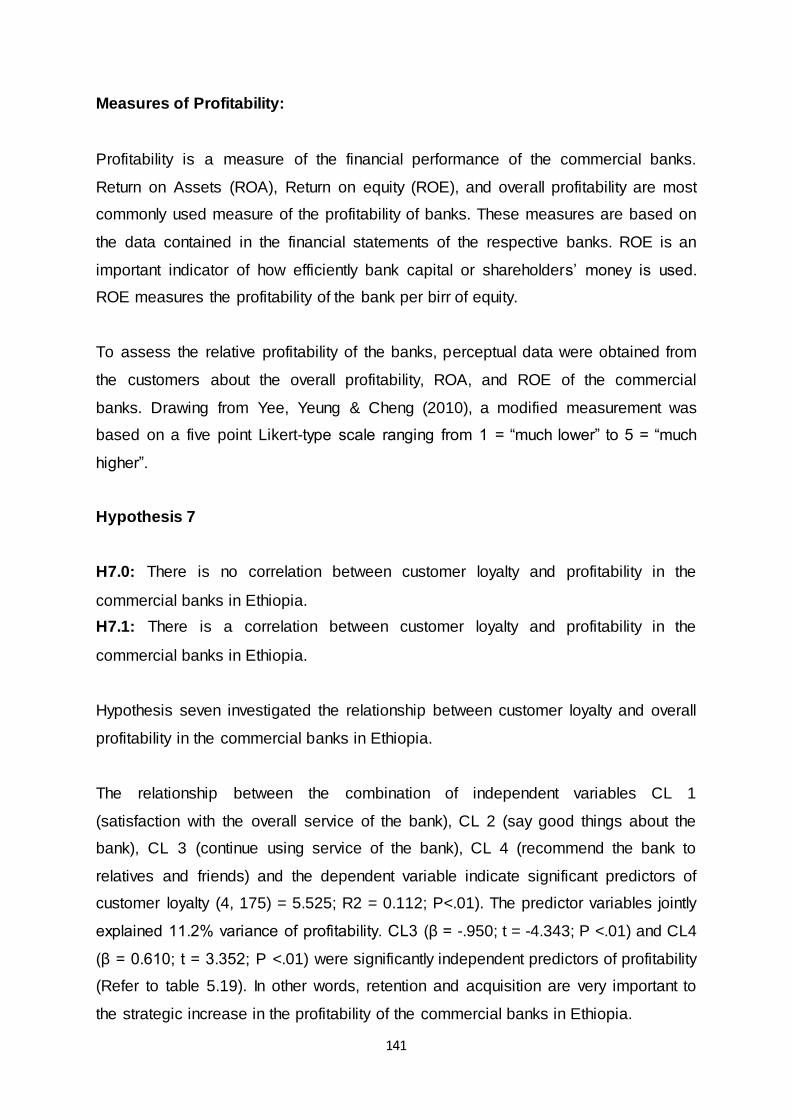
141
Measures of Profitability:
Profitability is a measure of the financial performance of the commercial banks.
Return on Assets (ROA), Return on equity (ROE), and overall profitability are most
commonly used measure of the profitability of banks. These measures are based on
the data contained in the financial statements of the respective banks. ROE is an
important indicator of how efficiently bank capital or shareholders‟ money is used.
ROE measures the profitability of the bank per birr of equity.
To assess the relative profitability of the banks, perceptual data were obtained from
the customers about the overall profitability, ROA, and ROE of the commercial
banks. Drawing from Yee, Yeung & Cheng (2010), a modified measurement was
based on a five point Likert-type scale ranging from 1 = “much lower” to 5 = “much
higher”.
Hypothesis 7
H7.0: There is no correlation between customer loyalty and profitability in the
commercial banks in Ethiopia.
H7.1: There is a correlation between customer loyalty and profitability in the
commercial banks in Ethiopia.
Hypothesis seven investigated the relationship between customer loyalty and overall
profitability in the commercial banks in Ethiopia.
The relationship between the combination of independent variables CL 1
(satisfaction with the overall service of the bank), CL 2 (say good things about the
bank), CL 3 (continue using service of the bank), CL 4 (recommend the bank to
relatives and friends) and the dependent variable indicate significant predictors of
customer loyalty (4, 175) = 5.525; R2 = 0.112; P<.01). The predictor variables jointly
explained 11.2% variance of profitability. CL3 (β = -.950; t = -4.343; P <.01) and CL4
(β = 0.610; t = 3.352; P <.01) were significantly independent predictors of profitability
(Refer to table 5.19). In other words, retention and acquisition are very important to
the strategic increase in the profitability of the commercial banks in Ethiopia.
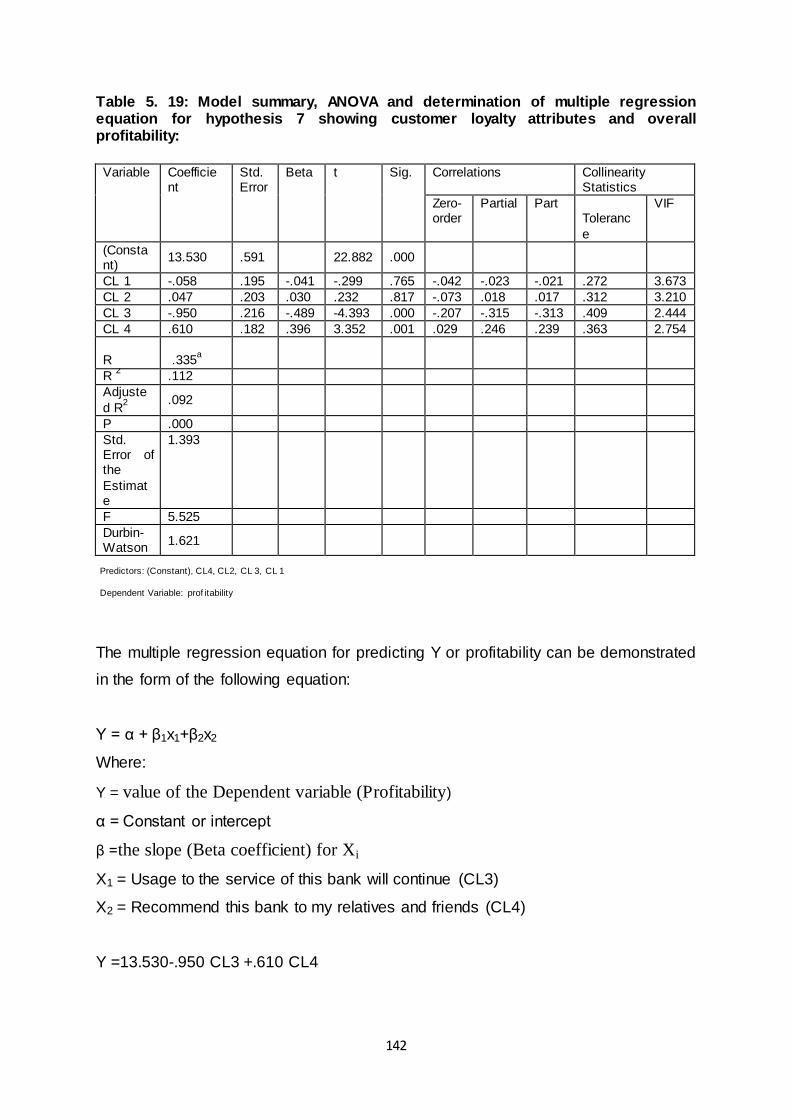
142
Table 5. 19: Model summary, ANOVA and determination of multiple regression equation for hypothesis 7 showing customer loyalty attributes and overall profitability:
Variable Coefficie
nt Std. Error
Beta t Sig. Correlations Collinearity Statistics
Zero-order
Partial Part Toleranc
e
VIF
(Constant)
13.530 .591
22.882 .000
CL 1 -.058 .195 -.041 -.299 .765 -.042 -.023 -.021 .272 3.673
CL 2 .047 .203 .030 .232 .817 -.073 .018 .017 .312 3.210
CL 3 -.950 .216 -.489 -4.393 .000 -.207 -.315 -.313 .409 2.444
CL 4 .610 .182 .396 3.352 .001 .029 .246 .239 .363 2.754
R .335
a
R 2 .112
Adjuste
d R2
.092
P .000
Std. Error of the
Estimate
1.393
F 5.525
Durbin-Watson
1.621
Predictors: (Constant), CL4, CL2, CL 3, CL 1
Dependent Variable: prof itability
The multiple regression equation for predicting Y or profitability can be demonstrated
in the form of the following equation:
Y = α + β1x1+β2x2
Where:
Y = value of the Dependent variable (Profitability)
α = Constant or intercept
β =the slope (Beta coefficient) for Xi
X1 = Usage to the service of this bank will continue (CL3)
X2 = Recommend this bank to my relatives and friends (CL4)
Y =13.530-.950 CL3 +.610 CL4

143
The predicted value of the dependent variable is 13.530 when all of the independent
variables of customer loyalty have a value of zero.
CL4 has a relatively higher slope in the equation which is 0.610. It is assumed that
every one unit increase in CL 4 increases the predicted overall profitability by the
same units after controlling CL3. The hypotheses test confirms that CL3 and CL4 are
correlated with customer profitability. CL4 shows the highest positive correlation with
customer loyalty. CL 3 shows a negative correlation with profitability.
It is noted from the literature that customer satisfaction has a long-term financial
impact on the operating results of a business (Nagar & Rajan, 2005; Chi & Gursoy,
2009). Highly satisfied customers of a firm are unlikely switch, but prolong fheir
business contact and as a means of attracting new customers (Anderson & Sullivan,
1994, and Gronholdt, et al, 2000).
The service-profit chain model (Heskett et al. (1994) proposed a relationship
between customer satisfaction, loyalty and profitability and further advocated that
higher customer satisfaction is followed by positive financial performance measures.
Anderson & Sullivan. (1994), Dresner & Xu (1995), Ittner & Larcker (1998),
Bernhardt et al. (2000), Homburg & Stock, (2005), Zhang & Pan, (2009); Yee et al.
(2008, 2010, and 2011) also found in their study a significant and positive
relationship between customer satisfaction and profitability. Thus, customer
satisfaction and customer loyalty are the basis for profitability for a business.
Table 5. 20: Profitability Indicators of Commercial Banks (2009-2013):
Banks
ROA ROE
2009 2010 2011 2012 2013 Ave. 2009 2010 2011 2012 2013 Ave.
C.B.E. 3.5 2.95 3.04 3.98 3.43 3.38 40.41 37.15 48.86 77.71 72.38 55.30
DB 2.85 2.93 3.34 4.05 3.26 3.29 30.49 31.89 35.15 40.44 31.33 33.86
AIB 2.5 3.4 4.0 3.6 3.8 3.46 21.2 29.3 32.1 27.0 28.0 27.52
LIB 0.34 3.45 3.0 4.0 4.0 2.96 1.45 18.43 15.0 19.0 23.0 15.38
NIB 3.6 3.7 4.0 3.7 5.1 4.02 23.2 24.4 24.0 21.0 35.0 25.52
UB 2.4 3.3 3.0 4.0 2.0 3.73 18.9 30.01 30.0 30.0 19.0 25.58
AB 2.1 2.4 2.7 2.8 2.4 2.48 21.4
25.5 29.0 27.6 21.5 25.0
WB 3.9 4.1 4.7 4.1 3.7 4.1 25.1 23.7 27.1 22.9 20.0 23.76
Ave. 3.43 28.99
Source: NBE
144
ROA measures how efficiently managers have been deploying the assets under their
control in generating profit. Many of the rewards to managers are tied up to the
profitability measured in terms of ROA. Thus, profit increases, with assets remaining
the same, indicates an increase in ROA. In terms of the average ROA (2009-2013),
WB is the most profitable bank (based on its 4.1% versus 3.43% industry average)
followed by NIB, UB, AIB, C.B.E, DB, LIB and AB respectively (Refer to table 5.26).
Financial leverage or debt is the major factor that separates ROE and ROA. If a firm
has no debt, its shareholders' equity and its total assets will be the same and its
ROE and ROA would also be the same. However, if a firm decides for financial
leverage, ROE would become greater than ROA. The data on table 5.26 indicate
that all banks are highly leveraged because their ROEs are by far larger than their
respective ROAs. This indicates the nature of banks in their ability to mobilize
deposits from customers so as to undertake their operations.
In terms of ROE, the banks under the study have registered increase in profitability
in the years 2009-2012 but marginal decrease in 2013. In this respect, C.B.E scored
extraordinarily the highest ROE of all banks during the years 2009-2013 based on its
average ROE of 55.3% versus the industry average of 28.99% followed by DB which
registered 33.86%. However, AIB, UB, NIB, AB, and WB scored slightly lower ROEs
than the average ROE while the profitability of LIB is by far lower than the industry
average (15.38%).
Impact of customer demographic factors on profitability
The demographic factors of the banks such as number of branches of a bank, age of
a bank, and type of bank were considered in the analysis so as to find out for any of
their respective possible impact on the overall profitability of the commercial banks in
Ethiopia using Kruskal-Wallis Analysis of Variance. The analysis is based on the
following hypothesis formulated based on empirical literature.

145
Hypothesis 8:
H8: 0 Number of branches of a bank has no effect on the overall profitability of the
commercial banks in Ethiopia.
H8: 1 Number of branches of a bank has an effect on the overall profitability the
commercial banks in Ethiopia.
To this effect, a Kruskal-Wallis Test revealed a statistically significant difference in
overall profitability levels across four different numbers of branch categories (Gp1, n
= 55: >150, Gp2, n = 37: [100-150], Gp3, n = 71: [99=80], Gp4, n = 17: < 80), χ2 (3,
n = 180) = 26.472, p = .000. The bank with the least number of branches (<80)
recorded a lower median score (Md= 10) than the other banks which indicated a
median of 12. This indicates that higher number of branches is positively and
significantly related to the profitability of the commercial banks in Ethiopia.
In order to inspect this effect, means rank was compared. It was identified that banks
with >150 number of branches are likely to generate the highest overall profitability
(mean rank 111.81), followed by banks with branches [99-80] (mean rank 88.13),
and banks with branches of [100=150] (mean rank 82.50) respectively.
H9: 0 Age of a bank has no effect on the overall profitability of the commercial banks
in Ethiopia.
H9: 1 Age of banks has an effect on the overall profitability of the commercial banks
in Ethiopia.
A Kruskal-Wallis Test was carried out to show the statistical significant difference in
the overall profitability levels across three age groups of the banks where (Gp1, n =
55: >20 years, Gp2, n = 904: [20-15 years], and Gp3, n = 31: <16 years, χ2 (2, n =
180) = 17.244, p = .000. The bank with the highest age group (> 15 years) revealed
a higher score (Md= 12). This indicates that a longer period of years in operation is
positively and significantly related to the overall profitability of the commercial banks
in Ethiopia. The mean rank indicates that overall profitability is related the age of the
banks. That is, banks with >20 years in service stand first (mean rank 111.81)
followed by banks with age of [20-16] years (mean rank 82.97), and by banks with

146
ages < 16 years (mean rank 88.13), and banks with branches of [100=150] (mean
rank 75.53) respectively.
H 10:01: The type of bank has no effect on the overall profitability of the commercial
banks in Ethiopia
H 10:1: The type of bank has an effect on the overall profitability of the commercial
banks in Ethiopia.
A statically significant difference of overall profitability across bank type was also
tested using a Kruskal-Wallis Test. A p-value of 0.000 depicted that H: 10:1 were
accepted. This also indicates that type of bank is positively and significantly related
to the overall profitability of the commercial banks in Ethiopia.
Abysinia bank revealed a lower median score (Md= 9) and followed by Lion
International bank with a median score (Md = 11). Wegagen bank revealed the
highest median score (Md = 13) and the other banks indicated a median of 12.
In order to inspect this effect, means rank was compared. It was identified that
Wegagen bank revealed the highest overall profitability (mean rank 123.12) followed
by CBE with (mean rank 109.55).
5.11 Comparative Tests Using Multiple Regression Analysis of Public
and Private Banks:
The result in appendix 21 shows that RLS, SB, WC, & RLW were significantly
independent predictors of employee satisfaction of public and private banks
respectively with P <.01. The remaining independent variables were in combination
significant predictors of employee job satisfaction of both public and private banks.
The predictor variables related to public banks jointly explained 98% variance of
employee job satisfaction while those related to private banks explained 97.8% of
the variance of employee job satisfaction.
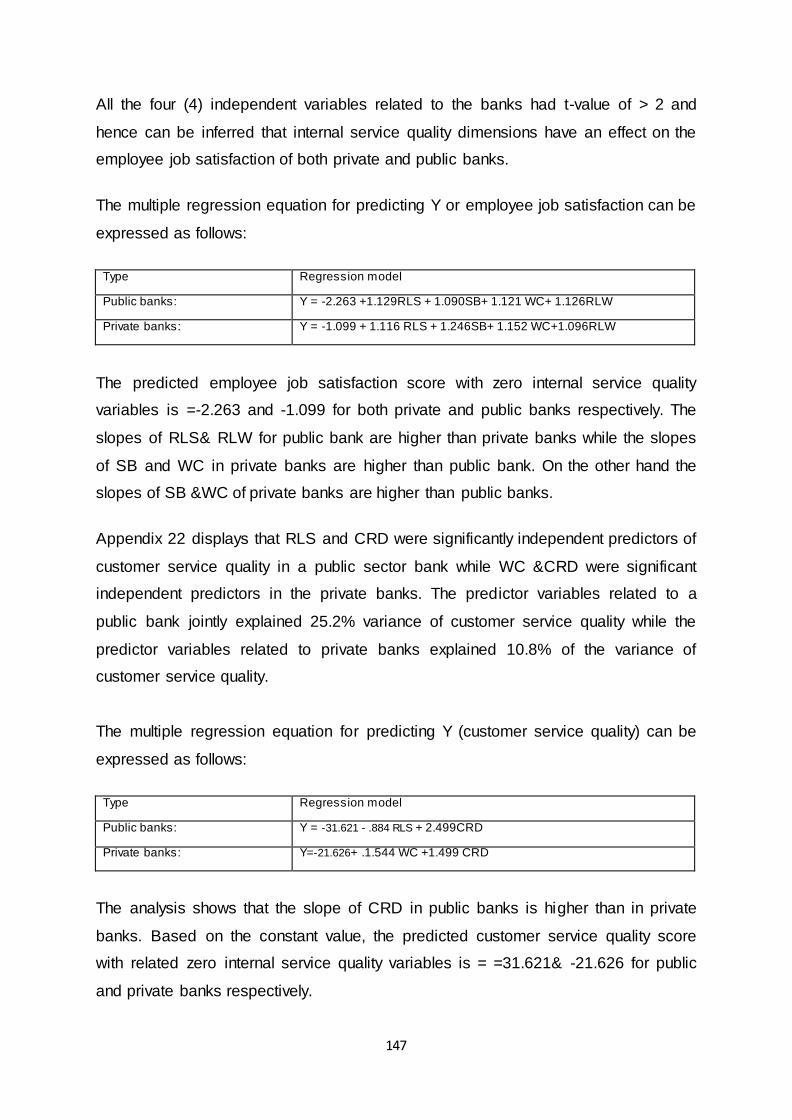
147
All the four (4) independent variables related to the banks had t-value of > 2 and
hence can be inferred that internal service quality dimensions have an effect on the
employee job satisfaction of both private and public banks.
The multiple regression equation for predicting Y or employee job satisfaction can be
expressed as follows:
Type Regression model
Public banks: Y = -2.263 +1.129RLS + 1.090SB+ 1.121 WC+ 1.126RLW
Private banks: Y = -1.099 + 1.116 RLS + 1.246SB+ 1.152 WC+1.096RLW
The predicted employee job satisfaction score with zero internal service quality
variables is =-2.263 and -1.099 for both private and public banks respectively. The
slopes of RLS& RLW for public bank are higher than private banks while the slopes
of SB and WC in private banks are higher than public bank. On the other hand the
slopes of SB &WC of private banks are higher than public banks.
Appendix 22 displays that RLS and CRD were significantly independent predictors of
customer service quality in a public sector bank while WC &CRD were significant
independent predictors in the private banks. The predictor variables related to a
public bank jointly explained 25.2% variance of customer service quality while the
predictor variables related to private banks explained 10.8% of the variance of
customer service quality.
The multiple regression equation for predicting Y (customer service quality) can be
expressed as follows:
Type Regression model
Public banks: Y = -31.621 - .884 RLS + 2.499CRD
Private banks: Y=-21.626+ .1.544 WC +1.499 CRD
The analysis shows that the slope of CRD in public banks is higher than in private
banks. Based on the constant value, the predicted customer service quality score
with related zero internal service quality variables is = =31.621& -21.626 for public
and private banks respectively.
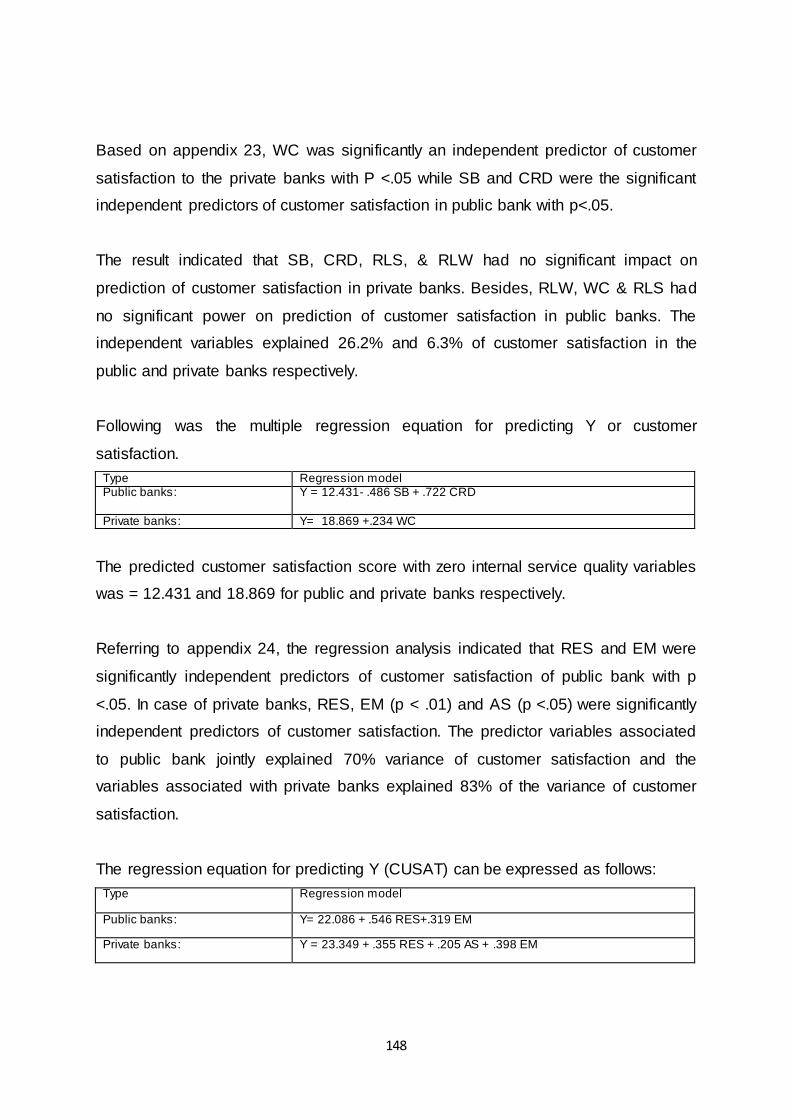
148
Based on appendix 23, WC was significantly an independent predictor of customer
satisfaction to the private banks with P <.05 while SB and CRD were the significant
independent predictors of customer satisfaction in public bank with p<.05.
The result indicated that SB, CRD, RLS, & RLW had no significant impact on
prediction of customer satisfaction in private banks. Besides, RLW, WC & RLS had
no significant power on prediction of customer satisfaction in public banks. The
independent variables explained 26.2% and 6.3% of customer satisfaction in the
public and private banks respectively.
Following was the multiple regression equation for predicting Y or customer
satisfaction.
Type Regression model Public banks: Y = 12.431- .486 SB + .722 CRD
Private banks: Y= 18.869 +.234 WC
The predicted customer satisfaction score with zero internal service quality variables
was = 12.431 and 18.869 for public and private banks respectively.
Referring to appendix 24, the regression analysis indicated that RES and EM were
significantly independent predictors of customer satisfaction of public bank with p
<.05. In case of private banks, RES, EM (p < .01) and AS (p <.05) were significantly
independent predictors of customer satisfaction. The predictor variables associated
to public bank jointly explained 70% variance of customer satisfaction and the
variables associated with private banks explained 83% of the variance of customer
satisfaction.
The regression equation for predicting Y (CUSAT) can be expressed as follows:
Type Regression model
Public banks: Y= 22.086 + .546 RES+.319 EM
Private banks: Y = 23.349 + .355 RES + .205 AS + .398 EM

149
The slope of RES for public banks is higher than private banks whereas the slope of
EM for private banks is higher than public banks. This indicates that RES is more
correlated to public bank than private banks while EM is more correlated to private
banks compared to public bank. The Constant is the predicted value of the
dependent variable when all of the independent variables have a value of zero. In
the context of this analysis, the predicted customer satisfaction score with zero
customer service quality variables is =.22.086 and 23.349 for public and private
banks respectively.
Appendix 25 points out that TA, REL and EM were significantly independent
indicators of customer loyalty of private banks with P <.05. These variables
explained 50.5% variance of customer loyalty. On the other hand, the customer
service quality variables are not in combination significant predictors of customer
loyalty in public banks.
The multiple regression equation for predicting Y or customer loyalty can be
expressed as follows:
Type Regression model
Public banks: Y = -.134 + .407RES+.374EM
Private banks: Y= 19.184 + .247 TAN +.369 REL + .214 EMP
The predicted customer loyalty score with zero customer service quality variables
indicated -.134 and 19.184 for public and private banks respectively.
Appendix 26 revealed that CS2 & CS5 were significantly independent predictors of
customer loyalty in both public and private banks. However, CS 3 & CS 4 were
independently significant predictors of public and private banks respectively. The
predictor variables jointly explained 64.5% and 76.1% variance of customer loyalty in
the public and private banks respectively.
The multiple regression equation for predicting Y or profitability can be expressed as
follows:

150
Type Regression model
Public banks: Y =4.446+1.161 CS 2+1.336 CS + 1.558 CS 5
Private banks: Y= 3.755 + 2.803 CS 2- .664 CS 4 + 1.025 CS 5
The predicted profitability score with zero customer satisfaction variables is = 4.446
and 3.755 for public and private banks respectively. CS 2 has the highest slope with
private banks while CS 5 has the highest slope with public banks.
Appendix 27 revealed that CL3 & CL4 were significantly independent predictors of
overall profitability in the public bank. CL3 was significant independent predictor of
private banks. The predictor variables jointly explained 21.3% and 7.2% variance of
profitability in the public and private banks respectively.
The multiple regression equation for predicting Y or profitability can be expressed as
follows:
Type Regression model
Public banks: Y =15.733- 1.263CL 3 +.657CL 4
Private banks: Y= 12.419-.748CL 3
The predicted profitability scores with zero customer loyalty variables are =15.733
and 12.419 for public and private banks respectively.
5.12 Summary and Key Findings
The theoretical literature and empirical studies provide evidence on the need to
incorporate both financial and non-financial measures of performance. The main
objective of the current study was to find the interrelationships between employee
satisfaction, customer service quality, customer satisfaction, customer loyalty and
profitability in the commercial banks in Ethiopia. This study was conducted with a
sample of 180 respondents, which were employees and customers of different
banks.

151
This chapter reviewed the demographic characteristics of the sampled respondents
relevant to achieve the objectives of the study by means of SPSS 16. Tests of
validity and reliability were conducted to the variables of the study. An exploratory
factor analysis, through a principal component analysis (PCA) with Varimax rotation
was conducted to test the construct validity of questionnaire items. The Kaiser–
Meyer–Olkin measure of sampling adequacy for the internal service quality
dimensions, employee satisfaction, customer service quality dimensions, customer
satisfaction customer loyalty and profitability were all above the recommended value
of 0.6. The result of the factor analysis indicated the existence of five dimensions for
each of the internal service quality and customer service quality items and one
dimension for each of customer satisfaction, customer loyalty and overall profitability
items with eigenvalues greater than one. The Bartlet tests of sphericity was
significant at p < 0.01 indicating suitability of the sample for factor analysis.
The reliability of the measures of the study was assessed using the inter-item
consistency measure of Cronbach‟s alpha. Result of Cronbach‟s alpha showed that
all measurements of the constructs were reliable indicating above the threshold
value of 0.70.
Descriptive statistics were computed for the various dimensions of employee job
satisfaction, customer service quality, customer satisfaction, and customer loyalty.
Results indicated that employees of the banks had the highest satisfaction from the
subscales RLW, RLS and WC constituting mean of 4.28, 4.18 and 4.06 respectively.
Customers of the banks had the highest satisfaction from the subscales CS 5 and
CS 4 constituting mean of 3.91 (SD= .895) and 3.74 (SD= 1.01) respectively. In
other words, the customers of the banks were more comfortable with the
courteousness and the skill of the employees in providing services respectively. In
relation to customer loyalty, CL 3 was the highest indicator with a mean of 4.14,
followed by CL 4 with a mean score of 3.91. This was related to the decision of the
customers to continue using the service of their banks and refer the bank to relatives
and friends.
A set of assumptions for multiple regression analysis were tested. Correlation and
multiple regression analysis were used to test the study hypotheses. On the basis of

152
the perceived customer service quality, customers were satisfied with the
convenience of branch location and working hours; the behaviour of bank employees
in paying due attention to their specific needs and dealing with customers in a caring
fashion (empathy); appealing facilities and materials, modern looking equipment,
neat and professionally appearing employees (tangibles); and the behaviour of
employees in instilling confidence in customers, the feeling of safety in transactions,
consistent courteousness of customers, and knowledge employees to answer
customers' questions (assurance).
To identify the strength of the relationship between two variables, correlation
analysis was carried out. The correlation matrix indicated that four internal service
quality dimensions (RLS, SB, WC, & RLW) were positively and strongly correlated
with employee job satisfaction.
Two of internal service quality dimensions (WC & CRD) were positively correlated
with customer service quality and customer satisfaction. However, the correlation
was weak.
Finally, five of the internal service quality dimensions (TA, REL, RES, AS and EM)
were positively and strongly correlated with customer satisfaction and customer
loyalty.
153
CHPTER 6
CONCLUSIONS, IMPLICATIONS, AND AREAS OF FUTURE
RESEARCH
6.1. Conclusions
The purpose of the study was to identify a comprehensive measure of performance
by assessing the relationship between employee satisfaction and customer
satisfaction on the profitability of the commercial banking industry in Ethiopia. The
thesis assumed unidimensional path models, multivariate approach and factor
analysis to address the objectives of the sttudy.
The hypothesized relationships were constructed on the epicenter of considering
people as the most important asset of any organization. In view of this, scholars
have spent an undue time and vigour focusing on what motivates employees and
customers in cementing their relationships. Various motivational theories have been
developed to shed light into what motivates people to behave the way they do.
Employee satisfaction is overriding, since it is detrimental to the success or failure of
any organization. Satisfied employees are motivated to perform better, leading to
improvement in the quality of their work, produce quality service and meet the
requirements of customers. These added values, in-turn, increase organisational
profitability.
Understanding how to apply motivational theories in the workplace can take the
leadership skills to the next level. Therefore, managers need to apply in their
practices and policies the concepts of the equity theory, the expectancy theory,
social exchange theory, attitude theory and emotional theory among others to
leverage on the contributions of the employees towards achieving quality service and
customer satisfaction. Customer retention and attraction will ultimately lead to
profitability.

154
6.2. Policy Implications of the Findings
6.2.1. Managerial Policy Implications of the findings
1. The result of the regression analysis indicated that there was a positive significant
relationship between internal service quality dimensions and employee job
satisfaction in the commercial banks in Ethiopia. It is worth paying due attention to
the satisfaction of employees because banks are highly dependent in the intangible
knowledge resource of their employees in their operations.
Employees were satisfied with SB, WC, RLS and RLW respectively. In view of this,
management should pay attention to remain competitive in SB scales and packages.
Management should also pay due attention to make work content more attractive
and allow the employees to enthusiastically engage themselves in the work.
Besides, the relations of the management with the employees is a motivating factor
and this could be stated by management as building trust through the participation of
employees in making decisions related to their routine job activities and that are
directly related to job satisfaction. Further, the harmonious relationship among the
workers is vital in the creation of a favourable work environment and efficient
communication.
Generally, banks can use the results of the study in further strengthening the
satisfaction of the employees. Besides, the finding of this study highlighted the need
for planning and developing strategies related to benefit packages, in public banks,
that could induce retention and enhance employee perceptions and satisfaction
respectively. The private banks should also invest their effort towards improving the
RLW, WC, & RLS components of internal marketing/service quality. It is also
important to periodically gauge the level of satisfaction of their employees and
design new strategies that could address the situation at hand. This is quite
important for the sustainable competitive survival of the banks in the emerging
environment.
2. The satisfaction of employees is believed to lead to a real improvement in services
provided to customers. Employees who feel that the organisation provides them with

155
a supportive working environment, and see that the organisation aspires to a high
quality of service and excellence, are often more willing to give customers the best
service. When customers meet a satisfied and enthusiastic employee, their
perceptions of the service are likely to reflect the positive encounter (Schneider,
White & Paul 1998).
3. Management of the commercial banks in Ethiopia recognise, at least in their
respective annual reports, employees as the most valuable assets of their respective
banks. This notion has a reality, since employees are the parties who have di rect
contact with customers and generate feedback about their feelings on service of the
banks. This requires creating an overall environment for the employees to contribute
towards service quality.
4. From the perspective of the banks in general, the study confirmed significant a
positive relationship between service quality attributes and customer satisfaction.
Besides, SERVQUAL can be used as an instrument for measuring the bank service
quality in Ethiopia. Therefore, bank managers can use this instrument to assess their
respective bank service quality. Based on the results of the study, the management
of the banks has to keep up with the service quality dimensions that had significant
correlation with customer satisfaction including responsiveness, assurance and
empathy components of the SERVQUAL.
However, results show that tangibles and reliability were not positively correlated
with customer satisfaction. The proximate availability of banking services consequent
to the horizontal and vertical expansion of the banks, the availability of ATMs, and
the introduction of IT linked banking services has accelerated the efficiency of the
services offered by the banks. All these benefits seem to have offset the desire of
customers to focus on tangibles against efficiency. But the importance of tangibles
could not be undermined. Therefore, banks have to work more for easier
accessibility of their services through the expansion of branch network, the use of
ATMs, expansion of IT linked banking services, the appearance of the staff,
maintaining secured parking lots, ventilated offices, and sufficient waiting places.
.
156
Reliability is one of the important factors driving customer satisfaction. It refers to the
extent to which the service is delivered according to the standards expected and
promised. The results of the study indicated no relationship between reliability and
customer satisfaction in the banks in Ethiopia. Therefore, management has to work
more in providing speedy services and resolve the problems of their customers.
However, it is worth noting the impeding external factors such as power, network
problems, and policy issues which are beyond the control of management.
The above discussions can also refer to private banks. In case of public banks, there
was no correlation between assurance and customer satisfaction. Therefore, the
management of the public bank has to build the competence of their staff, including
the recruitment, training and the like so as to build the trust and confidence of their
customers which is the core of a banking business.
5. Maintaining customer satisfaction has been recognised as a means of building
customer loyalty. It is also believed to be less costly to maintain existing customers
than attracting new customers. However, loyal customers may also be prone to
defect if they feel like getting better value, convenience or quality elsewhere.
Therefore, the level of customer satisfaction cannot remain static for long if it is not
checked periodically and take the necessary measures for adjustment. Therefore,
bank management should always keep on ensuring that their customers are intact in
their satisfaction with bank services. Specifically, even if public banks are better in
CS2 than private banks, management of both private and public banks have to work
towards improving the indicated predictors and their lingering predictors of customer
loyalty.
6. Customer loyalty is the core strategic tool in the struggle for a competitive edge.
Then, bank management need to have continuous feedback from their customers,
evaluate the need for appropriate measures, and build the capacity of the front line
staff in handling customer requests. From this perspective, it can be inferred that
C.B.E. has made improvements in deposit mobilization.

157
6.2.2 Public Policy Implications of the Findings
The Ethiopian financial system is still closed to foreign entry. The competitive
environment would have been different had there been foreign players in the market.
Therefore, the Federal Government of Ethiopia needs to take further measures in the
liberalization of the financial sector, including entry of foreign banks given the need
for alternative corridors of service quality to the customers, increase the competitive
efficiency of the banks, benefit from technology transfer and benefit from the
country‟s desire in joining the World Trade Organisation.
6.3 Limitations of the study
The current study provided empirical and theoretical insights into the relationships
between the constructs of employee satisfaction, customer service quality, customer
satisfaction, customer loyalty, and profitability. Nevertheless, the study was not free
from limitations.
First, the study employed quantitative research design based on survey data
collected from employees and customers of banks to test the theoretical models,
thus limiting the choice of methodology.
Second, the cross sectional nature of the data on employee job satisfaction,
customer service quality, customer satisfaction and customer loyalty limited the
scope to justify the causal inferences to profitability which was based on historical
data.
Third, the data were also analysed based on the personal experiences and
perceptions of the respondents. As a result, the study might be affected by response
bias possibly emerging from the respondent‟s subjectivity.
Fourth, the study was not based on probability sampling (but based on convenience
sampling). This was due to the difficulty faced by the researcher to get a list and
address of the population of the study. Thus, in spite of the causal relationships
158
shown between variables using regression models, this limits for making
generalisations about the population based on the sample data collected.
Fifth, all the hypotheses were not tested simultaneously in a single model. It has
been proved that multiple regression analysis can explain how the predictor
variables combine to affect the dependent variable. Despite the advantage of this
approach, the nature of the study and the small sample size inhibits the use of more
powerful statistical methods associated with larger sample sizes.
Sixth, the sample size of the study was 180 and the study was geographically bound
to the banks in Northern Ethiopia of Tigrai Regional State which might affect the
generalizability of the results.
Seventh, this study was non-experimental where the researcher relied on
interpretation, but could not control, manipulate, or alter the predictor variables.
Thus, statements of causality under such causal inferences could not be taken for
granted.
Eighth, a firm‟s financial performance might be influenced by several factors
including satisfaction. Nevertheless, this study did not consider other factors that
might influence the financial performance of an organisation.
Finally, the research was limited to the commercial banks in Ethiopia and this may
raise alarms on the generalisability of the findings on other sectors.
6.4 Suggestions for Future research
Acknowledging the above limitations, the study forwards the following areas of future
research.
1. Future research has to be conducted by supplementing the quantitative approach
with qualitative research such as focus group sessions, structured interviews, and
other complementary sources of data involving other stakeholders from top

159
management such as corporate level managers including the managers for Branch
Banking, Finance and Accounting and Human resource and Central services of the
commercial banks. These interviewees could contribute in view of their positions in
the formulation and execution of strategies, policies and guidelines relevant to the
financial performance, human resource affairs, and operations and branching
decisions of their respective banks. Further, this may possibly provide richer data
and significantly strengthen the research design and the findings to account for more
rigorous tests of causality
2. it would be imperative to conduct longitudinal studies using a mixed method so as
to offset the disadvantages of cross-sectional research, assess the changing
behaviour of employees and customers, consider the factors affecting the change,
examine more accurate causal relationships and draw the consistency of using
performance measures based on BSC and SPC approaches over time.
3. Future research should be based on a random probability sampling method which
can provide results that are more accurate.
4. Finally, future research could account for more rigorous tests of causality using
larger samples, additional relevant explanatory variables, and more powerful
statistical analytical methods such as SEM

160
Bibliography
Abbasi, M.M., Khan, M.M. and Rashid, K., 2011. Employee empowerment, service
quality and customer satisfaction in Pakistani banks. IUP Journal of Bank
Management, 10(4), pp.47-60.
Abd-El-Salam, E.M., Shawky, A.Y. and El-Nahas, T., 2013. The impact of corporate
image and reputation on service quality, customer satisfaction and customer loyalty:
testing the mediating role. Case analysis in an international service company.
Journal of Business and Retail Management Research, 8(1), pp. 130-153
Abu-Suleiman, A., 2006. An analytical performance management framework
enabling-enterprise strategy management. PhD thesis. The University of Texas,
Arlington.
Acheampong, I. and Asamoah, K.A., 2013. Service Delivery and Business Growth
Among Banks in Ghana Using the Service Profit Chain Model, InternationalJournal
of Global Business, 6 (2), pp. 57-79.
Adams, J. S. 1965. Inequality in Social Exchange in Advances in Experimental
Psychology, L. Berkowitz (ed.), Academic Press, New York, NY.
Adams, J. S. 1963. Towards An Understanding of Inequality,Journal of Abnormal
and Normal Social Psychology, (67), pp. 422-436.
Ahmad, S., Khalil, A.A., Rashed, C.A. and Ferdoushi, N., 2012. Effect of Some
Selected Factors on Job Satisfaction in Public Banking. IOSR Journal of Business
and Management, 5(3), pp.41-46.
Ahmed, I., Razzaque, R. and Ramzan, M., 2011. Examining the Links Between
Employee and Customer Variables of Service Profit Chain: A Case of Pakistani
Banks. Australian Journal of Basic and Applied Sciences, 5(11), pp. 1634-1645.
161
Ahokpossi, C., 2013. Determinants of Bank Interest Margins in Sub-Saharan Africa,
International Monetary Fund, WP/13/34, PP. 1-20.
.
Al-Hawary, S., Al-Qudah, K., Abutayeh, P., Abutayeh, S. and Al-Zyadat, D., 2013.
The impact of internal marketing on employee‟s job satisfaction of commercial
banks in Jordan. Journal of Contemporary Research in Business, 4(9), pp. 811-826.
Al-Hawary, S., Alhamali, R.M., and Alghanim, S.A. 2011. Banking Service Quality
Provided by Commercial Banks and Customer Satisfaction. American Journal of
Scientific Research, 27, pp. 68-83
Al Sawalqa, F., Holloway, D. and Alam, M., 2011. Balanced Scorecard
implementation in Jordan: An initial analysis. International Journal of Electronic
Business Management, 9(3), pp. 196-211.
Alderfer, C. P. 1969. An empirical test of a new theory of human needs.
Organizational Behavior and Human Performance, 4(2), pp. 142–175.
Alemayehu, G., 2006. The Structure and Performance of Ethiopia‟s Financial Sector
in the Pre- and Post-Reform Period with a Special Focus on Banking,UNIU/WIDER.
Ali, K. Akhtar, M.F. and Ahmed, H.Z., 2011. Bank-Specific and Macroeconomic
Indicators of Profitability - Empirical Evidence from the Commercial Banks of
Pakistan. International Journal of Business and Social Science, 2(6), pp. 235-242.
Almazari, A., 2011. Financial Performance Evaluation of Some Selected Jordanian
Commercial Banks, Master Thesis in MBA in the School of Management, Blekinge
Inistitute of Technology. International Research Journal of Finance and Economics,
68, pp. 50-63.
162
Anber, A. and Shireen, Y., 2011. Service Quality Perspectives and Customer
Satisfaction in Commercial Banks Working in Jordan. Middle Eastern Finance
and Economics I4, pp. 61-72.
Anderson, E. W. and Sullivan, M. W., 1994. The Antecedents and Consequences of
Customer Satisfaction for Firms. Marketing Science, 12(2), pp. 125-143.
Anderson, K. and McAdam, R., 2004. A critique of benchmarking and performance
measurement: lead or lag?. Benchmarking: an international Journal, 11(5), pp.465-
483.
Annual Report, 2013, National Bank of Etiopia.
Athanasoglou, P.P., Brissimis, S.N. and Delis, M.D., 2008. Bank-specific, industry-
specific and macroeconomic determinants of bank profitability. Journal of
international financial Markets, Institutions and Money, 18(2), pp.121-136.
Atkinson, H., 2006. Performance measurement in the international hospitality
industry. Accounting and financial management, p.46.
Arnolds, C.A. and Boshoff, C. 2002. Compensation, esteem valence and job
performance: an empirical assessment of Alderfer's ERG theory. The International
Journal of Human Resource Management, 13 (4), pp. 697-719.
Austin, I.L., 2013. 2. performative utterances. The Semantics-Pragmatics Boundary
in Philosophy, p.21.
Awan, A.G., Hassan, J., and Shahid, P., 2014. Relationship between Employees
Motivation & Customer Satisfaction - A case study of selected Banks in Pakistan.
Global Journal of Human Resource Management, .2 (3), pp. 1-12.
163
Babakus, E., Bienstock, C., and Scotter, J., 2004. Linking perceived quality and
customer satisfaction to store traffic and revenue growth. Decision Sciences, 35 (4),
pp. 713-737.
Bader, H. A. M., Hashim, I. H. M., and Zaharim, N. M. 2013. Job Satisfaction among
Bank Employees in Eastern Libya,. American International Journal of Social Science,
2(1), pp. 30-44.
Bagozzi, R.P., Yi, Y., and Phillip, L.W., 1992. Assessing Construct Validity in
Organizational Research. Adminstrative Science Quarterly, 36 (3), pp. 421-58.
Bartlett, M.S. 1954. A note on the multiplying factors for various chi square
approximations. Journal of the Royal Statistical Society, 16, pp. 296–298.
Baruch, Y. and Holtom, B.C., 2008. Survey response rate levels and trends in
organizational research. Human Relations, 61(8), pp.1139-1160.
Buchanan, A.L., McCubbin, L.D. and Adesope, O., 2016. Exploratory factor analysis
of the Trauma and Attachment Belief Scale among partners of service
members. Traumatology, 22(3), p.214.
Baxamusa, M., 2012. The Relationship between Underinvestment, Overinvestment
and CEO's Compensation. Review of Pacific Basin Financial Markets and Policies,
15(03), p.1250014.
Bhaskar, S.S. and Khera, S.N., 2013. Employee Satisfaction-Customer Satisfaction
Link: A Literature Review of Theoretical Explanations. Interdisciplinary journal of
contemporary research in business, 4(11), p.626.
Beerli, A., Martin, J. D., and Quintana, A. 2004. A model of customer loyalty in the
retail banking market. European Journal of Marketing, 38(1/2), pp. 253-275.
Beim, D. and Charles, W. C., 2001. Emerging Financial Markets, New York:
McGraw Hill.

164
Belainesh, D., 2011. Determinants of Commercial banks profitability-An empirical
study on the commercial banks in Ethiopia. Masters Thesis. Addis Ababa University,
Ethiopia.
Bento, A., Bento, R., and White, L., 2012. Validating Cause-and-Effect Relationships
in the Balanced Scorecard, Merrick School of Business, University of Baltimore.
Berger, A,, Hasan, I. and Zhou, 2009. Bank ownership and efficiency in China: What
will happen in the world‟s largest nation?. Journal of Banking & Finance, 33 (1), pp.
113-130.
Bernhardt, K., Donthu, N. Kennett, P. 2000. A Longitudinal Analysis of Satisfaction
and Profitability. Journal of Business Research, 47, pp. 161–17.
Bisbe, J. and Otley, D., 2004. The effects of the interactive use of management
control systems on product innovation. Accounting, Organizations and Society,
29(8), pp. 709–737.
Blau, P. M., 1964. Exchange and Power in Social Life., New York: Wiley
Bonin, J.P., Hasan, I., Wachtel, P. 2005. Bank performance, efficiency and
ownership in transition countries. Journal of Banking and Finance, 29(1), pp. 31–53.
Bosompem, M., Kwarteng, J. A., Obeng-Mensah, A. 2012. Determinants of
Motivation of Senior High School Agricultural Science Teachers in the Central
Region, Ghana. Journal of Arts, Science & Commerce, 3.
Boukis, A., Kaminakis, K., Siampos, A. and Kostopoulos, I., 2015. Linking internal
marketing with customer outcomes. Marketing Intelligence & Planning, 33(3),
pp.394-413.

165
Bourke, P. 1989. Concentration and Other Determinants of Bank Profitability in
Europe, North America and Australia, Journal of Banking and Finance, 13, pp. 65-
67.
Cardoso, E., Viaene, S. and Costa, C., 2009. Designing strategy maps for
programme performance measurement in higher education, International
Conference of European University Information Systems (EUNIS 2009), Santiago de
Compostela (Spain) date: 23-26 June 2009.
Cardozo, R.N. 1965. An experimental study of customer effort, expectation and
satisfaction. Journal of Marketing Research, 2, pp. 244-249.
Caruana, A. 2002. Service loyalty – the effects of service quality and the mediating
role of customer satisfaction. European Journal of Marketing, 36(7/8), pp. 811- 27.
Case, J. 1995. Open-book management: The coming business revolution. New
York, HarperCollins.
Cavana, R.Y., Delahaye, B.L. and Sekaran, U., 2001. Applied business research:
Qualitative and quantitative methods. John Wiley & Sons Australia.
Chandler, A.D., 1962. Strategy and structure: The history of American industrial
enterprise. MIT Press, Cambridge, Mass.(1977) The Visible Hand, Harvard
University Press, Cambridge, Mass.(1980) The Growth of the Transnational
Industrial Firm in the United States and the United Kingdom: a Comparative
Analysis', Economic History Review, 33, pp.396-410.
Cheng, B-L., and Abdul Rashid, Z. 2013. Service Quality and the Mediating Effect of
Corporate Image on the Relationship between Customer Satisfaction and Customer
Loyalty in the Malaysian Hotel Industry. Gadjah Mada International Journal of
Business, 15(2), pp. 99 – 112.

166
Cheng, C. F., Lai, M. K. and Wu, W. Y. 2010. Exploring the impact of innovation
strategy on R&D employees‟ job satisfaction: A mathematical model and empirical
research. Technovation, 30 (7-8), pp. 459-470.
Chenhall, R.H. 2005. Integrative strategic performance measurement systems,
strategic alignment of manufacturing, learning and strategic outcomes: an
exploratory study. Accounting, Organizations and Society, 30, pp. 395-422.
Christina. G. and Gursoy, D. 2009. Employee satisfaction, customer satisfaction, and
financial performance: An empirical examination. International Journal of Hospitality
Management, 28(2), pp. 245-253.
Child, J. 1975. Managerial and organisational factors associated with company
performance. Part 2: a contingency analysis. Journal of Management Studies, 12,
pp. 12-27.
Child, J. 1972. Organizational structure, environment, and performance: The role of
Strategic choice. Sociology, 6, pp. 1 - 22.
Chow, C.W., Haddad, K.M. and Williamson, J.E., 1997. Applying the balanced
scorecard to small companies. Strategic Finance, 79(2), pp.21-27..
Chow , C. W., and Van der Stede, W. A. 2006. The use and usefulness of
nonfinancial performance measures.. Management Accounting Quarterly, 7(3), pp.
1-8.
Cohen, S., D. Thiraios and M. Kandilorou, 2008. Performance Parameters
interrelations from a Balanced Scorecard Perspective: An Analysis of Greek
Companies. Managerial Auditing Journal, 23(5), pp. 483-503.
Cohen, D., Gan, C., Yong, H., and Chong, E. 2007. Customer Retention by Banks in
New Zealand. Banks and Bank Systems, 2 (1), pp. 40-56.
Cole, G.A., 2004. Management theory and practice. Cengage Learning EMEA.

167
Costello AB, Osborne JW. 2015. Best Practices in Exploratory Factor Analysis: Four
Recommendations for Getting the Most From Your Analysis. Practical Assessment,
Research & Evaluation. 10(7):1-9.
Courtney, M.G.R. and Gordon, M., 2013. Determining the number of factors to retain
in EFA: Using the SPSS R-Menu v2. 0 to make more judicious estimations. Practical
Assessment, Research & Evaluation, 18(8), pp.1-14.
Cravens, K. 2000. Assessing th e Performanceof Strategic Alliances: Matching
Metrics to Strategies. European Management Journal 18 (5), pp. 529-541.
Creswell, J. W. 2004. Research Design: Qualitative, Quantitative, and Mixed
Methods Approaches. Thousand Oaks: Sage Publications.
Cronbach L. J. 1951. Coefficient Alpha and Internal Structure of Test.
Psychometrika, 16, pp. 297-334.
Cronin, J.J., Brady, M.K., and Hult, G.T.M. 2000. Assessing the effects of quality,
value, and customer satisfaction on consumer behavioral intentions in service
environments. Journal of Retailing, 76 (2), pp. 193–218.
Cronin, J. Taylor. A. 1992. Measuring service quality: A reexamination and
extension. Journal of Marketing, 56 (3), pp. 55-68.
Cropanzano, R., M. S. Mitchell. 2005. Social exchange theory: An interdisciplinary
review. Journal of Management 31(6), pp. 874-900.
Cropanzano, R. Rupp, D. and Byrne, S. 2003. The relationship of emotional
exhaustion to work attitudes, job performance and organizational citizenship
behaviours. Journal of Applied Psychology, 88(1), pp. 160-169.

168
Danish, R. Q. and Usman, A. 2010. Impact of Reward and Recognition on Job
Satisfaction and Motivation: An Empirical Study from Pakistan. International Journal
of Business and Management, 5 (2), pp. 159-167.
Davis, S. and Albright, T. 2004. An Investigation of the effect of Balanced Scorecard
Implementation on Financial Performance. Management Accounting Research, 15,
pp. 135-153.
De Vaus, D., 2013. Surveys in social research. Routledge.
DeBusk, G. K., Brown, R. M., and Killough, L. N. 2003. Components and relative
weights in utilization of dashboard measurement systems like the balanced
scorecard. British Accounting Review, 35(3), pp.215-23
Deng, Z., Lu, Y., Wei, K.K. and Zhang, J., 2010. Understanding customer
satisfaction and loyalty: An empirical study of mobile instant messages in China.
International journal of information management, 30(4), pp.289-300.
Devie, Tarigan, J. and Widjaja, D. 2012. The Relationship between Non-Financial
Performance and Financial Performance Using Balanced Scorecard Framework: A
Research in Cafe and Restaurant Sector. International Journal of Innovation,
Management and Technology, 3 (5), pp. 614- 618.
Dick, A., and Basu, K. 1994. Customer loyalty: Towards an integrated framework.
Journal of the Academy of Marketing Sciences, 22 (2), pp. 99-113.
Donaldson, L. 2001. The Contingency Theory of Organisations. California: A Sage
publications Inc.
Donthu, N. and Yoo, B. 1999. Cultural Influences on Service Quality Expectations.
Journal of Service Research, 1 (2), pp. 178 – 186.
Dresner, M., & Xu, K. 1995. Customer service, customer satisfaction, and corporate
performance in the service sector. Journal of Business Logistics, 16, p. 23.

169
Drucker, P. F. 1973. Management, New York: Harper & Row.
Drucker, P.F. 1954. The Practice o f Management. New York: Harper and Row
Publishers, Inc.
Dubey, R., Singh, T., Samar Ali, S., Venkatesh, V.G. and K. Gupta, O., 2014.
Exploring dimensions of firm competencies and their impact on performance: Some
exploratory empirical results. Benchmarking: An International Journal, 21(6),
pp.1003-1022.
Duncan, E., Elliott, G. 2004. Efficiency, customer service and financial
performanceamong Australian financial institutions, The International Journal of
Bank Marketing, 22(5), pp. 319-342.
Eccles, R. G., and Pyburn, P. J. 1992. Creating a comprehensive system to measure
performance. Management Accounting, Oct: 41-44.
Ellickson, M. C., and Logsdon, K. 2001. Determinants of job satisfaction of municipal
government employees. State and Local Government Review, 33(3), pp. 73-84.
Eshghi, A., Haughton, D., and Topi, H. 2007. Determinants of customer loyalty in
the wireless telecommunications industry. Telecommunications policy, 31 (2), pp. 93-
106.
Faboze, J. Modigliani, F. and Jones, F. 2005. Capital Markets, Institutions
andInstruments. 3rded. New Delhi: Prentice-Hall of India private limited
Fatih, M. 2012. Bank Specific and Macroeconomic Determinants of Turky.
Economics Bulletin, 32 (1): 586-595.
Fowler Jr, F.J., 2013. Survey research methods. Sage publications.

170
Fayol, H. 1916/1949. General and Industrial Management, London, Sir Isaac Pitman
& Sons, Ltd.
Fayol. H. 1916/1999. Aministration industrielle et générale, Paris, Dunod.
Fazlzadeh, A., Faryabi, M., Darabi, H.A., and Zahedi, B. 2012. A Survey on the
Effect of Service Delivery System on Corporate Performance Using Service Profit
Chain Model. Journal of Business and Management, 7(6), pp. 61-171.
Field, A.P. 2005. Discovering statistics using SPSS (2nd edition). London: Sage.
Fitzgerald, L., Johnston, r., Brignall, TJ, Silvestro, R. and Voss,
C.,(1991).Performance Measurement in Service Businesses.
Flynn, F. J. 2005. Identity orientations and forms of social exchange in organizations.
Academy of Management Review, 30 (4), pp. 737-750.
Forsman, S., 2001. Recource-Based strategy analysis: a case of logal food
processing firms in Finland. The food sector in transition: nordic research/Borgen,
SO (ed.).
Fornell, C. 1992. A National Customer Satisfaction Barometer: The Swedish
Experience. Journal of Marketing, 56 (1), pp. 6-21.
Fornell, C., Johnson, M.D., Anderson, E.W., Cha, J., and Bryant, E. 1996. The
American Customer Satisfaction Index: Nature, Purpose, and Findings. Journal of
Marketing, 60 (4), pp. 7-18.
Franco-Santos, M. Kennerley, M. Micheli, P. Martinz, V. Mason, S. Marr, B. Gray, D.
and Neely, A. 2007. Towards a definition of a business performance measurement
system. International Journal of Operations and Production Management, 27 (8), pp.
784-801.
171
Fuhrmann, T. 2006. Motivating Employees. WCDS Advances in Dairy Technology,
18, pp. 93-101.
García-Herrero, A and Santabárbara, D. 2008. Does the Chinese banking system
benefit from foreign investors?. BOFIT Discussion Paper, 11/2008, Bank of England.
Gelade, G. and Young, S. 2005. Test of a service profit chain model in the retail
banking sector. Journal of Occupational and Organizational Psychology, 78 (1), pp.
1–22.
George, D, and Mallery, P. 2003. SPSS for windows step by step: A sample Guide &
reference, Boston; Allyn & Bacon.
George, E., Louw, D. and Badenhorst, G., 2008. Job satisfaction among urban
secondary-school teachers in Namibia. South African Journal of Education, 28(2),
pp.135-154.
Gerwin, D., 1993. Manufacturing flexibility: a strategic perspective. Management
science, 39(4), pp.395-410.
Ghosh, S. and Mukherjee, S. 2006. Measurement of corporate performance through
Balanced Scorecard: An overview. Vidyasagar University journal of commerce,
11(3). Pp. 13-25.
Gimbert, X., Bisbe, J., & Mendoza, X. 2010. The role of performance
measurementsystems in strategy formulation processes, Long Range
Planning, 43(4), pp. 477-497.
Gimžauskienė, E., and Klovienė, L. 2009. The role of institutional factors on changes
of performance measurement system. Economics anc Management, pp. 22-29.
Gimzauskiene, E., and Kloviene, L. 2008. Implementing activity based management:
the role of organizational values. Social research, 4(14), pp. 26-35.
172
Gorji, M. & Sargolzaee, S. 2011. The study of the relation between service quality
and customer satisfaction the based on SERVQUAL model. International onference
on E-business, Management and Economics IPEDR, IACSIT Press, Singapore,
25, PP 191-196.
Grant, R.M., 2016. Contemporary strategy analysis: Text and cases edition. John
Wiley & Sons.
Grant, R. M. 2002. The Resource-Based Theory of Competitive Advantage:
Implications for Strategy. California Management Review, 33 (3), pp. 114-135
Gremler, D.D. and Brown, S.W., 1996. Service loyalty: its nature, importance, and
implications. Advancing service quality: A global perspective, 5, pp.171-181.
Grigorian, D. and Manole, V., 2002. Determinants of commercial bank performance
in transition: An application of data envelopment analysis.World Bank Policy
Research Working Paper, (2850).
Grigoroudis, E., Tsitsiridi, E. and Zopounidis, C., 2013. Linking customer satisfaction,
employee appraisal, and business performance: an evaluation methodology in the
banking sector. Annals of Operations Research, 205(1), pp.5-27.
Gronroos, C. 1988. Service quality: the six criteria of good perceived service quality.
Review of business, 9(3), PP. 10-12.
Groth, M. 2005. Customers as good soldiers: examining citizenship behaviors in
internet service deliveries. Journal of Management, 31(1), PP. 7-27.
Guerreiro, R, Alberto, C and Frezatti, F, 2006. Evaluating management accounting
change according to the institutional theory approach a case study of a Brazilian
bank. Journal of Accounting & Organizational Change, 2 (3), PP. 96-228.
173
Gull, S. and Ashraf, S.M. 2012. Impact of Internal Branding on Service Employees‟
Quality Commitment – Study on Education Sector of Pakistan. InternationalJournal
of Business and Social Science, 3 (14), PP. 302- 311.
Gull, S. Irshad, F. and Zaman, K. 2011. Factors affecting bank profitability in
Pakistan. The Romanian Journal, 4(39), PP,61-87.
Gumbus, A. 2005. Introducing the balanced scorecard: creating metrics to measure
performance. Journal of Management Education, 29(4), PP. 617-630.
Gupta, N. and Shaw, J. D., 2014. Employee compensation: The neglected area of
HRM research. Human Resource Management Review, 24:PP, 1–4
Gupta, S. and Zeithaml, V., 2006. Customer Metrics and Their Impact on Financial
Performance. Marketing Science, 25 (6), PP, 718-739.
Ha, N.P.N., 2014. The analysis of impacts of service quality on customer satisfaction
and customer loyalty: The case of Galaxy cinemas (Doctoral dissertation,
International University HCMC, Vietnam).
Hackman, J. R. and Oldham, G. R. 1975. Development of job diagnostic survey.
Journal of Applied Psychology, 60, PP, 159-170.
Hackman, J. R. and Oldham, G. R. 2010. Not what it was and not what it will be: The
future of job design research. Journal of Organizational Behavior, 31, PP. 463-479.
Heffernan, S and Fu, X. 2008. The determinants of bank performance in China.
Available at SSRN 1247713.
Hair, J.F., Black, W.C., Babin, B.J., Anderson, R.E. and Tatham, R.L., 2006.
Multivariate data analysis (Vol. 6).
Hair, J.F., Anderson, R.E., Tatham, R.L. and Black, W.C., 1998. Multivariate data
analysis, 5th. NY: Prentice Hall International.

174
Hallowell, R. 1996. The Relationship of Customer Satisfaction, Customer Loyalty,
and Profitability: An Empirical Study. Journal of Service Industry Management, 7 (4),
PP. 27-42.
Hambrick, D. 1981. Environment, strategy, and power within top management teams
administrative. Science Quarterly, 5, pp. 253-276.
Hammedi, W., Kandampully, J., Zhang, T.T. and Bouquiaux, L., 2015. Online
customer engagement: Creating social environments through brand community
constellations. Journal of Service Management, 26(5), pp.777-806.
Hatfield, E., Cacioppo, J. and Rapson, R. 1994. Emotional contagion. New York:
Cambridge University Press.
Hayes, R. H. and Abernathy, W. J. 1980. Managing our way to economic decline.
Harvard Business Review, July-August, pp. 67-77.
Herbert A. S. 1946. Administrative Behavior, Free Press, United States.
Herzberg, F., Mausner, B., Peterson, R.D. and Capwell, D.F., 1957. Job attitudes:
Review of research and opinions. Pittsburgh: Psychological Service of Pittsburgh.
Hoppock, R.(1935). Job satisfaction.
Herzberg, F., Mausner, B., and Snyderman, B.B. 1959. The motivation to work. New.
York: Wiley
Heskett, J.L., Sasser, W.E. and Schlesinger, L.A., 2010. The Value Profit Chain:
Treat Employees Like Customers and Customers Like. Simon and Schuster.
Heskett, J. L., Jones, T. O., Loveman, G. W., and Sasser Jr, W. E. Schlesinger, LA.
2008. Putting the Service-Profit Chain to Work. Harvard Business Review, 86(7/8),
PP, 118-129.
175
Heskett, J.L., Sasser, W.E., Schlesinger, L.A. 1997. The Service Profit Chain. The
Free Press, New York.
Heskett, J.L., Jones, T.O., Loveman, G.W., Sasser, W.E., Schlesinger, L.A., 1994.
Putting the service-profit chain to work. Harvard Business Review, 72 (2), PP.164-
175.
Homburg, C., and Stock, R. M. 2004. The link between salespeople‟s job satisfaction
and customer satisfaction in a business-to-business context: A dynadic analysis.
Journal of the Academy of Marketing Science, 32(2), PP, 144-158.
Homburg, C., and Stock, R. M. 2005. Exploring the conditions under which
salesperson work satisfaction can lead to customer satisfaction. Psychology and
Marketing, 22(5), PP. 393-420.
Hong, Y., Liao, H., Hu, J. and Jiang, K., 2013. Missing link in the service profit chain:
A meta-analytic review of the antecedents, consequences, and moderators of
service climate. Journal of Applied Psychology, 98(2), p.237.
Hoppock, R. 1935. Job satisfaction, New York: Harper and Brothers
Hoque, Z. 2004. A contingency model of the association between strategy,
environmental uncertainty and performance measurement: Impact on organizational
performance. International Business Review, 13 (4), PP. 485-502.
Hoque, Z. and James, W. 2000. Linking balanced scorecard measures to size and
market factors: impact on organizational performance. Journal of management
accounting research, 12(1), PP. 1-17.
Hur, W.M., Moon, T.W. and Jung, Y.S., 2015. Customer response to employee
emotional labor: the structural relationship between emotional labor, job satisfaction,
and customer satisfaction. Journal of Services Marketing, 29(1), pp.71-80.

176
Idris, A., Asari, F., Taufik. N., Salim, N., Mustaff, R., and Jusoff, K. 2011.
Determinant of Islamic Banking Institutions‟ Profitability in Malaysia. World Applied
Sciences Journal, 12, PP. 1-7.
Ifeoma, O. M. and Ijeoma M.M. 2012. Performance Measurement in Business
Organizations: An Empirical Analysis of the Financial Performance of Some
Breweries in Nigeria. Journal of Finance and Accounting, 3 (11), PP. 48-57.
Ishtiaq, I.M. 2011. An empirical investigation of customer satisfaction and
behavioural responses in Pakistani banking sector, Management & Marketing
Challenges for the Knowledge Society, 6 (3), PP. 457-470
Ittner, C. D. and Larcker, D. F. 2003. Coming up short on nonfinancial performance
measurement. Harvard business review, 81(11), PP. 88-95.
Ittner, C.D., Larcker, D.F. and Randall, T. 2003. Performance Implications of
Strategic Performance Measurement in Financial Services Firm. Accounting,
Organizations and Society, 28, PP. 715-741.
Ittner, C. D., and Larcker, D. F. 1998. Are nonfinancial measures leading indicators
of financial performance? An analysis of customer satisfaction. Journal of accounting
research, PP. 1-35.
Itnner, C. D., Larcker, D. F. and Rajan, M. V. 1997. The Choice of Performance
Measures in Annual Bonus Contracts. The Accounting Review, 72 (2), PP. 231-255.
Ivancevich, J., Konopaske, R. and Matteson, M. T. 2007. Organizational Behavior
and Management (8th ed.). New York: McGraw-Hill Higher Education.
Johnson, H.T., and Kaplan, R.S. 1987. Relevance Lost: The Rise and Fall of
Management Accounting. Boston: Harvard Business School Press.
Johnson, M. D. 1998. Customer orientation and market action, Upper Saddle River,
NJ: Prentice Hall.

177
Johnson, R. 1995. The Zone of Tolerance: Exploring the Relationship between
Service Transactions and Satisfaction with Overall Service. International Journal of
Service Industry Management, 6(2), PP. 46-61.
Jost, J.T. and Kay, A.C., 2010. Social justice: History, theory, and
research.Handbook of social psychology.
Kaiser, H.F., 1974. An index of factorial simplicity. Psychometrika, 39(1), pp.31-36
.Kaliski, B.S. 2007. Encyclopaedia of Business and Finance, Second edition,
Thompson Gale, Detroit.
Kamakura, W. A., Mittal, V., De Rosa, F., and Mazzon, J. A. 2002. Assessing the
service-profit chain. Marketing Science, 21(3), PP. 294-317.
Kamal, Y. and Hanif, F., 2009. Pay and job satisfaction: A comparative analysis of
different Pakistani commercial banks. Available at SSRN 1428346.
Kameswari, A.V. and Rajyalakshmi, N., 2012. Role of internal marketing in job
satisfaction of employees in State Bank of India. In Ninth AIMS International
Conference on Management, january 1-4, pp. 47-55.
Kaplan, R. 1984. The evolution of management accounting. The Accounting Review,
59(3), PP. 390-418.
Kaplan, R.S. and Norton, D.P. 1992 The balanced scorecard-Measures that
drive performance. Harvard Business Review, 70:(1), PP. 71-79.
Kaplan, R. S. and Norton D. P. 1996. The Balanced Scorecard-Translating strategy
into Action, Boston, Harvard Business School Press.
Kaplan, R. S. 2001. Strategic performance measurement and management in
nonprofit organizations. Non-profit Management and Leadership, 11(3), PP. 53-370.

178
Karim, A. and Chowdhury, T. 2014. Customer satisfaction on service quality in
commercial banking sector in Bangladesh. British Journal of Marketing Studies, 2
(2), PP, 1-11.
Kasperskaya, Y., 2007. Essays on causal performance measurement models.
Universitat Pompeu Fabra.
Keegan, D.P., Eiler, R.G., and Jones, C.R. 1989. Are your performance measures
obsolete?. Management Accounting, 70(12), PP. 45–50.
Kellen, V. and Wolf, B., 2003. Business performance measurement. Information
Visualization, 1(312), pp.1-36.
Khan, F., Tabassum, A. and Jahan, K., 2014. Assessment of Service Gap in
Superstores of Bangladesh by using SERVQUAL Model. Assessment, 4(1).
Khan, M.M. and Fasih, M., 2014. Impact of service quality on customer satisfaction
and customer loyalty: Evidence from banking sector. Pakistan Journal of Commerce
and Social Sciences, 8(2), pp.331-354.
Khan, A. H., Nawaz, M.M., Aleem M. and Hamed, W. 2012. Impact of job satisfaction
on employee performance: An empirical study of autonomous Medical Institutions of
Pakistan. African Journal of Business Management, 6(7), PP. 2697-2705.
Khan, F., Anuar, M. A., Choo, L. G., and Khan, H. 2011. Determinants of Bank
Profitability in Pakistan: A Case Study of Pakistani Banking Sector. World Applied
Sciences Journal, 15(10), PP. 1484-1493.
Khan, M. A., Rehman, K., Rehman, I., Safwan, N., and Ahmad, A. 2011. Modeling
Link between Internal Service Quality in Human Resources Management and
Employees Retention: A Case of Pakistani Privatized and Public Sector Banks.
African Journal of Business Management, 5(3), PP. 949-959.

179
Khan, U. M., Halabi, K. A., and Masud, Z. M. 2010. Emprical study of the underlying
theoretical ypothesis in the Balanced Scorecard (BSC) Model: Further evidence from
Bangladesh. Asia-Pacific Management Accounting Journal, 5 (2), PP. 45-73.
Kheng, L.L., Mahamad, O., Ramayah, T. and Mosahab, R. 2010. The Impact of
Service Quality on Customer Loyalty: A Study of Banks in Penang, Malaysia‟,
International Journal of Marketing Studies, 2 (2), PP. 57-66.
Khiaonarong, T and Liebena, J. 2009. Banking on innovations: modernization of
payment systems. Springer Publishing Company, UK.
Kim, Y.H., Kim, D.J. and Wachter, K., 2013. A study of mobile user engagement
(MoEN): Engagement motivations, perceived value, satisfaction, and continued
engagement intention. Decision Support Systems, 56, pp. 361-370.
Klein, S. 2003. The Natural Roots of Capitalism and Its Virtues and Values. Journal
of Business Ethics, 45(4), PP.387.
Kotler, P. and Armstrong, G. 2012. Principles of Marketing. 14thed. NJ: Pearson
Education Inc.
Kotter, John P. 1995. Leading Change. Harvard Business Review, March- April, PP.
56-67.
Kovach, K. A. 1987. What Motivates Employees? Workers and Supervisors Give
Different Answers. Business Horizons, 30 (5), PP. 58-65.
Kovach, K. A. 1995. Employee motivation: Addressing a crucial factor in an
organization's performance. Employment Relations Today, 22(2), PP. 93-107.
Koys, D. J. 2001. The effects of employee satisfaction, organizational citizenship
behavior, and turnover on organizational effectiveness: A unit‐level, longitudinal
study. Personnel psychology, 54(1), PP.101-114.

180
Kiyota, K., Peitsch, B. and Stern, R.M., 2007. The Case for Financial Sector
Liberalization in Ethiopia. Ann Arbor, 1001, pp.48109-3091.
Kumar, K. and Chandra B. 2006. Performance Measurement of Banks: An
application of BalancedScorecard. The Cost and Management, 34(6), PP. 21-30.
Kuusik, A., 2007. Affecting customer loyalty: Do different factors have various
influences in different loyalty levels?. The University of Tartu Faculty of Economics
and Business Administration Working Paper, (58-2007).
Ladhari, R. 2009. Assessment of the psychometric properties of SERVQUAL in the
Canadian banking industry. Journal of Financial Services Marketing, 14(1),PP.70-82.
Lages, C. R., and Piercy, N. F. 2012. Key drivers of frontline employee generation of
ideas for customer service improvement. Journal of Service Research, 15 (215), PP.
214-230.
Lapavitsas, C & Santos, P L D 2008. Globalisation and contemporary banking: on
the impact of new technology. Contributions to Political Economy, .27: 31- 56.
Lau, M.M. and Lam, A. 2013. Measuring Service Quality in the Banking Industry: A
Hong Kong Based Study. Contemporary Management Research, 9 (3), PP. 263-282.
Lazarus, R. 1991.Emotion and Adaptation. New York: Oxford University Press
Lee, C. and Wen-Jung, C., 2005. The effects of internal marketing and
organizational culture on knowledge management in the information technology
industry. International Journal of Management, 22(4), p.661.
Lee, M., Park, K., and Park, T. 2008. Effects of a link between service provider and
customer on a service supply chain. California Journal of Operations
Management, 6(1), PP. 102-108.
181
Lee, N. and Lings, L. 2008. Doing Business Research. Thousand Oaks: Sage
Publishing
Lensink, R, A Meesters, and Naaborg. 2008. Bank efficiency and foreign ownership:
Do good institutions matter?. Journal of Banking & Finance, 32 (5), PP.834-844.
Likert, R. 1932. A Technique for the Measurement of Attitudes,. Archives of
Psychology, 140, PP. 1-55.
Lin, H. H., and Wang, Y. S. 2006. An examination of the determinants of customer
loyalty in mobile commerce contexts. Information & management, 43, PP. 271-282.
Lin, X and Zhang, Y. 2009. Bank ownership reform and bank performance in China.
Journal of Banking & Finance, 33 (1), PP. 20-29.
Lings, I.N. and Greenley, G.E.2005. Measuring internal market orientation. Journal of
Service Research, 7(3), PP. .290-306.
Lisiecka, K. and Czyż-Gwiazda, E., 2013. Performance Measurement Models–
Comparative Review. In 57th EOQ Congress: Quality Renaissance-Co-creating a
Viable Future, Tallinn, Estonia.
Locke, E. A. 1968. Toward a theory of task motivation and incentives.
Organizational Behavior and Human Performance,3 (2), PP.157–189.
Locke, E. A. 1976. The nature and causes of job satisfaction. In M. D. Dunnette
(Ed.), Handbook Industrial and Organizational Psychology. Chicago: Rand McNally
College Publishing Company.
Locke, E. A. and Schweiger, D. M. 1979. Participation in decision-making: One more
look, Research in organizational behavior, 1(10), PP.265-339.

182
Luddy, N. 2005. Job satisfaction amongst employees at a public health inistitution in
the Western Cape, Cape:University of the Western Cape.
Lynch, R.L., and Cross, K.F. 1991. Measure Up: The Essential Guide to Measuring
Business Performance. London: Mandarin.
Malhotra, N. and Mukherjee, A. 2004. The relative influence of organizational
commitment and job satisfaction on service quality of customer –contact employees
in banking call centres. Journal of Services Marketing, 18(3), PP. 162-174.
Malina, M. A., and Selto, F. H. 2001. Communicating and controlling strategy: an
empirical study of the effectiveness of the balanced scorecard. Journal of
Management Accounting Research, 13(1), PP. 47-90.
Malmi, T. 2001. Balanced scorecards in Finnish companies: a research note.
Management Accounting Research, 12, PP. 207-20.
Manandhar, R and Tang, J. 2002. „The evaluation of bank branch performance using
data envelopment analysis: A framework‟, The Journal of High Technology Management
Research, 13 (1), PP. 1-17.
Mansor, N., Noor, J. M. M. and Hassan, N. F. N. 2012. Job Satisfaction among the
Bankers: An investigation on Islamic Financial Institution in Eastern Region of
Malaysia. Asian Social Science, 8(10), PP. 186-197
Manzoor, Q.A., 2012. Impact of employees motivation on organizational
effectiveness. Business management and strategy, 3(1), p.1.
Martins, H. and Proença, T., 2012. Minnesota Satisfaction Questionnaire–
Psychometric properties and validation in a population of Portuguese hospital
workers. FEP Economics and Management.
Maslow, A. 2013. A Theory of Motivation, UK. Amazon.com

183
Maslow, A. 1962. Notes on being-psychology‟, journal of Humanistic Psychogy, 2
(2), pp. 47-71.
Matzler, K. and Renzl, B. 2007. Assessing asymmetric effects in the formation of
employee satisfaction. Tourism Management, 28 (4), PP. 1093-1103.
Mayo, E. 1960. Human problems of an industrial civilization. Viring Press.
Mayo, E. 1923. The irrational factor in human behavior: The „night-mind‟ in industry.
The Annals of the American Academy of Political and Social Science,110, pp.117-
130.
McGregor, D. 1960. The Human Side of Enterprise, New York, McGraw-Hill.
Meena, M.L. and Dangayach, G.S. 2012. Analysis of Employee Satisfaction in
banking sector. International Journal of Humanities and Applied Sciences, 1(2), pp.
78-81.
Mishra, S. 2010. Internal Marketing- A Tool to Harness Employees Power in Service
Organizations in India. International Journal of Business and Management. 8(11),
PP. 45-61.
Mittal, S., Gera, R. and Batra, D.K., 2015. An evaluation of an integrated perspective
of perceived service quality for retail banking services in India.International Journal
of Bank Marketing, 33(3), pp.330-350.
Mohammad, T. and Abdullah, C. 2010. Profit maximisation theory, survival-based
theory, and contingency theory: A review on several underlying research theories
of corporate turnround. Jurnal Ekonom, 13 (2), PP. 138-143.
Mohsan, F., Nawaz, M.M., Khan, S., Shaukat, Z., and Aslam, N. 2011. Impact of
Customer Satisfaction on Customer Loyalty and Intentions to Switch: Evidence from
Banking Sector of Pakistan. International Journal of Business and Social Science,
2(16), PP. 263-270.

184
Mullins, L., J.,2010. „Management & Organisational Behaviour‟.
Munir, R., Perera, S., and Baird, K. 2011. An Analytical Framework to Examine
Changes in Performance Measurement Systems within the Banking Sector.
Australasian Accounting, Business and Finance Journal, 5(1), PP. 93-115.
Naceur, S. B. and Omran, M. 2011. The effects of bank regulations, competition, and
financial reforms on banks' performance. Emerging markets review, 12(1), PP. 1- 20.
Nadem, S. E. and Ekpenyong, O. E. 2013. Relating customer satisfaction to
profitability: An empirical analysis of the association between attitudes and
behaviour. Global Journal of Social Sciences, 1, PP. 49-61
Naeem, H., Akram, A. and Saif, M.I., 2011. Service Quality and its impact on
Customer Satisfaction: An empirical evidence from the Pakistani banking
sector. International Business & Economics Research Journal (IBER), 8(12).
Nagar, V., and Rajan, M. V. 2005. Measuring customer relationships: the case of
the retail banking industry. Management science, 51 (6), PP. 904-919.
Ndubisi, N. O. 2006. A structural equation modelling of the antecedents of
relationship quality in the Malaysia banking sector. Journal of Financial Services
Marketing, 11 (2), PP. 131-141.
Neely, A., Gregory, M., and Platts, K. 2005. Performance measurement system
design: a literature review and research agenda. International Journal of Operations
& Production Management, 25(12), PP. 1228-1263.
Neely, A. 1999. The performance measurement revolution: why now and what next?.
International Journal of Operations & Production Management, 19 (2), PP. 205-228.

185
Ngoc, H. 2014. The relationship between employee job satisfaction and productivity
in the banking industry: The case of Vietnam. African Journal of Social Sciences, 4
(3), PP. 60-82.
Nørreklit, H., 2003. The balanced scorecard: what is the score? A rhetorical analysis
of the balanced scorecard. Accounting, organizations and society,28(6), pp.591-619.
Norreklit, H., 2000. The balance on the balanced scorecard a critical analysis of
some of its assumptions. Management accounting research, 11(1), pp.65-88.
Nunnally, J. C. 2010. Psychometric theory, 2nded. New York: McGraw-Hill.
Odunlami, I.B., 2014. Impact of customer satisfaction and customer retention on
customer loyalty: A case study of enterprise bank in oyo. International Journal of
Education and Research, Odunlami, BI,(2014), 2(9), pp.234-242.
Ojo, O., 2010. The relationship between service quality and customer satisfaction in
the telecommunication industry: Evidence from Nigeria.BRAND. Broad Research in
Accounting, Negotiation, and Distribution, 1(1), pp.88-100.
Oh, H., Johnson, A.L., Lucianetti, L. and Youn, S., 2015. The Effect of Performance
Measurement Systems on Productive Performance: An Empirical Study of Italian
Manufacturing Firms. Available at SSRN.
Oliver, R.L. 1999. Whence consumer loyalty?. Journal of Marketing, 63 (Special
issue), PP. 33–44.
Oliver, R.L. 1997. Satisfaction: A behavioral perspective on the consumer. New
York: McGraw-Hill.
Oliver, R.L., Rust, R.T., and Varki, S. 1997. Customer delight: Foundations, findings,
and managerial insight. Journal of Retailing, 73 (3), PP.311–336.
186
Pallant, J. 2010. SPSS survival manual - A step by step guide to data analysis using
SPSS, 4th ed., Open University PressMcGraw-Hill.
Pandey, I.M. 2005. Balanced scorecard: myth and reality. Vikalpa, 30 (1), PP.134-
42.
Papageorgiou, G., Giorgalli, F., and Petrou, A. 2013. Management for Motivation and
Job Satisfaction in the COOP Banking Industry. International Journal of Economics
and Statistics, 1(1), PP.14-20.
Parasuraman, A., Zeithaml, V.A. and Berry, L.L. 1994. Alternative scales for
measuring service quality: a comparative assessment based on psychometric
and diagnostic criteria. Journal of Retailing, 70(3), PP.201-230.
Parasuraman, A. and Berry, L. L. 1991. Marketing for Services: Competing through
Quality, The Free Press, New York, NY.
Parasuraman, A., Zeithaml, V. and Berry, L 1988. SERVQUAL: A multiple item scale
for measuring customer perceptions of service quality. Journal of Retailing, 64(1),
PP.12-40.
Parasuraman, A., Berry, L.L and Zeithaml, V. 1985. A conceptual model of service
quality and the implications for future research. Journal of Marketing Management, 4
(49), PP.41-51.
Payne, M., 2014. Modern social work theory. Palgrave Macmillan.
Payne, A. and Frow, P. 2006. Customer relationship management: from strategy to
implementation. Journal of Marketing Management, 22(1-2), PP.135-168.
Payne, G. and Payne, J. 2013. Key Concepts in Social Research-Ethnography,
SAGE Publications, Ltd.

187
Pistoni, A. and Songini, L., 2015. New Trends and Directions in CSD: The Integrated
Reporting. In Sustainability Disclosure: State of the Art and New Directions (pp. 81-
105). Emerald Group Publishing Limited.
Pritchard, M., and Silvestro, R. 2005. Applying the service profit chain to analyse
retail performance: The case of the managerial strait-jacket?. International Journal
of Service Industry Management, 16(4), PP.337-356.
Proclamation No. 592/2008, article 23 of the Federal Democratic Republic Ethiopia
Pugh, S.D., 2001. Service with a smile: Emotional contagion in the service
encounter. Academy of management journal, 44(5), pp.1018-1027.
Pun, K. F., and White, A. S. 2005. A performance measurement paradigm for
integrating strategy formulation: A review of systems and frameworks.
International Journal of Management Reviews, 7(1), PP. 49-71.
Raduan, C. R, Jegak, U., Haslinda, A., and Alimin, I. 2009. Management, Strategic
Management Theories and the Linkage with Organizational Competitive Advantage
from the Resource-Based View. European Journal of Social Sciences,11(3),pp.
402-417.
Rafiq, M. and Ahmed, P.K. 2000. Advances in the internal marketing concept:
definition, synthesis and extension. Journal of Services Marketing, 14 (6), PP.449-
462.
Razak, R.M., Chong, C.S., and Lin, B. (2007). Service quality of a local Malaysian
bank: Customers‟ expectations, perceptions, satisfaction and loyalty. International
Journal of Services and Standards, 3 (1), PP.18-38.
Reichheld, F. F. 2000. „Lead for loyalty‟, Harvard Business Review, 79(7), pp. 76-84.
Reichheld, F., 1996. The Loyalty Effect – The Hidden Force Behind Growth, Profits
and Lasting Value, Boston, Harvard Business School Press.
188
Reichheld, F. F. and Sasser, W. 1990. Zero Defections: Quality Comes to Services.
Harvard Business Review, 68, PP.105-111.
Robbins, S.P. 1998. Organizational Behavior: Concepts, Controversies, Applications.
Upper
Rose, R.C., Kumar, N. and Pak, O.G., 2009. The effect of organizational learning on
organizational commitment, job satisfaction and work performance. Journal of
Applied Business Research, 25(6), p.55.
Roth, A. V. and Jackson, W. E. 1995. Strategic determinants of service quality and
performance: Evidence from te banking industry. Management Science, 41 (11), pp.
1720-1733.
Rucci, A. J., Kirn, S. P. and Quinn, R. T. 1998. The employee-customer-profit chain
at Sears. Harvard Business Review, Jan-Feb, 83-97.
Rust, R. T., Moorman, C., & Dickson, P. R. 2002. Getting returns from service
quality: Revenue expansion, cost reduction, or both. Journal of Marketing, 66
(October), 7- 24
Rust, R.T., and Oliver, R.L. 1993. Service quality: insights and managerial
implications from the frontier, JAI press, Greenwich, CT.
Rust, R. and Zahorik, A.J. 1993. Customer satisfaction, customer retention, and
market share. Journal of Retailing, 69, PP.193-215.
Sageer, A., Rafat, S. and Agarwal, P., 2012. Identification of variables affecting
employee satisfaction and their impact on the organization. IOSR Journal of
business and management, 5(1), pp.32-39.
189
Sanda, M.A. and Kuada, J., 2016. Influencing dynamics of culture and employee
factors on retail banks‟ performances in a developing country context. Management
Research Review, 39(5).
Sang, K., Ison, S. and Dainty, A. 2009. The Job Satisfaction of UK architects and
relationships with work-life balance and turnover intentions. Engineering,
Construction and Architectural Management, 16 (3), PP. 288-300.
Sasser, W.E, Olsen, R.P. & Wyckoff, D.D 1978. Management of service operations.
Allyn & Bacon, Boston, MA.
Sasser, E.W., and Arbeit, S.P. 1976. Selling Jobs in the Services Sector‟. Business
Horizons, 19 (3), PP.61-65.
Saunders, S. J., and Petzer, D.J.2010. The interrelationship between service quality,
satisfaction and behavioural intention by customer stage in the service delivery
processes. Management Dynamics, 19(1)P, P.25-34.
Schalm, R.L. and Kelloway, E.K., 2001. The relationship between response rate and
effect size in occupational health psychology research. Journal of Occupational
Health Psychology, 6(2), p.160.
Schermerhorn, J. R., Hunt, J. G., Osborn, R. N., and Uhl-Bein, M. 2011.
Organizational Behavior (11th Ed.). Pennsylvania, USA: John Wiley & Sons Inc.
Shrivastava, A. and Purang, P. 2009. Employee perceptions of job satisfaction:
Comparative study on Indian Banks. Asian Academy of Management Journal, 14,
(2), PP.65-78.
Seiders, K., Berry, L.L. and Gresham, L.G. 2000. Attention, retailers! How
convenient is your convenience strategy?. Sloan Management Review, 41 (3),
PP.79-89.

190
Sergeant, A and Frenkel, S. 2000. When do customer contact employees sail
customers?. Journal of Services Research, 3(I), pp. 18-34.
Siddiqi, K. O. 2011. Interrelations between service quality attributes, customer
satisfaction and customer loyalty in the retail banking sector in Bangladesh.
International Journal of Business and Management, 6(3), PP.12-40.
Singh, M., and Kumar, S. 2007. Balanced Scorecard Implementations Global and
Indian Experiences. Indian Management Studies Journal, 11, PP. 21-39.
Siti-Nabiha, A.K. and Scapens, R.W., 2005. Stability and change: an institutionalist
study of management accounting change. Accounting, Auditing & Accountability
Journal, 18(1), pp.44-73.
Slater, S. F., and Olson, E. M. 2002. A fresh look at industry and market analysis.
Business Horizons, 45(1), PP.15-22.
Smith, P. C., Kendall, L. M., and Hulin, C. L. 1969. The measurement of satisfaction
in work and retirement. Chicago: Rand McNally.
Speckbacher, G., Bischof, J. and Pfeiffer, T. 2003. A descriptive analysis on the
implementation of Balanced Scorecards in German-speaking countries.
Management Accounting Research, 14 (4), PP.361-388.
Spector, P. E. 1997. Job satisfaction: Application, Assessment, Causes, And
Consequence‟, Thousand Oaks, CA, Sage
Spector, P. E. 1985. Measurement of human service staff satisfaction: Development
of the job satisfaction survey. American Journal of Community Psychology, 13(6),
PP.693-713.
Spreng, MacKenzie, and Olshavsky 1996. An empirical examination of a model of
perceived service quality and satisfaction. Journal of Retailing,72(2), PP.201-14.
191
Stecher, M.D. and Rosse, J.G., 2007. Understanding reactions to workplace injustice
through process theories of motivation: A teaching module and simulation. Journal of
Management Education, 31(6), pp.777-796.
Steven, B. P. Lam, S. K. 2008. A Meta-Analysis of Relationships Linking Employee
Satisfaction to Customer Responses. Journal of Retailing, 84 (3), PP. 243-255.
Sufian, F. and Chong, R.R., 2008. Determinants of bank profitability in a developing
economy: Empirical evidence from the Philippines. Asian academy of management
journal of accounting and finance, 4(2), pp.91-112.
.
Soumadi, M.M. and Aldaibat, S. F. 2012. Growth strategy and bank profitability:
Case of Housing Bank for Trade and Finance, 8(22):
Sureshchandar, G., Rajendran, C., and Anantharaman, R.. 2003. Customer
perceptions of service quality in the banking sector of a developing economy: a
critical analysis. International Journal of Bank Marketing, 21(5), PP. 233-242.
Suzuki, E., Itomine, I., Kanoya, Y., Katsuki, T., Horii, S. and Sato, C. 2006. Factors
affecting rapid turnover of novice nurses in university hospitals. Journal of
Occupational Health, 48 (1), PP.49–61.
Swinton, S., 2006. Adams Equity Motivation Theory; Put Workplace Psychology Into
Action and Increase Motivation. Retrived from http://www. mftrou. com/adams-
equity-motivation-theory. html on September, 24, p.2009.
Tabachnick, B. G., & Fidell, L. S. 2007. Using multivariate statistics. Boston, MA:
Pearsons Education.
Tadeka, F., Ibaraki, N., Yokoyama, E., Miyake, T. and Ohida, T. 2005. The
relationship of job type to burnout in social workers at social welfare offices. Journal
Occupational Health, 47 (2):, pp. 119-125.
192
Tapanya, S. 2004. Examining the factors which influence performance measurement
and management in the Thai banking industry: an application of the balanced
scorecard framework. Phd thesis. Murdoch University.
Tarawneh, M., 2006. A comparison of financial performance in the banking sector:
Some Evidence from Omani Commercial Banks. International Research Journal of
Finance and Economics, 3(3), pp.101-112.
Taylor, F.W. 1991. The Principles of Scientific Management, New York, Harper.
Teeratansirikool, L., Siengthai, S., Badir, Y. & Charoenngam, C., 2013. Competitive
strategies and firm performance: the mediating role of performance measurement.
International Journal of Productivity and Performance Management, 62(2), pp.168-
184.
The Ethiopian commercial code No. 166 of 1960, article 63.
The Monetary and Banking Proclamation No.83/1994 for the Licensing and
Supervision of Banking Business.
Theriou, N.G., Loukas, A., Maditinos, D.I. and Theriou, G.N., 2007. Is the BSC
Really a New Performance Measurement System?. In 5th International Conference
on Accounting and Finance in Transition (ICAFT) conference proceedings, London:
Greenwich University Press.
Thibaut, J.W. and Kelley, H.H., 1959. The social psychology of groups.
Thompson, B. 2004. Exploratory and confirmatory factor analysis: understanding
concepts and applications. Washington, DC: American Psychological Association.
Thompson, A., Strickland, A., and Gamble, J. 2005. Crafting and Executing
Strategies. New Delhi: TATA McGraw-Hill.
193
Tornow, W.W. and Wiley, J.W. 1991. Service quality and management practices: a
look at employee attitudes, customer satisfaction, and bottom line consequences.
Human Resource Planning, 14(2), PP.105-15.
Treacy, M., and Wiersema, F. 1993. Customer intimacy and other value disciplines.
Harvard business review, 71(1), PP.84-93.
Trujillo-Ponce, A. 2013. What determines the profitability of banks? Evidence from
Spain. Accounting and Finance, 53(2), PP.561-586
Tsai, Y., and Wu, S. W. 2011. Using internal marketing to improve organizational
commitment and service quality. Journal of advanced nursing, 67(12), PP.2593-
2604.
Tsai, Y. and Tang, T. 2008. How to improve service quality: internal marketing as a
determining factor. Total Quality Management and Business Excellence Review,
19, PP.1117–1126.
Tseng, M.L., Lan, L.W., Wang, R., Chiu, A. and Cheng, H.P., 2011. Using hybrid
method to evaluate the green performance in uncertainty. Environmental Monitoring
and Assessment, 175(1-4), pp.367-385.
Verbeeten, F.H.M. and Boons, A.N.A.M. 2009. Strategic Priorities, Performance
Measures and Performance: An Empirical Analysis of Dutch Firms. European
Management Journal, 27, PP.113-128.
Vroom, V.H. 1964. Work and Motivation, John Wiley and Sons, New York.
Wegge, J., Dick, R.V., Fisher, G.K., West, M.A. and Dawson, J.F., 2006. A Test of
Basic Assumptions of Affective Events Theory (AET) in Call Centre Work. British
Journal of Management, 17(3), pp. 237-254.

194
Weiss, D. J., Dawis, R. V., England, G. W., & Lofquist, L. H. 1967. Manual for the
Minnesota Satisfaction Questionnaire, Minneapolis, MN: University of Minnesota,
Industrial Relations Center.
Williams, B 2003, Domestic and international determinants of bank profits: Foreign
banks in Australia. Journal of Banking & Finance, 27 (6), PP.1185-1210.
Wilson, A., Zeithaml, V., Binter, M. and Gremler, D. 2008 Service Marketing:
Integrating Customer Focus Across the Firm, McGraw-Hill, London.
Wong, D. H., Rexha, N. and Phau, I. 2008 Re-examining traditional service quality in
an e-banking era. International Journal of Bank Marketing, 26 (7), pp. 526-45.
Xu, Y., and Geodegebuure, R. 2005. Employee satisfaction and customer
satisfaction: testing the service-profit chain in a Chinese securities firm. Innovative
Marketing, 1 (2), PP.49-59.
Yee, R., Yeung, A., & Cheng, T. 2011. The service profit chain: An empirical analysis
in high-contact service industries. International Journal of Production Economics,
130, PP.236-245.
Yee, R. W. Y., Yeung, A. C. L. & Edwin Cheng, T. C. 2010. An empirical study of
employee loyalty, service quality and firm performance in the service industry.
International Journal of Production Economics, 124 (1), PP.109-120.
Yee, R.W.Y., Yeung, A.C.L., Cheng, E.T.C. 2008. The impact of employee
satisfaction on quality and profitability in high contact service industries. Journal of
Operation Management, 26 (5), PP.651-88.
Yu, l., Perera, s., Susan Crowe, S. 2008. Effectiveness of the Balanced Scorecard:
The Impact of Strategy and Causal Links. JAMAR, 6(2), pp. 37-56.
Yücel, 2012. Examining the Relationships among Job Satisfaction, Organizational
195
Commitment, and Turnover Intention: An Empirical Study. International Journal of
Business and Management, 7(20), PP.44-58.
Zeithaml, V. A., Wilson, A., and Bitner, M. J. 2008. Services Marketing. 4thed. New
Delhi: The McGraw-Hill.
Zeithaml, V., A. & Bitner, M, J.(2003) Service Marketing: Integrating Customer Focus
Across the Firm.
Zeithaml, V.A., Berry, L.L. and Parasuraman, A. 1996. The
BehaviouralConsequences of Service Quality. Journal of Marketing, 60(2), PP.31-46.
Zeithaml, V.A., Berry, L.L. and Parasuraman, A. 1988. Communication and control
processes in the delivery of service. Journal of Marketing, 52, PP.35-48.
Zhang, X. and Daly, K. 2013. The Impact of Bank Specific and Macroeconomic
Factors on China‟s Bank Performance. Global Economy and Finance Journal, 6 (2),
PP.1 – 25
Zhang, C., and Pan, F. 2009. The impacts of customer satisfaction on profitability. A
case study of state-owned enterprises in China. Xiamen University, 1(1), P.21-

196
Appendices:
Appendix 1: Bank employees’ satisfaction Survey (English Version)
____________Bank
Dear participant
The enclosed research questionnaire is part of a doctoral dissertation study dealing
with the performance of the commercial banks in Ethiopia being carried out by a
student in the Doctor of Business Leadership (DBL) at the University of South
Africa‟s School of Business Leadership (SBL).
The purpose of the study is to identify the current measures of performance of the
commercial banks in Ethiopia and propose a comprehensive measure that involves
both quantitative/financial and qualitative/nonfinancial measures. To this end, the
study is designed to gather data from selected bank officers, branch managers,
employees, and customers through questionnaire for which the voluntary and cordial
engagement of the participants is vital. The survey will take around 20 minutes to
complete and the researcher asserts that your responses will be kept confidential.
The findings of the study are expected to set out the basis for establishing key
performance measures in the banking industry in Ethiopia and provide additional
evidence for the body of knowledge about the multiple measures of performance
relationship.
The researcher would like to thank you in advance for your assistance in completing
the enclosed questionnaire.
Regards,
Assefa Worede.

197
Employee satisfaction questionnaire
The purpose of this questionnaire is to give you a chance to tell how you feel about
your present job, on what things you agree with and on what things you do not agree
with. On the basis of your answers and those of people like you, the researcher
hopes to get a better understanding of the things people like and dislike about their
jobs.
The questionnaire below has two parts. The first part deals with questions relating to
demographic profile of respondents. The second part deals with questions to identify
with factors that influence the satisfaction of employees.
Note: Please
Read each statement carefully.
Decide how you feel about the aspect of your job described by the statement,
and
Give your answers for every statement.
Part I: (Please tick on the space provided)
1. Gender:
Male: ________
Female:________
2. Age:
20–30 years ________
31–40 years ________
41–50 years ________
Above 50 ________
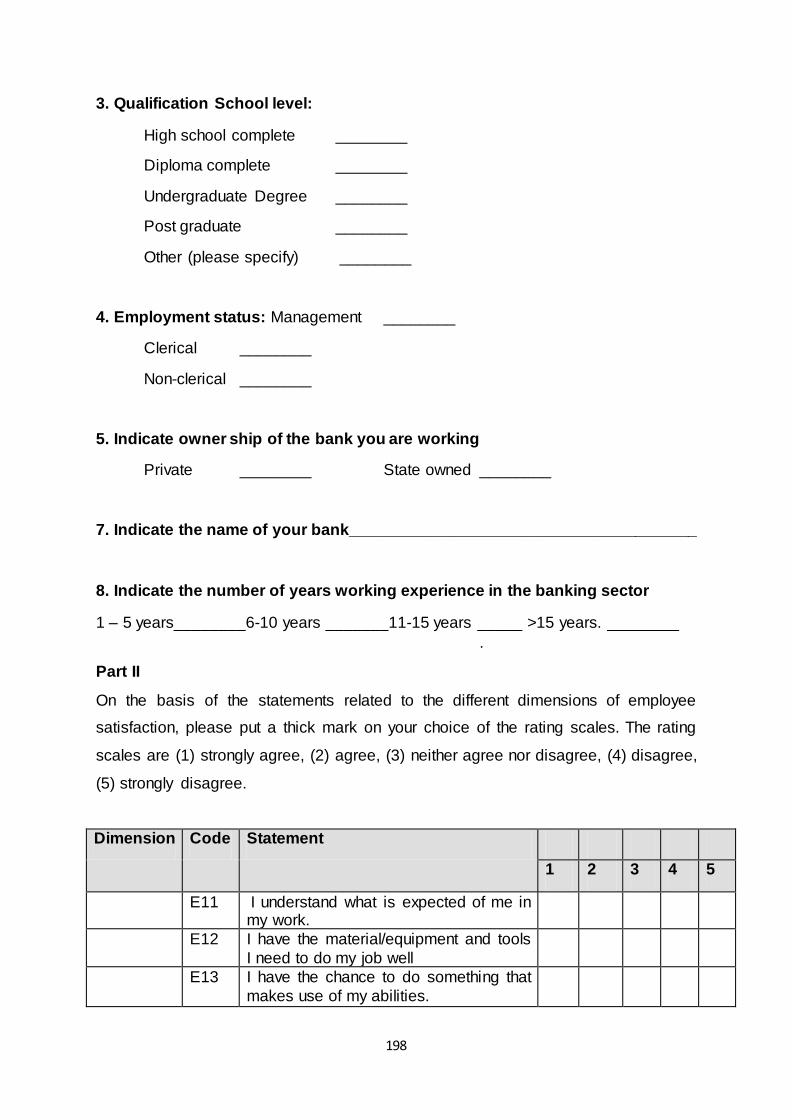
198
3. Qualification School level:
High school complete ________
Diploma complete ________
Undergraduate Degree ________
Post graduate ________
Other (please specify) ________
4. Employment status: Management ________
Clerical ________
Non-clerical ________
5. Indicate owner ship of the bank you are working
Private ________ State owned ________
7. Indicate the name of your bank_______________________________________
8. Indicate the number of years working experience in the banking sector
1 – 5 years________6-10 years _______11-15 years _____ >15 years. ________
.
Part II
On the basis of the statements related to the different dimensions of employee
satisfaction, please put a thick mark on your choice of the rating scales. The rating
scales are (1) strongly agree, (2) agree, (3) neither agree nor disagree, (4) disagree,
(5) strongly disagree.
Dimension Code Statement
1 2 3 4 5
E11 I understand what is expected of me in my work.
E12 I have the material/equipment and tools
I need to do my job well
E13 I have the chance to do something that
makes use of my abilities.

199
Dimension Code Statement
1 2 3 4 5
E14 I am satisfied with my job and the kind of work I do.
E15 My job is challenging and interesting.
E16 I am satisfied with the status I gain in
the community.
E17 I am satisfied with the variety in my
work
E21
There is a chance for being recognised and acknowledged for doing a good job
E22 I was given enough feedback on my performance.
E23 I am satisfied with the opportunities for training.
E24 The company makes every effort to fill
vacancies from within before recruiting from outside.
E25
I am satisfied with the chances for advancement for a better position in the job.
E26 Promotion goes to those who most deserve it.
E31 My immediate superior deals with all employees fairly.
E32
The manger involves my participation in
the supervisory decisions that affect my job.
E33 My manager is available when I need advice.
E34 My managertrusts me.
E35 My manager helps me to improve myself.
E36
My manager takes prompt and fair corrective action on employees who fail to perform their work satisfactorily.
E37 I feel free to talk openly and honestly to my manager.
E38 My manager praises me when I do a good job.
E39
The manager has the technical know-
how of the operations.
E40 My manager has the competence in making effective decision.
E41 I am treated with respect.

200
Dimension Code Statement
1 2 3 4 5
E42 I am satisfied with how members of my work group solve problems.
E43
My co-workers harmoniously get along
with each other.
E44 I enjoy coming to work.
E45
I feel free to talk openly and honestly with members of my work group.
E51
I believe my job provides me secure
employment
E52
The physical working conditions (heating, lighting, ventilation, etc.) on
the job are good.
E53 I am satisfied with the way company policies are put into practice.
E54 My workload is reasonable
E61
I am satisfied with my pay and the
amount of work I do.
E62
I am satisfied with the bank‟s reward
and incentive systems.
E63
I am satisfied with bank‟s welfare programs such insurance, health care,
etc.
E64 The payment system is equitable.

201
Appendix 2: Bank employees’ satisfaction Survey (Amharic Version)
የባንክ ሠራተኞች የሥራ እርካታ መጠይቅ
የተከበሩ የመጠይቁ ተሳታፉ!
ይህ መጠይቅ ሇትምህርት ጥናት አገሌግልተ የሚውሌ ሲሆን የጥናቱም ዓሊማ በአሁኑ
ወቅት ባንኮች የሚጠቀሙበት የሥራ ውጤት ግምገማፊይናንሳዊና ፊይናንሳዊ ያሌሆኑ
መስፇርቶችን የጠቃሌሌ እንደሆነና ካሌሆነም መወሰድ ያሇበትን የመፍትሄ እርምጃ
ሇመጠቆም ነው::ጥናቱ የባንክ ሠራተኞች በሥራቸው ሇይ ያሊቸውን የእርካታ ደረጃ
ምን ያህሌ እንደሆነ በምርጫ መሌክ የሚያስቀምጥ ሲሆን የርስዎን የመሊሹን በጎ
ፇቃድና ትብብር መሰረት ያደረገ ይሆናሌ:: መጠይቁ ወደ 20 ደቂቃ ያህሌ የሚወስድ
ሲሆን የጥናቱ ባሇቤት የተሳታፉዎቹን ማንነት የማይገሌፅና የሚያገኘውም ዝርዝር
የመጠይቅ መሌስ በሚስጥር የሚጠበቅ መሆኑን ሲያረጋግጥ ሇሚደረግሇት ትብብር
በቅድምያ ምስጋናውን ያቀርባሌ:: በመጨረሻም የጥናቱ ውጤት እንዳሇቀ ይፊ
እንደሚደረግ ይገሌጻሌ::
ከሰሊምታ ጋር

202
የባንክ ሠራተኞች የሥራ እርካታ መጠይቅ
መግቢያ፣
የዚህ መጠይቅ ዋና ዓሊማ የባንኩ ሠራተኞች አሁን በሚሰሩበት ሥራ ሊይ የሚሰማቸውን ስሜት ሇመግሇፅ እንዲችለ ከቀረቡት አማራጮች የሚስማሙበትንና የማይስማሙበትን እንዲመርጡ ዕድሌ የሚሰጥ ነው፡፡ ጥናቱእርስዎና ላልችም በሚገሌፁት ሃሳብ መሰረት በማድረግ ሠራተኞች በሥራቸው ሇይ የሚፇሌጉትንና የማይፇሌጉትን ምን ምን እንደሆነ ግንዛቤ ሇማግኘት ይረዳሌ፡፡
ይህ መጠይቅ ሁሇት ክፍልች ሲኖሩት የመጀመሪያው ክፍሌ የመሊሹን ወይም የመሊሽዋን ግሊዊ ግን አስፇሊጊ መረጃዎችን የሚጠይቁ ጥያቄዎች ናቸው፡፡ ሁሇተኛው ክፍሌ ግን የሠራተኞችን የሥራ ፍሊጎት ሉወስኑ ይችለ ይሆናለ ተብሇው የሚገመቱ ምክንያቶችን ሇማወቅ የቀረቡ ጥያቄዎች ናቸው፡፡ ስሇሆነም ከቀረቡት ዝርዝር ሃሳቦች አኳያ መስማማትዎን ወይም አሇመስማማትዎን በደረጃ ያስቀምጣለ፡፡
መሌስዎን በተቀመጠው ክፍት ቦታ (x) ምሌክት ያድርጉበት፡፡
ክፍሌ አንድ፡-
የመሊሹ/ሽዋ የግሌ መረጃዎች
1. ፆታ፡ ወንድ: ________ ሴት ________
2. እድሜ፡
ከ20-30 ዓመት ________ ከ41-50 ዓመት________
ከ31-40 ዓመት ________ ከሃምሳ በሊይ ________
3. የት/ት ደረጃ፡-
አንደኛ ደረጃ ________ ዲፕልማ ________
ሁሇተኛ ደረጃ ________ የመጀመሪያ ዲግሪ ________
የመሰናዶ ት/ት ________ ሁሇተኛ ዲግሪ ________
ላሊ (እባክዎን ይጥቀሱ)______________________________________________

203
4. የተሰማሩበት የስራ ሁኔታ፡-
ማነጅመንት_____ የጽህፇት ስራ ______ከማነጅመንትና ከጽህፇት ሥራውጭ________
5. የሚሰሩበት ባንክ ይዞታ የማን ነው?
የግሌ ________ የመንግሥት ________
6. የሚሰሩበት ባንክ ስም ማን ይባሊሌ?____________________________________
7. በባንክ ሥራ ሇይ ምን ያህሌ ጊዜ አገሌግሇዋሌ?
ከ 1 - 5 ዓመታት ________ ከ 11 - 15 ዓመታት ________
ከ 6 - 10 ዓመታት ________ ከ 15 ዓመታት በሊይ ________
ክፍሌ ሁሇት፡
ከዚህ በታች በቀረቡት ዝርዝር ሃሳቦች መሰረት ከ 1 - 5 ተራ ቁጥር ከቀረበሌዎት የደረጃ እርከን አማራጮች ውስጥ መስማማትዎን ወይም ያሇመስማማትዎን ሇመግሇፅ በክፍት ቦታው (x) ምሌክት ያድርጉ፡፡
1. በጣም አሌስማማም
2. አሌስማማም
3. አስተያየት የሇኝም
4. እስማማሇሁ
5. በጣም እስማማሇሁ
1 2 3 4 5
1. በሥራዩ ሊይ ከኔ የሚጠበቅብኝን በሙለ አውቃሇሁ
2. ሥራዩን ሇማከናወን የሚያስፇሌጉኝ መሳርያዎች ተማሌቶአሌ
3. ችልታየን ሇመጠቀም የሚያስችሌ ዕድሌ አሇኝ
4. በምሰራው ሥራና የሥራ ዓይነት ደስተኛ ነኝ
5. ሥራዩ ፇታኝና ደስታን የሚሰጥ ነው
6. በዚሁ ሥራ መሰማራቴ በህብረተሰቡ ዘንድ ከበሬታን አስገኝቶሌኛሌ
7. ሥራዩ የተሇያዩ ክንውኖችን ማቀፈ ያረካኛሌ
8. አጥጋቢ የሥራ ክንውን ሇፇፀመ ዕውቅናና ምስጋናን የማግኘት
ዕድሌ ይኖረዋሌ
9. ሇፇፀምኩት የሥራ ክንውን በቂ አስተያየት ተሰጥቶኛሌ
10. በባንኩ በኩሌ የሚሰጡት የስሌጠና ዕድልች ያረኩኛሌ
11. ባንኩ ክፍት የሥራ ቦታዎችን በውስጥ ውድድር ሇመሙሊት ጥረት ያደርጋሌ
204
12. ሇበሇጠ የዕድገት መሰሊሌ ሇመውጣት የሚያስችሌ ዕድሌ
ስሊሇው ሥራውን እወደዋሇሁ
13. የሥራ ዕድገት የሚያገኙት የሚገባቸው ናቸው
14. የቅርብ አሇቃዩ ከሁለም ሠራተኞች መሌካም ግኑኝነት አሇው
15. አሇቃየ ሥራዩን በሚመሇከት ጉዳይ በሚደረገው ውሳኔ ያሳትፇኛሌ
16. አሇቃዩን ማማከር በምፇሌግበት ወቅት በቅርብ የማግኘት ዕድሌ አሇኝ
17. አሇቃዩ በኔ ሇይ እምነት አሇው
18. አሇቃዩ ራሴን እንዳሻሻሌ ድጋፍ ያደርግሌኛሌ
19. አሇቃዩ ስራቸውን በበቂ ሁኔታ ማከናወን ባሌቻለ ሰራተኞች
ሊይ በወቅቱ ትክክሇኛ የእርምት እርምጃ ይወስዳሌ
20. አሇቃዩን በግሌፅ ሇማናገር ነፃነት አሇኝ
21. አሇቃዩ አጥጋቢ ሥራ በማከናውንበት ወቅት ያበረታታኛሌ
22. አሇቃዩ በባንክ ሥራ በቂ ዕውቀት አሇው
23. አሇቃዩ ወሳኝ ውሰኔዎችን የመወሰን ችልታ አሇው
24. የሥራ ባሌደረቦቼ በምንሰጠው የአገሌግልት ጥራት ሃሊፉነት ይሰማቸዋሌ
25. በሥራ ባሌደረቦቼ መካከሌ መሌካም የሥራ ግኑኝነት አሇ
26. ወደ ሥራ መምጣቱ የደስታ ስሜት ይፇጥርሌኛሌ
27. ከሥራ በሌደረቦቼ ጋር ያሇው የሥራ ክፍፍሌ ፍትሓዊ ነው
28. ሃሳቤን ከሥራ በሌደረቦቼ ጋር ስገሌፅ ነፃነት ይሰማኛሌ
29. ሥራየ ቀጣይነት እንዳሇው እምነት አሇኝ
30. የሥራ አካባቢው ምቹ ነው
31. በባንኩ ፖሉስዎች አተገባበር ሊይ ደስተኛ ነኝ
32. በሥራ ሊይ ያሇኝ ጫና ተቀባይነት አሇው
33. ሇምሰራው ስራ በቂ ክፍያ ይከፇሇኛሌ
34. ባንኩ በሚሰጠው ሽሌማትና ማትጊያደስተኛ ነኝ
35. ባንኩ በሚሰጠው የኢንሹራንስ፣ የህክምና አገሌግሌትና
የመሳሰለት ጥቅማ ጥቅሞች ደስተኛ ነኝ
36. የክፍያው መጠንፍትሃዊ ነው
ሇትብብርዎ እናመሰግናሇን
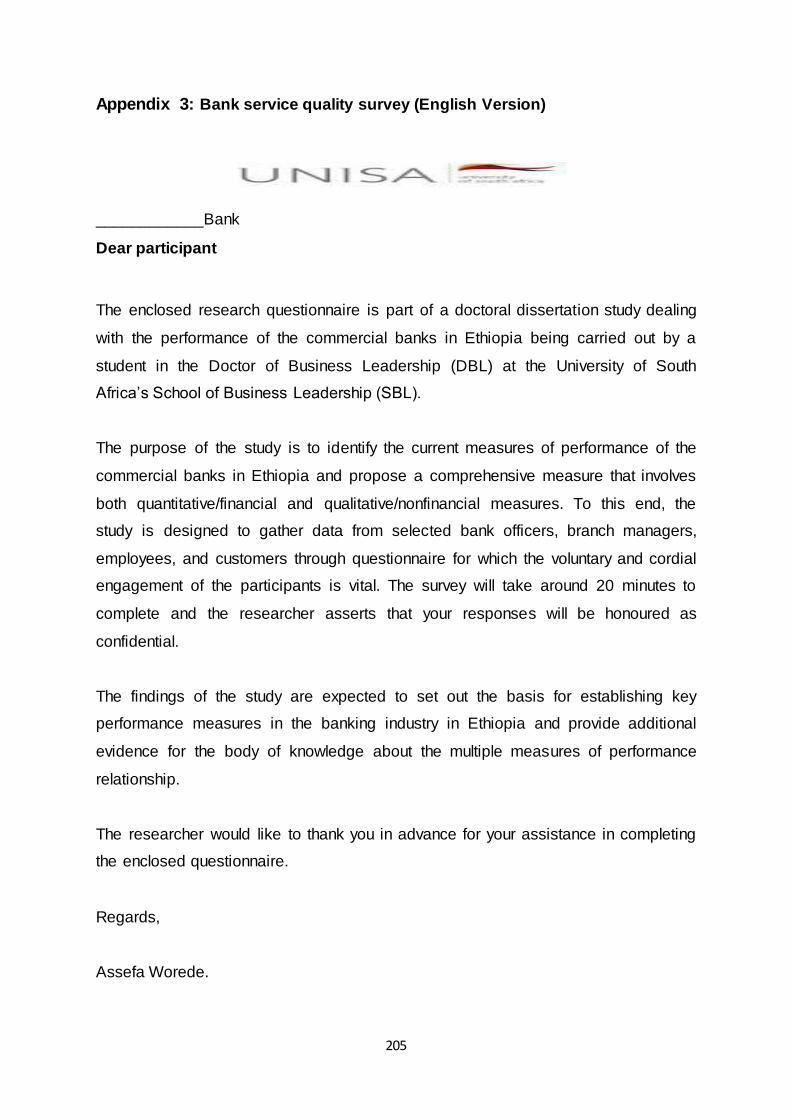
205
Appendix 3: Bank service quality survey (English Version)
____________Bank
Dear participant
The enclosed research questionnaire is part of a doctoral dissertation study dealing
with the performance of the commercial banks in Ethiopia being carried out by a
student in the Doctor of Business Leadership (DBL) at the University of South
Africa‟s School of Business Leadership (SBL).
The purpose of the study is to identify the current measures of performance of the
commercial banks in Ethiopia and propose a comprehensive measure that involves
both quantitative/financial and qualitative/nonfinancial measures. To this end, the
study is designed to gather data from selected bank officers, branch managers,
employees, and customers through questionnaire for which the voluntary and cordial
engagement of the participants is vital. The survey will take around 20 minutes to
complete and the researcher asserts that your responses will be honoured as
confidential.
The findings of the study are expected to set out the basis for establishing key
performance measures in the banking industry in Ethiopia and provide additional
evidence for the body of knowledge about the multiple measures of performance
relationship.
The researcher would like to thank you in advance for your assistance in completing
the enclosed questionnaire.
Regards,
Assefa Worede.
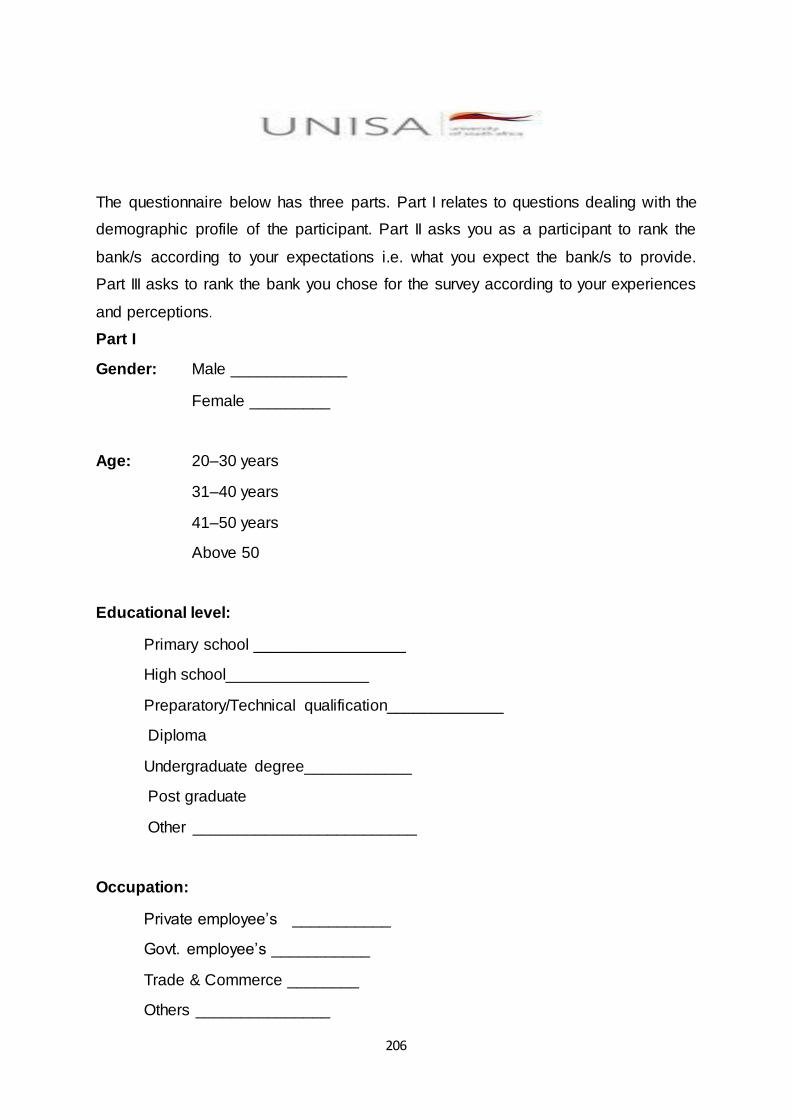
206
The questionnaire below has three parts. Part I relates to questions dealing with the
demographic profile of the participant. Part II asks you as a participant to rank the
bank/s according to your expectations i.e. what you expect the bank/s to provide.
Part III asks to rank the bank you chose for the survey according to your experiences
and perceptions.
Part I
Gender: Male _____________
Female _________
Age: 20–30 years
31–40 years
41–50 years
Above 50
Educational level:
Primary school _________________
High school________________
Preparatory/Technical qualification_____________
Diploma
Undergraduate degree____________
Post graduate
Other _________________________
Occupation:
Private employee‟s ___________
Govt. employee‟s ___________
Trade & Commerce ________
Others _______________
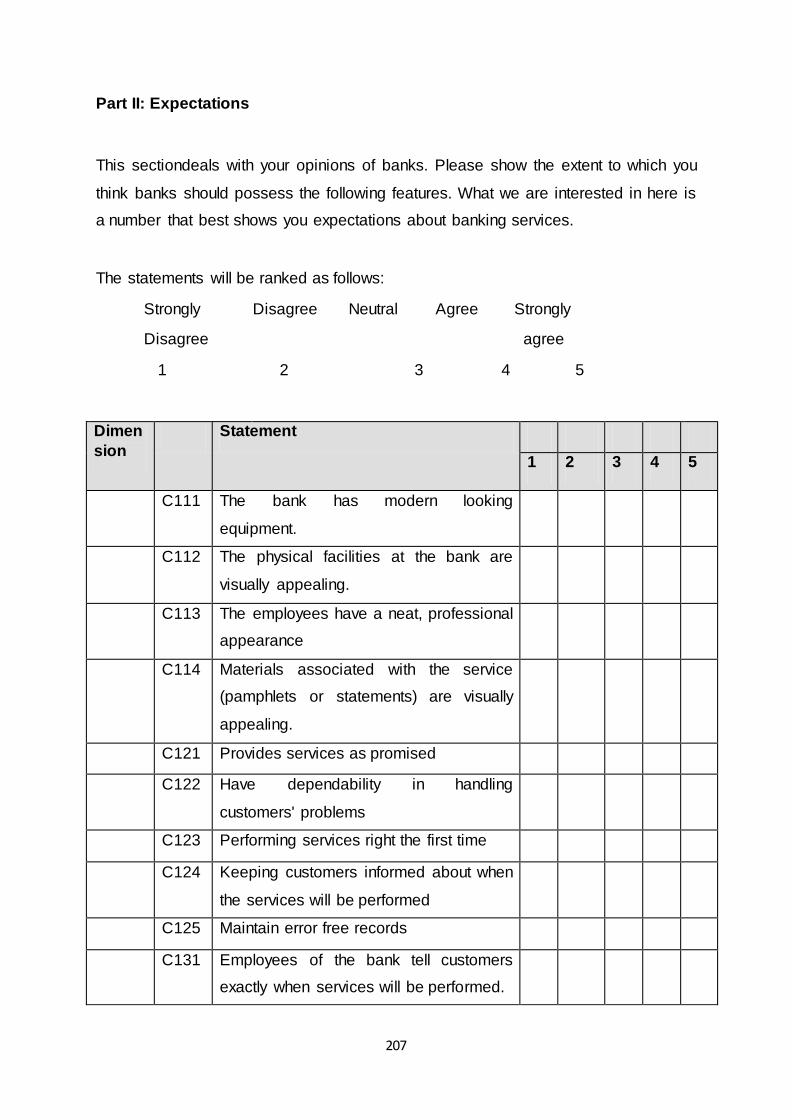
207
Part II: Expectations
This sectiondeals with your opinions of banks. Please show the extent to which you
think banks should possess the following features. What we are interested in here is
a number that best shows you expectations about banking services.
The statements will be ranked as follows:
Strongly Disagree Neutral Agree Strongly
Disagree agree
1 2 3 4 5
Dimen
sion
Statement
1 2 3 4 5
C111 The bank has modern looking
equipment.
C112 The physical facilities at the bank are
visually appealing.
C113 The employees have a neat, professional
appearance
C114 Materials associated with the service
(pamphlets or statements) are visually
appealing.
C121 Provides services as promised
C122 Have dependability in handling
customers' problems
C123 Performing services right the first time
C124 Keeping customers informed about when
the services will be performed
C125 Maintain error free records
C131 Employees of the bank tell customers
exactly when services will be performed.

208
C132
Employees give prompt service to
customers.
C133
Employees of are always willing to help
customers.
C134
Employees are ready to respond to
customers' requests.
C141
The behaviour of employees in the bank
instils confidence in customers.
C142
Banks make customers feel safe in
transactions.
C143
Employees are consistently courteous
with customers.
C144
Employees have the knowledge to
answer customers' questions.
C151
The bank gives customers individual
attention.
C152
The bank maintains convenient branch
location and operating hours to its
customers.
C153
The bank has employees who deal with
customers in a caring fashion.
C154
The bank has customer's best interest at
heart.
C155
The employees of the bank understand
the specific needs of their customers.
Part III: Perceptions
The following statements relate to your feelings about the bank you deal with. Please
show the extent to which you believe this bank has the feature described in the
statement. Here, we are interested in a number from 1 to 5 that shows your
perceptions about the bank.
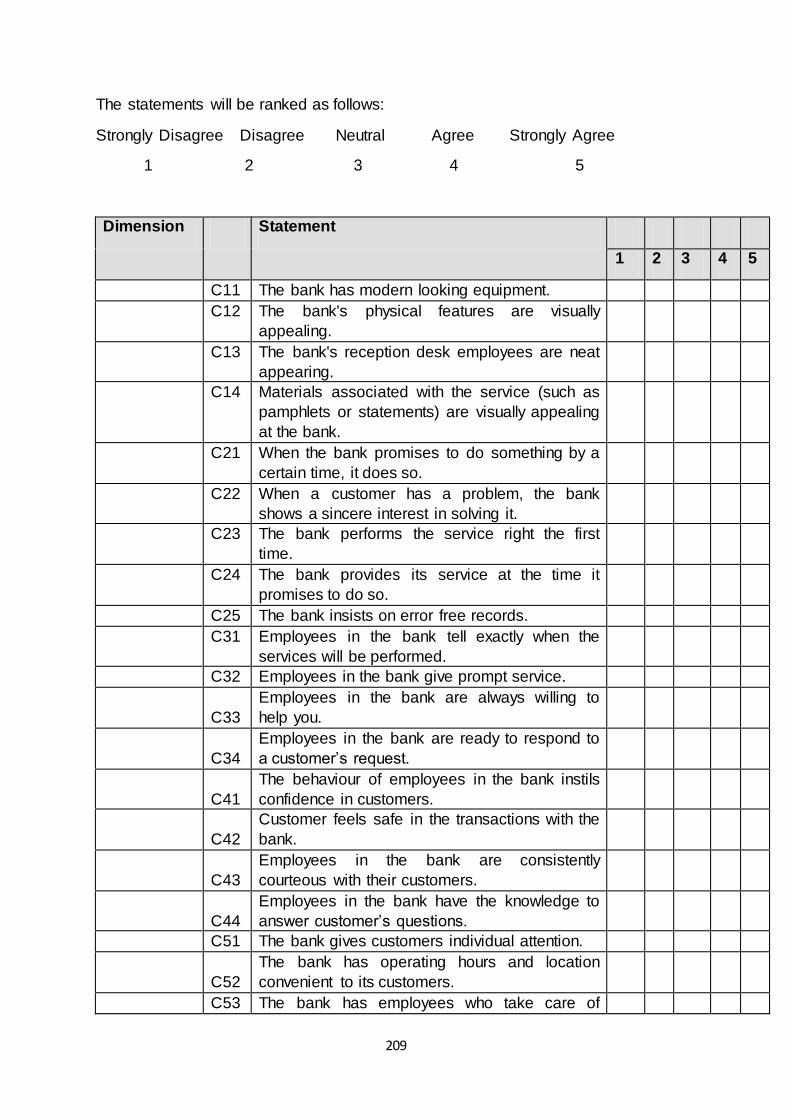
209
The statements will be ranked as follows:
Strongly Disagree Disagree Neutral Agree Strongly Agree
1 2 3 4 5
Dimension Statement
1 2 3 4 5
C11 The bank has modern looking equipment.
C12 The bank's physical features are visually
appealing.
C13 The bank's reception desk employees are neat
appearing.
C14 Materials associated with the service (such as
pamphlets or statements) are visually appealing
at the bank.
C21 When the bank promises to do something by a
certain time, it does so.
C22 When a customer has a problem, the bank
shows a sincere interest in solving it.
C23 The bank performs the service right the first
time.
C24 The bank provides its service at the time it
promises to do so.
C25 The bank insists on error free records.
C31 Employees in the bank tell exactly when the
services will be performed.
C32 Employees in the bank give prompt service.
C33
Employees in the bank are always willing to
help you.
C34
Employees in the bank are ready to respond to
a customer‟s request.
C41
The behaviour of employees in the bank instils
confidence in customers.
C42
Customer feels safe in the transactions with the
bank.
C43
Employees in the bank are consistently
courteous with their customers.
C44
Employees in the bank have the knowledge to
answer customer‟s questions.
C51 The bank gives customers individual attention.
C52
The bank has operating hours and location
convenient to its customers.
C53 The bank has employees who take care of
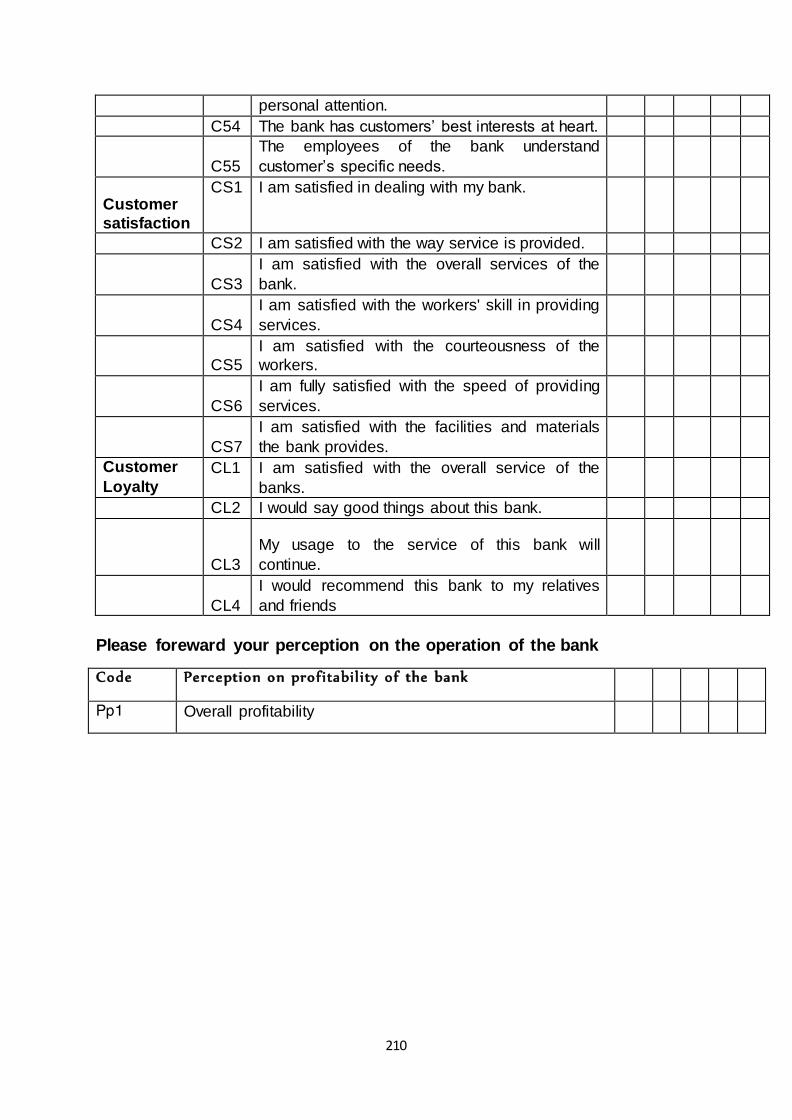
210
personal attention.
C54 The bank has customers‟ best interests at heart.
C55
The employees of the bank understand
customer‟s specific needs.
Customer
satisfaction
CS1
I am satisfied in dealing with my bank.
CS2 I am satisfied with the way service is provided.
CS3
I am satisfied with the overall services of the
bank.
CS4
I am satisfied with the workers' skill in providing
services.
CS5
I am satisfied with the courteousness of the
workers.
CS6
I am fully satisfied with the speed of providing
services.
CS7
I am satisfied with the facilities and materials
the bank provides.
Customer
Loyalty
CL1
I am satisfied with the overall service of the
banks.
CL2 I would say good things about this bank.
CL3
My usage to the service of this bank will
continue.
CL4
I would recommend this bank to my relatives
and friends
Please foreward your perception on the operation of the bank
Code Perception on profitabil ity of the bank
Pp1 Overall profitability

211
Appendix 4: Bank service quality survey (Amharic Version)
የባንክ ደንበኞች የአገሌግልት እርካታ መጠይቅ
የተከበሩ የመጠይቁ ተሳታፉ!
ይህ መጠይቅ ሇትምህርት ጥናት አገሌግልተ የሚውሌ ሲሆን የጥናቱም ዓሊማ በአሁኑ ወቅት
ባንኮች የሚጠቀሙበት የስራ ውጤት ግምገማ ፊይናንሳዊና ፊይናንሳዊ ያሌሆኑ መስፇርቶችን
የጠቃሌሌ እንደሆነና ካሌሆነም መወሰድ ያሇበትን የመፍትሄ እርምጃ ሇመጠቆም ነው:: ጥናቱ
የባንክ ደንበኞችን የአገሌግልት እርካታ ደረጃ ምን ያህሌ እንደሆነ በምርጫ መሌክ
የሚያስቀምጥ ሲሆን የርስዎን የመሊሹን በጎ ፇቃድና ትብብር መሰረት ያደረገ ይሆናሌ::
መጠይቁ ወደ 20 ደቂቃ ያህሌ የሚወስድ ሲሆን የጥናቱ ባሇቤት የተሳታፉዎቹን ማንነት
የማይገሌፅና የሚያገኘውም ዝርዝር የመጠይቅ መሌስ በሚስጥር የሚጠበቅ መሆኑን ሲያረጋግጥ
ሇሚደረግሇት ትብብር በቅድምያ ምስጋናውን ያቀርባሌ::
ከሰሊምታ ጋር

212
የባንክ ደምበኞች የአገሌግልት እርካታ መጠይቅ
መግቢያ፣
ይህ የመጠይቅ ቅፅ ሦስት ክፍልች ሲኖሩት የመጀመሪያው የመሊሹን ወይም የመሊሽዋን ግሊዊ ግን አስፇሊጊ መረጃዎችን የሚጠይቁ ጥያቄዎች አለት፡፡
ሁሇተኛው ክፍሌ እርስዎ እንደተጠቃሚ በመርህ ወይም በሃሳብ ደረጃ እገሇገሌበታሇሁ በሚለት ባንክ ወይም ባንኮች ውስጥ ሉኖሩ ይገባቸዋሌ ብሇው በሚጠብቋቸው ዝርዝሮች ሃሳቦች አኳያመስማማትዎን ወይም አሇመስማማትዎን በደረጃ የሚያስቀምጡበት ነው፡፡
ሦስተኛውና የመጨረሻው ክፍሌ እርስዎ እንደ ባንክ አገሌግልት ተጠቃሚ ካዳበሩት ሌምድና እይታ አንፃር በመንተራስ አሁን በሚጠቀሙበት ባንክ ወይም ባንኮች ውስጥ ያሇውን የአገሌግልት ሁኔታ ከተቀመጡት መስፇርቶች አኳያ የእርስዎ መስማማት ወይም አሇመስማማት በደረጃ የሚያስቀምጡበት ክፍሌ ነው፡፡
መሌስዎን በተቀመጠው ክፍት ቦታ (x) ምሌክት ያድርጉበት፡፡
ክፍሌ አንድ፡-
የመሊሹ/ሽዋ የግሌ መረጃዎች
1. ፆታ፡ ወንድ: _______ ሴት ________
2. እድሜ፡
ከ20-30 ዓመት ________ ከ 31-40 ________
ከ41-50 ዓመት ________ ከሃምሳ በሊይ ________
3. የት/ት ደረጃ፡
አንደኛ ደረጃ ________ ዲፕልማ ________
ሁሇተኛ ደረጃ ________ የመጀመሪያ ዲግሪ ________
ሁሇተኛ ዲግሪ ________
ላሊ (እባክዎን ይጥቀሱ)______________________________________________

213
4. የተሰማሩበት የስራ ሁኔታ፡-
የግሌ ተቀጣሪ ________
የመንግስት ተቀጣሪ________
የንግድ ስራ ________
ላሊ (እባክዎን ቢገሌፁት)____________________________________________
ክፍሌ ሁሇት፡
በዚህ ክፍሌ ውስጥ እርስዎ በመርህ ወይም በሃሳብ ደረጃ እገሇገሌበታሇሁ በሚለት ባንክ ወይም ባንኮች ውስጥ ሉኖሩ ይገባቸዋሌ ብሇው የሚጠብቋቸውን የአገሌግልት ቅድመ ግምቶች ወይን እሳቤዎች ከተጠቀሱት ዝርዝር ሃሳቦች አኳያ መስማማትዎን ወይም ያሇመስማማትዎን ቀጥል በቁጥር በተቀመጠውመስፇርት መሰረት የሚያሳዩበት ይሆናሌ፡፡
1. በጣም አሌስማማም
2. አሌስማማም
3. አስተያየት የሇኝም
4. እስማማሇሁ
5. በጣም እስማማሇሁ
ስሇሆነም ከዚህ በታች ሇተጠቀሱት ዝርዝር ፍሬ ሃሳቦች ከ1-5 አንዱን በመምረጥ የመስማማትዎን ወይም ያሇመስማማትዎን ደረጃ ያሳዩ፡፡
ኮድ አንድ ባንክ ወይም ቅርንጫፍ ባንክ 1 2 3 4 5
C111 ዘመናዊ የአገሌግልት ቴክኖልጂ ግብአቶች ሉኖሩት ይገባሌ፣
C112 እይታን የሚማርክ ህንፃ፣ ቁሳቁስ፣ የመኪና ማቆምያና ምቹ
የእንግዶች መቀመጫ ሉኖሩት ይገባሌ፣
C113 ጥንቁቅና ፅዱ ሰራተኞች ሉኖሩት ይገባሌ፣
C114 ባንኩ የሚጠቀምባቸው ፅሁፎቹ (በራሪ ፅሁፎች አመሇካች
ፅሁፎች የሂሳብ መግሇጫ ወዘተ) ተነባቢና ማራኪ መሆን
አሇባቸው፣
C121 የሚሰጠው አገሌግልት ቃሌ በገባው መሰረት መሆን አሇበት፣
C122 አስተማማኝና ያሌተንዛዛ የደንበኞች ችግር አፇታት ዘዴ
መከተሌ አሇበት፣
C123 ከመጀመሪያ የስራ መክፇቻ ደቂቃ ጀምሮ አገሌግልት
መስጠት አሇበት፣

214
C124 የአገሌግልት መስጫ ጊዜያትን በግሌፅ መስቀመጥ አሇበት፣
C125 ከስህተት የፀዱ የመዛግብት አያያዝ ሉኖሩት ይገባሌ፣
C131 የሚሰጡትን አዳዲስ አገሌግልቶች መቸ እንደሚጀመር
በትክክሌ መግሇፅ አሇበት፣
C132 ፇጣን አገሌግልት የሚሰጡ ሰራተኞች ሉኖሩት ይገባሌ፣
C133 ምንግዜም ደንበኞችን ሇመርዳት ፇቃደኛ የሆኑ ሰራተኞች
ሉኖሩት ይገባሌ፣
C134 የተደረገውን የፖሉሲ ሇውጥ በግሌፅ ሇማስረዳት ዝግጁ የሆኑ
ሰራተኞች ሉኖሩት ይገባሌ፣
C141 በደንበኞች ሊይ መተማመንን የሚያሰርፅ ባህርይ የተሊበሱ
ሰራተኞች ሉኖሩት ይገባሌ፣
C142 ደንበኞች በሚያካሄዱት የንግድ ሌውውጥ /ሂደት/ ሊይ
ደህንነት እንዲሰማቸው ማድረግ አሇበት፣
C143 ወጥና ሁሌጊዜም አክብሮትን በተሊበሰ አኳኃን
የሚያስተናግዱ ሰራተኞች ሉኖሩት ይገባሌ፣
C144 ሇደንበኞች ጥያቄ ተገቢውን መሌስ ሇመስጠት ችልታና
ተነሳሽነት ያሊቸው ሰራተኞች ሉኖሩት ይገባሌ፣
C151 ደንበኞች፣ በተናጠሌም ቢሆን ተፇሊጊውን ትኩረት
የሚሰጡበት መሆን አሇበት፣
C152 ደንበኞች ምቹ የሆነ የአገሌግልት መስጫ ቅርንጫፍና የስራ
ሰዓት ሉኖራቸው ይገባሌ፣
C153 ደንበኞችን፣ በትህትናና በእንክብካቤ መንፇስ የሚያስተናግዱ
ሰራተኞች ሉኖሩት ይገባሌ፣
C154 የደንበኞችን ፍሊጎት ማርካት ዋነኛ መሮሆው ማድረግ
አሇበት፣
C155 የእያንዳንዱን ደንበኛ ፍሊጎት የሚረዱ ሰራተኞች ሉኖሩት
ይገባሌ፣
ክፍሌ ሦስት፡-
5. አሁን የሚጠቀሙበት የባንክ ስም ማን ይባሊሌ?__________________________________
6. ከባንኩ ጋር በደንበኝነት ምን ያህሌ ጊዜ ቆይተዋሌ?________________________________

215
7. ከዚህ ባንክ ውጭ የላሊ ባንክ ደንበኛ ነዎት? __________________________________
8. ከሊይ ሇቀረበው ጥያቄ መሌስዎ አዎ ከሆነ የሚገሇገለበት ባንክ ወይም ባንኮች ስም ቢጠቅሱ!
__________________________________________________________________
በዚህ ክፍሌ ውስጥ እርስዎ እንደ ባንክ ተጠቃሚ በአገሌግልቱ ሊይ ያሇዎትን ሌምድና እይታ መሰረት በማድረግ ከቀረቡት ዝርዝር ሀሳቦች አኳያ መስማማትዎን ወይም አሇመስማማትዎን በደረጃ በማስቀመጥ የሚያሳዩበት ይሆናሌ፡፡ ደረጃውም ከ 1 እስከ 5 ሲሆን በዝርዝርም፡-
1. በጣም አሌስማማም
2. አሌስማማም
3. አስተያየት የሇኝም
4. እስማማሇሁ
5. በጣም እስማማሇሁ
ስሇሆነም ከዚህ በታች ሇተጠቀሱት ዝርዝር ፍሬ ሃሳቦች ከ1-5 ከቀረቡት መስፇርቶች አንዱን በመምረጥ የመስማማትዎን ወይም ያሇመስማማትዎን ደረጃ ያሳዩ፡፡
ኮድ አሁን የሚገሇገለበት ባንክ 1 2 3 4 5
C11 ዘመናዊ የአገሌግልት ቴክኖልጂ ግብአቶች አለት፣
C12 እይታን የሚማርክ ህንፃ፣ ግቢ፣ ቁሳቁስ፣ የመኪና ማቆምያና ምቹ የእንግዶች መቀመጫ አሇው፣
C13 ጥንቁቅና ፅዱ ሰራተኞች አለት፣
C14 የሚጠቀምባቸው ፅሁፎቹ (በራሪ ፅሁፎች አመሇካች ፅሁፎች
የሂሳብ መግሇጫ ወዘተ) ተነባቢና ማራኪ ናቸው፣
C21 አገሌግልቱን የሚሰጠውቃሌ በገባው መሰረት ነው፣
C22 አስተማማኝና ያሌተንዛዛ የደንበኞች ችግር አፇታት
ይከተሊሌ፣
C23 ከመጀመሪያ የስራ መክፇቻ ደቂቃ ጀምሮ
አገሌግልትይሰጣሌ፣
C24 የአገሌግልት መስጫ ጊዜያትን በግሌፅ አሰቀምጦአሌ፣
C25 ሇደንበኞች የሚሰጡት የሂሳብ መግሇጫዎች ስህተት
የሊቸውም፣ ቢከሰትም አስፇሊጊውን እርማት በወቅቱ
ይወስዳሌ፣
C31 ሇደምበኞቹ የሚሰጡት አዳዳዲስ አገሌግልቶች መቸ
እንደሚጀመር በትክክሌ የሚገሌፁ ሰራተኞች ያለት፣
C32 ፇጣን አገሌግልት የሚሰጡ ሰራተኞች አለት፣
C33 ምንግዜም ደንበኞችን ሇመርዳት ፇቃደኛ የሆኑ ሰራተኞች

216
አለት፣
C34 የተደረገውን የፖሉሲ ሇውጥ በግሌፅ ሇማስረዳት ዝግጁ የሆኑ
ሰራተኞች አለት፣
C41 በደንበኞች ሊይ መተማመንን የሚያሰርፅ ባህርይ የተሊበሱ
ሰራተኞች አለት፣
C42 ደንበኞች በሚያካሄዱት የንግድ ሌውውጥ /ሂደት/ ሊይ
ደህንነት እንዲሰማቸው ያደርጋለ፣
C43 ሇደንበኞች ወጥና ሁሌጊዜም አክብሮት በተሊበሰ አኳኃን
የሚያስተናግዱ ሰራተኞች አለት፣
C44 ሇደንበኞች ጥያቄ ተገቢውን መሌስ ሇመስጠት ችልታና
ተነሳሽነት ያሊቸው ሰራተኞች አለት፣
C51 ሇደንበኞች፣ በተናጠሌም ቢሆን ተፇሊጊውን ትኩረት
ይሰጣሌ፣
C52 ሇደንበኞች ምቹ የሆነ የአገሌግልት መስጫ ቅርንጫፍና
የስራ ሰዓት አሇው፣
C53 ሇደንበኞች፣ በትህትናና በእንክብካቤ መንፇስ መስተንግዶ
የሚሰጡ ሰራተኞች አለት፣
C54 መሰረታዊ መርሆው የደንበኞችን ፍሊጎት ማርካት ነው፣
C55 የእያንዳንዱን የደንበኛ ፍሊጎት የሚረዱ ሰራተኞች አለት፣
የደንበኞች ዕርካታ
CS1 ከባንኩ ጋር ባሇኝ ግኑኝነት ረክቻሇሁ
CS2 ባንኩ በሚሰጠው አገሌግልት ረክቻሇሁ
CS3 ባንኩ በሚሰጠው አጠቃሊይ አገሌግልት እርካታ አሇኝ
CS4 የባንኩ ሰራተኞች በአገሌግልት አሰጣጥ ችልታቸው
ረክቻሇሁ
CS5 የባንኩ ሰራተኞች ሇደንበኞች ባሊቸው ትህትና ረክቻሇሁ
CS6 የባንኩ ሰራተኞች በሚሰጡት የተቀሊጠፇ አገሌግልት ሙለ
እርካታ አሇኝ
CS7 ባንኩ ሇደንበኞቹ በሚያቀርበው ቁሳዊና ማተርያሊዊ
አገሌግልቶች እርካታ አሇኝ
የደንበኞች የእርካታ መገሇጫ
CL1 በአጠቃሊይ በሚሰጠው አገሌግልት ረክቻሇሁ፣
217
CL2 ባንኩን በሚመሇከት ሇሰዎች በጎ ነገር እናገራሇሁ፣
CL3 ሇቀጣይም ቢሆን የባንኩ ደምበኝነቴን እቀጥሊሇሁ፣
CL4 ላልች ጓደኞቼና ቤተሰቦቼ የዚህ ባንክ አገሌግልት ተጠቃሚ
እንዲሆኑ አግባባሇሁ፣
ሇትብብርዎ እናመሰግናሇን
በባንክ የስራ ውጤት በሚመለከት የሚቀርብ አስተያየት
ኮድ ትርፍን በሚመለከት ያልዎት አስተያየት
pp አጠቃሊይ ትርፊማነት

218
Appendix 5: Emplyee Satisfiction Regression standardized Residual
(EMST)

219
Appendix 6: Normal P -P Plot of regression statndardized residual
Observed Cum Prob (EMST)

220
Appendix 7: Scatterplot regression standardized predicted value (EMST)
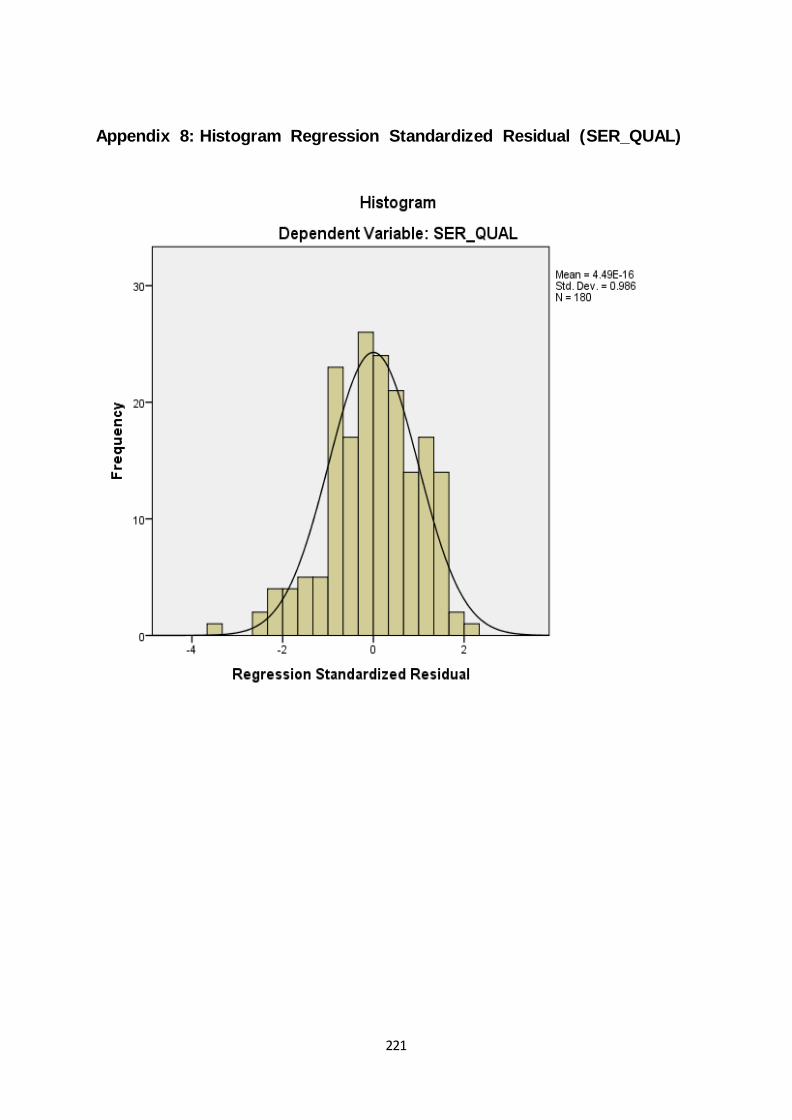
221
Appendix 8: Histogram Regression Standardized Residual (SER_QUAL)

222
Appendix 9: Normal P –P plot of regression standardized residual
Observed cub prob (SER_QUAL)
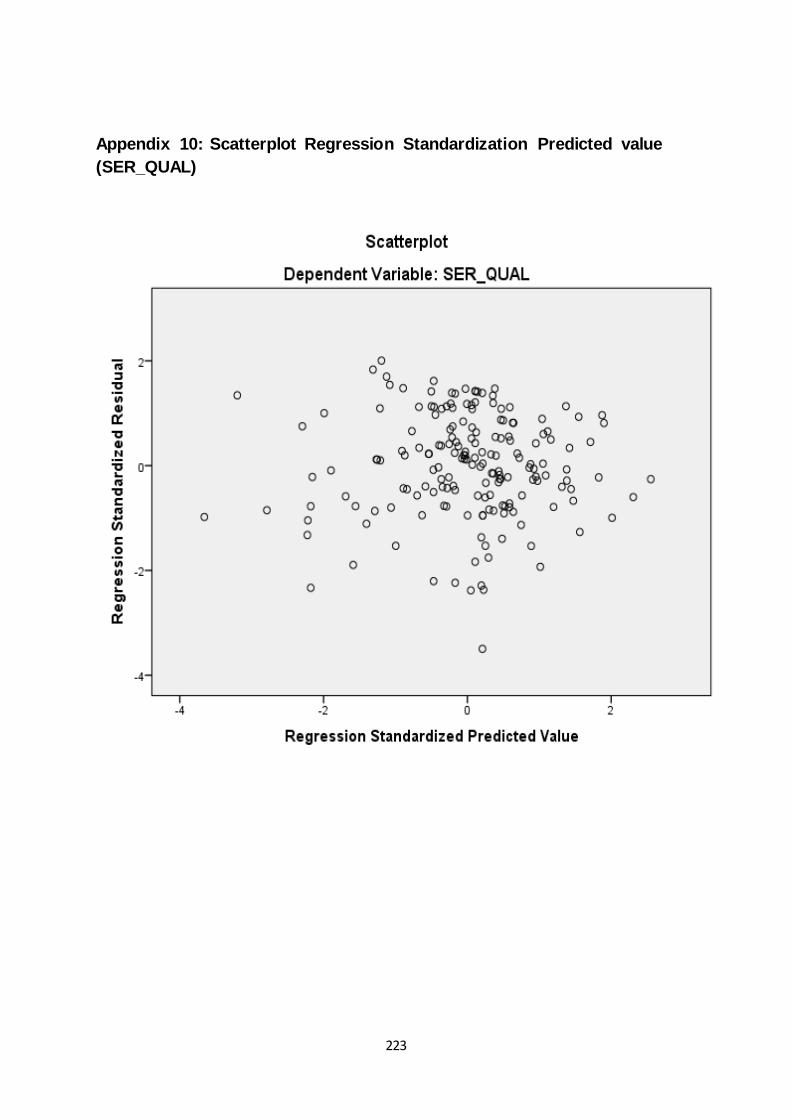
223
Appendix 10: Scatterplot Regression Standardization Predicted value
(SER_QUAL)

224
Appendix 11 Histogram Regression Standardized Residual
(CU_SATISFACTION)
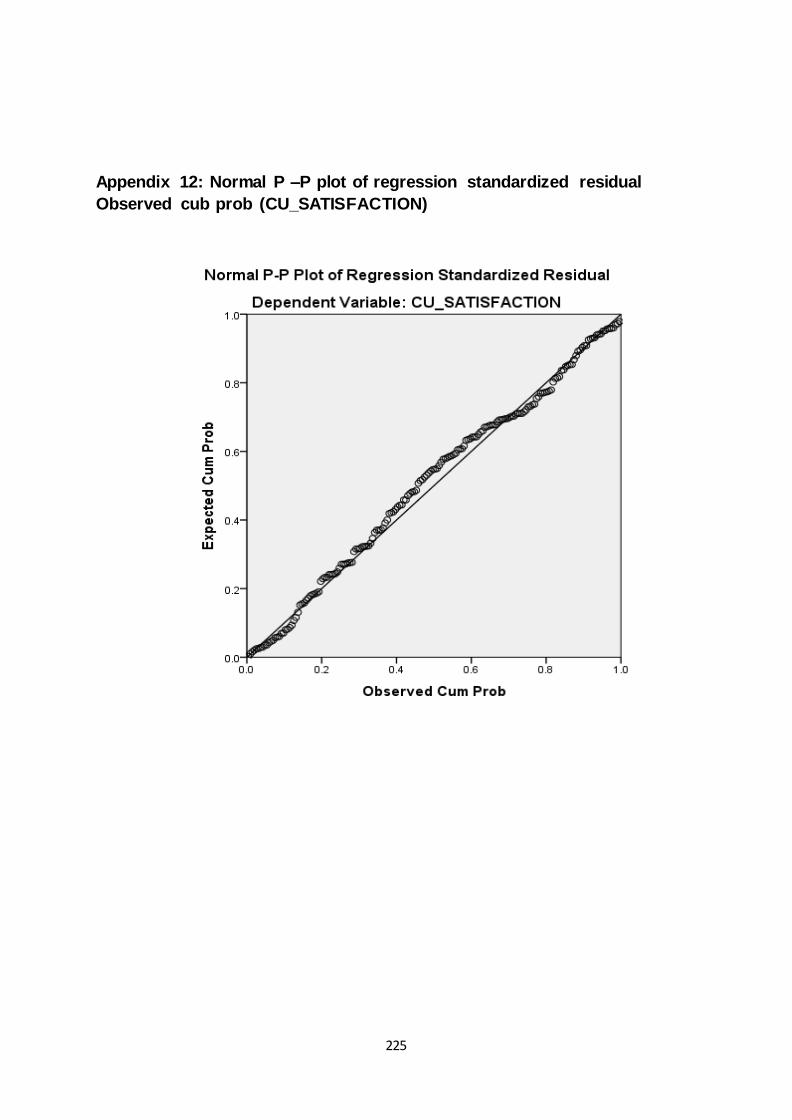
225
Appendix 12: Normal P –P plot of regression standardized residual
Observed cub prob (CU_SATISFACTION)

226
Appendix 13: Scatterplot Regression Standardizaed Predicted value
(CU_SATISFACTION)

227
Appendix 14: Histogram Regression Standardized Residual
(CU_SATISFACTION)

228
Appendix 15: Normal P –P plot of regression standardized residual
Observed cub prob (CU_SATISFACTION)
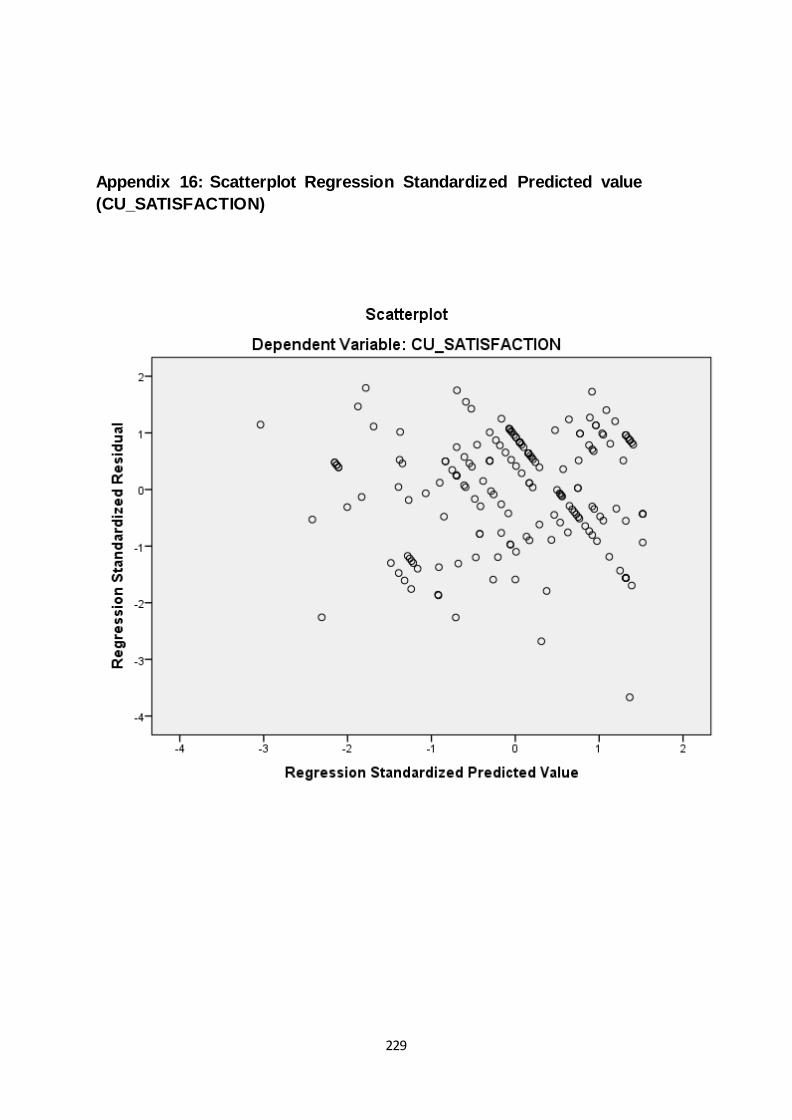
229
Appendix 16: Scatterplot Regression Standardized Predicted value
(CU_SATISFACTION)

230
Appendix 17: Histogram Regression Standardized Residual
(CU_LOYALITY)
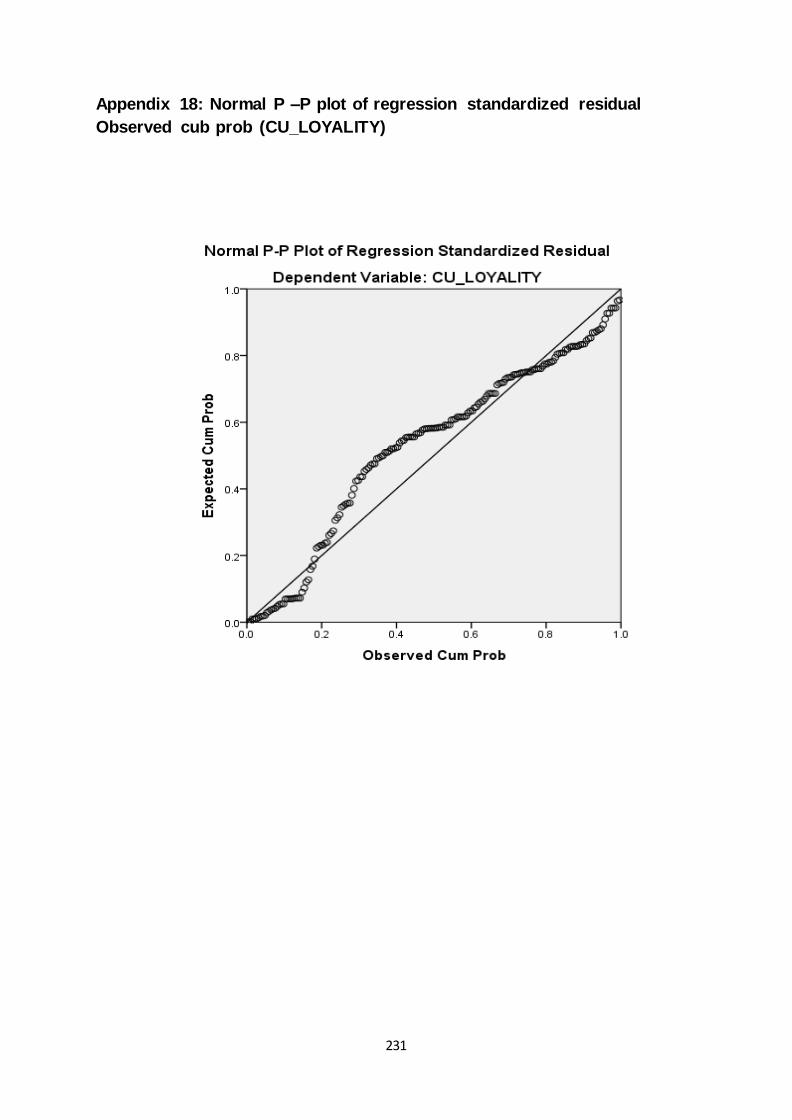
231
Appendix 18: Normal P –P plot of regression standardized residual
Observed cub prob (CU_LOYALITY)
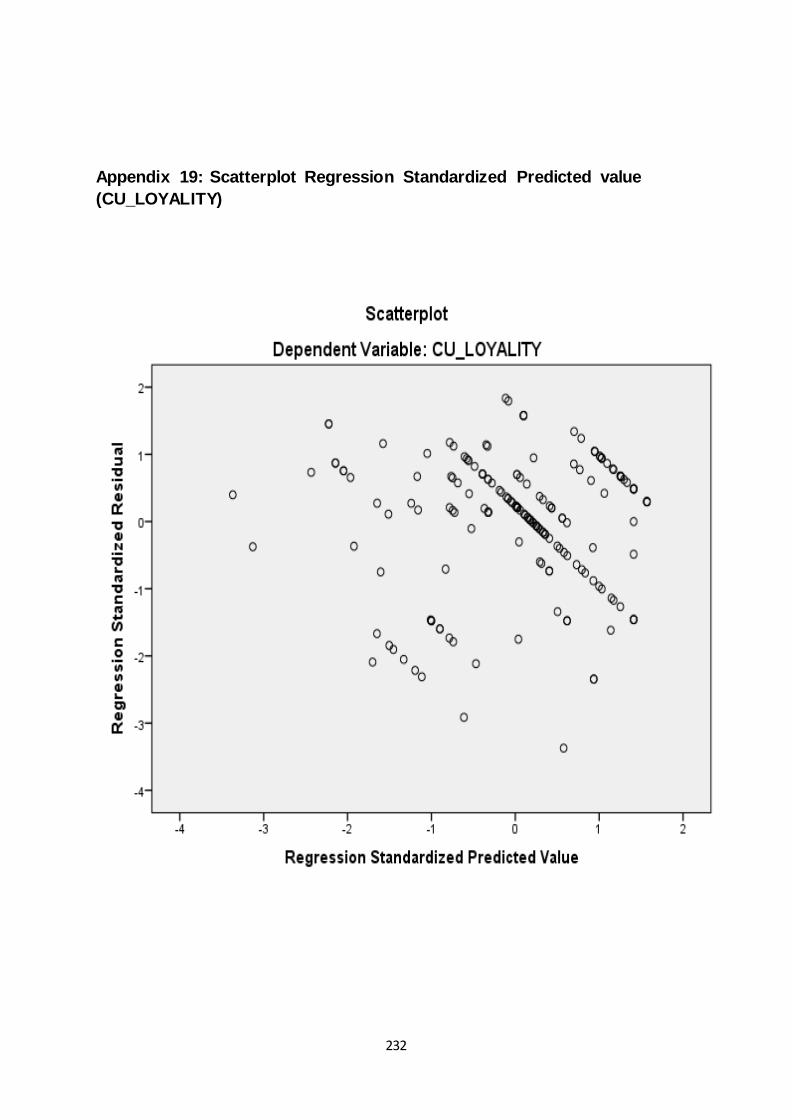
232
Appendix 19: Scatterplot Regression Standardized Predicted value
(CU_LOYALITY)
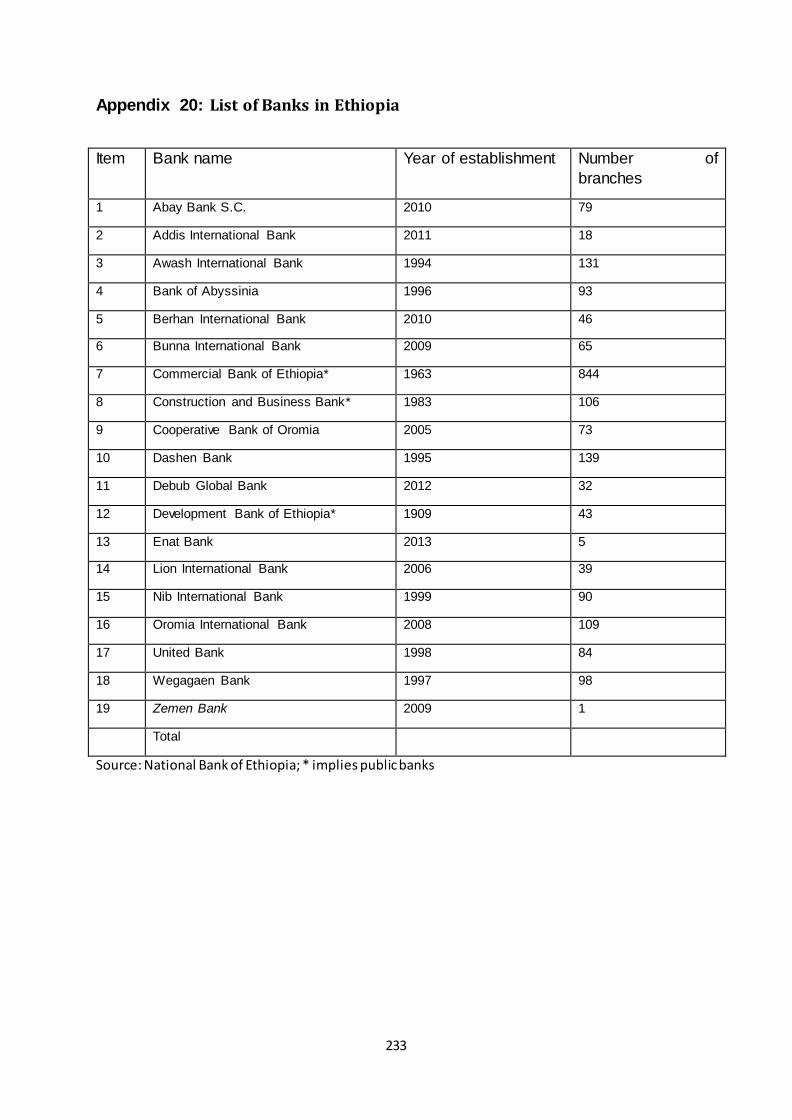
233
Appendix 20: List of Banks in Ethiopia
Item Bank name Year of establishment Number of
branches
1 Abay Bank S.C. 2010 79
2 Addis International Bank 2011 18
3 Awash International Bank 1994 131
4 Bank of Abyssinia 1996 93
5 Berhan International Bank 2010 46
6 Bunna International Bank 2009 65
7 Commercial Bank of Ethiopia* 1963 844
8 Construction and Business Bank* 1983 106
9 Cooperative Bank of Oromia 2005 73
10 Dashen Bank 1995 139
11 Debub Global Bank 2012 32
12 Development Bank of Ethiopia* 1909 43
13 Enat Bank 2013 5
14 Lion International Bank 2006 39
15 Nib International Bank 1999 90
16 Oromia International Bank 2008 109
17 United Bank 1998 84
18 Wegagaen Bank 1997 98
19 Zemen Bank 2009 1
Total
Source: National Bank of Ethiopia; * implies public banks

234
Appendix 21: Summary of the inter item correlations of internal marketing
attributes and the correlation of internal marketing attributes with employee
job satisfaction: (N=180)
EMSAT RLS SB WC CRD
EMSAT Pearson Correlation 1.000
RLS .889 1.000
SB .664 .413 1.000
WC .727 .500 .466 1.000
RLW .638 .513 .518 .367 1.000
Sig. (2-tailed) .000 .000 .000 .000 .000
N 180 180 180 180 180
**. Correlation is significant at the 0.01 level (2-tailed).
Appendix 22: Summary of the correlations of internal service quality
attributes/employee satisfaction and customer service quality:(N=180)
SQ* WC CRD RLS RLW SB
SQ* Pearson Correlation
1.000
RLS .015 1.000
SB .077 .413 1.000
RLW .034 .513 .200 1.000
WC .220 .500 .466 .367 1.000
CRD .229 .596 .518 .415 .543 1.000
N . .420 .153 .325 .002 .001
**. Correlation is significant at the 0.01 level (2-tailed).
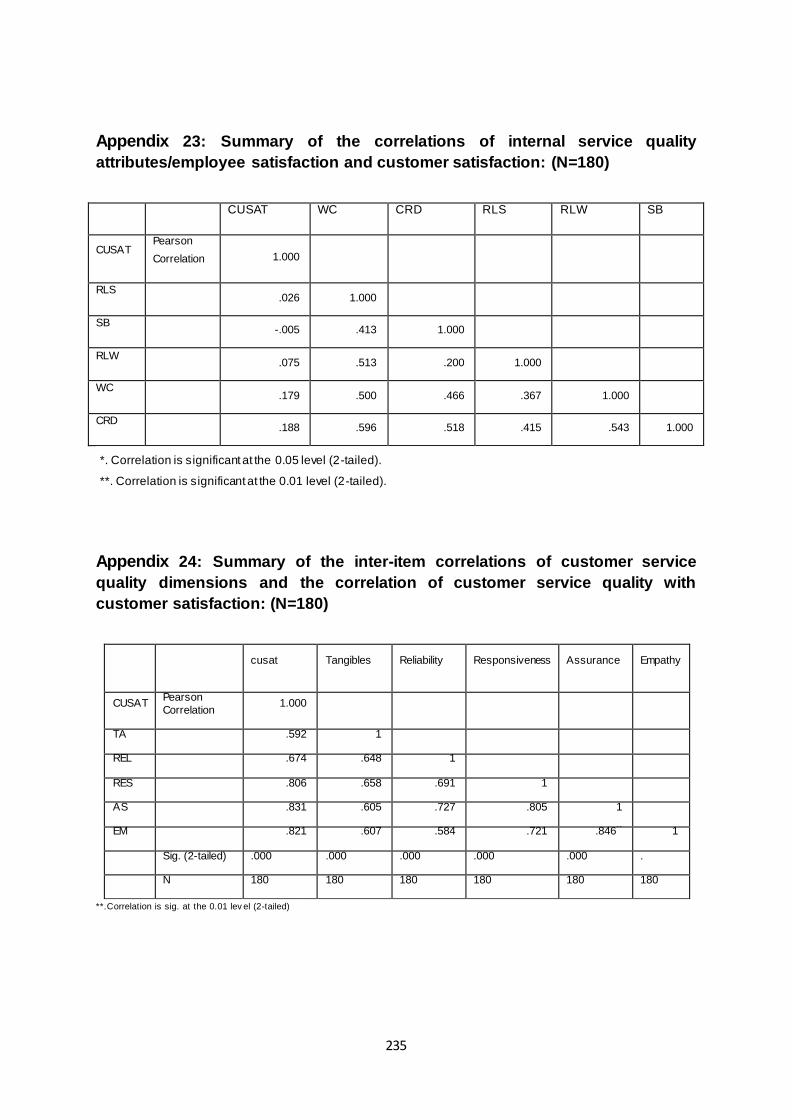
235
Appendix 23: Summary of the correlations of internal service quality
attributes/employee satisfaction and customer satisfaction: (N=180)
CUSAT WC CRD RLS RLW SB
CUSAT Pearson
Correlation 1.000
RLS .026 1.000
SB -.005 .413 1.000
RLW .075 .513 .200 1.000
WC .179 .500 .466 .367 1.000
CRD .188 .596 .518 .415 .543 1.000
*. Correlation is significant at the 0.05 level (2-tailed).
**. Correlation is significant at the 0.01 level (2-tailed).
Appendix 24: Summary of the inter-item correlations of customer service
quality dimensions and the correlation of customer service quality with
customer satisfaction: (N=180)
cusat Tangibles Reliability Responsiveness Assurance Empathy
CUSAT Pearson
Correlation 1.000
TA .592 1
REL .674 .648 1
RES .806 .658 .691 1
AS .831 .605 .727 .805 1
EM .821 .607 .584 .721 .846** 1
Sig. (2-tailed) .000 .000 .000 .000 .000 .
N 180 180 180 180 180 180
**.Correlation is sig. at the 0.01 lev el (2-tailed)

236
Appendix 25: Summary of the correlation of customer service quality
dimensions with customer loyalty: (N=180) cusat Tangibles Reliability Responsiv eness Assurance Empathy
CL Pearson
Correlation 1.000
TAN .617 1.000
REL .656 .648 1.000
RES .679 .658 .691 1.000
ASSURANCE .704 .605 .727 .805 1.000
EMPATHY .687 .607 .584 .721 .846 1.000
Sig. (2-
tailed) .000 .000 .000 .000 .000 .
N 180 180 180 180 180 180
**.Correlation is signif icant at the 0.01 lev el (2-tailed).
Appendix 26: Summary of the correlation of customer satisfaction dimensions
with customer loyalty:(N=180)
CL CS2 CS3 CS4 CS5 CS6
CL Pearson Correlation 1
CS2 Pearson Correlation .795** 1
CS3 Pearson Correlation .612** .571
** 1
CS4 Pearson Correlation .610** .623
** .626
** 1
CS5 Pearson Correlation .661** .626
** .608
** .837
** 1
CS6 Pearson Correlation .606** .616
** .848
** .595
** .680
** 1
Sig. (2-tailed) .000 .000 .000 .000 .000 **. Correlation is significant at the 0.01 level (2-tailed).

237
Appendix 27: Multiple regression analysis of internal service quality
dimensions and employee satisfaction in public and private banks:
Variable Coefficient Std. error Beta T Sig.
Pub. Priv. Pub. Priv. Pub. Priv. Pub. Priv. Pub. Priv.
(Constant) -2.263 -1.099 1.69
5
1.81
6
-1.335 -.605 .188 .546
RLS 1.119 1.116 .056 .030 .488 .581 19.995 36.948 .000 .000
SB 1.090 1.246 .090 .059 .231 .314 12.060 21.057 .000 .000
WC 1.321 1.152 .118 .069 .226 .271 11.174 16.769 .000 .000
RLW 1.126 1.098 .093 .087 .234 .191 12.057 12.582 .000 .000
R .995d .989b
R Square .990 978
Adjusted R
Square ..989 .977
Probability
..000d .000c
Std. Error of
the Estimate
1.749 1.699
F 1225.27 1333.78
Durbin-
Watson 1.814 2.043

238
Appendix 28: Multiple regression analysis showing internal service quality
dimensions and customer service quality in public and private banks:
Variable Coefficient Std. error Beta T Sig.
public Private Public Private Public Private public Private Public Private
(Constant) -31.621 -21.626 10.862 16.290 -2.911 -1.328 .005 .187
RLS -.884 -.384 .368 .287 -.527 -.143 -2.400 -1.339 .020 .183
SB -.846 -.034 .575 .567 -.246 -.006 -1.472 -.060 .147 .952
RLW .698 -1.212 .599 .786 .198 -.151 1.167 -1.542 .249 .126
WC 1.001 1.544 .797 .628 .234 .261 1.256 2.458 .215 .015
CRD 2.499 1.459 .882 .821 .559 .204 2.833 1.776 .007 .078
R
.502a
.328a
.
R Square .252 .108
Adjusted R Square
.177 .070
Probability
.011c .018c
Std. Error of the Estimate
11.0195 15.2206
F 3.361 2.853
Durbin-Watson
1.761 2.013

239
Appendix 29: Multiple regression analysis showing internal service quality
dimensions and customer satisfaction in public and private banks:
Variable Coefficient Std. error Beta T Sig.
Public Private Public private public private Public Private Public Private
(Constant) 12.431 18.869 3.478 4.638
3.574 4.068 .001 .000
RLS -.144 -.091 .118 .082 -.265 -.123 -1.218 -1.118 .229 .266
SB -.486 -.114 .184 .162 -.437 -.074 -2.640 -.706 .011 .482
RLW .269 -.238 .192 .224 .237 -.107 1.405 -1.064 .166 .290
WC .234 .374 .255 .179 .169 .227 .916 2.090 .364 .039
CRD .722 .311 .282 .234 .501 .156 2.556 1.331 .014 .186
R .512a .250
a
R Square . .262a . .063
a
Adjusted
R Square .189 .023
Probability
.008 .171
Std. Error of the
Estimate
.3.52846 4.33374
F 3.558 1.580
Durbin-
Watson 1.699 2.005
Predictors: (Constant), CRD, RLW, SB, WC, RLS; Dependent Variable: CU_SAT
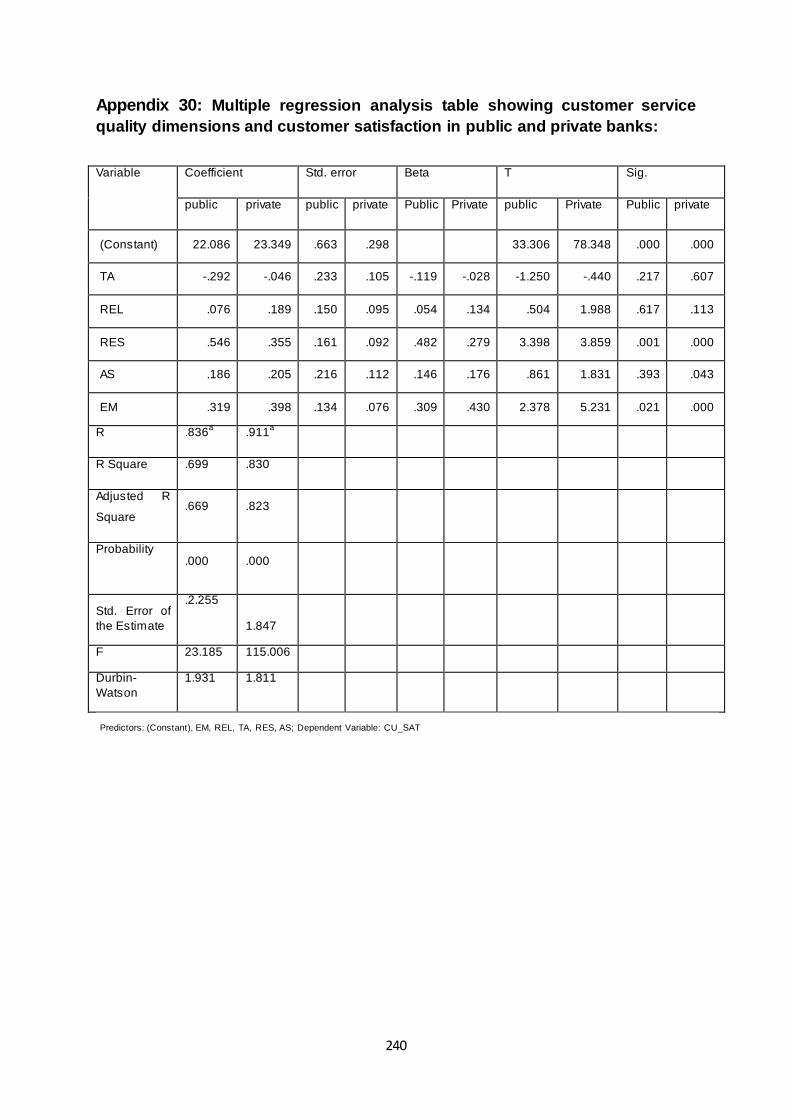
240
Appendix 30: Multiple regression analysis table showing customer service
quality dimensions and customer satisfaction in public and private banks:
Variable Coefficient Std. error Beta T Sig.
public private public private Public Private public Private Public private
(Constant) 22.086 23.349 .663 .298
33.306 78.348 .000 .000
TA -.292 -.046 .233 .105 -.119 -.028 -1.250 -.440 .217 .607
REL .076 .189 .150 .095 .054 .134 .504 1.988 .617 .113
RES .546 .355 .161 .092 .482 .279 3.398 3.859 .001 .000
AS .186 .205 .216 .112 .146 .176 .861 1.831 .393 .043
EM .319 .398 .134 .076 .309 .430 2.378 5.231 .021 .000
R .836a .911
a
R Square .699 .830
Adjusted R
Square .669 .823
Probability
.000 .000
Std. Error of
the Estimate
.2.255
1.847
F 23.185 115.006
Durbin-
Watson
1.931 1.811
Predictors: (Constant), EM, REL, TA, RES, AS; Dependent Variable: CU_SAT
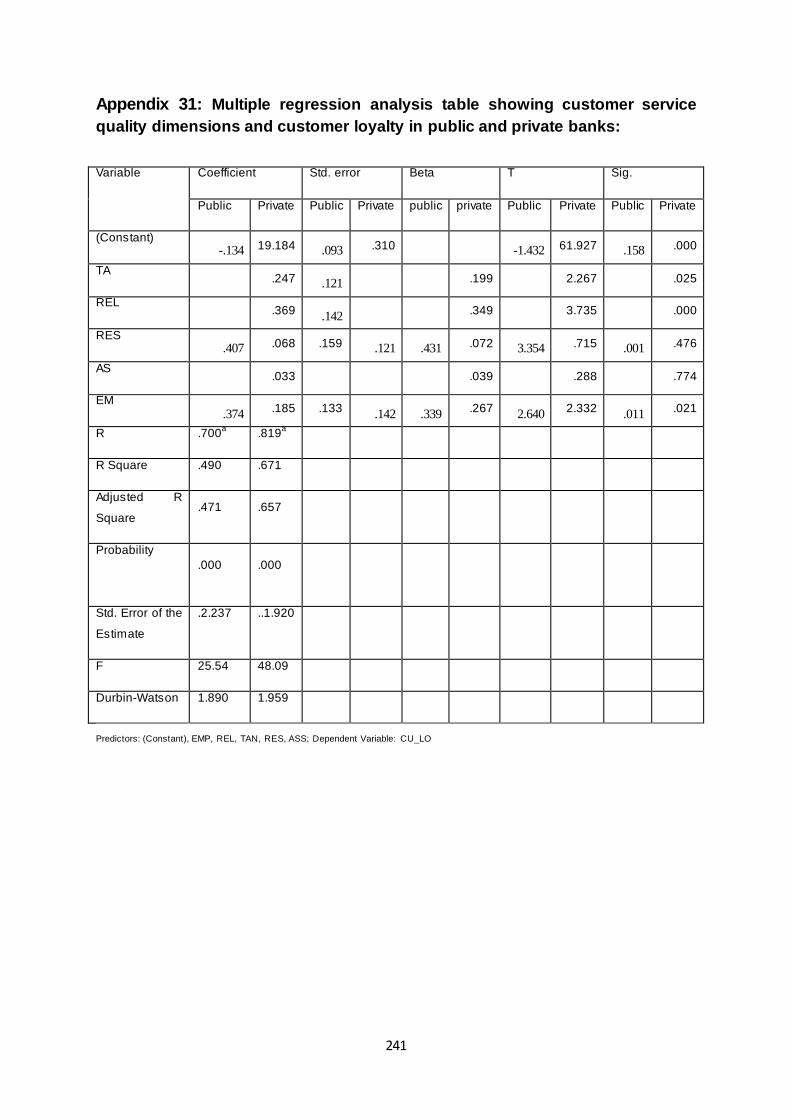
241
Appendix 31: Multiple regression analysis table showing customer service
quality dimensions and customer loyalty in public and private banks:
Variable Coefficient Std. error Beta T Sig.
Public Private Public Private public private Public Private Public Private
(Constant) -.134 19.184 .093 .310
-1.432 61.927 .158 .000
TA .247 .121 .199 2.267 .025
REL
.369 .142
.349
3.735
.000
RES .407 .068 .159 .121 .431 .072 3.354 .715 .001 .476
AS .033 .039 .288 .774
EM .374
.185 .133 .142 .339
.267 2.640
2.332 .011
.021
R .700a .819
a
R Square .490 .671
Adjusted R
Square .471 .657
Probability
.000 .000
Std. Error of the
Estimate
.2.237 ..1.920
F 25.54 48.09
Durbin-Watson 1.890 1.959
Predictors: (Constant), EMP, REL, TAN, RES, ASS; Dependent Variable: CU_LO
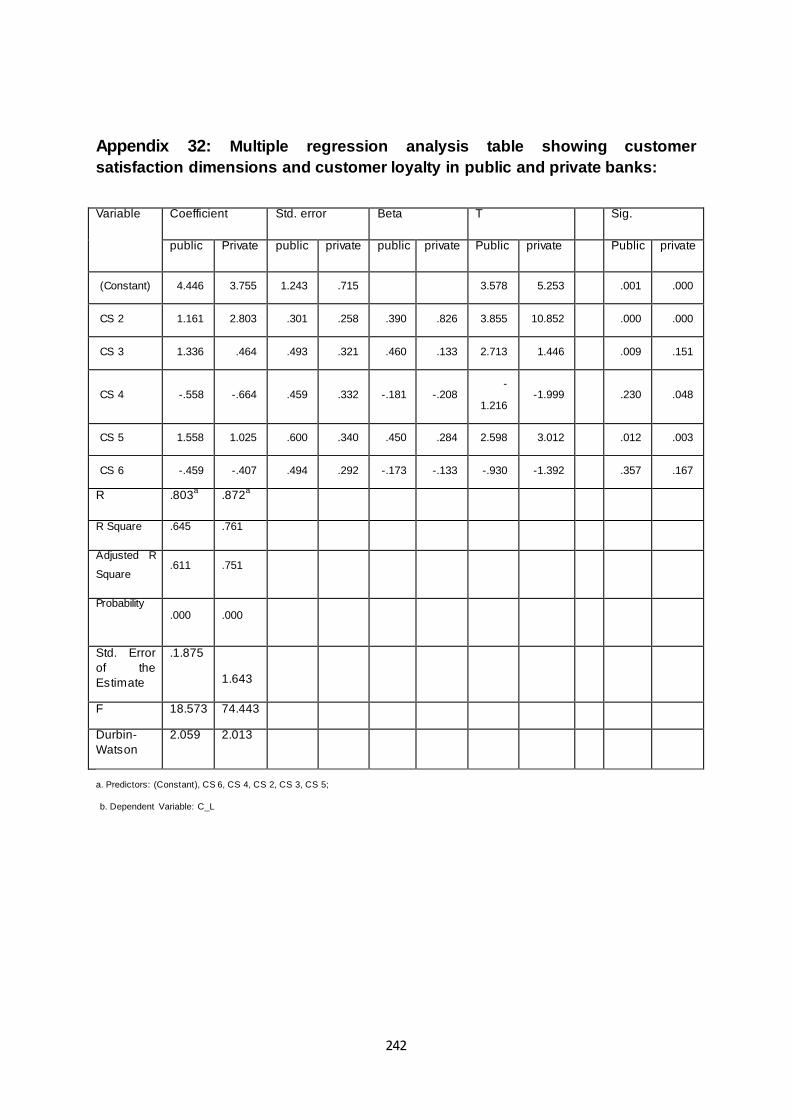
242
Appendix 32: Multiple regression analysis table showing customer
satisfaction dimensions and customer loyalty in public and private banks:
Variable Coefficient Std. error Beta T Sig.
public Private public private public private Public private Public private
(Constant) 4.446 3.755 1.243 .715
3.578 5.253 .001 .000
CS 2 1.161 2.803 .301 .258 .390 .826 3.855 10.852 .000 .000
CS 3 1.336 .464 .493 .321 .460 .133 2.713 1.446 .009 .151
CS 4 -.558 -.664 .459 .332 -.181 -.208 -
1.216 -1.999
.230 .048
CS 5 1.558 1.025 .600 .340 .450 .284 2.598 3.012 .012 .003
CS 6 -.459 -.407 .494 .292 -.173 -.133 -.930 -1.392 .357 .167
R .803a .872
a
R Square .645 .761
Adjusted R
Square .611 .751
Probability
.000 .000
Std. Error
of the
Estimate
.1.875
1.643
F 18.573 74.443
Durbin-
Watson
2.059 2.013
a. Predictors: (Constant), CS 6, CS 4, CS 2, CS 3, CS 5;
b. Dependent Variable: C_L

243
Appendix 33: Multiple regression analysis table showing customer loyalty
dimensions and profitability in public and private banks:
Variable Coefficient Std. error Beta T Sig.
public Private public private public private Public private Public Private
(Constant) 15.733 12.419 1.220 .625
12.901 19.877 .000 .000
CL 1 -.269 .032 .346 .220 -.170 .026 -.778 .143 .440 .886
CL 2 .129 .151 .382 .227 .077 .107 .336 .664 .738 .508
CL 3 -1.263 -.748 .368 .253 -.541 -.463 -3.430 -2.960 .001 .004
CL 4 .657 .414 .326 .210 .353 .324 2.020 1.973 .049 .051
R .462a .269
a
R Square .213 .072
Adjusted R
Square .153 .041
Probability
.000 .000
Std. Error of the Estimate
.1.479
1.238
F 3.526 2.300
Durbin-Watson
2.488 1.392
a. There are no valid cases in one or more split files. Statistics cannot be computed.
b. Dependent Variable: PROFITABILITY