Embed Size (px)
Citation preview
Comprehensive Search for New Phases and Compounds in Binary Alloy Systems Based onPlatinum-Group Metals, Using a Computational First-Principles Approach
Gus L.W. Hart,1 Stefano Curtarolo,2,* Thaddeus B. Massalski,3 and Ohad Levy2
1Department of Physics and Astronomy, Brigham Young University, Provo, Utah 84602, USA2Center for Materials Genomics, Department of Mechanical Engineering and Materials Science and Department of Physics,
Duke University, Durham, North Carolina 27708, USA3Materials Science, Engineering and Physics, Carnegie Mellon University, Pittsburgh, Pennsylvania 15213, USA
(Received 25 August 2013; published 30 December 2013)
We report a comprehensive study of the binary systems of the platinum-group metals with the transition
metals, using high-throughput first-principles calculations. These computations predict stability of new
compounds in 28 binary systems where no compounds have been reported in the literature experimentally
and a few dozen of as-yet unreported compounds in additional systems. Our calculations also identify
stable structures at compound compositions that have been previously reported without detailed structural
data and indicate that some experimentally reported compounds may actually be unstable at low
temperatures. With these results, we construct enhanced structure maps for the binary alloys of
platinum-group metals. These maps are much more complete, systematic, and predictive than those
based on empirical results alone.
DOI: 10.1103/PhysRevX.3.041035 Subject Areas: Computational Physics, Materials Science
I. INTRODUCTION
The platinum-group metals (PGMs)—osmium, iridium,ruthenium, rhodium, platinum, and palladium—are im-mensely important in numerous technologies, but theexperimental and computational data on their binary alloysstill contain many gaps. Interest in PGMs is driven by theiressential role in a wide variety of industrial applications,which is at odds with their high cost. The primary applica-tion of PGMs is in catalysis, where they are core ingredientsin the chemical, petroleum, and automotive industries. Theyalso extensively appear as alloying components in aeronau-tics and electronics applications. The use of platinum alloysin the jewelry industry also accounts for a sizable fraction ofits worldwide consumption, about 30% over the last decade[1]. The importance and high cost of PGMs motivate nu-merous efforts directed at more effective usage or at thedevelopment of less-expensive alloy substitutes. Despitethese efforts, there are still sizable gaps in the knowledgeof the basic properties of PGMs and their alloys; many ofthe possible alloy compositions have not yet been studied,and there is a considerable difficulty in the application ofthermodynamic experiments because they often requirehigh temperatures or pressures and very long equilibrationprocesses.
The possibility of predicting the existence of orderedstructures in alloy systems from their starting componentsis a major challenge of current materials research.
Empirical methods use experimental data to constructstructure maps and make predictions based on clusteringof simple physical parameters. Their usefulness dependson the availability of reliable data over the entire parameterspace of components and stoichiometries. Advances infirst-principles methods for the calculation of materialsproperties open the possibility to complement the experi-mental data by computational results. Indeed, many recentstudies present such calculations of PGM alloy structures[2–25]. However, most of these studies consider a limitednumber of structures, at just a few stoichiometries of asingle binary system or a few systems [3–17]. Some clusterexpansion studies of specific binary systems include alarger set of structures, but limited to a single lattice type(usually fcc) [18–23]. Realizing the potential of first-principles calculations to complement the lacking, oronly partial, empirical data requires high-throughput com-putational screening of large sets of materials, with struc-tures spanning all lattice types and including, in addition, aconsiderable number of off-lattice structures [2,26–28].Such large-scale screenings can be used to construct low-temperature binary phase diagrams. They provide insightinto trends in alloy properties and indicate the possibleexistence of hitherto unobserved compounds [27]. A fewprevious studies implemented this approach to binary sys-tems of specific metals—hafnium, rhenium, rhodium,ruthenium, and technetium [24,25,29–31].The capability to identify new phases is key to tuning the
catalytic properties of PGM alloys and their utilization innew applications, or as reduced-cost or higher-activitysubstitutes in current applications. Even predicted phasesthat are difficult to access kinetically in the bulk may beexhibited in nanophase alloys [32] and could be used toincrease the efficiency or the lifetimes of PGM catalysts.
Published by the American Physical Society under the terms ofthe Creative Commons Attribution 3.0 License. Further distri-bution of this work must maintain attribution to the author(s) andthe published article’s title, journal citation, and DOI.
Selected for a Viewpoint in PhysicsPHYSICAL REVIEW X 3, 041035 (2013)
2160-3308=13=3(4)=041035(33) 041035-1 Published by the American Physical Society
Given the potential payoff of uncovering such phases, wehave undertaken a thorough examination of PGM binaryphases with the transition metals, using the first-principleshigh-throughput (HT) framework AFLOW [33,34]. Wefind new potentially stable PGM phases in many binarysystems, and comparing experimental data with our pre-dictions, we construct enhanced Pettifor-type maps thatdemonstrate new ordering trends and compound-formingpossibilities in these alloys.
II. METHODS
Computations of the low-temperature stability of thePGM-transition metal systems were carried out using theHT framework AFLOW [33,34]. For each of the 153 binarysystems studied, we calculated the energies of more than250 structures, including all the crystal structures reportedfor the system in the phase-diagram literature [35,36] andadditional structures from the AFLOWLIB database ofprototypes and hypothetical hcp-, bcc-, and fcc-derivativesuperstructures [33]. A complete list of structures examinedfor each binary system can be found on the online repository[34,37] and in the supplemental material (see Ref. [38]).The low-temperature phase diagram of a system is con-structed as the minimum formation enthalpy convex hullfrom these candidate structures, identifying the orderingtrends in each alloy system and indicating the possibleexistence of previously unknown compounds. It should benoted that there is no guarantee that the true ground states ofa system will be found among the common experimentallyobserved structures or among small-unit-cell derivativestructures. However, even if it is impossible to rule out theexistence of additional unexpected ground states, this pro-tocol (searching many enumerated derivative structures[39] and exhaustively exploring experimentally reportedones) is expected to give a reasonable balance betweenhigh-throughput speed and scientific accuracy to determinemiscibility (or lack thereof) in these alloys. In Ref. [2],it was shown that the probability of reproducing thecorrect ground state, if well defined and not ambiguous, is�?C � 96:7% [‘‘reliability of the method,’’ Eq. (3)].
The calculations of the structure energies wereperformed with the VASP software [40] with projector-augmented-wave pseudopotentials [41] and the exchange-correlation functionals parametrized by Perdew, Burke,and Ernzerhof for the generalized gradient approximation[42]. The energies were calculated at zero temperatureand pressure, with spin polarization and without zero-point motion or lattice vibrations. All crystal structureswere fully relaxed (cell volume and shape and the basisatom coordinates inside the cell). Numerical convergenceto about 1 meV=atom was ensured by a high-energy cut-off (30% higher than the maximum cutoff of both poten-tials) and a 6000-k-point, or higher, Monkhorst-Packmesh [43].
The presented work comprises 39 266 calculations, per-formed by using 1:82� 106 CPU hours on 2013 Intel XeonE5 cores at 2.2 GHz. The calculations were carried out byextending the preexisting AFLOWLIB structure database[34] with additional calculations characterizing PGMalloys. Detailed information about all the examinedstructures can be found on the online repository [34,37],including input/output files, calculation parameters, ge-ometry of the structures, energies, and formation energies.In addition, the reader can prepare phase diagrams (asin Figs. 5–19) linked to the appropriate structure URLlocations. The Supplemental Material contains the wholeset of geometrical and relaxed structures with ab initio totalenergies and formation enthalpies (see Ref. [38]).The analysis of formation enthalpy is, by itself, insuffi-
cient to compare alloy stability at different concentrationsand their resilience toward high-temperature disorder. Theformation enthalpy, �HðAxB1�xÞ�HðAxB1�xÞ�xHðAÞ�ð1�xÞHðBÞ, represents the ordering strength of a mixtureAxB1�x against decomposition into its pure constituents atthe appropriate proportion xA and ð1� xÞB (�H is negativefor compound-forming systems). However, it does not con-tain information about its resilience against disorder, whichis captured by the entropy of the system. To quantify thisresilience we define the entropic temperature
Ts � maxi
��HðAxiB1�xiÞ
kB½xi logðxiÞ þ ð1� xiÞ logð1� xiÞ��; (1)
where i counts all the stable compounds identified in theABbinary system by the ab initio calculations, and the sign ischosen so that a positive temperature is needed for compet-ing against compound stability. This definition assumesan ideal scenario [28], where the entropy is S½fxig� ¼�kB
Pixi logðxiÞ. This first approximation should be con-
sidered as indicative of a trend (see Fig. 1 of Ref. [28] andFig. 1), which might be modified somewhat by a system-specific thorough analysis of the disorder. Ts is aconcentration-maximized formation enthalpy weighted bythe inverse of its entropic contribution. It represents thedeviation of a system convex hull from the purely entropicfree-energy hull, �TSðxÞ, and hence the ability of its or-dered phases to resist the deterioration into a temperature-driven, entropically promoted, disordered binary mixture.
III. HIGH-THROUGHPUT RESULTS
We examine the 153 binary systems containing a PGMand a transition metal, including the PGM-PGM pairs (seeFig. 1). An exhaustive comparison of experimental andcomputational ground states is given in Tables I, II, III,IV, V, and VI. Convex hulls for systems that exhibitcompounds are shown in the Appendix (Figs. 5–19).These results uncover 28 alloy systems reported as non-compound forming in the experimental literature but pre-dicted computationally to have low-temperature stable
HART et al. PHYS. REV. X 3, 041035 (2013)
041035-2

compounds. Dozens of new compounds are also predictedin systems known to be compound forming.
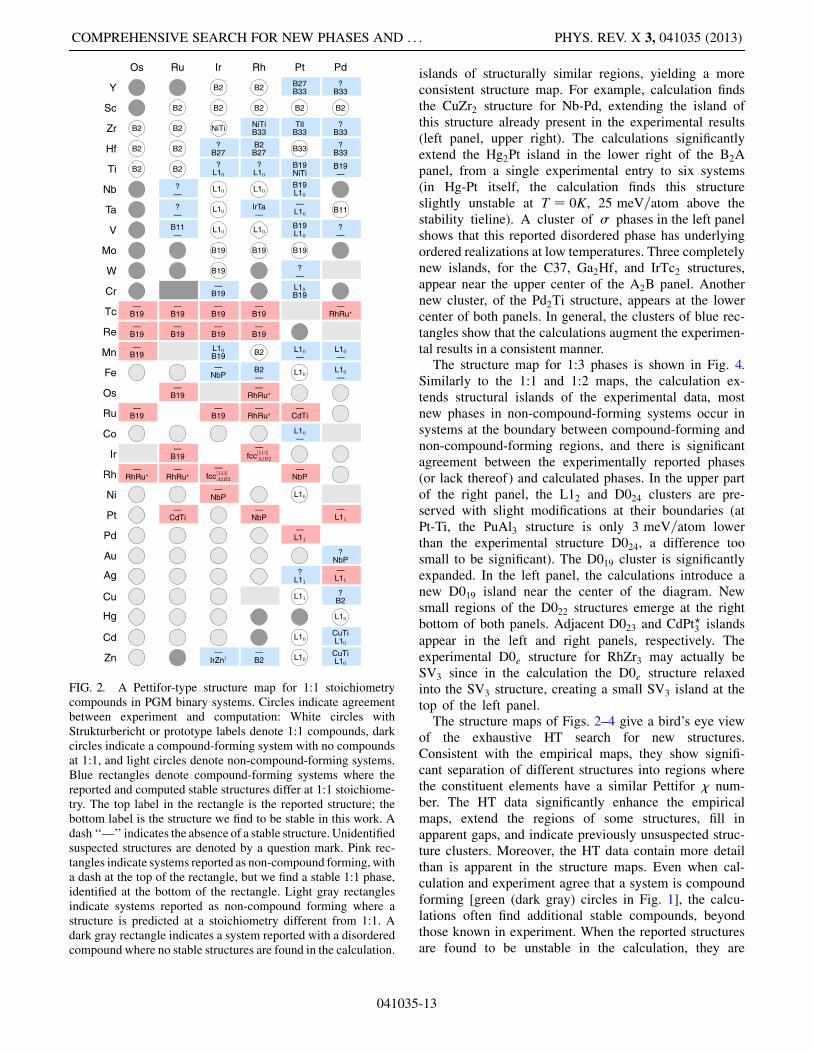
The top panel of Fig. 1 gives a broad overview of thecomparison of experiment and computation. Green circles(dark gray) indicate systems where experiment and com-putation agree that the system is compound forming. Lightgray circles indicate agreement that the system is notcompound forming. The elements along the axes of thisdiagram are listed according to their Pettifor � parameter[44,45], leading, as expected, to compound-forming andnon-compound-forming systems separating rather cleanlyinto different broad regions of the diagram. Most of thecompound-forming systems congregate in a large clusteron the left half of the diagram and in a second smallercluster at the lower right corner.
The systems for which computation predicts compoundsbut experiment does not report any are marked by redsquares. As is clear in the top panel of Fig. 1, these systems,which harbor potential new phases, occur near the bound-ary between the compound-forming and non-compound-forming regions of the diagram. They also fill in severalisolated spots where experiment reports no compounds inthe compound-forming region (e.g., Pd-Wand Ag-Pd), andthey bridge the gap between the large cluster of compound-forming systems, on the left side of the panel, and the small
island of such systems at its center. The computations alsopredict ordered structures in most systems reported onlywith disordered phases (yellow circles in top panel ofFig. 1). Two disordered phases, � and �, turn up in theexperimental literature on PGM alloys. In the HT search,we included all ordered realizations of these phases (theprototypes Al12Mg17 and Re24Ti5 are ordered versions ofthe � phase, and the � phase has 32 ordered realizations,denoted by �XXXXX, where X ¼ A, B). In most of thesesystems, we find one of these corresponding ordered struc-tures to be stable. The only exception is the Cr-Ru system,where the lowest-lying ordered phase is found just4 meV=atom above the elements’ tieline (yellow squarein Fig. 1). These results thus identify the low-temperatureordered compounds that underlie the reported disorderedphases. The calculated compound-forming regions areconsiderably more extensive than reported by the availableexperimental data, identifying potential new systems formaterials engineering.The bottom panel of Fig. 1 ranks systems by their
estimated entropic temperature Ts. Essentially, the (toppanel) map, incorporating the computational data, corre-sponds to what would be observed at low temperatures,assuming thermodynamic equilibrium, whereas a mapwith only experimental data reports systems as compound
OsRu
IrRhPtPd
Y Sc Zr Hf Ti Nb Ta V Mo W Cr Tc ReMn Fe Os Ru Co Ir Rh Ni Pt Pd Au Ag Cu Hg Cd Zn
OsRu
IrRhPtPd
Y Sc Zr Hf Ti Nb Ta V Mo W Cr Tc ReMn Fe Os Ru Co Ir Rh Ni Pt Pd Au Ag Cu Hg Cd Zn
Increasing
FIG. 1. Top panel: Compound-forming vs non-compound-forming systems as determined by experiment and computation. Circlesindicate agreement between experiment and computation—green for compound-forming systems, gray for non-compound-formingsystems. Yellow circles indicate systems reported in experiment to have disordered phases, for which low-energy compounds werefound in this work. Ru-Cr is the only system (yellow square) experimentally reported to include a disordered phase where no low-temperature stable compounds were found. Red squares mark systems for which low-temperature compounds are found incomputation but no compounds are reported in experiment. Bottom panel: Ts for the binary systems in this work. Colors: Fromred to blue indicates the lowest to highest Ts.
COMPREHENSIVE SEARCH FOR NEW PHASES AND . . . PHYS. REV. X 3, 041035 (2013)
041035-3

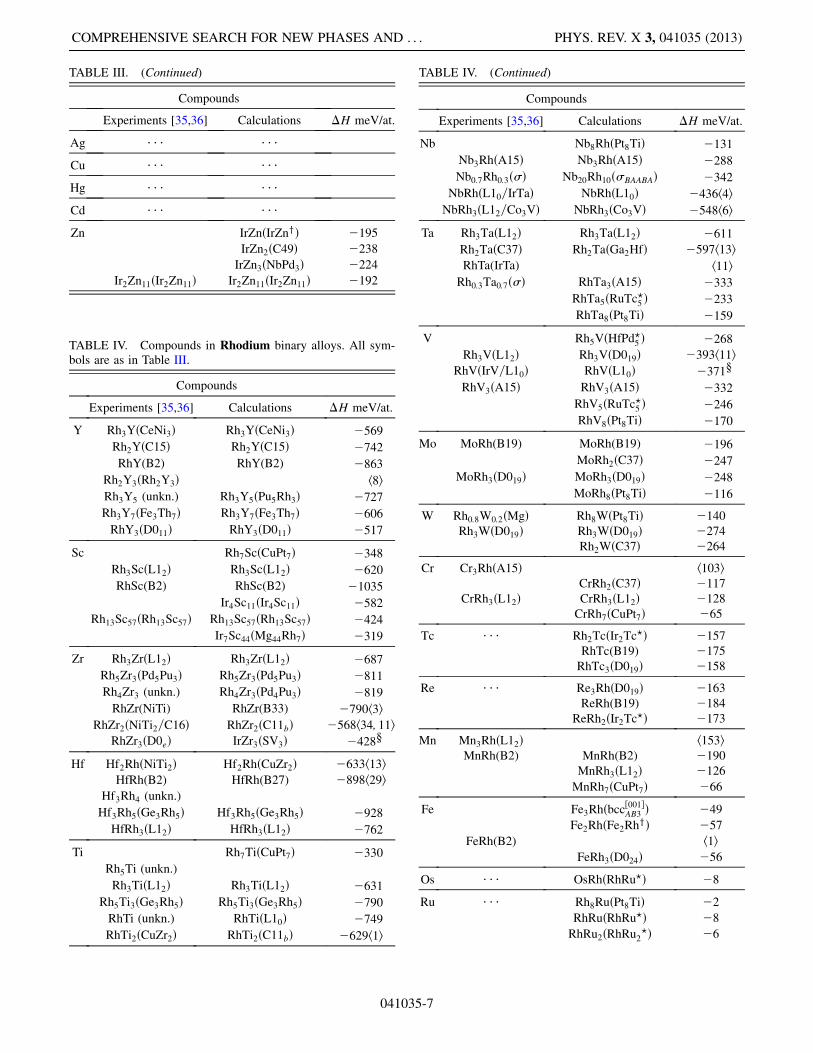
TABLE I. Compounds observed in experiments or predictedby ab initio calculations in Osmium binary alloys (structureprototype in parentheses; multiple entries denote different re-ported structures in the experiments or degenerate structures inthe calculations). The ‘‘� � �’’ denotes no compounds. The super-script ‘‘?’’ denotes unobserved prototypes found in calculations[2,13,25,27,29,31]. �H are the formation enthalpies from thepresent study. The energy difference between reported andcalculated structures or between the reported structure (unstablein the calculation) and a two-phase tieline is indicated as h�i.
Compounds
Experiments [35,36] Calculations �H meV/at.
Y Os2YðC14Þ Os2YðC14Þ �304
OsY3ðD011Þ OsY3ðD011Þ �239
Sc Os2ScðC14Þ Os2ScðC14Þ �390
OsSc2ðfcc½001�AB2 Þ �400
Os4Sc11ðIr4Sc11Þ Os4Sc11ðIr4Sc11Þ �372
Os7Sc44ðMg44Rh7Þ Os7Sc44ðMg44Rh7Þ �197
Zr Os2ZrðC14Þ Os2ZrðC14Þ �388
OsZr(B2) OsZr(B2) �524
Os4Zr11ðIr4Sc11Þ Os4Zr11ðIr4Sc11Þ �29
Os17Zr54ðHf54Os17Þ h8iOsZr4ðD1aÞ �220
Hf Hf54Os17ðHf54Os17Þ h20iHf2OsðNiTi2Þ h44iHfOs(B2) HfOs(B2) �709
HfOs2ðC14Þ h66iTi OsTi(B2) OsTi(B2) �714
OsTi2ðC49Þ �515
OsTi3ðMo3Ti?Þ �403
Nb Nb5OsðHfPd?5 Þ �200
Nb3OsðA15Þ Nb3OsðA15Þ �275
Nb0:6Os0:4ð�Þ Nb20Os10ð�BAABAÞ �274
Nb0:4Os0:6ð�Þ Nb12Os17ðAl12Mg17Þ �247
NbOs3ðD024Þ �115
Ta Os2TaðGa2HfÞ �205
Os0:5Ta0:5ð�Þ Os12Ta17ðAl12Mg17Þ �313
Os0:3Ta0:7ð�Þ Os10Ta20ð�ABBABÞ �335
OsTa3ðA15Þ �330
V Os3VðRe3Ru?Þ �150
Os3V5ðGa3Pt5Þ �350
OsV2ðC11bÞ �354
OsV3ðA15Þ OsV3ðD03Þ �361h21iOsV5ðMo5Ti
?Þ �253
Mo Mo3OsðA15Þ h29iMo0:65Os0:35ð�Þ
Compounds
Experiments [35,36] Calculations �H meV/at.
MoOs3ðD019Þ �52
W Os3WðD019Þ �56Os0:3W0:7ð�Þ
Cr Cr3OsðA15Þ h18iCrOs3ðD019Þ �22
CrOs5ðHf5Sc?Þ �19
Tc � � � Os5TcðHf5Sc?Þ �49
Os3TcðD019Þ �71
OsTc(B19) �83
OsTc3ðD019Þ �57
Re � � � Os3ReðD019Þ �78
OsRe(B19) �89
OsRe2ðSc2Zr?Þ �68
OsRe3ðRe3Ru?Þ �56
Mn � � � MnOs(B19) �42
MnOs3ðD019Þ �36
Fe � � � � � �Os Reference
Ru � � � Os3RuðD0aÞ �9
OsRu(B19) �15
OsRu3ðD0aÞ �11
OsRu5ðHf5Sc?Þ �9
Co � � � � � �Ir � � � Ir8OsðPt8TiÞ �8
IrOs5ðHf5Sc?Þ �7
Rh � � � OsRhðRhRu?Þ �8
Ni � � � � � �Pt � � � � � �Pd � � � � � �Au � � � � � �Ag � � � � � �Cu � � � � � �Hg � � � � � �Cd � � � � � �Zn � � � � � �
TABLE I. (Continued)
HART et al. PHYS. REV. X 3, 041035 (2013)
041035-4

TABLE II. Compounds in Ruthenium binary alloys. The term(unkn.) denotes an unknown structure. All other symbols are asin Table I.
Compounds
Experiments [35,36] Calculations �H meV/at.
Y Ru2YðC14Þ Ru2YðC14Þ �313
Ru2Y3ðEr3Ru2Þ h79iRu25Y44ðRu25Y44Þ Ru25Y44ðRu25Y44Þ �342
Ru2Y5ðC2Mn5Þ Ru2Y5ðC2Mn5Þ �334
RuY3ðD011Þ RuY3ðD011Þ �307
Sc Ru2ScðC14Þ Ru2ScðC14Þ �389
RuSc(B2) RuSc(B2) �540
Ru3Sc5ðD88Þ h42iRuSc2ðNiTi2Þ RuSc2ðC11bÞ �484h84i
Ru4Sc11ðIr4Sc11Þ Ru4Sc11ðIr4Sc11Þ �405
Ru13Sc57ðRh13Sc57Þ h10iRu7Sc44ðMg44Rh7Þ Ru7Sc44ðMg44Rh7Þ �226
Zr RuZr(B2) RuZr(B2) �644
Hf HfRu(B2) HfRu(B2) �819
HfRu2 (unkn.)
Ti RuTi(B2) RuTi(B2) �763
RuTi2ðC49Þ �532
RuTi3ðMo3Ti?Þ �401
Nb Nb8RuðPt8TiÞ �117
Nb5RuðNb5Ru?Þ �172
Nb3RuðL60Þ �222
Nb5Ru3ðGa3Pt5Þ �249
NbRu (unkn.)
Nb3Ru5ðGa3Pt5Þ �240
NbRu3ðL12Þ h8iTa Ru5Ta3 (unkn.) Ru5Ta3ðGa3Pt5Þ �332
RuTa (unkn.)
Ru3Ta5ðGa3Pt5Þ �313
RuTa3ðfcc½001�AB3 Þ �281
RuTa5ðNb5Ru?Þ �207
V Ru3VðRe3Ru?Þ �145
Ru2VðC37Þ �192
RuV(B11) h28iRu3V5ðGa3Pt5Þ �313
RuV2ðC11bÞ �321
RuV3ðMo3Ti?Þ �296
RuV4ðD1aÞ �262
RuV5ðNb5Ru?Þ �230
RuV8ðPt8TiÞ �154
Mo Mo0:6Ru0:4ð�Þ Mo14Ru16ð�AABABÞ �116
W Ru0:4W0:6ð�Þ Ru3WðD019Þ �65
Compounds
Experiments [35,36] Calculations �H meV/at.
Cr Cr0:7Ru0:3ð�Þ � � �Tc � � � Ru3TcðD019Þ �63
RuTc(B19) �73RuTc3ðD019Þ �47
RuTc5ðRuTc5?Þ �32
Re � � � Re3RuðRe3Ru?Þ �53
ReRu(B19) �86
ReRu3ðD019Þ �80
Mn � � � Mn24Ru5ðRe24Ti5Þ �18
Fe � � � � � �Os � � � Os3RuðD0aÞ �9
OsRu(B19) �15
OsRu3ðD0aÞ �11
OsRu5ðHf5Sc?Þ �9
Ru Reference
Co � � � � � �Ir � � � Ir8RuðPt8TiÞ �20
Ir3RuðL12Þ �34
IrRu(B19) �49
IrRu2ðIr2Tc?Þ �54
IrRu3ðD019Þ �53
IrRu5ðHf5Sc?Þ �37
Rh � � � Rh8RuðPt8TiÞ �2
RhRuðRhRu?Þ �8
RhRu2ðRhRu2?Þ �6
RhRu5ðRhRu5?Þ �3
Ni � � � � � �Pt � � � PtRu(CdTi) �33
Pd � � � � � �Au � � � � � �Ag � � � � � �Cu � � � � � �Hg � � � � � �Cd � � � � � �Zn RuZn3ðL12Þ �150
RuZn6ðRuZn6Þ RuZn6ðRuZn6Þ �132
TABLE II. (Continued)
COMPREHENSIVE SEARCH FOR NEW PHASES AND . . . PHYS. REV. X 3, 041035 (2013)
041035-5
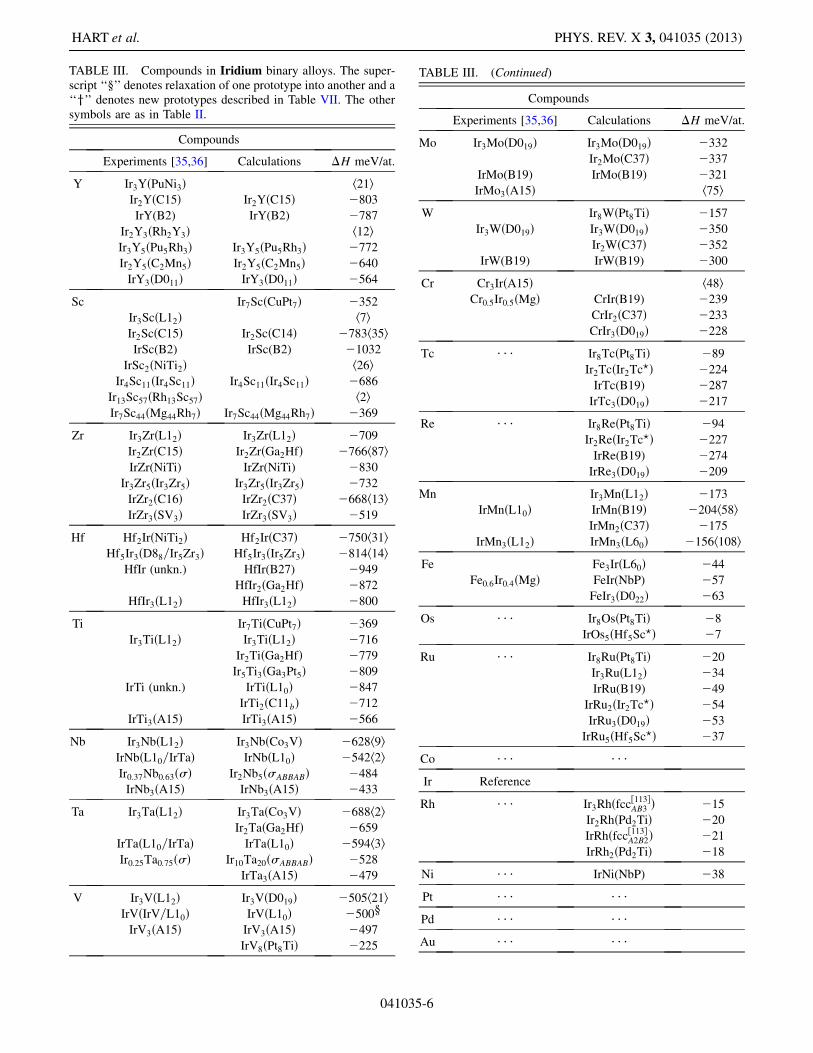
TABLE III. Compounds in Iridium binary alloys. The super-script ‘‘x’’ denotes relaxation of one prototype into another and a‘‘y’’ denotes new prototypes described in Table VII. The othersymbols are as in Table II.
Compounds
Experiments [35,36] Calculations �H meV/at.
Y Ir3YðPuNi3Þ h21iIr2YðC15Þ Ir2YðC15Þ �803
IrY(B2) IrY(B2) �787
Ir2Y3ðRh2Y3Þ h12iIr3Y5ðPu5Rh3Þ Ir3Y5ðPu5Rh3Þ �772
Ir2Y5ðC2Mn5Þ Ir2Y5ðC2Mn5Þ �640
IrY3ðD011Þ IrY3ðD011Þ �564
Sc Ir7ScðCuPt7Þ �352
Ir3ScðL12Þ h7iIr2ScðC15Þ Ir2ScðC14Þ �783h35iIrSc(B2) IrSc(B2) �1032
IrSc2ðNiTi2Þ h26iIr4Sc11ðIr4Sc11Þ Ir4Sc11ðIr4Sc11Þ �686
Ir13Sc57ðRh13Sc57Þ h2iIr7Sc44ðMg44Rh7Þ Ir7Sc44ðMg44Rh7Þ �369
Zr Ir3ZrðL12Þ Ir3ZrðL12Þ �709
Ir2ZrðC15Þ Ir2ZrðGa2HfÞ �766h87iIrZr(NiTi) IrZr(NiTi) �830
Ir3Zr5ðIr3Zr5Þ Ir3Zr5ðIr3Zr5Þ �732
IrZr2ðC16Þ IrZr2ðC37Þ �668h13iIrZr3ðSV3Þ IrZr3ðSV3Þ �519
Hf Hf2IrðNiTi2Þ Hf2IrðC37Þ �750h31iHf5Ir3ðD88=Ir5Zr3Þ Hf5Ir3ðIr5Zr3Þ �814h14i
HfIr (unkn.) HfIr(B27) �949
HfIr2ðGa2HfÞ �872
HfIr3ðL12Þ HfIr3ðL12Þ �800
Ti Ir7TiðCuPt7Þ �369
Ir3TiðL12Þ Ir3TiðL12Þ �716
Ir2TiðGa2HfÞ �779
Ir5Ti3ðGa3Pt5Þ �809
IrTi (unkn.) IrTiðL10Þ �847
IrTi2ðC11bÞ �712
IrTi3ðA15Þ IrTi3ðA15Þ �566
Nb Ir3NbðL12Þ Ir3NbðCo3VÞ �628h9iIrNbðL10=IrTaÞ IrNbðL10Þ �542h2iIr0:37Nb0:63ð�Þ Ir2Nb5ð�ABBABÞ �484
IrNb3ðA15Þ IrNb3ðA15Þ �433
Ta Ir3TaðL12Þ Ir3TaðCo3VÞ �688h2iIr2TaðGa2HfÞ �659
IrTaðL10=IrTaÞ IrTaðL10Þ �594h3iIr0:25Ta0:75ð�Þ Ir10Ta20ð�ABBABÞ �528
IrTa3ðA15Þ �479
V Ir3VðL12Þ Ir3VðD019Þ �505h21iIrVðIrV=L10Þ IrVðL10Þ �500xIrV3ðA15Þ IrV3ðA15Þ �497
IrV8ðPt8TiÞ �225
Compounds
Experiments [35,36] Calculations �H meV/at.
Mo Ir3MoðD019Þ Ir3MoðD019Þ �332
Ir2MoðC37Þ �337
IrMo(B19) IrMo(B19) �321
IrMo3ðA15Þ h75iW Ir8WðPt8TiÞ �157
Ir3WðD019Þ Ir3WðD019Þ �350
Ir2WðC37Þ �352
IrW(B19) IrW(B19) �300
Cr Cr3IrðA15Þ h48iCr0:5Ir0:5ðMgÞ CrIr(B19) �239
CrIr2ðC37Þ �233
CrIr3ðD019Þ �228
Tc � � � Ir8TcðPt8TiÞ �89
Ir2TcðIr2Tc?Þ �224
IrTc(B19) �287
IrTc3ðD019Þ �217
Re � � � Ir8ReðPt8TiÞ �94
Ir2ReðIr2Tc?Þ �227
IrRe(B19) �274
IrRe3ðD019Þ �209
Mn Ir3MnðL12Þ �173
IrMnðL10Þ IrMnðB19Þ �204h58iIrMn2ðC37Þ �175
IrMn3ðL12Þ IrMn3ðL60Þ �156h108iFe Fe3IrðL60Þ �44
Fe0:6Ir0:4ðMgÞ FeIr(NbP) �57
FeIr3ðD022Þ �63
Os � � � Ir8OsðPt8TiÞ �8
IrOs5ðHf5Sc?Þ �7
Ru � � � Ir8RuðPt8TiÞ �20
Ir3RuðL12Þ �34
IrRu(B19) �49
IrRu2ðIr2Tc?Þ �54
IrRu3ðD019Þ �53
IrRu5ðHf5Sc?Þ �37
Co � � � � � �Ir Reference
Rh � � � Ir3Rhðfcc½113�AB3 Þ �15
Ir2RhðPd2TiÞ �20
IrRhðfcc½113�A2B2Þ �21
IrRh2ðPd2TiÞ �18
Ni � � � IrNi(NbP) �38
Pt � � � � � �Pd � � � � � �Au � � � � � �
TABLE III. (Continued)
HART et al. PHYS. REV. X 3, 041035 (2013)
041035-6
Compounds
Experiments [35,36] Calculations �H meV/at.
Ag � � � � � �Cu � � � � � �Hg � � � � � �Cd � � � � � �Zn IrZnðIrZnyÞ �195
IrZn2ðC49Þ �238
IrZn3ðNbPd3Þ �224
Ir2Zn11ðIr2Zn11Þ Ir2Zn11ðIr2Zn11Þ �192
TABLE III. (Continued)
TABLE IV. Compounds in Rhodium binary alloys. All sym-bols are as in Table III.
Compounds
Experiments [35,36] Calculations �H meV/at.
Y Rh3YðCeNi3Þ Rh3YðCeNi3Þ �569
Rh2YðC15Þ Rh2YðC15Þ �742
RhY(B2) RhY(B2) �863
Rh2Y3ðRh2Y3Þ h8iRh3Y5 (unkn.) Rh3Y5ðPu5Rh3Þ �727
Rh3Y7ðFe3Th7Þ Rh3Y7ðFe3Th7Þ �606
RhY3ðD011Þ RhY3ðD011Þ �517
Sc Rh7ScðCuPt7Þ �348
Rh3ScðL12Þ Rh3ScðL12Þ �620
RhSc(B2) RhSc(B2) �1035
Ir4Sc11ðIr4Sc11Þ �582
Rh13Sc57ðRh13Sc57Þ Rh13Sc57ðRh13Sc57Þ �424
Ir7Sc44ðMg44Rh7Þ �319
Zr Rh3ZrðL12Þ Rh3ZrðL12Þ �687
Rh5Zr3ðPd5Pu3Þ Rh5Zr3ðPd5Pu3Þ �811
Rh4Zr3 (unkn.) Rh4Zr3ðPd4Pu3Þ �819
RhZr(NiTi) RhZr(B33) �790h3iRhZr2ðNiTi2=C16Þ RhZr2ðC11bÞ �568h34; 11i
RhZr3ðD0eÞ IrZr3ðSV3Þ �428xHf Hf2RhðNiTi2Þ Hf2RhðCuZr2Þ �633h13i
HfRh(B2) HfRh(B27) �898h29iHf3Rh4 (unkn.)
Hf3Rh5ðGe3Rh5Þ Hf3Rh5ðGe3Rh5Þ �928
HfRh3ðL12Þ HfRh3ðL12Þ �762
Ti Rh7TiðCuPt7Þ �330
Rh5Ti (unkn.)
Rh3TiðL12Þ Rh3TiðL12Þ �631
Rh5Ti3ðGe3Rh5Þ Rh5Ti3ðGe3Rh5Þ �790
RhTi (unkn.) RhTiðL10Þ �749
RhTi2ðCuZr2Þ RhTi2ðC11bÞ �629h1i
Compounds
Experiments [35,36] Calculations �H meV/at.
Nb Nb8RhðPt8TiÞ �131
Nb3RhðA15Þ Nb3RhðA15Þ �288
Nb0:7Rh0:3ð�Þ Nb20Rh10ð�BAABAÞ �342
NbRhðL10=IrTaÞ NbRhðL10Þ �436h4iNbRh3ðL12=Co3VÞ NbRh3ðCo3VÞ �548h6i
Ta Rh3TaðL12Þ Rh3TaðL12Þ �611
Rh2TaðC37Þ Rh2TaðGa2HfÞ �597h13iRhTa(IrTa) h11iRh0:3Ta0:7ð�Þ RhTa3ðA15Þ �333
RhTa5ðRuTc?5 Þ �233
RhTa8ðPt8TiÞ �159
V Rh5VðHfPd?5 Þ �268
Rh3VðL12Þ Rh3VðD019Þ �393h11iRhVðIrV=L10Þ RhVðL10Þ �371xRhV3ðA15Þ RhV3ðA15Þ �332
RhV5ðRuTc?5 Þ �246
RhV8ðPt8TiÞ �170
Mo MoRh(B19) MoRh(B19) �196
MoRh2ðC37Þ �247
MoRh3ðD019Þ MoRh3ðD019Þ �248
MoRh8ðPt8TiÞ �116
W Rh0:8W0:2ðMgÞ Rh8WðPt8TiÞ �140Rh3WðD019Þ Rh3WðD019Þ �274
Rh2WðC37Þ �264
Cr Cr3RhðA15Þ h103iCrRh2ðC37Þ �117
CrRh3ðL12Þ CrRh3ðL12Þ �128CrRh7ðCuPt7Þ �65
Tc � � � Rh2TcðIr2Tc?Þ �157RhTc(B19) �175RhTc3ðD019Þ �158
Re � � � Re3RhðD019Þ �163ReRh(B19) �184
ReRh2ðIr2Tc?Þ �173
Mn Mn3RhðL12Þ h153iMnRh(B2) MnRh(B2) �190
MnRh3ðL12Þ �126
MnRh7ðCuPt7Þ �66
Fe Fe3Rhðbcc½001�AB3 Þ �49
Fe2RhðFe2RhyÞ �57
FeRh(B2) h1iFeRh3ðD024Þ �56
Os � � � OsRhðRhRu?Þ �8
Ru � � � Rh8RuðPt8TiÞ �2
RhRuðRhRu?Þ �8
RhRu2ðRhRu2?Þ �6
TABLE IV. (Continued)
COMPREHENSIVE SEARCH FOR NEW PHASES AND . . . PHYS. REV. X 3, 041035 (2013)
041035-7
forming when reaching thermodynamic equilibrium ispresumably easier. That is not to say, however, thatthe predicted phases will necessarily be difficult tosynthesize—some of the systems where the Ts value issmall have been experimentally observed to be compoundforming (e.g., Cr-Pd, Au-Pd, Ag-Pt, Hg-Rh, and Co-Pt). Ts
decreases gradually as we move from the centers of thecompound-forming clusters towards their edges. Mostsystems with low Ts are adjacent to the remaining non-compound-forming region. This leads to a qualitativepicture of compound stability against disorder, which iscorrelated with the position of a system within thecompound-forming cluster and with larger clusters cen-tered at systems with more stable structures.
It is instructive to note that many obscure and large unitcell structures that are reported in the experimental litera-ture are recovered in the HT search. For example, com-pounds of prototypes such as Mg44Rh7, Ru25Y44, Ir4Sc11,
Compounds
Experiments [35,36] Calculations �H meV/at.
RhRu5ðRhRu5?Þ �3
Co � � � � � �Ir � � � Ir3Rhðfcc½113�AB3 Þ �15
Ir2RhðPd2TiÞ �20
IrRhðfcc½113�A2B2Þ �21
IrRh2ðPd2TiÞ �18
Rh Reference
Ni � � � � � �Pt � � � PtRh(NbP) �25
PtRh2ðPd2TiÞ �21
PtRh3ðD022Þ �18
Pd � � � � � �Au � � � � � �Ag � � � � � �Cu � � � Cu7RhðCuPt7Þ �4
Hg ‘‘Hg5Rh’’ Hg4RhðHg4PtÞ �40
‘‘Hg4:63Rh’’
Hg2RhðHg2PtÞ h28iCd ‘‘Cd21Rh5’’ Cd4RhðHg4PtÞ �104
(�-brass) Cd2RhðHg2PtÞ �166
Zn ‘‘Rh5Zn21’’ RhZn(B2) �391
(�-brass) Rh3Zn5ðGa3Pt5Þ �395
RhZn2ðZrSi2Þ �388
RhZn3ðD023Þ �351Rh2Zn11 (ICSD#107576) �250RhZn13 (ICSD#107575) �129
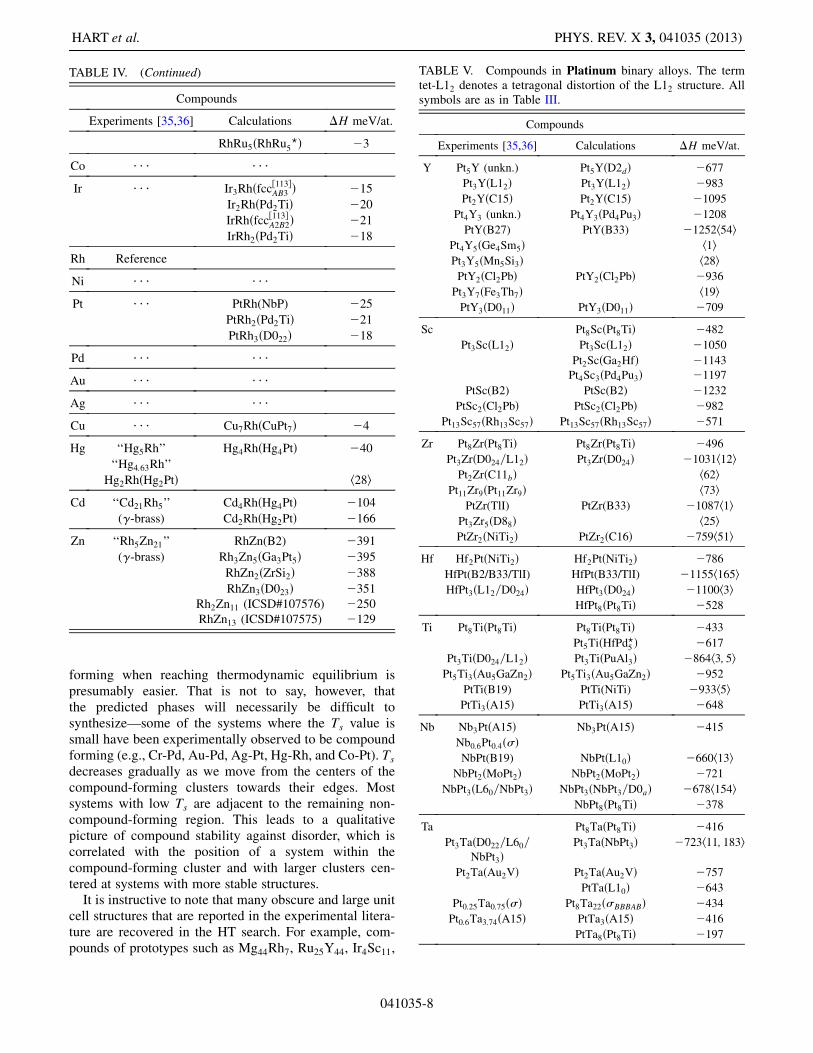
TABLE IV. (Continued) TABLE V. Compounds in Platinum binary alloys. The termtet-L12 denotes a tetragonal distortion of the L12 structure. Allsymbols are as in Table III.
Compounds
Experiments [35,36] Calculations �H meV/at.
Y Pt5Y (unkn.) Pt5YðD2dÞ �677
Pt3YðL12Þ Pt3YðL12Þ �983
Pt2YðC15Þ Pt2YðC15Þ �1095
Pt4Y3 (unkn.) Pt4Y3ðPd4Pu3Þ �1208
PtY(B27) PtY(B33) �1252h54iPt4Y5ðGe4Sm5Þ h1iPt3Y5ðMn5Si3Þ h28iPtY2ðCl2PbÞ PtY2ðCl2PbÞ �936
Pt3Y7ðFe3Th7Þ h19iPtY3ðD011Þ PtY3ðD011Þ �709
Sc Pt8ScðPt8TiÞ �482
Pt3ScðL12Þ Pt3ScðL12Þ �1050
Pt2ScðGa2HfÞ �1143
Pt4Sc3ðPd4Pu3Þ �1197
PtSc(B2) PtSc(B2) �1232
PtSc2ðCl2PbÞ PtSc2ðCl2PbÞ �982
Pt13Sc57ðRh13Sc57Þ Pt13Sc57ðRh13Sc57Þ �571
Zr Pt8ZrðPt8TiÞ Pt8ZrðPt8TiÞ �496
Pt3ZrðD024=L12Þ Pt3ZrðD024Þ �1031h12iPt2ZrðC11bÞ h62i
Pt11Zr9ðPt11Zr9Þ h73iPtZr(TlI) PtZr(B33) �1087h1i
Pt3Zr5ðD88Þ h25iPtZr2ðNiTi2Þ PtZr2ðC16Þ �759h51i
Hf Hf2PtðNiTi2Þ Hf2PtðNiTi2Þ �786
HfPt(B2/B33/TlI) HfPt(B33/TlI) �1155h165iHfPt3ðL12=D024Þ HfPt3ðD024Þ �1100h3i
HfPt8ðPt8TiÞ �528
Ti Pt8TiðPt8TiÞ Pt8TiðPt8TiÞ �433
Pt5TiðHfPd?5 Þ �617
Pt3TiðD024=L12Þ Pt3TiðPuAl3Þ �864h3; 5iPt5Ti3ðAu5GaZn2Þ Pt5Ti3ðAu5GaZn2Þ �952
PtTi(B19) PtTi(NiTi) �933h5iPtTi3ðA15Þ PtTi3ðA15Þ �648
Nb Nb3PtðA15Þ Nb3PtðA15Þ �415
Nb0:6Pt0:4ð�ÞNbPt(B19) NbPtðL10Þ �660h13i
NbPt2ðMoPt2Þ NbPt2ðMoPt2Þ �721
NbPt3ðL60=NbPt3Þ NbPt3ðNbPt3=D0aÞ �678h154iNbPt8ðPt8TiÞ �378
Ta Pt8TaðPt8TiÞ �416
Pt3TaðD022=L60=NbPt3Þ
Pt3TaðNbPt3Þ �723h11; 183i
Pt2TaðAu2VÞ Pt2TaðAu2VÞ �757
PtTaðL10Þ �643
Pt0:25Ta0:75ð�Þ Pt8Ta22ð�BBBABÞ �434
Pt0:6Ta3:74ðA15Þ PtTa3ðA15Þ �416
PtTa8ðPt8TiÞ �197
HART et al. PHYS. REV. X 3, 041035 (2013)
041035-8
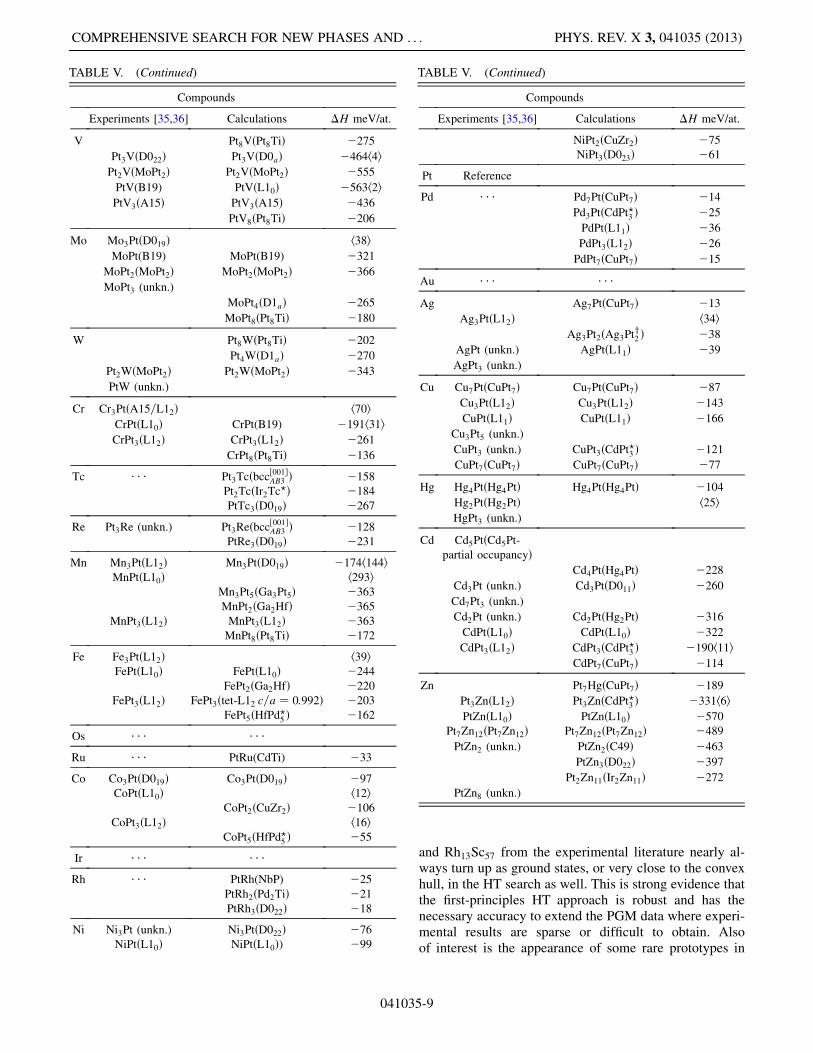
and Rh13Sc57 from the experimental literature nearly al-ways turn up as ground states, or very close to the convexhull, in the HT search as well. This is strong evidence thatthe first-principles HT approach is robust and has thenecessary accuracy to extend the PGM data where experi-mental results are sparse or difficult to obtain. Alsoof interest is the appearance of some rare prototypes in
Compounds
Experiments [35,36] Calculations �H meV/at.
V Pt8VðPt8TiÞ �275
Pt3VðD022Þ Pt3VðD0aÞ �464h4iPt2VðMoPt2Þ Pt2VðMoPt2Þ �555
PtV(B19) PtVðL10Þ �563h2iPtV3ðA15Þ PtV3ðA15Þ �436
PtV8ðPt8TiÞ �206
Mo Mo3PtðD019Þ h38iMoPt(B19) MoPt(B19) �321
MoPt2ðMoPt2Þ MoPt2ðMoPt2Þ �366
MoPt3 (unkn.)
MoPt4ðD1aÞ �265
MoPt8ðPt8TiÞ �180
W Pt8WðPt8TiÞ �202
Pt4WðD1aÞ �270
Pt2WðMoPt2Þ Pt2WðMoPt2Þ �343
PtW (unkn.)
Cr Cr3PtðA15=L12Þ h70iCrPtðL10Þ CrPt(B19) �191h31iCrPt3ðL12Þ CrPt3ðL12Þ �261
CrPt8ðPt8TiÞ �136
Tc � � � Pt3Tcðbcc½001�AB3 Þ �158Pt2TcðIr2Tc?Þ �184
PtTc3ðD019Þ �267
Re Pt3Re (unkn.) Pt3Reðbcc½001�AB3 Þ �128PtRe3ðD019Þ �231
Mn Mn3PtðL12Þ Mn3PtðD019Þ �174h144iMnPtðL10Þ h293i
Mn3Pt5ðGa3Pt5Þ �363MnPt2ðGa2HfÞ �365
MnPt3ðL12Þ MnPt3ðL12Þ �363MnPt8ðPt8TiÞ �172
Fe Fe3PtðL12Þ h39iFePtðL10Þ FePtðL10Þ �244
FePt2ðGa2HfÞ �220FePt3ðL12Þ FePt3ðtet-L12 c=a ¼ 0:992Þ �203
FePt5ðHfPd?5 Þ �162
Os � � � � � �Ru � � � PtRu(CdTi) �33
Co Co3PtðD019Þ Co3PtðD019Þ �97CoPtðL10Þ h12i
CoPt2ðCuZr2Þ �106
CoPt3ðL12Þ h16iCoPt5ðHfPd?5 Þ �55
Ir � � � � � �Rh � � � PtRh(NbP) �25
PtRh2ðPd2TiÞ �21PtRh3ðD022Þ �18
Ni Ni3Pt (unkn.) Ni3PtðD022Þ �76NiPtðL10Þ NiPtðL10Þ) �99
TABLE V. (Continued)
Compounds
Experiments [35,36] Calculations �H meV/at.
NiPt2ðCuZr2Þ �75NiPt3ðD023Þ �61
Pt Reference
Pd � � � Pd7PtðCuPt7Þ �14
Pd3PtðCdPt?3 Þ �25
PdPtðL11Þ �36
PdPt3ðL12Þ �26
PdPt7ðCuPt7Þ �15
Au � � � � � �Ag Ag7PtðCuPt7Þ �13
Ag3PtðL12Þ h34iAg3Pt2ðAg3Pty2 Þ �38
AgPt (unkn.) AgPtðL11Þ �39
AgPt3 (unkn.)
Cu Cu7PtðCuPt7Þ Cu7PtðCuPt7Þ �87
Cu3PtðL12Þ Cu3PtðL12Þ �143
CuPtðL11Þ CuPtðL11Þ �166
Cu3Pt5 (unkn.)
CuPt3 (unkn.) CuPt3ðCdPt?3 Þ �121
CuPt7ðCuPt7Þ CuPt7ðCuPt7Þ �77
Hg Hg4PtðHg4PtÞ Hg4PtðHg4PtÞ �104
Hg2PtðHg2PtÞ h25iHgPt3 (unkn.)
Cd Cd5PtðCd5Pt-partial occupancyÞ
Cd4PtðHg4PtÞ �228
Cd3Pt (unkn.) Cd3PtðD011Þ �260
Cd7Pt3 (unkn.)
Cd2Pt (unkn.) Cd2PtðHg2PtÞ �316
CdPtðL10Þ CdPtðL10Þ �322
CdPt3ðL12Þ CdPt3ðCdPt?3 Þ �190h11iCdPt7ðCuPt7Þ �114
Zn Pt7HgðCuPt7Þ �189
Pt3ZnðL12Þ Pt3ZnðCdPt?3 Þ �331h6iPtZnðL10Þ PtZnðL10Þ �570
Pt7Zn12ðPt7Zn12Þ Pt7Zn12ðPt7Zn12Þ �489
PtZn2 (unkn.) PtZn2ðC49Þ �463
PtZn3ðD022Þ �397
Pt2Zn11ðIr2Zn11Þ �272
PtZn8 (unkn.)
TABLE V. (Continued)
COMPREHENSIVE SEARCH FOR NEW PHASES AND . . . PHYS. REV. X 3, 041035 (2013)
041035-9
TABLE VI. Compounds in Palladium binary alloys. The termtet-fcc denotes a tetragonal distortion of stacked fcc superstruc-tures. All symbols are as in Table III.
Compounds
Experiments [35,36] Calculations �H meV/at.
Y Pd7YðCuPt7Þ Pd7YðCuPt7Þ �442
Pd3YðL12Þ Pd3YðL12Þ �863
Pd2Y (unkn.)
Pd3Y2 (unkn.)
Pd4Y3ðPd4Pu3Þ Pd4Y3ðPd4Pu3Þ �923
PdY (unkn.) PdY(B33) �913
Pd2Y3ðNi2Er3Þ h8iPdY2ðC37Þ �622
PdY3ðD011Þ PdY3ðD011Þ �475
Sc Pd8ScðPt8TiÞ �411Pd5ScðHfPd�5Þ �595
Pd3ScðL12Þ Pd3ScðL12Þ �855
Pd2Sc (unkn.) Pd2ScðC37Þ �898Pd4Sc3ðPd4Pu3Þ �910
PdSc(B2) PdSc(B2) �906
PdSc2ðNiTi2Þ PdSc2ðNiTi2Þ �660
PdSc4 (unkn.)
Zr Pd8ZrðPt8TiÞ �424
Pd5ZrðHfPd?5 Þ �591
Pd3ZrðD024Þ Pd3ZrðD024Þ �816
Pd2ZrðC11bÞ h1iPd4Zr3ðPd4Pu3Þ h2iPdZr (unkn.) PdZr(B33) �645
Pd3Zr5ðD88Þ h90iPdZr2ðNiTi2=CuZr2Þ PdZr2ðC11b=CuZr2Þ �487h83i
Hf Hf2PdðC11b=CuZr2Þ
Hf2PdðC11b=CuZr2Þ �527
HfPd (unkn.) HfPd(B33) �685
Hf2Pd3ðPd3Ti2Þ �778
Hf3Pd4 (unkn.)
Hf3Pd5ðPd5Ti3Þ �800
HfPd2ðC11bÞ h9iHfPd3ðD024=L12Þ HfPd3ðD024Þ �879h11i
HfPd5ðHfPd?5 Þ �635
HfPd8ðPt8TiÞ �430
Ti Pd5TiðHfPd?5 Þ �481
Pd3:2Ti0:8ðL12Þ h7iPd3TiðD024Þ Pd3TiðD024Þ �646
Pd2TiðPd2TiÞ Pd2TiðPd2TiÞ �632
Pd5Ti3ðPd5Ti3Þ Pd5Ti3ðPd5Ti3Þ �615
Pd3Ti2ðPd3Ti2Þ Pd3Ti2ðPd3Ti2Þ �602
PdTi(B19) h5iPdTi2ðCuZr2Þ PdTi2ðC11b=CuZr2Þ �451
Pd0:8Ti3:2ðA15Þ PdTi3ðA15Þ �342
Nb Nb3PdðNb3PdyÞ �167
Nb2PdðCuZr2Þ �220
Nb0:6Pd0:4ð�Þ
Compounds
Experiments [35,36] Calculations �H meV/at.
NbPd2ðMoPt2Þ NbPd2ðMoPt2Þ �432
NbPd3ðNbPd3=D022Þ NbPd3ðNbPd3Þ �435h2iNbPd5ðHfPd?5 Þ �356
NbPd8ðPt8TiÞ �279
Ta Pd8TaðPt8TiÞ �325
Pd5TaðHfPd?5 Þ �401
Pd3TaðD022Þ Pd3TaðD022Þ �480
Pd2TaðMoPt2Þ Pd2TaðMoPt2Þ �458
PdTa(B11) PdTa(B11) �362
Pd0:25Ta0:75ð�ÞPdTa8ðPt8TiÞ �98
V Pd8VðPt8TiÞ �177
Pd3VðD022Þ Pd3VðNbPd3Þ �253h6iPd2VðMoPt2Þ Pd2VðMoPt2Þ �274
PdV (unkn.)
PdV3ðA15Þ h9iPd5VðMo5Ti
?Þ �115
PdV8ðPt8TiÞ �94
Mo MoPd2ðMoPt2Þ MoPd2ðMoPt2Þ �99
MoPd4ðD1aÞ �92
MoPd8ðPt8TiÞ �86
W � � � Pd8WðPt8TiÞ �122
Cr Cr0:49Pd0:51ðInÞCr1:33Pd2:67ðL12Þ CrPd3ðL12Þ �81
CrPd5ðHfPd?5 Þ �76
Tc � � � PdTcðRhRu?Þ �63
PdTc3ðD019Þ �73
Re � � � PdRe3ðD019Þ �56
Mn MnPdðL10Þ h5iMn3Pd5ðGa3Pt5Þ Mn3Pd5ðGa3Pt5Þ �250
MnPd2ðC37Þ �252MnPd3ðD023Þ MnPd3ðL12Þ �234h10i
MnPd5ðHfPd?5 Þ �175MnPd8ðPt8TiÞ �125
Fe Fe0:96Pd1:04ðL10Þ h22iFePd2ðCuZr2Þ �116
FePd3ðL12Þ FePd3ðD023Þ �112h2iFePd5ðHfPd?5 Þ �100FePd8ðPt8TiÞ �81
Os � � � � � �Ru � � � � � �Co � � � CoPd3ðtet-fcc½001�AB3
c=a ¼ 2:8Þ�10
Ir � � � � � �Rh � � � � � �
TABLE VI. (Continued)
HART et al. PHYS. REV. X 3, 041035 (2013)
041035-10
systems similar to those in which they were identifiedexperimentally. For example, the prototype Pd3Ti2, re-ported only in the Pd-Ti system [36], also emerges as acalculated ground state in the closely related system Hf-Pd.In Hf-Pt, it appears as marginally stable, at 3 meV=atomabove the convex hull, in agreement with a very recentexperimental study that identified the previously incor-rectly characterized structure of a Hf2Pt3 phase [46].In the systems we examined, there are nearly 50
phases reported in the experimental phase diagrams forwhich the crystal structure of the phase is not known. Inhalf of these cases, the HT calculations identify stablestructures for these unknown phases. For the other halfof these unknown structures, our calculations find nostable compounds at the reported concentration, but findstable compounds at other concentrations. The reportedphases (sans structural information) may, therefore, bedue to phases that decompose at low temperatures or maymerely represent samples that were kinetically inhibitedand unable to settle into their stable phases during thetime frame of the experiments.The prototype database included in this study com-
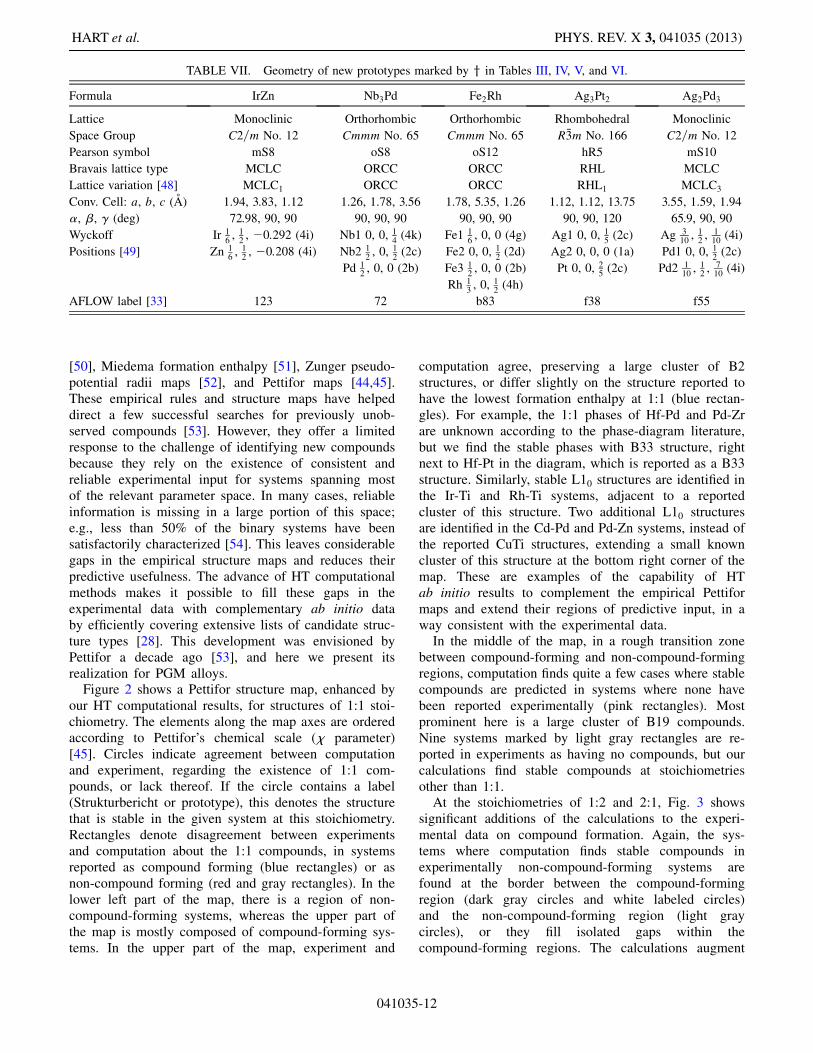
prises both experimentally reported structures and hypo-thetical structures constructed combinatorially fromderivative supercells of fcc, bcc, and hcp lattices [39,47].Occasionally, these derivative superstructures are predictedto be ground states by the first-principles calculations. Inthis work, we find compounds with five of these newstructures, for which no prototype is known and noStrukturbericht designation has been given. These newprototypes are marked by a y in Tables III, IV, V, and VI,and their crystallographic parameters are given inTable VII. We also find a few other compounds withunobserved prototypes (marked by a ? in Tables I, II, III,IV, V, and VI) previously uncovered in related HT studies[2,13,25,27,29,31].
IV. STRUCTURE MAPS
Empirical structure maps present available experimen-tal data in ways that highlight similarities in materialsbehavior in alloy systems. Their arrangement principlesusually depend on simple parameters, e.g., atomic num-ber, atomic radius, electronegativity, ionization energy,melting temperature, or enthalpy. Several well-knownclassification methods include Hume-Rothery rules
Compounds
Experiments [35,36] Calculations �H meV/at.
Ni � � � NiPd3ðtet-fcc½001�AB3
c=a ¼ 2:7Þ�6
Pt � � � Pd7PtðCuPt7Þ �14Pd3PtðCdPt?3 Þ �25PdPtðL11Þ �36PdPt3ðL12Þ �26PdPt7ðCuPt7Þ �15
Pd Reference
Au Au5PdðHfPd?5 Þ �55Au3Pd (unkn.) Au3PdðD023Þ �82
Au2PdðC49Þ �88AuPd (unkn.) AuPd(NbP) �94
AuPd3 (unkn.) AuPd3ðL12Þ �56
Ag � � � Ag7PdðCuPt7Þ �33
Ag5PdðHfPd?5 Þ �41
Ag3PdðD023Þ �58
Ag2PdðC37Þ �63
Ag2Pd3ðAg2Pdy3 Þ �63
AgPdðL11Þ �59
AgPd3ðCdPt?3 Þ �31
Cu Cu7PdðCuPt7Þ h18iCu5PdðHfPd?5 Þ �72
Cu3PdðL12=SrPb3Þ Cu3PdðD023Þ �107h2; 5iCu2PdðGa2HfÞ �117
CuPd (unkn.) CuPd(B2) �125
CuPd3ðL12Þ �71
CuPd7ðCuPt7Þ CuPd7ðCuPt7Þ �37
Hg Hg4Pd (unkn.) Hg4PdðHg4PtÞ �101
Hg5Pd2ðHg5Mn2Þ h65iHg2PdðHg2PtÞ �150
HgPdðL10Þ HgPdðL10Þ �174
Hg3Pd5ðGa3Pt5Þ �166
HgPd2ðC37Þ �160
HgPd3 (unkn.) HgPd3ðD022Þ �139
HgPd4ðD1aÞ �112
Cd Cd11Pd2ðIr2Zn11Þ Cd11Pd2ðIr2Zn11Þ �171
Cd4Pd (unkn.)
Cd3Pd (unkn.)
Cd2PdðHg2PtÞ �307
CdPd(CuTi) CdPdðL10Þ �418h164iCdPd2ðC37Þ �334
CdPd3ðD022Þ �272CdPd 4ðD1aÞ �225
CdPd5ðHfPd?5 Þ �188
CdPd7ðCuPt7Þ �142
Zn Pd8ZnðPt8TiÞ �165
Pd2ZnðC37Þ Pd2ZnðC37Þ �462
TABLE VI. (Continued)
Compounds
Experiments [35,36] Calculations �H meV/at.
PdZn(CuTi) PdZnðL10Þ �570h187iPd3Zn5 (unkn.)
PdZn3ðD022Þ �359
Pd2Zn11ðIr2Zn11Þ Pd2Zn11ðIr2Zn11Þ �243
TABLE VI. (Continued)
COMPREHENSIVE SEARCH FOR NEW PHASES AND . . . PHYS. REV. X 3, 041035 (2013)
041035-11
[50], Miedema formation enthalpy [51], Zunger pseudo-potential radii maps [52], and Pettifor maps [44,45].These empirical rules and structure maps have helpeddirect a few successful searches for previously unob-served compounds [53]. However, they offer a limitedresponse to the challenge of identifying new compoundsbecause they rely on the existence of consistent andreliable experimental input for systems spanning mostof the relevant parameter space. In many cases, reliableinformation is missing in a large portion of this space;e.g., less than 50% of the binary systems have beensatisfactorily characterized [54]. This leaves considerablegaps in the empirical structure maps and reduces theirpredictive usefulness. The advance of HT computationalmethods makes it possible to fill these gaps in theexperimental data with complementary ab initio databy efficiently covering extensive lists of candidate struc-ture types [28]. This development was envisioned byPettifor a decade ago [53], and here we present itsrealization for PGM alloys.
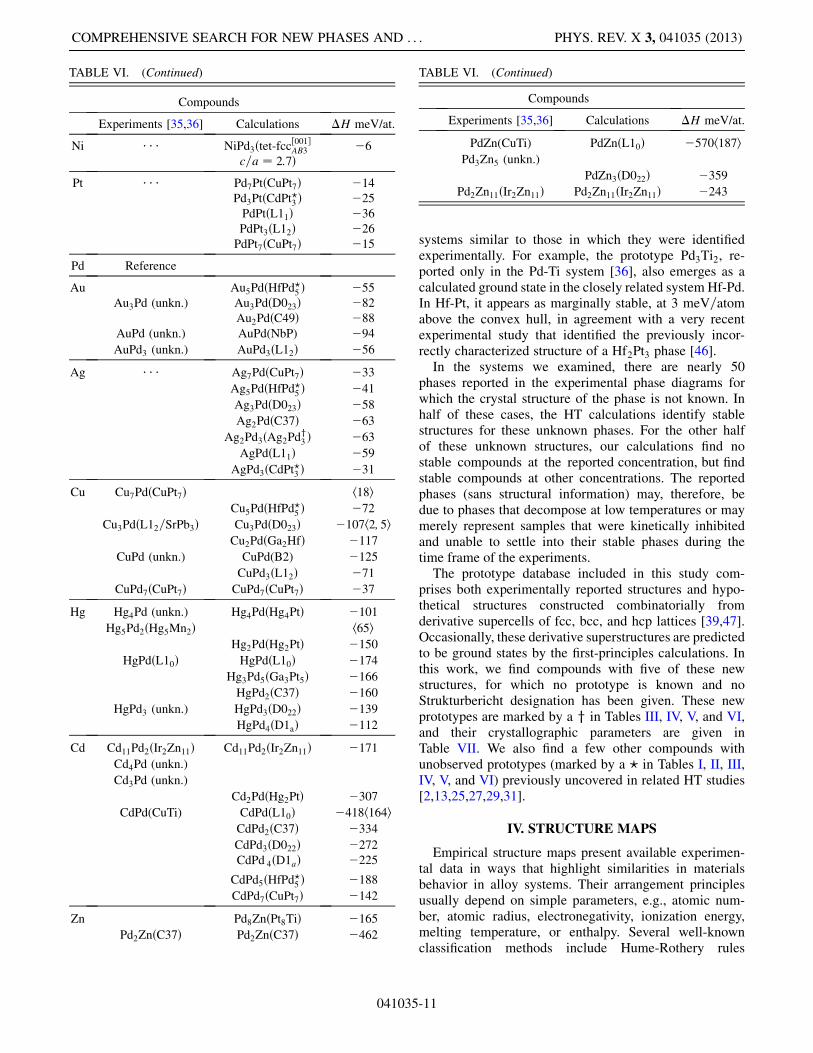
Figure 2 shows a Pettifor structure map, enhanced byour HT computational results, for structures of 1:1 stoi-chiometry. The elements along the map axes are orderedaccording to Pettifor’s chemical scale (� parameter)[45]. Circles indicate agreement between computationand experiment, regarding the existence of 1:1 com-pounds, or lack thereof. If the circle contains a label(Strukturbericht or prototype), this denotes the structurethat is stable in the given system at this stoichiometry.Rectangles denote disagreement between experimentsand computation about the 1:1 compounds, in systemsreported as compound forming (blue rectangles) or asnon-compound forming (red and gray rectangles). In thelower left part of the map, there is a region of non-compound-forming systems, whereas the upper part ofthe map is mostly composed of compound-forming sys-tems. In the upper part of the map, experiment and
computation agree, preserving a large cluster of B2structures, or differ slightly on the structure reported tohave the lowest formation enthalpy at 1:1 (blue rectan-gles). For example, the 1:1 phases of Hf-Pd and Pd-Zrare unknown according to the phase-diagram literature,but we find the stable phases with B33 structure, rightnext to Hf-Pt in the diagram, which is reported as a B33structure. Similarly, stable L10 structures are identified inthe Ir-Ti and Rh-Ti systems, adjacent to a reportedcluster of this structure. Two additional L10 structuresare identified in the Cd-Pd and Pd-Zn systems, instead ofthe reported CuTi structures, extending a small knowncluster of this structure at the bottom right corner of themap. These are examples of the capability of HTab initio results to complement the empirical Pettiformaps and extend their regions of predictive input, in away consistent with the experimental data.In the middle of the map, in a rough transition zone
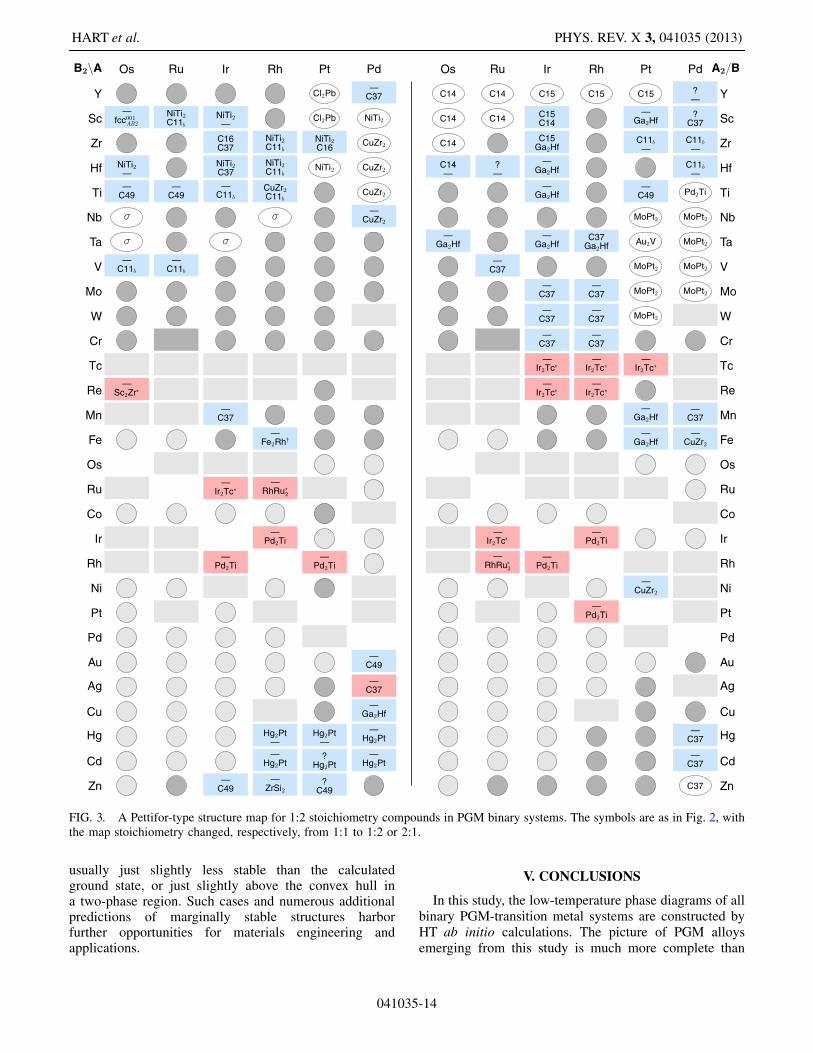
between compound-forming and non-compound-formingregions, computation finds quite a few cases where stablecompounds are predicted in systems where none havebeen reported experimentally (pink rectangles). Mostprominent here is a large cluster of B19 compounds.Nine systems marked by light gray rectangles are re-ported in experiments as having no compounds, but ourcalculations find stable compounds at stoichiometriesother than 1:1.At the stoichiometries of 1:2 and 2:1, Fig. 3 shows
significant additions of the calculations to the experi-mental data on compound formation. Again, the sys-tems where computation finds stable compounds inexperimentally non-compound-forming systems arefound at the border between the compound-formingregion (dark gray circles and white labeled circles)and the non-compound-forming region (light graycircles), or they fill isolated gaps within thecompound-forming regions. The calculations augment
TABLE VII. Geometry of new prototypes marked by y in Tables III, IV, V, and VI.
Formula IrZn Nb3Pd Fe2Rh Ag3Pt2 Ag2Pd3
Lattice Monoclinic Orthorhombic Orthorhombic Rhombohedral Monoclinic
Space Group C2=m No. 12 Cmmm No. 65 Cmmm No. 65 R�3m No. 166 C2=m No. 12
Pearson symbol mS8 oS8 oS12 hR5 mS10
Bravais lattice type MCLC ORCC ORCC RHL MCLC
Lattice variation [48] MCLC1 ORCC ORCC RHL1 MCLC3
Conv. Cell: a, b, c (A) 1.94, 3.83, 1.12 1.26, 1.78, 3.56 1.78, 5.35, 1.26 1.12, 1.12, 13.75 3.55, 1.59, 1.94
�, �, � (deg) 72.98, 90, 90 90, 90, 90 90, 90, 90 90, 90, 120 65.9, 90, 90
Wyckoff Ir 16 ,
12 , �0:292 (4i) Nb1 0, 0, 1
4 (4k) Fe1 16 , 0, 0 (4g) Ag1 0, 0, 1
5 (2c) Ag 310 ,
12 ,
110 (4i)
Positions [49] Zn 16 ,
12 , �0:208 (4i) Nb2 1
2 , 0,12 (2c) Fe2 0, 0, 1
2 (2d) Ag2 0, 0, 0 (1a) Pd1 0, 0, 12 (2c)
Pd 12 , 0, 0 (2b) Fe3 1
2 , 0, 0 (2b) Pt 0, 0, 25 (2c) Pd2 1
10 ,12 ,
710 (4i)
Rh 13 , 0,
12 (4h)
AFLOW label [33] 123 72 b83 f38 f55
HART et al. PHYS. REV. X 3, 041035 (2013)
041035-12
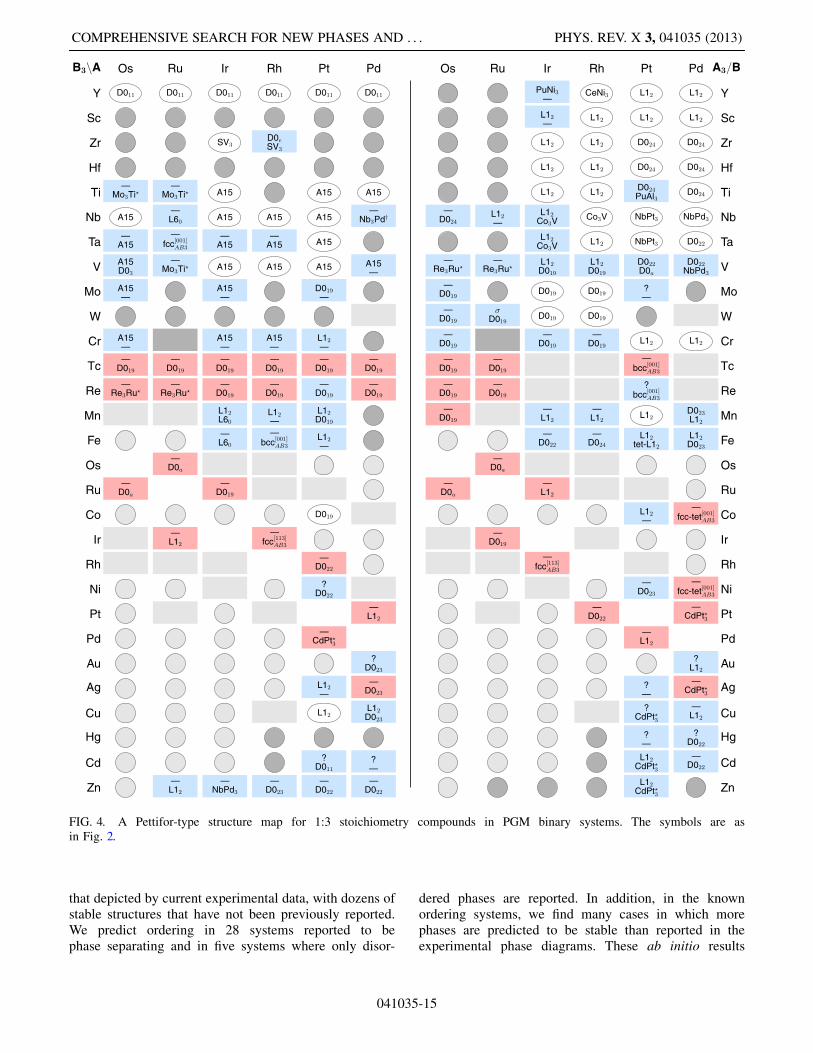
islands of structurally similar regions, yielding a moreconsistent structure map. For example, calculation findsthe CuZr2 structure for Nb-Pd, extending the island ofthis structure already present in the experimental results(left panel, upper right). The calculations significantlyextend the Hg2Pt island in the lower right of the B2Apanel, from a single experimental entry to six systems(in Hg-Pt itself, the calculation finds this structureslightly unstable at T ¼ 0K, 25 meV=atom above thestability tieline). A cluster of � phases in the left panelshows that this reported disordered phase has underlyingordered realizations at low temperatures. Three completelynew islands, for the C37, Ga2Hf, and IrTc2 structures,appear near the upper center of the A2B panel. Anothernew cluster, of the Pd2Ti structure, appears at the lowercenter of both panels. In general, the clusters of blue rec-tangles show that the calculations augment the experimen-tal results in a consistent manner.The structure map for 1:3 phases is shown in Fig. 4.
Similarly to the 1:1 and 1:2 maps, the calculation ex-tends structural islands of the experimental data, mostnew phases in non-compound-forming systems occur insystems at the boundary between compound-forming andnon-compound-forming regions, and there is significantagreement between the experimentally reported phases(or lack thereof) and calculated phases. In the upper partof the right panel, the L12 and D024 clusters are pre-served with slight modifications at their boundaries (atPt-Ti, the PuAl3 structure is only 3 meV=atom lowerthan the experimental structure D024, a difference toosmall to be significant). The D019 cluster is significantlyexpanded. In the left panel, the calculations introduce anew D019 island near the center of the diagram. Newsmall regions of the D022 structures emerge at the rightbottom of both panels. Adjacent D023 and CdPt?3 islands
appear in the left and right panels, respectively. Theexperimental D0e structure for RhZr3 may actually beSV3 since in the calculation the D0e structure relaxedinto the SV3 structure, creating a small SV3 island at thetop of the left panel.The structure maps of Figs. 2–4 give a bird’s eye view
of the exhaustive HT search for new structures.Consistent with the empirical maps, they show signifi-cant separation of different structures into regions wherethe constituent elements have a similar Pettifor � num-ber. The HT data significantly enhance the empiricalmaps, extend the regions of some structures, fill inapparent gaps, and indicate previously unsuspected struc-ture clusters. Moreover, the HT data contain more detailthan is apparent in the structure maps. Even when cal-culation and experiment agree that a system is compoundforming [green (dark gray) circles in Fig. 1], the calcu-lations often find additional stable compounds, beyondthose known in experiment. When the reported structuresare found to be unstable in the calculation, they are
Os Ru Ir Rh Pt Pd
Y
Sc
Zr
Hf
Ti
Nb
Ta
V
Mo
W
Cr
Tc
Re
Mn
Fe
Os
Ru
Co
Ir
Rh
Ni
Pt
Pd
Au
Ag
Cu
Hg
Cd
Zn
B2
B2
B2
—B19
—B19
—B19
—B19
—RhRu
B2
B2
B2
B2
?—
?—
B11—
—B19
—B19
—B19
—B19
—RhRu
—CdTi
B2
B2
NiTi
?B27
?L1
L1
L1
L1
B19
B19
—B19
—B19
—B19
L1B19—
NbP
—B19
—fcc
—NbP
—IrZn
B2
B2
NiTiB33
B2B27
?L1
L1
IrTa—
L1
B19
—B19
—B19
B2
B2——
RhRu
—RhRu
—fcc
—NbP
—B2
B27B33
B2
TlIB33
B33
B19NiTi
B19L1—L1
B19L1
B19
?—L1B19
L1—
L1
—CdTi
L1—
—NbP
L1
—L1
?L1
L1
L1
L1
?B33
B2
?B33
?B33
B19—
B11
?—
—RhRu
L1—
L1—
—L1
?NbP—L1
?B2
L1
CuTiL1
CuTiL1
FIG. 2. A Pettifor-type structure map for 1:1 stoichiometrycompounds in PGM binary systems. Circles indicate agreementbetween experiment and computation: White circles withStrukturbericht or prototype labels denote 1:1 compounds, darkcircles indicate a compound-forming system with no compoundsat 1:1, and light circles denote non-compound-forming systems.Blue rectangles denote compound-forming systems where thereported and computed stable structures differ at 1:1 stoichiome-try. The top label in the rectangle is the reported structure; thebottom label is the structure we find to be stable in this work. Adash ‘‘—’’ indicates the absence of a stable structure. Unidentifiedsuspected structures are denoted by a question mark. Pink rec-tangles indicate systems reported as non-compound forming, witha dash at the top of the rectangle, but we find a stable 1:1 phase,identified at the bottom of the rectangle. Light gray rectanglesindicate systems reported as non-compound forming where astructure is predicted at a stoichiometry different from 1:1. Adark gray rectangle indicates a system reported with a disorderedcompound where no stable structures are found in the calculation.
COMPREHENSIVE SEARCH FOR NEW PHASES AND . . . PHYS. REV. X 3, 041035 (2013)
041035-13
usually just slightly less stable than the calculatedground state, or just slightly above the convex hull ina two-phase region. Such cases and numerous additionalpredictions of marginally stable structures harborfurther opportunities for materials engineering andapplications.
V. CONCLUSIONS
In this study, the low-temperature phase diagrams of allbinary PGM-transition metal systems are constructed byHT ab initio calculations. The picture of PGM alloysemerging from this study is much more complete than
FIG. 3. A Pettifor-type structure map for 1:2 stoichiometry compounds in PGM binary systems. The symbols are as in Fig. 2, withthe map stoichiometry changed, respectively, from 1:1 to 1:2 or 2:1.
HART et al. PHYS. REV. X 3, 041035 (2013)
041035-14
that depicted by current experimental data, with dozens ofstable structures that have not been previously reported.We predict ordering in 28 systems reported to bephase separating and in five systems where only disor-
dered phases are reported. In addition, in the knownordering systems, we find many cases in which morephases are predicted to be stable than reported in theexperimental phase diagrams. These ab initio results
FIG. 4. A Pettifor-type structure map for 1:3 stoichiometry compounds in PGM binary systems. The symbols are asin Fig. 2.
COMPREHENSIVE SEARCH FOR NEW PHASES AND . . . PHYS. REV. X 3, 041035 (2013)
041035-15

complement the ordering tendencies implied by theempirical Pettifor maps. Augmenting the experimentaldata compiled in the phase-diagram databases [35,36]with high-throughput first-principles data [33,34], weconstruct Pettifor-type structure maps that point to newopportunities for alloys research. These maps demon-strate that the integration of the empirical and computa-tional data produces enhanced maps that should provide amore comprehensive foundation for rational materialsdesign. The theoretical predictions presented here willhopefully serve as a motivation for their experimentalvalidation and be a guide for future studies of theseimportant systems.
The maps in Figs. 2–4 include a large number of light
blue rectangles, pointing to experiment-theory mis-
matches on structures at simple compositions in binary
systems known to be compound forming. This may raise
reservations that the level of theory employed, DFT-
PBE, may not be as good as commonly accepted for
transition metal alloys. A more careful look, however,
shows that many of these mismatches, e.g., HfIr, PdZr,
Cd2Pt, CuPt3, and Au3Pd, involve cases where a com-
pound of unknown structure has been reported by ex-
periments. The calculation thus reveals the stable
structure and closes the gap in the experimental data.
In most other cases, e.g., RhZr, PtV, Ir3V, Rh2Ta, andCu3Pt, the energy difference between the reported struc-
ture and the calculated structure or two-phase tieline is
rather small and is congruent with the adjacent structure
clusters in the maps. Similar improved consistency with
reported structure clusters also appears in cases where
the discrepancies are considerable, e.g., CdPd and PdZn.
In addition, as discussed in Sec. III, the calculations
reproduce many complex large unit-cell structures that
are reported in the experimental literature. Moreover, it
is important to remember that experiments are per-
formed at room temperature or higher, while our calcu-
lations are carried out at zero temperature. Many phase
discrepancies may therefore be due to vibrational pro-
motion [55] or the tendency of structures to gain sym-
metries by losing their internal Peierls instabilities or
Jahn-Teller distortions. Therefore, the disagreements
emerging in our calculations may not be a sign of
deficiencies in the theoretical treatment but a demon-
stration of its usefulness is bridging gaps in the experi-
mental data and extending it towards unknown phase
transitions at lower temperatures. The ultimate test of
this issue rests with experimental validation of at least
some of our predictions, which would hopefully be
motivated by this work.To help accelerate this process of experimental valida-
tion, discovery, and development of materials [56], we willoffer a public domain ‘‘Application ProgrammingInterface’’ (REST-API [57]) that will allow the scientific
community to download information from the AFLOWLIBrepository [37]. It would ultimately enable researchers togenerate alloy information remotely on their own com-puters. Extension of the database to nanoalloys and nano-sintered systems is planned within the size-pressureapproximation (i.e., Fig. 2 of Ref. [58]), to study trendsof solubility and size-dependent disorder-order transitionsand segregation in nanocatalysts [21,58–60] and nanocrys-tals [61,62].A few of our predictions correspond to phases where
the driving force for ordering is small (i.e., the forma-tion enthalpy is small, and it may be difficult to reachthermal equilibrium); however, it should be noted thatsome experimentally reported phases have similarlysmall formation enthalpies. Some of these predictedphases could be more easily realized as nanostructuredphases, where the thermodynamics for their formationmay be more favorable. Our results should serve as thefoundation for finite-temperature simulations to identifyphases that are kinetically accessible. Rapid thermody-namical modeling and descriptor-based screening ofsystems predicted to harbor new phases should beused to pinpoint those phases with the greatest potentialfor applications [28]. Such simulations would be aninvaluable extension to this work; however, the neces-sary tools to accomplish them on a similarly large scaleare not yet mature.
ACKNOWLEDGMENTS
S. C. acknowledges support from DOD-ONR (GrantsNo. N00014-13-1-0635, No. N00014-11-1 0136, andNo. N00014-09-1-0921). G. L.W.H. is grateful for sup-port from the National Science Foundation, GrantNo.DMR-0908753. O. L. thanks the Center forMaterials Genomics of Duke University for its hospital-ity. We thank Fulton Supercomputing Laboratory and theCray Corporation for computational support. The authorsthank Dr. M. Buongiorno Nardelli, Dr. M. Asta, Dr. C.Toher, Dr. K. Rasch, and Dr. C. E. Calderon for usefulcomments.Note added in proof.—While this paper was being pre-
pared for publication, a new experimental study identifiedthe new compound Hf3Pt4, of prototype Pd4Pu3 [63]. Ourcalculations show that this structure is metastable in theHfPt system, at 19 meV/atom above the convex hull, aswell as in the HfPd and PdZr systems. The same structureis predicted as a ground state in the RhZr, PtSc, PdSc, PtY,and PdY systems.
APPENDIX
This appendix includes Figs. 5–19, which present thelow-temperature phase diagrams (convex hulls) of allthe compound-forming PGM-transition metal binarysystems.
HART et al. PHYS. REV. X 3, 041035 (2013)
041035-16
0 20 40 60 80 100
−70
−60
−50
−40
−30
−20
−10
0
10fcc
CuPt7
HfPd5*
D023
C37 Ag2Pd
3+
L11
CdPt3*
fcc
Ag PdAtomic Percent Palladium
meV
/ato
m
0 20 40 60 80 100
−40
−30
−20
−10
0
10
fcc
CuPt7
Ag3Pt
2+
L11
fcc
Ag PtAtomic Percent Platinum
meV
/ato
m
0 20 40 60 80 100
−100
−80
−60
−40
−20
0fcc
HfPd5*
D023
C49
NbP
L12
fcc
Au PdAtomic Percent Palladium
meV
/ato
m
0 20 40 60 80 100
−0.4
−0.3
−0.2
−0.1
0hcp
Ir2Zn
11
Hg2Pt
L10
C37
D022
D1a
HfPd5
*
CuPt7
fcc
Cd PdAtomic Percent Palladium
eV/a
tom
0 20 40 60 80 100
−0.35
−0.3
−0.25
−0.2
−0.15
−0.1
−0.05
0hcp
Hg4Pt
D011
Hg2Pt L1
0
CdPt3*
CuPt7
fcc
Cd PtAtomic Percent Platinum
eV/a
tom
0 20 40 60 80 100
−0.15
−0.1
−0.05
0hcp
Hg4Pt
Hg2Pt
fcc
Cd RhAtomic Percent Rhodium
eV/a
tom
0 20 40 60 80 100
−10
−5
0
5
10
hcp
tet −fccAB3[001] c/a=2.8
fcc
Co PdAtomic Percent Palladium
meV
/ato
m
0 20 40 60 80 100
−0.12
−0.1
−0.08
−0.06
−0.04
−0.02
0
0.02hcp
D019
CuZr2
HfPd5*
fcc
Co PtAtomic Percent Platinum
eV/a
tom
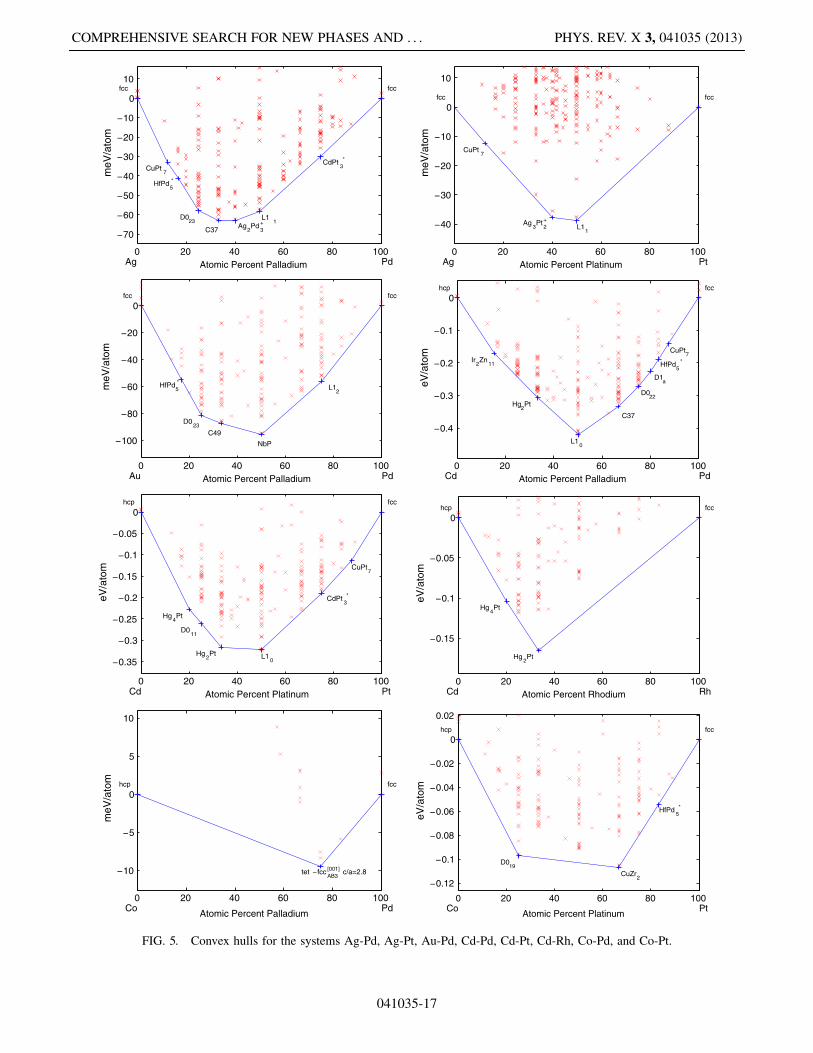
FIG. 5. Convex hulls for the systems Ag-Pd, Ag-Pt, Au-Pd, Cd-Pd, Cd-Pt, Cd-Rh, Co-Pd, and Co-Pt.
COMPREHENSIVE SEARCH FOR NEW PHASES AND . . . PHYS. REV. X 3, 041035 (2013)
041035-17

0 20 40 60 80 100
−0.25
−0.2
−0.15
−0.1
−0.05
0bcc
B19 C37 D0
19
fcc
Cr IrAtomic Percent Iridium
eV/a
tom
0 20 40 60 80 100
−25
−20
−15
−10
−5
0
5
10
bcc
D019
Hf5Sc *
hcp
Cr OsAtomic Percent Osmium
meV
/ato
m
0 20 40 60 80 100
−80
−60
−40
−20
0bcc
L12
HfPd5
*
fcc
Cr PdAtomic Percent Palladium
meV
/ato
m
0 20 40 60 80 100−0.3
−0.25
−0.2
−0.15
−0.1
−0.05
0bcc
B19
L12
Pt8Ti
fcc
Cr PtAtomic Percent Platinum
eV/a
tom
0 20 40 60 80 100
−0.14
−0.12
−0.1
−0.08
−0.06
−0.04
−0.02
0
0.02bcc
C37 L1
2
CuPt7
fcc
Cr RhAtomic Percent Rhodium
eV/a
tom
0 20 40 60 80 100
−0.14
−0.12
−0.1
−0.08
−0.06
−0.04
−0.02
0
0.02fcc
HfPd5*
D023
Ga2Hf
B2
L12
CuPt7
fcc
Cu PdAtomic Percent Palladium
eV/a
tom
0 20 40 60 80 100
−0.15
−0.1
−0.05
0fcc
CuPt7
L12
L11
CdPt3
*
CuPt7
fcc
Cu PtAtomic Percent Platinum
eV/a
tom
0 20 40 60 80 100−5
0
5
10
fcc
CuPt7
fcc
Cu RhAtomic Percent Rhodium
meV
/ato
m
FIG. 6. Convex hulls for the systems Cr-Ir, Cr-Os, Cr-Pd, Cr-Pt, Cr-Rh, Cu-Pd, Cu-Pt, and Cu-Rh.
HART et al. PHYS. REV. X 3, 041035 (2013)
041035-18

0 20 40 60 80 100
−70
−60
−50
−40
−30
−20
−10
0
10bcc
L60
NbP D0
22
fcc
Fe IrAtomic Percent Iridium
meV
/ato
m
0 20 40 60 80 100
−0.12
−0.1
−0.08
−0.06
−0.04
−0.02
0
0.02bcc
CuZr2
D023
HfPd5
*
Pt8Ti
fcc
Fe PdAtomic Percent Palladium
eV/a
tom
0 20 40 60 80 100
−0.25
−0.2
−0.15
−0.1
−0.05
0bcc
L10
Ga2Hf
tet−L12 c/a=.992
HfPd5*
fcc
Fe PtAtomic Percent Platinum
eV/a
tom
0 20 40 60 80 100
−60
−50
−40
−30
−20
−10
0
10bcc
bccAB3[001]
Fe2Rh * D0
24
fcc
Fe RhAtomic Percent Rhodium
meV
/ato
m
0 20 40 60 80 100
−1
−0.8
−0.6
−0.4
−0.2
0hcp
C37 Ir
5Zr
3
B27
Ga2Hf
L12
fcc
Hf IrAtomic Percent Iridium
eV/a
tom
0 20 40 60 80 100−0.8
−0.7
−0.6
−0.5
−0.4
−0.3
−0.2
−0.1
0hcp
B2
hcp
Hf OsAtomic Percent Osmium
eV/a
tom
0 20 40 60 80 100−1
−0.8
−0.6
−0.4
−0.2
0hcp
C11b/CuZr
2
B33
Pd3Ti
2 Pd
5Ti
3
D024
HfPd5*
Pt8Ti
fcc
Hf PdAtomic Percent Palladium
eV/a
tom
0 20 40 60 80 100
−1.2
−1
−0.8
−0.6
−0.4
−0.2
0hcp
NiTi2
B33/TlI D0
24
Pt8Ti
fcc
Hf PtAtomic Percent Platinum
eV/a
tom
FIG. 7. Convex hulls for the systems Fe-Ir, Fe-Pd, Fe-Pt, Fe-Rh, Hf-Ir, Hf-Os, Hf-Pd, and Hf-Pt.
COMPREHENSIVE SEARCH FOR NEW PHASES AND . . . PHYS. REV. X 3, 041035 (2013)
041035-19
0 20 40 60 80 100
−1
−0.8
−0.6
−0.4
−0.2
0hcp
CuZr2
B27 Ge3Rh
5
L12
fcc
Hf RhAtomic Percent Rhodium
eV/a
tom
0 20 40 60 80 100
−0.9
−0.8
−0.7
−0.6
−0.5
−0.4
−0.3
−0.2
−0.1
0hcp
B2
hcp
Hf RuAtomic Percent Ruthenium
eV/a
tom
0 20 40 60 80 100−0.2
−0.15
−0.1
−0.05
0rhl
Hg4Pt
Hg2Pt
L10
Ga3Pt
5 C37
D022
D1a
fcc
Hg PdAtomic Percent Palladium
eV/a
tom
0 20 40 60 80 100−0.12
−0.1
−0.08
−0.06
−0.04
−0.02
0
0.02
rhl
Hg4Pt
fcc
Hg PtAtomic Percent Platinum
eV/a
tom
0 20 40 60 80 100
−40
−30
−20
−10
0
10
rhl
Hg4Pt
fcc
Hg RhAtomic Percent Rhodium
meV
/ato
m
0 20 40 60 80 100
−0.2
−0.15
−0.1
−0.05
0fcc
L12
B19
C37
L60
hcp
Ir MnAtomic Percent Manganese
eV/a
tom
0 20 40 60 80 100
−0.35
−0.3
−0.25
−0.2
−0.15
−0.1
−0.05
0fcc
D019 C37
B19
bcc
Ir MoAtomic Percent Molybdenum
eV/a
tom
0 20 40 60 80 100
−0.7
−0.6
−0.5
−0.4
−0.3
−0.2
−0.1
0fcc
Co3V
L10
σABBAB
A15
bcc
Ir NbAtomic Percent Niobium
eV/a
tom
FIG. 8. Convex hulls for the systems Hf-Rh, Hf-Ru, Hg-Pd, Hg-Pt, Hg-Rh, Ir-Mn, Ir-Mo, and Ir-Nb.
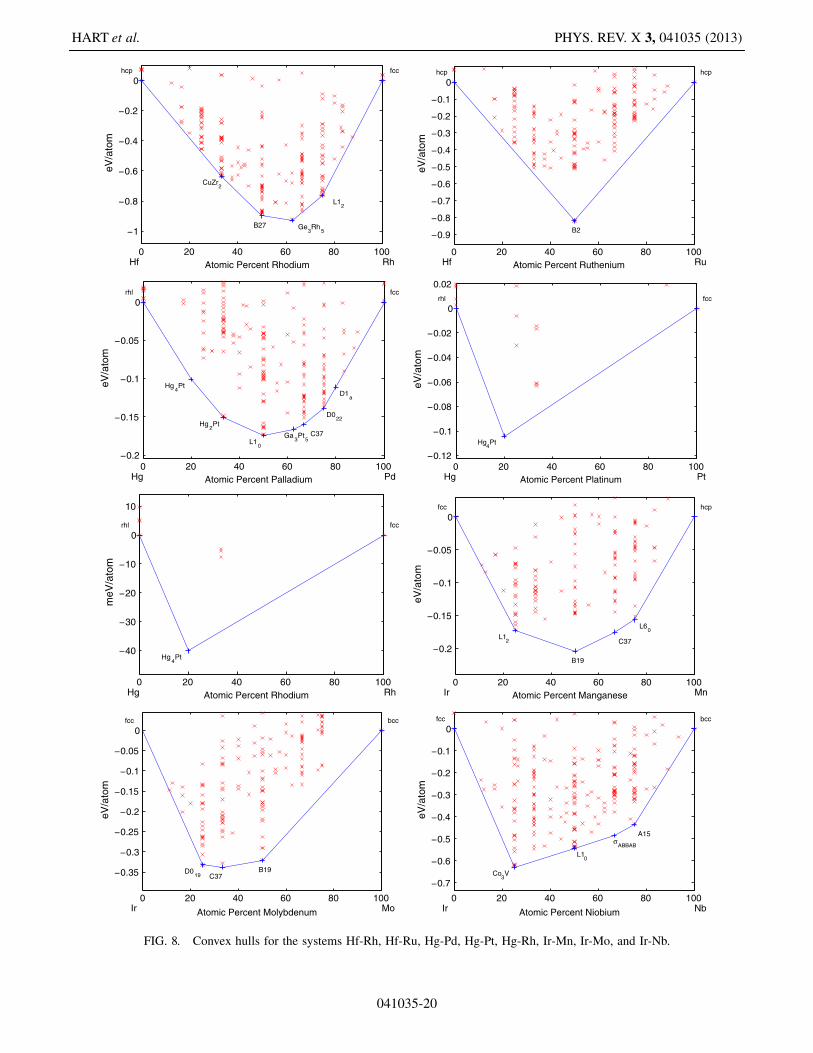
HART et al. PHYS. REV. X 3, 041035 (2013)
041035-20
0 20 40 60 80 100
−40
−30
−20
−10
0
10
fcc
NbP
fcc
Ir NiAtomic Percent Nickel
meV
/ato
m
0 20 40 60 80 100
−10
−5
0
5
10
fcc
Pt8Ti
Hf5Sc *
hcp
Ir OsAtomic Percent Osmium
meV
/ato
m
0 20 40 60 80 100
−0.3
−0.25
−0.2
−0.15
−0.1
−0.05
0fcc
Pt8Ti
Ir2Tc *
B19
D019
hcp
Ir ReAtomic Percent Rhenium
eV/a
tom
0 20 40 60 80 100−25
−20
−15
−10
−5
0
5
10
fcc
fccAB3[113]
Pd2Ti
fccA2B2[113]
Pd2Ti
fcc
Ir RhAtomic Percent Rhodium
meV
/ato
m
0 20 40 60 80 100
−60
−50
−40
−30
−20
−10
0
10fcc
Pt8Ti
L12
B19Ir
2Tc * D0
19
Hf5Sc *
hcp
Ir RuAtomic Percent Ruthenium
meV
/ato
m
0 20 40 60 80 100−1.2
−1
−0.8
−0.6
−0.4
−0.2
0fcc
CuPt7
C14
B2
Ir4Sc
11
Mg44
Rh7
hcp
Ir ScAtomic Percent Scandium
eV/a
tom
0 20 40 60 80 100−0.8
−0.7
−0.6
−0.5
−0.4
−0.3
−0.2
−0.1
0fcc
Co3V
Ga2Hf
L10
σABBAB
A15
bcc
Ir TaAtomic Percent Tantalum
eV/a
tom
0 20 40 60 80 100
−0.3
−0.25
−0.2
−0.15
−0.1
−0.05
0fcc
Pt8Ti
Ir2Tc *
B19
D019
hcp
Ir TcAtomic Percent Technetium
eV/a
tom
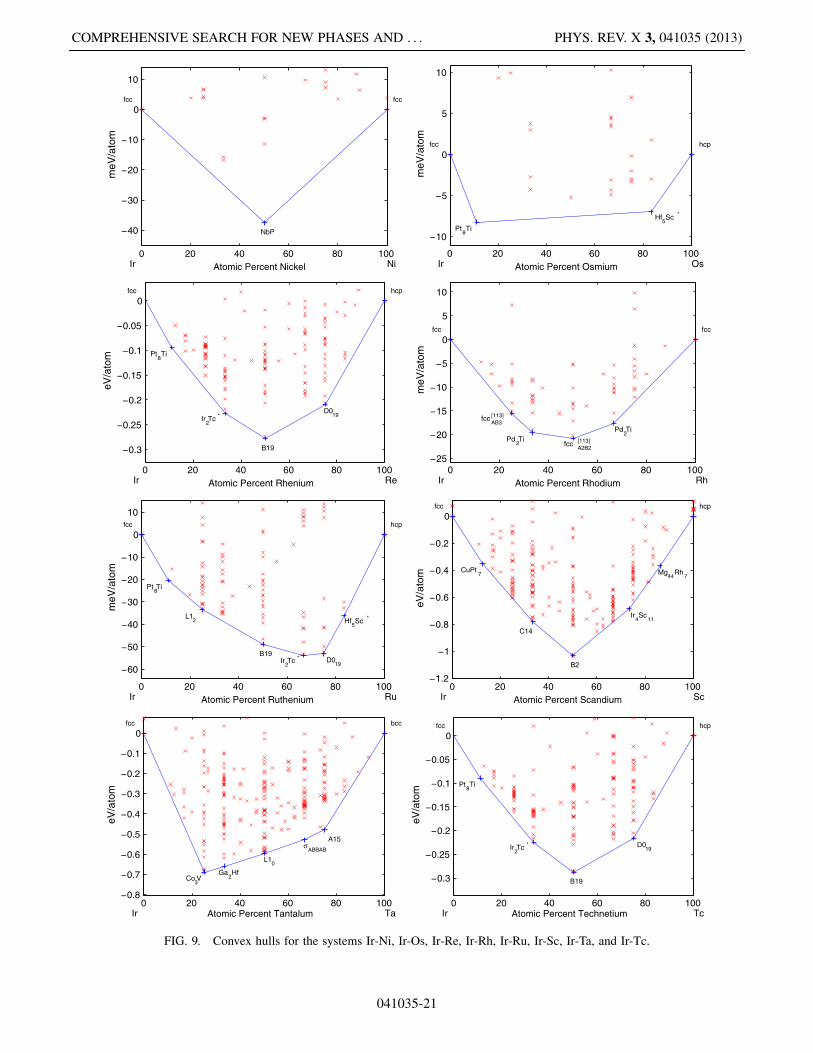
FIG. 9. Convex hulls for the systems Ir-Ni, Ir-Os, Ir-Re, Ir-Rh, Ir-Ru, Ir-Sc, Ir-Ta, and Ir-Tc.
COMPREHENSIVE SEARCH FOR NEW PHASES AND . . . PHYS. REV. X 3, 041035 (2013)
041035-21
0 20 40 60 80 100
−0.9
−0.8
−0.7
−0.6
−0.5
−0.4
−0.3
−0.2
−0.1
0fcc
CuPt7
L12
Ga2Hf Ga
3Pt
5 L10
C11b
A15
hcp
Ir TiAtomic Percent Titanium
eV/a
tom
0 20 40 60 80 100−0.6
−0.5
−0.4
−0.3
−0.2
−0.1
0fcc
D019 L1
0A15
Pt8Ti
bcc
Ir VAtomic Percent Vanadium
eV/a
tom
0 20 40 60 80 100−0.4
−0.35
−0.3
−0.25
−0.2
−0.15
−0.1
−0.05
0fcc
Pt8Ti
D019 C37
B19
bcc
Ir WAtomic Percent Tungsten
eV/a
tom
0 20 40 60 80 100
−0.9
−0.8
−0.7
−0.6
−0.5
−0.4
−0.3
−0.2
−0.1
0fcc
C15 B2 Pu
5Rh
3
C2Mn
5
D011
hcp
Ir YAtomic Percent Yttrium
eV/a
tom
0 20 40 60 80 100
−0.25
−0.2
−0.15
−0.1
−0.05
0fcc
IrZn +
C49
NbPd3
Ir2Zn
11
hcp
Ir ZnAtomic Percent Zinc
eV/a
tom
0 20 40 60 80 100
−0.9
−0.8
−0.7
−0.6
−0.5
−0.4
−0.3
−0.2
−0.1
0fcc
L12
Ga2Hf
NiTi
Ir3Zr
5
C37
SV3
hcp
Ir ZrAtomic Percent Zirconium
eV/a
tom
0 20 40 60 80 100−50
−40
−30
−20
−10
0
10
A12
B19
D019
hcp
Mn OsAtomic Percent Osmium
meV
/ato
m
0 20 40 60 80 100
−0.25
−0.2
−0.15
−0.1
−0.05
0A12
Ga3Pt
5 C37
L12
HfPd5
*
Pt8Ti
fcc
Mn PdAtomic Percent Palladium
eV/a
tom
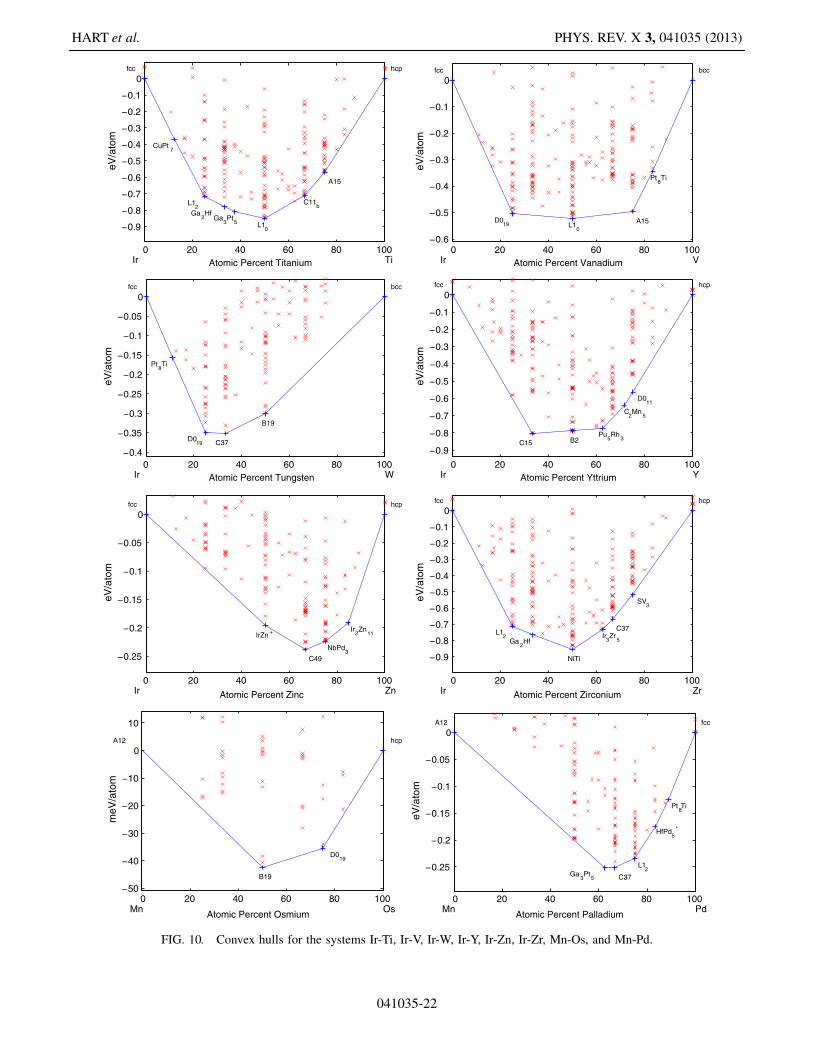
FIG. 10. Convex hulls for the systems Ir-Ti, Ir-V, Ir-W, Ir-Y, Ir-Zn, Ir-Zr, Mn-Os, and Mn-Pd.
HART et al. PHYS. REV. X 3, 041035 (2013)
041035-22

0 20 40 60 80 100
−0.4
−0.35
−0.3
−0.25
−0.2
−0.15
−0.1
−0.05
0A12
D019
Ga3Pt
5 Ga
2Hf L1
2
Pt8Ti
fcc
Mn PtAtomic Percent Platinum
eV/a
tom
0 20 40 60 80 100
−0.2
−0.15
−0.1
−0.05
0A12
B2
L12
CuPt7
fcc
Mn RhAtomic Percent Rhodium
eV/a
tom
0 20 40 60 80 100
−20
−15
−10
−5
0
5
10
A12
Re24
Ti5
hcp
Mn RuAtomic Percent Ruthenium
meV
/ato
m
0 20 40 60 80 100−60
−50
−40
−30
−20
−10
0
10bcc
D019
hcp
Mo OsAtomic Percent Osmium
meV
/ato
m
0 20 40 60 80 100
−100
−80
−60
−40
−20
0bcc
MoPt2
D1a
Pt8Ti
fcc
Mo PdAtomic Percent Palladium
meV
/ato
m
0 20 40 60 80 100
−0.4
−0.35
−0.3
−0.25
−0.2
−0.15
−0.1
−0.05
0bcc
B19
MoPt2
D1a
Pt8Ti
fcc
Mo PtAtomic Percent Platinum
eV/a
tom
0 20 40 60 80 100
−0.25
−0.2
−0.15
−0.1
−0.05
0bcc
B19
C37 D019
Pt8Ti
fcc
Mo RhAtomic Percent Rhodium
eV/a
tom
0 20 40 60 80 100
−0.12
−0.1
−0.08
−0.06
−0.04
−0.02
0
0.02bcc
σAABAB
hcp
Mo RuAtomic Percent Ruthenium
eV/a
tom
FIG. 11. Convex hulls for the systems Mn-Pt, Mn-Rh, Mn-Ru, Mo-Os, Mo-Pd, Mo-Pt, Mo-Rh, and Mo-Ru.
COMPREHENSIVE SEARCH FOR NEW PHASES AND . . . PHYS. REV. X 3, 041035 (2013)
041035-23
0 20 40 60 80 100
−0.3
−0.25
−0.2
−0.15
−0.1
−0.05
0bcc
HfPd5*
A15 σ
BAABA
Al12
Mg17
D024
hcp
Nb OsAtomic Percent Osmium
eV/a
tom
0 20 40 60 80 100−0.5
−0.4
−0.3
−0.2
−0.1
0bcc
Nb3Pd +
CuZr2
MoPt2
NbPd3
HfPd5
*
Pt8Ti
fcc
Nb PdAtomic Percent Palladium
eV/a
tom
0 20 40 60 80 100
−0.8
−0.7
−0.6
−0.5
−0.4
−0.3
−0.2
−0.1
0bcc
A15
L10
MoPt2
NbPt3/D0
a
Pt8Ti
fcc
Nb PtAtomic Percent Platinum
eV/a
tom
0 20 40 60 80 100
−0.6
−0.5
−0.4
−0.3
−0.2
−0.1
0bcc
Pt8Ti
A15σ
BAABA
L10
Co3V
fcc
Nb RhAtomic Percent Rhodium
eV/a
tom
0 20 40 60 80 100
−0.25
−0.2
−0.15
−0.1
−0.05
0bcc
Pt8Ti
Nb5Ru *
L60
Ga3Pt
5
Ga3Pt
5
hcp
Nb RuAtomic Percent Ruthenium
eV/a
tom
0 20 40 60 80 100
−6
−4
−2
0
2
4
6
8
10
fcc
tet −fccAB3[001] c/a=2.7
fcc
Ni PdAtomic Percent Palladium
meV
/ato
m
0 20 40 60 80 100
−100
−80
−60
−40
−20
0fcc
D022
L10
CuZr2
D023
fcc
Ni PtAtomic Percent Platinum
meV
/ato
m
0 20 40 60 80 100
−100
−80
−60
−40
−20
0hcp
D019
B19
Sc2Zr *
Re3Ru *
hcp
Os ReAtomic Percent Rhenium
meV
/ato
m
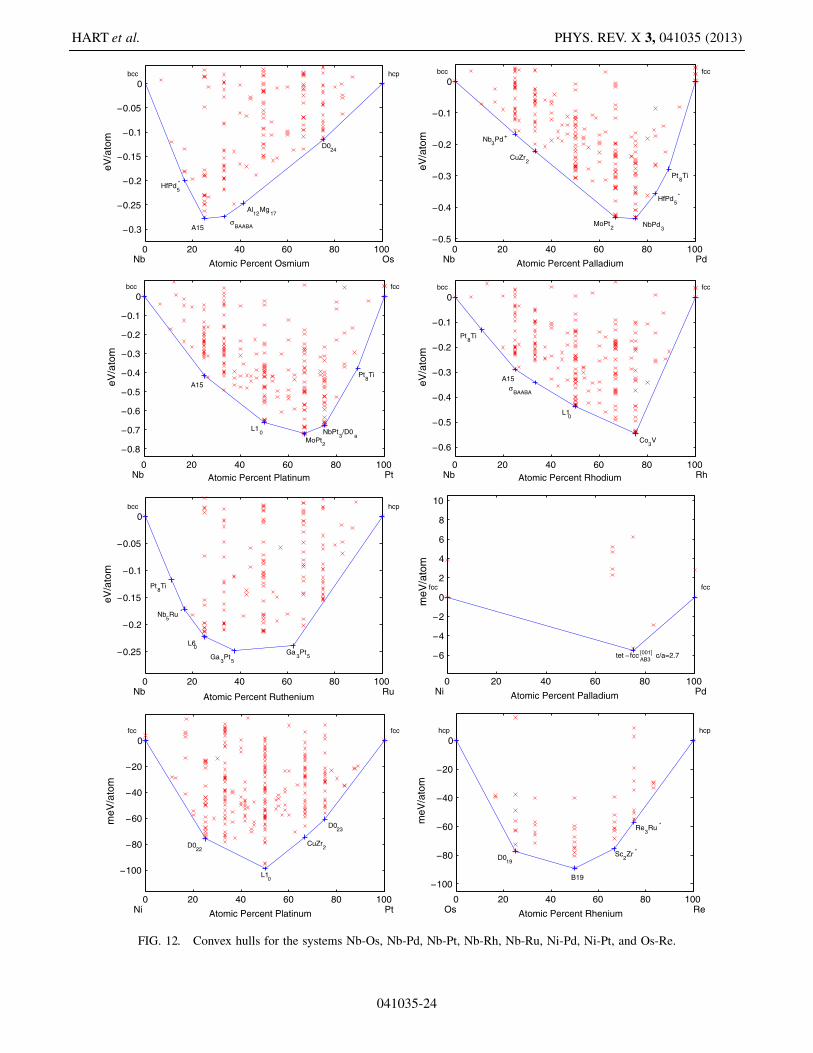
FIG. 12. Convex hulls for the systems Nb-Os, Nb-Pd, Nb-Pt, Nb-Rh, Nb-Ru, Ni-Pd, Ni-Pt, and Os-Re.
HART et al. PHYS. REV. X 3, 041035 (2013)
041035-24
0 20 40 60 80 100−10
−5
0
5
10
hcp
RhRu *
fcc
Os RhAtomic Percent Rhodium
meV
/ato
m
0 20 40 60 80 100
−15
−10
−5
0
5
10
hcp
D0a
B19
D0a
Hf5Sc *
hcp
Os RuAtomic Percent Ruthenium
meV
/ato
m
0 20 40 60 80 100−0.45
−0.4
−0.35
−0.3
−0.25
−0.2
−0.15
−0.1
−0.05
0hcp
C14 fccAB2[001]
Ir4Sc
11
Mg44
Rh7
hcp
Os ScAtomic Percent Scandium
eV/a
tom
0 20 40 60 80 100
−0.35
−0.3
−0.25
−0.2
−0.15
−0.1
−0.05
0hcp
Ga2Hf
Al12
Mg17
σ
ABBAB A15
bcc
Os TaAtomic Percent Tantalum
eV/a
tom
0 20 40 60 80 100
−80
−60
−40
−20
0hcp
Hf5Sc *
D019
B19
D019
hcp
Os TcAtomic Percent Technetium
meV
/ato
m
0 20 40 60 80 100
−0.8
−0.7
−0.6
−0.5
−0.4
−0.3
−0.2
−0.1
0hcp
B2
C49
Mo3Ti*
hcp
Os TiAtomic Percent Titanium
eV/a
tom
0 20 40 60 80 100
−0.4
−0.35
−0.3
−0.25
−0.2
−0.15
−0.1
−0.05
0hcp
Re3Ru*
Ga3Pt
5 C11
b D0
3
Mo5Ti *
bcc
Os VAtomic Percent Vanadium
eV/a
tom
0 20 40 60 80 100
−60
−50
−40
−30
−20
−10
0
10hcp
D019
bcc
Os WAtomic Percent Tungsten
meV
/ato
m
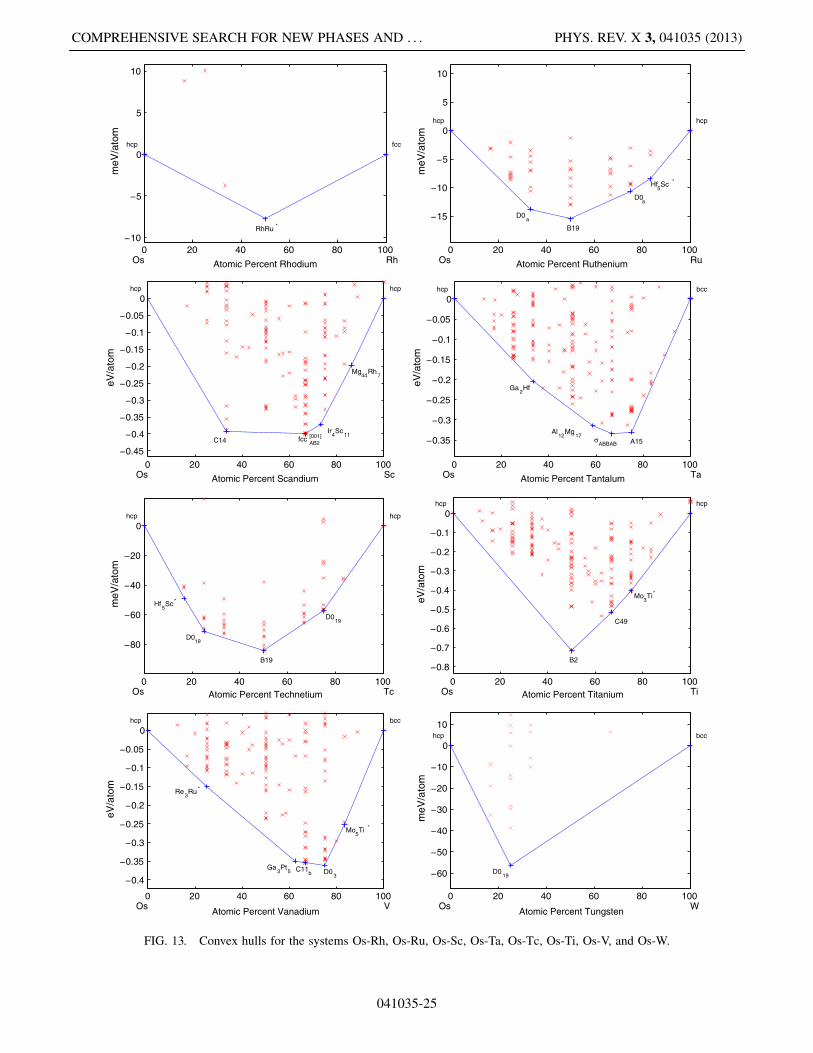
FIG. 13. Convex hulls for the systems Os-Rh, Os-Ru, Os-Sc, Os-Ta, Os-Tc, Os-Ti, Os-V, and Os-W.
COMPREHENSIVE SEARCH FOR NEW PHASES AND . . . PHYS. REV. X 3, 041035 (2013)
041035-25
0 20 40 60 80 100−0.35
−0.3
−0.25
−0.2
−0.15
−0.1
−0.05
0hcp
C14
D011
hcp
Os YAtomic Percent Yttrium
eV/a
tom
0 20 40 60 80 100−0.6
−0.5
−0.4
−0.3
−0.2
−0.1
0hcp
C14
B2
Ir4Sc
11
D1a
hcp
Os ZrAtomic Percent Zirconium
eV/a
tom
0 20 40 60 80 100
−40
−30
−20
−10
0
10
fcc
CuPt7
CdPt3*
L11
L12
CuPt7
fcc
Pd PtAtomic Percent Platinum
meV
/ato
m
0 20 40 60 80 100
−60
−50
−40
−30
−20
−10
0
10fcc
D019
hcp
Pd ReAtomic Percent Rhenium
meV
/ato
m
0 20 40 60 80 100
−1
−0.8
−0.6
−0.4
−0.2
0fcc
Pt8Ti
HfPd5*
L12
C37 Pd4Pu
3 B2
NiTi2
hcp
Pd ScAtomic Percent Scandium
eV/a
tom
0 20 40 60 80 100
−0.5
−0.4
−0.3
−0.2
−0.1
0fcc
Pt8Ti
HfPd5*
D022
MoPt2
B11
Pt8Ti
bcc
Pd TaAtomic Percent Tantalum
eV/a
tom
0 20 40 60 80 100
−80
−70
−60
−50
−40
−30
−20
−10
0
10fcc
RhRu *
D019
hcp
Pd TcAtomic Percent Technetium
meV
/ato
m
0 20 40 60 80 100
−0.7
−0.6
−0.5
−0.4
−0.3
−0.2
−0.1
0fcc
HfPd5*
D024
Pd2Ti Pd
5Ti
3 Pd
3Ti
2
C11b/CuZr
2
A15
hcp
Pd TiAtomic Percent Titanium
eV/a
tom
FIG. 14. Convex hulls for the systems Os-Y, Os-Zr, Pd-Pt, Pd-Re, Pd-Sc, Pd-Ta, Pd-Tc, and Pd-Ti.
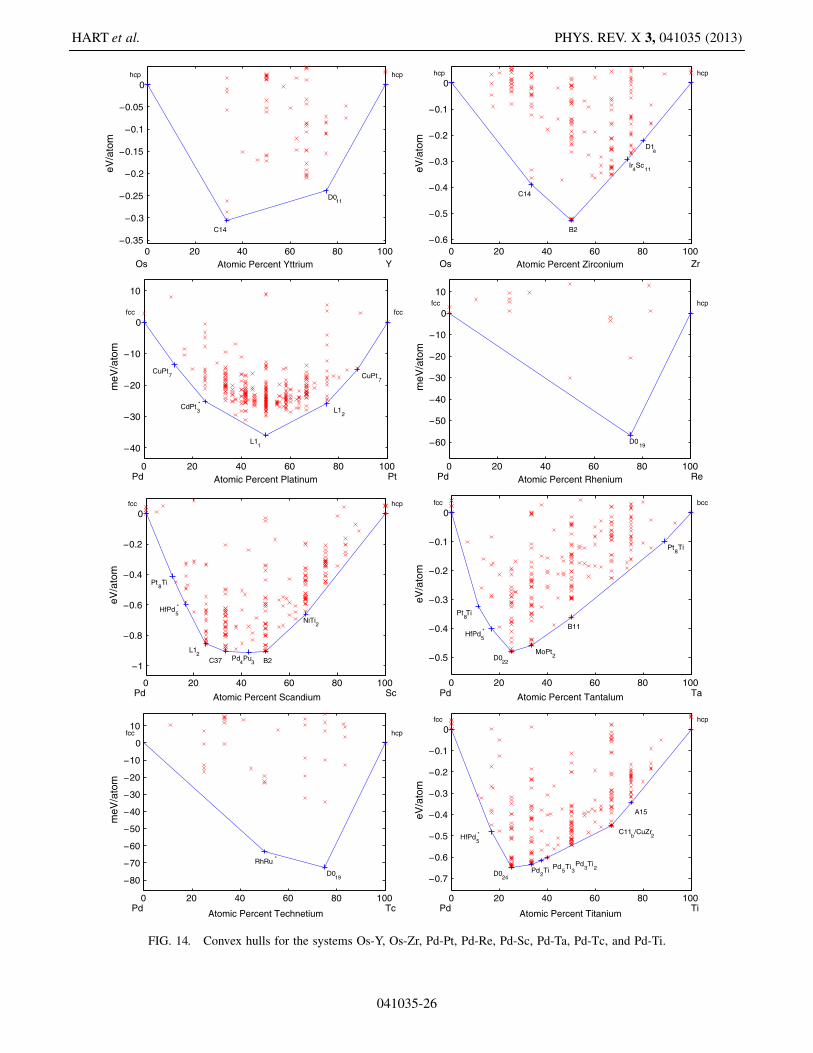
HART et al. PHYS. REV. X 3, 041035 (2013)
041035-26

0 20 40 60 80 100
−0.3
−0.25
−0.2
−0.15
−0.1
−0.05
0fcc
Pt8Ti
NbPd3
MoPt2
Mo5Ti*
Pt8Ti
bcc
Pd VAtomic Percent Vanadium
eV/a
tom
0 20 40 60 80 100−0.14
−0.12
−0.1
−0.08
−0.06
−0.04
−0.02
0
0.02fcc
Pt8Ti
bcc
Pd WAtomic Percent Tungsten
eV/a
tom
0 20 40 60 80 100
−1
−0.8
−0.6
−0.4
−0.2
0fcc
CuPt7
L12
Pd4Pu
3 B33
C37
D011
hcp
Pd YAtomic Percent Yttrium
eV/a
tom
0 20 40 60 80 100
−0.6
−0.5
−0.4
−0.3
−0.2
−0.1
0fcc
Pt8Ti
C37
L10
D022
Ir2Zn
11
hcp
Pd ZnAtomic Percent Zinc
eV/a
tom
0 20 40 60 80 100
−0.9
−0.8
−0.7
−0.6
−0.5
−0.4
−0.3
−0.2
−0.1
0fcc
Pt8Ti
HfPd5*
D024
B33
C11b/CuZr
2
hcp
Pd ZrAtomic Percent Zirconium
eV/a
tom
0 20 40 60 80 100
−0.25
−0.2
−0.15
−0.1
−0.05
0fcc
bccAB3[001]
D019
hcp
Pt ReAtomic Percent Rhenium
eV/a
tom
0 20 40 60 80 100−30
−25
−20
−15
−10
−5
0
5
10
fcc
NbP
Pd2Ti
D022
fcc
Pt RhAtomic Percent Rhodium
meV
/ato
m
0 20 40 60 80 100
−35
−30
−25
−20
−15
−10
−5
0
5
10
fcc
CdTi
hcp
Pt RuAtomic Percent Ruthenium
meV
/ato
m
FIG. 15. Convex hulls for the systems PdV, Pd-W, Pd-Y, Pd-Zn, Pd-Zr, Pt-Re, Pt-Rh, and Pt-Ru.
COMPREHENSIVE SEARCH FOR NEW PHASES AND . . . PHYS. REV. X 3, 041035 (2013)
041035-27

0 20 40 60 80 100−1.4
−1.2
−1
−0.8
−0.6
−0.4
−0.2
0fcc
Pt8Ti
L12
Ga2
Hf Pd
4Pu
3 B2
Cl2Pb
Rh13
Sc57
hcp
Pt ScAtomic Percent Scandium
eV/a
tom
0 20 40 60 80 100
−0.8
−0.7
−0.6
−0.5
−0.4
−0.3
−0.2
−0.1
0fcc
Pt8Ti
NbPt3 Au
2V
L10
σBBBAB
A15
Pt8Ti
bcc
Pt TaAtomic Percent Tantalum
eV/a
tom
0 20 40 60 80 100
−0.3
−0.25
−0.2
−0.15
−0.1
−0.05
0fcc
bccAB3[001]
Ir2Tc *
D019
hcp
Pt TcAtomic Percent Technetium
eV/a
tom
0 20 40 60 80 100
−1
−0.8
−0.6
−0.4
−0.2
0fcc
Pt8Ti
HfPd5*
PuAl3
Au5GaZn
2 NiTi
A15
hcp
Pt TiAtomic Percent Titanium
eV/a
tom
0 20 40 60 80 100
−0.6
−0.5
−0.4
−0.3
−0.2
−0.1
0fcc
Pt8Ti
D0a
MoPt2
L10
A15
Pt8Ti
bcc
Pt VAtomic Percent Vanadium
eV/a
tom
0 20 40 60 80 100−0.4
−0.35
−0.3
−0.25
−0.2
−0.15
−0.1
−0.05
0fcc
Pt8Ti
D1a
MoPt2
bcc
Pt WAtomic Percent Tungsten
eV/a
tom
0 20 40 60 80 100
−1.4
−1.2
−1
−0.8
−0.6
−0.4
−0.2
0fcc
D2d
L12
C15Pd
4Pu
3B33
Cl2Pb
D011
hcp
Pt YAtomic Percent Yttrium
eV/a
tom
0 20 40 60 80 100
−0.6
−0.5
−0.4
−0.3
−0.2
−0.1
0fcc
CuPt7
CdPt3*
L10
Pt7Zn
12 C49
D022
Ir2Zn
11
hcp
Pt ZnAtomic Percent Zinc
eV/a
tom
FIG. 16. Convex hulls for the systems Pt-Sc, Pt-Ta, Pt-Tc, Pt-Ti, Pt-V, Pt-W, Pt-Y, and Pt-Zn.
HART et al. PHYS. REV. X 3, 041035 (2013)
041035-28
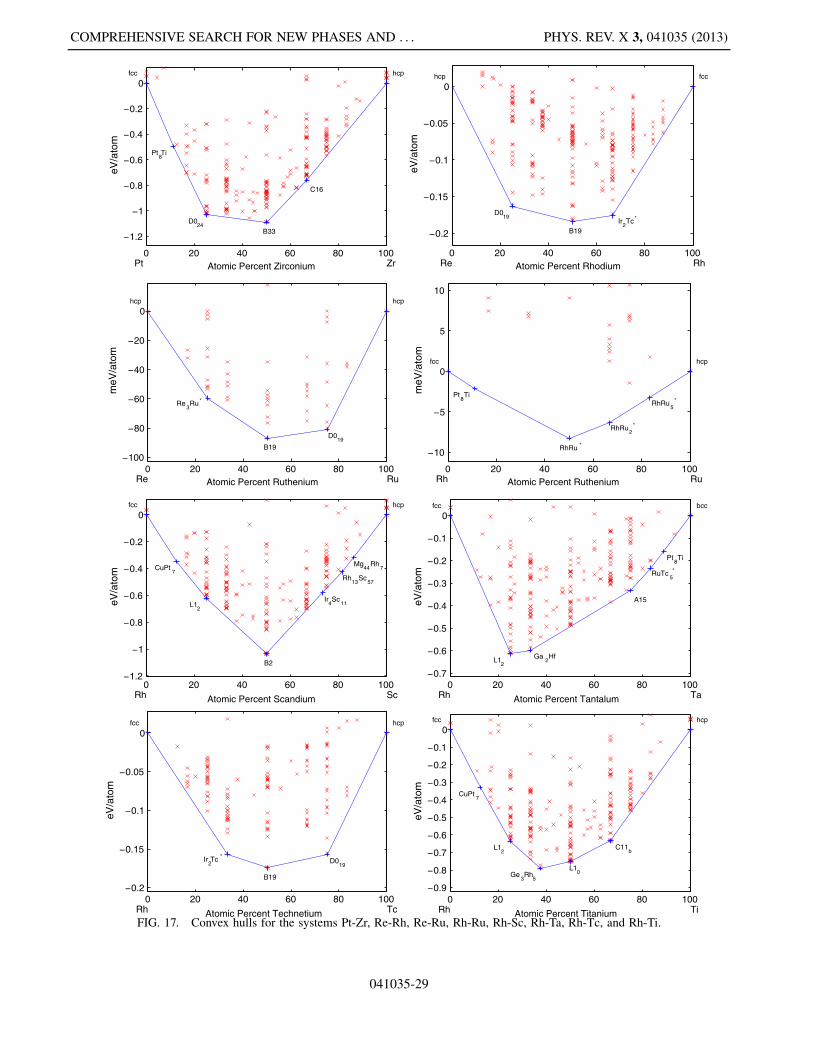
0 20 40 60 80 100
−1.2
−1
−0.8
−0.6
−0.4
−0.2
0fcc
Pt8Ti
D024
B33
C16
hcp
Pt ZrAtomic Percent Zirconium
eV/a
tom
0 20 40 60 80 100
−0.2
−0.15
−0.1
−0.05
0hcp
D019
B19 Ir
2Tc*
fcc
Re RhAtomic Percent Rhodium
eV/a
tom
0 20 40 60 80 100−100
−80
−60
−40
−20
0hcp
Re3Ru*
B19
D019
hcp
Re RuAtomic Percent Ruthenium
meV
/ato
m
0 20 40 60 80 100
−10
−5
0
5
10
fcc
Pt8Ti
RhRu *
RhRu2
*
RhRu5
*
hcp
Rh RuAtomic Percent Ruthenium
meV
/ato
m
0 20 40 60 80 100−1.2
−1
−0.8
−0.6
−0.4
−0.2
0fcc
CuPt7
L12
B2
Ir4Sc
11
Rh13
Sc57
Mg44
Rh7
hcp
Rh ScAtomic Percent Scandium
eV/a
tom
0 20 40 60 80 100−0.7
−0.6
−0.5
−0.4
−0.3
−0.2
−0.1
0fcc
L12
Ga2Hf
A15
RuTc5*
Pt8Ti
bcc
Rh TaAtomic Percent Tantalum
eV/a
tom
0 20 40 60 80 100−0.2
−0.15
−0.1
−0.05
0fcc
Ir2Tc *
B19
D019
hcp
Rh TcAtomic Percent Technetium
eV/a
tom
0 20 40 60 80 100−0.9
−0.8
−0.7
−0.6
−0.5
−0.4
−0.3
−0.2
−0.1
0fcc
CuPt7
L12
Ge3Rh
5
L10
C11b
hcp
Rh TiAtomic Percent Titanium
eV/a
tom
FIG. 17. Convex hulls for the systems Pt-Zr, Re-Rh, Re-Ru, Rh-Ru, Rh-Sc, Rh-Ta, Rh-Tc, and Rh-Ti.
COMPREHENSIVE SEARCH FOR NEW PHASES AND . . . PHYS. REV. X 3, 041035 (2013)
041035-29
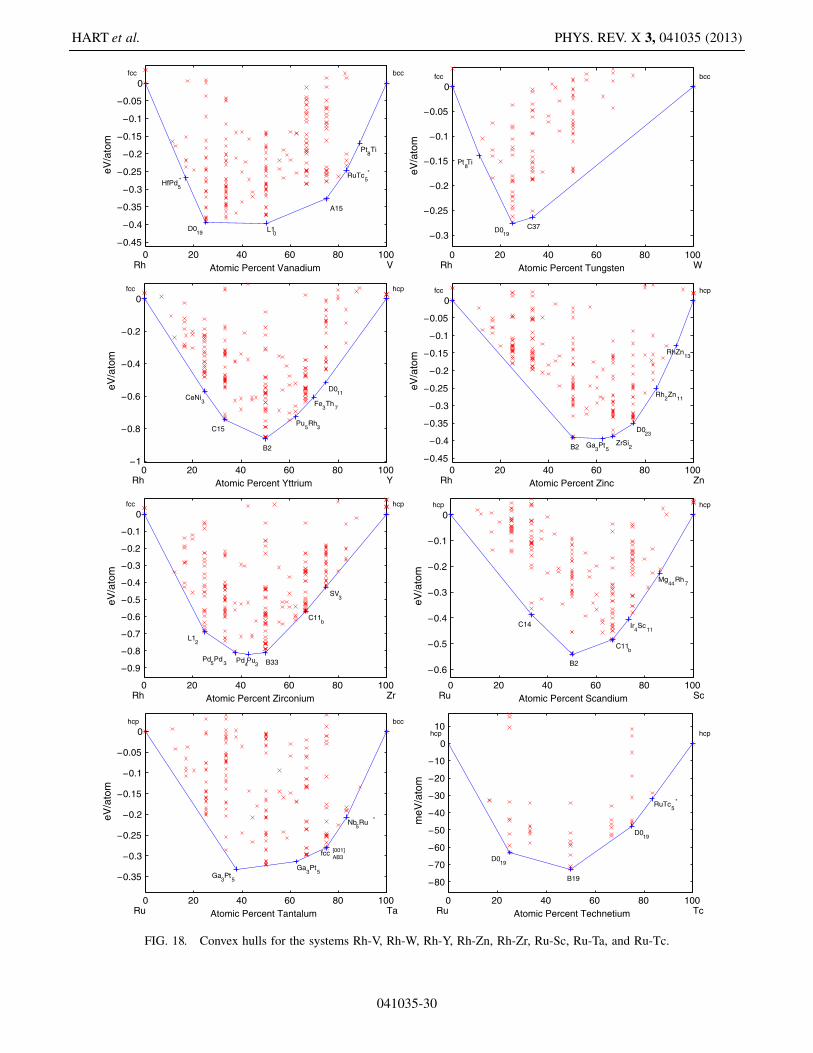
0 20 40 60 80 100−0.45
−0.4
−0.35
−0.3
−0.25
−0.2
−0.15
−0.1
−0.05
0fcc
HfPd5*
D019 L1
0
A15
RuTc5*
Pt8Ti
bcc
Rh VAtomic Percent Vanadium
eV/a
tom
0 20 40 60 80 100
−0.3
−0.25
−0.2
−0.15
−0.1
−0.05
0fcc
Pt8Ti
D019
C37
bcc
Rh WAtomic Percent Tungsten
eV/a
tom
0 20 40 60 80 100−1
−0.8
−0.6
−0.4
−0.2
0fcc
CeNi3
C15
B2
Pu5Rh
3
Fe3Th
7
D011
hcp
Rh YAtomic Percent Yttrium
eV/a
tom
0 20 40 60 80 100−0.45
−0.4
−0.35
−0.3
−0.25
−0.2
−0.15
−0.1
−0.05
0fcc
B2 Ga3Pt
5 ZrSi
2
D023
Rh2Zn
11
RhZn13
hcp
Rh ZnAtomic Percent Zinc
eV/a
tom
0 20 40 60 80 100
−0.9
−0.8
−0.7
−0.6
−0.5
−0.4
−0.3
−0.2
−0.1
0fcc
L12
Pd5Pd
3 Pd
4Pu
3 B33
C11b
SV3
hcp
Rh ZrAtomic Percent Zirconium
eV/a
tom
0 20 40 60 80 100
−0.6
−0.5
−0.4
−0.3
−0.2
−0.1
0hcp
C14
B2
C11b
Ir4Sc
11
Mg44
Rh7
hcp
Ru ScAtomic Percent Scandium
eV/a
tom
0 20 40 60 80 100
−0.35
−0.3
−0.25
−0.2
−0.15
−0.1
−0.05
0hcp
Ga3Pt
5
Ga3Pt
5
fccAB3[001]
Nb5Ru *
bcc
Ru TaAtomic Percent Tantalum
eV/a
tom
0 20 40 60 80 100
−80
−70
−60
−50
−40
−30
−20
−10
0
10hcp
D019
B19
D019
RuTc5
*
hcp
Ru TcAtomic Percent Technetium
meV
/ato
m
FIG. 18. Convex hulls for the systems Rh-V, Rh-W, Rh-Y, Rh-Zn, Rh-Zr, Ru-Sc, Ru-Ta, and Ru-Tc.
HART et al. PHYS. REV. X 3, 041035 (2013)
041035-30
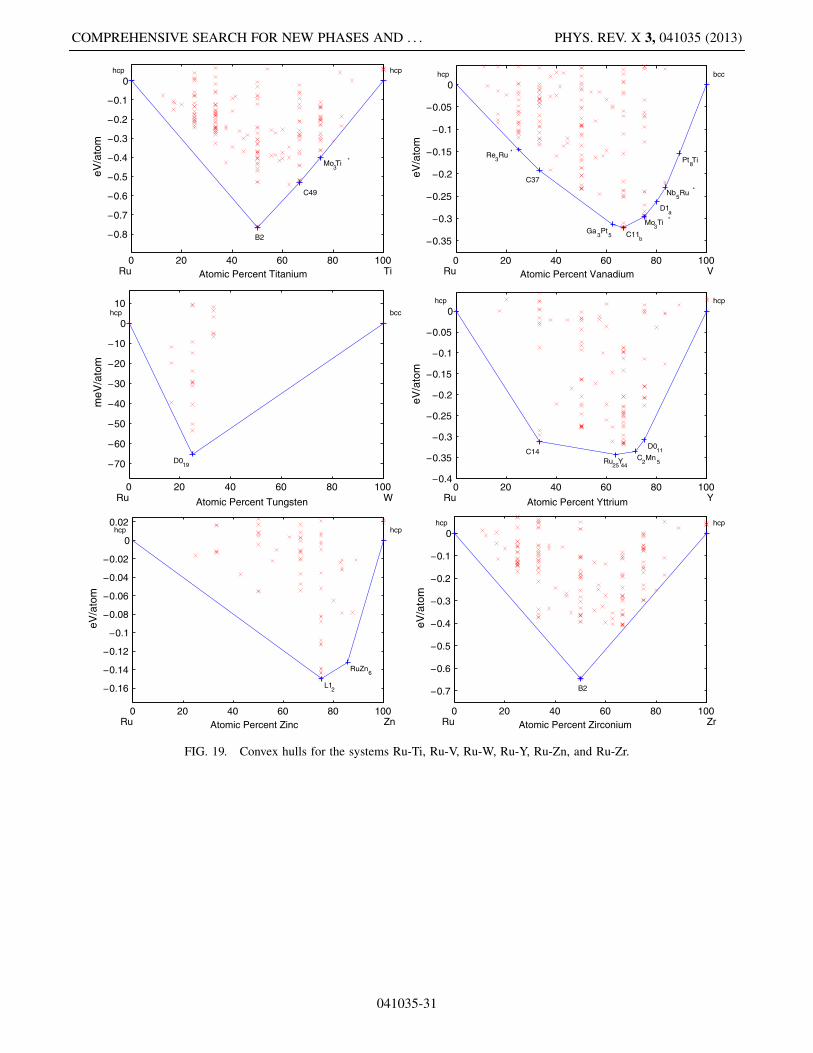
0 20 40 60 80 100
−0.8
−0.7
−0.6
−0.5
−0.4
−0.3
−0.2
−0.1
0hcp
B2
C49
Mo3Ti *
hcp
Ru TiAtomic Percent Titanium
eV/a
tom
0 20 40 60 80 100
−0.35
−0.3
−0.25
−0.2
−0.15
−0.1
−0.05
0hcp
Re3Ru *
C37
Ga3Pt
5 C11
b
Mo3Ti *
D1a
Nb5Ru *
Pt8Ti
bcc
Ru VAtomic Percent Vanadium
eV/a
tom
0 20 40 60 80 100
−70
−60
−50
−40
−30
−20
−10
0
10hcp
D019
bcc
Ru WAtomic Percent Tungsten
meV
/ato
m
0 20 40 60 80 100−0.4
−0.35
−0.3
−0.25
−0.2
−0.15
−0.1
−0.05
0hcp
C14Ru
25Y44
C2Mn
5
D011
hcp
Ru YAtomic Percent Yttrium
eV/a
tom
0 20 40 60 80 100
−0.16
−0.14
−0.12
−0.1
−0.08
−0.06
−0.04
−0.02
0
0.02hcp
L12
RuZn6
hcp
Ru ZnAtomic Percent Zinc
eV/a
tom
0 20 40 60 80 100
−0.7
−0.6
−0.5
−0.4
−0.3
−0.2
−0.1
0hcp
B2
hcp
Ru ZrAtomic Percent Zirconium
eV/a
tom
FIG. 19. Convex hulls for the systems Ru-Ti, Ru-V, Ru-W, Ru-Y, Ru-Zn, and Ru-Zr.
COMPREHENSIVE SEARCH FOR NEW PHASES AND . . . PHYS. REV. X 3, 041035 (2013)
041035-31
[1] P. J. Loferski, 2008 Minerals Yearbook—Platinum GroupMetals (US Geological Survey, Reston, VA, 2008).
[2] S. Curtarolo, D. Morgan, and G. Ceder, Accuracy ofab initio Methods in Predicting the Crystal Structures ofMetals: Review of 80 Binary Alloys, CALPHAD: Comput.Coupling Phase Diagrams Thermochem. 29, 163(2005).
[3] A. V. Ruban, I. A. Abrikosov, and H. L. Skriver, Ground-State Properties of Ordered, Partially Ordered, andRandom Cu-Au and Ni-Pt Alloys, Phys. Rev. B 51, 12958(1995).
[4] D. Paudyal and A. Mookerjee, Phase Stability andMagnetism in NiPt and NiPd alloys, J. Phys. Condens.Matter 16, 5791 (2004).
[5] D. Paudyal, T. Saha-Dasgupta, and A. Mookerjee, PhaseStability-Analysis in Fe-Pt and Co-Pt Alloy Systems: AnAugmented Space Study, J. Phys. Condens. Matter 16,7247 (2004).
[6] D. Paudyal, T. Saha-Dasgupta, and A. Mookerjee, Study ofPhase Stability in NiPt Systems, J. Phys. Condens. Matter15, 1029 (2003).
[7] N. A. Zarkevich, T. L. Tan, and D.D. Johnson, First-Principles Prediction of Phase-Segregating Alloy PhaseDiagrams and a Rapid Design Estimate of TheirTransition Temperatures, Phys. Rev. B 75, 104203 (2007).
[8] S. Barthlein, E. Winning, G. L.W. Hart, and S. Muller,Stability and Instability of Long-Period Superstructures inBinary Cu-Pd Alloys: A First-Principles Study, ActaMater. 57, 1660 (2009).
[9] S. Barthlein, G. L.W. Hart, A. Zunger, and S. Muller,Reinterpreting the Cu-Pd Phase diagram Based on NewGround-State Predictions, J. Phys. Condens. Matter 19,032201 (2007).
[10] R. Taylor, S. Curtarolo, and G. L.W. Hart, Predictions ofthe Pt8Ti Phase in Unexpected Systems, J. Am. Chem.Soc. 132, 6851 (2010).
[11] M. J. Mehl, G. L. Hart, and S. Curtarolo, DensityFunctional Study of the L10-�IrV Transition in IrV andRhV, J. Alloys Compd. 509, 560 (2011).
[12] R. V. Chepulskii and S. Curtarolo, Revealing Low-Temperature Atomic Ordering in Bulk Co-Pt with theHigh-Throughput ab initio Method, Appl. Phys. Lett. 99,261902 (2011).
[13] G. L.W. Hart, Verifying Predictions of the L13 CrystalStructure in Cd-Pt and Pd-Pt by Exhaustive Enumeration,Phys. Rev. B 80, 014106 (2009).
[14] B. Schoenfeld, M. Engelke, and A.V. Ruban, Lack ofSupport for Adaptive Superstructure NiPt7: Experimentand First-Principles Calculations, Phys. Rev. B 79,064201 (2009).
[15] K. Yuge, A. Seko, A. Kuwabara, F. Oba, and I. Tanaka,First-Principles Study of Bulk Ordering and SurfaceSegregation in Pt-Rh Binary Alloys, Phys. Rev. B 74,174202 (2006).
[16] S. L. Shang, Y. Wang, D. E. Kim, C. L. Zacherl, Y. Du, andZ.K. Liu, Structural, Vibrational, and ThermodynamicProperties of Ordered and Disordered Ni1�xPtx Alloysfrom First-Principles Calculations, Phys. Rev. B 83,144204 (2011).
[17] D. A. Carr, J. Corbitt, G. R. Hart, E. Gilmartin, andG. L.W. Hart, Finding New Phases for Precipitate-
Hardening in Platinum and Palladium Alloys, Comput.Mater. Sci. 51, 331 (2012).
[18] B. Sanyal, S. K. Bose, V. Drchal, and J. Kudrnovsky,Ordering and Segregation in XPt (X ¼ V, Cu, and Au)Random Alloys, Phys. Rev. B 64, 134111 (2001).
[19] P. E. A. Turchi, V. Drchal, and J. Kudrnovsky, Stability andOrdering Properties of fcc Alloys Based on Rh, Ir, Pd, andPt, Phys. Rev. B 74, 064202 (2006).
[20] M.H. F. Sluiter, C. Colinet, and A. Pasturel, Ab initioCalculation of the Phase Stability in Au-Pd and Ag-PtAlloys, Phys. Rev. B 73, 174204 (2006).
[21] R. V. Chepulskii, W.H. Butler, A. van de Walle, and S.Curtarolo, Surface Segregation in Nanoparticles fromFirst Principles: The Case of FePt, Scr. Mater. 62, 179(2010).
[22] L. J. Nelson, S. Curtarolo, and G. L.W. Hart, Ground StateCharacterizations of Systems Predicted to Exhibit L11 orL13 Crystal Structures, Phys. Rev. B 85, 054203 (2012).
[23] S. V. Barabash, V. Blum, S. Mueller, and A. Zunger,Prediction of Unusual Stable Ordered Structures ofAu-Pd Alloys via a First-Principles Cluster Expansion,Phys. Rev. B 74, 035108 (2006).
[24] O. Levy, R.V. Chepulskii, G. L.W. Hart, and S. Curtarolo,The New Face of Rhodium Alloys: Revealing OrderedStructures from First Principles, J. Am. Chem. Soc. 132,833 (2010).
[25] M. Jahnatek, O. Levy, G. L.W. Hart, L. J. Nelson, R. V.Chepulskii, J. Xue, and S. Curtarolo, Ordered Structuresand Vibrational Stabilization in Ruthenium Alloys fromFirst Principles Calculations, Phys. Rev. B 84, 214110(2011).
[26] O. Levy, G. L.W. Hart, and S. Curtarolo, UncoveringCompounds by Synergy of Cluster Expansion and High-Throughput Methods, J. Am. Chem. Soc. 132, 4830(2010).
[27] O. Levy, G. L.W. Hart, and S. Curtarolo, Structure Mapsfor hcp Metals from First-Principles Calculations, Phys.Rev. B 81, 174106 (2010).
[28] S. Curtarolo, G. L.W. Hart, M. Buongiorno Nardelli, N.Mingo, S. Sanvito, and O. Levy, The High-ThroughputHighway to Computational Materials Design, Nat. Mater.12, 191 (2013).
[29] O. Levy, G. L.W. Hart, and S. Curtarolo, Hafnium BinaryAlloys from Experiments and First Principles, Acta Mater.58, 2887 (2010).
[30] O. Levy, M. Jahnatek, R. V. Chepulskii, G. L.W. Hart, andS. Curtarolo, Ordered Structures in Rhenium BinaryAlloys from First-Principles Calculations, J. Am. Chem.Soc. 133, 158 (2011).
[31] O. Levy, J. Xue, S. Wang, G. L.W. Hart, and S. Curtarolo,Stable Ordered Structures of Binary Technetium Alloysfrom First Principles, Phys. Rev. B 85, 012201 (2012).
[32] A. R. Harutyunyan, E. Mora, T. Tokune, K. Bolton, A.Rosen, A. Jiang, N. Awasthi, and S. Curtarolo, HiddenFeatures of the Catalyst Nanoparticles Favorable forSingle-Walled Carbon Nanotube Growth, Appl. Phys.Lett. 90, 163120 (2007).
[33] S. Curtarolo, W. Setyawan, G. L.W. Hart, M. Jahnatek,R. V. Chepulskii, R. H. Taylor, S. Wang, J. Xue, K. Yang,O. Levy, M. Mehl, H. T. Stokes, D.O. Demchenko,and D. Morgan, AFLOW: An Automatic Framework for
HART et al. PHYS. REV. X 3, 041035 (2013)
041035-32

High-Throughput Materials Discovery, Comput. Mater.Sci. 58, 218 (2012).
[34] S. Curtarolo, W. Setyawan, S. Wang, J. Xue, K. Yang,R. H. Taylor, L. J. Nelson, G. L.W. Hart, S. Sanvito,M. Buongiorno Nardelli, N. Mingo, and O. Levy,AFLOWLIB.ORG: A Distributed Materials PropertiesRepository from High-Throughput ab initio Calculations,Comput. Mater. Sci. 58, 227 (2012).
[35] P. Villars, M. Berndt, K. Brandenburg, K. Cenzual, J.Daams, F. Hulliger, T. Massalski, H. Okamoto, K.Osaki, A. Prince, H. Putz, and S. Iwata, The PaulingFile, Binaries Edition, J. Alloys Compd. 367, 293 (2004).
[36] T. B. Massalski, H. Okamoto, P. R. Subramanian, and L.Kacprzak, Binary Alloy Phase Diagrams (AmericanSociety for Metals, Materials Park, OH, 1990).
[37] See www.aflowlib.org.[38] See the Supplemental Material at http://link.aps.org/
supplemental/10.1103/PhysRevX.3.041035 for the set ofgeometrical and relaxed structures with ab initio totalenergies and formation enthalpies.
[39] G. L.W. Hart and R.W. Forcade, Algorithm forGenerating Derivative Structures, Phys. Rev. B 77,224115 (2008).
[40] G. Kresse and J. Hafner, Ab initio Molecular Dynamics forLiquid Metals, Phys. Rev. B 47, 558 (1993).
[41] P. E. Blochl, Projector Augmented-Wave Method, Phys.Rev. B 50, 17953 (1994).
[42] J. P. Perdew, K. Burke, and M. Ernzerhof, GeneralizedGradient Approximation Made Simple, Phys. Rev. Lett.77, 3865 (1996).
[43] H. J. Monkhorst and J. D. Pack, Special Points forBrillouin-Zone Integrations, Phys. Rev. B 13, 5188 (1976).
[44] D. G. Pettifor, A Chemical Scale for Crystal-StructureMaps, Solid State Commun. 51, 31 (1984).
[45] D. G. Pettifor, The Structures of Binary Compounds. I.Phenomenological Structure Maps, J. Phys. C 19, 285(1986).
[46] J. K. Stalick, K. Wang, and R.M. Waterstrat, The CrystalStructure and Phase Transition of Hf2Pt3, J. PhaseEquilib. 34, 385 (2013).
[47] G. L.W. Hart and R.W. Forcade, Generating DerivativeStructures from Multilattices: Application to hcp Alloys,Phys. Rev. B 80, 014120 (2009).
[48] W. Setyawan and S. Curtarolo, High-ThroughputElectronic Band Structure Calculations: Challenges andTools, Comput. Mater. Sci. 49, 299 (2010).
[49] T. Hahn, International Tables of Crystallography. VolumeA: Space-Group Symmetry (Kluwer Academic Publishers,
International Union of Crystallography, Chester, England,2002).
[50] W. Hume-Rothery, The Metallic State (Oxford UniversityPress, Oxford, UK, 1931).
[51] A. R. Miedema, P. F. de Chatel, and F. R. de Boer,Cohesion in Alloys—Fundamentals of a Semi-empiricalModel, Physica (Amsterdam) 100B, 1 (1980).
[52] A. Zunger, Systematization of the Stable Crystal Structureof All AB-Type Binary Compounds: A PseudopotentialOrbital-Radii Approach, Phys. Rev. B 22, 5839(1980).
[53] D. G. Pettifor, Structure Maps Revisited, J. Phys. Condens.Matter 15, V13 (2003).
[54] P. Villars, K. Brandenburg, M. Berndt, S. LeClair, A.Jackson, Y.H. Pao, B. Igelnik, M. Oxley, B. Bakshi,P. Chen, and S. Iwata, Binary, Ternary and QuaternaryCompound Former/Nonformer Prediction via MendeleevNumber, J. Alloys Compd. 317–318, 26 (2001).
[55] C. Wolverton and V. Ozolin, s, Entropically FavoredOrdering: The Metallurgy of Al2Cu Revisited, Phys.Rev. Lett. 86, 5518 (2001).
[56] Fuelling Discovery by Sharing, Nat. Mater. 12, 173(2013).
[57] R. T. Fielding and R.N. Taylor, Principled Design of theModern Web Architecture, ACM Trans. Internet Technol.2, 115 (2002).
[58] A. R. Harutyunyan, N. Awasthi, A. Jiang, W. Setyawan, E.Mora, T. Tokune, K. Bolton, and S. Curtarolo, ReducedCarbon Solubility in Fe Nano-Clusters and Implicationsfor the Growth of Single-Walled Carbon Nanotubes, Phys.Rev. Lett. 100, 195502 (2008).
[59] S. Curtarolo, N. Awasthi, W. Setyawan, A. Jiang, K.Bolton, T. Tokune, and A. R. Harutyunyan, Influence ofMo on the Fe:Mo:C Nanocatalyst Thermodynamics forSingle-Walled Carbon Nanotube Growth, Phys. Rev. B 78,054105 (2008).
[60] F. Cervantes-Sodi, T. P. McNicholas, J. G. S. Jr., J. Liu, G.Csanyi, A. C. Ferrari, and S. Curtarolo, Viscous StateEffect on the Activity of Fe Nanocatalysts, ACS Nano 4,6950 (2010).
[61] T. Chookajorn, H.A. Murdoch, and C.A. Schuh, Designof Stable Nanocrystalline Alloys, Science 337, 951(2012).
[62] H. A. Murdoch and C.A. Schuh, Stability of binary nano-crystalline alloys against grain growth and phase separa-tion, Acta Mater. 61, 2121 (2013).
[63] J. K. Stalick and R.M. Waterstrat, The Hafnium-PlatinumPhase Diagram, J. Phase Equilib. (2013).
COMPREHENSIVE SEARCH FOR NEW PHASES AND . . . PHYS. REV. X 3, 041035 (2013)
041035-33