Embed Size (px)
Citation preview

ORE Open Research Exeter
TITLE
Comprehensive Risk Management using Fuzzy FMEA and MCDA Techniques in Highway ConstructionProjects
AUTHORS
Ahmadi, A; Behzadian, Kourosh; Ardeshir, Abdollah; et al.
JOURNAL
Journal of Civil Engineering and Management
DEPOSITED IN ORE
26 November 2015
This version available at
http://hdl.handle.net/10871/18782
COPYRIGHT AND REUSE
Open Research Exeter makes this work available in accordance with publisher policies.
A NOTE ON VERSIONS
The version presented here may differ from the published version. If citing, you are advised to consult the published version for pagination, volume/issue and date ofpublication
COMPREHENSIVE RISK MANAGEMENT USING FUZZY FMEA AND MCDA
TECHNIQUES IN HIGHWAY CONSTRUCTION PROJECTS
Submitted Day Month Year; accepted Day Month Year
Abstract: This paper presents a comprehensive framework to manage the main risk events of highway construction projects
within three stages: (1) identification of potential risks, (2) assessment and prioritisation of identified risks based on fuzzy
FMEA; (3) identification of appropriate response. The main criteria analysed for prioritising potential risk events are cost,
time and quality which are quantified and combined using fuzzy AHP. A new expert system is suggested for identifying
an appropriate risk response strategy for a risk event based on risk factor, control number and risk allocation. The best
response action for a risk event is then identified with respect to the same criteria using “scope expected deviation” (SED)
index. The proposed methodology is demonstrated for management of risk events in a construction project of Bijar-Zanjan
highway in Iran. For the risk event of “increase in tar price”, deviation from the target values of the criteria is analysed for
business-as-usual state plus two risk response actions using SED index. The results show that the response action of
“changing paving construction technology from asphalt pavement to RCC pavement” can successfully cope with the risk
event of “increase in tar price” and have the minimum deviation.
Keywords: risk management, response actions, risk strategy, fuzzy AHP, fuzzy FMEA.
1. Introduction
Occurrence of events with negative impacts on a project
objective is usually known as “risk” (PMI, 2008). Risk
generally exists in construction projects due to uncertain
events which are inevitable and may impose delays, incur
additional costs and decline the quality of the projects
(Mahamid, 2011). Expansion of the size and complexity of
a construction project would lead to increase in the amount
of associated risk events rapidly (Diab et al., 2012).
In particular, highway construction projects are
subject to higher risks and uncertainties than other
construction projects due to higher capital investments and
more complexity and their dependency on economic,
societal, and political challenges (Wilson and Molenaar,
2009). Researchers could reveal the main causes of delays
and additional costs in these projects using analysis of risk
events. For instance, a study on 219 highway projects in
Illinois found that the main causes of cost overruns (~4%
above the bid price) were due mainly to unpredicted
additions and balanced final field measurements (Nassar et
al., 2005). The results of a study in highway construction
projects in Queensland indicated a correlation between the
reciprocal of project budget size and percentage cost
overrun (Creedy et al., 2010). Another research divided the
main risks in highway projects into two scales including
company level (i.e. political and financial risks) and
project level (i.e. emerging technology and resource risks)
(Zayed and Amer, 2008).
Furthermore, one of the main issues for risk
management of highway projects especially in developing
countries is the lack of documented inventory of the
relevant data for the finished projects and thus the key
parameters of relevant statistical distributions are mainly
unknown. This would lead to an increased uncertainty for
occurrence of any risk events which cause to make more
conservative decisions for all involved parties such as
contractors, insurance companies and employers.
Therefore, risk management of these projects, though
faced with a lot of challenges, is still vital in order to
reveals the critical risk events and take some proper
measure for alleviation of their consequences over the
construction period.
The main purpose of this paper is to propose a new
comprehensive framework to manage risk events in
highway construction projects. This framework comprises
identification, assessment and eventually selection of an
appropriate response to each risk event. A brief literature
review of the methodologies used in this paper is first
given in the next section. The proposed framework steps
and applied techniques are then described. These
techniques include Fuzzy Failure Mode and Effects
Analysis (FMEA), fuzzy Analytical Hierarchy Process
(AHP) and scope expected deviation (SED) index. Then,
the results of demonstrating risk management to a real
highway construction project are presented and discussed.
Finally, the conclusions are drawn and some
recommendations are made for future studies.
2. Background
Over the last decades, various risk analysis techniques
have been generally developed by researchers and
practitioners in construction industry based on Risk Matrix
(RM) (Mahamid, 2011; Ashley et al., 2006), Monte Carlo
Simulation (MCS) (Maher and smith, 2006), Sensitivity
Analysis (SA) (Jouandou, 2010), Event Tree (ET)
(Jouandou, 2010; Nývlt et al., 2011), Fault Tree (FT)
(Nývlt et al., 2011; Abdelgawad and Fayek, 2011), AHP
(Zayed et al., 2008), TOPSIS grey (Zavadskas et al.,
2010), FMEA (Sant'Anna, 2012) and so on. The main aims
and limitations for some of the most frequently used
techniques have been listed in Table 1. FMEA is
recognised as one of the effective risk analysis techniques
suggested by international standards such as MIL-STD-
1689A (U.S. Department of Defence, 1980). This method
has been widely used for identifying and removing the
main causes for failure and the relevant consequences
before occurrence and thus improving the reliability of
productions or processes (Sant'Anna, 2012). Carbone and
Tippett (2004) applied Risk Failure Mode and Effects
Analysis (RFMEA) for project risk management.
Application of multi-criteria decision analysis
(MCDA) techniques such as fuzzy AHP has been
developed by researchers in the recent decades in
construction management projects (Abdelgawad and
Fayek, 2010; Torfi and Rashidi, 2011). Abdelgawad and
Fayek (2010) employed fuzzy FMEA and fuzzy AHP for
risk identification and assessment of high risk events. They
finally suggested some strategies for response to risk
events based on partitioning the risk critical number into
nine limits. However, these strategies have not applied risk
owners and their ability to manage risk events. Some
others have suggested better responses for managing risk
events. Fan et al. (2008) applied this methodology for
selecting a response to a particular risk event based on
minimum cost criterion only and thus other factors (e.g.,
time and quality) were ignored. Beyond the identifications
and evaluations of risk events in highway projects, some
researchers stepped forward into analysing allocate risk
among contractual parties in order to facilitate risk
handling strategies. For instance, the result of a risk
allocation analysis in highway projects in Taiwan
concluded the consequence of inappropriately allocated
risk would result in the tendency of the relevant parties for
handling risk changing from actively transferring the risk
to passively retaining the risk (Wang and Chou 2003).
Another research carried out for several highway projects
stressed the need for identifying the risk responsibilities of
contractual parties and allocating in a well-defined manner
in order to improve their risk handling strategies (Perera et
al., 2009).
Despite a plethora of useful and applicable studies
related to risk management, there are still some
outstanding issues which need to be addressed. To the best
knowledge of the authors, there was no study that
demonstrates the entire aspects of risk management
simultaneously. More specifically, a comprehensive,
holistic framework for risk management in the road
construction projects including identification of potential
hazards, assessment of associated risks and identification
of appropriate response needs to be developed. Moreover,
the best response needs to be identified with respect to risk
allocation, proper risk response strategy and different
aspects of the influencing criteria (i.e. time, cost and
quality). This paper aims to fill this gap based on
highlighting the aforementioned issues.
Table 1. The most frequently used applications of risk-related techniques in construction industry
Technique Aim Main limitation Reference
Risk matrix -Rank risk events using qualitative
analyses of risk components
-Classification of risks into only a limited
number of categories
Mahamid, 2011;
Ashley et al., 2006
Monte Carlo
simulation
-Aggregate the combined effects
resulted from uncertain parameters
-Precise experimental statistical data
-Computationally expensive
Maher and Smith
2006
Scenario analysis
methods
-Test the likelihood of consequences
for alternative scenarios in a project
-Many statistical data required for
evaluating probability of events
Jouandou, 2010;
Nývlt et al. 2011
AHP -Rank risk events based on pairwise
comparisons
-Limited to a few number of pairwise
comparisons
Zayed et al., 2008
Fuzzy logic
assessment
-Useful in the absence of probabilistic
data
-Not as precise as probabilistic methods. Abdelgawad and
Fayek, 2010
FMEA -Identify critical risk events -Only quantify one consequence in a time Sant'Anna, 2012
3. Methodology
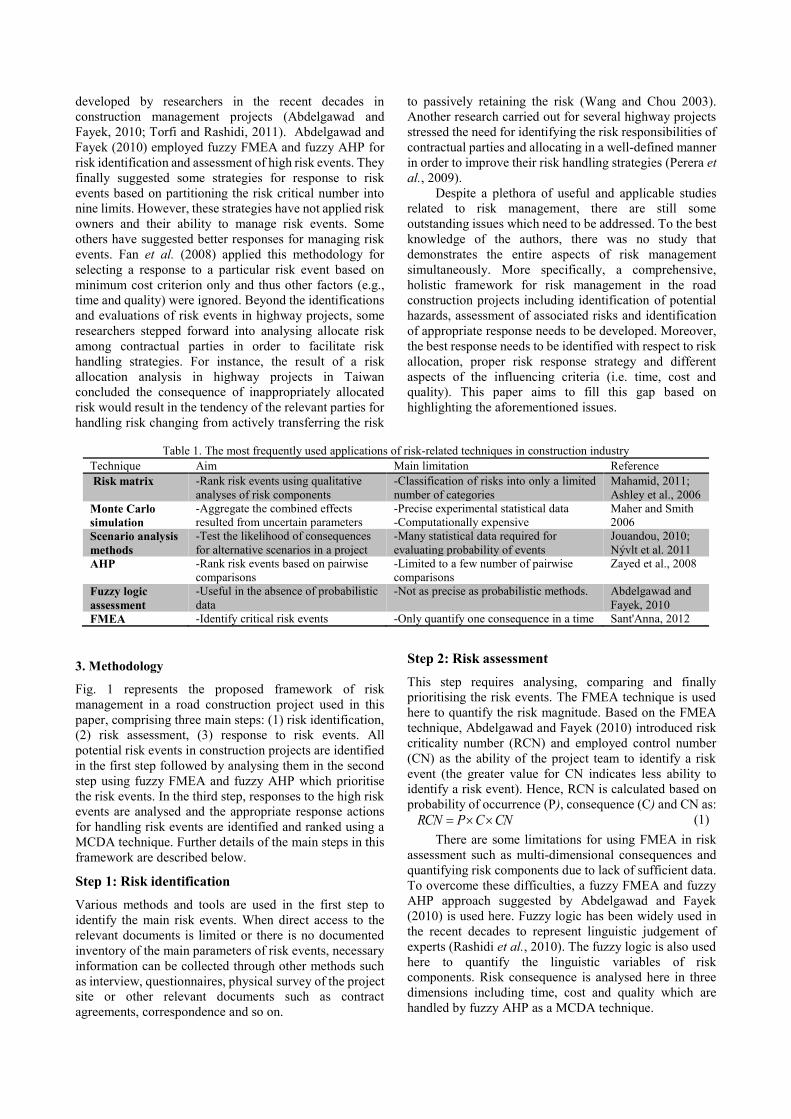
Fig. 1 represents the proposed framework of risk
management in a road construction project used in this
paper, comprising three main steps: (1) risk identification,
(2) risk assessment, (3) response to risk events. All
potential risk events in construction projects are identified
in the first step followed by analysing them in the second
step using fuzzy FMEA and fuzzy AHP which prioritise
the risk events. In the third step, responses to the high risk
events are analysed and the appropriate response actions
for handling risk events are identified and ranked using a
MCDA technique. Further details of the main steps in this
framework are described below.
Step 1: Risk identification
Various methods and tools are used in the first step to
identify the main risk events. When direct access to the
relevant documents is limited or there is no documented
inventory of the main parameters of risk events, necessary
information can be collected through other methods such
as interview, questionnaires, physical survey of the project
site or other relevant documents such as contract
agreements, correspondence and so on.
Step 2: Risk assessment
This step requires analysing, comparing and finally
prioritising the risk events. The FMEA technique is used
here to quantify the risk magnitude. Based on the FMEA
technique, Abdelgawad and Fayek (2010) introduced risk
criticality number (RCN) and employed control number
(CN) as the ability of the project team to identify a risk
event (the greater value for CN indicates less ability to
identify a risk event). Hence, RCN is calculated based on
probability of occurrence (P), consequence (C) and CN as:
CNCPRCN (1)
There are some limitations for using FMEA in risk
assessment such as multi-dimensional consequences and
quantifying risk components due to lack of sufficient data.
To overcome these difficulties, a fuzzy FMEA and fuzzy
AHP approach suggested by Abdelgawad and Fayek
(2010) is used here. Fuzzy logic has been widely used in
the recent decades to represent linguistic judgement of
experts (Rashidi et al., 2010). The fuzzy logic is also used
here to quantify the linguistic variables of risk
components. Risk consequence is analysed here in three
dimensions including time, cost and quality which are
handled by fuzzy AHP as a MCDA technique.
Step 2.1: Linguistic terms for risk components
This step entails defining linguistic variables and their
membership functions (MFs) related to the three
components of fuzzy FMEA. Based on some interviews
and previous studies (PMI, 2008; Jazebi and Rashidi,
2013), linguistic terms for the three dimensions of severity
of consequence , i.e. cost (Cc), time (Ct) and quality (Cq),
probability of occurrence (P), and control number (CN) are
defined in five levels (very high, high, medium, low, very
low) as described in Table 1. According to some
recommendations made by PMI (2008) and Abdelgawad
and Fayek (2010), a trapezoidal shape MF is suggested for
all levels of the fuzzy numbers in Table 1. For each fuzzy
number in this Table, a, b, c and d represent low, middle
lower, middle upper and up bounds of the trapezoidal
fuzzy MFs, respectively.
Table 1. Linguistic variables of risk components
Linguistic variable/
fuzzy number (a,b,c,d)
Severity of consequence
Time of delay relative to
completion date (Ct) [%]
Cost increase relative to
estimated cost (Cc) [%] Quality of constructed project (Cq)
Very High (8,9,10,10) 20% 40% Uselessness of entire/part of project
High (6,7,8,9) 10% and ≤20% 20% and ≤40% Quality decrease is conclusive
Medium (3,4,6,7) 5% and ≤10% 10% and ≤20% Quality decrease required approval
Low (1,2,3,4) ≤5% ≤10% Quality decrease unimportant
Very Low (0,0,1,2) On time No extra cost Acceptable
probability of occurrence (P) Control Number (CN)
Very High (8,9,10,10) Very likely (>80%) Incapable of identifying/controlling a risk event before/after occurrence
High (6,7,8,9) Likely (50%<and ≤80) Low chance to identify/control a risk event before/after occurrence
Medium (3,4,6,7) Less likely (10%<and ≤50) Medium chance to identify/ control a risk event before/after occurrence
Low (1,2,3,4) Unlikely (5%<and ≤10) High chance to identify/control a risk event before/after occurrence
Very Low (0,0,1,2) Very unlikely (≤5%) Capable of identifying/controlling a risk event before/after occurrence
1.1.Identify risk events1.1.Identify risk events
2.1.Define linguistic terms for
fuzzy FMEA components
2.1.Define linguistic terms for
fuzzy FMEA components 2.2.Define linguistic terms for
fuzzy AHP criteria
2.2.Define linguistic terms for
fuzzy AHP criteria
2.3. Collect and combine experts’ judgment as linguistic terms for:
1-Probability of risk events (P)
2- severity of Consequences of risk events (Cc, Ct, Cq)
3-Control Number (CN)
4-Pairwise comparisons of the criteria (Cct, Ccq, Ctq)
2.3. Collect and combine experts’ judgment as linguistic terms for:
1-Probability of risk events (P)
2- severity of Consequences of risk events (Cc, Ct, Cq)
3-Control Number (CN)
4-Pairwise comparisons of the criteria (Cct, Ccq, Ctq)
2.4.Prioritise risk events using fuzzy FMEA and fuzzy AHP
1- Calculate severity of consequence by fuzzy AHP
2- Calculate Risk Criticality Number (RCN) by fuzzy FMEA
3- Prioritise risk event base on RCN
2.4.Prioritise risk events using fuzzy FMEA and fuzzy AHP
1- Calculate severity of consequence by fuzzy AHP
2- Calculate Risk Criticality Number (RCN) by fuzzy FMEA
3- Prioritise risk event base on RCN
3.2. Allocate risk owner for response actions3.2. Allocate risk owner for response actions
3.1. Identify possible response actions3.1. Identify possible response actions
`̀
`̀
1. R
isk
id
enti
fica
tion
1. R
isk
id
enti
fica
tion
2.R
isk
ass
essm
ent
2.R
isk
ass
essm
ent
3. R
esp
on
se t
o r
isk
even
ts3. R
esp
on
se t
o r
isk
even
ts
3.4. Select the best response action/actions group 3.4. Select the best response action/actions group
3.3. Select response actions with respect to
response strategy
3.3. Select response actions with respect to
response strategy
Fig. 1. Proposed framework of risk management
Step 2.2: Linguistic terms for pairwise comparisons of
the criteria
Given the three criteria for severity of consequence,
pairwise comparisons of the criteria need to be defined as
cost vs time (Ctq), cost vs quality (Ccq) and (c) time vs
quality (Cct) as linguistic terms. Therefore, pairwise
comparisons of the relative preferences (importance)
between the criteria are defined in five linguistic terms
(strongly more, more, equal, less and strongly less). Based
on the experiences obtained from saaty (1982), the
corresponding MFs of fuzzy numbers are suggested in five
triangular shapes i.e., (3,5,5), (1,3,5), (0.33,1,3),
(0.2,0.33,1) and (0,0.2,0.33), respectively.
The fuzzy AHP technique initially developed by
Saaty (1982) is used here to compare the three dimensions
of consequence of the risk events. Fuzzy AHP enables a
pairwise comparison between these criteria by using
linguistic terms and finally provides a relative weight for
each criterion which will be used for making a single
severity of consequence for a risk event.
Step 2.3: Combine the judgment of experts
For each risk event, all linguistic variables of risk
components (i.e. Cc, Ct, Cq and CN) defined in Table 1
need to be assessed by a number of experts in the project.
The pairwise comparisons of the three criteria also need to
be assessed only once by experts using linguistic terms
defined in step 2.2. All these assessments can be made
through questionnaires or interviews. The judgements
made by different experts need to be combined into a
single judgement which was done here by using the α–cut
method. Thus, a relative weight is calculated for each
expert based on job position (5 scores from simple worker
to manager), professional experience (5 scores from less
than 5 years to over 30 years) and educational level (4
scores from secondary education to master degree). The
relative weight of each expert is calculated by dividing the
absolute weight of the expert (sum of the scores related to
the three specifications) by sum of absolute weights of all
experts. Therefore, the single judgment of variable i (Ei)
can be calculated as a fuzzy number by a linear
combination of all experts’ judgements as:
n
jjiji WFE
1
(2)
where Fᵢj= judgement of variable i by expert j (fuzzy
number), Wj= relative weight of expert j (real number) and
n=number of experts participated in the survey. Also note
that as grouping decision making have been used in this
study using completely independent experts, any biased
opinions will be moderated and combined average
judgements. Furthermore, in order to validate the
consistency of the pair-wise judgements by a group of
experts, the metric of inconsistency ratio was finally
checked. The inconsistency ratio provides useful guidance
about how to interpret information coming back from an
individual or a group. The inconsistency ratio greater than
about 0.is generally viewed as worthy of concern while the
ratio smaller than 0.1 reflects a pretty coherent set of
assessments (Saaty, 1982).
Step 2.4: Prioritise risk events using fuzzy FMEA and
fuzzy AHP
This step entails calculations of fuzzy values and
defuzzification within three consecutive stages:
1) Calculate severity of consequence: After
combining different experts’ judgement, a single fuzzy
number is obtained for each pairwise comparison of the
three dimensions of consequence. Fuzzy AHP is used to
convert the fuzzy numbers of pairwise comparisons into
three fuzzy numbers of the relative weights. These fuzzy
numbers are then converted into crisp values
(defuzzification) by using centre of gravity (COR)
technique (Ardeshir et al. 2014). These crisp (real) values
are the relative weights of each consequence dimension,
i.e. cost (Wc), time (Wt) and quality (Wq).
Finally, a single fuzzy number is derived for severity
of consequence C from a linear–weighted combination of
the three fuzzy numbers of the consequence (i.e. Cc, Ct and
Cq) using the α–cut method as:
(3) qqttcc CWCWCWC
This single fuzzy number is used in Eq. (1) as
severity of consequence combining the three dimensions
in a risk event.
2) Calculate risk criticality number: After incorporating
the fuzzy numbers of experts’ judgements into single fuzzy
numbers for the probability of occurrence (P), severity of
consequences (C) and control number (CN), the fuzzy
number of risk criticality number (RCN) is calculated for
each risk event according to Eq. (1) using the α–cut
method. Then, the fuzzy number of RCN is converted into
a crisp (real) value by using the COR method.
3) Prioritise risk events: To prioritise the risk events, they
are ranked based on the calculated RCN. Therefore, high
ranked risk events are those which need to be considered
by decision makers as high priority for any immediate
action to respond risk events. Response to each risk event
should be done by the risk owner and should be
proportional to the relevant risk strategy.
Step 3: Response to risk events
To identify a proper response to a risk event, four
consecutive stages described below are proposed here.
These stages ensure the screening of all possible response
actions which eventually lead to identifying the best
response for a risk event.
Step 3.1: Identify possible response actions
Possible actions in response to each risk event are
identified at this stage using various methods and
techniques such as brainstorming, interview, information
from databases and previous experiences. This would form
a list of possible actions for each risk event.
Step 3.2: Allocate risk owner for response actions
Each response action of a risk event is allocated a risk
owner who takes the responsibility of the risk event and
has an ability to manage and control it (Ashley et al, 2006).
A risk owner can be one of the contractual parties (e.g.
contractor, employer or consultant). Risk owner may have
several definitions (Uff, 1995) but risk owner here is
assumed to be someone who is responsible for control and
management of risk events plus any financial losses
incurred by risk events. Furthermore, the allocated risk
owner for a response action must be the same as the risk
owner specified in contract documents. Otherwise that
response action should be discarded from the list.
Step 3.3: Select response actions with respect to response
strategy
Risk response actions should be selected proportional the
appropriate response strategy. Generally, a risk response
strategy can be divided into four categories (Wang and
chou, 2003; Ashley et al., 2006) as: (1) risk avoidance (i.e.
changing plan/design in order to remove the risk); (2) risk
transference (i.e. transferring the responsibility of risk
management to other parties); (3) risk mitigation (i.e.
alleviating risk magnitude by reducing any of risk
components such as P, C or CN); (4) risk acceptance (i.e.
doing nothing and accept any resulting consequences).
Abdelgawad and Fayek (2010) proposed a response
strategy based on the RCN value only (shown in in Fig. 2
as solid lines with five regions). In the Abdelgawad-Fayek
(AF) expert system, a response strategy is proposed within
five ranges as acceptance for RCN<162.5, Mitigation for
162.5<RCN<250, Mitigation/Transfer for
250<RCN<462.5, Transfer/Avoidance for
462.5<RCN<725 and Avoidance for 725<RCN<1000.
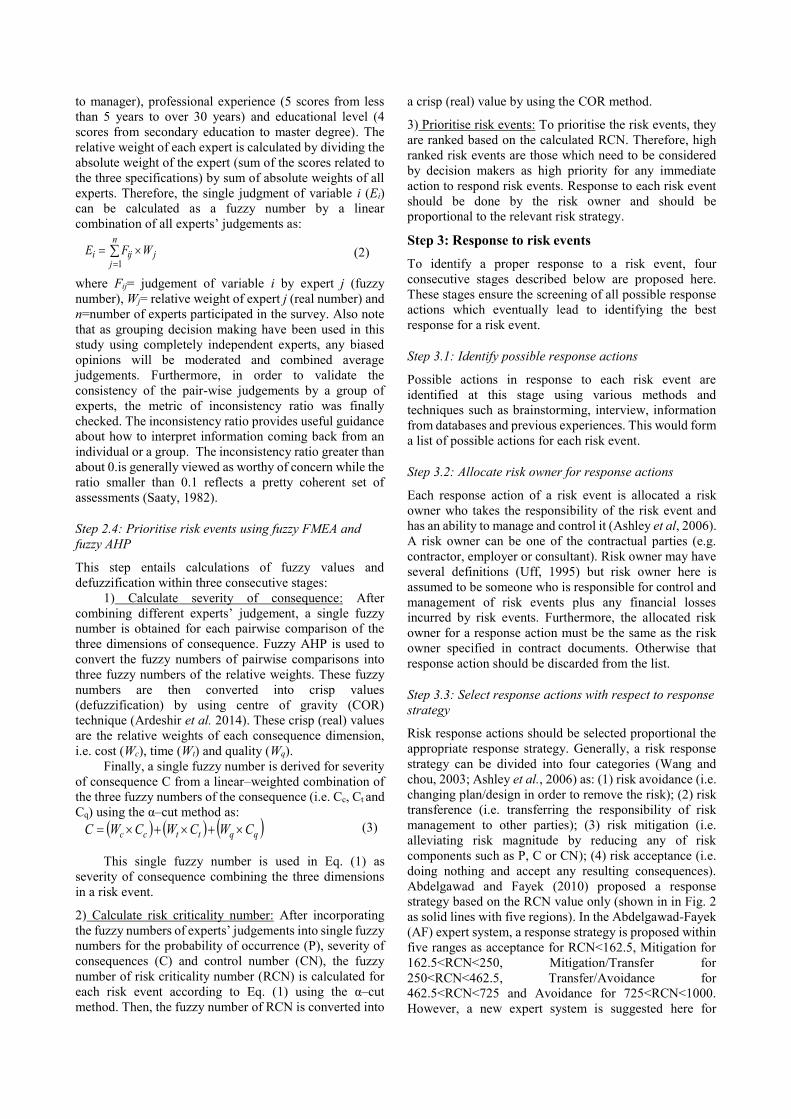
However, a new expert system is suggested here for
selecting a proper risk response strategy based on the effect
of the two components of the RCN value (i.e. control
number CN and risk factor RF) separately (shown in Fig.
2 as dashed lines with three regions). Note that the RF
value is calculated based on P and C (Cooper et al., 2005):
(4) CPRF
In this approach, a risk event with a low CN (i.e. high
control capability) such as technical problems can be
managed by using risk mitigation or risk avoidance
strategies. For handling a risk event with high CN (i.e. low
control capability) such as political issues and economic
crisis, the response strategies of risk mitigation, transfer
and avoidance can be considered (Fan et al., 2008).
Furthermore, response actions are also dependent to the RF
value. For instance, a risk event with low RF in which both
probability of occurrence and severity of consequence are
small, risk acceptance strategy can be considered (Ashley
et al., 2006). Therefore, in the suggested expert system,
risk acceptance strategy is proposed for the risk events
with RF less than 30 (region 1) whilst risk mitigation/
avoidance strategies can be considered for the risk events
with RF above 30 and control number below 4 (region 2).
Finally, risk events with RF greater than 30 and CN above
4 will be handled by risk avoidance/ transference/
mitigation strategies (region 3). Note that RF and CN
values in this figure are real (crisp) values resulted from
defuzzification of the equivalent fuzzy values. Also, as the
P and C values in Eq. (4) are within the limit of 0 and 10,
the RF value would be within 0 and 100. By comparing
these two expert systems, the following can be noted: (1)
in region 2 where risk factor is high and CN is low (high
ability of the project team to identify and handle risk), the
AF system mainly proposes the risk acceptance strategies
while the suggested system strictly rejects the risk
acceptance due to high risk factor. However, since risk
control ability is high, the suggested system adopts
mitigation strategy if the avoidance strategy cannot be
conducted. This is partially in agreement with the AF
system; (2) all three strategies including mitigation and
transfer and avoidance can be selected in both systems in
region 3; and (3) the AF system adopts partially mitigation
strategy in addition to considerable portion of acceptance
strategy in the region 1 while the suggested system always
select an acceptance strategy owing to low amount of risk
factor.
Fig. 2. Suggested expert system (dashed lines with three
regions) and Abdolgawad-Fayek (AF) expert system (solid
lines with five regions) for selection of response strategy
Step 3.4: Select the best response action/actions group
Having selected several response actions with respect to a
proper risk response strategy, the most appropriate
response action/actions group needs to be selected. This
selection is carried out based on three criteria including
cost, time and quality. To select the best response action
with respect to these criteria, the index of “scope expected
deviation” (SED) derived from TOPSIS method is used as
a MCDA technique (Seyedhosseini et al., 2009). The SED
index minimising the deviations from target values of
project is expressed as:
0
0
0
0
0
0
C
CCW
Q
QQW
T
TTWSED cqt
(5
)
where T0, Q0, C0 = target values for completion time,
quality and budget of the project, respectively; T, Q, C=
actual expected completion time, quality and cost of the
project, respectively; Wt , Wq , Wc = relative weights factor
for time, quality and cost, respectively. These relative
weights are obtained from fuzzy AHP in step 2.4. Both
expected and actual values of the criteria need to be
estimated for both risk events and response actions. For a
better estimation of these values, work breakdown
structure (WBS) of projects is used here. The following
typical six phases are considered here for WBS of highway
construction projects: (Ph1) Site acquisition and
preparation; (Ph2) Structural works; (Ph3) Cleaning, basic
earthworks; (Ph4) Paving 1 (sub-base and base layers);
(Ph5) Paving 2 (finishing layers); (Ph6) Installation of
signs, guards and line marking. Each of these phases is
allocated a relative weight. The value of each criterion
(e.g. T0 or T) is then calculated based on the combination
of the weighting-average WBS phases.
4. Case study
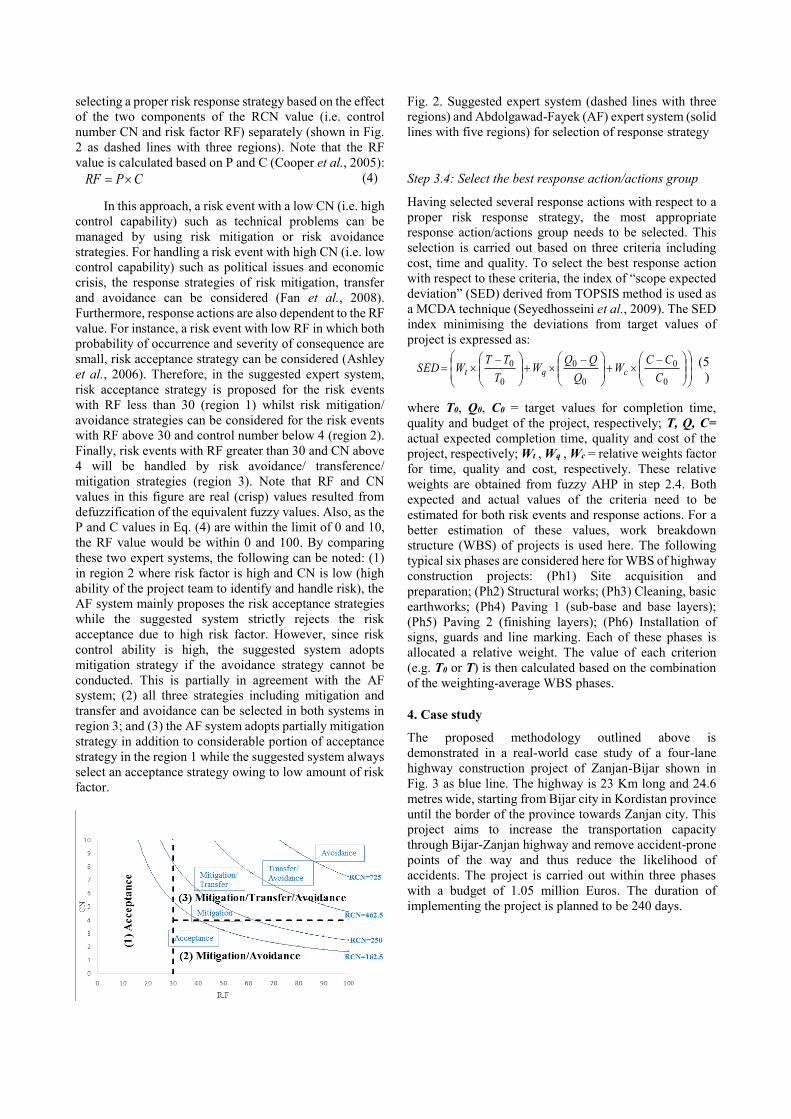
The proposed methodology outlined above is
demonstrated in a real-world case study of a four-lane
highway construction project of Zanjan-Bijar shown in
Fig. 3 as blue line. The highway is 23 Km long and 24.6
metres wide, starting from Bijar city in Kordistan province
until the border of the province towards Zanjan city. This
project aims to increase the transportation capacity
through Bijar-Zanjan highway and remove accident-prone
points of the way and thus reduce the likelihood of
accidents. The project is carried out within three phases
with a budget of 1.05 million Euros. The duration of
implementing the project is planned to be 240 days.
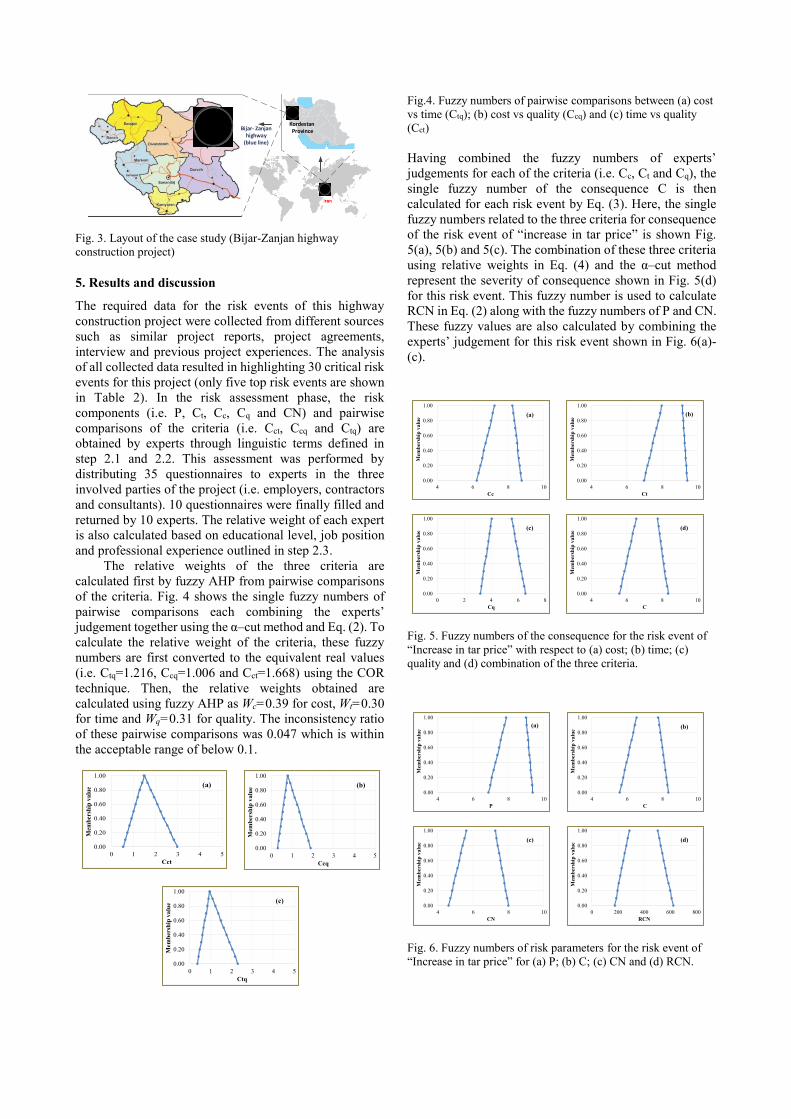
Fig. 3. Layout of the case study (Bijar-Zanjan highway
construction project)
5. Results and discussion
The required data for the risk events of this highway
construction project were collected from different sources
such as similar project reports, project agreements,
interview and previous project experiences. The analysis
of all collected data resulted in highlighting 30 critical risk
events for this project (only five top risk events are shown
in Table 2). In the risk assessment phase, the risk
components (i.e. P, Ct, Cc, Cq and CN) and pairwise
comparisons of the criteria (i.e. Cct, Ccq and Ctq) are
obtained by experts through linguistic terms defined in
step 2.1 and 2.2. This assessment was performed by
distributing 35 questionnaires to experts in the three
involved parties of the project (i.e. employers, contractors
and consultants). 10 questionnaires were finally filled and
returned by 10 experts. The relative weight of each expert
is also calculated based on educational level, job position
and professional experience outlined in step 2.3.
The relative weights of the three criteria are
calculated first by fuzzy AHP from pairwise comparisons
of the criteria. Fig. 4 shows the single fuzzy numbers of
pairwise comparisons each combining the experts’
judgement together using the α–cut method and Eq. (2). To
calculate the relative weight of the criteria, these fuzzy
numbers are first converted to the equivalent real values
(i.e. Ctq=1.216, Ccq=1.006 and Cct=1.668) using the COR
technique. Then, the relative weights obtained are
calculated using fuzzy AHP as Wc=0.39 for cost, Wt=0.30
for time and Wq=0.31 for quality. The inconsistency ratio
of these pairwise comparisons was 0.047 which is within
the acceptable range of below 0.1.
Fig.4. Fuzzy numbers of pairwise comparisons between (a) cost
vs time (Ctq); (b) cost vs quality (Ccq) and (c) time vs quality
(Cct)
Having combined the fuzzy numbers of experts’
judgements for each of the criteria (i.e. Cc, Ct and Cq), the
single fuzzy number of the consequence C is then
calculated for each risk event by Eq. (3). Here, the single
fuzzy numbers related to the three criteria for consequence
of the risk event of “increase in tar price” is shown Fig.
5(a), 5(b) and 5(c). The combination of these three criteria
using relative weights in Eq. (4) and the α–cut method
represent the severity of consequence shown in Fig. 5(d)
for this risk event. This fuzzy number is used to calculate
RCN in Eq. (2) along with the fuzzy numbers of P and CN.
These fuzzy values are also calculated by combining the
experts’ judgement for this risk event shown in Fig. 6(a)-
(c).
Fig. 5. Fuzzy numbers of the consequence for the risk event of
“Increase in tar price” with respect to (a) cost; (b) time; (c)
quality and (d) combination of the three criteria.
Fig. 6. Fuzzy numbers of risk parameters for the risk event of
“Increase in tar price” for (a) P; (b) C; (c) CN and (d) RCN.
Bijar- Zanjan highway
(blue line)
Kordestan Province
0.00
0.20
0.40
0.60
0.80
1.00
0 1 2 3 4 5
Mem
bersh
ip v
alu
e
Ccq
(b)
0.00
0.20
0.40
0.60
0.80
1.00
0 1 2 3 4 5
Mem
ber
ship
va
lue
Cct
(a)
0.00
0.20
0.40
0.60
0.80
1.00
0 1 2 3 4 5
Mem
ber
ship
va
lue
Ctq
(c)
0.00
0.20
0.40
0.60
0.80
1.00
4 6 8 10
Mem
ber
ship
va
lue
Cc
(a)
0.00
0.20
0.40
0.60
0.80
1.00
4 6 8 10
Mem
ber
ship
va
lue
Ct
(b)
0.00
0.20
0.40
0.60
0.80
1.00
0 2 4 6 8
Mem
ber
ship
va
lue
Cq
(c)
0.00
0.20
0.40
0.60
0.80
1.00
4 6 8 10
Mem
ber
ship
va
lue
C
(d)
0.00
0.20
0.40
0.60
0.80
1.00
4 6 8 10
Mem
ber
ship
va
lue
P
(a)
0.00
0.20
0.40
0.60
0.80
1.00
4 6 8 10
Mem
ber
ship
va
lue
C
(b)
0.00
0.20
0.40
0.60
0.80
1.00
4 6 8 10
Mem
ber
ship
va
lue
CN
(c)
0.00
0.20
0.40
0.60
0.80
1.00
0 200 400 600 800
Mem
ber
ship
va
lue
RCN
(d)
By multiplying three fuzzy numbers of P, C and CN
in Eq. (2) and using the α–cut method, the fuzzy number
of RCN is calculated for this risk event which is shown in
Fig. 6(d). The real value of RCN for this risk event after
defuzzification is equal to 396. Thus, the analysed 30 risk
events are ranked based on the RCN values. Here, the list
of the top five highly ranked risk events are only shown in
Table 2. This list in the descending order of RCN presents
prioritised risk events as a guide for key decision makers
of the project to follow the appropriate actions.
Table 2. Top five risk events in the highway construction
project in the descending order of RCN
Risk
allocation RCN Risk event No
contractor 463 Budget deficit or insufficient
allocation of budget 1
employer 429 Lack of timely budget allocation 2
employer 396 Increase in tar price 3
Contractor
&
employer
363
Financial problems of the
contractor and inability to
provide enough self-fund
between payment intervals
4
employer 355 Unexpected increase in price of
materials (except tar), fuel and
labours wage
5
As a result of the third step of risk management, a list
of all possible response actions proportional to the proper
risk response strategy and risk allocation is provided for all
risk events (not shown here due to limited space). In order
to describe how the best response action is selected, the
risk event of “increase in tar price” is analysed here in
further details as a critical risk in road construction projects
in Iran. This risk event is ranked third in Table 2 with
RCN=396, RF=59 and CN=6.35. Table 3 presents four
suggested possible response actions and the relevant risk
allocation and strategy type for this risk event. According
to the contractual documents, the employer is the risk
owner of this risk event and is responsible for any
additional costs incurred for tar during the project.
Therefore, the first three response actions in the Table
remains and the forth is discarded. The appropriate risk
response strategy with respect to the values of CN and RF
in Fig. 2 does not include the risk acceptance. Therefore,
the third response action in Table 3 removes and only the
first two response actions remain for final selection.
Table 3. Possible response actions to the risk event of “increase
in tar price”
Response action description Strategy
type
Risk
allocation
Creating a saving budget box of the
project for unexpected costs
incurred by inflation in tar prices
mitigation employer
Changing design of pavement
construction technology from
asphalt concrete to Roller-
avoidance employer
Compacted Concrete (RCC) for
removing tar in pavement
Paying additional costs incurred by
inflation in tar prices based on daily
tar prices
acceptance employer
Ordering for tar purchase a few
months in advance mitigation contractor
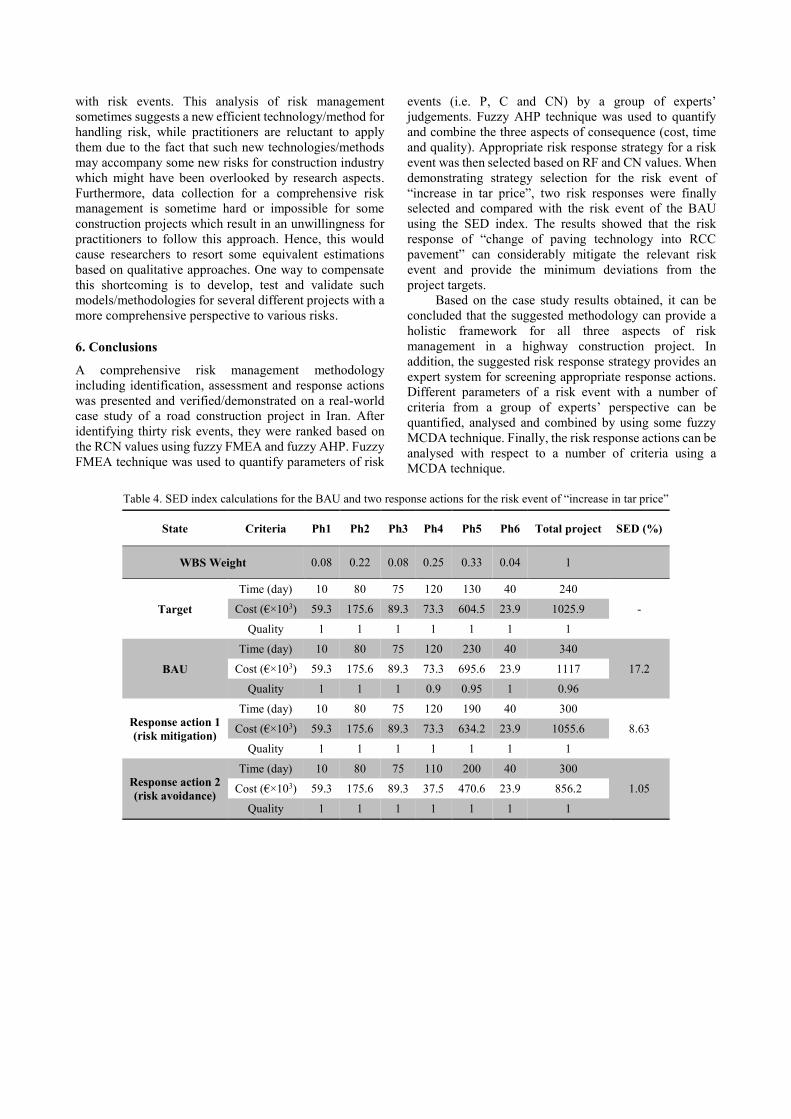
To select the best response action, the SED index of
this risk event for the business-as-usual (BAU) state and
the two remaining response actions is calculated using Eq.
(5) based on the six WBS phases outlined in step 3.4. The
target values of the criteria (costs, time and quality) for
each WBS phase are extracted from the available
contractual documents given in Table 4. The similar
parameters for actual expected values in the BAU and
response action 1 are estimated by using interview and
previous reports and experiences (see Table 4). Note that
the actual quality is estimated based on the relative actual
quality with respect to the target quality (Q0) which is
equal to 1. Thus, the actual quality (Q’) would be within
the range of [0.1].
Actual expected values for cost and time for response
action 2, “using Roller-Compacted Concrete (RCC)”, is
estimated based on a typical design (Abdul and ASI,
1995). The time required for implementing a RCC
pavement is around 15 percent longer than asphalt
concrete pavement due to concrete curing process.
However the costs of RCC pavement is almost 25 percent
less than of asphalt concrete pavement. Therefore, the cost
of designed asphalt concrete pavement is used for the BAU
and the response action and the cost of a typical equivalent
RCC pavement is used for response action 2 in Table 4.
Table 4 represents the detailed calculations of SED
index for this risk event. As it can be seen from this Table,
SED obtained from the risk event in the BAU (i.e. 17.2%)
can successfully be reduced by the two response actions.
More specifically, response action 2 (RCC technology)
seems to have a better response as it could almost approach
the actual expected criteria to the target values
(SED=1.05%). In addition, other benefits of this
technology compared with asphalt concrete pavement
method are minor maintenance costs, more life time
expectancy, more environmentally friendly due to less
material used in pavement layers and less contaminant
production. Despite of these benefits, some weak points
are also attributed to this technology such as less
experience and technical knowledge of contractors and
thus need more advanced machinery and certain technical
skills and experiences which make the use application of
this method more complicated.
This suggested framework demonstrated in this paper
provides a comprehensive risk management methodology.
However, there might exist some reasons that construction
industry is reluctant to adopt such computational models.
The following can be noted in this regard: one of the main
limitations is probably the complexity of the decision
support/expert systems which require enough knowledge
and understanding for handling risk by practitioners in the
construction industry. Instead, practitioners usually prefer
to rely on their own professional experience for dealing
with risk events. This analysis of risk management
sometimes suggests a new efficient technology/method for
handling risk, while practitioners are reluctant to apply
them due to the fact that such new technologies/methods
may accompany some new risks for construction industry
which might have been overlooked by research aspects.
Furthermore, data collection for a comprehensive risk
management is sometime hard or impossible for some
construction projects which result in an unwillingness for
practitioners to follow this approach. Hence, this would
cause researchers to resort some equivalent estimations
based on qualitative approaches. One way to compensate
this shortcoming is to develop, test and validate such
models/methodologies for several different projects with a
more comprehensive perspective to various risks.
6. Conclusions
A comprehensive risk management methodology
including identification, assessment and response actions
was presented and verified/demonstrated on a real-world
case study of a road construction project in Iran. After
identifying thirty risk events, they were ranked based on
the RCN values using fuzzy FMEA and fuzzy AHP. Fuzzy
FMEA technique was used to quantify parameters of risk
events (i.e. P, C and CN) by a group of experts’
judgements. Fuzzy AHP technique was used to quantify
and combine the three aspects of consequence (cost, time
and quality). Appropriate risk response strategy for a risk
event was then selected based on RF and CN values. When
demonstrating strategy selection for the risk event of
“increase in tar price”, two risk responses were finally
selected and compared with the risk event of the BAU
using the SED index. The results showed that the risk
response of “change of paving technology into RCC
pavement” can considerably mitigate the relevant risk
event and provide the minimum deviations from the
project targets.
Based on the case study results obtained, it can be
concluded that the suggested methodology can provide a
holistic framework for all three aspects of risk
management in a highway construction project. In
addition, the suggested risk response strategy provides an
expert system for screening appropriate response actions.
Different parameters of a risk event with a number of
criteria from a group of experts’ perspective can be
quantified, analysed and combined by using some fuzzy
MCDA technique. Finally, the risk response actions can be
analysed with respect to a number of criteria using a
MCDA technique.
Table 4. SED index calculations for the BAU and two response actions for the risk event of “increase in tar price”
State Criteria Ph1 Ph2 Ph3 Ph4 Ph5 Ph6 Total project SED (%)
WBS Weight 0.08 0.22 0.08 0.25 0.33 0.04 1
Target
Time (day) 10 80 75 120 130 40 240
- Cost (€×103) 59.3 175.6 89.3 73.3 604.5 23.9 1025.9
Quality 1 1 1 1 1 1 1
BAU
Time (day) 10 80 75 120 230 40 340
17.2 Cost (€×103) 59.3 175.6 89.3 73.3 695.6 23.9 1117
Quality 1 1 1 0.9 0.95 1 0.96
Response action 1
(risk mitigation)
Time (day) 10 80 75 120 190 40 300
8.63 Cost (€×103) 59.3 175.6 89.3 73.3 634.2 23.9 1055.6
Quality 1 1 1 1 1 1 1
Response action 2
(risk avoidance)
Time (day) 10 80 75 110 200 40 300
1.05 Cost (€×103) 59.3 175.6 89.3 37.5 470.6 23.9 856.2
Quality 1 1 1 1 1 1 1
One of the limitations of the proposed methodology is that it
is useful if only one contract party is identified as the risk
owner. However, if a risk event is shared between more than
one party, risk allocation percentage to each involved party
and their cooperative response actions can be divided through
“cooperative game theory”. This needs to be investigated in
the future research work. Also, when responding to a risk
event, some secondary risk events may be generated which
need to be considered in the future researches. In addition, the
impact of two simultaneous response actions or more for a
risk event needs to be analysed in the future.
References
Abdelgawad, M.; Fayek, A. 2010. Risk Management in the
Construction Industry Using Combined Fuzzy FMEA and
Fuzzy AHP, Journal of Construction Engineering and
Management, 136(9): 1028-1036.
Abdelgawad, M.; Fayek, A. 2011. Fuzzy Reliability Analyzer:
Quantitative Assessment of Risk Events in the
Construction Industry Using Fuzzy Fault-Tree Analysis,
Journal of Construction Engineering and Management,
137( 4): 294-302.
Abdul Wahhab, h.i.; ASI, I.M. 1995. Optimization of Roller
Compacted Concrete for Local Application, Transportation
Research Record 1458.
Ardeshir, A.; Mohseni, N.; Behzadian, K.; Errington, M. 2014.
Selection of a Bridge Construction Site Using Fuzzy
Analytical Hierarchy Process in Geographic Information
System. Arabian Journal for Science and Engineering, 1-
16.
Ashley, D.B.; Diekmann, J.E.; Molenaar, K.R. 2006. Guide to
Risk Assessment and Allocation for Highway Construction
Management, Federal Highway Administration, US
Department of Transportation, Report No. FHWA-PL-06-
032, october 2006. Carbone, T.D.; Tippett, D.D. 2004. Project Risk Management
Using the Project Risk FMEA, Engineering Management
Journal, 14(4): 28-35.
Cooper, D.F.; Grey S.,Raymond G.; Walker, P. 2005. Project
Risk Management Guidelines: Managing Risk in Large
Projects and Complex Procurements, Wiley.
Creedy, G., Skitmore, M. and Wong, J. 2010. “Evaluation of Risk
Factors Leading to Cost Overrun in Delivery of Highway
Construction Projects”, Journal of Construction
Engineering and Management, 136(5), p.p. 528-537, 2010.
Diab, M.F.; Varma, A.; Nassar, K. 2012. Using Risk Assessment
to Improve Highway Construction Project Performance,
48th ASC Annual International Conference
Proceedings2012, Birmingham City University,
Birmingham, UK, 2012. Fan, M., Lin N.P.; Sheu, C. 2008. Choosing a project risk-
handling strategy: An analytical model, International
Journal of Production Economics, 112(2): 700-713.
Jazebi, F.; Rashidi A. 2013. An automated procedure for
selecting project managers in construction firms, Journal
of Civil Engineering and Management, 19(1): 97-106.
Jouandou, R. 2010. Dealing with uncertainty: selecting a risk
analysis tool on the basic project characteristics and
phases. Master Thesis, Department of Civil,
Environmental and Architectural Engineering. University
of Colorado.
Mahamid, I. 2011. Risk matrix for factors affecting time delay in
road construction projects: owner’s perspective.
Engineering, Construction and Architectural, 18(6): 609 –
617.
Maher, M.L.J.; Smith, A.D. 2006. Risk-based cost and schedule
estimation for large transportation projects, Annual
European Transport Conference, Strasbourg, France,
2006.
Nassar, K., Nassar, W. and Hegab, M., 2005. “Evaluating Cost
Overruns of Asphalt Paving Project Using Statistical
Process Control Methods”, Journal of Construction
Engineering and Management, 131(11), p.p. 1173-1178.
Nývlt, O.; Prívara S.; Ferkl, L. 2011. Probabilistic risk
assessment of highway tunnels, Tunnelling and
Underground Space Technology, 26(6): 71-82.
Perera, B.A.K.S.; Dhanasinghe, I.; Rameezdeen, R. 2009. Risk
management in road construction: The case of Sri Lanka,
International Journal of Strategic Property Management,
13(2): 87-102.
Project Management Institute (PMI) 2008, “A Guide to the
Project Management Body of Knowledge: PMBOK
Guide”. Rashidi, A.; Jazebi F.; Brilakis I. 2010. Neurofuzzy genetic
system for selection of construction project managers,
Journal of Construction Engineering and Management,
137(1): 17-29.
Saaty, T. L. 1982. Decision making for leaders: The analytical
hierarchy process for decision in a complex world.
Lifetime Learning, Belmont. Calif. 75–92.
Sant'Anna, A.P. 2012. Probabilistic priority numbers for failure
modes and effects Analysis, International Journal of
Quality & Reliability Management, 29(3): 349-362.
Seyedhosseini, S.M.; Noori, S.; Hatefi, M.A. 2009. An Integrated
Methodology for Assessment and Selection of the Project
Risk Response Actions, Risk Analysis, 29(5): 752-763.
Torfi, F.; Rashidi A. 2011. Selection of project managers in
construction Firms using analytic hierarchy process (AHP)
and fuzzy Topsis: a case study, Journal of Construction in
Developing Countries, 16(1): 69-89.
Uff, J. 1995. Management and Procurement in Construction,
London, Centre of Construction Law and Management.
U.S. Department of Defence 1980. Procedures for performing a
failure mode effects and criticality analysis, MILSTD-
1929A: Military standard, Washington, D.C.
Wang, M.; Chou, H. 2003. Risk Allocation and Risk Handling of
Highway Projects in Taiwan, Journal of Management in
Engineering, 19(2): 60-68.
Wilson, C.R. and Molenaar,K.R., 2009 “A Risk-Based Approach
to Contingency Estimation in Highway Project
Development”, Construction Research Congress, p.p. 786-
795, 2009.
Zavadskas, E. K., Turskis, Z., & Tamošaitiene, J. 2010. Risk
assessment of construction projects. Journal of civil
engineering and management, 16(1), 33-46.
Zayed, T.; Amer, M.; Pan, J. 2008. Assessing risk and uncertainty
inherent in Chinese highway projects using AHP,
International Journal of Project Management, 26(4): 408-
419.
Appendix I
List of acronyms used in this paper

MCDA Multi-Criteria decision analysis
FMEA Failure mode and effect analysis
AHP analytic hierarchy process
R.F Risk factor
CN Control number
P probability
C consequence
Cc Cost consequence
Ct Time consequence
Cq Quality consequence
RCN Risk critical number
SED scope expected deviation
RCC Roller-compacted concrete
BAU business-as-usual
WBS Work break down structure


![Using Fuzzy FMEA Approach to Improve Decision-Making ...ijiepr.iust.ac.ir/article-1-835-en.pdf[10] considered FMEA in Amhara Pipe Factory P.L.C., Bahir Dar, and Ethiopia. Three key](https://img.pdfslide.us/doc/110x75/5e9f9a8c3b06ea576c5b946b/using-fuzzy-fmea-approach-to-improve-decision-making-10-considered-fmea-in.jpg)