Embed Size (px)
Citation preview
Michigan Farms CNMP Aug. 2003 1
Comprehensive Nutrient Management Plan Example
As generated by the Michigan CNMP Template
For
Training Dairy 123 Road
Somewhere, MI
County:
Driving directions to the farm from nearest town.
NOTE TO USER: This is not a mandatory document. This is the type of information that is needed in a CNMP and using MMP software can help you achieve this information. You may also generate similar
information by other methods if you choose The tables in this document have been generated from the Purdue MMP software, via the Michigan
CNMP Template, both available free, at www.maeap.org
Date Printed: January 2005
PLAN PROVIDER Name: Address: Phone: Email:
Michigan Farms CNMP Aug. 2003 2
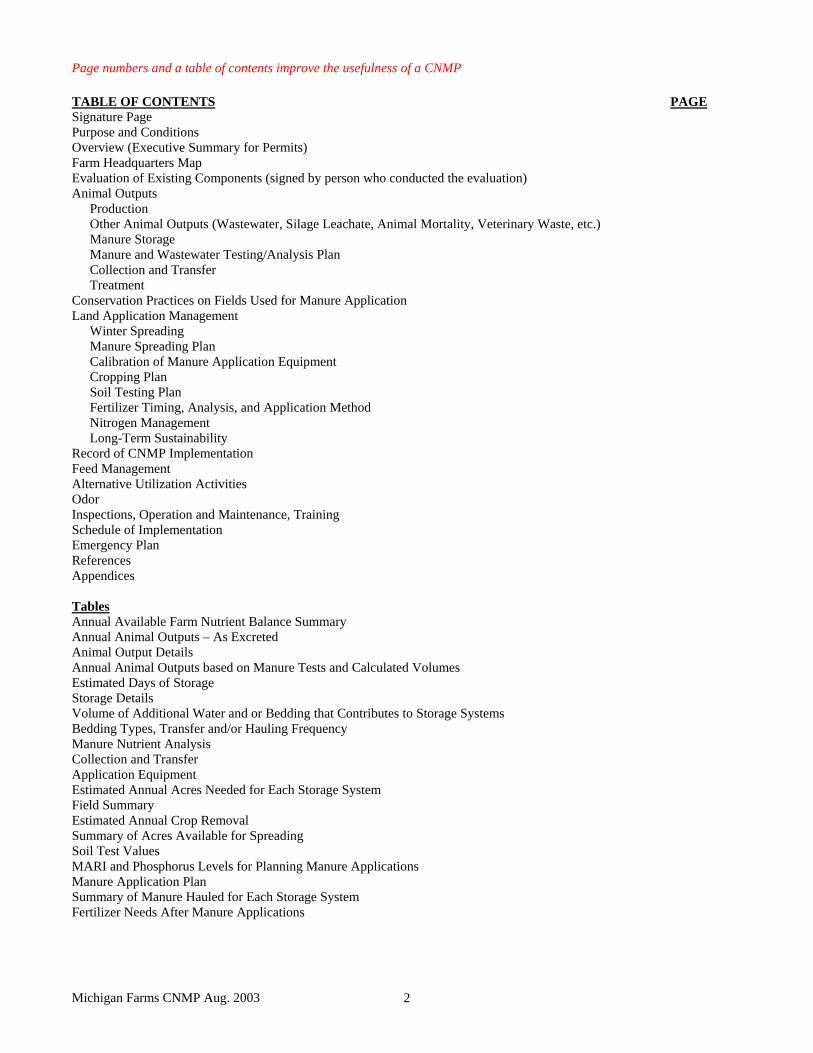
Page numbers and a table of contents improve the usefulness of a CNMP TABLE OF CONTENTS PAGE Signature Page Purpose and Conditions Overview (Executive Summary for Permits) Farm Headquarters Map Evaluation of Existing Components (signed by person who conducted the evaluation) Animal Outputs Production Other Animal Outputs (Wastewater, Silage Leachate, Animal Mortality, Veterinary Waste, etc.) Manure Storage Manure and Wastewater Testing/Analysis Plan Collection and Transfer Treatment Conservation Practices on Fields Used for Manure Application Land Application Management Winter Spreading Manure Spreading Plan Calibration of Manure Application Equipment Cropping Plan Soil Testing Plan Fertilizer Timing, Analysis, and Application Method Nitrogen Management Long-Term Sustainability Record of CNMP Implementation Feed Management Alternative Utilization Activities Odor Inspections, Operation and Maintenance, Training Schedule of Implementation Emergency Plan References Appendices Tables Annual Available Farm Nutrient Balance Summary Annual Animal Outputs – As Excreted Animal Output Details Annual Animal Outputs based on Manure Tests and Calculated Volumes Estimated Days of Storage Storage Details Volume of Additional Water and or Bedding that Contributes to Storage Systems Bedding Types, Transfer and/or Hauling Frequency Manure Nutrient Analysis Collection and Transfer Application Equipment Estimated Annual Acres Needed for Each Storage System Field Summary Estimated Annual Crop Removal Summary of Acres Available for Spreading Soil Test Values MARI and Phosphorus Levels for Planning Manure Applications Manure Application Plan Summary of Manure Hauled for Each Storage System Fertilizer Needs After Manure Applications
Michigan Farms CNMP Aug. 2003 3
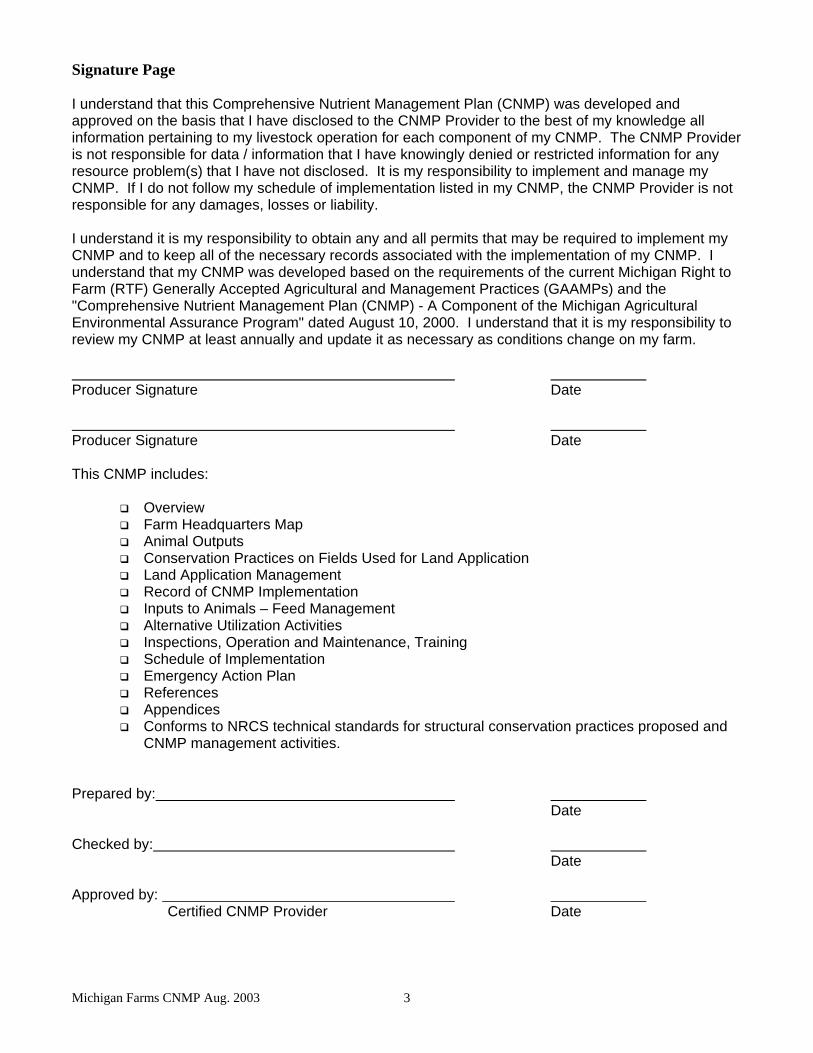
Signature Page I understand that this Comprehensive Nutrient Management Plan (CNMP) was developed and approved on the basis that I have disclosed to the CNMP Provider to the best of my knowledge all information pertaining to my livestock operation for each component of my CNMP. The CNMP Provider is not responsible for data / information that I have knowingly denied or restricted information for any resource problem(s) that I have not disclosed. It is my responsibility to implement and manage my CNMP. If I do not follow my schedule of implementation listed in my CNMP, the CNMP Provider is not responsible for any damages, losses or liability. I understand it is my responsibility to obtain any and all permits that may be required to implement my CNMP and to keep all of the necessary records associated with the implementation of my CNMP. I understand that my CNMP was developed based on the requirements of the current Michigan Right to Farm (RTF) Generally Accepted Agricultural and Management Practices (GAAMPs) and the "Comprehensive Nutrient Management Plan (CNMP) - A Component of the Michigan Agricultural Environmental Assurance Program" dated August 10, 2000. I understand that it is my responsibility to review my CNMP at least annually and update it as necessary as conditions change on my farm. Producer Signature Date Producer Signature Date This CNMP includes:
Overview Farm Headquarters Map Animal Outputs Conservation Practices on Fields Used for Land Application Land Application Management Record of CNMP Implementation Inputs to Animals – Feed Management Alternative Utilization Activities Inspections, Operation and Maintenance, Training Schedule of Implementation Emergency Action Plan References Appendices Conforms to NRCS technical standards for structural conservation practices proposed and
CNMP management activities.
Prepared by: Date Checked by: Date Approved by: Certified CNMP Provider Date
Michigan Farms CNMP Aug. 2003 4
Purpose A Comprehensive Nutrient Management Plan (CNMP) describes the production practices, equipment, and structure(s) that the owner/operator of an agricultural operation now uses and/or will implement to sustain livestock and/or crop production in a manner that is both environmentally and economically sound. It combines conservation practices and management activities into a system that addresses animal production operations from feed inputs through the use of animal manure and other organic by-products. The CNMP is a planning tool as well as a record of decisions in that it details the activities that the landowner/operator implements. It also documents all the land (cropland, facilities, etc.), which the landowner/operator owns or has decision-making authority over, on which manure or organic by-products will be generated, handled or applied. The CNMP will help the operator in complying with the Generally Accepted Agricultural and Management Practices (GAAMPs) developed and adopted under the Michigan Right to Farm Act, including the GAAMPs for Manure Management and Utilization, and Site Selection and Odor Control for New and Expanding Livestock Production Facilities. In addition, the CNMP conforms to USDA Natural Resources Conservation Service (NRCS) Technical Guidance for developing CNMPs which includes meeting NRCS technical standards for structural conservation practices proposed and all management activities in the CNMP. Conditions State if this CNMP is meeting a Permit requirement, MDA complaint, under DEQ order, seeking MAEAP verification and or NRCS EQIP financial assistance funds. This CNMP will need to be recertified by a Certified CNMP Provider at least once every three years, for MAEAP re-verification by the Michigan Dept. of Agriculture. This CNMP needs to be updated annually. This CNMP needs to be updated and recertified by a Certified CNMP Provider prior to any of the following circumstances occurring:
1. An increase in the number of animal units that is greater than or equal to 10% of the number identified in the CNMP
2. An increase in the number of animal units that results in a decrease of manure storage capacity time by one month or more.
3. An increase in the number of animal units where the manure generated by the livestock requires more land for its application than is available at the time of the increase
4. A decrease in the number of acres available for land application, where the manure/wastewater generated requires more land for its application than will be available after the decrease.
Michigan Farms CNMP Aug. 2003 5
Overview (Executive Summary needed for Permit) Pertinent points to list in the Overview (just list briefly, discuss items later in plan). • County, township and section number of farm, if not on the front page • Briefly describe the farming operation, including enterprises, type of operation, number of livestock, animal units. • Total acres and acres available for manure application, amount owned or rented • Unique points that are highly relevant to the manure management of the farm such as no-till, inject or surface spread,
winter spreading needed, irrigation of manure or just water, prevalence of tile drains etc. Sometimes it is important to list what they don’t have (no outdoor lots, no outdoor storage, no surface waters on farm, etc.)
• Indicate if it is a new, existing or expanding production facility. • The type, size and general construction of the facility and of manure storage system(s), examples: total confinement,
outdoor storage, earthen or prefab storages, general length of storage. • Identify water quality or resource concerns specific to this farm (runoff to surface waters, groundwater, odor). • If plan is needed to satisfy a Right to Farm, DEQ issue, or is seeking EQIP funds through NRCS, please state how the
plan addresses these concerns.
Michigan Farms CNMP Aug. 2003 6
Map of the Farm Headquarters Buildings and other structural features should be labeled and those names used consistently throughout the CNMP. Often, several maps are useful, such as a larger map showing the relationship of fields and farmsteads to each other and a close up map showing the following items: • North arrow and prevailing wind direction • Location of all buildings including livestock, machine storage, feed, fuel, chemical, fertilizer storage, etc. • Roads and other location references • Farm house(s) and other pertinent physical features • Animal housing, outdoor lots, livestock travel lanes • Manure storage structures • Other sources of manure and wastewater such as silage bunkers, etc. • Map all wells and give the distance, in feet, to all manure storage systems within 800’ of well • Surface waters • Direction of slope around farmstead indicating direction of runoff • County, township and section numbers.
Evaluation of Existing Components Letter Existing components may be included as part of a CNMP only if all of the following conditions are met: 1. The existing component is consistent with the safety guidance of the CNMP. 2. An investigation of the existing component indicates it is consistent with sound engineering practices. 3. The failure of the existing component will not impair the structural integrity or operation of new components. 4. The existing component is in good operating condition. 5. The existing component can be managed as part of the CNMP. Refer to the MAEAP website for “CNMP Answers to Frequently Asked Questions” for more information on what is needed to document and evaluate existing components of a livestock facility. This should be signed by the person who conducted the evaluation.
Michigan Farms CNMP Aug. 2003 7
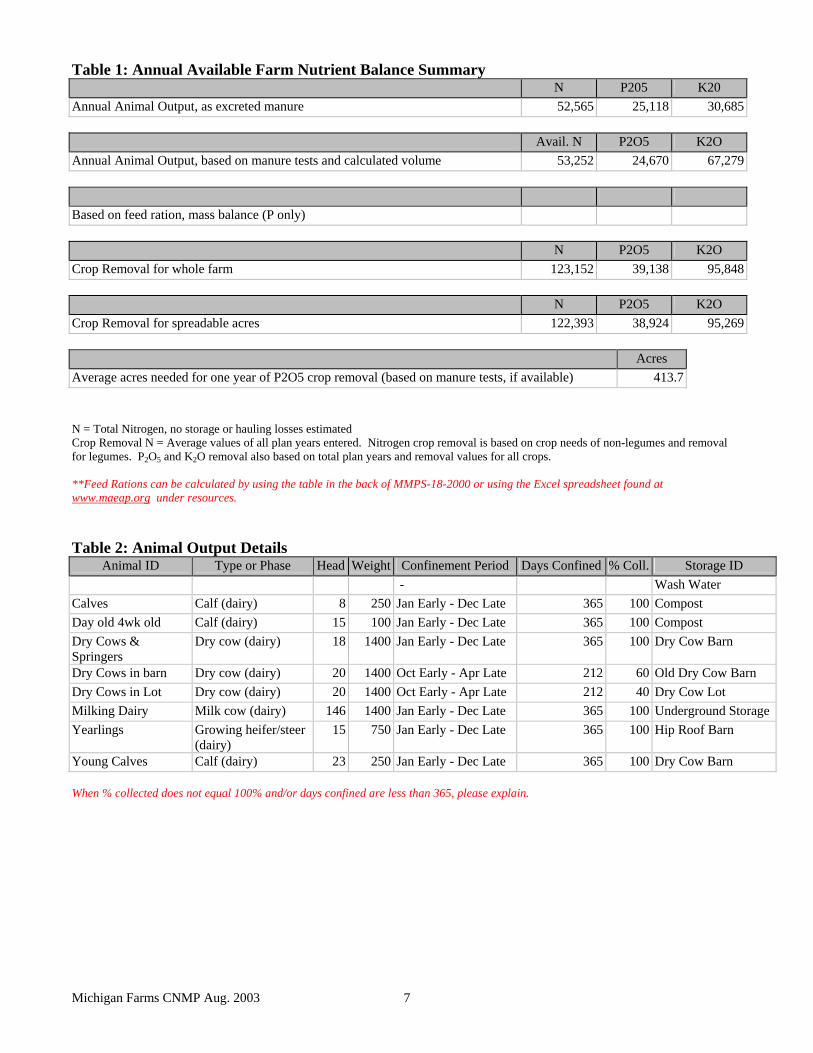
Table 1: Annual Available Farm Nutrient Balance Summary N P205 K20
Annual Animal Output, as excreted manure 52,565 25,118 30,685
Avail. N P2O5 K2O Annual Animal Output, based on manure tests and calculated volume 53,252 24,670 67,279
Based on feed ration, mass balance (P only)
N P2O5 K2O Crop Removal for whole farm 123,152 39,138 95,848
N P2O5 K2O Crop Removal for spreadable acres 122,393 38,924 95,269
Acres Average acres needed for one year of P2O5 crop removal (based on manure tests, if available) 413.7 N = Total Nitrogen, no storage or hauling losses estimated Crop Removal N = Average values of all plan years entered. Nitrogen crop removal is based on crop needs of non-legumes and removal for legumes. P2O5 and K2O removal also based on total plan years and removal values for all crops. **Feed Rations can be calculated by using the table in the back of MMPS-18-2000 or using the Excel spreadsheet found at www.maeap.org under resources. Table 2: Animal Output Details
Animal ID Type or Phase Head Weight Confinement Period Days Confined % Coll. Storage ID - Wash Water Calves Calf (dairy) 8 250 Jan Early - Dec Late 365 100 Compost Day old 4wk old Calf (dairy) 15 100 Jan Early - Dec Late 365 100 Compost Dry Cows & Springers
Dry cow (dairy) 18 1400 Jan Early - Dec Late 365 100 Dry Cow Barn
Dry Cows in barn Dry cow (dairy) 20 1400 Oct Early - Apr Late 212 60 Old Dry Cow Barn Dry Cows in Lot Dry cow (dairy) 20 1400 Oct Early - Apr Late 212 40 Dry Cow Lot Milking Dairy Milk cow (dairy) 146 1400 Jan Early - Dec Late 365 100 Underground StorageYearlings Growing heifer/steer
(dairy) 15 750 Jan Early - Dec Late 365 100 Hip Roof Barn
Young Calves Calf (dairy) 23 250 Jan Early - Dec Late 365 100 Dry Cow Barn When % collected does not equal 100% and/or days confined are less than 365, please explain.
Michigan Farms CNMP Aug. 2003 8
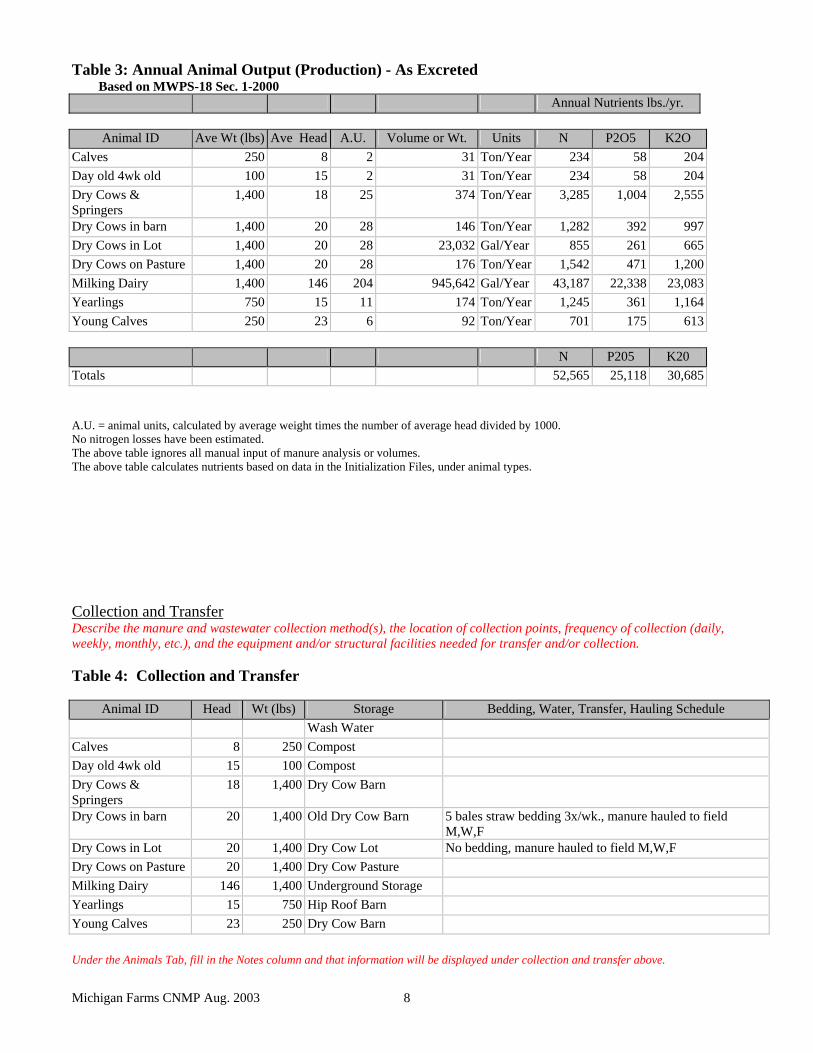
Table 3: Annual Animal Output (Production) - As Excreted Based on MWPS-18 Sec. 1-2000
Annual Nutrients lbs./yr.
Animal ID Ave Wt (lbs) Ave Head A.U. Volume or Wt. Units N P2O5 K2O Calves 250 8 2 31 Ton/Year 234 58 204Day old 4wk old 100 15 2 31 Ton/Year 234 58 204Dry Cows & Springers
1,400 18 25 374 Ton/Year 3,285 1,004 2,555
Dry Cows in barn 1,400 20 28 146 Ton/Year 1,282 392 997Dry Cows in Lot 1,400 20 28 23,032 Gal/Year 855 261 665Dry Cows on Pasture 1,400 20 28 176 Ton/Year 1,542 471 1,200Milking Dairy 1,400 146 204 945,642 Gal/Year 43,187 22,338 23,083Yearlings 750 15 11 174 Ton/Year 1,245 361 1,164Young Calves 250 23 6 92 Ton/Year 701 175 613
N P205 K20 Totals 52,565 25,118 30,685 A.U. = animal units, calculated by average weight times the number of average head divided by 1000. No nitrogen losses have been estimated. The above table ignores all manual input of manure analysis or volumes. The above table calculates nutrients based on data in the Initialization Files, under animal types. Collection and Transfer Describe the manure and wastewater collection method(s), the location of collection points, frequency of collection (daily, weekly, monthly, etc.), and the equipment and/or structural facilities needed for transfer and/or collection. Table 4: Collection and Transfer
Animal ID Head Wt (lbs) Storage Bedding, Water, Transfer, Hauling Schedule Wash Water Calves 8 250 Compost Day old 4wk old 15 100 Compost Dry Cows & Springers
18 1,400 Dry Cow Barn
Dry Cows in barn 20 1,400 Old Dry Cow Barn 5 bales straw bedding 3x/wk., manure hauled to field M,W,F
Dry Cows in Lot 20 1,400 Dry Cow Lot No bedding, manure hauled to field M,W,F Dry Cows on Pasture 20 1,400 Dry Cow Pasture Milking Dairy 146 1,400 Underground Storage Yearlings 15 750 Hip Roof Barn Young Calves 23 250 Dry Cow Barn Under the Animals Tab, fill in the Notes column and that information will be displayed under collection and transfer above.

Michigan Farms CNMP Aug. 2003 9
Michigan Farms CNMP Aug. 2003 10
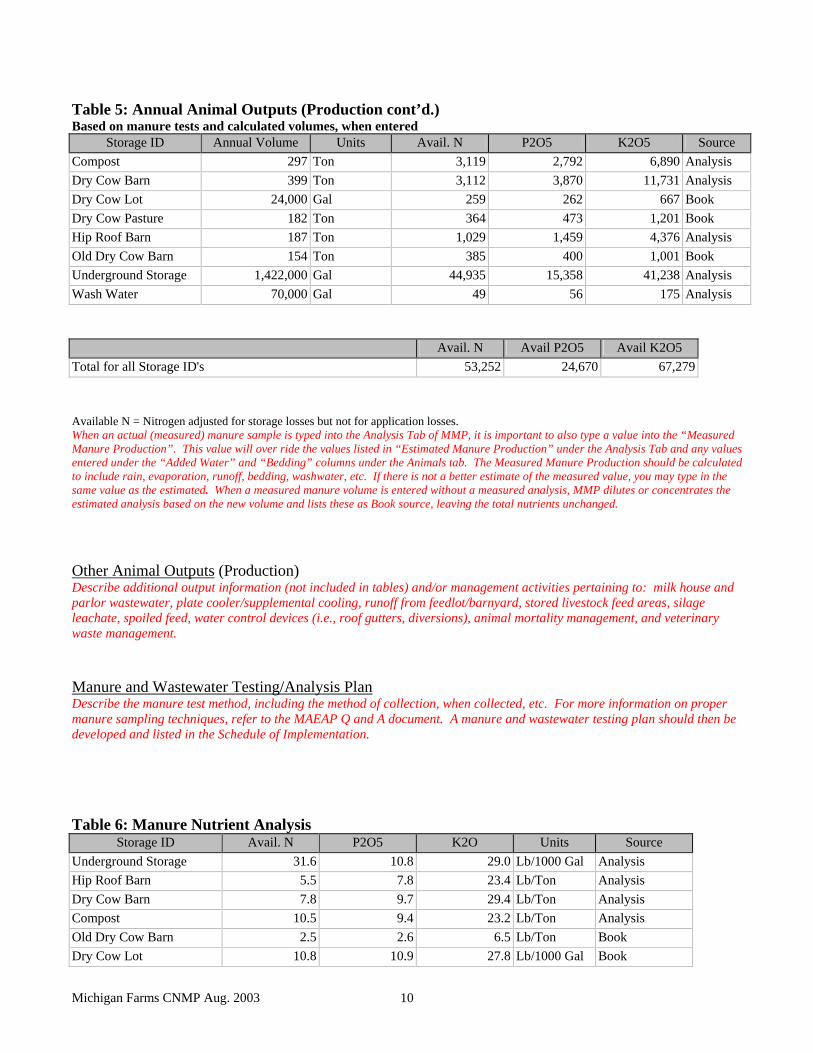
Table 5: Annual Animal Outputs (Production cont’d.) Based on manure tests and calculated volumes, when entered
Storage ID Annual Volume Units Avail. N P2O5 K2O5 Source Compost 297 Ton 3,119 2,792 6,890 Analysis Dry Cow Barn 399 Ton 3,112 3,870 11,731 Analysis Dry Cow Lot 24,000 Gal 259 262 667 Book Dry Cow Pasture 182 Ton 364 473 1,201 Book Hip Roof Barn 187 Ton 1,029 1,459 4,376 Analysis Old Dry Cow Barn 154 Ton 385 400 1,001 Book Underground Storage 1,422,000 Gal 44,935 15,358 41,238 Analysis Wash Water 70,000 Gal 49 56 175 Analysis
Avail. N Avail P2O5 Avail K2O5 Total for all Storage ID's 53,252 24,670 67,279 Available N = Nitrogen adjusted for storage losses but not for application losses. When an actual (measured) manure sample is typed into the Analysis Tab of MMP, it is important to also type a value into the “Measured Manure Production”. This value will over ride the values listed in “Estimated Manure Production” under the Analysis Tab and any values entered under the “Added Water” and “Bedding” columns under the Animals tab. The Measured Manure Production should be calculated to include rain, evaporation, runoff, bedding, washwater, etc. If there is not a better estimate of the measured value, you may type in the same value as the estimated. When a measured manure volume is entered without a measured analysis, MMP dilutes or concentrates the estimated analysis based on the new volume and lists these as Book source, leaving the total nutrients unchanged. Other Animal Outputs (Production) Describe additional output information (not included in tables) and/or management activities pertaining to: milk house and parlor wastewater, plate cooler/supplemental cooling, runoff from feedlot/barnyard, stored livestock feed areas, silage leachate, spoiled feed, water control devices (i.e., roof gutters, diversions), animal mortality management, and veterinary waste management. Manure and Wastewater Testing/Analysis Plan Describe the manure test method, including the method of collection, when collected, etc. For more information on proper manure sampling techniques, refer to the MAEAP Q and A document. A manure and wastewater testing plan should then be developed and listed in the Schedule of Implementation. Table 6: Manure Nutrient Analysis
Storage ID Avail. N P2O5 K2O Units Source Underground Storage 31.6 10.8 29.0 Lb/1000 Gal Analysis Hip Roof Barn 5.5 7.8 23.4 Lb/Ton Analysis Dry Cow Barn 7.8 9.7 29.4 Lb/Ton Analysis Compost 10.5 9.4 23.2 Lb/Ton Analysis Old Dry Cow Barn 2.5 2.6 6.5 Lb/Ton Book Dry Cow Lot 10.8 10.9 27.8 Lb/1000 Gal Book
Michigan Farms CNMP Aug. 2003 11
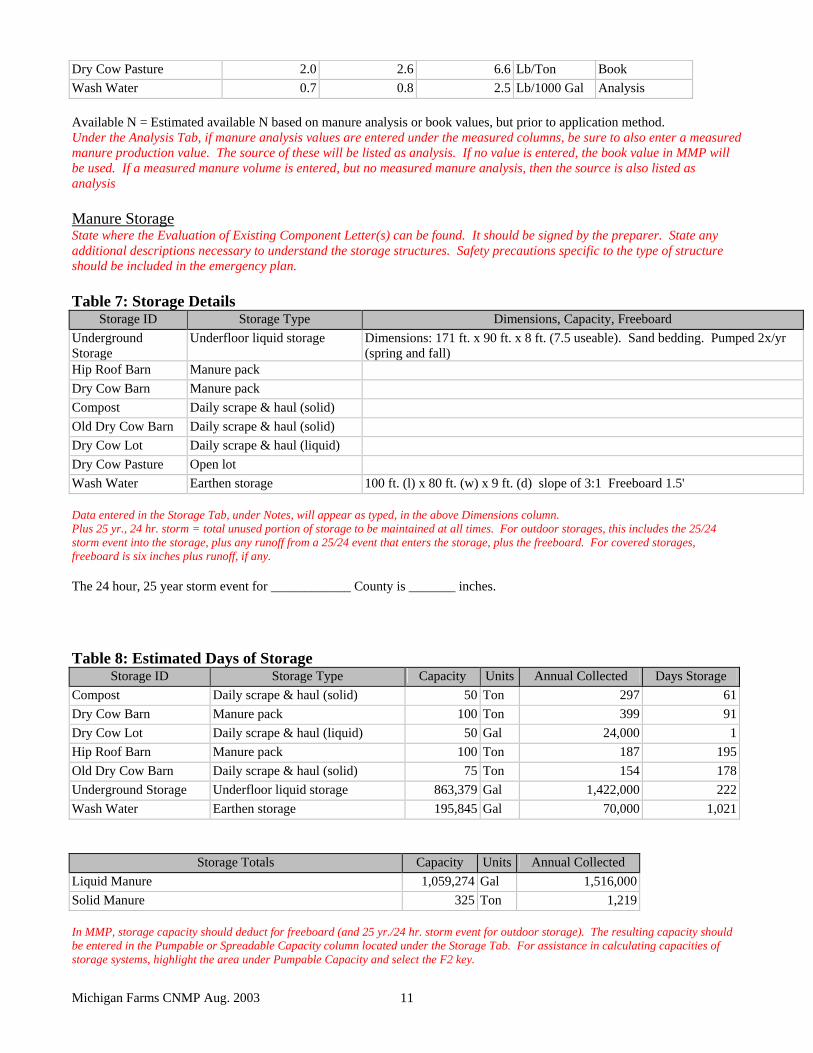
Dry Cow Pasture 2.0 2.6 6.6 Lb/Ton Book Wash Water 0.7 0.8 2.5 Lb/1000 Gal Analysis Available N = Estimated available N based on manure analysis or book values, but prior to application method. Under the Analysis Tab, if manure analysis values are entered under the measured columns, be sure to also enter a measured manure production value. The source of these will be listed as analysis. If no value is entered, the book value in MMP will be used. If a measured manure volume is entered, but no measured manure analysis, then the source is also listed as analysis Manure Storage State where the Evaluation of Existing Component Letter(s) can be found. It should be signed by the preparer. State any additional descriptions necessary to understand the storage structures. Safety precautions specific to the type of structure should be included in the emergency plan. Table 7: Storage Details
Storage ID Storage Type Dimensions, Capacity, Freeboard Underground Storage
Underfloor liquid storage Dimensions: 171 ft. x 90 ft. x 8 ft. (7.5 useable). Sand bedding. Pumped 2x/yr (spring and fall)
Hip Roof Barn Manure pack Dry Cow Barn Manure pack Compost Daily scrape & haul (solid) Old Dry Cow Barn Daily scrape & haul (solid) Dry Cow Lot Daily scrape & haul (liquid) Dry Cow Pasture Open lot Wash Water Earthen storage 100 ft. (l) x 80 ft. (w) x 9 ft. (d) slope of 3:1 Freeboard 1.5' Data entered in the Storage Tab, under Notes, will appear as typed, in the above Dimensions column. Plus 25 yr., 24 hr. storm = total unused portion of storage to be maintained at all times. For outdoor storages, this includes the 25/24 storm event into the storage, plus any runoff from a 25/24 event that enters the storage, plus the freeboard. For covered storages, freeboard is six inches plus runoff, if any. The 24 hour, 25 year storm event for ____________ County is _______ inches. Table 8: Estimated Days of Storage
Storage ID Storage Type Capacity Units Annual Collected Days Storage Compost Daily scrape & haul (solid) 50 Ton 297 61Dry Cow Barn Manure pack 100 Ton 399 91Dry Cow Lot Daily scrape & haul (liquid) 50 Gal 24,000 1Hip Roof Barn Manure pack 100 Ton 187 195Old Dry Cow Barn Daily scrape & haul (solid) 75 Ton 154 178Underground Storage Underfloor liquid storage 863,379 Gal 1,422,000 222Wash Water Earthen storage 195,845 Gal 70,000 1,021
Storage Totals Capacity Units Annual Collected Liquid Manure 1,059,274 Gal 1,516,000 Solid Manure 325 Ton 1,219 In MMP, storage capacity should deduct for freeboard (and 25 yr./24 hr. storm event for outdoor storage). The resulting capacity should be entered in the Pumpable or Spreadable Capacity column located under the Storage Tab. For assistance in calculating capacities of storage systems, highlight the area under Pumpable Capacity and select the F2 key.

Michigan Farms CNMP Aug. 2003 12
Michigan Farms CNMP Aug. 2003 13
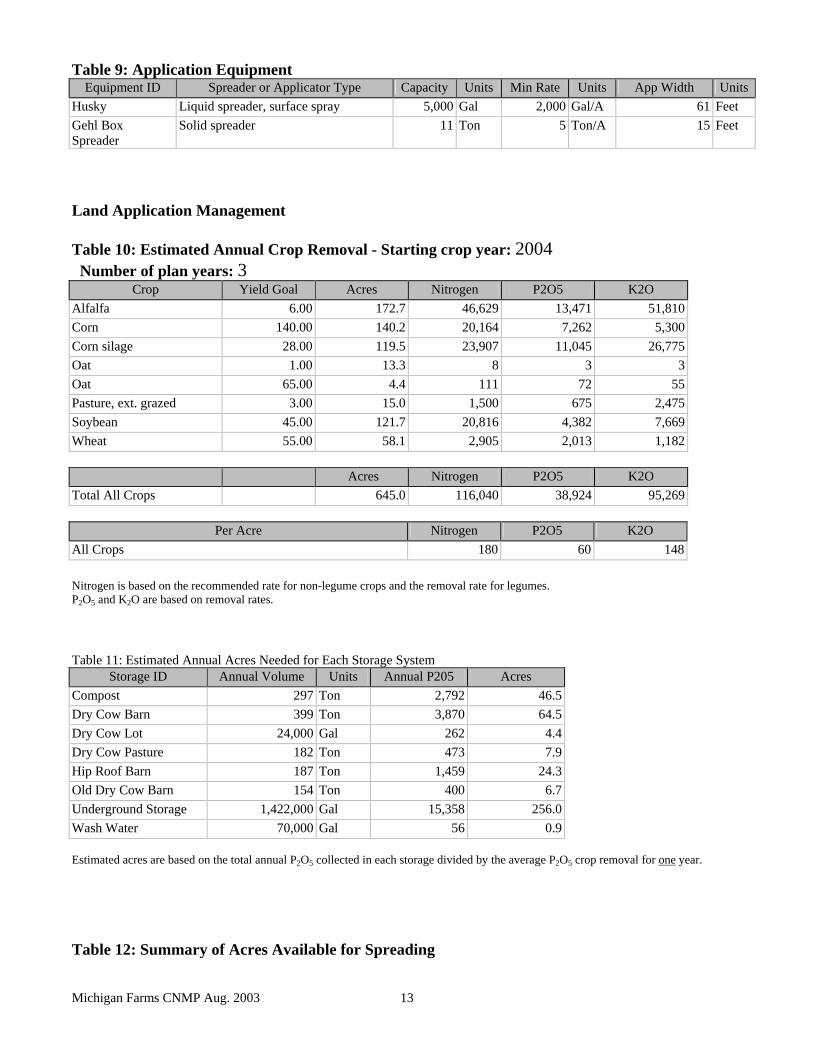
Table 9: Application Equipment Equipment ID Spreader or Applicator Type Capacity Units Min Rate Units App Width Units
Husky Liquid spreader, surface spray 5,000 Gal 2,000 Gal/A 61 Feet Gehl Box Spreader
Solid spreader 11 Ton 5 Ton/A 15 Feet
Land Application Management Table 10: Estimated Annual Crop Removal - Starting crop year: 2004 Number of plan years: 3
Crop Yield Goal Acres Nitrogen P2O5 K2O Alfalfa 6.00 172.7 46,629 13,471 51,810Corn 140.00 140.2 20,164 7,262 5,300Corn silage 28.00 119.5 23,907 11,045 26,775Oat 1.00 13.3 8 3 3Oat 65.00 4.4 111 72 55Pasture, ext. grazed 3.00 15.0 1,500 675 2,475Soybean 45.00 121.7 20,816 4,382 7,669Wheat 55.00 58.1 2,905 2,013 1,182
Acres Nitrogen P2O5 K2O Total All Crops 645.0 116,040 38,924 95,269
Per Acre Nitrogen P2O5 K2O All Crops 180 60 148 Nitrogen is based on the recommended rate for non-legume crops and the removal rate for legumes. P2O5 and K2O are based on removal rates. Table 11: Estimated Annual Acres Needed for Each Storage System
Storage ID Annual Volume Units Annual P205 Acres Compost 297 Ton 2,792 46.5Dry Cow Barn 399 Ton 3,870 64.5Dry Cow Lot 24,000 Gal 262 4.4Dry Cow Pasture 182 Ton 473 7.9Hip Roof Barn 187 Ton 1,459 24.3Old Dry Cow Barn 154 Ton 400 6.7Underground Storage 1,422,000 Gal 15,358 256.0Wash Water 70,000 Gal 56 0.9 Estimated acres are based on the total annual P2O5 collected in each storage divided by the average P2O5 crop removal for one year. Table 12: Summary of Acres Available for Spreading
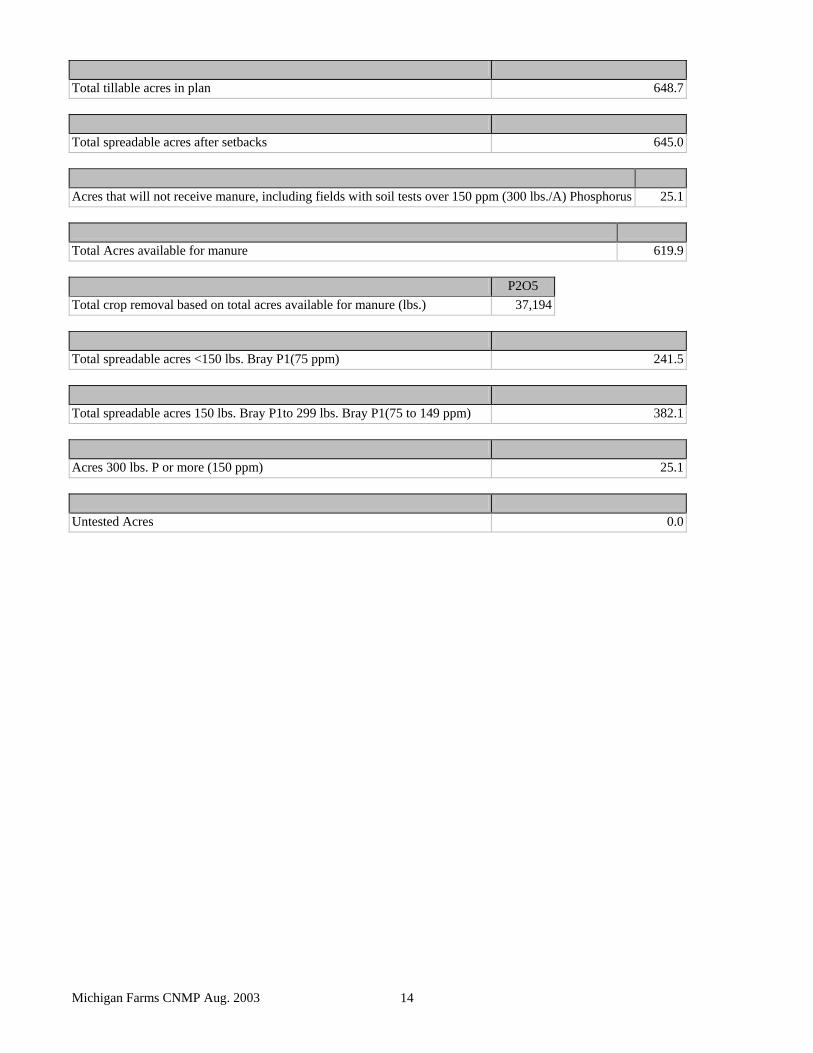
Michigan Farms CNMP Aug. 2003 14
Total tillable acres in plan 648.7
Total spreadable acres after setbacks 645.0
Acres that will not receive manure, including fields with soil tests over 150 ppm (300 lbs./A) Phosphorus 25.1
Total Acres available for manure 619.9
P2O5 Total crop removal based on total acres available for manure (lbs.) 37,194
Total spreadable acres <150 lbs. Bray P1(75 ppm) 241.5
Total spreadable acres 150 lbs. Bray P1to 299 lbs. Bray P1(75 to 149 ppm) 382.1
Acres 300 lbs. P or more (150 ppm) 25.1
Untested Acres 0.0
Michigan Farms CNMP Aug. 2003 15
Winter Spreading The Manure Application Risk Index (MARI) should be used to sort fields by risk for winter spreading. Provide a written summary of MARI evaluations, if applicable. Identify which fields are and are not appropriate for winter spreading. The MARI tables should be included in the Appendix. Manure Spreading Plan The purpose of this section is to document that crop nutrient needs are being met by adequate and proper manure and fertilizer application. The CNMP should give information to the producer that will help him/her prepare detailed field by field spreading plans in the current and future years. Determine how many acres are needed to apply manure nutrients (N or P, whichever is limiting, and generally it is P) annually. A field by field manure spreading plan should be prepared for a minimum of the next 12 months of the CNMP. This can be achieved by filling in the Nutrient Management Tab in MMP. All the phosphorus generated in one year needs to be shown that it can be spread over a 12 month period of time, taking into account the crop rotation (are there fields available for winter spreading and for summer spreading) and that no manure is applied on fields testing over 300 lbs. (150 ppm) Bray P1. Nutrient application rates will be based on MSU/Tri-State Fertilizer Recommendations. In addition, the CNMP must address the following issues for each source of agricultural waste:
- Land application of manure and nutrients cannot exceed nitrogen crop demand on fields less than 150 lb. (75 ppm) Bray P1, or exceed the phosphorus crop uptake on fields between 150 and 300 lb. Bray P1.
- Manure rates cannot exceed 2-year P removal. Where spreading is done at multiple year phosphorus rates, care must be taken to ensure that the field is not receiving P in the ‘off’ year.
- When fields test greater than 150 lb. (75 ppm) Bray P1 or the acres needed for spreading are close to the acres available, the CNMP provider should ensure that sufficient spreading area is available at the time it is needed throughout the typical rotation.
Identifying spreading ‘windows of opportunity’ will help farmers to balance what manure is available to spread with what volume of manure is generated during the broad seasonal time periods. Appropriate manure applications should be determined by on-farm manure and soil test results and be supported by record keeping. In absence of manure analysis data, use MWPS-18 version 2000 Table 6. A CNMP can be approved if it documents that the nutrient amounts, measured by manure tests or book values, can be agronomically utilized over the years of the crop rotation. Calibration of Manure Application Equipment Discuss calibration of manure application equipment and how desired rates will be achieved. Cropping Plan Document the current or planned crop production sequence or crop rotation. Two years of crops is a minimum. If a producer has a typical three to five year crop rotation, this may be more representative to utilize for planning manure applications. Provide yield goals. Refer to the MAEAP Q and A document for information on choosing realistic yield goals. Summarize crop removal rate of N, P and K by total acres and yield goal. Soil Testing Plan Describe the method used for taking soil samples. Note frequency of sampling and sampling procedure (i.e., sampling by soil type and cropping pattern according to MSU recommendations, or grid sampling.) Include information on PSNT sampling or plant tissue sampling, if applicable. See Answers to Frequently Asked Questions.
Michigan Farms CNMP Aug. 2003 16
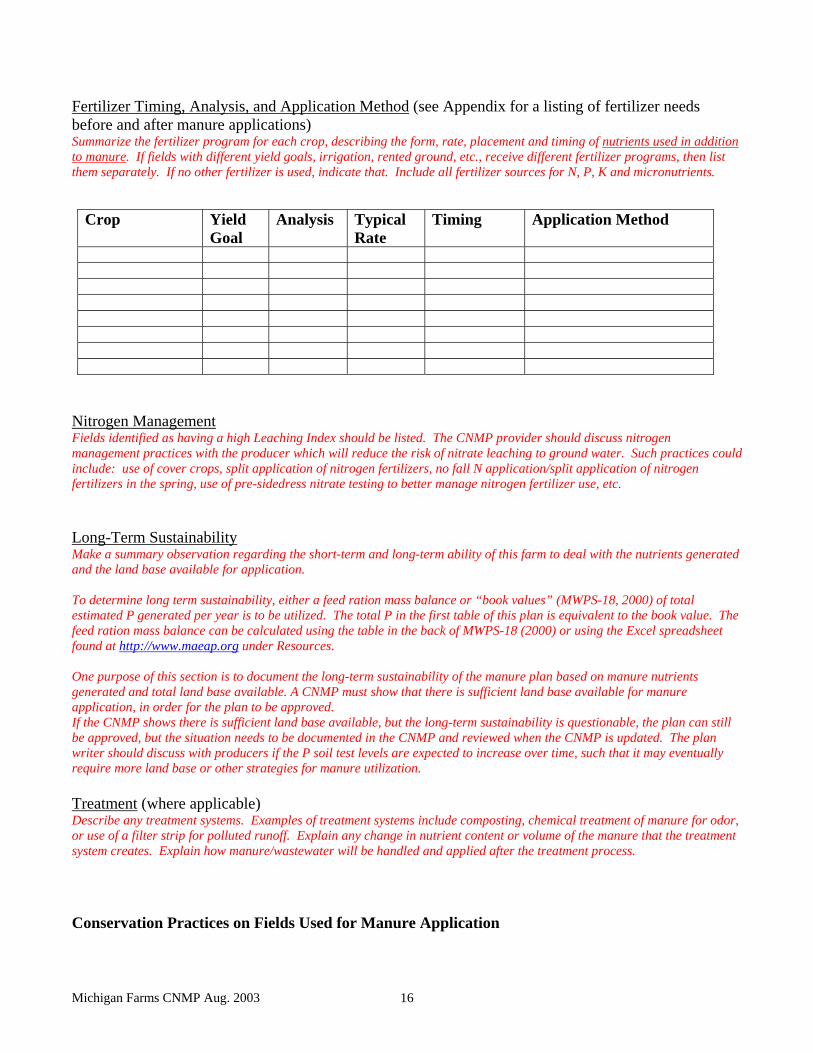
Fertilizer Timing, Analysis, and Application Method (see Appendix for a listing of fertilizer needs before and after manure applications) Summarize the fertilizer program for each crop, describing the form, rate, placement and timing of nutrients used in addition to manure. If fields with different yield goals, irrigation, rented ground, etc., receive different fertilizer programs, then list them separately. If no other fertilizer is used, indicate that. Include all fertilizer sources for N, P, K and micronutrients.
Nitrogen Management Fields identified as having a high Leaching Index should be listed. The CNMP provider should discuss nitrogen management practices with the producer which will reduce the risk of nitrate leaching to ground water. Such practices could include: use of cover crops, split application of nitrogen fertilizers, no fall N application/split application of nitrogen fertilizers in the spring, use of pre-sidedress nitrate testing to better manage nitrogen fertilizer use, etc. Long-Term Sustainability Make a summary observation regarding the short-term and long-term ability of this farm to deal with the nutrients generated and the land base available for application. To determine long term sustainability, either a feed ration mass balance or “book values” (MWPS-18, 2000) of total estimated P generated per year is to be utilized. The total P in the first table of this plan is equivalent to the book value. The feed ration mass balance can be calculated using the table in the back of MWPS-18 (2000) or using the Excel spreadsheet found at http://www.maeap.org under Resources. One purpose of this section is to document the long-term sustainability of the manure plan based on manure nutrients generated and total land base available. A CNMP must show that there is sufficient land base available for manure application, in order for the plan to be approved. If the CNMP shows there is sufficient land base available, but the long-term sustainability is questionable, the plan can still be approved, but the situation needs to be documented in the CNMP and reviewed when the CNMP is updated. The plan writer should discuss with producers if the P soil test levels are expected to increase over time, such that it may eventually require more land base or other strategies for manure utilization. Treatment (where applicable) Describe any treatment systems. Examples of treatment systems include composting, chemical treatment of manure for odor, or use of a filter strip for polluted runoff. Explain any change in nutrient content or volume of the manure that the treatment system creates. Explain how manure/wastewater will be handled and applied after the treatment process. Conservation Practices on Fields Used for Manure Application
Crop Yield Goal
Analysis Typical Rate
Timing Application Method
Michigan Farms CNMP Aug. 2003 17
The CNMP must document that manure and nutrients stay in the field and out of surface water and groundwater resources. Achievement of these goals will require that some fields or parts of fields be managed differently regarding manure application, because of risk factors inherent to the soil and site conditions. Utilize the “notes” column under the Fields tab in MMP to include relevant information. This can be printed off in MMP by selecting: Tools Custom Standard MMP Custom Reports Generate Plan Data Report with Access Include field maps in the appendix. Maps should indicate field identification (such as FSA field and tract numbers or producer’s i.d. numbers), field and property boundaries, acres, land use, scale of map, general location (include state, county, township and section #’s), sensitive areas (such as streams, wetlands, drainage tile locations*, risers, wells, water bodies – also note swales or direction of water movement through fields, where appropriate), conservation practices, setbacks, date prepared, and north arrow. - Identify both existing and needed conservation and management practices on maps, such as setbacks, buffers, etc. - Provide NRCS soil maps w/legends (include field boundaries and numbers on maps). - Summarize RUSLE/RUSLE 2 and Wind Erosion calculations. Include details in the appendix. Provide calculations or other documentation in the Appendix to show that soil erosion levels are within “T”. - Summarize MARI evaluations, if applicable. The MARI tables should be included in an appendix. Identify risks by field. - Provide information on all fields that will receive manure. - List irrigation water management strategy, if applicable. *Refer to the MAEAP Question and Answer document for more information on CNMP requirements for tiled fields used for manure application. Record of CNMP Implementation Specify what system is being used (computer program, spreadsheet, paper records, etc.) Blank recordkeeping forms can be added here or in an appendix. The following records will be kept on file at the farm by field (for 5 years): - Field maps (aerial photos, soil maps, or other) - Current crops - Realistic crop yield goals - Soil test reports - Total volume of manure produced (based on number of loads) - Dates and rates of manure/wastewater applications (include source and form of manure) - Dates, rates, and forms of other nutrient applications - Dates of incorporation (where applicable) - Method of application (e.g. surface applied, injected, irrigated) - Acres and area of field where nutrients have been applied - Weather conditions during application of manure - Field conditions during application of manure - Recommended nutrient application rates - Previous crops grown and yields - Plant tissue sampling and testing reports (where applicable) - Pre-Sidedress Nitrate Test (PSNT) reports (where applicable) - Complete N, P, K nutrient budget by field Other records that should be kept:
- Manure/wastewater quantities produced and nutrient analysis reports - Inspection and maintenance records - Records related to any uncontrolled discharge of manure or wastewater that warranted
emergency response notification to the Michigan Department of Agriculture and/or Michigan Department of Environmental Quality (if appropriate) - Records of rental or other agreements for application of manure/wastewater on land not
Michigan Farms CNMP Aug. 2003 18
owned by the producer (if applicable) - Records for manure that moves off site (include amount of manure, date of transfer, recipient name - provide recipient an analysis of the manure for their cropping plan, including fertilizer adjustments)
Table 12A: Feed Management Feed Ration Information
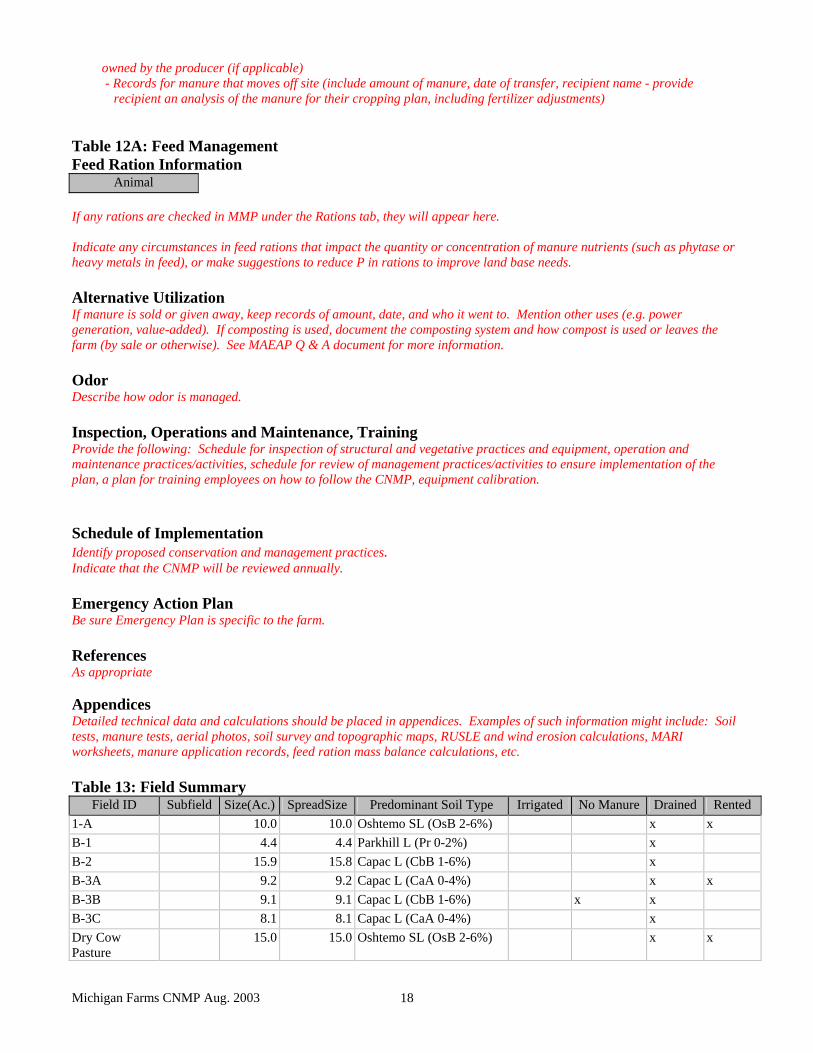
Animal If any rations are checked in MMP under the Rations tab, they will appear here. Indicate any circumstances in feed rations that impact the quantity or concentration of manure nutrients (such as phytase or heavy metals in feed), or make suggestions to reduce P in rations to improve land base needs. Alternative Utilization If manure is sold or given away, keep records of amount, date, and who it went to. Mention other uses (e.g. power generation, value-added). If composting is used, document the composting system and how compost is used or leaves the farm (by sale or otherwise). See MAEAP Q & A document for more information. Odor Describe how odor is managed. Inspection, Operations and Maintenance, Training Provide the following: Schedule for inspection of structural and vegetative practices and equipment, operation and maintenance practices/activities, schedule for review of management practices/activities to ensure implementation of the plan, a plan for training employees on how to follow the CNMP, equipment calibration. Schedule of Implementation Identify proposed conservation and management practices. Indicate that the CNMP will be reviewed annually. Emergency Action Plan Be sure Emergency Plan is specific to the farm. References As appropriate Appendices Detailed technical data and calculations should be placed in appendices. Examples of such information might include: Soil tests, manure tests, aerial photos, soil survey and topographic maps, RUSLE and wind erosion calculations, MARI worksheets, manure application records, feed ration mass balance calculations, etc. Table 13: Field Summary
Field ID Subfield Size(Ac.) SpreadSize Predominant Soil Type Irrigated No Manure Drained Rented 1-A 10.0 10.0 Oshtemo SL (OsB 2-6%) x x B-1 4.4 4.4 Parkhill L (Pr 0-2%) x B-2 15.9 15.8 Capac L (CbB 1-6%) x B-3A 9.2 9.2 Capac L (CaA 0-4%) x x B-3B 9.1 9.1 Capac L (CbB 1-6%) x x B-3C 8.1 8.1 Capac L (CaA 0-4%) x Dry Cow Pasture
15.0 15.0 Oshtemo SL (OsB 2-6%) x x
Michigan Farms CNMP Aug. 2003 19
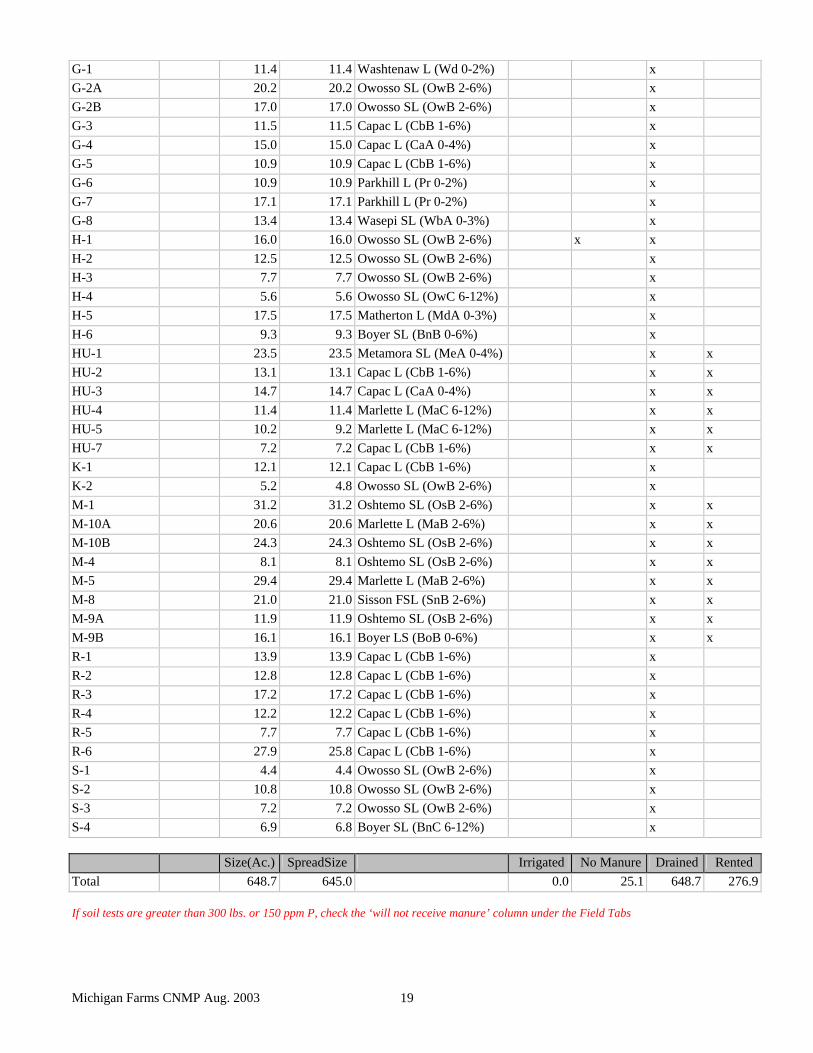
G-1 11.4 11.4 Washtenaw L (Wd 0-2%) x G-2A 20.2 20.2 Owosso SL (OwB 2-6%) x G-2B 17.0 17.0 Owosso SL (OwB 2-6%) x G-3 11.5 11.5 Capac L (CbB 1-6%) x G-4 15.0 15.0 Capac L (CaA 0-4%) x G-5 10.9 10.9 Capac L (CbB 1-6%) x G-6 10.9 10.9 Parkhill L (Pr 0-2%) x G-7 17.1 17.1 Parkhill L (Pr 0-2%) x G-8 13.4 13.4 Wasepi SL (WbA 0-3%) x H-1 16.0 16.0 Owosso SL (OwB 2-6%) x x H-2 12.5 12.5 Owosso SL (OwB 2-6%) x H-3 7.7 7.7 Owosso SL (OwB 2-6%) x H-4 5.6 5.6 Owosso SL (OwC 6-12%) x H-5 17.5 17.5 Matherton L (MdA 0-3%) x H-6 9.3 9.3 Boyer SL (BnB 0-6%) x HU-1 23.5 23.5 Metamora SL (MeA 0-4%) x x HU-2 13.1 13.1 Capac L (CbB 1-6%) x x HU-3 14.7 14.7 Capac L (CaA 0-4%) x x HU-4 11.4 11.4 Marlette L (MaC 6-12%) x x HU-5 10.2 9.2 Marlette L (MaC 6-12%) x x HU-7 7.2 7.2 Capac L (CbB 1-6%) x x K-1 12.1 12.1 Capac L (CbB 1-6%) x K-2 5.2 4.8 Owosso SL (OwB 2-6%) x M-1 31.2 31.2 Oshtemo SL (OsB 2-6%) x x M-10A 20.6 20.6 Marlette L (MaB 2-6%) x x M-10B 24.3 24.3 Oshtemo SL (OsB 2-6%) x x M-4 8.1 8.1 Oshtemo SL (OsB 2-6%) x x M-5 29.4 29.4 Marlette L (MaB 2-6%) x x M-8 21.0 21.0 Sisson FSL (SnB 2-6%) x x M-9A 11.9 11.9 Oshtemo SL (OsB 2-6%) x x M-9B 16.1 16.1 Boyer LS (BoB 0-6%) x x R-1 13.9 13.9 Capac L (CbB 1-6%) x R-2 12.8 12.8 Capac L (CbB 1-6%) x R-3 17.2 17.2 Capac L (CbB 1-6%) x R-4 12.2 12.2 Capac L (CbB 1-6%) x R-5 7.7 7.7 Capac L (CbB 1-6%) x R-6 27.9 25.8 Capac L (CbB 1-6%) x S-1 4.4 4.4 Owosso SL (OwB 2-6%) x S-2 10.8 10.8 Owosso SL (OwB 2-6%) x S-3 7.2 7.2 Owosso SL (OwB 2-6%) x S-4 6.9 6.8 Boyer SL (BnC 6-12%) x
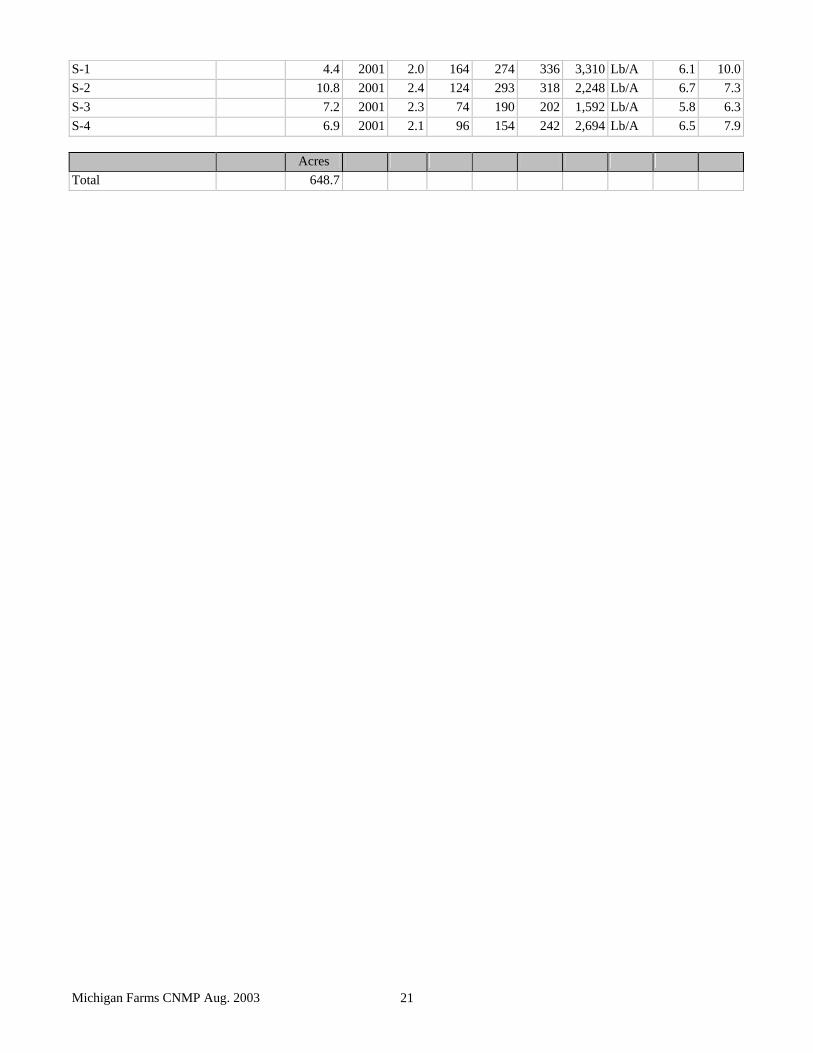
Size(Ac.) SpreadSize Irrigated No Manure Drained Rented Total 648.7 645.0 0.0 25.1 648.7 276.9 If soil tests are greater than 300 lbs. or 150 ppm P, check the ‘will not receive manure’ column under the Field Tabs
Michigan Farms CNMP Aug. 2003 20
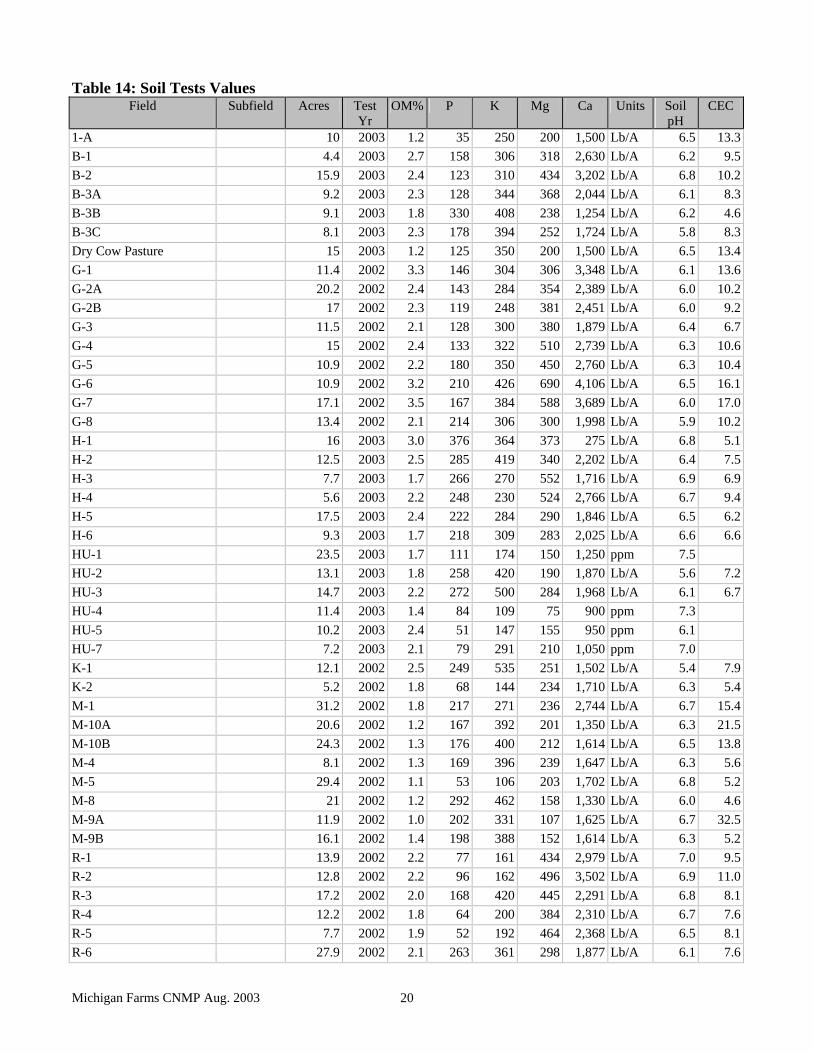
Table 14: Soil Tests Values
Field Subfield Acres Test Yr
OM% P K Mg Ca Units Soil pH
CEC
1-A 10 2003 1.2 35 250 200 1,500 Lb/A 6.5 13.3B-1 4.4 2003 2.7 158 306 318 2,630 Lb/A 6.2 9.5B-2 15.9 2003 2.4 123 310 434 3,202 Lb/A 6.8 10.2B-3A 9.2 2003 2.3 128 344 368 2,044 Lb/A 6.1 8.3B-3B 9.1 2003 1.8 330 408 238 1,254 Lb/A 6.2 4.6B-3C 8.1 2003 2.3 178 394 252 1,724 Lb/A 5.8 8.3Dry Cow Pasture 15 2003 1.2 125 350 200 1,500 Lb/A 6.5 13.4G-1 11.4 2002 3.3 146 304 306 3,348 Lb/A 6.1 13.6G-2A 20.2 2002 2.4 143 284 354 2,389 Lb/A 6.0 10.2G-2B 17 2002 2.3 119 248 381 2,451 Lb/A 6.0 9.2G-3 11.5 2002 2.1 128 300 380 1,879 Lb/A 6.4 6.7G-4 15 2002 2.4 133 322 510 2,739 Lb/A 6.3 10.6G-5 10.9 2002 2.2 180 350 450 2,760 Lb/A 6.3 10.4G-6 10.9 2002 3.2 210 426 690 4,106 Lb/A 6.5 16.1G-7 17.1 2002 3.5 167 384 588 3,689 Lb/A 6.0 17.0G-8 13.4 2002 2.1 214 306 300 1,998 Lb/A 5.9 10.2H-1 16 2003 3.0 376 364 373 275 Lb/A 6.8 5.1H-2 12.5 2003 2.5 285 419 340 2,202 Lb/A 6.4 7.5H-3 7.7 2003 1.7 266 270 552 1,716 Lb/A 6.9 6.9H-4 5.6 2003 2.2 248 230 524 2,766 Lb/A 6.7 9.4H-5 17.5 2003 2.4 222 284 290 1,846 Lb/A 6.5 6.2H-6 9.3 2003 1.7 218 309 283 2,025 Lb/A 6.6 6.6HU-1 23.5 2003 1.7 111 174 150 1,250 ppm 7.5HU-2 13.1 2003 1.8 258 420 190 1,870 Lb/A 5.6 7.2HU-3 14.7 2003 2.2 272 500 284 1,968 Lb/A 6.1 6.7HU-4 11.4 2003 1.4 84 109 75 900 ppm 7.3HU-5 10.2 2003 2.4 51 147 155 950 ppm 6.1HU-7 7.2 2003 2.1 79 291 210 1,050 ppm 7.0K-1 12.1 2002 2.5 249 535 251 1,502 Lb/A 5.4 7.9K-2 5.2 2002 1.8 68 144 234 1,710 Lb/A 6.3 5.4M-1 31.2 2002 1.8 217 271 236 2,744 Lb/A 6.7 15.4M-10A 20.6 2002 1.2 167 392 201 1,350 Lb/A 6.3 21.5M-10B 24.3 2002 1.3 176 400 212 1,614 Lb/A 6.5 13.8M-4 8.1 2002 1.3 169 396 239 1,647 Lb/A 6.3 5.6M-5 29.4 2002 1.1 53 106 203 1,702 Lb/A 6.8 5.2M-8 21 2002 1.2 292 462 158 1,330 Lb/A 6.0 4.6M-9A 11.9 2002 1.0 202 331 107 1,625 Lb/A 6.7 32.5M-9B 16.1 2002 1.4 198 388 152 1,614 Lb/A 6.3 5.2R-1 13.9 2002 2.2 77 161 434 2,979 Lb/A 7.0 9.5R-2 12.8 2002 2.2 96 162 496 3,502 Lb/A 6.9 11.0R-3 17.2 2002 2.0 168 420 445 2,291 Lb/A 6.8 8.1R-4 12.2 2002 1.8 64 200 384 2,310 Lb/A 6.7 7.6R-5 7.7 2002 1.9 52 192 464 2,368 Lb/A 6.5 8.1R-6 27.9 2002 2.1 263 361 298 1,877 Lb/A 6.1 7.6
Michigan Farms CNMP Aug. 2003 21
S-1 4.4 2001 2.0 164 274 336 3,310 Lb/A 6.1 10.0S-2 10.8 2001 2.4 124 293 318 2,248 Lb/A 6.7 7.3S-3 7.2 2001 2.3 74 190 202 1,592 Lb/A 5.8 6.3S-4 6.9 2001 2.1 96 154 242 2,694 Lb/A 6.5 7.9
Acres Total 648.7
Michigan Farms CNMP Aug. 2003 22
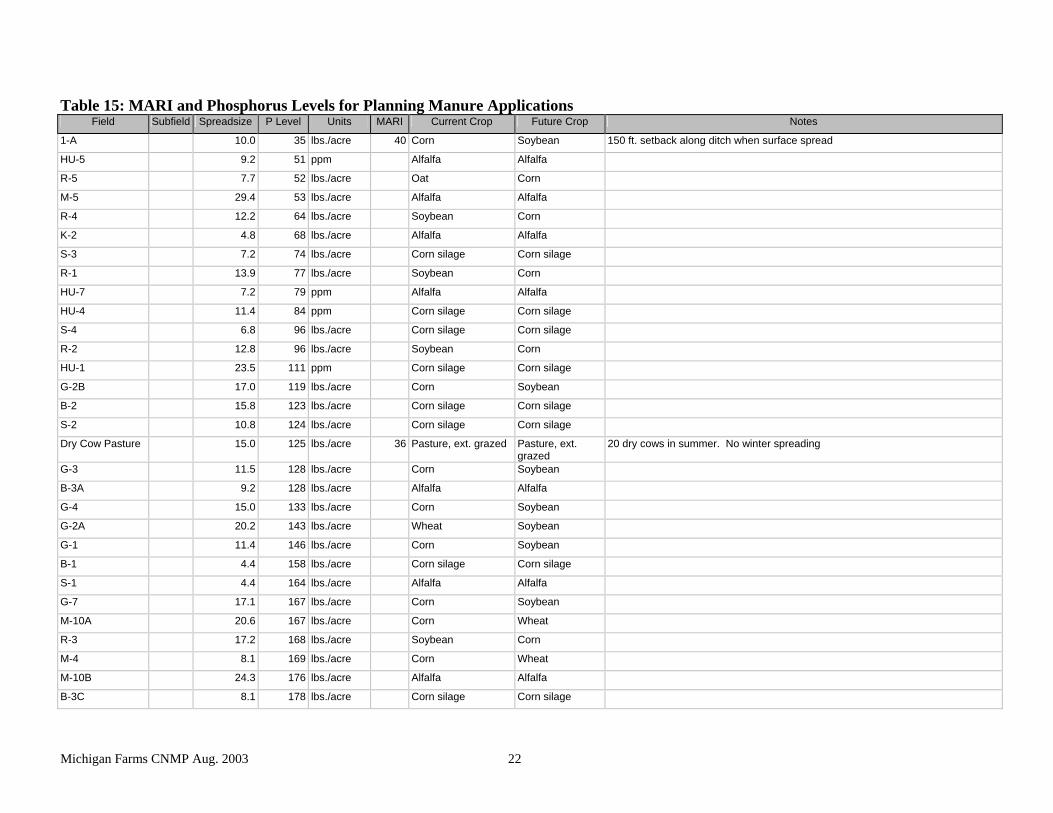
Table 15: MARI and Phosphorus Levels for Planning Manure Applications Field Subfield Spreadsize P Level Units MARI Current Crop Future Crop Notes
1-A 10.0 35 lbs./acre 40 Corn Soybean 150 ft. setback along ditch when surface spread
HU-5 9.2 51 ppm Alfalfa Alfalfa
R-5 7.7 52 lbs./acre Oat Corn
M-5 29.4 53 lbs./acre Alfalfa Alfalfa
R-4 12.2 64 lbs./acre Soybean Corn
K-2 4.8 68 lbs./acre Alfalfa Alfalfa
S-3 7.2 74 lbs./acre Corn silage Corn silage
R-1 13.9 77 lbs./acre Soybean Corn
HU-7 7.2 79 ppm Alfalfa Alfalfa
HU-4 11.4 84 ppm Corn silage Corn silage
S-4 6.8 96 lbs./acre Corn silage Corn silage
R-2 12.8 96 lbs./acre Soybean Corn
HU-1 23.5 111 ppm Corn silage Corn silage
G-2B 17.0 119 lbs./acre Corn Soybean
B-2 15.8 123 lbs./acre Corn silage Corn silage
S-2 10.8 124 lbs./acre Corn silage Corn silage
Dry Cow Pasture 15.0 125 lbs./acre 36 Pasture, ext. grazed Pasture, ext. grazed
20 dry cows in summer. No winter spreading
G-3 11.5 128 lbs./acre Corn Soybean
B-3A 9.2 128 lbs./acre Alfalfa Alfalfa
G-4 15.0 133 lbs./acre Corn Soybean
G-2A 20.2 143 lbs./acre Wheat Soybean
G-1 11.4 146 lbs./acre Corn Soybean
B-1 4.4 158 lbs./acre Corn silage Corn silage
S-1 4.4 164 lbs./acre Alfalfa Alfalfa
G-7 17.1 167 lbs./acre Corn Soybean
M-10A 20.6 167 lbs./acre Corn Wheat
R-3 17.2 168 lbs./acre Soybean Corn
M-4 8.1 169 lbs./acre Corn Wheat
M-10B 24.3 176 lbs./acre Alfalfa Alfalfa
B-3C 8.1 178 lbs./acre Corn silage Corn silage
Michigan Farms CNMP Aug. 2003 23
G-5 10.9 180 lbs./acre Corn Wheat
M-9B 16.1 198 lbs./acre Oat Soybean
M-9A 11.9 202 lbs./acre Soybean Oat
G-6 10.9 210 lbs./acre Corn Wheat
G-8 13.4 214 lbs./acre Corn Soybean
M-1 31.2 217 lbs./acre Wheat Corn
H-6 9.3 218 lbs./acre Alfalfa Alfalfa
H-5 17.5 222 lbs./acre Alfalfa Alfalfa
H-4 5.6 248 lbs./acre Corn silage Oat
K-1 12.1 249 lbs./acre Alfalfa Alfalfa
HU-2 13.1 258 lbs./acre Corn silage Corn silage
R-6 25.8 263 lbs./acre Soybean Corn
H-3 7.7 266 lbs./acre Alfalfa Alfalfa
HU-3 14.7 272 lbs./acre Corn silage Corn silage
H-2 12.5 285 lbs./acre Alfalfa Alfalfa
M-8 21.0 292 lbs./acre Soybean Wheat
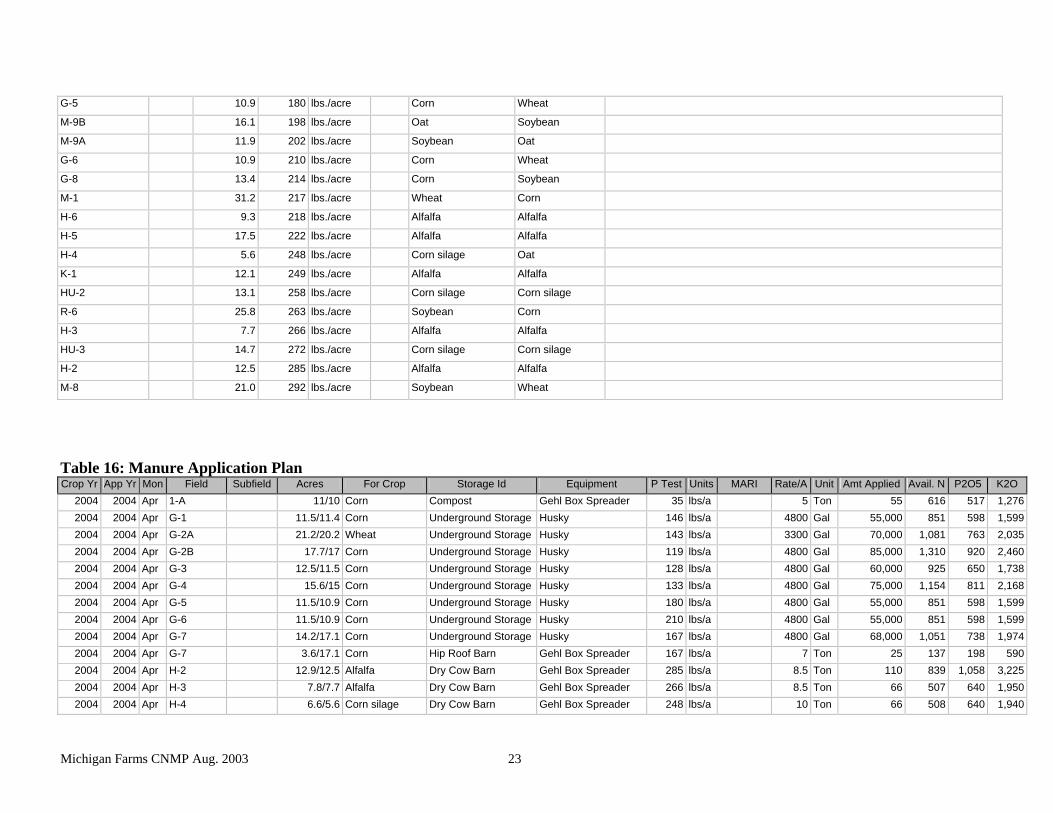
Table 16: Manure Application Plan Crop Yr App Yr Mon Field Subfield Acres For Crop Storage Id Equipment P Test Units MARI Rate/A Unit Amt Applied Avail. N P2O5 K2O
2004 2004 Apr 1-A 11/10 Corn Compost Gehl Box Spreader 35 lbs/a 5 Ton 55 616 517 1,276 2004 2004 Apr G-1 11.5/11.4 Corn Underground Storage Husky 146 lbs/a 4800 Gal 55,000 851 598 1,599 2004 2004 Apr G-2A 21.2/20.2 Wheat Underground Storage Husky 143 lbs/a 3300 Gal 70,000 1,081 763 2,035 2004 2004 Apr G-2B 17.7/17 Corn Underground Storage Husky 119 lbs/a 4800 Gal 85,000 1,310 920 2,460 2004 2004 Apr G-3 12.5/11.5 Corn Underground Storage Husky 128 lbs/a 4800 Gal 60,000 925 650 1,738 2004 2004 Apr G-4 15.6/15 Corn Underground Storage Husky 133 lbs/a 4800 Gal 75,000 1,154 811 2,168 2004 2004 Apr G-5 11.5/10.9 Corn Underground Storage Husky 180 lbs/a 4800 Gal 55,000 851 598 1,599 2004 2004 Apr G-6 11.5/10.9 Corn Underground Storage Husky 210 lbs/a 4800 Gal 55,000 851 598 1,599 2004 2004 Apr G-7 14.2/17.1 Corn Underground Storage Husky 167 lbs/a 4800 Gal 68,000 1,051 738 1,974 2004 2004 Apr G-7 3.6/17.1 Corn Hip Roof Barn Gehl Box Spreader 167 lbs/a 7 Ton 25 137 198 590 2004 2004 Apr H-2 12.9/12.5 Alfalfa Dry Cow Barn Gehl Box Spreader 285 lbs/a 8.5 Ton 110 839 1,058 3,225 2004 2004 Apr H-3 7.8/7.7 Alfalfa Dry Cow Barn Gehl Box Spreader 266 lbs/a 8.5 Ton 66 507 640 1,950 2004 2004 Apr H-4 6.6/5.6 Corn silage Dry Cow Barn Gehl Box Spreader 248 lbs/a 10 Ton 66 508 640 1,940
Michigan Farms CNMP Aug. 2003 24
2004 2004 Apr H-5 2.6/17.5 Alfalfa Dry Cow Barn Gehl Box Spreader 222 lbs/a 8.5 Ton 22 169 213 650 2004 2004 Apr K-2 5.3/4.8 Alfalfa Underground Storage Husky 68 lbs/a 7500 Gal 40,000 615 429 1,150 2004 2004 Apr M-5 30/29.4 Alfalfa Underground Storage Husky 53 lbs/a 7500 Gal 225,000 3,480 2,430 6,510 2004 2004 Apr R-1 14.7/13.9 Soybean Underground Storage Husky 77 lbs/a 3400 Gal 50,000 1,161 544 1,455 2004 2004 Apr R-4 13.2/12.2 Soybean Underground Storage Husky 64 lbs/a 3400 Gal 45,000 1,043 488 1,307 2004 2004 Apr S-3 7.6/7.2 Corn silage Underground Storage Husky 74 lbs/a 8600 Gal 65,000 1,003 707 1,892 2004 2004 Sep H-6 1.4/9.3 Alfalfa Underground Storage Husky 218 lbs/a 7300 Gal 10,000 157 111 297 2004 2004 Sep HU-5 4.5/9.2 Alfalfa Underground Storage Husky 51 ppm 7300 Gal 32,500 504 356 954 2004 2004 Sep HU-5 5.5/9.2 Alfalfa Hip Roof Barn Gehl Box Spreader 51 ppm 10 Ton 55 303 429 1,287 2004 2004 Sep HU-7 5.2/7.2 Alfalfa Dry Cow Barn Gehl Box Spreader 79 ppm 8.5 Ton 44 338 426 1,300 2004 2004 Sep HU-7 2.3/7.2 Alfalfa Hip Roof Barn Gehl Box Spreader 79 ppm 10 Ton 23 127 179 538 2004 2004 Sep K-1 12.9/12.1 Alfalfa Dry Cow Barn Gehl Box Spreader 249 lbs/a 8.5 Ton 110 839 1,058 3,225 2004 2004 Sep K-2 1.3/4.8 Alfalfa Dry Cow Barn Gehl Box Spreader 68 lbs/a 8.5 Ton 11 85 107 325 2004 2004 Sep S-1 5.2/4.4 Alfalfa Compost Gehl Box Spreader 164 lbs/a 8.5 Ton 44 541 416 1,024 2005 2004 Sep HU-1 23.8/23.5 Corn silage Underground Storage Husky 111 ppm 8600 Gal 205,000 3,142 2,213 5,926 2005 2004 Sep HU-2 13.4/13.1 Corn silage Underground Storage Husky 258 lbs/a 8600 Gal 115,000 1,769 1,246 3,337 2005 2004 Sep HU-3 15.1/14.7 Corn silage Underground Storage Husky 272 lbs/a 8600 Gal 130,000 1,993 1,404 3,760 2005 2004 Sep HU-4 11.6/11.4 Corn silage Underground Storage Husky 84 ppm 8600 Gal 100,000 1,531 1,079 2,888 2005 2004 Sep S-2 7.7/10.8 Corn silage Compost Gehl Box Spreader 124 lbs/a 10 Ton 77 862 724 1,786 2005 2005 Apr B-1 4.7/4.4 Corn silage Underground Storage Husky 158 lbs/a 8600 Gal 40,000 620 437 1,170 2005 2005 Apr B-2 16.3/15.8 Corn silage Underground Storage Husky 123 lbs/a 8600 Gal 140,000 2,152 1,516 4,059 2005 2005 Apr B-3A 1.1/9.2 Alfalfa Hip Roof Barn Gehl Box Spreader 128 lbs/a 10 Ton 11 61 86 257 2005 2005 Apr B-3A 8.2/9.2 Alfalfa Underground Storage Husky 128 lbs/a 7300 Gal 60,000 918 648 1,738 2005 2005 Apr B-3C 8.1/8.1 Corn silage Underground Storage Husky 178 lbs/a 8600 Gal 70,000 1,069 753 2,017 2005 2005 Apr M-1 13.9/31.2 Corn Hip Roof Barn Gehl Box Spreader 217 lbs/a 7 Ton 98 528 765 2,280 2005 2005 Apr M-1 18/31.2 Corn Dry Cow Barn Gehl Box Spreader 217 lbs/a 5.5 Ton 99 756 954 2,916 2005 2005 Apr M-5 10.4/29.4 Alfalfa Dry Cow Barn Gehl Box Spreader 53 lbs/a 8.5 Ton 88 676 853 2,600 2005 2005 Apr R-1 14.6/13.9 Corn Underground Storage Husky 77 lbs/a 4800 Gal 70,000 1,080 759 2,029 2005 2005 Apr R-2 13.5/12.8 Corn Underground Storage Husky 96 lbs/a 4800 Gal 65,000 999 702 1,877 2005 2005 Apr R-3 17.7/17.2 Corn Underground Storage Husky 168 lbs/a 4800 Gal 85,000 1,310 920 2,460 2005 2005 Apr R-4 12.5/12.2 Corn Underground Storage Husky 64 lbs/a 4800 Gal 60,000 925 650 1,738 2005 2005 Apr R-5 8.3/7.7 Corn Underground Storage Husky 52 lbs/a 4800 Gal 40,000 614 432 1,154 2005 2005 Apr R-6 26/25.8 Corn Underground Storage Husky 263 lbs/a 4800 Gal 125,000 1,924 1,352 3,614 2005 2005 Apr S-1 5.2/4.4 Alfalfa Compost Gehl Box Spreader 164 lbs/a 8.5 Ton 44 541 416 1,024 2005 2005 Apr S-2 3.3/10.8 Corn silage Compost Gehl Box Spreader 124 lbs/a 10 Ton 33 370 310 766 2005 2005 Apr S-3 7.7/7.2 Corn silage Compost Gehl Box Spreader 74 lbs/a 10 Ton 77 862 724 1,786
Michigan Farms CNMP Aug. 2003 25
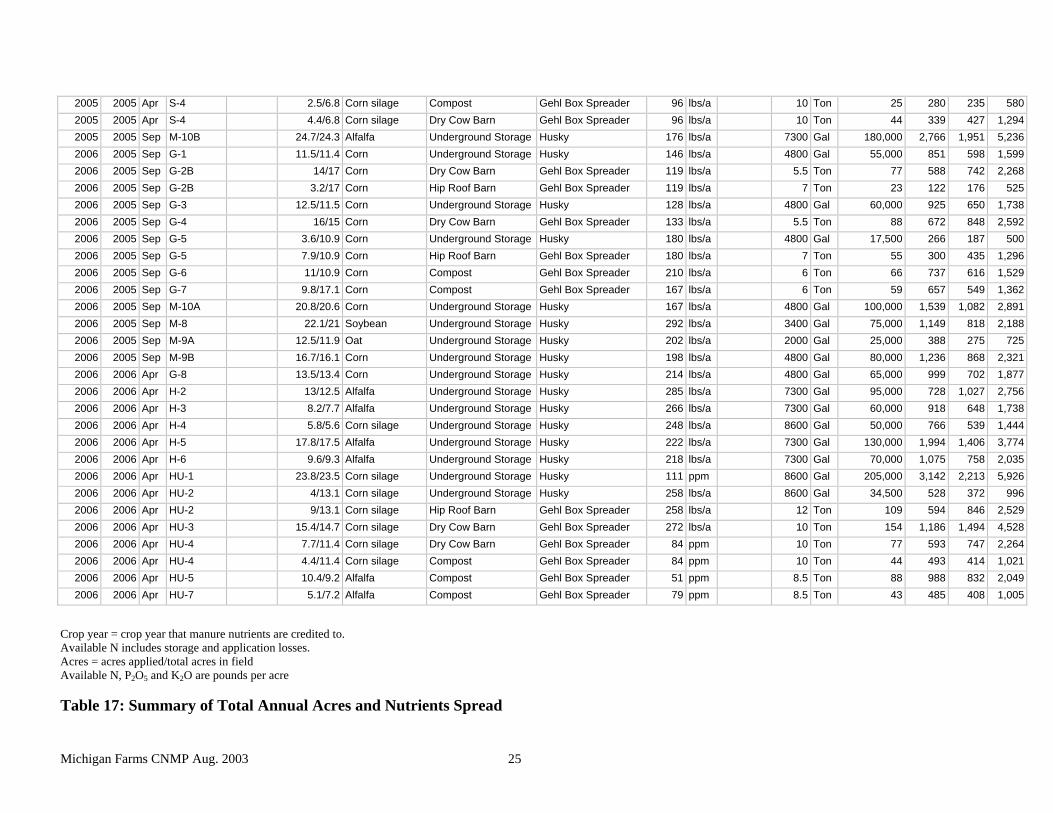
2005 2005 Apr S-4 2.5/6.8 Corn silage Compost Gehl Box Spreader 96 lbs/a 10 Ton 25 280 235 580 2005 2005 Apr S-4 4.4/6.8 Corn silage Dry Cow Barn Gehl Box Spreader 96 lbs/a 10 Ton 44 339 427 1,294 2005 2005 Sep M-10B 24.7/24.3 Alfalfa Underground Storage Husky 176 lbs/a 7300 Gal 180,000 2,766 1,951 5,236 2006 2005 Sep G-1 11.5/11.4 Corn Underground Storage Husky 146 lbs/a 4800 Gal 55,000 851 598 1,599 2006 2005 Sep G-2B 14/17 Corn Dry Cow Barn Gehl Box Spreader 119 lbs/a 5.5 Ton 77 588 742 2,268 2006 2005 Sep G-2B 3.2/17 Corn Hip Roof Barn Gehl Box Spreader 119 lbs/a 7 Ton 23 122 176 525 2006 2005 Sep G-3 12.5/11.5 Corn Underground Storage Husky 128 lbs/a 4800 Gal 60,000 925 650 1,738 2006 2005 Sep G-4 16/15 Corn Dry Cow Barn Gehl Box Spreader 133 lbs/a 5.5 Ton 88 672 848 2,592 2006 2005 Sep G-5 3.6/10.9 Corn Underground Storage Husky 180 lbs/a 4800 Gal 17,500 266 187 500 2006 2005 Sep G-5 7.9/10.9 Corn Hip Roof Barn Gehl Box Spreader 180 lbs/a 7 Ton 55 300 435 1,296 2006 2005 Sep G-6 11/10.9 Corn Compost Gehl Box Spreader 210 lbs/a 6 Ton 66 737 616 1,529 2006 2005 Sep G-7 9.8/17.1 Corn Compost Gehl Box Spreader 167 lbs/a 6 Ton 59 657 549 1,362 2006 2005 Sep M-10A 20.8/20.6 Corn Underground Storage Husky 167 lbs/a 4800 Gal 100,000 1,539 1,082 2,891 2006 2005 Sep M-8 22.1/21 Soybean Underground Storage Husky 292 lbs/a 3400 Gal 75,000 1,149 818 2,188 2006 2005 Sep M-9A 12.5/11.9 Oat Underground Storage Husky 202 lbs/a 2000 Gal 25,000 388 275 725 2006 2005 Sep M-9B 16.7/16.1 Corn Underground Storage Husky 198 lbs/a 4800 Gal 80,000 1,236 868 2,321 2006 2006 Apr G-8 13.5/13.4 Corn Underground Storage Husky 214 lbs/a 4800 Gal 65,000 999 702 1,877 2006 2006 Apr H-2 13/12.5 Alfalfa Underground Storage Husky 285 lbs/a 7300 Gal 95,000 728 1,027 2,756 2006 2006 Apr H-3 8.2/7.7 Alfalfa Underground Storage Husky 266 lbs/a 7300 Gal 60,000 918 648 1,738 2006 2006 Apr H-4 5.8/5.6 Corn silage Underground Storage Husky 248 lbs/a 8600 Gal 50,000 766 539 1,444 2006 2006 Apr H-5 17.8/17.5 Alfalfa Underground Storage Husky 222 lbs/a 7300 Gal 130,000 1,994 1,406 3,774 2006 2006 Apr H-6 9.6/9.3 Alfalfa Underground Storage Husky 218 lbs/a 7300 Gal 70,000 1,075 758 2,035 2006 2006 Apr HU-1 23.8/23.5 Corn silage Underground Storage Husky 111 ppm 8600 Gal 205,000 3,142 2,213 5,926 2006 2006 Apr HU-2 4/13.1 Corn silage Underground Storage Husky 258 lbs/a 8600 Gal 34,500 528 372 996 2006 2006 Apr HU-2 9/13.1 Corn silage Hip Roof Barn Gehl Box Spreader 258 lbs/a 12 Ton 109 594 846 2,529 2006 2006 Apr HU-3 15.4/14.7 Corn silage Dry Cow Barn Gehl Box Spreader 272 lbs/a 10 Ton 154 1,186 1,494 4,528 2006 2006 Apr HU-4 7.7/11.4 Corn silage Dry Cow Barn Gehl Box Spreader 84 ppm 10 Ton 77 593 747 2,264 2006 2006 Apr HU-4 4.4/11.4 Corn silage Compost Gehl Box Spreader 84 ppm 10 Ton 44 493 414 1,021 2006 2006 Apr HU-5 10.4/9.2 Alfalfa Compost Gehl Box Spreader 51 ppm 8.5 Ton 88 988 832 2,049 2006 2006 Apr HU-7 5.1/7.2 Alfalfa Compost Gehl Box Spreader 79 ppm 8.5 Ton 43 485 408 1,005
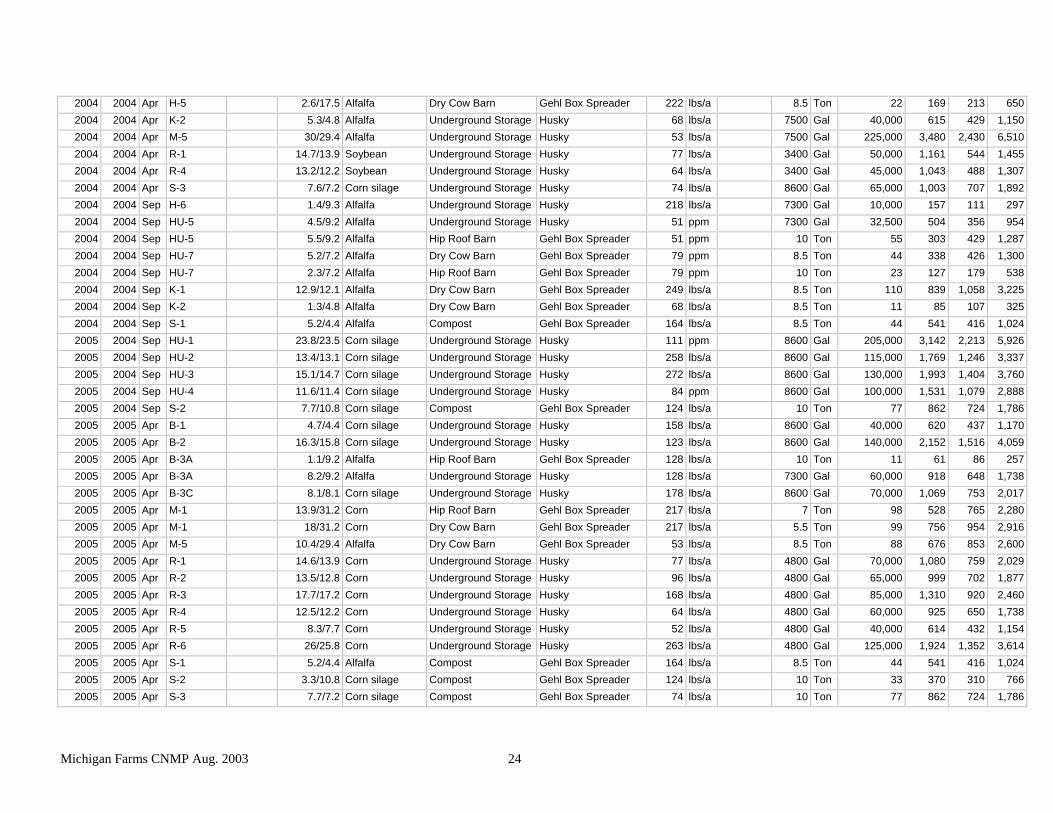
Crop year = crop year that manure nutrients are credited to. Available N includes storage and application losses. Acres = acres applied/total acres in field Available N, P2O5 and K2O are pounds per acre Table 17: Summary of Total Annual Acres and Nutrients Spread
Michigan Farms CNMP Aug. 2003 26
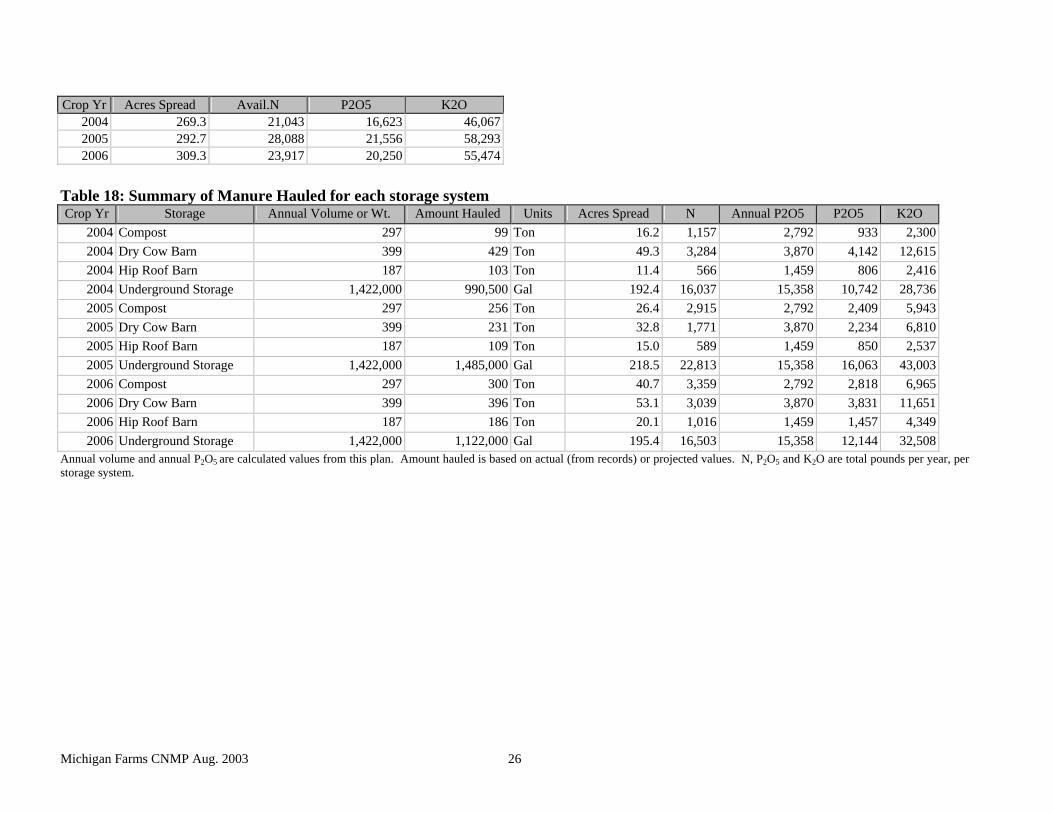
Crop Yr Acres Spread Avail.N P2O5 K2O 2004 269.3 21,043 16,623 46,0672005 292.7 28,088 21,556 58,2932006 309.3 23,917 20,250 55,474
Table 18: Summary of Manure Hauled for each storage system Crop Yr Storage Annual Volume or Wt. Amount Hauled Units Acres Spread N Annual P2O5 P2O5 K2O
2004 Compost 297 99 Ton 16.2 1,157 2,792 933 2,3002004 Dry Cow Barn 399 429 Ton 49.3 3,284 3,870 4,142 12,6152004 Hip Roof Barn 187 103 Ton 11.4 566 1,459 806 2,4162004 Underground Storage 1,422,000 990,500 Gal 192.4 16,037 15,358 10,742 28,7362005 Compost 297 256 Ton 26.4 2,915 2,792 2,409 5,9432005 Dry Cow Barn 399 231 Ton 32.8 1,771 3,870 2,234 6,8102005 Hip Roof Barn 187 109 Ton 15.0 589 1,459 850 2,5372005 Underground Storage 1,422,000 1,485,000 Gal 218.5 22,813 15,358 16,063 43,0032006 Compost 297 300 Ton 40.7 3,359 2,792 2,818 6,9652006 Dry Cow Barn 399 396 Ton 53.1 3,039 3,870 3,831 11,6512006 Hip Roof Barn 187 186 Ton 20.1 1,016 1,459 1,457 4,3492006 Underground Storage 1,422,000 1,122,000 Gal 195.4 16,503 15,358 12,144 32,508
Annual volume and annual P2O5 are calculated values from this plan. Amount hauled is based on actual (from records) or projected values. N, P2O5 and K2O are total pounds per year, per storage system.