Embed Size (px)
Citation preview

COMPREHENSIVE MULTI-YEAR
PLAN FOR IMMUNIZATIONS
(2017 – 2021)
THE GAMBIA

Contents
EXECUTIVE SUMMARY ........................................................................................................................ 4
LIST OF ABBREVIATIONS .................................................................................................................... 5
CHAPTER 1: COUNTRY INFORMATION ............................................................................................... 8
1.1 BACKGROUND ......................................................................................................................... 8
1.1.1 Demography .......................................................................................................................... 8
1.1.2 Socio-Economic Characteristics ........................................................................................... 8
CHAPTER 2: SITUATION ANALYSIS ..................................................................................................... 9
2.1 HEALTH SYSTEM ANALYSIS ..................................................................................................... 9
2.2.1 Function of the National Health System ............................................................................... 9
2.2.2 Organization of The Gambia National Health System........................................................ 10
2.2.3 Governance ......................................................................................................................... 10
2.2.4 The Referral System............................................................................................................ 12
2.2.5 The Tiers of The Gambia National Health System ............................................................ 12
2.2.5.1 Tertiary health Care (Hospitals) ......................................................................................... 12
2.2.5.2 Basic Health Services .......................................................................................................... 12
2.2.5.3 Village Health Services (VHS) ............................................................................................ 13
2.2.6. Partnership in Health ........................................................................................................... 14
2.2.7 Health Indices of The Gambia ............................................................................................. 18
2.2.8 Achievements and Challenges of the Health Sector ........................................................... 21
2.2.8.1 Achievements ...................................................................................................................... 21
2.2.8.2 Challenges ........................................................................................................................... 22
2.2.9 National Health Strategic Plan 2014-2020 .......................................................................... 23
2.2.10 Status of implementation of the cMYP 2012-2016 ............................................................. 24
2.3 Immunization System ............................................................................................................. 24
2.3.1 Routine Immunization Analysis .......................................................................................... 24
2.3.2 Accelerated Disease Control Analysis .................................................................................... 26
2.3.3 Routine EPI Immunization System Components Analysis ..................................................... 28
The EPI Programme ............................................................................................................................. 28
EPI Programme Goal ........................................................................................................................... 28
The EPI Structure ................................................................................................................................. 28
2.3.4 Strength, Weakness Opportunity and Threat (SWOT) Analysis ..................................... 36
CHAPTER THREE: IMMUNIZATION GOALS, OBJECTIVES, STRATEGIES AND KEY
ACTIVITIES............................................................................................................................................... 39
3.1 Program Goals and Main Objectives ...................................................................................... 39
3.2 Priority Objectives and Milestones ......................................................................................... 41
3.3 Aligning with GVAP ................................................................................................................. 41
3.4 Strategies .................................................................................................................................... 41
CHAPTER FOUR: COSTING, FINANCING AND FINANCIAL SUSTAINABILITY.......................... 60
4.1 Analysis of costing and financing (including Baseline). ............................................................... 60
4.2 Analysis of future resources requirements, financing and gaps. .......................................... 62
4.2.1 Total Immunization Cost ........................................................................................................... 62
4.2.2 Routine Immunization................................................................................................................ 63
4.2.3 Supplemental Immunization ...................................................................................................... 64
4.2.4 Cost by Strategy ......................................................................................................................... 65
4.3 Resource Requirement & financing gaps ..................................................................................... 67
4.4 Financing and Financial Sustainability Strategies components ................................................. 70
4.4.1 GAVI Graduation and Graduation Process ................................................................................ 70
4.4.2 Sustainability plan ...................................................................................................................... 70
CHAPTER FIVE: MONITORING AND EVALUATION FRAMEWORK ............................................. 72
ANNEXURE............................................................................................................................................. 107
Annex 1: GVAP Checklist .............................................................................................................. 107
Annex 2: Key Activities, Strategies and Objectives cMYP 2017-2021 ....................................... 107

EXECUTIVE SUMMARY

LIST OF ABBREVIATIONS AD Auto-Disable ADB African Development Bank ART Antiretroviral Therapy AEFI Adverse Events Following Immunization AFP Acute Flaccid Paralysis AIDS Acquired Immunodeficiency Syndrome APHO ARI Acute Respiratory Infections BEMOC Basic Emergency Obstetrics Care BCG Bacille Calmette-Guerin vaccine BHS Basic Health Service CAN Community Nurse Attendant CBR Crude Birth Rate CDR Crude Death Rate CEO Chief Executive Officer CHN Community Health Nurse CMD cMYP Comprehensive Multi Year Plan CUG DHPE Directorate of Health Promotion and Education DHR Directorate of Health Research DHRH Directorate of Human Resources for Health DHS Directorate of Health Services DNPS Directorate of National Pharmaceutical Services DOTS Directly Observed Treatment, Short Course DPI Directorate of Planning and Information DPT Diphtheria, Pertussis and Tetanus toxoid vaccine DRF Drug Revolving Fund DST Drug Sensitivity Test DSW Directorate of Social Welfare ENC Basic Emergency Newborn care EPI Expanded Programme on Immunization EVM Effective Vaccine Management FP Family Planning GAVI Global Alliance of Vaccine and Immunization GFATM Global Funds for AIDS, Tuberculosis and Malaria GBOS GDHS Gambia Demographic and Health Survey GDP Gross Domestic Product GIVS Global Immunization Mission & Strategies GLF Gambia Local Fund GNI Gross National Income GRISP Global Routine Immunization Strategies and Practices GVAP Global Vaccine Action Plan

HCW Healthcare workers HePDO HIV Human Immunodeficiency Virus HMIS Health Management Information System HPV Human Papilloma Virus HSRS Health Sector Requirement Studies HSS Health System Strengthening ICC Inter-agency Coordination Committee ICT Information Communication Technology IDSR Integrated Disease Surveillance Response IEC Information, Education and Communication IMF International Monetary Fund IMNCI Integrated Management of Neonatal and Childhood Illnesses IMR Infant Mortality Rate IWC Infant Welfare Clinic IPC Inter Personal Communication ISS JRF KABP LDCs Least Developed Countries MCH Maternal and Child Health MCNHRP Maternal and Child Nutrition and Health Results Project
MDG Millennium Development Goal
MenA Meningococcal A
MICS Multiple Indicator Cluster Survey MMR Maternal Mortality Rate MOFEA MOH&SW Ministry of Health and Social Welfare MPA Minimum Package of Activities MR Measles-Rubella MRC Medical Research Council MDFT Multidisciplinary Facilitation Teams NACP National AIDS Control Programme NCDs Non-Communicable Diseases NGOs Non-Governmental Organizations NHA NID National Immunization Day NITAG NPHLS National Public Health Laboratory Services NT Neonatal Tetanus OIC Officer in Charge OPV Oral Polio Vaccine PAGE Programme for Accelerated Growth and Employment PER

PHC Primary Health Care PHO Public Health Officer PIE Post Introduction Evaluation PPE Personal Protective Equipment PRSP Poverty Reduction Strategic Paper RCH Reproductive and Child Health RED Reaching Every District RHD Regional Health Director RHT Regional Health Team RPPHO Regional Principal Public Health Officer ROO Regional Operations Officer SBCC Social and Behaviour Change Communication SDD SIA Supplementary Immunization Activity SMART SMM SSA Sub Saharan Africa STI Sexually Transmitted Infection SWOT Strength, Weakness Opportunity and Threat TB Tuberculosis TBA Traditional Birth Attendants TCW TFR Total fertility Rate TT Tetanus Toxoid vaccine TV Television UN United Nations UNDP United Nations Development Programme UNFPA United Nations Fund for Population Activities UNICEF United Nations Children Fund US United States VDC Village Development Committee VPD Vaccine Preventable Disease VHS Village Health Service VHW Village Health Workers (VHWs) WHO World Health Organization YF Yellow Fever

CHAPTER 1: COUNTRY INFORMATION
1.1 BACKGROUND
1.1.1 Demography
The Gambia is a narrow strip of land on both sides of the river, stretching inland for
about 400 kilometers and occupies 11,000.square kilometers of land. The climate is subtropical
Savannah with an annual rainfall of between 800mm – 1200mm lasting for about 5 months (mid-
June to mid-October). The Gambia is predominantly an agrarian society with ground nut being
the main cash crop. However, tourism also plays an important role in the economy. The Republic
of The Gambia has an estimated total population of 1.8 million in 2015 with an annual growth
rate of 3.3%1. The Gambian population is characterized by its youthful nature. Forty-four
percent (44%) are below the age of 15 years; females constitute 51% of the total population and
women of the reproductive age (i.e. 15 – 49 years) represent 23.3%.
Figure X….. Administrative Map of Gambia
1.1.2 Socio-Economic Characteristics
The Gambia is amongst the Least Developed Countries (LDCs) with Gross Domestic Product
(GDP) per capita of US$ 560 (IMF Staff report 2011). The national economy is based mainly on
agriculture, with groundnut as the main export crop. The recent upturn in performance of the
economy has however been driven mainly by the service sector including tourism,
telecommunication, construction, etc. However it is the services sector that is the biggest
contributor to GDP, at 60%, with agriculture contributing about 30%. The economy grew by
7.2% in 2007 over the preceding fiscal year; national revenue has been increasing progressively;
1 National Population census 2003 projected

inflation reducing to low single digit levels and was 2.3% as at end May 2007 (PRSP II, 2007).
According to MOFEA, the Gambia has been registering annual GDP growth rates of more than
5% (2008-2011) during the current global economic crisis, and has maintained a stable
macroeconomic environment that is increasingly threatened by a mounting debt burden. The
Gambia is ranked 168 out of 187 countries in the 2011 UN Human Development Index and the
last poverty survey (2008) revealed that about 55% of the population lives below the poverty
line. The economy suffered a contraction of GDP to 4.3% in 2011 due to drought. This was due
to a fall in crop production of around 45 per cent in that year, despite several non-agricultural
sectors of the economy, such as tourism, performing well during 2011. The figures for 2012
show a rebound in GDP growth of 5.3 per cent due to a recovery in crop production and strong
growth in wholesale and retail trade, and construction. The services sector saw its total
contribution drop 1.8 percentage points from 16.3 per cent in 2011 to 14.5 per cent in 2012
(PAGE 2012).
CHAPTER 2: SITUATION ANALYSIS
2.1 HEALTH SYSTEM ANALYSIS
2.2.1 Function of the National Health System
The MOH&SW is responsible for the management of the health sector, which includes:
policy formulation and policy dialogue, resource mobilization, regulation, setting standards,
health service delivery, quality assurance, capacity development and technical support, technical
advice to other government line Ministries on matters of public health importance, provision of
nationally coordinated programmes such as epidemiology and disease control, coordination of
health research and monitoring and evaluation of the overall sector performance. Due to on-
going health system reforms, such as decentralization of health services, some of the functions of
the central level management have been delegated to national semi autonomous institutions
including referral hospitals, specialist and general hospitals, professional councils, national drug
authority and other regulatory bodies as well as local government authorities and research
activities conducted by some research institutions.
The Ministry is headed by a Minister who is appointed by the President and head of state,
and assisted by a Permanent Secretary, who serves as the Chief Administrator of the Ministry.
Two deputy permanent secretaries also assist the Permanent Secretary; The Deputy Permanent
Secretary Technical assists the Permanent Secretary on technical operations of the Ministry,
while the Deputy Permanent Secretary Administration and Finance assists the permanent
secretary on administrative and financial matters.

2.2.2 Organization of The Gambia National Health System
The current organizational structure at the Ministry comprises of two departments
namely; Medical and Health Department and Social Welfare Department. The department of
Medical and Health comprises of; Directorate of Health Services (DHS); Directorate of Planning
and Information (DPI); Directorate of National Public Health Laboratory Services (NPHLS);
Directorate of Health Promotion and Education (DHPE); Directorate of Health Research (DHR);
Directorate of Human Resources for Health (DHRH) and Directorate of National Pharmaceutical
Services (DNPS). The Department of Social Welfare comprises of one directorate, which is the
Directorate of Social Welfare (DSW).
The public health sector covers 90% of the health facilities in the country, complemented
by a few NGO and private sector run health facilities, mainly located in the Greater Banjul Area.
Thus, in the Gambia, the provision of healthcare is dominated by the Government facilities, with
a minimum (subsidized) charge for accessing treatment under the basic care package at the three
levels of health service delivery. The large majority of private health facilities are located in the
Greater Banjul Area, making choice in health services delivery point in the rural community
non-existence.
2.2.3 Governance
The central level is the decision-making point for the health sector’s internal issues. The
six directorates of the two departments plan, direct, manage and coordinate all Government
health care activities countrywide through specialized units. The relationship between these
directorates is neither vertical nor horizontal but iterative. The country is divided into seven
health regions each with a regional health team (RHT), headed by a Regional Health Director
(RHD). The RHTs are responsible for the day-to-day administration, management and
supervision of health services in their respective regions. They have overall responsibility for the
primary and secondary health care facilities and their staff within their regions. The Regional
Public Health Officer, Regional Public Health Nurse, Senior Administrative Officer and other
support staff, assists the RHDs. The tertiary level, which comprises the hospitals and teaching
hospital on the other hand, has semi-autonomous boards and headed by CEOs and CMDs
respectively.
The public health system is complemented by more than 60 private health facilities, NGO
and community managed health facilities. Formal health services in The Gambia are delivered
mostly in health facilities funded by the Government of The Gambia. These facilities are also
supported by a number of donors and NGOs. NGOs and private practitioners also provide
services though most of them are located in the Greater Banjul Area. In addition, there are a
large number of private pharmacies, drug sellers, and traditional healers that deliver health
services of some kind.

Figure X… Organogram of The Gambian Health System
Table X …: Health facilities by type and Region
Health Facility Type WHR1 WHR2 NBWR NBER LRR CRR URR Total 2012
Hospitals 4 1 0 1 0 1 1 7
Major Health Centres 1 1 1 1 1 1 6
Minor Health Centres 5 4 4 6 5 7 10 41
NGO Facilities and Clinics
5 4 2 12 0 4 18
Private Health Facilities
6 9 0 0 12 5 23
Community Managed Facilities
7 9 6 5 4 8 1 40
Specialized RCH Clinics
2 0 0 10 10 4

RCH Outreach Clinics
13 24 32 31 34 62 61 257
RCH Base clinics sites 18 6 6 7 5 9 7 58
Total RCH clinic sites 31 30 38 38 39 71 68 315
PHC Key Villages 3 12 13 9 8 17 12 74
Total PHC Villages 26 92 100 95 92 159 70 634
Service Clinics 40 0 1 1 1 18
Total Service Delivery Points
91 150 151 148 145 251 160 1,096
Source: Health Service Statistics Report, 2012
2.2.4 The Referral System
Activities within the private sector of the health care delivery service are regulated and
monitored by the Directorate of Health Services, a function that the regulatory bodies should be
involved. The relationship between MoH&SW and the private sector health facilities is cordial.
The Government is the main provider of health services in the country. The Government through
its annual budgetary allocation to the health sector funds health care services. Donor partners
such as UNICEF, WHO, UNDP, UNFPA, Global Fund, ADB etc. also give maximum support to
the health sector through programmes and projects’ support.
2.2.5 The Tiers of The Gambia National Health System
2.2.5.1 Tertiary health Care (Hospitals)
Currently there is one teaching and specialised hospital (Edward Francis Small Teaching
Hospital ) and five general public hospitals namely: Sheikh Zayed Regional Eye Care Centre in
Kanifing, Bansang Hospital in Central River Region, Armed Forces Provisional Ruling Council
hospital in Farafenni, North Bank Region, Sulayman Junkung General Hospital in Bwiam,
Serekunda General Hospital in Kanifing and Jammeh Foundation for Peace Hospital in
Bundung. They have semi-autonomous status, with hospital management boards, and are not
generally supplied or supervised by the RHTs. They do, however, have some important
responsibilities to the RHTs, including reporting diseases incidences, maternal deaths, and
providing feedback on patients referred to them by the VHS and basic health facilities. The
administration at the hospitals generally consists of the Chief Executive Officer and several
administrative staff.
2.2.5.2 Basic Health Services
Basic Health Service is at the secondary level of the national health systems and it
comprises of major and minor health facilities. The major health centre serves as the referral
point for minor health centres for services such as: Family planning (prescribe contraceptives

and follow-up users; perform surgical contraception for men and women), Maternal and child
Health (Provide basic gynaecological services; manage normal and complicated deliveries
(including C-section); counsel mothers on infant and child nutrition, audit maternal deaths;
provide antenatal, postnatal care (in facility and through treks) Disease Management: (Diagnose
and treat cases of diarrhoea/dehydration, ARI, malaria, HIV/AIDS, STIs, leprosy and TB;
manage simple mental health cases ), Minor Surgery, Radiology Services, and Laboratory
Services and Referral (refer and transport serious illnesses and injuries, or cases needing
specialist care, to the nearest public hospital). The standard bed capacity for major health centres
ranges from 110-150 beds per 150,000 - 200,000 population. The minor health facilities provide
the following services: RCH services, FP services, Nutrition services, control of common
endemic diseases, Health promotion and protection and provision of essential drugs and
vaccines. A minor health facility has between 20–40 beds per 15000 population and should
provide 70% of the basic health care package.
These BHS facilities provide the core outpatient (OPD) clinics and the Reproductive and
Child Health (RCH) services. OPD clinics usually are held daily and treat children age five and
above and all non-pregnant adults, as well as children less than five years and pregnant women.
RCH clinics provide most of the health care to children under the age of five (Infant Welfare
Clinic, IWC) and antenatal care for pregnant women including immunizations services. RCH
base clinics are held at the facility at least once per week. Trekking team visits a set schedule of
outreach clinics in each health facility’s catchments area. These trekking stations are visited at
least once a month, depending on the catchment area population. The RCH team usually consists
of a nurse midwife, health facility-based CHNs or CHN/midwives (with the addition of the
VHS/CHN at some of the clinics), Community Nurse Attendant(s) (CNAs), an APHO for EPI
activities and a Drug Revolving Fund (DRF) collector. The number of staff will vary with the
size of the facility and the catchment area. User fees were introduced in 1988 as part of the cost
recovery programme. However, government introduced a policy for free maternal and child
health services in 2007.Growth monitoring of children under five, antenatal care, immunizations
and family planning services are all provided through these RCH base and trekking clinics.
Supervision of the RCH team is carried out by the basic health facility and, ultimately, by the
RHT.
Eighteen facilities run by NGOs supplement the government-run facilities and are
supervised by the RHT in whose jurisdiction they operate. The Medical Research Council
(MRC) is British research organizations that provide clinical services at Fajara, Keneba, and
Basse. Twenty-three private health clinics and many pharmacies also diagnose and prescribe
treatment, particularly in the urban area. These are not integrated into the government system,
and provide services for fees paid by the patients.
2.2.5.3 Village Health Services (VHS)
Primary health care villages have been selected from those with a population of 400 and
above or from those located in relatively isolated areas. In these villages, village health workers

(VHWs) and traditional birth attendants (TBAs) are selected by the Village Development
Committee (VDC). They are given 6 (TBAs) to 8 (VHWs) weeks of formal training using a
standardized curriculum at a designated place by the MOH&SW and partners. These workers are
issued a start-up supply of medication and equipment (minimal) by Government. A fee of D
0.75($0.02) is charged for each patient seen. This money is paid to the VDC treasurer to be used
for the purchase of additional drugs and supplies as needed. The VDC provides support to
VHWs through in-kind contributions or voluntary labor in their farms. The VHW functions as a
primary health care provider for minor illnesses and injuries, serving males and females of all
ages. In addition, the VHW functions as a community based health educator and adviser. The
TBA, as their name implies, have been part of the culture long before the formal health care
system was introduced. They function as trained birth attendants, as antenatal and postnatal
advisers, family planning distributors and health educators. Both TBA and VHW are expected to
refer serious cases to the local health facility. The VHWs and TBAs are supervised and given
continuing education by VHS/Community Health Nurses (VHS/CHN) who oversees circuits of 4
to 10 PHC villages. These VHS/CHNs in turn report through their nearest BHS facility and is
supervised by the OIC of that facility and by the Regional Health Team. There are 634 PHC
villages organized into 69 circuits. The CHNs were provided with motorcycles for supervisory
VHS trekking. The VHS/CHNs are essential for the successful functioning of primary health
care in The Gambia.
Effective and efficient referral services from one level of health care to another
(community to secondary and secondary to tertiary), are important in patient management and
disease outcome. However, the current referral system still has major challenges. Some of the
challenges include inadequate and ill equipped ambulances, intermittent shortage of fuel,
inadequate feedback mechanism, inadequate referral protocol and guidelines and late referrals
especially at community level. This situation is further compounded by limited (only receiving)
telecommunication services within health facilities.
2.2.6. Partnership in Health
Effective partnership and participation can contribute significantly to financing health.
However, priorities of actors may differ from that of the national health agenda. This promotes
vertical health programmes, inefficient utilization of health services which also has negative
impact on the sustainability and overall performance of the health system. For these reasons
better coordination mechanism of all actors and partners in health and healthcare delivery is
required for sustainability and better health outcomes. Partnership will be based on consensus
with partners on the strategic interest of the health sector and the common basket approach will
form the basis for donor funding in health.
It is in the light of the aforementioned reasons that the national health policy provides a
comprehensive framework for support to the sector, but is not sufficient alone to guarantee a
coordinated approach to health sector development. The composition of stakeholders in the
health sector is complex; there is a diverse range of partners who provide support in many

different forms. Such an environment necessitates the need for partner coordination, which is
deemed critical for the successful implementation of any National Health Sector Strategic Plan.
In an attempt to strengthen the existing coordination mechanisms, the Ministry of Health
in 2011, established coordination mechanisms such as: The Resource Mobilization Committee,
Fellowship Committee, Institutional Committee, Bilateral Committee, MOU Committee, Project
Management and Monitoring Committee, Hajj Committee, and the Regional Health Advisory
committee.
National, regional and international cooperation are in line with the activities outlined in
the health sector strategic plan by the Ministry of Health for the implementation of the Health
Sector Policy. Multilateral, bilateral and non-governmental cooperation is founded on the basis
of mutual agreement between the Government and the donor country or organization.
Mechanisms for the joint management and evaluation of resources to support the functioning of
health services are to be strengthened. The mechanisms for national and international
coordination, as initiated by the MOH&SW and certain partners, are to be put in place under the
umbrella of a sector-wide approach.
The health mapping exercise of 2001 defined the packages that were being implemented
at the different levels of the health care delivery system. This was based on the reports of 3
documents, Health Sector Requirement Studies, 1995 (HSRS); the 1998 PER and the Report on
extended Senior Management meeting, MoH&SW, December 1998 (MoH&SW SMM). The last
review of the service delivery packages was based on the DOSH SMM report, where the
packages were defined for PHC level, including RCH trekking sites, secondary level,
distinguishing between minor and major health centre services; and tertiary level. Since then, no
review of the service delivery packages has taken place, whilst the challenges of the health sector
significantly changed with an increasing prevalence of Non communicable diseases, to cite an
example.
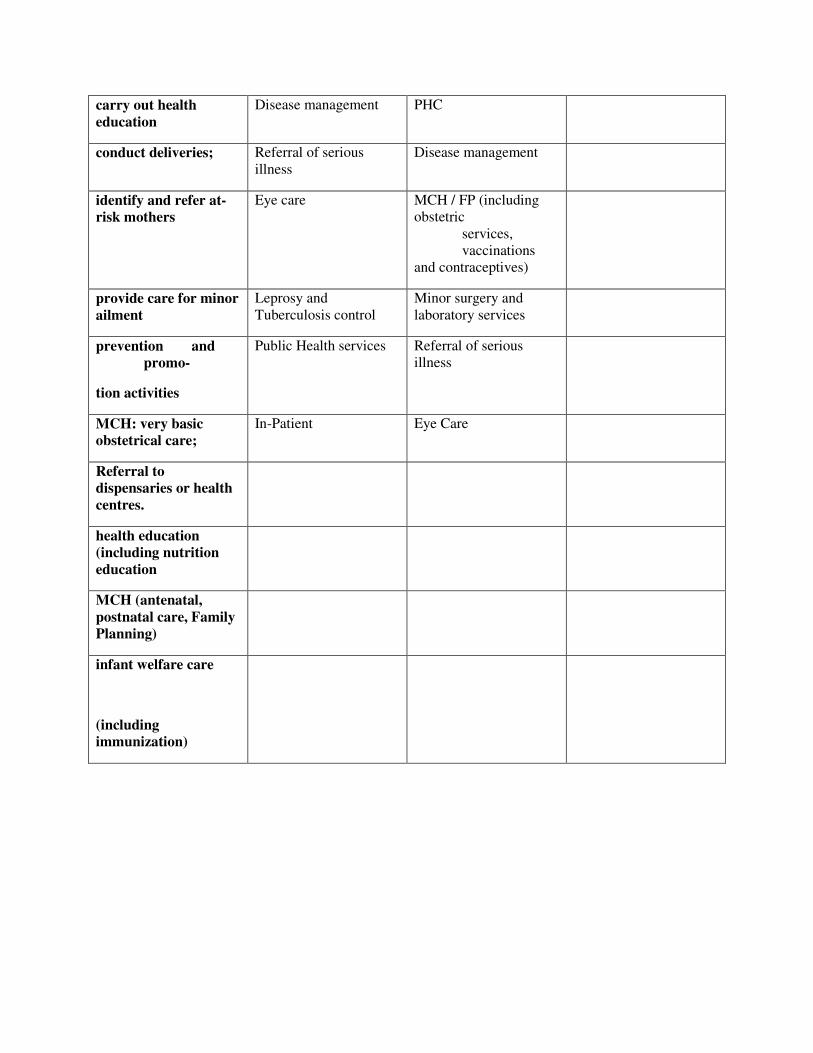
Table X:… Components of basic health care package at the various levels of the health care
delivery system
PHC Minor H/C Major H/C Hospitals
Maintain supply of essential drugs;
MCH/FP (including obstetric services, vaccinations and contraceptives)
Out-patient services All services provided by major health centres
Provide outpatient care,
make home visits;
PHC In patient Specialized care using
more sophisticated equipment.
carry out health education
Disease management PHC
conduct deliveries; Referral of serious illness
Disease management
identify and refer at-risk mothers
Eye care MCH / FP (including obstetric services, vaccinations and contraceptives)
provide care for minor ailment
Leprosy and Tuberculosis control
Minor surgery and laboratory services
prevention and promo-
tion activities
Public Health services Referral of serious illness
MCH: very basic obstetrical care;
In-Patient Eye Care
Referral to dispensaries or health centres.
health education (including nutrition education
MCH (antenatal, postnatal care, Family Planning)
infant welfare care
(including immunization)

Table X….: Minimum Health Care Package (Health Policy 2012)
VHS Minor H/C Major H/C Regional Hospital
Teaching Hospital
Primary care service including:
Maternity care (antenatal, delivery and postpartum
All services provided at minor H/C level
All services pro- vided at major H/C level
All services provided at regional hospital level
treatment of minor illnesses and referrals
Family Planning Comprehensive emergency obstetric care (including theatre and blood transfusion services)
Specialist care and service
Specialist hospital services (in- and out-patient services)
environmental health & sanitation
STIs/RTIs/HIV/AIDS prevention and control
Functional theatre Higher level referral services
Post-mortem and embalmment ser-vices
antenatal, delivery and postpartum care,
IMNCI Comprehensive emergency new- born care
Specialized dental and eye care services
Overseas referral
home visits, Immunization In-patient services Comprehensive laboratory services
community health promotion activities
Neonatal and child health
Pharmacy Services Radiology services
Maternal and child nutrition
Basic Lab. services including HIV and TB Screening.
Basic EMOC
Basic emergency new-born care (ENC)
Disease prevention and control( malaria, TB, etc)
Health protection and control
Basic Lab services(HB, BF, VDRL, Urine analysis TB and HIV

screening)
In-Patient
Referral Service
Dispensary
Eye Care Service
Out-Patient
Registration of birth and death
Regarding the implementation of the minimum package of activities (MPA) as defined in
2001, certain discrepancies exist across the levels, in that at the lower level (PHC) there is higher
implementation of the package than at higher levels (Major H/Cs). In addition, variance in
implementation has also been observed at the same level. For instance 50% of major health
centres are currently equipped to perform Comprehensive emergency obstetric care (including
theatre and blood transfusion services). Basse, Brikama and Soma are currently functional in
terms of EMOC services, however, within the last ten years the number of major health centres
that provide EMOC services varies between different facilities.
Over the last ten years, the disease pattern has changed significantly with increasing prevalence
of non- communicable diseases (Table….: Disease Burden). The MPA as last defined has not
accommodated the screening of cancers, testing for diabetes, haemodialysis, etc. These
deviations, among others underline the urgency to review and implement health care packages
for different levels of the health care delivery system.
2.2.7 Health Indices of The Gambia
The Crude Birth Rate (CBR) is 40.5 per 1000 population (Gambia Demographic and Health
Survey [GDHS], 2013) and the Crude Death Rate (CDR) is estimated at 9.24 per 1000 population
(World Bank Report, 2010). The Infant Mortality Rate (IMR) is 34 per 1000 and Under-5
Mortality Rate (>5 MR) is reported at 54 per 1000 live births (GDHS, 2013), Maternal Mortality
Ratio (MMR) is 433 per 100000 live births (GDHS 2013). The Gambia is among the least
developed and poorest countries; ranked 168 out of 182 countries in the Human Development
Index of 2011 with a per capita Gross National Income (GNI) of about $US 1,282(UNDP, 2011).
61.2% of the population lives below the poverty line with a marked variation between urban and
rural populations. Sixty percent of the population lives in the rural area; and women constitute
50.5% of the total population. The high fertility level of 5.6 births per woman (GDHS, 2013) has
resulted in a very youthful population structure. The annual population growth rate is 3.3%
(GDHS, 2013). Nearly 44% of the population is below 15 years and 19% between the ages 15 to

24 years; whilst those aged 65 years and above account for about 3.4% of the population,
(Multiple Indicator Cluster Survey [MICS], 2006).
The health sector despite remarkable achievements registered in the past is still under great
pressure due to a number of factors: high population growth rate, increasing morbidity and
mortality, insufficient financial and logistic support, deterioration of physical infrastructure,
inadequacies of supplies and equipment, shortage of adequately and appropriately trained health
personnel, high attrition rate as well as inadequate referral system. Poverty, traditional beliefs
and low awareness have led to inappropriate health seeking behaviours thus contributing to ill
health.
Indicators of child and maternal mortality are improving, however more work need to b done in
the following areas: poverty, low literacy, prevalence of communicable and non-communicable
diseases such as Malaria, Diarrhoea, Pneumonia, Tuberculosis, Accidents, Hypertension,
Cancers, and Pregnancy related conditions, and malnutrition and HIV/AIDS and its spread. Most
of these diseases can easily be prevented if appropriate environmental and lifestyle measures are
taken, with more attention paid to development of health promotion and prevention actions than
merely focusing on curative care alone.
HIV prevalence stands at 1.9% with the main route of transmission being through heterosexual
contact. However, in children, the major mode of spread is by transmission from mother to child
during pregnancy, delivery and through breast-feeding. On the other hand, under-nutrition
continues to be a major public health problem in the country, with 25% of children chronically
malnourished or stunted and 8% severely stunted. 12% of the children were found to be wasted
or acutely malnourished, with 4% severely wasted. 16% were found to be underweight, with 4%
severely underweight (GDHS 2013), aggravated by poverty, food deficit, rural-urban migration,
environmental degradation, poor dietary habits, low literacy levels, poor sanitation, infections
and a high population growth rate.
Like many developing countries, The Gambia is also experiencing the ‘double burden of
malnutrition’ with the emergence of Diet-related Non-Communicable Diseases (NCDs) such as
diabetes, hypertension, coronary heart disease, obesity, and some forms of cancers. With
infectious diseases still a major public health burden, the increase in prevalence of diet-related
non-communicable diseases poses a challenge for the allocation of scare resources and is
exerting immense pressure on an already over-stretched health budget.
Table X… Basic Health Profile of Gambia
No Indicator Rate/Ratio Source (Year)
1 Infant Mortality 34/1000 GDHS, 2013

2 Neonatal Mortality 22/1000 GDHS, 2013
3 Under Five Mortality 54/1000 GDHS 2013
4 Crude Birth Rate (CBR) 40.5/1000 DHS, 2013
5 Crude Death Rate 9.24/ 1000 (World Bank Report 2010)
6 Growth Rate 3.3% GBOS, 2013 (2013 census)
7 Maternal Mortality 433/100000 GDHS, 2013
8 Antenatal care
a. At least once by skilled personnel 98.9% GDHS,2013
b. At least four times by a skilled personnel
77.6% GDHS, 2013
9 Deliveries attended by skilled personnel 57% GDHS, 2013
Total fertility Rate (TFR) 5.6% GDHS, 2013
Contraceptive Prevalence 9% GDHS, 2013
Family planning Unmet need 24.9% GDHS, 2013
11 HIV prevalence 1.9% GDHS, 2013
12 Life expectancy 62. 5 Years-males
65 years-females
63.4 see more up to date
GDHS, 2013
13 Literacy Rate 69.9% GDHS, 2013
14 Poverty Index 61.2% UNDP, 2011
15 GDP per capita USD 428 MoFEA, 2014
16 Total Health expenditure per capita (USD)
USD28.08 NHA, 2013
17 Total government expenditure on health per capita (USD)
USD 7.89 NHA, 2013
18 Government expenditure on health as percent of general government expenditure
12.4% NHA, 2013
19 General government expenditure on health as percent of total expenditure on
28% NHA, 2013

health expenditure on health
20 Out of pocket expenditure on health as percentage of total health expenditure health expenditure
21.21% NHA, 2013
21 Malaria incidence 10% or 103/1000 MOH&SW 2012
22 Professional Health workers per 10000 population
8.3/10000 MOH&SW 2012
23 Doctors per 10000 population 1.1/10000 MOH&SW 2012
24 Nurses per 10000 population 3.2/10000 MOH&SW 2012
25 Midwives per 10000 population 1.8/10000 MOH&SW 2012
2.2.8 Achievements and Challenges of the Health Sector
2.2.8.1 Achievements
A five-year strategic plan 2010-2014 was developed but the institutional arrangement
was not in place to steer and monitor its implementation. Notwithstanding the health sector has
registered several achievements: For instance, there is high political commitment for TB control
in the Gambia. Diagnosis and treatment of TB is provided free of charge to all irrespective of
nationality. There has not been any stock-out of anti-TB drugs in The Gambia. With the support
of Global Fund, NLTP has increased Directly Observed Treatment, Short Course (DOTS)
centres as part of the scale up plan from 11 in 2006 to 36 centres in 2013 including the Mile 2
central prison for infection control measures. Diagnosis of new smear positive cases increased
from 1306 cases in 2008 to 1429 cases in 2012. The proportion of new smear positive TB cases
(SS+) in all notified cases has increased from a baseline of 52% in 2003 to almost 64% in 2012.
According to the routine HIV surveillance report, HIV prevalence among TB patients is
estimated at 16%. In 2012, 69% and 98% of TB/HIV co-infected patients were initiated on ART
and CPT respectively. NLTP has succeeded in the procurement a GeneXpert that can test many
samples for Drug Sensitivity Test (DST) and culture in a short period of time. TB prevalence
survey was successfully conducted under the RD 9 TB grant, a second of its kind in Africa.
Finally, defaulter rate declined from 14% in 2005 to 2% in 2011 while treatment success rate
increased from 86% in 2006 to 89% in 2012, exceeding the WHO target of at least 85%.
1. The HIV prevalence rate is 1.57% for HIV1 and 0.26% for HIV2 (MOH&SW 2012)
compared with 2.8% for HIV1 and 0.9% for HIV2 (MOH&SW 2006).
2. There has been an increase in national coverage for penta-3-immunization of children
from 96% in 2011 to 98 % in 2012 (MOH&SW2012).
3. Several policy documents have been developed on Health Financing, Non Communicable
Disease, Tobacco Control, Tuberculosis and HIV, Reproductive Child Health, Health

Research, Human Resource for Health, Mental Health, Traditional Medicine, and
Prevention of Mother to Child Transmission, Social Welfare, and Disability.
4. The infant and under-five mortality rates were 98/1000 live births and 141/1000 live
births in 2006 (MICS, 2006), which declined to 81/1000 and 109/1000 live births in 2010
respectively (MICS, 2010). These rates further declined to 34 and 54/1000 live births in
2013 respectively (GDHS, 2013).
5. Maternal mortality ratio dropped from 1050/100000 live births in 1990 (MoH&SW 1990)
to 730/100000 live births in 2001(MoH&SW 2001) and further reduced to 433/100 000
live births in 2013 (GDHS, 2013).
6. The proportion of underweight children has increased from 17% in 2010 (MICS, 2010) to
22.6% in 2015 (SMART, 2015).
2.2.8.2 Challenges
Over the years, significant achievements were registered by the Health and Social
Welfare Sector as highlighted above. However, in recent past frequent changes in senior
management has hindered policy implementation, which also has the potential for eroding the
much-needed institutional memory. In addition, there are limited human, financial and material
resources to meet the growing demand of health and social welfare services at national, regional
and community levels. High attrition rate of skilled health and social workers attributed to a
number of factors such as poor working conditions and challenged personnel management
(MOH&SW 2005). Furthermore, there is insufficient supply of drugs, basic equipment,
consumables and other logistics including inadequate health and ICT Infrastructure. This
situation therefore hinders efforts to reduce the burden of communicable and non-communicable
diseases. Significant gains have been registered in the health service delivery system such as
Expanded Programme on Immunisation (EPI), Reproductive and Child Health (RCH). However,
sustaining the gains in service management areas such as Health Management Information
System (HMIS), Health Financing, and referral services remain a challenge to the health system
in general. Below is a brief summary of some of the key areas requiring urgent actions for
greater achievements in the health sector.
Over the years, government has continually invested in the development of the human
resource base for the health sector through the University of The Gambia (school of Medicine
and Allied Health Sciences), the Gambia College (School Nursing and Midwifery and The
School Of Public Health), the School for Enrolled Nurse in Bansang and the School for
Community Health Nurses in Mansakonko. Thus, more medical doctors, nurses, nurse midwives,
pharmacists, public health officers and laboratory technicians are now providing invaluable
health services to the Gambian Population. In addition, development partners such as the Global
fund through the HIV/AIDS-Health System Strengthening (grant 8) has supported the training of
nurses, laboratory technicians, pharmacy assistants and village health workers all geared towards
improving health care delivery in The Gambia. Despite all these laudable initiatives and

achievements, the physician population ratio estimated at 1.1 per 10,000 and the nurse/midwives
-population estimated at 8.7 per 10,000 population in 2013 (WHS, 2015), underscore the urgent
need for scaling-up training and retention of medical doctors, nurses and midwives in the health
sector. In addition, the number of public/ environmental health officers increased from 100 in
2013 to 128 in 2014 (Human Resource for Health Directorate, 2014).
Government expenditure on health as percentage of total government expenditure in 2013
amounts to 12.5% and the total expenditure on health as percentage of GDP reported at 5.6% in
2013 (NHA, 2013). However, Government has steadily shown commitment in the budget
apportioned to the health sector, notwithstanding the 15% allocation from the national budget, as
pledged in the Abuja Declaration is still not achieved. In addition, out-of-pocket expenditure as
percentage of private expenditure on health estimated at 30.7% (NHA, 2013) continues to impact
negatively on the livelihood of the ordinary Gambians resulting in catastrophic health
expenditure.
Whilst significant investment has been made in terms of availability of modern health
care facilities across the country, diagnostic and rehabilitation services/facilities are limited and
inequitably distributed. Similarly, adequate and skilled human resource to operate efficiently
such services/machines also poses some challenges. In addition, ICT infrastructure and services
are largely confined within the urban centres, but the low bandwidth and human resource
capacity presents a challenge especially when plans are underway to introduce e-health services
in the Ministry.
Government through the health ministry has invested greatly in medical consumables
including essential drugs. However, owing to the high demand vis-a-vis population growth
continues to exert pressure on the availability of drugs, and as such drug shortages in health
facilities are often being reported. For instance, an assessment of the health sector based on the
PAGE mid-term evaluation report 2012-2013, revealed 17% and 15% of male and female
respondents respectively reported that their main reason for dissatisfaction with the health sector
was primarily due to drug stock-out.
2.2.9 National Health Strategic Plan 2014-2020
The strategic priorities are in line with The National Health Policy, the PAGE, MDGs
and Vision 2020 targets. These priorities are:
1. Maternal, neonatal, infant and child health services
2. Surveillance, prevention, control and management of communicable and Non
communicable diseases (NCDs)
3. Improve knowledge and skills of health care providers at all levels
4. Build capacity of the Health Management Information System (HMIS) and data
management system within the health sector

5. Improve health infrastructure at primary, secondary and tertiary health care levels
6. Establishment of a National M& E coordinating body
Vision: Provision of quality and affordable Health Services for All By 2020
Mission: Promote and protect the health of the population through the equitable provision of
quality health care.
Goal: Reduce morbidity and mortality to contribute significantly to quality of life in the
population.
The strategic objectives of the Gambia health sector strategic plan are;
1. To provide high quality basic health care services that is affordable, available and
accessible to all Gambian populace.
2. To reduce the burden of communicable and non-communicable diseases to a level
that they cease to be a public health problem
3. To ensure the availability and retention of highly skilled and well-motivated HR for
Gambian populace based on the health demands
4. To increase access to quality pharmaceutical, laboratory, radiology and blood
transfusion services to all by 2020
5. To improve infrastructure and logistics requirements of the public health system for
quality health care delivery
6. To establish an effective, efficient, equitable and sustainable health sector financing
mechanism by 2020
7. To improve the effectiveness and efficiency of Health Information System for
Planning and decision making to yield improved service delivery
8. To ensure effective and efficient health service provision through the development of
effective regulatory framework and Promoting effective coordination and partnership
with all partners
2.2.10 Status of implementation of the cMYP 2012-2016
2.3 Immunization System
2.3.1 Routine Immunization Analysis
Immunization coverage
During the period under review of the cMYP 2012-2016 for which data were available from the
JRF 2012-2015, coverage of over 90% has been attained for both DPT3 containing antigen and
measles at national level which was what the program set to achieve between 2012 and 2015 as

shown in Table…. In addition, the DHS 2013 has revealed that the percentage of fully
immunized children stood at 76%. There is also consistency between the administrative DPT3
containing antigen coverage with that of the WHO-UNICEF estimate of national immunization
coverage in 2012 and 2013.
Immunization demand
Based on the National Data from EPI for 2014 and 2015, the drop-out rate for both DPT1-DPT3
reported 2.03 and 1.97% respectively, BCG-Measles at 7.2% and 9.09% are both within the
WHO acceptable range (ie. 0-10%).
Immunization equity
Based on the DHS 2013, people in the lowest income class utilize immunization services more
than those individuals in the highest wealth quintile, giving us a percentage gap of -7.3%. DPT3
containing antigen coverage of >80% was attained in all the seven health regions of the Gambia
as shown in the JRF2012-2015 in Table ….
New vaccine introduction
As shown in Table … , three new vaccines were introduced into routine immunization service
namely; Measles 2nd dose (2012), Rota virus (2013) and IPV (2015). Since the introduction of
the Rotavirus, for instance there has been an increase in the DPT3 containing antigen coverage
from 96% to 97% in 2015, which connotes that the new vaccine had impact on routine
immunization for the period.
Table X:……..Situation analysis of routine immunization in The Gambia
Routine immunization
Suggested indicators National status
Source of Data
2012 2013 2014 2015
Immunization Official coverage estimates % DTP3 containing antigen.
98% 98% 96% 97% JRF 2012-2015
coverage Official coverage estimates % Measles (1) 93% 94% 96% 97% JRF 2012-2015
Other official coverage estimates as per immunization schedule (DPT3)
98% 97% - - WUENIC
Most recent survey coverage % DTP3 - 87.7% - - DHS 2013
Percentage fully immunized child 76% DHS 2013
Immunization demand
Percentage drop-out DTP1 – DTP3 - - 2.03% 1.97% NATIONAL
DATA
Percentage drop-out BCG – Measles - - 7.2% 9.09% NATIONAL
DATA
Immunization equity
Percentage gap in DTP3 between highest and lowest socio-economic quintiles
-7.3 DHS 2013
Number and proportion of districts with DTP3 coverage >80%
7 7 7 7 JRF 2012 -2015

Number of high-risk communities identified for accelerated routine immunization programming
- - - - -
New vaccines introduction
Number of new vaccines introduced into the routine schedule in the last plan period
1 1 0 1 GAVI
APPLICATION
Pentavalent coverage 98% 97% 96% 97% JRF 2012-2015
Rotavirus coverage ND ND 92% 97% JRF 2014-2015
2.3.2 Accelerated Disease Control Analysis
Poliomyelitis:
The coverage for OPV3 has steadily surpassed the national target of 90% from 2012 to 2015
(JRF 2012-2015). The country had at least one round of polio campaign in 2012, 2013 and 2014
as part of effort to sustain her polio free status. Over the years, improvements in disease
surveillance particularly on AFP was observed with a Non-AFP rate of 5.6/100000 children
under 15 years of age in 2015 (Weekly WHO-IST bulletin 2015).
Maternal and Neonatal Tetanus (MNT)
Whist significant improvements in TT2+ coverage has been realized in 2015, it remains to be a
major challenge. Despite the incorporation of MNT in The National IDSR strategy, cases of
MNT are not being reported. The DHS 2013 has indicated delivery at health facility level at
62.6%.
Measles and Rubella
Measles (1st dose) has steadily increased with over 90% of the national target for the period
2012-2015. However, measles 2nd dose introduced in late 2012 has witnessed a remarkable
increase over the years, however laboratory confirmed cases for measles has improved from 1 in
2014 to 71 cases in 2015, which may suggest that there was pockets of children still un-
immunized against measles. The increase in the number of confirmed measles cases is due to
increased capacity of surveillance officers in measles sample collection and investigation, in
which incentives were tied to outputs, several suspected cases of measles have been reported
over the period 2012-2015.
Yellow fever
Over 95% coverage has been registered in The Gambia from 2012-2015 exceeding the national
target of 90% (JRF 2012-2016). However the number of districts reporting >1 suspected case of
yellow fever were above 20 and there was no round of yellow fever campaign conducted yet.
Epidemic meningitis

Data for routine Meningococcal A is not available as it is not part of the routine immunization
services for the Gambia. However, Meningococcal A campaign held in 2013 achieved a104%
coverage (JRF 2013) as shown in Table … .
Table..: Situation analysis by accelerated disease-control initiatives in The Gambia
Disease-control initiative
Suggested indicators
National status1
Source of Data
2012 2013 2014 2015
Polio OPV3 coverage 98% 96% 97% 96% JRF 2012-2015
Non-polio AFP rate per 100 000 children under 15 years-of-age
- - - 5.6 WEEKLY IST
BULLETIN 2015
Number of rounds of national (NID) and sub-national (SNID) immunization days Coverage range
1 2
2 0 JRF 2012-2015
MNT TT2+ coverage 67% 58% 60% 82% JRF 2012-2015
Percentage target population protected at birth from neonatal tetanus
67% 58% 60% 82% JRF 2012-2015
Number and proportion of districts reporting >1 case of neonatal tetanus per 1000 live births
ND ND ND ND
Was there an SIA? (Y/N) NO NO NO NO
Neonatal deaths reported and investigated NO NO NO NO
Delivery at facility rate 62.6% DHS 2013
Measles & rubella
Measles / MR vaccination coverage (1st dose)
95% 96% 96% 97% JRF 2012-2015
Measles / MR vaccination coverage (2nd dose)
37% 53% 73% 81% JRF 2012-2016
Number of laboratory confirmed measles/rubella outbreaks
0 0 1 71 JRF 2012-2015
Geographic extent national immunization day (NID) Age group Coverage
0 0 0
0 JRF
Total measles cases (Lab/clinical/epidemiological)
93 135 98 172 JRF 2012-2015
Total rubella cases (Lab/clinical/epidemiological)
93 135 97 101 JRF 2012-2015
Yellow fever YF coverage 95% 97% 96% 97% JRF 2012-2015
Number and percentage of districts reporting >1 suspected case
26 43 20 24
Was a preventive campaign conducted? (Y/N)
NO NO NO NO
Epidemic meningitis
Meningococcal A coverage - 104% - -

2.3.3 Routine EPI Immunization System Components Analysis
The EPI Programme
The Expanded Programme on Immunization (EPI) is one of the frontline public health
intervention programmes under the directorate of Health Services within the Ministry of Health
(MoHSW). EPI started in the Gambia in May 1979, following the 1978 yellow fever epidemic in
the Upper River Region (URR). Since its inception, it has been integrated into the Reproductive
and Child Health (RCH) and services are delivered primarily through the static and outreach
strategies. Owing to the high infant and under five mortality rates, EPI has also been linked with
other public health intervention programmes/units such as the Epidemiology and Disease
Control, National Malaria Control , Leprosy/Tuberculosis Control, Integrated Management of
Neonatal and Childhood Illnesses (IMNCI), National AIDS Control Programme (NACP) and
the Health Promotion Directorate. Furthermore, the Ministry of health’s effort is complemented
by a host of NGOs (local and international specifically health-oriented) and other private clinics
within the Greater Banjul Area. From May 1979 to date, the EPI has made steady progress in
implementing and attaining Global Initiatives such as Polio Eradication, Maternal & Neonatal
Tetanus (MNT) and Measles Elimination as well as Reaching Every District (RED)/ Reaching
Every Child strategy as envisioned in the WHO AFRO Strategic Plan.
EPI Programme Goal
The goal of the EPI Programme is to reduce childhood morbidity and mortality due to EPI target
diseases. These include Tuberculosis, Poliomyelitis, Diphtheria, Pertussis, Tetanus, Measles,
Yellow Fever, Hepatitis B, Haemophilus influenza type b and pneumococcal diseases. The
primary target age group for EPI activities is children aged less than one year and women of
childbearing age (15-49 years).
The EPI Structure
Immunization services are provided through the Expanded Programme on Immunization. This is
one of the high impact child survival and development programmes of the Ministry of Health &
Social Welfare. There are five directorates within the Ministry of Health namely, Directorates of
Health Services, Planning & Information, Food Safety and Quality Assurances, National Public
Health Laboratories and Social Welfare. The EPI Unit is under the Directorate of Health
Services and is linked to other intervention programmes e.g. RCH, EDC, IMNCI etc.
Immunization services are provided to the communities through the RCH clinics monitored and
supervised by the Regional Health Teams. Figure … is an organogram showing the location and
linkages of the EPI programme within the health sector.

Figure X ... Diagram of EPI service delivery
The Guiding principles for achieving this goal focus on the following areas:
1. Strengthening Immunization Services (Expanding Outreach Services and immunizing
more people in a changing world as well as conducting Polio and measles SIAs)
2. Accelerating disease Control- Disease Reduction (Integration, eradication and
elimination of Polio, measles and Maternal & Neonatal Tetanus respectively).
3. Introducing New vaccines- Pentavalent/ Pneumococcal/ measles second dose/Rota/IPV
4. Drop Out reduction ( Monthly Penta3 Monitoring) and Wastage reduction ( Instituting
wastage Monitoring system)
5. Political Commitment and community Involvement and Participation
6. Conducting operations research and other relevant technologies
However, achievement of the goal and objectives will depend heavily on the availability of
financial and human resources and continuing political commitment for the EPI. The delivery of
EPI vaccines is based on the national immunization schedule as shown in Table … .
Table X ..: National Immunization Schedule
Antigen Age given
BCG,OPV0 & Hep.B0 At Birth
OPV1, Penta 1/Pneumo1, Rota1 2 Months
OPV2, , Penta2,Pneumo2, Rota2 3 Months
OPV3,, Penta 3 &Pneumo3, Rota3 4 Months

Measles, Yellow Fever & OPV4 9 Months
OPV BOOSTER , Measles 2nd Dose 18 Months
DPT BOOSTER 1Year After Penta 3
TT1
First Contact
TT2
4 Weeks after TT1
TT3 6 Months after TT2
TT4 1 Year after TT3
TT5 1Year after TT4
Programme Management
In a bit to be in line with the global and regional initiatives to addressing problems of vaccine
preventable diseases The government of The Gambia in collaboration with EPI national…. has
established a national medicine and vaccine regulatory body that looks at and ascertain the
potency of vaccines and drugs coming into the country. EPI with some partners with support
from partners has developed an annual work plan to guide the implementation of activities.
However, the EPI unit is faced with challenges like the lack of an immunization policy to guide
the implementation of all immunization services. Equally, there is no micro-planning done in the
health facilities at regional level. NITAG has not met once since inauguration in 2015. There was
no presentation on immunization financing to the legislature since 2012.
Human Resources Management
The EPI programme consists of the following:- Programme Manager; Deputy Programme
Manager; Surveillance Officer; Data Manager; Logistician; Communication Officer, Capacity
Building Officer, 2 Cold Chain Technicians, 1 Storekeeper, 2 Drivers and a Secretary. In
addition there are EPI focal persons- Regional Principal Public Health Officer (RPPHO)
/Regional Operations Officer (ROOs) in each Region and all the health facilities.
The strength of the EPI in the Gambia is largely anchored on the organizational structure from
the central level to regional and service delivery point, while the human resource (Skilled
personnel) available are best opportunities for the success in the EPI program. In contrast,
irregular training for middle level managers, weak supportive supervision and low incentive to
retain staff becomes a challenge and weakness in general of MoHSW. Evidence has shown that

the incentives had a positive effect on retention, motivation and performance. Other forces that
obstruct the institutionalization of EPI services are; high attrition and inadequate training (quality
of training) of health institutions on immunization.
Financing Health care in The Gambia
Financial support for public health services including EPI comes from three (3) principal
sources: 1. Government recurrent and development budget (10 -14%); 2. Cost-recovery on drugs
(effective in some of the Bamako Initiative health facilities) and 3. External assistance.
Vaccine Supply, Quality and Logistics
All regions are equipped with at least two supervisory vehicles to facilitate effective supervision
at both facility and community level. The supply system of vaccine and other immunization
logistics are always available at all levels. This is a big improvement as it used to be a major
challenge that leads to stock outs. There are functional cold chains systems at all level to assure
the potency and efficacy of the vaccines at all times. However, there are some gaps that can
affect the whole immunization services and they are as follows: most of the motorcycles are in
bad condition and sometimes they are off the road; fuel allocated to the Public Health Officers is
inadequate to deliver public health services in a month; in-adequate incinerators leads to poor
EPI waste management and stock-out of vaccines due to mainly of consignments being expired
as a result of poor vaccine management.
Immunization Services
The Gambia EPI Programme provides ten antigens to its target population through static and
outreach strategies based on the national immunization schedule in as shown in the Table on
National Immunization Schedule, Table….. The static clinics are conducted in health facilities
whilst outreach clinics are held at key villages/health posts. Both strategies are implemented
through the Reproductive and Child Health (RCH) clinics; thus at a single visit, mothers and
children can access a wide range of services. Approximately 60% of immunization services are
delivered through outreach clinics.
The immunization coverage rate for Penta3 in the Gambia is 97% (Admin Data 2015) and 87.7%
(GDHS 2013) while the dropout rate from Penta1 to Penta3 is 1.97%. The Gambia has an
impressive geographical access of about 90%. However, due to increased demand as a result of
population growth and ill equipped outreach sites, there are overcrowding at immunization sites.
It is therefore prudent to build new sites especially in urban areas and existing ones rehabilitated
to meet standards.
Surveillance and Reporting
As part of disease prevention and control measures, surveillance is a very important component.
In the Gambia there are surveillance officers and tools for data collection across the country. In

addition a fully equipped national public health laboratory has been established. Late
disbursement of surveillance incentives, weak contact tracing and in-active surveillance system
are some of the challenges faced by the immunization programme. However availability of a
national pharmacovigilance committee to give technical advice and support vaccine reaction and
site effects has also been established.
Several reviews, coverage surveys and operational research have been conducted between 2012
and 2015 to guide effective programme implementation and they are as follows:
1. Measles Second Dose Post Introduction Evaluation (PIE) in 2015.
2. Post Introduction Evaluation for HPV in 2015.
3. The Gambia Effective Vaccine Management (EVM) Assessment 2014.
4. Desk Review 2011/cMYP 2012-2016.
5. Comprehensive EPI review in 2015.
Demand Generation and Communication
Gathering information is crucial as quality information is the foundation of any advocacy and
communication effort. There is a directorate of health promotion and education charged
responsibility of running all communication activities in coordination with the communication
officer of the immunization programme .Some of the activities conducted by the directorate
include engaging communities on what they know about EPI and RCH services through focus
group discussions, face to face interaction and interviews. Communication support materials
such as posters, leaflets, factsheet, T-shirts, caps and pictorial dialogue on immunization though
available to an extent, there is need to produced more to create increased awareness/knowledge
and demand for immunization services. Some of the messages on the communication support
materials should be translated into local languages and depicted in pictorial/graphic form for
better understanding. In addition, radio and television spots and jingles on immunization should
be produced and aired on GRTS as well as private and community radio stations to create
awareness.
Table X:…..Situation analysis of routine EPI by immunization system components
System components
Suggested indicators
RESULTS
Source of Data
2012 2013 2014 2015
1. PROGRAMME MANAGEMENT
Law & regulation
What numbers of functions are conducted by the NRA?
1
1 1
1
WHO Dossier Report and EPI Review Report 2015

Is there legislation or other administrative order establishing a line item for vaccines?
Yes
Yes Yes
Yes WHO and UNICEF
prequalified vaccine list
Is there legislation identifying the sources of public revenue for immunization financing?
Yes
Yes Yes
Yes GG year vaccine
subvention
Policy Has the national immunization policy been updated in the last five years?
No
No No
No There is only a draft EPI
policy
Planning Does the country have an annual work plan for immunization funded through Ministry of Health budgeting processes?
Yes
Yes Yes
Yes
What is the number and proportion of districts with an annual micro-plan for immunization?
0 0 0 0
Coordination What were the number of ICC (or equivalent) meetings held last year at which routine immunization was discussed?
4 4
4
4
ICC minutes
What were the number of NITAG (or equivalent) meetings held last year?
O
O o
o ICC minutes
Advocacy How many presentations on immunization performance or expenditures were made to parliament?
O
0 0
0
2. HUMAN RESOURCES MANAGEMENT
HR numbers Number of health workers per 10 000 population
Percentage vaccinator posts currently vacant
0
0 0 0
Capacity-building
Number & proportion of health workers & managers trained in immunization services through MLM or IIP training per year
0
0
0
0
Percentage of health workers trained in immunization in the last two years (data from PIE and EPI reviews)
0
0 250
200
EPI activity report

Curriculum review for pre-service medical and nursing and public officers, immunization education conducted
0
0
0 0
Supervision Average number of central supervision visits to each district level per year
4
4 4
2 Supervisory Reports
3. FINANCING
Financial sustainability
What percentage of total routine vaccine spending was financed using government funds (including loans and excluding external public financing)?
What proportion of the line item in the national budget for immunization was actually funded?
What percentage of immunization resources are being met by the domestic health budget (as identified in the annual budget plan)?
Difficulty In having the
actual budget
Government expenditures on routine immunization per surviving infant (JRF 6700)
Are sub-national immunization budgets and expenditures monitored and reported at national level?
4. VACCINE SUPPLY, QUALITY & LOGISTICS
Transport / mobility
Percentage of districts with a sufficient number of supervisory/EPI field
activity vehicles /motorbikes/bicycles
(based on their need) in working condition
100
100 100
100 Regional inventory( it is important to note that
there is need to provide
more motorcycles
at facility level
Vaccine supply Was there a stock out of any antigen at national
level during the last year?
No
No yes
yes EPI
If yes, specify duration in months
3months
Six months
EPI

If yes, specify which antigen(s)
BCG
YF and DPT
Cold-chain/ logistics
Percentage of districts with adequate numbers
of appropriate and functional cold-chain
equipment
100% 100% 100%
100%
What was the year of last inventory assessment for all cold-chain, transport and waste management equipment (or EVM)?
2014 EVMA report
Number of PHC facilities with >80% score for all indicators on the last EVM assessment
0
EVMA report
Percentage districts with availability of a cold-chain replacement plan
0 Not available
Waste disposal Availability of a waste-management policy and
plan Yes Yes Yes
yes Anti-littering policy
5. IMMUNIZATION SERVICES
Routine coverage
DTP3 coverage 98 97 96 97 JRF 2012-15
Demand National DTP1–DTP3 drop-out rate
7.2 1.97 ADMIN
DATA
Percentage of districts with drop-out rate DTP1–DTP3 >10%
0 0
Equity Number of districts <80% coverage
0 0 0 0 JRF 2012-
2015
Percentage gap between lowest/highest socio-economic quintile
NA
Percentage planned outreach visits conducted
100% 100% 100% 100% EPI reports
Line list of high-risk districts/communities identified
NA NA NA
NA There are no high risk
areas I the Gambia
High-risk plan for disadvantaged communities
NA NA NA
NA There are no high risk
areas I the Gambia
New vaccines Percentage PCV coverage (or coverage for other new antigens)
98 96
96
97
6. SURVEILLANCE & REPORTING cont'd...
Coverage monitoring
Percentage gap in match between DTP3 survey
9 DHS 2013

coverage and officially reported figures
Immunization safety
Percentage of districts that have been supplied with adequate (equal or more) numbers of AD syringes for all routine immunizations
100%
100%
100%
100%
Requisition notes and vaccine ledgers
Adverse events National AEFI system is active with a designated national committee
Yes Yes Yes Yes
Number of serious AEFI cases reported and investigated
0
0 0 0 AEFI
investigation report
7. DEMAND GENERATION AND COMMUNICATION
Communication strategy
Availability of a routine immunization communication plan
No
Draft Draft Draft Draft copy
Research Year of last study on community knowledge, attitudes and practices in relation to immunization
2015/16 KABP report
2.3.4 Strength, Weakness Opportunity and Threat (SWOT) Analysis
The strength, weakness, opportunities and threat of Routine Immunization, accelerated disease
control is as shown in Figure…. . And the SWOT analysis of the routine EPI immunization
system components is in table….

STRENGTHS
1. High political will from Government 2. Availability of Compressive National
health sector plan & National M& E plan
3. Existence of cMYP 2012-2016 4. Over 90% coverage for DPT3 5. Low drop-out rate for DPT1-DPT3
and BCG- Measles 6. A non-AFP rate of 5.6/100000 children
< 15yrs 7. Successful introduction of three new
vaccines into the routine immunization services
8. Introduction of CUG facility to foster communication on surveillance /EPI services
9. Introduction of Regional Operation Officers for EPI services in all health regions
WEAKNESSES
1. MNT not being reported. 2. National EPI Policy not updated. 3. Limited storage capacity of vaccine both
at regional and facility level 4. Inadequate transportation facilities
(Vehicles And Motor Cycles) for EPI/ Reproductive Child Health Outreach Services at facility level
5. Inadequate CUG facility at field level. 6. Weak coordination between central and
regional level 7. Unavailability of Fire Extinguishers at
regional EPI stores 8. Lack of office space, furniture and ICT
equipment for ROOs
OPPORTUNITIES
1. Availability of GAVI HSS Support for the country.
2. Upcoming of Program Based Budgeting in 2017
3. Sustain and expand incentive package for health care workers
4. Incorporation of e-Surveillance into the DHIS2 as part of the national disease surveillance system
5. Introduction of Rapid Convenience Monitoring for monitoring vaccinated children
6. Alignment of the cMYP 2017-2021 with the NHSSP 2014-2020 & the National M& E Plan-2015-2020
THREATS 1. Inadequate financial resource for EPI
services 2. High attrition/staff turn-over at service
delivery point 3. Mal-distribution/inequitable distribution
of health care work force 4. Donor driven programmes 5. Shifting focus from routine surveillance
services to emerging infectious diseases e.g. Ebola Viral Disease
Figure X ….: SWOT Analysis for Routine Immunization and Accelerated Disease Control

Table….. SWOT Analysis of Routine EPI Immunization System Components
1. Programme Management
Strength Weakness Opportunities Threat
1. Availability of national medicine regulatory council (NMC)
2. Availability of national immunization annual work plan.
1. No annual micro planning at regional level.
2. Inadequate advocacy on immunization.
1. Availability Interagency coordinating committee (ICC).
2. Availability of National Immunization Technical Advisory Group (NITAG).
3. Availability of Technical and financial partners i.e WHO/UNICEF
1. No national immunization policy.
2. Human Resource Management
Strength Weakness Opportunities Threat
1. Well defined immunization structure in place.
1. No regular training for middle level managers on immunization.
2. Weak supportive supervision at both central and regional level.
3. Low motivation and retention packages.
1. Adequate immunization personnel at all immunization posts.
1. High staff attrition rate.
2. Curricular at training institutions are not regularly updated to current immunization technology.
3. Financing
Strength Weakness Opportunities Threat
4. Vaccine Supply, Quality and Logistics
Strength Weakness Opportunities Threat
1. Functional cold chain system at all levels.
2. Reliable vaccine supply at all levels.
1. Inadequate incinerators at facility level.
2. Absence of computerized stock management system at national vaccine store.
3. Occasional vaccine Stock outs
1. Adequate supervisory vehicles.
2. Cordial collaboration with WHO and UNICEF in vaccine procurement.
1. Limited functional motorcycles for routine immunization services.
2. Inadequate fuel supply to support immunization service (motorcycles).
3. Use of inappropriate RCH trekking vehicle.
5. Immunization Services
Strength Weakness Opportunities Threat
1. High immunization coverage (Penta 3).
2. High utilization of immunization services (low
1. Low community sensitization.
2. Low health worker population ratio (1.02/1000) compared
1. No hard-to-reach area in the country.
1. Overcrowding leading to long waiting time for clients.

dropout rate). 3. High access to
immunization (BCG).
to (2.3/1000). 3. ILL equipped
outreach sites
6. Monitoring, Surveillance and Reporting
Strength Weakness Opportunities Threat
1. Availability of surveillance officers and tools all over the country.
1. Late disbursement of surveillance incentives.
2. Weak contact tracing. 3. In-active surveillance
system
1. Availability of a national vaccine pharmacovigilance committee
2. Availability of national public health lab.
7. Demand Generation and Communication
Strength Weakness Opportunities Threat
1. There are regional health promotion and educations officers in all; the health regions
2. Availability of
communication materials on immunisation services.
1. No communication plan
2. In adequate advocacy programs
3. No television spots and jingles on routine immunization
4. No communication support materials translated to local languages.
1. Availability of a directorate of health promotion and communication
CHAPTER THREE: IMMUNIZATION GOALS, OBJECTIVES, STRATEGIES AND KEY
ACTIVITIES
3.1 Program Goals and Main Objectives
The goal of The Gambia comprehensive multi-year plan 2017-2021 is to reduce
morbidity and mortality of infants and children from vaccine preventable diseases. Government
and development partners did a thorough situation analysis of the period 2012-2015 of the EPI

immunization system and identified some priority areas for 2017-2021 planning years. The
priority areas are:
1. Providing quality immunization services to all.
2. Strengthening surveillance and accelerating disease control (integration, eradication, and
elimination of Measles/NNT, AEFI Surveillance)
3. Advocating for improved financing for immunization and community involvement and
participation in immunization.
4. Improvement of coordination of immunization activities at national and the regional
levels.
5. Strengthening of the Cold Chain System and other logistics to accommodate existing and
new vaccines to be introduced
6. Improving data management system through the health information system and District
Vaccine Data Management tool.
7. Introducing new vaccines such as HPV, MR and Meningococcal A into routine
immunization schedule.
8. Integration of immunization into a well-functioning health system.
9. Conducting operational research on EPI activities and other relevant technologies.
The main objectives to achieve the set goals along the immunization system components
are as shown below:
S/no Immunization
Component System
Main Objectives
1 Immunization services
delivery
To increase demand and equitable uptake of immunization services for
both traditional and new vaccines by 2021
2 Demand generation,
communication and
advocacy
To increase uptake of immunization services through advocacy, social
mobilization and behavioral change communication by 2021
3 Vaccine, cold-chain
and logistics
To strengthen the cold chain system and ensure the sustainable supply
of vaccines and other related supplies at all level by 2021
4 Surveillance and
reporting
To strengthen surveillance and reporting of EPI reportable diseases by
2021

5 Costing and financing To increase access to funds for immunization services
6 Programme
management.
To improve implementation and uptake of Immunization services at all
levels
7 Human resource
management
To strengthen human resources at all level
3.2 Priority Objectives and Milestones
After a detailed situation analysis of the EPI for the period of 2012 to 2015, new program
priorities for the country comprehensive multi –year plan 2017-2021 were developed based on
previous achievements and challenges. Set objectives were also developed along the national EPI
priorities. Strategies and activities with timeline to achieve the set objectives were also itemized
as shown in the annex. The Immunization Priority Objectives and Milestones as well as the key
activities and timelines are shown in Table…and Table…..
3.3 Aligning with GVAP
In the course of developing the cMYP 2017-2021, the national priority objectives, strategies
and key activities were aligned with the Global Action Plan 2011-2020 as summarized below
and shown in the checklist in annex…. Other reference materials that this cMYP was aligned
with were the country National Health Sector Strategic Plan 2014-2020, the Global Routine
Immunization Strategies and Practices (GRISP), the Regional Strategies for immunization
2014-2020.
3.4 Strategies
1. Reach every child by strengthening the RED/REC strategy
Planning for effecting management of human and financial resources, improving access
to services, building community partnership and ownership, supportive supervision and
monitoring for action and providing feedback for continuous self-assessment and
improvement.
2. Strengthen safe injection practices and waste disposal
Strict adherence to injections being given using a single sterile syringe and needle
combination, which is then safely disposed of after use. This policy will be adhered to by
providing safe injection equipment and waste disposal facilities with continuous

strengthening and monitoring (reporting and management) of adverse events following
immunization.
3. Ensure sustainable financing through continuous advocacy and mobilization.
Advocacy will continue for effective resource mobilization to ensure the financial
sustainability and continued support by the national Government. The country will
continue to work with health partners and stakeholders while ensuring efficient use of
vaccines within the health system. GAVI Alliance will continue to support the country
with vaccines.
4. Effective Cold Chain and Vaccine Management.
Effective management and maintenance of the cold chain system ensures the potency of
vaccine throughout the supply chain. The country will continue to ensure preventive
maintenance of cold chain equipment at all levels of services delivery. In addition,
efforts will continue to expand the capacity at the national and sub-national cold rooms
and ensure use of continuous temperature monitoring devices. Opportunity will be
created to build capacity of staff on cold chain management regularly.
5. Strengthen Advocacy, Communication and IEC
Strengthen EPI communication and advocacy at all levels to promote vaccine demand.
Stakeholders (Government officials, media, traditional leaders, community and civil
society organizations) will be actively engaged to promote demand and sustain the uptake
of immunization services.
6. Sustain the benefits of integrated interventions through SIAs
Planned Immunization campaigns will be carried out every year. The Programme will
continue to use these supplementary activities to advocate and sensitize communities to
demand child survival services including immunization.
7. Ensure effective and sustainable introduction of new vaccines
As indicated under immunization services, three new vaccines were introduced into
routine immunization service namely; Measles 2nd dose (2012), Rota virus (2013) and
IPV (2015). There are national efforts to introduce a vaccine against epidemic meningitis
(Men A) within the next two years. National efforts on introducing new vaccines and use
of technology to optimize protection and survival of children will be key considerations.
8. Strengthen Programme Management
Short term and in-service training of health workers will be organized regularly to build
and maintain the skill of staff in immunization service delivery. Efficient organization of
the programme at the national level and service delivery at all levels will be instituted to
reduce missed opportunities and unmet need for immunization. Create and improve the
physical state of existing service delivery points to enhance coverage.
9. Strengthen AEFI and VPDs surveillance
Surveillance for Vaccine Preventable Diseases (VPDs) will be strengthened especially at
the community level using all available structures within the health system.
Institutionalized AEFI surveillance will also be strengthened.

10. Effective Monitoring, evaluation and supervision for quality service
Intermittent reviews will be organized to assess performance and provide feedback to all
levels. Facilitative and supportive supervision will be conducted regularly to strengthen
capacity.
11. Strengthen capacity to conduct operational research relevant to
immunization
Data driven and evidence-based decisions will be used to improve programme
performance. Data validation at all levels, especially at service delivery points will be
conducted regularly. The Programme will collaborate with other institutions to
undertake research and to use the platform of collaboration to build the capacity of staff
in operational research.

The national priority objectives for achieving the goal of the plan by 2021 is shown in Table…
Table X…Immunization Priority Objectives and Milestones
Immunization services
Current performance Objectives Milestones Order of Priority
1. Immunisation services Delivery
Immunization coverage
DPT3 coverage decreased from 98% in 2012 to 97% in 2015
To achieve 99% coverage at national and 96% coverage at regional for all vaccines by 2021 To achieve 99% coverage at national and 96% coverage at regional for DPT3 containing vaccine by 2021
Achieve 98% coverage at national and 95% coverage at regional for all vaccines by 2019 and 99% by 2021 Achieve 98% coverage at national and 95% coverage at regional for DPT3 containing vaccine by 2019 and 99% by 2021
1
TT2+ coverage increased from 67% in 2012 to 82% in 2015
Achieve 90% coverage for TT2+ at national and 85% coverage in all health regions by 2021
Attain 86% coverage for TT2 + at national and in all health regions by 2018, 88% by 2020 and 90% by 2021
1
Immunization Demand
DPT1-DPT3 drop-out rate decreased from 2.03 in 2014 to 1.97% in 2015
To maintain DPT1-DPT3 dropout rate to no more than 5% by 2021
Increase DPT3 coverage to 98% by 2019 and 99% by 2021.
1
BCG- Measles drop-out rate increased from 7.2 in 2014 to 9.09% in 2015
To reduce BCG- Measles drop-out rate to 5% by 2021
Increase measles 1st dose coverage to 98% by 2019 and 99% by 2021.
1
Immunisation equity
The % gap between Lowest and highest economic quintile stood at -7.03 in 2013
To bridge the % gap between the highest and lowest wealth quintile to zero by 2021
Decrease the % gap to -4% by 2018 between the highest and highest wealth quintiles and -2% in 2020 and 1.03% in 2021
1

Immunisation services
Current performance Objectives Milestones Order of Priority
1. Immunisation services Delivery
New vaccines introduction
3 new vaccines (Measles 2nd dose, Rota virus and IPV) introduced between 2012 to 2015
To increase the coverage of Measles 2nd dose from 81% by 2015 to 90% by 2021 in all health regions
Attain 85% coverage for measles 2nd dose by 2019 and 90% by 2021 in all health regions
1
To increase Rotavirus coverage from 97% in 2015 to 99% by 2021 in all health regions
98% Rotavirus coverage by 2019 and 99% by 2021 in all health regions
1
To increase IPV coverage from 71% in 2015 to 99% in 2021 in all health regions
85% IPV coverage by 2018, 95% in 2020 and 99% in 2021 in all health regions
1
To introduce MR, HPV & MenA between 2017-2021
Introduce MR by 2017, HPV and MenA by 2018 Achieve 80% coverage of MR by 2017and for HPV and MenA by 2018 in all health regions
2

Immunization service
Current performance Objective Milestone Order of priority
2. Demand generation, communication and advocacy
Advocacy and Social
Mobilization
Inadequate involvement and participation of policy makers, politicians, communities/religious leaders and the private sector in EPI services
To sensitize Policy makers and politicians, t actively involved and participates in immunization services by the end of 2021.
To mobilize all communities to sustain high immunization coverage by the end of 2021.
By 2019, 80% of the policy makers , politicians communities actively participate and involved in immunization services By 2019, 90% of all communities are mobilized to sustain high immunization coverage
1
Limited utilization of
the print and
electronic Media in
promoting routine
immunization services
To increase the utilization of the
print and electronic media for
routine immunization services by
the end of 2021
By 2018, 75% of the Print and electronic media are utilized in routine immunization services.
2
Social and Behavioral Change Communication
Inadequate knowledge
of caregivers/parents
on the importance of
immunization
To increase the awareness level of caregivers/parents from xxxx to xxxxxx on the importance of immunization by the end 2021
By 2019, 80% of the
caregivers/parents are aware of
the importance of immunization
1
Limited involvement
of male in
immunization services
To actively increase the participation of male in immunization services by 2021
By 2017, 50% of the male actively participate in immunization services
1
Inadequate SBCC
support materials
To provide 90% of communities with SBCC support materials by 2021
By 2018, 70% 0f the communities provided with SBCC support materials
2

Immunization service
Current performance Objective Milestone Order of priority
3. Vaccines, cold-chain and logistics
Cold Chain System
Inadequate cold chain system at central, in regional stores and some public health facilities
To provide 40 M3 cold room at central level by end of 2021 To provide 25 TCW 3000 SDD in six regional cold stores by end of 2021 To provide 20 TCW 2000 in of public health facilities offering immunization services by the end of 2021.
By 2017, 40 M3 cold room at the Central level is provided By 2018 50% of the regional stores are provided with 25 TCW 3000 SDD. By 2019, 80% of public health facilities offering immunization services are provided with TCW 2000
1
Lack of automatic voltage regulators for EPI central cold stores
To Procure and install automatic voltage regulators for the central EPI cold store by 2021
By 2017, automatic voltage regulators for the central EPI cold store procured and installed
1
Lack of Multi-loggers at the cold rooms
To procure and install 2 multi-loggers at the cold rooms by 2021
.By 2018, 2 multi-loggers procured and installed in the cold rooms
2
Waste Management
Inadequate and aging incinerator in the six health regions
To provide six incinerators in six health region by 2021
By 2019,80% of the six regions are provided with incinerators
2

Immunization services
Current performance Objectives Milestones Order of priority
4. Surveillance and Reporting Polio
Sustained the interruption of wild polio virus in the country
To sustain interruption of wild polio virus by 2021
Sustain interruption of wild polio virus by 2018 in all health regions
1
MNT
No data available on MNT status in the Gambia
To attain and maintain MNT elimination/control by 2021
All health regions to attain and maintain MNT elimination by 2018
1
Measles and Rubella
Measles surveillance data reported 172 suspected cases in 2015
To achieve an incidence rate of less than 1/1000000 population by 2021
To achieve an incidence rate of less than 1/1000000 population by 2020
1
Yellow fever
24 suspected cases of yellow fever reported in 2015
To attain and maintain Yellow fever elimination/control by 2021
All health regions to attain and maintain Yellow fever elimination by 2018
1
Epidemic meningitis
National Surveillance data reported 92 suspected cases of meningitis in 2015
To attain and maintain Meningitis control by 2021
All health regions to attain and maintain Meningitis control by 2018
1
AEFI surveillance and reporting
Vaccine and drug regulatory authority in place including an AEFI committee
To institutionalize routine AEFI surveillance in all health facilities by 2021
Institutionalization of routine AEFI surveillance in at least 80% of health facilities by 2019
1

Immunization Service
CURRENT PERFORMANCE
OBJECTIVES MILESTONES ORDER OF PRIORITY
5. Costing and Financing Financing and Resource Mobilization
Inadequate and difficulty in accessing operation funds for immunisation services
To increase and improve access to funds for EPI programme implementation by 2021
2019: 90% of EPI programmes funded and implemented
1
External Resources Management
6. Program Management Political commitment and advocacy
Inadequate participation of senior government officials, politicians, religious leaders and the private sector in EPI related services
To increase the participation of senior government officials, politicians, religious leaders and the private sector in EPI related services by 2021
2020: Active participation of Senior government officials politicians, religious leaders and the private sector in 80% of the EPI related activities
1
Policy No immunization policy
To develop a national immunization policy by 2021
2019: Develop a national immunization policy
1
Monitoring and evaluation plan
No M & E Plan To develop an Integrated M & E plan for immunization services by 2021
2018: M & E Plan developed and used
1

Immunization Service
CURRENT PERFORMANCE
OBJECTIVES MILESTONES ORDER OF PRIORITY
7. Human Resource Management Staff Retention High staff attrition rate To retain 90% of staff involved in
immunization services by 2021 2019: Retain 85% of staff involved in immunization services
1
Staff Distribution
Inequitable Staff Distribution
To develop a staffing norm for equitable distribution of immunization service providers by 2021
2018: staffing norm developed and used
2
Human Resource Development
No middle level managers trained on immunization services in last 5 years
To train 25 middle level managers on immunization services by 2021
2019: train 60% of middle level managers on immunization services
2
Inadequate in-service training for healthcare workers on immunization
To train 90% of immunization service providers by 2021
2020: 90% of health workers trained
1

Table X: Timeline of Activities- cMYP 2017-2021, The Gambia.
Thematic Areas
Objectives Strategies Activities Timeline
2017 2018 2019 2020 2021
1. Immunization Service Delivery
Immunization coverage
To achieve 99% coverage at national and 96% coverage at regional for all vaccines by 2021
Implement “Reach every community” in every health region
Update micro plans to include hard to reach communities
x x x x x
Expand routine immunization services to reach all communities
x x
Conduct refresher trainings on inter personal communication(IPC) for immunization service providers
x x x
Conduct coverage surveys to identify areas of low coverage
x x x
Immunization demand
To maintain DPT1-DPT3 dropout rate to no more than 5% by 2021
Engaging communities to create demand for immunization services
Sensitize communities on their roles and responsibilities in immunization service delivery
x x x x x
Immunization equity
To bridge the % gap between the highest and lowest wealth quintile to zero by 2021
Improve immunization equity through program design.
Orientation of the highest income group on the benefits of immunization
x x
New vaccine introduction
To introduce MR, HPV & MenA between 2017-2021
Baseline survey for the introduction of new vaccines
Conduct immunization campaigns, demonstration, Post introduction Evaluation and cluster surveys
x x

Conduct national immunization programme reviews regularly in preparation of strategic programme planning
x
Thematic Areas Objectives Strategies Activities Timeline
2017 2018 2019 2020 2021
2. Demand Generation, Communication & Advocacy
Advocacy and Social Mobilization
To sensitize Policy makers and politicians, actively involved and participate in immunization services by the end of 2021.
Engagement of policy makers and politician
Conduct advocacy meetings X X X X X
To mobilize all communities to sustain high immunization coverage by the end of 2021.
Community mobilization Increasing demand for immunization
Conduct SBBC meetings X X X X X
To increase the utilization of the print and electronic media for routine immunization services by the end of 2021
Organize radio and TV shows X X X X X
Organize media briefing X X X X X
Train health workers on risk communication
X X X
To increase the awareness level of communities on the importance of immunization by the end of 2021
Sensitize communities on the importance of immunization
X X X X X
Conduct open field days X X X
Social and Behavioral Change Communication
To actively increase the participation of male in immunization services by 2021
Sensitization meeting with male X X X X X
To provide 90% of communities with SBCC support materials by
Providing SBCC support
Develop, print and distribute SBBC support materials
X X X

2021 materials Train health workers on effective communication skills
X X X
Thematic Areas
Objectives Strategies Activities Timeline
2017 2018 2019 2020 2021
3. Vaccine Cold Chain & Logistics
Cold Chain System
1.To provide 40 M3 cold room at central level by end of 2021
Strengthening and expansion of the cold chain
1. Procure 1 cold room for central level, 45 fridges for regional and health facilities, and spare parts for all levels
X X X
2.To provide 25 TCW 3000 SDD in six
2. Install the fridges and the cold room at health facility regional, and central level
X X X
regional cold stores by end of 2021
Procure and install three automatic voltage regulators at the central cold room
X
3. To provide 20 TCW 2000 in 30% of the newly built public health facilities offering immunization services by the end of 2021.
Procure and install two multi- loggers at the central and regional cold rooms
X
To Procure and install automatic voltage regulators for the central EPI cold store by 2021
To Procure and install Multi- loggers in the cold rooms by 2021

Maintaining regular and quality vaccine supply by 2021
1.Mobilize funds to procure vaccines
.Advocacy meeting with policy makers
X X X
2.Capacity building on effective vaccine management(EVM)
2. Train immunization providers on EVM
X X X X X
3.Strengthening regular stock and temperature monitoring and recording at all levels
3.Provide two hundred fridge tags
X X X X X
Inadequate EPI logistic system at all levels
Strengthening logistic system at all levels
Conduct supportive supervision and monitoring
X X X X X
1.Procure spare parts and fuel
X X X X X
2.Install spare parts X X X X X
3.Conduct regular maintenance
X X X X X
4.Construct and refurbish dry stores
X X
Waste Management
To provide six incinerators in six health region by 2021
Improving waste management and injection safety
1.Construct and maintain incinerator
X X X X
2.Train incinerator attendance
X X X X
3.Procure PPEs X
Thematic Areas Objectives Strategies Activities Timeline

2017 2018 2019 2020 2021
4. Monitoring, Surveillance & Reporting
Polio To improve and expand disease surveillance & reporting by 2021
Strengthen and expand disease prevention and control services
Review and update Standard Operation Procedures and guidelines on surveillance
x x x
MNT Train Health Care Workers on standard operation procedures and guidelines on surveillance
x x x
Measles & Rubella
Yellow fever
Epidemic meningitis
Review and update the EPI technical guideline
x x x
Harmonize EPI data collection tools into Health Management Information System
x
Strengthen data management, reporting and feedback mechanism at central and regional levels
x
Strengthen collection, handling & transportation of samples to National Public Health Laboratory
x

Thematic Areas Objectives Strategies Activities Timeline
2017 2018 2019 2020 2021
4. Monitoring, Surveillance & Reporting
AEFI surveillance and reporting
To institutionalize routine AEFI surveillance in all health facilities by 2021
Strengthen AEFI surveillance and reporting
Develop, review and update AEFI reporting tools
x
Train health care workers on the use of AEFI tools
x
Institute monthly reporting of AEFI including zero
x
Establish & train national and regional AEFI committees to enable rapid and trustworthy investigation of, and response to, serious AEFIs
x
Thematic Areas Objectives Strategies Activities Timeline
2017 2018 2019 2020 2021
4. Costing and Financing
Financing and Resource Mobilization
To increase and improve access to funds for EPI programme implementation by
Enhancing operational efficiency through better budget management
Develop and implement Operational Plan for immunization policy financing
X

2021 Constitute a task force to advocate for more resource mobilization
X X
Develop a tool that will track the execution of approved immunization budget
X
Develop a resource mobilization plan
X X
Proportion of immunization budget released on time.
X X X X X
Thematic Areas Objectives Strategies Activities Timeline
2017 2018 2019 2020 2021
6. Programme Management
Political commitment and advocacy
To increase the participation of senior government officials, politicians, religious leaders and the private sector in EPI related services by 2021
Engage Senior government officials and politicians and other stakeholders to participate in EPI related services
Sensitize senior government officials, politicians and other stakeholders
X X
Conduct annual meetings with the health select committee of the National Assembly
X X X X X
Conduct regular meeting with National Immunization Technical Advisory Group members (NITAG)
X X X X X
Policy To develop a national immunization policy
Development of a national immunization
Resource mobilization X X X

by 2021 policy with relevant stakeholders
Identify and engage partners
X X X X
Conduct training workshops to orient (NITAG)
X
Monitoring and evaluation plan
To develop an Integrated Monitoring and Evaluation (M & E) plan for immunization services by 2021
Development of an integrated M & E plan
Mobilization of resources from immunization development Partners.
X X
Identify and engage partners
X
Thematic Areas Objectives Strategies Activities Timeline
2017 2018 2019 2020 2021
7. Human Resource Management
Staff Retention To retain 90% of staff involved in immunization services by 2021
Improve incentive package at all levels
Allocate 50% of basic salary as retention allowance for immunization service providers
X X X X X
Create a special hard to reach area allowance for health staff.
X X X X X
Provide performance based reward advocate for free medical care or all health workers and their immediate family members.
X X X X X
Construct new and refurbish existing structures
X X X
Staff Distribution To develop a staffing norm for equitable distribution of
Equitable distribution of immunization staff at all levels
Develop and implement posting guideline and policy
X

immunization service providers by 2021
Implement staffing norm X
Human Resource Development
To train 25 middle level managers on immunization services by 2021
Strengthen capacity of Human Resource at all levels
Conduct training needs assessment at all levels ( private & Public)
X X
Conduct training for middle level managers
X X X X X
To train 90% of immunization service providers by 2021
Harmonize and improve continuous professional development
1: Develop guidelines for in service training
X X X

CHAPTER FOUR: COSTING, FINANCING AND FINANCIAL SUSTAINABILITY
4.1 Analysis of costing and financing (including Baseline).
Total cost for routine immunization for the base year for the cMYP (year 2015 was used
because it had actual expenditures) and reflecting the current cost profile, was $5,008,050.
Cost of new vaccines was more than half the total cost $2,954,117 (59%) and a fifth of the
total cost was expenditure on Supplemental immunization activities, $1,061,369 (21%) in
2015 (as in Table C1).
Table C1: Baseline Cost Profile for Routine Immunization, 2015 in The Gambia
Cost category
2015 US$
Percent of Total cost
Traditional Vaccines 231,151 4.62
Underused Vaccines 0 0.00
New vaccines 2,954,117 58.99
Injection supplies 55,133 1.10
Personnel 145,068 2.90
Transportation 17,594 0.35
Other routine recurrent costs 488,221 9.75
Vehicles 0 0.00
Cold chain equipment 54,397 1.09
Other capital equipment 1,000 0.02
Supplemental immunization activities 1,061,369 21.19
TOTAL 5,008,050 100.00
Total cost of immunization services including shared cost for immunization staff for the
period 2017 to 2021 is estimated to be $ 32,331,733 ($32.3million). In all, half (50.0%) of
the total amount is for vaccines and logistics supplies for routine immunization. Shared health
system cost constitutes 18.8%, Programme management, 12.9% and Supplemental
immunization activities 9.2% respectively. Service delivery support constitutes 1.6% of the
total cost (as in Table C2)

Table C2: Total Cost of Immunization Services, 2017-2021, The Gambia
Future Resource Requirements Percent of Total cost
cMYP Component
US$ US$ US$ US$ US$ US$
2017 2018 2019 2020 2021 Total 2017 -
2021
Vaccine supply and logistics (routine only)
2,739,040
3,258,023
3,206,766
3,242,384
3,731,595
16,177,807
50.04
Service delivery
117,197
88,454
91,039
77,912
151,379
525,981 1.63
Advocacy and Communication
212,048
327,123
296,720
348,510
292,226
1,476,628
4.57
Monitoring and disease surveillance
162,789
177,492
197,534
215,172
231,049
984,036
3.04
Program management
669,871
767,396
852,561
1,174,850
706,011
4,170,689
12.90
*Supplemental immunization activities (SIAs)
248,465
267,568
1,619,539
853,475
-
2,989,047
9.24
Shared Health Systems Costs (EPI Portion)
1,009,268
1,298,464
1,169,713
1,226,392
1,303,708
6,007,545
18.58
Grand Total
5,158,676
6,184,520
7,433,873
7,138,696
6,415,967
32,331,733 100.00
*No SIAs cost for 2021- based on the assumption of the target date for Poliomyelitis eradication; in addition, SIAs for MR and TT would be conducted just the year before
i.e. in 2020 per the planned activities.

4.2 Analysis of future resources requirements, financing and gaps.
4.2.1 Total Immunization Cost
Total immunization cost represents approximately 81.4% of total cost of the cMYP whilst shared health systems cost account for the remaining
18. 6%. Shared health systems cost was estimated for salaries of non-direct immunization staff contribution to immunization services at all
levels.
Table C3: Total Immunization Cost 2017-2021 (US$)
Year
2017 2018 2019 2020 2021 Total direct costs
Percent of Total cost
Vaccine supply and logistics
2,739,040 3,258,023 3,206,766 3,242,384 3,731,595 16,177,807 61.46
Service delivery 117,197 88,454 91,039 77,912 151,379 525,981 2.00
Advocacy and Communication
212,048 327,123 296,720 348,510 292,226 1,476,628 5.61
Monitoring and disease surveillance
162,789 177,492 197,534 215,172 231,049 984,036
3.74
Program management 669,871 767,396 852,561 1,174,850 706,011 4,170,689 15.84
Supplemental immunization activities (SIAs)
248,465 267,568 1,619,539 853,475
2,989,047 11.35

Total direct costs 4,149,408 4,886,057 6,264,160 5,912,304 5,112,259 26,324,188 100.00
4.2.2 Routine Immunization
Total routine immunization cost is estimated to be $22,943,198 ($22.9million) over the five years. Vaccines and injection safety supplies
represent about 64.2% of routine recurrent cost. Of the cost of vaccines, new vaccines constitute 53.6% of the cost. Maintenance of cold chain
and capital equipment and overheads 16.8% of total cost of routine immunization over the period.
Table C4: Routine Recurrent Costs 2017-2021
Cost category
Future Cost Projections (US$)
Total 2017 - 2021
Percent of Total 2017 2018 2019 2020 2021
Vaccines 2,346,303 2,869,120 2,817,185 2,866,801 2,958,487 13,857,896 60.40
Traditional 315,050 324,761 321,550 320,598 332,858 1,614,817 7.04
Underused 0 0 0 0 0 0 0.00
New 2,031,253 2,544,359 2,495,634 2,546,203 2,625,629 12,243,079 53.36
Injection supplies 108,162 106,748 111,117 114,660 524,516 965,203 4.21
Personnel 165,194 178,654 200,993 217,145 231,260 993,246 4.33
Salaries of full-time EPI health workers (immunization specific) 37,139 39,553 45,892 48,875 52,052 223,512 0.97
Per-diems for outreach vaccinators/mobile teams 0 0 0 0 0 0 0.00
Per-diems for supervision and monitoring 128,056 139,101 155,101 168,270 179,207 769,735 3.35
Transportation 28,698 36,308 45,147 29,037 32,004 171,193 0.75
Fixed Site Strategy (Incl. Vaccine Distribution) 0 0 0 0 0 0 0.00
Outreach strategy 28,698 36,308 45,147 29,037 32,004 171,193 0.75
Mobile strategy 0 0 0 0 0 0 0.00

Maintenance and overhead 452,136 511,936 553,732 595,438 635,275 2,748,517 11.98
Cold chain maintenance and overhead 147,769 155,495 172,339 180,105 182,454 838,163 3.65
Maintenance of other capital equipment 29,270 47,662 50,999 61,811 66,137 255,878 1.12
Building Overheads (Electricity, Water etc) 275,097 308,780 330,394 353,522 386,684 1,654,476 7.21
Short-term training 55,982 87,049 86,513 78,827 6,059 314,430 1.37
IEC/Social Mobilization 212,048 327,123 296,720 348,510 292,226 1,476,628 6.44
Disease Surveillance 34,733 38,391 42,434 46,902 51,842 214,301 0.93
Program management 338,791 371,567 435,655 742,501 313,268 2,201,783 9.60
Other routine recurrent costs 0 0 0 0 0 0 0.00
Subtotal 3,742,049 4,526,897 4,589,494 5,039,822 5,044,937 2,2943,198 100.00
4.2.3 Supplemental Immunization
Supplemental Immunization Services (SIAs) will be conducted for different antigens over the five-year period. Total cost of Supplemental
Immunization Services over the period is $5, 978, 094 ($6 million)
Table C5: Total Supplemental Immunization Cost, 2017-2021
Vaccine Type
Future Cost Projections (US$) 2017 2018 2019 2020 2021* Total
Polio (0-59 m0nths) 496,929 535,137 -- -- 1,032,066
MR (9 months-5 years) -- -- -- 1,109,267 -- 1,109,267
MenA (1 year-5 years) -- -- 1,093,036 -- -- 1,093,036
YF (9 months-year-15 years) -- -- 2,146,042 -- -- 2,146,042
TT (15 years-49 years) -- -- -- 597,683 -- 597,683
Total 496,929 535,137 3,239,078 1,706,950 -- 5,978,094

4.2.4 Cost by Strategy
The National Immunization Programme will focus mainly on these strategies for the delivery of immunization services (as in Table C6). The
cost of fix and outreach strategies represents about 43.1% of total cost for the five years. Mobile strategy and campaigns account for 33.3% and
23.6% respectively. It is expected that there will increases in the coverage by strategies, however these proportions may not vary much over the
period.
Table C6: Costs by Strategy (shared costs excluded) (US$)
Strategy 2017 2018 2019 2020 2021 Total cost Percent of total cost
Fixed and Outreach activities 2,455,106 2,958,476 2,907,167 3,142,610 3,207,984 64,663,466 43.12
Mobile strategy 2,455,106 2,958,476 2,907,167 3,142,610 3,207,984 49,992,123 33.33
Supplemental immunization activities 248,465 267,568 1,619,539 853,475 0 35,320,780 23.55
Total 5,158,676 6,184,520 7,433,873 7,138,696 6,415,967 149,976,368 100.00
This information is demonstrated pictorially (for ease of appreciation) in Figure C1.

Figure C1: Total Immunization Cost by Strategy, 2017-2021
$0
$2,000,000
$4,000,000
$6,000,000
$8,000,000
20172018
20192020
2021
Costs By Strategy (Shared Costs Excluded)
Routine fixed site delivery Outreach activities
Mobile strategy Supplemental immunization activities

4.3 Resource Requirement & financing gaps
The future secure and probable financing and gaps (shared costs excluded) analysis indicate GAVI and Government will need to continue to
contribute to immunization services. The government of The Gambia will continue to provide for health services and still remain a major source
of financing. However due to Donor specialization, it is possible that in some programmes, a multilateral or bilateral organization may be the
major funding source. The probable financing gap will be relatively wider from 2018 to 2020, and thus intensifying resource mobilization
activities and active engagement of all partners will be key (as in Table C7) and pictorially demonstrated to appreciate the gaps in Figure C2 as
well.
Table C7: Funding Gap (with secured funds only)
Secured Funding: 2017 2018 2019 2020 2021 US$ US$ US$ US$ US$
Government 1,666,387 1,970,010 1,573,655 389,473 1,775,940
Sub-national government 0 0 0 0 0
Gov. co-financing of GAVI vaccine 134,240 138,774 143,318 148,048 153,130
UNICEF 66,885 42,413 75,000 60,000 5,000
WHO 93,770 0 0 0 0
GAVI 2,928,930 3,617,399 3,546,569 3,931,748 3,965,209
Rotary International 0 0 0 0 0
Total secure funding 4,890,212 5,768,596 5,338,542 529,269 5,899,279
Total resources needed: 5,158,676 6,184,520 7,433,873 7,138,696 6,415,967
Funding gap 268,465 415,924 2,095,331 2,609,427 $516,689

Figure C2: Future Secure and Probable Financing and Gaps (shared costs excluded)
The analysis indicates Government of The Gambia co-financing of GAVI vaccine is relatively low, the Government will pay approximately 5%
of all co-financed vaccines in 2017, and will remain around this level (less than 5% till 2021). Thus GAVI remains the main provider of funds
for new vaccines; this is noted in the development of the financing component of this document. Active engagement of partners and continued
Government support is imperative. It is important to note however that, The Gambia has always met its co- financing obligations (The Gambia
GAVI HSS, 2014).
$0
$1,000,000
$2,000,000
$3,000,000
$4,000,000
$5,000,000
$6,000,000
$7,000,000
$8,000,000
2017 2018 2019 2020 2021
Future Secure Financing And Gaps (Shared Costs Excluded)
Government Sub-national government Gov. co-financing of gavi vaccine UNICEF WHO GAVI Rotary International Funding gap
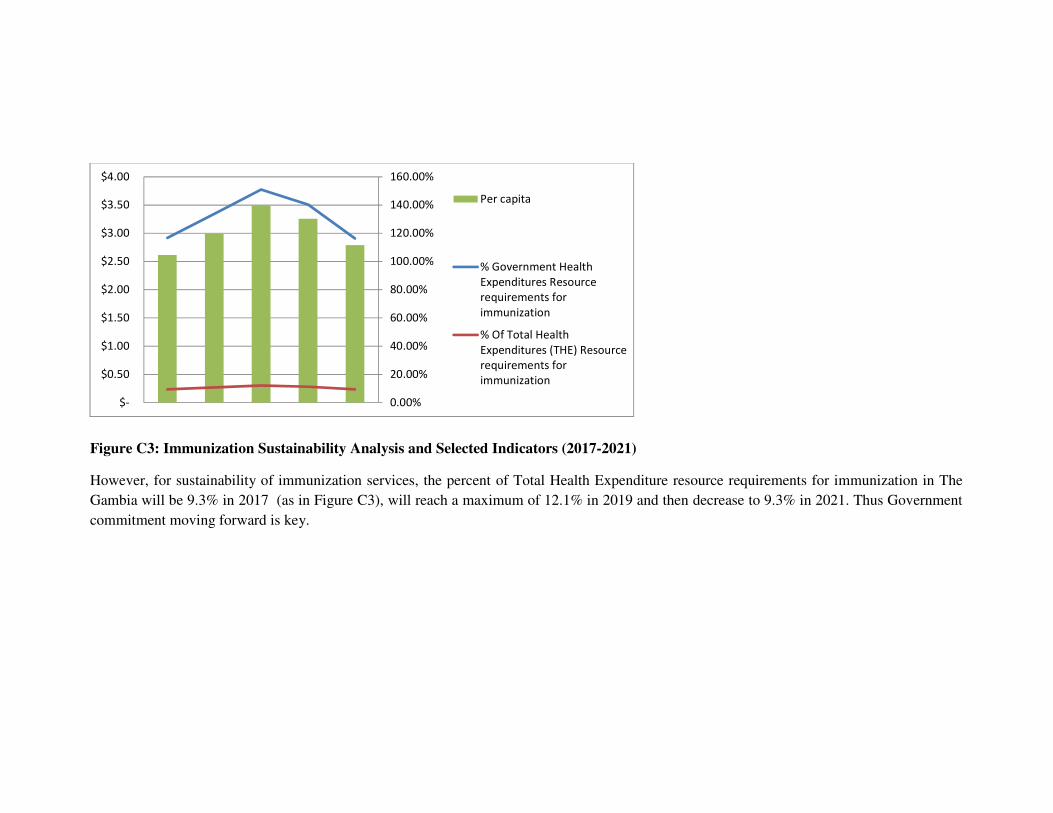
Figure C3: Immunization Sustainability Analysis and Selected Indicators (2017-2021)
However, for sustainability of immunization services, the percent of Total Health Expenditure resource requirements for immunization in The
Gambia will be 9.3% in 2017 (as in Figure C3), will reach a maximum of 12.1% in 2019 and then decrease to 9.3% in 2021. Thus Government
commitment moving forward is key.
0.00%
20.00%
40.00%
60.00%
80.00%
100.00%
120.00%
140.00%
160.00%
$-
$0.50
$1.00
$1.50
$2.00
$2.50
$3.00
$3.50
$4.00
Per capita
% Government Health
Expenditures Resource
requirements for
immunization
% Of Total Health
Expenditures (THE) Resource
requirements for
immunization

4.4 Financing and Financial Sustainability Strategies
4.4.1 GAVI Graduation and Graduation Process
One of GAVI’s strategic goals is to “contribute to strengthening the capacity of integrated
health systems to deliver immunisation”. The Government of Gambia has received various
support from GAVI including Health System Strengthening (HSS) Cash Support of 2014 and
the GAVI funded HPV demonstration (2014-2016) among others. The country has received
co-financing for DPT-Hib-HepB and PCV-13 since 2009 and Rota virus vaccine since 2013,
with an expected final year of co-financing in 2021.
4.4.2 Sustainability plan
The Government of The Gambia is fully committed to improving the health and welfare of
the entire population and has formulated policies and strategies for achieving this national
goal and ranks health very high as a national priority ( as per the Programme for Accelerated
Growth and Employment of The Gambia). The Primary health care strategy which calls for
stronger partnership and collaboration encompasses a large range of providers and services
across the public, private and non-government sectors contributing to improved access to
different segment of the population. The Ministry of Health and Social Welfare will use the
PHC strategy to sustain the gains registered under the national immunization programme with
the support of GAVI and other partners during the implementation period of the current
cMYP.
The Ministry of Health and Social Welfare will continue to provide support from the national
budget towards maintenance of transport and cold chain facilities (GAVI HSS, 2014) as well
as the running cost of transport facilities (The Gambia GAVI HSS, 2014). In addition, a cold
van has been purchased for the distribution of vaccines routinely and during campaigns from
ISS funds.
The Government of The Gambia will continue to support capacity building for staff, pay
salaries, allowances and fuel from the Gambia Local Fund (GLF). The Gambia has always
met its co- financing obligations and this will be continued to enhance effective
immunization service delivery during the implementation of the cMYP 2017-2021 (The
Gambia GAVI HSS, 2014).
The Ministry of Health and Social Welfare will work closely with various Ministries and
partners such as the Ministry of Regional Integration, Lands and Traditional Rulers, Ministry

of Finance and Economic Affairs, GFATM, UNICEF, WHO, UNFPA, The Gambia Red
Cross Society, Child Fund, Action Aid, HePDO and other potential partners in order to
secure additional resources for the implementation of the of the cMYP 2017 – 2021.
The existing community structures such as the Village Development Committees (VDC),
Multidisciplinary Facilitation Teams (MDFT), as well as community frontline
communicators will be engaged to take ownership towards the maintenance of infrastructures
for providing immunization services. As part of community engagement to improve
immunization services, NGOs, CSOs, Community Volunteers and other critical partners
operating at grass-root level will be mobilized and involved throughout the implementation of
the cMYP. The Gambian EPI communication plan 2014-2018 highlights the importance of
NGOs and CBOs in the promotion of immunization services and related essential family
health practices. The WHO, UNICEF and the World Bank continue to be major partners as
well as other partner in health such as The Red Cross. UNICEF has been a long standing
partner in the provision of cold chain equipment while WHO continues to assist in technical
areas and waste management as part of immunization service delivery and the World Bank
through Maternal and Child Nutrition and Health Results Project (MCNHRP).
The government of The Gambia is committed to the immunization programme and has
shown commitment to funding obligations over the years and will continue to collaborate
with all partners in meeting national immunization targets in the coming years.

CHAPTER FIVE: MONITORING AND EVALUATION FRAMEWORK
The country cMYP 2017 – 2021 provides an opportunity for the programme managers
at all levels to monitor and keep track of the objectives, strategies and key activities based on
identified indicators. The cMYP 2017-2021 was also aligned with the national monitoring
and evaluation framework and the GVAP M& E framework. The data to be used to monitor
these indicators are either collected monthly routinely or through surveys. The EPI
programme plan to conduct an annual review of these indicators and will be reported on. The
cMYP 2017-2021 M&E Framework is as shown in Table….
A mid-term evaluation of the cMYP is proposed in 2019 to evaluate the progress and
performance in the implementation plan activities. It will also evaluate the progress towards
achieving set targets and objectives.
A final evaluation of the cMYP 2017 – 2021 will be done in 2021 and the findings
from this evaluation will inform the strategic focus for another cMYP cycle starting in 2022.

Table X: Monitoring and Evaluation Framework for immunization services (2017-2021) in The Gambia
Objective OUTCOME
INDICATOR
Baseline Targets Frequency
of Data
Collection
Responsible
Person Results Year Source 2017 2018 2019 2020 2021 Means
of
Verificat
ion
1. Immunization Service Delivery
To achieve 99%
coverage at
national and 96%
coverage at
regional for all
vaccines by 2021
No. of
coverage
surveys
conducted
97% 2015 JRF 99% 99% 99% 99% 99% HMIS Monthly EPI
To maintain
DPT1-DPT3
dropout rate to no
more than 5% by
2021
Proportion of
health facilities
with dropout
rate less than
5%
1.97% 2015 JRF <5% <5% <5% <5% <5% HMIS Monthly PHOs
To bridge the %
gap between the
highest and lowest
wealth quintile to
zero by 2021
Proportion of
the rich
utilizing
Immunization
services
-7.3 2013 DHS 0% 0% 0% 0% 0% Assessm
ent &
Survey
reports
Once MOHSW &
Partners

To introduce MR,
HPV & MenA
between 2017-2021
No. of new
vaccines
introduced
3 2012 -
2015
GAVI
Applic
ation
MR HPV,
Men
A
0 0 0 New
Vaccine
introduct
ion
reports
1 - 2 years MOHSW &
Partners
Strategies OUTPUT
INDICATOR
Baseline Targets Frequency
of Data
Collection
Responsible
Person Results Year Source 2017 2018 2019 2020 2021 Means
of
Verificat
ion
1. Immunization Service Delivery
Implement “Reach
every community”
in every health
region
Proportion of
health facilities
that have
updated micro
plans
96% 2015 EPI
Compr
ehensiv
e
assess
ment
100
%
100
%
100% 100
%
100
%
Micro
plan
reports
Once MOHSW &
Partners
Engaging
communities to
create demand for
immunization
services
Proportion of
health facilities
that have
functional
health facility
management
communities
0 0 0 100
%
100
%
100% 100
%
100
%
Reports Monthly PHOs

Improve
immunization
equity through
program design
Equal
immunization
coverage among
all socio-
economic class
(Equal Ratio
1:1)
The
differen
ce
between
the
highest
and the
lowest
socio-
economi
c class
(-7.3)
2013 DHS 1 to 1 1 to 1 1 to 1 1 to
1
1 to 1 DHS 2 - 3 years MOHSW &
Partners
Introduction of
new vaccines (MR,
HPV & MenA)
into the EPI
schedule
Number of new
vaccines
introduced
Measles
2, Rota
& IPV
2016 HMIS MR Men
A
and
HPV
0 0 0 HMIS Annual MOHSW &
Partners
Activities INPUT
INDICATOR
Baseline Targets Frequency
of Data
Collection
Responsible
Person Results Year Source 2017 2018 2019 2020 2021 Means
of
Verificat
ion
1. Immunization Service Delivery
Update micro
plans to include
hard to reach
No. of micro
plans
conducted
3 2015 EPI
Report
s
100
%
100
%
100% 100
%
100
%
Reports Annually EPI , RHDs
& Health
Facility

communities
Expand routine
immunization
services to reach
all communities
No. of new
immunization
outreach Clinics
established
0 2016 NA 80% 85% 90% 95% 100
%
HMIS Bi-Annual MOHSW &
Partners
Conduct refresher
trainings on inter
personal
communication(IP
C) for
immunization
service providers
No. of
Trainings
conducted
80% 2015 EPI
Report
s
85% 90% 95% 98% 100
%
Training
Reports
and List
of
participa
nts
Bi-Annual MOHSW &
Partners
Conduct surveys
to identify areas of
low immunization
coverage
No. of coverage
Surveys
conducted
1 2013 EPI
Report
s
1 1 1 Survey
results
Bi-Annual MOHSW &
Partners
Sensitize
communities on
their roles and
responsibilities in
immunization
service delivery
No of
sensitizations
conducted
0 2015 EPI
Report
s
4 4 4 4 4 Sensitiza
tion
Reports
quarterly EPI , RHDs
& Health
Facility

Orientation of the
highest income
group on the
benefits of
immunization
No of
orientation
sessions
conducted
0 2015 EPI
Report
s
4 4 4 4 4 Orientati
on
Reports
quarterly EPI , RHDs
& Health
Facility
Conduct Post
introduction
Evaluation
No of post-
introduction
evaluations
conducted
PIE
HPV
demonst
ration
project
and
Measles
2nd
dose
2015 PIE
HPV
and
Measle
s 2nd
dose
Report
MR HPV
&
Men
A
PIE
Reports
A year after
introduction
MOHSW &
Partners
Conduct national
EPI programme
reviews
No of EPI
reviews
conducted
1 2015 EPI
Report
s
1 1 1 Review
Reports
Bi-Annual EPI , RHDs
& Partners
Objective OUTCOM
E
INDICAT
OR
Baseline Targets Frequency of
Data
Collection
Responsibl
e Person Results Year Source 2017 2018 2019 2020 2021 Means of
Verification
2. Monitoring, Surveillance and Reporting
To improve and
expand disease
surveillance &
Monthly
Reporting
on Polio,
OPV3=
96%
2015 JRF 97% 98% 99% 99%
99% HMIS
reports
Monthly PHOs

reporting by
2021: 1. Polio 2.
MNT
3.Measles,Yello
w Fever,5
meningitis
MNT,
Measles
Yellow
Fever and
Meningitis
2.TT2+ =
82%
2015 85% 89% 93% 97% 99% HMIS
reports
Monthly PHOs
3.Measles
1= 97%
2015 98% 98% 98% 99% 99% HMIS
reports
Monthly PHOs
4.Yellow
Fever=
97%
2015 98% 98% 98% 99% 99% HMIS
reports
Monthly PHOs
5.
Meningitis
= 104
(SIA)
2013
(SIA
)
70% 80% 85% 90% 95% HMIS
reports
Monthly PHOs
To
institutionalize
routine AEFI
surveillance in
all health
facilities by 2021
% of
health
facilities
reporting
AEFI
surveillanc
e regularly
No base
line result
2015 EPI
comprehensi
ve
Assessment
60% 70% 80% 90% 98% AEFI
Reports
Monthly EPI,
EDC,RHDs
and Health
Facility
Strategies OUTPUT
INDICAT
OR
Baseline Targets Frequency of
Data
Collection
Responsibl
e Person Results Year Source 2017 2018 2019 2020 2021 Means of
Verification
2. Monitoring, Surveillance and Reporting
Strengthen and % of health 98% of 2015 HMIS and 100 100 100 100 100 No, of reports Monthly PHOs
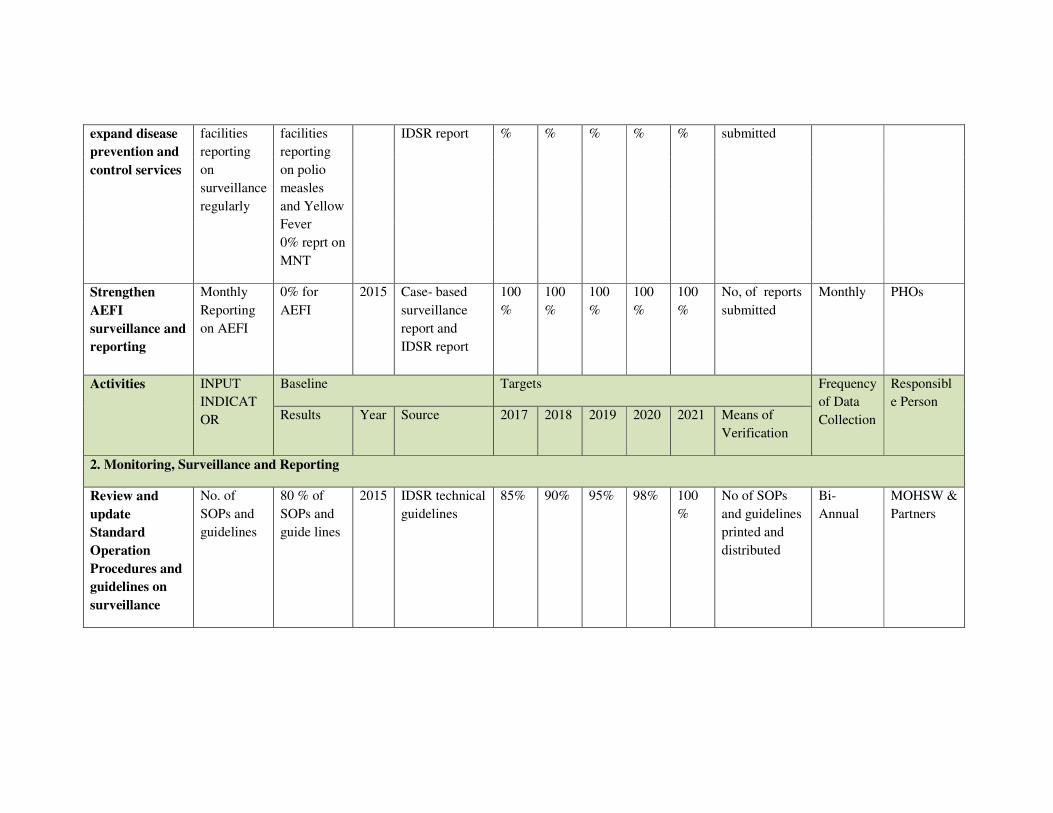
expand disease
prevention and
control services
facilities
reporting
on
surveillance
regularly
facilities
reporting
on polio
measles
and Yellow
Fever
0% reprt on
MNT
IDSR report % % % % % submitted
Strengthen
AEFI
surveillance and
reporting
Monthly
Reporting
on AEFI
0% for
AEFI
2015 Case- based
surveillance
report and
IDSR report
100
%
100
%
100
%
100
%
100
%
No, of reports
submitted
Monthly PHOs
Activities INPUT
INDICAT
OR
Baseline Targets Frequency
of Data
Collection
Responsibl
e Person Results Year Source 2017 2018 2019 2020 2021 Means of
Verification
2. Monitoring, Surveillance and Reporting
Review and
update
Standard
Operation
Procedures and
guidelines on
surveillance
No. of
SOPs and
guidelines
80 % of
SOPs and
guide lines
2015 IDSR technical
guidelines
85% 90% 95% 98% 100
%
No of SOPs
and guidelines
printed and
distributed
Bi-
Annual
MOHSW &
Partners

Train Health
Care Workers
on standard
operation
procedures and
guidelines on
surveillance
No of
Health Care
workers
trained
80% 2015 EPI
comprehensive
Assessment
85% 90% 95% 98% 100
%
Health Care
workers
trained
Bi-
Annual
MOHSW &
Partners
Review and
update the EPI
technical
guideline
No. of
guidelines
reviewed
and
updated
85% 2015 EPI
comprehensive
Assessment
100
%
100
%
100
%
100
%
100
%
guidelines
reviewed and
updated
Once MOHSW &
Partners
Harmonize EPI
data collection
tools into
Health
Management
Information
System
No of
HMIS
report with
EPI data
0% 2016 HMIS report 70% 80% 85% 90% 100
%
DHIS2
Database
Monthly EPI,
EDC,RHDs
and Health
Facility
Strengthen data
management,
reporting and
feedback
mechanism at
central and
regional levels
No. of
feedback
reports sent
from
central to
regional
and from
regional to
health
0% 2015 EPI
comprehensive
Assessment
70% 75% 80% 90% 100
%
feedback
reports
Monthly EPI,
EDC,RHDs
and Health
Facility

facilities
Strengthen
collection,
handling &
transportation
of samples to
National Public
Health
Laboratory
No of
specimen
samples
sent timely
70% 2016 EPI
comprehensive
Assessment
75% 80% 90% 95% 100
%
Case
investigation
forms
Monthly PHOs
Develop, review
and update
AEFI reporting
tools
% of AEFI
tools
reviewed
and
updated
0% 2015 EPI
comprehensive
Assessment
70% 75% 80% 90% 100
%
AEFI tools Bi-
Annual
MOHSW &
Partners
Train health
care workers on
the use of AEFI
tools
Proportion
of health
care
workers
trained on
AEFI
0% 2016 During the
development
of cMYP 2017
to 2021
70% 75% 80% 90% 100
%
health care
workers
trained
Bi-
Annual
MOHSW &
Partners
Institute
monthly
reporting of
AEFI including
Proportion
of health
facilities
reporting
0% 2016 HMIS report 70% 75% 80% 90% 100
%
Health Facility
reports
Monthly EPI

zero AEFI
Establish &
train national
and regional
AEFI
committees to
enable rapid
and trustworthy
investigation of,
and response to,
serious AEFIs
Percentage
of staff
trained on
AEFI at all
levels
0% 2016 During the
development
of cMYP 2017
to 2021
70% 75% 80% 90% 100
%
Training
reports
Bi-
Annual
EPI
Objective OUTCOM
E
INDICAT
OR
Baseline Targets Frequency
of data
collection
Responsible
person
Results Year Source 2017 2018 2019 2020 2021 Means of
Verificatio
n
3. Demand generation, communication and advocacy
To sensitize
Policy makers
and politicians,
actively
involved and
participate in
immunization
services by the
% of policy
makers and
politicians
sensitized
on
immunizati
on services
25% 2016 ICC
Report
30% 50% 80% 90% 100% ICC Report Quarterly EPI

end of 2021
To mobilize all
communities to
sustain high
immunization
coverage by
the end of 2021.
% of
communiti
es
mobilised
on high
immunizati
on
sustainabili
ty
50% 2016 60% 70% 80% 90% 100% EPI
Activity
Report
Yearly EPI/DHPE
To increase the
utilization of
the print and
electronic
media for
routine
immunization
services by the
end of 2021
% 0f print
and
electronic
media
utilized in
immunizati
on services
50% 60% 70% 80% 90% 100% EPI
Activity
Report
Yearly EPI/DHPE
To actively
increase the
participation
of male in
immunization
services by
Proportion
of male
sensitize on
their
involvemen
t in
0 25% 50% 75% 80% 100% EPI
Sensitizatio
n Report
Yearly EPI/DHPE/RC
H

2021 immunizati
on services
To provide
90% of
communities
with SBCC
support
materials by
2021
% of
communiti
es provided
with SBCC
support
material
0 50% 75% 100% EPI
Inventory
BI-annually EPI/DHPE/RC
H
Strategies OUTPUT
INDICAT
OR
Baseline Targets Frequency
of data
collection
Responsible
person
Results Year Source 2017 2018 2019 2020 2021 Means of
Verification
3. Demand generation, communication and advocacy
Engagement of
policy makers
and politician
Proportion
of policy
makers and
politicians
engaged
10% 30% 50% 75% 90% 100% Advocacy
meeting
Report
Yearly EPI/DHPE
Community
mobilization for
increase
immunization
demand
Proportion
of
Communiti
es
mobilized
for
50% 65% 70% 80% 90% 100% Sensitization
meeting
Report
Yearly EPI/DHPE

increased
immunizati
on demand
Providing
SBCC support
materials
Proportion
of
communiti
es provided
with SBCC
support
material
50% 65% 75% 100% EPI/DHPE
Inventory
Yearly EPI/DHPE
Activities INPUT
INDICAT
OR
Baseline Targets Frequency
of data
collection
Responsible
person
Results Year Source 201
7
2018 2019 2020 2021 Means of
Verification
3. Demand generation, communication and advocacy
conduct
advocacy
meetings
Proportion
of
advocacy
meeting
conducted
25% 2016 100
%
100
%
100
%
100% 100% Meeting
report
Yearly EPI/DHPE
Conduct SBBC
meetings
Proportion
of SBCC
meeting
conducted
50% 2016 60% 70% 80% 90% 100% Meeting
report
Quarterly EPI/DHPE
Organize radio Proportion
of radio
55% 60% 70% 75% 90% 100% Programme Quarterly EPI/DHPE

and TV shows and TV
shows
organised
report
Organize media
briefing
Proportion
of media
briefing
organised
15% 25% 50% 75% 90% 100% Media
briefing
Report
Yearly EPI/DHPE
Train health
workers on risk
communication
Proportion
of health
workers
trained
0 50% 75% 100% EPI Training
Report
Yearly EPI
Develop,
print and
distribute
SBBC support
materials
Proportion
of SBCC
support
materials
developed,
printed and
distributed
25% 50% 75% 100% EPI/DHPE
Inventory
BI-Annually EPI/DHPE
Train health
workers on
effective
communication
skills
Proportion
of health
workers
trained
25% 50% 75% 100% EPI Training
Report
Yearly EPI/DHPE

Objective OUTCOME
INDICATO
R
Baseline Targets Frequency
of data
collection
Responsible
person
Results Year Source 2017 2018 2019 2020 2021 Means of
Verification
4. Vaccine, Cold Chain and Logistics
1.To provide 40
M3 cold room
at central level
by end of 2019
40m3 cold
room
provided at
central level
1 2016 Cold chain
inventory
1 Cold chain
inventory,
Invoice and
receipts
Bi-
annually
EPI
.To provide 25
refrigerators
(TCW 3000
SDD) in six
regional cold
stores by end of
2021
% of
refrigerators
provided at
the regional
cold store
10 2016 Cold chain
inventory
12 25 Cold chain
inventory
Yearly EPI
To provide 20
refrigerators
(TCW 2000) in
public health
facilities
offering
immunization
services by the
end of 2021.
% of
refrigerators
provided in
newly built
facilities
providing
immunizati
on services
5 2016 Cold chain
inventory
16 20 Cold chain
inventory
Yearly EPI

To Procure and
install
automatic
voltage
regulators for
the central EPI
cold store by
2021
% of
automatic
voltage
regulators
installed for
central and
regional
store
0 2016 Cold chain
inventory
1 Cold chain
inventory
Every 2
years
EPI
Maintaining
regular and
quality vaccine
supply by 2021
proportion
of vaccine
stores
maintaining
regular and
quality
vaccine
55 2016 Stock card
and
Temperatu
re record
100
%
100
%
100
%
100
%
100% Stock card
and
Temperature
record
Yearly EPI
Inadequate EPI
logistic system
at all levels
Proportion
of health
facilities
with
improved
logistic
system
75% 2016 EVM
report
Yearly EPI
To provide six
incinerators in
six health
region by 2021
% of
incinerators
provided at
regional
level
6 2016 Cold chain
inventory
4 6 Cold chain
inventory
Every 3
years
EPI

Strategies OUTPUT
INDICATO
R
Baseline Targets Frequency
of data
collection
Responsible
person
Results Year Source 2017 2018 2019 2020 2021 Means of
Verification
4. Vaccine, Cold Chain and Logistics
Strengthening
and expansion
of the cold
chain
Proportion
of
additional
Cold chain
equipment
installed
1% 50% 75% 100
%
Cold Chain
inventory
and
supervisory
report
Yearly EPI
Mobilize funds
to procure
vaccines
Proportion
of routine
vaccine
available.
100% EVM
report
100
%
100
%
100
%
100
%
100% Government
budget
allocation
Yearly EPI
Strengthening
regular stock
and
temperature
monitoring and
recording at all
levels
Proportion
of health
facilities
storing
vaccines
that record
temperature
daily
100% EVM
report
100
%
100
%
100
%
100
%
100% Temperature
monitoring
chart
Monthly EPI
Capacity
building on
effective
vaccine
No of
capacity
building
workshop
1 2014 EVM
report
1 1 EVM
training
report
Yearly EPI

management(E
VM
on EVM.
Strengthening
logistic system
at all levels
Proportion
of
additional
logistic
provided
0 EVM
report
25% 50% 75% 100
%
EPI
Inventory
Yearly EPI
Improving
waste
management
and injection
safety
Proportion
of
additional
incinerators
0 EVM
report
50% 80% 90% 100% Quarterly EPI/DHPE
Activities INPUT
INDICATO
R
Baseline Targets Frequency
of data
collection
Responsible
person Results Year 2018 2019 2020 2021 Means of
Verification
4. Vaccine, Cold Chain and Logistics
Procure 1 cold
room for
central level ,45
fridges for
regional and
health facilities
, and spare
parts for all
1. Cold
room
procured at
central
level. 2.
No. of
fridges
procured at
central
(1)
regional
(20) ,
health
facility(
50)
2016 EPI
Inventory
1 25 45 EPI
Inventory
Every 5
years
EPI

levels regional and
health
facities.3.
No. of spare
parts
procured
Install the
fridges and the
cold room at
health facility
regional, and
central level
Cold room
installed at
central
level. 2.
No. of
fridges
installed at
regional and
health
facities.3.
No. of spare
parts
available at
all levels
central
(1)
regional
(20) ,
health
facility(
50)
2016 EPI
Inventory
1 25 45 EPI
Inventory
Yearly EPI
Procure and
install three
automatic
voltage
regulators at
the central cold
room
No. of
automatic
voltage
regulators
procured
and
installed at
central cold
0 2016 EVM
report
3 EPI
Inventory
Yearly EPI

room
Procure and
install two
multi- loggers
at the central
and regional
cold rooms
No. of
multi-
loggers
procure and
installed at
central and
regional
cold stores
0 2016 EVM
report
2 EPI
Inventory
Every 5
years
EPI
Advocacy
meeting with
policy makers
No. of
advocacy
meetings
conducted
4 2016 ICC
Minutes
1 2 3 ICC Minutes Yearly EPI/DHPE
Train
immunization
providers on
EVM
No. of
immunizati
on
providers
trained
200 2016 EVM
report
25% 50% 75% 100
%
EPI training
report
Yearly EPI
Procure two
hundred fridge
tags and 100
freeze tags for
central,
regional and
health facilities
Proportion
of fridge
tags and
freezed tags
procured for
all levels
100% 2016 Shipping
documents
25% 50% 75% 100
%
Shipping
documents
Yearly EPI

Conduct
supportive
supervision and
monitoring
Proportion
of
supportive
supervision
and
monitoring
conducted
50% 2016 Supervisor
y report
100
%
100
%
100
%
100
%
100% Supervisory
Report
Quarterly EPI
Procure spare
parts and fuel
Proportion
of spare part
and fuel
procured
50% 2016 Shipping
documents
and
inventory
30% 50% 70% 90% 100% Shipping
documents
and
inventory
Yearly EPI
Install spare
parts
Proportion
of Spare
part
installed
0% 2016 Inventory 30% 50% 70% 90% 100% EPI
Inventory
Yearly EPI
Conduct
regular
maintenance
Proportion
of regular
maintenanc
e conducted
100% 2016 Maintenan
ce log
book
100
%
100
%
100
%
100
%
100% Maintenance
log book
Quarterly EPI
Construct and
refurbish dry
stores
Proportion
of dry stores
constructed
and
refurbished
13% 2016 EVM
report
50% 100
%
EVM report Yearly EPI
Construct and
maintain
Proportion
of
incinerators
70% 2016 EPI
Comprehe
nsive
50% 100
%
EPI
Comprehens
ive review
Every 5
years
EPI

incinerator constructed
and
maintained
review report
Train
incinerator
attendance
Proportion
of
incinerator
attendance
trained
0% 2016 EPI
Comprehe
nsive
review
25% 50% 75% 100% EPI
Comprehens
ive review
report
Yearly EPI
Procure PPEs Proportion
of PPEs
procured
0% 2016 EPI
Comprehe
nsive
review
100
%
EPI
Comprehens
ive review
Yearly EPI
Objective OUTCOME
INDICATOR
Baseline Targets Frequency of
Data
Collection
Responsible
Person Results Year Source 2017 2018 2019 2020 2021 Means of
Verification
5. Costing and Finance
To increase
and improve
access to
funds for EPI
programme
implementati
Total
expenditure on
immunization
as % of
MoHSW
budget
30% 2015 JRF 40% 40% 40% 40% 40% JRF reports 1 EPI

on by 2021 Proportion of
immunization
budget
released on
time.
0 2015 JRF 80% 80% 80% 80% 80% JRF reports 1 EPI
Strategies OUTPUT
INDICATOR
Baseline Targets Frequency of
Data
Collection
Responsible
Person Results Year Source 2017 2018 2019 2020 2021 Means of
Verification
5. Costing and Finance
Enhancing
operational
efficiency
through
better budget
management
Availability of
budget
management
tool
0 2015 EPI
comprehe
nsive
review
1 0 0 0 0 Copies of
the budget
managemen
t tool
1 EPI
Activities INPUT
INDICATOR
Baseline Targets Frequency of
Data
Collection
Responsible
Person Results Year Source 2017 2018 2019 2020 2021 Means of
Verification
5. Costing and Finance
Develop and
implement
Operational
Plan for
immunization
policy
Availability of
an operational
plan for
immunization
policy
0 2015 EPI
comprehe
nsive
review
1 1 1 1 1 Copies of
the annual
operational
plan
1 EPI

financing financing
Constitute a
task force to
advocate for
more
resource
mobilization
Availability of
a task force for
resource
mobilization
0 2015 EPI
comprehe
nsive
review
1 1 0 0 0 Records of
taskforce
members
1 EPI
Develop a
tool that will
track the
execution of
approved
immunization
budget
Availability of
a tool to track
the approved
immunization
budget
0 2015 EPI
comprehe
nsive
review
1 0 0 0 0 copy of the
tool
developed
1 EPI
Develop a
resource
mobilization
plan
Availability
and use of a
cMYP
resource
mobilization
plan
0 2015 EPI
comprehe
nsive
review
1 1 0 0 0 Records of
Plan
1 EPI
Objective OUTCOME
INDICATO
R
Baseline Targets Frequency
of Data
Collection
Responsibl
e Person Results Year Source 2017 2018 2019 2020 2021 Means of
Verification

6. Program Management
To increase
the
participation
of senior
government
officials,
politicians,
religious
leaders and
the private
sector in EPI
related
services by
2021
Number of
advocacy
meetings
held with
senior
government
officials,
politicians,
religious
leaders and
the private
sector on
EPI related
services
0 2015 EPI
compreh
ensive
review
1 1 1 1 1 minutes of
meetings
1 EPI
To develop a
national
immunization
policy by
2021
Availability
of national
Immunizatio
n Policy
0 2015 EPI
compreh
ensive
review
1 0 0 0 0 Minutes of
the
immunizatio
n policy
validation
meetings
1 EPI
To develop
an Integrated
Monitoring
and
Evaluation
(M & E) plan
for
Availability
of integrated
M & E Plan
for cMYP
2017-2021
0 2015 EPI
compreh
ensive
review
1 0 0 0 0 Integrated
M & E Plan
validated,
lunched and
distributed
1 EPI

immunization
services by
2021
Strategies OUTPUT
INDICATO
R
Baseline Targets Frequency
of Data
Collection
Responsibl
e Person Results Year Source 2017 2018 2019 2020 2021 Means of
Verification
6. Program Management
Engage
Senior
government
officials and
politicians
and other
stakeholders
to participate
in EPI
related
services
Number of
meetings
with Senior
government
officials and
politicians
on EPI
0 2015 EPI
compreh
ensive
review
1 1 1 1 1 minutes of
meetings
1 EPI
Development
of a national
immunization
policy with
relevant
stakeholders
Number of
stakeholder
meetings
held on
Immunizatio
n Policy
0 2015 EPI
compreh
ensive
review
1 0 0 0 0 minutes of
the
stakeholder
meetings
1 EPI

Development
of an
integrated M
& E plan
Integrated M
& E Plan
Developed
and launched
0 2015 EPI
compreh
ensive
review
1 0 0 0 0 minutes of
the
integrated
M&E plan
meetings
1 EPI
Activities INPUT
INDICATO
R
Baseline Targets Frequency
of Data
Collection
Responsibl
e Person Results Year Source 2017 2018 2019 2020 2021 Means of
Verification
6. Program Management
Sensitize
senior
government
officials,
politicians
and other
stakeholders
Number of
sensitization
meetings
conducted
0 2015 EPI
comprehensi
ve review
1 1 1 1 1 minutes of
sensitization
meetings
1 EPI
Conduct
annual
meetings with
the health
select
committee of
the National
Assembly
Number of
meetings
conducted
0 2015 EPI
comprehensi
ve review
1 1 1 1 1 Minutes of
annual meetings
1 EPI

Conduct
regular
meeting with
National
Immunizatio
n Technical
Advisory
Group
members
(NITAG)
Number of
meetings
conducted
0 2015 EPI
comprehensi
ve review
1 1 1 1 1 Minutes of
annual meetings
1 EPI
Resource
mobilization
for policy
development
Number of
resource
mobilization
activities
conducted
0 2015 EPI
comprehensi
ve review
1 1 1 1 1 Advocacy reports 1 EPI
Identify and
engage
partners on
policy
development
Number of
partners
engagement
meetings
held on
policy
development
0 2015 EPI
comprehensi
ve review
1 1 1 1 1 Minutes of
annual meetings
1 EPI
Conduct
training
workshops to
orient
(NITAG)
Proportion
of
workshops
conducted
0 2015 EPI
comprehensi
ve review
0 0 1 0 0 minutes of the
workshop
1 EPI
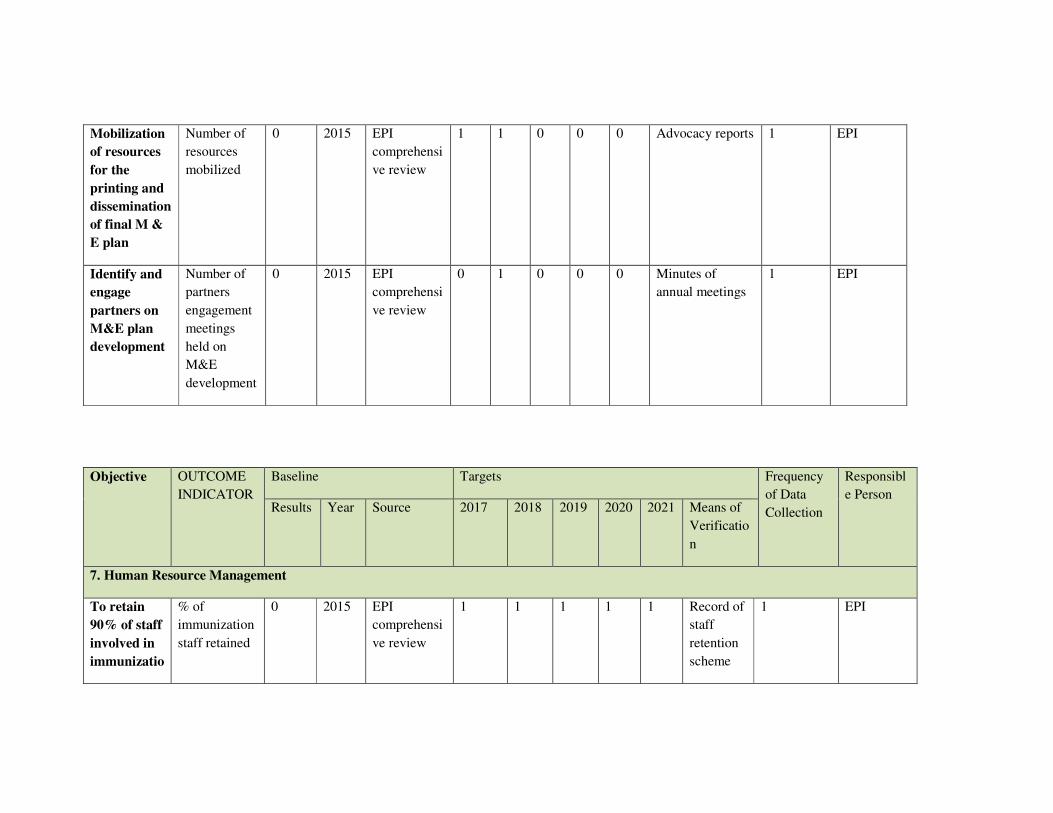
Mobilization
of resources
for the
printing and
dissemination
of final M &
E plan
Number of
resources
mobilized
0 2015 EPI
comprehensi
ve review
1 1 0 0 0 Advocacy reports 1 EPI
Identify and
engage
partners on
M&E plan
development
Number of
partners
engagement
meetings
held on
M&E
development
0 2015 EPI
comprehensi
ve review
0 1 0 0 0 Minutes of
annual meetings
1 EPI
Objective OUTCOME
INDICATOR
Baseline Targets Frequency
of Data
Collection
Responsibl
e Person Results Year Source 2017 2018 2019 2020 2021 Means of
Verificatio
n
7. Human Resource Management
To retain
90% of staff
involved in
immunizatio
% of
immunization
staff retained
0 2015 EPI
comprehensi
ve review
1 1 1 1 1 Record of
staff
retention
scheme
1 EPI

n services
by 2021
To develop
a staffing
norm for
equitable
distribution
of
immunizatio
n service
providers
by 2021
Availability
of staffing
norm
0 2015 EPI
comprehensi
ve review
1 1 1 1 1 staffing
norms
produced
1 EPI
To train 25
middle level
managers
on
immunizatio
n services
by 2021
Proportion of
middle level
managers
trained on
immunization
services
0 2015 EPI
comprehensi
ve review
1 0 1 0 1 minutes
of the
training
held
1 EPI
To train
90% of
immunizatio
n service
providers
by 2021
% of
immunization
service
providers
trained
0 2015 EPI
comprehensi
ve review
1 0 1 0 1 minutes
of the
training
held
1 EPI
Strategies OUTPUT Baseline Targets Frequency Responsibl

INDICATOR Results Year Source 2017 2018 2019 2020 2021 Means of
Verificati
on
of Data
Collection
e Person
7. Human Resource Management
Improve
incentive
package at
all levels
Proportion of
health
workers
benefitied
from
incentives
0 2015 EPI
comprehensi
ve review
1 1 1 1 1 payment
vouchers
1 EPI/HRH
Equitable
distribution
of
immunizatio
n staff at all
levels
Proportion of
immunization
service
providers in
rural and
urban areas
0 2015 EPI
comprehensi
ve review
1 1 1 1 1 record of
staffing
norm
1 EPI/HRH
Strengthen
capacity of
Human
Resource at
all levels
proportion of
facilities with
required
human
resource
0 2015 EPI
comprehensi
ve review
1 1 1 1 1 record of
staffing
norm
1 EPI/HRH
Harmonize
and
improve
continuous
professional
developmen
proportion of
immunization
staff benefited
from
professional
0 2015 EPI
comprehensi
ve review
1 0 1 0 1 Records
of staff
trained
1 EPI

t training
Activities INPUT
INDICATOR
Baseline Targets Frequency
of Data
Collection
Responsibl
e Person Results Year Source 2017 2018 2019 2020 2021 Means of
Verificati
on
7. Human Resource Management
Allocate
50% of
basic salary
as retention
allowance
for
immunizatio
n service
providers
Proportion of
immunization
service
providers
benefited
from
incentives
0 201
5
EPI
comprehensiv
e review
1 11 1 1 1 payment
vouchers
1 EPI
Create a
special hard
to reach
allowance
for
immunizatio
n staff
Number of
immunization
service
providers
received hard-
to-reach
allowance
0 201
5
EPI
comprehensiv
e review
1 1 1 1 1 Records of
staff receiving
hard to reach
allowance
1 EPI

Provide
performanc
e based
reward
advocate for
free medical
care for all
immunizatio
n service
providers
and their
immediate
family
members.
Number of
immunization
service
providers and
their families
benefited
from the
performance
based reward
s 201
5
EPI
comprehensiv
e review
1 1 1 1 1 Records of
immunization
staff and their
families
receiving
performance
based rewards
1 EPI
Construct
new and
refurbish
existing
structures
% of
infrastructures
refurbished
59 201
5
EPI
comprehensiv
e review
0 1 0 1 0 Contract
documents
1 EPI
Number of
new
structures
constructed
59 201
5
EPI
comprehensiv
e review
0 1 0 1 0 Contract
documents
1 EPI
Develop and
implement
posting
guideline
and policy
Availability
of
immunization
staff posting
policy
0 201
5
EPI
comprehensiv
e review
1 0 1 0 1 Posting Policy 1 EPI
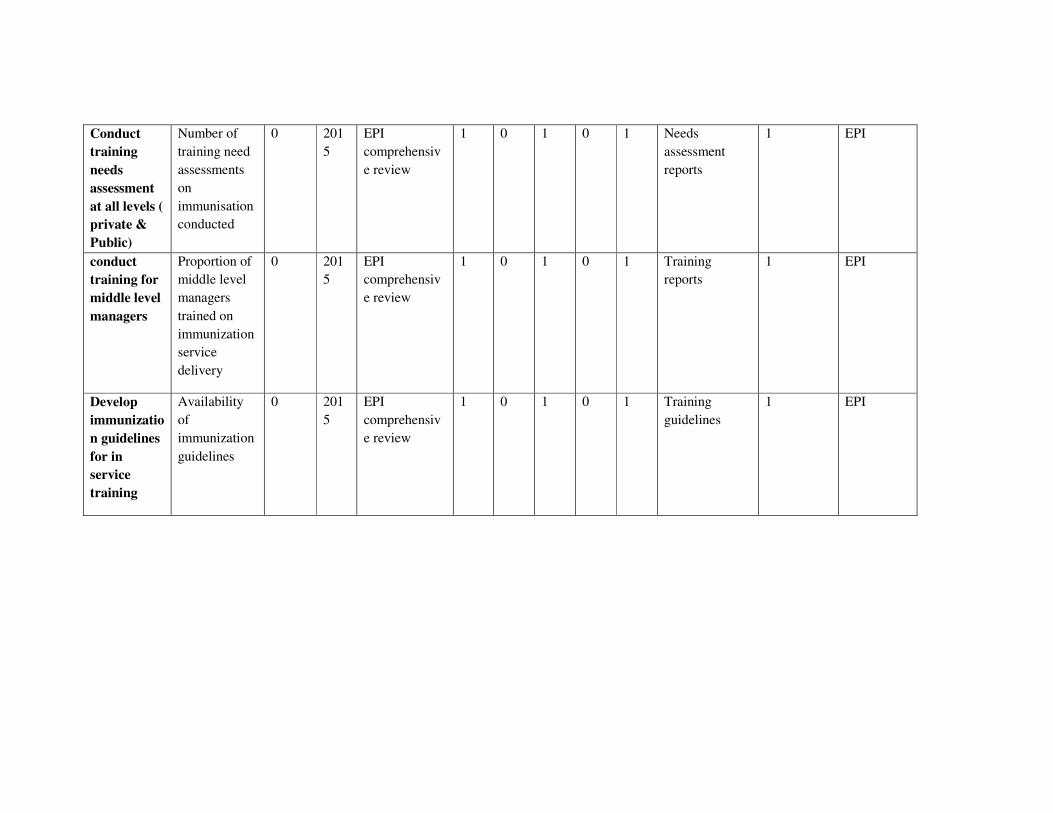
Conduct
training
needs
assessment
at all levels (
private &
Public)
Number of
training need
assessments
on
immunisation
conducted
0 201
5
EPI
comprehensiv
e review
1 0 1 0 1 Needs
assessment
reports
1 EPI
conduct
training for
middle level
managers
Proportion of
middle level
managers
trained on
immunization
service
delivery
0 201
5
EPI
comprehensiv
e review
1 0 1 0 1 Training
reports
1 EPI
Develop
immunizatio
n guidelines
for in
service
training
Availability
of
immunization
guidelines
0 201
5
EPI
comprehensiv
e review
1 0 1 0 1 Training
guidelines
1 EPI

ANNEXURE
Annex 1: GVAP Checklist
Annex 2: Key Activities, Strategies and Objectives cMYP 2017-2021
Thematic Areas
Objectives Strategies Activities
1. Immunization Service Delivery
Immunization coverage
To achieve 99% coverage at national and 96% coverage at regional for all vaccines by 2021
Implement “Reach every community” in every health region
1. Update micro plans to include hard to reach communities
2. Expand routine immunization services to reach all communities
3. Conduct refresher trainings on inter personal communication(IPC) for immunization service providers
4. Conduct coverage surveys to identify areas of low coverage
Immunization demand
To maintain DPT1-DPT3 dropout rate to no more than 5% by 2021
Engaging communities to create demand for immunization services
5. Sensitize communities on their roles and responsibilities in immunization service delivery
Immunization equity
To bridge the % gap between the highest and lowest wealth quintile to zero by 2021
Improve immunization equity through program design.
6. Orientation of the highest income group on the benefits of immunization
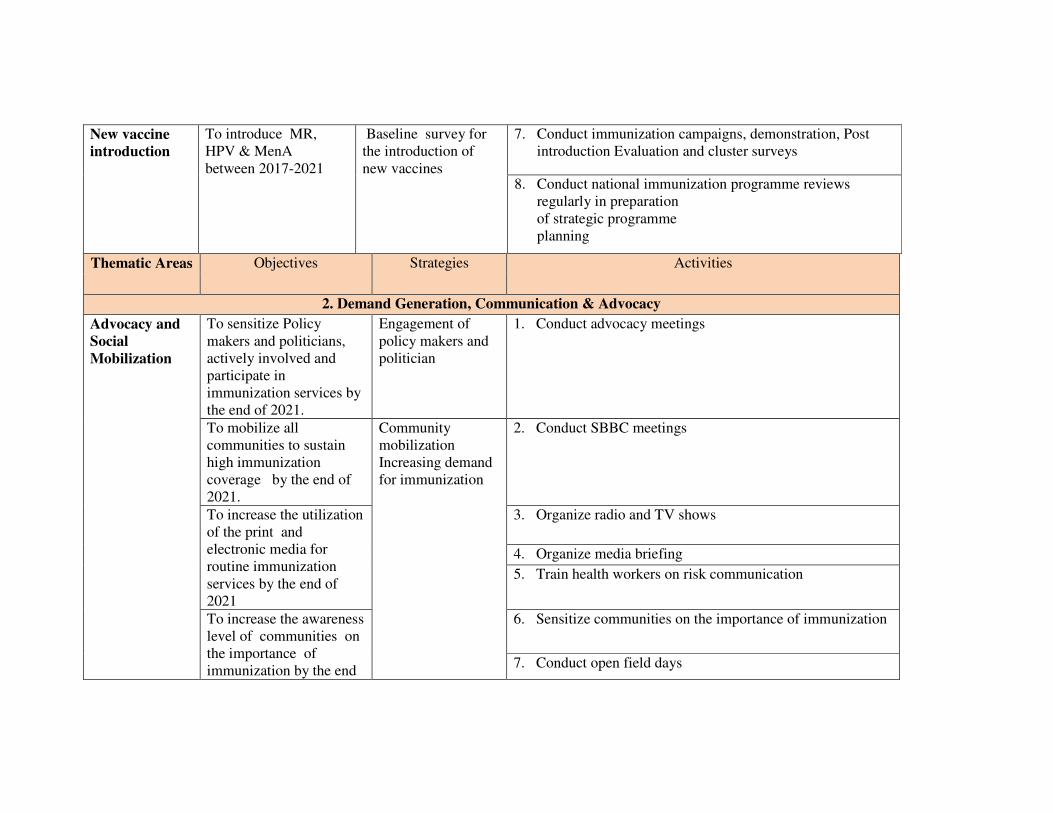
New vaccine introduction
To introduce MR, HPV & MenA between 2017-2021
Baseline survey for the introduction of new vaccines
7. Conduct immunization campaigns, demonstration, Post introduction Evaluation and cluster surveys
8. Conduct national immunization programme reviews regularly in preparation of strategic programme planning
Thematic Areas Objectives Strategies Activities
2. Demand Generation, Communication & Advocacy
Advocacy and Social Mobilization
To sensitize Policy makers and politicians, actively involved and participate in immunization services by the end of 2021.
Engagement of policy makers and politician
1. Conduct advocacy meetings
To mobilize all communities to sustain high immunization coverage by the end of 2021.
Community mobilization Increasing demand for immunization
2. Conduct SBBC meetings
To increase the utilization of the print and electronic media for routine immunization services by the end of 2021
3. Organize radio and TV shows
4. Organize media briefing
5. Train health workers on risk communication
To increase the awareness level of communities on the importance of immunization by the end
6. Sensitize communities on the importance of immunization
7. Conduct open field days

of 2021
Social and Behavioral Change Communication
To actively increase the participation of male in immunization services by 2021
8. Sensitization meeting with male
To provide 90% of communities with SBCC support materials by 2021
Providing SBCC support materials
9. Develop, print and distribute SBBC support materials
10. Train health workers on effective communication skills
hematic Areas Objectives Strategies Activities
3. Vaccine Cold Chain & Logistics
Cold Chain System
1.To provide 40 M3 cold room at central level by end of 2021
Strengthening and expansion of the cold chain
1. Procure 1 cold room for central level, 45 fridges for regional and health facilities, and spare parts for all levels
2.To provide 25 TCW 3000 SDD in six
2. Install the fridges and the cold room at health facility regional, and central level
regional cold stores by end of 2021
3. Procure and install three automatic voltage regulators at the central cold room
3. To provide 20 TCW 2000 in 30% of the newly built public health facilities offering immunization services by the end of 2021.
4. Procure and install two multi- loggers at the central and regional cold rooms
To Procure and install automatic voltage regulators for the central EPI cold store by 2021

To Procure and install Multi- loggers in the cold rooms by 2021
Maintaining regular and quality vaccine supply by 2021
1.Mobilize funds to procure vaccines
5. Advocacy meeting with policy makers
2.Capacity building on effective vaccine management(EVM)
6. 2. Train immunization providers on EVM
3.Strengthening regular stock and temperature monitoring and recording at all levels
7. 3.Provide two hundred fridge tags
Inadequate EPI logistic system at all levels
Strengthening logistic system at all levels
8. Conduct supportive supervision and monitoring
9. Procure spare parts and fuel
10. Install spare parts
11. Conduct regular maintenance
12. Construct and refurbish dry stores
Waste Management
To provide six incinerators in six health region by 2021
Improving waste management and injection safety
13. Construct and maintain incinerator
14. Train incinerator attendance

15. Procure PPEs
Thematic Areas
Objectives Strategies Activities
4. Monitoring, Surveillance & Reporting
Polio To improve and expand disease surveillance & reporting by 2021
Strengthen and expand disease prevention and control services
1. Review and update Standard Operation Procedures and guidelines on surveillance
MNT 2. Train Health Care Workers on standard operation procedures and guidelines on surveillance
Measles & Rubella
3.
Yellow fever 4.
Epidemic meningitis
5. Review and update the EPI technical guideline
6. Harmonize EPI data collection tools into Health Management Information System
7. Strengthen data management, reporting and feedback mechanism at central and regional levels
8. Strengthen collection, handling & transportation of samples to National Public Health Laboratory
AEFI surveillance and reporting
To institutionalize routine AEFI surveillance in all health facilities by 2021
Strengthen AEFI surveillance and reporting
9. Develop, review and update AEFI reporting tools
10. Train health care workers on the use of AEFI tools
11. Institute monthly reporting of AEFI including zero
12. Establish & train national and regional AEFI committees to enable rapid and trustworthy investigation of, and

response to, serious AEFIs
Thematic Areas Objectives Strategies Activities
5. Costing and Financing
Financing and
Resource
Mobilization
To increase and improve
access to funds for EPI
programme
implementation by 2021
Enhancing
operational efficiency
through better
budget management
1. Develop and implement Operational Plan for immunization
policy financing
2. Constitute a task force to advocate for more resource
mobilization
3. Develop a tool that will track the execution of approved
immunization budget
4. Develop a resource mobilization plan
5. Proportion of immunization budget released on time.
Thematic Areas Objectives Strategies Activities
6. Programme Management
Political
commitment
and advocacy
To increase the participation
of senior government
officials, politicians, religious
leaders and the private
sector in EPI related services
by 2021
Engage Senior
government officials
and politicians and
other stakeholders to
participate in EPI
related services
1. Sensitize senior government officials, politicians and other
stakeholders
2. Conduct annual meetings with the health select committee of
the National Assembly
3. Conduct regular meeting with National Immunization Technical
Advisory Group members (NITAG)
Policy To develop a national
immunization policy by 2021
Development of a
national
immunization policy
with relevant
stakeholders
4. Resource mobilization
5. Identify and engage partners
6. Conduct training workshops to orient (NITAG)
Monitoring and
evaluation plan
To develop an Integrated
Monitoring and Evaluation
Development of an
integrated M & E
7. Mobilization of resources from immunization development
Partners.

(M & E) plan for
immunization services by
2021
plan 8. Identify and engage partners
Thematic Areas Objectives Strategies Activities
7. Human Resource Management
Staff Retention To retain 90% of staff
involved in immunization
services by 2021
Improve incentive
package at all levels
1. Allocate 50% of basic salary as retention allowance for
immunization service providers
2. Create a special hard to reach area allowance for health staff.
3. Provide performance based reward advocate for free medical
care or all health workers and their immediate family members.
4. Construct new and refurbish existing structures
Staff
Distribution
To develop a staffing norm
for equitable distribution of
immunization service
providers by 2021
Equitable
distribution of
immunization staff
at all levels
5. Develop and implement posting guideline and policy
6. Implement staffing norm
Human
Resource
Development
To train 25 middle level
managers on immunization
services by 2021
Strengthen capacity
of Human Resource
at all levels
7. Conduct training needs assessment at all levels ( private &
Public)
8. Conduct training for middle level managers
To train 90% of immunization
service providers by 2021
Harmonize and
improve continuous
professional
development
9. Develop guidelines for in service training