Embed Size (px)
Citation preview

biomolecules
Article
Comprehensive Evaluation of PAXgene Fixation on Oral CancerTissues Using Routine Histology, Immunohistochemistry, andFTIR Microspectroscopy
Pooja Lahiri 1,* , Suranjana Mukherjee 1 , Biswajoy Ghosh 1 , Debnath Das 1, Basudev Lahiri 2 ,Shailendra Kumar Varshney 2, Mousumi Pal 3, Ranjan Rashmi Paul 4 and Jyotirmoy Chatterjee 1
�����������������
Citation: Lahiri, P.; Mukherjee, S.;
Ghosh, B.; Das, D.; Lahiri, B.;
Varshney, S.K.; Pal, M.; Paul, R.R.;
Chatterjee, J. Comprehensive
Evaluation of PAXgene Fixation on
Oral Cancer Tissues Using Routine
Histology, Immunohistochemistry,
and FTIR Microspectroscopy.
Biomolecules 2021, 11, 889. https://
doi.org/10.3390/biom11060889
Academic Editors: Agostino Guida,
Giuseppe Pannone and
Marco Annunziata
Received: 19 May 2021
Accepted: 10 June 2021
Published: 15 June 2021
Publisher’s Note: MDPI stays neutral
with regard to jurisdictional claims in
published maps and institutional affil-
iations.
Copyright: © 2021 by the authors.
Licensee MDPI, Basel, Switzerland.
This article is an open access article
distributed under the terms and
conditions of the Creative Commons
Attribution (CC BY) license (https://
creativecommons.org/licenses/by/
4.0/).
1 School of Medical Science and Technology, Indian Institute of Technology Kharagpur,Kharagpur 721302, India; [email protected] (S.M.); [email protected] (B.G.);[email protected] (D.D.); [email protected] (J.C.)
2 Department of Electronics and Electrical Communication Engineering, Indian Institute of TechnologyKharagpur, Kharagpur 721302, India; [email protected] (B.L.); [email protected] (S.K.V.)
3 Guru Nanak Institute of Dental Sciences and Research (GNIDSR), Kolkata 700114, India;[email protected]
4 Department of Oral & Dental Sciences, JIS University, Kolkata 700109, India; [email protected]* Correspondence: [email protected]
Abstract: The choice of tissue fixation is critical for preserving the morphology and biochemicalinformation of tissues. Fragile oral tissues with lower tensile strength are challenging to processfor histological applications as they are prone to processing damage, such as tissue tear, wrinkling,and tissue fall-off from slides. This leads to loss of morphological information and unnecessarydelay in experimentation. In this study, we have characterized the new PAXgene tissue fixationsystem on oral buccal mucosal tissue of cancerous and normal pathology for routine histological andimmunohistochemical applications. We aimed to minimize the processing damage of tissues andimprove the quality of histological experiments. We also examined the preservation of biomoleculesby PAXgene fixation using FTIR microspectroscopy. Our results demonstrate that the PAXgene-fixedtissues showed significantly less tissue fall-off from slides. Hematoxylin and Eosin staining showedcomparable morphology between formalin-fixed and PAXgene-fixed tissues. Good quality andslightly superior immunostaining for cancer-associated proteins p53 and CK5/6 were observed inPAXgene-fixed tissues without antigen retrieval than formalin-fixed tissues. Further, FTIR mea-surements revealed superior preservation of glycogen, fatty acids, and amide III protein secondarystructures in PAXgene-fixed tissues. Overall, we present the first comprehensive evaluation of thePAXgene tissue fixation system in oral tissues. This study concludes that the PAXgene tissue fixationsystem can be applied to oral tissues to perform diagnostic molecular pathology experiments withoutcompromising the quality of the morphology or biochemistry of biomolecules.
Keywords: PAXgene tissue fixation; formalin fixation; oral epithelial dysplasia; oral squamous cellcarcinoma; immunohistochemistry; spectral histology; FTIR
1. Introduction
Pre-analytical handling of surgical, biopsy, or post-mortem tissue is a critical stepthat influences the quality of the collected biospecimen and determines the outcome ofthe diagnostic methods applied [1]. Ten percent neutral buffered formalin (NBF) is thefixative reagent of choice for biological tissues in the medical community for almost acentury because of its excellent preservation capability [2]. The processing of tissues withNBF is relatively cheap and hassle-free and can be applied to any type of biological tissueacross species. The NBF-fixed paraffin-embedded (FFPE) tissue blocks can be stored for anextended period of time, allowing the creation of disease-specific archives (tissue-biobanks)
Biomolecules 2021, 11, 889. https://doi.org/10.3390/biom11060889 https://www.mdpi.com/journal/biomolecules

Biomolecules 2021, 11, 889 2 of 16
of diagnostically relevant tissues [1,2]. These tissue biobanks are often used in medicalresearch to investigate and teach the pathogenesis of a variety of diseases [3,4].
In recent years, molecular diagnostic pathology has widened its approaches to assessdisease progression. Histo-morphological assessment with alterations in genetic materialand functional biochemistry of disease-associated biomolecules is fast becoming the normfor a comprehensive diagnosis [1,2,4,5]. Therefore, enormous efforts are being made bythe scientific and clinical community to isolate and preserve a good quality of nucleicacids and proteins from FFPE tissue blocks for molecular diagnostic assays. However, thesuccess rates of these efforts are marginalized by the harsher treatments required to breakthe nucleic acid and protein crosslinks formed by NBF fixation, rendering the isolatedsamples not suitable for molecular analysis [6,7]. Currently, snap freezing of tissues andstorage at low temperatures in liquid nitrogen is considered appropriate for molecularanalysis [3,8]. Nevertheless, liquid nitrogen preservation comes with the possibility ofintracellular ice build-up, leading to defects in the morphology of tissue [9]. Hence, thechoice of tissue fixative should be made carefully when new biomarker studies on diseaseprogression are initiated to ensure that the antigenicity of the epitopes is not compromised,and the chemistry of crucial biomolecules is preserved. Newer methods of fixation andpreservation of tissues are always wanted in clinical diagnostics.
In this study, we have characterized the new PAXgene tissue fixation and stabilizationreagent on oral buccal mucosal biopsied tissues for routine histological and immunohis-tochemical applications [8]. Oral buccal mucosal tissue has the lowest tensile strengthamong other intraoral sites, such as the gingiva and hard palate [10]. Hence, it is notsurprising that oral buccal mucosal tissue suffers from histological processing errors, suchas tissue fall-off from the slides and wrinkling. We observed continuing difficulty inhandling FFPE oral buccal mucosal tissues for immunohistochemical studies and routinehistological staining, leading to delays in experimental results, non-reproducibility of data,and loss of useful molecular information. Therefore, we aimed to optimize the oral tissuefixation and histological staining procedures with PAXgene tissue fixation reagents. Ac-cording to the manufacturer (QIAGEN), the PAXgene tissue fixation system is a non-toxicmethod of tissue fixation consisting of mixtures of alcohols, acetic acid, and soluble organiccompounds [8]. It is claimed that the PAXgene fixation reagent rapidly preserves themorphology of the biomolecules [11]. The fixation is followed by adding a stabilizationreagent consisting of a mixture of alcohol that enhances the stability of the bio-specimensfor the transport of samples and long-term preservation. We have further investigated thepreservation of biomolecules by PAXgene fixation by FTIR microspectroscopy. The FTIRspectrum provides information on the overall biochemical status of major biomolecules,i.e., nucleic acids, lipids, and proteins in tissue. The variations in biomolecule chemistryin response to external factors (in this study—tissue fixation methods) can be calculatedby assessing the changes in infrared spectra [12]. In this study, we thoroughly evaluatedthe PAXgene fixation with conventional formalin fixation with an aim to minimize theprocessing damage of tissues and improve the quality of the histopathological diagnosis.
2. Materials and Methods2.1. Collection of Tissue and Fixation
Patients showing clinical symptoms of oral pre-cancers and oral squamous cell car-cinoma (OSCC) were chosen for the biopsy procedure. All biopsies were performed atGuru Nanak Institute of Dental Sciences and Research (GNIDSR). A wedge biopsy wasperformed to collect representative tissues from pre-cancerous or cancerous areas in thebuccal mucosa of selected patients. Another tissue biopsy was performed on the adjacentbuccal mucosa to the pre-cancerous or cancerous site, clinically representing a normalarchitecture or normal oral mucosa (NOM). Further, all types of collected biopsied tissueswere divided into two equal parts. One part of the tissue was added to freshly prepared10% NBF (tissue_F) and the other part of the tissue was added into PAXgene tissue fix (QI-AGEN) reagent (tissue_P). After 48 h of fixation, fresh 10% NBF formalin was added to the

Biomolecules 2021, 11, 889 3 of 16
tissue_F, and the PAXgene tissue stabilizer reagent was added to the tissue_P followed bygentle agitation (250 rpm) for 72 h. Post stabilization of tissue_P, both tissue_F and tissue_Pwere processed for paraffin embedding according to the established protocol reported else-where [3,8,13]. In this article, formalin-fixed paraffin-embedded tissues and PAXgene-fixedparaffin-embedded tissues will be referred to as FFPE and PFPE, respectively. The samplesize for the different experimental set-ups is mentioned whenever required. This study wasperformed with the informed consent of all individuals and approved by the institutionalethics committee (GNIDSR/IEC/07/16).
2.2. Hematoxylin and Eosin Staining
Histological assessment of FFPE and PFPE tissues in terms of preservation of morphol-ogy (overall morphology and nuclear, cytoplasmic, and membrane details) was performedon 4 µm tissue sections using hematoxylin and eosin (H&E) staining and verified by at leastthree certified oral pathologists from GNIDSR, Kolkata. The tissue sections were mountedon AUTOFROST charged adhesion microscopic slides (#20190710; Cancer Diagnostics Inc.,, Durham, NC, USA.
For H&E staining, FFPE and PFPE tissue sections were deparaffinized at 65 ◦C for30 min, followed by xylene treatment for 20 min. The rehydration of the tissue sections wasperformed with decreasing gradients of ethanol (100%, 90%, 70%, 50%, and MilliQ water).Tissue slides were stained by immersing in Mayer’s Hematoxylin solution (#51275, SigmaAldrich, Bangalore, India) for 1 min, followed by a tap water wash for 5 min. Counter-staining with Eosin Y stain (#E4009, Sigma Aldrich) was performed for 20 s. Dehydrationwith an increasing gradient of ethanol was immediately done after counterstaining. Theslides were cleared with xylene for 5 min and mounted with DPX. The integrated densityvalue of the hematoxylin and eosin stain for PFPE-fixed and FFPE-fixed NOM, dysplasia,and OSCC tissues were calculated using the ImageJ (NIH, Bethesda, MD, USA) colordeconvolution tool (HE filter,). Statistical analysis was performed using GraphPad Prismsoftware (GraphPad, San Diego, CA, USA).
2.3. Immunohistochemistry
Immunohistochemical staining for epithelial cytokeratin CK5/6 (#ab5312 and # ab18586,Abcam, Cambridge, UK) and tumor suppressor protein p53 (#ab131442, Abcam, Cam-bridge, UK) was performed on 4 µm tissue sections prepared from FFPE and PFPE blocksaccording to manufacturer’s instructions (#K8023, DAKO, Santa Clara, CA, USA), withmodifications in the antigen retrieval methodology (Table S2). Both FFPE and PFPE tissueslides were deparaffinized at 65 ◦C for 30 min, followed by xylene treatment for 30 min.The tissue sections were re-dehydrated by immersing the slides consecutively in 100%ethanol, 90% ethanol, 70% ethanol, and 50% ethanol for 2 min each. All the tissue slideswere given a brief MilliQ water wash prior to antigen retrieval. As oral biopsied tissues aresensitive to tissue fall-off during microwave/pressure cooker procedures, antigen retrievalfor FFPE tissue was performed by immersing the slides with tissue sections in TRIS EDTApH 9 buffers at 65 ◦C for 30 min to minimize tissue disruption (Table S2). Identical antigenretrieval conditions were maintained for PFPE tissue. In addition, PFPE tissue sectionswere also processed without heat-induced antigen retrieval. After antigen retrieval (ifperformed), tissue slides were brought back to room temperature prior to the antibodysteps. Primary antibody dilution was prepared according to the manufacturer’s instruc-tion (p53:1:500; CK5/6, 1:500) in 1% BSA + TBS. The tissue slides were incubated withprimary antibody overnight. The next day, ready to use secondary antibody (EnVision™FLEX/HRP; DAKO) was added to the TBS-washed tissue sections and incubated for 1 h.Following secondary antibody application, sections were properly washed in TBS, andDAB chromogen was added for the color reaction. The appropriate time was noted forthe color development (p53; 2.5 min and CK5/6; 1 min) and was maintained for all theexperiments performed. All the tissue slides were counterstained with Mayer’s Hema-toxylin, dehydrated using ethanol, and mounted using DPX (#06522, Merck, Bangalore,

Biomolecules 2021, 11, 889 4 of 16
India) (Method S1). The integrated density value of each immuno-stain (p53 and CK5/6)for PFPE-fixed and FFPE-fixed NOM, dysplasia, and OSCC tissues were calculated usingthe ImageJ (NIH, Bethesda, MD., USA) color deconvolution tool (H DAB filter). Statisticalanalysis was performed using GraphPad Prism software (GraphPad Prism, San Diego,CA, USA).
2.4. Microscopy
H&E and immunohistochemistry images were captured using a brightfield micro-scope (Leica Microsystems, Wetzlar, Germany) at different magnifications (10×, 20×, and40×). Scale bars were added using Image J. All the H&E images and IHC images wereassembled as figures using ImageJ, Adobe Illustrator CC (Adobe, San Jose, CA, USA), orMS PowerPoint software.
2.5. FTIR Microspectroscopy
Tissue sections of 4 µm in thickness were prepared from both FFPE and PFPE blocksfor FTIR microspectroscopy. Of note, 4 µm sections for H&E staining and immunohisto-chemistry were prepared simultaneously and are considered parallel sections for selectedexperiments. The 4 µm tissue sections on AUTOFROST slides were baked at 60 ◦C for30 min, followed by two changes of xylene for deparaffinization. Immediately, the tis-sue sections were dehydrated by immersing the slides in 100% ethanol for 10 min. Thetissue sections were then allowed to air dry for 30 min at room temperature. The tissuesections were analyzed under a LUMOS-II FTIR microspectroscope (Bruker, Billerica, MA,USA) with a liquid nitrogen-cooled mercury-cadmium-telluride 64 × 64-pixel focal planearray (FPA) detector within the same day post dehydration. Histologically diagnosedFFPE-NOM, PFPE-NOM, and FFPE-OSCC, PFPE OSCC were used for measurement ofthe spectra. Spectroscopic imaging data were acquired in reflection mode. Backgroundspectra were collected from a region free of tissue of the FTIR-reflective slide. Spectraldata were recorded using a mirror speed of 1 cm−1, a spectral resolution of 4 cm−1, andusing an acquisition time of 6 s (64 scans) per measurement. Twenty tissues from eachgroup were used for spectral data acquisition. In total, 200 spectral measurements wererecorded for FFPE-NOM (Nspectra = 100) and PFPE-NOM (Nspectra = 100), and 300 spec-tral measurements were recorded for FFPE-OSCC (Nspectra = 150) and PFPE-OSCC tissue(Nspectra = 150). Pathologically similar regions of interest exhibiting a normal oral mor-phology of the epithelium were chosen for spectral measurements from the NOM groupof tissues. Moreover, epithelial islands from well-differentiated squamous cell carcinomatissues were chosen for spectral measurements from the OSCC group of tissues. Averagespectra were calculated and smoothened for 25 smoothening points (Savitzky Golay al-gorithm) for each tissue group only after ascertaining no significant variation betweenthe average spectra and individual spectra taken from each region of interest. No otherpost-processing of spectra was performed. The band position for each bio-componentwas calculated using the peak analyzer algorithm of Origin Pro software (Northampton,MA, USA).
Sample collection and the experimental set-ups are depicted in Figure 1.

Biomolecules 2021, 11, 889 5 of 16
Biomolecules 2021, 11, 5 of 16
Figure 1. Sample collection and experimental setup of the study. Abbreviations: H&E, hematoxylin and eosin; IHC, im-munohistochemistry; R, retrieval; FTIR, Fourier-transform infrared; AR, antigen retrieval.
Figure 1. Sample collection and experimental setup of the study. Abbreviations: H&E, hematoxylin and eosin; IHC,immunohistochemistry; R, retrieval; FTIR, Fourier-transform infrared; AR, antigen retrieval.

Biomolecules 2021, 11, 889 6 of 16
3. Results3.1. Histological Comparison of FFPE and PFPE Tissues Using H&E Staining
FFPE oral buccal mucosal tissues with a normal architecture (NOM) are challengingto process for histological staining. We frequently experienced tissue tear, wrinkling, andfall-off of the tissue-section from slides, either after deparaffinization at 65 ◦C or afterrehydration with a decreasing gradient of alcohol. We maintained a log of all the FFPEsamples received between 2019 and 2020 from the GNIDSR tissue bank and documentedthe cases of tissue fall-off from slides. Around 28.6% of the FFPE-NOM cases could not beprocessed further for histological staining after the rehydration step due to the fall-off oftissue sections from the slides (Table 1). However, only 5.5% of FFPE-OSCC cases sufferedtissue section fall-off from slides (Table 1).
Table 1. Documentation of cases of tissue section fall-off from slides during sample processing stepsfor histochemical staining experiments for a period of 1 year (2019–2020) for FFPE tissues from thetissue bank of GNIDSR.
Total Number ofFFPE Tissue a
Cases of TissueFall-Off * Percentage
Number of NOM samples 35 10 28.57Number of OSCC samples 73 8 5.48
a Number of tissue samples (FFPE) received during 2019–2020 from GNIDSR, Kolkata. * Number of cases of tissuefall-off from slides after either deparaffinization or rehydration of the tissue section with a decreasing gradient ofalcohol. Abbreviations: NOM, normal oral mucosa; OSCC, oral squamous cell-carcinoma; FFPE, formalin-fixedparaffin embedded; PFPE, PAXgene-fixed paraffin embedded.
To minimize the delay in experimentation due to the loss of tissue sections during theprocessing of FFPE samples, we used PAXgene as an alternative tissue fixation methodfor oral buccal mucosal tissue. We investigated whether the change in fixation methodof oral tissues reduces the problem of tissue section fall-off, tissue tear, or wrinkling. Forthis purpose, we selected a total of 40 fresh biopsied tissues (NOM: n = 20; OSCC: n = 20),divided them into two parts, and fixed them in freshly prepared 10% NBF or PAXgenetissue fixative solution (Figure 1). Tissue sections of 4 µm in thickness were prepared fromFFPE and PFPE tissue blocks and processed for H&E staining. We noted seven cases oftissue section fall-off for the FFPE-NOM (n = 20) tissue sample compared to three cases forthe PFPE-NOM tissue samples (n = 20) (Table 2). Further analysis on H&E-stained sectionsshowed the percentage of loss of epithelial and sub-epithelial tissue area due to tissue tearor wrinkling, which was more prominent in FFPE-NOM samples than PFPE-NOM samples(Table S1). Moreover, no cases of tissue section fall-off were noted for the PFPE-OSCCtissue samples (n = 20), and only one case was noted for the FFPE-OSCC tissue samples(Table 2).
Table 2. Documentation of cases of tissue section fall-off from slides during the sample processing steps for histochemicalstaining experiments for matched FFPE and PFPE tissue biopsies.
Total Number ofFFPE Tissues a
Cases of TissueFall-Off * Percentage Total Number of
PFPE Tissues aCases of Tissue
Fall-Off * Percentage
Number ofNOM samples 20 7 35.00 20 3 15.00
Number ofOSCC samples 20 1 5.00 20 0 0.00
a Number of tissue samples (FFPE or PFPE) received from GNIDSR, Kolkata, for the comparative study. * Number of cases of tissuefall-off from slides after either deparaffinization or rehydration of the tissue section with a decreasing gradient of alcohol. Abbreviations:NOM, normal oral mucosa; OSCC, oral squamous cell-carcinoma; FFPE, formalin-fixed paraffin-embedded; PFPE, PAXgene-fixed paraffin-embedded.

Biomolecules 2021, 11, 889 7 of 16
In terms of overall histology, the morphology of the H&E-stained sections of FFPE-NOM and PFPE-NOM or FFPE-OSCC and PFPE-OSCC was similar (Figure 2). A slightlyenhanced eosinophilic reaction was observed in both the epithelium and sub-epitheliumregions of PFPE-NOM and PFPE-OSCC tissues (Figure 2A–F). This enhanced the cyto-plasmic and nuclear details and did not hamper the histological evaluation of the diseasemorphology (Figure 2B,D).
Biomolecules 2021, 11, 7 of 16
In terms of overall histology, the morphology of the H&E-stained sections of FFPE-NOM and PFPE-NOM or FFPE-OSCC and PFPE-OSCC was similar (Figure 2). A slightly enhanced eosinophilic reaction was observed in both the epithelium and sub-epithelium regions of PFPE-NOM and PFPE-OSCC tissues (Figure 2A–F). This enhanced the cyto-plasmic and nuclear details and did not hamper the histological evaluation of the disease morphology (Figure 2B,D).
Figure 2. Morphological comparisons of PFPE and FFPE tissues. Hematoxylin and eosin staining was performed on FFPE NOM and OSCC tissues (A,C) and PFPE NOM and OSCC tissues (B,D). PFPE tissues were more eosinophilic than FFPE tissues (A,B)—corresponding integrated density value plot (E)—and (C,D)—corresponding integrated density value plot (F). Morphology of the epithelium layers and sub-epithelium region was well-preserved in PFPE-NOM tissue (B) and was comparable to FFPE-NOM tissue (A). Squamous cell carcinoma was well-represented in both PFPE (C) and FFPE tissue (D). High magnification insets for each panel (A–D) shows the morphology of the epithelial cells in NOM (A,B) and OSCC (C,D). An example of loss of tissue area (dotted lines) due to sample processing was shown in FFPE-NOM tissue (A). Magnification = 10×; Scale bar = 50 µm. p < 0.05 * (student’s t-test). Abbreviations: PFPE, PAXgene-fixed paraffin embed-ded; FFPE, formalin-fixed paraffin embedded; NOM, normal oral mucosa; OSCC, oral squamous cell carcinoma; Intg., integrated.
3.2. PFPE Tissues Do Not Require Heat-Induced Antigen Retrieval for Immunohistochemistry After we observed comparatively fewer tissue section fall-off cases for PFPE tissue
samples, we tested the PFPE-NOM and PFPE-OSCC tissue samples for immunohisto-chemical applications. In particular, we assessed the expression of tumor suppressor pro-tein p53 and cytoskeletal cytokeratins (CK) 5 and 6 by performing immunohistochemistry with respective antibodies on FFPE and PFPE tissue sections. Our laboratory experienced an increase in tissue fall-off cases from slides after the heat-induced antigen retrieval step for FFPE tissues (Table 3). We tried various heating and pressure conditions for optimum antigen retrieval with FFPE-NOM tissues (n = 20) (Table S2) and to minimize tissue fall-off and damage (Table 4). The optimum antigen-retrieval was observed after heating the samples at 65 °C for 30 min with tris-citrate buffer, pH 6, in a water bath (Table S2).
Figure 2. Morphological comparisons of PFPE and FFPE tissues. Hematoxylin and eosin staining was performed onFFPE NOM and OSCC tissues (A,C) and PFPE NOM and OSCC tissues (B,D). PFPE tissues were more eosinophilic thanFFPE tissues (A,B)—corresponding integrated density value plot (E)—and (C,D)—corresponding integrated density valueplot (F). Morphology of the epithelium layers and sub-epithelium region was well-preserved in PFPE-NOM tissue (B) andwas comparable to FFPE-NOM tissue (A). Squamous cell carcinoma was well-represented in both PFPE (C) and FFPEtissue (D). High magnification insets for each panel (A–D) shows the morphology of the epithelial cells in NOM (A,B) andOSCC (C,D). An example of loss of tissue area (dotted lines) due to sample processing was shown in FFPE-NOM tissue(A). Magnification = 10×; Scale bar = 50 µm. p < 0.05 * (student’s t-test). Abbreviations: PFPE, PAXgene-fixed paraffinembedded; FFPE, formalin-fixed paraffin embedded; NOM, normal oral mucosa; OSCC, oral squamous cell carcinoma;Intg., integrated.
3.2. PFPE Tissues Do Not Require Heat-Induced Antigen Retrieval for Immunohistochemistry
After we observed comparatively fewer tissue section fall-off cases for PFPE tissuesamples, we tested the PFPE-NOM and PFPE-OSCC tissue samples for immunohistochem-ical applications. In particular, we assessed the expression of tumor suppressor proteinp53 and cytoskeletal cytokeratins (CK) 5 and 6 by performing immunohistochemistry withrespective antibodies on FFPE and PFPE tissue sections. Our laboratory experienced anincrease in tissue fall-off cases from slides after the heat-induced antigen retrieval stepfor FFPE tissues (Table 3). We tried various heating and pressure conditions for optimumantigen retrieval with FFPE-NOM tissues (n = 20) (Table S2) and to minimize tissue fall-offand damage (Table 4). The optimum antigen-retrieval was observed after heating thesamples at 65 ◦C for 30 min with tris-citrate buffer, pH 6, in a water bath (Table S2).

Biomolecules 2021, 11, 889 8 of 16
Table 3. Documentation of cases of tissue section fall-off from slides during sample processing steps for immuno-histochemical staining experiments for a period of 1 year (2019–2020) for FFPE tissues.
Total Number ofFFPE Tissues *
Cases of Tissue Fall-Offafter D or R Steps
Cases of TissueFall-Off after AR
Total Cases ofTissue Fall-Off
Number of CasesLeft for IHC Expts.
Number ofNOM samples 35 12 18 30 5
Number ofOSCC samples 73 3 43 46 30
* Number of tissue samples (FFPE) received during 2019–2020 from GNIDSR, Kolkata. Abbreviations: D, deparaffinization; R, rehydration;NOM, normal oral mucosa; OSCC, oral squamous cell-carcinoma; FFPE, formalin-fixed paraffin embedded; AR, antigen retrieval; IHC,immunohistochemistry.
Table 4. Documentation of cases of tissue section fall-off from slides during sample processing stepsfor immune-histochemical staining experiments for matched PFPE and FFPE tissue biopsies.
Number of NOMSamples
Number of OSCCSamples
Total number of FFPE tissues 20 20Cases of tissue fall-off after D or R steps 6 2Cases of tissue fall-off after AR 12 9Total cases of tissue fall-off 18 11Number of cases left for IHC experiments 2 9Percentage of tissues left for IHC experiments 10 45
Total number of PFPE tissues 20 20Cases of tissue fall-off after D or R steps 3 1Cases of tissue fall-off after AR 5 3Total cases of tissue fall-off 7 4Number of cases left for IHC experiments 13 16Percentage of tissues left for IHC experiments 65 80
Abbreviations: D, deparaffinization; R, rehydration; NOM, normal oral mucosa; OSCC, oral squamous cell-carcinoma; FFPE, formalin-fixed paraffin embedded; AR, antigen retrieval; IHC, immunohistochemistry.
Unlike formalin, the PAXgene tissue fixation solution does not form methylenecrosslinks in tissues [8]. Hence, a protocol deviation was introduced for PFPE tissueswhere a parallel section was not subjected to antigen retrieval (Figure 3B,E). We observedcytoplasmic and nuclear expression of p53 in the basal and suprabasal layer of the epithe-lium and no difference in p53 immuno-expression between PFPE-NOM tissue sectionswith and without antigen retrieval (Figure 3A,B,G). However, the intensity of the p53immuno-expression was significantly less in the suprabasal layer, and no or noticeablylight staining was observed in FFPE-NOM tissue when compared to PFPE-NOM tissues(Figure 3C vs. Figure 3A,B,G) in replicated experiments even with an increase in the timingof DAB staining to 2.5 min (data not shown). We observed a homogenous cytoplasmicexpression of CK5/6 in the epithelium of PFPE-NOM and FFPE-NOM tissue; however,similar to p53, the intensity of expression of CK5/6 was significantly less (Figure 3H) inthe epithelium layers of FFPE-NOM tissue (Figure 3F vs. Figure 3D,E). Furthermore, nodifference in CK5/6 immuno-expression was observed between PFPE-NOM tissues withor without antigen retrieval (Figure 3D,E,H).
Next, we analyzed the expression profile of p53 and CK5/6 in cases of dysplasiaand OSCC. A higher expression of p53 and CK5/6 was observed in dysplasia and OSCCtissues than NOM tissues (Figure 4 vs. Figure 3). No significant differences in the ex-pression pattern of p53 and CK5/6 in dysplasia or OSCC were observed between PFPEtissues with antigen retrieval (Figure 4A,D,G,J); PFPE tissues without antigen retrieval(Figure 4B,E,H,K); and FFPE tissues (Figure 4C,F,I,L). However, the density value plot forp53 and CK5/6 showed a trend of a decrease in immuno-staining for both proteins in FFPEtissues compared to PFPE tissues (Figure 4M–P). Furthermore, p53 was observed in thecytoplasm and nucleus of the basal and suprabasal cells in dysplasia (Figure 4A–C) andepithelial islands in OSCC (Figure 4D–F). Likewise, CK5/6 expression was cytoplasmic

Biomolecules 2021, 11, 889 9 of 16
and spread homogeneously throughout the epithelium layers in dysplasia (Figure 4G–I).In OSCC, cytoplasmic expression of CK5/6 was homogenously expressed in the cytoplasmof epithelial islands and the keratin pearls (Figure 4J–L).
Biomolecules 2021, 11, 9 of 16
Figure 3. Heat-induced antigen retrieval is not essential for PFPE-NOM tissues. Immunohistochemistry with antibodies against p53 (A–C; upper panel) and CK5/6 (D,E; lower panel) was performed on PFPE-NOM (A,B,D,E) and FFPE-NOM (C,F) tissue sections. Parallel tissue sections of PFPE-NOM samples were subjected to primary antibody (p53 or CK5/6) incubation with a prior antigen retrieval step (A,D) and without an antigen retrieval step (B,E). Antigen retrieval was performed on tissue sections of FFPE-NOM samples (C,F) before antibody (p53 or CK5/6) incubation (C,F). p53 immuno-staining was observed in basal and suprabasal layers of the epithelium in PFPE-NOM tissues with (A) or without antigen retrieval (B). However, the intensity of p53 immuno-staining was markedly less in FFPE-NOM tissues (corresponding integrated density value plot (G) for A–C) with no or noticeably light staining of p53 in basal cells. Similarly, CK5/6 im-muno-staining was observed homogenously throughout the epithelium in PFPE-NOM tissues with (D) and without anti-gen retrieval (E). In FFPE-NOM tissue, CK5/6 immuno-staining was observed through-out the epithelium, but with mark-edly less intensity than PFPE-NOM tissues (corresponding integrated density value plot (H) for D–F). The incubation time for DAB chromogen was 2.5 min for p53 antibody and 1 min for CK5/6 antibody. Magnification = 20×; Scale bar = 25 µm. p < 0.0001 *** (student t-test). Abbreviations: E, epithelium, SE, sub-epithelium; AR, antigen retrieval; FFPE, formalin-fixed paraffin embedded; PFPE, PAXgene-fixed paraffin embedded; NOM, normal oral mucosa; CK, cytokeratin; Intg, inte-grated.
Next, we analyzed the expression profile of p53 and CK5/6 in cases of dysplasia and OSCC. A higher expression of p53 and CK5/6 was observed in dysplasia and OSCC tissues than NOM tissues (Figure 4 vs. Figure 3). No significant differences in the expression pat-tern of p53 and CK5/6 in dysplasia or OSCC were observed between PFPE tissues with antigen retrieval (Figure 4A,D,G,J); PFPE tissues without antigen retrieval (Figure 4B,E,H,K); and FFPE tissues (Figure 4C,F,I,L). However, the density value plot for p53 and CK5/6 showed a trend of a decrease in immuno-staining for both proteins in FFPE tissues compared to PFPE tissues (Figure 4M–P). Furthermore, p53 was observed in the cyto-plasm and nucleus of the basal and suprabasal cells in dysplasia (Figure 4A–C) and epi-thelial islands in OSCC (Figure 4D–F). Likewise, CK5/6 expression was cytoplasmic and spread homogeneously throughout the epithelium layers in dysplasia (Figure 4G–I). In OSCC, cytoplasmic expression of CK5/6 was homogenously expressed in the cytoplasm of epithelial islands and the keratin pearls (Figure 4J–L).
Figure 3. Heat-induced antigen retrieval is not essential for PFPE-NOM tissues. Immunohistochemistry with antibodiesagainst p53 (A–C; upper panel) and CK5/6 (D,E; lower panel) was performed on PFPE-NOM (A,B,D,E) and FFPE-NOM(C,F) tissue sections. Parallel tissue sections of PFPE-NOM samples were subjected to primary antibody (p53 or CK5/6)incubation with a prior antigen retrieval step (A,D) and without an antigen retrieval step (B,E). Antigen retrieval wasperformed on tissue sections of FFPE-NOM samples (C,F) before antibody (p53 or CK5/6) incubation (C,F). p53 immuno-staining was observed in basal and suprabasal layers of the epithelium in PFPE-NOM tissues with (A) or without antigenretrieval (B). However, the intensity of p53 immuno-staining was markedly less in FFPE-NOM tissues (correspondingintegrated density value plot (G) for A–C) with no or noticeably light staining of p53 in basal cells. Similarly, CK5/6immuno-staining was observed homogenously throughout the epithelium in PFPE-NOM tissues with (D) and withoutantigen retrieval (E). In FFPE-NOM tissue, CK5/6 immuno-staining was observed through-out the epithelium, but withmarkedly less intensity than PFPE-NOM tissues (corresponding integrated density value plot (H) for D–F). The incubationtime for DAB chromogen was 2.5 min for p53 antibody and 1 min for CK5/6 antibody. Magnification = 20×; Scale bar= 25 µm. p < 0.0001 *** (student t-test). Abbreviations: E, epithelium, SE, sub-epithelium; AR, antigen retrieval; FFPE,formalin-fixed paraffin embedded; PFPE, PAXgene-fixed paraffin embedded; NOM, normal oral mucosa; CK, cytokeratin;Intg, integrated.
3.3. FTIR Microspectroscopy Revealed Comparable Preservation of Bio-Components between FFPETissues and PFPE Tissues
FTIR microspectroscopy is an emerging technique in the field of ex-vivo diagnostics.FTIR spectra provide an overall estimation of the biochemical content inside tissues and canbe analyzed to differentiate between disease states [12]. However, it has become apparentthat methods for tissue preservation can affect or change the biochemical spectra and maylead to a false interpretation of the data [12,14,15]. We have assessed the bio-fingerprintregion (900–1700 cm−1) to compare the effects of formalin and PAXgene tissue fixation onthe spectral signatures of various bio-components in NOM and OSCC. Figure 5 representsthe average spectra from each group of samples analyzed, and Table 5 depicts the bandassignment [12,15] of the analyzed spectral peaks (Nspectra = 100, PFPE-NOM and FFPE-NOM; Nspectra = 150, PFPE-OSCC and FFPE-OSCC) for the bio-fingerprint region of eachtissue sample group.
Biomolecules 2021, 11, 889 10 of 16Biomolecules 2021, 11, 10 of 16
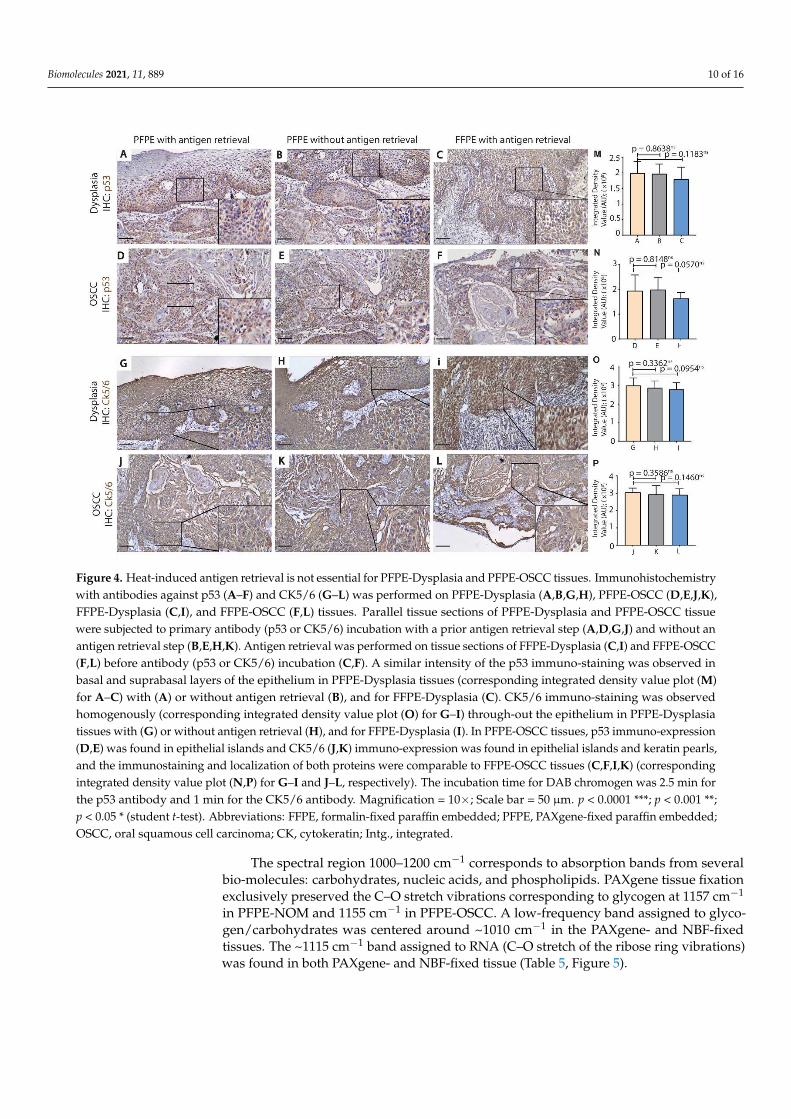
Figure 4. Heat-induced antigen retrieval is not essential for PFPE-Dysplasia and PFPE-OSCC tissues. Immunohistochem-istry with antibodies against p53 (A–F) and CK5/6 (G–L) was performed on PFPE-Dysplasia (A,B,G,H), PFPE-OSCC (D,E,J,K), FFPE-Dysplasia (C,I), and FFPE-OSCC (F,L) tissues. Parallel tissue sections of PFPE-Dysplasia and PFPE-OSCC tissue were subjected to primary antibody (p53 or CK5/6) incubation with a prior antigen retrieval step (A,D,G,J) and without an antigen retrieval step (B,E,H,K). Antigen retrieval was performed on tissue sections of FFPE-Dysplasia (C,I) and FFPE-OSCC (F,L) before antibody (p53 or CK5/6) incubation (C,F). A similar intensity of the p53 immuno-staining was observed in basal and suprabasal layers of the epithelium in PFPE-Dysplasia tissues (corresponding integrated den-sity value plot (M) for A–C) with (A) or without antigen retrieval (B), and for FFPE-Dysplasia (C). CK5/6 immuno-staining was observed homogenously (corresponding integrated density value plot (O) for G–I) through-out the epithelium in PFPE-Dysplasia tissues with (G) or without antigen retrieval (H), and for FFPE-Dysplasia (I). In PFPE-OSCC tissues, p53 immuno-expression (D,E) was found in epithelial islands and CK5/6 (J,K) immuno-expression was found in epithelial islands and keratin pearls, and the immunostaining and localization of both proteins were comparable to FFPE-OSCC tissues (C,F,I,K) (corresponding integrated density value plot (N,P) for G–I and J–L, respectively). The incubation time for DAB chromogen was 2.5 min for the p53 antibody and 1 min for the CK5/6 antibody. Magnification = 10×; Scale bar = 50 µm. p < 0.0001 ***; p < 0.001 **; p < 0.05 * (student t-test). Abbreviations: FFPE, formalin-fixed paraffin embedded; PFPE, PAXgene-fixed paraffin embedded; OSCC, oral squamous cell carcinoma; CK, cytokeratin; Intg., integrated
3.3. FTIR Microspectroscopy Revealed Comparable Preservation of Bio-Components between FFPE Tissues and PFPE Tissues
FTIR microspectroscopy is an emerging technique in the field of ex-vivo diagnostics. FTIR spectra provide an overall estimation of the biochemical content inside tissues and can be analyzed to differentiate between disease states [12]. However, it has become ap-parent that methods for tissue preservation can affect or change the biochemical spectra and may lead to a false interpretation of the data [12,14,15]. We have assessed the bio-fingerprint region (900–1700 cm−1) to compare the effects of formalin and PAXgene tissue fixation on the spectral signatures of various bio-components in NOM and OSCC. Figure 5 represents the average spectra from each group of samples analyzed, and Table 5 depicts the band assignment [12,15] of the analyzed spectral peaks (Nspectra = 100, PFPE-NOM and FFPE-NOM; Nspectra = 150, PFPE-OSCC and FFPE-OSCC) for the bio-fingerprint region of each tissue sample group.
Figure 4. Heat-induced antigen retrieval is not essential for PFPE-Dysplasia and PFPE-OSCC tissues. Immunohistochemistrywith antibodies against p53 (A–F) and CK5/6 (G–L) was performed on PFPE-Dysplasia (A,B,G,H), PFPE-OSCC (D,E,J,K),FFPE-Dysplasia (C,I), and FFPE-OSCC (F,L) tissues. Parallel tissue sections of PFPE-Dysplasia and PFPE-OSCC tissuewere subjected to primary antibody (p53 or CK5/6) incubation with a prior antigen retrieval step (A,D,G,J) and without anantigen retrieval step (B,E,H,K). Antigen retrieval was performed on tissue sections of FFPE-Dysplasia (C,I) and FFPE-OSCC(F,L) before antibody (p53 or CK5/6) incubation (C,F). A similar intensity of the p53 immuno-staining was observed inbasal and suprabasal layers of the epithelium in PFPE-Dysplasia tissues (corresponding integrated density value plot (M)for A–C) with (A) or without antigen retrieval (B), and for FFPE-Dysplasia (C). CK5/6 immuno-staining was observedhomogenously (corresponding integrated density value plot (O) for G–I) through-out the epithelium in PFPE-Dysplasiatissues with (G) or without antigen retrieval (H), and for FFPE-Dysplasia (I). In PFPE-OSCC tissues, p53 immuno-expression(D,E) was found in epithelial islands and CK5/6 (J,K) immuno-expression was found in epithelial islands and keratin pearls,and the immunostaining and localization of both proteins were comparable to FFPE-OSCC tissues (C,F,I,K) (correspondingintegrated density value plot (N,P) for G–I and J–L, respectively). The incubation time for DAB chromogen was 2.5 min forthe p53 antibody and 1 min for the CK5/6 antibody. Magnification = 10×; Scale bar = 50 µm. p < 0.0001 ***; p < 0.001 **;p < 0.05 * (student t-test). Abbreviations: FFPE, formalin-fixed paraffin embedded; PFPE, PAXgene-fixed paraffin embedded;OSCC, oral squamous cell carcinoma; CK, cytokeratin; Intg., integrated.
The spectral region 1000–1200 cm−1 corresponds to absorption bands from severalbio-molecules: carbohydrates, nucleic acids, and phospholipids. PAXgene tissue fixationexclusively preserved the C–O stretch vibrations corresponding to glycogen at 1157 cm−1
in PFPE-NOM and 1155 cm−1 in PFPE-OSCC. A low-frequency band assigned to glyco-gen/carbohydrates was centered around ~1010 cm−1 in the PAXgene- and NBF-fixedtissues. The ~1115 cm−1 band assigned to RNA (C–O stretch of the ribose ring vibrations)was found in both PAXgene- and NBF-fixed tissue (Table 5, Figure 5).

Biomolecules 2021, 11, 889 11 of 16Biomolecules 2021, 11, 12 of 16
Figure 5. Average FTIR spectra from PFPE-NOM, FFPE-NOM, PFPE-OSCC, and FFPE OSCC tissues depicting the biofin-gerprint region 900 cm−1–1700 cm−1. Nspectra PFPE-NOM = 100; Nspectra FFPE-NOM = 100; Nspectra PFPE-OSCC = 150; and Nspectra FFPE-OSCC = 150. Abbreviations: FFPE, formalin-fixed paraffin embedded; PFPE, PAXgene-fixed paraffin embed-ded; OSCC, oral squamous cell carcinoma; NOM, normal oral mucosa.
Figure 5. Average FTIR spectra from PFPE-NOM, FFPE-NOM, PFPE-OSCC, and FFPE OSCC tissues depicting thebiofingerprint region 900 cm−1–1700 cm−1. Nspectra PFPE-NOM = 100; Nspectra FFPE-NOM = 100; Nspectra PFPE-OSCC =150; and Nspectra FFPE-OSCC = 150. Abbreviations: FFPE, formalin-fixed paraffin embedded; PFPE, PAXgene-fixed paraffinembedded; OSCC, oral squamous cell carcinoma; NOM, normal oral mucosa.

Biomolecules 2021, 11, 889 12 of 16
Table 5. Assignment of FTIR bands for PFPE and FFPE tissues.
Band Positions (cm−1)
Vibration PFPENOM
FFPENOM
PFPEOSCC
FFPEOSCC
Assignment [12] (Maleket al. 2014; Wang and
Wang 2021)
COH deformation 1010 1021 1010 1002 Glycogen/carbohydrates
Biomolecules 2021, 11, 11 of 16
The spectral region 1000–1200 cm−1 corresponds to absorption bands from several bio-molecules: carbohydrates, nucleic acids, and phospholipids. PAXgene tissue fixation ex-clusively preserved the C–O stretch vibrations corresponding to glycogen at 1157 cm−1 in PFPE-NOM and 1155 cm−1 in PFPE-OSCC. A low-frequency band assigned to glyco-gen/carbohydrates was centered around ~1010 cm−1 in the PAXgene- and NBF-fixed tis-sues. The ~1115 cm−1 band assigned to RNA (C–O stretch of the ribose ring vibrations) was found in both PAXgene- and NBF-fixed tissue (Table 5, Figure 5).
To understand the preservation of proteins by PAXgene fixation, we analyzed the spectral region between 1200 and 1700 cm−1. We observed the primary amide III band centered around ~1245 cm−1 for the PAXgene- and NBF-fixed tissues. Additional amide III bands were observed at 1324 cm−1 in PFPE-NOM tissues and at 1326 cm−1 in PFPE OSCC tissues. The 1324 cm−1 band was absent in FFPE-NOM tissues; however, a 1330 cm−1 band was found in FFPE OSCC tissues (Table 5, Figure 5). These bands may correspond to the secondary structure of proteins corresponding to the amide III region [14]. The amide II band and amide I band were centered around ~1571 cm−1 and ~1684 cm−1, respectively, for all tissue groups.
A high-frequency band associated with COO- symmetric stretch vibrations centered around 1427 cm−1 assigned to fatty acids/amino acids was preserved in all tissue groups. Interestingly, the low-frequency band attributed to fatty acids centered at 1419 cm−1 was found exclusively in PAXgene-fixed NOM and OSCC tissues. Further, the band corre-sponding to CH3 and CH2 deformations assigned to lipids was found at ~1472 cm−1 in all tissue groups.
Table 5. Assignment of FTIR bands for PFPE and FFPE tissues.
Band Positions (cm−1)
Vibration PFPE NOM FFPE NOM PFPE OSCC FFPE OSCC Assignment [12] (Malek et al. 2014; Wang and Wang
2021)
COH deformation 1010 1021 1010 1002 Glycogen/carbohydrates
PO2- asymmetric stretch 1085 1082 1082 1080 Nucleic acids and phospholipids
C–O stretch of the ribose ring 1113 1111 1113 1115 RNA
C–O stretch 1157 × 1155 × Glycogen
Amide III 1245 1249 1247 1245 Protein
1324 × 1326 1330 Protein
COO- symmetric stretch 1419 × 1419 × Fatty acids, amino acids
1427 1427 1427 1431 Fatty acids, amino acids
CH3 and CH2 deformations 1472 1474 1474 1472 Lipid Proteins Ring CC stretch of tyrosine
residues 1517 1515 1515 1515 Tyrosine Proteins
NH bend + C–N stretch Amide II
1565 1571 1571 1573 Proteins
C = O + NH bend Amide I 1684 1689 1687 1684 Proteins Colored shapes represent the assigned biomolecules, which can be correlated with spectra represented in Figure 5. Abbre-viations: FFPE, formalin-fixed paraffin embedded; PFPE, PAXgene-fixed paraffin embedded; OSCC, oral squamous cell carcinoma; NOM, normal oral mucosa.
PO2- asymmetric stretch 1085 1082 1082 1080 Nucleic acids and
phospholipids
Biomolecules 2021, 11, 11 of 16
The spectral region 1000–1200 cm−1 corresponds to absorption bands from several bio-molecules: carbohydrates, nucleic acids, and phospholipids. PAXgene tissue fixation ex-clusively preserved the C–O stretch vibrations corresponding to glycogen at 1157 cm−1 in PFPE-NOM and 1155 cm−1 in PFPE-OSCC. A low-frequency band assigned to glyco-gen/carbohydrates was centered around ~1010 cm−1 in the PAXgene- and NBF-fixed tis-sues. The ~1115 cm−1 band assigned to RNA (C–O stretch of the ribose ring vibrations) was found in both PAXgene- and NBF-fixed tissue (Table 5, Figure 5).
To understand the preservation of proteins by PAXgene fixation, we analyzed the spectral region between 1200 and 1700 cm−1. We observed the primary amide III band centered around ~1245 cm−1 for the PAXgene- and NBF-fixed tissues. Additional amide III bands were observed at 1324 cm−1 in PFPE-NOM tissues and at 1326 cm−1 in PFPE OSCC tissues. The 1324 cm−1 band was absent in FFPE-NOM tissues; however, a 1330 cm−1 band was found in FFPE OSCC tissues (Table 5, Figure 5). These bands may correspond to the secondary structure of proteins corresponding to the amide III region [14]. The amide II band and amide I band were centered around ~1571 cm−1 and ~1684 cm−1, respectively, for all tissue groups.
A high-frequency band associated with COO- symmetric stretch vibrations centered around 1427 cm−1 assigned to fatty acids/amino acids was preserved in all tissue groups. Interestingly, the low-frequency band attributed to fatty acids centered at 1419 cm−1 was found exclusively in PAXgene-fixed NOM and OSCC tissues. Further, the band corre-sponding to CH3 and CH2 deformations assigned to lipids was found at ~1472 cm−1 in all tissue groups.
Table 5. Assignment of FTIR bands for PFPE and FFPE tissues.
Band Positions (cm−1)
Vibration PFPE NOM FFPE NOM PFPE OSCC FFPE OSCC Assignment [12] (Malek et al. 2014; Wang and Wang
2021)
COH deformation 1010 1021 1010 1002 Glycogen/carbohydrates
PO2- asymmetric stretch 1085 1082 1082 1080 Nucleic acids and phospholipids
C–O stretch of the ribose ring 1113 1111 1113 1115 RNA
C–O stretch 1157 × 1155 × Glycogen
Amide III 1245 1249 1247 1245 Protein
1324 × 1326 1330 Protein
COO- symmetric stretch 1419 × 1419 × Fatty acids, amino acids
1427 1427 1427 1431 Fatty acids, amino acids
CH3 and CH2 deformations 1472 1474 1474 1472 Lipid Proteins Ring CC stretch of tyrosine
residues 1517 1515 1515 1515 Tyrosine Proteins
NH bend + C–N stretch Amide II
1565 1571 1571 1573 Proteins
C = O + NH bend Amide I 1684 1689 1687 1684 Proteins Colored shapes represent the assigned biomolecules, which can be correlated with spectra represented in Figure 5. Abbre-viations: FFPE, formalin-fixed paraffin embedded; PFPE, PAXgene-fixed paraffin embedded; OSCC, oral squamous cell carcinoma; NOM, normal oral mucosa.
C–O stretch of the ribose ring 1113 1111 1113 1115 RNA
Biomolecules 2021, 11, 11 of 16
The spectral region 1000–1200 cm−1 corresponds to absorption bands from several bio-molecules: carbohydrates, nucleic acids, and phospholipids. PAXgene tissue fixation ex-clusively preserved the C–O stretch vibrations corresponding to glycogen at 1157 cm−1 in PFPE-NOM and 1155 cm−1 in PFPE-OSCC. A low-frequency band assigned to glyco-gen/carbohydrates was centered around ~1010 cm−1 in the PAXgene- and NBF-fixed tis-sues. The ~1115 cm−1 band assigned to RNA (C–O stretch of the ribose ring vibrations) was found in both PAXgene- and NBF-fixed tissue (Table 5, Figure 5).
To understand the preservation of proteins by PAXgene fixation, we analyzed the spectral region between 1200 and 1700 cm−1. We observed the primary amide III band centered around ~1245 cm−1 for the PAXgene- and NBF-fixed tissues. Additional amide III bands were observed at 1324 cm−1 in PFPE-NOM tissues and at 1326 cm−1 in PFPE OSCC tissues. The 1324 cm−1 band was absent in FFPE-NOM tissues; however, a 1330 cm−1 band was found in FFPE OSCC tissues (Table 5, Figure 5). These bands may correspond to the secondary structure of proteins corresponding to the amide III region [14]. The amide II band and amide I band were centered around ~1571 cm−1 and ~1684 cm−1, respectively, for all tissue groups.
A high-frequency band associated with COO- symmetric stretch vibrations centered around 1427 cm−1 assigned to fatty acids/amino acids was preserved in all tissue groups. Interestingly, the low-frequency band attributed to fatty acids centered at 1419 cm−1 was found exclusively in PAXgene-fixed NOM and OSCC tissues. Further, the band corre-sponding to CH3 and CH2 deformations assigned to lipids was found at ~1472 cm−1 in all tissue groups.
Table 5. Assignment of FTIR bands for PFPE and FFPE tissues.
Band Positions (cm−1)
Vibration PFPE NOM FFPE NOM PFPE OSCC FFPE OSCC Assignment [12] (Malek et al. 2014; Wang and Wang
2021)
COH deformation 1010 1021 1010 1002 Glycogen/carbohydrates
PO2- asymmetric stretch 1085 1082 1082 1080 Nucleic acids and phospholipids
C–O stretch of the ribose ring 1113 1111 1113 1115 RNA
C–O stretch 1157 × 1155 × Glycogen
Amide III 1245 1249 1247 1245 Protein
1324 × 1326 1330 Protein
COO- symmetric stretch 1419 × 1419 × Fatty acids, amino acids
1427 1427 1427 1431 Fatty acids, amino acids
CH3 and CH2 deformations 1472 1474 1474 1472 Lipid Proteins Ring CC stretch of tyrosine
residues 1517 1515 1515 1515 Tyrosine Proteins
NH bend + C–N stretch Amide II
1565 1571 1571 1573 Proteins
C = O + NH bend Amide I 1684 1689 1687 1684 Proteins Colored shapes represent the assigned biomolecules, which can be correlated with spectra represented in Figure 5. Abbre-viations: FFPE, formalin-fixed paraffin embedded; PFPE, PAXgene-fixed paraffin embedded; OSCC, oral squamous cell carcinoma; NOM, normal oral mucosa.
C–O stretch 1157 × 1155 × Glycogen
Biomolecules 2021, 11, 11 of 16
The spectral region 1000–1200 cm−1 corresponds to absorption bands from several bio-molecules: carbohydrates, nucleic acids, and phospholipids. PAXgene tissue fixation ex-clusively preserved the C–O stretch vibrations corresponding to glycogen at 1157 cm−1 in PFPE-NOM and 1155 cm−1 in PFPE-OSCC. A low-frequency band assigned to glyco-gen/carbohydrates was centered around ~1010 cm−1 in the PAXgene- and NBF-fixed tis-sues. The ~1115 cm−1 band assigned to RNA (C–O stretch of the ribose ring vibrations) was found in both PAXgene- and NBF-fixed tissue (Table 5, Figure 5).
To understand the preservation of proteins by PAXgene fixation, we analyzed the spectral region between 1200 and 1700 cm−1. We observed the primary amide III band centered around ~1245 cm−1 for the PAXgene- and NBF-fixed tissues. Additional amide III bands were observed at 1324 cm−1 in PFPE-NOM tissues and at 1326 cm−1 in PFPE OSCC tissues. The 1324 cm−1 band was absent in FFPE-NOM tissues; however, a 1330 cm−1 band was found in FFPE OSCC tissues (Table 5, Figure 5). These bands may correspond to the secondary structure of proteins corresponding to the amide III region [14]. The amide II band and amide I band were centered around ~1571 cm−1 and ~1684 cm−1, respectively, for all tissue groups.
A high-frequency band associated with COO- symmetric stretch vibrations centered around 1427 cm−1 assigned to fatty acids/amino acids was preserved in all tissue groups. Interestingly, the low-frequency band attributed to fatty acids centered at 1419 cm−1 was found exclusively in PAXgene-fixed NOM and OSCC tissues. Further, the band corre-sponding to CH3 and CH2 deformations assigned to lipids was found at ~1472 cm−1 in all tissue groups.
Table 5. Assignment of FTIR bands for PFPE and FFPE tissues.
Band Positions (cm−1)
Vibration PFPE NOM FFPE NOM PFPE OSCC FFPE OSCC Assignment [12] (Malek et al. 2014; Wang and Wang
2021)
COH deformation 1010 1021 1010 1002 Glycogen/carbohydrates
PO2- asymmetric stretch 1085 1082 1082 1080 Nucleic acids and phospholipids
C–O stretch of the ribose ring 1113 1111 1113 1115 RNA
C–O stretch 1157 × 1155 × Glycogen
Amide III 1245 1249 1247 1245 Protein
1324 × 1326 1330 Protein
COO- symmetric stretch 1419 × 1419 × Fatty acids, amino acids
1427 1427 1427 1431 Fatty acids, amino acids
CH3 and CH2 deformations 1472 1474 1474 1472 Lipid Proteins Ring CC stretch of tyrosine
residues 1517 1515 1515 1515 Tyrosine Proteins
NH bend + C–N stretch Amide II
1565 1571 1571 1573 Proteins
C = O + NH bend Amide I 1684 1689 1687 1684 Proteins Colored shapes represent the assigned biomolecules, which can be correlated with spectra represented in Figure 5. Abbre-viations: FFPE, formalin-fixed paraffin embedded; PFPE, PAXgene-fixed paraffin embedded; OSCC, oral squamous cell carcinoma; NOM, normal oral mucosa.
Amide III 1245 1249 1247 1245 Protein
Biomolecules 2021, 11, 11 of 16
The spectral region 1000–1200 cm−1 corresponds to absorption bands from several bio-molecules: carbohydrates, nucleic acids, and phospholipids. PAXgene tissue fixation ex-clusively preserved the C–O stretch vibrations corresponding to glycogen at 1157 cm−1 in PFPE-NOM and 1155 cm−1 in PFPE-OSCC. A low-frequency band assigned to glyco-gen/carbohydrates was centered around ~1010 cm−1 in the PAXgene- and NBF-fixed tis-sues. The ~1115 cm−1 band assigned to RNA (C–O stretch of the ribose ring vibrations) was found in both PAXgene- and NBF-fixed tissue (Table 5, Figure 5).
To understand the preservation of proteins by PAXgene fixation, we analyzed the spectral region between 1200 and 1700 cm−1. We observed the primary amide III band centered around ~1245 cm−1 for the PAXgene- and NBF-fixed tissues. Additional amide III bands were observed at 1324 cm−1 in PFPE-NOM tissues and at 1326 cm−1 in PFPE OSCC tissues. The 1324 cm−1 band was absent in FFPE-NOM tissues; however, a 1330 cm−1 band was found in FFPE OSCC tissues (Table 5, Figure 5). These bands may correspond to the secondary structure of proteins corresponding to the amide III region [14]. The amide II band and amide I band were centered around ~1571 cm−1 and ~1684 cm−1, respectively, for all tissue groups.
A high-frequency band associated with COO- symmetric stretch vibrations centered around 1427 cm−1 assigned to fatty acids/amino acids was preserved in all tissue groups. Interestingly, the low-frequency band attributed to fatty acids centered at 1419 cm−1 was found exclusively in PAXgene-fixed NOM and OSCC tissues. Further, the band corre-sponding to CH3 and CH2 deformations assigned to lipids was found at ~1472 cm−1 in all tissue groups.
Table 5. Assignment of FTIR bands for PFPE and FFPE tissues.
Band Positions (cm−1)
Vibration PFPE NOM FFPE NOM PFPE OSCC FFPE OSCC Assignment [12] (Malek et al. 2014; Wang and Wang
2021)
COH deformation 1010 1021 1010 1002 Glycogen/carbohydrates
PO2- asymmetric stretch 1085 1082 1082 1080 Nucleic acids and phospholipids
C–O stretch of the ribose ring 1113 1111 1113 1115 RNA
C–O stretch 1157 × 1155 × Glycogen
Amide III 1245 1249 1247 1245 Protein
1324 × 1326 1330 Protein
COO- symmetric stretch 1419 × 1419 × Fatty acids, amino acids
1427 1427 1427 1431 Fatty acids, amino acids
CH3 and CH2 deformations 1472 1474 1474 1472 Lipid Proteins Ring CC stretch of tyrosine
residues 1517 1515 1515 1515 Tyrosine Proteins
NH bend + C–N stretch Amide II
1565 1571 1571 1573 Proteins
C = O + NH bend Amide I 1684 1689 1687 1684 Proteins Colored shapes represent the assigned biomolecules, which can be correlated with spectra represented in Figure 5. Abbre-viations: FFPE, formalin-fixed paraffin embedded; PFPE, PAXgene-fixed paraffin embedded; OSCC, oral squamous cell carcinoma; NOM, normal oral mucosa.
1324 × 1326 1330 Protein
Biomolecules 2021, 11, 11 of 16
The spectral region 1000–1200 cm−1 corresponds to absorption bands from several bio-molecules: carbohydrates, nucleic acids, and phospholipids. PAXgene tissue fixation ex-clusively preserved the C–O stretch vibrations corresponding to glycogen at 1157 cm−1 in PFPE-NOM and 1155 cm−1 in PFPE-OSCC. A low-frequency band assigned to glyco-gen/carbohydrates was centered around ~1010 cm−1 in the PAXgene- and NBF-fixed tis-sues. The ~1115 cm−1 band assigned to RNA (C–O stretch of the ribose ring vibrations) was found in both PAXgene- and NBF-fixed tissue (Table 5, Figure 5).
To understand the preservation of proteins by PAXgene fixation, we analyzed the spectral region between 1200 and 1700 cm−1. We observed the primary amide III band centered around ~1245 cm−1 for the PAXgene- and NBF-fixed tissues. Additional amide III bands were observed at 1324 cm−1 in PFPE-NOM tissues and at 1326 cm−1 in PFPE OSCC tissues. The 1324 cm−1 band was absent in FFPE-NOM tissues; however, a 1330 cm−1 band was found in FFPE OSCC tissues (Table 5, Figure 5). These bands may correspond to the secondary structure of proteins corresponding to the amide III region [14]. The amide II band and amide I band were centered around ~1571 cm−1 and ~1684 cm−1, respectively, for all tissue groups.
A high-frequency band associated with COO- symmetric stretch vibrations centered around 1427 cm−1 assigned to fatty acids/amino acids was preserved in all tissue groups. Interestingly, the low-frequency band attributed to fatty acids centered at 1419 cm−1 was found exclusively in PAXgene-fixed NOM and OSCC tissues. Further, the band corre-sponding to CH3 and CH2 deformations assigned to lipids was found at ~1472 cm−1 in all tissue groups.
Table 5. Assignment of FTIR bands for PFPE and FFPE tissues.
Band Positions (cm−1)
Vibration PFPE NOM FFPE NOM PFPE OSCC FFPE OSCC Assignment [12] (Malek et al. 2014; Wang and Wang
2021)
COH deformation 1010 1021 1010 1002 Glycogen/carbohydrates
PO2- asymmetric stretch 1085 1082 1082 1080 Nucleic acids and phospholipids
C–O stretch of the ribose ring 1113 1111 1113 1115 RNA
C–O stretch 1157 × 1155 × Glycogen
Amide III 1245 1249 1247 1245 Protein
1324 × 1326 1330 Protein
COO- symmetric stretch 1419 × 1419 × Fatty acids, amino acids
1427 1427 1427 1431 Fatty acids, amino acids
CH3 and CH2 deformations 1472 1474 1474 1472 Lipid Proteins Ring CC stretch of tyrosine
residues 1517 1515 1515 1515 Tyrosine Proteins
NH bend + C–N stretch Amide II
1565 1571 1571 1573 Proteins
C = O + NH bend Amide I 1684 1689 1687 1684 Proteins Colored shapes represent the assigned biomolecules, which can be correlated with spectra represented in Figure 5. Abbre-viations: FFPE, formalin-fixed paraffin embedded; PFPE, PAXgene-fixed paraffin embedded; OSCC, oral squamous cell carcinoma; NOM, normal oral mucosa.
COO- symmetric stretch 1419 × 1419 × Fatty acids, amino acids
Biomolecules 2021, 11, 11 of 16
The spectral region 1000–1200 cm−1 corresponds to absorption bands from several bio-molecules: carbohydrates, nucleic acids, and phospholipids. PAXgene tissue fixation ex-clusively preserved the C–O stretch vibrations corresponding to glycogen at 1157 cm−1 in PFPE-NOM and 1155 cm−1 in PFPE-OSCC. A low-frequency band assigned to glyco-gen/carbohydrates was centered around ~1010 cm−1 in the PAXgene- and NBF-fixed tis-sues. The ~1115 cm−1 band assigned to RNA (C–O stretch of the ribose ring vibrations) was found in both PAXgene- and NBF-fixed tissue (Table 5, Figure 5).
To understand the preservation of proteins by PAXgene fixation, we analyzed the spectral region between 1200 and 1700 cm−1. We observed the primary amide III band centered around ~1245 cm−1 for the PAXgene- and NBF-fixed tissues. Additional amide III bands were observed at 1324 cm−1 in PFPE-NOM tissues and at 1326 cm−1 in PFPE OSCC tissues. The 1324 cm−1 band was absent in FFPE-NOM tissues; however, a 1330 cm−1 band was found in FFPE OSCC tissues (Table 5, Figure 5). These bands may correspond to the secondary structure of proteins corresponding to the amide III region [14]. The amide II band and amide I band were centered around ~1571 cm−1 and ~1684 cm−1, respectively, for all tissue groups.
A high-frequency band associated with COO- symmetric stretch vibrations centered around 1427 cm−1 assigned to fatty acids/amino acids was preserved in all tissue groups. Interestingly, the low-frequency band attributed to fatty acids centered at 1419 cm−1 was found exclusively in PAXgene-fixed NOM and OSCC tissues. Further, the band corre-sponding to CH3 and CH2 deformations assigned to lipids was found at ~1472 cm−1 in all tissue groups.
Table 5. Assignment of FTIR bands for PFPE and FFPE tissues.
Band Positions (cm−1)
Vibration PFPE NOM FFPE NOM PFPE OSCC FFPE OSCC Assignment [12] (Malek et al. 2014; Wang and Wang
2021)
COH deformation 1010 1021 1010 1002 Glycogen/carbohydrates
PO2- asymmetric stretch 1085 1082 1082 1080 Nucleic acids and phospholipids
C–O stretch of the ribose ring 1113 1111 1113 1115 RNA
C–O stretch 1157 × 1155 × Glycogen
Amide III 1245 1249 1247 1245 Protein
1324 × 1326 1330 Protein
COO- symmetric stretch 1419 × 1419 × Fatty acids, amino acids
1427 1427 1427 1431 Fatty acids, amino acids
CH3 and CH2 deformations 1472 1474 1474 1472 Lipid Proteins Ring CC stretch of tyrosine
residues 1517 1515 1515 1515 Tyrosine Proteins
NH bend + C–N stretch Amide II
1565 1571 1571 1573 Proteins
C = O + NH bend Amide I 1684 1689 1687 1684 Proteins Colored shapes represent the assigned biomolecules, which can be correlated with spectra represented in Figure 5. Abbre-viations: FFPE, formalin-fixed paraffin embedded; PFPE, PAXgene-fixed paraffin embedded; OSCC, oral squamous cell carcinoma; NOM, normal oral mucosa.
1427 1427 1427 1431 Fatty acids, amino acids
Biomolecules 2021, 11, 11 of 16
The spectral region 1000–1200 cm−1 corresponds to absorption bands from several bio-molecules: carbohydrates, nucleic acids, and phospholipids. PAXgene tissue fixation ex-clusively preserved the C–O stretch vibrations corresponding to glycogen at 1157 cm−1 in PFPE-NOM and 1155 cm−1 in PFPE-OSCC. A low-frequency band assigned to glyco-gen/carbohydrates was centered around ~1010 cm−1 in the PAXgene- and NBF-fixed tis-sues. The ~1115 cm−1 band assigned to RNA (C–O stretch of the ribose ring vibrations) was found in both PAXgene- and NBF-fixed tissue (Table 5, Figure 5).
To understand the preservation of proteins by PAXgene fixation, we analyzed the spectral region between 1200 and 1700 cm−1. We observed the primary amide III band centered around ~1245 cm−1 for the PAXgene- and NBF-fixed tissues. Additional amide III bands were observed at 1324 cm−1 in PFPE-NOM tissues and at 1326 cm−1 in PFPE OSCC tissues. The 1324 cm−1 band was absent in FFPE-NOM tissues; however, a 1330 cm−1 band was found in FFPE OSCC tissues (Table 5, Figure 5). These bands may correspond to the secondary structure of proteins corresponding to the amide III region [14]. The amide II band and amide I band were centered around ~1571 cm−1 and ~1684 cm−1, respectively, for all tissue groups.
A high-frequency band associated with COO- symmetric stretch vibrations centered around 1427 cm−1 assigned to fatty acids/amino acids was preserved in all tissue groups. Interestingly, the low-frequency band attributed to fatty acids centered at 1419 cm−1 was found exclusively in PAXgene-fixed NOM and OSCC tissues. Further, the band corre-sponding to CH3 and CH2 deformations assigned to lipids was found at ~1472 cm−1 in all tissue groups.
Table 5. Assignment of FTIR bands for PFPE and FFPE tissues.
Band Positions (cm−1)
Vibration PFPE NOM FFPE NOM PFPE OSCC FFPE OSCC Assignment [12] (Malek et al. 2014; Wang and Wang
2021)
COH deformation 1010 1021 1010 1002 Glycogen/carbohydrates
PO2- asymmetric stretch 1085 1082 1082 1080 Nucleic acids and phospholipids
C–O stretch of the ribose ring 1113 1111 1113 1115 RNA
C–O stretch 1157 × 1155 × Glycogen
Amide III 1245 1249 1247 1245 Protein
1324 × 1326 1330 Protein
COO- symmetric stretch 1419 × 1419 × Fatty acids, amino acids
1427 1427 1427 1431 Fatty acids, amino acids
CH3 and CH2 deformations 1472 1474 1474 1472 Lipid Proteins Ring CC stretch of tyrosine
residues 1517 1515 1515 1515 Tyrosine Proteins
NH bend + C–N stretch Amide II
1565 1571 1571 1573 Proteins
C = O + NH bend Amide I 1684 1689 1687 1684 Proteins Colored shapes represent the assigned biomolecules, which can be correlated with spectra represented in Figure 5. Abbre-viations: FFPE, formalin-fixed paraffin embedded; PFPE, PAXgene-fixed paraffin embedded; OSCC, oral squamous cell carcinoma; NOM, normal oral mucosa.
CH3 and CH2 deformations 1472 1474 1474 1472 Lipid Proteins
Biomolecules 2021, 11, 11 of 16
The spectral region 1000–1200 cm−1 corresponds to absorption bands from several bio-molecules: carbohydrates, nucleic acids, and phospholipids. PAXgene tissue fixation ex-clusively preserved the C–O stretch vibrations corresponding to glycogen at 1157 cm−1 in PFPE-NOM and 1155 cm−1 in PFPE-OSCC. A low-frequency band assigned to glyco-gen/carbohydrates was centered around ~1010 cm−1 in the PAXgene- and NBF-fixed tis-sues. The ~1115 cm−1 band assigned to RNA (C–O stretch of the ribose ring vibrations) was found in both PAXgene- and NBF-fixed tissue (Table 5, Figure 5).
To understand the preservation of proteins by PAXgene fixation, we analyzed the spectral region between 1200 and 1700 cm−1. We observed the primary amide III band centered around ~1245 cm−1 for the PAXgene- and NBF-fixed tissues. Additional amide III bands were observed at 1324 cm−1 in PFPE-NOM tissues and at 1326 cm−1 in PFPE OSCC tissues. The 1324 cm−1 band was absent in FFPE-NOM tissues; however, a 1330 cm−1 band was found in FFPE OSCC tissues (Table 5, Figure 5). These bands may correspond to the secondary structure of proteins corresponding to the amide III region [14]. The amide II band and amide I band were centered around ~1571 cm−1 and ~1684 cm−1, respectively, for all tissue groups.
A high-frequency band associated with COO- symmetric stretch vibrations centered around 1427 cm−1 assigned to fatty acids/amino acids was preserved in all tissue groups. Interestingly, the low-frequency band attributed to fatty acids centered at 1419 cm−1 was found exclusively in PAXgene-fixed NOM and OSCC tissues. Further, the band corre-sponding to CH3 and CH2 deformations assigned to lipids was found at ~1472 cm−1 in all tissue groups.
Table 5. Assignment of FTIR bands for PFPE and FFPE tissues.
Band Positions (cm−1)
Vibration PFPE NOM FFPE NOM PFPE OSCC FFPE OSCC Assignment [12] (Malek et al. 2014; Wang and Wang
2021)
COH deformation 1010 1021 1010 1002 Glycogen/carbohydrates
PO2- asymmetric stretch 1085 1082 1082 1080 Nucleic acids and phospholipids
C–O stretch of the ribose ring 1113 1111 1113 1115 RNA
C–O stretch 1157 × 1155 × Glycogen
Amide III 1245 1249 1247 1245 Protein
1324 × 1326 1330 Protein
COO- symmetric stretch 1419 × 1419 × Fatty acids, amino acids
1427 1427 1427 1431 Fatty acids, amino acids
CH3 and CH2 deformations 1472 1474 1474 1472 Lipid Proteins Ring CC stretch of tyrosine
residues 1517 1515 1515 1515 Tyrosine Proteins
NH bend + C–N stretch Amide II
1565 1571 1571 1573 Proteins
C = O + NH bend Amide I 1684 1689 1687 1684 Proteins Colored shapes represent the assigned biomolecules, which can be correlated with spectra represented in Figure 5. Abbre-viations: FFPE, formalin-fixed paraffin embedded; PFPE, PAXgene-fixed paraffin embedded; OSCC, oral squamous cell carcinoma; NOM, normal oral mucosa.
Ring CC stretch of tyrosine residues 1517 1515 1515 1515 Tyrosine Proteins
Biomolecules 2021, 11, 11 of 16
The spectral region 1000–1200 cm−1 corresponds to absorption bands from several bio-molecules: carbohydrates, nucleic acids, and phospholipids. PAXgene tissue fixation ex-clusively preserved the C–O stretch vibrations corresponding to glycogen at 1157 cm−1 in PFPE-NOM and 1155 cm−1 in PFPE-OSCC. A low-frequency band assigned to glyco-gen/carbohydrates was centered around ~1010 cm−1 in the PAXgene- and NBF-fixed tis-sues. The ~1115 cm−1 band assigned to RNA (C–O stretch of the ribose ring vibrations) was found in both PAXgene- and NBF-fixed tissue (Table 5, Figure 5).
To understand the preservation of proteins by PAXgene fixation, we analyzed the spectral region between 1200 and 1700 cm−1. We observed the primary amide III band centered around ~1245 cm−1 for the PAXgene- and NBF-fixed tissues. Additional amide III bands were observed at 1324 cm−1 in PFPE-NOM tissues and at 1326 cm−1 in PFPE OSCC tissues. The 1324 cm−1 band was absent in FFPE-NOM tissues; however, a 1330 cm−1 band was found in FFPE OSCC tissues (Table 5, Figure 5). These bands may correspond to the secondary structure of proteins corresponding to the amide III region [14]. The amide II band and amide I band were centered around ~1571 cm−1 and ~1684 cm−1, respectively, for all tissue groups.
A high-frequency band associated with COO- symmetric stretch vibrations centered around 1427 cm−1 assigned to fatty acids/amino acids was preserved in all tissue groups. Interestingly, the low-frequency band attributed to fatty acids centered at 1419 cm−1 was found exclusively in PAXgene-fixed NOM and OSCC tissues. Further, the band corre-sponding to CH3 and CH2 deformations assigned to lipids was found at ~1472 cm−1 in all tissue groups.
Table 5. Assignment of FTIR bands for PFPE and FFPE tissues.
Band Positions (cm−1)
Vibration PFPE NOM FFPE NOM PFPE OSCC FFPE OSCC Assignment [12] (Malek et al. 2014; Wang and Wang
2021)
COH deformation 1010 1021 1010 1002 Glycogen/carbohydrates
PO2- asymmetric stretch 1085 1082 1082 1080 Nucleic acids and phospholipids
C–O stretch of the ribose ring 1113 1111 1113 1115 RNA
C–O stretch 1157 × 1155 × Glycogen
Amide III 1245 1249 1247 1245 Protein
1324 × 1326 1330 Protein
COO- symmetric stretch 1419 × 1419 × Fatty acids, amino acids
1427 1427 1427 1431 Fatty acids, amino acids
CH3 and CH2 deformations 1472 1474 1474 1472 Lipid Proteins Ring CC stretch of tyrosine
residues 1517 1515 1515 1515 Tyrosine Proteins
NH bend + C–N stretch Amide II
1565 1571 1571 1573 Proteins
C = O + NH bend Amide I 1684 1689 1687 1684 Proteins Colored shapes represent the assigned biomolecules, which can be correlated with spectra represented in Figure 5. Abbre-viations: FFPE, formalin-fixed paraffin embedded; PFPE, PAXgene-fixed paraffin embedded; OSCC, oral squamous cell carcinoma; NOM, normal oral mucosa.
NH bend + C–N stretch Amide II 1565 1571 1571 1573 Proteins
Biomolecules 2021, 11, 11 of 16
The spectral region 1000–1200 cm−1 corresponds to absorption bands from several bio-molecules: carbohydrates, nucleic acids, and phospholipids. PAXgene tissue fixation ex-clusively preserved the C–O stretch vibrations corresponding to glycogen at 1157 cm−1 in PFPE-NOM and 1155 cm−1 in PFPE-OSCC. A low-frequency band assigned to glyco-gen/carbohydrates was centered around ~1010 cm−1 in the PAXgene- and NBF-fixed tis-sues. The ~1115 cm−1 band assigned to RNA (C–O stretch of the ribose ring vibrations) was found in both PAXgene- and NBF-fixed tissue (Table 5, Figure 5).
To understand the preservation of proteins by PAXgene fixation, we analyzed the spectral region between 1200 and 1700 cm−1. We observed the primary amide III band centered around ~1245 cm−1 for the PAXgene- and NBF-fixed tissues. Additional amide III bands were observed at 1324 cm−1 in PFPE-NOM tissues and at 1326 cm−1 in PFPE OSCC tissues. The 1324 cm−1 band was absent in FFPE-NOM tissues; however, a 1330 cm−1 band was found in FFPE OSCC tissues (Table 5, Figure 5). These bands may correspond to the secondary structure of proteins corresponding to the amide III region [14]. The amide II band and amide I band were centered around ~1571 cm−1 and ~1684 cm−1, respectively, for all tissue groups.
A high-frequency band associated with COO- symmetric stretch vibrations centered around 1427 cm−1 assigned to fatty acids/amino acids was preserved in all tissue groups. Interestingly, the low-frequency band attributed to fatty acids centered at 1419 cm−1 was found exclusively in PAXgene-fixed NOM and OSCC tissues. Further, the band corre-sponding to CH3 and CH2 deformations assigned to lipids was found at ~1472 cm−1 in all tissue groups.
Table 5. Assignment of FTIR bands for PFPE and FFPE tissues.
Band Positions (cm−1)
Vibration PFPE NOM FFPE NOM PFPE OSCC FFPE OSCC Assignment [12] (Malek et al. 2014; Wang and Wang
2021)
COH deformation 1010 1021 1010 1002 Glycogen/carbohydrates
PO2- asymmetric stretch 1085 1082 1082 1080 Nucleic acids and phospholipids
C–O stretch of the ribose ring 1113 1111 1113 1115 RNA
C–O stretch 1157 × 1155 × Glycogen
Amide III 1245 1249 1247 1245 Protein
1324 × 1326 1330 Protein
COO- symmetric stretch 1419 × 1419 × Fatty acids, amino acids
1427 1427 1427 1431 Fatty acids, amino acids
CH3 and CH2 deformations 1472 1474 1474 1472 Lipid Proteins Ring CC stretch of tyrosine
residues 1517 1515 1515 1515 Tyrosine Proteins
NH bend + C–N stretch Amide II
1565 1571 1571 1573 Proteins
C = O + NH bend Amide I 1684 1689 1687 1684 Proteins Colored shapes represent the assigned biomolecules, which can be correlated with spectra represented in Figure 5. Abbre-viations: FFPE, formalin-fixed paraffin embedded; PFPE, PAXgene-fixed paraffin embedded; OSCC, oral squamous cell carcinoma; NOM, normal oral mucosa.
C = O + NH bend Amide I 1684 1689 1687 1684 Proteins
Biomolecules 2021, 11, 11 of 16
The spectral region 1000–1200 cm−1 corresponds to absorption bands from several bio-molecules: carbohydrates, nucleic acids, and phospholipids. PAXgene tissue fixation ex-clusively preserved the C–O stretch vibrations corresponding to glycogen at 1157 cm−1 in PFPE-NOM and 1155 cm−1 in PFPE-OSCC. A low-frequency band assigned to glyco-gen/carbohydrates was centered around ~1010 cm−1 in the PAXgene- and NBF-fixed tis-sues. The ~1115 cm−1 band assigned to RNA (C–O stretch of the ribose ring vibrations) was found in both PAXgene- and NBF-fixed tissue (Table 5, Figure 5).
To understand the preservation of proteins by PAXgene fixation, we analyzed the spectral region between 1200 and 1700 cm−1. We observed the primary amide III band centered around ~1245 cm−1 for the PAXgene- and NBF-fixed tissues. Additional amide III bands were observed at 1324 cm−1 in PFPE-NOM tissues and at 1326 cm−1 in PFPE OSCC tissues. The 1324 cm−1 band was absent in FFPE-NOM tissues; however, a 1330 cm−1 band was found in FFPE OSCC tissues (Table 5, Figure 5). These bands may correspond to the secondary structure of proteins corresponding to the amide III region [14]. The amide II band and amide I band were centered around ~1571 cm−1 and ~1684 cm−1, respectively, for all tissue groups.
A high-frequency band associated with COO- symmetric stretch vibrations centered around 1427 cm−1 assigned to fatty acids/amino acids was preserved in all tissue groups. Interestingly, the low-frequency band attributed to fatty acids centered at 1419 cm−1 was found exclusively in PAXgene-fixed NOM and OSCC tissues. Further, the band corre-sponding to CH3 and CH2 deformations assigned to lipids was found at ~1472 cm−1 in all tissue groups.
Table 5. Assignment of FTIR bands for PFPE and FFPE tissues.
Band Positions (cm−1)
Vibration PFPE NOM FFPE NOM PFPE OSCC FFPE OSCC Assignment [12] (Malek et al. 2014; Wang and Wang
2021)
COH deformation 1010 1021 1010 1002 Glycogen/carbohydrates
PO2- asymmetric stretch 1085 1082 1082 1080 Nucleic acids and phospholipids
C–O stretch of the ribose ring 1113 1111 1113 1115 RNA
C–O stretch 1157 × 1155 × Glycogen
Amide III 1245 1249 1247 1245 Protein
1324 × 1326 1330 Protein
COO- symmetric stretch 1419 × 1419 × Fatty acids, amino acids
1427 1427 1427 1431 Fatty acids, amino acids
CH3 and CH2 deformations 1472 1474 1474 1472 Lipid Proteins Ring CC stretch of tyrosine
residues 1517 1515 1515 1515 Tyrosine Proteins
NH bend + C–N stretch Amide II
1565 1571 1571 1573 Proteins
C = O + NH bend Amide I 1684 1689 1687 1684 Proteins Colored shapes represent the assigned biomolecules, which can be correlated with spectra represented in Figure 5. Abbre-viations: FFPE, formalin-fixed paraffin embedded; PFPE, PAXgene-fixed paraffin embedded; OSCC, oral squamous cell carcinoma; NOM, normal oral mucosa.
Colored shapes represent the assigned biomolecules, which can be correlated with spectra represented in Figure 5. Abbreviations:FFPE, formalin-fixed paraffin embedded; PFPE, PAXgene-fixed paraffin embedded; OSCC, oral squamous cell carcinoma; NOM, normaloral mucosa.
To understand the preservation of proteins by PAXgene fixation, we analyzed thespectral region between 1200 and 1700 cm−1. We observed the primary amide III bandcentered around ~1245 cm−1 for the PAXgene- and NBF-fixed tissues. Additional amide IIIbands were observed at 1324 cm−1 in PFPE-NOM tissues and at 1326 cm−1 in PFPE OSCCtissues. The 1324 cm−1 band was absent in FFPE-NOM tissues; however, a 1330 cm−1 bandwas found in FFPE OSCC tissues (Table 5, Figure 5). These bands may correspond to thesecondary structure of proteins corresponding to the amide III region [14]. The amide IIband and amide I band were centered around ~1571 cm−1 and ~1684 cm−1, respectively,for all tissue groups.
A high-frequency band associated with COO- symmetric stretch vibrations centeredaround 1427 cm−1 assigned to fatty acids/amino acids was preserved in all tissue groups.Interestingly, the low-frequency band attributed to fatty acids centered at 1419 cm−1
was found exclusively in PAXgene-fixed NOM and OSCC tissues. Further, the bandcorresponding to CH3 and CH2 deformations assigned to lipids was found at ~1472 cm−1
in all tissue groups.
4. Discussion
Oral buccal mucosal tissues have low tensile strength when compared to other intrao-ral sites such as the gingiva and hard palate [10]. Thus, it is not surprising that processingof oral buccal mucosal tissue for histological experiments is a tedious process and suffersfrom processing errors such as tissue fall-off from slides, wrinkling, and tissue tear. Thisleads to unnecessary experimental delay and loss of critical morphological or molecularinformation. We have successfully used the formalin-free PAXgene tissue fixation systemfor oral buccal mucosal tissue of normal and cancer morphology without compromisingthe quality of the histopathological analysis (Figure 2). In line with previous observa-tions [5,8,11], a slightly high eosinophilic reaction was observed in H&E-stained PFPEtissues (Figure 2E,F), which did not interfere with the histopathological analysis. Accordingto the participating oral pathologists in this study, architectural alterations in the surfaceepithelium and individual cell alterations [16] were detectable and comparable to formalinfixation in both H&E-stained PFPE-NOM and PFPE-OSCC tissues.
Immunohistochemistry, by far, is the most routinely used method to analyze spe-cific cancer biomarkers and, to an extent, has advanced our knowledge on oral cancerprogression [17,18]. The heat-induced antigen retrieval step is a critical step in immuno-

Biomolecules 2021, 11, 889 13 of 16
histochemistry; however, direct boiling of FFPE-NOM and FFPE-OSCC tissue in buffersresults in the damage of tissues or fall-off of tissues from the slide. Several factors havebeen identified to contribute to the problem of tissue fall-off from slides, such as inad-equate fixation, uneven sectioning and drying, and poor quality of adherent and un-cleaned slides [19]. Even after taking care of the aforementioned factors, we observedrecurrent tissue fall-off from slides of FFPE-NOM and FFPE-OSCC samples after boiling(Tables 3 and 4). PAXgene-fixed tissues show a slight reduction in tissue-fall from slidesafter boiling (Table 4). As PAXgene tissue fixation systems do not form crosslinks withthe tissues, we removed the antigen-retrieval step for the PFPE-NOM and PFPE-OSCCsamples and successfully optimized the immunohistochemistry protocol for oral cancerbiomarkers p53 and CK5/6. Skipping the antigen retrieval step significantly reduced theproblem of tissue fall-off from slides (Table S3). Although antigen retrieval by boiling is anexcellent way to gain the immunoreactivity of antibodies, it also damages the morphologyof the tissue to some extent, which may hinder diagnosis. Further, the consensus basedon previous observations on FFPE tissue is that every antigen requires a “tailor-made”retrieval condition, which is highly prone to technical errors, leading to irreproducibilityof the data [20]. Our experiments showed improved quality of immuno-staining of bothp53 and CK5/6 in basal and suprabasal epithelial layers for PFPE-NOM tissues (withor without antigen retrieval) over FFPE-NOM tissues (with antigen retrieval) (Figure 4).This is an important observation as any redundancies in the control group may lead toincorrect interpretation of the expression of cancer-associated proteins (in this case—p53and CK5/6), false diagnosis, and incorrect statistics in comparative datasets. For dysplasiaand OSCC samples, the immuno-staining in PFPE tissues was comparable to FFPE tis-sues as per the oral-pathologists’ interpretation (Figure 4). However, a semi-quantitativeanalysis on the density value of the immuno-stains shows less expression of p53 andCK5/6 in FFPE-tissues (Figures 3 and 4). Recently, concerns have been raised regardingthe irreproducibility of the immunohistochemical data for studying prognostic features inOSCC [21,22]. The 8th edition of the American Joint Committee on Cancer (AJCC) staginghas reinforced focus on histo-morphological prognostic features, such as tumor stromaratio, depth of invasion, and extranodal extension, to study the prognosis of OSCC [22].From our experiments, it can be inferred that PAXgene tissue fixation of oral mucosa tissuescan be successfully implemented in histo-morphological and molecular pathology studies,with enhanced staining characteristics and minimal risk of irreproducibility.
Next, we investigated the preservation of biochemical content of oral samples usingFTIR microspectroscopy. We measured and analyzed spectra from pathologically similarregion of interests from grouped tissues of NOM and OSCC fixed with either NBF orthe PAXgene tissue fixation system (Figure 1). PAXgene fixation, and not NBF fixation,showed preservation of the C–O vibrations attributable to glycogen (Figure 5 and Table 5).Previous histological studies have shown a higher glycogen expression in oral dysplasiawhen compared to normal, and it is an indicator of cancer progression [23,24]. Structuralalterations in nucleic acids, and increased transcriptional activity pertaining to increasein RNA, was previously reported in various studies on OSCC [17,24]. The RNA bandcorresponding to the C–O stretch of the ribose ring was preserved in both PAXgene andNBF-fixed tissues (Figure 5 and Table 5). Further, prior studies have shown PAXgenefixation is superior in preserving RNA integrity, particularly in low-yield samples formolecular experiments [3,5,25]. It also was reported that the PAXgene-fixed RNA hasbetter RT-PCR efficiency than NBF fixation and was comparable to snap-frozen samples,irrespective of the length of the mRNA, in a wide variety of cancerous tissues, includingsquamous cell carcinoma [5,25,26]. Further in-depth comparative studies are warranted inoral tissue to understand the effect of PAXgene fixation on RNA integrity and downstreamanalysis such as RT-PCR and RNA sequencing.
In terms of the preservation of proteins, all three amide bands (amide I, amide II, andamide III) were preserved in both PAXgene- and NBF-fixed tissues. We also observed anadditional band for amide III centered around ~1324 cm−1 in both PFPE-NOM and PFPE

Biomolecules 2021, 11, 889 14 of 16
OSCC tissues (Table 5). These bands correspond to the alpha-helical secondary structure ofproteins [14]. The amide I region is generally used for studying the secondary structuremodifications in proteins, whereas the amide III region is comparatively neglected dueto the low signal. However, it was previously described that the secondary structures ofproteins have more resolved differences in their amide III spectra [14,27]. Recent studieshave indicated that the secondary structure modifications are a direct measure of the gain-of-function mutations of the amino acids of proteins leading to cancer progression [28,29].Furthermore, alterations in secondary structure of proteins, to an extent, modulates thephosphorylation of proteins [30]. Recently, a MS-based approach showed 62 uniquephosphorylated sites in the tumor epithelium of OSCC [31]. In this regard, prior studieshave shown enhanced preservation of phosphorylated proteins in PAXgene-fixed tissuesthan formalin-fixed tissues [26,32]. Further studies on secondary structure alterationsin PAXgene-fixed NOM and OSCC tissues may provide new insights into the proteinbiomarkers of oral cancer progression.
5. Conclusions
To the best of our knowledge, this is the first time that PAXgene and NBF fixation oforal tissues were simultaneously compared in terms of morphology (histology, immuno-histochemistry) and the sample biochemical variations arising from different methods offixation (FTIR). Our study demonstrates that for fragile tissues such as oral buccal mucosa,which are prone to processing and handling errors, PAXgene tissue fixation systems canbe implemented for routine histological and immunohistochemistry experiments with-out compromising on the quality of the morphological diagnosis. PAXgene fixation alsoensured the preservation of several important biocomponents (nucleic acids, lipids, andproteins) as revealed by FTIR microspectroscopy. This information will save time in theclinics while collecting and processing the oral tissue for molecular diagnostic purposesas a second fixative for the preservation of nucleic acids may not be required. As medicaldecision-making moves towards personalized diagnostics by obtaining a broader spectrumof information from the same tissue, the PAXgene tissue fixation system may help improvethe efficiency of diagnosis.
Supplementary Materials: The following are available online at https://www.mdpi.com/article/10.3390/biom11060889/s1, Table S1: Percentage loss of tissue area from epithelium and sub-epitheliumregions due to tissue tear or wrinkling, Table S2: Experimental Conditions Used for Optimizationof Antigen Retrieval for Immunohistochemistry Application, Table S3. Documentation of cases oftissue section fall-off from slides during sample processing steps for immuno-histochemical stainingexperiments for PFPE tissue without antigen retrieval, Methods S1: Immunohistochemistry.
Author Contributions: Conceptualization, P.L; methodology, P.L., S.M., B.G., D.D., M.P., R.R.P.;software, P.L, B.G., S.M.; validation, P.L., S.M. and B.G.; formal analysis, P.L., S.M., B.G., M.P., R.R.P.,B.L.; investigation, P.L., S.M., B.G., J.C.; resources, P.L.,B.L., S.K.V., J.C.; data curation, P.L., S.M.;writing—original draft preparation, P.L.; writing—review and editing, P.L., S.M., B.G., D.D., B.L.,S.K.V., M.P., R.R.P., J.C.; visualization, P.L.; supervision, P.L., J.C.; project administration. P.L.; fundingacquisition, P.L., B.L., M.P., S.K.V., J.C. All authors have read and agreed to the published version ofthe manuscript.
Funding: The study was funded by institute postdoctoral fellowship contingency fund (18MMPD101)of IIT Kharagpur to P.L., West Bengal DST grant (Ref. Memo no. 151(SANC.)/ST/P/S&T/9G-32/2016) to J.C., and Science and Engineering Board-Core Research Grant (CRG/2020/002687) toB.L., S.K.V. and M.P.
Institutional Review Board Statement: The study was conducted according to the guidelines of theDeclaration of Helsinki. This study was performed with the informed consent of all individuals andapproved by the institutional ethics committee (GNIDSR/IEC/07/16).
Informed Consent Statement: Informed consent was obtained from all subjects involved in the study.

Biomolecules 2021, 11, 889 15 of 16
Data Availability Statement: All data pertaining to the manuscript is given in the main-text orsupplementary data. Additional information can be requested from the corresponding author if andwhen required.
Acknowledgments: The authors would like to acknowledge the MDS students from GNIDSR,Kolkata, and R. Ahmed Medical College, Kolkata, for their active participation in the collectionof samples.
Conflicts of Interest: The authors declare no conflict of interest. The funders had no role in the designof the study; in the collection, analyses, or interpretation of data; in the writing of the manuscript, orin the decision to publish the results.
References1. Hicks, D.G.; Boyce, B.F. The challenge and importance of standardizing pre-analytical variables in surgical pathology specimens
for clinical care and translational research. Biotech. Histochem. 2012, 87, 14–17. [CrossRef] [PubMed]2. Howat, W.J.; Wilson, B.A. Tissue fixation and the effect of molecular fixatives on downstream staining procedures. Methods 2014,
70, 12–19. [CrossRef]3. Kap, M.; Smedts, F.; Oosterhuis, W.; Winther, R.; Christensen, N.; Reischauer, B.; Viertler, C.; Groelz, D.; Becker, K.-F.; Zatloukal, K.;
et al. Histological assessment of PAXgene tissue fixation and stabilization reagents. PLoS ONE 2011, 6, e27704. [CrossRef][PubMed]
4. Gillard, M.; Tom, W.R.; Antic, T.; Paner, G.P.; Lingen, M.W.; VanderWeele, D.J. Next-gen tissue: Preservation of molecular andmorphological fidelity in prostate tissue. Am. J. Transl. Res. 2015, 7, 1227–1235.
5. Groelz, D.; Sobin, L.; Branton, P.; Compton, C.; Wyrich, R.; Rainen, L. Non-formalin fixative versus formalin-fixed tissue:A comparison of histology and RNA quality. Exp. Mol. Pathol. 2013, 94, 188–194. [CrossRef] [PubMed]
6. Masuda, N.; Ohnishi, T.; Kawamoto, S.; Monden, M.; Okubo, K. Analysis of chemical modification of RNA from formalin-fixedsamples and optimization of molecular biology applications for such samples. Nucleic Acids Res. 1999, 27, 4436–4443. [CrossRef]
7. Mc Sherry, E.A.; Mc Goldrick, A.; Kay, E.W.; Hopkins, A.M.; Gallagher, W.M.; Dervan, P.A. Formalin-fixed paraffin-embeddedclinical tissues show spurious copy number changes in array-CGH profiles. Clin. Genet. 2007, 72, 441–447. [CrossRef]
8. Mathieson, W.; Marcon, N.; Antunes, L.; Ashford, D.A.; Betsou, F.; Frasquilho, S.G.; Kofanova, O.A.; McKay, S.C.; Pericleous, S.;Smith, C.; et al. A Critical Evaluation of the PAXgene Tissue Fixation System: Morphology, Immunohistochemistry, MolecularBiology, and Proteomics. Am. J. Clin. Pathol. 2016, 146, 25–40. [CrossRef]
9. Pegg, D.E. The relevance of ice crystal formation for the cryopreservation of tissues and organs. Cryobiology 2010, 60, S36–S44.[CrossRef] [PubMed]
10. Choi, J.J.E.; Zwirner, J.; Ramani, R.S.; Ma, S.; Hussaini, H.M.; Waddell, J.N.; Hammer, N. Mechanical properties of human oralmucosa tissues are site dependent: A combined biomechanical, histological and ultrastructural approach. Clin. Exp. Dent. Res.2020, 6, 602–611. [CrossRef]
11. Belloni, B.; Lambertini, C.; Nuciforo, P.; Phillips, J.; Bruening, E.; Wong, S.; Dummer, R. Will PAXgene substitute formalin?A morphological and molecular comparative study using a new fixative system. J. Clin. Pathol. 2013, 66, 124–135. [CrossRef]
12. Malek, K.; Wood, B.R.; Bambery, K.R. FTIR Imaging of Tissues: Techniques and Methods of Analysis. In Optical Spectroscopy andComputational Methods in Biology and Medicine; Baranska, M., Ed.; Springer: Dordrecht, The Netherlands, 2014; pp. 419–473.
13. PAXgene Tissue FIX Container Product Circular—PreAnalytiX www.preanalytix.com. Available online: https://www.preanalytix.com/storage/download/_ProductResources_/Handbooks/HB-1477-001_1074355_HB_Tissue_all_FIX_Container_0213_WW.pdf (accessed on 26 February 2021).
14. Cai, S.; Singh, B.R. A Distinct Utility of the Amide III Infrared Band for Secondary Structure Estimation of Aqueous ProteinSolutions Using Partial Least Squares Methods. Biochemistry 2004, 43, 2541–2549. [CrossRef] [PubMed]
15. Wang, R.; Wang, Y. Fourier Transform Infrared Spectroscopy in Oral Cancer Diagnosis. Int. J. Mol. Sci. 2021, 22, 1206. [CrossRef][PubMed]
16. Geetha, K.M.; Leeky, M.; Narayan, T.V.; Sadhana, S.; Saleha, J. Grading of oral epithelial dysplasia: Points to ponder. J. OralMaxillofac. Pathol. JOMFP 2015, 19, 198–204. [CrossRef]
17. Choi, P.; Jordan, C.D.; Mendez, E.; Houck, J.; Yueh, B.; Farwell, D.G.; Futran, N.; Chen, C. Examination of oral cancer biomarkersby tissue microarray analysis. Arch. Otolaryngol. Head Neck Surg. 2008, 134, 539–546. [CrossRef]
18. Almangush, A.; Heikkinen, I.; Mäkitie, A.A.; Coletta, R.D.; Läärä, E.; Leivo, I.; Salo, T. Prognostic biomarkers for oral tonguesquamous cell carcinoma: A systematic review and meta-analysis. Br. J. Cancer 2017, 117, 856–866. [CrossRef]
19. Shi, S.R.; Shi, Y.; Taylor, C.R. Antigen retrieval immunohistochemistry: Review and future prospects in research and diagnosisover two decades. J. Histochem. Cytochem. 2011, 59, 13–32. [CrossRef] [PubMed]
20. Ezaki, T. Antigen retrieval on formaldehyde-fixed paraffin sections: Its potential drawbacks and optimization for doubleimmunostaining. Micron 2000, 31, 639–649. [CrossRef]
21. Mascitti, M.; Rubini, C.; De Michele, F.; Balercia, P.; Girotto, R.; Troiano, G.; Lo Muzio, L.; Santarelli, A. American Joint Committeeon Cancer staging system 7th edition versus 8th edition: Any improvement for patients with squamous cell carcinoma of thetongue? Oral Surg. Oral Med. Oral Pathol. Oral Radiol. 2018, 126, 415–423. [CrossRef]

Biomolecules 2021, 11, 889 16 of 16
22. Mascitti, M.; Zhurakivska, K.; Togni, L.; Caponio, V.C.A.; Almangush, A.; Balercia, P.; Balercia, A.; Rubini, C.; Lo Muzio, L.;Santarelli, A.; et al. Addition of the tumour–stroma ratio to the 8th edition American Joint Committee on Cancer staging systemimproves survival prediction for patients with oral tongue squamous cell carcinoma. Histopathology 2020, 77, 810–822. [CrossRef]
23. Isacsson, G.; Shear, M. Content and distribution of glycogen in oral epithelial dysplasia. Scand. J. Dent. Res. 1981, 89, 79–88.[CrossRef] [PubMed]
24. Sabbatini, S.; Conti, C.; Rubini, C.; Librando, V.; Tosi, G.; Giorgini, E. Infrared microspectroscopy of Oral Squamous CellCarcinoma: Spectral signatures of cancer grading. Vib. Spectrosc. 2013, 68, 196–203. [CrossRef]
25. Southwood, M.; Krenz, T.; Cant, N.; Maurya, M.; Gazdova, J.; Maxwell, P.; McGready, C.; Moseley, E.; Hughes, S.; Stewart, P.; et al.Systematic evaluation of PAXgene® tissue fixation for the histopathological and molecular study of lung cancer. J. Pathol. Clin.Res. 2020, 6, 40–54. [CrossRef]
26. Viertler, C.; Groelz, D.; Gündisch, S.; Kashofer, K.; Reischauer, B.; Riegman, P.H.; Winther, R.; Wyrich, R.; Becker, K.F.; Oelmüller, U.;et al. A new technology for stabilization of biomolecules in tissues for combined histological and molecular analyses. J. Mol.Diagn. 2012, 14, 458–466. [CrossRef]
27. Singh, B.; DeOliveira, D.; Fu, F.-N.; Fuller, M. Fourier transform infrared analysis of amide III bands of proteins for the secondary structureestimation; SPIE: Bellingham, WA, USA, 1993; Volume 1890.
28. Khan, S.; Vihinen, M. Spectrum of disease-causing mutations in protein secondary structures. BMC Struct. Biol. 2007, 7, 56.[CrossRef]
29. Tikhonov, D.; Kulikova, L.; Kopylov, A.; Malsagova, K.; Stepanov, A.; Rudnev, V.; Kaysheva, A. Super Secondary Structures ofProteins with Post-Translational Modifications in Colon Cancer. Molecules 2020, 25, 3144. [CrossRef]
30. Johnson, L.N.; Barford, D. The effects of phosphorylation on the structure and function of proteins. Annu. Rev. Biophys. Biomol.Struct. 1993, 22, 199–232. [CrossRef]
31. Winck, F.V.; Belloni, M.; Pauletti, B.A.; de Lima Zanella, J.; Domingues, R.R.; Sherman, N.E.; Paes Leme, A.F. Phosphoproteomeanalysis reveals differences in phosphosite profiles between tumorigenic and non-tumorigenic epithelial cells. J. Proteom. 2014, 96,67–81. [CrossRef] [PubMed]
32. Gündisch, S.; Schott, C.; Wolff, C.; Tran, K.; Beese, C.; Viertler, C.; Zatloukal, K.; Becker, K.-F. The PAXgene(®) tissue systempreserves phosphoproteins in human tissue specimens and enables comprehensive protein biomarker research. PLoS ONE 2013,8, e60638. [CrossRef] [PubMed]