Embed Size (px)
Citation preview
OMNITRANS, San Bernardino, California
COMPREHENSIVE ANNUAL REPORT
CONNECTING OUR COMMUNITY
CO
MP
REH
ENS
IVE
AN
NU
AL
FIN
AN
CIA
L R
EPO
RT
Before I came to Omnitrans, I always thought Omnitrans was a good organization. Now, having been Omnitrans’CEO/General Manager for two-and-a-half years, I know it is a great organization. Omnitrans only has one truepurpose – to safely transport people from point A to point B. The difference we make in people’s lives each day is an experience our coach operators are fortunate to witness as passengers make their way from home to work, school, the store, medical centers, and back home again. It’s all about acknowledging the people thatmake Omnitrans a great organization – our passengers, our employees, and our business partners.
Omnitrans is currently in the midst of a Comprehensive Operational Analysis (COA), one of the most extensiveever to be conducted of Omnitrans by San Bernardino Associated Governments (SANBAG). According to the objective of the COA, there is the potential for numerous changes in our organizational structure and servicedelivery model. The challenge ahead will be to focus on what must be done to successfully implement the recommendation(s) of the COA adopted by the Board of Directors, while maintaining the highest sustainablequality of service. The completion of the COA is essential to charting the path forward for Omnitrans and reinventingthe Agency to meet the growing demand for public transit services in our community.
MILO VICTORIACEO/General Manager
MISSION:To provide the San Bernardino Valley with comprehensive mass transportation services,which maximize customer use, comfort, safety, and satisfaction while efficiently usingfinancial and other resources, in an environmentally sensitive manner.
OMNITRANSSan Bernardino, California
COMPREHENSIVE ANNUAL FINANCIAL REPORTFiscal Year Ended June 30, 2012
(With Independent Auditor’s Report Thereon)
Prepared by the Finance Department
DONALD WALKERDirector of Finance
INTRODUCTORY SECTION
Letter of Transmittal iOrganizational Chart iiiList of Elected and Appointed Officials ivGFOA Certificate of Achievement viiGeneral Information viii
FINANCIAL SECTION
Independent Auditors ̦ Report 1Management’s Discussion and Analysis (required supplementary information) 3
Financial Highlights 3Overview of the Financial Statements 3Net Position 8Changes in Net Position 9
Basic Financial Statements 12Statement of Net Position 12Statement of Revenues, Expenses and Changes in Net Assets 13Statement of Cash Flows 14Notes to Basic Financial Statements 16
STATISTICAL SECTION
Financial Trends 32Net Position by Component 32Changes in Net Position 33
Revenue Capacity 34Revenue Source 34
Demographic and Economic Information 35Demographics and Statistics of San Bernardino County 35Principal Employers of San Bernardino County 35Industry Employment and Labor Force 36
Operating Information 40Number of Employees 40Operating Expenses by Category 41Operating Expenses by Function 41Capital Assets by Function 42
TABLE OF CONTENTS
CONNECTING COMMUNITYOUR
INTR
OD
UC
TOR
Y SEC
TION
CONNECTING COMMUNITYOUR
INTR
OD
UC
TOR
Y S
ECTI
ON
i2 0 1 2 C o m p r e h e n s i v e A n n u a l F i n a n c i a l R e p o r t
INTR
OD
UC
TOR
Y SEC
TION
January 9, 2013
To the Members of the Omnitrans Board of Directors, CEO/General Manager and Citizens of the County of San Bernardino.
California Government Code sections 25250 and 25253 require that every general-purpose local government publishwithin six months of the close of each fiscal year a complete set of audited financial statements. This report is published in fulfillment of that requirement for the fiscal year ended June 30, 2012.
The Comprehensive Annual Financial Report (CAFR) is a valuable tool that enables Omnitrans’ officials to make sound financialdecisions. This report provides an independently audited account of the financial condition of the Agency. The financial statements,supplemental schedules, and statistical information are the representations of Omnitrans’ management. Consequently,management assumes full responsibility for their accuracy, completeness and fairness. To provide a reasonable basis formaking these representations, management has established a comprehensive internal-control framework that is designed both toprotect the Agency’s assets from loss, theft or misuse, and to compile sufficient reliable information for the preparation of theAgency’s financial statements in conformity with generally accepted accounting principles. In conformance with these principles,this report was developed on the accrual basis of accounting, treating Omnitrans as a single enterprise fund.
Mayer Hoffman McCann LLP, a firm of licensed certified public accountants, audited Omnitrans’ financial statements. Thegoal of the independent audit is to provide reasonable assurance that the financial statements of the Agency for the fiscalyear ended June 30, 2012 are free of material misstatement. The independent audit involves examining, on a test basis, evidence supporting the amounts and disclosures in the financial statements; assessing the accounting principles used andsignificant estimates made by management; and evaluating the overall financial statement presentation. The independentauditor concluded, based upon the audit, that there was a reasonable basis for rendering an unqualified opinion that Omnitrans’ financial statements for the fiscal year ended June 30, 2012 are fairly represented in conformity with GenerallyAccepted Accounting Principles (GAAP). The independent auditor’s report is presented as the first component of the financialsection of this report.
Management’s Discussion and Analysis (MD&A) immediately follows the independent auditor’s report and provides a narrativeintroduction, overview and analysis of the basic financial statements. MD&A complement this letter of transmittal and should beread in conjunction with it.
The independent audit of the financial statements of Omnitrans was part of a broader, federally mandated “Single Audit” designedto meet the special needs of federal grantor agencies. The standards governing Single Audit engagements require the independentauditor to report on the fair presentation of the financial statements, with special emphasis on internal controls and legalrequirements involving the administration of federal awards. These reports are included in a separate Single Audit report.
Omnitrans • 1700 West Fifth Street • San Bernardino, CA 92411Phone: 909-379-7100 • Web site: www.omnitrans.org • Fax 909-889-5779
Serving the communities of Chino Hills, Colton, County of San Bernardino, Fontana, Grand Terrace, Highland, Loma Linda,Montclair, Ontario, Rancho Cucamonga, Redlands, Rialto, San Bernardino, Upland and Yucaipa.
continued on next page
2 0 1 2 C o m p r e h e n s i v e A n n u a l F i n a n c i a l R e p o r tii
INTR
OD
UC
TOR
Y S
ECTI
ON
As stewards of the taxpayer’s money, Omnitrans continues to achieve its primary objective of safeguarding the funds entrusted to us. Our primary focus is the planning, securing and controlling of Omnitrans’ financial resources. This includes:
•Developing an Accurate Budget
Develop a realistic budget that clearly indicates what expenditures Omnitrans will incur during the fiscal year. Indoing so, the finance department assists all departments of the agency in planning their activities. The budget clearly shows how much departments can spend on each particular activity.
•Coordinating Activities With Other Departments
Strive to coordinate the flow of funds with the agency's activities, using long-range planning while preparing for short-term needs. This involves timing, making sure Omnitrans has sufficient funds for its activities when needed.
•Secure Funding
Research, apply and secure all available funding opportunities to ensure adequate cash flow to support the construction, operation and maintenance of Omnitrans’ transportation system. This includes the day-to-day operations as well as long-term goals.
•Maintaining Transparency
Provide transparency in our operations to all the stakeholders of Omnitrans to instill a sense of trust by consistent actions that show we are reliable, cooperative and committed to the success of Omnitrans. This includes providing thorough and accurate financial information to all stakeholders.
Omnitrans takes great pride in the fact that previously issued CAFRs have been awarded a prestigious award by theGovernment Finance Officers Association (GFOA) in the form of its Certificate of Achievement for Excellence in FinancialReporting. Omnitrans has received the GFOA “Certificate of Achievement for Excellence in Finance Reporting” a total ofnine times. These prior awards and the one that we are currently seeking this year evidence the significant improvementsregarding the strengthening of internal controls and our compliance with stringent GFOA standards for professional financial reporting. Omnitrans’ system of internal control is supported by written policies and procedures and is continually reviewed, evaluated and modified to meet current needs.
iii2 0 1 2 C o m p r e h e n s i v e A n n u a l F i n a n c i a l R e p o r t
INTR
OD
UC
TOR
Y SEC
TION
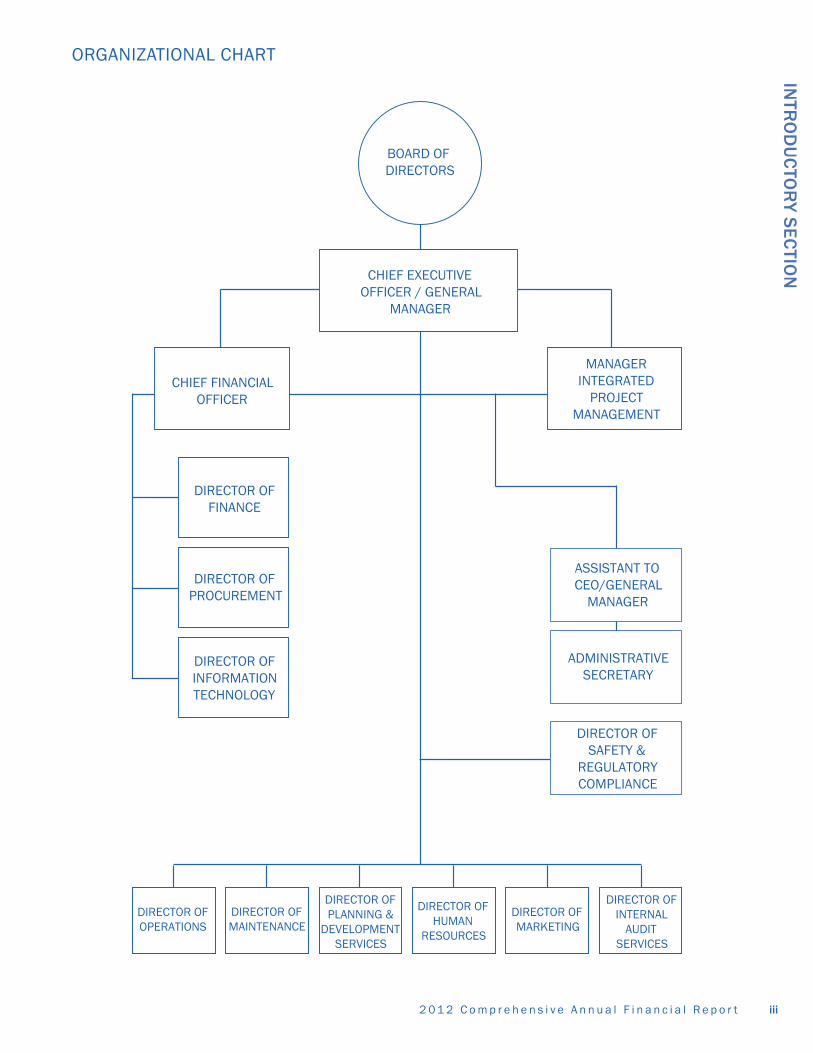
BOARD OF DIRECTORS
CHIEF EXECUTIVEOFFICER / GENERAL
MANAGER
MANAGERINTEGRATED
PROJECTMANAGEMENT
ASSISTANT TOCEO/GENERAL
MANAGER
CHIEF FINANCIALOFFICER
DIRECTOR OFFINANCE
DIRECTOR OFPROCUREMENT
DIRECTOR OFINFORMATIONTECHNOLOGY
ADMINISTRATIVESECRETARY
DIRECTOR OFSAFETY &
REGULATORYCOMPLIANCE
DIRECTOR OFOPERATIONS
DIRECTOR OFMAINTENANCE
DIRECTOR OFPLANNING &
DEVELOPMENTSERVICES
DIRECTOR OFMARKETING
DIRECTOR OFINTERNAL
AUDIT SERVICES
DIRECTOR OFHUMAN
RESOURCES
ORGANIZATIONAL CHART
2 0 1 2 C o m p r e h e n s i v e A n n u a l F i n a n c i a l R e p o r t
INTR
OD
UC
TOR
Y S
ECTI
ON
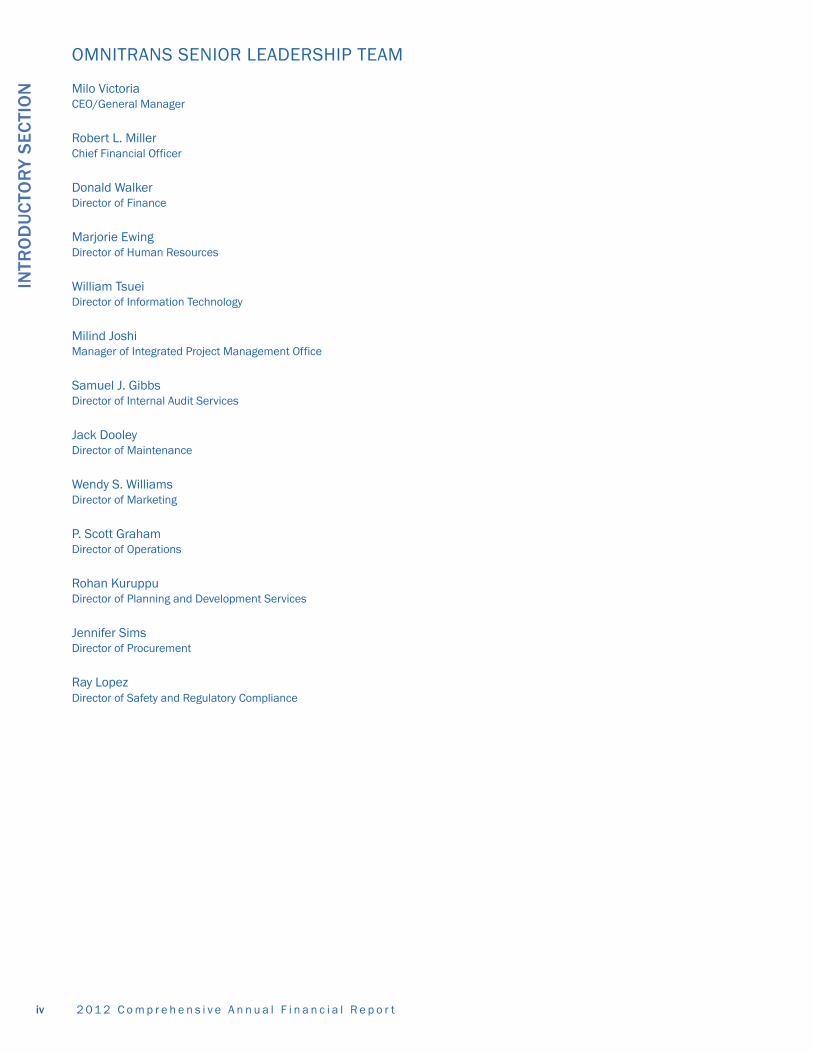
OMNITRANS SENIOR LEADERSHIP TEAM
Milo VictoriaCEO/General Manager
Robert L. MillerChief Financial Officer
Donald WalkerDirector of Finance
Marjorie EwingDirector of Human Resources
William TsueiDirector of Information Technology
Milind JoshiManager of Integrated Project Management Office
Samuel J. GibbsDirector of Internal Audit Services
Jack DooleyDirector of Maintenance
Wendy S. WilliamsDirector of Marketing
P. Scott GrahamDirector of Operations
Rohan KuruppuDirector of Planning and Development Services
Jennifer SimsDirector of Procurement
Ray LopezDirector of Safety and Regulatory Compliance
iv

v2 0 1 2 C o m p r e h e n s i v e A n n u a l F i n a n c i a l R e p o r t
INTR
OD
UC
TOR
Y SEC
TION
OMNITRANS BOARD OF DIRECTORS
ChairDick Riddell- Yucaipa -
SupervisorGary Ovitt- County -
SupervisorBrad Mitzelfelt
- County -
SupervisorNeil Derry- County -
SupervisorJosie Gonzales
- County -
SupervisorJanice Rutherford
- County -
Dennis Yates- Chino -
Vice ChairAlan D. Wapner
- Ontario -

2 0 1 2 C o m p r e h e n s i v e A n n u a l F i n a n c i a l R e p o r tvi
INTR
OD
UC
TOR
Y S
ECTI
ON
Ed Graham- Chino Hills -
Frank Gonzales- Colton -
John B. Roberts, Jr- Fontana -
Lee Ann Garcia- Grand Terrace -
Ron Dailey- Loma Linda -
Paul Eaton- Montclair -
Penny Liburn- Highland -
Sam Spagnolo- Rancho Cucamonga -
Paul Foster- Redlands -
Edward M. Palmer- Rialto -
Pat Morris- San Bernardino -
Ray Musser- Upland -
vii2 0 1 2 C o m p r e h e n s i v e A n n u a l F i n a n c i a l R e p o r t
INTR
OD
UC
TOR
Y SEC
TION
viii 2 0 1 2 C o m p r e h e n s i v e A n n u a l F i n a n c i a l R e p o r t
INTR
OD
UC
TOR
Y S
ECTI
ON PROFILE OF OMNITRANS
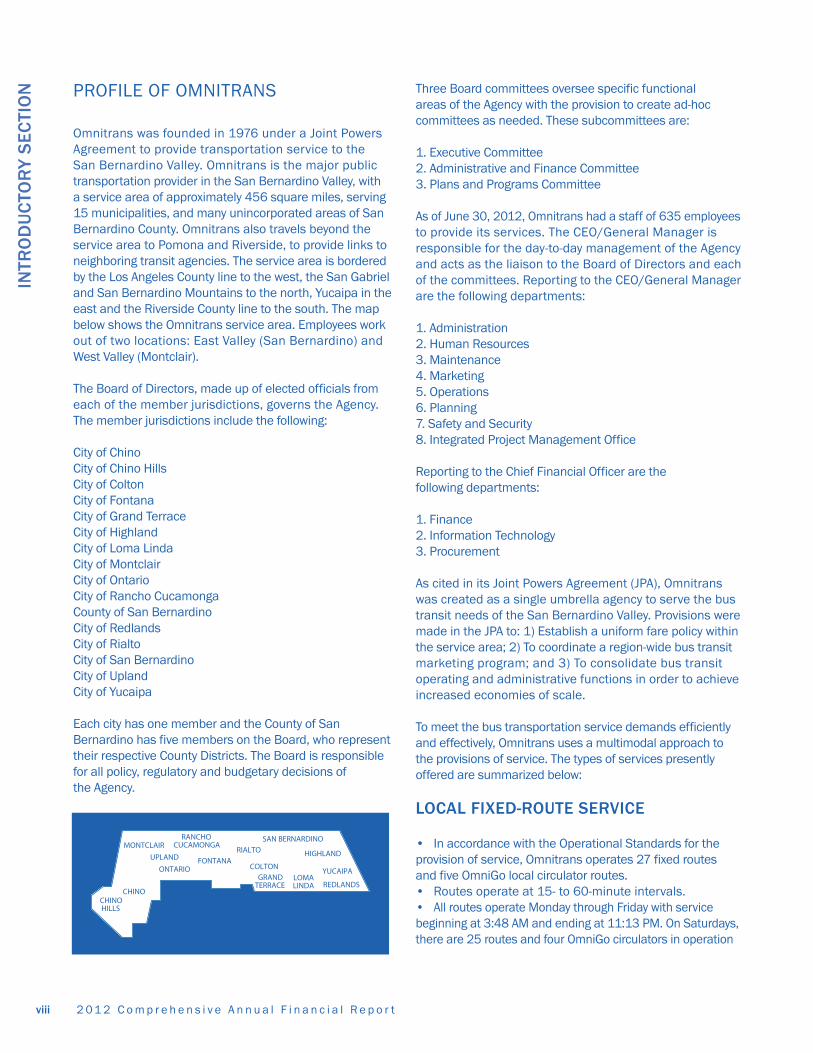
Omnitrans was founded in 1976 under a Joint Powers Agreement to provide transportation service to the San Bernardino Valley. Omnitrans is the major public transportation provider in the San Bernardino Valley, with a service area of approximately 456 square miles, serving 15 municipalities, and many unincorporated areas of SanBernardino County. Omnitrans also travels beyond the service area to Pomona and Riverside, to provide links toneighboring transit agencies. The service area is borderedby the Los Angeles County line to the west, the San Gabrieland San Bernardino Mountains to the north, Yucaipa in theeast and the Riverside County line to the south. The mapbelow shows the Omnitrans service area. Employees workout of two locations: East Valley (San Bernardino) and West Valley (Montclair).
The Board of Directors, made up of elected officials fromeach of the member jurisdictions, governs the Agency. The member jurisdictions include the following:
City of ChinoCity of Chino HillsCity of ColtonCity of FontanaCity of Grand TerraceCity of HighlandCity of Loma LindaCity of MontclairCity of OntarioCity of Rancho CucamongaCounty of San BernardinoCity of RedlandsCity of RialtoCity of San BernardinoCity of UplandCity of Yucaipa
Each city has one member and the County of San Bernardino has five members on the Board, who representtheir respective County Districts. The Board is responsiblefor all policy, regulatory and budgetary decisions of the Agency.
Three Board committees oversee specific functional areas of the Agency with the provision to create ad-hoc committees as needed. These subcommittees are:
1. Executive Committee2. Administrative and Finance Committee3. Plans and Programs Committee
As of June 30, 2012, Omnitrans had a staff of 635 employeesto provide its services. The CEO/General Manager is responsible for the day-to-day management of the Agencyand acts as the liaison to the Board of Directors and eachof the committees. Reporting to the CEO/General Managerare the following departments:
1. Administration2. Human Resources3. Maintenance4. Marketing5. Operations6. Planning7. Safety and Security8. Integrated Project Management Office
Reporting to the Chief Financial Officer are the following departments:
1. Finance2. Information Technology3. Procurement
As cited in its Joint Powers Agreement (JPA), Omnitranswas created as a single umbrella agency to serve the bustransit needs of the San Bernardino Valley. Provisions weremade in the JPA to: 1) Establish a uniform fare policy withinthe service area; 2) To coordinate a region-wide bus transitmarketing program; and 3) To consolidate bus transit operating and administrative functions in order to achieveincreased economies of scale.
To meet the bus transportation service demands efficientlyand effectively, Omnitrans uses a multimodal approach tothe provisions of service. The types of services presently offered are summarized below:
LOCAL FIXED-ROUTE SERVICE
• In accordance with the Operational Standards for theprovision of service, Omnitrans operates 27 fixed routes and five OmniGo local circulator routes.• Routes operate at 15- to 60-minute intervals.• All routes operate Monday through Friday with service beginning at 3:48 AM and ending at 11:13 PM. On Saturdays,there are 25 routes and four OmniGo circulators in operation
MONTCLAIR
CHINOCHINOHILLS
UPLAND
ONTARIO
RANCHOCUCAMONGA
RIALTO
GRANDTERRACE
LOMALINDA REDLANDS
YUCAIPA
HIGHLANDFONTANA
SAN BERNARDINO
COLTON
ix 2 0 1 2 C o m p r e h e n s i v e A n n u a l F i n a n c i a l R e p o r t
INTR
OD
UC
TOR
Y SEC
TION
with service beginning at 5:13 AM and ending at 10:16 PM.On Sundays, there are 23 routes and four OmniGo circulatorsin service, which begin at 5:52 AM and end at 7:54 PM.• Coordinated local fixed-route service with Orange CountyTransit Authority, Foothill Transit, Los Angeles County Metropolitan Transportation Authority (limited), RiversideTransit Agency, and Mountain Area Regional Transit Authority;operated under Cooperative and/or Joint Service Agreementsbetween Omnitrans and neighboring transit operators.
OMNIGO CIRCULATOR SERVICE
• OmniGo is a new fixed-route community circulator servicethat operates in the cities of Chino Hills, Grand Terrace and Yucaipa.• Implemented in September of 2010, it connects pointsof interest within each city and provides connectivity toOmnitrans fixed-route bus services.• All OmniGo services are contracted out by Omnitrans andoperated by a private contractor. • The vehicles used are the 16-passenger cutaway vehicles similar to those used by OmniLink and Access;this ensures that the service can both navigate the narrowresidential streets and serve the residents of the city morecost-effectively.• OmniGo routes operate all week long with the followingspans: for Yucaipa Routes 308 and 309, Weekdays: 6:11 AMto 8:55 PM, Saturdays: 7:00 AM to 8:25 PM, Sundays: 7:30AM to 6:39 PM; for Yucaipa Route 310, Weekdays: 6:00 AMto 7:52 PM; for Grand Terrace Route 325, Weekdays: 5:17AM to 8:19 PM, Saturdays: 7:17 AM to 6:14 PM, Sundays:8:27 AM to 6:14 PM; for Chino Hills Route 365, Weekdays:5:05 AM to 10:00 PM, Saturdays: 6:05 AM to 7:00 PM, andSundays: 6:05 AM to 6:00 PM.• OmniGo fares are the same as those for other Omnitransfixed-route bus services.
REGIONAL FIXED-ROUTE SERVICE
• Route 215 is a cross-county service provided by Omnitrans. This route provides service between the Omnitrans 4th Street Transit Mall and Riverside TransitAgency’s Downtown Terminal.• This route operates on 20-/30-minute and 60-minute frequencies.
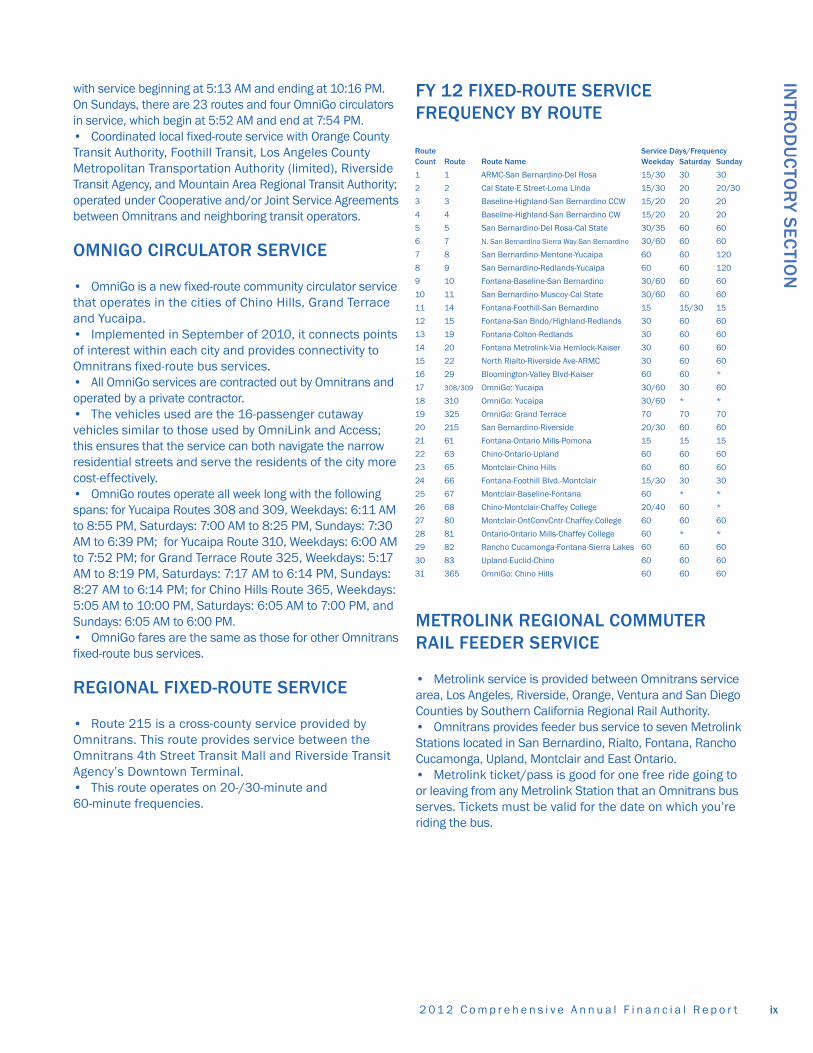
FY 12 FIXED-ROUTE SERVICEFREQUENCY BY ROUTE
METROLINK REGIONAL COMMUTER RAIL FEEDER SERVICE
• Metrolink service is provided between Omnitrans servicearea, Los Angeles, Riverside, Orange, Ventura and San DiegoCounties by Southern California Regional Rail Authority.• Omnitrans provides feeder bus service to seven MetrolinkStations located in San Bernardino, Rialto, Fontana, RanchoCucamonga, Upland, Montclair and East Ontario.• Metrolink ticket/pass is good for one free ride going to or leaving from any Metrolink Station that an Omnitrans busserves. Tickets must be valid for the date on which you’reriding the bus.
Route Service Days/Frequency Count Route Route Name Weekday Saturday Sunday
1 1 ARMC-San Bernardino-Del Rosa 15/30 30 30
2 2 Cal State-E Street-Loma Linda 15/30 20 20/30
3 3 Baseline-Highland-San Bernardino CCW 15/20 20 20
4 4 Baseline-Highland-San Bernardino CW 15/20 20 20
5 5 San Bernardino-Del Rosa-Cal State 30/35 60 60
6 7 N. San Bernardino-Sierra Way-San Bernardino 30/60 60 60
7 8 San Bernardino-Mentone-Yucaipa 60 60 120
8 9 San Bernardino-Redlands-Yucaipa 60 60 120
9 10 Fontana-Baseline-San Bernardino 30/60 60 60
10 11 San Bernardino-Muscoy-Cal State 30/60 60 60
11 14 Fontana-Foothill-San Bernardino 15 15/30 15
12 15 Fontana-San Bndo/Highland-Redlands 30 60 60
13 19 Fontana-Colton-Redlands 30 60 60
14 20 Fontana Metrolink-Via Hemlock-Kaiser 30 60 60
15 22 North Rialto-Riverside Ave-ARMC 30 60 60
16 29 Bloomington-Valley Blvd-Kaiser 60 60 *
17 308/309 OmniGo: Yucaipa 30/60 30 60
18 310 OmniGo: Yucaipa 30/60 * *
19 325 OmniGo: Grand Terrace 70 70 70
20 215 San Bernardino-Riverside 20/30 60 60
21 61 Fontana-Ontario Mills-Pomona 15 15 15
22 63 Chino-Ontario-Upland 60 60 60
23 65 Montclair-Chino Hills 60 60 60
24 66 Fontana-Foothill Blvd.-Montclair 15/30 30 30
25 67 Montclair-Baseline-Fontana 60 * *
26 68 Chino-Montclair-Chaffey College 20/40 60 *
27 80 Montclair-OntConvCntr-Chaffey College 60 60 60
28 81 Ontario-Ontario Mills-Chaffey College 60 * *
29 82 Rancho Cucamonga-Fontana-Sierra Lakes 60 60 60
30 83 Upland-Euclid-Chino 60 60 60
31 365 OmniGo: Chino Hills 60 60 60
x 2 0 1 2 C o m p r e h e n s i v e A n n u a l F i n a n c i a l R e p o r t
INTR
OD
UC
TOR
Y S
ECTI
ON ACCESS
• In accordance with the Americans with Disabilities Act(ADA), Omnitrans provides wheelchair-lift-equipped vansfor curb-to-curb transportation services.• Reservations for service must be made one day in advance of your travel needs, with the option to call up to seven days in advance.• Access operates during the same days and hours as fixed route buses within a ¾-mile range of routes. • Who can ride Access? – Those persons with an Omnitrans(or other transit agency) ADA certification ID card. Personswith an Omnitrans Disability card. Personal Care Attendantsproviding personal care to an ADA certified rider. Companions(Adult accompanying person with a disability) and/or Childrenof a qualified Adult ADA certified rider. (Maximum of two children 46” tall and under may ride free. Children underage 6 and/or under 60 pounds must travel in a rider-supplied, child-restraint device).
OMNILINK
• Omnilink is a general public demand response van servicein the cities of Chino Hills and Yucaipa.• Reservations can be made for same-day service on aspace-available basis. Reservations can also be made upto three days in advance.• Operates 7:00 AM to 6:00 PM, Monday through Friday.• Omnilink is available to the general public on a first-come, first-service basis.
LOCAL ECONOMY
The leading industries in San Bernardino County are government, retail and service industries. Light manufacturing and warehouses dominate portions of the County, particularly near California State Universityand San Bernardino International Airport. Omnitrans operates within the greater San Bernardino-RiversideCounty, commonly referred to as the Inland Empire (IE).
San Bernardino-Riverside County residents can expect to see some growth in the area according to a recently released economic forecast. The forecast was authored by Beacon Economics and released in partnership withthe University of California, Riverside’s School of Business Administration. It will be several years before the IE experiences a return to peak employment levels, but employment is a lagging indicator, and the leading indicators show signs of continued growth, according to the report. The report’s key findings include:
• The economic recovery in Inland Southern California hasbeen slow, but the recovery is moving in the right directionand the region has made significant progress.
• The San Bernardino-Riverside metropolitan area hasadded 30,800 new jobs to its employment base since hitting bottom at the end of 2009, which is a slower rate of growth than seen in the state overall, but represents a recovery nonetheless.• The second quarter of 2012 marked the 12th consecutivequarter of rising taxable sales in Inland Southern California.• The region’s hotels and restaurants are starting to thriveagain, and sales tax receipts at restaurants and hotels acrossSan Bernardino-Riverside are up by nearly nine percent on ayear-to-date basis. This is the third fasted rate of growth byspending category.• Inland areas are pulling ahead of the pack in homeprices and new residential and non-residential construction.Rising employment, affordability and low interest rates are all helping to increase activity in the local economy,with 2013 expected to be even better.
Other advantages of the region include newer facilities at lower lease rates than competing markets, superior transportation infrastructure, and access to a market of 23million people within three hours of driving. Significant speculative industrial construction activity has returned to the region, and with trade volumes expected to increase, theeconomic outlook for San Bernardino County continues to be optimistic.
The crowded coastal areas and resistance to densificationsignifies the IE as the final frontier for Southern California.Dissected by passes and freeways, San Bernardino Countypatiently waits on economic recovery to position itself as theintermodal logistics hub of Southern California. Inexpensiveland prices (compared to Los Angeles and Orange Counties),a large supply of vacant land, and a transport networkwhere many highways and railroads intersect have madethe San Bernardino County a major shipping hub. Some ofthe nation's largest manufacturing companies continue tochoose the County for their distribution facilities. The regionserves as a critical link in the global supply chain for manyinternational businesses. It is also the best location forcompanies looking for a regional distribution hub to servethe southwestern U.S.
LONG-TERM FINANCIAL PLANNING
Omnitrans continually plans for both the short-term and the long-term. The short-term planning rarely looks furtherahead than the 12 months in the fiscal year. It seeks to ensure that the Agency has enough cash to pay its bills. In the long-term planning, the planning horizon is typically 2 to 5 years. The long-term financial planning focuses onthe Agency’s long-term goals and the funding that must be secured prior to project implementation.
Like many medium-size public transit agencies, Omnitrans’approach to long-term financial planning is very conservative.
xi2 0 1 2 C o m p r e h e n s i v e A n n u a l F i n a n c i a l R e p o r t
INTR
OD
UC
TOR
Y SEC
TION
The focus is centered on sustainability of current operationsand the availability of federal, state and local funding opportunities. Primarily all major capital projects are not implemented until the necessary funding has been dedicated and secured. Omnitrans does not issue debt of any kind to secure funding for its capital projects.
Under the direction of the Chief Financial Officer, the FinanceDepartment administers the financial affairs of Omnitrans.The department manages revenues, expenditures, investments, cash management, accounting, grants andbudgeting. The Finance Department is responsible for keepingabreast of current federal, state and local grant funding opportunities to support the operations and long-term capitalinvestment goals of Omnitrans.
There are two types of federal grant programs. Formulagrant programs are funded to States based on formulas of population. Discretionary grant programs are awardedbased on meeting application requirements and selectedbased on selected criteria specific to each. Each grant program is referred to by name and most also by a numberthat correlates to the section number of Title 49 of the UnitedStates Code.
In collaboration with the other departments, the FinanceDepartment recently submitted discretionary grant applications and was awarded the following:
• 8.3 million – 5309 Bus and Bus Facilities (San Bernardino Transcenter)
• $5.0 million – 5309 Bus and Bus Facilities (Fixed-Route Vehicle Replacement)
• $1.1 million – 5310 Transportation for Elderly Persons and Persons with Disabilities (Access Van Replacement)
• $850 thousand – 5339 Alternatives Analysis (Holt Boulevard Alternative Analysis)
There are several capital projects for which funding hasbeen secured that are currently in progress with completiondates in the near future. The Agency’s main focus is centeredon sustainability of current operations and on the challengesand opportunities associated with the following:
• San Bernardino Express (sbX) E Street Corridor Bus Rapid Transit (BRT) Project
• East Valley Maintenance Facility Remodel Project • Intermodal Transit Station (Transcenter) Project• Rolling Stock Replacement Project
The sbX route is 15.7 miles along the E Street corridor. With16 stations, sbX stops at the major activity centers wherewe live, work, shop, learn and play. The current route features5.4 miles of exclusive lanes, separated from normal traffic.
The remaining 10.3 miles of the route will be in mixed traffic, with transit priority signals at key intersections.
The East Valley Maintenance Facility Remodel Project is theremodeling of the current facility to accommodate and servicethe buses that will be used in providing the sbX service. ThesbX buses are 60-foot articulated buses that will requiremodification and replacement of facility and shop equipment.
The Transcenter is the transfer point for bus routes servingthe downtown area, with future connections to the sbX BRTsystem, proposed downtown San Bernardino Passenger RailProject, which is a one-mile Metrolink extension from theSanta Fe Depot, and the proposed Redlands Passenger RailProject with stops on route to the University of Redlands.
The Rolling Stock Replacement Project is the Agency’s ongoing bus replacement program to maintain the servicereliability of its fleet and maintaining capital assets in a State of Good Repair (SGR) as required by the FederalTransit Administration (FTA). This is essential if publictransportation systems are to provide safe and reliableservice to its customers.
RELEVANT FINANCIAL POLICIES
Omnitrans is required by its Board of Directors to develop abalanced annual operating and capital expenditure budgetwithin the prescribed limits to meet the objectives of the subsequent fiscal year. The annual operating and capitalbudgets show in detail the estimated revenues and expensesnecessary to operate Omnitrans’ service for the upcomingyear. The annual budget serves as the foundation for Omnitrans financial planning and control of expenditures.
California Government Code, Section 53646, requires thateach legislative body review and adopt an Investment PolicyStatement on an annual basis. It is the policy of Omnitransto invest public funds in a manner which will provide maximum security with the highest investment returnwhile meeting the daily cash flow demands of the Agencyand conforming to all state and local statutes governingthe investment of public funds.
The investment policy applies to the cash funds of theAgency, except for its employees’ retirement system fund,which is administered separately by the California Public Employees’ Retirement System (PERS) and the 457 Deferred Compensation Fund, administered separatelyby the International City/County Management AssociationRetirement Corporation.
Omnitrans initially implemented a Forward Fuel Purchasingpolicy, which is an amended agreement with a liquefiednatural gas (LNG) supplier to fix the price of up to 60%
2 0 1 2 C o m p r e h e n s i v e A n n u a l F i n a n c i a l R e p o r t
INTR
OD
UC
TOR
Y S
ECTI
ON of Omnitrans’ LNG requirements or 180,000 gallons per
month. The agreement expired on January 31, 2012. A newhedge was established on January 17, 2012; fixing the priceof 150,000 gallons of fuel per month for Omnitrans beginning in February 2012 through June 2014. The ChiefFinancial Officer acts as the Trade Officer in the agreement.
MAJOR INITIATIVES
On the federal level, the Federal Transit Administration (FTA)sponsors an array of initiatives and programs to support research, coordination and development of public transportation. Some of the FTA initiatives and programsthat are of particular interest to Omnitrans include:
• Moving Ahead for Progress in the 21st Century Act (MAP-21) - The new two-year surface transportation authority that provides FTA an authorization level of $10.6 billion in FY 2013 and $10.7 billion in FY 2014. MAP-21 consolidates certain transit programsto improve their efficiency and provides significant funding increases specifically for improving the state of good repair of the nation’s transit systems. The law grants FTA authority to strengthen the safety of public transportation systems throughout the United States. It also streamlines the New Start process to expedite project delivery and provides forcore capacity project eligibility. MAP-21 took effect on October 1, 2012.
• State of Good Repair (SGR) - State of Good Repair includes sharing ideas on recapitalization and maintenance issues, asset management practices, and innovative financing strategies. It also includes issues related to measuring the condition of transit capital assets, prioritizing local transit re-investmentdecisions and preventive maintenance practices. Finally, research and the identification of the tools needed to address this problem are vital. The FTA will lead the nation's effort to address the State of Good Repair by collaborating with the industry to bring the nation's transit infrastructure into the 21st century.
• Job Access and Reverse Commute (JARC) - The Job Access and Reverse Commute (JARC) program addresses the unique transportation challenges faced by welfare recipients and low-income persons seeking to obtain and maintain employment. Many
new entry-level jobs are located in suburban areas, and low-income individuals have difficulty accessingthese jobs from their inner city, urban or rural neighborhoods. In addition, many entry-level jobs require working late at night or on weekends when conventional transit services are either reduced or non-existent. Finally, many employment-related tripsare complex and involve multiple destinations, including reaching childcare facilities or other services.
• New Freedom - The New Freedom formula grant program aims to provide additional tools to overcomeexisting barriers facing Americans with disabilities seeking integration into the workforce and full participation in society. Lack of adequate transportation is a primary barrier to work for individuals with disabilities. The 2000 Census showed that only 60 percent of people between the ages of 16 and 64 with disabilities are employed. The New Freedom formula grant program seeks to reduce barriers to transportation services and expandthe transportation mobility options available to peoplewith disabilities beyond the requirements of the Americans with Disabilities Act (ADA) of 1990.
• United We Ride - A federal interagency initiative aimed at improving the availability, quality and efficient delivery of transportation services for olderadults, people with disabilities and individuals with lower incomes.
• Livable and Sustainable Communities - Enhancing economic and social well-being of all Americans by creating and maintaining a safe, reliable integrated and accessible transportation network that enhanceschoices for transportation users, provides easy access to employment opportunities and other destinations, and promotes positive effects on the surrounding community.
Each year the federal government funds numerous publictransit initiatives through an array of programs. Althoughthe need for federal money to fund these initiatives hascontinued to grow, the federal budget increasingly hasbeen strained by other competing funding priorities. Tohelp finance major projects and achieve program goals,Omnitrans systematically “leverages” FTA funds with otherstate and local resources. An integral part of Omnitrans’long-term strategy of sustainability is leveraging federalfunding whenever possible.
xii

xiii2 0 1 2 C o m p r e h e n s i v e A n n u a l F i n a n c i a l R e p o r t
INTR
OD
UC
TOR
Y SEC
TION
AWARDS AND ACKNOWLEDGEMENTS
The Government Finance Officers Association (GFOA)awarded a Certificate of Achievement for Excellence in Financial Reporting to Omnitrans for its Comprehensive Annual Financial Report (CAFR) for the fiscal year ended June 30, 2011. The Certificate of Achievement is a prestigiousnational award, recognizing conformance with the higheststandards for preparation of a state or local governmentfinancial report. This was the ninth time Omnitrans has received this award. In order to be awarded a Certificate ofAchievement, a government unit must publish an easilyreadable and efficiently organized CAFR. This report mustsatisfy both GAAP and applicable legal requirements.
A Certificate of Achievement is valid for a period of one yearonly. We believe that our current CAFR continues to meetthe Certificate of Achievement Program’s requirements and we are submitting it to the GFOA to determine its eligibility for another certificate.
Omnitrans was honored with the California Challenge Awardin May 2012. The award, which is patterned on the nationalMalcolm Baldrige Award, is one of the highest honors an organization can achieve in the state of California. Evaluationcriteria are based on seven categories: leadership, strategicplanning, workforce focus, customer focus, measurement,analysis and knowledge management, and outcome focus.
Omnitrans’ Marketing Department received multiple awardsin the American Public Transportation Association (APTA) annual “AdWheel” competition for advertising campaign elements submitted in fiscal year 2012. Capturing first-placeawards were the Omnitrans blog, Go Smart college pass program digital ads and the agency’s “Dump the Pump Day”newspaper ad, radio commercial and interior bus cards.
Additionally, the Go Smart digital ad received the grand prizefrom among all first-place winners in the electronic mediacategory. The annual AdWheel Awards competition honorsAPTA member organizations for excellence in advertising,marketing, promotion and communications. Each year, APTAmembers submit their very best advertising, marketing, promotion, and communications materials in the mediacategories of print, electronic, campaigns and special eventsto the AdWheel Awards competition.
Preparation of this report could not have been accomplishedwithout the professional, efficient, and dedicated services of the Finance Department staff, with special thanks to MaeSung, Accounting Manager and Maurice Mansion, TreasuryManager. We wish also to express our appreciation to MiloVictoria, our CEO/General Manager; Wendy Williams, Directorof Marketing; and Rohan Kuruppu, Director of Planningand Development Services for their assistance and supportof this report. We would also like to express our appreciation to the Board of Directors and members of the Administrativeand Finance Committee. Finally, we acknowledge that this report could not have been completed without the partnershipand professional oversight of Mayer Hoffman McCann, P.C.
Respectfully submitted,
Robert L. MIllerChief Financial Officer, OMNITRANS

THIS PAGE LEFT BLANK INTENTIONALLY
CONNECTING COMMUNITYOUR
FINA
NC
IAL S
ECTIO
N

CONNECTING COMMUNITYOUR
FIN
AN
CIA
L S
ECTI
ON
12 0 1 2 C o m p r e h e n s i v e A n n u a l F i n a n c i a l R e p o r t
Board of DirectorsOmnitransSan Bernardino, California
INDEPENDENT AUDITORS’ REPORT
We have audited the accompanying basic financial statements of Omnitrans as of and for the year endedJune 30, 2012, as listed in the table of contents. These financial statements are the responsibility of themanagement of Omnitrans. Our responsibility is to express an opinion on these financial statementsbased on our audit. The prior year partial comparative information has been derived from the financialstatements of Omnitrans for the year ended June 30, 2011 and, in our report dated October 31, 2011,we expressed an unqualified opinion on those financial statements.
We conducted our audit in accordance with auditing standards generally accepted in the United Statesof America and the standards applicable to financial audits contained in Government Auditing Standards,issued by the Comptroller General of the United States. Those standards require that we plan and perform the audit to obtain reasonable assurance about whether the financial statements are free ofmaterial misstatement. An audit includes examining, on a test basis, evidence supporting the amountsand disclosures in the financial statements. An audit also includes assessing the accounting principlesused and significant estimates made by management, as well as evaluating the overall financial statement presentation. We believe that our audit provides a reasonable basis for our opinion.
In our opinion, the financial statements referred to above present fairly, in all material respects, thefinancial position of Omnitrans on June 30, 2012, and the respective changes in financial positionand cash flows of Omnitrans for the year then ended, in conformity with accounting principles generallyaccepted in the United States of America.
As described further in note 1 to the financial statements, the accompanying financial statements reflect certain changes for reporting deferred outflows of resources, deferred inflows of resources andnet position in a statement of financial position and related disclosures due to the implementation ofGovernmental Accounting Standards Board Statement No. 63.
Accounting principles generally accepted in the United States of America require that management’sdiscussion and analysis be presented to supplement the basic financial statements. Such information,although not a part of the basic financial statements, is required by the Governmental AccountingStandards Board who considers it to be an essential part of the financial reporting for placing thebasic financial statements in an appropriate operational, economic or historical context. We have applied certain limited procedures to the required supplementary information in accordance with auditing standards generally accepted in the United States of America, which consisted of inquiries of management regarding the methods of preparing the information and comparing the information
FINA
NC
IAL S
ECTIO
N
continued on next page
2 0 1 2 C o m p r e h e n s i v e A n n u a l F i n a n c i a l R e p o r t
Board of DirectorsOmnitransSan Bernardino, California
for consistency with management’s responses to our inquiries, the basic financial statements, andother knowledge we obtained during our audit of the basic financial statements. We do not expressan opinion or provide any assurance on the information because the limited procedures do not provideus with sufficient evidence to express an opinion or provide any assurance.
Our audit was conducted for the purpose of forming opinions on the basic financial statements thatcollectively comprise Omnitrans’ basic financial statements. The introductory section and statisticaltables are presented for purposes of additional analysis and are not a required part of the basic financial statements. Such information has not been subjected to the auditing procedures appliedin the audit of the basic financial statements and, accordingly, we express no opinion or provide anyassurance on it.
In accordance with Government Auditing Standards, we have also issued our report dated October31, 2012 on our consideration of Omnitrans’ internal control over financial reporting and our testsof its compliance with certain provisions of laws, regulations, contracts, grant agreements and othermatters. The purpose of that report is to describe the scope of our testing of internal control over financial reporting and compliance and the results of that testing, and not to provide an opinion onthe internal control over the financial reporting or on compliance. That report is an integral part of an audit performed in accordance with Government Auditing Standards and should be considered in assessing the results of our audit.
Irvine, CaliforniaOctober 31, 2012
2
FIN
AN
CIA
L S
ECTI
ON

32 0 1 2 C o m p r e h e n s i v e A n n u a l F i n a n c i a l R e p o r t
MANAGEMENT’S DISCUSSION AND ANALYSIS
As management of Omnitrans (the Agency), we offer the readers of the Agency’s financial statements this narrativeoverview and analysis of the financial activities for the Agency for the fiscal year ended June 30, 2012.
We encourage readers to consider the information presented here in conjunction with additional information that wehave furnished in the transmittal letter and financial statements, which are included in this report.
FINANCIAL HIGHLIGHTS
• At the end of fiscal year 2012, the Statement of Net Position presents total assets of $176.9 million and total liabilities and deferred inflow of resources of $32.2 million and $55.3 thousand respectively. Total assets increased 9.9 percent over the previous fiscal year, resulting largely from increases in construction in progress that consists mainly of the E Street Bus Rapid Transit (sbX) project.
• Total liabilities at fiscal year ended June 30, 2012 was $32.2 million, up $5.3 million or 20.1 percent over previous fiscal year end. Accounts payable increases of $6.0 million, attributed to the accrual of goods and services received but not yet paid, was offset by reductions in unearned revenues of $2.4 million. Noncurrent liabilities increased $1.8 million or 24.2 percent due to lease financing arrangements for support vehicles, office equipment, and the estimated outstanding losses highlighted in the actuarial study of the self-insured workers compensation andliability programs as of June 30, 2012.
• As a result of General Accounting Standards Board (GASB) 53, $55.3 thousand of accumulated increase in fair value of hedging derivatives is presented on the Statement of Net Position at fiscal year ended June 30, 2012.
• Operating revenues at fiscal year ended June 30, 2012 of $15.4 million decreased $107.1 thousand or 0.7 percent compared to last fiscal year end. Operating expense, excluding depreciation, at fiscal year end June 30, 2012 increased $2.7 million or 4.0 percent compared to last fiscal year end.
• Non-operating revenues, which include federal and local operating grants and pass-through to other agencies, increased by $13.8 million or 41.4 percent. The majority of this increase is attributed to the return of $16.0 million (collected in prior years) in Local Transportation Funds (LTF) to San Bernardino Associated Governments (SANBAG) in the previous fiscal year.
• At fiscal year end June 30, 2012, capital assistance of $34.4 million increased $13.4 million or 63.7 percent compared to the previous fiscal year. This increase is due to increased activity on the sbX project, the major capital project of Omnitrans.
OVERVIEW OF THE FINANCIAL STATEMENTS
This annual financial report consists of two parts: Management’s Discussion and Analysis and the basic financial statements,including notes to the financial statements. The Agency financial statements offer key, high-level financial information aboutthe Agency’s activities.
The Agency is a government-funded entity that follows enterprise-fund accounting and presents its financial statement onthe accrual basis of accounting. The enterprise-fund concept is similar to how private business enterprises are financedand operated.
FINA
NC
IAL S
ECTIO
N
2 0 1 2 C o m p r e h e n s i v e A n n u a l F i n a n c i a l R e p o r t
MANAGEMENT’S DISCUSSION AND ANALYSIS (CONTINUED)
The statements of net position include information on all of the Agency’s assets and liabilities with the difference betweenassets and liabilities reported as net position. Changes in net position may serve as a useful indicator of whether thefinancial position of the Agency is improving or deteriorating.
The statement of revenues, expenses and change in net position present information regarding how the Agency net positionchanged during the fiscal years ended June 30, 2012 and 2011. All changes in net position are reported as soon as the underlying event giving rise to the change occurs, and amounts are measurable, regardless of the timing of related cash flows.
FINANCIAL STATEMENTS ANALYSIS
The following tables summarize revenues, expenses and changes in net position comparing fiscal year 2012 with fiscalyear 2011. For additional information regarding the Agencies’ financial activities for fiscal year ended June 30, 2012, readersare encourage to read this section in conjunction with the accompanying Notes to the Basic Financial Statements.
REVENUES AND EXPENSES
REVENUES
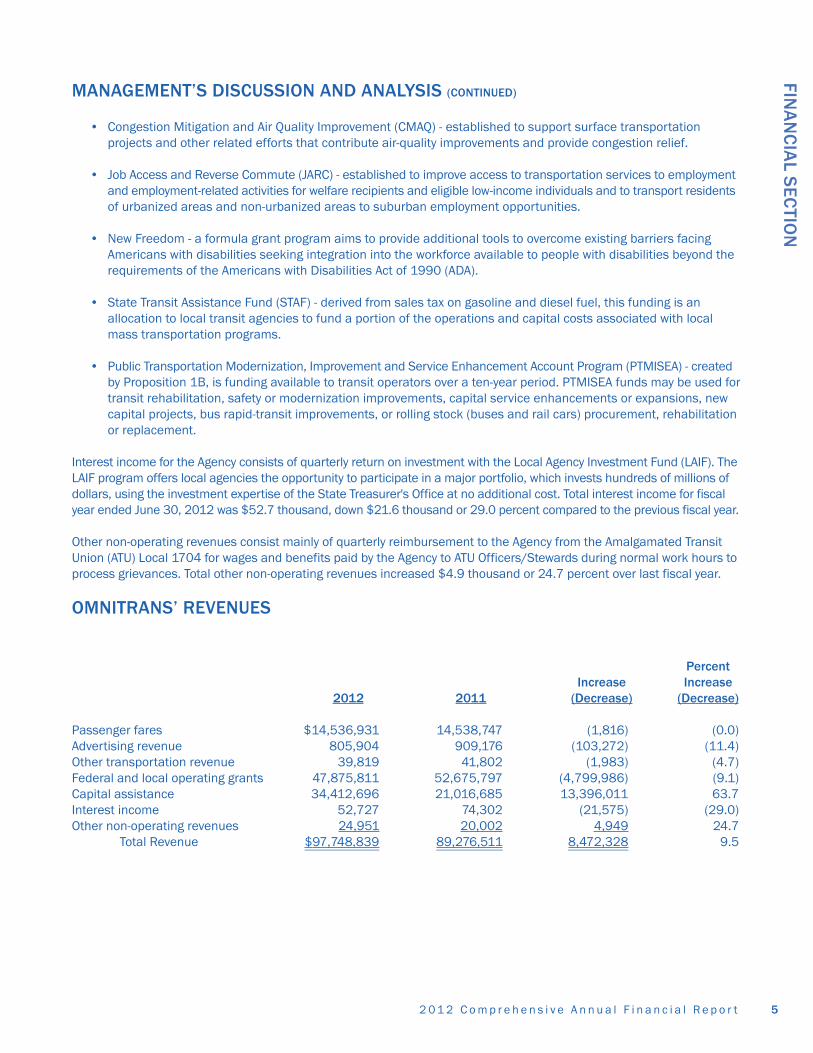
Omnitrans’ total revenues for fiscal year ending June 30, 2012 show an increase of $8.5 million or 9.5 percent compared tothe last fiscal year. Revenue from fares, pass and ticket sales less discount to pass sale vendors was $1.8 thousand less thanthe previous fiscal year. Reduction in advertising revenues account for the majority of the decrease in total operating revenues.Advertising revenue decreased $103.3 thousand or 11.4 percent compared to the previous fiscal year. Other transportationrevenues account for less than 0.3 percent of total operating revenues decreased $2.0 thousand or 4.7 percent.
Federal and local operating grants for Omnitrans decreased from $52.7 million in fiscal year 2011 to $47.9 million infiscal year 2012. This represents a $4.8 million or 9.5 percent reduction in revenues. Omnitrans receive federal, stateand local funding, which is utilized for both operating and capital expenditures.
The slow economy continues to affect the rate of return on the Agency’s investment with Local Agency Investment Fund(LAIF). The Agency’s interest income from LAIF decreased $21.6 thousand or 29.0 percent compared to the previousfiscal year. LAIF’s interest rate on investment remains under one percent.
Financing the construction, operation and maintenance of public transportation systems involves many different types offunding sources, including federal and non-federal grants, and other revenue sources. Omnitrans received $47.9 million infederal and local operating grants and $34.4 million in capital assistance for fiscal year ended June 30, 2012. Compared tolast fiscal year, federal and local operating grants decreased $4.8 million or 9.1 percent and capital assistance increased$13.4 million or 63.7%. The source of federal and local operating grants and capital assistance include the following:
• Measure I - the ½-cent sales tax collected throughout San Bernardino County for transportation improvements.
• Local Transportation Fund (LTF) - Transportation Development Act (TDA) earmark ¼ percent of the state sales taxfor transit.
• Urbanized Area Formula Program (5307) - transit capital and operating assistance in urbanized areas and for transportation-related planning.
4
FIN
AN
CIA
L S
ECTI
ON
52 0 1 2 C o m p r e h e n s i v e A n n u a l F i n a n c i a l R e p o r t
MANAGEMENT’S DISCUSSION AND ANALYSIS (CONTINUED)
• Congestion Mitigation and Air Quality Improvement (CMAQ) - established to support surface transportation projects and other related efforts that contribute air-quality improvements and provide congestion relief.
• Job Access and Reverse Commute (JARC) - established to improve access to transportation services to employment and employment-related activities for welfare recipients and eligible low-income individuals and to transport residentsof urbanized areas and non-urbanized areas to suburban employment opportunities.
• New Freedom - a formula grant program aims to provide additional tools to overcome existing barriers facing Americans with disabilities seeking integration into the workforce available to people with disabilities beyond the requirements of the Americans with Disabilities Act of 1990 (ADA).
• State Transit Assistance Fund (STAF) - derived from sales tax on gasoline and diesel fuel, this funding is an allocation to local transit agencies to fund a portion of the operations and capital costs associated with local mass transportation programs.
• Public Transportation Modernization, Improvement and Service Enhancement Account Program (PTMISEA) - created by Proposition 1B, is funding available to transit operators over a ten-year period. PTMISEA funds may be used fortransit rehabilitation, safety or modernization improvements, capital service enhancements or expansions, new capital projects, bus rapid-transit improvements, or rolling stock (buses and rail cars) procurement, rehabilitation or replacement.
Interest income for the Agency consists of quarterly return on investment with the Local Agency Investment Fund (LAIF). TheLAIF program offers local agencies the opportunity to participate in a major portfolio, which invests hundreds of millions ofdollars, using the investment expertise of the State Treasurer's Office at no additional cost. Total interest income for fiscalyear ended June 30, 2012 was $52.7 thousand, down $21.6 thousand or 29.0 percent compared to the previous fiscal year.
Other non-operating revenues consist mainly of quarterly reimbursement to the Agency from the Amalgamated TransitUnion (ATU) Local 1704 for wages and benefits paid by the Agency to ATU Officers/Stewards during normal work hours toprocess grievances. Total other non-operating revenues increased $4.9 thousand or 24.7 percent over last fiscal year.
OMNITRANS’ REVENUES
PercentIncrease Increase
2012 2011 (Decrease) (Decrease)
Passenger fares $14,536,931 14,538,747 (1,816) (0.0)Advertising revenue 805,904 909,176 (103,272) (11.4)Other transportation revenue 39,819 41,802 (1,983) (4.7)Federal and local operating grants 47,875,811 52,675,797 (4,799,986) (9.1)Capital assistance 34,412,696 21,016,685 13,396,011 63.7 Interest income 52,727 74,302 (21,575) (29.0)Other non-operating revenues 24,951 20,002 4,949 24.7
Total Revenue $97,748,839 89,276,511 8,472,328 9.5
FINA
NC
IAL S
ECTIO
N

2 0 1 2 C o m p r e h e n s i v e A n n u a l F i n a n c i a l R e p o r t
MANAGEMENT’S DISCUSSION AND ANALYSIS (CONTINUED)
EXPENSES
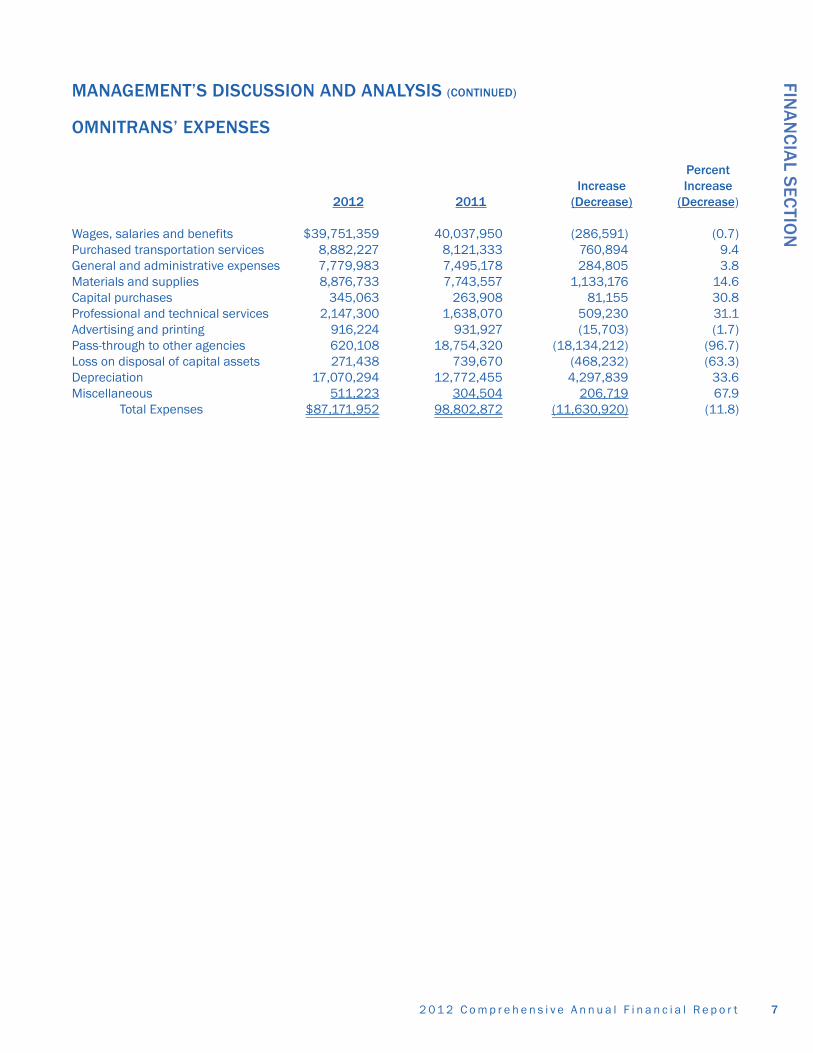
Total expenses for fiscal year 2012 decreased $11.6 million or 11.8% compared to the previous fiscal year. The decreasein pass-through to other agencies of $18.1 million and the increase in depreciation of $4.3 million accounts for most ofthe difference.
Wages, salaries and benefits decreased by $286.6 thousand or 0.7 percent under previous fiscal year. This reduction is attributed mainly to the recapture of cost associated with the Agency’s cost allocation plan (CAP). Wage and benefitcosts for an employee’s time spent on capital projects was charged to the applicable grant. For fiscal year ending June 30,2012, $981.9 thousand in labor and benefit cost was recaptured compared to only $346.0 thousand in the previous fiscal year. Additionally, Omnitrans operated under a Board of Directors-authorized wage freeze for the fiscal year endedJune 30, 2012. Fiscal year 2012 is the third consecutive year wages, salaries and benefits were frozen.
Purchased transportation services for fiscal year ended June 30, 2012 increased $760.9 thousand or 9.4 percent comparedto the previous fiscal year. The increase in cost is attributed to increases negotiated in the contract, and the increase in service hours for additional OmniGo service.
General and administrative expenses consist mainly of occupancy expenses (utilities, communication and office equipment,repairs, ground maintenance, stops and stations, etc.) and casualty and liability expenses (property, general, vehicle andworkers’ compensation insurance). Occupancy expense decreased $153.0 thousand, and casualty and liability cost increased $426.7 thousand when compared to the previous fiscal year.
Material and supplies increased $1.1 million or 14.6 percent over last fiscal year. The difference is attributed to the amountof compressed natural gas (CNG) fuel tax credit recognized in each of the fiscal years. In fiscal year ended June 30, 2011,the Agency recognized $2.0 million in fuel tax credit to offset its fuel cost. In fiscal year ended June 30, 2012, only $636.5thousand was recognized to offset fuel cost.
The decrease in fuel tax credit was offset by the fuel hedge program implemented at Omnitrans. A fuel hedging programwas implemented May 6, 2009, to increase the predictability of Omnitrans costs and reduce operational uncertainty inthe event of dramatic fuel price increases in the open market. Omnitrans is authorized to hedge up to 150,000 gallonsper month of compressed natural gas (CNG) on the New York Mercantile Exchange (NYMEX) through Morgan Stanley.Omnitrans CNG cost decreased $472.5 thousand or 10.3 percent compared to the previous fiscal year.
Professional and technical services increased $509.2 thousand or 31.1 percent above previous fiscal year ended June30, 2011. The increase is mainly attributed to the outsourcing of computer hardware and maintenance function of theInformation Technology department.
Omnitrans, as a direct grantee of FTA funding, is responsible for complying with specific FTA requirements. These includethe solicitation, evaluation, selection and project management oversight of sub-recipients. The pass-through to other agenciesrepresents federal and local reimbursements to sub-recipients for cost incurred on approved projects. Pass-through paymentsto other agencies decrease $18.1 million or 96.7 percent compared to the previous fiscal year. This reduction is attributed to the return of LTF funds to San Bernardino Associated Governments (SANBAG), previously held by Omnitrans as unrestrictedreserves in the previous fiscal year.
The increase in depreciation and loss on disposal of capital assets over the previous fiscal year is attributed to disposal and replacement of fixed-route and purchased transportation vehicles that were fully depreciated. The parts carried in inventory forrepairs and maintenance for these vehicles was also disposed of in accordance with FTA requirements.
Miscellaneous expenses for the fiscal year ended June 30, 2012 increased $206.7 thousand or 67.9 percent whencompared to the last fiscal year. The increase is mainly attributed to increased travel and meeting expenses, employeetraining and employee recognition. Additionally, cost associated with CNG hedging activities we recognized as a resultof accounting and financial reporting for derivative instruments (GASB 53).
6
FIN
AN
CIA
L S
ECTI
ON
72 0 1 2 C o m p r e h e n s i v e A n n u a l F i n a n c i a l R e p o r t
MANAGEMENT’S DISCUSSION AND ANALYSIS (CONTINUED)
OMNITRANS’ EXPENSES
PercentIncrease Increase
2012 2011 (Decrease) (Decrease)
Wages, salaries and benefits $39,751,359 40,037,950 (286,591) (0.7)Purchased transportation services 8,882,227 8,121,333 760,894 9.4General and administrative expenses 7,779,983 7,495,178 284,805 3.8Materials and supplies 8,876,733 7,743,557 1,133,176 14.6Capital purchases 345,063 263,908 81,155 30.8Professional and technical services 2,147,300 1,638,070 509,230 31.1Advertising and printing 916,224 931,927 (15,703) (1.7)Pass-through to other agencies 620,108 18,754,320 (18,134,212) (96.7)Loss on disposal of capital assets 271,438 739,670 (468,232) (63.3)Depreciation 17,070,294 12,772,455 4,297,839 33.6Miscellaneous 511,223 304,504 206,719 67.9
Total Expenses $87,171,952 98,802,872 (11,630,920) (11.8)
FINA
NC
IAL S
ECTIO
N
2 0 1 2 C o m p r e h e n s i v e A n n u a l F i n a n c i a l R e p o r t
MANAGEMENT’S DISCUSSION AND ANALYSIS (CONTINUED)
NET POSITION
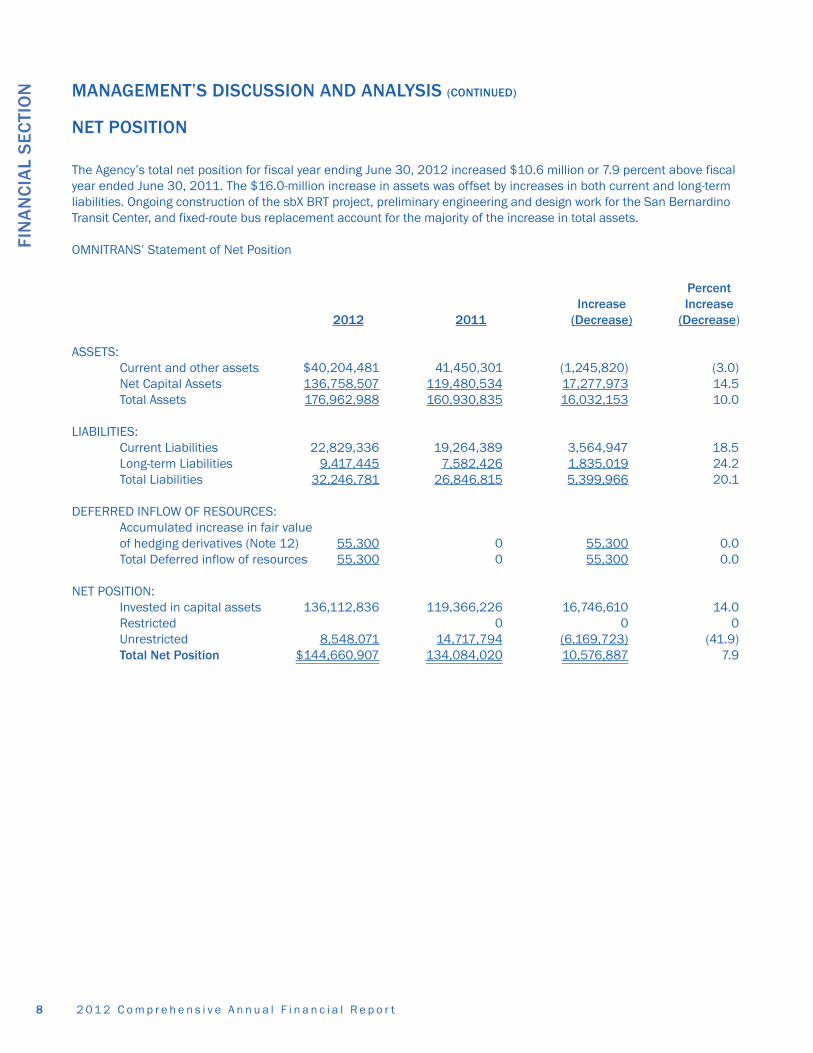
The Agency’s total net position for fiscal year ending June 30, 2012 increased $10.6 million or 7.9 percent above fiscalyear ended June 30, 2011. The $16.0-million increase in assets was offset by increases in both current and long-termliabilities. Ongoing construction of the sbX BRT project, preliminary engineering and design work for the San BernardinoTransit Center, and fixed-route bus replacement account for the majority of the increase in total assets.
OMNITRANS’ Statement of Net Position
PercentIncrease Increase
2012 2011 (Decrease) (Decrease)
ASSETS:Current and other assets $40,204,481 41,450,301 (1,245,820) (3.0)Net Capital Assets 136,758,507 119,480,534 17,277,973 14.5 Total Assets 176,962,988 160,930,835 16,032,153 10.0
LIABILITIES:Current Liabilities 22,829,336 19,264,389 3,564,947 18.5Long-term Liabilities 9,417,445 7,582,426 1,835,019 24.2Total Liabilities 32,246,781 26,846,815 5,399,966 20.1
DEFERRED INFLOW OF RESOURCES:Accumulated increase in fair valueof hedging derivatives (Note 12) 55,300 0 55,300 0.0Total Deferred inflow of resources 55,300 0 55,300 0.0
NET POSITION:Invested in capital assets 136,112,836 119,366,226 16,746,610 14.0Restricted 0 0 0Unrestricted 8,548,071 14,717,794 (6,169,723) (41.9)Total Net Position $144,660,907 134,084,020 10,576,887 7.9
8
FIN
AN
CIA
L S
ECTI
ON
92 0 1 2 C o m p r e h e n s i v e A n n u a l F i n a n c i a l R e p o r t
MANAGEMENT’S DISCUSSION AND ANALYSIS (CONTINUED)
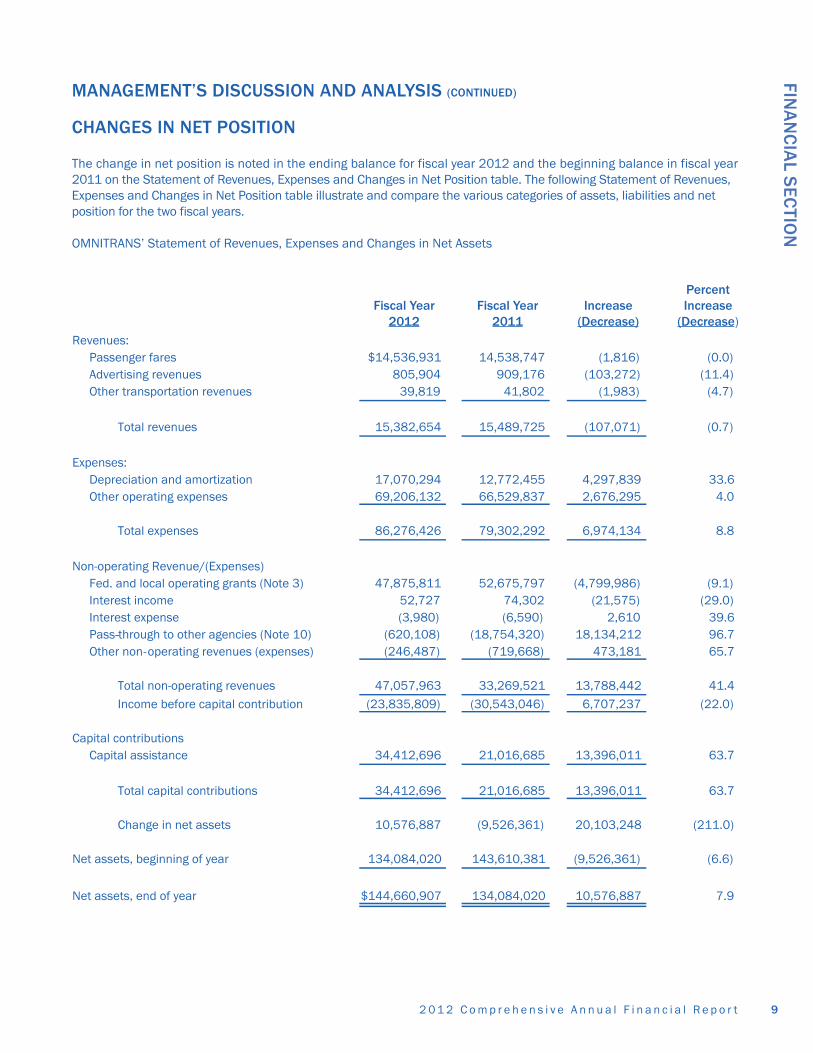
CHANGES IN NET POSITION
The change in net position is noted in the ending balance for fiscal year 2012 and the beginning balance in fiscal year2011 on the Statement of Revenues, Expenses and Changes in Net Position table. The following Statement of Revenues,Expenses and Changes in Net Position table illustrate and compare the various categories of assets, liabilities and netposition for the two fiscal years.
OMNITRANS’ Statement of Revenues, Expenses and Changes in Net Assets
PercentFiscal Year Fiscal Year Increase Increase
2012 2011 (Decrease) (Decrease)
FINA
NC
IAL S
ECTIO
N
Revenues:
Passenger fares $ 14,536,931
14,538,747
(1,816)
(0.0)
Advertising revenues
805,904
909,176
(103,272)
(11.4)
Other transportation revenues 39,819
41,802
(1,983)
(4.7)
Total revenues
15,382,654
15,489,725
(107,071)
(0.7)
Expenses:
Depreciation and amortization 17,070,294
12,772,455
4,297,839
33.6
Other operating expenses
69,206,132
66,529,837
2,676,295
4.0
Total expenses
86,276,426
79,302,292
6,974,134
8.8
Non-operating Revenue/(Expenses) Fed. and local operating grants (Note 3)
47,875,811
52,675,797
(4,799,986)
(9.1) Interest income
52,727
74,302
(21,575)
(29.0)
Interest expense
(3,980)
(6,590)
2,610
39.6 Pass-through to other agencies (Note 10)-
(620,108)
(18,754,320)
18,134,212
96.7
Other non-operating revenues (expenses)
(246,487)
(719,668)
473,181
65.7
Total non-operating revenues
47,057,963
33,269,521
13,788,442
41.4
Income before capital contribution
(23,835,809)
(30,543,046)
6,707,237
(22.0)
Capital contributions
Capital assistance
34,412,696
21,016,685
13,396,011
63.7
Total capital contributions
34,412,696
21,016,685
13,396,011
63.7
Change in net assets
10,576,887
(9,526,361)
20,103,248
(211.0)
Net assets, beginning of year
134,084,020
143,610,381
(9,526,361)
(6.6)
Net assets, end of year $ 144,660,907
134,084,020
10,576,887
7.9
2 0 1 2 C o m p r e h e n s i v e A n n u a l F i n a n c i a l R e p o r t
MANAGEMENT’S DISCUSSION AND ANALYSIS (CONTINUED)
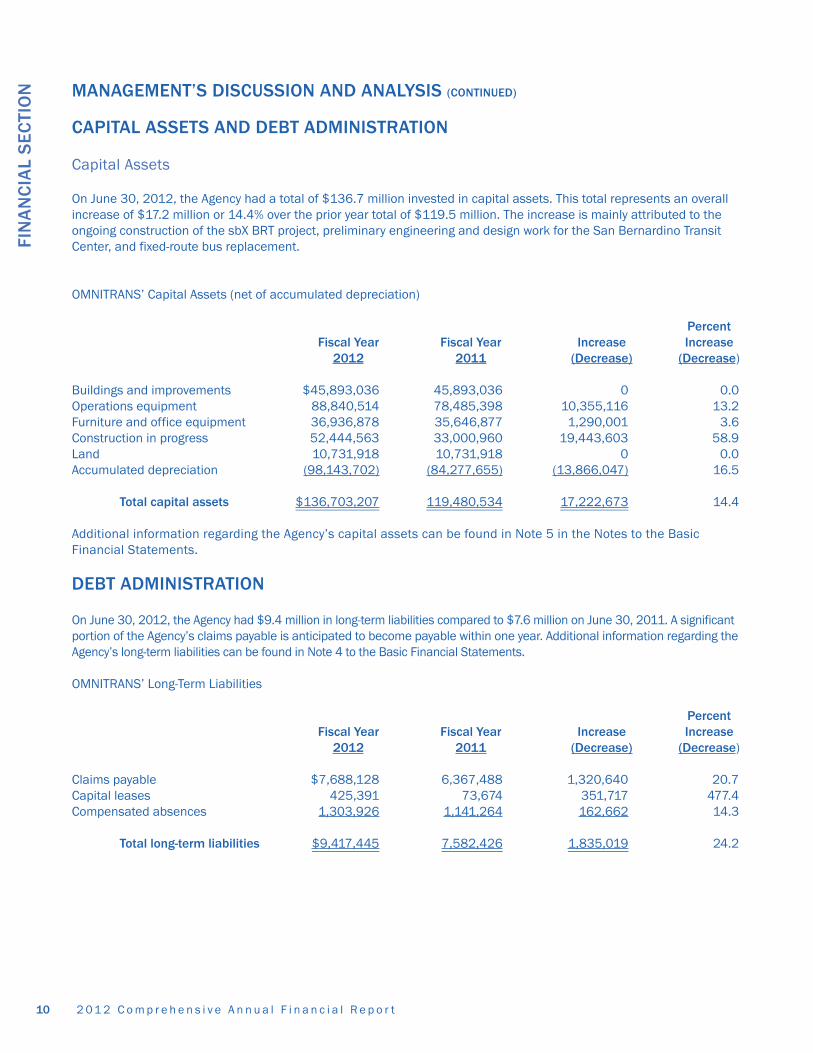
CAPITAL ASSETS AND DEBT ADMINISTRATION
Capital Assets
On June 30, 2012, the Agency had a total of $136.7 million invested in capital assets. This total represents an overall increase of $17.2 million or 14.4% over the prior year total of $119.5 million. The increase is mainly attributed to theongoing construction of the sbX BRT project, preliminary engineering and design work for the San Bernardino TransitCenter, and fixed-route bus replacement.
OMNITRANS’ Capital Assets (net of accumulated depreciation)
PercentFiscal Year Fiscal Year Increase Increase
2012 2011 (Decrease) (Decrease)
Buildings and improvements $45,893,036 45,893,036 0 0.0 Operations equipment 88,840,514 78,485,398 10,355,116 13.2 Furniture and office equipment 36,936,878 35,646,877 1,290,001 3.6 Construction in progress 52,444,563 33,000,960 19,443,603 58.9 Land 10,731,918 10,731,918 0 0.0 Accumulated depreciation (98,143,702) (84,277,655) (13,866,047) 16.5
Total capital assets $136,703,207 119,480,534 17,222,673 14.4
Additional information regarding the Agency’s capital assets can be found in Note 5 in the Notes to the BasicFinancial Statements.
DEBT ADMINISTRATION
On June 30, 2012, the Agency had $9.4 million in long-term liabilities compared to $7.6 million on June 30, 2011. A significantportion of the Agency’s claims payable is anticipated to become payable within one year. Additional information regarding theAgency’s long-term liabilities can be found in Note 4 to the Basic Financial Statements.
OMNITRANS’ Long-Term Liabilities
PercentFiscal Year Fiscal Year Increase Increase
2012 2011 (Decrease) (Decrease)
Claims payable $7,688,128 6,367,488 1,320,640 20.7 Capital leases 425,391 73,674 351,717 477.4Compensated absences 1,303,926 1,141,264 162,662 14.3
Total long-term liabilities $9,417,445 7,582,426 1,835,019 24.2
10
FIN
AN
CIA
L S
ECTI
ON

112 0 1 2 C o m p r e h e n s i v e A n n u a l F i n a n c i a l R e p o r t
MANAGEMENT’S DISCUSSION AND ANALYSIS (CONTINUED)
NEXT YEAR’S BUDGET
Omnitrans continue to face the challenge of providing mobility, environmental and quality of life benefits within the SanBernardino Valley during difficult economic times with rising gas prices, high unemployment and discontinued schoolbus services. Omnitrans prepares an operating and capital budget annually that is approved by the Board of Directorsprior to the beginning of its fiscal year. The operating budget for fiscal year ending June 30, 2013 will be comparable to the previous fiscal year 2012. Consequently, the focus will be to maintain cost for goods and services at current levels.Fiscal year 2013 will be the fourth consecutive fiscal year that Omnitrans’ operating budget has remained at the existing level.
Omnitrans is currently in the midst of a Comprehensive Operational Analysis (COA), one of the most extensive ever to be conducted of Omnitrans by SANBAG. According to the objectives of the COA, numerous major changes will result for the COA.
The capital budget consists of a multi-year program that includes the sbX E Street Corridor project and the San BernardinoTransit Center. Funding for these major projects has been identified, approved by the Board of Directors, and committed tothose projects.
CONTACTING THE AGENCY’S FINANCIAL MANAGEMENT
This financial report is designed to provide our customers, stakeholders and creditors with an overview of the Agency’sfinancial operations and condition. If you have a question about this report or need additional information, you maycontact the Agency’s Finance Director at 1700 W. 5th Street, San Bernardino, California 92411-2401.
FINA
NC
IAL S
ECTIO
N
2 0 1 2 C o m p r e h e n s i v e A n n u a l F i n a n c i a l R e p o r t
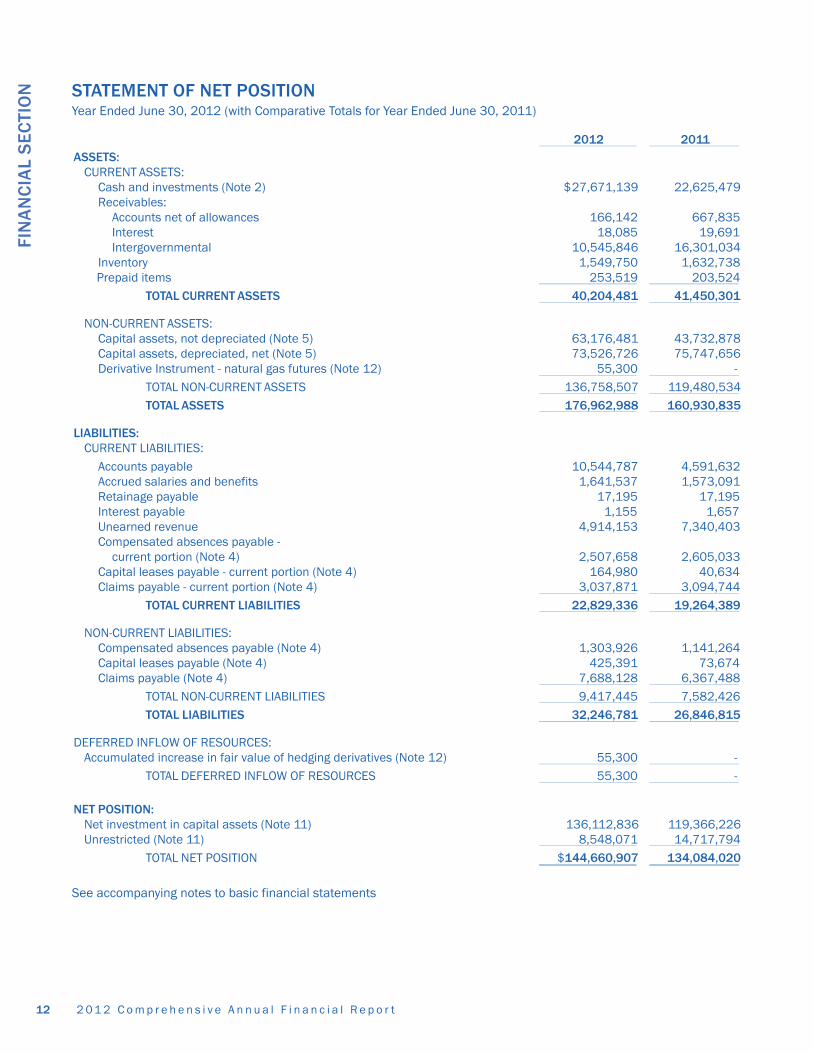
STATEMENT OF NET POSITIONYear Ended June 30, 2012 (with Comparative Totals for Year Ended June 30, 2011)
See accompanying notes to basic financial statements
12
FIN
AN
CIA
L S
ECTI
ON
2012 2011ASSETS:
CURRENT ASSETS:Cash and investments (Note 2) 27,671,139$ 22,625,479 Receivables:
Accounts net of allowances 166,142 667,835 Interest 18,085 19,691 Intergovernmental 10,545,846 16,301,034
Inventory 1,549,750 1,632,738 Prepaid items 253,519 203,524
TOTAL CURRENT ASSETS 40,204,481 41,450,301
NON-CURRENT ASSETS:Capital assets, not depreciated (Note 5) 63,176,481 43,732,878 Capital assets, depreciated, net (Note 5) 73,526,726 75,747,656 Derivative Instrument - natural gas futures (Note 12) 55,300 -
TOTAL NON-CURRENT ASSETS 136,758,507 119,480,534 TOTAL ASSETS 176,962,988 160,930,835
LIABILITIES:CURRENT LIABILITIES:
Accounts payable 10,544,787 4,591,632 Accrued salaries and benefits 1,641,537 1,573,091 Retainage payable 17,195 17,195 Interest payable 1,155 1,657 Unearned revenue 4,914,153 7,340,403 Compensated absences payable -
current portion (Note 4) 2,507,658 2,605,033 Capital leases payable - current portion (Note 4) 164,980 40,634 Claims payable - current portion (Note 4) 3,037,871 3,094,744
TOTAL CURRENT LIABILITIES 22,829,336 19,264,389
NON-CURRENT LIABILITIES:Compensated absences payable (Note 4) 1,303,926 1,141,264 Capital leases payable (Note 4) 425,391 73,674 Claims payable (Note 4) 7,688,128 6,367,488
TOTAL NON-CURRENT LIABILITIES 9,417,445 7,582,426 TOTAL LIABILITIES 32,246,781 26,846,815
DEFERRED INFLOW OF RESOURCES:Accumulated increase in fair value of hedging derivatives (Note 12) 55,300 -
TOTAL DEFERRED INFLOW OF RESOURCES 55,300 -
NET POSITION:Net investment in capital assets (Note 11) 136,112,836 119,366,226 Unrestricted (Note 11) 8,548,071 14,717,794
TOTAL NET POSITION 144,660,907$ 134,084,020

132 0 1 2 C o m p r e h e n s i v e A n n u a l F i n a n c i a l R e p o r t
STATEMENT OF REVENUES, EXPENSES AND CHANGES IN NET ASSETSYear Ended June 30, 2012 (with Comparative Totals for Year Ended June 30, 2011)
See accompanying notes to basic financial statements
FINA
NC
IAL S
ECTIO
N
2012 2011
OPERATING REVENUES:Passenger fares 14,536,931$ 14,538,747 Advertising revenue 805,904 909,176 Other transportation revenue 39,819 41,802
TOTAL OPERATING REVENUES 15,382,654 15,489,725
OPERATING EXPENSES:Salaries and benefits 39,751,359 40,037,950 Purchased transportation services 8,882,227 8,121,333 General and administrative 7,779,983 7,495,178 Materials and supplies 8,876,733 7,743,557 Capital purchases 345,063 263,908 Professional and technical services 2,147,300 1,638,070 Advertising and printing 916,224 931,927 Depreciation 17,070,294 12,772,455 Miscellaneous 507,243 297,914
TOTAL OPERATING EXPENSES 86,276,426 79,302,292
OPERATING INCOME/(LOSS) (70,893,772) (63,812,567)
NON-OPERATING REVENUES/(EXPENSES):Federal and local operating grants 47,875,811 52,675,797 Interest income 52,727 74,302 Interest expense (3,980) (6,590) Pass-through to other agencies (Note 10) (620,108) (18,754,320) Loss on disposal of capital assets (271,438) (739,670) Other non-operating revenues (expenses) 24,951 20,002
TOTAL NON-OPERATING REVENUES 47,057,963 33,269,521
INCOME BEFORE CAPITAL CONTRIBUTIONS (23,835,809) (30,543,046)
CAPITAL CONTRIBUTIONS:Capital assistance 34,412,696 21,016,685
CHANGE IN NET POSITION 10,576,887 (9,526,361)
NET POSITION, BEGINNING OF YEAR 134,084,020 143,610,381
NET POSITION, END OF YEAR 144,660,907$ 134,084,020

2 0 1 2 C o m p r e h e n s i v e A n n u a l F i n a n c i a l R e p o r t
STATEMENT OF CASH FLOWSYear Ended June 30, 2012 (with Comparative Totals for Year Ended June 30, 2011)
See accompanying notes to basic financial statements
14
FIN
AN
CIA
L S
ECTI
ON
2012 2011CASH FLOWS FROM OPERATING ACTIVITIES:
Cash received from customers 15,889,414$ 14,965,317 Nonoperating miscellaneous receipts (payments) 24,951 20,002 Cash payments to suppliers for goods and services (22,204,847) (26,833,933) Cash payments to employees for services (39,617,638) (39,964,466)
Net cash used for operating activities (45,908,120) (51,813,080)
CASH FLOWS FROM NON-CAPITAL FINANCING ACTIVITIES:Federal, state and local operating grants 50,807,315 54,131,745 Pass-through payments to other agencies (620,108) (18,754,320)
Net cash provided by non-capital financing activities 50,187,207 35,377,425
CASH FLOWS FROM CAPITAL AND RELATED FINANCING ACTIVITIES:
Acquisition and construction of capital assets (33,911,700) (18,104,911) Principal paid on capital leases (176,306) (136,821) Interest paid on capital leases (4,482) (7,310) Proceeds from sale of capital assets 1,486 58,349 Capital grants received 34,803,242 20,153,259
Net cash provided by (used for) capital and related financing activities 712,240 1,962,566
CASH FLOWS FROM INVESTING ACTIVITIES:Proceeds from sales and maturities of investments 46,785,300 64,200,000 Purchase of investments (55,509,632) (45,806,112) Interest received 54,333 106,111
Net cash provided by investing activities (8,669,999) 18,499,999
Net decrease in cash and cash equivalents (3,678,672) 4,026,910
CASH AND CASH EQUIVALENTS, BEGINNING OF YEAR 9,656,222 5,629,312
CASH AND CASH EQUIVALENTS, END OF YEAR 5,977,550$ 9,656,222
RECONCILIATION OF CASH AND CASH EQUIVALENTS TOAMOUNTS REPORTED ON STATEMENT OF NET ASSETS:
Reported on statement of net assets:Cash and investments 27,671,139$ 22,625,479
Less investments not meeting the definition of cash and cash equivalents (21,693,589) (12,969,257)
(continued on next page)
CASH AND CASH EQUIVALENTS, END OF YEAR 5,977,550$ 9,656,222
152 0 1 2 C o m p r e h e n s i v e A n n u a l F i n a n c i a l R e p o r t
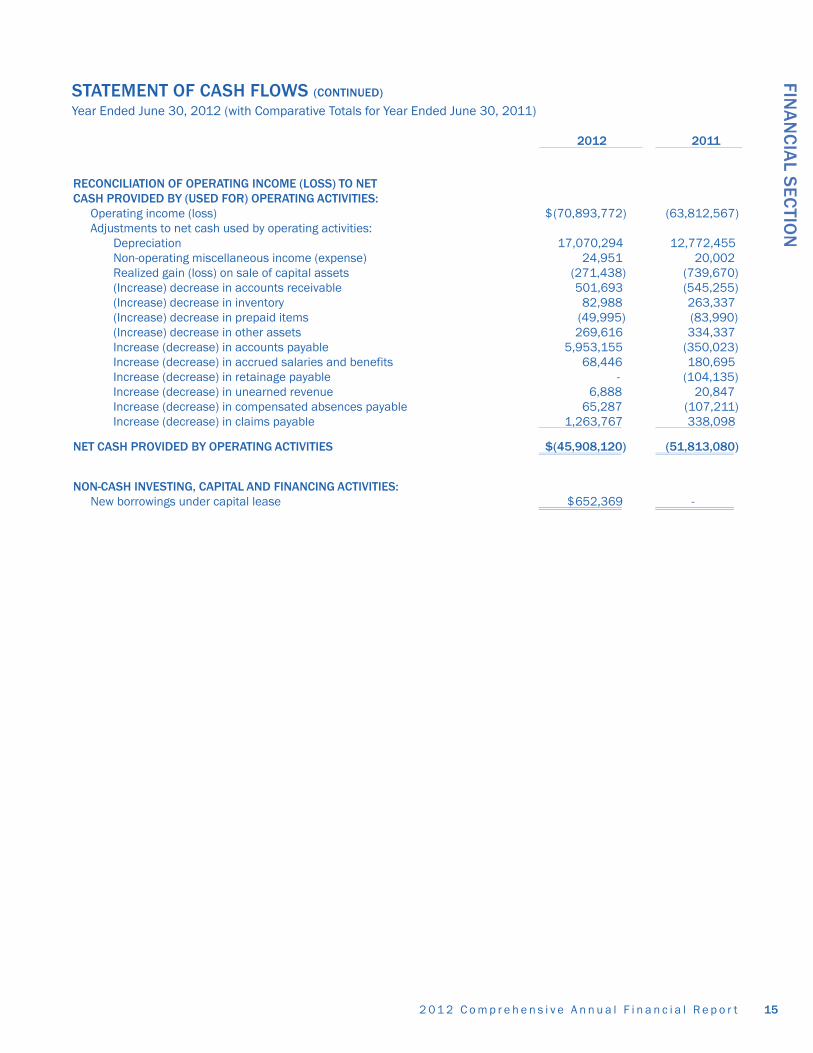
STATEMENT OF CASH FLOWS (CONTINUED)
Year Ended June 30, 2012 (with Comparative Totals for Year Ended June 30, 2011)
FINA
NC
IAL S
ECTIO
N
RECONCILIATION OF OPERATING INCOME (LOSS) TO NETCASH PROVIDED BY (USED FOR) OPERATING ACTIVITIES:
Operating income (loss) (70,893,772)$ (63,812,567) Adjustments to net cash used by operating activities:
Depreciation 17,070,294 12,772,455 Non-operating miscellaneous income (expense) 24,951 20,002 Realized gain (loss) on sale of capital assets (271,438) (739,670) (Increase) decrease in accounts receivable 501,693 (545,255) (Increase) decrease in inventory 82,988 263,337 (Increase) decrease in prepaid items (49,995) (83,990) (Increase) decrease in other assets 269,616 334,337 Increase (decrease) in accounts payable 5,953,155 (350,023) Increase (decrease) in accrued salaries and benefits 68,446 180,695 Increase (decrease) in retainage payable - (104,135) Increase (decrease) in unearned revenue 6,888 20,847 Increase (decrease) in compensated absences payable 65,287 (107,211) Increase (decrease) in claims payable 1,263,767 338,098
NET CASH PROVIDED BY OPERATING ACTIVITIES (45,908,120)$ (51,813,080)
NON-CASH INVESTING, CAPITAL AND FINANCING ACTIVITIES:New borrowings under capital lease 652,369$ -
2012 2011
2 0 1 2 C o m p r e h e n s i v e A n n u a l F i n a n c i a l R e p o r t
NOTES TO BASIC FINANCIAL STATEMENTS YEAR ENDED JUNE 30, 2012
(1) SUMMARY OF SIGNIFICANT ACCOUNTING POLICIES
NATURE OF BUSINESS
Omnitrans was organized on March 8, 1976, by a joint powers agreement between the County of San Bernardino, Californiaand the following cities: Chino; Colton; Fontana; Loma Linda; Montclair; Ontario; Redlands; Rialto; San Bernardino; and Upland under Section 6506 of the California Government Code for the purpose of providing transit services under a singleagency. The following cities were added thereafter: Rancho Cucamonga and Grand Terrace in 1979; Highland in 1988; Yucaipa in 1990; and Chino Hills in 1992.
Omnitrans provides a variety of transit services to the public of San Bernardino County. These services include bus operations,purchased transportation services with independent contractors and demand response transportation services. Omnitrans alsofunctions as a “pass-through” administrative agency for various federal, state and local grants.
BASIS OF ACCOUNTING
Omnitrans is accounted for as an enterprise fund (proprietary fund type) using the economic resources measurementfocus and the accrual basis of accounting. A fund is an accounting entity with a self-balancing set of accounts establishedto record the financial position and results of operations of a specific governmental activity. The activities of enterprisefunds closely resemble those of ongoing businesses in which the purpose is to conserve and add to basic resources whilemeeting operating expenses from current revenues. Enterprise funds account for operations that provide services on a continuous basis and are substantially financed by revenues derived from user charges. Revenues are recognized whenearned and expenses are recognized as they are incurred.
Omnitrans applies all applicable pronouncements issued by the Government Accounting Standards Board (GASB) in accounting and reporting for proprietary operations as well as pronouncements issued on or before November 30,1989, unless those pronouncements conflict with or contradict GASB pronouncements: Financial Accounting StandardsBoard (FASB) Statements and Interpretations, Accounting Principles Board (APB) Opinions, and Accounting ResearchBulletins (ARBs) of the Committee on Accounting Procedure.
IMPLEMENTATION OF GASB NO. 63
During the year ended June 30, 2012, Omnitrans implemented Statement No. 63 of the Governmental AccountingStandards Board, “Financial Reporting of Deferred Outflows of Resources, Deferred Inflows of Resources, and Net Position.”The accompanying financial statements reflect certain changes that have been made with respect to the reporting of thebasic financial statements as a result of the implementation of GASB No. 63.
Statement No. 63 requires governments to no longer report net assets, fund balance or equity, in favor of “net position.”Accordingly, Omnitrans has reported a Statement of Net Position in lieu of a Statement of Net Assets, with net positionbeing equal to assets, plus deferred outflows of resources, less liabilities and less deferred inflows of resources.
CLASSIFICATION OF REVENUES AND EXPENSES
Enterprise funds distinguish operating revenues and expenses from non-operating items. Operating revenues and expensesgenerally result from providing services and producing and delivering goods in connection with an enterprise fund’sprincipal operations. The principal operating revenues of Omnitrans consist of bus transit services. Non-operating revenues consist of federal, state and local operating grants, investment income, and special charges that can be usedfor either operating or capital purposes. Operating expenses for enterprise funds include the cost of sales, administrativeexpenses and depreciation on capital assets.
Expenses not meeting this definition are reported as non-operating expenses. Non-operating expenses primarily consist ofpayments to pass-through agencies and interest expense.
16
FIN
AN
CIA
L S
ECTI
ON
172 0 1 2 C o m p r e h e n s i v e A n n u a l F i n a n c i a l R e p o r t
Capital contributions consist of grants that are legally restricted for capital expenses by federal, state or local law thatestablished those charges.
When both restricted and unrestricted resources are available for use, it is Omnitrans' policy to use restricted resourcesfirst, and then unrestricted resources as they are needed.
CASH AND CASH EQUIVALENTS
For the purposes of the Statement of Cash Flows, cash equivalents are defined as short-term, highly liquid investmentsthat are both readily convertible to known amounts of cash, or so near their maturity that they present insignificant riskof changes in value because of changes in interest rates, and have an original maturity date of three months or less.
INVESTMENTS
Investments are reported in the accompanying Statement of Net Position at fair value. Changes in fair value that occurduring the fiscal year are recognized as investment income reported for that fiscal year. Investment income includes interest earnings, changes in fair value, and any gains or losses realized upon the liquidation or sale of investments.
ALLOWANCE FOR DOUBTFUL ACCOUNTS
Omnitrans has a policy which requires that receivables, except for intergovernmental receivables, be written off after 60 days. The allowance for doubtful accounts as of June 30, 2012 was $69.
BUDGETARY INFORMATION
Although Omnitrans prepares and approves an annual budget, budgetary information is not presented because Omnitransis not legally required to adopt a budget.
INVENTORIES
Inventories consist of Operations vehicles’ parts and fuel in storage held for consumption. The parts and fuel in storageare stated at the lower of cost (average cost method) or market. The value of parts and fuel held in storage as of June30, 2012 was $1,549,750.
CAPITAL ASSETS
Capital assets are valued at cost or estimated historical cost if actual cost is not available. Donated assets are valuedat their estimated fair market value on the date donated. Omnitrans capitalizes all assets with a historical cost of atleast $2,000 and a useful life of at least one year. The cost of normal maintenance and repairs that do not add to thevalue of the assets or materially extend asset lives are not capitalized.
Depreciation of capital assets used by Omnitrans is charged as an expense against its operations. Depreciation is computedutilizing the straight-line method over the following estimated useful lives:
NumberCategory of Years
Buildings and improvements 5 to 30Operations equipment 3 to 10Furniture and office equipment 3 to 20
DEFERRED OUTFLOWS/INFLOWS OF RESOURCES
In addition to assets, the Statement of Net Position will sometimes report a separate section for deferred outflows of resources. This separate financial statement element represents a consumption of net position that applies to a future periodand so will not be recognized as an outflow of resources (expenditure) until then. Omnitrans does not have any items thatqualify for reporting in this category.
FINA
NC
IAL S
ECTIO
N
2 0 1 2 C o m p r e h e n s i v e A n n u a l F i n a n c i a l R e p o r t
In addition to liabilities, the Statement of Net Position will sometimes report a separate section for deferred inflows of resources. This separate financial statement element represents an acquisition of net position that applies to a future period and so will not be recognized as an inflow of resources (revenue) until that time. The government has one item thatqualifies for reporting in this category. Omnitrans reports the value of their derivative instrument, a natural gas futuresbasket used for hedging purposes, as an inflow of resources in the period that the amounts become available.
COMPENSATED ABSENCES
It is Omnitrans’ policy to permit employees to accumulate earned but unused vacation and sick leave benefits up to certainlimits. Management, non-exempt, and coach operator employees begin to accrue vested sick leave hours after six monthsof service. Upon voluntary resignation, retirement or death and after six months of service, management and non-exemptemployees or their estate are paid for any unused sick leave up to a maximum of 50 percent of the available sick leavehours not to exceed 1,200 hours (e.g. 50 percent of 1,200 hours would be paid at 600 hours). Represented employeesbegin to accrue vested sick leave hours after reaching a certain amount of service time based upon their respective workclassification. Teamsters accrue sick leave after 1,040 hours of actual hours worked and Amalgamated Transit Union (ATU)members after their first year of continuous full-time employment, based upon their respective work classification.Upon voluntary resignation, retirement or death, and after a certain amount of years of service (ATU members after 8 yearsof service and Teamsters after 10 years of service), represented employees or their estate are paid for any unused sickleave up to a maximum of 50 percent of available sick leave hours not to exceed 1,200 hours (e.g. 50 percent of 1,200hours would be paid at 600 hours).
Full-time, non-represented employees begin to accrue vacation hours after 6 months of service. Employee vacation creditsmay be accrued and accumulated up to a maximum of 2 years total accumulated vacation credits. Eligible employees withan annual accrual of 3 or more weeks of vacation per year, after taking 80 hours vacation, shall be permitted to request 2 weeks pay in lieu of time off. Represented employees will accrue vacation benefits in accordance with the provisionsof their respective Memorandum of Understanding (MOU).
Accumulated unpaid vacation and vested sick leave pay is recorded as an expense and a liability at the time the benefit isearned. Total compensated absences payable was $3,811,584 on June 30, 2012.
PRIOR YEAR DATA
Selected information regarding the prior year has been included in the accompanying financial statements. This informationhas been included for comparison purposes only and does not represent a complete presentation in accordance with generally accepted accounting principles. Accordingly, such information should be read in conjunction with Omnitrans’prior year financial statements, from which this selected financial data was derived.
FEDERAL, STATE AND LOCAL GRANTS
Federal, state and local governments have made various grants available to Omnitrans for operating assistance and acquisition of capital assets. Grants for operating assistance, the acquisition of equipment or other capital outlay arenot formally recognized in the accounts until the grant becomes a valid receivable as a result of Omnitrans complyingwith appropriate grant requirements. Operating assistance grants are included in non-operating revenues in the year inwhich the grant is applicable and the related expenses are incurred. Revenues earned under capital grants are recordedas capital contributions.
PASS-THROUGH ACTIVITIES
Revenues associated with grants, where Omnitrans serves as the administrating agent, are recorded as either non-operatingrevenues or capital contributions based on the approved use of the grant. The related expense is recorded as “pass-throughto other agencies” in the Statement of Revenues, Expenses, and Changes in Net Position as the expenses do not support theoperations of Omnitrans nor provide an asset.
18
FIN
AN
CIA
L S
ECTI
ON
192 0 1 2 C o m p r e h e n s i v e A n n u a l F i n a n c i a l R e p o r t
NET POSITION
The unrestricted net position of Omnitrans is restricted by state law for sole use by Omnitrans for bus transit operations.It is reported as unrestricted net position in the accompanying financial statements because this restriction correspondsto the general purpose for which Omnitrans has been established. It is unavailable for other government uses and iscommitted to the ongoing operations of Omnitrans, including amounts necessary to cover contingencies, unanticipatedexpenses, revenue shortfalls, and weather and economic fluctuations.
USE OF ESTIMATES
The preparation of basic financial statements in conformity with accounting principles generally accepted in the UnitedStates of America requires management to make estimates and assumptions that affect the reported amounts of assetsand liabilities, and disclosure of contingent assets and liabilities at the date of the financial statements, and the reportedamounts of revenue and expenses during the reporting period. Actual results could differ from those estimates.
(2) CASH AND INVESTMENTS
Cash and investments as of June 30, 2012 consist of the following:
Cash on hand $ 3,000Deposits with financial institutions 5,974,550Investments (includes market value adjustment) 21,693,589
$27,671,139
INVESTMENTS AUTHORIZED BY THE CALIFORNIA GOVERNMENT CODEOR OMNITRANS’ INVESTMENT POLICY
The table below identifies the investment types that are authorized by the California Government Code (or Omnitrans’investment policy, where more restrictive). The table also identifies certain provisions of the California Government Code(or Omnitrans’ investment policy, where more restrictive) that address interest rate risk, credit risk, and concentration ofcredit risk.
Authorized By Maximum MaximumAuthorized Investment Maximum Percentage Investment
Investment Type Policy Maturity of Portfolio in One Issuer
Local Agency Bonds No 5 years None NoneU.S. Treasury Obligations No 5 years None NoneFederal Agency Securities No 5 years None NoneBanker’s Acceptances No 180 days 40% 30%Commercial Paper No 270 days 25% 10%Negotiable Certificates of Deposit No 5 years 30% NoneRepurchase Agreements No 1 year None None
20% of baseReverse Repurchase Agreements No 92 days value NoneMedium-Term Notes No 5 years 30% NoneMutual Funds No N/A 20% 10%Money Market Mutual Funds No N/A 20% 10%Mortgage Pass-Through Securities No 5 years 20% NoneCounty Pooled Investment Funds No N/A None NoneLocal Agency Investment Fund Yes N/A None NoneState Pools (other investment pools) Yes N/A None None
FINA
NC
IAL S
ECTIO
N
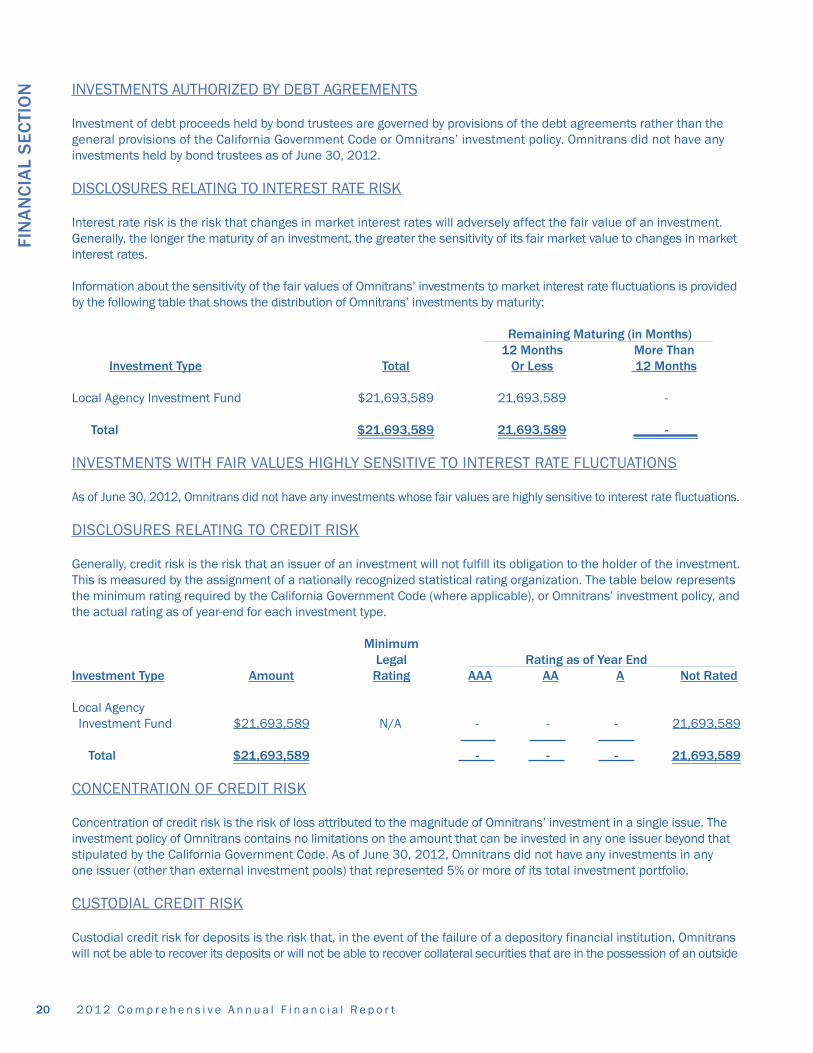
2 0 1 2 C o m p r e h e n s i v e A n n u a l F i n a n c i a l R e p o r t
INVESTMENTS AUTHORIZED BY DEBT AGREEMENTS
Investment of debt proceeds held by bond trustees are governed by provisions of the debt agreements rather than thegeneral provisions of the California Government Code or Omnitrans’ investment policy. Omnitrans did not have any investments held by bond trustees as of June 30, 2012.
DISCLOSURES RELATING TO INTEREST RATE RISK
Interest rate risk is the risk that changes in market interest rates will adversely affect the fair value of an investment.Generally, the longer the maturity of an investment, the greater the sensitivity of its fair market value to changes in marketinterest rates. Information about the sensitivity of the fair values of Omnitrans’ investments to market interest rate fluctuations is providedby the following table that shows the distribution of Omnitrans’ investments by maturity:
Remaining Maturing (in Months)12 Months More Than
Investment Type Total Or Less 12 Months
Local Agency Investment Fund $21,693,589 21,693,589 -
Total $21,693,589 21,693,589 -
INVESTMENTS WITH FAIR VALUES HIGHLY SENSITIVE TO INTEREST RATE FLUCTUATIONS
As of June 30, 2012, Omnitrans did not have any investments whose fair values are highly sensitive to interest rate fluctuations.
DISCLOSURES RELATING TO CREDIT RISK
Generally, credit risk is the risk that an issuer of an investment will not fulfill its obligation to the holder of the investment.This is measured by the assignment of a nationally recognized statistical rating organization. The table below representsthe minimum rating required by the California Government Code (where applicable), or Omnitrans’ investment policy, andthe actual rating as of year-end for each investment type.
MinimumLegal Rating as of Year End
Investment Type Amount Rating AAA AA A Not Rated
Local Agency Investment Fund $21,693,589 N/A - - - 21,693,589
Total $21,693,589 - - - 21,693,589
CONCENTRATION OF CREDIT RISK
Concentration of credit risk is the risk of loss attributed to the magnitude of Omnitrans’ investment in a single issue. Theinvestment policy of Omnitrans contains no limitations on the amount that can be invested in any one issuer beyond thatstipulated by the California Government Code. As of June 30, 2012, Omnitrans did not have any investments in any one issuer (other than external investment pools) that represented 5% or more of its total investment portfolio.
CUSTODIAL CREDIT RISK
Custodial credit risk for deposits is the risk that, in the event of the failure of a depository financial institution, Omnitranswill not be able to recover its deposits or will not be able to recover collateral securities that are in the possession of an outside
20
FIN
AN
CIA
L S
ECTI
ON

212 0 1 2 C o m p r e h e n s i v e A n n u a l F i n a n c i a l R e p o r t
party. The custodial credit risk for investments is the risk that, in the event of the failure of the counterparty (e.g., broker-dealer)to a transaction, a government will not be able to recover the value of its investment or collateral securities that are in thepossession of another party. The California Government Code and Omnitrans’ investment policy do not contain legal orpolicy requirements that would limit the exposure to custodial credit risk for deposits or investments, other than the followingprovision for deposits. The California Government Code requires that a financial institution secure deposits made by stateor local government units by pledging securities in an undivided collateral pool held by a depository regulated under statelaw (unless so waived by the governmental unit). The market value of the pledged securities in the collateral pool mustequal at least 110% of the total amount deposited by the public agencies. California law also allows financial institutionsto secure Omnitrans’ deposits by pledging first trust deed mortgage notes having a value of 150% of the secured publicdeposits. As of June 30, 2012, $173,676 of Omnitrans’ deposits held by Morgan Stanley Smith Barney were uncollateralized.
INVESTMENT IN LAIF
Omnitrans is a voluntary participant in the Local Agency Investment Fund (LAIF), which is regulated by California GovernmentCode Section 16429.1 through 16429.4 under the oversight of the Treasurer of the State of California. The fair value of Omnitrans’ investment in this pool is reported in the accompanying financial statements at amounts based upon Omnitrans’pro-rata share of the fair value provided by LAIF for the entire LAIF portfolio (in relation to the amortized cost of that portfolio).The balance available for withdrawal is based on the accounting records maintained by LAIF, which are recorded on anamortized cost basis. Included in LAIF’s investment portfolio are mortgage-backed securities, loans to certain state funds, securities with interest rates that vary according to changes in rates greater than a one-for-one basis, and structured notes.LAIF is not rated.
(3) FEDERAL, STATE AND LOCAL GRANTS
Omnitrans receives operating and capital assistance from various federal, state and local sources.
FEDERAL ASSISTANCE
Under the provision of the Federal Transit Administration (FTA), funds are available to Omnitrans for preventive maintenance, security, and various capital costs. Total FTA revenue recognized during the fiscal year ended June 30, 2012 was $39,989,581.
TRANSPORTATION DEVELOPMENT ACT ASSISTANCE
Pursuant to provisions of the 1971 Transportation Development Act (TDA), as amended, the California State Legislatureenacted the Local Transportation Fund (LTF) and the State Transit Assistance Fund (STAF) to provide operating and capitalassistance for public transportation. These funds are received from the County of San Bernardino based on annual claimsfiled by Omnitrans and approved by the San Bernardino Associated Governments (SANBAG), the regional transportationplanning entity.
To be eligible for TDA funds, Omnitrans must maintain a ratio of passenger fares to operating costs of not less than 20.00%for general public transit service and 10.00% for specialized service for the elderly and handicapped. After considering certain cost exemption provisions of the TDA, Omnitrans’ ratios for the fiscal year ended June 30, 2012 were 23.81% forgeneral public transit service, and 12.57% for specialized service for the elderly and handicapped. Total TDA revenue recognized during the fiscal year ended June 30, 2012 was $33,828,990.
MEASURE I
Omnitrans receives Measure I funds for paratransit operating costs. Measure I funds are derived from a locally imposed0.5% retail sales and use tax on all taxable sales within the County of San Bernardino. The allocation and administrationof Measure I is performed by SANBAG. Total Measure I revenue recognized during the fiscal year ended June 30, 2012was $6,379,645.
FINA
NC
IAL S
ECTIO
N

2 0 1 2 C o m p r e h e n s i v e A n n u a l F i n a n c i a l R e p o r t
PROPOSITION 1B
The Public Transportation Modernization, Improvement and Service Enhancement Account (PTMISEA) Fund is a part ofthe State of California’s Highway Safety, Traffic Reduction, Air Quality, and Port Security Bond Act of 2006 (Bond Act),approved by California voters as Proposition 1B on November 7, 2006. A total of $19.9 billion was deposited into thePTMISEA fund, $3.6 billion of which was made available to project sponsors in California for allocation to eligible publictransportation projects over a 10-year period. Proposition 1B funds can be used for rehabilitation, safety or modernizationimprovements, capital service enhancements or expansions, new capital projects, bus rapid transit improvements, orfor rolling stock procurement, rehabilitation or replacement. During the fiscal year ended June 30, 2012, Proposition 1Bcash receipts and cash disbursements were as follows:
Unspent Proposition 1B funds as of June 30, 2011 $7,120,882Proposition 1B funds received during the fiscal year ended June 30, 2012 128,566Proposition 1B expenses incurred during the fiscal year ended June 30, 2012 (2,418,114)Interest revenue earned on unspent Proposition 1B funds during the fiscal year ended June 30, 2012 5,170
Total unspent Proposition 1B funds as of June 30, 2012 $4,836,504
(4) LONG-TERM LIABILITIES
Long-term liabilities for the year ended June 30, 2012 are as follows:
AmountDue
Balance on Balance on Due Within BeyondJune 30, 2011 Additions Deletions June 30, 2012 One Year One Year
Compensatedabsences $3,746,297 1,977,953 (1,912,666) 3,811,584 2,507,658 1,303,926
Capital leases 114,308 652,369 (176,306) 590,371 164,980 425,391Claims payable 9,462,232 2,859,989 (1,596,222) 10,725,999 3,037,871 7,688,128
Total long-termliabilities $13,322,837 5,490,311 (3,685,194) 15,127,954 5,710,509 9,417,445
CAPITAL LEASE OBLIGATIONS
During April 2012, Omnitrans entered into two lease financing arrangements for 29 vehicles with Enterprise Fleet Services.The minimum lease payments required during the current five-year term of these agreements are $665,411. The lease payments have a present value of $652,369, which approximates the value of the asset, and is the amount capitalizedin Omnitrans’ capital assets. The outstanding principal balance was $516,696 as of June 30, 2012.
During May 2010, Omnitrans entered into two lease financing arrangements for five relief vehicles with Enterprise FleetServices. The minimum lease payments required during the current five-year term of these agreements are $147,420.The lease payments have a present value of $135,836, which approximates the value of the asset, and is the amountcapitalized in Omnitrans’ capital assets. The outstanding principal balance was $63,399 as of June 30, 2012.
In December 2007, Omnitrans entered into an equipment lease for ten copiers in the amount of $169,954. The term of the agreement approximates the useful lives of the copiers. The monthly installment payments of $1,303 are due onthe first day of each month commencing March 1, 2008 and ending February 1, 2013. The outstanding principal balancewas $10,276 as of June 30, 2012.
22
FIN
AN
CIA
L S
ECTI
ON

232 0 1 2 C o m p r e h e n s i v e A n n u a l F i n a n c i a l R e p o r t
The future minimum lease obligations and the net present value of these minimum lease payments as of June 30, 2012 were as follows:
Year EndingJune 30 Principal Interest Total
2013 $164,981 8,007 172,9882014 157,123 5,444 162,5672015 139,166 2,757 141,9232016 129,101 1,392 130,493
Total $590,371 17,600 607,971
(5) CAPITAL ASSETS
Capital asset activity for the year ended June 30, 2012 is as follows:
Balance at Balance atJune 30, 2011 Additions Retirements June 30, 2012
CAPITAL ASSETS, NOT DEPRECIATED:Land $10,731,918 - - 10,731,918Construction in progress 33,000,960 33,343,986 (13,900,383) 52,444,563Total capital assets,not depreciated $43,732,878 33,343,986 (13,900,383) 63,176,481
CAPITAL ASSETS, DEPRECIATED:Buildings and improvements 45,893,036 - - 45,893,036Operations equipment 78,485,398 13,818,690 (3,463,574) 88,840,514Furniture and office equipment 35,646,877 1,301,778 (11,777) 36,936,878Total capital assets,depreciated $160,025,311 15,120,468 (3,475,351) 171,670,428
LESS ACCUMULATED DEPRECIATION FOR:Buildings and improvements (21,026,164) (1,840,128) - (22,866,292)Operations equipment (48,776,140) (7,690,192) 3,192,470 (53,273,862)Furniture and office equipment (14,475,351) (7,539,974) 11,777 (22,003,548)
Total accumulateddepreciation (84,277,655) (17,070,294) 3,204,247 (98,143,702)
Total capital assets, depreciated, net 75,747,656 (1,949,826) (271,104) 73,526,726
Capital assets, net $119,480,534 31,394,160 (14,171,487) 136,703,207
Depreciation expense for the year ended June 30, 2012 was $17,070,294.
FINA
NC
IAL S
ECTIO
N
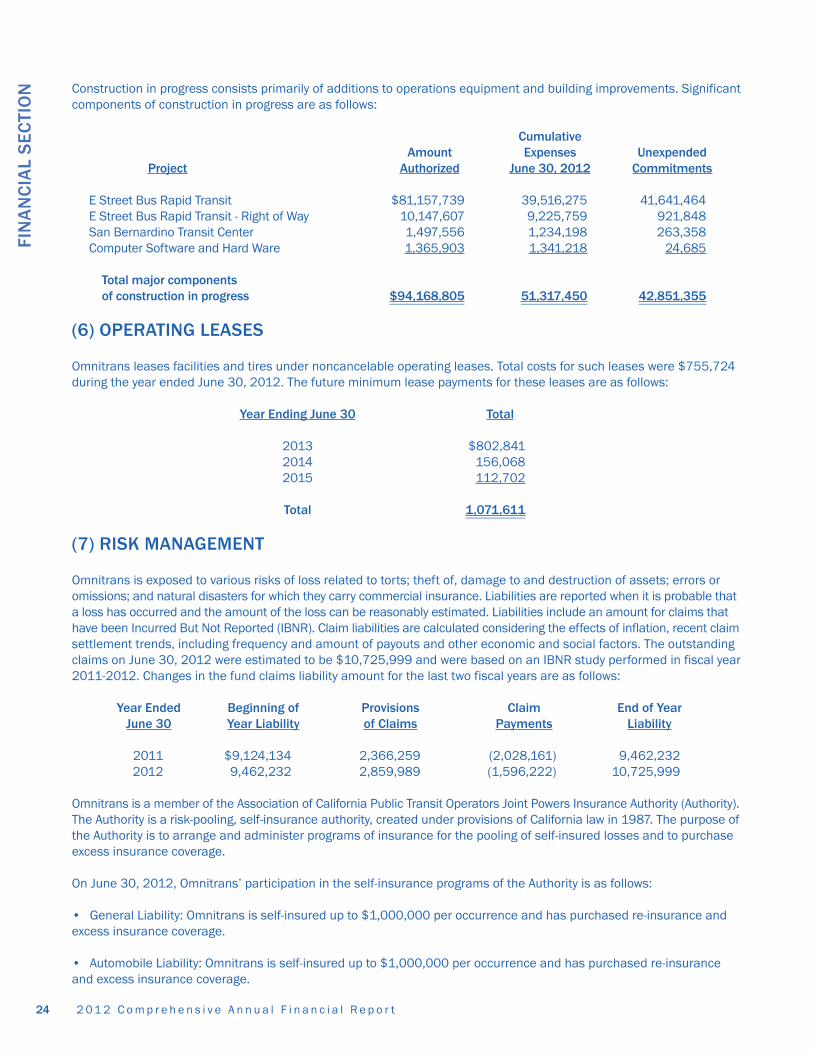
2 0 1 2 C o m p r e h e n s i v e A n n u a l F i n a n c i a l R e p o r t
Construction in progress consists primarily of additions to operations equipment and building improvements. Significantcomponents of construction in progress are as follows:
CumulativeAmount Expenses Unexpended
Project Authorized June 30, 2012 Commitments
E Street Bus Rapid Transit $81,157,739 39,516,275 41,641,464E Street Bus Rapid Transit - Right of Way 10,147,607 9,225,759 921,848San Bernardino Transit Center 1,497,556 1,234,198 263,358Computer Software and Hard Ware 1,365,903 1,341,218 24,685
Total major componentsof construction in progress $94,168,805 51,317,450 42,851,355
(6) OPERATING LEASES
Omnitrans leases facilities and tires under noncancelable operating leases. Total costs for such leases were $755,724during the year ended June 30, 2012. The future minimum lease payments for these leases are as follows:
Year Ending June 30 Total
2013 $802,8412014 156,0682015 112,702
Total 1,071,611
(7) RISK MANAGEMENT
Omnitrans is exposed to various risks of loss related to torts; theft of, damage to and destruction of assets; errors oromissions; and natural disasters for which they carry commercial insurance. Liabilities are reported when it is probable thata loss has occurred and the amount of the loss can be reasonably estimated. Liabilities include an amount for claims thathave been Incurred But Not Reported (IBNR). Claim liabilities are calculated considering the effects of inflation, recent claimsettlement trends, including frequency and amount of payouts and other economic and social factors. The outstandingclaims on June 30, 2012 were estimated to be $10,725,999 and were based on an IBNR study performed in fiscal year2011-2012. Changes in the fund claims liability amount for the last two fiscal years are as follows:
Year Ended Beginning of Provisions Claim End of YearJune 30 Year Liability of Claims Payments Liability
2011 $9,124,134 2,366,259 (2,028,161) 9,462,232 2012 9,462,232 2,859,989 (1,596,222) 10,725,999
Omnitrans is a member of the Association of California Public Transit Operators Joint Powers Insurance Authority (Authority).The Authority is a risk-pooling, self-insurance authority, created under provisions of California law in 1987. The purpose ofthe Authority is to arrange and administer programs of insurance for the pooling of self-insured losses and to purchaseexcess insurance coverage.
On June 30, 2012, Omnitrans’ participation in the self-insurance programs of the Authority is as follows:
• General Liability: Omnitrans is self-insured up to $1,000,000 per occurrence and has purchased re-insurance andexcess insurance coverage.
• Automobile Liability: Omnitrans is self-insured up to $1,000,000 per occurrence and has purchased re-insuranceand excess insurance coverage.
24
FIN
AN
CIA
L S
ECTI
ON
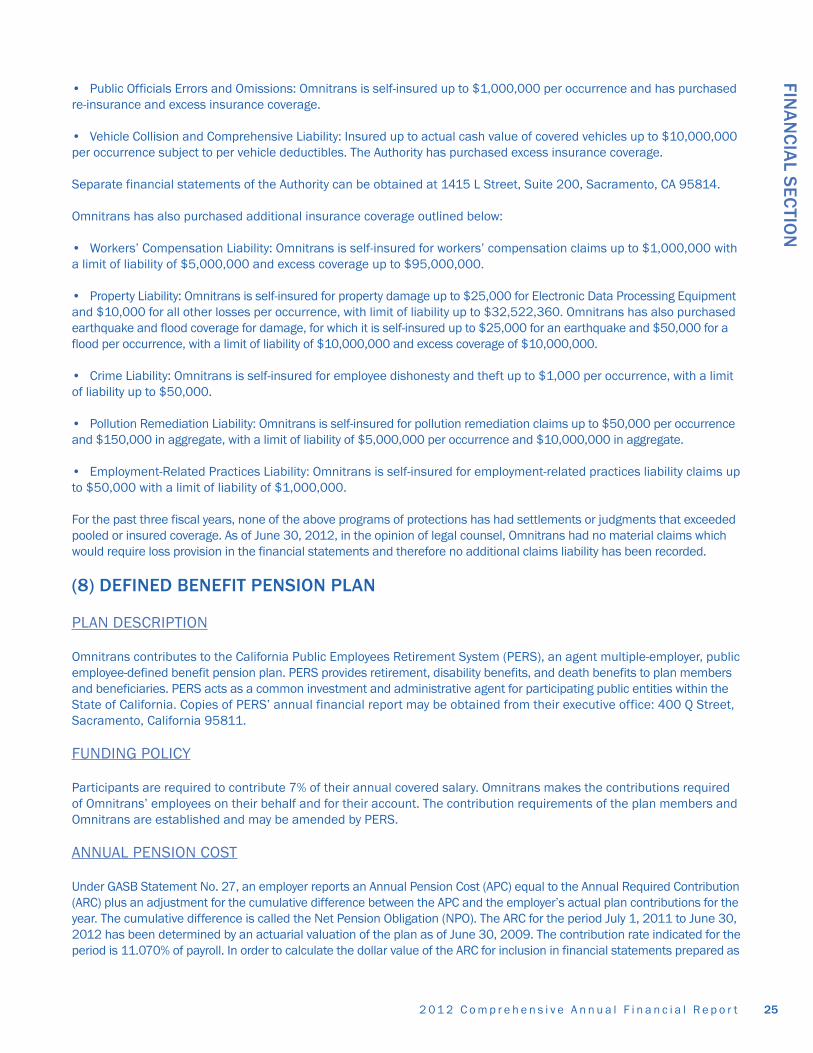
252 0 1 2 C o m p r e h e n s i v e A n n u a l F i n a n c i a l R e p o r t
• Public Officials Errors and Omissions: Omnitrans is self-insured up to $1,000,000 per occurrence and has purchasedre-insurance and excess insurance coverage.
• Vehicle Collision and Comprehensive Liability: Insured up to actual cash value of covered vehicles up to $10,000,000per occurrence subject to per vehicle deductibles. The Authority has purchased excess insurance coverage.
Separate financial statements of the Authority can be obtained at 1415 L Street, Suite 200, Sacramento, CA 95814.
Omnitrans has also purchased additional insurance coverage outlined below:
• Workers’ Compensation Liability: Omnitrans is self-insured for workers’ compensation claims up to $1,000,000 witha limit of liability of $5,000,000 and excess coverage up to $95,000,000.
• Property Liability: Omnitrans is self-insured for property damage up to $25,000 for Electronic Data Processing Equipmentand $10,000 for all other losses per occurrence, with limit of liability up to $32,522,360. Omnitrans has also purchasedearthquake and flood coverage for damage, for which it is self-insured up to $25,000 for an earthquake and $50,000 for aflood per occurrence, with a limit of liability of $10,000,000 and excess coverage of $10,000,000.
• Crime Liability: Omnitrans is self-insured for employee dishonesty and theft up to $1,000 per occurrence, with a limitof liability up to $50,000.
• Pollution Remediation Liability: Omnitrans is self-insured for pollution remediation claims up to $50,000 per occurrenceand $150,000 in aggregate, with a limit of liability of $5,000,000 per occurrence and $10,000,000 in aggregate.
• Employment-Related Practices Liability: Omnitrans is self-insured for employment-related practices liability claims upto $50,000 with a limit of liability of $1,000,000.
For the past three fiscal years, none of the above programs of protections has had settlements or judgments that exceededpooled or insured coverage. As of June 30, 2012, in the opinion of legal counsel, Omnitrans had no material claims whichwould require loss provision in the financial statements and therefore no additional claims liability has been recorded.
(8) DEFINED BENEFIT PENSION PLAN
PLAN DESCRIPTION
Omnitrans contributes to the California Public Employees Retirement System (PERS), an agent multiple-employer, publicemployee-defined benefit pension plan. PERS provides retirement, disability benefits, and death benefits to plan membersand beneficiaries. PERS acts as a common investment and administrative agent for participating public entities within theState of California. Copies of PERS’ annual financial report may be obtained from their executive office: 400 Q Street,Sacramento, California 95811.
FUNDING POLICY
Participants are required to contribute 7% of their annual covered salary. Omnitrans makes the contributions requiredof Omnitrans’ employees on their behalf and for their account. The contribution requirements of the plan members andOmnitrans are established and may be amended by PERS.
ANNUAL PENSION COST
Under GASB Statement No. 27, an employer reports an Annual Pension Cost (APC) equal to the Annual Required Contribution(ARC) plus an adjustment for the cumulative difference between the APC and the employer’s actual plan contributions for theyear. The cumulative difference is called the Net Pension Obligation (NPO). The ARC for the period July 1, 2011 to June 30,2012 has been determined by an actuarial valuation of the plan as of June 30, 2009. The contribution rate indicated for theperiod is 11.070% of payroll. In order to calculate the dollar value of the ARC for inclusion in financial statements prepared as
FINA
NC
IAL S
ECTIO
N
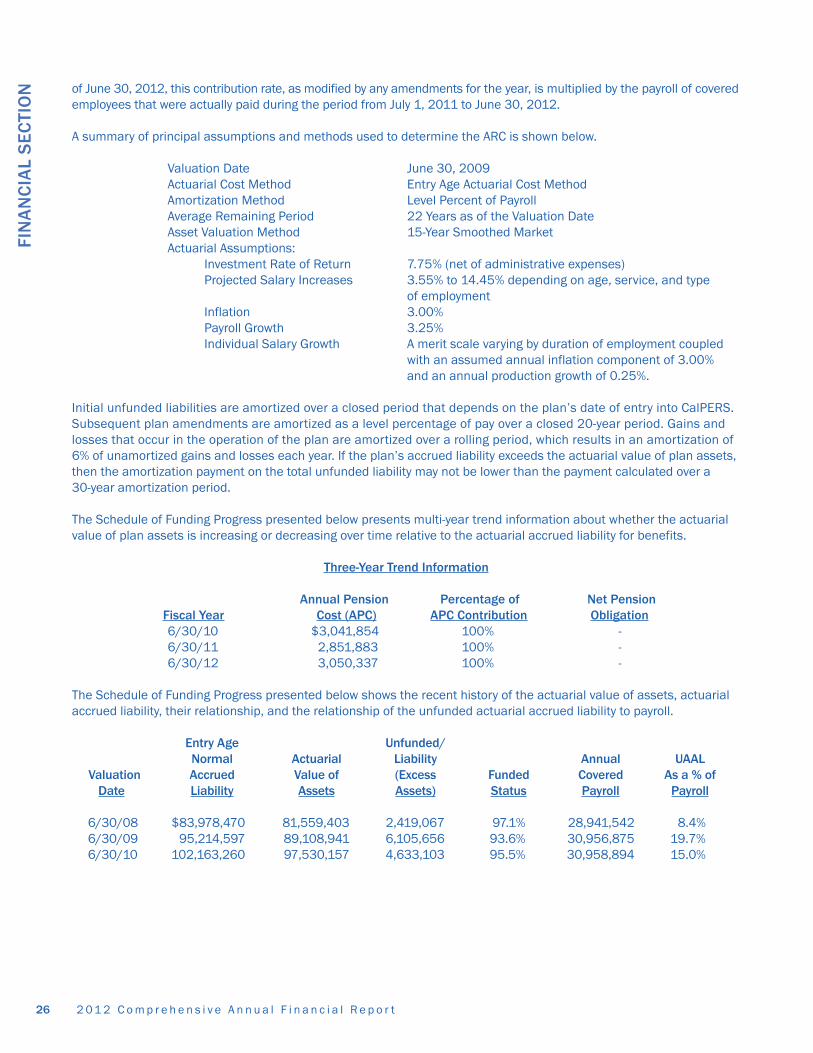
2 0 1 2 C o m p r e h e n s i v e A n n u a l F i n a n c i a l R e p o r t
of June 30, 2012, this contribution rate, as modified by any amendments for the year, is multiplied by the payroll of coveredemployees that were actually paid during the period from July 1, 2011 to June 30, 2012.
A summary of principal assumptions and methods used to determine the ARC is shown below.
Valuation Date June 30, 2009Actuarial Cost Method Entry Age Actuarial Cost MethodAmortization Method Level Percent of PayrollAverage Remaining Period 22 Years as of the Valuation DateAsset Valuation Method 15-Year Smoothed MarketActuarial Assumptions:
Investment Rate of Return 7.75% (net of administrative expenses)Projected Salary Increases 3.55% to 14.45% depending on age, service, and type
of employmentInflation 3.00%Payroll Growth 3.25%Individual Salary Growth A merit scale varying by duration of employment coupled
with an assumed annual inflation component of 3.00% and an annual production growth of 0.25%.
Initial unfunded liabilities are amortized over a closed period that depends on the plan’s date of entry into CalPERS.Subsequent plan amendments are amortized as a level percentage of pay over a closed 20-year period. Gains andlosses that occur in the operation of the plan are amortized over a rolling period, which results in an amortization of 6% of unamortized gains and losses each year. If the plan’s accrued liability exceeds the actuarial value of plan assets,then the amortization payment on the total unfunded liability may not be lower than the payment calculated over a 30-year amortization period.
The Schedule of Funding Progress presented below presents multi-year trend information about whether the actuarialvalue of plan assets is increasing or decreasing over time relative to the actuarial accrued liability for benefits.
Three-Year Trend Information
Annual Pension Percentage of Net Pension Fiscal Year Cost (APC) APC Contribution Obligation6/30/10 $3,041,854 100% -6/30/11 2,851,883 100% -6/30/12 3,050,337 100% -
The Schedule of Funding Progress presented below shows the recent history of the actuarial value of assets, actuarialaccrued liability, their relationship, and the relationship of the unfunded actuarial accrued liability to payroll.
Entry Age Unfunded/Normal Actuarial Liability Annual UAAL
Valuation Accrued Value of (Excess Funded Covered As a % ofDate Liability Assets Assets) Status Payroll Payroll
6/30/08 $83,978,470 81,559,403 2,419,067 97.1% 28,941,542 8.4%6/30/09 95,214,597 89,108,941 6,105,656 93.6% 30,956,875 19.7%6/30/10 102,163,260 97,530,157 4,633,103 95.5% 30,958,894 15.0%
26
FIN
AN
CIA
L S
ECTI
ON
272 0 1 2 C o m p r e h e n s i v e A n n u a l F i n a n c i a l R e p o r t
(9) COMMITMENTS AND CONTINGENCIES
LITIGATION
Omnitrans is subject to lawsuits and claims which arise out of the normal course of business. In the opinion of management,based upon the opinion of legal counsel, the disposition of such actions of which it is aware will not have a material effect onthe financial position, results of operations or liquidity of Omnitrans.
CONTINGENCIES
Omnitrans has received federal and state funds for specific purposes that are subject to review and audit by grantoragencies. Although such audits could generate expenditure disallowances under the terms of the grants, in the opinionof management, any additional required reimbursement will not have a material effect on the financial position, resultsof operations or liquidity of Omnitrans.
(10) PASS-THROUGH GRANTS
In November 2003, the Board approved a grant to the City of Needles for the restoration of the El Garces Hotel/SantaFe Depot. The restoration is funded by FTA funds with Omnitrans acting as the administrative agent and the City of Needlesacting as the sub-grantee. During the fiscal year ended June 30, 2012, expenses incurred were $110,934.
In November 2004, the Board approved an agreement between Omnitrans and Chaffey College which initiated the cooperation and participation in development and construction of the Chaffey College Transcenter to be located in theCity of Rancho Cucamonga. During the fiscal year ended June 30, 2012, expenses incurred were $265,825.
In March 2008, the Board approved an agreement between Omnitrans and SANBAG which included a cooperative andcollaborative process to establish the range of alternatives to be considered and factors to be addressed regarding theSan Bernardino to Redlands Corridor Regionally Significant Transportation Investment Study (RSTIS) and EnvironmentalAnalysis. During the fiscal year ended June 30, 2012, expenses incurred were $7,465.
In August 2009, the Board approved an agreement to obtain New Freedom Funds for the Inland Valley Recovery Servicesto operate a rehab center that would purchase and operate a vehicle. During the fiscal year ended June 30, 2012,expenses incurred were $23,762.
In October 2009, Omnitrans received an FTA Award for various projects. Within that award agreement was a portion topass through to the City of Chino for the Chino Transit Terminal Facility Improvements to be located in the City of Chino.During the fiscal year ended June 30, 2012, expenses incurred were $7,993.
In December 2010, the Board approved an agreement between Omnitrans and the City of Ontario to participate in theconstruction of the Ontario Civic Center Transit Station to be located in the city of Ontario. During the fiscal year endedJune 30, 2012, expenses incurred were $13,451.
In February 2011, the Board approved an agreement between Omnitrans and the City of Rialto to participate in the RialtoMetrolink Expansion Project to be located in the City of Rialto. During the fiscal year ended June 30, 2012, expensesincurred were $14,532.
In March 2012, the Board approved an agreement between Omnitrans and Central City Lutheran to fund the purchase of a vehicle for medical and social service appointments and operating expenses. During the fiscal yearended June 30, 2012, expenses incurred were $56,521.
In January 2012, the Board approved an agreement between Omnitrans and Pomona Valley Workshop (PVW) to participatein the PVW In Motion Program and fund the purchase of 4 vehicles and the hiring of a transportation coordinator to overseethe program. During the fiscal year ended June 30, 2012, expenses incurred were $117,292.
FINA
NC
IAL S
ECTIO
N

2 0 1 2 C o m p r e h e n s i v e A n n u a l F i n a n c i a l R e p o r t
In February 2012, the Board approved an agreement between Omnitrans and Valley Transportation Services to fund thestaffing of 5 travel training project employees. During the fiscal year ended June 30, 2012, expenses incurred were $1,725.
In February 2012, the Board approved an agreement between Omnitrans and Community Senior Services to establish avolunteer driver program to service disabled residents of west San Bernardino Valley. During the fiscal year ended June30, 2012, expenses incurred were $608.
Pass-through activity for the year ended June 30, 2012 is summarized as follows:
City of Needles $110,934Chaffey College Transit Center 265,825SANBAG 7,465Inland Valley Recovery Services 23,762City of Chino 7,993City of Ontario 13,451City of Rialto 14,532Central City Lutheran 56,521Pomona Valley 117,292Valley Transportation Services 1,725Community Senior Services 608
Total $620,108
(11) NET POSITION
The following is a detailed breakdown of net position. Also shown below is a listing of the uses of unrestricted net position.
Capital assets, net of accumulated depreciation $136,703,207Less: Debt offsetting capital assets (590,371)
Net investment in capital assets 136,112,836Unrestricted net position 8,548,071
Total net position $144,660,907
Although not legally restricted, unrestricted net position has been recorded as reserves for various purposes. These reserveshave been established and maintained to provide sound financial management and a stable and equitable rate structure.The June 30, 2012 reserve amounts consist of the following:
Reserved for bus transit operations, workers’compensation and general liability contingencies $8,548,071
Total unrestricted net position $8,548,071
(12) DERIVATIVE INSTRUMENTS
Omnitrans holds a basket of natural gas futures contracts with a contract price of $3.349 / MMBtu and a notional amountof 12,500 MMBtus / month that settle on a monthly basis. As of June 30, 2012, there were 23 remaining monthly settlementsas the last maturity date is May 29, 2014. These futures contracts are classified as cash flow hedges of forecasted purchases(12,500 MMBtus per month) of clean energy natural gas through May 2014.
28
FIN
AN
CIA
L S
ECTI
ON
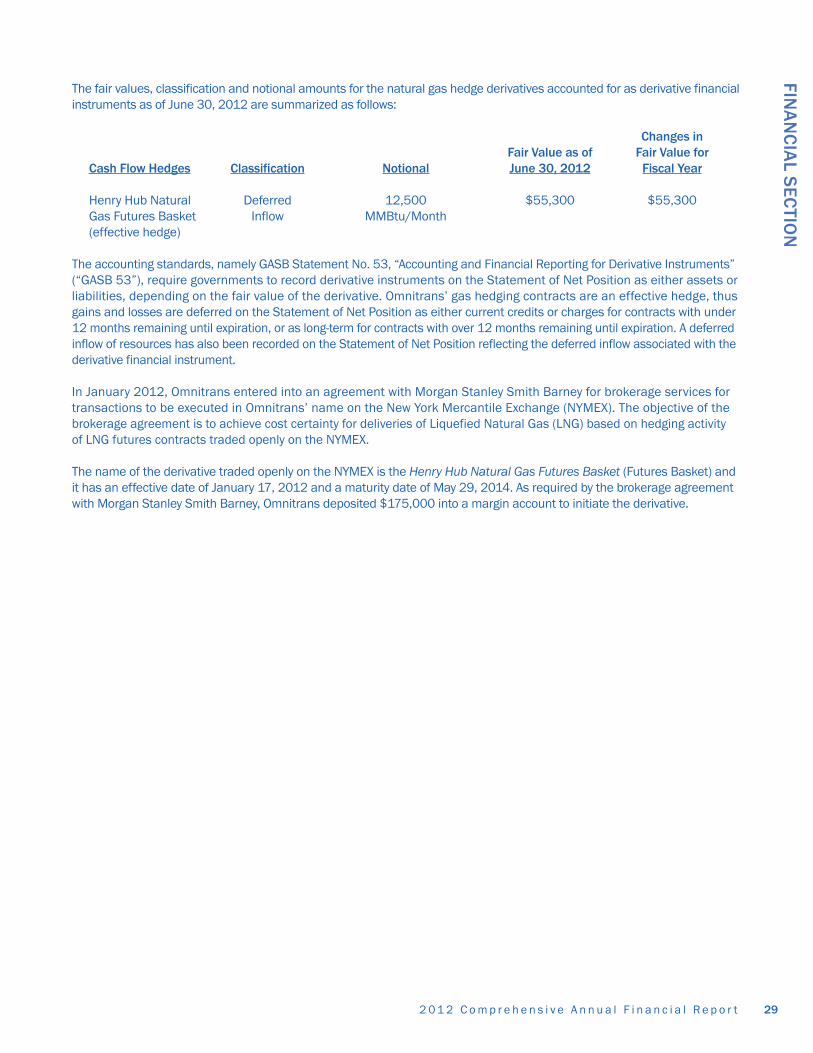
292 0 1 2 C o m p r e h e n s i v e A n n u a l F i n a n c i a l R e p o r t
FINA
NC
IAL S
ECTIO
N
The fair values, classification and notional amounts for the natural gas hedge derivatives accounted for as derivative financialinstruments as of June 30, 2012 are summarized as follows:
Changes inFair Value as of Fair Value for
Cash Flow Hedges Classification Notional June 30, 2012 Fiscal Year
Henry Hub Natural Deferred 12,500 $55,300 $55,300Gas Futures Basket Inflow MMBtu/Month(effective hedge)
The accounting standards, namely GASB Statement No. 53, “Accounting and Financial Reporting for Derivative Instruments”(“GASB 53”), require governments to record derivative instruments on the Statement of Net Position as either assets orliabilities, depending on the fair value of the derivative. Omnitrans’ gas hedging contracts are an effective hedge, thusgains and losses are deferred on the Statement of Net Position as either current credits or charges for contracts with under 12 months remaining until expiration, or as long-term for contracts with over 12 months remaining until expiration. A deferredinflow of resources has also been recorded on the Statement of Net Position reflecting the deferred inflow associated with thederivative financial instrument.
In January 2012, Omnitrans entered into an agreement with Morgan Stanley Smith Barney for brokerage services fortransactions to be executed in Omnitrans’ name on the New York Mercantile Exchange (NYMEX). The objective of the brokerage agreement is to achieve cost certainty for deliveries of Liquefied Natural Gas (LNG) based on hedging activity of LNG futures contracts traded openly on the NYMEX.
The name of the derivative traded openly on the NYMEX is the Henry Hub Natural Gas Futures Basket (Futures Basket) andit has an effective date of January 17, 2012 and a maturity date of May 29, 2014. As required by the brokerage agreementwith Morgan Stanley Smith Barney, Omnitrans deposited $175,000 into a margin account to initiate the derivative.

30
THIS PAGE LEFT BLANK INTENTIONALLY

CONNECTING COMMUNITYOUR
STATIS
TICA
L SEC
TION
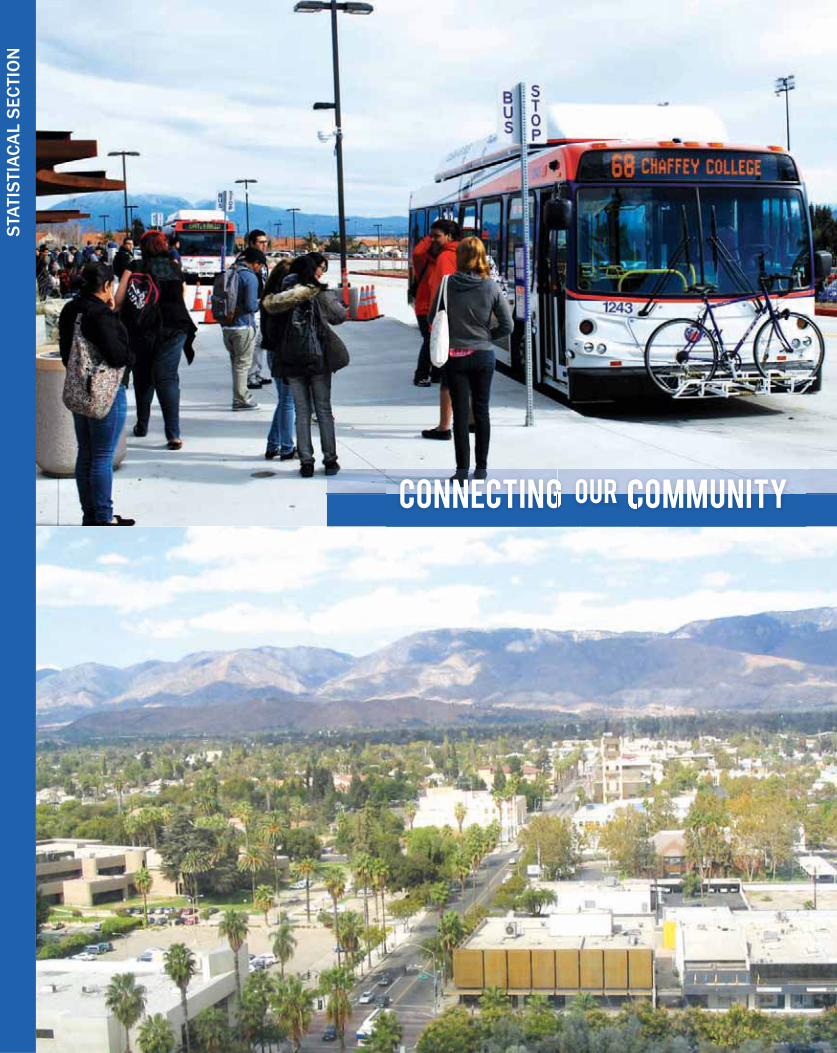
CONNECTING COMMUNITYOUR
STA
TIS
TIA
CA
L S
ECTI
ON

312 0 1 2 C o m p r e h e n s i v e A n n u a l F i n a n c i a l R e p o r t
STATISTICAL SECTION
This section of Omnitrans’ Comprehensive Annual Financial Report presents detailed information as a context forunderstanding what the information in the financial statements, note disclosures, and required supplementary information says about Omnitrans’ overall financial health. This information has not been audited by the independent auditors.
Page
FINANCIAL TRENDS 32 These schedules contain trend information to help the reader understand how Omnitrans’ financial performance and well-being has changed over time.
REVENUE CAPACITY 34These schedules contain information to help the reader assess Omnitrans’ most significant local revenue source, passenger fares.
THE ECONOMY AND ECONOMIC OUTLOOK 39These schedules offer demographic and economic indicators to help the reader understand the environment within which Omnitrans’ financial activities take place.
OPERATING INFORMATION 40These schedules contain service and infrastructure data to help the reader understand how the information in Omnitrans’ financial report relates to the services Omnitrans provides and the activities it performs.
Source: Unless otherwise noted, the information in these schedules derived from the Comprehensive Annual FinancialReports for the relevant years. Omnitrans implemented Governmental Accounting Standards Board, Statement Number34 (GASB 34) in the fiscal year ended June 30, 2003; schedules presented government-wide information includes informationbeginning in the year.
STATIS
TICA
L SEC
TION

2 0 1 2 C o m p r e h e n s i v e A n n u a l F i n a n c i a l R e p o r t32
STA
TIS
TIC
AL
SEC
TIO
N FI
NA
NC
IAL
TREN
DS
NET
PO
SIT
ION
BY
CO
MPO
NEN
T
2200
32
00
42
00
52
00
62
007
20
08
200
92
010
201
120
12
Capi
tal a
sset
s, n
et o
f ac
cum
ulat
ed d
epre
ciat
ion
$6
8,9
67
,32
9
77,1
67
,08
581
,66
4,8
277
9,3
18,6
62
8
4,7
31,3
56
8
4,3
17,3
08
94
,90
9,0
96
114
,54
0,7
64
119
,48
0,5
34
136
,70
3,2
07
Less
: Deb
t off
sett
ing
capi
tal a
sset
s5
47,9
21
85
0,1
73
0
(5
7,0
44
)(4
04
,37
2)
(36
4,3
70
)(2
41,2
26
)(2
51,1
29
)(1
14,3
08
)(5
90
,371
)
Tota
l inv
este
d in
cap
ital a
sset
s,
69
,515
,25
07
8,0
17,2
58
81
,66
4,8
27
79
,261
,618
8
4,3
26
,98
4
83
,95
2,9
38
9
4,6
67
,87
0
114
,28
9,6
35
119
,36
6,2
26
136
,11
2,8
36
net o
f rel
ated
deb
t
Unr
estr
icte
d ne
t ass
ets
16,7
78
,83
3
15,0
05
,58
3
17,6
17,0
17
28
,25
6,7
48
2
9,6
83
,07
9
33
,30
0,9
03
3
3,8
83
,45
5
29
,32
0,7
46
14,7
17,7
94
8,5
48
,071
Tota
l net
pos
ition
$8
6,2
94
,08
3
93
,02
2,8
41
99
,281
,84
4
107
,51
8,3
66
1
14
,01
0,0
63
1
17,2
53
,841
12
8,5
51,3
25
14
3,6
10
,381
13
4,0
84
,02
0
14
4,6
60
,907
Om
nitr
ans
impl
emen
ted
GAS
B 3
4 d
urin
g th
e fis
cal y
ear e
nd J
une
30
, 20
03
. The
incr
ease
in n
et p
ositi
on is
mai
nly
attr
ibut
ed to
ong
oing
con
stru
ctio
n of
the
San
Ber
nard
ino
Expr
ess
Bus
Rap
id T
rans
it (s
bX),
and
prel
imin
ary
engi
neer
ing
and
desi
gn o
f the
San
Ber
nard
ino
Tran
sit C
ente
r pro
ject
s.
Sour
ce: F
inan
ce D
epar
tmen
t
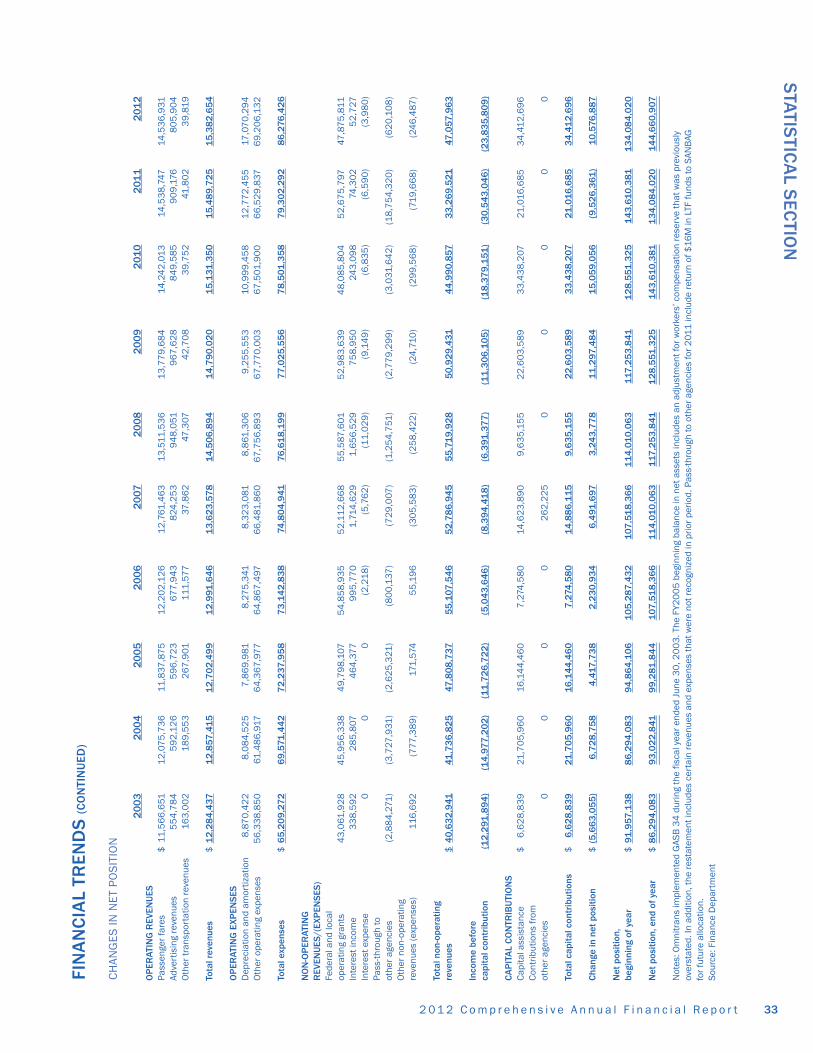
332 0 1 2 C o m p r e h e n s i v e A n n u a l F i n a n c i a l R e p o r t
STATIS
TICA
L SEC
TION
FIN
AN
CIA
L TR
END
S (C
ON
TIN
UED
)
CH
ANG
ES IN
NET
PO
SIT
ION
20
03
20
04
20
05
20
06
20
072
00
82
00
92
010
201
12
012
OP
ERAT
ING
REV
ENU
ESPa
ssen
ger f
ares
$11
,56
6,6
511
2,0
75
,73
611
,837
,87
51
2,2
02
,12
61
2,7
61,4
63
13,5
11,5
36
13,7
79
,68
414
,24
2,0
1314
,53
8,7
4714
,53
6,9
31Ad
vert
isin
g re
venu
es5
54
,78
45
92
,12
65
96
,72
36
77,9
43
824
,25
39
48
,051
96
7,6
28
84
9,5
85
90
9,1
768
05
,90
4O
ther
tran
spor
tatio
n re
venu
es16
3,0
02
189
,55
32
67
,901
111,
577
37,8
62
47,3
074
2,7
08
39
,75
241
,80
23
9,8
19
Tota
l rev
enue
s$
12
,28
4,4
371
2,8
57,4
15
12
,70
2,4
99
12
,991
,64
61
3,6
23
,57
81
4,5
06
,89
41
4,7
90
,02
01
5,1
31,3
50
15
,48
9,7
25
15
,38
2,6
54
OP
ERAT
ING
EXP
ENS
ESD
epre
ciat
ion
and
amor
tizat
ion
8,8
70
,42
28
,08
4,5
25
7,8
69
,981
8,2
75
,341
8,3
23
,081
8,8
61,3
06
9,2
55
,55
310
,99
9,4
58
12
,77
2,4
55
17,0
70
,29
4
Oth
er o
pera
ting
expe
nses
56
,33
8,8
50
61,4
86
,917
64
,36
7,9
776
4,8
67
,497
66
,481
,86
06
7,7
56
,89
36
7,7
70
,00
36
7,5
01,9
00
66
,52
9,8
376
9,2
06
,13
2
Tota
l exp
ense
s$
65
,20
9,2
72
69
,571
,44
27
2,2
37,9
58
73
,14
2,8
38
74,8
04
,941
76,6
18
,19
97
7,0
25
,55
67
8,5
01,3
58
79
,30
2,2
92
86
,276
,42
6
NO
N-O
PER
ATIN
G
REV
ENU
ES/(
EXP
ENS
ES)
Fede
ral a
nd lo
cal
oper
atin
g gr
ants
43
,061
,92
84
5,9
56
,33
84
9,7
98
,107
54
,85
8,9
35
52
,11
2,6
68
55
,587
,601
52
,98
3,6
39
48
,08
5,8
04
52
,67
5,7
9747
,87
5,8
11In
tere
st in
com
e3
38
,59
22
85
,807
46
4,3
779
95
,77
01,
714
,62
91,
65
6,5
29
75
8,9
50
243
,09
874
,30
25
2,7
27In
tere
st e
xpen
se0
00
(2,2
18)
(5,7
62
)(1
1,0
29
)(9
,14
9)
(6,8
35
)(6
,59
0)
(3,9
80
)Pa
ss-th
roug
h to
ot
her a
genc
ies
(2,8
84
,271
)(3
,727
,931
)(2
,62
5,3
21)
(80
0,1
37)
(72
9,0
07)
(1,2
54
,751
)(2
,77
9,2
99
)(3
,031
,64
2)
(18
,75
4,3
20
)(6
20
,10
8)
Oth
er n
on-o
pera
ting
reve
nues
(exp
ense
s)11
6,6
92
(777
,38
9)
171,
574
55
,19
6(3
05
,58
3)
(25
8,4
22
)(2
4,7
10)
(29
9,5
68
)(7
19,6
68
)(2
46
,487
)
Tota
l non
-ope
ratin
g re
venu
es$
40
,63
2,9
4141
,73
6,8
25
47,8
08
,737
55
,107
,54
65
2,7
86
,94
55
5,7
19
,92
85
0,9
29
,431
44
,99
0,8
573
3,2
69
,521
47,0
57,9
63
Inco
me
befo
re
capi
tal c
ontr
ibut
ion
(12
,291
,89
4)
(14
,977
,20
2)
(11
,72
6,7
22
)(5
,04
3,6
46
)(8
,39
4,4
18
)(6
,391
,37
7)
(11
,30
6,1
05
)(1
8,3
79
,151
)(3
0,5
43
,04
6)
(23
,83
5,8
09
)
CA
PIT
AL
CO
NTR
IBU
TIO
NS
Capi
tal a
ssis
tanc
e$
6,6
28
,83
921
,70
5,9
60
16,1
44
,46
07
,274
,58
014
,62
3,8
90
9,6
35
,15
52
2,6
03
,58
93
3,4
38
,207
21,0
16,6
85
34
,41
2,6
96
Cont
ribut
ions
from
ot
her a
genc
ies
00
00
26
2,2
25
00
00
0
Tota
l cap
ital c
ontr
ibut
ions
$6
,62
8,8
39
21,7
05
,96
01
6,1
44
,46
07
,274
,58
01
4,8
86
,11
59
,63
5,1
55
22
,60
3,5
89
33
,43
8,2
0721
,01
6,6
85
34
,41
2,6
96
Cha
nge
in n
et p
ositi
on$
(5,6
63
,05
5)
6,7
28
,75
84
,417
,73
82
,23
0,9
34
6,4
91,6
973
,24
3,7
78
11
,297
,48
41
5,0
59
,05
6(9
,52
6,3
61)
10
,576
,887
Net
pos
ition
, be
ginn
ing
of y
ear
$91
,957
,13
88
6,2
94
,08
39
4,8
64
,10
61
05
,287
,43
21
07,5
18
,36
61
14
,01
0,0
63
117
,25
3,8
411
28
,551
,32
51
43
,61
0,3
811
34
,08
4,0
20
Net
pos
ition
, end
of y
ear
$8
6,2
94
,08
39
3,0
22
,841
99
,281
,84
41
07,5
18
,36
61
14
,01
0,0
63
117
,25
3,8
411
28
,551
,32
51
43
,61
0,3
811
34
,08
4,0
20
14
4,6
60
,907
Not
es: O
mni
tran
s im
plem
ente
d G
ASB
34
dur
ing
the
fisca
l yea
r end
ed J
une
30
, 20
03
. The
FY2
00
5 b
egin
ning
bal
ance
in n
et a
sset
s in
clud
es a
n ad
just
men
t for
wor
kers
’ com
pens
atio
n re
serv
e th
at w
as p
revi
ousl
yov
erst
ated
. In
addi
tion,
the
rest
atem
ent i
nclu
des
cert
ain
reve
nues
and
exp
ense
s th
at w
ere
not r
ecog
nize
d in
prio
r per
iod.
Pas
s-th
roug
h to
oth
er a
genc
ies
for 2
011
incl
ude
retu
rn o
f $16
M in
LTF
fund
s to
SAN
BAG
for f
utur
e al
loca
tion.
Sour
ce: F
inan
ce D
epar
tmen
t
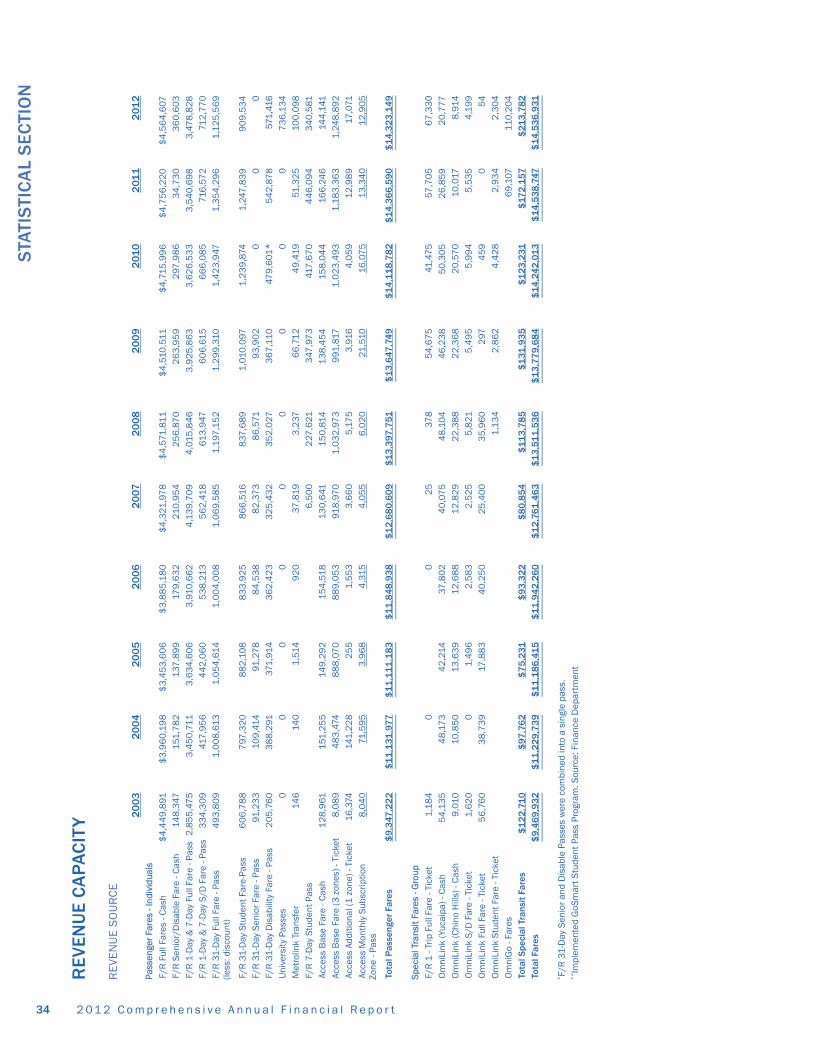
2 0 1 2 C o m p r e h e n s i v e A n n u a l F i n a n c i a l R e p o r t34
STA
TIS
TIC
AL
SEC
TIO
N
REV
ENU
E C
APA
CIT
Y
REV
ENU
E S
OU
RC
E
20
03
20
04
20
05
20
06
20
072
00
82
00
92
010
201
12
012
Pass
enge
r Far
es -
Indi
vidu
als
F/R
Ful
l Far
es -
Cash
$4
,44
9,8
91$
3,9
60
,19
8$
3,4
53
,60
6$
3,8
85
,18
0$
4,3
21,9
78
$4
,571
,811
$4
,510
,511
$4
,715
,99
6$
4,7
56
,22
0$
4,5
64
,607
F/R
Sen
ior/
Dis
able
Far
e - C
ash
148
,347
151,
78
213
7,8
99
179
,63
221
0,9
54
25
6,8
70
26
3,9
59
297
,98
63
4,7
30
36
0,6
03
F/R
1-D
ay &
7-D
ay F
ull F
are
- Pas
s2
,85
5,4
75
3,4
50
,711
3,6
34
,60
63
,910
,66
24
,13
9,7
09
4,0
15,8
46
3,9
25
,86
33
,62
6,5
33
3,5
40
,69
83
,47
8,8
28
F/R
1-D
ay &
7-D
ay S
/D F
are
- Pas
s3
34
,30
941
7,9
56
44
2,0
60
53
8,2
135
62
,418
613
,947
60
6,6
156
66
,08
571
6,5
72
712
,77
0F/
R 3
1-D
ay F
ull F
are
- Pas
s 4
93
,80
91,
00
8,6
131,
05
4,6
141,
00
4,0
08
1,0
69
,58
51,
197
,15
21,
29
9,3
101,
42
3,9
471,
35
4,2
96
1,1
25
,56
9(le
ss: d
isco
unt)
F/R
31
-Day
Stu
dent
Far
e-Pa
ss6
06
,78
87
97,3
20
88
2,1
08
83
3,9
25
86
6,5
168
37,6
89
1,01
0,0
971,
23
9,8
741,
247
,83
99
09
,53
4F/
R 3
1-D
ay S
enio
r Far
e - P
ass
91,2
33
109
,414
91,2
78
84
,53
88
2,3
73
86
,571
93
,90
20
00
F/R
31
-Day
Dis
abili
ty F
are
- Pas
s2
05
,76
03
88
,291
371,
914
36
2,4
23
32
5,4
32
35
2,0
273
67
,110
479
,601
*5
42
,87
857
1,41
6U
nive
rsity
Pas
ses
00
00
00
00
07
36
,13
4M
etro
link
Tran
sfer
146
140
1,51
49
20
37,8
193
,237
66
,71
24
9,4
1951
,32
510
0,0
98
F/R
7-D
ay S
tude
nt P
ass
6,5
00
227
,621
347
,97
341
7,6
70
44
6,0
94
34
0,5
81Ac
cess
Bas
e Fa
re -
Cash
12
8,9
6115
1,2
55
149
,29
215
4,5
1813
0,6
4115
0,8
1413
8,4
54
158
,04
416
6,2
46
144
,141
Acce
ss B
ase
Fare
(3 z
ones
) - T
icke
t8
,08
94
83
,474
88
8,0
70
88
9,0
53
918
,97
01,
03
2,9
73
991
,817
1,0
23
,49
31,
183
,36
31,
248
,89
2Ac
cess
Add
ition
al (1
zon
e) -
Tick
et16
,374
141,
22
82
55
1,5
53
3,6
60
5,1
75
3,9
164
,05
91
2,9
89
17,0
71Ac
cess
Mon
thly
Sub
scrip
tion
8,0
40
71,5
95
3,9
68
4,3
154
,05
56
,02
021
,510
16,0
75
13,3
40
12
,90
5Zo
ne -
Pass
Tota
l Pas
seng
er F
ares
$9
,347
,22
2$
11
,131
,97
7$
11
,11
1,1
83
$1
1,8
48
,93
8$
12
,68
0,6
09
$1
3,3
97,7
51$
13
,647
,74
9$
14
,11
8,7
82
$1
4,3
66
,59
0$
14
,32
3,1
49
Spec
ial T
rans
it Fa
res
- Gro
upF/
R 1
- Tr
ip F
ull F
are
- Tic
ket
1,18
40
02
537
85
4,6
75
41,4
75
57,7
05
67
,33
0O
mni
Link
(Yuc
aipa
) - C
ash
54
,13
54
8,1
73
42
,214
37,8
02
40
,07
54
8,1
04
46
,23
85
0,3
05
26
,85
92
0,7
77O
mni
Link
(Chi
no H
ills)
- Ca
sh9
,010
10,8
50
13,6
39
12
,68
81
2,8
29
22
,38
82
2,3
68
20
,57
010
,017
8,9
14O
mni
Link
S/D
Far
e - T
icke
t1,
62
00
1,4
96
2,5
83
2,5
25
5,8
215
,49
55
,99
45
,53
54
,19
9O
mni
Link
Ful
l Far
e - T
icke
t5
6,7
60
38
,73
917
,88
34
0,2
50
25
,40
03
5,9
60
297
45
90
54
Om
niLi
nk S
tude
nt F
are
- Tic
ket
1,13
42
,86
24
,42
82
,93
42
,30
4O
mni
Go
- Far
es6
9,1
0711
0,2
04
Tota
l Spe
cial
Tra
nsit
Fare
s$
12
2,7
10
$97
,76
2$
75
,231
$9
3,3
22
$8
0,8
54
$1
13
,78
5$
131
,93
5$
12
3,2
31$
172
,157
$21
3,7
82
Tota
l Far
es$
9,4
69
,93
2$
11
,22
9,7
39
$1
1,1
86
,41
5$
11
,94
2,2
60
$1
2,7
61,4
63
$1
3,5
11
,53
6$
13
,77
9,6
84
$1
4,2
42
,01
3$
14
,53
8,7
47$
14
,53
6,9
31
*F/
R 3
1-D
ay S
enio
r and
Dis
able
Pas
ses
wer
e co
mbi
ned
into
a s
ingl
e pa
ss.
**Im
plem
ente
d G
oSm
art S
tude
nt P
ass
Prog
ram
. Sou
rce:
Fin
ance
Dep
artm
ent
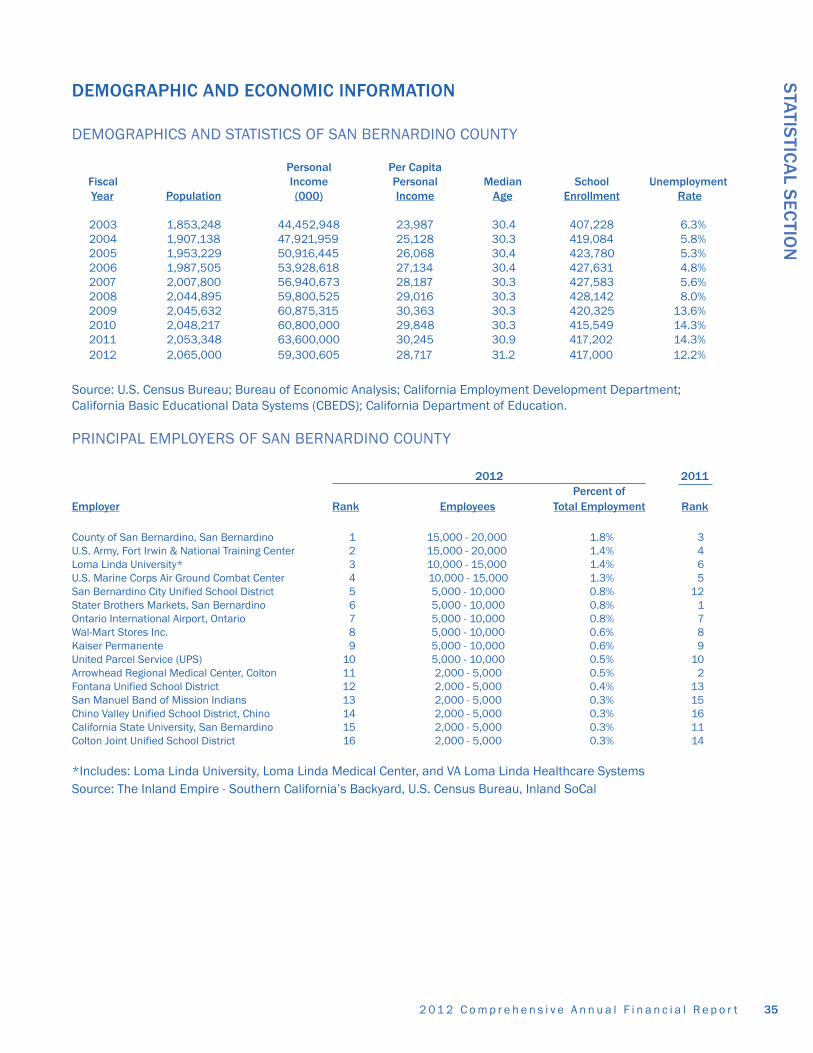
352 0 1 2 C o m p r e h e n s i v e A n n u a l F i n a n c i a l R e p o r t
STATIS
TICA
L SEC
TION
DEMOGRAPHIC AND ECONOMIC INFORMATION
DEMOGRAPHICS AND STATISTICS OF SAN BERNARDINO COUNTY
Personal Per Capita Fiscal Income Personal Median School UnemploymentYear Population (000) Income Age Enrollment Rate
2003 1,853,248 44,452,948 23,987 30.4 407,228 6.3%2004 1,907,138 47,921,959 25,128 30.3 419,084 5.8%2005 1,953,229 50,916,445 26,068 30.4 423,780 5.3%2006 1,987,505 53,928,618 27,134 30.4 427,631 4.8%2007 2,007,800 56,940,673 28,187 30.3 427,583 5.6%2008 2,044,895 59,800,525 29,016 30.3 428,142 8.0%2009 2,045,632 60,875,315 30,363 30.3 420,325 13.6%2010 2,048,217 60,800,000 29,848 30.3 415,549 14.3%2011 2,053,348 63,600,000 30,245 30.9 417,202 14.3%2012 2,065,000 59,300,605 28,717 31.2 417,000 12.2%
Source: U.S. Census Bureau; Bureau of Economic Analysis; California Employment Development Department; California Basic Educational Data Systems (CBEDS); California Department of Education.
PRINCIPAL EMPLOYERS OF SAN BERNARDINO COUNTY
2012 2011Percent of
Employer Rank Employees Total Employment Rank
County of San Bernardino, San Bernardino 1 15,000 - 20,000 1.8% 3U.S. Army, Fort Irwin & National Training Center 2 15,000 - 20,000 1.4% 4Loma Linda University* 3 10,000 - 15,000 1.4% 6U.S. Marine Corps Air Ground Combat Center 4 10,000 - 15,000 1.3% 5San Bernardino City Unified School District 5 5,000 - 10,000 0.8% 12Stater Brothers Markets, San Bernardino 6 5,000 - 10,000 0.8% 1Ontario International Airport, Ontario 7 5,000 - 10,000 0.8% 7Wal-Mart Stores Inc. 8 5,000 - 10,000 0.6% 8Kaiser Permanente 9 5,000 - 10,000 0.6% 9United Parcel Service (UPS) 10 5,000 - 10,000 0.5% 10Arrowhead Regional Medical Center, Colton 11 2,000 - 5,000 0.5% 2Fontana Unified School District 12 2,000 - 5,000 0.4% 13San Manuel Band of Mission Indians 13 2,000 - 5,000 0.3% 15Chino Valley Unified School District, Chino 14 2,000 - 5,000 0.3% 16California State University, San Bernardino 15 2,000 - 5,000 0.3% 11Colton Joint Unified School District 16 2,000 - 5,000 0.3% 14
*Includes: Loma Linda University, Loma Linda Medical Center, and VA Loma Linda Healthcare SystemsSource: The Inland Empire - Southern California’s Backyard, U.S. Census Bureau, Inland SoCal

2 0 1 2 C o m p r e h e n s i v e A n n u a l F i n a n c i a l R e p o r t36
STA
TIS
TIC
AL
SEC
TIO
N
TITL
EJu
n-0
3Ju
n-0
4Ju
n-0
5Ju
n-0
6Ju
n-07
Jun-
08
Jun-
09
Jun-
10
Jun-
11
Jun-
12
Ave
rage
Civi
lian
Labo
r For
ce1,
58
9,0
00
1,6
51,4
00
1,7
03
,60
01,
746
,00
01,
767
,40
01,
78
0,2
00
1,77
6,7
00
1,7
94,8
00
1,7
93
,40
01,
80
8,0
00
1,7
41,0
50
Civi
lian
Empl
oym
ent
1,4
80
,00
01,
54
9,3
00
1,61
0,1
00
1,6
56
,70
01,
66
4,2
00
1,6
36
,80
01,
53
6,6
00
1,5
37,7
00
1,5
42
,70
01,
579
,80
01,
579,
39
0
Civi
lian
Une
mpl
oym
ent
109
,00
010
2,1
00
93
,50
08
9,3
00
103
,20
014
3,4
00
240
,20
02
57,1
00
25
0,6
00
22
8,2
00
161,
66
0
Civi
lian
Une
mpl
oym
ent R
ate
6.9
%6
.2%
5.5
%5
.1%
5.8
%8
.1%
13.5
%14
.3%
14.0
%1
2.6
%9
.2%
Tota
l, Al
l Ind
ustr
ies
1,13
0,1
00
1,18
7,5
00
1,24
5,5
00
1,3
00
,60
01,
301
,40
01,
25
6,2
00
1,16
0,0
00
1,15
4,1
00
1,14
5,8
00
1,16
8,5
00
1,2
04
,97
0
Tota
l Far
m2
8,8
00
25
,90
02
3,7
00
22
,50
02
2,8
00
21,9
00
20
,90
021
,10
019
,00
019
,10
02
2,5
70
Tota
l Non
farm
1,10
1,3
00
1,16
1,6
00
1,2
21,8
00
1,27
8,1
00
1,27
8,6
00
1,2
34
,30
01,
139
,10
01,
133
,00
01,
12
6,8
00
1,14
9,4
00
1,1
82,
40
0
Tota
l Priv
ate
887
,20
09
48
,20
01,
001
,60
01,
05
0,8
00
1,0
49
,60
01,
001
,00
09
06
,30
08
91,4
00
89
6,0
00
924
,30
09
55,6
40
Goo
ds P
rodu
cing
217
,00
02
34
,40
024
7,0
00
25
9,4
00
237
,80
02
03
,50
015
9,9
00
147
,80
014
6,1
00
146
,30
01
99,
92
0
Min
ing
and
Logg
ing
1,2
00
1,2
00
1,3
00
1,4
00
1,3
00
1,2
00
1,2
00
1,0
00
1,0
00
1,10
01
,19
0
Cons
truc
tion
99
,80
011
2,2
00
124
,90
013
2,6
00
116
,60
09
3,8
00
69
,80
061
,30
05
9,1
00
59
,30
09
2,9
40
Cons
truc
tion
of B
uild
ings
15,7
00
17,8
00
20
,30
02
2,5
00
20
,30
016
,30
01
2,0
00
10,6
00
10,7
00
11,1
00
15,
73
0
Hea
vy &
Civ
il En
gine
erin
g Co
nstr
uctio
n10
,70
011
,40
01
2,5
00
12
,50
013
,00
011
,70
09
,10
08
,20
09
,00
09
,50
010
,76
0
Spec
ialty
Tra
de C
ontr
acto
rs7
3,4
00
83
,00
09
2,1
00
97,6
00
83
,30
06
5,8
00
48
,70
04
2,5
00
39
,40
03
8,7
00
66,
45
0
Bui
ldin
g Fo
unda
tion
& E
xter
ior C
ontr
acto
rs2
6,7
00
30
,40
03
4,7
00
37,2
00
29
,20
02
0,8
00
13,6
00
12
,40
010
,80
09
,60
02
2,5
40
Bui
ldin
g Eq
uipm
ent C
ontr
acto
rs18
,40
02
0,0
00
22
,20
02
2,9
00
21,8
00
19,2
00
15,8
00
13,7
00
13,4
00
13,2
00
18,
06
0
Bui
ldin
g Fi
nish
ing
Cont
ract
ors
19,9
00
23
,50
02
5,0
00
25
,90
021
,60
016
,50
01
2,4
00
10,4
00
9,8
00
9,1
00
17,4
10
Man
ufac
turin
g11
6,0
00
121
,00
01
20
,80
01
25
,40
011
9,9
00
108
,50
08
8,9
00
85
,50
08
6,0
00
85
,90
010
5,7
90
Dur
able
Goo
ds8
2,5
00
85
,80
08
6,0
00
88
,60
08
3,1
00
73
,70
05
8,2
00
55
,50
05
6,6
00
55
,70
07
2,5
70
Fabr
icat
ed M
etal
Pro
duct
Man
ufac
turin
g15
,90
016
,50
017
,00
016
,80
016
,10
014
,90
011
,90
011
,50
01
2,5
00
12
,40
014
,55
0
Non
dura
ble
Goo
ds3
3,5
00
35
,20
03
4,8
00
36
,80
03
6,8
00
34
,80
03
0,7
00
30
,00
02
9,4
00
30
,20
03
3,2
20
Food
Mfg
& B
ever
age
& T
obac
co P
rodu
ct M
fg8
,80
09
,30
09
,60
010
,80
011
,10
010
,50
09
,70
09
,80
09
,50
09
,60
09
,87
0
Serv
ice
Prov
idin
g8
84
,30
09
27,2
00
974
,80
01,
018
,70
01,
04
0,8
00
1,0
30
,80
097
9,2
00
98
5,2
00
98
0,7
00
1,0
03
,10
09
82,
48
0
Priv
ate
Serv
ice
Prod
ucin
g6
70
,20
071
3,8
00
75
4,6
00
791
,40
081
1,8
00
797
,50
074
6,4
00
743
,60
074
9,9
00
778
,00
07
55,
72
0
Trad
e, T
rans
port
atio
n &
Util
ities
23
4,5
00
251
,20
027
2,7
00
28
9,3
00
29
9,0
00
29
3,3
00
270
,10
02
69
,00
027
2,3
00
278
,20
027
2,9
60
Who
lesa
le T
rade
44
,00
04
5,1
00
49
,90
05
4,2
00
56
,90
05
5,0
00
48
,90
04
8,9
00
48
,80
05
4,1
00
50,
58
0
Mer
chan
t Who
lesa
lers
, Dur
able
Goo
ds2
6,9
00
27,2
00
30
,80
03
4,1
00
34
,50
03
3,0
00
29
,10
02
9,2
00
29
,00
031
,40
03
0,5
20
Mer
chan
t Who
lesa
lers
, Non
dura
ble
Goo
ds13
,40
013
,00
013
,80
014
,50
016
,50
016
,60
015
,40
015
,50
015
,50
016
,10
01
5,0
30
Ret
ail T
rade
140
,50
015
1,3
00
163
,10
017
1,6
00
173
,30
016
8,1
00
154
,10
015
3,9
00
155
,00
015
4,5
00
15
8,5
40
Mot
or V
ehic
le &
Par
ts D
eale
r2
2,6
00
23
,70
02
5,0
00
25
,90
02
5,3
00
23
,20
018
,60
018
,70
019
,60
02
0,4
00
22,
30
0
Auto
mot
ive
Part
s, A
cces
sorie
s &
Tire
Sto
res
6,5
00
6,7
00
6,7
00
6,8
00
6,4
00
6,3
00
6,0
00
6,4
00
6,5
00
6,5
00
6,4
80
Bui
ldin
g M
ater
ial &
Gar
den
Equi
pmen
t Sto
res
12
,50
014
,30
015
,30
016
,20
015
,40
013
,90
01
2,8
00
12
,50
01
2,3
00
12
,30
01
3,7
50
Food
& B
ever
age
Stor
es27
,80
02
8,9
00
30
,80
031
,80
03
3,7
00
33
,30
03
2,9
00
32
,70
03
0,7
00
31,2
00
31,3
80
Hea
lth &
Per
sona
l Car
e St
ores
7,5
00
8,2
00
7,7
00
8,3
00
8,9
00
9,4
00
9,0
00
9,1
00
9,1
00
9,5
00
8,6
70
Clot
hing
& C
loth
ing
Acce
ssor
ies
Stor
es1
2,3
00
12
,50
013
,50
014
,50
016
,10
016
,20
014
,40
015
,60
017
,10
018
,00
01
5,0
20
Clot
hing
Sto
res
9,1
00
9,2
00
10,1
00
11,0
00
12
,40
01
2,6
00
11,2
00
12
,30
013
,50
014
,00
011
,54
0
Gen
eral
Mer
chan
dise
Sto
res
28
,50
031
,20
03
5,4
00
38
,40
037
,70
037
,10
03
5,5
00
35
,50
03
5,0
00
35
,10
03
4,9
40
Dep
artm
ent S
tore
s21
,20
02
3,9
00
27,8
00
30
,50
02
9,2
00
27,9
00
25
,10
024
,60
02
3,8
00
23
,70
025
,77
0
Oth
er G
ener
al M
erch
andi
se S
tore
s7
,30
07
,30
07
,60
07
,90
08
,50
09
,20
010
,40
010
,90
011
,20
011
,40
09,
170
Tran
spor
tatio
n, W
areh
ousi
ng &
Util
ities
50
,00
05
4,8
00
59
,70
06
3,5
00
68
,80
07
0,2
00
67
,10
06
6,2
00
68
,50
06
9,6
00
63,8
40
Util
ities
5,0
00
5,0
00
5,3
00
5,6
00
5,7
00
5,9
00
5,8
00
5,8
00
5,8
00
5,9
00
5,5
80
Tran
spor
tatio
n &
War
ehou
sing
45
,00
04
9,8
00
54
,40
057
,90
06
3,1
00
64
,30
061
,30
06
0,4
00
62
,70
06
3,7
00
58,
26
0
RIV
ERS
IDE-
SA
N B
ERN
AR
DIN
O-O
NTA
RIO
MS
A (
RIV
ERS
IDE
AN
D S
AN
BER
NA
RD
INO
CO
UN
TIES
)
IND
UST
RY
EMPL
OYM
ENT
AND
LAB
OR
FO
RC
E
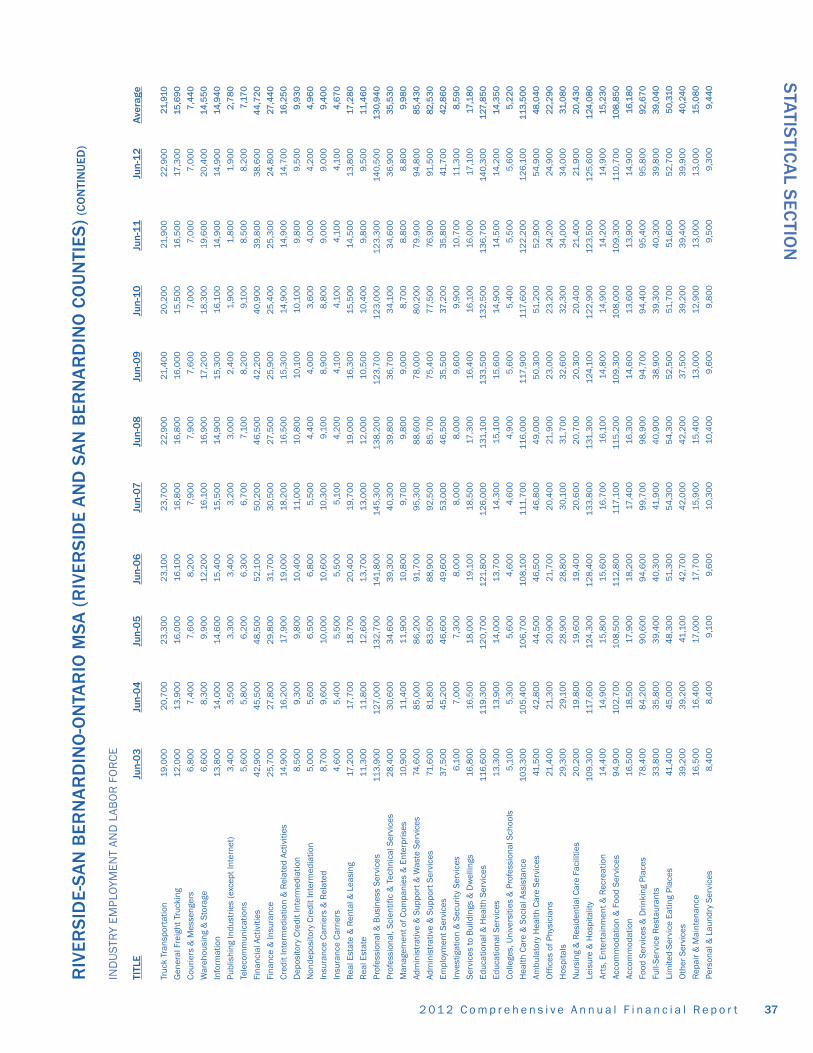
372 0 1 2 C o m p r e h e n s i v e A n n u a l F i n a n c i a l R e p o r t
TITL
EJu
n-0
3Ju
n-0
4Ju
n-0
5Ju
n-0
6Ju
n-07
Jun-
08
Jun-
09
Jun-
10
Jun-
11
Jun-
12
Ave
rage
Truc
k Tr
ansp
orta
tion
19,0
00
20
,70
02
3,3
00
23
,10
02
3,7
00
22
,90
021
,40
02
0,2
00
21,9
00
22
,90
021
,910
Gen
eral
Fre
ight
Tru
ckin
g1
2,0
00
13,9
00
16,0
00
16,1
00
16,8
00
16,8
00
16,0
00
15,5
00
16,5
00
17,3
00
15,6
90
Cour
iers
& M
esse
nger
s6
,80
07
,40
07
,60
08
,20
07
,90
07
,90
07
,60
07
,00
07
,00
07
,00
07
,44
0
War
ehou
sing
& S
tora
ge6
,60
08
,30
09
,90
01
2,2
00
16,1
00
16,9
00
17,2
00
18,3
00
19,6
00
20
,40
014
,55
0
Info
rmat
ion
13,8
00
14,0
00
14,6
00
15,4
00
15,5
00
14,9
00
15,3
00
16,1
00
14,9
00
14,9
00
14,9
40
Publ
ishi
ng In
dust
ries
(exc
ept I
nter
net)
3,4
00
3,5
00
3,3
00
3,4
00
3,2
00
3,0
00
2,4
00
1,9
00
1,8
00
1,9
00
2,7
80
Tele
com
mun
icat
ions
5,6
00
5,8
00
6,2
00
6,3
00
6,7
00
7,1
00
8,2
00
9,1
00
8,5
00
8,2
00
7,1
70
Fina
ncia
l Act
iviti
es4
2,9
00
45
,50
04
8,5
00
52
,10
05
0,2
00
46
,50
04
2,2
00
40
,90
03
9,8
00
38
,60
04
4,7
20
Fina
nce
& In
sura
nce
25
,70
027
,80
02
9,8
00
31,7
00
30
,50
027
,50
02
5,9
00
25
,40
02
5,3
00
24,8
00
27,4
40
Cred
it In
term
edia
tion
& R
elat
ed A
ctiv
ities
14,9
00
16,2
00
17,9
00
19,0
00
18,2
00
16,5
00
15,3
00
14,9
00
14,9
00
14,7
00
16,2
50
Dep
osito
ry C
redi
t Int
erm
edia
tion
8,5
00
9,3
00
9,8
00
10,4
00
11,0
00
10,8
00
10,1
00
10,1
00
9,8
00
9,5
00
9,9
30
Non
depo
sito
ry C
redi
t Int
erm
edia
tion
5,0
00
5,6
00
6,5
00
6,8
00
5,5
00
4,4
00
4,0
00
3,6
00
4,0
00
4,2
00
4,9
60
Insu
ranc
e Ca
rrie
rs &
Rel
ated
8,7
00
9,6
00
10,0
00
10,6
00
10,3
00
9,1
00
8,9
00
8,8
00
9,0
00
9,0
00
9,4
00
Insu
ranc
e Ca
rrie
rs4
,60
05
,40
05
,50
05
,50
05
,10
04
,20
04
,10
04
,10
04
,10
04
,10
04
,67
0
Rea
l Est
ate
& R
enta
l & L
easi
ng17
,20
017
,70
018
,70
02
0,4
00
19,7
00
19,0
00
16,3
00
15,5
00
14,5
00
13,8
00
17,2
80
Rea
l Est
ate
11,3
00
11,8
00
12
,60
013
,70
013
,00
01
2,0
00
10,5
00
10,4
00
9,8
00
9,5
00
11,
46
0
Prof
essi
onal
& B
usin
ess
Serv
ices
113
,90
01
27,0
00
132
,70
014
1,8
00
145
,30
013
8,2
00
12
3,7
00
12
3,0
00
12
3,3
00
140
,50
01
30,
94
0
Prof
essi
onal
, Sci
entif
ic &
Tec
hnic
al S
ervi
ces
28
,40
03
0,6
00
34
,60
03
9,3
00
40
,30
03
9,8
00
36
,70
03
4,1
00
34
,60
03
6,9
00
35,5
30
Man
agem
ent o
f Com
pani
es &
Ent
erpr
ises
10,9
00
11,4
00
11,9
00
10,8
00
9,7
00
9,8
00
9,0
00
8,7
00
8,8
00
8,8
00
9,9
80
Adm
inis
trat
ive
& S
uppo
rt &
Was
te S
ervi
ces
74,6
00
85
,00
08
6,2
00
91,7
00
95
,30
08
8,6
00
78
,00
08
0,2
00
79
,90
09
4,8
00
85,4
30
Adm
inis
trat
ive
& S
uppo
rt S
ervi
ces
71,6
00
81,8
00
83
,50
08
8,9
00
92
,50
08
5,7
00
75
,40
077
,50
076
,90
091
,50
082
,53
0
Empl
oym
ent S
ervi
ces
37,5
00
45
,20
04
6,6
00
49
,60
05
3,0
00
46
,50
03
5,5
00
37,2
00
35
,80
041
,70
042
,86
0
Inve
stig
atio
n &
Sec
urity
Ser
vice
s6
,10
07
,00
07
,30
08
,00
08
,00
08
,00
09
,60
09
,90
010
,70
011
,30
08
,59
0
Serv
ices
to B
uild
ings
& D
wel
lings
16,8
00
16,5
00
18,0
00
19,1
00
18,5
00
17,3
00
16,4
00
16,1
00
16,0
00
17,1
00
17,1
80
Educ
atio
nal &
Hea
lth S
ervi
ces
116
,60
011
9,3
00
12
0,7
00
121
,80
01
26
,00
013
1,10
013
3,5
00
132
,50
013
6,7
00
140
,30
01
27,8
50
Educ
atio
nal S
ervi
ces
13,3
00
13,9
00
14,0
00
13,7
00
14,3
00
15,1
00
15,6
00
14,9
00
14,5
00
14,2
00
14,3
50
Colle
ges,
Uni
vers
ities
& P
rofe
ssio
nal S
choo
ls5
,10
05
,30
05
,60
04
,60
04
,60
04
,90
05
,60
05
,40
05
,50
05
,60
05
,22
0
Hea
lth C
are
& S
ocia
l Ass
ista
nce
103
,30
010
5,4
00
106
,70
010
8,1
00
111,
70
011
6,0
00
117
,90
011
7,6
00
12
2,2
00
12
6,1
00
113
,50
0
Ambu
lato
ry H
ealth
Car
e Se
rvic
es41
,50
04
2,8
00
44
,50
04
6,5
00
46
,80
04
9,0
00
50
,30
051
,20
05
2,9
00
54
,90
048
,04
0
Off
ices
of P
hysi
cian
s21
,40
021
,30
02
0,9
00
21,7
00
20
,40
021
,90
02
3,0
00
23
,20
024
,20
024
,90
022
,29
0
Hos
pita
ls2
9,3
00
29
,10
02
8,9
00
28
,80
03
0,1
00
31,7
00
32
,60
03
2,3
00
34
,00
03
4,0
00
31,0
80
Nur
sing
& R
esid
entia
l Car
e Fa
cilit
ies
20
,20
019
,80
019
,60
019
,40
02
0,6
00
20
,70
02
0,3
00
20
,40
021
,40
021
,90
020
,43
0
Leis
ure
& H
ospi
talit
y10
9,3
00
117
,60
01
24,3
00
12
8,4
00
133
,80
013
1,3
00
124
,10
01
22
,90
01
23
,50
01
25
,60
01
24,0
80
Arts
, Ent
erta
inm
ent &
Rec
reat
ion
14,4
00
14,9
00
15,8
00
15,6
00
16,7
00
16,1
00
14,8
00
14,9
00
14,2
00
14,9
00
15,2
30
Acco
mm
odat
ion
& F
ood
Serv
ices
94
,90
010
2,7
00
108
,50
011
2,8
00
117
,10
011
5,2
00
109
,30
010
8,0
00
109
,30
011
0,7
00
108
,85
0
Acco
mm
odat
ion
16,5
00
18,5
00
17,9
00
18,2
00
17,4
00
16,3
00
14,6
00
13,6
00
13,9
00
14,9
00
16,1
80
Food
Ser
vice
s &
Drin
king
Pla
ces
78
,40
08
4,2
00
90
,60
094
,60
09
9,7
00
98
,90
09
4,7
00
94
,40
09
5,4
00
95
,80
092
,67
0
Full-
Serv
ice
Res
taur
ants
33
,80
03
5,8
00
39
,40
04
0,3
00
41,9
00
40
,90
03
8,9
00
39
,30
04
0,3
00
39
,80
039
,04
0
Lim
ited-
Serv
ice
Eatin
g Pl
aces
41,4
00
45
,00
04
8,3
00
51,3
00
54
,30
05
4,3
00
52
,50
051
,70
051
,60
05
2,7
00
50,
310
Oth
er S
ervi
ces
39
,20
03
9,2
00
41,1
00
42
,70
04
2,0
00
42
,20
037
,50
03
9,2
00
39
,40
03
9,9
00
40,
240
Rep
air &
Mai
nten
ance
16,5
00
16,4
00
17,0
00
17,7
00
15,9
00
15,4
00
13,0
00
12
,90
013
,00
013
,00
015
,08
0
Pers
onal
& L
aund
ry S
ervi
ces
8,4
00
8,4
00
9,1
00
9,6
00
10,3
00
10,4
00
9,6
00
9,8
00
9,5
00
9,3
00
9,4
40
STATIS
TICA
L SEC
TION
RIV
ERS
IDE-
SA
N B
ERN
AR
DIN
O-O
NTA
RIO
MS
A (
RIV
ERS
IDE
AN
D S
AN
BER
NA
RD
INO
CO
UN
TIES
) (C
ON
TIN
UED
)
IND
UST
RY
EMPL
OYM
ENT
AND
LAB
OR
FO
RC
E

2 0 1 2 C o m p r e h e n s i v e A n n u a l F i n a n c i a l R e p o r t
TITL
EJu
n-0
3Ju
n-0
4Ju
n-0
5Ju
n-0
6Ju
n-07
Jun-
08
Jun-
09
Jun-
10
Jun-
11
Jun-
12
Ave
rage
Gov
ernm
ent
214
,10
021
3,4
00
22
0,2
00
227
,30
02
29
,00
02
33
,30
02
32
,80
024
1,6
00
23
0,8
00
22
5,1
00
22
6,7
60
Fede
ral G
over
nmen
t17
,00
017
,00
018
,80
019
,30
019
,50
019
,70
02
0,3
00
25
,00
021
,40
02
0,5
00
19,8
50
Dep
artm
ent o
f Def
ense
5,2
00
5,3
00
5,6
00
5,7
00
5,6
00
5,8
00
6,1
00
6,3
00
6,4
00
6,0
00
5,8
00
Fede
ral G
over
nmen
t exc
ludi
ng
11,8
00
11,7
00
13,2
00
13,6
00
13,9
00
13,9
00
14,2
00
18,7
00
15,0
00
14,5
00
14,0
50
Dep
artm
ent o
f Def
ense
Stat
e &
Loc
al G
over
nmen
t19
7,1
00
196
,40
02
01,4
00
20
8,0
00
20
9,5
00
213
,60
021
2,5
00
216
,60
02
09
,40
02
04
,60
02
06
,910
Stat
e G
over
nmen
t27
,30
027
,00
027
,60
027
,90
02
9,3
00
30
,50
03
0,8
00
29
,90
03
0,1
00
29
,10
02
8,9
50
Stat
e G
over
nmen
t Edu
catio
n10
,20
09
,90
010
,10
010
,30
010
,70
011
,10
011
,20
010
,90
011
,60
011
,30
010
,730
Stat
e G
over
nmen
t Exc
ludi
ng E
duca
tion
17,1
00
17,1
00
17,5
00
17,6
00
18,6
00
19,4
00
19,6
00
19,0
00
18,5
00
17,8
00
18
,220
Loca
l Gov
ernm
ent
169
,80
016
9,4
00
173
,80
018
0,1
00
180
,20
018
3,1
00
181,
70
018
6,7
00
179
,30
017
5,5
00
177
,960
Loca
l Gov
ernm
ent E
duca
tion
100
,40
010
0,2
00
98
,50
09
9,9
00
97,1
00
99
,20
09
9,2
00
107
,10
010
3,0
00
100
,00
010
0,4
60
Coun
ty3
4,1
00
32
,40
03
2,5
00
36
,00
037
,40
037
,70
037
,50
03
6,4
00
35
,20
03
5,0
00
35
,420
City
15,0
00
15,2
00
15,5
00
16,2
00
17,3
00
17,9
00
17,7
00
16,6
00
16,2
00
15,3
00
16,2
90
Spec
ial D
istr
icts
plu
s In
dian
Trib
es2
0,3
00
21,6
00
27,3
00
28
,00
02
8,4
00
28
,30
027
,30
02
6,5
00
24,9
00
25
,20
02
5,7
80
Sour
ce: C
A Em
ploy
men
t Dev
elop
men
t Dep
artm
ent L
abor
Mar
ket I
nfor
mat
ion
38
STA
TIS
TIC
AL
SEC
TIO
N
RIV
ERS
IDE-
SA
N B
ERN
AR
DIN
O-O
NTA
RIO
MS
A (
RIV
ERS
IDE
AN
D S
AN
BER
NA
RD
INO
CO
UN
TIES
) (C
ON
TIN
UED
)
IND
UST
RY
EMPL
OYM
ENT
AND
LAB
OR
FO
RC
E
392 0 1 2 C o m p r e h e n s i v e A n n u a l F i n a n c i a l R e p o r t
STATIS
TICA
L SEC
TION
THE ECONOMY AND ECONOMIC OUTLOOK
After a steady decline in employment in San Bernardino County since 2006, the number of jobs rose in 2011 and continuedto rise into 2012. Between the high of 2006 and the low of 2010, employment declined by nearly 82,000 jobs. Employmentbegan to rebound in 2011 and by the first quarter of 2012 had reached 760,600 jobs, an increase of 21,700. Still, over110,000 San Bernardino County residents report being unemployed as of March 2012.
Paralleling unemployment trends nationwide, San Bernardino County’s unemployment rate fell in 2011 and continuedfalling into early 2012 (according to the latest data available at the time of this report). During the 10-year period from 2002to 2012, the unemployment rate in San Bernardino County ranged from a low of 4.8% in 2006 to a high of 14.2% in 2010.From its high in 2010, the unemployment rate decreased slightly to 13.2% in 2011 and 12.2% as of March 2012. In March2012, San Bernardino County’s unemployment rate was ranked 25th out of the 58 counties in California, the same rankingas in March 2011. San Bernardino County had higher unemployment rates than in the United States as a whole between2002 and 2012.
The unemployment rate in the Riverside-San Bernardino-Ontario MSA was 11.3 percent in November 2012, down froma revised 11.7 percent in October 2012, and below the year-ago estimate of 12.4 percent. This compares with an unadjustedunemployment rate of 9.6 percent for California and 7.4 percent for the nation during the same period. The unemploymentrate was 11.5 percent in Riverside County and 11.0 percent in San Bernardino County.
As the economy continues to recover from the Great Recession, San Bernardino County has experienced a slow, butsteady decline in unemployment. In 2011, the county added nearly 2,500 jobs to the local economy with significant activityin manufacturing and logistics. With the workforce driving corporate relocations and expansions, San Bernardino County is well positioned with a labor pool of 900,000 and a two million-resident metropolitan area. Other advantages of the regioninclude newer facilities at lower lease rates than competing markets, superior transportation infrastructure, and access to amarket of 23 million people within three hours of driving. Significant speculative industrial construction activity has returnedto the region, and with trade volumes expected to increase, the economic outlook for San Bernardino County is optimistic.
Source: San Bernardino 2012 Community Indicator Report and the County of San Bernardino Economic Development Agency.
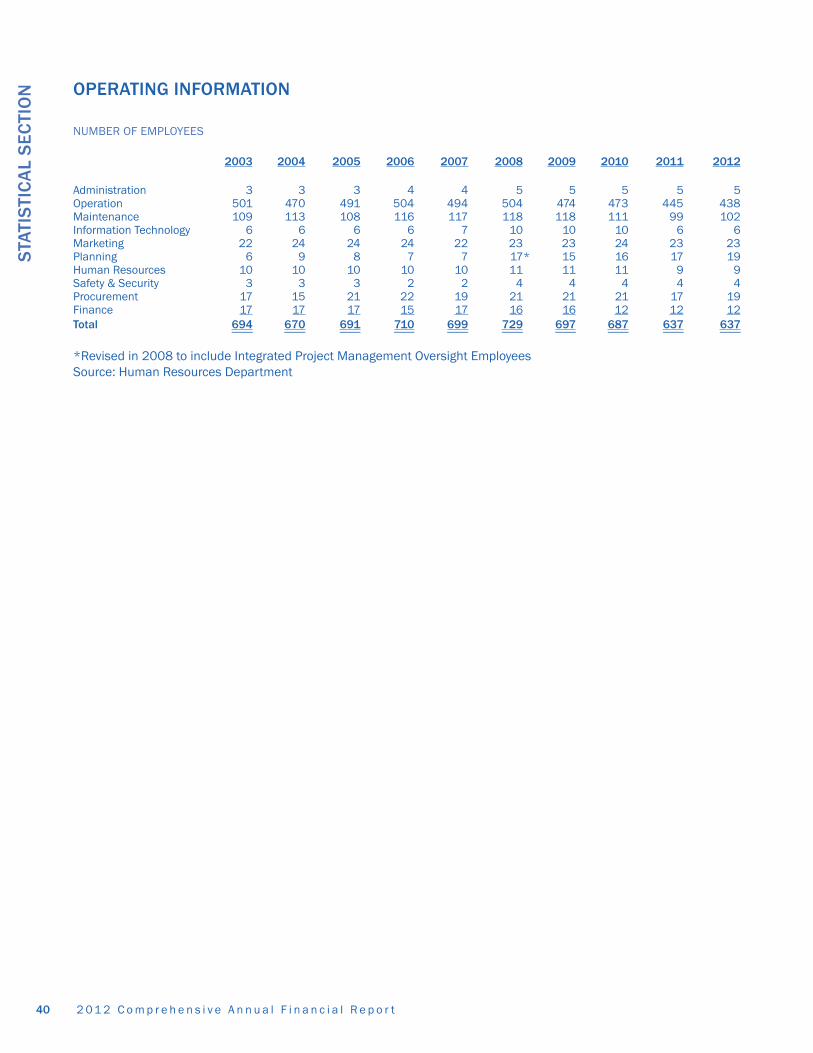
2 0 1 2 C o m p r e h e n s i v e A n n u a l F i n a n c i a l R e p o r t40
STA
TIS
TIC
AL
SEC
TIO
N OPERATING INFORMATION
NUMBER OF EMPLOYEES
2003 2004 2005 2006 2007 2008 2009 2010 2011 2012
Administration 3 3 3 4 4 5 5 5 5 5Operation 501 470 491 504 494 504 474 473 445 438Maintenance 109 113 108 116 117 118 118 111 99 102Information Technology 6 6 6 6 7 10 10 10 6 6Marketing 22 24 24 24 22 23 23 24 23 23Planning 6 9 8 7 7 17* 15 16 17 19Human Resources 10 10 10 10 10 11 11 11 9 9Safety & Security 3 3 3 2 2 4 4 4 4 4Procurement 17 15 21 22 19 21 21 21 17 19Finance 17 17 17 15 17 16 16 12 12 12Total 694 670 691 710 699 729 697 687 637 637
*Revised in 2008 to include Integrated Project Management Oversight Employees Source: Human Resources Department

412 0 1 2 C o m p r e h e n s i v e A n n u a l F i n a n c i a l R e p o r t
STATIS
TICA
L SEC
TION
220
032
004
20
05
200
620
072
008
200
92
010
2011
201
2
Pers
onne
l$
19,3
92
,75
2$
19,7
87,7
68
$21
,09
3,3
08
$24
,297
,50
9$
25
,19
8,1
19$
25
,63
9,1
06
$2
6,7
04
,10
9$
26
,62
8,4
84
$24
,86
9,7
13$
25
,28
0,1
31M
ater
ials
& S
uppl
ies
7,2
68
,910
7,2
49
,581
8,0
73
,124
10,7
32
,72
310
,911
,13
610
,05
3,6
55
9,0
62
,29
6
8,8
31,9
59
7,7
43
,557
8,4
79
,014
Casu
alty
& L
iabi
lity
6,9
62
,241
9,4
92
,39
67
,68
3,4
473
,70
4,8
40
2,2
06
,571
4,9
81,8
89
4,4
48
,557
,23
3,3
60
4,6
74,1
42
5,1
00
,83
0Pu
rcha
sed
Tran
spor
tatio
n7
,227
,66
38
,88
4,8
53
9,8
76,9
23
7,4
04
,17
36
,241
,231
6,3
36
,70
26
,719
,510
7,1
14,0
73
8,8
31,9
59
8,8
82
,227
Dep
reci
atio
n &
Oth
er2
3,6
49
,79
92
3,2
71,4
95
25
,20
8,0
4727
,00
3,5
93
30
,247
,88
42
9,6
06
,847
30
,091
,08
431
,69
3,4
82
33
,18
2,9
213
8,5
34
,224
Tota
l Ope
ratin
g Ex
pens
es$
64
,501
,36
5$
68
,68
6,0
93
$71
,93
4,8
49
$7
3,1
42
,83
8$
74,8
04
,941
$76
,61
8,1
99
$7
7,0
25
,55
6$
78
,501
,35
8$
79
,30
2,2
92
$8
6,2
76,4
26
Sour
ce: F
inan
ce D
epar
tmen
t
OP
ERAT
ING
INFO
RM
ATIO
N (C
ON
TIN
UED
)
OPE
RAT
ING
EXP
ENS
ES B
Y C
ATEG
OR
Y
OPE
RAT
ING
EXP
ENS
ES B
Y FU
NC
TIO
N
20
032
00
42
00
52
006
200
72
008
200
92
010
2011
201
2
Tran
spor
tatio
n$
19,6
05
,28
4$
19,0
71,4
73
$21
,79
4,5
08
$24
,68
0,2
19$
25
,50
6,0
68
$2
6,1
63
,421
$27
,787
,511
$2
8,2
39
,33
0$
29
,16
8,3
99
$2
9,2
61,5
93
Mai
nten
ance
13,9
55
,55
214
,13
4,0
65
14,0
54
,73
817
,48
8,0
8118
,315
,98
517
,86
7,5
94
16,6
27,7
1915
,77
0,7
95
14,2
04
,78
014
,83
0,0
16R
isk
Man
agem
ent*
6,6
18,2
379
,18
5,0
69
7,1
57,9
05
3,7
08
,74
92
,20
6,5
714
,981
,88
94
,44
8,5
574
,23
3,3
60
4,6
74,1
42
5,1
00
,83
0M
arke
ting
1,8
35
,971
2,1
15,1
29
2,1
11,7
95
2,2
75
,82
82
,32
8,2
73
2,3
66
,48
42
,33
0,5
612
,67
3,8
472
,26
0,1
66
2,2
59
,48
8G
ener
al A
dmin
istr
atio
n4
,90
0,1
814
,847
,16
63
,40
2,2
53
6,5
10,3
717
,341
,09
49
,56
9,1
84
7,4
51,9
417
,22
6,8
777
,83
5,2
46
8,0
52
,76
6D
epre
ciat
ion
& O
ther
**
17,5
86
,14
019
,33
2,1
912
3,4
13,6
50
18,4
81,8
08
19,1
06
,95
015
,66
9,6
2718
,37
9,2
68
20
,357
,14
821
,15
9,5
58
26
,771
,73
3To
tal O
pera
ting
Expe
nses
$6
4,5
01,3
65
$6
8,6
85
,09
3$
71,9
34
,84
9$
73
,14
5,0
56
$74
,80
4,9
41$
76,6
18
,19
9$
77
,02
5,5
56
$7
8,5
01,3
58
$7
9,3
02
,29
2$
86
,276
,42
6
*R
isk
Man
agem
ent c
onsi
sts
of c
asua
lty a
nd li
abili
ty c
osts
. *
*D
epre
ciat
ion
& O
ther
cos
t con
sist
s of
dep
reci
atio
n, p
urch
ased
tran
spor
tatio
n, le
ases
and
rent
als,
and
cap
ital p
urch
ases
cha
rged
to o
pera
ting.
Sour
ce: F
inan
ce D
epar
tmen
t
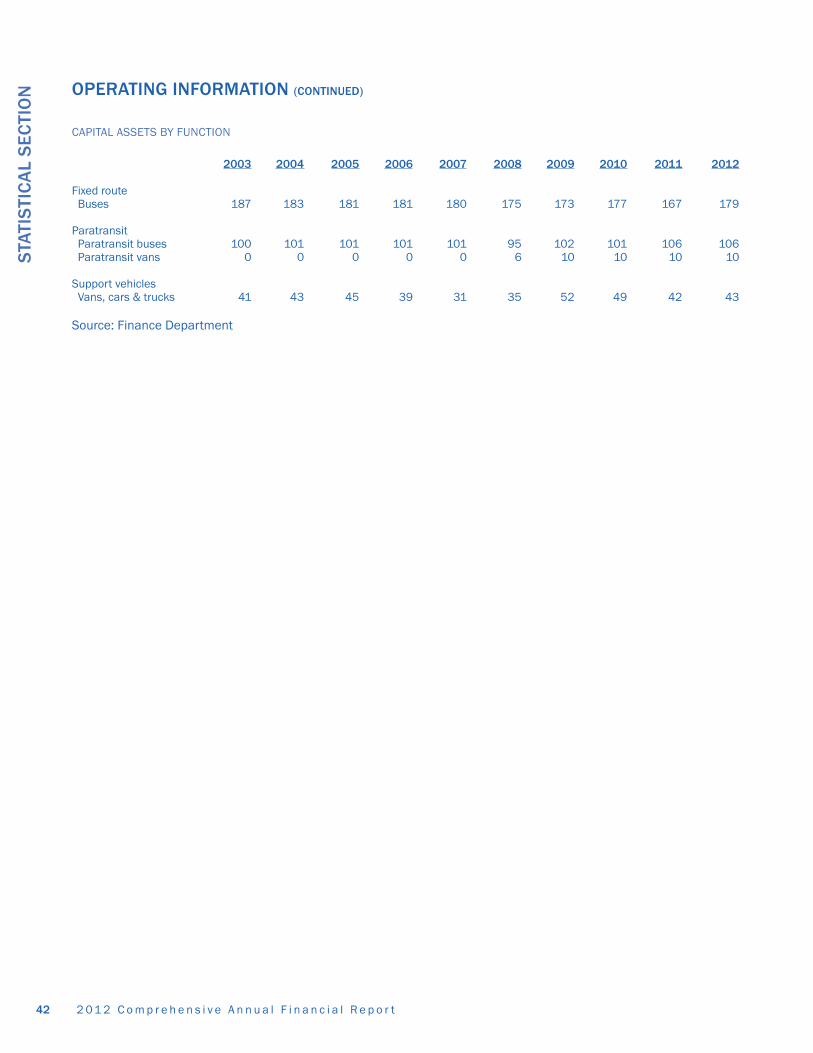
2 0 1 2 C o m p r e h e n s i v e A n n u a l F i n a n c i a l R e p o r t42
STA
TIS
TIC
AL
SEC
TIO
N OPERATING INFORMATION (CONTINUED)
CAPITAL ASSETS BY FUNCTION
2003 2004 2005 2006 2007 2008 2009 2010 2011 2012
Fixed routeBuses 187 183 181 181 180 175 173 177 167 179
ParatransitParatransit buses 100 101 101 101 101 95 102 101 106 106Paratransit vans 0 0 0 0 0 6 10 10 10 10
Support vehiclesVans, cars & trucks 41 43 45 39 31 35 52 49 42 43
Source: Finance Department
OMNITRANS1700 W Fifth Street
San Bernardino, CA 92411
CONNECTING COMMUNITYOUR

- 1 -
Administrative and Finance Committee Omnitrans San Bernardino, California We have audited the financial statements of Omnitrans for the year ended June 30, 2012, and have issued our report thereon dated October 31, 2012. Professional standards require that we provide you with the following information related to our audit.
Our Responsibility under U.S. Generally Accepted Auditing Standards and OMB Circular A-133
Our responsibility, as described by professional standards, is to express an opinion about whether the financial statements prepared by management with your oversight are fairly presented, in all material respects, in conformity with U.S. generally accepted accounting principles. Our audit of the financial statements does not relieve you or management of your responsibilities. Our responsibility is to plan and perform the audit to obtain reasonable, but not absolute, assurance that the financial statements are free of material misstatement. In planning and performing our audit, we considered Omnitrans’ internal control over financial reporting in order to determine our auditing procedures for the purpose of expressing our opinion on the financial statements and not to provide assurance on the internal control over financial reporting. We also considered internal control over compliance with requirements that could have a direct and material effect on a major federal program in order to determine our auditing procedures for the purpose of expressing our opinion on compliance and to test and report on internal control over compliance in accordance with the U.S. Office of Management and Budget (OMB) Circular A-133. As part of obtaining reasonable assurance about whether Omnitrans’ financial statements are free of material misstatement, we performed tests of its compliance with certain provisions of laws, regulations, contracts, and grants, noncompliance with which could have a direct and material effect on the determination of financial statement amounts. However, providing an opinion on compliance with those provisions was not an objective of our audit. Also, in accordance with OMB Circular A-133, we examined, on a test basis, evidence about Omnitrans’ compliance with the types of compliance requirements described in the OMB Circular A-133 Compliance Supplement applicable to its major federal program for the purpose of expressing an opinion on Omnitrans’ compliance with those requirements. While our audit provides a reasonable basis for our opinion, it does not provide a legal determination on Omnitrans’ compliance with those requirements.
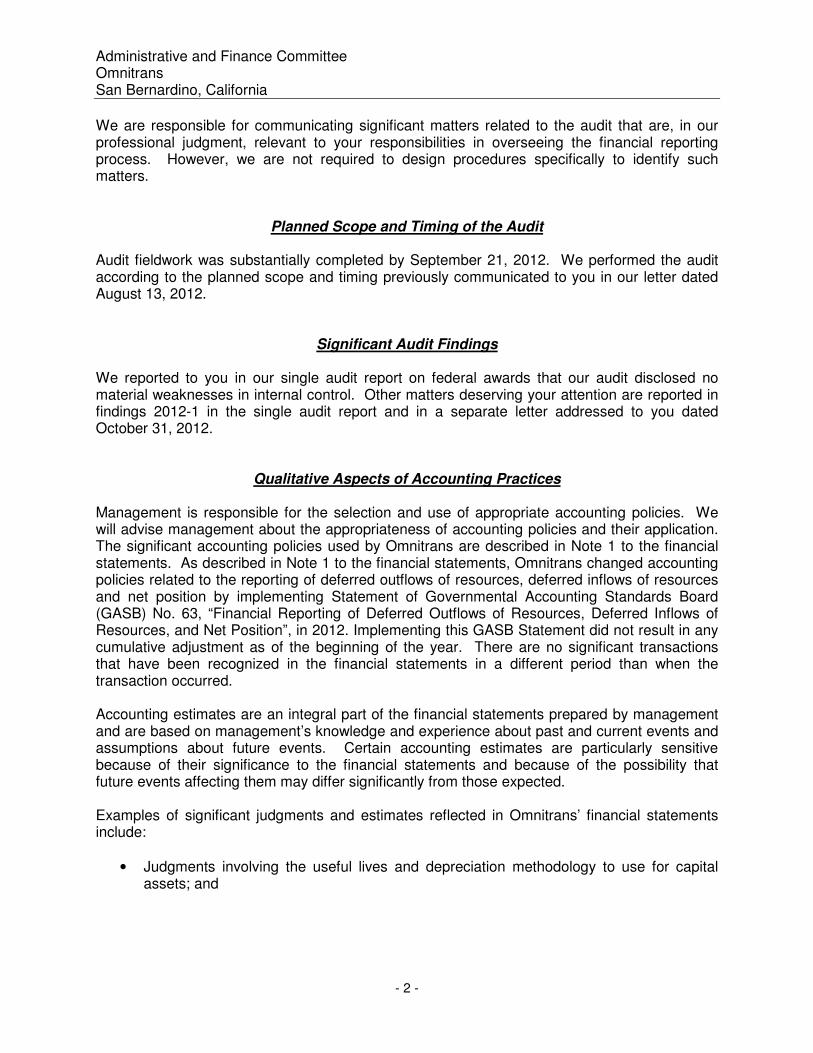
Administrative and Finance Committee Omnitrans San Bernardino, California
- 2 -
We are responsible for communicating significant matters related to the audit that are, in our professional judgment, relevant to your responsibilities in overseeing the financial reporting process. However, we are not required to design procedures specifically to identify such matters.
Planned Scope and Timing of the Audit Audit fieldwork was substantially completed by September 21, 2012. We performed the audit according to the planned scope and timing previously communicated to you in our letter dated August 13, 2012.
Significant Audit Findings We reported to you in our single audit report on federal awards that our audit disclosed no material weaknesses in internal control. Other matters deserving your attention are reported in findings 2012-1 in the single audit report and in a separate letter addressed to you dated October 31, 2012.
Qualitative Aspects of Accounting Practices Management is responsible for the selection and use of appropriate accounting policies. We will advise management about the appropriateness of accounting policies and their application. The significant accounting policies used by Omnitrans are described in Note 1 to the financial statements. As described in Note 1 to the financial statements, Omnitrans changed accounting policies related to the reporting of deferred outflows of resources, deferred inflows of resources and net position by implementing Statement of Governmental Accounting Standards Board (GASB) No. 63, “Financial Reporting of Deferred Outflows of Resources, Deferred Inflows of Resources, and Net Position”, in 2012. Implementing this GASB Statement did not result in any cumulative adjustment as of the beginning of the year. There are no significant transactions that have been recognized in the financial statements in a different period than when the transaction occurred. Accounting estimates are an integral part of the financial statements prepared by management and are based on management’s knowledge and experience about past and current events and assumptions about future events. Certain accounting estimates are particularly sensitive because of their significance to the financial statements and because of the possibility that future events affecting them may differ significantly from those expected. Examples of significant judgments and estimates reflected in Omnitrans’ financial statements include:
• Judgments involving the useful lives and depreciation methodology to use for capital assets; and
Administrative and Finance Committee Omnitrans San Bernardino, California
- 3 -
• Judgments concerning whether an accrual for incurred but not reported claims for workers’ compensation and general liability should be estimated and recorded at year end.
• Judgments involving the fair value and effectiveness of derivative investments associated with hedging transactions to stabilize the cost of fuel for buses.
We evaluated each of the significant judgments and estimates and found them to be reasonable and based upon supported documentation and/or reports from consultants specializing in the related field.
Difficulties Encountered in Performing the Audit We encountered no significant difficulties in performing and completing our audit.
Corrected and Uncorrected Misstatements Professional standards require us to accumulate all known and likely misstatements identified during the audit, other than those that are trivial, and communicate them to the appropriate level of management. To our knowledge, no misstatements were identified during our audit.
Disagreements with Management For purposes of this letter, professional standards define a disagreement with management as a financial accounting, reporting or auditing matter, whether or not resolved to our satisfaction that could be significant to the financial statements or the auditor’s report. We are pleased to report that no such disagreements arose during the course of our audit.
Management Representations We have requested certain representations from management that are included in the management representation letter dated October 31, 2012.
Management Consultations with Other Independent Accountants In some cases, management may decide to consult with other accountants about auditing and accounting matters, similar to obtaining a “second opinion” on certain situations. If a consultation involves application of an accounting principle to Omnitrans’ financial statements or a determination of the type of auditor’s opinion that may be expressed on those statements, our professional standards require the consulting accountant to check with us to determine that the consultant has all the relevant facts. To our knowledge, there were no such consultations with other accountants.
Administrative and Finance Committee Omnitrans San Bernardino, California
- 4 -
Other Audit Findings or Issues We generally discuss a variety of matters, including the application of accounting principles and auditing standards, with management each year prior to retention as Omnitrans’ auditors. However, these discussions occurred in the normal course of our professional relationship and our responses were not a condition to our retention. This information is intended solely for the use of the Administrative and Finance Committee and management of Omnitrans and is not intended to be and should not be used by anyone other than these specified parties.
Irvine, California October 31, 2012
- 1 -
Administrative and Finance Committee Omnitrans San Bernardino, California
Recommendations Regarding Internal Control
In planning and performing our audit of the financial statements of Omnitrans as of and for the year ended June 30, 2012, in accordance with auditing standards generally accepted in the United States of America, we considered Omnitrans’ internal control over financial reporting (internal control) as a basis for designing our auditing procedures for the purpose of expressing our opinion on the financial statements, but not for the purpose of expressing an opinion on the effectiveness of Omnitrans’ internal control. Accordingly, we do not express an opinion on the effectiveness of the organization’s internal control. Our consideration of internal control was for the limited purpose described in the preceding paragraph and was not designed to identify all deficiencies in internal control that might be material weaknesses or significant deficiencies and therefore material weaknesses or significant deficiencies may exist that were not identified. A deficiency in internal control exists when the design or operation of a control does not allow management or employees, in the normal course of performing their assigned functions, to prevent, or detect and correct misstatements on a timely basis. A material weakness is a deficiency or combination of deficiencies in internal control, such that there is a reasonable possibility that a material misstatement of the entity’s financial statements will not be prevented, or detected and corrected on a timely basis. We did not identify any deficiencies in internal control that we consider to be material weaknesses, as defined above. In addition, as a service to you, we identified other matters during our audit that provide you an opportunity to enhance your existing internal controls. The matters identified below are provided as recommendations for your consideration and are not considered to be material weaknesses or significant deficiencies in internal control. (1) Enhancing Procedures Over Subrecipient Monitoring and Reporting
For all federal sub-awards, Omnitrans did not provide pertinent federal award information details (CFDA Title and number, award name and number, etc.) to its subrecipients as required by OMB Circular A-133.

Administrative and Finance Committee Omnitrans San Bernardino, California
- 2 -
For sub-awards made on or after October 1, 2010, Omnitrans did not obtain the subrecipient’s DUNS number during the subrecipient application and award process as required by 2 CFR Section 25.110 and Appendix A to 2 CFR part 25. For non-ARRA sub-awards in excess of $25,000, Omnitrans did not enter key data elements of the sub-award into the Federal Funding Accountability and Transparency Act Subaward Reporting System (FSRS). A requirement under the Federal Funding Accountability and Transparency Act (Transparency Act), as amended by Section 6202(a) of the Government Funding Transparency Act of 2008) is that non-ARRA subawards over $25,000 must be reported in the FSRS. The Information is to be reported in FSRS no later than the last day of the month following the month in which the award or the modification was signed. Program personnel were not aware of these reporting requirements. Failure to obtain the DUNS number and ensure that all subrecipients are entered into FSRS could result in inaccurate reporting of subrecipient awards and expenditures. Recommendation We recommend that Omnitrans develop and implement subrecipient application and award procedures to ensure that the information required by OMB Circular A-133 is obtained from the subrecipient during the application process, and that the key data elements are provided to subrecipients and reported in FSRS by the end of the month following the month in which the award was made. Management Response As recommended, Omnitrans will develop and implement application and award procedures to ensure that the information required by OMB Circular A-133 is obtained from all subrecipients during the application and award process. Additionally, all key data elements will be transmitted and reported on the Federal Funding Accountability and Transparency Act Subaward Reporting System (FSRS).
(2) Need for Enhanced Security Controls over Information Technology Systems Access controls limit or detect inappropriate access to computer resources, thereby protecting them from unauthorized modification, loss and disclosure. Logical access controls require users to authenticate themselves (through the use of secret passwords or other identifiers) and limit the files and other resources that authenticated users can access and the actions that they can execute. Without adequate access controls, unauthorized individuals, including outside intruders and former employees, can surreptitiously read and copy sensitive data and make undetected changes or deletions for malicious purposes or personal gain. In addition, authorized users can intentionally or unintentionally read, add, delete, modify, or execute changes that are outside their span of authority. Inadequate access controls diminish the reliability of computerized data and increase the risk of destruction or inappropriate disclosure of data. During our review of network and SAP accounts, we noted 5 former employees within active network accounts and 3 former employees with active SAP accounts. Omnitrans

Administrative and Finance Committee Omnitrans San Bernardino, California
- 3 -
IT indicated the accounts remain active by request by the departmental directors in order to access information from their accounts. However, the accounts result in a weakness in the security posture of the network. The accounts can be construed as “shared” accounts that are not directly associated to a current employee. During our prior year review of password configurations for users logging onto the network, we noted certain security policies and procedures could be enhanced to provide better security over the network processing environment. It was indicated the password configurations were updated to be more in line with industry best practice. However, we noted additional areas where the password required could be further enhanced. Specifically, we noted password complexity requirements were not enabled. In addition, we noted the minimum password age was set to 0. Without a minimum password age set to greater than 0, users can cycle through passwords repeatedly until they get to an old favorite. Included below are generally accepted industry best practice password configurations:
• A minimum character length, at least 8 characters, should be required for passwords.
• Passwords should be required to be changed periodically, between 30 to 90 days.
• Passwords should be required to contain both alphanumeric and special characters.
• Use of old passwords (for example, within 6 generations) should be prohibited.
• Unsuccessful attempts to login should be limited to between 3 and 5 attempts.
• Individual users should be uniquely identified rather than having users within a group share the same ID or password; generic user IDs and passwords should not be used.
Recommendation We recommend Omnitrans remove accounts for former employees. If this is not feasible, we recommend Omnitrans implement additional security controls over the accounts, including monitoring controls. In addition, we recommend Omnitrans enhance its user access (password) controls to be more in line with industry best practice. Management Response As recommended Omnitrans will implement additional security controls over the accounts, including monitoring controls. Additionally, Omnitrans has begun steps to enhance its user access (password) controls by implementing the following:
1. Password length has to be 8 characters or more. 2. Password has to include combination of alpha and numeric characters. 3. User cannot use the previous 6 passwords. 4. User cannot recycle old password within the 30 days window. 5. User password will expire every 60 days.
Administrative and Finance Committee Omnitrans San Bernardino, California
- 4 -
Omnitrans’ written responses to the matters identified in our audit were not subjected to the auditing procedures applied in the audit of the financial statements and, accordingly, we express no opinion on them. This communication is intended solely for the information and use of the management, those charged with governance, others within Omnitrans, and agencies that provided federal financial assistance to Omnitrans and is not intended to be and should not be used by anyone other than these specified parties.
Irvine, California October 31, 2012

OMNITRANS
Single Audit Report on Federal Awards
Year Ended June 30, 2012
OMNITRANS
Single Audit Report on Federal Awards
Year Ended June 30, 2012
TABLE OF CONTENTS Page
Report on Internal Control over Financial Reporting and on Compliance and Other Matters Based on an Audit of Financial Statements Performed in Accordance with Government Auditing Standards 1 Report on Compliance with Requirements That Could Have a Direct Effect on Each Major Program, Internal Control over Compliance and on the Schedule of Expenditures of Federal Awards in Accordance with OMB Circular A-133 3
Schedule of Expenditures of Federal Awards 6 Note to Schedule of Expenditures of Federal Awards 7 Schedule of Findings and Questioned Costs 8 Summary Schedule of Prior Audit Findings 9
- 1 -
Board of Directors Omnitrans San Bernardino, California
REPORT ON INTERNAL CONTROL OVER FINANCIAL REPORTING AND ON COMPLIANCE AND OTHER MATTERS BASED ON AN AUDIT OF
FINANCIAL STATEMENTS PERFORMED IN ACCORDANCE WITH GOVERNMENT AUDITING STANDARDS
We have audited the basic financial statements of Omnitrans as of and for the year ended June 30, 2012, and have issued our report thereon dated October 31, 2012. We conducted our audit in accordance with auditing standards generally accepted in the United States of America and the standards applicable to financial audits contained in Government Auditing Standards, issued by the Comptroller General of the United States.
Internal Control Over Financial Reporting Management of Omnitrans is responsible for maintaining effective internal control over financial reporting. In planning and performing our audit, we considered Omnitrans’ internal control over financial reporting as a basis for designing our auditing procedures for the purpose of expressing our opinion on the financial statements, but not for the purpose of expressing an opinion on the effectiveness of Omnitrans’ internal control over financial reporting. Accordingly, we do not express an opinion on the effectiveness of Omnitrans’ internal control over financial reporting. A deficiency in internal control exists when the design or operation of a control does not allow management or employees, in the normal course of performing their assigned functions, to prevent, or detect and correct misstatements on a timely basis. A material weakness is a deficiency, or combination of deficiencies, in internal control, such that there is a reasonable possibility that a material misstatement of the entity’s financial statements will not be prevented, or detected and corrected on a timely basis. Our consideration of the internal control over financial reporting was for the limited purpose described in the first paragraph of this section and was not designed to identify all deficiencies in internal control over financial reporting that might be deficiencies, significant deficiencies or
Board of Directors Omnitrans San Bernardino, California
- 2 -
material weaknesses. We did not identify any deficiencies in internal control over financial reporting that we consider to be material weaknesses, as defined above.
Compliance and Other Matters As part of obtaining reasonable assurance about whether Omnitrans’ financial statements are free of material misstatement, we performed tests of its compliance with certain provisions of laws, regulations, contracts and grant agreements, noncompliance with which could have a direct and material effect on the determination of financial statement amounts. However, providing an opinion on compliance with those provisions was not an objective of our audit and, accordingly, we do not express such an opinion. The results of our tests disclosed no instances of noncompliance or other matters that are required to be reported under Government Auditing Standards. We noted certain matters that we reported to management of Omnitrans’ in a separate letter dated October 31, 2012. This report is intended solely for the information and use of the Board of Directors, Omnitrans’ management, federal awarding agencies, and pass-through entities and is not intended to be and should not be used by anyone other than these specified parties.
Irvine, California October 31, 2012
- 3 -
Board of Directors Omnitrans San Bernardino, California
REPORT ON COMPLIANCE WITH REQUIREMENTS THAT COULD HAVE A DIRECT AND MATERIAL EFFECT ON EACH MAJOR PROGRAM AND ON INTERNAL
CONTROL OVER COMPLIANCE IN ACCORDANCE WITH OMB CIRCULAR A-133
Independent Auditors’ Report
Compliance and Other Matters We have audited Omnitrans’ compliance with the types of compliance requirements described in the OMB Circular A-133 Compliance Supplement that could have a direct and material effect on Omnitrans’ major federal programs for the year ended June 30, 2012. Omnitrans’ major federal programs are identified in the summary of auditors’ results section of the accompanying schedule of findings and questioned costs. Compliance with the requirements of laws, regulations, contracts, and grants applicable to its major federal program is the responsibility of Omnitrans’ management. Our responsibility is to express an opinion on Omnitrans’ compliance based on our audit. We conducted our audit of compliance in accordance with auditing standards generally accepted in the United States of America; the standards applicable to financial audits contained in Government Auditing Standards, issued by the Comptroller General of the United States; and OMB Circular A-133, Audits of States, Local Governments, and Non-Profit Organizations. Those standards and OMB Circular A-133 require that we plan and perform the audit to obtain reasonable assurance about whether noncompliance with the types of compliance requirements referred to above that could have a direct and material effect on a major federal program occurred. An audit includes examining, on a test basis, evidence about Omnitrans’ compliance with those requirements and performing such other procedures as we considered necessary in the circumstances. We believe that our audit provides a reasonable basis for our opinion. Our audit does not provide a legal determination on Omnitrans’ compliance with those requirements. In our opinion, Omnitrans complied, in all material respects, with the compliance requirements referred to above that could have a direct and material effect on each of its major federal programs for the year ended June 30, 2012. However, the results of our auditing procedures

Board of Directors Omnitrans San Bernardino, California
- 4 -
disclosed an immaterial instance of noncompliance with those requirements and which is described in the accompanying Schedule of Findings and Questioned Costs as Item 2012-1.
Internal Control Over Compliance Management of Omnitrans is responsible for establishing and maintaining effective internal control over compliance with requirements of laws, regulations, contracts, and grants applicable to federal programs. In planning and performing our audit, we considered Omnitrans’ internal control over compliance with requirements that could have a direct and material effect on a major federal program to determine the auditing procedures for the purpose of expressing our opinion on compliance and to test and report on internal control over compliance in accordance with OMB Circular A-133, but not for the purpose of expressing an opinion on the effectiveness of internal control over compliance. Accordingly, we do not express an opinion on the effectiveness of Omnitrans’ internal control over compliance. A deficiency in internal control over compliance exists when the design or operation of a control over compliance does not allow management or employees, in the normal course of performing their assigned functions, to prevent, or detect and correct, noncompliance with a type of compliance requirement of a federal program on a timely basis. A material weakness in internal control over compliance is a deficiency, or combination of deficiencies, in internal control over compliance, such that there is a reasonable possibility that material noncompliance with a type of compliance requirement of a federal program will not be prevented, or detected and corrected, on a timely basis. Our consideration of internal control over compliance was for the limited purpose described in the first paragraph of this section and would not necessarily identify all deficiencies in internal control that might be deficiencies, significant deficiencies or material weaknesses. We did not identify any deficiencies in internal control over compliance that we consider to be material weaknesses, as defined above.
Schedule of Expenditures of Federal Awards We have audited the basic financial statements of Omnitrans as of and for the year ended June 30, 2012, and have issued our report thereon dated October 31, 2012, which contained an unqualified opinion on those financial statements. Our audit was performed for the purpose of forming our opinion on the financial statements that collectively comprise Omnitrans’ basic financial statements. The accompanying Schedule of Expenditures of Federal Awards is presented for purposes of additional analysis as required by OMB Circular A-133 and is not a required part of the basic financial statements. Such information is the responsibility of management and was derived from and relates directly to the underlying accounting and other records used to prepare the financial statements. The information has been subjected to the auditing procedures applied in the audit of the basic financial statements and certain other procedures, including comparing and reconciling such information directly to the underlying accounting and other records used to prepare the financial statements or to the financial statements themselves, and other procedures in accordance with auditing standards generally accepted in the United States of America. In our opinion, the Schedule of expenditures of

Board of Directors Omnitrans San Bernardino, California
- 5 -
Federal Awards is fairly stated, in all material respects, in relation to the basic financial statements taken as a whole. Omnitrans’ response to the finding identified in our audit is described in the accompanying Schedule of Findings and Questioned Costs. We did not audit Omnitrans’ response, and accordingly, we express no opinion on it. This report is intended solely for the information and use of the Board of Directors, Omnitrans’ management, federal awarding agencies, and pass-through entities and is not intended to be and should not be used by anyone other than these specified parties.
Irvine, California October 31, 2012
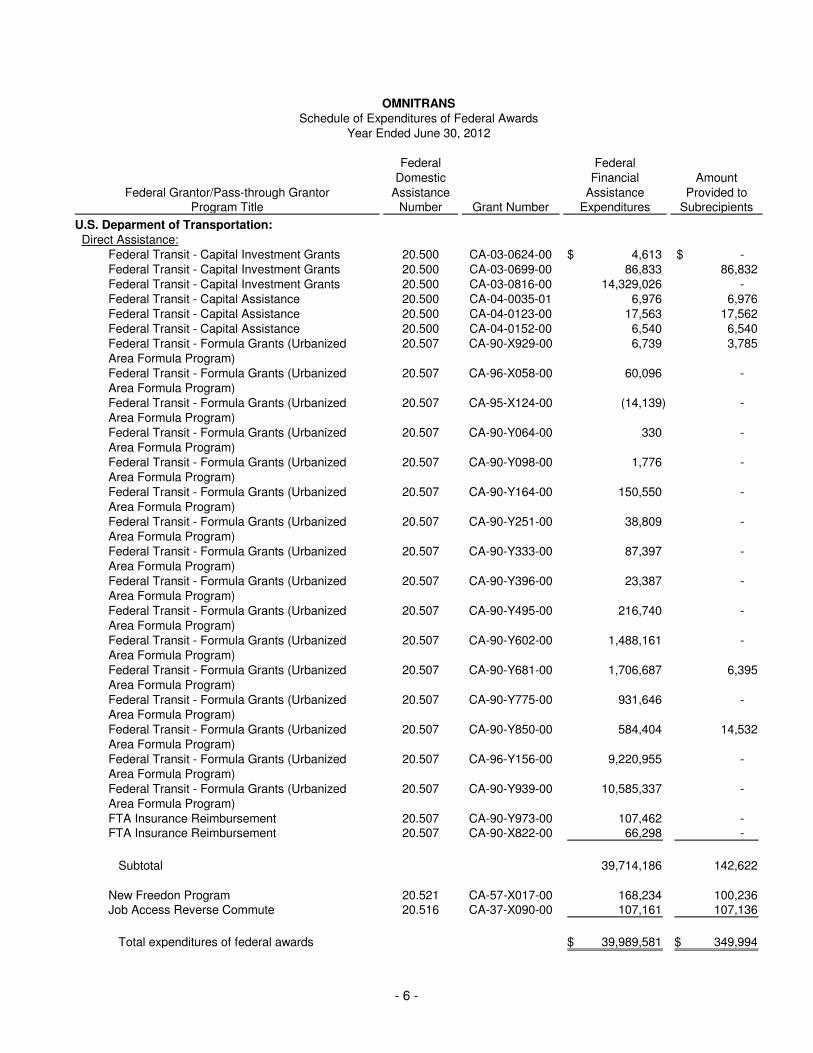
OMNITRANS
Schedule of Expenditures of Federal Awards
Year Ended June 30, 2012
Federal Federal
Domestic Financial Amount
Federal Grantor/Pass-through Grantor Assistance Assistance Provided toProgram Title Number Grant Number Expenditures Subrecipients
U.S. Deparment of Transportation:
Direct Assistance:
Federal Transit - Capital Investment Grants 20.500 CA-03-0624-00 4,613$ -$
Federal Transit - Capital Investment Grants 20.500 CA-03-0699-00 86,833 86,832
Federal Transit - Capital Investment Grants 20.500 CA-03-0816-00 14,329,026 -
Federal Transit - Capital Assistance 20.500 CA-04-0035-01 6,976 6,976
Federal Transit - Capital Assistance 20.500 CA-04-0123-00 17,563 17,562
Federal Transit - Capital Assistance 20.500 CA-04-0152-00 6,540 6,540
Federal Transit - Formula Grants (Urbanized 20.507 CA-90-X929-00 6,739 3,785
Area Formula Program)
Federal Transit - Formula Grants (Urbanized 20.507 CA-96-X058-00 60,096 -
Area Formula Program)
Federal Transit - Formula Grants (Urbanized 20.507 CA-95-X124-00 (14,139) -
Area Formula Program)
Federal Transit - Formula Grants (Urbanized 20.507 CA-90-Y064-00 330 -
Area Formula Program)
Federal Transit - Formula Grants (Urbanized 20.507 CA-90-Y098-00 1,776 -
Area Formula Program)
Federal Transit - Formula Grants (Urbanized 20.507 CA-90-Y164-00 150,550 -
Area Formula Program)
Federal Transit - Formula Grants (Urbanized 20.507 CA-90-Y251-00 38,809 -
Area Formula Program)
Federal Transit - Formula Grants (Urbanized 20.507 CA-90-Y333-00 87,397 -
Area Formula Program)
Federal Transit - Formula Grants (Urbanized 20.507 CA-90-Y396-00 23,387 -
Area Formula Program)
Federal Transit - Formula Grants (Urbanized 20.507 CA-90-Y495-00 216,740 -
Area Formula Program)
Federal Transit - Formula Grants (Urbanized 20.507 CA-90-Y602-00 1,488,161 -
Area Formula Program)
Federal Transit - Formula Grants (Urbanized 20.507 CA-90-Y681-00 1,706,687 6,395
Area Formula Program)
Federal Transit - Formula Grants (Urbanized 20.507 CA-90-Y775-00 931,646 -
Area Formula Program)
Federal Transit - Formula Grants (Urbanized 20.507 CA-90-Y850-00 584,404 14,532
Area Formula Program)
Federal Transit - Formula Grants (Urbanized 20.507 CA-96-Y156-00 9,220,955 -
Area Formula Program)
Federal Transit - Formula Grants (Urbanized 20.507 CA-90-Y939-00 10,585,337 -
Area Formula Program)
FTA Insurance Reimbursement 20.507 CA-90-Y973-00 107,462 - FTA Insurance Reimbursement 20.507 CA-90-X822-00 66,298 -
Subtotal 39,714,186 142,622
New Freedon Program 20.521 CA-57-X017-00 168,234 100,236 Job Access Reverse Commute 20.516 CA-37-X090-00 107,161 107,136
Total expenditures of federal awards 39,989,581$ 349,994$
- 6 -
OMNITRANS
Note to Schedule of Expenditures of Federal Awards
Year Ended June 30, 2012
- 7 -
(1) Summary of Significant Accounting Policies Applicable to the Schedule of Expenditures of Federal Awards
(a) Scope of Presentation
The accompanying schedule presents only the expenditures incurred by Omnitrans that are reimbursable under federal programs of federal financial assistance. For the purposes of this schedule, federal financial assistance includes both federal financial assistance received directly from a federal agency, as well as federal funds received indirectly by Omnitrans from a non-federal agency or other organization. Only the portion of program expenditures reimbursable with such federal funds is reported in the accompanying schedule. Program expenditures in excess of the maximum federal reimbursement authorized or the portion of the program expenditures that were funded with state, local or other non-federal funds are excluded from the accompanying schedule.
(b) Basis of Accounting
The expenditures included in the accompanying schedule were reported on the accrual basis of accounting. Under the accrual basis of accounting, expenditures are recognized when Omnitrans becomes obligated for payment as a result of the receipt of the related goods and services. Expenditures reported included any property or equipment acquisitions incurred under the federal program.
(c) Subrecipients
During the fiscal year ended June 30, 2012, Omnitrans provided $349,994 in federal awards to subrecipients from funding provided by the U.S. Department of Transportation – Federal Transit – Capital Investment Grants Program (CFDA Nos. 20.500 and 20.507), 5317 New Freedom Program (CFDA No. 20.521) and JARC Capital Program (CFDA 20.516).

OMNITRANS
Schedule Findings and Questioned Costs
Year Ended June 30, 2012
- 8 -
(A) Summary of Auditors’ Results 1. An unqualified report was issued by the auditors on the financial statements of the
auditee. 2. No material weaknesses or significant deficiencies in internal control over financial
reporting were reported. 3. The audit disclosed no instances of noncompliance which are material to the financial
statements of the auditee. 4. No material weaknesses or significant deficiencies in internal control over compliance with
the major program of the auditee were reported. 5. An unqualified report was issued by the auditors on compliance for the major program. 6. There was one immaterial instance of noncompliance reported under OMB Circular A-133
and is described in the accompanying Section C as Item 2012-1. 7. The major programs of the auditee were:
• CFDA No. 20.500 U.S. Department of Transportation – Federal Transit – Capital Investment Grants, and
• CFDA No. 20.507, U.S. Department of Transportation – Federal Transit – Formula Grants (Urbanized Area Formula Program).
8. The dollar threshold used to distinguish Type A and Type B programs was $1,199,687. 9. The auditee met the criteria to be considered a low risk auditee for the year ended June
30, 2012 for the purpose of major program determination. (B) Findings Related to the Financial Statements which are Required to be Reported in
Accordance with GAGAS There are no auditors’ findings required to be reported in accordance with GAGAS.
OMNITRANS
Schedule of Findings and Questioned Costs
(Continued)
9
(C) Findings and Questioned Costs for Federal Awards 2012-1: Subrecipient Monitoring and Reporting FEDERAL AGENCY: U.S. Department of Transportation CFDA No.: 20.500 and 20.507 FEDERAL PROGRAM NAME: Federal Transit – Capital Investment Grants Program, and Federal Transit – Formula Grants (Urbanized Area Formula Program) FEDERAL AWARD PROGRAM NO.: Various FEDERAL AWARD YEAR: Various CONTROL CATEGORY: Subrecipient Monitoring & Reporting QUESTIONED COSTS: $0 Condition: For all federal sub-awards, Omnitrans did not provide pertinent federal award information details (CFDA Title and number, award name and number, etc.) to its subrecipients. For sub-awards made on or after October 1, 2010, Omnitrans did not obtain the subrecipient’s DUNS number during the subrecipient application and award process. For non-ARRA sub-awards in excess of $25,000, Omnitrans did not enter key data elements of the sub-award into the Federal Funding Accountability and Transparency Act Subaward Reporting System (FSRS). Criteria: In accordance with OMB Circular A-133 §___.400(d)(1), pass-through entities must inform subrecipients of CFDA title and number, award name and number, award year, if the award is R&D, and name of Federal agency. For subawards made on or after October 1, 2010, an applicant for a non-ARRA award must provide a DUNS number as part of the application or before getting the award (2CFR section 25.110 and Appendix A to 2CFR part 25). A requirement under the Federal Funding Accountability and Transparency Act (Transparency Act), as amended by Section 6202(a) of the Government Funding Transparency Act of 2008) is that non-ARRA subawards over $25,000 must be reported in the Federal Funding Accountability and Transparency Act Subaward Reporting System (FSRS). The Information is to be reported in FSRS no later than the last day of the month following the month in which the award or the modification was signed. Cause: Program personnel were not aware of these recently implemented reporting requirements. Effect: Failure to obtain the DUNS number and ensure that all subrecipients are entered into FSRS could result in inaccurate reporting of subrecipient awards and expenditures.

OMNITRANS
Schedule of Findings and Questioned Costs
(Continued)
10
(C) Findings and Questioned Costs for Federal Awards (Continued) 2012-1: Subrecipient Monitoring and Reporting (Continued) Recommendation: We recommend that Omnitrans develop and implement subrecipient application and award procedures to ensure that the information required by OMB Circular A-133 is obtained from the subrecipient during the application process, and that the key data elements are transmitted and reported in FSRS by the subrecipient by the end of the month following the month in which the award was made. Questioned Costs: None Management’s Response: As recommended, Omnitrans will develop and implement application and award procedures to ensure that the information required by OMB Circular A-133 is obtained from all subrecipients during the application and award process. Additionally, all key data elements will be transmitted and reported on the Federal Funding Accountability and Transparency Act Subaward Reporting System (FSRS).
OMNITRANS
Summary Schedule of Prior Audit Findings
Year Ended June 30, 2012
- 11 -
2011-1: Need to Charge Salary Costs Based Upon Actual
Recommendation: We recommended that Omnitrans implement procedures to ensure salary costs were based upon actual time worked. Current Year Status: Omnitrans implemented procedures to ensure salary costs are based upon actual time worked. As such, this finding has been resolved.
2011-2: Data Quality Review of the ARRA 1512 Report Recommendation: We recommended that Omnitrans develop and implement a data quality review process for the ARRA 1512 reports, following the guidance at OMB Memorandum number M-09-21 section 4.2. Current Year Status: Omnitrans has successfully implemented data quality review processes for the ARRA 1512 reports. As such, this finding has been resolved.
OMNITRANS
Report on Transportation Development Act and
Proposition 1B
Year Ended June 30, 2012
OMNITRANS
Report on Transportation Development Act and Proposition 1B
Year Ended June 30, 2012
TABLE OF CONTENTS Page
Independent Auditors’ Report on Internal Control over Financial Reporting and on Compliance and Other Matters Based on an Audit of Financial Statements Performed in Accordance with Government Auditing Standards 1 Independent Auditors’ Report on Supplementary Information 3 Exhibit A – Transportation Development Act Compliance Requirements 4
Exhibit B – Schedule of Receipts and Disbursements of Proposition 1B Funds 7
- 1 -
Board of Directors Omnitrans San Bernardino, California
INDEPENDENT AUDITORS’ REPORT ON INTERNAL CONTROL OVER FINANCIAL REPORTING AND ON COMPLIANCE AND OTHER MATTERS BASED ON AN
AUDIT OF FINANCIAL STATEMENTS PERFORMED IN ACCORDANCE WITH GOVERNMENT AUDITING STANDARDS
We have audited the basic financial statements of Omnitrans as of and for the year ended June 30, 2012, and have issued our report thereon dated October 31, 2012. We conducted our audit in accordance with auditing standards generally accepted in the United States of America and the standards applicable to financial audits contained in Government Auditing Standards, issued by the Comptroller General of the United States.
Internal Control over Financial Reporting Management of Omnitrans is responsible for establishing and maintaining effective internal control over financial reporting. In planning and performing our audit, we considered Omnitrans’ internal control over financial reporting as a basis for designing our auditing procedures for the purpose of expressing our opinion on the financial statements, but not for the purpose of expressing an opinion on the effectiveness of Omnitrans’ internal control over financial reporting. Accordingly, we do not express an opinion on the effectiveness of Omnitrans’ internal control over financial reporting. A deficiency in internal control exists when the design or operation of a control does not allow management or employees, in the normal course of performing their assigned functions, to prevent, or detect and correct misstatements on a timely basis. A material weakness is a deficiency, or combination of deficiencies, in internal control, such that there is a reasonable possibility that a material misstatement of Omnitrans’ financial statements will not be prevented, or detected and corrected on a timely basis. Our consideration of the internal control over financial reporting was for the limited purpose described in the first paragraph of this section and would not necessarily identify all deficiencies in internal control over financial reporting that might be deficiencies, significant deficiencies or material weaknesses. We did not identify any deficiencies in internal control over financial reporting that we consider to be material weaknesses, as defined above.
Board of Directors Omnitrans San Bernardino, California
- 2 -
Compliance and Other Matters As part of obtaining reasonable assurance about whether Omnitrans’ financial statements are free of material misstatement, we performed tests of its compliance with certain provisions of laws, regulations, contracts, and grant agreements, including Section 6667 of Part 21 of the California Code of Regulations, Section 8879.50 et seq of the California Government Code, and the fifteen tasks contained in the “SANBAG Transportation Development Act 2005 Compliance Guide”, published by the San Bernardino Associated Governments (see Exhibit A), noncompliance with which could have a direct and material effect on the determination of financial statement amounts. However, providing an opinion on compliance with those provisions was not an objective of our audit, and accordingly, we do not express such an opinion. The results of our tests disclosed no instances of noncompliance that are required to be reported under Government Auditing Standards, including Section 6667 of Part 21 of the California Code of Regulations, Section 8879.50 et seq of the California Government Code, and the fifteen tasks contained in the “SANBAG Transportation Development Act 2005 Compliance Guide”, published by the San Bernardino Associated Governments. See Exhibit B for a Schedule of Receipts and Disbursements of Proposition 1B funds as required by Section 8879.50 et seq of the California Government Code. We noted certain other matters that we reported to management of Omnitrans in a separate letter dated October 31, 2012. This report is intended solely for the information and use of the Board of Directors of Omnitrans, its management, the San Bernardino Associated Governments, the California State Department of Transportation and the California State Controller’s Office and is not intended to be and should not be used by anyone other than these specified parties.
Irvine, California October 31, 2012

- 3 -
Board of Directors Omnitrans San Bernardino, California
INDEPENDENT AUDITORS’ REPORT ON SUPPLEMENTARY INFORMATION We have audited the basic financial statements of Omnitrans as of and for the year ended June 30, 2012, and have issued our report thereon dated October 31, 2012. Our audit was performed for the purpose of forming an opinion on the basic financial statements taken as a whole. The accompanying Schedule of Receipts and Disbursements of Proposition 1B Funds (Exhibit B) is presented for purposes of additional analysis as required by Section 8879.50 et seq of the California government Code and is not a required part of the basic financial statements. Such information is the responsibility of management and was derived from and relates directly to the underlying accounting and other records used to prepare the financial statements. The information has been subjected to the auditing procedures applied in the audit of the basic financial statements or to the financial statements themselves, and other additional procedures in accordance with auditing standards generally accepted in the United States of America. In our opinion, the Schedule of Receipts and Disbursements of Proposition 1B Funds is fairly stated, in all material respects, in relation to the basic financial statements taken as a whole. This report is intended solely for the information and use of the Board of Directors, Omnitrans’ management, federal awarding agencies, and pass-through entities and is not intended to be and should not be used by anyone other than these specified parties.
Irvine, California October 31, 2012

Exhibit A OMNITRANS
Transportation Development Act Compliance Requirements
- 4 -
Task Number Task Description
1 (All Claimants)
Determine that Claimant is eligible under one of the following TDA Articles: 1. Article 3 (SB821) – Pedestrian and Bicycle Facilities 2. Article 4 – Public Transportation Systems 3. Article 4.5 – Community Transit Services 4. Article 4.5 – Consolidated Transportation Services Agencies 5. Article 6.5 (SB620) – State Transit Assistance Fund 6. Article 8 – Pedestrian and Bicycle Facilities 7. Article 8 – Public Transit Services 8. Article 8 – Local Streets and Roads 9. Article 8 – Multi-Modal Transportation Services
2 (All Transit Claimants)
Determine that claimant has maintained accurate and complete records and has prepared and submitted an annual report of its operations in accordance with the Uniform System of Accounts and Records adopted by the State Controller.
3 (All Transit Claimants)
Determine that claimant did not receive TDA funds in excess of the amount claimant was eligible for. If it is found that excess funds have been received, determine that they have been properly accounted for. Identify by footnote to the financial statement the manner in which the agency has treated the excess. Determine that claimant has not recorded as income or as an account receivable any TDA allocations being reserved in the Local Transportation Fund (LTF) or committed in the State Transit Assistance Fund (STAF). If either case is determined, the financial statement should be footnoted.
4 (Article 6.5
Claimants Only)
Determine that claimant was eligible to receive State Transit Assistance. Determine that claimant was eligible to receive State Transit Assistance for operating assistance, including but not limited to verifying the operators’ operating cost per revenue hour does not exceed the prior year operating cost per revenue hour adjusted by the Consumer Price Index (CPI) or the average cost per revenue hour of the past three years adjusted by CPI. The actual cost per revenue hour comparison must be calculated in footnotes.
5 (All Claimants)
Determine that funds expended were eligible for expenditures under the provisions of the TDA. Determine that proposed budgets contained within the claim for the audit year are consistent with the audited financial statements and the Short Range Transit Plan or Transit Operating and Capital Plan. If an excess exists, refer to Task 3.
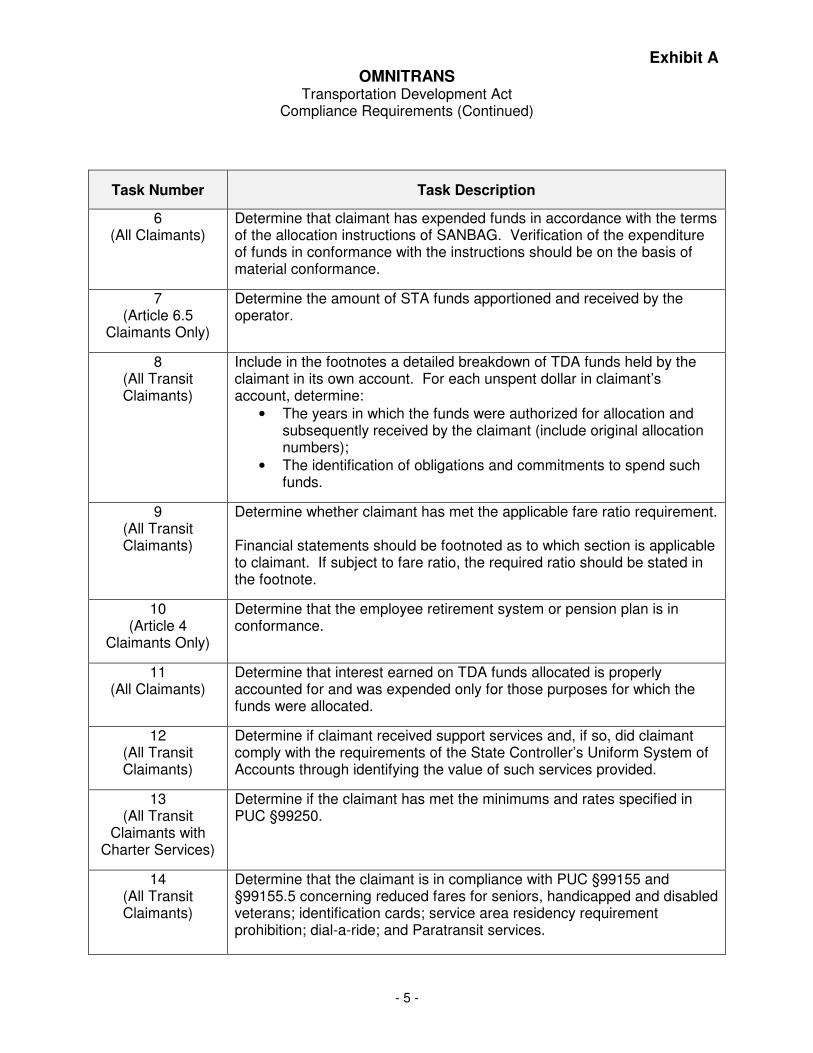
Exhibit A OMNITRANS
Transportation Development Act Compliance Requirements (Continued)
- 5 -
Task Number Task Description
6 (All Claimants)
Determine that claimant has expended funds in accordance with the terms of the allocation instructions of SANBAG. Verification of the expenditure of funds in conformance with the instructions should be on the basis of material conformance.
7 (Article 6.5
Claimants Only)
Determine the amount of STA funds apportioned and received by the operator.
8 (All Transit Claimants)
Include in the footnotes a detailed breakdown of TDA funds held by the claimant in its own account. For each unspent dollar in claimant’s account, determine:
• The years in which the funds were authorized for allocation and subsequently received by the claimant (include original allocation numbers);
• The identification of obligations and commitments to spend such funds.
9 (All Transit Claimants)
Determine whether claimant has met the applicable fare ratio requirement. Financial statements should be footnoted as to which section is applicable to claimant. If subject to fare ratio, the required ratio should be stated in the footnote.
10 (Article 4
Claimants Only)
Determine that the employee retirement system or pension plan is in conformance.
11 (All Claimants)
Determine that interest earned on TDA funds allocated is properly accounted for and was expended only for those purposes for which the funds were allocated.
12 (All Transit Claimants)
Determine if claimant received support services and, if so, did claimant comply with the requirements of the State Controller’s Uniform System of Accounts through identifying the value of such services provided.
13 (All Transit
Claimants with Charter Services)
Determine if the claimant has met the minimums and rates specified in PUC §99250.
14 (All Transit Claimants)
Determine that the claimant is in compliance with PUC §99155 and §99155.5 concerning reduced fares for seniors, handicapped and disabled veterans; identification cards; service area residency requirement prohibition; dial-a-ride; and Paratransit services.

Exhibit A OMNITRANS
Transportation Development Act Compliance Requirements (Continued)
- 6 -
Task Number Task Description
15 (All Claimants)
Determine that claimant has complied with legislative or regulatory code changes that have occurred subsequent to the publication of the SANBAG Compliance Audit Guide and to additional provisions of the TDA that are specifically applicable to claimant.
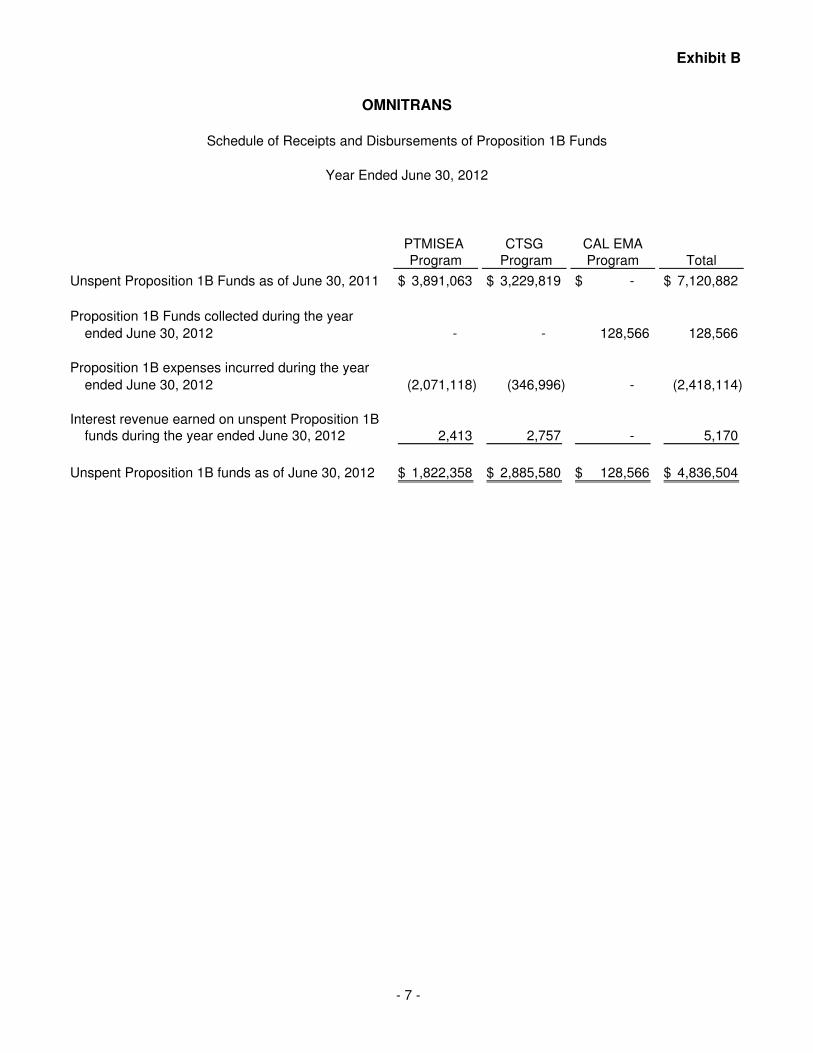
Exhibit B
OMNITRANS
Schedule of Receipts and Disbursements of Proposition 1B Funds
Year Ended June 30, 2012
PTMISEA CTSG CAL EMA
Program Program Program Total
Unspent Proposition 1B Funds as of June 30, 2011 3,891,063$ 3,229,819$ -$ 7,120,882$
Proposition 1B Funds collected during the year
ended June 30, 2012 - - 128,566 128,566
Proposition 1B expenses incurred during the year
ended June 30, 2012 (2,071,118) (346,996) - (2,418,114)
Interest revenue earned on unspent Proposition 1B
funds during the year ended June 30, 2012 2,413 2,757 - 5,170
Unspent Proposition 1B funds as of June 30, 2012 1,822,358$ 2,885,580$ 128,566$ 4,836,504$
- 7 -
OMNITRANS
Annual National Transit Database Reporting
For the Period July 1, 2011 through June 30, 2012
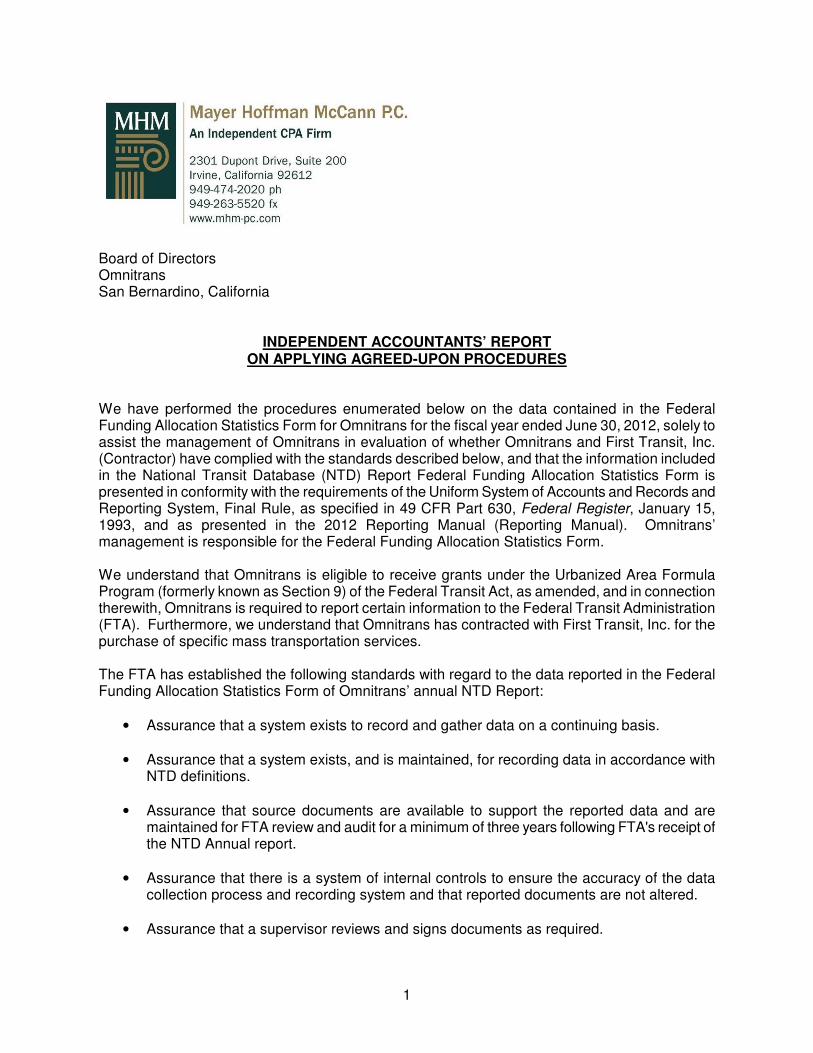
1
Board of Directors Omnitrans San Bernardino, California
INDEPENDENT ACCOUNTANTS’ REPORT ON APPLYING AGREED-UPON PROCEDURES
We have performed the procedures enumerated below on the data contained in the Federal Funding Allocation Statistics Form for Omnitrans for the fiscal year ended June 30, 2012, solely to assist the management of Omnitrans in evaluation of whether Omnitrans and First Transit, Inc. (Contractor) have complied with the standards described below, and that the information included in the National Transit Database (NTD) Report Federal Funding Allocation Statistics Form is presented in conformity with the requirements of the Uniform System of Accounts and Records and Reporting System, Final Rule, as specified in 49 CFR Part 630, Federal Register, January 15, 1993, and as presented in the 2012 Reporting Manual (Reporting Manual). Omnitrans’ management is responsible for the Federal Funding Allocation Statistics Form. We understand that Omnitrans is eligible to receive grants under the Urbanized Area Formula Program (formerly known as Section 9) of the Federal Transit Act, as amended, and in connection therewith, Omnitrans is required to report certain information to the Federal Transit Administration (FTA). Furthermore, we understand that Omnitrans has contracted with First Transit, Inc. for the purchase of specific mass transportation services. The FTA has established the following standards with regard to the data reported in the Federal Funding Allocation Statistics Form of Omnitrans’ annual NTD Report:
• Assurance that a system exists to record and gather data on a continuing basis.
• Assurance that a system exists, and is maintained, for recording data in accordance with NTD definitions.
• Assurance that source documents are available to support the reported data and are maintained for FTA review and audit for a minimum of three years following FTA's receipt of the NTD Annual report.
• Assurance that there is a system of internal controls to ensure the accuracy of the data collection process and recording system and that reported documents are not altered.
• Assurance that a supervisor reviews and signs documents as required.
Board of Directors Omnitrans San Bernardino, California
2
• Assurance that the data collection methods are those suggested by the FTA; or have been approved by the FTA or a qualified statistician as being equivalent in quality and precision. The collection methods must be documented and followed.
• Assurance that the deadhead miles appear to be accurate.
• Documentation that reported data have undergone analytic review to ensure that they are consistent with prior reporting periods and other facts known about transit agency operations.
• Documentation of the specific documents reviewed and tests performed.
• Documentation of how purchased transportation (PT) fare revenues and contract expenditures are reported; i.e., PT fare revenues should include all fare revenues pertaining to the PT service, and buyer's contract expenditures are reported net of (not including) the PT fare revenues.
This engagement to apply agreed upon procedures was conducted in accordance with attestation standards established by the American Institute of Certified Public Accountants. The sufficiency of these procedures is solely the responsibility of those parties specified in the report. Consequently, we make no representation regarding the sufficiency of the procedures described below, either for the purpose for which this report has been requested or for any other purpose. The procedures described below were applied separately to the information systems used to develop the reported vehicle revenue miles, passenger miles and operating expenses of Omnitrans for the fiscal year ended June 30, 2012, for the following transportation modes:
Mode Type of Service Motor bus Directly operated (MBDO) Motor bus Purchased transportation (MBPT)
Demand response Purchased transportation (DRPT) We were not engaged to, and did not, conduct an audit, the objective of which would be the expression of an opinion on Omnitrans’ Federal Funding Allocation Statistics Form for the fiscal year ended June 30, 2012, which is presented in conformity with the requirements of the Uniform System of Accounts and Records and Reporting Systems, as specified in 49 CFR Part 630, Federal Register, January 15, 1993, and as presented in the 2012 Reporting Manual. Accordingly, we do not express such an opinion. Had we performed additional procedures, other matters might have come to our attention that would have been reported to you. This report relates only to the information described above and does not extend to Omnitrans’ financial statements, or the forms in Omnitrans’ NTD Report, other than the Federal Funding Allocation Statistics Form, for any date or period. The procedures performed and the results of those procedures were as follows:
a. We obtained and read a copy of Omnitrans’ written procedures related to the system for
reporting and maintaining data in accordance with NTD requirements and definitions set forth in 49 CFR part 630, Federal Register, January 15, 2991 and as presented in the 2012 Reporting Manual.
Board of Directors Omnitrans San Bernardino, California
3
Results: Omnitrans’ written procedures are in accordance with NTD requirements.
b. We discussed with Omnitrans’ personnel the procedures related to the system for preparing and maintaining data in accordance with the NTD requirements and definitions set forth in 49 CFR Part 630, Federal Register, January 15, 1991 and as presented in the 2012 Reporting Manual. Results: The following is a listing of the individuals interviewed with the assigned responsibility of supervising the preparation and maintenance of the data:
• Directly operated services: o Gabriel Serna, Operations Analyst o Carolann Williams, Operations Analyst o Jeremiah Bryant, Manager of Planning o Elena Fitts, Senior Financial Analyst
• Purchased transportation services: o Frank Quass, Operations Services Supervisor
We discussed the procedures in place for purchased transportation with Omnitrans’ personnel assigned with the responsibility of supervising the preparation and maintenance of NTD data. Omnitrans has adequate procedures for accumulating and reporting purchased transportation data. Omnitrans believes its procedures are in accordance with NTD requirements.
c. We inquired of Omnitrans regarding the retention policy that is followed with respect to source documents supporting the NTD data reported on the Federal Funding Allocation Statistics Form (FFA-10).
Results: We obtained Omnitrans’ records retention policy and noted that it includes provisions for maintaining source documents supporting NTD data for 11 years.
d. Based upon the description of procedures referenced in Procedures a. and b. above, we identified the source documents that are to be retained for a minimum of three years. We selected the months of July 2011, August 2011 and November 2011, for directly operated services, and purchased transportation services and validated whether the documents were retained as required. The following is a listing of the source documents and other records (such as Data Summaries) which are to be retained:
• Access Core Trip Sheets
• Omni Link Trip Sheets
• Monthly Performance Indicator Reports
• Monthly Transit Agency Services Form
• Monthly Service Change Summary
• Coach Operators Seniority List – Full Time
• Part Time Coach Operator List
• Coach Operators Inactive List

Board of Directors Omnitrans San Bernardino, California
4
• Daily Vehicle Surveying Reports
• Daily Driver Manifests
• Monthly Trip Log
• Service Interruptions Report
• Training/Absenteeism/Personnel Count Report
• Fixed Route Schedule
• Mandatory Federal Transit Administration NTD Survey
Results: No exceptions were noted as a result of our procedures.
e. We inquired of Omnitrans personnel whether individuals independent of preparing source documents and posting data summaries and reviewing the source documents and data summaries for completeness, accuracy and reasonableness.
Results: No exceptions were noted as a result of our procedures.
f. We randomly selected a sample of Bus Trip Sheets and Contractor’s Trip Sheet Data Entry Database Print Screens for the months of July 2011, August 2011 and November 2011 for purchased transportation services to determine whether supervisors’ signatures are present as required by the system of internal controls. Our sample included 58 trip sheets. Results: No exceptions were noted as a result of our procedures.
g. We obtained the worksheets utilized by Omnitrans, including documents obtained from the Contractor, to prepare the final data that is transcribed onto the Federal Funding Allocation Statistics Form. We compared the data included on the worksheets to periodic summaries prepared by Omnitrans and the Contractor, and verified the mathematical accuracy of the summarization for the months of July 2011, August 2011 and November 2011 for directly operated services, and purchased transportation services.
Results: No exceptions were noted as a result of our procedures.
h. We discussed with Omnitrans management as to its procedures for accumulating and recording passenger mile data in accordance with NTD requirements.
Results: We noted that Omnitrans uses an estimate of passenger miles based upon a statistical sampling method that is in accordance with FTA C2710.1A, “Sampling Procedures For Obtaining Fix Route Bus Operating Data Required under the Section 15 Reporting System” for the directly operated program, and FTA C2710.2A “Sampling Techniques For Obtaining Demand Responsive Bus System Operating Data required Under the Section 15 Reporting System” for the purchased transportation program. No exceptions were noted as a result of our procedures.

Board of Directors Omnitrans San Bernardino, California
5
i. We discussed with Omnitrans management as to its eligibility to conduct statistical sampling for passenger mile data every third year.
Results: This procedure was not applicable. Omnitrans did not meet the criteria established by the FTA to conduct statistical sampling for passenger mile data every third year.
j. We discussed with Omnitrans management as to the statistical sampling procedure used for the estimation of passenger mile data.
Results: We noted that Omnitrans obtains an estimate of passenger boarding based upon a statistical sampling method that is in accordance with FTA C2710.1A and meets the FTA’s 95% confidence level and 10% precision requirements. We obtained a copy of Omnitrans’ working papers to estimate passenger miles and noted that Omnitrans selects its sample from the universe of runs. We further noted that Omnitrans’ policy is to randomly select more than the required amount to ensure the sample size will always consist of vehicles with a properly functioning Automatic Passenger Count (APC) fare box. No exceptions were noted as a result of our procedures.
k. We selected a random sample of the source documents for accumulating passenger mileage data and determined that they are complete (all required data are recorded) and that the computations are accurate. We selected a random sample of the accumulation periods and recomputed the accumulations for each of the selected periods. We listed the accumulation periods that were tested, and verified the mathematical accuracy of the summarization.
Results: We reviewed the accumulation of passenger mileage data by judgmentally selecting a sample of 58 bus trip surveys for the months of July 2011, August 2011 and November 2011 for purchased transportation services. We also reviewed a sample of 135 trip surveys for the months of July 2011, August 2011 and November 2011 for directly operated services. We verified that all required data was recorded on the trip surveys and/or supporting documentation that were used for the calculation of passenger mileage, and ensured that the computations were mathematically accurate. We verified the mathematical accuracy of the accumulation of the passenger mileage data on the Daily Summary Report and the summarization of the passenger mileage data on the Monthly Ridership Summary Report for the items selected. No exceptions were noted as a result of our procedures.
l. We discussed with Omnitrans management as to its procedures for the systematic exclusion of charter school bus and other ineligible vehicle miles from the calculation of vehicle revenue miles.
Results: This procedure was not applicable as Omnitrans does not operate school buses, charter services or other ineligible vehicles.
Board of Directors Omnitrans San Bernardino, California
6
m. We discussed with Omnitrans management as to its treatment of deadhead miles for directly operated services and purchased transportation services.
Results: Trip sheets are not prepared for directly operated services. Instead, directly operated bus routes are fixed and have scheduled revenue miles that exclude deadhead miles. Deadhead miles include mileage from the garage to the first pick-up, and from the last drop-off to the garage. Mileage driven during lunch, although rare, is also considered deadhead miles. We further noted that purchased transportation deadhead miles are similar to directly operated services deadhead miles and is excluded from the calculation of purchased transportation services. Purchased transportation miles are recorded on daily trip sheets and revenue mileage is derived by calculating the total mileage from the point of passenger pickup to the point of drop-off for each trip. The Contractor’s vehicle revenue miles are calculated, recorded and reported directly to Omnitrans on a monthly basis. We selected 58 purchased transportation trip sheets from the months of July 2011, August 2011 and November 2011 and agreed the reported mileage to print screens from the Trip Sheet Data Entry Database (Transtrak) to ensure that reported mileage was reported accurately and excluded deadhead miles. In comparing amounts reported on the trip sheets to the Transtrak Surveying Sheets we noted passenger mile variances on 12 of the 58 selected for testing. For the months selected, Transtrak reported a total of 7,524 passenger miles while a total of 7,469 passenger miles were reported on the trip sheets. This resulted in 55 excess passenger miles reported in the Data Entry System. Recommendation: We recommend that Omnitrans develop and implement procedures to ensure that purchased transportation passenger miles entered into Transtrak are in agreement with the supporting trip sheets. Management Response: Contractor audited and found clerical transcription errors occurred when the survey sheets were prepared. Contractor has added additional oversight by their Assistant General Manager and/or designee designed to review and verify the accuracy of the survey reporting. Omnitrans Operations has added additional oversight by the Operations Services Supervisor or designee to validate the monthly survey report to the original trip sheet data.
n. We inquired as to whether Omnitrans provides rail service so that we could determine whether vehicle revenue miles were properly accumulated.
Results: This procedure was not applicable as Omnitrans does not provide rail service.
o. We discussed with Omnitrans personnel as to the treatment of fixed guideway directional route miles in order to determine that reporting procedures meet the NTD service requirements. We discussed bus service operating over exclusive or controlled access rights-of-way. We discussed restricted access of High Occupancy Vehicles (HOV) and High Occupancy/Toll (HO/T) lanes.
Board of Directors Omnitrans San Bernardino, California
7
Results: This procedure was not applicable as Omnitrans does not provide any fixed guideway, bus service over controlled access rights-of-way, or HOV lane services.
p. We discussed with Omnitrans personnel as to the measurement of fixed guideway directional route miles in order to determine if the mileage reported is computed in accordance with NTD requirements. We also inquired as to whether a service change occurred during the year resulting in an increase or decrease in directional route miles.
Results: This procedure was not applicable as Omnitrans does not provide fixed guideway services.
q. We inquired as to whether there were any interruptions in service for fixed guideway directional route miles.
Results: This procedure was not applicable as Omnitrans does not provide fixed guideway services.
r. We measured the fixed guideway directional route miles from maps or by retracing the
routes.
Results: This procedure was not applicable as Omnitrans does not provide fixed guideway services.
s. We discussed with Omnitrans’ personnel whether other public transit agencies operate
service over the same fixed guideway segment.
Results: This procedure was not applicable as Omnitrans does not provide fixed guideway services.
t. We performed an anaylsis of the Fixed Guideway Segment Form S-20. This procedure required comparing the 2010 S-20 to the 2011 S-20 to determine if the information reported was consistent. Additionally, this procedure required ensuring that the correct fixed guideway commencement date was reported.
Results: This procedure was not applicable as Omnitrans does not provide fixed guideway services.
u. We reconciled operating expenses reported on the NTD Form F-40, Operating Expense Summary to the audited financial statements of Omnitrans.
Results: The operating expenses as reported on NTD Form F-40 agreed to the audited financial statements of Omnitrans without exception.

Board of Directors Omnitrans San Bernardino, California
8
v. We inquired as to whether Omnitrans purchased transportation services during the period July 1, 2011 through June 30, 2012. If so, we agreed purchased transportation (PT) revenues as reported on the Contractual Relationship Identification Form (B-30) to the audited financial statements.
Results: Omnitrans purchased transportation services from First Transit, Inc. during the period July 1, 2011 through June 30, 2012. PT fare revenues, as reported on Form B-30, agreed to the audited financial statements of Omintrans. No exceptions were noted as a result of our procedures.
w. We discussed with Omnitrans’ management and First Transit, Inc. management, the reporting of the PT data.
Results: We noted that First Transit, Inc. does not operate in excess of 100 vehicles. As such, they are not required to have an Independent Auditor Statement for Federal Funding Allocation Data.
x. We obtained a copy of the PT contract between Omnitrans and First Transit, Inc. and verified that it contained the following information as required by NTD guidelines: (1) specifies the specific public transportation services to be provided; (2) specifies the monetary consideration obligated by Omnitrans; (3) specifies the period covered by the contract and that this period is the same as, or a portion of, the period covered by Omnitrans’ NTD report; and (4) is signed by representatives of both parties to the contract. We interviewed the person responsible for maintaining the NTD data regarding the retention of the executed contract, and determined that copies of the contracts are retained for three years.
Results: No exceptions were noted as a result of our procedures.
y. We discussed with Omnitrans management and the Contractor regarding the allocation of statistical information over urbanized and/or non-urbanized areas.
Results: We noted that Omnitrans does provide service to more than one urbanized area, or an urbanized area and non-urbanized area. However, they do not perform an allocation of statistics between urbanized areas and non-urbanized areas. The allocation is provided by the San Bernardino Associated Governments (SANBAG) and the Southern California Association of Governments (SCAG). As such, no exceptions were noted as a result of our procedures.
z. We compared the vehicle revenue miles, passenger miles and operating expense data reported on Form FFA-10 to comparable data for the prior year’s Form FFA-10, and calculated the percentage change from the prior year to the current year.
Results: We performed the above procedure and noted the following changes (increases or decreases) in excess of 10%:
Board of Directors Omnitrans San Bernardino, California
9
• MBPT – Vehicle Revenue Mileage (VRM) – Increase of 29.31%
• MBPT – Operating Expenses – Increase of 22.87%
• DRPT – Vehicle Revenue Mileage – Increase of 10.14%
• DRPT – Operating Expenses – Increase of 10.57%
The MBPT program began in September 2010, and the current fiscal year was the first full year of operations which adequately explain the increase in Vehicle Revenue Mileage and Operating Expenses. For DRPT, we noted an increase in ridership from 454,274 in fiscal year 2010-11 to 478,342 in fiscal year 2011-12, which accounts for the increases in Vehicle Revenue Miles and Operating Expenses.
This report is intended solely for the information and use of the Board of Directors and management of Omnitrans and its Federal awarding agencies and is not intended to be and should not be used by anyone other than these specified parties.
Irvine, California October 19, 2012