Embed Size (px)
Citation preview


For the Fiscal Year Ended June 30, 2010Prepared by the Finance Department
2011 Comprehensive AnnualFinancial ReportFor the Fiscal Year Ended June 30, 2011Prepared by the Finance Department

INTRODUCTORY SECTION Letter of Transmittal ............................................................................................................................................... 5 – 9 Board of Commissioners ........................................................................................................................................... 10 Organization Chart and Executive Staff .................................................................................................................... 11 Certificate of Achievement for Excellence in Financial Reporting ............................................................................ 12
FINANCIAL SECTION Independent Auditors’ Report ................................................................................................................................... 15 Management’s Discussion and Analysis ........................................................................................................... 16 – 25 Financial Statements as of and for the Years Ended June 30, 2011 and 2010 Statements of Net Assets ................................................................................................................... 27 – 28 Statements of Revenues, Expenses and Changes in Net Assets ............................................................ 30 Statements of Cash Flows ................................................................................................................. 31 – 32 Notes to Financial Statements ........................................................................................................... 33 – 56
REQUIRED SUPPLEMENTARY INFORMATION Schedules of Funding Progress for the Year Ended June 30, 2011 ......................................................................... 57
SUPPLEMENTARY INFORMATION Schedule of Net Assets Information by Entity ................................................................................................... 59 – 60 Schedule of Revenues, Expenses and Changes in Net Assets Information by Entity .............................................. 62 Schedule of Airport Revenue Bonds, Principal and Interest Requirements by Fiscal Year ............................. 63 – 64
STATISTICAL SECTION Airport-specific Statistics Operating Revenues Analysis ................................................................................................................... 67 Cost per Enplaned Passenger .................................................................................................................. 68 Operating Revenues Analysis – Activity Detail ......................................................................................... 69 Public Parking Analysis ............................................................................................................................. 69 Operating Expenses Analysis ................................................................................................................... 70 Schedule of Capital Assets ....................................................................................................................... 71 Ratios of Outstanding Revenue Bonds as a Percentage of Total Revenue Bond Debt .......................... 71 Change in Net Assets ............................................................................................................................... 72 Net Assets ................................................................................................................................................. 73 Debt Service Coverage ..................................................................................................................... 74 – 76 Passenger Enplanements Market Share ................................................................................................... 76 Enplanement History ................................................................................................................................. 77 Airline Landed Weights Market Share ............................................................................................... 77 – 78 Aircraft Activity and Weights ............................................................................................................. 79 – 80 Airport Tenants .......................................................................................................................................... 81 Staffing – Full-time Equivalents ................................................................................................................. 82 Local Economy Statistics Population Analysis ................................................................................................................................... 82 Unemployment Analysis ............................................................................................................................ 83 Top 25 Local Employers ............................................................................................................................ 84 Wealthiest Tennessee ZIP Codes .............................................................................................................. 84 Top 25 Middle Tennessee Public Companies ............................................................................................ 85 Top 25 Tennessee Public Companies ........................................................................................................ 853 Metropolitan Nashville Airport Authority | Comprehensive Annual Financial Report
Table of Contents
Metropolitan Nashville Airport Authority | Comprehensive Annual Financial Report

This section contains the following subsections:
Letter of Transmittal
Board of Commissioners
Organization Chart and Executive Staff
Certificate of Achievement for Excellence in Financial Reporting
Introductory Section
Metropolitan Nashville Airport Authority | Comprehensive Annual Financial Report

LETTER OF TRANSMITTAL
One Terminal Drive, Suite 501 • Nashville, TN 37214-4114 • 615-275- 1600
October 20, 2011
To the Board of Commissioners of the Metropolitan Nashville Airport Authority
The Comprehensive Annual Financial Report (“CAFR”) of the Metropolitan Nashville Airport Authority (the “Authority” or “MNAA”) for the fiscal year ended June 30, 2011, is hereby submitted. Responsibility for both the accuracy of the data and the completeness and fairness of the presentation, including all disclosures, rests with the finance department of the Authority. To the best of our knowledge and belief, the enclosed data are accurate in all material respects and are reported in a manner designed to present fairly the financial position and results of operations of the Authority. All disclosures necessary to enable the reader to gain an understanding of the Authority’s financial activities have been included.
The Authority is a metropolitan airport authority created February 9, 1970, pursuant to state statute and is an independent political subdivision of the State of Tennessee. The major purposes of the Authority are the development, financing and operation of the Nashville International Airport (“BNA”) and John C. Tune Airport (“JWN”), a general aviation reliever airport. These activities collectively provided the framework to deliver the Nashville Airports Experience, the Authority’s core competency, to nearly ten million passengers and many other stakeholders in fiscal year 2011. The Authority also owns MNAA Properties Corporation (“MPC”), a Tennessee nonprofit corporation, whose purpose is to support and facilitate the operations of the Authority and to help the economic development of the surrounding area. The Authority has all the powers of a governmental entity necessary to accomplish its purpose, such as acquiring land and constructing airport facilities; issuing revenue bonds and other tax-exempt indebtedness; maintaining its own policy and aircraft rescue and firefighting (“ARFF”); and setting rates, charges and rentals for activities on airport properties. Based upon the criteria set forth in Governmental Accounting Standards Board Statement No. 14, The Financial Reporting Entity, it has been determined that the Authority is a component unit of the Metropolitan Government of Nashville and Davidson County, Tennessee.
A Board of Commissioners governs the Authority and serves without compensation. The Board of Commissioners is made up of ten members, nine of whom are appointed by the Mayor with the tenth being the Mayor. The Metropolitan Council of Nashville and Davidson County confirms all appointments. The appointments are four-year terms, and terms are staggered to provide for continuity of airport development and management. By state law, the Commissioners represent different professional and management disciplines, including engineering, aviation, law, commerce, finance and industry. The Board appoints the Authority’s President, who is the chief executive and administrative officer responsible for day-to-day operations and planning for both Authority airports and MPC. The President heads a full-time staff of professional and technical personnel with a total budgeted headcount of 284 positions for fiscal year 2011.
A significant portion of day-to-day operations and planning relates to fiscal management. Staff prepares operating and capital budgets that are reviewed by various committees of the Board of Commissioners and legally adopted by the full Board of Commissioners. In the case of the Nashville International Airport, the annual capital and operating budgets are additionally reviewed and approved by the eight airlines that have committed to the residual lease agreement. This agreement expires September 30, 2017. Although budget programs are approved by the Board of Commissioners, individual expenditures, whether for capital or operating purposes, must comply with the Authority’s bylaws and policies and procedural requirements for competitive acquisition.
The Authority utilizes a cash management and investment policy intended to achieve maximum financial return while minimizing risk of loss on all available funds. The trust indenture and supplemental resolutions, which govern the investment of bond proceeds, generally authorize the Authority to invest in direct obligations of or obligations guaranteed by the U.S. Government,
5 Metropolitan Nashville Airport Authority | Comprehensive Annual Financial Report

obligations issued or guaranteed by specific agencies of the U.S. Government, secured certificates of deposit, secured repurchase agreements, and specifically rated obligations of state governments, commercial paper and money market funds. The carrying amount and market value of the investments at June 30, 2011 and 2010, were $8,760,764 and $29,340,490, respectively, as the Authority chose to maintain higher cash balances rather than investing during the year. For more detailed information relating to the Authority’s cash and investments, refer to Note 3, Cash and Cash Equivalents and Investments, to the Authority’s financial statements included in the financial section of this CAFR.
Another top priority of the Authority is to protect MNAA assets to the greatest degree economically feasible to comply with all statutory and revenue bond trust indenture requirements. The Authority’s exposure to loss has been minimized through the acquisition of a $500,000,000 general liability policy that requires self-retention of $5,000 per occurrence and a $25,000 aggregate deductible. Additionally, real and personal property is insured for $400,000,000 with various deductibles depending upon the loss category involved. The Authority’s tenant and contractor insurance requirements and indemnifications have been coordinated with the aforementioned policies to further reduce the risk of loss through actions beyond management’s control.
ECONOMIC CONDITIONS AND OUTLOOk OF ThE METROPOLITAN STATISTICAL AREA (MSA)
Nashville, one of America’s Friendliest City for 2010 according to Travel + Leisure magazine, experienced an economic environment more favorable than other regions of Tennessee and the United States during fiscal year 2011. Fiscal year 2011 saw unemployment rates decrease from its peak in 2010. In fiscal year 2011, the unemployment rate average was 8.45% for the Nashville – Davidson – Murfreesboro Metropolitan Statistical Area (“Nashville MSA”) compared with 9.50% for Tennessee, and 9.35% for the nation as a whole according to the U.S. Bureau of Labor Statistics. Additional information is provided in the statistical section of this report. The average unemployment rates for the Nashville MSA, State of Tennessee, and United States during fiscal years 2011, 2010, 2009 and 2008 were as follows:
Nashville MSA Tennessee United States
June 30, 2011 8.45% 9.50% 9.35%
June 30, 2010 9.41% 10.64% 9.77%
June 30, 2009 7.40% 8.37% 7.57%
June 30, 2008 4.45% 5.29% 4.95%
During fiscal year 2011, the Authority maintained an “A” rating and stable outlook with Standard & Poor’s Ratings Services for its airport revenue bonds. Moody’s Investors Service rated the airport revenue bonds “A2” with a stable outlook. This rating was based on the Authority’s low cost structure, strong competitive position and diversity of revenue sources.
MAJOR INITIATIvES AND DEvELOPMENTS
Nashville International Airport served over 9.4 million total passengers in FY 2011, operating an average of 380 daily flights to approximately 70 markets, of which 48 are nonstop markets. Nashville International is utilized by 11 airlines and boasts 61 air carrier gates and up to 78 commuter aircraft parking positions. The MNAA’s two airports contribute $3.74 billion in total economic activity, $1.18 billion in wages and more than 39,700 jobs annually to the regional economy. The focus at BNA in recent years has been major airfield and landside work and extensive terminal renovations. The Authority completed work in 2011 on $36 million of improvements in the second phase of terminal renovations. In January 2010, the Authority issued $66.3 million of special facility revenue bonds, with the sole source of revenue being customer facility charges (CFCs). These bonds are financing construction of a consolidated rental car facility (“CONRAC”), built adjacent to the existing short term lot. This project is on schedule for its grand opening on November 1, 2011.
The Authority successfully refunded $86 million in bonds early in the fiscal year, achieving more than $8.4 million, or 9.14%, in debt service cost savings. The refunding included $70 million in non-Alternative Minimum Tax (AMT) bonds and $16 million in Alternative Minimum Tax (AMT) bonds and included bond series 1995, 1998A, 1998C and 2001A.
The first phase of terminal renovations, focusing on concession improvements, saw BNA’s efforts recognized when Airport Revenue News, a leading concessions trade publication, announced that BNA earned awards in the medium airport division for the Best Concessions Management Team, Airport with the Best Customer Service, and Airport with the Most Unique Services in 2009. In 2010, BNA again received an award for Best Concessions Program.
Metropolitan Nashville Airport Authority | Comprehensive Annual Financial Report 6
LETTER OF TRANSMITTAL

Nashville experienced major flooding in May 2010, damaging many top tourist destinations. While most of these sites quickly reopened, enplanements were negatively impacted in early fiscal year 2011. Nevertheless, BNA ended the year strong with enplanements increasing 5.3% for fiscal year 2011.
Airline mergers continued in fiscal year 2011, with Southwest announcing its acquisition of AirTran and American Airlines announcing plans to spin off its subsidiary American Eagle. United completed its merger with Continental during the year, following previous years in which Delta acquired Northwest and Republic Airlines acquired Frontier and Midwest Airlines.
Outlook for Fiscal Year 2012
Airline alliances will continue to drive decisions by most airlines on route development. Both internationally and domestically, enplanements are improving from low levels experienced with the economic downturn in 2008. Recent trends indicate that enplanements are likely to increase. Airlines are especially susceptible to changes in fuel prices which could be impacted by changing economic conditions. However, several recent events have caused economic uncertainty and eroded consumer confidence. These events include Standard & Poor’s downgrade of the United States, continuing U.S. budget deficits and high unemployment rates, along with extreme volatility in the stock market. While the Authority cannot accurately predict the economic climate throughout fiscal year 2012, budget assumptions used were conservative and used estimates for both enplanements and landed weights below those actually experienced in fiscal year 2011. Early indications are that revenues in fiscal year 2012 will exceed budgeted performance. The Authority also has a longstanding practice of managing expenses to budgeted levels. Accordingly, the Authority expects to meet or exceed budgeted performance in fiscal year 2012.
7 Metropolitan Nashville Airport Authority | Comprehensive Annual Financial Report
LETTER OF TRANSMITTAL
Operating Revenues and Enplanements
$90,000,000
$85,000,000
$80,000,000
$75,000,000
$70,000,000
$65,000,000
$60,000,000
$55,000,000
$50,000,000
$45,000,000
8,000,000
7,000,000
6,000,000
5,000,000
4,000,000
3,000,000
2,000,000
1,000,000
0
2011 2010 2009 2008 2007 2006 2005 2004 2003 2002
Enplanements Operating Revenues

FINANCIAL INFORMATION
Financial Position and Results of Operations
Management’s Discussion and Analysis (“MD&A”), starting on page 16 summarizes the Authority’s Statement of Net Assets and Statement of Revenues, Expenses and Changes in Net Assets and reviews the changes from the beginning to the end of fiscal year 2011 as well as certain comparisons of the current year to the prior year. The actual financial statements and related footnotes are presented on pages 27 to 56. The information contained in the MD&A should be considered in conjunction with the information contained in this report.
Internal Control Structure Framework
The financial statements of the Authority are prepared following U.S. generally accepted accounting principles applicable to governmental unit enterprise funds. This results in financial statements prepared on the full accrual basis.
Internal control is a process affected by an entity’s governing board, management and other personnel and designed to provide reasonable assurance regarding the achievement of objectives in the following categories: (a) safeguarding of assets from loss from unauthorized use or disposition; (b) execution of transactions in accordance with management’s authorization; (c) reliability of financial records for preparing financial statements and maintaining accountability for assets; (d) effectiveness and efficiency of operations; and (e) compliance with applicable laws and regulations.
Internal controls, no matter how well designed and operated, can provide only reasonable assurance to management and the Board regarding achievement of an entity’s control objectives. The likelihood of achievement is affected by limitations inherent to internal control. Such limitations include:
1. Human judgment in decision-making can be faulty;
2. Breakdowns in internal controls can occur due to errors or mistakes;
3. Controls can be circumvented by the collusion of two or more people or management override of internal controls;
4. Costs of an entity’s internal controls should not exceed the benefits that are expected to be derived; and
5. Custom, culture and the corporate governance system inhibit irregularities by management, but they are not absolute deterrents.
All internal control evaluations occur within the above framework. We believe that the Authority’s internal controls adequately meet the objectives listed above and have devoted considerable time this past year to attract and retain individuals in our finance department who embrace the concept of a healthy internal control environment.
OThER INFORMATION
Independent Audit
The Authority’s independent auditor, Crosslin & Associates, P.C., has rendered an unqualified opinion that the Authority’s financial statements as of and for the years ended June 30, 2011 and 2010, present fairly, in all material respects, the Authority’s financial position, changes in net assets and cash flows. The Authority participates in the Federal single audit program, which consists of a single audit of federally funded programs administered by the Authority. Participation in the single audit program is mandatory as a condition for continued funding eligibility. The single audit performed by Crosslin & Associates, P.C., met the requirements set forth by the State of Tennessee and the Federal Single Audit Act of 1996 and related Office of Management and Budget Circular A-133. The independent auditors’ reports issued based upon work performed in accordance with those requirements noted no instances of material noncompliance by the Authority with any applicable state or Federal laws or regulations for the fiscal years ending June 30, 2011 and 2010.
Certificate of Achievement for Excellence in Financial Reporting
The Government Finance Officers Association of the United States and Canada (“GFOA”) awarded a Certificate of Achievement for Excellence in Financial Reporting to the Metropolitan Nashville Airport Authority for its Comprehensive Annual Financial Report for the fiscal year ended June 30, 2010. In order to be awarded a Certificate of Achievement, a government must publish an easily readable and efficiently organized comprehensive annual financial report. This report must satisfy both generally accepted accounting principles and applicable legal requirements.
Metropolitan Nashville Airport Authority | Comprehensive Annual Financial Report 8
LETTER OF TRANSMITTAL

9 Metropolitan Nashville Airport Authority | Comprehensive Annual Financial Report
A Certificate of Achievement is valid for a period of one year only. We believe that our current Comprehensive Annual Financial Report continues to meet the Certificate of Achievement Program’s requirements and are submitting it to GFOA to determine its eligibility for another certificate.
Acknowledgments
The preparation of this CAFR would not be possible without the desire of the Authority’s Board of Commissioners and senior management to maintain the Authority as a model of excellence with respect to management of Nashville International Airport, John C. Tune Airport and MNAA Properties Corporation in an effort to meet the air service needs of Middle Tennessee and the surrounding communities.
Respectfully submitted,
Stan Van Ostran
Vice President and CFO
LETTER OF TRANSMITTAL
Chair
James H. Cheek, IIIBass, Berry & Sims, P.L.C.
vice Chair
Juli H. Mosley, P.E.
Secretary
Dr. A. Dexter SamuelsTennessee State University
Commissioners
Jack O. Bovender, Jr.HCA Inc.
Karl F. DeanMayor, Metropolitan Government
of Nashville & Davidson County
Rod Essig Creative Artists Agency
Robert J. JoslinJoslin and Son Signs
Saul SolomonBridgestone Americas
Robert J. WalkerWalker, Tipps & Malone
Deborah WrightAmenacorp Business Services
BOARD OF COMMISSIONERS
Metropolitan Nashville Airport Authority | Comprehensive Annual Financial Report 10

METROPOLITAN NAShvILLE AIRPORT AUThORITY ORgANIzATION ChARTAS OF JUNE 30, 2011
Executive Staff (As of June 30, 2011)
Raul L. Regalado, C.A.E.President & Chief Executive Officer
Robert Wigington, I.A.P.Executive Vice President & Chief Operating Officer
Robert Watson, JDSenior Vice President & Chief Legal Officer
Stan van Ostran, CPA, CIA, CFE, JD, CMVice President & Chief Financial Officer
Amelia N. ArmstrongVice President & Chief People Officer
vanessa hickman, CM Vice President & Chief Information Officer
John howardAssistant Vice President, Properties and Business Development
Walt MatwijecAssistant Vice President, Continuous Improvement
Robert Ramsey, PE, CMAssistant Vice President-Planning and Design
Christine vitt, PE (NY), CMAssistant Vice President-Construction and Environmental
Emily RichardAssistant Director, Corporate CommunicationsGovernment Relations
Properties MPC – Mgr.
Board of Commissioners
President & CEOBoard Audit Committee
External Audit
Internal Audit
General Counsel
Vice President & CIO
Information Systems
Electronics
Vice President & CPO
Human Resources – Dir.
Admin. Services
Executive Vice President & COO
Senior Vice President & CLO
Vice President & CFO
Operations – Mgr.
Business Diversity Dev. Dir.
Construction – Asst. VPFinance – ControllerContinuous Improvement - AVP
G.Trans/Park–Ops Asst. Mgr.
John C. Tune – GA Mgr.
Comm. Affairs/Cust. Serv. – Dir. Purchasing & Inv. – Dir.
Properties & Bus. Dev. – AVP
Business Development – Dir.Dept. of Public Safety - Chief
Properties – Dir.
Facilities Maintenance – Dir.
Management Analysis
Flying Aces
Information Ctr.
Arts at Airport
Operations Commander
Asst. Treasurer
Properties – Mgr.
Construction Project Eng.
Corporate Comm. – Asst. Dir.
Const. Project Mgrs. (3)
Design – Project Mgr. (4)
Planning - Dir.
Environ. Comp.–Asst. Mgr.
Planning and Design – Asst. VP
Fac. Maint. – Mgr.
Bus. Diversity Dev. Asst. Mgr.Staff Attorney
Help Desk
Network Administration
11 Metropolitan Nashville Airport Authority | Comprehensive Annual Financial Report
CERTIFICATE OF AChIEvEMENT FOR ExCELLENCE IN FINANCIAL REPORTINg
Metropolitan Nashville Airport Authority | Comprehensive Annual Financial Report 12


This section contains the following subsections:
Independent Auditors’ Report
Management’s Discussion & Analysis
Financial Statements
Financial Section
Metropolitan Nashville Airport Authority | Comprehensive Annual Financial Report

15 Metropolitan Nashville Airport Authority | Comprehensive Annual Financial Report
InDEpEnDEnt AuDItORs’ REpORt
Board of CommissionersMetropolitan Nashville Airport AuthorityNashville, Tennessee
We have audited the accompanying statements of net assets of the Metropolitan Nashville Airport Authority (the “Authority”), a component unit of the Metropolitan Government of Nashville and Davidson County, Tennessee, as of June 30, 2011 and 2010, and the related statements of revenues, expenses and changes in net assets and cash flows for the years then ended. These financial statements are the responsibility of the Authority’s management. Our responsibility is to express an opinion on these financial statements based on our audits.
We conducted our audits in accordance with auditing standards generally accepted in the United States of America. Those standards require that we plan and perform the audit to obtain reasonable assurance about whether the financial statements are free of material misstatement. An audit includes examining, on a test basis, evidence supporting the amounts and disclosures in the financial statements. An audit also includes assessing the accounting principles used and significant estimates made by management as well as evaluating the overall financial statement presentation. We believe that our audits provide a reasonable basis for our opinion.
In our opinion, the financial statements referred to above present fairly, in all material respects, the financial position of the Metropolitan Nashville Airport Authority as of June 30, 2011 and 2010, and the changes in its financial position and its cash flows for the years then ended in conformity with accounting principles generally accepted in the United States of America.
Management’s Discussion and Analysis and the schedules of funding progress, as listed in the table of contents, are not required parts of the basic financial statements but are supplementary information required by accounting principles generally accepted in the United States of America. This required supplementary information is the responsibility of the Authority’s management. We have applied certain limited procedures, which consisted principally of inquiries of management regarding the methods of measurement and presentation of the required supplementary information. However, we did not audit the information and express no opinion on it.
Our audits were conducted for the purpose of forming an opinion on the Metropolitan Nashville Airport Authority’s basic financial statements. The introductory section and the statistical section, as listed in the table of contents, are presented for the purpose of additional analysis and are not a required part of the basic financial statements. This supplementary information is the responsibility of the Authority’s management. The introductory section and statistical section have not been subjected to the auditing procedures applied in our audits of the basic financial statements, and accordingly, we express no opinion on them.
The schedule of net assets information by entity, the schedule of revenues, expenses and changes in net assets information by entity, and the schedule of airport revenue bonds, principal and interest requirements by fiscal year, as listed in the table of contents, are presented for the purpose of additional analysis and are not a required part of the basic financial statements. This information is the responsibility of the Authority’s management. Such information has been subjected to the auditing procedures applied in our 2011 audit of the basic financial statements and, in our opinion, is fairly stated in all material respects in relation to the basic financial statements taken as a whole.
Crosslin & Associates, P.C. Nashville, TennesseeOctober 20, 2011
2525 West End Avenue, Suite 1100 • Nashville, Tennessee 37203 • phone: 615-320-5500 • fax: 615-329-9465 • www.crosslinpc.comAn Independent Member of The BDO Seidman Alliance

Metropolitan Nashville Airport Authority | Comprehensive Annual Financial Report 16
MEtROpOlItAn nAshvIllE AIRpORt AuthORIty MAnAgEMEnt’s DIsCussIOn AnD AnAlysIs
The following Management’s Discussion and Analysis (“MD&A”) of the Metropolitan Nashville Airport Authority (the “Authority” or “MNAA”) is presented to assist the reader in focusing on significant financial issues, by providing an overview of the Authority’s financial activity and in identifying changes in the Authority’s financial position. Management encourages the reader to consider the MD&A in conjunction with the information contained in the Authority’s financial statements.
BASIC FINANCIAL STATEMENTS
The Authority’s financial statements are prepared on the accrual basis of accounting in accordance with generally accepted accounting principles promulgated by the Governmental Accounting Standards Board. The Authority is structured as a single enterprise fund with revenues recognized when earned, not when received. Expenses are recognized when incurred, not when paid. Capital assets are capitalized and (except land and construction in progress) are depreciated over their useful lives. Please refer to Note 2 to the financial statements for a summary of the Authority’s significant accounting policies.
The Statement of Net Assets presents information on all of the Authority’s assets and liabilities, with the difference between the two reported as net assets. Over time, increases or decreases in net assets may serve as a useful indicator of the Authority’s financial position.
The Statement of Revenues, Expenses and Changes in Net Assets presents information showing the change in the Authority’s net assets during the fiscal year. All changes in net assets are reported when the underlying events occur, regardless of timing of related cash flows. Thus, revenues and expenses are recorded and reported in this statement for some items that will result in cash flows in future periods.
The Statement of Cash Flows relates to the inflows and outflows of cash and cash equivalents. Consequently, only transactions that affect the Authority’s cash accounts are recorded in this statement. A reconciliation is provided within the Statement of Cash Flows to assist in understanding the difference between cash flows from operating activities and operating income.
The notes to the financial statements provide additional information that is essential to a full understanding of the data provided in the basic financial statements.
AIRPORT ACTIvITY hIghLIghTS
Fiscal year 2011 began with the region drying out and recovering from flooding which occurred in May 2010 when Middle Tennessee experienced an historic 500-year flood. Record rainfall ranging from 14” to 18” occurred on May 1 and 2, 2010, which broke the Nashville one- and two-day rainfall records (and later contributed to the one-month rainfall record), and caused the Cumberland River, Harpeth River and other low-lying areas to overflow their banks and overwhelm residential communities and business districts with water. Many area tourist destinations were flooded, including the Grand Ole Opry, Gaylord Opryland Hotel and much of the surrounding area, as well as parts of downtown Nashville. While our airports suffered only minimal damage, enplanement levels were off in the early months of fiscal year 2011. However, most of these tourist destinations were back in operation within a few months and enplanements continued to rebound in 2011 ending the year up 5.3% compared to 2010.
The Metropolitan Nashville Airport Authority started few construction projects in 2011, instead focusing on completing projects already under way. Recent years had seen historic levels of capital activity with the Authority spending over $316 million for needed improvements since 2007. For fiscal year 2011, the Authority added $81.5 million in capital assets. Federal, state and local grants and contributions provided approximately $16.8 million of this funding during the year, with the remainder mostly coming from bond proceeds. Construction projects totaling $58.7 million were completed during 2011, and $113.1 million remains in construction in progress at June 30.
Recent projects at Nashville International Airport (BNA) include Runway 2L-20R, which was demolished, crushed and used as a base for the reconstructed runway. The runway, 7,702 feet long and 150 feet wide, was enhanced with 35-foot-wide asphalt shoulders, a requirement for larger, Group V aircraft. An additional connector taxiway complemented the project, and the runway was placed back into service early in the fiscal year. An in-line explosive detection system (EDS) project was also nearing completion at the end of the fiscal year. This project was funded with $20 million from the federal government and $12 million from other sources. The project also included removing the existing EDS and explosives trace detection (ETD) machines from the public spaces and freeing up space in the ticket lobby.
A new automated sort-controlled, outbound baggage handling system with two separate, in-line screening matrices was also completed in 2011. Nashville International Airport (BNA) continued to renovate the terminal building, completing most of the Phase II terminal renovation projects during the year. These renovations were financed with proceeds from bonds issued in 2009, with Passenger Facility Charges (PFCs) used to pay the debt service. Carpeting, wall coverings, restrooms, airline hold rooms, elevators, air handlers and other elements were replaced in this two-year project.

17 Metropolitan Nashville Airport Authority | Comprehensive Annual Financial Report
MAnAgEMEnt’s DIsCussIOn AnD AnAlysIs
The $70 million consolidated rental car (CONRAC) facility, commenced in February 2010, remains on schedule with a planned opening November 1, 2011. The three-level concrete structure can house 2,400 rental cars, a quick-turnaround facility with car wash bays and fueling stations, escalators, elevators, moving walkways, and various environmentally desirable features. The CONRAC project is being financed through $66.3 million in CONRAC Special Facility Bonds issued in fiscal year 2010. Debt service of the CONRAC bonds will be paid through Customer Facility Charges (CFCs).
New projects started in fiscal year 2011 included the $17.2 million reconstruction of Taxiway T4 & S, $1.5 million upgrade of the security camera system and $1.8 million of lighting improvements. The lighting improvements are expected to pay for themselves with utility savings within six years.
John C. Tune (JWN), BNA’s reliever airport on the west side of Nashville, expected a busy construction year, but was stalled when a small drainage channel was declared a wetlands area. The area is at the north end of the runway in the same location as a planned runway safety area project. This $6.8 million safety project is expected to proceed in 2012 as the Authority works with other agencies to develop more wetlands in the region to offset the wetlands recently discovered. The airport also replaced roofs on some existing hangars and is currently constructing several T-hangars. A taxiway and apron overlay project for $2.5 million and $1.8 million in runway and taxiway lighting are expected in 2013 and 2014, respectively.
The property development organization of the Authority, MNAA Properties Corporation (MPC), continued its efforts to refurbish one of its multi-use tenant properties, International Plaza. Projects on the building in 2011 included installation of four new elevators, as well as a lighting retrofit project expected to reduce energy costs. Another project identified and abated asbestos throughout the building. Projects planned for 2012 include new exterior panels to improve the building’s appearance and an asphalt overlay of the parking lot. Occupancy reached a high of 75% during the year, better than most area office buildings, with interest by prospects in the building continuing at a high level.
OPERATIONAL hIghLIghTS
Enplanements, a commonly cited airport statistic, were up 5.3% in 2011 at BNA with 4,724,974 enplanements compared to 4,487,336 in 2010. Certified gross landed weights, another key indicator, were at 6,038,280 pounds, up 2.8% in 2011. Nashville International Airport served over 9.4 million total passengers in FY 2011, operating an average of 380 daily flights to approximately 70 markets, of which 48 are nonstop. Nashville International is utilized by nine major airlines and has 61 air carrier gates and up to 78 commuter aircraft parking positions. The MNAA’s two airports contribute $3.74 billion in total economic activity, $1.18 billion in wages and more than 39,700 jobs annually to the regional economy. Fiscal year 2012 is starting well as enplanements are up 3.5% for the first three months compared to the same period a year ago.
Several of the most common indicators of activity during 2011, 2010 and 2009 appear below:
2011 2010 2009
Enplanements 4,724,974 4,487,336 4,460,962 % increase (decrease) 5.3% 0.6% (8.6%)
Aircraft landed weight (all – 000) 6,038,280 5,875,693 6,431,457 % increase (decrease) 2.8% (8.6%) (7.9%)
Aircraft operations (passenger) 85,139 83,023 87,972 % increase (decrease) 2.5% (5.6%) (9.3%)
Aircraft operations (all other) 89,459 91,145 90,759 % increase (decrease) (1.8%) 0.4% (15.1%)
Load factors 75.6% 73.6% 67.9% % increase (decrease) 2.7% 8.4% n/C
Load factors are the percentages of seats occupied on all passenger aircraft, both arriving and departing airplanes. The increase of 2.7% in occupied seats occurred despite airlines increasing available seats by 2.3% in 2011. The 8.4% increase in fiscal year 2010 was a result of fewer and smaller aircraft transporting passengers. BNA also saw a 2.5% increase in total airline aircraft operations during 2011. These increases signal that airlines are becoming more efficient in selecting the right mix of aircraft to meet their scheduling requirements.

Metropolitan Nashville Airport Authority | Comprehensive Annual Financial Report 18
Airline mergers continued to change the landscape in fiscal year 2011, with Southwest announcing plans to acquire AirTran and American Airlines announcing plans to spin off its subsidiary American Eagle. United completed its merger with Continental during the year, following the recently completed mergers of Delta acquiring Northwest and Republic Airlines acquiring Frontier and Midwest Airlines. The Authority has experienced no significant operational impact from previous mergers and expects no negative impact with the latest merger announcements.
In anticipation of the CONRAC project, the Board of Commissioners had previously approved the imposition of a customer facility charge (CFC) for rental car customers. The Authority began collecting a $4.00 CFC per day effective January 1, 2008, and increased the CFC rate to $4.50 effective January 1, 2010. This nonoperating revenue source is to pay for costs, fees and expenses associated with the planning, design, construction, financing, maintenance and operation of the CONRAC facility as well as other costs, fees and expenses that may be paid from CFC proceeds. Since imposition of the CFC fee, the Authority has collected over $28.9 million, with more than $9 million collected in fiscal year 2011. Transaction days also improved in 2011, averaging 168,050 per month, compared to 156,210 and 159,351 in fiscal years 2010 and 2009, respectively.
SUMMARY OF OPERATIONS AND ChANgES IN NET ASSETS
The Authority’s Statements of Revenues, Expenses and Changes in Net Assets for the three most recent fiscal years provide considerable insight about the financial impact of activities during the respective years. The following represents a summary of changes in net assets over the past three fiscal years with “%Change” representing the change from 2010 to 2011 and 2009 to 2010:
2011 2010 %Change 2009 %Change
Operating revenues $89,441,577 $81,684,429 9.5% $79,255,840 3.1%
Operating expenses 62,294,769 57,475,479 8.4% 53,076,173 8.3%
Operating income before depreciation 27,146,808 24,208,950 12.1% 26,179,667 (7.5%)
Depreciation 29,679,570 25,882,986 14.7% 25,151,547 2.9%
Operating (loss) income (2,532,762) (1,674,036) (51.3%) 1,028,120 >(100.0%)
Nonoperating revenues 24,592,244 24,245,319 1.4% 20,771,966 16.7%
Nonoperating expenses 10,579,134 22,614,006 (53.2%) 14,554,050 55.4%
Income (loss) before capital contributions 11,480,348 (42,723) >100.0% 7,246,036 >(100.0%)
Capital contributions 16,861,226 46,422,786 (63.7%) 24,316,658 90.9%
Increase in net assets 28,341,574 46,380,063 (38.9%) 31,562,694 46.9%
Net assets, beginning of year 360,599,153 314,219,090 14.8% 282,656,396 11.2%
net assets, end of year $388,940,727 $360,599,153 7.9% $314,219,090 14.8%
OPERATINg AND NONOPERATINg REvENUE hIghLIghTS
Operating revenue for the year was up 9.5% over the prior year, with signatory airline revenue up 23.3% and parking revenues up 11.1%. Operating revenue for 2011 was up 12.9% from 2009, with signatory airline revenue up 48.7% and parking revenue up 5.6%. Signatory airline revenue will likely be down in 2012 as rates were reduced based on forecasts for other operating revenues in 2012. The residual signatory airline agreement requires signatory airlines to provide additional funding if fees and charges and all other net airport revenues are insufficient to cover the Authority’s eligible obligations, but reduces fees and charges as other revenues increase. Recent and projected increases in enplanements are mostly driving forecasts of increased revenues, requiring the Authority to reduce signatory airline fees and charges under the agreement. However, during the recent recession signatory airlines made up budget revenue shortfalls of $1,914,700 and $7,265,000 in 2010 and 2009, respectively, under the agreement.
Nonoperating revenue was mostly unchanged in 2011, with a slight 1.4% increase. Nevertheless, investment income was down 56.2% from the prior year due to historically low interest rates. Investment income was $342,616 in 2011, compared to $781,719 in 2010 and $1,642,936 in 2009. PFC revenue was also down 14.2% as the collection rate dropped to $3.00 from $4.50 in 2011. The PFC collection rate was $4.50 for most of 2010 and $3.00 for all of 2009. Currently, the Authority is collecting for PFC-funded projects that are not eligible for collection at the $4.50 level. The Authority intends to qualify future PFC applications to remain at the $4.50 collection authority. PFC dollars are restricted for capital projects approved by the FAA and spent accordingly. Customer Facility Charges (CFC), which will fund debt service for the new consolidated rental car (CONRAC) facility, were up 14.7% in 2011. CFC revenues were $9,074,716 in 2011, compared to $7,911,785 in 2010 and $7,648,876 in 2009. Other nonoperating revenue was the most improved category with $1,874,664 in revenues in 2011
MAnAgEMEnt’s DIsCussIOn AnD AnAlysIs

19 Metropolitan Nashville Airport Authority | Comprehensive Annual Financial Report
MAnAgEMEnt’s DIsCussIOn AnD AnAlysIs
compared to $57,143 in 2010. This gain was due to a refunding in September 2010 (see Note 5 to Financial Statements, Synthetic Advance Refunding, Series 2001A).
In addition to BNA, other MNAA entities also reported stable operating revenues in 2011. At JWN, the 2011 operating revenue was $711,345, which compares to $701,045 in 2010 and $693,713 in 2009. MPC reported total operating revenue of $1,981,541 in 2011, compared to $2,128,766 in 2010. However, included in 2010 operating revenue was a payment made by Metro Water Services for $156,713 as a reimbursement for overbilling for water service at International Plaza, one of the two properties MPC owns. Nonoperating revenue was incidental in 2011 and 2010 for both entities, as investment income was down considerably from 2009 due to historically low interest rates.
The following summarizes all the Authority revenues for the fiscal years ended June 30, 2011, 2010 and 2009 with “%Change” representing the change from 2010 to 2011 and 2009 to 2010:
2011 2010 %Change 2009 %Change
Operating revenues
Signatory airline $ 25,305,820 $20,522,901 23.3% $17,017,714 20.6%
Parking 29,743,911 26,768,620 11.1% 28,174,733 (5.0%)
Concession 16,609,629 16,511,983 0.6% 16,558,935 (0.3%)
Space rental 9,804,161 9,938,642 (1.4%) 10,077,305 (1.4%)
Other 7,978,056 7,942,283 0.5% 7,427,153 6.9%
total operating revenues 89,441,577 81,684,429 9.5% 79,255,840 3.1%
nonoperating revenues
Investment income 342,616 781,719 (56.2%) 1,642,936 (52.4%)
Passenger facility charges 13,300,248 15,494,672 (14.2%) 11,480,154 35.0%
Customer facility charges 9,074,716 7,911,785 14.7% 7,648,876 3.4%
Other nonoperating revenues 1,874,664 57,143 >100% - >100%
total nonoperating revenues 24,592,244 24,245,319 1.4% 20,771,966 16.7%
Capital contributions 16,861,226 46,422,786 (63.7%) 24,316,658 90.9%
total revenues and capital contributions $130,895,047 $152,352,534 (14.1%) $124,344,464 22.5%
The five revenue sources that comprise signatory airline fees and charges include: ramp fees (RF), main terminal (MT), north (NC) and south concourse (SC) fees, as well as landing fees (LF). These budgeted rates for 2011 were $101.26 (RF), $93.16 (MT), $41.29 (NC), $41.12 (SC) and $2.05 (LF). In comparison, budgeted fees and charges for 2012 are $84.78 (RF), $78.84 (MT), $36.13 (NC), $37.51 (SC) and $0.32 (LF). This further compares to the final true-up fees and charges for 2010 of $114.62 (RF), $89.12 (MT), $42.31 (NC), $41.33 (SC) and $1.26 (LF). Signatory landing fees for 2011 exceeded $10.4 million, up from $7.0 million in 2010, and were the greatest revenue increase. Non-signatory rates, also referred to as compensatory rates, for 2011 remained at published rates throughout the year at $301.87 (RF), $238.37 (MT), $90.13 (NC), $92.73 (SC) and $5.02 (LF). While the budgeted signatory fees and charges for 2012 dropped significantly, non-signatory airlines will only see landing fees reduced. These fees drop to $3.92 in 2012, compared to $5.02 in 2011. However, other non-signatory fees will increase slightly in 2012. Under the signatory agreement rate model, landing fees are disproportionately affected compared to other cost centers causing landing fees to move more dramatically with any change in eligible revenue or expense.

The following chart demonstrates the 10-year trend for MNAA’s operating revenues from 2002 through 2011:
The Authority offers a frequent parker program that enables customers to earn free parking points when using the public parking areas at BNA. Various marketing efforts promoting the program continued in 2011, and interest increased dramatically with a promotion of the short-term garage during the temporary closure of the Long Term A lot for repaving. The loss in revenue from the temporary closure of the Long Term A lot during 2011 and the permanent loss of parking spots due to CONRAC have been offset by parking rate increases and general enplanement activity.
Capital contributions were down 63.7% in 2011 as the airport slowed its capital spending. Capital contributions in 2011 were only $16,861,226 compared to $46,422,786 in 2010 and $24,316,658 in 2009.
OPERATINg AND NONOPERATINg ExPENSES hIghLIghTS
The Authority’s expenses continued to increase in 2011 for two of the three organizations. The following represents a summary of Authority expenses for the fiscal years ended June 30, 2011, 2010 and 2009 with “%Change” representing the change from 2010 to 2011 and 2009 to 2010:
2011 2010 %Change 2009 %Change
Operating expensesSalaries and wages $ 28,570,046 $28,057,407 1.8% $26,339,723 6.5%Contractual services 21,851,020 18,680,783 17.0% 16,358,604 14.2%Materials and supplies 2,875,601 2,363,467 21.7% 1,704,622 38.7%Utilities 6,317,661 5,909,708 6.9% 6,231,268 (5.2%)Other 2,680,441 2,464,114 8.8% 2,441,956 0.9% total operating expenses before provision for depreciation 62,294,769 57,475,479 8.4% 53,076,173 8.3%
Provision for depreciation 29,679,570 25,882,986 14.7% 25,151,547 2.9%
nonoperating expenses
Interest expense 11,717,420 15,081,502 (22.3%) 13,823,696 9.1%(Gain) loss on disposal of property and equipment (426,224) 7,292,588 >(100%) (744,112) >(100%)(Gain) loss on derivative financial instruments (712,062) 239,916 >(100%) 1,474,466 (83.7%)total nonoperating expenses 10,579,134 22,614,006 (53.2%) 14,554,050 55.4%
total expenses $102,553,473 $105,972,471 (3.2%) $92,781,770 14.2%
Metropolitan Nashville Airport Authority | Comprehensive Annual Financial Report 20
MAnAgEMEnt’s DIsCussIOn AnD AnAlysIs
Other
Space Rental
Concession
Parking
Signatory Airline
2011 2010 2009 2008 2007 2006 2005 2004 2003 2002
$100,000
$80,000
$60,000
$40,000
$20,000
$0
Operating Revenues (000s)

MAnAgEMEnt’s DIsCussIOn AnD AnAlysIs
21 Metropolitan Nashville Airport Authority | Comprehensive Annual Financial Report
Expenses were up in all categories for 2011, but were mostly anticipated increases that had been budgeted. Salaries and wages increased only 1.8% in 2011. In past years the increase had been more remarkable and was driven by pension and other postemployment benefit (OPEB) expenses. Contractual services and materials and supplies saw the largest increases in 2011 and were attributable to several factors, including additional costs for pavement maintenance (which were offset by grant revenues), a contract to maintain the new baggage systems and increased transportation costs for parking customers. The CONRAC construction continued to disrupt shuttle bus routes and increase transportation costs.
Unusual winter weather in both 2011 and 2010 caused increased costs for snow and ice removal, which also increased materials and supplies. Snow and ice removal costs were $308,226 in 2011, compared to $303,450 in 2010 and only $29,442 in 2009. Winter weather also contributed to increased costs in other ways. In 2009, a compliance inspection by the State of Tennessee first identified contamination due to stormwater run-off of deicing fluid at BNA. While BNA made efforts to mitigate the deicing issue and study how to prevent a recurrence, additional run-off contamination was noted again in 2011. More information about this item may be found in Note 14 to the financial statements. BNA continues to make further efforts to mitigate the issue, including a $1.8 million capital project and continuing efforts to treat or remove contaminated stormwater run-off.
Utilities increased 6.9% during the year and are projected to increase in future years as new demand metering charges are implemented. Depreciation also increased by 14.7% in 2011, reflecting the aggressive capital program undertaken in recent years, including the terminal renovations and several airfield projects.
The following chart demonstrates the 10-year trend for MNAA’s operating expenses from 2002 through 2011:
2011 2010 2009 2008 2007 2006 2005 2004 2003 2002
$70,000
$60,000
$50,000
$40,000
$30,000
$20,000
$10,000
$0
Operating Expenses (before Depreciation) (000s)
Other
Utilities
Supplies and Materials
Contractual Services
Salaries and Wages
The most notable item of nonoperating expenses was the charge for the loss on disposal of property and equipment in early 2010. The Authority reviewed historical records of the original terminal structure and airfield assets, identifying components that had been retired or replaced. This analysis accounted for most of the $7,292,588 loss on disposals in 2010 at BNA, including parking improvements not depreciated that are within the footprint of the new CONRAC facility. The $7,292,588 loss in 2010 compares with a $426,224 gain in 2011, mostly from the sale of certain residential properties. The Authority also recognized a gain of $712,062 relating to the change in fair value of interest rate swap derivative instruments.
At JWN, operating expenses decreased from $512,889 in 2010 to $434,279 in 2011. The higher expenses in 2010 are mostly attributable to one-time landscaping costs incurred for the new entrance at JWN. Depreciation at JWN increased from $1.05 million in 2010 to $1.11 million in 2011, which reflects several airfield projects completed in recent years. Expenses at MPC increased from $1.3 million in 2010 to $1.6 million in 2011.

Metropolitan Nashville Airport Authority | Comprehensive Annual Financial Report 22
MAnAgEMEnt’s DIsCussIOn AnD AnAlysIs
Parking33.3%
Other8.9%
Signatory Airline28.3%
space Rental11.0%
Concession18.5%
Fy 2011 Operating Revenues Composition
The composition of all MNAA operating revenues and operating expenses are presented here for 2011:
FINANCIAL POSITION SUMMARY
The Statements of Net Assets depict the Authority’s financial position as of June 30 and include all assets and liabilities of the Authority.
Following is a condensed summary of the Authority’s financial position at June 30, 2011, 2010 and 2009. The “%Change” reflects changes from 2010 to 2011 and 2009 to 2010 as follows:
2011 2010 %Change 2009 %Change
Assets
Current assets $133,537,431 $186,743,588 (28.5%) $138,007,855 35.3%
Capital assets, net 546,399,466 494,568,675 10.5% 442,763,034 11.7%
Other noncurrent assets 17,335,662 18,810,358 (7.8%) 19,761,969 (4.8%)
total assets $697,272,559 $700,122,621 (0.4%) $600,532,858 16.6%
Liabilities
Current liabilities $ 49,725,042 $ 52,033,831 (4.4%) $ 44,077,363 18.1%
Noncurrent liabilities 258,606,790 287,489,637 (10.0%) 242,236,405 18.7%
total liabilities 308,331,832 339,523,468 (9.2%) 286,313,768 18.6%
Net assets
Invested in capital assets, net of related debt 309,766,045 284,697,793 8.8% 235,035,655 21.1%
Restricted 73,638,747 66,224,548 11.2% 68,634,046 (3.5%)
Unrestricted 5,535,935 9,676,812 (42.8%) 10,549,389 (8.3%)
total net assets 388,940,727 360,599,153 7.9% 314,219,090 14.8%
Total liabilities and net assets $697,272,559 $700,122,621 (0.4%) $600,532,858 16.6%
Fy 2011 Operating Expenses before provision for Depreciation
Utilities10.1%
Other4.3%
ContractualServices
35.1% Salaries and Wages
45.9%
suppliesand Materials
4.6%

Current assets declined back to normal levels in 2011, while the increase in 2010 was due to proceeds from the CONRAC Series 2010 bonds. The $51,830,791 increase in capital assets was due to various construction projects, including CONRAC, offset by current year depreciation.
Liabilities decreased in 2011, partially due to a refunding last September and other overall reductions in debt obligations. This refunding is discussed under the title “Debt Administration” which follows. Current liabilities decreased from $52,033,831 in 2010 to $49,725,042 in 2011. The current portion of maturities for airport revenue bonds increased slightly from to $27,440,000 in 2010 to $27,815,000. At JWN, liabilities decreased to $121,141 in 2011, compared to $333,230 in 2010 and $98,835 in 2009. JWN had a large trade accounts payable of $310,473 in 2010, which accounts for most of this reduction. Similarly, MPC reduced its liabilities to $602,850 in 2011 from $852,696 in 2010 and $79,080 in 2009. It too had a large trade accounts payable of $404,696 at the end of 2010.
The other postemployment benefits (OPEB) obligation grew by $4.1 million in 2011. The Authority’s Board approved a funding plan to address the unfunded pension and OPEB obligations on May 18, 2011. As the funding schedule shows below, the plan provides $19 million for the retirement plan and $14 million for OPEB of total funding before 2017, the end of the signatory agreement, and works with the Authority’s goal to manage these liabilities. At that time, debt service requirements will be substantially reduced and funding shortfalls, if any, can be easily addressed.
Fiscal Year Retirement Plan OPEB Plan Funding Funding 2010 $ - $ 500,000 2011 1,000,000 500,000 2012 1,500,000 500,000 2013 1,500,000 1,000,000 2014 5,000,000 1,000,000 2015 5,000,000 1,000,000 2016 5,000,000 1,000,000 2017 - 8,500,000 tOtAl $19,000,000 $14,000,000
The portion of the Authority’s net assets shown below, $73,638,747, represents 18.9% of total net assets. This compares with $66,224,548 (18.4% of total net assets) in restricted net assets at June 30, 2010, and $68,634,046 (21.8% of total net assets) at June 30, 2009. These resources are subject to restrictions on use and are not available for spending as they have already been committed as follows:
Passenger facility charge projects and related debt service $ 20,471,601Customer facility charge projects and related debt service 23,105,902Debt service and other 30,061,244
Total restricted net assets $ 73,638,747
The unrestricted net assets of $5,535,935 may be used to meet the Authority’s ongoing obligations.
MAnAgEMEnt’s DIsCussIOn AnD AnAlysIs
23 Metropolitan Nashville Airport Authority | Comprehensive Annual Financial Report

MAnAgEMEnt’s DIsCussIOn AnD AnAlysIs
Metropolitan Nashville Airport Authority | Comprehensive Annual Financial Report 24
CASh MANAgEMENT POLICIES AND CASh FLOW ACTIvITIES
All cash receipts are deposited daily into interest-bearing accounts. All investments are in compliance with the laws of the State of Tennessee and the Investment Policy adopted by the Authority’s Board of Commissioners. The proceeds from issuance of the CONRAC Series 2010 bonds, to cover construction costs of the consolidated rental car facility, account for the increase of cash and cash equivalents at June 30, 2010. Use of such proceeds during 2011 caused the decrease at June 30, 2011.
2011 2010 2009
Cash flows provided by (used in):
Operating $33,157,649 $37,492,750 $25,662,188
Non-capital financing (992,425) (1,349,653) (1,341,987)
Capital and related financing (81,724,573) 13,063,742 (7,168,857)
Investing 20,901,031 (13,972,349) 26,981,622
Net (decrease) increase in cash and
cash equivalents $(28,658,318) $35,234,490 $44,132,966
Cash and cash equivalents:
Beginning of year 147,207,919 111,973,429 67,840,463
End of year $118,549,601 $147,207,919 $111,973,429
CAPITAL ACTIvITIES
Capital assets, net of accumulated depreciation, increased from $494,568,675 to $546,399,466 at year-end. This $51,830,791 or 10.5% increase was due to the project activities occurring both landside and on the airfield. One of the largest projects in the Authority’s history, the consolidated rental car (CONRAC) facility, is on schedule to open November 1, 2011. Phase II of the terminal renovation project was completed in 2011 as well, along with several other projects previously mentioned. The Authority continued to secure federal and state support for eligible projects whenever possible. Additional funding is provided through PFCs, CFCs, airline rates and charges, and the issuance of debt. Capital asset acquisitions are capitalized at cost and depreciated using the straight-line method. Note 4 to the financial statements provides additional information about the additions, retirements and transfers during the years ended June 30, 2011 and 2010.
DEBT ADMINISTRATION
The Authority issued Airport Improvement Revenue Bond Series 2010B in the amount of $70,400,000 and Revenue Bond Series 2010C in the amount of $16,170,000 in August 2010. The Series 2010B and 2010C bonds were issued to refund certain of the outstanding Airport Improvement Revenue Bonds, pay the premiums of municipal bond insurance policies and debt service reserve surety policies for the 2010 bonds, and pay certain costs of their issuance. The refunding did not extend the maturity dates of the bonds and reduced the total principal and interest due during the remaining term of the bonds, fiscal years 2012 to 2017, by $11,345,710. For more information on the Authority’s outstanding bonds, see Note 5 of the Notes to Financial Statements and “Schedule of Airport Revenue Bonds, Principal and Interest Requirements by Fiscal Year” on p. 63 and 64. The Refunded Bonds consisted of the following:
series of Maturities (July 1) Refunded Redemption Redemption Refunded Bonds Years Inclusive Amounts Date Price
1995 2011-2015 ...............$33,305,000 September 20, 2010 100% 1998A 2011-2014 ...................3,015,000 September 20, 2010 100% 1998C 2011, 2013-2016 ............14,115,000 September 20, 2010 100% 2001A 2011-2015 .................42,490,000 September 20, 2010 103%
$92,925,000

The first principal amount for the Series 2010B of $9,900,000 is due on July 1, 2011. The first principal amount for the Series 2010C of $2,805,000 is due on July 1, 2011. The Series 2010B bonds mature on July 1, 2015, and the Series 2010C mature on July 1, 2016.
As of June 30, 2011, the Authority’s balance of outstanding long-term revenue bonds was $256,980,000 compared with $290,775,000 at the end of the prior year. The current portion of revenue bonds is $27,815,000 and is due on July 1, 2011.
The only bond issued under the PFC resolution will mature July 1, 2012, with $7,750,000 principal owed on or before that date. The Series 2010A bonds are being paid for with draws from PFC collections as a result of eligible projects undertaken in the 1990s that were paid for years ago. These dollars are being reimbursed back to the Authority as needed to cover both principal and interest payments until maturity. Under PFC Application 14, approved during fiscal year 2009, debt service on the Series 2009A will also be paid with PFC collections. However, this bond series was actually issued under the MNAA master resolution as a general airport revenue bond rather than as a special revenue bond (under the PFC resolution), resulting in lower financing costs.
series Beginning (Refundings) principal Ending
Description Balance new Bonds Repayment Balance
Series 1995 Revenue Bonds $ 38,265,000 $ (33,305,000) $ (4,960,000) $ -
Series 1998A Revenue Bonds 4,330,000 (3,015,000) (1,315,000) -
Series 1998C Revenue Bonds 16,190,000 (14,115,000) (2,075,000) -
Series 2001A Revenue Bonds 49,475,000 (42,490,000) (6,985,000) -
Series 2003 PFC Revenue Bonds 11,485,000 - (3,735,000) 7,750,000
Series 2003B Revenue Bonds 17,260,000 - - 17,260,000
Series 2008A Revenue Bonds 25,700,000 - (6,400,000) 19,300,000
Series 2009A Revenue Bonds 36,000,000 - (715,000) 35,285,000
Series 2010 CONRAC Revenue Bonds 66,300,000 - - 66,300,000
Series 2010A Revenue Bonds 25,770,000 - (1,255,000) 24,515,000
Series 2010B Revenue Bonds - 70,400,000 - 70,400,000
Series 2010C Revenue Bonds - 16,170,000 - 16,170,000
total $290,775,000 $(6,355,000) $(27,440,000) $256,980,000
More detailed information about the Authority’s debt can be found in Note 5 to the financial statements.
REQUEST FOR INFORMATION
This financial report is designed to provide detail information on the Authority’s operations to the Authority’s Board of Commissioners, management, investors, creditors, customers and all others with an interest in the Authority’s financial affairs and to demonstrate the Authority’s accountability for the assets it controls and the funds it receives and expends. Questions concerning any of the information provided in this report or any request for additional information should be made in writing to MNAA, One Terminal Drive, Suite 501, Nashville, Tennessee, 37214-4114, by sending an email to [email protected] or by calling (615) 275-1600.
Respectfully submitted,
Stan Van Ostran Vice President and CFO Nashville, Tennessee
MAnAgEMEnt’s DIsCussIOn AnD AnAlysIs
25 Metropolitan Nashville Airport Authority | Comprehensive Annual Financial Report

Metropolitan Nashville Airport Authority | Comprehensive Annual Financial Report 26
This page intentionally left blank.

STATEMENTS OF NET ASSETS JUNE 30, 2011 AND 2010
ASSETS
2011 2010
CURRENT ASSETS:
Unrestricted assets:
Cash and cash equivalents $ 34,397,372 $ 33,373,144
Short-term investments - 3,097,500
Accounts receivable (net of allowance for doubtful
accounts of $47,948 and $86,345, respectively) 2,801,699 5,077,268
Inventories 594,835 520,654
Accrued interest receivable - 44,430
Prepaid expenses and other 833,092 776,355
Total current unrestricted assets 38,626,998 42,889,351
Restricted assets:
Cash and cash equivalents 84,152,229 113,834,775
Short-term investments 5,159,000 22,385,500
Passenger facility charges receivable 1,172,837 2,485,987
Customer facility charges receivable 883,490 854,532
Amounts due from governmental agencies 3,542,877 4,204,568
Accrued interest receivable - 88,875
Total current restricted assets 94,910,433 143,854,237
Total current assets 133,537,431 186,743,588
NONCURRENT ASSETS:
Capital assets:
Land and land improvements 518,623,318 505,594,005
Land held for future expansion 36,701,068 36,701,068
Buildings and building improvements 183,122,322 161,692,621
Equipment, furniture and fixtures 57,665,911 51,082,588
Construction in progress 113,187,969 90,428,596
Total capital assets 909,300,588 845,498,878
Less accumulated depreciation (362,901,122) (350,930,203)
Total capital assets, net 546,399,466 494,568,675
Restricted investments 3,601,764 3,600,000
Unrestricted investments - 257,490
Deferred bond issue costs 4,764,673 4,618,483
Other assets 8,969,225 10,334,385
Total noncurrent assets 563,735,128 513,379,033
TOTAL ASSETS $ 697,272,559 $ 700,122,621
27 Metropolitan Nashville Airport Authority | Comprehensive Annual Financial Report
Metropolitan Nashville Airport Authority | Comprehensive Annual Financial Report 28
STATEMENTS OF NET ASSETS JUNE 30, 2011 AND 2010
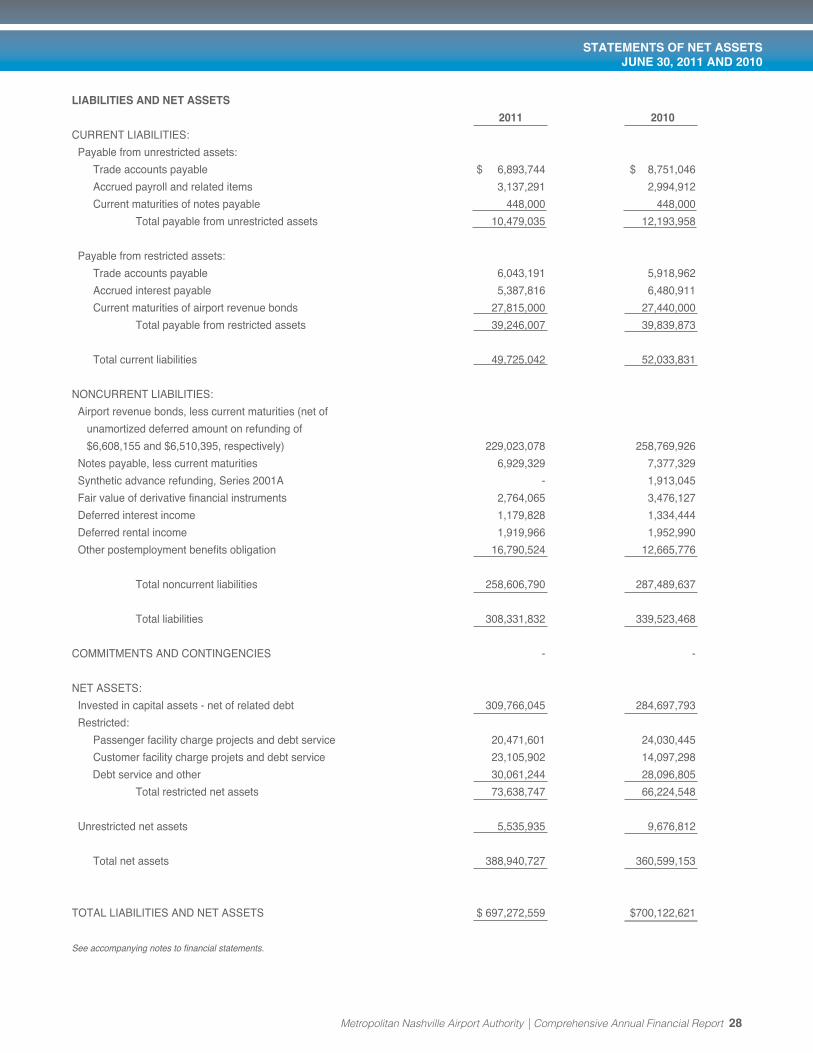
LIABILITIES AND NET ASSETS
2011 2010
CURRENT LIABILITIES:
Payable from unrestricted assets:
Trade accounts payable $ 6,893,744 $ 8,751,046
Accrued payroll and related items 3,137,291 2,994,912
Current maturities of notes payable 448,000 448,000
Total payable from unrestricted assets 10,479,035 12,193,958
Payable from restricted assets:
Trade accounts payable 6,043,191 5,918,962
Accrued interest payable 5,387,816 6,480,911
Current maturities of airport revenue bonds 27,815,000 27,440,000
Total payable from restricted assets 39,246,007 39,839,873
Total current liabilities 49,725,042 52,033,831
NONCURRENT LIABILITIES:
Airport revenue bonds, less current maturities (net of
unamortized deferred amount on refunding of
$6,608,155 and $6,510,395, respectively) 229,023,078 258,769,926
Notes payable, less current maturities 6,929,329 7,377,329
Synthetic advance refunding, Series 2001A - 1,913,045
Fair value of derivative financial instruments 2,764,065 3,476,127
Deferred interest income 1,179,828 1,334,444
Deferred rental income 1,919,966 1,952,990
Other postemployment benefits obligation 16,790,524 12,665,776
Total noncurrent liabilities 258,606,790 287,489,637
Total liabilities 308,331,832 339,523,468
COMMITMENTS AND CONTINGENCIES - -
NET ASSETS:
Invested in capital assets - net of related debt 309,766,045 284,697,793
Restricted:
Passenger facility charge projects and debt service 20,471,601 24,030,445
Customer facility charge projets and debt service 23,105,902 14,097,298
Debt service and other 30,061,244 28,096,805
Total restricted net assets 73,638,747 66,224,548
Unrestricted net assets 5,535,935 9,676,812
Total net assets 388,940,727 360,599,153
TOTAL LIABILITIES AND NET ASSETS $ 697,272,559 $700,122,621
See accompanying notes to financial statements.

29 Metropolitan Nashville Airport Authority | Comprehensive Annual Financial Report
This page intentionally left blank.

2011 2010
OPERATING REVENUES:
Signatory airline $ 25,305,820 $ 20,522,901
Parking 29,743,911 26,768,620
Concession 16,609,629 16,511,983
Space rental 9,804,161 9,938,642
Other 7,978,056 7,942,283
89,441,577 81,684,429
OPERATING EXPENSES:
Salaries and wages 28,570,046 28,057,407
Contractual services 21,851,020 18,680,783
Materials and supplies 2,875,601 2,363,467
Utilities 6,317,661 5,909,708
Other 2,680,441 2,464,114
62,294,769 57,475,479
OPERATING INCOME BEFORE PROVISION
FOR DEPRECIATION 27,146,808 24,208,950
PROVISION FOR DEPRECIATION 29,679,570 25,882,986
OPERATING LOSS ( 2,532,762) ( 1,674,036)
NONOPERATING REVENUES (EXPENSES):
Investment income 342,616 781,719
Passenger facility charges 13,300,248 15,494,672
Customer facility charges 9,074,716 7,911,785
Interest expense ( 11,717,420) ( 15,081,502)
Gain (loss) on disposal of property and equipment 426,224 ( 7,292,588)
Gain (loss) on derivative financial instruments 712,062 ( 239,916)
Other nonoperating, net 1,874,664 57,143
14,013,110 1,631,313
INCOME (LOSS) BEFORE CAPITAL CONTRIBUTIONS 11,480,348 ( 42,723)
CAPITAL CONTRIBUTIONS 16,861,226 46,422,786
INCREASE IN NET ASSETS 28,341,574 46,380,063
TOTAL NET ASSETS - BEGINNING OF YEAR 360,599,153 314,219,090
TOTAL NET ASSETS - END OF YEAR $ 388,940,727 $ 360,599,153
See accompanying notes to financial statements.
Metropolitan Nashville Airport Authority | Comprehensive Annual Financial Report 30
STATEMENTS OF REvENUES, ExPENSES AND ChANgES IN NET ASSETS FOR ThE YEARS ENDED JUNE 30, 2011 AND 2010

31 Metropolitan Nashville Airport Authority | Comprehensive Annual Financial Report
STATEMENTS OF CASh FLOWS FOR ThE YEARS ENDED JUNE 30, 2011 AND 2010
2011 2010
CASH FLOWS FROM OPERATING ACTIVITIES:
Cash received from customers $ 91,685,202 $ 82,509,710
Cash paid to employees ( 24,302,919) ( 22,082,869)
Cash paid to suppliers ( 31,544,193) ( 20,469,977)
Other payments ( 2,680,441) ( 2,464,114)
Net cash provided by operating activities 33,157,649 37,492,750
CASH FLOWS FROM NONCAPITAL FINANCING ACTIVITIES:
Payments on long-term debt - ( 350,000)
Interest paid on long-term debt ( 992,425) ( 999,653)
Net cash used in noncapital financing activities ( 992,425) ( 1,349,653)
CASH FLOWS FROM CAPITAL AND RELATED
FINANCING ACTIVITIES:
Receipt of passenger facility charges 14,613,398 14,504,476
Receipt of customer facility charges 9,045,758 7,742,765
Purchases of property and equipment ( 81,521,662) ( 85,142,302)
Interest paid on long-term debt ( 10,771,991) ( 10,652,380)
Proceeds from issuance of long-term debt - 68,166,706
Net cash (used in) provided by debt refundings ( 1,873,780) 720,000
Payment of bond issue costs ( 1,348,329) ( 2,578,928)
Payments on long-term debt ( 27,888,000) ( 26,268,000)
Swap termination payment - ( 1,348,500)
Contributions from governmental agencies 17,522,917 47,701,675
Other nonoperating 497,116 218,230
Net cash (used in) provided by capital and
related financing activities ( 81,724,573) 13,063,742
CASH FLOWS FROM INVESTING ACTIVITIES:
Purchase of investments ( 35,473,412) ( 39,598,191)
Proceeds from the sale and maturities of investments 56,054,902 25,314,334
Interest received on investments 319,541 311,508
Net cash provided by (used in) investing activities 20,901,031 ( 13,972,349)
NET (DECREASE) INCREASE IN CASH AND CASH EQUIVALENTS ( 28,658,318) 35,234,490
CASH AND CASH EQUIVALENTS
Beginning of year 147,207,919 111,973,429
End of year $ 118,549,601 $ 147,207,919
See accompanying notes to financial statements. (Continued)

2011 2010
RECONCILIATION OF OPERATING LOSS
TO NET CASH PROVIDED BY OPERATING ACTIVITIES:
Operating loss $( 2,532,762) $( 1,674,036)
Adjustments to reconcile operating loss to net
cash provided by operating activities:
Provision for depreciation 29,679,570 25,882,986
Amortization of deferred real estate leasing commission 1,080 1,080
Amortization of deferred rental income ( 34,904) ( 34,904)
Changes in operating assets and liabilities:
Decrease in accounts receivable 2,275,569 850,058
Increase in inventories ( 74,181) ( 95,514)
(Increase) decrease in prepaid expenses ( 56,737) 116,439
Decrease in other assets 1,364,080 2,697,263
(Decrease) increase in trade accounts payable ( 1,733,073) 3,765,793
Increase in accrued payroll and related items 142,379 881,675
Increase in deferred rental income 1,880 9,047
Increase in other postemployment benefit obligation 4,124,748 5,092,863
Net cash provided by operating activities $ 33,157,649 $ 37,492,750
CASH AND CASH EQUIVALENTS - END OF YEAR
CONSIST OF:
Unrestricted cash and cash equivalents $ 34,397,372 $ 33,373,144
Restricted cash and cash equivalents 84,152,229 113,834,775
$118,549,601 $147,207,919
NONCASH INVESTING AND FINANCING ACTIVITIES:
During 2011 and 2010, $1,144,071 and $2,055,192, respectively,
were recorded to interest expense for amortization of deferred
bond issue costs, deferred loss on refunding of debt and
bond premium.
During 2011 and 2010, interest expense was reduced by $97,972
and $664,723, respectively, for the amortization of the synthetic
advance refunding.
During 2011 and 2010, $154,616 and $351,853, respectively,
were included in interest income related to the amortization
of deferred interest income.
During 2011 and 2010, gains (losses) of $712,062 and $(239,916),
respectively, were recognized for the change in fair value of
derivative financial instruments.
During 2011, bond issue costs of $644,268 were reclassified to
deferred loss on refunding relating to the 2010B & C bonds.
See accompanying notes to financial statements.
Metropolitan Nashville Airport Authority | Comprehensive Annual Financial Report 32
STATEMENTS OF CASh FLOWS FOR ThE YEARS ENDED JUNE 30, 2011 AND 2010

33 Metropolitan Nashville Airport Authority | Comprehensive Annual Financial Report
1. METROPOLITAN NAShvILLE AIRPORT AUThORITY
The creation of Metropolitan Nashville Airport Authority (the “Authority”) was authorized by Public Chapter 174 of the Public Acts of the 86th General Assembly of the State of Tennessee, 1969 Session. The Metropolitan Council of The Metropolitan Government of Nashville and Davidson County, Tennessee (“Metropolitan Government”) created the Authority to operate as a separate enterprise. The Authority owns and operates Nashville International Airport and John C. Tune Airport, a general aviation reliever airport. Based upon the criteria set forth by the Governmental Accounting Standards Board (“GASB”), it has been determined that the Authority is a component unit of the Metropolitan Government.
The Authority’s Board of Commissioners consists of 10 members who serve without compensation, nine of whom are appointed by the Metropolitan Government Mayor and approved by the Metropolitan Government Council, with the tenth being the Mayor (or his designee). There are provisions whereby commissioners may be removed by vote of the Metropolitan Government Council. All appointments to the Authority are for a term of four years. The terms are staggered to provide for continuity of Airport development and management. The Board of Commissioners appoints a president and charges him with the responsibility for day-to-day operations.
During April 2007, the Board of Commissioners of the Authority approved an interlocal cooperation agreement with the Industrial Development Board of the Metropolitan Government. As a result of this action, MNAA Properties Corporation (“MPC”), a Tennessee nonprofit corporation, was formed for the purpose of supporting and facilitating the operations of the Authority and to help the economic development of the surrounding area. The Commissioners of the Authority constitute the Board of Directors of MPC. For financial reporting purposes, MPC is a blended component unit of the Authority. A capital contribution of $9 million was transferred from the Authority to MPC in August 2007. During fiscal year 2008, MPC Holdings, LLC, a limited liability company in which MPC is the sole member, purchased two separate multi-tenant buildings and commenced operation. Both facilities are on Nashville International Airport property. It is currently expected that no other property or assets of the Authority will be pledged or committed to support MPC or any subsidiaries of MPC.
During November 2009, the Board of Commissioners approved the formation of a Tennessee nonprofit limited liability company, MPC CONRAC, LLC. This entity was created in connection with the special facilities financing for the Authority’s consolidated rental car facility. MPC CONRAC, LLC, is a single member LLC, wholly owned by MPC. The formation of MPC CONRAC, LLC, created an appropriate entity to execute various agreements and secure services as necessary in order to meet the needs that may arise when the consolidated rental car (“CONRAC”) facility is completed in November 2011.
The accompanying financial statements also include the accounts of the Arts at the Airport Foundation, a nonprofit organization that facilitates the display and performance of artists within the Nashville International Airport terminal. The Arts at the Airport Foundation qualifies as a component unit of the Authority due to its being fiscally dependent on the Authority and due to the Authority’s appointment of the voting majority of its governing board.
2. SUMMARY OF SIgNIFICANT ACCOUNTINg POLICIES
Measurement Focus, Basis of Accounting and Basis of PresentationThe financial statements of the Authority are presented using the economic resources measurement focus and the accrual basis of accounting in accordance with accounting principles generally accepted in the United States of America. Under the accrual basis of accounting, revenues are recorded when earned and expenses are recorded when incurred. The financial statements include the operations of the Nashville International Airport, John C. Tune Airport and MPC, including MPC CONRAC, LLC, as noted above.
The Authority applies all relevant Governmental Accounting Standards Board (“GASB”) pronouncements. The Authority has elected to apply all Financial Accounting Standards Board (“FASB”) Statements and Interpretations issued after November 30, 1989, except for those that conflict with or contradict GASB pronouncements.
Use of Estimates in the Preparation of Financial StatementsThe preparation of financial statements in conformity with accounting principles generally accepted in the United States of America requires management to make assumptions that affect the reported amounts of assets and liabilities, disclosure of contingent assets and liabilities at the date of the financial statements, and the reported amounts of revenues and expenses during the reporting period. Significant estimates include the useful lives of capital assets, the fair value of derivative financial instruments, the allowance for doubtful accounts, pension valuation, other postemployment benefits obligation and certain self-insured liabilities. Actual results could differ from those estimates.
NOTES TO FINANCIAL STATEMENTS AS OF AND FOR ThE YEARS ENDED JUNE 30, 2011 AND 2010
Metropolitan Nashville Airport Authority | Comprehensive Annual Financial Report 34
NOTES TO FINANCIAL STATEMENTS AS OF AND FOR ThE YEARS ENDED JUNE 30, 2011 AND 2010
BudgetsThe Authority is required to prepare an annual operating budget and capital improvement budget to obtain the support of the Airline Affairs Committee, which is composed of the eight signatory airlines, and the approval of the Board of Commissioners. A five-year capital improvement program, including modifications and reasons therefore, is also required to be submitted each year. In addition, an annual operating budget and capital improvement budget are submitted to the Board of Commissioners for approval for John C. Tune Airport and to the Board of Directors for MPC.
The Authority is not required to demonstrate statutory compliance with its annual operating budget. Accordingly, budgetary data is not included in the basic financial statements. All budgets are prepared in accordance with bond covenants and airport lease and use agreements. Unexpended operating appropriations lapse at year-end.
Operating and Nonoperating Revenues and ExpensesThe Authority distinguishes operating revenues and operating expenses from nonoperating items. Operating revenues and expenses generally result from providing services in connection with the principal ongoing operations. Revenues from space rental and fees, landing fees, parking, and other miscellaneous income are reported as operating revenues. Transactions that are capital, financing or investing related, are reported as nonoperating revenues. Such nonoperating revenues include passenger facility charges (“PFCs”) as described in Note 9 and customer facility charges (“CFCs”) as described in Note 10. Expenses from employee wages and benefits, purchases of services, materials and supplies, and other miscellaneous expenses are reported as operating expenses. Interest expense and financing costs are reported as nonoperating expenses.
The Authority’s operating revenues are presented in five components as follows:
Signatory Airline - Signatory airline revenue consists of the revenues earned from eight signatory airlines primarily for terminal space rentals and landing fees. Terminal rents and landing fees charged to the signatory airlines are based on a residual agreement which takes into account all eligible revenues, expenses and debt service of the Authority. The residual agreement is designed to minimize the landing fees and terminal rents of the signatory airlines while assuring the payment of all net operating costs and debt service relating to the Authority (See Note 12). However, in recent years, eligible revenues covered less expenses and debt service thereby increasing the residual amount the signatory airlines have been required to pay in the form of terminal rents and landing fees. Parking - Parking revenue is generated primarily from the operation of Authority-owned parking facilities at Nashville International Airport. This amount is presented net of ‘frequent parker’ and other incentive programs.
Concession - Concession revenue is generated through concessionaires and tenants who pay monthly fees for using airport facilities to offer their goods and services to the public. Payments to the Authority are based on negotiated agreements with concessionaires to remit amounts usually based either on a minimum guarantee or on a percentage of gross receipts.
Space Rental - Space rental revenue includes nonsignatory airline terminal space rental, car rental companies’ space rental and certain other income received from leases of Authority-owned property.
Other - Other revenue consists primarily of nonsignatory airline landing fees, cargo airline landing fees and the Authority’s portion of fixed based operators’ fuel sales.
Cash and Cash EquivalentsCash and cash equivalents include cash on hand and short-term investments with original maturities of three months or less.
InvestmentsInvestments consist primarily of securities of U.S. Agencies. Investments are accounted for in accordance with GASB Statement No. 31, Accounting and Financial Reporting for Certain Investments and for External Investment Pools, which requires that certain investments be recorded at fair value (e.g., quoted market prices). Short-term, highly liquid debt instruments that have a remaining maturity at time of purchase of one year or less are reported at amortized cost, provided that the fair value of those investments is not significantly affected by the impairment of the credit standing of the issuer or by other factors.
Amounts Due from Governmental Agencies The Authority has grants for aid in construction from the Federal Airport Improvement Program (“AIP”), the American Recovery and Reinvestment Act of 2009 (“ARRA”) and the U.S. Department of Homeland Security (“DHS”). The ARRA project was completed during fiscal year 2010, and accordingly, this grant has been closed. Amounts due from governmental agencies under the terms of grant agreements are accrued as the related reimbursable costs are incurred.
InventoriesInventories are stated at the lower of cost or market under the first-in, first-out method and consist primarily of supplies and maintenance repair parts.
35 Metropolitan Nashville Airport Authority | Comprehensive Annual Financial Report
NOTES TO FINANCIAL STATEMENTS AS OF AND FOR ThE YEARS ENDED JUNE 30, 2011 AND 2010
Restricted AssetsRestricted assets consist of cash and cash equivalents, investments and other resources which are restricted legally or by enabling legislation. The Authority’s restricted assets are to be used for purposes specified in the respective bond indentures, other authoritative or legal documents as is the case with the collection of CFCs for building a consolidated rental car facility, or for purposes specified by the PFC program, as administered by the Federal Aviation Administration.
When restricted and unrestricted resources are available for use, it is the Authority’s policy to use restricted resources first, then use unrestricted resources as needed.
Capital AssetsCapital assets are stated at cost, except for contributions of property received from governmental agencies, which are recorded at fair value at the time of contribution. The Authority’s policy is to capitalize assets with a cost of $25,000 or more at Nashville International Airport and $10,000 at John C. Tune Airport and MPC. Routine maintenance and repairs are expensed as incurred. Net interest cost incurred during the construction of facilities is capitalized as part of project costs if funding is not from grants or restricted resources. Provision for depreciation of property and equipment is made on a basis considered adequate to depreciate the cost of depreciable assets over their estimated useful lives and is computed on the straight-line method.
Asset lives used in the calculation of depreciation are generally as follows:
Land improvements 10 to 30 years Buildings and building improvements 10 to 30 years Equipment, furniture and fixtures 3 to 15 years
Derivative Financial InstrumentsThe Authority’s derivative financial instruments consist of interest rate swap agreements, and are accounted for at fair value in accordance with GASB Statement No. 53, Accounting and Financial Reporting for Derivative Instruments.
Deferred Bond Issue CostsDeferred bond issue costs incurred in connection with issuance of the airport revenue bonds are being amortized to interest expense using the effective interest method, or the straight-line method when not materially different, over the term of the respective bonds. Issue costs associated with refunded bonds are reclassified from unamortized issue costs assets to deferred loss on refunding at the time of refunding and amortized over the term of the new bonds or old bonds, whichever is shorter.
Postemployment BenefitsPostemployment benefits are accounted for under GASB Statement No. 27, Accounting for Pensions by State and Local Governmental Employers, which establishes standards for the measurement, recognition and display of pension expense and related liabilities, assets, note disclosures and, if applicable, required supplementary information.
Postemployment health care benefits other than pension benefits are accounted for under GASB Statement No. 45, Accounting and Financial Reporting by Employers for Postemployment Benefits Other than Pensions, which establishes standards for the measurement, recognition and display of postemployment health care benefits expense and related liabilities, assets, note disclosures and, if applicable, required supplementary information.
Compensated AbsencesCompensated absences are accrued as payable when earned by employees and are cumulative from one fiscal year to the next. The compensated absences liability is reported with accrued payroll and related items in the financial statements.
Self-insuranceThe Authority is self-insured, up to certain limits, for employee group health insurance claims. The Authority has purchased reinsurance in order to limit its exposure. The cost of claims reported and an estimate of claims incurred but not reported are charged to operating expenses. Liabilities for unpaid claims are accrued based on management’s estimate using historical experience and current trends. The appropriateness of the self-insurance accrued liabilities are continually reviewed and updated by management.
Deferred Loss on Bond RefundingsIn accordance with GASB Statement No. 23, Accounting and Financial Reporting for Refunding of Debt Reported by Proprietary Activities, the refunding difference between the net carrying amount of the original debt and the reacquisition price is reported as a deduction from long-term debt. The deferred loss on refunding is amortized over the term of the new bonds or old bonds, whichever is shorter, using the effective interest method or the straight-line method, when not materially different.

Metropolitan Nashville Airport Authority | Comprehensive Annual Financial Report 36
NOTES TO FINANCIAL STATEMENTS AS OF AND FOR ThE YEARS ENDED JUNE 30, 2011 AND 2010
Deferred RevenueDeferred revenue consists of deferred interest income and deferred rental income. Deferred interest income relates to the Authority’s debt forward delivery agreements entered into in connection with certain bond financing transactions. The deferred interest income is being amortized to nonoperating income using the effective interest method over the term of the related agreements. Deferred rental income represents lease rentals, received in advance, for certain ground leases entered into with developers. The deferred rental income is being recognized in nonoperating income on a straight-line basis over the terms of the related leases.
Components of Net AssetsThe Authority’s net asset classifications are defined as follows:
Invested in capital assets, net of related debt - This component of net assets consists of capital assets, net of accumulated depreciation and reduced by the outstanding balances of any bonds, mortgages, notes, capital lease obligations or other borrowings that are attributable to the acquisition, construction or improvement of those assets. If there are significant unspent related debt proceeds at year-end, the portion of the debt attributable to the unspent proceeds is not included in the calculation of invested in capital assets, net of related debt. Rather, that portion of the debt is included in the same net assets component as the unspent proceeds.
Restricted net assets - This component of net assets represents restrictions imposed by creditors, grantors, contributors, or laws or regulations of other governments and restrictions imposed by law or through constitutional provisions or enabling legislation.
Unrestricted net assets - This component of net assets consists of net assets that do not meet the definition of “restricted” or “invested in capital assets, net of related debt.”
TaxesThe Authority is exempt from payment of federal and state income, property, and certain other taxes.
Fair Value MeasurementsAssets and liabilities recorded at fair value in the statements of net assets are categorized based on the level of judgment associated with the inputs used to measure their fair value. Level inputs, as defined by Financial Accounting Standards Board Accounting Standards Codification (“ASC”) 820, Fair Value Measurements and Disclosures, are as follows:
Level 1 - Values are unadjusted quoted prices for identical assets in active markets accessible at the measurement date.
Level 2 - Inputs include quoted prices for similar assets in active markets, quoted prices from those willing to trade in markets that are not active, or other inputs that are observable or can be corroborated by market data for the term of the instrument. Such inputs include market interest rates and volatilities, spreads, and yield curves.
Level 3 - Certain inputs are unobservable (supported by little or no market activity) and significant to the fair value measurement. Unobservable inputs reflect the Authority’s best estimate of what hypothetical market participants would use to determine a transaction price for the asset or liability at the reporting date.
ReclassificationsCertain reclassifications have been made to the fiscal year 2010 amounts in the financial statements to conform to the presentation adopted for fiscal year 2011.
Recent Accounting PronouncementsThe GASB has recently issued the following pronouncements applicable to the Authority:
Statement No. 61 - The Financial Reporting Entity: Omnibus—an amendment of GASB Statements No. 14 and No. 34
The objective of this Statement is to improve financial reporting for a governmental financial reporting entity to better meet user needs and to address reporting entity issues. This Statement modifies certain requirements for inclusion of component units in the financial reporting entity.
The objectives of the amendments to the criteria for including component units are to allow users of financial statements to better assess the accountability of elected officials by ensuring that the financial reporting entity includes only organizations for which the elected officials are financially accountable or that are determined by the government to be misleading to exclude.
The amendments to the criteria for blending intend to improve the focus of a financial reporting entity on the primary government by ensuring that the primary government includes only those component units that are so intertwined with the primary

37 Metropolitan Nashville Airport Authority | Comprehensive Annual Financial Report
NOTES TO FINANCIAL STATEMENTS AS OF AND FOR ThE YEARS ENDED JUNE 30, 2011 AND 2010
government that they are essentially the same as the primary government, and by clarifying which component units have that characteristic. For primary governments that are business-type activities reporting in a single column, the guidance for reporting blended component units allows users to better distinguish between the primary government and its component units by requiring condensed combining information to be included in the notes to the financial statements.
The provisions of this Statement are effective for financial statements for periods beginning after June 15, 2012.
Statement No. 62 - Codification of Accounting and Financial Reporting Guidance Contained in Pre-November 30, 1989, FASB and AICPA Pronouncements
The objective of this Statement is to incorporate into the GASB’s authoritative literature certain accounting and financial reporting guidance that is included in the following pronouncements issued on or before November 30, 1989, which does not conflict with or contradict GASB pronouncements:
1. Financial Accounting Standards Board (FASB) Statements and Interpretations 2. Accounting Principles Board Opinions 3. Accounting Research Bulletins of the American Institute of Certified Public Accountants’ (AICPA) Committee on Accounting Procedure.
This Statement eliminates the election provided for enterprise funds and business-type activities to apply post-November 30, 1989, FASB Statements and Interpretations that do not conflict with or contradict GASB pronouncements. However, those entities can continue to apply, as other accounting literature, post-November 30, 1989, FASB pronouncements that do not conflict with or contradict GASB pronouncements, including this Statement.
The requirements of this Statement are effective for financial statements for periods beginning after December 15, 2011. The provisions of this Statement generally are required to be applied retroactively for all periods presented.
Statement No. 63 - Financial Reporting of Deferred Outflows of Resources, Deferred Inflows of Resources and Net Position
This Statement provides financial reporting guidance for deferred outflows of resources and deferred inflows of resources. The requirements of this Statement will improve financial reporting by standardizing the presentation of deferred outflows of resources and deferred inflows of resources and their effects on a government’s net position. It alleviates uncertainty about reporting those financial statement elements by providing guidance where none previously existed.
The provisions of this Statement are effective for financial statements for periods beginning after December 15, 2011.
Statement No. 64 - Derivative Instruments: Application of Hedge Accounting Termination Provisions—an amendment of GASB Statement No. 53
The objective of this Statement is to clarify whether an effective hedging relationship continues after the replacement of a swap counterparty or a swap counterparty’s credit support provider. This Statement sets forth criteria that establish when the effective hedging relationship continues and hedge accounting should continue to be applied.
The requirements of this Statement enhance comparability and improve financial reporting by clarifying the circumstances in which hedge accounting should continue when a swap counterparty, or a swap counterparty’s credit support provider, is replaced. The provisions of this Statement are effective for financial statements for periods beginning after June 15, 2011.
Management is currently analyzing the impact of the recently issued GASB Statements on the Authority’s financial statements and related disclosures.
3. CASh AND CASh EQUIvALENTS AND INvESTMENTS
The Authority’s deposit and investment policy is governed by the laws of the State of Tennessee and bond trust indentures and supplemental resolutions, which govern the investment of bond proceeds. Permissible investments generally include direct obligations of, or obligations guaranteed by, the U.S. Government, obligations issued or guaranteed by specific agencies of the U.S. Government, secured certificates of deposit, secured repurchase agreements, and specifically rated obligations of state governments, commercial paper and money market funds.

Metropolitan Nashville Airport Authority | Comprehensive Annual Financial Report 38
NOTES TO FINANCIAL STATEMENTS AS OF AND FOR ThE YEARS ENDED JUNE 30, 2011 AND 2010
Cash and Cash EquivalentsThe Authority’s unrestricted and restricted cash and cash equivalent bank balances totaling $120,891,981 and $151,197,446 at June 30, 2011 and 2010, respectively (with a carrying value of $118,549,601 and $147,207,919) represent a variety of time deposits and cash equivalents.
Cash deposits are maintained at two financial institutions and are carried at cost plus interest, which approximates fair value. Cash deposits are required by State statute to be secured and collateralized by such institutions. The collateral must meet certain requirements and must have a total minimum market value of 105% of the value of the deposits placed in the institutions less the amount protected by federal depository insurance.
The Authority’s financial institutions are members of the State of Tennessee’s Bank Collateral Pool that collateralizes public fund accounts including those of the Authority. Financial institutions participating in the Collateral Pool determine the aggregate balance of their public fund accounts and the required collateral for the Authority. The amount of collateral required to secure these public deposits must be equal to 105% of the average daily balance of public deposits held. Collateral securities required to be pledged by the participating banks to protect their public fund accounts are pledged to the State Treasurer on behalf of the bank collateral pool. The securities pledged to protect these accounts are pledged in the aggregate rather than against each individual account. The members of the pool may be required by agreement to pay an assessment to cover any deficiency. Under this additional assessment agreement, public funds accounts covered by the pool are considered to be insured for purposes of credit risk disclosure in accordance with GASB Statement No. 40, Deposit and Investment Risk Disclosures.
Cash equivalents are held at another financial institution, and consist of money market and other short-term investments with original maturities of three months or less. Cash equivalents are collateralized at 105%, as required by State statute.
InvestmentsAs of June 30, 2011 and 2010, the Authority had the following investments and maturities:
Investment Maturities (in Years)
Credit Fair Less
Investment type Rating value than 1 1–5 6–10
June 30, 2011
U.S. agencies AAA/aaa $ 8,760,764 $ 5,159,000 $ 3,601,764 $ -
June 30, 2010
U.S. agencies AAA/aaa $ 24,535,500 $ 20,935,500 $ - $ 3,600,000
Asset-backed securities AAA/aaa 126,909 - 126,909 -
Mortgage-backed securities AAA/aaa 130,581 - 130,581 -
Certificate of deposit A1/P1 4,547,500 4,547,500 - -
$ 29,340,490 $ 25,483,000 $ 257,490 $ 3,600,000
The credit ratings above are reported as of June 30, 2011 and 2010, respectively. During August 2011, S&P downgraded the credit rating for U.S. Agency investments from AAA to AA+.
The carrying amount of investments is reflected in the accompanying statements of net assets at June 30, 2011 and 2010, as follows:
2011 2010
Short-term unrestricted investments $ - $ 3,097,500
Short-term restricted investments 5,159,000 22,385,500
Noncurrent unrestricted investments - 257,490
Noncurrent restricted investments 3,601,764 3,600,000
$ 8,760,764 $ 29,340,490

39 Metropolitan Nashville Airport Authority | Comprehensive Annual Financial Report
NOTES TO FINANCIAL STATEMENTS AS OF AND FOR ThE YEARS ENDED JUNE 30, 2011 AND 2010
Interest Rate Risk - The investment policy states that the portfolio may be allocated among U.S. Treasury Obligations (0 - 100%), U.S. Agency Instruments (0 - 100%), Repurchase Agreements (0 - 20%), Commercial Paper (0 - 25%), Money Market Mutual Funds (0 - 25%), Corporate Debt (0 -15%), Asset Backed Securities (0 - 25%), CMOs/Mortgage Backed Securities (0 - 25%) and Cash Equivalents (0 - 100%). In addition, the maximum maturity of investments is 270 days (commercial paper), 180 days (repurchase agreements), 365 days (certificates of deposit, time deposits and bankers acceptances), five years (all other corporate debt) and ten years (all other investments). To control the volatility of the portfolio and limit exposure to interest rate risk, the Authority’s Chief Financial Officer determines a duration target for the portfolio, which typically does not exceed three years. Credit Risk - The investment policy specifies acceptable credit ratings by instrument type but overall long-term credit ratings range from “A2” to “AAA” by Moody’s and “A” to “AAA” by Standard & Poor’s. Acceptable short-term credit rating levels are “A1“ or better by Standard & Poor’s and “P1” or better by Moody’s.
Custodial Credit Risk - All investment securities purchased by the Authority or held as collateral on either deposits or investments are held in third-party safekeeping at a financial institution, acting solely as agent of the Authority and qualified to act in this capacity. As a means to limit custodial credit risk, all trades of marketable securities are executed on the basis of delivery versus payment and avoid the physical delivery of securities (bearer form) to ensure that securities are deposited with a custodian prior to the release of Authority funds. The Authority’s unrestricted and restricted investments at June 30, 2011 and 2010, are all insured by securities held by the Authority’s agent in the Authority’s name.
Concentration of Credit Risk - The investment policy requires that no more than 10% of the Authority’s portfolio may be invested in the securities of any single issuer with a maturity of less than 365 days and not more than 5% of the Authority’s portfolio may be invested in the securities of any single issuer with a maturity greater than one year except that 100% of the Authority’s portfolio may be invested in U.S. Treasury Obligations and U.S. Agency Instruments. Forward Delivery AgreementsIn November 1999, the Authority entered into a Debt Service Forward Delivery Agreement (“1999 DSFDA”) with a financial institution for the continuous investment of certain bond principal and interest investments through the term of the respective bonds. The present value of future investment earnings under the 1999 DSFDA was received by the Authority in an upfront, lump sum payment of $3,275,000. The amount of the upfront payment was recorded as deferred interest income and is being amortized into income over the term of the agreement. Certain bond refundings have occurred since the Authority entered into the 1999 DSFDA. The principal and interest investments of the new bonds have replaced the investments of the former bond series. As of June 30, 2011, the bonds subject to the 1999 DSFDA include Series 2008A, Series 2010B and Series 2010C.
The remaining unearned amount relating to the forward delivery agreement was $1,179,828 and $1,334,444 at June 30, 2011 and 2010, respectively. Such amounts are reported as deferred interest income in the accompanying statements of net assets.
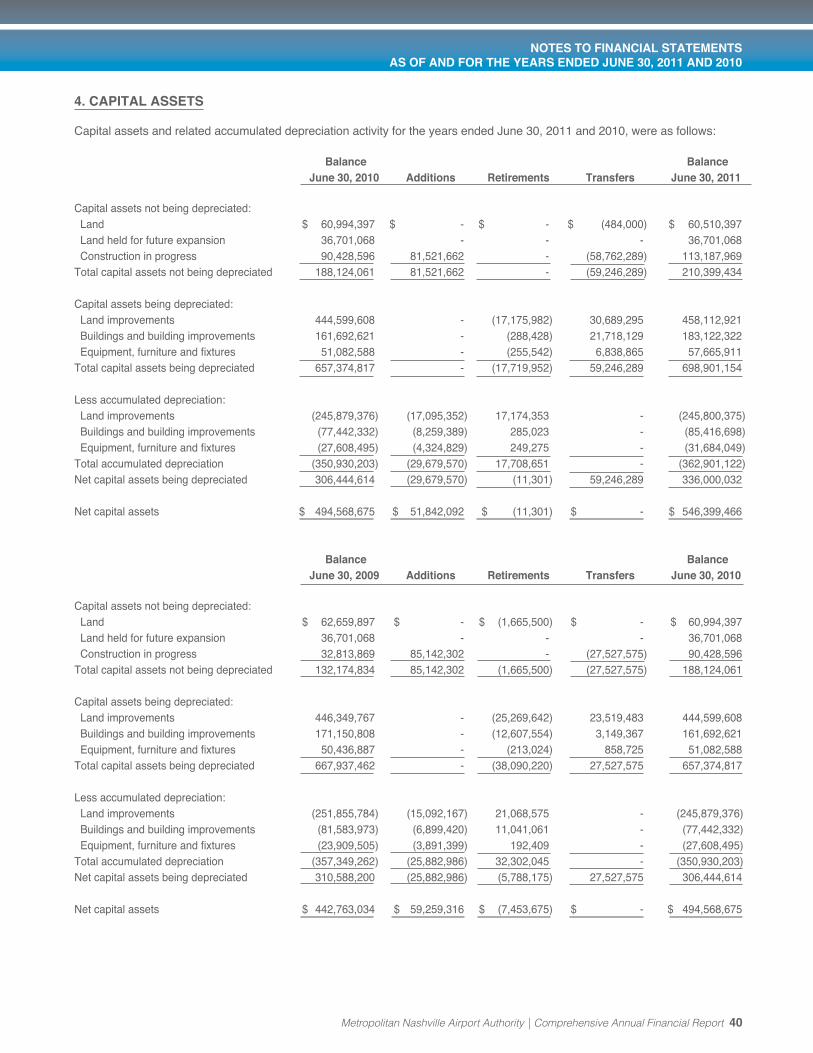
Metropolitan Nashville Airport Authority | Comprehensive Annual Financial Report 40
NOTES TO FINANCIAL STATEMENTS AS OF AND FOR ThE YEARS ENDED JUNE 30, 2011 AND 2010
4. CAPITAL ASSETS
Capital assets and related accumulated depreciation activity for the years ended June 30, 2011 and 2010, were as follows:
Balance Balance June 30, 2010 Additions Retirements Transfers June 30, 2011
Capital assets not being depreciated: Land $ 60,994,397 $ - $ - $ (484,000) $ 60,510,397 Land held for future expansion 36,701,068 - - - 36,701,068 Construction in progress 90,428,596 81,521,662 - (58,762,289) 113,187,969Total capital assets not being depreciated 188,124,061 81,521,662 - (59,246,289) 210,399,434 Capital assets being depreciated: Land improvements 444,599,608 - (17,175,982) 30,689,295 458,112,921 Buildings and building improvements 161,692,621 - (288,428) 21,718,129 183,122,322 Equipment, furniture and fixtures 51,082,588 - (255,542) 6,838,865 57,665,911 Total capital assets being depreciated 657,374,817 - (17,719,952) 59,246,289 698,901,154 Less accumulated depreciation: Land improvements (245,879,376) (17,095,352) 17,174,353 - (245,800,375) Buildings and building improvements (77,442,332) (8,259,389) 285,023 - (85,416,698) Equipment, furniture and fixtures (27,608,495) (4,324,829) 249,275 - (31,684,049)Total accumulated depreciation (350,930,203) (29,679,570) 17,708,651 - (362,901,122)Net capital assets being depreciated 306,444,614 (29,679,570) (11,301) 59,246,289 336,000,032 Net capital assets $ 494,568,675 $ 51,842,092 $ (11,301) $ - $ 546,399,466
Balance Balance June 30, 2009 Additions Retirements Transfers June 30, 2010
Capital assets not being depreciated: Land $ 62,659,897 $ - $ (1,665,500) $ - $ 60,994,397 Land held for future expansion 36,701,068 - - - 36,701,068 Construction in progress 32,813,869 85,142,302 - (27,527,575) 90,428,596 Total capital assets not being depreciated 132,174,834 85,142,302 (1,665,500) (27,527,575) 188,124,061 Capital assets being depreciated: Land improvements 446,349,767 - (25,269,642) 23,519,483 444,599,608 Buildings and building improvements 171,150,808 - (12,607,554) 3,149,367 161,692,621 Equipment, furniture and fixtures 50,436,887 - (213,024) 858,725 51,082,588 Total capital assets being depreciated 667,937,462 - (38,090,220) 27,527,575 657,374,817 Less accumulated depreciation: Land improvements (251,855,784) (15,092,167) 21,068,575 - (245,879,376) Buildings and building improvements (81,583,973) (6,899,420) 11,041,061 - (77,442,332) Equipment, furniture and fixtures (23,909,505) (3,891,399) 192,409 - (27,608,495)Total accumulated depreciation (357,349,262) (25,882,986) 32,302,045 - (350,930,203)Net capital assets being depreciated 310,588,200 (25,882,986) (5,788,175) 27,527,575 306,444,614 Net capital assets $ 442,763,034 $ 59,259,316 $ (7,453,675) $ - $ 494,568,675
41 Metropolitan Nashville Airport Authority | Comprehensive Annual Financial Report
NOTES TO FINANCIAL STATEMENTS AS OF AND FOR ThE YEARS ENDED JUNE 30, 2011 AND 2010
The amount of construction in progress at June 30, 2011, is attributable to the following (See Note 14):
CONRAC $62,429,082 In-line explosive detection system 32,551,994 Taxiway T4 & S 7,295,674 Other projects 10,911,219
Total construction in progress $113,187,969
During fiscal year 2011, the Authority capitalized interest of $2,239,432 relating to the CONRAC project.
During fiscal year 2010, as a result of the construction projects under way, the Authority analyzed its capital asset schedules and wrote off a number of assets that had been or are going to be replaced. The portion of the terminal building that was replaced during the phases of the terminal renovation project and the TARI-impacted airport roadways were removed from the balance sheet. Additionally, the CONRAC project’s impact on the public parking footprint accounted for much of the remainder of the loss on the disposal of assets in fiscal year 2010.
During fiscal year 2011, the Authority received $400,000 from the Metropolitan Government for the Automatic Vehicle Locator project. This amount is included in contributed capital in the accompany statement of revenues, expenses and changes in net assets.
5. AIRPORT BONDS
Airport Improvement Revenue Bonds, Adjustable Rate Refunding Series 1995During June 1995, the Authority issued Series 1995 bonds in the principal amount of $74,810,000. The bonds were issued to provide funds to refund the aggregate outstanding principal amount of the Authority’s Airport Revenue Bonds, Series 1985.
The Series 1995 bonds were initially issued bearing interest at a variable weekly rate, but were subsequently remarketed with a fixed rate. The remarketed bonds contained serial bonds at interest rates ranging from 4.80% to 5.00%. At the option of the Authority, the Series 1995 bonds maturing on and after July 1, 2010, may be repaid at 100% of the principal balance outstanding. The Series 1995 bonds were refunded in their entirety with the Series 2010B bonds in August 2010. See further discussion of the 2010B bonds below.
Airport Improvement Revenue Bonds, Series 1998During December 1997, the Authority issued Series 1998A bonds in the principal amount of $19,695,000. The Series 1998A issue contained serial bonds at interest rates ranging from 4.90% to 5.15%. At the option of the Authority, the 1998A bonds maturing on and after July 1, 2010, may be repaid at 100% of the principal balance outstanding. The Series 1998A bonds were refunded in their entirety with the Series 2010C bonds in August 2010. See further discussion of the 2010C bonds below.
During March 1998, the Authority issued Series 1998C bonds in the principal amount of $32,660,000. The bonds were issued to provide funds to refund the aggregate outstanding principal amount of the Authority’s Airport Revenue Bonds, Series 1989A. The 1998C issue contained serial bonds at the interest rate of 5.38%. At the option of the Authority, the bonds may be repaid beginning July 1, 2010, at 100% of the principal balance outstanding. The Series 1998C bonds were refunded in their entirety with the Series 2010C bonds in August 2010. See further discussion of the 2010C bonds below.
Airport Improvement Revenue Bonds, Series 2001ADuring April 2001, the Authority issued Series 2001A bonds in the principal amount of $91,930,000. The bonds were issued to provide funds to refund the aggregate outstanding principal amount of the Authority’s Airport Revenue Bonds, Series 1991C.
The Series 2001A issue contained serial bonds at an interest rate of 6.60%. The Series 2001A bonds were refunded in their entirety with the Series 2010B bonds in August 2010. The reacquisition price was 103% of the outstanding principal. See further discussion of the 2010B bonds below.
Synthetic Advance Refunding, Series 2001ADuring September 1998, the Authority completed a synthetic advance refunding of $91,930,000 of the callable Airport Revenue Bonds, Series 1991C (the “1991C bonds”), to take advantage of significantly lower interest rates. As discussed above, during April 2001, the Authority issued the 2001A bonds which were used to redeem the long-term portion of the outstanding 1991C bonds.

Metropolitan Nashville Airport Authority | Comprehensive Annual Financial Report 42
NOTES TO FINANCIAL STATEMENTS AS OF AND FOR ThE YEARS ENDED JUNE 30, 2011 AND 2010
The Authority accelerated annual savings resulting from the synthetic advance refunding transaction. This was done through an off-market swap in which the fixed rate liability was set at an artificially higher interest rate such that its net debt service liability approximated that of the refunded 1991C bonds. In exchange for the higher payments, the Authority received a net upfront payment of $7,947,134 based on the increased value of the swap. The net upfront payment was recorded as a deferred credit upon receipt and will be credited to interest expense over the term of the Airport Revenue Bonds, Series 2001A. Interest accretion began upon receipt resulting in a charge to operations, based upon the discount rate used in determining the present value of the accelerated annual savings, with a corresponding increase in the deferred credit.
As described below, the Series 2001A bonds were refunded with the Series 2010B bonds. Upon issuance of the 2010B bonds, an analysis of the 2001A synthetic advance refunding concluded that any obligation associated with the upfront payment was defeased at the first call date, July 1, 2010. Therefore, the outstanding deferred credit balance was recorded to other nonoperating income at the time the Series 2001A bonds were refunded with the 2010B bonds in August 2010. More information about the refunding of these bonds is detailed below.
Passenger Facility Charge and Airport Improvement Revenue Bonds, Series 2003During July 2003, the Authority issued Refunding Series 2003 bonds in the principal amount of $32,020,000. These bonds were issued together with other available funds of the Authority to provide funds primarily to refund $29,885,000 aggregate principal amount of the Authority’s Passenger Facility Charge and Airport Improvement Revenue Bonds, Series 1992, and to fund a reserve with respect to the Series 2003 bonds.
The refunding resulted in a difference between the reacquisition and the net carrying amount of the old debt of $988,946. The difference, reported in the accompanying financial statements as a deduction from long-term debt, is being amortized through fiscal year 2012.
The Series 2003 bonds initially bore interest at a weekly rate determined by SunTrust Capital Markets, Inc. Subject to the satisfaction of certain conditions in the Supplemental Resolution, the Authority may from time to time change the method of determining the interest rate on the Series 2003 bonds to a daily rate, weekly rate, a commercial paper rate or a fixed rate. The bonds mature in progressive annual amounts ranging from $3,825,000 on July 1, 2011, to $3,925,000 on July 1, 2012. Airport Improvement Revenue Bonds, Series 2003BDuring November 2003, the Authority issued Series 2003B taxable bonds in the principal amount of $19,585,000. These bonds were issued to provide funding for a portion of the projected unfunded liability of the Metropolitan Nashville Airport Authority Retirement Plan for Employees (See Note 15).
The Series 2003B bonds contain serial bonds at interest rates ranging from 4.13% to 5.94%, with annual sinking fund requirements in progressive annual amounts ranging from $380,000 on July 1, 2011, to $1,280,000 on July 1, 2033. The 2003B bonds are subject to an extraordinary optional redemption, in whole at any time, at a redemption price equal to the principal amount plus accrued interest to the date of redemption only in the event of the destruction or damage to all or substantially all of the Nashville International Airport or the condemnation of the airport facility.
Airport Improvement Revenue Bonds, Refunding Series 2008ADuring June 2008, the Authority issued Refunding Series 2008A in the principal amount of $37,600,000. These bonds were issued to provide funds to refund $37,600,000 aggregate outstanding principal amount of the Authority’s Series 1993 bonds. The purpose of the refunding was to replace the liquidity facility agreement with a direct pay letter of credit. There was no significant economic gain as a result of the refunding. There were no changes to the debt service schedule or other terms of the bonds. The refunding of the Series 1993 bonds resulted in a difference between the reacquisition price and the net carrying amount of the old debt of $2,124,070. This difference, reported in the accompanying financial statements as a deduction from long-term debt, is being amortized through fiscal year 2020. The Series 2008A issue contains serial bonds bearing interest at a weekly variable rate. In order to limit its exposure to changes in interest rates, the Authority transferred its existing 1993 interest rate swap agreement to the 2008A bonds (“2008A Swap Agreement”), resulting in a fixed interest rate of 4.49% (See Note 8). The 2008A bonds mature in various annual amounts ranging from $6,700,000 on July 1, 2011, to $3,800,000 on July 1, 2019.
Airport Improvement Revenue Bonds, Refunding Series 2008BDuring June 2008, the Authority issued Refunding Series 2008B in the principal amount of $27,605,000. These bonds were issued to provide funds to refund $26,985,000 aggregate outstanding principal amounts of both the Authority’s Series 2006 and Series 2007A bonds. The purpose of the refunding was to replace the liquidity facility with a direct pay letter of credit. There were no significant changes to the terms of the bonds, and there was no significant economic gain as a result of the refunding.
The refunding of the Series 2006 and 2007A bonds resulted in a difference between the reacquisition price and the net carrying amount of the old debt of $547,608. The Series 2008B issue contained serial bonds bearing interest at a weekly variable rate. To manage its exposure to market risks from fluctuations in interest rates, the Authority entered into an interest rate swap agreement (the “2008B Swap Agreement”) eliminating any basis risk to the Authority, resulting in a net fixed rate of 3.32% on the Series 2008B bonds. The Series 2008B bonds were refunded with the Series 2010A bonds in February 2010. See further discussion of the 2010A bonds below.

43 Metropolitan Nashville Airport Authority | Comprehensive Annual Financial Report
NOTES TO FINANCIAL STATEMENTS AS OF AND FOR ThE YEARS ENDED JUNE 30, 2011 AND 2010
Airport Improvement Revenue Bonds, Series 2009ADuring March 2009, the Authority issued Series 2009A bonds in the principal amount of $36,000,000. The bonds were issued to provide funds for the majority of the costs associated with the second phase of the terminal renovation project, and to fund a deposit to the debt service reserve account for the Series 2009A bonds.
The Series 2009A bonds contain serial bonds at interest rates ranging from 3.00% to 5.25%, maturing in progressive annual amounts ranging from $1,200,000 on July 1, 2011, to $7,970,000 on July 1, 2019. The debt service reserve account and interest earned on that account will be used to pay a portion of the final principal payment on July 1, 2019.
Airport Improvement Revenue Bonds, Series 2010ADuring February 2010, the Authority issued Series 2010A bonds in the principal amount of $25,770,000. The bonds were issued to provide funds to refund $25,050,000 aggregate outstanding principal amount of the Authority’s Series 2008B bonds and to pay issuance costs. The purpose of the refunding was to replace variable rate bonds with fixed rate bonds thereby terminating an interest rate swap with a financial institution. There were no significant changes to the terms of the bonds, and there was no significant economic gain as a result of the refunding.
The refunding of the Series 2008B bonds resulted in a difference between the reacquisition price and the net carrying amount of the old debt of $498,838. This difference, reported in the accompanying financial statements as a deduction from long-term debt, is being amortized through fiscal year 2018.
The Series 2010A issue contains serial bonds at interest rates ranging from 3.00% to 5.00%, maturing in amounts ranging from $3,295,000 on July 1, 2011, to $3,835,000 on July 1, 2017.
Special Facility Revenue Bonds (MPC CONRAC LLC Project) Series 2010 BondsDuring February 2010, the Authority issued CONRAC Series 2010 bonds in the principal amount of $66,300,000. The bonds, together with customer facility charge (“CFC”) collections on hand and collected during the construction period, will be used for the development and construction of a new consolidated rental car facility and related improvements, including quick-turnaround facilities at the Airport, to fund certain deposits to the debt service reserve fund and coverage fund, and to pay bond issue costs of $2,268,828. Issuance costs are being charged to operations through fiscal year 2018 using the effective interest method. The CONRAC Series 2010 bonds are payable from and secured by a pledge of certain rental payments derived from customer facility charges under leases with rental car agencies (See Note 10).
The CONRAC Series 2010 bonds contain serial bonds at interest rates ranging from 2.25% to 6.19%, maturing in progressive annual amounts ranging from $1,580,000 on July 1, 2012, to $3,800,000 on July 1, 2024. The CONRAC Series 2010 bonds also contain term bonds at 6.79%, maturing in progressive amounts ranging from $4,055,000 on July 1, 2025, to $13,755,000 on July 1, 2029.
Airport Improvement Revenue Bonds, Series 2010 B&CDuring August 2010, the Authority issued Series 2010B bonds in the principal amount of $70,400,000 and Series 2010C in the principal amount of $16,170,000, collectively the “Series 2010B&C bonds.” These bonds, together with other funds of the Authority, were issued to provide funds to refund $92,925,000 aggregate outstanding principal amount of the Authority’s Series 1995, 1998A, 1998C and 2001A bonds, to pay the premiums of municipal bond insurance policies and debt service reserve fund surety policies, and to pay certain costs of their issuance. Interest on the 2010C bonds is treated as a preference item in calculating alternative minimum tax. The 2010B&C bonds were issued at a premium totaling $5,755,919. The refunding resulted in an economic gain of approximately $8,500,000.
The refunding of the Series 1995, 1998A, 1998C and 2001A bonds resulted in a difference between the reacquisition price and the net carrying amount of the refunded debt of $1,918,969, including a 3%, $1,274,700 repayment premium on the 2001A bonds. This difference, reported as a deduction from long-term debt, is being amortized through fiscal year 2017.
The Series 2010B issue contains serial bonds at interest rates ranging from 3.00% to 4.00%, maturing in amounts from $9,990,000 on July 1, 2011, to $16,475,000 on July 1, 2015. The Series 2010C issue contains serial bonds at interest ranging from 3.00% to 4.00%, maturing in amounts from $2,805,000 on July 1, 2011, to $1,740,000 on July 1, 2016.

Metropolitan Nashville Airport Authority | Comprehensive Annual Financial Report 44
NOTES TO FINANCIAL STATEMENTS AS OF AND FOR ThE YEARS ENDED JUNE 30, 2011 AND 2010
2011 2010
Principal and Interest Funds:
Airport Improvement Revenue Bonds, Series 1995 $ - $ 5,333,001
Airport Improvement Revenue Bonds, Series 1998 - 3,536,004
Airport Improvement Revenue Bonds, Series 2001A - 7,762,000
Airport Improvement Revenue Bonds, Series 2003B 745,146 365,310
PFC and Airport Improvement Revenue Bonds, Series 2003 4,546,713 4,481,638
Airport Improvement Revenue Bonds, Series 2008A 6,778,589 5,901,409
Airport Improvement Revenue Bonds, Series 2009A 1,946,744 1,472,469
Airport Improvement Revenue Bonds, Series 2010A 4,042,940 1,894,494
Airport Improvement Revenue Bonds, Series 2010B 11,280,649 -
Airport Improvement Revenue Bonds, Series 2010C 3,092,505 -
Bond Reserve Funds:
PFC and Airport Improvement Revenue Bonds, Series 2003 4,429,527 4,547,500
Airport Improvement Revenue Bonds, Series 2009A 3,662,356 3,660,490
Airport Improvement Revenue Bonds, Series 2010A 2,584,196 2,579,309
CONRAC Series 2010 Bonds 6,645,587 6,633,131
Construction Funds:
PFC and Airport Improvement Revenue Bonds, Series 2003 10,325,447 12,440,827
Airport Improvement Revenue Bonds, Series 2009A 8,184,234 16,162,015
CONRAC Series 2010 Bonds 5,187,437 54,334,894
Other Funds (not bond-related):
Energy Improvement 1,807,000 -
Various CONRAC Accounts 17,537,410 8,181,942
Other 116,513 533,842
$ 92,912,993 $ 139,820,275
In summary, all of the Authority’s bonds, except for the Series 2003 PFC bonds, were issued under the Airport Improvement Revenue Bond Resolution adopted by the Board of Commissioners of the Authority on August 15, 1991 (as amended and supplemented from time to time). The 2003 PFC bonds were issued under the PFC Resolution and were secured by an additional pledge of and lien on PFC revenues less operating expenses. The Authority is also using PFC revenues that were approved under PFC Program Application for its annual debt service costs on the 2009A bonds and the Series 2010A bonds (See Note 9). Although the CONRAC Series 2010 bonds were issued under the General Resolution, the CFCs are not in and of themselves a part of airport revenues or net revenues as defined in the General Bond Resolution. Therefore, airport revenues derived by the Authority from the operation of the Airport are not pledged for payment of and do not constitute security for the CONRAC Series 2010 bonds. All other bonds are secured by a pledge of and lien on net revenues derived by the Authority from the operation of the airports.
The following shows the composition of restricted cash and cash equivalents and investments as of June 30, 2011 and 2010 (the restricted funds relate primarily to airport bonds and related activity):

45 Metropolitan Nashville Airport Authority | Comprehensive Annual Financial Report
NOTES TO FINANCIAL STATEMENTS AS OF AND FOR ThE YEARS ENDED JUNE 30, 2011 AND 2010
Airport bond activity for the year ended June 30, 2011, is summarized as follows:
series Balance new principal BalanceDescription June 30, 2010 Borrowings Repayment Refundings Amortization June 30, 2011
Series 1995 $ 38,265,000 $ - $ (4,960,000) $ (33,305,000) $ - $ - Series 1998A 4,330,000 - (1,315,000) (3,015,000) - - Series 1998C 16,190,000 - (2,075,000) (14,115,000) - -Series 2001A 49,475,000 - (6,985,000) (42,490,000) - - Series 2003 PFC 11,485,000 - (3,735,000) - - 7,750,000 Series 2003B 17,260,000 - - - - 17,260,000 Series 2008A 25,700,000 - (6,400,000) - - 19,300,000Series 2009A 36,000,000 - (715,000) - - 35,285,000 Series 2010A 25,770,000 - (1,255,000) - - 24,515,000 CONRAC Series 2010 66,300,000 - - - - 66,300,000 Series 2010B - 70,400,000 - - - 70,400,000Series 2010C - 16,170,000 - - - 16,170,000Total 290,775,000 86,570,000 (27,440,000) (92,925,000) - 256,980,000Plus unamortized premium 1,945,321 5,755,919 - - (1,235,007) 6,466,233Less unamortized deferred amount on refunding (6,510,395) - - (1,918,967) 1,821,207 (6,608,155) 286,209,926 $ 92,325,919 $ (27,440,000) $ (94,843,967) $ 586,200 $ 256,838,078 Less current portion (27,440,000) (27,815,000)
$ 258,769,926 $ 229,023,078
Airport bond activity for the year ended June 30, 2010, is summarized as follows:
series Balance new principal BalanceDescription June 30, 2009 Borrowings Repayment Refundings Amortization June 30, 2010
Series 1995 $ 42,775,000 $ - $ (4,510,000) $ - $ - $ 38,265,000 Series 1998A 5,810,000 - (1,480,000) - - 4,330,000 Series 1998C 18,150,000 - (1,960,000) - - 16,190,000Series 2001A 56,030,000 - (6,555,000) - - 49,475,000 Series 2003 PFC 14,145,000 - (2,660,000) - - 11,485,000 Series 2003B 17,610,000 - (350,000) - - 17,260,000 Series 2008A 31,800,000 - (6,100,000) - - 25,700,000Series 2008B 27,605,000 - (2,555,000) (25,050,000) - -Series 2009A 36,000,000 - - - - 36,000,000 Series 2010A - 25,770,000 - - - 25,770,000 CONRAC Series 2010 - 66,300,000 - - - 66,300,000 Total 249,925,000 92,070,000 (26,170,000) (25,050,000) - 290,775,000Plus unamortized premium 180,568 1,866,706 - - (101,953) 1,945,321Less unamortized deferred amount on refunding (7,675,177) - - (498,838) 1,663,620 (6,510,395) 242,430,391 $ 93,936,706 $ (26,170,000) $ (25,548,838) $ 1,561,667 $ 286,209,926 Less current portion (26,170,000) (27,440,000)
$ 216,260,391 $ 258,769,926

Metropolitan Nashville Airport Authority | Comprehensive Annual Financial Report 46
NOTES TO FINANCIAL STATEMENTS AS OF AND FOR ThE YEARS ENDED JUNE 30, 2011 AND 2010
Aggregate maturities of revenue bonds outstanding at June 30, 2011, are as follows:
Year Ending June 30, principal Interest total
2012 $ 27,815,000 $ 10,932,891 $ 38,747,8912013 30,510,000 10,205,153 40,715,1532014 26,645,000 9,274,622 35,919,6222015 27,835,000 8,182,747 36,017,7472016 29,105,000 7,006,667 36,111,6672017-2021 57,340,000 24,369,077 81,709,0772022-2026 21,580,000 15,472,442 37,052,4422027-2031 32,520,000 6,560,129 39,080,1292032-2034 3,630,000 331,749 3,961,749
$ 256,980,000 $ 92,335,477 $ 349,315,477
The interest amounts on the 2008A variable rate debt, which has an interest rate swap agreement associated with it, was computed based on the fixed rate in the agreement plus an estimate for additional fees where applicable. The variable Series 2003 PFC bond’s interest computation was based on the weekly reset in place at June 30, 2011, of 0.58%.
During September 2008, the Authority entered into a $15,000,000 line of credit agreement with a financial institution. Proceeds from the line of credit were to be used solely to pay accrued debt services on certain bond issues designated for refunding by the Authority. However, there were no draws on the line of credit and it expired in December 2010 and was not renewed.
6. OThER NONCURRENT DEBT - MPC NOTES PAYABLE
In October 2007, MPC Holdings, LLC, entered into a term note in the amount of $7,600,000 with a financial institution. Proceeds were used to replenish MPC Holdings, LLC’s cash balance shortly after its purchase of International Plaza in September 2007. The variable rate loan was entered into bearing interest at a monthly rate. Principal payments are due in level monthly installments of $31,667. The obligation matures in November 2012, at which time the remaining balance will be $5,700,000. The principal balance at June 30, 2011, was $6,238,329. The note is collateralized by the building. In order to reduce its exposure to fluctuations in interest rates, MPC Holdings, LLC, entered into an interest rate swap agreement (“2007 MPC Swap Agreement”) that fixes the interest rate at 5.67% (See Note 8). In March 2008, MPC Holdings, LLC, entered into a term note in the amount of $1,360,000 with a financial institution. Proceeds were used to purchase a multi-purpose building on airport property from a major tenant. The variable rate loan was entered into bearing interest at a monthly rate. Principal payments are due in level monthly installments of $5,666. The obligation matures in February 2013, at which time the remaining balance will be $1,027,000. The principal balance at June 30, 2011, was $1,139,000. The note is collateralized by the building. MPC Holdings, LLC, entered into an interest rate swap agreement (“2008 MPC Swap Agreement”) that fixes the interest rate at 4.33% (See Note 8).
The aggregate principal maturities of the MPC notes payable are $448,000 in fiscal year 2012 and $6,929,329 in fiscal year 2013. As part of its loan agreements, MPC is required to comply with debt covenants, including certain financial ratios and minimum balance requirements. As of June 30, 2011 and 2010, MPC was in compliance with its financial covenants.
Balance new principal BalanceDescription June 30, 2010 Borrowings Repayment June 30, 2011
MPC Note 1 $ 6,618,329 $ - $( 380,000) $ 6,238,329MPC Note 2 1,207,000 - ( 68,000) 1,139,000 $ 7,825,329 $ - $( 448,000) $ 7,377,329
Balance new principal BalanceDescription June 30, 2009 Borrowings Repayment June 30, 2010
MPC Note 1 $ 6,998,333 $ - $( 380,004) $ 6,618,329MPC Note 2 1,275,000 - ( 68,000) 1,207,000 $ 8,273,333 $ - $( 448,004) $ 7,825,329

47 Metropolitan Nashville Airport Authority | Comprehensive Annual Financial Report
NOTES TO FINANCIAL STATEMENTS AS OF AND FOR ThE YEARS ENDED JUNE 30, 2011 AND 2010
7. OThER NONCURRENT LIABILITIES
Other noncurrent liabilities activity for the years ended June 30, 2011 and 2010, is as follows:
Net Cash Change in Other noncurrent liabilities Balance Receipts Derivative BalanceDescription June 30, 2010 (Repayments) Amortization Instruments June 30, 2011 Synthetic advance refunding, Series 2001A $ 1,913,045 $ - $(1,913,045) $ - $ - Fair value of derivative financial instruments 3,476,127 - - (712,062) 2,764,065 Deferred interest income 1,334,444 - (154,616) - 1,179,828 Deferred rental income 1,952,990 1,880 (34,904) - 1,919,966 $ 8,676,606 $ 1,880 $(2,102,565) $ (712,062) $ 5,863,859
Net Cash Change in Other noncurrent liabilities Balance Receipts Derivative BalanceDescription June 30, 2009 (Repayments) Amortization Instruments June 30, 2010 Synthetic advance refunding, Series 2001A $ 2,577,768 $ - $ (664,723) $ - $ 1,913,045 Fair value of derivative financial instruments 4,334,856 (1,098,645) - 239,916 3,476,127 Deferred interest income 1,686,297 - (351,853) - 1,334,444 Deferred rental income 1,978,847 9,047 (34,904) - 1,952,990 $10,577,768 $ (1,089,598) $(1,051,480) $ 239,916 $ 8,676,606
8. DERIvATIvE FINANCIAL INSTRUMENTS
The Authority maintains several interest rate swap agreements in order to manage its exposure to market risk from fluctuations in interest rate. The interest rate swaps are designed as pay-fixed, receive variable swaps.
2008A Interest Rate Swap Agreement - During 2008, in connection with the refunding of the Authority’s Series 1993 bonds with the Series 2008A bonds, the Authority’s 1993 Swap Agreement was transferred from the 1993 bonds to the 2008A bonds. All the terms of the 1993 Swap Agreement, now the “2008A Swap Agreement,” remained intact and apply to the Series 2008A bonds. In general, the 2008A Swap Agreement provides that the Authority will pay a fixed rate of 4.49% to the counterparty on a notional amount equal to the principal amount of the Series 2008A bonds outstanding.
2008B Interest Rate Swap Agreement - In connection with the Authority’s Series 2008B bonds, the Authority entered into an interest rate swap agreement in June 2008, (the “2008B Swap Agreement”) with a bank. The Series 2008B were refunded with the Series 2010A bonds in February 2010, at which time a termination payment was made in the amount of $1,348,500. The resulting loss on the termination of this interest rate swap was $249,855.
MPC 2007 Interest Rate Swap Agreement - In October 2007, MPC Holdings, LLC, entered into an interest rate swap agreement (the “2007 MPC Swap Agreement”) in order to manage its exposure to market risks from fluctuations in interest rates in connection with a term loan used to purchase a multi-tenant structure (See Note 6). In general, this agreement provides that MPC will pay a fixed rate of 5.67% on the outstanding notional amount. This agreement terminates November 1, 2012, to correspond with the termination of the loan.
MPC 2008 Interest Rate Swap Agreement - In March 2008, MPC Holdings, LLC, entered into an interest rate swap agreement (the “2008 MPC Swap Agreement”) in order to manage its exposure to market risks from fluctuations in interest rates in connection with a term loan used to purchase a multi-purpose structure (See Note 6). In general, this agreement provides that MPC will pay a fixed rate of 4.33% on the outstanding notional amount. This agreement terminates March 1, 2013, to correspond with the termination of the loan.
Arrangements made in the Authority’s interest rate swap agreements do not alter the Authority’s obligation to pay the principal of, premium, if any, and interest on the related debt.

Metropolitan Nashville Airport Authority | Comprehensive Annual Financial Report 48
NOTES TO FINANCIAL STATEMENTS AS OF AND FOR ThE YEARS ENDED JUNE 30, 2011 AND 2010
The fair value balances and other details of the interest rate swap agreements are as follows:
notional Counterparty Amount Maturity Credit Fair value June 30,Description June 30, 2011 Date terms Rating 2011 2010
2008A Swap $ 19,300,000 7/1/2019 pay 4.49% fixed; receive SIFMA Aa3/A+ $2,319,810 $2,803,435
MPC 2007 Swap 6,238,329 11/1/2012 pay 5.67% fixed; receive 1-month LIBOR A2/BBB 385,831 595,475
MPC 2008 Swap 1,139,000 3/1/2013 pay 4.33% fixed; receive 1-month LIBOR A2/BBB 58,424 77,217
$2,764,065 $3,476,127
The fair value of the interest rate swaps is recorded in noncurrent liabilities in the statements of net assets. Changes in the interest rate swaps are included in nonoperating revenues (expenses) in the statement of changes in revenues, expenses and changes in net assets.
Credit risk. The Authority is exposed to credit risk on hedging derivative instruments that are in asset positions. There were no such instruments in asset positions at June 30, 2011 or 2010. The Authority relies primarily on credit rating of the counterparty to access credit risk.
Interest rate risk. The Authority is exposed to interest rate risk on its interest rate swaps. On its pay-fixed, receive-variable interest rate swaps, as the variable swap index decreases, the Authority’s net payments on the swaps increase.
Basis risk. The Authority is exposed to basis risk on its pay-fixed interest rate swaps because the variable-rate payments received by the Authority on these hedging derivative instruments are, in certain circumstances, based on a rate or index other than interest rates the Authority pays on its hedged variable-rate debt.
Termination Risk. The Authority or its counterparties may terminate a derivative instrument if the other party fails to perform under the terms of the contract. If at the time of termination, a hedging derivative instrument is in a liability position, the Authority would be liable to the counterparty for a payment equal to the liability.
9. PASSENgER FACILITY ChARgES
On January 1, 1993, the airlines began collecting a Passenger Facility Charge (“PFC”) on qualifying enplaning passengers at Nashville International Airport on behalf of the Authority. PFCs are fees imposed on enplaning passengers by airports to finance eligible airport-related projects that preserve or enhance safety, capacity or security of the national air transportation system, reduce noise from an airport that is part of such system or furnish opportunities for enhanced competition between or among air carriers. Both the fee and intended projects must be reviewed and approved by the Federal Aviation Administration (“FAA”). Federal guidance on the PFC program has been updated from time to time since 1993, and the current maximum fee that can be authorized through federal regulation is $4.50 per enplaning passenger. PFCs are recorded as nonoperating revenue. PFC revenue during fiscal years 2011 and 2010 totaled $13,300,248 and $15,494,672, respectively.
The Authority has received approval from the FAA to impose a $4.50 PFC effective December 1, 2009, until $19,250,558 is collected. The authority reverted back to $3.00 per enplaning passenger in September 2010. The following project summary has been approved by the FAA as of June 30, 2011:
Airfield development $ 169,253,361Terminal development 123,961,879Land acquisition 23,195,200
$ 316,410,440
As of June 30, 2011, cumulative expenditures to date on approved PFC projects totaled $227,554,889.
49 Metropolitan Nashville Airport Authority | Comprehensive Annual Financial Report
NOTES TO FINANCIAL STATEMENTS AS OF AND FOR ThE YEARS ENDED JUNE 30, 2011 AND 2010
10. CUSTOMER FACILITY ChARgES
On January 1, 2008, the Authority began requiring the car rental companies at Nashville International Airport to charge a Customer Facility Charge (“CFC”) to be used to pay, or to reimburse the Authority, for costs, fees and expenses associated with the planning, design, construction, financing, maintenance and operation of the Consolidated Rental Car Facility (“CONRAC facility”), and other costs, fees and expenses that may be paid from CFC proceeds. This amount increased from $4.00 to $4.50 effective January 1, 2010, in anticipation of the issuance of debt to pay for the CONRAC facility. The CFC is a $4.50 fee per transaction day and is collected by the on-airport car rental companies from each of their customers and subsequently remitted to the Authority. The Authority has pledged the CFC proceeds as collateral security for the payment of the CONRAC Series 2010 bonds issued in February 2010 (See Note 5). CFC revenue during fiscal years 2011 and 2010 totaled $9,074,716 and $7,911,785, respectively. CFC revenue is reported as nonoperating revenues.
Upon completion of the CONRAC facility, the Authority will be leasing the facility to MPC CONRAC LLC under a lease agreement and leasing back the facility from MPC CONRAC LLC under a sublease agreement. In turn, the Authority will lease the CONRAC facility to the on-airport rental car companies under the consolidated rental car lease agreements. Under these lease agreements, the on-airport rental car companies have agreed to collect the CFC on all vehicle rental transactions as specifically set forth in the CFC enabling resolution and the lease agreements.
Net assets relating to CFCs totaled $24,107,914 and $16,477,990 at June 30, 2011 and 2010, respectively, and are included in invested in capital assets - net of related debt and restricted net assets in the statements of net assets. Construction in progress for the CONRAC facility totaled $62,429,082 as of June 30, 2011. The project is expected to be completed in November 2011 (See Notes 4 and 14).
11. SPECIAL FACILITY REvENUE BONDS
Special Facility Revenue Bonds, Series 2005During April 2005, the Authority issued $9,500,000 of Special Facility Revenue Bonds, Series 2005, on behalf of Embraer Aircraft Maintenance Services, Inc. The bonds were issued to finance the development and construction of an aircraft maintenance facility at Nashville International Airport. The bonds are due through July 2030.
The outstanding Special Facility Revenue Bonds, Series 2005, are special obligations of the Authority, and the debt service thereon shall be payable solely from revenues provided by Embraer Aircraft Maintenance Services, Inc., pursuant to a special facility sublease agreement or from letter-of-credit drawings made by the trustee. Since these bonds do not represent a claim on the Authority’s assets or require the Authority to incur future obligations, they represent conduit debt and have not been recorded in the Authority’s financial statements.
Special Facility Revenue Bonds, Series 2006/Refunding Series 2010During July 2006, the Authority approved an amendment to the ground lease with Aero Nashville, LLC, whereby the Authority agreed to issue $6,515,000 of Special Facility Revenue Bonds, Series 2006, on behalf of Aero Nashville, LLC. Aero Nashville is an affiliate of Aeroterm US, Inc., the firm selected by Federal Express Corporation to be the developer of a 69,000-square-foot cargo and support facility on approximately 15 acres of land at Nashville International Airport in 2005.
During November 2010, the Authority issued $6,200,000 in Special Facility Revenue Bonds, Refunding Series 2010, the proceeds of which were used to currently refund the outstanding Series 2006 bonds. The Refunding Series 2010 bonds are term bonds with mandatory sinking fund requirements annually through July 2026. The Special Facility Revenue Bonds, Series 2006, and outstanding Refunding Series 2010 bonds are special obligations of the Authority, and the debt service thereon shall be payable solely from revenues provided by Aero Nashville, LLC, pursuant to a special facility sublease agreement or from letter-of-credit drawings made by the trustee. Since these bonds do not represent a claim on the Authority’s assets or require the Authority to incur future obligations, they represent conduit debt and have not been recorded in the Authority’s financial statements.
12. AIRLINE LEASE AgREEMENTS During the year ended June 30, 1975, the Authority entered into long-term lease agreements with certain of the airlines serving Nashville for use of the facilities at Nashville International Airport. Rentals and fees due under terms of the leases are based upon the Authority’s projected cost of providing the facilities to the airlines. Terminal rents and landing fees charged to the signatory airlines are based on the residual agreement which takes into account all eligible revenues, expenses and debt service of the Authority. The residual agreement is designed to minimize the landing fees and terminal rents of the signatory airlines while assuring the payment of all net operating costs and debt service relating to the Authority. Costs recovered
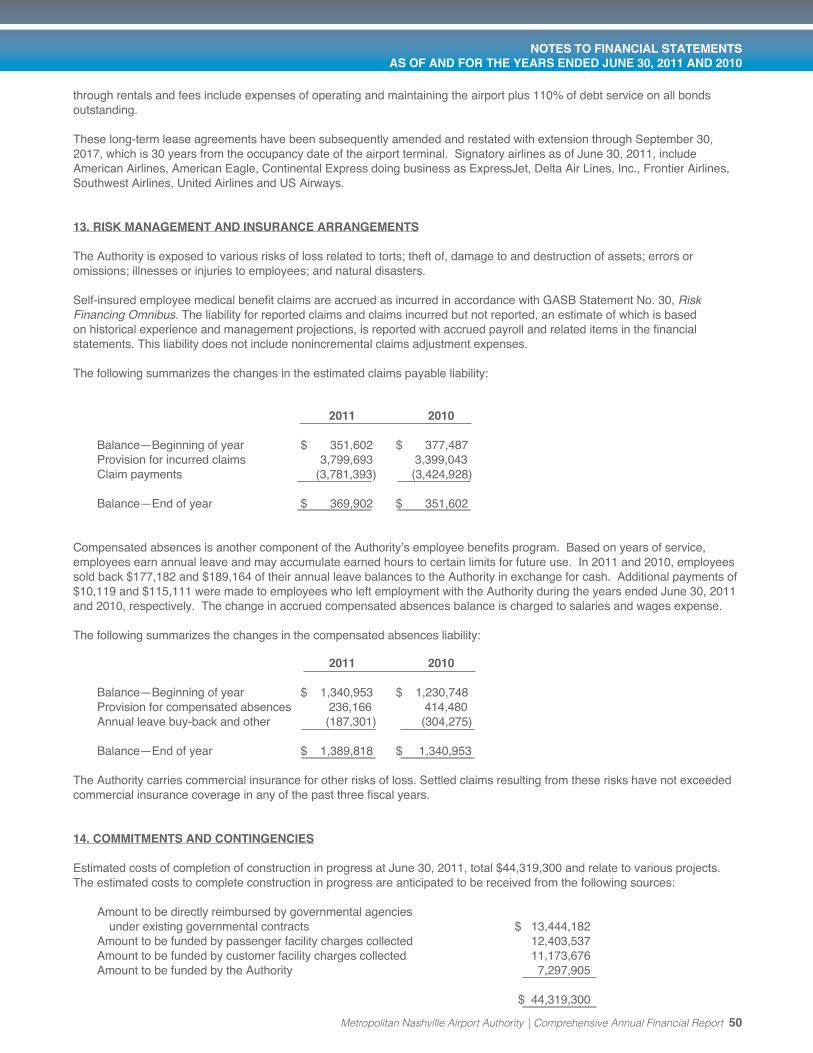
Metropolitan Nashville Airport Authority | Comprehensive Annual Financial Report 50
NOTES TO FINANCIAL STATEMENTS AS OF AND FOR ThE YEARS ENDED JUNE 30, 2011 AND 2010
through rentals and fees include expenses of operating and maintaining the airport plus 110% of debt service on all bonds outstanding.
These long-term lease agreements have been subsequently amended and restated with extension through September 30, 2017, which is 30 years from the occupancy date of the airport terminal. Signatory airlines as of June 30, 2011, include American Airlines, American Eagle, Continental Express doing business as ExpressJet, Delta Air Lines, Inc., Frontier Airlines, Southwest Airlines, United Airlines and US Airways.
13. RISk MANAgEMENT AND INSURANCE ARRANgEMENTS
The Authority is exposed to various risks of loss related to torts; theft of, damage to and destruction of assets; errors or omissions; illnesses or injuries to employees; and natural disasters.
Self-insured employee medical benefit claims are accrued as incurred in accordance with GASB Statement No. 30, Risk Financing Omnibus. The liability for reported claims and claims incurred but not reported, an estimate of which is based on historical experience and management projections, is reported with accrued payroll and related items in the financial statements. This liability does not include nonincremental claims adjustment expenses.
The following summarizes the changes in the estimated claims payable liability:
2011 2010
Balance—Beginning of year $ 351,602 $ 377,487 Provision for incurred claims 3,799,693 3,399,043 Claim payments (3,781,393) (3,424,928)
Balance—End of year $ 369,902 $ 351,602
Compensated absences is another component of the Authority’s employee benefits program. Based on years of service, employees earn annual leave and may accumulate earned hours to certain limits for future use. In 2011 and 2010, employees sold back $177,182 and $189,164 of their annual leave balances to the Authority in exchange for cash. Additional payments of $10,119 and $115,111 were made to employees who left employment with the Authority during the years ended June 30, 2011 and 2010, respectively. The change in accrued compensated absences balance is charged to salaries and wages expense.
The following summarizes the changes in the compensated absences liability:
2011 2010
Balance—Beginning of year $ 1,340,953 $ 1,230,748 Provision for compensated absences 236,166 414,480 Annual leave buy-back and other (187,301) (304,275)
Balance—End of year $ 1,389,818 $ 1,340,953
The Authority carries commercial insurance for other risks of loss. Settled claims resulting from these risks have not exceeded commercial insurance coverage in any of the past three fiscal years.
14. COMMItMEnts AnD COntIngEnCIEs
Estimated costs of completion of construction in progress at June 30, 2011, total $44,319,300 and relate to various projects. The estimated costs to complete construction in progress are anticipated to be received from the following sources:
Amount to be directly reimbursed by governmental agencies under existing governmental contracts $ 13,444,182
Amount to be funded by passenger facility charges collected 12,403,537 Amount to be funded by customer facility charges collected 11,173,676 Amount to be funded by the Authority 7,297,905 $ 44,319,300

51 Metropolitan Nashville Airport Authority | Comprehensive Annual Financial Report
NOTES TO FINANCIAL STATEMENTS AS OF AND FOR ThE YEARS ENDED JUNE 30, 2011 AND 2010
In February 2009, the Authority entered into a $7,500,000 line-of-credit loan agreement with financial institution to provide bridge financing on the In-Line EDS project. Over half the funding for this project was received from the U.S. Department of Homeland Security (DHS). The interest rate on any outstanding balance was 3.34%, payable monthly. As costs were incurred, draws were made on the credit line; when grant revenue was received, the credit line was repaid. The balance outstanding on the line of credit was $2,057,268 at June 30, 2010, and was reported in accounts payable in the accompanying statement of net assets. The line of credit was repaid during fiscal year 2011, and there is no balance outstanding at June 30, 2011.
During a routine compliance inspection in February 2010, State regulatory personnel identified contamination in an area stream. It was determined that those impacts were the result of the release of untreated deicing chemicals. From a review of winter deicing activities, it was determined that, due to abnormally low temperatures and high snowfall amounts, pavement deicing chemicals had been used in areas outside of the stormwater treatment system and that aircraft deicing fluid-laden snow had been pushed to areas outside of the treatment system. This allowed a slow release of the chemical to the environment as the snow melted.
Various corrective actions were taken in the following months. From March 24 through May 10, 2010, Nashville International Airport discharged a total of 6.916 million gallons of untreated stormwater to the municipal sanitary sewer through a specially permitted discharge. An additional 905,000 gallons of wastewater were hauled off-site for treatment and disposal. The Authority is undertaking a $1,800,000 capital improvement project that includes lining the treatment lagoon and two retention ponds with high-density polyethylene liner, lining the effluent discharge channel with concrete and installing a new valve at the bottom of the treatment lagoon to provide easier access for sludge removal. The remaining capital improvement project and any fines or penalties as a result of this matter are not currently expected to have a material impact on the financial condition or operations of the Authority.
The Authority is a defendant to various legal proceedings incidental to its operations. In the opinion of management and the Authority’s legal counsel, while the ultimate outcome of these matters, including an estimate of potential loss, cannot presently be determined, any losses sustained would not be material to the Authority’s financial position or operations. Additionally, losses sustained would be recoverable through the Authority’s leases with certain airlines discussed in Note 12.
15. RETIREMENT BENEFIT PLANS
Effective September 1989, the Authority adopted a single-employer public employee retirement system (“PERS”) for its employees whereby the net assets available for benefits relative to the Authority’s employees were transferred from the Metropolitan Government’s pension system to the Metropolitan Nashville Airport Authority Retirement Plan for Employees (the “Plan”). Certain Authority employees participate in the pension system of the Metropolitan Government of Nashville and Davidson County, Tennessee, a cost-sharing multiple employer PERS. Employees participate in either “Fund B” (pension benefits for credited service other than credited Fire and Police service) or “Fund C” (pension benefits for credited Fire and Police service) of the Metropolitan Employees’ Benefit Trust Fund (the “Fund”). New employees of the Authority and those previously selecting the new Metropolitan Nashville Airport Authority’s single-employer PERS are not eligible for participation in the Metropolitan Government’s pension system. As a result of the relatively few number of employee participants, additional postemployment benefits information in regards to the Fund has not been presented.
The Plan is a noncontributory defined benefit pension plan administered by the Authority. The plan provides retirement, disability and death benefits to plan members and beneficiaries. Cost-of-living adjustments are provided to members and beneficiaries at the discretion of the Authority. Benefit provisions are established and may be amended by the Authority. Effective June 27, 2003, the Plan was closed to new participants; therefore, employees hired after June 27, 2003, are not eligible to participate in the Plan. The Plan issues a publicly available financial report that includes financial statements and required supplementary information. That report may be obtained by writing to Metropolitan Nashville Airport Authority, One Terminal Drive, Suite 501, Nashville, Tennessee, 37214, or by calling (615) 275-1600.
For the year ended June 30, 2011, the Authority’s annual pension cost of $2,608,858 was equal to the annual required contribution of $2,458,044, less interest in the amount of $734,685 on the net pension asset, plus the annual required contribution adjustment of $885,499. For the year ended June 30, 2010, the Authority’s annual pension cost of $2,809,352 was equal to the annual required contribution of $2,629,722, less interest in the amount of $959,433 on the net pension asset, plus the annual required contribution adjustment of $1,139,063. A contribution of $19,000,000 was made to the Plan in 2004 through the issuance of Airport Improvement Revenue Bonds, Series 2003B (See Note 5). Additionally, during fiscal year 2011, the Authority made a contribution of $1,000,000 to the Plan.

Metropolitan Nashville Airport Authority | Comprehensive Annual Financial Report 52
NOTES TO FINANCIAL STATEMENTS AS OF AND FOR ThE YEARS ENDED JUNE 30, 2011 AND 2010
The following table presents the annual pension cost, percentage of annual pension cost contributed, and the net pension asset for the years ended June 30, 2011, 2010 and 2009:
Percentage of Net Pension Year Ended Annual Annual Pension Obligation June 30 Pension Cost Cost Contributed (Assets)
2011 $2,608,858 38.3% $ ( 7,574,702) 2010 2,809,352 -% (9,183,560)
2009 1,665,239 -% (11,992,912)
The funded status of the pension plan as of the valuation date, July 1, 2010, is detailed below:
Actuarial accrued liability (a) $38,835,563Actuarial value of plan assets (b) 21,753,320
Unfunded actuarial accrued liability (a) - (b) $ 17,082,243Funded ratio (b) / (a) 56.0%
Covered payroll (c) $ 7,876,534Unfunded actuarial accrued liability as a percentage of covered payroll [(a) - (b)] / (c) 216.9%
Actuarial valuations of an ongoing plan involve estimates of the value of reported amounts and assumptions about the probability of occurrence of events far into the future. Examples include assumptions about future employment, mortality and the projected salary increases. Amounts determined regarding the funded status of the plan and the annual required contributions of the employer are subject to continual revision as actual results are compared with past expectations and new estimates are made about the future. The schedule of funding progress, presented as required supplementary information following the notes to the financial statements, presents multi-year trend information about whether the actuarial value of plan assets is increasing or decreasing over time relative to the actuarial accrued liabilities for benefits.
Significant actuarial methods and assumptions as of July 1, 2010, which were confirmed with the issuance of the July 1, 2011, actuarial valuation, are detailed below:
Actuarial valuation method Projected unit credit methodAmortization method Level percentage closed over 30 yearsDiscount rate 8.0%Asset valuation method 3-year weighted average of asset gains and lossesRate of investment return 8.0% per annum for funding purposesProjected inflation 4.0%Cost-of-living adjustments None in the current year
See further information in the Pension Plan Schedule of Funding Progress (unaudited) in the required supplementary information section.
16. OThER POSTEMPLOYMENT BENEFITS (OPEB)
The Authority provides postemployment healthcare benefits to certain eligible employees who retire under either the Authority’s PERS or the Metropolitan Government’s PERS.
Under the Authority’s PERS, the Authority pays approximately 75% of the medical, dental, vision and prescription coverage cost, with the retirees paying the remaining 25%. The Authority also pays 100% of the premium cost of a $10,000 life insurance policy on each retiree. In addition, the retirees have the option to pay 100% of the cost of supplemental life insurance coverage. Currently, 97 retirees are receiving benefits under the PERS. The monthly contribution requirements for participants in the Authority’s medical plan range from $4 (single “Core Wellness” premium) to $225 (family “Core Plus” premium). The plan was closed to new entrants on January 1, 2009. Therefore, any employee hired on or after this date is not eligible for any postemployment benefits through the Authority. The postemployment benefit plan does not issue separate financial statements.
For the year ended June 30, 2011, the Authority’s annual OPEB cost of $6,187,879 was equal to the annual required contribution of $6,399,488, plus interest on the net OPEB obligation of $506,631, less the amortization on the net OPEB obligation of $718,240. For the year ended June 30, 2010, the Authority’s annual OPEB cost of $6,268,830 was equal to the annual required contribution of $6,395,351, plus interest on the net OPEB obligation of $302,917, less the amortization on

NOTES TO FINANCIAL STATEMENTS AS OF AND FOR ThE YEARS ENDED JUNE 30, 2011 AND 2010
53 Metropolitan Nashville Airport Authority | Comprehensive Annual Financial Report
the net OPEB obligation of $429,438. The Authority’s contributions during fiscal years 2011 and 2010 totaled $2,063,131 and $1,175,967, respectively. The amount contributed during fiscal year 2011 includes $1,000,000 to an OPEB Trust to fund plan assets as further described below. The Authority’s annual OPEB cost, percentage of annual OPEB cost contributed, and the net OPEB obligation for 2011, 2010 and 2009 are as follows:
Year Ended Percentage of Annual Net OPEB June 30 Annual OPEB Cost OPEB Cost Contributed Obligation
2011 $6,187,879 33.3% $16,790,524 2010 6,268,830 18.8% 12,665,776 2009 6,362,894 20.7% 7,572,913
The funded status of the postemployment health care plan as of the actuarial valuation date, July 1, 2010, is detailed below:
Actuarial accrued liability (a) $53,039,196Actuarial value of plan assets (b) -
Unfunded actuarial accrued liability (a) - (b) $53,039,196Funded ratio (b) / (a) -%
Covered payroll (c) $13,619,447Unfunded actuarial accrued liability as a percentage of covered payroll [(a) - (b)] / (c) 389.4%
As described above, the Authority made $1,000,000 in contributions to an OPEB Trust during fiscal year 2011, which will be considered in the July 1, 2011, valuation. Actuarial valuations of an ongoing plan involve estimates of the value of reported amounts and assumptions about the probability of occurrence of events far into the future. Examples include assumptions about future employment, mortality and the health care cost trend. Amounts determined regarding the funded status of the plan and the annual required contributions of the employer are subject to continual revision as actual results are compared with past expectations and new estimates are made about the future. The schedule of funding progress, presented as required supplementary information following the notes to the financial statements, presents multi-year trend information about whether the actuarial value of plan assets is increasing or decreasing over time relative to the actuarial accrued liabilities for benefits.
Projections of benefits for financial reporting purposes are based on the substantive plan (the plan as understood by the employer and the plan members) and include the types of benefits provided at the time of each valuation and the historical pattern of sharing of benefit costs between the employer and plan members to that point. The actuarial methods and assumptions used include techniques that are designed to reduce the effects of short-term volatility in actuarial accrued liabilities and the actuarial value of assets, consistent with the long-term perspective of the calculations.
The July 1, 2010, actuarial valuation was reaffirmed by the July 1, 2011, valuation, in which the following significant actuarial methods and assumptions were used:
Actuarial valuation method Entry age normal method Amortization method Level dollar open over 30 years Discount rate 4.00% Health care cost trend rate 8% graded down uniformly to 5% for 2015 and beyond Mortality RP-2000 Combined Mortality Table Retirement rates Varying rates beginning with 5% at age 50 to 100% retirement at age 65
On April 22, 2009, the Board of Commissioners approved MNAA Resolution 2009-07 establishing an investment trust for the purpose of funding OPEB as provided in Tennessee Code Annotated, Title 8, Chapter 50, Part 12. The Tennessee State Funding Board approved the formation of the trust on June 17, 2009. There is no obligation to fund the trust, and management is currently working to develop a plan whereby cash contributions would be made to help offset the anticipated increased outflows in future years to cover retiree benefits. Contributions totaling $1,000,000 were made to the trust during fiscal year 2011.
See further information in the OPEB Plan Schedule of Funding Progress (unaudited) in the required supplementary information section.
Under the Metropolitan Government’s PERS, the Authority pays 75% of the cost of medical and dental coverage, while the retirees pay the remaining 25%. The Authority also pays 100% of the premium cost of a $10,000 life insurance policy on each retiree. As of June 30, 2011 and 2010, 16 retirees are receiving benefits under the PERS. During the years ended June 30, 2011 and 2010, payments of $58,890 and $53,121, respectively, were made to the Metropolitan Government for postemployment benefits under this PERS.

Metropolitan Nashville Airport Authority | Comprehensive Annual Financial Report 54
NOTES TO FINANCIAL STATEMENTS AS OF AND FOR ThE YEARS ENDED JUNE 30, 2011 AND 2010
17. DEFERRED COMPENSATION PLAN
The Authority offers its employees a deferred compensation plan created in accordance with Internal Revenue Code Section 457. The plan, available to all Authority employees, permits the deferral of a portion of salary until future years. Participation in the plan is optional. The deferred compensation is not available to employees until termination, retirement, death or unforeseeable emergency. The assets of the plan are held in custodial and annuity accounts for the exclusive benefit of plan participants, and accordingly, the related assets of the plan are not reflected on the Authority’s statement of net assets. Beginning January 1, 2001, the Authority’s matching contributions have been made to a deferred compensation plan created in accordance with Internal Revenue Code Section 401(a). Amounts contributed by the Authority to the deferred compensation plan were $705,786 and $690,595 in 2011 and 2010, respectively.
18. LAND LEASES AND LAND OPTIONS
The Authority leases, or has entered into options to lease, several tracts of land to developers. The leases expire in 2058. In accordance with the terms of the lease agreements, the Authority received advance rental payments totaling $2,533,613. This amount is being amortized into income over the terms of the leases. The unamortized amount was $1,631,960 and $1,666,864 at June 30, 2011 and 2010, respectively, and is included as deferred rental income in the statements of net assets. The buildings and any other improvements constructed on the land become the property of the Authority upon the expiration or termination of the leases.
19. MAJOR CUSTOMERS
The largest airline serving Nashville International Airport accounted for approximately 55.4% and 53.5% of the total enplanements of 4,724,974 and 4,487,336 in fiscal years 2011 and 2010, respectively.
20. INFORMATION ON AUThORITY OPERATINg RESULTS BY ENTITY Operating income (loss) consists of revenues from operations less operating expenses and depreciation. Nonoperating items such as interest income, passenger facility charges, customer facility charges and interest expense are not considered in determining operating income (loss). The details of operating income (loss) by entity are as follows:
Nashville MNAA International John C. tune properties Airport Airport Corporation totalYear Ended June 30, 2011
Operating revenues $ 86,748,691 $ 711,345 $ 1,981,541 $ 89,441,577Operating expenses 60,220,829 434,279 1,639,661 62,294,769 Provision for depreciation 27,898,289 1,110,759 670,522 29,679,570 Operating loss $ (1,370,427) $ (833,693) $ (328,642) $ (2,532,762)
Nashville MNAA International John C. tune properties Airport Airport Corporation total Year Ended June 30, 2010
Operating revenues $ 78,854,618 $ 701,045 $ 2,128,766 $ 81,684,429Operating expenses 55,613,944 512,889 1,348,646 57,475,479Provision for depreciation 24,197,799 1,054,240 630,947 25,882,986
Operating (loss) income $ (957,125) $ (866,084) $ 149,173 $ (1,674,036)
The activity of MPC CONRAC LLC, is included with Nashville International Airport above as it is integrated with the Airport for operational purposes.
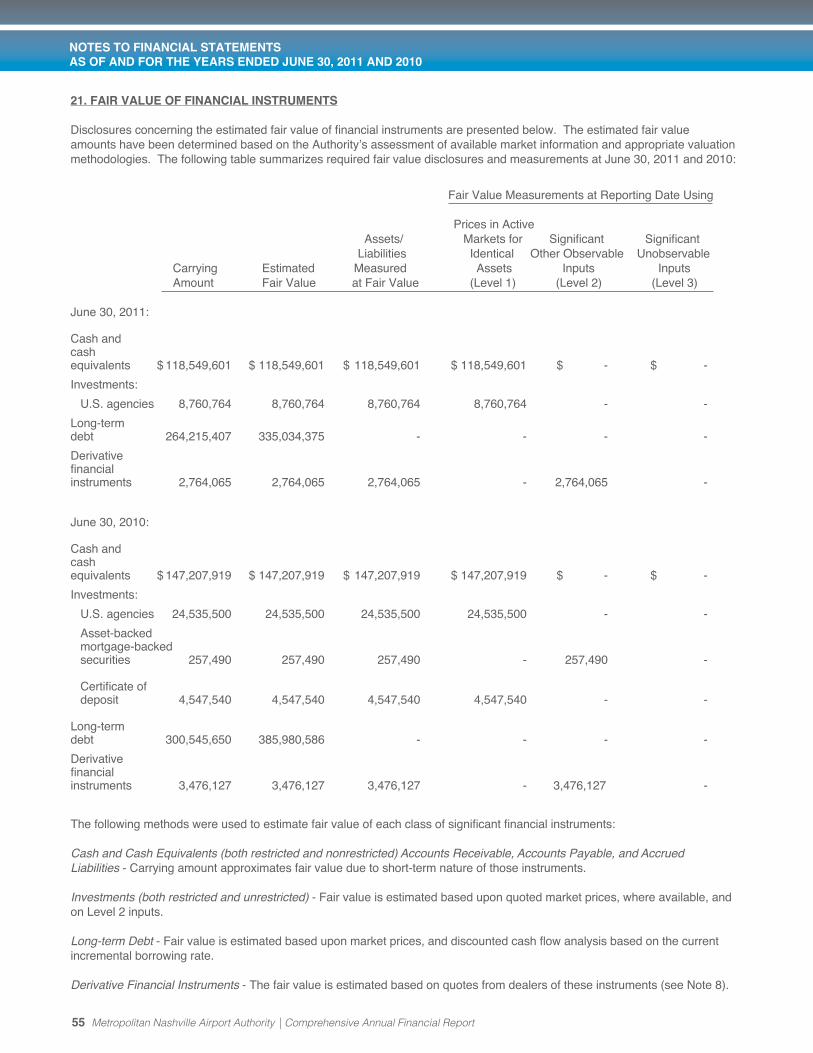
NOTES TO FINANCIAL STATEMENTS AS OF AND FOR ThE YEARS ENDED JUNE 30, 2011 AND 2010
55 Metropolitan Nashville Airport Authority | Comprehensive Annual Financial Report
21. FAIR vALUE OF FINANCIAL INSTRUMENTS
Disclosures concerning the estimated fair value of financial instruments are presented below. The estimated fair value amounts have been determined based on the Authority’s assessment of available market information and appropriate valuation methodologies. The following table summarizes required fair value disclosures and measurements at June 30, 2011 and 2010:
Fair Value Measurements at Reporting Date Using
Prices in Active Assets/ Markets for Significant Significant Liabilities Identical Other Observable Unobservable Carrying Estimated Measured Assets Inputs Inputs Amount Fair Value at Fair Value (Level 1) (Level 2) (Level 3)
June 30, 2011:
Cash andcashequivalents $ 118,549,601 $ 118,549,601 $ 118,549,601 $ 118,549,601 $ - $ -
Investments:
U.S. agencies 8,760,764 8,760,764 8,760,764 8,760,764 - -
Long-termdebt 264,215,407 335,034,375 - - - -
Derivative financialinstruments 2,764,065 2,764,065 2,764,065 - 2,764,065 -
June 30, 2010:
Cash andcashequivalents $ 147,207,919 $ 147,207,919 $ 147,207,919 $ 147,207,919 $ - $ -
Investments:
U.S. agencies 24,535,500 24,535,500 24,535,500 24,535,500 - -
Asset-backed mortgage-backed securities 257,490 257,490 257,490 - 257,490 -
Certificate of deposit 4,547,540 4,547,540 4,547,540 4,547,540 - -
Long-termdebt 300,545,650 385,980,586 - - - -
Derivative financialinstruments 3,476,127 3,476,127 3,476,127 - 3,476,127 -
The following methods were used to estimate fair value of each class of significant financial instruments:
Cash and Cash Equivalents (both restricted and nonrestricted) Accounts Receivable, Accounts Payable, and Accrued Liabilities - Carrying amount approximates fair value due to short-term nature of those instruments.
Investments (both restricted and unrestricted) - Fair value is estimated based upon quoted market prices, where available, and on Level 2 inputs.
Long-term Debt - Fair value is estimated based upon market prices, and discounted cash flow analysis based on the current incremental borrowing rate.
Derivative Financial Instruments - The fair value is estimated based on quotes from dealers of these instruments (see Note 8).

NOTES TO FINANCIAL STATEMENTS AS OF AND FOR ThE YEARS ENDED JUNE 30, 2011 AND 2010
Metropolitan Nashville Airport Authority | Comprehensive Annual Financial Report 56
The fair value estimates presented herein are based on pertinent information available to management as of June 30, 2011 and 2010. Although management is not aware of any factors that would significantly affect the estimated fair value amounts, such amounts have not been comprehensively revalued for purposes of the financial statements since that date, and current estimates of fair value may differ significantly from the amounts presented herein.
22. SUBSEQUENT EvENTS
The Authority has evaluated subsequent events through October 20, 2011, the date the financial statements were available for issuance, and has determined that there are no subsequent events that require disclosure.
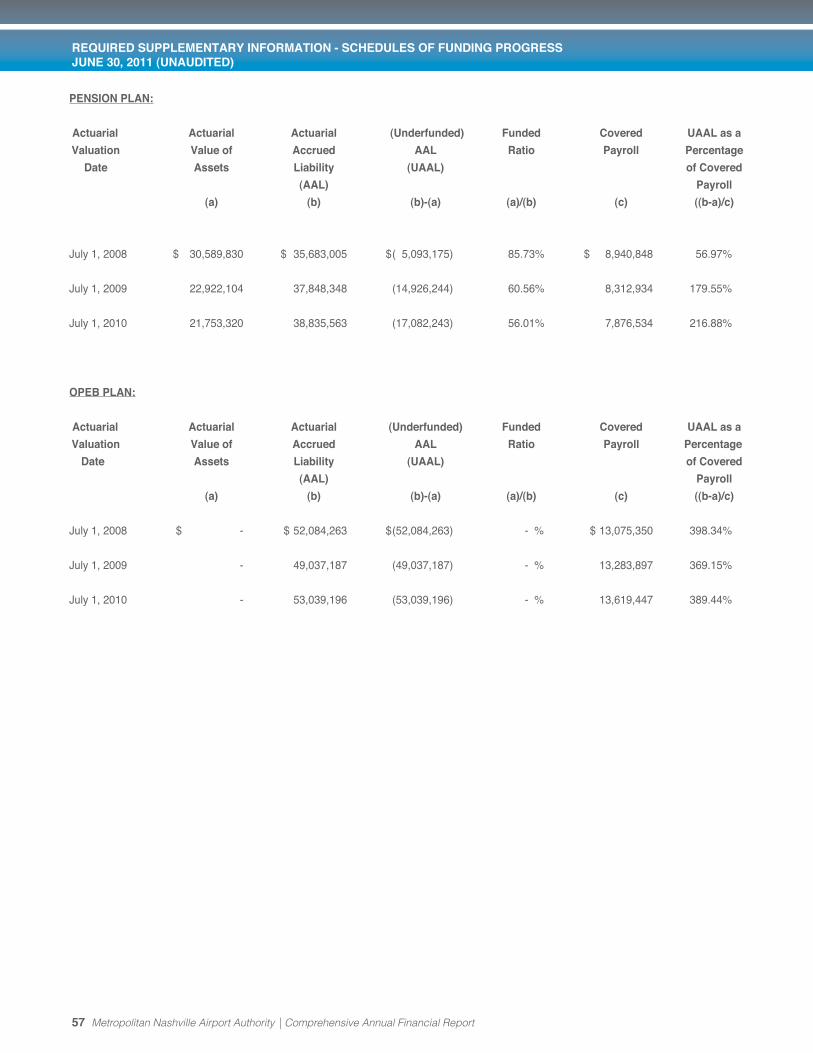
57 Metropolitan Nashville Airport Authority | Comprehensive Annual Financial Report
PENSION PLAN:
Actuarial Actuarial Actuarial (Underfunded) Funded Covered UAAL as a
valuation value of Accrued AAL Ratio Payroll Percentage
Date Assets Liability (UAAL) of Covered
(AAL) Payroll
(a) (b) (b)-(a) (a)/(b) (c) ((b-a)/c)
July 1, 2008 $ 30,589,830 $ 35,683,005 $ ( 5,093,175) 85.73% $ 8,940,848 56.97%
July 1, 2009 22,922,104 37,848,348 (14,926,244) 60.56% 8,312,934 179.55%
July 1, 2010 21,753,320 38,835,563 (17,082,243) 56.01% 7,876,534 216.88%
OPEB PLAN:
Actuarial Actuarial Actuarial (Underfunded) Funded Covered UAAL as a
valuation value of Accrued AAL Ratio Payroll Percentage
Date Assets Liability (UAAL) of Covered
(AAL) Payroll
(a) (b) (b)-(a) (a)/(b) (c) ((b-a)/c)
July 1, 2008 $ - $ 52,084,263 $ (52,084,263) - % $ 13,075,350 398.34%
July 1, 2009 - 49,037,187 (49,037,187) - % 13,283,897 369.15%
July 1, 2010 - 53,039,196 (53,039,196) - % 13,619,447 389.44%
REQUIRED SUPPLEMENTARY INFORMATION - SChEDULES OF FUNDINg PROgRESS JUNE 30, 2011 (UNAUDITED)

Metropolitan Nashville Airport Authority | Comprehensive Annual Financial Report
Supplementary Information
Metropolitan Nashville Airport Authority | Comprehensive Annual Financial Report
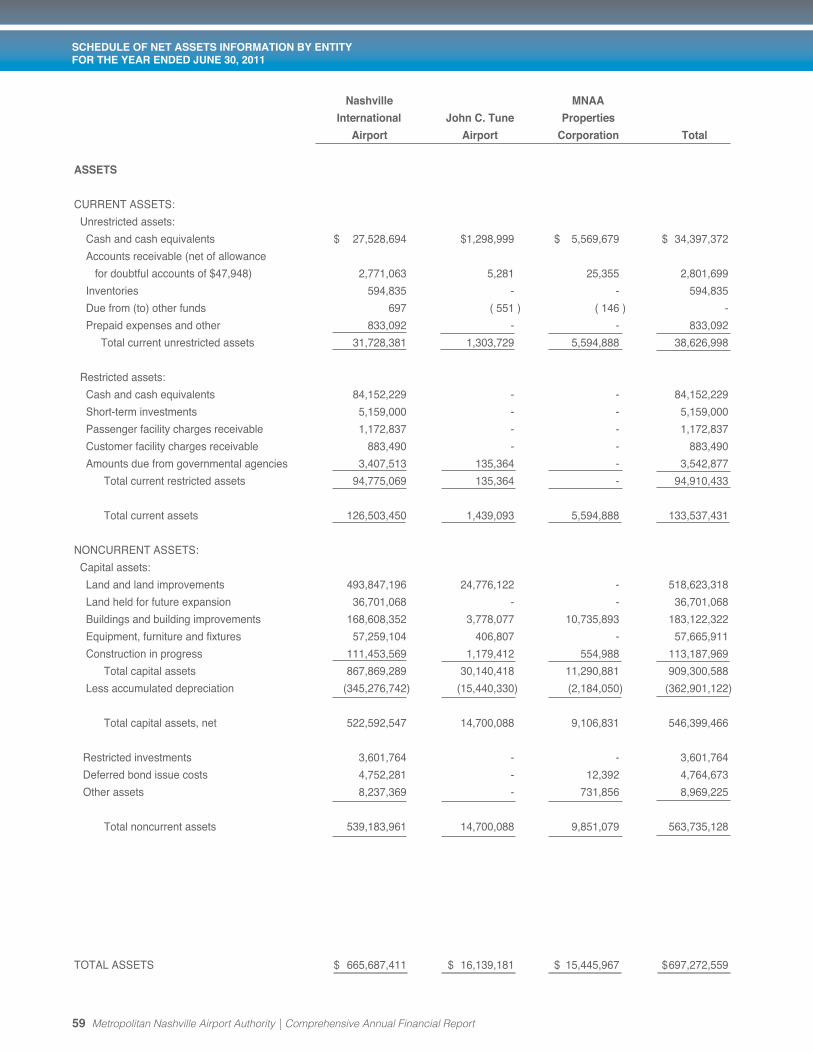
59 Metropolitan Nashville Airport Authority | Comprehensive Annual Financial Report
SChEDULE OF NET ASSETS INFORMATION BY ENTITY FOR ThE YEAR ENDED JUNE 30, 2011
Nashville MNAA
International John C. tune properties
Airport Airport Corporation total
ASSETS
CURRENT ASSETS:
Unrestricted assets:
Cash and cash equivalents $ 27,528,694 $1,298,999 $ 5,569,679 $ 34,397,372
Accounts receivable (net of allowance
for doubtful accounts of $47,948) 2,771,063 5,281 25,355 2,801,699
Inventories 594,835 - - 594,835
Due from (to) other funds 697 ( 551 ) ( 146 ) -
Prepaid expenses and other 833,092 - - 833,092
Total current unrestricted assets 31,728,381 1,303,729 5,594,888 38,626,998
Restricted assets:
Cash and cash equivalents 84,152,229 - - 84,152,229
Short-term investments 5,159,000 - - 5,159,000
Passenger facility charges receivable 1,172,837 - - 1,172,837
Customer facility charges receivable 883,490 - - 883,490
Amounts due from governmental agencies 3,407,513 135,364 - 3,542,877
Total current restricted assets 94,775,069 135,364 - 94,910,433
Total current assets 126,503,450 1,439,093 5,594,888 133,537,431
NONCURRENT ASSETS:
Capital assets:
Land and land improvements 493,847,196 24,776,122 - 518,623,318
Land held for future expansion 36,701,068 - - 36,701,068
Buildings and building improvements 168,608,352 3,778,077 10,735,893 183,122,322
Equipment, furniture and fixtures 57,259,104 406,807 - 57,665,911
Construction in progress 111,453,569 1,179,412 554,988 113,187,969
Total capital assets 867,869,289 30,140,418 11,290,881 909,300,588
Less accumulated depreciation (345,276,742) (15,440,330) (2,184,050) (362,901,122)
Total capital assets, net 522,592,547 14,700,088 9,106,831 546,399,466
Restricted investments 3,601,764 - - 3,601,764
Deferred bond issue costs 4,752,281 - 12,392 4,764,673
Other assets 8,237,369 - 731,856 8,969,225
Total noncurrent assets 539,183,961 14,700,088 9,851,079 563,735,128
TOTAL ASSETS $ 665,687,411 $ 16,139,181 $ 15,445,967 $ 697,272,559

Metropolitan Nashville Airport Authority | Comprehensive Annual Financial Report 60
SChEDULE OF NET ASSETS INFORMATION BY ENTITY FOR ThE YEAR ENDED JUNE 30, 2011
Nashville MNAA
International John C. tune properties
Airport Airport Corporation total
LIABILITIES AND NET ASSETS
CURRENT LIABILITIES:
Payable from unrestricted assets:
Trade accounts payable $ 6,645,073 $ 93,821 $ 154,850 $ 6,893,744
Accrued payroll and related items 3,130,022 7,269 - 3,137,291
Current maturities of notes payable - - 448,004 448,000
Total payable from unrestricted assets 9,775,095 101,090 602,850 10,479,035
Payable from restricted assets:
Trade accounts payable 6,043,191 - - 6,043,191
Accrued interest payable 5,387,816 - - 5,387,816
Current maturities of airport revenue bonds 27,815,000 - - 27,815,000
Total payable from restricted assets 39,246,007 - - 39,246,007
Total current liabilities 49,021,102 101,090 602,850 49,725,042
NONCURRENT LIABILITIES:
Airport revenue bonds (net of unamortized
deferred amount on refunding of $6,608,155) 229,023,078 - - 229,023,078
Notes payable, less current maturities - - 6,929,329 6,929,329
Fair value of derivative financial instruments 2,319,810 - 444,255 2,764,065
Deferred interest income 1,179,828 - - 1,179,828
Deferred rental income 1,850,552 20,051 49,363 1,919,966
Other postemployment benefit obligation 16,790,524 - - 16,790,524
Total noncurrent liabilities 251,163,792 20,051 7,422,947 258,606,790
Total liabilities 300,184,894 121,141 8,025,797 308,331,832
COMMITMENTS AND CONTINGENCIES - - - -
NET ASSETS:
Invested in capital assets-net of related debt 293,324,066 14,700,088 1,741,891 309,766,045
Restricted:
Passenger facility charge projects and debt service 20,471,601 - - 20,471,601
Customer facility charge projects and debt service 23,105,902 - - 23,105,902
Debt service and other 30,061,244 - - 30,061,244
Total restricted net assets 73,638,747 - - 73,638,747
Unrestricted net assets ( 1,460,296 ) 1,317,952 5,678,279 5,535,935
Total net assets 365,502,517 16,018,040 7,420,170 388,940,727
TOTAL LIABILITIES AND NET ASSETS $ 665,687,411 $ 16,139,181 $ 15,445,967 $ 697,272,559
See independent auditors’ report.

61 Metropolitan Nashville Airport Authority | Comprehensive Annual Financial Report
This page intentionally left blank.

Nashville MNAA
International John C. tune properties
Airport Airport Corporation total
OPERATING REVENUES:
Signatory airline $ 25,305,820 $ - $ - $ 25,305,820
Parking 29,743,911 - - 29,743,911
Concession 16,609,629 - - 16,609,629
Space rental 7,191,170 666,157 1,946,834 9,804,161
Other 7,898,161 45,188 34,707 7,978,056
86,748,691 711,345 1,981,541 89,441,577
OPERATING EXPENSES:
Salaries and wages 28,351,560 218,486 - 28,570,046
Contractual services 20,826,552 115,996 908,472 21,851,020
Materials and supplies 2,785,678 47,510 42,413 2,875,601
Utilities 5,860,345 31,655 425,661 6,317,661
Other 2,396,694 20,632 263,115 2,680,441
60,220,829 434,279 1,639,661 62,294,769
OPERATING INCOME BEFORE PROVISION
FOR DEPRECIATION 26,527,862 277,066 341,880 27,146,808
PROVISION FOR DEPRECIATION 27,898,289 1,110,759 670,522 29,679,570
OPERATING LOSS ( 1,370,427 ) ( 833,693 ) ( 328,642 ) ( 2,532,762 )
NONOPERATING REVENUES (EXPENSES):
Investment income 340,254 1,629 733 342,616
Passenger facility charges 13,300,248 - - 13,300,248
Customer facility charges 9,074,716 - - 9,074,716
Interest expense ( 11,286,015 ) - ( 431,405 ) ( 11,717,420 )
Gain on disposal of property and equipment 426,224 - - 426,224
Gain on derivative financial instruments 483,625 - 228,437 712,062
Other nonoperating, net 1,874,664 - - 1,874,664
14,213,716 1,629 ( 202,235 ) 14,013,110
INCOME (LOSS) BEFORE CAPITAL
CONTRIBUTIONS 12,843,289 ( 832,064 ) ( 530,877 ) 11,480,348
CAPITAL CONTRIBUTIONS 14,723,264 2,137,962 - 16,861,226
INCREASE (DECREASE) IN NET ASSETS 27,566,553 1,305,898 ( 530,877 ) 28,341,574
TOTAL NET ASSETS - BEGINNING OF YEAR 337,935,964 14,712,142 7,951,047 360,599,153
TOTAL NET ASSETS - END OF YEAR $ 365,502,517 $16,018,040 $ 7,420,170 $ 388,940,727
See independent auditors’ report.
Metropolitan Nashville Airport Authority | Comprehensive Annual Financial Report 62
SChEDULE OF REvENUES, ExPENSES AND ChANgES IN NET ASSETS INFORMATION BY ENTITY FOR ThE YEAR ENDED JUNE 30, 2011

Year Ending Series 2003 PFC Series 2003B Series 2008A Series 2009A Series 2010A
June 30, Revenue Bonds Revenue Bonds Revenue Bonds Revenue Bonds Revenue Bonds
Principal Interest Principal Interest Principal Interest Principal Interest Principal Interest
2012 $ 3,825,000 $ 30,939 $ - $ 964,842 $ 6,700,000 $ 565,740 $ 1,200,000 $ 1,469,488 $ 3,295,000 $ 1,025,937
2013 3,925,000 - 1,145,000 945,459 100,000 561,250 3,320,000 1,379,088 3,365,000 909,212
2014 - - 420,000 924,977 100,000 556,760 3,455,000 1,260,863 3,335,000 775,212
2015 - - 445,000 903,043 200,000 547,780 3,555,000 1,129,050 3,435,000 626,931
2016 - - 465,000 879,515 200,000 538,800 3,715,000 977,656 3,560,000 460,800
2017 - - 490,000 853,928 1,200,000 484,920 3,860,000 825,394 3,690,000 284,000
2018 - - 515,000 826,340 3,400,000 332,260 4,020,000 661,625 3,835,000 95,875
2019 - - 545,000 797,243 3,600,000 170,620 4,190,000 487,056 - -
2020 - - 575,000 765,551 3,800,000 - 7,970,000 197,700 - -
2021 - - 610,000 731,067 - - - - - -
2022 - - 645,000 694,547 - - - - - -
2023 - - 680,000 655,989 - - - - - -
2024 - - 720,000 615,249 - - - - - -
2025 - - 760,000 571,725 - - - - - -
2026 - - 805,000 525,245 - - - - - -
2027 - - 855,000 475,943 - - - - - -
2028 - - 905,000 423,671 - - - - - -
2029 - - 960,000 368,280 - - - - - -
2030 - - 1,015,000 309,623 - - - - - -
2031 - - 1,075,000 247,550 - - - - - -
2032 - - 1,140,000 181,764 - - - - - -
2033 - - 1,210,000 111,969 - - - - - -
2034 - - 1,280,000 38,016 - - - - - -
Totals 7,750,000 30,939 17,260,000 13,811,536 19,300,000 3,758,130 35,285,000 8,387,920 24,515,000 4,177,967
Bond Premium - - - - - - 144,455 - 1,531,118 -
Loss on Refunding - - - - (1,544,778) - - - (769,830) -
$ 7,750,000 $ 30,939 $ 17,260,000 $ 13,811,536 $ 17,755,222 $ 3,758,130 $ 35,429,455 $ 8,387,920 $ 25,276,288 $ 4,177,967
SChEDULE OF AIRPORT REvENUE BONDS, PRINCIPAL AND INTEREST REQUIREMENTS BY FISCAL YEAR JUNE 30, 2011
63 Metropolitan Nashville Airport Authority | Comprehensive Annual Financial Report

Metropolitan Nashville Airport Authority | Comprehensive Annual Financial Report 64
SChEDULE OF AIRPORT REvENUE BONDS, PRINCIPAL AND INTEREST REQUIREMENTS BY FISCAL YEAR JUNE 30, 2011
Series 2010B Series 2010C CONRAC Series 2010
Revenue Bonds Revenue Bonds Revenue Bonds Total Debt Service
Principal Interest Principal Interest Principal Interest Principal Interest Total
$ 9,990,000 $2,427,600 $ 2,805,000 $ 527,175 $ - $ 3,921,170 $ 27,815,000 $10,932,891 $ 38,747,891
13,865,000 2,069,775 3,210,000 436,950 1,580,000 3,903,419 30,510,000 10,205,153 40,715,153
14,580,000 1,570,200 3,010,000 328,600 1,745,000 3,858,010 26,645,000 9,274,622 35,919,622
15,490,000 968,800 2,805,000 212,300 1,905,000 3,794,843 27,835,000 8,182,747 36,017,747
16,475,000 329,500 2,600,000 104,200 2,090,000 3,716,196 29,105,000 7,006,667 36,111,667
- - 1,740,000 26,100 2,285,000 3,622,034 13,265,000 6,096,376 19,361,376
- - - - 2,480,000 3,511,292 14,250,000 5,427,392 19,677,392
- - - - 2,695,000 3,382,352 11,030,000 4,837,271 15,867,271
- - - - 2,840,000 3,236,635 15,185,000 4,199,886 19,384,886
- - - - 3,000,000 3,077,085 3,610,000 3,808,152 7,418,152
- - - - 3,175,000 2,902,161 3,820,000 3,596,708 7,416,708
- - - - 3,365,000 2,710,402 4,045,000 3,366,391 7,411,391
- - - - 3,575,000 2,501,707 4,295,000 3,116,956 7,411,956
- - - - 3,800,000 2,275,349 4,560,000 2,847,074 7,407,074
- - - - 4,055,000 2,020,068 4,860,000 2,545,313 7,405,313
- - - - 4,340,000 1,734,932 5,195,000 2,210,875 7,405,875
- - - - 4,645,000 1,429,757 5,550,000 1,853,428 7,403,428
- - - - 4,970,000 1,103,184 5,930,000 1,471,464 7,401,464
- - - - 13,755,000 467,189 14,770,000 776,812 15,546,812
- - - - - - 1,075,000 247,550 1,322,550
- - - - - - 1,140,000 181,764 1,321,764
- - - - - - 1,210,000 111,969 1,321,969
- - - - - - 1,280,000 38,016 1,318,016
70,400,000 7,365,875 16,170,000 1,635,325 66,300,000 53,167,785 256,980,000 92,335,477 349,315,477
4,191,838 - 598,822 - - - 6,466,233 - 6,466,233
(3,901,135) - (392,412) - - - (6,608,155) - (6,608,155)
$70,690,703 $7,365,875 $16,376,410 $1,635,325 $66,300,000 $53,167,785 $256,838,078 $92,335,477 $349,173,555
Note 1: This schedule intends to present the cash outflow requirements for payment of principal and interest on the Authority’s bonds. Payment of principal on bonds is made annually on July 1. Payment of interest on fixed rate bonds is made semiannually on July 1 and January 1. Payment of interest on variable rate bonds is generally made monthly.
See independent auditors’ report.


Statistical Section
Metropolitan Nashville Airport Authority | Comprehensive Annual Financial Report
Statistical information differs from financial statements because it usually covers more than one fiscal year and may present
nonaccounting data. Available financial trend data is presented to assist the reader in understanding the Authority’s primary business activities and to identify emerging financial trends. Operational data
further supports this. The residual lease agreement with eight signatory airlines dictates their responsibility to cover any revenue shortfall in
the form of rates and charges. Therefore, special attention is placed on operating revenues, operating expenses and related indicators. Readers are interested in the Authority’s debt burden as it provides
some insight as to the ability of the Authority to finance major capital projects such as runways, taxiways and terminal improvements in the
future. Finally, demographic, economic and operating information is presented to further explain the interrelationship of key indicators in
Middle Tennessee with the activities of the Authority.
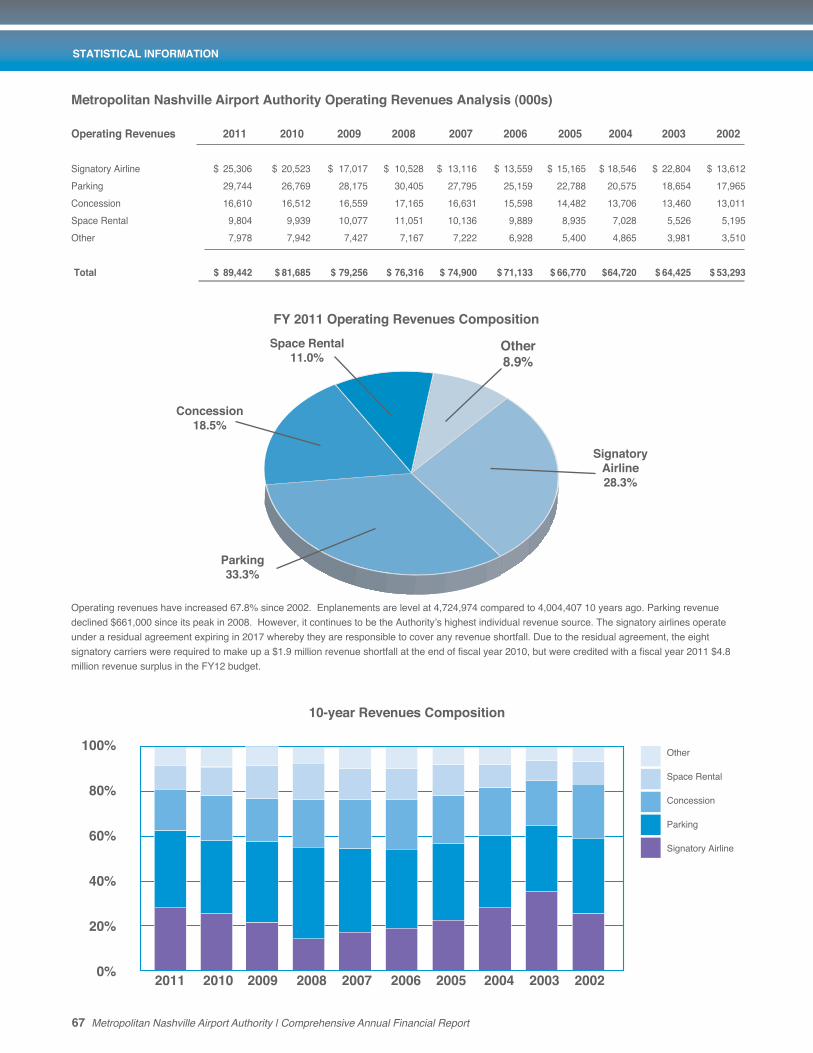
Metropolitan nashville Airport Authority Operating Revenues Analysis (000s)
Operating Revenues 2011 2010 2009 2008 2007 2006 2005 2004 2003 2002
Signatory Airline $ 25,306 $ 20,523 $ 17,017 $ 10,528 $ 13,116 $ 13,559 $ 15,165 $ 18,546 $ 22,804 $ 13,612
Parking 29,744 26,769 28,175 30,405 27,795 25,159 22,788 20,575 18,654 17,965
Concession 16,610 16,512 16,559 17,165 16,631 15,598 14,482 13,706 13,460 13,011
Space Rental 9,804 9,939 10,077 11,051 10,136 9,889 8,935 7,028 5,526 5,195
Other 7,978 7,942 7,427 7,167 7,222 6,928 5,400 4,865 3,981 3,510
total $ 89,442 $ 81,685 $ 79,256 $ 76,316 $ 74,900 $ 71,133 $ 66,770 $ 64,720 $ 64,425 $ 53,293
Operating revenues have increased 67.8% since 2002. Enplanements are level at 4,724,974 compared to 4,004,407 10 years ago. Parking revenue declined $661,000 since its peak in 2008. However, it continues to be the Authority’s highest individual revenue source. The signatory airlines operate under a residual agreement expiring in 2017 whereby they are responsible to cover any revenue shortfall. Due to the residual agreement, the eight signatory carriers were required to make up a $1.9 million revenue shortfall at the end of fiscal year 2010, but were credited with a fiscal year 2011 $4.8 million revenue surplus in the FY12 budget.
STATISTICAL INFORMATION
67 Metropolitan Nashville Airport Authority | Comprehensive Annual Financial Report
10-year Revenues Composition
100%
80%
60%
40%
20%
0%2011 2010 2009 2008 2007 2006 2005 2004 2003 2002
Other
Space Rental
Concession
Parking
Signatory Airline
Fy 2011 Operating Revenues Composition
Parking33.3%
Other8.9%
Signatory Airline28.3%
space Rental11.0%
Concession18.5%

2011 2010 2009 2008 2007 2006 2005 2004 2003 2002
$20.00$18.00$16.00$14.00$12.00$10.00
$8.00$6.00$4.00$2.00
$0
Metropolitan Nashville Airport Authority | Comprehensive Annual Financial Report 68
nashville International Airport - Cost per Enplaned passenger (CpEp) (000s)
2011 2010 2009 2008 2007 2006 2005 2004 2003 2002
Signatory Airlines:
Space and Ramp Fees $ 14,874 $ 13,470 $ 13,358 $ 9,293 $ 11,504 $ 12,838 $ 13,498 $ 14,655 $ 15,514 $ 11,204
Landing Fees 10,432 7,053 3,660 1,235 1,612 721 1,667 3,891 7,290 2,408
Total Signatory Revenue 25,306 20,523 17,018 10,528 13,116 13,559 15,165 18,546 22,804 13,612
Signatory Enplaned (000) 4,278 3,788 3,820 4,195 4,247 3,874 3,716 3,622 3,532 3,699
Cost per Signatory Enplaned $ 5.92 $ 5.42 $ 4.45 $ 2.51 $ 3.09 $ 3.50 $ 4.08 $ 5.12 $ 6.46 3.68
Non-signatory Airlines:
Space and Ramp Fees $ 944 $ 1,245 $ 649 $ 2,081 $ 3,027 $ 3,520 $ 2,652 $ 604 $ 10 $ 24
Landing Fees 2,751 2,731 2,486 2,748 3,216 3,068 2,362 2,148 1,263 1,097
Total Non-signatory Revenue 3,695 3,976 3,135 4,829 6,243 6,588 5,014 2,752 1,273 1,121
Non-signatory Enplaned (000) 447 699 639 683 692 861 720 543 465 298
Cost per Non-signatory Enplaned $ 8.27 $ 5.69 $ 4.91 $ 7.07 $ 9.02 $ 7.65 $ 6.96 $ 5.07 $ 2.74 $ 3.76
Summary Analysis:
Total Signatory & Non-signatory Revenue $ 29,001 $ 24,499 $ 20,153 $ 15,357 $ 19,359 $ 20,147 $ 20,179 $ 21,298 $ 24,077 $ 14,733
Blended Cost per Enplaned $ 6.14 $ 5.46 $ 4.52 $3.15 $ 3.92 $ 4.25 $ 4.55 $ 5.11 $ 6.02 $ 3.68
Operating Revenues (BNA only) $ 86,749 $ 78,855 $ 77,431 $ 74,041 $ 74,541 $ 70,512 $ 66,351 $ 64,306 $ 64,011 $ 52,897
Total Enplaned (includes charters) 4,725 4,487 4,461 4,880 4,938 4,736 4,438 4,167 3,998 4,004
Operating Revenues per Enplaned $ 18.36 $ 17.57 $ 17.36 $ 15.17 $ 15.10 $ 14.89 $ 14.95 $ 15.43 $ 16.01 $ 13.21
Enplanement (EpAX) Revenues Analysis
Operating Revenues per EPAX
Non-signatory CPEP
Signatory CPEP
CPEP
STATISTICAL INFORMATION

STATISTICAL INFORMATION
69 Metropolitan Nashville Airport Authority | Comprehensive Annual Financial Report
Parking lot revenue (000) $ 29,744 $ 26,769 $ 28,175 $ 30,405 $ 27,795 $ 25,159 $ 22,788 $ 20,575 $ 18,654 $ 17,965
Spaces available (actual) 10,605 10,189 12,830 11,675 11,675 11,216 11,216 11,216 11,216 11,112
Revenue per space $ 2,805 $ 2,627 $ 2,196 $ 2,604 $ 2,381 $ 2,243 $ 2,032 $ 1,834 $ 1,663 $ 1,617
Fiscal year 2009 began with Short Term-1,706, Long Term A-3,883, Long Term B-2,129, Economy-3,957 and Valet-1,155 spaces - all for public use. During 2009 valet services were moved from various areas in and around the short term garage to a dedicated lot north of the terminal building. In fiscal year 2010, Long Term A was reduced in size to 1,517 spaces for CONRAC construction staging and footprint. At June 30, 2010, public parking spaces included Short Term-1,706, Long Term A-1,517, Long Term B-2,124, Economy-3,690 and Valet-1,152. After the CONRAC facility is completed in November 2011, there will be 2,066 long term parking spaces within walking distance of the terminal. The TARI roadway project was completed in October 2009, and the new 50-space complimentary cellphone lot opened shortly thereafter. Over $3.9 million of parking revenue was attributable to valet parking services in FY10 for this 1,152-space lot near the terminal building. For FY2011, the available spaces were as follows: Short Term-1,706, Long Term A-1,959, Long Term B-2,129, Economy-3,660, Valet-1,151.
Metropolitan nashville Airport Authority Operating Revenues Analysis - Activity Detail (000s)Signatory and Non-signatory rate history effective July 1 of each year.
2011 2010 2009 2008 2007 2006 2005 2004 2003 2002Signatory Rates
Landing fee $ 2.05 $ 1.26 $ 0.30 $ 0.19 $ 0.29 $ 0.12 $ 0.29 $ 0.17 $ 1.19 $ 0.38
Ramp 101.26 114.62 62.36 71.20 95.80 104.97 114.40 114.33 118.20 95.51
Main terminal 93.16 89.12 50.03 63.24 81.91 90.08 90.91 88.34 91.34 64.02
North concourse 41.29 42.31 20.61 29.82 39.04 43.64 45.59 43.49 44.85 33.89
South concourse 41.12 41.33 21.61 22.24 25.45 24.87 26.87 27.47 27.90 19.33
The signatory FY04 rates were effective for the last half of the year and changed from rates similar to those published for FY03. The signatory FY09 rates are the original rates. The $7.265 million year-end true-up was charged to landing fees and main terminal rents. The signatory FY10 rates effective July 1, 2009, were $0.90 (LF), $97.44 (R), $75.76 (MT), $35.97 (NC) and $35.14 (SC). Those of January 1, 2010, are reflected above, as well as a non-signatory landing fees adjustment (was $3.52 on July 1, 2009). The signatory rates effective July 1, 2011, are $2.32 (LF), $84.78 (R), $78.84 (MT), $36.13 (NC) and $37.51 (SC).
Non-signatory Rates
Landing fee $ 5.02 $ 3.96 $ 3.26 $ 3.24 $ 2.91 $ 2.71 $ 2.97 $ 3.01 $ 2.53 $ 2.43
Ramp 301.87 287.29 317.96 304.37 297.52 289.61 293.07 289.95 272.00 262.77
Main terminal 238.37 223.32 195.11 176.79 173.44 155.59 151.81 150.22 141.18 135.15
North concourse 90.13 89.86 88.87 80.67 80.45 77.67 76.78 75.77 76.38 74.39
South concourse 92.73 88.27 84.76 67.48 67.13 64.19 61.43 60.53 60.99 59.22
The non-signatory rates effective July 1, 2011, have been set at $3.92 (LF), $309.47 (R), $245.48 (MT), $88.44 (NC) and $104.64 (SC).
2011 2010 2009 2008 2007 2006 2005 2004 2003 2002
14,000
12,000
10,000
8,000
6,000
4,000
2,000
$3,000
$2,500
$2,000
$1,500
$1,000
$500
$0
Revenue per Space Public Parking Spaces
Spaces Revenue
Public Parking Analysis

Metropolitan Nashville Airport Authority | Comprehensive Annual Financial Report 70
Metropolitan nashville Airport Authority Operating Expenses Analysis (000s)
Operating Expenses 2011 2010 2009 2008 2007 2006 2005 2004 2003 2002
Salaries and wages $ 28,570 $ 28,057 $ 26,340 $ 23,690 $ 20,379 $ 18,657 $ 16,412 $ 16,249 $ 16,301 $ 16,361
Contractual services 21,851 18,681 16,359 16,299 14,430 12,917 12,454 11,424 11,260 10,005
Supplies and materials 2,876 2,363 1,705 2,229 2,437 1,702 1,894 1,565 2,042 1,721
Utilities 6,318 5,910 6,231 5,537 4,409 4,178 3,662 3,427 3,368 3,229
Depreciation 29,680 25,883 25,152 20,425 18,121 17,640 17,546 17,967 17,742 17,608
Other 2,680 2,464 2,442 2,689 2,944 3,295 2,274 2,580 2,639 2,233
total $ 91,975 $ 83,358 $ 78,229 $ 70,869 $ 62,720 $ 58,389 $ 54,242 $ 53,212 $ 53,352 $ 51,157
STATISTICAL INFORMATION
Costs associated with the Authority’s closed pension program and other postemployment benefits (OPEB) continue to increase. The unfunded liability for OPEB increased $4,124,748 in 2011, compared with $5,092,863 in 2010 and $5,043,064 in 2009. Pension costs as a component of Salaries and Wages were $1,665,234 in 2009, $2,809,352 in 2010 and $2,608,858 in 2011. Most of the increase in Contractual Services can be attributed to the new baggage handling system management as well as cleanup from the stormwater contamination.
Fy 2011 Operating Expenses before provision for Depreciation
Utilities10.1%
Other4.3%
ContractualServices
35.1%
Salaries and Wages
45.9%
suppliesand Materials
4.6%
13,000
12,000
11,000
10,000
9,000
8,000
7,000
6,000
5,000 2011 2010 2009 2008 2007 2006 2005 2004 2003 2002
$90,000
$80,000
$70,000
$60,000
$50,000
$40,000
$30,000
$20,000
$10,000
$0
Total Passengers Operating Expenses
Passengers Expenses
total passengers and Operating Expenses (before Depreciation) (000s)

STATISTICAL INFORMATION
71 Metropolitan Nashville Airport Authority | Comprehensive Annual Financial Report
Met
ropo
litan
nas
hvill
e A
irpo
rt A
utho
rity
sch
edul
e of
Cap
ital A
sset
sA
t Jun
e 30
for
Eac
h Y
ear
Pre
sent
ed
20
11
%
2010
2
009
20
08
20
07
200
6
2005
2
004
2
003
2
002
Land
$6
0,51
0,39
7
28.8
%
$60,
994,
397
$6
2,65
9,89
7
$62,
659,
897
$6
2,65
9,89
7
$62,
659,
897
$6
2,65
9,89
7
$62,
633,
055
$6
2,72
5,14
6
$62,
725,
146
Land
held
for f
utur
e ex
pans
ion
36,7
01,0
68
17.4
%
36,7
01,0
68
36,7
01,0
68
36,7
01,0
68
36,7
01,0
68
36,7
01,0
68
36,7
01,0
68
36,7
01,0
68
36,7
01,0
68
36,7
01,0
68
Cons
tructi
on in
pro
gres
s 11
3,18
7,96
9
53.8
%
90,4
28,5
96
32,8
13,8
69
48,4
47,9
56
46,2
76,3
85
29,9
86,1
64
22,3
52,3
19
11,1
20,2
99
9,89
3,30
1
9,85
6,09
5
Tota
l cap
ital a
sset
s not
bein
g de
prec
iated
21
0,39
9,43
4
100.
0%
188,
124,
061
13
2,17
4,83
4
147,
808,
921
14
5,63
7,35
0
129,
347,
129
12
1,71
3,28
4
110,
454,
422
10
9,31
9,51
5
109,
282,
309
La
nd im
prov
emen
ts 45
8,11
2,92
1
65.5
%
444,
599,
608
44
6,34
9,76
7
406,
464,
775
38
7,48
2,24
2
369,
423,
129
37
0,98
1,65
5
369,
854,
122
35
8,10
0,63
5
361,
109,
732
Build
ings a
nd b
uildin
g im
prov
emen
ts 18
3,12
2,32
2
26.2
%
161,
692,
621
17
1,15
0,80
8
156,
272,
307
12
7,25
0,00
1
123,
618,
070
12
6,69
6,86
5
126,
696,
865
12
5,60
9,43
5
119,
946,
469
Equip
men
t, fu
rnitu
re a
nd fix
ture
s 57
,665
,911
8.
3%
51,0
82,5
88
50,4
36,8
87
44,5
28,3
69
31,8
13,6
49
29,1
63,8
87
22,9
72,5
60
21,3
67,6
19
20,9
49,1
81
20,0
40,2
90
To
tal c
apita
l ass
ets b
eing
depr
eciat
ed
698,
901,
154
10
0.0%
65
7,37
4,81
7
667,
937,
462
60
7,26
5,45
1
546,
545,
892
52
2,20
5,80
6
520,
651,
080
51
7,91
8,60
6
504,
659,
251
50
1,09
6,49
1
Less
acc
umula
ted
depr
eciat
ion
(362
,901
,122
) 51
.9%
(3
50,9
30,2
03)
(357
,349
,262
) (3
34,2
46,5
62)
(314
,025
,691
) (2
96,0
27,3
49)
(287
,025
,150
) (2
70,2
91,9
50)
(252
,335
,482
) (2
34,6
09,2
04)
net c
apita
l ass
ets
$546
,399
,466
n/
a $4
94,5
68,6
75
$442
,763
,034
$4
20,8
27,8
10
$378
,157
,551
$3
55,5
24,8
66
$355
,339
,214
$3
58,0
81,0
78
$361
,643
,284
$3
75,7
69,5
96
Rat
ios
of O
utst
andi
ng R
even
ue B
ond
Deb
t as
a P
erce
ntag
e of
Tot
al R
even
ue B
ond
Deb
tA
t Jun
e 30
for
Eac
h Y
ear
Pre
sent
ed
20
11
%
2010
2
009
20
08
20
07
200
6
2005
2
004
2
003
2
002
Serie
s 199
1A R
even
ue B
onds
$-
n/
a $-
$-
$-
$-
$-
$-
$-
$9
,410
,000
$1
2,96
5,00
0 Se
ries 1
991C
Rev
enue
Bon
ds
- n/
a -
- -
- -
- -
- -
Serie
s 199
2 PF
C Re
venu
e Bo
nds
- n/
a -
- -
- -
- -
35,4
65,0
00
38,0
25,0
00
Serie
s 199
3 Re
venu
e Bo
nds
- n/
a -
- -
43,2
00,0
00
48,5
00,0
00
52,0
00,0
00
52,7
00,0
00
53,4
00,0
00
53,5
00,0
00
Serie
s 199
5 Re
venu
e Bo
nds
- n/
a 38
,265
,000
42
,775
,000
46
,875
,000
50
,600
,000
53
,990
,000
57
,070
,000
59
,870
,000
62
,415
,000
64
,730
,000
Se
ries 1
998A
Rev
enue
Bon
ds
- n/
a 4,
330,
000
5,
810,
000
7,
435,
000
9,
185,
000
11
,035
,000
12
,955
,000
14
,930
,000
16
,945
,000
18
,985
,000
Se
ries 1
998B
Rev
enue
Bon
ds
- n/
a -
- -
- -
- -
- -
Serie
s 199
8C R
even
ue B
onds
-
n/a
16,1
90,0
00
18,1
50,0
00
20,0
10,0
00
21,7
70,0
00
23,4
45,0
00
25,0
35,0
00
26,5
50,0
00
27,9
85,0
00
29,3
55,0
00
Serie
s 200
1A R
even
ue B
onds
-
n/a
49,4
75,0
00
56,0
30,0
00
62,1
80,0
00
67,9
45,0
00
73,3
55,0
00
78,4
25,0
00
83,2
00,0
00
87,6
95,0
00
91,9
30,0
00
Serie
s 200
3 PF
C Re
venu
e Bo
nds
7,75
0,00
0
3.0%
11
,485
,000
14
,145
,000
18
,675
,000
22
,145
,000
25
,525
,000
28
,825
,000
32
,020
,000
-
- Se
ries 2
003A
Rev
enue
Bon
ds
- n/
a -
- -
- -
1,50
5,00
0
5,65
0,00
0
- -
Serie
s 200
3B R
even
ue B
onds
17
,260
,000
6.
7%
17,2
60,0
00
17,6
10,0
00
17,9
45,0
00
18,2
70,0
00
18,5
90,0
00
18,9
00,0
00
18,9
00,0
00
- -
Serie
s 200
6 Re
venu
e Bo
nds
- n/
a -
- -
18,2
85,0
00
- -
- -
- Se
ries 2
008A
Rev
enue
Bon
ds
19,3
00,0
00
7.5%
25
,700
,000
31
,800
,000
37
,600
,000
-
- -
- -
- Se
ries 2
008B
Rev
enue
Bon
ds
- n/
a -
27,6
05,0
00
27,6
05,0
00
- -
- -
- -
Serie
s 200
9A R
even
ue B
onds
35
,285
,000
13
.7%
36
,000
,000
36
,000
,000
-
- -
- -
- -
Serie
s 201
0A R
even
ue B
onds
24
,515
,000
9.
5%
25,7
70,0
00
- -
- -
- -
- -
Serie
s 201
0 CO
NRAC
Rev
enue
Bon
ds
66,3
00,0
00
25.8
%
66,3
00,0
00
- -
- -
- -
- -
Serie
s 201
0B R
even
ue B
onds
70
,400
,000
27
.4%
-
- -
- -
- -
- -
Serie
s 201
0C R
even
ue B
onds
16
,170
,000
6.
3%
- -
- -
- -
- -
- To
tal R
even
ue B
onds
25
6,98
0,00
0
100.
0%
290,
775,
000
24
9,92
5,00
0
238,
325,
000
25
1,40
0,00
0
254,
440,
000
27
4,71
5,00
0
293,
820,
000
29
3,31
5,00
0
309,
490,
000
Serie
s 199
9 Su
bord
inate
d No
te
- n/
a -
- -
409,
553
77
1,22
7
771,
227
93
5,77
6
1,09
0,34
0
1,23
5,52
5 Pl
us u
nam
ortiz
ed p
rem
ium
6,46
6,23
3
1,
945,
321
18
0,56
8
- -
- -
- -
- Le
ss u
nam
ortiz
ed d
efer
red
amou
nt o
n re
fund
ing
(6,6
08,1
55)
n/a
(6,5
10,3
95)
(7,6
75,1
77)
(9,4
93,8
71)
(10,
813,
988)
(1
2,63
6,03
6)
(15,
047,
310)
(1
7,65
4,12
5)
(19,
251,
919)
(2
1,69
0,41
7)
net O
utst
andi
ng D
ebt
$256
,838
,078
n/
a $2
86,2
09,9
26
$242
,430
,391
$2
28,8
31,1
29
$240
,995
,565
$2
42,5
75,1
91
$260
,438
,917
$2
77,1
01,6
51
$275
,153
,421
$2
89,0
35,1
08
Enpl
anem
ents
4,
724,
974
4,
487,
336
4,46
0,96
2 4,
880,
360
4,93
8,19
1 4,
735,
910
4,43
8,39
2 4,
166,
820
3,99
7,98
0 4,
004,
407
net O
utst
andi
ng D
ebt p
er E
npla
nem
ent
$54.
36
$6
3.78
$5
4.34
$4
6.89
$4
8.80
$5
1.22
$5
8.68
$6
6.50
$6
8.82
$7
2.18

Metropolitan Nashville Airport Authority | Comprehensive Annual Financial Report 72
STATISTICAL INFORMATION
Met
ropo
litan
nas
hvill
e A
irpo
rt A
utho
rity
Cha
nge
in n
et A
sset
sA
s of
Jun
e 30
for
Eac
h Y
ear
Pre
sent
ed
20
11
201
0
2
009
200
8
2
007
2
006
20
05
2004
2
003
2002
Ope
ratin
g R
even
ues
Sign
ator
y Ai
rline
$2
5,30
5,82
0
$20,
522,
901
$1
7,01
7,71
4
$10,
527,
728
$1
3,11
6,16
9
$13,
559,
361
$1
5,16
4,91
2
$18,
545,
916
$2
2,80
3,48
9
$13,
611,
398
Park
ing
29,7
43,9
11
26,7
68,6
20
28,1
74,7
33
30,4
05,0
23
27,7
94,4
82
25,1
59,4
87
22,7
87,7
40
20,5
75,3
01
18,6
54,4
87
17,9
65,1
80
Con
cess
ion
16,6
09,6
29
16,5
11,9
83
16,5
58,9
35
17,1
64,5
13
16,6
31,3
19
15,5
97,5
29
14,4
81,7
91
13,7
05,7
15
13,4
60,2
63
13,0
11,3
70
Spac
e R
enta
l 9,
804,
161
9,
938,
642
10
,077
,305
11
,050
,944
10
,135
,718
9,
888,
852
8,
935,
551
7,
028,
387
5,
525,
643
5,
195,
128
Oth
er
7,97
8,05
6
7,94
2,28
3
7,42
7,15
3
7,16
7,11
8
7,22
1,90
8
6,92
8,04
8
5,39
9,86
9
4,86
4,67
2
3,98
0,90
5
3,50
9,87
3 to
tal O
pera
ting
Rev
enue
s 89
,441
,577
81
,684
,429
79
,255
,840
76
,315
,326
74
,899
,596
71
,133
,277
66
,769
,863
64
,719
,991
64
,424
,787
53
,292
,949
Ope
ratin
g Ex
pens
esSa
larie
s an
d w
ages
28
,570
,046
28
,057
,407
26
,339
,723
23
,690
,248
20
,379
,376
18
,657
,132
16
,412
,494
16
,248
,675
16
,301
,303
16
,361
,252
C
ontra
ctua
l Ser
vice
s 21
,851
,020
18
,680
,783
16
,358
,604
16
,299
,124
14
,430
,214
12
,916
,582
12
,453
,870
11
,424
,236
11
,259
,823
10
,005
,484
M
ater
ials
and
Sup
plie
s 2,
875,
601
2,
363,
467
1,
704,
622
2,
228,
830
2,
437,
293
1,
702,
182
1,
894,
344
1,
564,
994
2,
042,
158
1,
720,
968
Util
ities
6,
317,
661
5,
909,
708
6,
231,
268
5,
537,
335
4,
408,
582
4,
178,
081
3,
662,
175
3,
426,
793
3,
367,
944
3,
228,
803
Oth
er
2,68
0,44
1
2,46
4,11
4
2,44
1,95
6
2,68
8,65
1
2,94
3,67
8
3,29
4,62
7
2,27
4,07
2
2,57
9,60
8
2,63
9,05
4
2,23
3,03
5
tota
l Ope
ratin
g Ex
pens
es
62,2
94,7
69
57,4
75,4
79
53,0
76,1
73
50,4
44,1
88
44,5
99,1
43
40,7
48,6
04
36,6
96,9
55
35,2
44,3
06
35,6
10,2
82
33,5
49,5
42
prov
isio
n fo
r Dep
reci
atio
n 29
,679
,570
25
,882
,986
25
,151
,547
20
,424
,563
18
,121
,419
17
,640
,198
17
,546
,203
17
,966
,519
17
,741
,820
17
,607
,702
non
oper
atin
g R
even
ues
Inve
stm
ent i
ncom
e 34
2,61
6
781,
719
1,
642,
936
4,
603,
766
4,
931,
594
2,
889,
516
2,
769,
432
1,
053,
385
3,
583,
967
3,
949,
999
Pass
enge
r fac
ility
char
ges
13,3
00,2
48
15,4
94,6
72
11,4
80,1
54
12,8
36,3
44
13,2
37,8
06
12,5
77,9
69
11,6
40,0
65
10,7
90,9
53
10,7
63,8
81
10,6
98,5
03
Cus
tom
er fa
cilit
y ch
arge
s 9,
074,
716
7,
911,
785
7,
648,
876
4,
259,
428
-
- -
- -
- O
ther
non
oper
atin
g re
venu
es
3,01
2,95
0
57,1
43
- 27
,536
25
,393
-
- 43
2,40
5
622,
280
64
9,10
3
tota
l non
oper
atin
g R
even
ues
25,7
30,5
30
24,2
45,3
19
20,7
71,9
66
21,7
27,0
74
18,1
94,7
93
15,4
67,4
85
14,4
09,4
97
12,2
76,7
43
14,9
70,1
28
15,2
97,6
05
non
oper
atin
g Ex
pens
esIn
tere
st e
xpen
se
11,7
17,4
20
15,0
81,5
02
13,8
23,6
96
14,5
04,7
22
14,3
96,5
42
15,6
29,6
37
16,4
16,3
04
16,9
43,3
86
18,5
49,6
33
17,1
64,4
75
Oth
er n
onop
erat
ing
expe
nses
-
7,53
2,50
4
730,
354
1,
690,
402
1,
029,
704
(1
,649
,398
) 93
8,76
2
(3,9
73,3
66)
548,
238
4,
410,
561
tota
l non
oper
atin
g Ex
pens
es
11,7
17,4
20
22,6
14,0
06
14,5
54,0
50
16,1
95,1
24
15,4
26,2
46
13,9
80,2
39
17,3
55,0
66
12,9
70,0
20
19,0
97,8
71
21,5
75,0
36
Cap
ital C
ontr
ibut
ions
16
,861
,226
46
,422
,786
24
,316
,658
22
,299
,530
13
,168
,339
6,
244,
876
6,
970,
112
5,
655,
203
3,
433,
673
3,
131,
916
Incr
ease
in n
et A
sset
s 28
,341
,574
46
,380
,063
31
,562
,694
33
,278
,055
28
,115
,920
20
,476
,597
16
,551
,248
16
,471
,092
10
,378
,615
(1
,009
,810
)
tota
l net
Ass
ets
- End
of y
ear
$388
,940
,727
$3
60,5
99,1
53
$314
,219
,090
$2
82,6
56,3
96
$249
,378
,341
$2
21,2
62,4
21
$200
,785
,824
$1
84,2
34,5
76
$167
,763
,484
$1
57,3
84,8
69

$400,000,000
$350,000,000
$300,000,000
$250,000,000
$200,000,000
$150,000,000
$100,000,000
$50,000,000
$02011 2010 2009 2008 2007 2006 2005 2004 2003 2002
STATISTICAL INFORMATION
73 Metropolitan Nashville Airport Authority | Comprehensive Annual Financial Report
Net Assets as of June 30 for Each of the Years Presented
Unrestricted Net Assets
CFCs
Restricted Debt Service
Restricted PFC Projects
Capital Assets Net of Related Debt
Details Not Available
2011 2010 2009 2008 2007 2006 2005 2004 2003 2002
Net Assets:
Invested in capital assets, net of related debt $309,766,045 $284,697,793 $235,035,655 $202,605,751 $150,379,604 $128,751,172 $101,464,942 $84,315,495 $78,131,588 $74,172,612
Restricted - passenger facility charge projects 20,471,601 24,030,445 30,014,741 34,949,517 29,759,895 40,849,597 43,257,624 34,400,719 39,046,042 42,211,448
Restricted - debt service 30,061,244 28,096,805 32,430,731 31,048,968 45,116,496 30,076,175 37,642,339 39,170,732 36,217,489 26,168,318
Restricted - customer facility charge projects 23,105,902 14,097,298 6,188,574 4,244,330 - - - - - -
Unrestricted net assets 5,535,935 9,676,812 10,549,389 9,807,830 24,122,346 21,585,477 18,420,919 26,347,630 14,368,365 14,832,491
Total Net Assets $388,940,727 $360,599,153 $314,219,090 $282,656,396 $249,378,341 $221,262,421 $200,785,824 $184,234,576 $167,763,484 $157,384,869
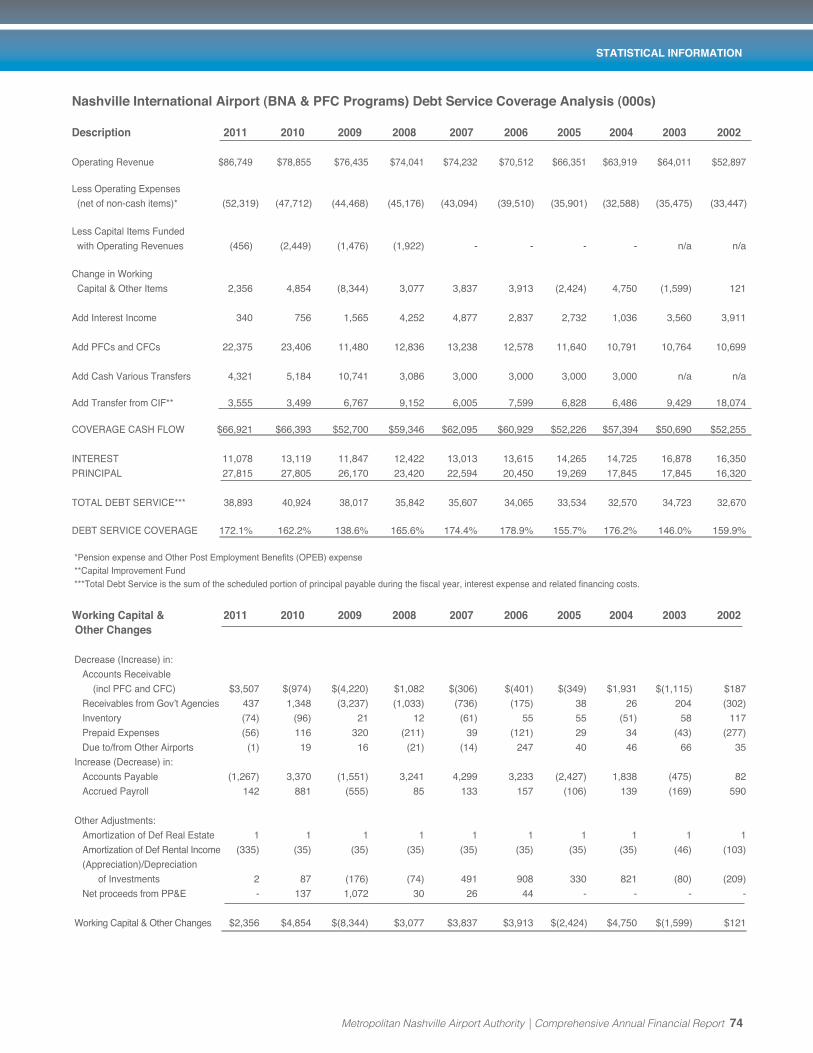
Metropolitan Nashville Airport Authority | Comprehensive Annual Financial Report 74
nashville International Airport (BnA & pFC programs) Debt service Coverage Analysis (000s)
Description 2011 2010 2009 2008 2007 2006 2005 2004 2003 2002
Operating Revenue $86,749 $78,855 $76,435 $74,041 $74,232 $70,512 $66,351 $63,919 $64,011 $52,897
Less Operating Expenses (net of non-cash items)* (52,319) (47,712) (44,468) (45,176) (43,094) (39,510) (35,901) (32,588) (35,475) (33,447)
Less Capital Items Funded with Operating Revenues (456) (2,449) (1,476) (1,922) - - - - n/a n/a
Change in Working Capital & Other Items 2,356 4,854 (8,344) 3,077 3,837 3,913 (2,424) 4,750 (1,599) 121
Add Interest Income 340 756 1,565 4,252 4,877 2,837 2,732 1,036 3,560 3,911
Add PFCs and CFCs 22,375 23,406 11,480 12,836 13,238 12,578 11,640 10,791 10,764 10,699
Add Cash Various Transfers 4,321 5,184 10,741 3,086 3,000 3,000 3,000 3,000 n/a n/a
Add Transfer from CIF** 3,555 3,499 6,767 9,152 6,005 7,599 6,828 6,486 9,429 18,074 COVERAGE CASH FLOW $66,921 $66,393 $52,700 $59,346 $62,095 $60,929 $52,226 $57,394 $50,690 $52,255
INTEREST 11,078 13,119 11,847 12,422 13,013 13,615 14,265 14,725 16,878 16,350 PRINCIPAL 27,815 27,805 26,170 23,420 22,594 20,450 19,269 17,845 17,845 16,320
TOTAL DEBT SERVICE*** 38,893 40,924 38,017 35,842 35,607 34,065 33,534 32,570 34,723 32,670
DEBT SERVICE COVERAGE 172.1% 162.2% 138.6% 165.6% 174.4% 178.9% 155.7% 176.2% 146.0% 159.9% *Pension expense and Other Post Employment Benefits (OPEB) expense **Capital Improvement Fund ***Total Debt Service is the sum of the scheduled portion of principal payable during the fiscal year, interest expense and related financing costs.
Working Capital & 2011 2010 2009 2008 2007 2006 2005 2004 2003 2002 Other Changes
Decrease (Increase) in: Accounts Receivable (incl PFC and CFC) $3,507 $(974) $(4,220) $1,082 $(306) $(401) $(349) $1,931 $(1,115) $187 Receivables from Gov’t Agencies 437 1,348 (3,237) (1,033) (736) (175) 38 26 204 (302) Inventory (74) (96) 21 12 (61) 55 55 (51) 58 117 Prepaid Expenses (56) 116 320 (211) 39 (121) 29 34 (43) (277) Due to/from Other Airports (1) 19 16 (21) (14) 247 40 46 66 35 Increase (Decrease) in: Accounts Payable (1,267) 3,370 (1,551) 3,241 4,299 3,233 (2,427) 1,838 (475) 82 Accrued Payroll 142 881 (555) 85 133 157 (106) 139 (169) 590
Other Adjustments: Amortization of Def Real Estate 1 1 1 1 1 1 1 1 1 1 Amortization of Def Rental Income (335) (35) (35) (35) (35) (35) (35) (35) (46) (103) (Appreciation)/Depreciation of Investments 2 87 (176) (74) 491 908 330 821 (80) (209) Net proceeds from PP&E - 137 1,072 30 26 44 - - - -
Working Capital & Other Changes $2,356 $4,854 $(8,344) $3,077 $3,837 $3,913 $(2,424) $4,750 $(1,599) $121
STATISTICAL INFORMATION

STATISTICAL INFORMATION
75 Metropolitan Nashville Airport Authority | Comprehensive Annual Financial Report
nashville International Airport (only BnA for 2003B, 2008A, 2010B, 2010C Bonds) Debt Service Coverage Analysis (000s)
Description 2011 2010 2009 2008 2007 2006 2005 2004 2003 2002
Operating Revenue $86,749 $78,855 $76,435 $74,041 $74,541 $70,512 $66,351 $63,919 $64,011 $52,897
Less Operating Expenses (net of non-cash items) (51,941) (46,929) (44,463) (45,176) (43,094) (39,510) (35,901) (32,588) (35,475) (33,447)
Less Capital Items Funded with Operating Revenues (456) (2,449) (1,476) (1,922) - - - - n/a n/a
Change in Working Capital & Other Items 696 8,157 (10,868) 4,121 845 3,206 (196) 2,195 (1,418) (391)
Add Interest Income 233 574 1,436 2,440 2,618 1,407 1,423 757 2,025 2,160
Add Various Transfers - 3,000 6,940 3,000 3,000 3,000 3,000 3,000 - -
Add Transfer from CIF* 3,555 3,499 6,767 9,152 6,005 7,599 6,828 6,486 9,429 18,074
COVERAGE CASH FLOW $38,836 $44,707 $34,771 $45,656 $43,915 $46,214 $41,505 $43,769 $38,572 $39,293
INTEREST 4,572 8,497 9,629 11,729 12,147 12,725 13,544 13,951 14,708 14,038 PRINCIPAL 19,495 22,100 19,975 19,870 19,124 17,150 16,074 15,135 15,285 13,895 TOTAL DEBT SERVICE 24,067 30,597 29,604 31,599 31,271 29,875 29,618 29,086 29,993 27,933
DEBT SERVICE COVERAGE 161.4% 146.1% 117.5% 144.5% 140.4% 154.7% 140.1% 150.5% 128.6% 140.7%
*Capital Improvement Fund
nashville International Airport (only pFC for 2003pFC, 2009A, 2010A Bonds) Debt Service Coverage Analysis (000s)
Description 2011 2010 2009 2008 2007 2006 2005 2004 2003 2002
Passenger Facility Charges (net) $13,300 $15,495 $11,480 $12,836 $12,929 $12,578 $11,640 $10,791 $10,764 $10,699
Less Operating Expenses (142) (509) (5) - - - - - - -
Add Various Transfers 4,321 2,184 3,801 86 - - - - - -
Change in Working Capital & Other Items 1,270 (2,447) 2,524 (1,044) 2,992 707 (2,228) 2,525 (181) 512
Add Interest Income 17 121 129 1,812 2,259 1,430 1,309 279 1,535 1,751
COVERAGE CASH FLOW $18,766 $14,844 $17,929 $13,690 $18,180 $14,715 $10,721 $13,595 $12,118 $12,962
INTEREST 2,581 3,098 2,218 693 866 890 721 774 2,170 2,312 PRINCIPAL 8,320 5,705 6,195 3,550 3,470 3,300 3,195 2,710 2,560 2,425 TOTAL DEBT SERVICE 10,901 8,803 8,413 4,243 4,336 4,190 3,916 3,484 4,730 4,737
DEBT SERVICE COVERAGE 172.1% 168.6% 213.1% 322.6% 419.3% 351.2% 273.8% 390.2% 256.2% 273.6%

Metropolitan Nashville Airport Authority | Comprehensive Annual Financial Report 76
nashville International Airport passenger Enplanements Market share
% of total 2011 2010 2009 2008 2007 2006 2005 2004 2003 2002
SIgNATORY AIRLINES
American Airlines 8.7% 413,028 440,120 485,037 569,878 537,270 511,263 405,642 404,473 394,741 459,884 American Eagle 4.4% 208,880 201,322 158,588 143,476 139,338 139,691 148,527 91,112 47,698 14,970 Continental Express d/b/a ExpressJet 3.2% 153,341 156,856 166,732 211,931 214,507 196,633 67,513 - - - Delta Air Lines Inc. 8.1% 381,859 277,740 170,821 186,493 276,209 268,272 329,373 296,148 328,344 375,817 Frontier Airlines 2.4% 115,004 108,283 112,954 121,853 120,921 96,023 66,344 2,046 - - Northwest Airlines Inc. 0.0% - - 170,974 220,949 306,451 338,020 372,211 355,339 334,019 310,036 Southwest Airlines 55.4% 2,619,094 2,400,069 2,341,657 2,474,183 2,435,801 2,396,765 2,097,881 2,089,884 2,019,190 2,065,784 TWA 0.0% - - - - - - - - - 50,426 United Airlines/Comair 1.6% 77,136 56,844 35,327 81,958 106,866 112,353 108,084 77,733 98,917 63,753 US Airways 3.7% 173,905 147,033 177,989 184,660 216,102 220,104 248,946 214,379 235,533 244,062
Subtotal 87.7% 4,142,247 3,788,267 3,820,079 4,195,381 4,353,465 4,279,124 3,844,521 3,531,114 3,458,442 3,584,732 Northwest Airlines Inc. and Delta Air Lines Inc. merged during FY2009. TWA was merged into American Airlines in FY2003. Continental and United Airlines merged in FY2011. Enplanement data is combined for reporting purposes beginning with 2010.
NON-SIgNATORY AIRLINES
Air Canada d/b/a Jazz Air 0.4% 17,874 17,762 19,025 21,138 19,471 11,219 9,894 17,689 19,520 20,395 Air Wisconsin 0.7% 31,531 59,220 55,347 47,476 50,069 45,414 36,447 43,331 19,466 31,549 American Connection/Chautauqua 0.0% - 5,236 21,222 14,211 21,899 13,965 10,092 13,322 72,111 - Astral Aviation d/b/a Skyway 0.0% - 10,152 26,139 27,387 22,097 20,695 15,101 12,787 13,494 11,985 Continental Airlines 0.0% 297 273 696 288 110 344 113,293 170,460 172,331 176,600 Delta/Chautauqua 0.1% 5,503 12,006 38,463 39,816 36,306 21,763 54,716 64,511 15,563 - Delta Connection/Atlantic Coast 0.0% - - - - - - 6,990 25,972 16,829 24,276 JetBlue Airways 0.0% - - - 40,219 65,273 - - - - - Mesa Airlines 1.3% 63,566 97,023 75,315 94,816 207,224 190,725 208,941 104,977 3,982 5,508 Regionsair Inc. 0.0% - - - - 229 7,400 15,085 16,784 20,800 13,727 Republic 1.4% 63,933 59,370 45,458 53,616 26,104 14,995 - - - - US Air d/b/a US Air Express 0.0% - - - - 49 5,591 5,519 4,804 - 13,556 Various/Trans State Airlines 0.4% 18,120 26,659 41,586 59,315 42,673 26,023 34,026 33,983 10,557 1,899United/Skywest 0.6% 23,434 58,021 72,035 67,357 44,788 57,951 17,624 15,309 21,049 -All Others (includes Charters) 7.5% 352,469 353,347 245,597 219,340 48,434 40,701 66,143 111,777 153,836 120,180 Subtotal 12.3% 582,727 699,069 640,883 684,979 584,726 456,786 593,871 635,706 539,538 419,675 TOTAL 100.0% 4,724,974 4,487,336 4,460,962 4,880,360 4,938,191 4,735,910 4,438,392 4,166,820 3,997,980 4,004,407
STATISTICAL INFORMATION
CFC - 2010 CONRAC Debt Service Coverage Analysis (000s) 2011 2010
Customer Facility Charges $9,075 $7,912
Less Operating Expenses (236) (274)
Change in Working Capital & Other Items 391 (855)
Add Interest Income 91 61
COVERAGE CASH FLOW $9,321 $6,844
INTEREST $3,926 $1,525 PRINCIPAL - -
TOTAL DEBT SERVICE 3,926 1,525
DEBT SERVICE COVERAGE 237.4% 448.8%

STATISTICAL INFORMATION
77 Metropolitan Nashville Airport Authority | Comprehensive Annual Financial Report
Continental Airlines officially transitioned from signatory to non-signatory status during 2007.
2011 2010 2009 2008 2007 2006 2005 2004 2003 2002
5,000,000
4,000,000
3,000,000
2,000,000
1,000,000
0
Enplanement history
Non-signatory Signatory
nashville International Airport passenger Airline landed Weights (000s)
% of total 2011 2010 2009 2008 2007 2006 2005 2004 2003 2002
SIgNATORY AIRLINES
American Airlines 9.1% 524,980 545,126 649,016 689,632 655,872 634,563 567,963 624,363 585,052 755,178
American Eagle 4.3% 250,201 256,929 208,495 187,228 183,165 176,907 201,774 108,377 58,641 32,413
Continental Express d/b/a ExpressJet 2.9% 170,289 161,622 178,362 213,733 217,946 210,740 143,285 - - -
Delta Air Lines Inc. 8.0% 463,462 235,775 215,579 220,001 332,566 324,574 453,689 435,374 490,498 672,503
Frontier Airlines 2.4% 138,158 136,647 140,062 150,367 156,727 136,359 - - - -
Northwest Airlines Inc. 0.0% - 113,227 217,913 262,432 390,255 451,613 508,023 501,271 511,171 454,697
Southwest Airlines 56.2% 3,256,494 3,099,020 3,320,830 3,612,516 3,585,140 3,483,250 3,566,231 3,566,775 3,560,773 3,577,728
TWA 0.0% - - - - - - - - - 95,429
United Airlines/Comair 1.6% 93,016 68,557 45,394 98,618 132,699 139,071 151,207 113,857 131,318 80,652
USAirways 3.9% 226,543 194,337 226,038 229,737 286,557 276,569 326,295 300,443 375,039 427,338
Sub Total 88.5% 5,123,143 4,811,240 5,201,689 5,664,264 5,940,927 5,833,646 5,918,467 5,650,460 5,712,492 6,095,938
Note: Northwest Airlines Inc. and Delta Air Lines Inc. merged during FY2009. However, landed weight data continued to be reported separately throughout the year. American Connection/Chautauqua, Compass Airlines, Branson Air Express & Express Jet/United Express were non-signatory prior to FY 2011.
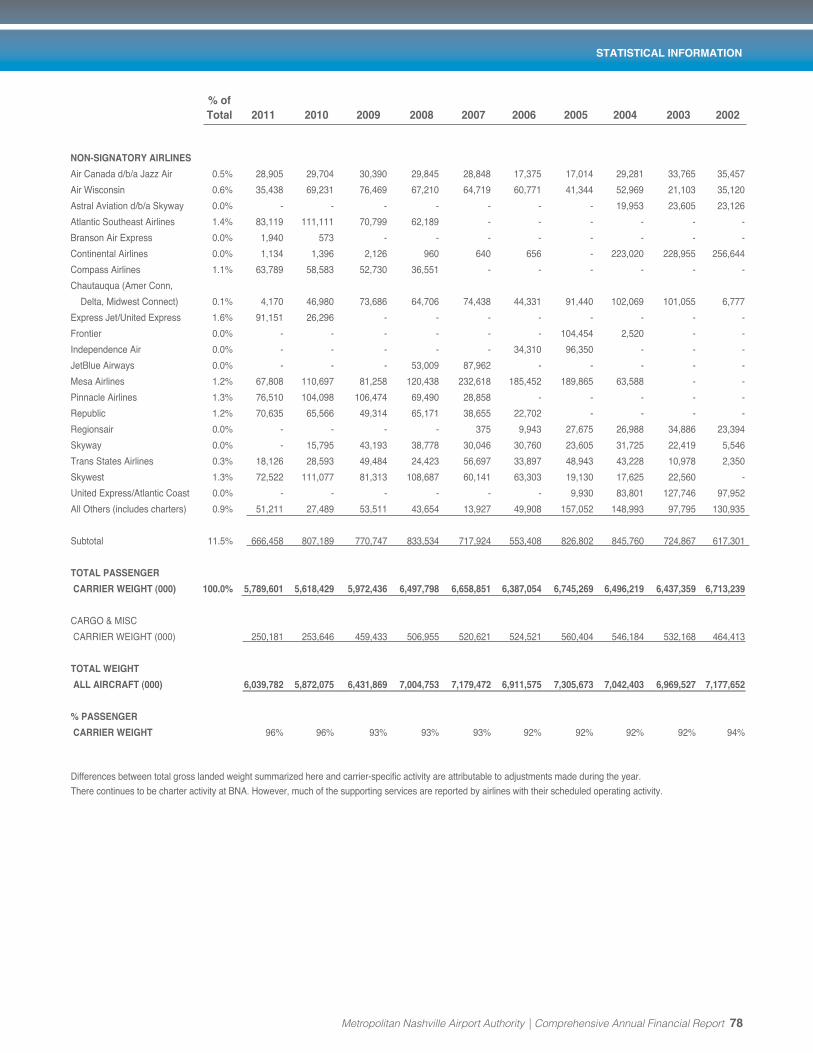
Metropolitan Nashville Airport Authority | Comprehensive Annual Financial Report 78
% of total 2011 2010 2009 2008 2007 2006 2005 2004 2003 2002
NON-SIgNATORY AIRLINES
Air Canada d/b/a Jazz Air 0.5% 28,905 29,704 30,390 29,845 28,848 17,375 17,014 29,281 33,765 35,457
Air Wisconsin 0.6% 35,438 69,231 76,469 67,210 64,719 60,771 41,344 52,969 21,103 35,120
Astral Aviation d/b/a Skyway 0.0% - - - - - - - 19,953 23,605 23,126
Atlantic Southeast Airlines 1.4% 83,119 111,111 70,799 62,189 - - - - - -
Branson Air Express 0.0% 1,940 573 - - - - - - - -
Continental Airlines 0.0% 1,134 1,396 2,126 960 640 656 - 223,020 228,955 256,644
Compass Airlines 1.1% 63,789 58,583 52,730 36,551 - - - - - -
Chautauqua (Amer Conn,
Delta, Midwest Connect) 0.1% 4,170 46,980 73,686 64,706 74,438 44,331 91,440 102,069 101,055 6,777
Express Jet/United Express 1.6% 91,151 26,296 - - - - - - - -
Frontier 0.0% - - - - - - 104,454 2,520 - -
Independence Air 0.0% - - - - - 34,310 96,350 - - -
JetBlue Airways 0.0% - - - 53,009 87,962 - - - - -
Mesa Airlines 1.2% 67,808 110,697 81,258 120,438 232,618 185,452 189,865 63,588 - -
Pinnacle Airlines 1.3% 76,510 104,098 106,474 69,490 28,858 - - - - -
Republic 1.2% 70,635 65,566 49,314 65,171 38,655 22,702 - - - -
Regionsair 0.0% - - - - 375 9,943 27,675 26,988 34,886 23,394
Skyway 0.0% - 15,795 43,193 38,778 30,046 30,760 23,605 31,725 22,419 5,546
Trans States Airlines 0.3% 18,126 28,593 49,484 24,423 56,697 33,897 48,943 43,228 10,978 2,350
Skywest 1.3% 72,522 111,077 81,313 108,687 60,141 63,303 19,130 17,625 22,560 -
United Express/Atlantic Coast 0.0% - - - - - - 9,930 83,801 127,746 97,952
All Others (includes charters) 0.9% 51,211 27,489 53,511 43,654 13,927 49,908 157,052 148,993 97,795 130,935
Subtotal 11.5% 666,458 807,189 770,747 833,534 717,924 553,408 826,802 845,760 724,867 617,301
TOTAL PASSENgER
CARRIER WEIghT (000) 100.0% 5,789,601 5,618,429 5,972,436 6,497,798 6,658,851 6,387,054 6,745,269 6,496,219 6,437,359 6,713,239
CARGO & MISC
CARRIER WEIGHT (000) 250,181 253,646 459,433 506,955 520,621 524,521 560,404 546,184 532,168 464,413
TOTAL WEIghT
ALL AIRCRAFT (000) 6,039,782 5,872,075 6,431,869 7,004,753 7,179,472 6,911,575 7,305,673 7,042,403 6,969,527 7,177,652
% PASSENgER
CARRIER WEIghT 96% 96% 93% 93% 93% 92% 92% 92% 92% 94%
Differences between total gross landed weight summarized here and carrier-specific activity are attributable to adjustments made during the year. There continues to be charter activity at BNA. However, much of the supporting services are reported by airlines with their scheduled operating activity.
STATISTICAL INFORMATION
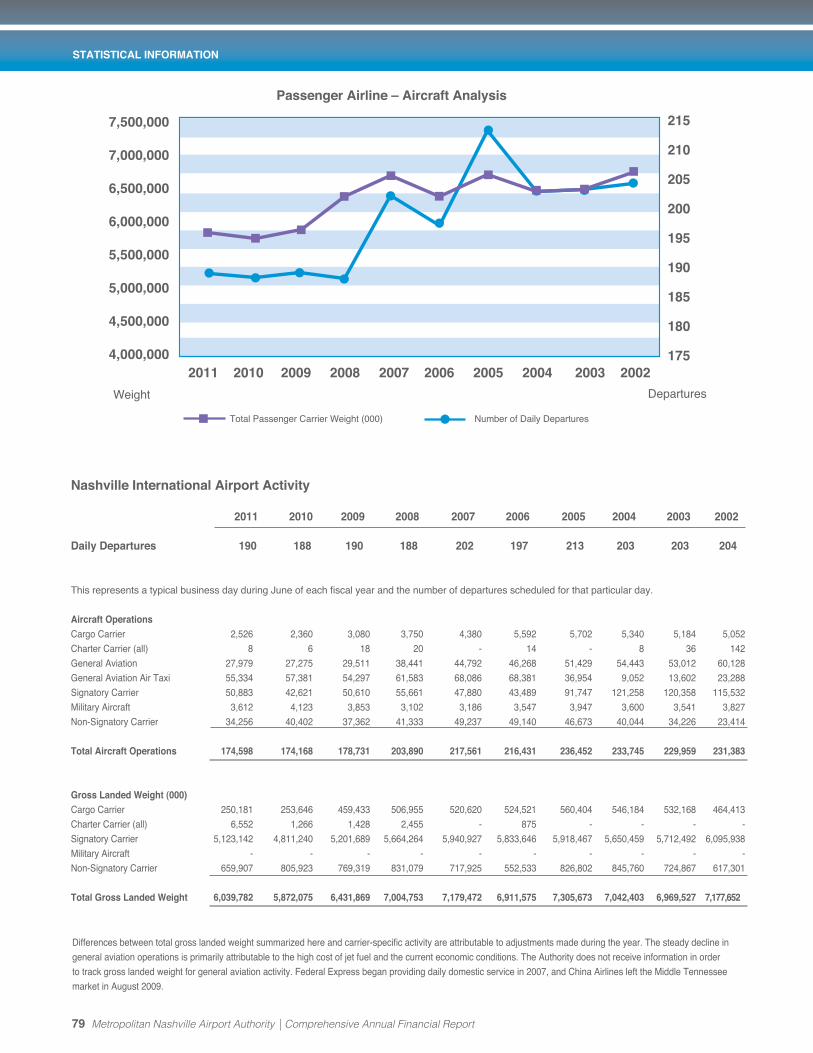
STATISTICAL INFORMATION
79 Metropolitan Nashville Airport Authority | Comprehensive Annual Financial Report
Differences between total gross landed weight summarized here and carrier-specific activity are attributable to adjustments made during the year. The steady decline in general aviation operations is primarily attributable to the high cost of jet fuel and the current economic conditions. The Authority does not receive information in order to track gross landed weight for general aviation activity. Federal Express began providing daily domestic service in 2007, and China Airlines left the Middle Tennessee market in August 2009.
nashville International Airport Activity
2011 2010 2009 2008 2007 2006 2005 2004 2003 2002
Daily Departures 190 188 190 188 202 197 213 203 203 204
This represents a typical business day during June of each fiscal year and the number of departures scheduled for that particular day.
Aircraft OperationsCargo Carrier 2,526 2,360 3,080 3,750 4,380 5,592 5,702 5,340 5,184 5,052 Charter Carrier (all) 8 6 18 20 - 14 - 8 36 142 General Aviation 27,979 27,275 29,511 38,441 44,792 46,268 51,429 54,443 53,012 60,128 General Aviation Air Taxi 55,334 57,381 54,297 61,583 68,086 68,381 36,954 9,052 13,602 23,288 Signatory Carrier 50,883 42,621 50,610 55,661 47,880 43,489 91,747 121,258 120,358 115,532 Military Aircraft 3,612 4,123 3,853 3,102 3,186 3,547 3,947 3,600 3,541 3,827 Non-Signatory Carrier 34,256 40,402 37,362 41,333 49,237 49,140 46,673 40,044 34,226 23,414
total Aircraft Operations 174,598 174,168 178,731 203,890 217,561 216,431 236,452 233,745 229,959 231,383
gross Landed Weight (000) Cargo Carrier 250,181 253,646 459,433 506,955 520,620 524,521 560,404 546,184 532,168 464,413 Charter Carrier (all) 6,552 1,266 1,428 2,455 - 875 - - - - Signatory Carrier 5,123,142 4,811,240 5,201,689 5,664,264 5,940,927 5,833,646 5,918,467 5,650,459 5,712,492 6,095,938 Military Aircraft - - - - - - - - - - Non-Signatory Carrier 659,907 805,923 769,319 831,079 717,925 552,533 826,802 845,760 724,867 617,301
Total gross Landed Weight 6,039,782 5,872,075 6,431,869 7,004,753 7,179,472 6,911,575 7,305,673 7,042,403 6,969,527 7,177,652
2011 2010 2009 2008 2007 2006 2005 2004 2003 2002
7,500,000
7,000,000
6,500,000
6,000,000
5,500,000
5,000,000
4,500,000
4,000,000
215
210
205
200
195
190
185
180
175
Passenger Airline – Aircraft Analysis
Total Passenger Carrier Weight (000) Number of Daily Departures
Weight Departures

Metropolitan Nashville Airport Authority | Comprehensive Annual Financial Report 80
STATISTICAL INFORMATION
2011 2010 2009 2008 2007 2006 2005 2004 2003 2002
8,000,0007,000,0006,000,0005,000,0004,000,0003,000,0002,000,0001,000,000
0
250,000
200,000
150,000
100,000
50,000
0
Aircraft Operations and gross landed Weight (000s)
Gross Landed Weight (000)
Aircraft Operations
2011 2010 2009 2008 2007 2006 2005 2004 2003 2002
Cargo (tons) Air Mail 2 8 18 459 543 2,360 3,421 3,479 3,964 7,654 Air Freight 3,467 7,851 8,319 6,912 6,174 6,373 6,369 6,394 5,343 5,682 Air Cargo - Domestic 17,177 36,162 33,914 38,230 38,040 33,013 35,778 34,517 33,555 31,698 Air Cargo - International - 2,321 23,381 33,665 30,164 32,085 29,374 24,373 20,258 8,355 total Cargo 20,646 46,342 65,632 79,266 74,921 73,831 74,942 68,763 63,120 53,389
The Authority does not receive information in order to track gross landed weight for general aviation activity. Federal Express began providing daily domestic service in 2007, and China Airlines left the Middle Tennessee market in August 2009.
Weight Operations

STATISTICAL INFORMATION
81 Metropolitan Nashville Airport Authority | Comprehensive Annual Financial Report
Major tenants at nashville International Airport and John C. tune Airport
Signatory CarriersAmerican AirlinesAmerican Eagle AirlinesDelta Air Lines Inc.Express Jet (Continental Express)Republic Airways Holdings*Southwest AirlinesUnited Airlines/ComairUS Airway
Non-signatory CarriersAir Canada d/b/a Jazz AirAir WisconsinAtlantic Southeast AirContinental AirlinesMesa AirlinesPinnacle AirlinesCompass MesabaPSA (owned by US Airways)Shuttle AmericaSkywestTrans States Airlines
Cargo CarriersAir Transport InternationalCapital Cargo InternationalDB SchenkerDHL/Astar ExpressFederal Express
Fixed-base OperatorsAtlantic AviationSignature Flight Support
ground transportation Hotel ShuttlesTaxicab CompaniesLimousine Companies
ground handlersDynair/Swissport
vehicle ParkingCentral Parking SystemsFirst Transit, Inc. (airport shuttle) Private hangar RentalsNashville HangarOwl Hill HoldingsSATA Inc.
Other Airport tenants118th Airlift WingAeronautical RadioAircraft Services InternationalEmbraer Aircraft MaintenanceFederal Aviation AdministrationMarisolMetro Air ServicesMetro GovernmentMonells DiningState of TennesseeTN Aeronautics CommissionTN Dept of TransportationTower Group InternationalUS CustomsUS Government Weather ServiceUS Postal ServiceUS DEA
Other Terminal Tenants24 Hour FlowerA T & TCareHere Medical ClinicClear Channel AirportsCountry Western Tours/Grayline ToursCTN Superior ShineDelaware North (Food & Beverage Concession)Fifth Third BankFirst Class SeatsGraycliffHMSHost (Food & Beverage Concession)Hudson Group (News & Gift Concession)i-Tech/Edge 1 CellularJarmon LimousineMassage Bar Inc.Nashville NailsNew Zoom SystemsOpryland HotelSecurity Point MediaSmarteCarteSunTrust BankTSAWright Travel Business Center
Rental CarAvisAdvantage Car RentalBudgetBurgner (Thrifty)DollarEnterpriseHertzVanguard (Alamo/National)
tenants at John C. tune AirportCorporate Flight ManagementRobert Orr/Sysco
* includes Frontier, Republic, Shuttle America and Chautauqua Airlines. Became signatory July 2011.

Metropolitan Nashville Airport Authority | Comprehensive Annual Financial Report 82
STATISTICAL INFORMATION
nashville – Davidson – Murfreesboro Metropolitan statistical Area population
Year Nashville MSA* Tennessee United States 1970 699,144 3,923,687 203,211,926 1980 850,505 4,591,120 226,545,805 1990 985,026 4,877,185 248,709,873 2000 1,231,311 5,689,283 281,421,906 2010 1,589,934 6,346,105 308,745,538 *The Nashville MSA consists of Cannon, Cheatham, Davidson, Dickson, Hickman, Macon, Robertson, Rutherford, Smith, Sumner, Trousdale, Williamson and Wilson counties.
30.00%
25.00%
20.00%
15.00%
10.00%
5.00%
0.00%
1980 1990 2000 2010
Nashville MSA Tennessee United States
population percent Change
Metropolitan nashville Airport Authority staffing - Full-time Equivalents
2011 2010 2009 2008 2007 2006 2005 2004 2003 2002
Administration 96.2 94.5 92.5 90.5 91.0 92.5 73.0 66.0 65.0 67.5
Engineering & Maintenance 71.3 70.0 67.0 68.0 75.0 73.0 77.0 77.0 76.0 79.0
Operations, safety, security 109.5 107.5 111.0 114.0 121.5 118.0 116.0 115.0 113.0 111.5
Total Authority Full-time Equivalents 277.0 272.0 270.5 272.5 287.5 283.5 266.0 258.0 254.0 258.0
Note: Staffing levels represent full-time equivalents as of the last pay cycle of each fiscal year. MPC has no employees.

STATISTICAL INFORMATION
83 Metropolitan Nashville Airport Authority | Comprehensive Annual Financial Report
nashville Metropolitan statistical Area* Average unemployment Rate
Year Nashville MSA Tennessee United States
2011 8.45% 9.50% 9.35%
2010 9.41% 10.64% 9.77%
2009 7.40% 8.37% 7.57%
2008 4.45% 5.29% 4.95%
2007 4.28% 5.23% 4.54%
2006 4.70% 5.82% 4.83%
2005 4.49% 5.68% 5.31%
2004 4.19% 5.45% 5.81%
2003 3.83% 5.08% 6.10%
2002 4.01% 5.12% 5.78%
10-yr Average 5.52% 6.62% 6.40%
*Nashville Metropolitan Statistical Area consists of Cannon, Cheatham, Davidson, Dickson, Hickman, Macon, Robertson, Rutherford, Smith, Sumner, Trousdale, Williamson and Wilson counties. Source: U.S. Bureau of Labor Statistics (http://data.bls.gov)
11.00%
10.00%
9.00%
8.00%
7.00%
6.00%
5.00%
4.00%
3.00%
2.00%
1.00%
0.0%2011 2010 2009 2008 2007 2006 2005 2004 2003 2002
Nashville MSA
Tennessee
United States
Average unemployment Rates

Metropolitan Nashville Airport Authority | Comprehensive Annual Financial Report 84
nashville Area top 25 Employers* (Ranked by number of local Employees) 2010 staff Employer headquarters 2009 staff 1 21,232 Vanderbilt University and Medical Center Nashville 1 21,739 2 18,736 State of Tennessee Nashville 2 20,576 3 12,313 U.S. Government Washington 3 11,599 4 11,500 Nissan North America Inc. Franklin 7 11,500 5 10,300 Metropolitan Nashville-Davidson County Public Schools Nashville 4 10,900 6 8,941 Metropolitan Government of Nashville and Davidson County Nashville 5 9,191 7 7,000 HCA, Inc. Nashville 8 7,000 8 6,500 Saint Thomas Health Service Nashville 6 6,500 9 5,200 Rutherford County Government Murfreesboro 14 5,200 10 4,482 Williamson County Public Schools and County Government Franklin 13 4,482 11 3,554 The Kroger Company Cincinnati, OH 18 3,577 12 3,531 Sumner County Government and Public Schools Gallatin 12 3,531 13 3,000 Shoney’s Inc. Nashville 16 3,000 14 2,803 Randstad Work Solutions Atlanta, GA 17 2,141 15 2,662 Gaylord Entertainment Co. Nashville 10 2,662 16 2,620 Cracker Barrel Old Country Store Inc. Lebanon 11 2,620 17 2,100 Ingram Industries Inc. Nashville 21 2,100 18 2,013 Middle Tennessee State University Murfreesboro 24 2,013 19 1,936 Dollar General Corporation Goodlettsville 27 1,977 20 1,825 National HealthCare Corporation Murfreesboro 28 1,795 21 1,800 Dell Corporation Round Rock, TX 15 1,800 22 1,665 State Farm Insurance Bloomington, IL 33 1,550 23 1,550 Community Health Systems, Inc. Franklin NR 1,550 24 1,500 Asurion Nashville 23 1,500 25 1,500 Regions Financial Corporation Birmingham, AL 30 1,500
*ranked by number of Middle Tennessee employees as of October 1, 2010.Nashville Business Journal’s Book of Lists 2011 (nashville.bizjournals.com)
Wealthiest Tennessee zIP Codes (City, County)**2010 2009 Median household Income 1 1 38139 Germantown, Shelby $134,496 2 2 37350 Lookout Mountain, Hamilton $128,295 3 4 37027 Brentwood, Williamson*** $118,958 4 3 37069 Franklin, Williamson*** $117,070 5 5 37067 Franklin, Williamson*** $105,674 6 8 38138 Germantown, Shelby $91,966 7 6 37934 Knoxville, Knox $90,893 8 10 38017 Collierville, Shelby $90,672 9 7 37922 Knoxville, Knox $89,607 10 9 37215 Nashville, Davidson*** $88,110 11 11 37220 Nashville, Davidson*** $85,261 12 15 37135 Nolensville, Williamson*** $84,038 13 13 38125 Memphis, Shelby $82,621 14 18 37064 Franklin, Williamson*** $79,749 15 16 38016 Cordova, Shelby $79,570 16 12 38120 Memphis, Shelby $79,406 17 14 37205 Nashville, Davidson*** $79,263 18 22 37014 Arrington, Williamson*** $78,628 19 17 38018 Cordova, Shelby $78,220 20 19 37221 Nashville, Davidson*** $77,557 21 25 38133 Memphis, Shelby $76,929 22 21 38135 Memphis, Shelby $76,786 23 20 37179 Thompson Station, Williamson*** $75,648 24 28 37122 Mt. Juliet, Wilson*** $73,235 25 24 37174 Spring Hill, Maury*** $72,480
**ranked by 2010 median annual household income.***ZIP codes in Middle Tennessee (13 of top 25)Nashville Business Journal’s Book of Lists 2011 (nashville.bizjournals.com)
STATISTICAL INFORMATION

85 Metropolitan Nashville Airport Authority | Comprehensive Annual Financial Report
STATISTICAL INFORMATION
Middle tennessee top 25 public Companies* 2010 2009 Employer headquarters 1 1 Community Health Systems Inc. Franklin 2 NR Dollar General Corp. Goodlettsville 3 3 Delek US Holdings Inc. Brentwood 4 2 Tractor Supply Co. Brentwood 5 4 LifePoint Hospitals Inc. Brentwood 6 5 HealthSpring Inc. Franklin 7 6 Cracker Barrel Old Country Store Inc. Lebanon 8 7 Brookdale Senior Living Inc. Brentwood 9 8 Psychiatric Solutions Inc. Franklin 10 9 Corrections Corp. Of America Nashville 11 10 Genesco Inc. Nashville 12 11 Louisiana-Pacific Corp. Nashville 13 NR Noranda Aluminum Holding Corp. Franklin 14 15 Emdeon Nashville 15 12 CLARCOR Inc. Franklin 16 13 O’Charley’s Inc. Nashville 17 14 Gaylord Entertainment Co. Nashville 18 16 Healthways Inc. Franklin 19 18 AmSurg Corp. Nashville 20 17 National HealthCare Corp. Murfreesboro 21 19 America Service Group Inc. Brentwood 22 NR Kirkland’s Inc. Nashville 23 20 Advocat Inc. Brentwood 24 22 Healthcare Realty Trust Inc. Nashville 25 21 First Acceptance Corp. Nashville
*Ranked by prior four quarters’ revenue as reported October 29, 2010, and Google Finance.Nashville Business Journal’s Book of Lists 2011 (nashville.bizjournals.com)
tennessee top 25 public Companies** 2010 2009 Employer headquarters 1 1 FedEx Memphis 2 2 International Paper Memphis 3 3 Community Health Systems Inc. Franklin 4 NR Dollar General Corp. Goodlettsville 5 NR Tennessee Valley Authority Knoxville 6 4 Unum Group Chattanooga 7 5 AutoZone Inc. Memphis 8 6 Eastman Chemical Co. Kingsport 9 8 Delek US Holdings Inc. Brentwood 10 7 Tractor Supply Co. Brentwood 11 10 LifePoint Hospitals Inc. Brentwood 12 9 Regal Entertainment Group Knoxville 13 11 HealthSpring Inc. Franklin 14 NR Tenn Health Holdings Inc. Knoxville 15 12 Cracker Barrel Old Country Store Inc. Lebanon 16 15 Brookdale Senior Living Inc. Brentwood 17 17 Mueller Industries Inc. Memphis 18 14 Thomas & Betts Corp. Memphis 19 16 Psychiatric Solutions Inc. Franklin 20 18 Fred’s Inc. Memphis 21 13 First Horizon National Corp. Memphis 22 19 Corrections Corp. of America Nashville 23 20 King Pharmaceuticals Inc. Bristol 24 21 Genesco Inc. Nashville 25 23 Verse Paper Group Memphis
**Per individual company report filings through October 29, 2010.Nashville Business Journal’s Book of Lists 2009 (nashville.bizjournals.com)