Embed Size (px)
Citation preview
Comprehensive Annual Financial Report
Raleigh-Durham Airport Authority
For the Fiscal Years Ended March 31, 2013 and 2012
Raleigh-Durham Airport AuthorityRDU Airport, North Carolina
Comprehensive Annual Financial Report
For the fiscal years March 31, 2013 and 2012
Prepared by the Finance Department
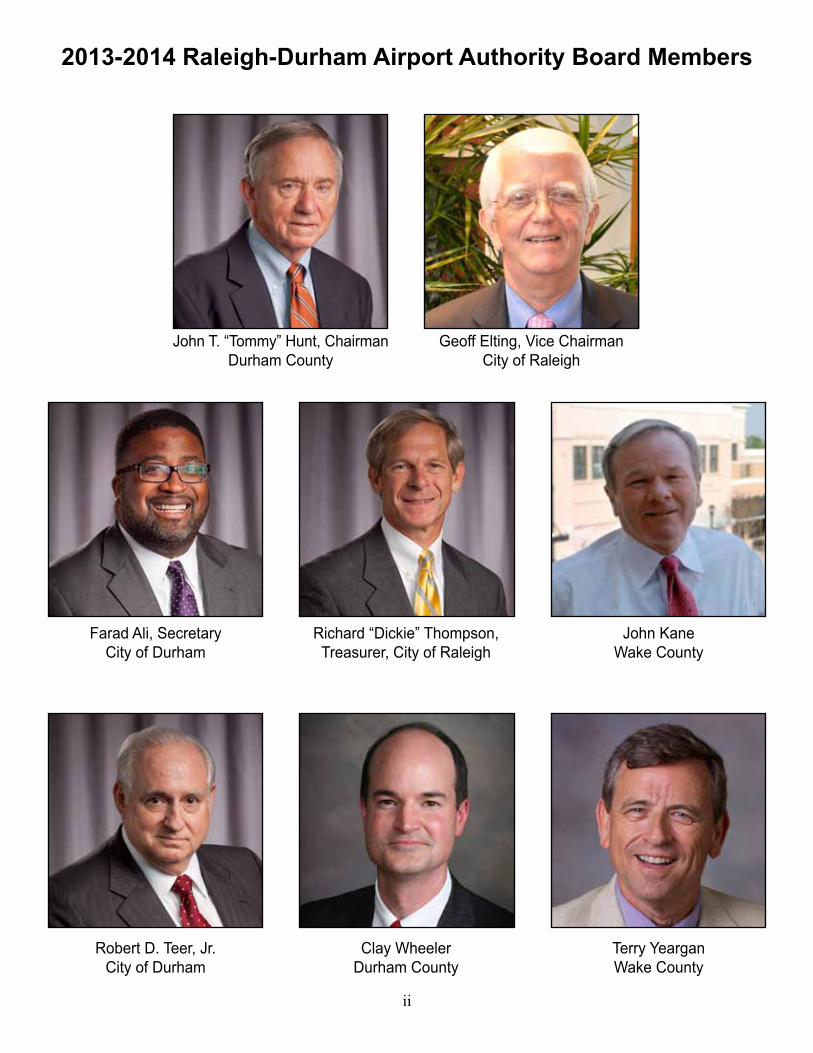
2013-2014 Raleigh-Durham Airport Authority Board Members
ii
John T. “Tommy” Hunt, Chairman Durham County
Geoff Elting, Vice Chairman City of Raleigh
Farad Ali, Secretary City of Durham
Richard “Dickie” Thompson, Treasurer, City of Raleigh
John Kane Wake County
Robert D. Teer, Jr.City of Durham
Clay Wheeler Durham County
Terry Yeargan Wake County
RALEIGH-DURHAM AIRPORT AUTHORITYTABLE OF CONTENTS
Years Ended March 31, 2013 and 2012
Page(s)
INTRODUCTORY SECTION:Title Page.......................................................................................................................... iAuthority Board Members.................................................................................................. iiTable of Contents .............................................................................................................. iii - ivOrganization Chart ............................................................................................................ vGovernment Finance Officers Association Certificate of Achievement for Excellence inFinancial Reporting ........................................................................................................... viLetter of Transmittal .......................................................................................................... vii - xiv
FINANCIAL SECTION:Report of Independent Auditor........................................................................................... 1 – 2Management’s Discussion and Analysis............................................................................ 3 – 14Basic Financial Statements:
Statements of Net Position............................................................................................ 15 – 16Statements of Revenues, Expenses and Changes in Net Position................................ 17Statements of Cash Flows ............................................................................................ 18 – 19Notes to Basic Financial Statements............................................................................. 20 – 42
Required Supplemental Information:Schedule of Funding Progress (OPEB) ......................................................................... 43Schedule of Employer Contributions (OPEB) ................................................................ 44Schedule of Funding Progress (Separation Allowance)…………………………………… 45Schedule of Employer Contributions (Separation Allowance)........................................ 46
Supplemental Information:Summary of Operating Revenues and Expenses Compared with Budget ..................... 47Revenues Compared with Budget – Parking Revenues ................................................ 48Revenues Compared with Budget – Airfield Revenues ................................................. 49 – 50Revenues Compared with Budget – General Aviation Revenues .................................. 51 – 52Revenues Compared with Budget – Terminal Revenues .............................................. 53 – 57Revenues Compared with Budget – Air Cargo Revenues ............................................. 58Revenues Compared with Budget – Fuel Farm Revenues ............................................ 59Revenues Compared with Budget – Rental Car Revenues ........................................... 60Revenues Compared with Budget – Other Revenues ................................................... 61Comparative Summaries of Operating Expenses by Cost Center ................................. 62Summary of Operating Expenses by Cost Center ......................................................... 63Expenses Compared with Budget – Airport Facilities Operating Expenses ................... 64 – 70Expenses Compared with Budget – Administrative Expenses....................................... 71 – 77Expenses Compared with Budget – Visitor Services Expenses..................................... 78Expenses Compared with Budget – Fuel Farm Expenses............................................. 79Expenses Compared with Budget – Airport Maintenance Expenses ............................. 80Expenses Compared with Budget – Law Enforcement Expenses ................................. 81Expenses Compared with Budget – Emergency Services Expenses............................. 82Expenses Compared with Budget – Operations Expenses............................................ 83Expenses Compared with Budget – Communications Expenses................................... 84Expenses Compared with Budget – Parking Expenses................................................. 85Expenses Compared with Budget – Ground Transportation Division Expenses ............ 86
iii
RALEIGH-DURHAM AIRPORT AUTHORITYTABLE OF CONTENTS
Years Ended March 31, 2013 and 2012
Expenses Compared with Budget – Terminal Services Division Expenses ................... 87Details of Airport and Facilities ...................................................................................... 88Summary of Depreciation.............................................................................................. 89
STATISTICAL SECTION: . 90Net Position by Component – Last Ten Fiscal Years..................................................... 91Statements of Revenues, Expenses and Changes in Net Position-Last Ten Fiscal Years 92Key Performance Indicators – Last Ten Years .............................................................. 93RDU Cash/Investment Balances vs Operating Reserve Policy–Last Ten Fiscal Years . 94Operating Expenses by Business Unit – Fiscal Year Ended March 31, 2013 ................ 95Operating Revenue by Source – Fiscal Year Ended March 31, 2013............................ 96Airline Derived Revenue by Carrier – Fiscal Year Ended March 31, 2013..................... 97Debt Service Schedule – Ten Years Projection............................................................. 98Debt Details and Amounts Outstanding......................................................................... 99RDU Demographic Information – Last Three Years ...................................................... 100Principal Employers – Current Year and Nine Years Ago.............................................. 101Activity Statistics – Last Ten Years ............................................................................... 102Enplaned Passengers by Airline – Last Ten Years........................................................ 103Enplaned Passengers by Airline Data – Last Ten Years ............................................... 104Enplaned Passengers by Month – Last Ten Years........................................................ 105Aircraft Landed Weights by Airline – Last Ten Years..................................................... 106Capital Assets and Other Airport information................................................................. 107Grant Awards History – Last Ten Years ........................................................................ 108Employee Headcounts – Last Ten Years ...................................................................... 109
iv
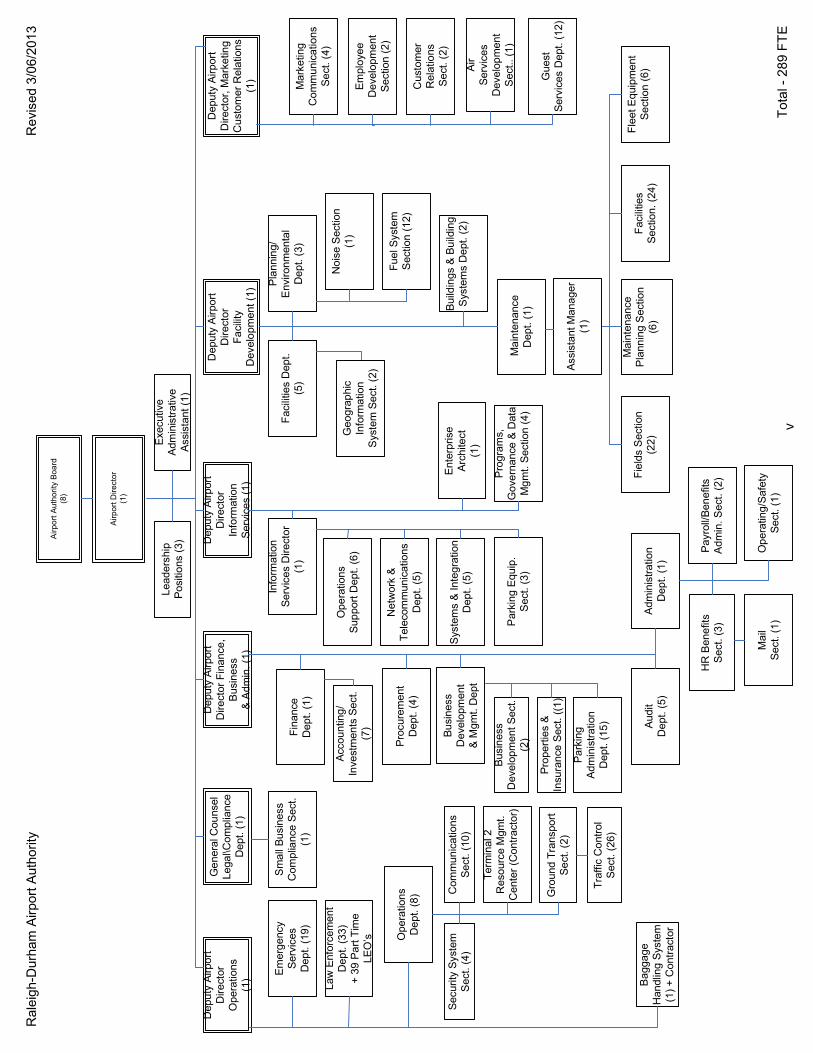
Airport Authority Board
(8)
Airport Director
(1)
Deputy Airport
Director
Facility
Development (1)
Deputy Airport
Director Finance,
Business
& Admin. (1)
Deputy Airport
Director, Marketing
Customer Relations
(1)
Finance
Dept. (1)
Accounting/
Investments Sect.
(7)
Procurement
Dept. (4)
Leadership
Positions (3)
Business
Development
& Mgmt. Dept
Properties &
Insurance Sect. ((1)
Business
Development Sect.
(2)
Administration
Dept. (1)
Deputy Airport
Director
Inform
ation
Services (1)
Operations
Support Dept. (6)
Network &
Telecommunications
Dept. (5)
Systems & Integration
Dept. (5)
Noise Section
(1)
Fuel System
Section (12)
Maintenance
Dept. (1)
Deputy Airport
Director
Operations
(1)
Emergency
Services
Dept. (19)
Law Enforcement
Dept. (33)
+ 39 Part Time
LEO’s Operations
Dept. (8) Communications
Sect. (10)
Security System
Sect. (4)
Parking
Administration
Dept. (15)
Ground Transport
Sect. (2)
Traffic Control
Sect. (26)
Parking Equip.
Sect. (3)
HR Benefits
Sect. (3)
Payroll/Benefits
Admin. Sect. (2)
Sect. (1)
Operating/Safety
Sect. (1)
Marketing
Communications
Sect. (4)
Customer
Relations
Sect. (2)
Employee
Development
Section (2)
Air
Services
Development
Sect.. (1)
Maintenance
Planning Section
(6)
Fleet Equipment
Section (6)
Fields Section
(22)
Executive
Administrative
Assistant (1)
General Counsel
Legal\Compliance
Dept. (1)
Small Business
Compliance Sect.
(1)
Facilities Dept.
(5)
Planning/
Environmental
Dept. (3)
Buildings & Building
Systems Dept. (2)
Assistant Manager
(1)
Facilities
Section. (24)
Geographic
Inform
ation
System Sect. (2)
Guest
Services Dept. (12)
Inform
ation
Services Director
(1)
Programs,
Governance & Data
Mgmt. Section (4)
Enterprise
Architect
(1)
Baggage
Handling System
(1) + Contractor
Term
inal 2
Resource Mgmt.
Center (Contractor)
Audit
Dept. (5)
Raleigh-Durham Airport Authority
Revised 3/06/2013
Total - 289 FTE
v
vi
vii
June 20, 2013
To the Board of the Raleigh-Durham Airport Authority,
This Comprehensive Annual Financial Report of the Raleigh-Durham Airport Authority(the “Authority”), is hereby submitted for the fiscal year ended March 31, 2013.Responsibility for the accuracy of the data and completeness and fairness of thepresentation, including all disclosures, rests with the Finance department of theAuthority. To the best of our knowledge and belief, the enclosed data is accurate in allmaterial respects and is reported in a manner designed to present fairly the financialposition and results of operations of the Authority.
The Comprehensive Annual Financial Report (CAFR)
The Comprehensive Annual Financial Report is presented in three sections –Introductory, Financial and Statistical. The Introductory section includes this Letter ofTransmittal, a depiction of the Authority Board Members, the Authority’s OrganizationChart and the Certificate of Achievement for Excellence in Financial Reporting Award ofthe Authority for its prior year FY 2011-12 submission. This Certificate of Achievementis a national award recognizing conformance with the highest standards for preparationof state and local government finance reports. The Financial Section includes theIndependent Auditor’s Report, Management’s Discussion and Analysis (MD&A), BasicFinancial Statements, Required Supplementary Information, and SupplementalInformation. The Statistical Section includes selected financial trends, debt service, keyperformance indicators (“KPIs”) and other operating statistics, and economicdemographic information, presented on a multi-year basis.
This Letter should be read in conjunction with the accompanying ManagementDiscussion & Analysis (“MD&A”) in order to gather a more complete financial andbusiness picture of the Authority. It is our intent to submit the FY2012-2013Comprehensive Annual Report to the Government Finance Officers Association for theirreview and seek the award for the 5th consecutive year.
Reporting Entity
The Authority is a special joint agency of the Cities of Raleigh and Durham, NorthCarolina and the Counties of Wake and Durham, North Carolina created for thedevelopment, operation and maintenance of the Raleigh-Durham International Airport(RDU). The Authority was created and exists pursuant to a special act enacted by theGeneral Assembly of North Carolina in 1939, as amended, and by action taken by thesponsoring governmental units pursuant to that act. The Authority is governed by aneight member board appointed by the sponsoring governmental units.
viii
Reporting Entity (continued)
The Authority has many of the same powers of any North Carolina local government unitwith some notable exceptions. It has no power to impose any taxes. In order to financeAirport development, operation and maintenance, it charges fees to those who use oroperate businesses at the Airport. Annually the Authority receives $12,500 from each ofthe four governmental units that appoint its members. This total of $50,000 is less thanone-tenth of one percent of the Authority’s annual operating revenue.
Economy, Region & Air Service
The Board, its Finance Committee, the Airport Director, senior staff and financialmanagement continued to closely monitor and respond to the continuing financial andbusiness uncertainties facing the global, national and local economy, the airline industryand the Authority itself during fiscal year 2012-13. A detailed financial review processwith the Board continues to occur on a quarterly basis.
Raleigh, Durham, and Chapel Hill make up the three primary cities of the ResearchTriangle metropolitan region. The regional nickname of “The Triangle” originated afterthe 1959 creation of the Research Triangle Park, primarily located in Durham County,four miles from Downtown Durham. It is encompassed on three sides by the city ofDurham and roughly midway between the cities of Raleigh and Chapel Hill and the threemajor research universities of NC State University, Duke University, and UNC-ChapelHill. This 7,000 acre park set aside for research and research oriented manufacturingemploys approximately 42,000 people. Anchored by leading technology firms,government, and world-class universities and medical centers, the area’s economyconsistently performs very well.
Wake, Durham, and Orange counties are part of the larger 13-county economic regionknown as the Research Triangle Region and provide the primary economic base for airtransportation at the Airport. The airport alone is estimated to have over an $8 billioneconomic impact. In 2010, the Research Triangle Region’s Gross Domestic Product(GDP) was $95 billion or 22% of the State’s total GDP. In 2012, this region’semployment grew by 36,000. In addition, the 2012 Raleigh Metropolitan Statistical Areahas expanded 48% since 2000, making it the fastest growing metropolitan area in thenation with a population above 1 million. The airport’s total impact on regionalemployment involves an estimated 47,000 jobs with payrolls of $2.5 billion. In addition,about 4,700 workers are employed in various functions on the airport.
Based on 2010 U.S. Census data, North Carolina was the 10th largest state in thenation. Data from the 2010 Census reveals that North Carolina continues to be one ofthe fastest growing states in the U.S. Between 2000 and 2010, the state's populationgrew by over 1.3 million or 18.5%, almost twice the national rate increase of 9.7%.
RDU is a very busy commercial service airport served by eight major airlines and theirregional partners offering service from RDU to 39 destinations. The airlines include AirCanada, AirTran, American, Delta, JetBlue, Southwest Airlines, United, and U.S.Airways. For the year ending March 31, 2013, the top three carriers in terms of marketshare were Delta, Southwest, and American, respectively, comprising about 66% of totalpassengers. Major cargo carriers at RDU include Federal Express and UPS. The airportprocessed 9.23 million passengers and over 85,000 tons of air cargo in the FY 2012-13.
ix
Economy, Region & Air Service (continued)
RDU is recognized by the FAA as a medium size hub and is the second largest airport inthe North Carolina behind Charlotte Douglas International (CLT). RDU, however, servesalmost exclusively origin-destination (O&D) passengers while CLT serves largelyconnecting passengers.
General Aviation facilities at RDU include the 22,000-square foot General Aviation (GA)Terminal owned by the Authority supporting two Fixed-Base Operators, LandmarkAviation and TAC Air. The complex offers 30 acres of aircraft parking space for a varietyof aircraft sizes and much more.
Regarding air service development, recent air carrier actions announced include thefollowing:
American Airlines added daily nonstop service to Los Angeles in April, 2013 Delta Airlines upgraded its 3 times a week nonstop service to Los Angeles to
daily service, April 2013
Frontier Airlines begin serving RDU April 8, 2013 with a daily flight to Trenton,New Jersey
Delta Airlines will add four daily, nonstop flights to Philadelphia in September,2013
Delta will add daily, nonstop service to Salt Lake City in December, 2013
United Airlines added nonstop, daily service to San Francisco beginning August15, 2012
Southwest’s added the nonstop destination of RDU-Houston on April 22, 2012 Primary domestic service improvements continue with efforts to secure nonstop
service to Austin and additional frequency to Phoenix and Denver
In May 2012, to support targeted, new non-stop transcontinental and transatlanticdestinations, the Authority adopted its first formal Air Service Policy. This policy includesthe use of Authority managed marketing support for new routes and airport fee waiversas airline incentives to promote future route development.
FY 2012-13 Major Events and Initiatives
The Authority is also committed to continuing proactive management of the issuesbrought on by the continuing economic turbulence of recent years. Authorizedheadcount has been managed with no growth in number of positions for the previousfive years. For the Fiscal Year ending March 31, 2013, the number of authorized fulltime positions of the Authority was 289. For the FY 2013-2014, the Authority also keptits authorized headcount at 289 positions.
In addition to its full-time positions, the Authority employs up to 39 part-time lawenforcement officers (in addition to its full time force) to provide law enforcementpresence at the Security Checkpoints. The cost of this checkpoint security force isreimbursable from the Transportation Security Administration and thus, to the extentreimbursed, is not passed on to the air carriers.
x
FY 2012-13 Major Events and Initiatives (continued)
In January of 2011, the Authority opened the second phase of Terminal 2, in total a920,000 square foot, 36 gate, state of the art, common use passenger terminal currentlyoccupied by all of the airlines other than Southwest and AirTran. Terminal 2 has 40shops and restaurants. This completed, on time and on budget, the $573 millionTerminal 2 project begun a decade ago. With Terminal 2 now fully operational, theAuthority has begun a $68 million project to renovate and modernize Terminal 1. Thisproject is scheduled to be complete in early 2014. The design includes an automatedinline bag handling system, a larger and more navigable security checkpoint, pre-security concession space, new exterior, modernized restroom facilities, higher ceilingsand extensive use of glass and translucent material to enhance the natural lightinginside the terminal. Terminal 1 will be occupied by Southwest and AirTran with room toaccommodate additional carriers or operations.
In FY 2011-12 the Authority completed an initial land use study of six of the Authority’sundeveloped parcels. One major purpose of this study to determine suitability for afuture consolidated rental car center (CONRAC). No definitive decision has been madeas to either need or timing of the CONRAC other than that this demand driven project iscurrently outside the 5 year construction planning horizon. Initial discussions about afuture CONRAC took place with the existing rental car operators during FY 2011-12.
The Authority is justly proud of its industry-exceptional AA-/Aa3 bond ratings (FitchRatings and Moody’s respectively) and considers maintaining these ratings a topstrategic priority. During the FY 2012-13, Fitch Ratings and Moody’s both affirmed theirrespective AA- and Aa3 ratings, each with stable outlooks. At March 31st, 2013 theAuthority’s debt portfolio consisted of approximately 90% fixed rate and 10% variablerate revenue bond obligations, with a weighted average interest rate of 3.93%.
In light of continuing economic uncertainties, the Authority has developed a conservativebudget for fiscal year 2013-14 with projected operating revenue of $97.6 million. Thisrepresented a 2.6%, or $2.5 million increase over budgeted operating revenue for FY2012-13. The major components of this increase in budgeted revenue were increasedParking and Rental Car revenue. This increase in forecast operating revenue is basedon the Authority’s FY 2012-13 actual operating results of $98.0 million, and based on aflat, no growth enplanement forecast, affirming the Authority’s conservative budgetingand financial management practices.
Budgeted operating expenses increased 4.3% or $2.2 million for FY 2013-14 relative tothe prior fiscal year. This increase was predominately driven by increased Operatingprojects such as runway restriping and increased maintenance costs and maintenancecontracts associated with its Terminals in part due to certain building componentscoming off warranty in our new Terminal 2. This is anticipated as the Authority begins ittransition to asset management in the years ahead following over a decade of majorasset development.
Financial Information
The MD&A summarizes the Authority’s Statements of Net Position, Statement ofRevenues, Expenses and Changes in Net Position, and Statements of Cash Flows andis included in this report. The information in the MD&A should be read in conjunction withthe information in the Letter of Transmittal.
xi
Financial Information (Continued)
For FY 2012-13, Operating Revenues and passenger counts at RDU continued theirmodest upward trend having both increased in the previous three fiscal years. Also forFY 2012-13, 9.3 million passengers represented an increase of 0.4% which helped drivean Operating Revenue budget surplus of $2.9 million or 3.1%. Total Operating revenuefor FY 2012-13 slightly exceeded $98.0 million.
Internal Control Structure Framework
The financial statements of the Authority are prepared following U.S. generally acceptedaccounting principles applicable to governmental unit enterprise funds. Annually, theAuthority’s Audit Department’s auditors evaluate the internal controls related to Raleigh-Durham Airport Authority’s financial reporting as a part of and in coordination with theAuthority’s external audit. On an ongoing basis, the Audit department operates under anannual audit plan currently approved by the Deputy Airport Director - Finance, Businessand Administration, the Airport Director, and the Board Finance/Audit Committee. TheAudit Plan includes substantial coverage of the Authority’s agreements withconcessionaires, airline carriers and other tenant agreements, key departmentalfunctions, and key business processes. While overall responsibility for the developmentand maintenance of Internal Controls clearly rests with Authority management,significant investments in the Internal Audit function over recent years have made apositive impact on the Authority’s overall control environment.
Internal control is a process affected by an entity’s governing board, management andother personnel and designed to provide reasonable assurance regarding theachievement of objectives in the following categories: (a) safeguarding of assets fromloss, from unauthorized use or disposition; (b) execution of transactions in accordancewith management’s authorization; (c) reliability of financial records for preparing financialstatements and maintaining accountability for assets; (d) effectiveness and efficiency ofoperation; and (e) compliance with applicable laws and regulations.
Internal controls, no matter how well designed and operated, can provide onlyreasonable assurance to management and the Board regarding achievement of anentity’s control objective. The likelihood of achievement is affected by limitationsinherent to internal control. Such limitations include:
1. Human judgment in decision-making can be faulty;2. Breakdowns in internal controls can occur due to errors or mistakes;3. Controls can be circumvented by the collusion of two or more people or
management override of internal controls;4. Cost of an entity’s internal controls should not exceed the benefits that are
expected to be derived; and5. Custom, culture and the corporate governance system inhibit irregularities by
management, but they are not absolute deterrents.
All internal control evaluations occur within the above framework. We believe that theAuthority’s internal controls adequately meet the objectives listed above and havedevoted considerable effort to attract and retain individuals in our finance departmentand organization who embrace the concept of a healthy internal control environment.
xii
Budgetary Controls
The Authority’s annual operating and capital budgets are reviewed in a Board worksession and subsequently approved at the regular meeting annually in March for theupcoming fiscal year that begins on April 1. Operating Budget approval is at the totaloperating expenditures level. The Authority Operating budget is a single enterprise fund.Subsequent individual expenditures against budget are subject to the Authority’sProcurement Policy, Minority and Women-Owned Small Business policy, and otherprocess and system controls including transaction signature authority limits and FinanceOfficer review.
The Authority will continue to maintain its cash reserve policy to set aside and reservean operating cash reserve of one times the current fiscal year’s annual OperatingBudgeted Expenses (excluding depreciation). For FY 2012-13 and FY 2013-14, thiscash reserve was maintained at the policy cap of $50 million. Authority policy requiresthat this reserve not be expended, encumbered, or budgeted for any purpose inexecuting Authority fiscal policy without Board approval and notification of the bondrating agencies that maintain bond ratings for the Authority.
The Authority adopts its budgets with the commitment to maintain a fiscally sound airportwith a low airline cost structure. The Authority continues to cost its services to aircarriers at about 75% of the medium hub average per the most recent ACI (Air CouncilInternational) survey data. Total budgeted Airline Cost per Enplanement (CPE) for RDUdecreased 2.6% for fiscal year 2013-2014 to $6.30.
Strategic Planning
Our vision-to be a world class airport- and our mission- to deliver excellent airportservices, facilities and unparalleled customer service – guide the Authority’s strategicbusiness plan. The FY 2013-14 Operating and Capital budgets are also driven by theAuthority’s strategic business plan, the new airport operating environment, and theongoing commitment to maintaining a fiscally sound airport. The primary areas of focusfor FY 2013-14 will be:
1. Elevating the customer experience2. Increasing emphasis on revenue management3. Transitioning from infrastructure and asset development to asset management4. Broadening the organization’s corporate governance, community engagement
and internal culture to meet new challenges and opportunities
In addition, the Authority is developing a comprehensive 3-5 year financial forecast tosupport its Strategic Planning and Budget processes. With its 2013 Strategic Businessplan, the Authority is taking steps to address the new low-growth aviation environmentwith dynamic strategic planning combined with a flexible business plan capable ofresponding to industry changes and opportunities.
Subsequent Events
For the 8th year in a row, RDU was recognized by the Air Transport Research Society(ATRS) as one of the top three airports in North America for both overall financialoperating efficiency and cost competitiveness. The ATRS is the leading academicsociety in the air transportation field and measures and compares the operating and
xiii
Subsequent Events (Continued)
managerial efficiency and cost competitiveness of 183 airports and 25 airport groupsworldwide. RDU was again ranked in the top 3 airports overall in the category of lessthan 15 million passenger enplanements for 2013. This acknowledgement reinforces theAuthority’s efforts to maintain low operating costs for the airlines that serve the Airportand its success in doing so.
With respect to AMR’s recent bankruptcy, American Airlines has modified and acceptedits lease with the Authority in late 2012 which will expire in June 2017. Americanreduced its number of leased gates from 8 to 5 and returned additional space as well.All Authority pre-petition bankruptcy claims for American were fully cured during thisprocess without having to draw on American’s collateral held by the Authority. While theAuthority cannot predict the final outcome of the American/US Airway’s ongoing merger,we are closely monitoring the situation and do not expect major changes. For FY 2012-13 American and USAirways (including affiliates) represented 17.1% and 15.2% of totalpassengers, respectively.
Independent Audit
The Authority’s independent auditor, Cherry Bekaert LLP, has performed the annualaudit as of and for the fiscal period ended March 31, 2013, and rendered an unqualifiedopinion as to the Authority’s financial statements. The audit is conducted in a mannerconsistent with the requirements of the Single Audit Act and the Office of Managementand Budget Circular A-133. The report and opinion are contained herein, and found thatthe Authority’s financial statements presented fairly, in all material respects, the financialposition of the Authority as of March 31, 2013 and 2012.
The Government Finance Officers Association (GFOA) awarded a Certificate ofAchievement for Excellence in Financial Reporting to the Authority for its comprehensiveannual financial report (CAFR) for the fiscal year ended March 31, 2012. This was the4th consecutive year of award. In order to be awarded a Certificate of Achievement, agovernment entity must publish an easily readable and efficiently organized CAFR. Thereport must satisfy both accounting principles generally accepted in the United States ofAmerica and applicable legal requirements.
A Certificate of Achievement is valid for a period of one year only. We believe that ourcurrent CAFR continues to meet the Certificate of Achievement Program’s requirementsand we are submitting it to the GFOA to determine its eligibility for another certificate.
Acknowledgements
The completion of this report would not have been possible without the support of theBoard and the Airport Director’s commitments to continuous improvement of thecorporate governance and financial reporting function. In addition, key members of theFinance department played a major role in bringing this expanded report to the Authority.

Raleigh-Durham Airport AuthorityRDU Airport, North Carolina
Financial Section
Prepared by the Finance Department
1
Report of Independent Auditor To the Members Raleigh-Durham Airport Authority RDU Airport, North Carolina Report on the Financial Statements We have audited the accompanying financial statements of the Raleigh-Durham Airport Authority (the Authority), which comprise the statements of net position as of March 31, 2013 and 2012, and the related statements of revenues, expenses and changes in net position, and cash flows for each of the years then ended, and the related notes to the financial statements. Management’s Responsibility for the Financial Statements Management is responsible for the preparation and fair presentation of the financial statements in accordance with accounting principles generally accepted in the United States of America; this includes the design, implementation, and maintenance of internal control relevant to the preparation and fair presentation of financial statements that are free from material misstatement, whether due to fraud or error. Auditor’s Responsibility Our responsibility is to express opinions on these financial statements based on our audits. We conducted our audit in accordance with auditing standards generally accepted in the United States of America and the standards applicable to financial audits contained in Government Auditing Standards, issued by the Comptroller General of the United States. Those standards require that we plan and perform the audit to obtain reasonable assurance about whether the financial statements are free from material misstatement. An audit involves performing procedures to obtain audit evidence about the amounts and disclosures in the financial statements. The procedures selected depend on the auditor’s judgment, including the assessment of the risks of material misstatement of the financial statements, whether due to fraud or error. In making those risk assessments, the auditor considers internal control relevant to the Authority’s preparation and fair presentation of the financial statements in order to design audit procedures that are appropriate in the circumstances, but not for the purpose of expressing an opinion on the effectiveness of the Authority’s internal control. Accordingly, we express no such opinion. An audit also includes evaluating the appropriateness of accounting policies used and the reasonableness of significant accounting estimates made by management, as well as evaluating the overall presentation of the financial statements. We believe that the audit evidence we have obtained is sufficient and appropriate to provide a basis for our audit opinions. Opinions In our opinion, the financial statements referred to above present fairly, in all material respects, the respective financial position of the Authority as of March 31, 2013 and 2012, and results of their operations and their cash flow for the years then ended in accordance with accounting principles generally accepted in the United States of America.
2
Other Matters
Emphasis of Matter As discussed in Note 2 to the financial statements, the Net Position section of the Statements of Financial Position has been reclassified. The Authority implemented GASB Statement No. 63 Financial Reporting of Deferred Outflows of Resources, Deferred Inflows of Resources, and Net Position and GASB Statement No. 65 Items Previously Reported as Assets and Liabilities. These statements require that certain assets and liabilities be classified as deferred outflows of resources and deferred inflows of resources and certain assets and liabilities be removed. Our opinion is not modified with respect to these matters.
Required Supplemental Information Accounting principles generally accepted in the United States of America require that the Management’s Discussion and Analysis, pages 3 – 14, and the required supplemental information, pages 43 – 46, be presented to supplement the financial statements. Such information, although not a part of the financial statements, is required by the Governmental Accounting Standards Board, who considers it to be an essential part of financial reporting for placing the financial statements in an appropriate operational, economic, or historical context. We have applied certain limited procedures to the Management’s Discussion and Analysis and required supplemental information in accordance with auditing standards generally accepted in the United States of America, which consisted of inquiries of management about the methods of preparing the information and comparing the information for consistency with management’s responses to our inquiries, the financial statements, and other knowledge we obtained during our audit of the financial statements. We do not express an opinion or provide any assurance on the information because the limited procedures do not provide us with sufficient evidence to express an opinion or provide any assurance.
Other Information Our audit was conducted for the purpose of forming an opinion on the Authority’s basic financial statements. The introductory section, pages i – xiv; supplemental information, pages 47 – 88; and statistical section, pages 89 – 108; are presented for purposes of additional analysis and are not a required part of the basic financial statements. The supplemental information is the responsibility of management and was derived from and relate directly to the underlying accounting and other records used to prepare the basic financial statements. Such information has been subjected to the auditing procedures applied in the audit of the basic financial statements and certain additional procedures, including comparing and reconciling such information directly to the underlying accounting and other records used to prepare the basic financial statements or to the basic financial statements themselves, and other additional procedures in accordance with auditing standards generally accepted in the United States of America. In our opinion, the supplemental information is fairly stated, in all material respects, in relation to the basic financial statements as a whole. The introductory and statistical sections have not been subjected to the auditing procedures applied in the audit of the basic financial statements and, accordingly, we not express an opinion or provide any assurance on them.
Other Reporting Required by Governmental Auditing Standards In accordance with Government Auditing Standards, we have also issued our report dated June 12, 2013, on our consideration of the Authority’s internal control over financial reporting and on our tests of its compliance with certain provisions of laws, regulations, contracts, and grant agreements and other matters. The purpose of that report is to describe the scope of our testing of internal control over financial reporting and compliance and the results of that testing, and not to provide an opinion on the internal control over financial reporting or on compliance. That report is an integral part of an audit performed in accordance with Government Auditing Standards and should be considered in assessing the results of our audits.
Raleigh, North Carolina June 12, 2013
RALEIGH–DURHAM AIRPORT AUTHORITYMANAGEMENT’S DISCUSSION AND ANALYSIS
Years Ended March 31, 2013 and 2012
3
Overview
The management discussion and analysis (“MD&A”) provides an overview of the Raleigh-DurhamAirport Authority’s (the “Authority”) activities during the fiscal years ended March 31, 2013 and March31, 2012. The Authority’s basic financial statements consist of three components; 1) Management’sDiscussion and Analysis, 2) financial statements, and 3) notes to the financial statements. In addition tothe management’s discussion and analysis, management has prepared the accompanying Statementsof Net Position, Statements of Revenues, Expenses and Changes in Net Position, and Statements ofCash Flows.
The MD&A is intended to aid the reader in interpreting the Authority’s relative financial position as of theabove referenced date. Condensed key financial as well as non-financial information will be highlightedfor the reader.
Required Financial Statements
The Financial Statements of the Authority report information about the Authority using accountingmethods similar to those used by private sector companies. These statements offer short and long-term financial information about its activities. The Statements of Net Position include all of theAuthority’s assets and liabilities and provides information about the nature and amounts of investmentsin resources (assets) and the obligations to Authority creditors (liabilities). It also provides the basis forcomputing rate of return, evaluating the capital structure of the Authority and assessing the liquidity andfinancial flexibility of the Authority. All of the current year’s revenues and expenses are accounted for inthe Statements of Revenues, Expenses, and Changes in Net Position. These statements can be usedto measure the success of the Authority’s operations over the past year, its financial position and canbe used to determine the Authority’s overall profitability, financial strength and credit worthiness. Thefinal required financial statement is the Statement of Cash Flows. The primary purpose of thisstatement is to provide information about the Authority’s cash receipts and cash payments during thereporting period. The statement reports cash receipts, cash payments, and net changes in cashresulting from operations, investing, and financing activities and provides answers to such questions aswhere did cash come from, what was cash used for, and what was the change in cash balance duringthe reporting period.
Notes to Basic Financial Statements
The notes provide additional information that is essential to a full understanding of the data provided inthe financial statements. The notes to the financial statements are on pages 20 to 42 of this report.
Background
The Raleigh-Durham International Airport (the “Airport”) is located in Wake County, between the Citiesof Raleigh and Durham approximately 10 miles from the downtown areas of each of Raleigh andDurham. Interstate 40, a major thoroughfare, is located immediately to the southwest of the Airport andUS Highway 70, another major thoroughfare, located immediately to the northeast of the Airport.William B. Umstead State Park is located to the immediate east of the Airport. The Airport consists ofapproximately 5,100 acres, approximately 2,075 of which are developed. The Airport has two activeterminals, 1 and 2. The newly constructed $573 million Terminal 2, a state of the art, common use
RALEIGH–DURHAM AIRPORT AUTHORITYMANAGEMENT’S DISCUSSION AND ANALYSIS
Years Ended March 31, 2013 and 2012
4
Background (Continued)
facility consists of approximately 900,000 square feet of floor space, including 36 passenger gates.The North Concourse of Terminal 2 opened October 26, 2008, while the final phase, or the SouthConcourse of Terminal 2, opened January 23, 2011. Having completed the Terminal 2 project, theAuthority has undertaken a project to renovate and modernize Terminal 1. Construction on this $68million project is scheduled to be complete in early 2014. Terminal 1 as configured during theconstruction period operates with 5 gates and is home to Southwest Airlines and AirTran. Terminal 1,once renovated, will be home to Southwest Airlines and potentially other carriers and operate with 9gates.
The Airport has two primary runways and one secondary runway. In the fiscal years ended March 31,2013 and 2012, 9.3 and 9.2 million passengers, respectively, used the Airport.
Passenger Facility Charges
In February 2003, the Authority received final approval from the Federal Aviation Administration (FAA)to begin charging a $3 passenger facility charge (“PFC”) effective May 1st, 2003. In fiscal year 2004-05,the Authority received approval from the FAA to increase this charge from $3.00 to $4.50 per eligibleenplanement effective October 1st, 2004. PFC cash balances decreased 30.4%, or $4.7 million for thefiscal year ending March 31, 2013 versus the prior year. This was primarily due to the plannedirrevocable commitment of PFC’s applied to debt service during FY 2012-13, or $23.634 million,exceeding PFC revenues of $18.7 million received during the same period. These PFC balances arerestricted for use on FAA approved projects as reimbursement of capital costs or to offset PFC eligibledebt service.
Annual PFC revenue of $18.7 million increased $311 thousand or 1.7% for FY 2012-13, relative to theprior year. In addition, a portion of PFCs are irrevocably committed to offset Authority debt servicebeginning FY 2005-06. This irrevocable commitment for the fiscal years ending March 31, 2013, 2012,and 2011, was $23,634,000, $22,946,000, and $22,442,000, respectively. Irrevocable commitments tothe extent not applied to debt service are carried forward for future application.
Financial Highlights and Analysis
Net Position
Current assets increased 2.0%, or $3.1 million from the prior year due to increased short-terminvestments of $30.3 million. Primarily offsetting this increase was a $26.9 million decrease in cashand cash equivalents and a $1.4 million decrease in Accounts receivable. Current assets increased1.2%, or $1.9 million from March 2011 to March 2012 due to increased cash and cash equivalents of$33.8 million and accounts receivable of $1.1 million. Primarily offsetting this increase was a $31.3million decrease in short term investments due primarily to the end of year reimbursement of $23million of PFC funds and related transfer from restricted to unrestricted cash. In addition, a $1.7 milliondecrease in grants receivable also offset the increase in cash and cash equivalents.
Total non-current assets, consisting of restricted assets and airport and facilities, net decreased $15.8million or 1.6%. This decrease was in part related to the reduction of PFC cash and cash equivalents
RALEIGH–DURHAM AIRPORT AUTHORITYMANAGEMENT’S DISCUSSION AND ANALYSIS
Years Ended March 31, 2013 and 2012
5
Net Position (Continued)
of $4.7 million. However, the largest part of this reduction, or $9.5 million, was related to a decrease inairport and facilities, net resulting from current depreciation exceeding the amount capitalized for theperiod. For the FY 2011-12, non-current assets, consisting of restricted assets and airport andfacilities, net decreased $35.6 million or 3.4%. This decrease was in part related to the reduction ofPFC cash and cash equivalents of $4.3 million. However, the largest part of this reduction, or $32.4million, was related to a decrease in airport and facilities, net which resulted from a large increase indepreciation, primarily a full year of Terminal 2 being recorded in FY 2011-12, compared to a half yearin the prior fiscal period.
Restricted assets decreased $6.3 million or 9.6% primarily due to a $4.7 million or $30.4% decrease inPFC cash and cash equivalents and a decrease in the parity reserve fund of $1.3 million or 2.8%.Restricted assets decreased $3.2 million or 4.5% from March 2011 to March 2012 primarily due to a$4.3 million decrease in PFC cash and cash equivalents. Offsetting this decrease in PFC cash andcash equivalents was an increase in Parity debt service reserve funds of $1.7 million or 3.7%.
Airport and facilities, net decreased $9.5 million or 1.0% primarily related to a decrease in airport andfacilities, net resulting from current depreciation exceeding the amount capitalized for the period.Airport and facilities, net decreased $32.4 million or 3.3% from March 2011 to March 2012 primarily dueto a full year of depreciation of Terminal 2 being recorded in FY 2011-12, compared to a half year inthe prior fiscal period.
The combined effect of the above items was to decrease total assets $12.7 million or 1.1% for the fiscalyear ended March 2013, and $34.3 million or 2.8% for the fiscal year ended March 2012, and $26.5million or 2.1% for the fiscal year ended March 2011.
For the period ending March 31, 2013, current liabilities increased by $7.5 million or 19.6% due to anincrease in retainage and construction accounts payable of $8.2 million related to the Terminal 1project, and a decrease in account payable of $1.0 million. For the prior period, March 2011 to March2012, current liabilities decreased by $3.5 million or 8.4% primarily due to a decrease in retainage andconstruction accounts payable of $3.1 million, and a decrease in other liabilities of $1.75 million.
Total non-current liabilities decreased by $18.7 million or 2.6% primarily due to decreases in long termdebt of $18.1 million and Debt issue premiums of $1.5 million both the result of scheduled principalreductions and premium amortizations, respectively. Slightly offsetting this decrease was a combinedincrease in OPEB Retiree cost and Separation allowance costs of $906 thousand. For the prior periodending March 31, 2012, total non-current liabilities decreased by $18.1 million or 2.5%, primarily due todecreases in long term debt of $17.4 million and Debt issue premiums, net of $1.2 million. This was theresult of scheduled principal reductions and premium amortizations, respectively.
Total deferred inflows of resources decreased $780 thousand or 59.1% due to the reduction in rentcredits related to lease changes with an air carrier.
The combined effect of these items was to decrease net position during the year ended March 31, 2013by $713 thousand or .2%, $12.1 million or 2.7%, for the year ended March 31, 2012, respectively. Netposition at March 31, 2013, March 31, 2012, and March 31, 2011 are presented in the following table:
RALEIGH–DURHAM AIRPORT AUTHORITYMANAGEMENT’S DISCUSSION AND ANALYSIS
Years Ended March 31, 2013 and 2012
6
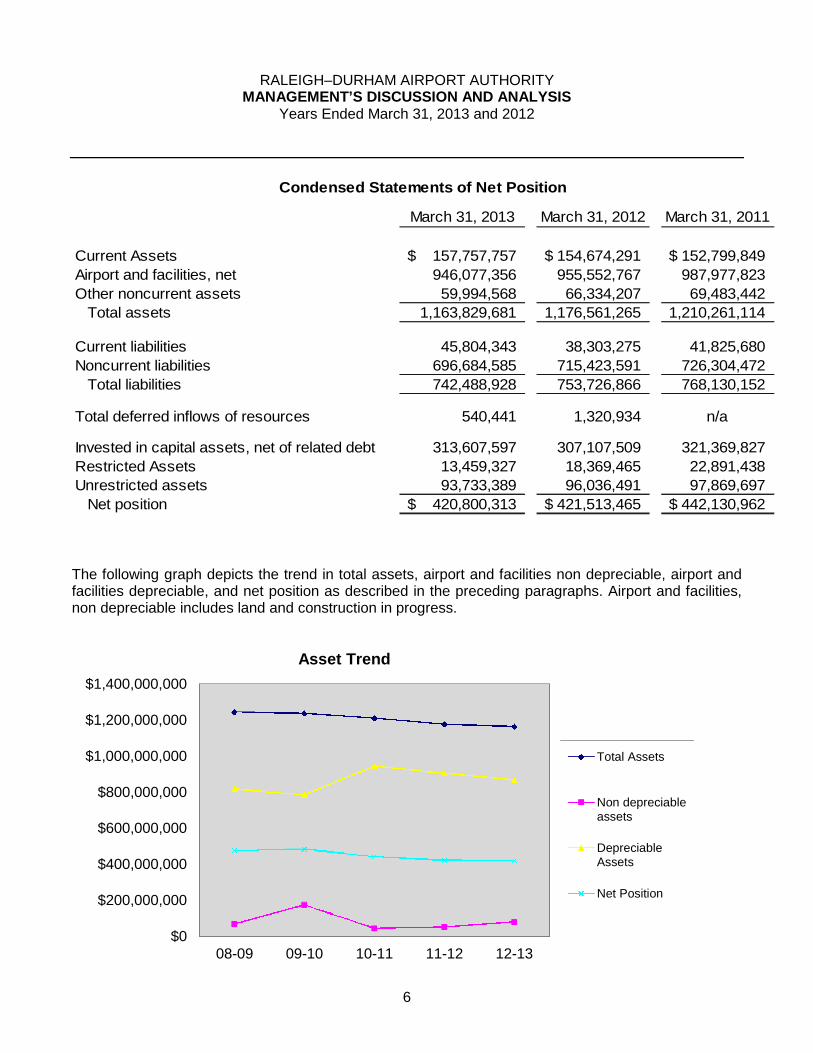
Condensed Statements of Net Position
March 31, 2013 March 31, 2012 March 31, 2011
Current Assets 157,757,757$ 154,674,291$ 152,799,849$
Airport and facilities, net 946,077,356 955,552,767 987,977,823
Other noncurrent assets 59,994,568 66,334,207 69,483,442
Total assets 1,163,829,681 1,176,561,265 1,210,261,114
Current liabilities 45,804,343 38,303,275 41,825,680
Noncurrent liabilities 696,684,585 715,423,591 726,304,472
Total liabilities 742,488,928 753,726,866 768,130,152
Total deferred inflows of resources 540,441 1,320,934 n/a
Invested in capital assets, net of related debt 313,607,597 307,107,509 321,369,827
Restricted Assets 13,459,327 18,369,465 22,891,438
Unrestricted assets 93,733,389 96,036,491 97,869,697
Net position 420,800,313$ 421,513,465$ 442,130,962$
The following graph depicts the trend in total assets, airport and facilities non depreciable, airport andfacilities depreciable, and net position as described in the preceding paragraphs. Airport and facilities,non depreciable includes land and construction in progress.
$0
$200,000,000
$400,000,000
$600,000,000
$800,000,000
$1,000,000,000
$1,200,000,000
$1,400,000,000
08-09 09-10 10-11 11-12 12-13
Asset Trend
Total Assets
Non depreciableassets
DepreciableAssets
Net Position
RALEIGH–DURHAM AIRPORT AUTHORITYMANAGEMENT’S DISCUSSION AND ANALYSIS
Years Ended March 31, 2013 and 2012
7
Revenues, Expenses, and Change in Net Position
For the fiscal year ended March 31, 2013, the Authority experienced a $3.6 million increase (3.9%) inoperating revenue, due primarily to an increase in parking revenue of $4.0 million compared to the prioryear. This overall increase in operating revenue was realized with an increase in passengers of 35thousand or .4% for the fiscal year ended March 31, 2013, relative to the prior fiscal year. TheAuthority’s rates and charges to air carriers remained at the low end of comparable airports. Inaddition, the Authority’s airline derived revenue remained diversified with no single carrier accountingfor more than approximately 9% of operating revenue for the fiscal year ended March 31, 2013.
For the fiscal year ended March 31, 2012, the Authority experienced a $4.8 million increase (5.3%) inoperating revenue, due primarily to an increase in parking revenue of $1.3 million and terminal revenueof $2.4 million, compared to the prior year. This overall increase in operating revenue was realized withan increase in enplaned passengers of 52 thousand or .6% for the fiscal year ended March 31, 2012,relative to the prior fiscal year. The Authority’s rates and charges to air carriers remained at the low endof comparable airports. In addition, the Authority’s airline derived revenue remained diversified with nocarrier accounting for more than approximately 8% of operating revenue for the fiscal year endedMarch 31, 2012.
Operating expenses (excluding depreciation) increased 1.8%, or $861 thousand, for the fiscal yearended March 31, 2013 relative to the prior year. This increase was primarily due to increases inAdministrative costs of $473 thousand or 4.9%, and an increase in Airport Maintenance costs of $435thousand or 8.5%, resulting from increased costs associated with maintaining equipment and assets.Depreciation expense decreased 1.4% or $681 thousand during the fiscal year ended March 31, 2013.Thus, total Operating expenses (including depreciation), increased .2%, or $180 thousand. Thecombined effect of the above items was a 93.7% or $3.5 million decrease in the Operating loss, relativeto the prior period. Nearly all of this decrease in Operating loss was directly related to increasedrevenue related to Parking.
Operating expenses (excluding depreciation) increased 1.6%, or $746 thousand, for the fiscal yearended March 31, 2012 relative to the prior year. This increase was primarily due to increases in Airportfacilities costs associated with the full year operation of Terminal 2 South concourse. Depreciationexpense increased 4.8% or $2.3 million during the fiscal year ended March 31, 2012. This increase wasdue to the full year addition of phase 2, Terminal 2 to depreciation expense ($9.5 million) vs. half yeardeprecation in the prior year. Thus, total Operating expenses (including depreciation), increased 3.2%,or $3.0 million. The combined effect of the above items was a 32.1% or $1.8 million decrease inOperating loss, relative to the prior period. Nearly all of this decrease in Operating loss was directlyrelated to increased Parking and Terminal revenue.
For FY 2012-13, non-operating revenues (expenses) in total decreased $2.8 million due to thefollowing: reductions in both the loss on swap terminations of $1.5 million, and $861 thousand lessbond interest expense, as compared to FY 2011-12.
For FY 2011-12, non-operating revenues (expenses) in total decreased $34.7 million due to thefollowing: reductions in both the loss on swap terminations of $32.9 million, and $5.4 millionamortization of deferred expenses for the 2001A bond refunding, as compared to FY 2010-11.
RALEIGH–DURHAM AIRPORT AUTHORITYMANAGEMENT’S DISCUSSION AND ANALYSIS
Years Ended March 31, 2013 and 2012
8
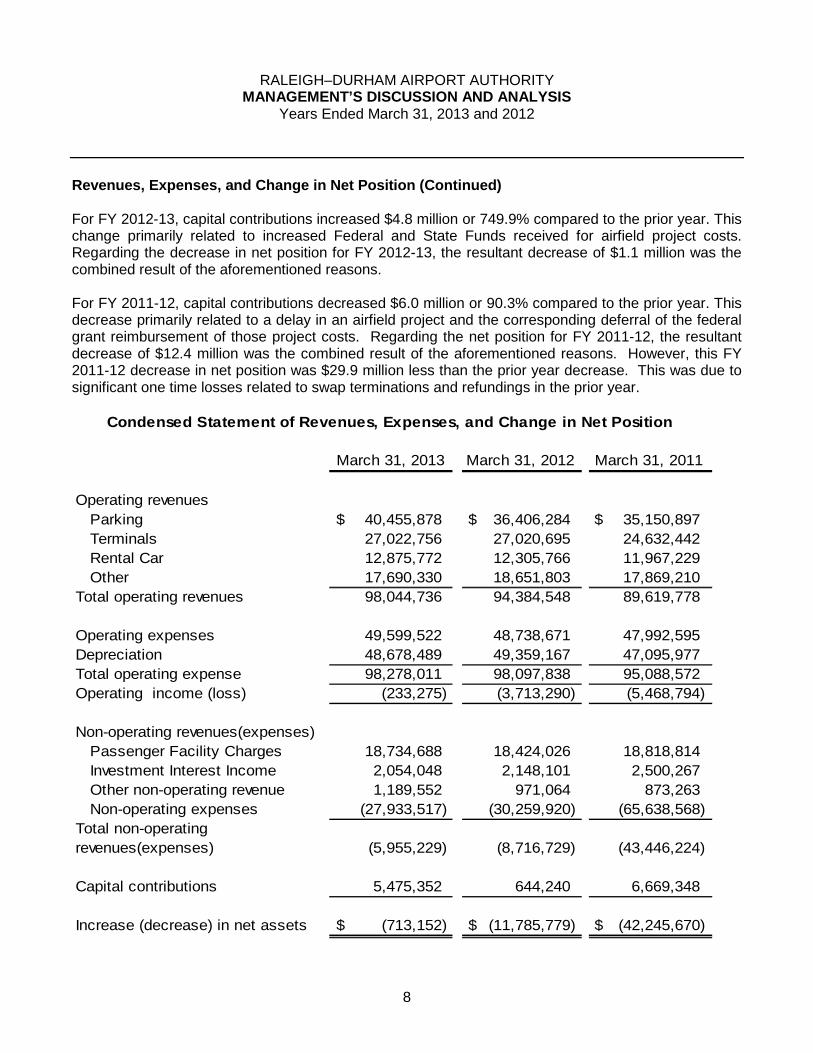
Revenues, Expenses, and Change in Net Position (Continued)
For FY 2012-13, capital contributions increased $4.8 million or 749.9% compared to the prior year. Thischange primarily related to increased Federal and State Funds received for airfield project costs.Regarding the decrease in net position for FY 2012-13, the resultant decrease of $1.1 million was thecombined result of the aforementioned reasons.
For FY 2011-12, capital contributions decreased $6.0 million or 90.3% compared to the prior year. Thisdecrease primarily related to a delay in an airfield project and the corresponding deferral of the federalgrant reimbursement of those project costs. Regarding the net position for FY 2011-12, the resultantdecrease of $12.4 million was the combined result of the aforementioned reasons. However, this FY2011-12 decrease in net position was $29.9 million less than the prior year decrease. This was due tosignificant one time losses related to swap terminations and refundings in the prior year.
Condensed Statement of Revenues, Expenses, and Change in Net Position
March 31, 2013 March 31, 2012 March 31, 2011
Operating revenues
Parking 40,455,878$ 36,406,284$ 35,150,897$
Terminals 27,022,756 27,020,695 24,632,442
Rental Car 12,875,772 12,305,766 11,967,229
Other 17,690,330 18,651,803 17,869,210
Total operating revenues 98,044,736 94,384,548 89,619,778
Operating expenses 49,599,522 48,738,671 47,992,595
Depreciation 48,678,489 49,359,167 47,095,977
Total operating expense 98,278,011 98,097,838 95,088,572
Operating income (loss) (233,275) (3,713,290) (5,468,794)
Passenger Facility Charges 18,734,688 18,424,026 18,818,814
Investment Interest Income 2,054,048 2,148,101 2,500,267
Other non-operating revenue 1,189,552 971,064 873,263
Non-operating expenses (27,933,517) (30,259,920) (65,638,568)
Total non-operating
revenues(expenses) (5,955,229) (8,716,729) (43,446,224)
Capital contributions 5,475,352 644,240 6,669,348
Increase (decrease) in net assets (713,152)$ (11,785,779)$ (42,245,670)$
Non-operating revenues(expenses)
RALEIGH–DURHAM AIRPORT AUTHORITYMANAGEMENT’S DISCUSSION AND ANALYSIS
Years Ended March 31, 2013 and 2012
9
Cash Flows
The Authority’s overall unrestricted liquidity position consisting of cash and cash equivalents, and short-term investments increased during FY 2012-13 by $3.4 million or 2.3% largely due to increased parkingrevenue. For FY 2011-12, this unrestricted cash position also increased by $2.5 million or 1.8%. Thisincrease was largely due to increased Parking and Terminal revenues. The Authority’s unrestrictedcash position for FY 2010-2011 also increased by $9.1 million or 6.7%.
For FY 2012-13 restricted cash decreased $6.1 million or 9.7% primarily due to a $4.7 million reductionin PFCs and a $1.3 million decrease in Parity Debt Service Reserve funds. For FY 2011-12 restrictedcash decreased $2.9 million or 4.4% primarily due to a $4.3 million reduction in PFCs offset by a $1.7million increase in Parity Debt Service Reserve funds. For FY 2010-11, restricted cash decreased$65.5 million or 48.5% due to two factors: the spend down of PFCs ($47.0 million) and a reduction inbond proceeds ($21.3 million), both used to fund Terminal 2 construction costs.
With regard to the statement of cash flows for FY 2012-13, cash provided by operating activities of$48.9 million increased $4.0 million or 8.9% from the prior fiscal year. FY 2011-12, cash provided byoperating activities of $45.0 million increased slightly ($1.0 million or 2.4%) from the prior fiscal year.For FY 2010-11, cash provided by operating activities of $43.9 million decreased slightly ($646thousand or 1.5%) from the prior fiscal year.
For FY 2012-13, cash used in investing activities of $27.4 million represented an increase of $61.2million or 181.3%, relative to the prior fiscal year. This large increase in cash used by investingactivities was the result of increased longer-term investment utilization. For FY 2011-12, cash providedby investing activities of $33.7 million represented an increase of $61.4 million or 221.8%, relative tothe prior fiscal year. This large increase in cash provided by investing activities was the result ofincreased bond calls of Federal agencies due to reductions in short-term rates. For FY 2010-11, cashprovided by investing activities decreased $45.0 million or 259.7%, relative to the prior fiscal year. Thislarge increase in cash used by investing activities was the result of increased longer-term investmentutilization.
For FY 2012-13, cash used in capital and related financing activities or $54.5 million, represented aincrease of $6.7 million or 14.1% from the prior period. Primary contributors to this increase were anincrease in additions to Airport and Facilities of $11.0 million. Offsetting cash used in capital andrelated financing activities was an increase in Contributed capital of $2.4 million related to additionalgrant receipts.
For FY 2011-12, cash used in capital and related financing activities or $47.8 million, represented adecrease of $55.1 million or 53.6% from the prior period. Primary contributors to this decrease were areduction in additions to Airport and Facilities of $64.5 million (compared to the prior year addition ofTerminal 2 South Concourse), and a reduction of $38.3 million in the amount of loss on swapterminations. Offsetting this decrease in capital and related financing activities was a decrease in debtissuance premiums ($27.0 million).
For FY 2010-11, cash used by capital and financing activities was $102.9 million represented adecrease of $25.2 million or 19.7% from the prior period. Primary contributors to this decrease was areduction in additions to Airport and Facilities ($36.5 million), a loss on swap terminations and refundingbond issues ($39.7 million), and a reduction in contributed capital ($7.8 million). Offsetting this
RALEIGH–DURHAM AIRPORT AUTHORITYMANAGEMENT’S DISCUSSION AND ANALYSIS
Years Ended March 31, 2013 and 2012
10
Cash Flow (continued)
decrease in capital and related financing activities was an increase in debt issuance premiums ($25.9million).
For FY 2012-13 positive operating cash activities ($48.9 million) offset by cash used in investmentactivities ($27.4 million) and offset by cash used by capital and related financing activities ($54.5million) combined to produce an overall decrease in cash and cash equivalents of $33.0 million.
For FY 2011-12 positive operating cash activities ($45.0 million) along with increased cash provided byinvestment activities ($33.7 million) offset by cash used by capital and related financing activities ($47.8million) combined to produce an overall increase in cash and cash equivalents of $30.9 million.
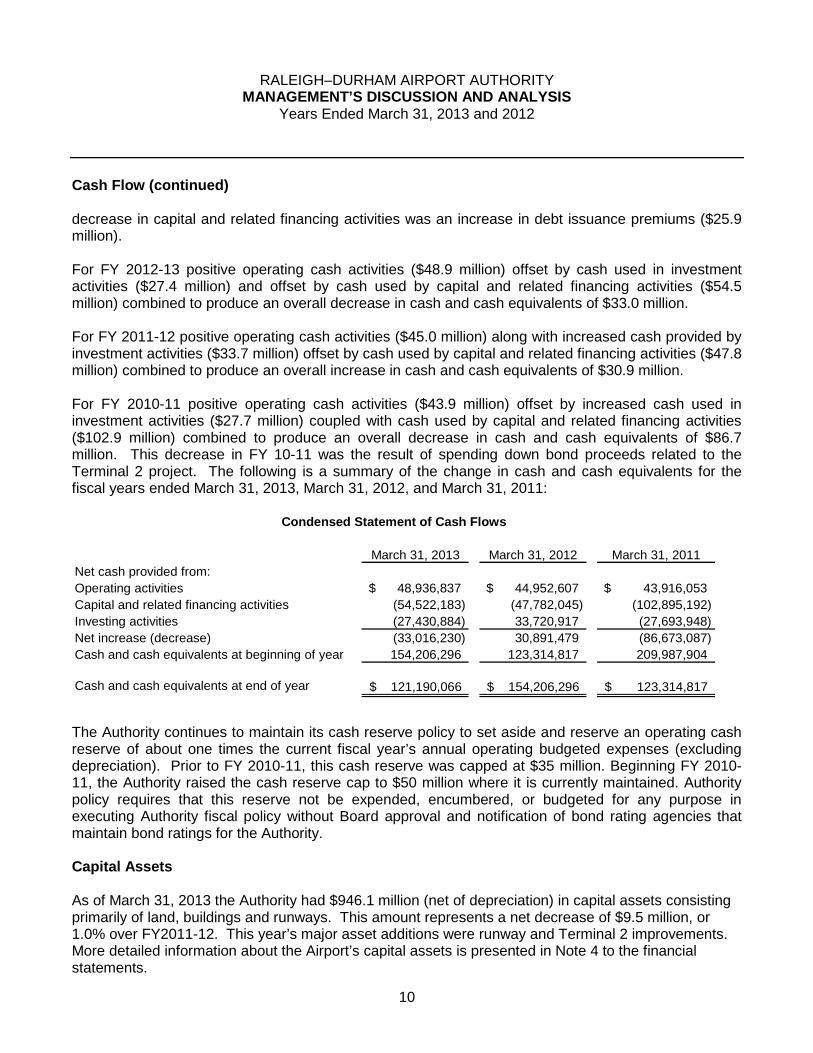
For FY 2010-11 positive operating cash activities ($43.9 million) offset by increased cash used ininvestment activities ($27.7 million) coupled with cash used by capital and related financing activities($102.9 million) combined to produce an overall decrease in cash and cash equivalents of $86.7million. This decrease in FY 10-11 was the result of spending down bond proceeds related to theTerminal 2 project. The following is a summary of the change in cash and cash equivalents for thefiscal years ended March 31, 2013, March 31, 2012, and March 31, 2011:
Condensed Statement of Cash Flows
March 31, 2013 March 31, 2012 March 31, 2011
Net cash provided from:
Operating activities 48,936,837$ 44,952,607$ 43,916,053$
Capital and related financing activities (54,522,183) (47,782,045) (102,895,192)
Investing activities (27,430,884) 33,720,917 (27,693,948)
Net increase (decrease) (33,016,230) 30,891,479 (86,673,087)
Cash and cash equivalents at beginning of year 154,206,296 123,314,817 209,987,904
Cash and cash equivalents at end of year 121,190,066$ 154,206,296$ 123,314,817$
The Authority continues to maintain its cash reserve policy to set aside and reserve an operating cashreserve of about one times the current fiscal year’s annual operating budgeted expenses (excludingdepreciation). Prior to FY 2010-11, this cash reserve was capped at $35 million. Beginning FY 2010-11, the Authority raised the cash reserve cap to $50 million where it is currently maintained. Authoritypolicy requires that this reserve not be expended, encumbered, or budgeted for any purpose inexecuting Authority fiscal policy without Board approval and notification of bond rating agencies thatmaintain bond ratings for the Authority.
Capital Assets
As of March 31, 2013 the Authority had $946.1 million (net of depreciation) in capital assets consistingprimarily of land, buildings and runways. This amount represents a net decrease of $9.5 million, or1.0% over FY2011-12. This year’s major asset additions were runway and Terminal 2 improvements.More detailed information about the Airport’s capital assets is presented in Note 4 to the financialstatements.
RALEIGH–DURHAM AIRPORT AUTHORITYMANAGEMENT’S DISCUSSION AND ANALYSIS
Years Ended March 31, 2013 and 2012
11
Economic Outlook and Capital Development
In 2000, the Authority, in response to record setting growth, was considering an extensiveredevelopment plan for Terminal A that would ultimately have expanded Terminal A from 23 gates to asmany as 40 gates. This plan would have added nearly 1,000,000 square feet of space to Terminal Aand would have potentially exceeded one billion dollars in cost.
Terminal C was built and paid for by American Airlines (AA) in 1987 through a Special Facility RevenueBond financing arrangement that originally provided AA with a forty-year lease, set to expire in 2027.The Terminal C facility was originally designed to house and support the AA hub operation begun in thelate 1980s. By FY 1996, American Airlines had closed it hubbing operation. During this time, MidwayAirlines relocated its hubbing operation from Chicago’s Midway Airport and subleased gates from AA inTerminal C. By FY 2002, Midway’s connecting passengers had fallen due to the 2001 recession. Whencoupled with the loss of traffic following the September 11, 2001 terrorist attacks, Midway ceasedoperations.
In FY 2001, connecting passengers represented 19% of total passengers which was down from AA’speak in 1995 of 61%. Thus, no longer a hub, RDU’s Origination and Destination (O&D) traffic reachedapproximately 96% where it remains today. In this new environment, Terminal C was not designed, norwas it able to effectively support a more diverse operation with multiple airlines with very little or about4% connecting traffic.
Subsequent to the major changes in the airline industry after September 11, 2001, the Authority and AAentered into an agreement, effective June 15, 2002, for the Authority to purchase AA’s leaseholdinterests at the Airport. This leasehold included Terminal C, certain cargo and fuel facilities as well asother airport improvements. This leasehold acquisition allowed the Authority the option to more costeffectively and efficiently expand and redevelop Terminal C rather than proceed with the redevelopmentof Terminal A. As a result, major redevelopment of Terminal A was deferred until some point after theredevelopment and expansion of Terminal C.
Now having effective control of the Terminal C facility, the Authority turned its attention to a majorredevelopment of Terminal C under a preliminary project budget of $350 million in 2003 dollars. Withthe additional planned redevelopment of the South Concourse, the project was subsequently revised to$573 million. In addition, these project costs were the result of extensive modeling and cost projectionsto incorporate a costing strategy to maintain the lowest possible cost per enplanement passenger to theairlines, thereby retaining the Airport’s competitive cost structure currently benchmarked at about 70%of the industry medium hub average.
During 2005, the Authority believed that an appropriate strategy with regard to financing this projectwas to limit risk associated with rising interest costs. Thus, the Authority developed a hedging programto lock in current historically low long-term interest rates through the use of forward interest rate swaps.On May 4, 2005, the Authority entered into two (2) negotiated synthetic fixed interest rate swaps (BMAor Bond Market Association Municipal Swap Index based) totaling $300,000,000. The purpose of thesetransactions was to fix interest costs related to the Terminal C Renovation and Expansion Project.
RALEIGH–DURHAM AIRPORT AUTHORITYMANAGEMENT’S DISCUSSION AND ANALYSIS
Years Ended March 31, 2013 and 2012
12
Economic Outlook and Capital Development (Continued)
Pursuant to these hedge agreements, the Authority on June 13, 2006, issued $300,000,000 of variablerate bonds, to be amortized over 30-years. Due to the swap agreements related to this debt, theAuthority was able to lock in a fixed interest rate of 4.27% on this transaction. Subsequent to the end ofFiscal Year 2007-08, the Authority refunded the Series 2006A-E Bonds in the amount of $300 millionon May 2, 2008. These bonds were variable, but underlying swaps convert this obligation to a fixedsynthetic rate. Several years later, these bonds were refunded to fix a trading problem associated withthe downgrade of the bond insurer the Authority used to insure these bonds. The new Series 2008A-Cbonds in the amount of $300 million had the identical amortization schedule as the Series 2006A-Erefunded bonds and were traded on the Authority’s credit rating (bond insurance was not used). Inaddition, the underlying swaps totaling $300 million on these bonds were not changed. The 2008A-Cbonds, once issued, returned to trading in a historic relationship to the benchmark tax exempt index.Thus, the trading problems associated with the ratings downgrade of the previous bond insurer wereresolved.
The financing for the Terminal 2 project was completed in 2007 with the issuance of $152 million offixed rate bonds on May 31, 2007. In connection with this financing, the Authority’s underlying creditrating was upgraded to AA- (from A+) and Aa3 (from A3) by Fitch Ratings and Moody’s InvestorService, respectively. A stable outlook was assigned in both cases and these ratings remain the sameat the end of FY 12-13.
On September 15, 2008 Lehman Brothers (Lehman) filed for bankruptcy and consequently defaulted onits $150 million swap agreement with the Authority. On February 9, the Airport Authority terminated theLehman swap at a cost to the Airport Authority of $9.1 million. Simultaneously, the Authority selectedBarclays and Morgan Keegan/Deutsche Bank as new swap counterparties and received $4,551,000from them to offset this payment made to Lehman Brothers. The new swaps were negotiated withBarclays in the amount of $50 million and with Morgan Keegan/Deutsche Bank in the amount of $25million. These new swaps were set at a swap rate of 4.099 percent, down from the 4.27 percentLehman swap rate, reducing the Airport Authority’s interest cost on this $75 million by approximately$128,000 per year. Thus, the remaining $75 million became un-hedged variable debt at that time.
Lehman had initially challenged the Authority’s calculations regarding these transactions and theAuthority’s calculation of the swap termination subsequent to Lehman’s default. Through mediation withLehman in the fall of 2011, the Authority successfully negotiated a final settlement of this swaptermination amount and all other related matters between the two parties.
On August 6th, 2010 the Authority elected to terminate all three of its interest rates swap positions.These swaps with Citigroup, Barclays Capital, and Morgan Keegan had notational values totaling$216.87 million at August 6, 2010. At this time, these swaps under existing market conditions had acollective market termination value of $33,549,516. In conjunction with these terminations, theAuthority simultaneously priced the 2010A refunding bonds in the amount of $242.365 million whichrefunded the 2008AB variable bonds (the swapped bonds), converting them to fixed rate non-AMTobligations. These swap positions had been undertaken in 2005 to lock in historically low interest rateson the Terminal 2 project in advance of its ability to access the bond markets. By eliminating its swappositions, the Authority sought to reduce its exposure to risks associated with the underlying variablerate demand obligations, particularly with regard to costs and availability of credit and liquidity support
RALEIGH–DURHAM AIRPORT AUTHORITYMANAGEMENT’S DISCUSSION AND ANALYSIS
Years Ended March 31, 2013 and 2012
13
Economic Outlook and Capital Development (Continued)
for the 2008A/B Bonds, and to risks associated with the interest rate swap agreements. Such risks hadincreased materially from 2005 when the Authority had entered into these swap agreements. As ofAugust 6, 2010 and additionally at March 31, 2013, the Authority had no interest rate swaps orderivatives in its debt portfolio.
During August 2010, the Authority also was able to advance refund the 2001A bonds with the series2010B and 2010B-1 bonds in the amounts of $94,080,000 and $38,235,000, respectively. Thesebonds achieved present value savings of 7.80% and 6.70%, respectively. Thus, with these refundingissues, the Authority officially defeased its 2001A bond obligations.
Prior to the swap terminations, the Authority and the North Carolina Local Government Commissionplaced a present value dis-savings cap of 3.0% on these transactions. The Authority achieved this goalwith associated present value dis-savings of 2.36% on these swap terminations on August 6, 2010. Incombination with present value savings from the 2010B and 2010B-1 refundings, the Authorityachieved overall present value savings of $5.2 million on the collective transactions.
In March 2011, in accordance with its financial plan, the Authority paid off (defeased) all its remaining2001B bond obligations by cash funding with the trustee the required payoff amount. The 2001B bondswere paid off in May 2011 in the amount of approximately $10.4 million. Thus, the 2001B bonds weredefeased in March 2011.
On October 26, 2008, the Authority opened phase 1 of Terminal 2 (renamed from Terminal C). TheSouth Concourse or phase 2 of the Terminal 2 project opened on January 23, 2011, thus completingthe $573 million Terminal 2 on time and on budget. No additional debt has been funded since the 2010refundings and the $68 million Terminal 1 (no longer Terminal A) project is planned to be entirely cashfunded.
For the fiscal year ended March 31, 2013, the Authority’s enplaned passengers increased to 9.26million which represented a .43% increase relative to the prior year. For the fiscal year ended March 31,2012, the Authority’s total passengers increased to 9.22 million which represented a .76% increase,relative to the prior period. In the fiscal year ended March 31, 2011, 9.15 million passengers used theAirport.
Long Term Debt Activity
At March 31, 2013 the Authority’s outstanding debt totaled $679,005,000 which was comprised of89.8% fixed rate revenue bonds and 10.2% variable rate revenue bonds. The weighted averageinterest cost of this debt portfolio was 3.93% at March 31, 2013. Other than pursuing potential costsaving bond refundings, the Authority currently has no plans to issue new or additional debt. For moreinformation on long-term debt activity please refer to footnote 5, “Long-term debt.”
Budget Information for the Fiscal Year Ending March 31, 2014
The Authority, as it typically does, has elected to forecast conservatively, especially with respect torevenue generation for the fiscal year ended March 31, 2014. For comparison purposes, FY 2013-14
RALEIGH–DURHAM AIRPORT AUTHORITYMANAGEMENT’S DISCUSSION AND ANALYSIS
Years Ended March 31, 2013 and 2012
14
Budget Information for the Fiscal Year Ending March 31, 2014 (Continued)
budgeted operating revenue of $97.6 million was 0.46% or $448 thousand less than actual FY 2012-13operating revenue of $98.0 million. For FY 2013-14 relative to the prior year budget, total budgetedoperating revenue increased $2.5 million or 2.6% due primarily to increased estimated: parking revenue(up $1.8 million or 4.5%), rental car revenue (up $857 thousand or 7.1%), and landing fee revenue (up$501 thousand or 4.4%). Budgeted non-operating revenue increased $6.0 million or 21.7% due toincreased Federal and State Grant revenue ($6.4 million).
Budgeted operating expenses (excluding depreciation) increased $1.8 million, or 3.5% for the yearended March 31, 2014 relative to the prior year. Inclusive of depreciation, total budgeted operatingexpenses increased $1.4 million or 1.4% relative to the prior year. Total budgeted non-operatingexpenses decreased $650 thousand or 2.2% due to decreased debt service interest expense.
The combined net effect of these items for the FY 2013-14 was to increase budgeted net positionnearly $2.0 million.
Requests for Information
This report is designed to provide an overview of the Authority’s finances for those with an interest inthis area. Questions concerning any of the information found in this report or requests for additionalinformation should be directed to the Director of Finance, Raleigh-Durham Airport Authority, P.O. Box80001, RDU Airport, North Carolina 27623.
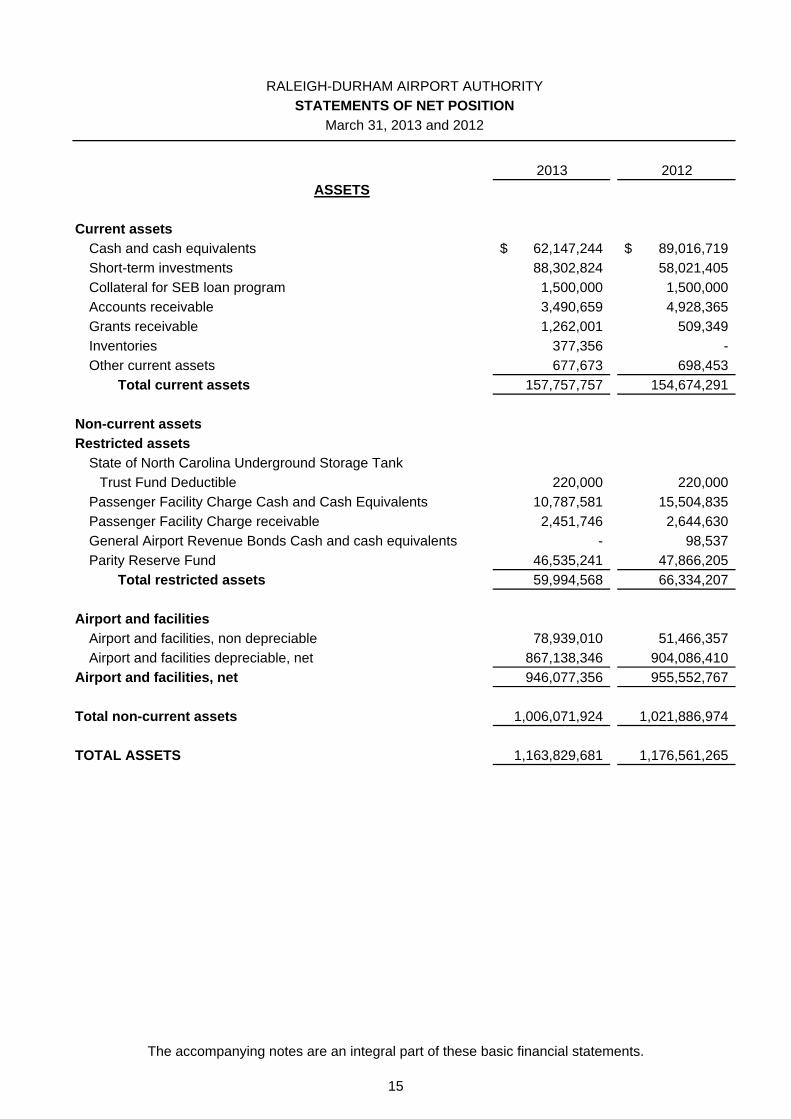
2013 2012
Current assets
Cash and cash equivalents 62,147,244$ 89,016,719$
Short-term investments 88,302,824 58,021,405
Collateral for SEB loan program 1,500,000 1,500,000
Accounts receivable 3,490,659 4,928,365
Grants receivable 1,262,001 509,349
Inventories 377,356 -
Other current assets 677,673 698,453
Total current assets 157,757,757 154,674,291
Non-current assets
Restricted assets
State of North Carolina Underground Storage Tank
Trust Fund Deductible 220,000 220,000
Passenger Facility Charge Cash and Cash Equivalents 10,787,581 15,504,835
Passenger Facility Charge receivable 2,451,746 2,644,630
General Airport Revenue Bonds Cash and cash equivalents - 98,537
Parity Reserve Fund 46,535,241 47,866,205
Total restricted assets 59,994,568 66,334,207
Airport and facilities
Airport and facilities, non depreciable 78,939,010 51,466,357
Airport and facilities depreciable, net 867,138,346 904,086,410
Airport and facilities, net 946,077,356 955,552,767
Total non-current assets 1,006,071,924 1,021,886,974
TOTAL ASSETS 1,163,829,681 1,176,561,265
ASSETS
RALEIGH-DURHAM AIRPORT AUTHORITY
STATEMENTS OF NET POSITION
March 31, 2013 and 2012
The accompanying notes are an integral part of these basic financial statements.
15
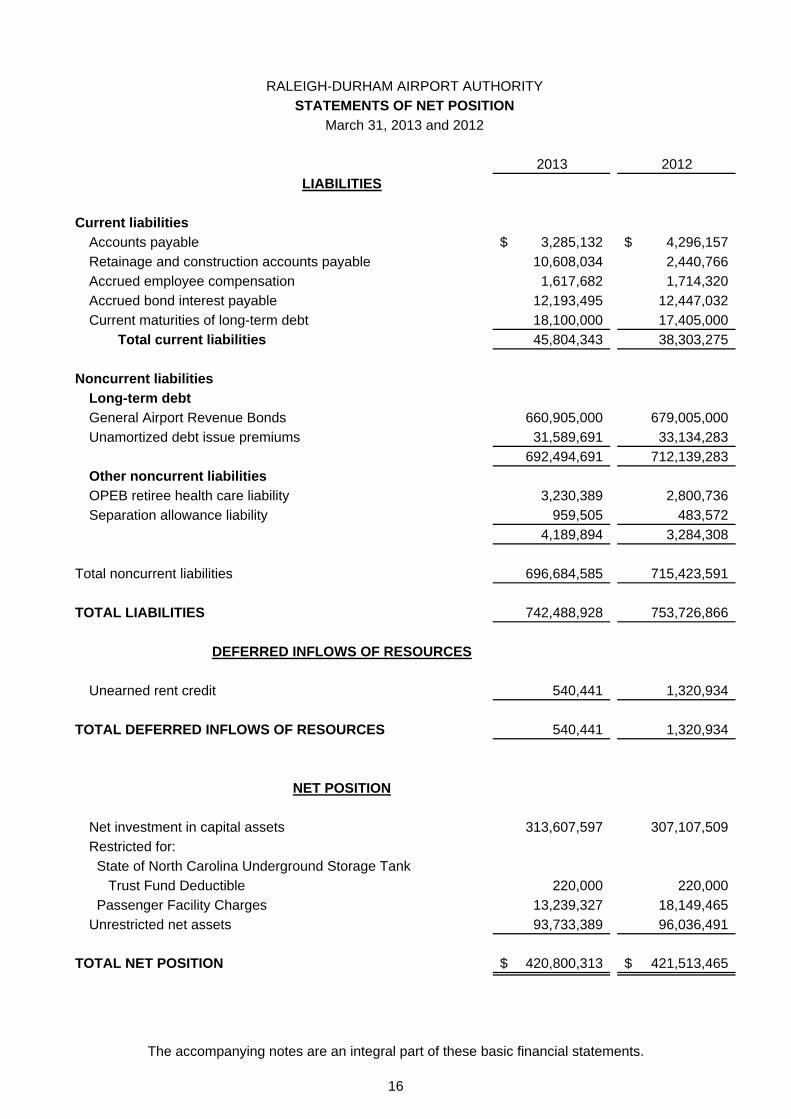
RALEIGH-DURHAM AIRPORT AUTHORITY
STATEMENTS OF NET POSITION
March 31, 2013 and 2012
2013 2012
Current liabilities
Accounts payable 3,285,132$ 4,296,157$
Retainage and construction accounts payable 10,608,034 2,440,766
Accrued employee compensation 1,617,682 1,714,320
Accrued bond interest payable 12,193,495 12,447,032
Current maturities of long-term debt 18,100,000 17,405,000
Total current liabilities 45,804,343 38,303,275
Noncurrent liabilities
Long-term debt
General Airport Revenue Bonds 660,905,000 679,005,000
Unamortized debt issue premiums 31,589,691 33,134,283
692,494,691 712,139,283
Other noncurrent liabilities
OPEB retiree health care liability 3,230,389 2,800,736
Separation allowance liability 959,505 483,572
4,189,894 3,284,308
Total noncurrent liabilities 696,684,585 715,423,591
TOTAL LIABILITIES 742,488,928 753,726,866
Unearned rent credit 540,441 1,320,934
TOTAL DEFERRED INFLOWS OF RESOURCES 540,441 1,320,934
Net investment in capital assets 313,607,597 307,107,509
Restricted for:
State of North Carolina Underground Storage Tank
Trust Fund Deductible 220,000 220,000
Passenger Facility Charges 13,239,327 18,149,465
Unrestricted net assets 93,733,389 96,036,491
TOTAL NET POSITION 420,800,313$ 421,513,465$
DEFERRED INFLOWS OF RESOURCES
NET POSITION
LIABILITIES
The accompanying notes are an integral part of these basic financial statements.
16
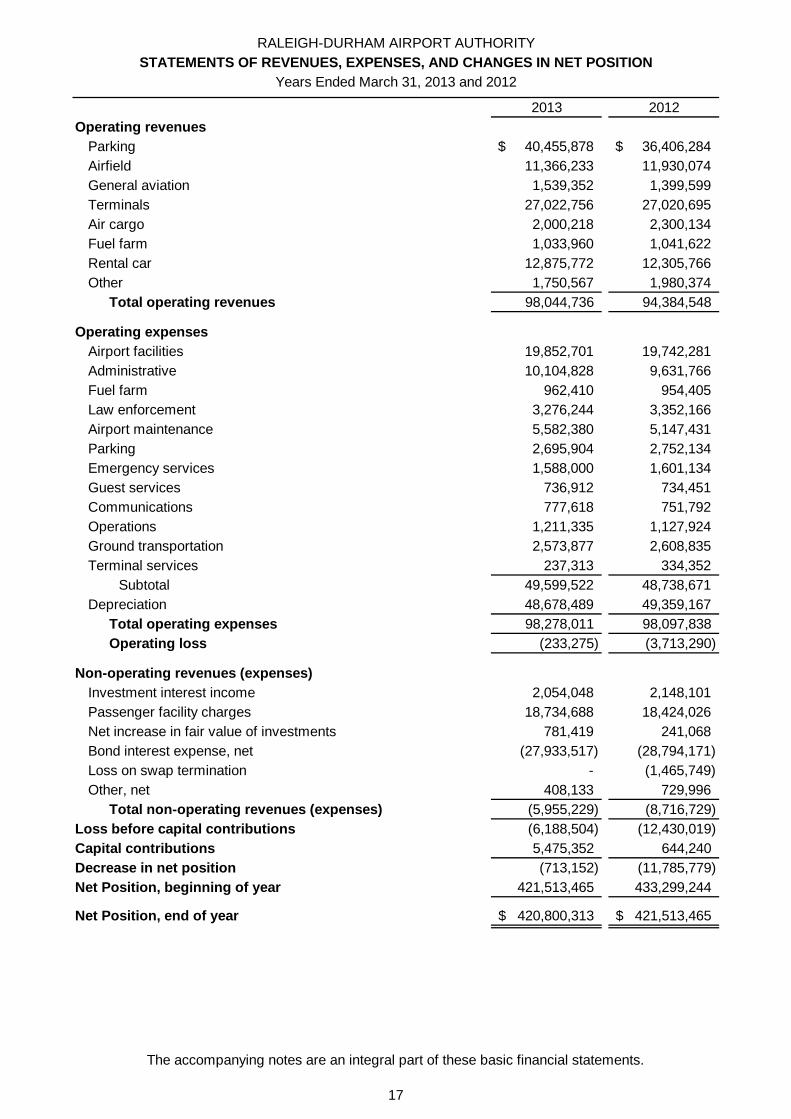
2013 2012
Operating revenues
Parking 40,455,878$ 36,406,284$
Airfield 11,366,233 11,930,074
General aviation 1,539,352 1,399,599
Terminals 27,022,756 27,020,695
Air cargo 2,000,218 2,300,134
Fuel farm 1,033,960 1,041,622
Rental car 12,875,772 12,305,766
Other 1,750,567 1,980,374
Total operating revenues 98,044,736 94,384,548
Operating expenses
Airport facilities 19,852,701 19,742,281
Administrative 10,104,828 9,631,766
Fuel farm 962,410 954,405
Law enforcement 3,276,244 3,352,166
Airport maintenance 5,582,380 5,147,431
Parking 2,695,904 2,752,134
Emergency services 1,588,000 1,601,134
Guest services 736,912 734,451
Communications 777,618 751,792
Operations 1,211,335 1,127,924
Ground transportation 2,573,877 2,608,835
Terminal services 237,313 334,352
Subtotal 49,599,522 48,738,671
Depreciation 48,678,489 49,359,167
Total operating expenses 98,278,011 98,097,838
Operating loss (233,275) (3,713,290)
Non-operating revenues (expenses)
Investment interest income 2,054,048 2,148,101
Passenger facility charges 18,734,688 18,424,026
Net increase in fair value of investments 781,419 241,068
Bond interest expense, net (27,933,517) (28,794,171)
Loss on swap termination - (1,465,749)
Other, net 408,133 729,996
Total non-operating revenues (expenses) (5,955,229) (8,716,729)
Loss before capital contributions (6,188,504) (12,430,019)
Capital contributions 5,475,352 644,240
Decrease in net position (713,152) (11,785,779)
Net Position, beginning of year 421,513,465 433,299,244
Net Position, end of year 420,800,313$ 421,513,465$
RALEIGH-DURHAM AIRPORT AUTHORITY
STATEMENTS OF REVENUES, EXPENSES, AND CHANGES IN NET POSITION
Years Ended March 31, 2013 and 2012
The accompanying notes are an integral part of these basic financial statements.
17
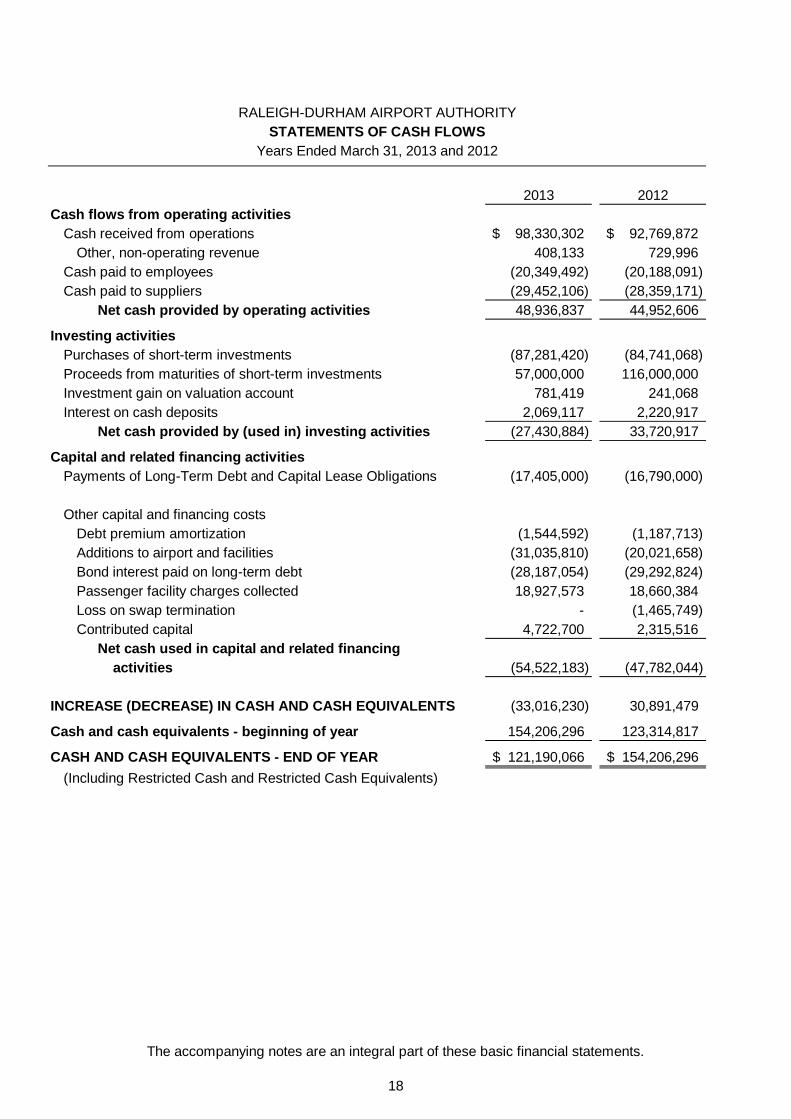
2013 2012
Cash flows from operating activities
Cash received from operations 98,330,302$ 92,769,872$
Other, non-operating revenue 408,133 729,996
Cash paid to employees (20,349,492) (20,188,091)
Cash paid to suppliers (29,452,106) (28,359,171)
Net cash provided by operating activities 48,936,837 44,952,606
Investing activities
Purchases of short-term investments (87,281,420) (84,741,068)
Proceeds from maturities of short-term investments 57,000,000 116,000,000
Investment gain on valuation account 781,419 241,068
Interest on cash deposits 2,069,117 2,220,917
Net cash provided by (used in) investing activities (27,430,884) 33,720,917
Capital and related financing activities
Payments of Long-Term Debt and Capital Lease Obligations (17,405,000) (16,790,000)
Other capital and financing costs
Debt premium amortization (1,544,592) (1,187,713)
Additions to airport and facilities (31,035,810) (20,021,658)
Bond interest paid on long-term debt (28,187,054) (29,292,824)
Passenger facility charges collected 18,927,573 18,660,384
Loss on swap termination - (1,465,749)
Contributed capital 4,722,700 2,315,516
Net cash used in capital and related financing
activities (54,522,183) (47,782,044)
INCREASE (DECREASE) IN CASH AND CASH EQUIVALENTS (33,016,230) 30,891,479
Cash and cash equivalents - beginning of year 154,206,296 123,314,817
CASH AND CASH EQUIVALENTS - END OF YEAR 121,190,066$ 154,206,296$
(Including Restricted Cash and Restricted Cash Equivalents)
RALEIGH-DURHAM AIRPORT AUTHORITY
STATEMENTS OF CASH FLOWS
Years Ended March 31, 2013 and 2012
The accompanying notes are an integral part of these basic financial statements.
18
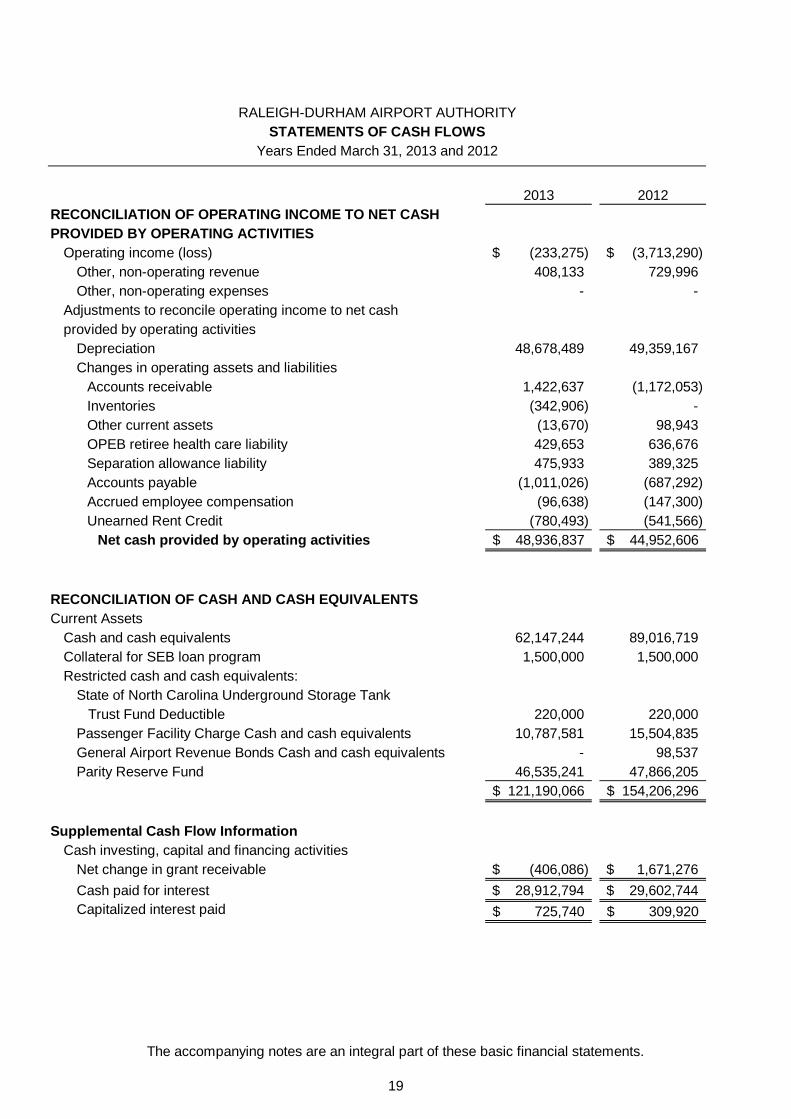
2013 2012
RALEIGH-DURHAM AIRPORT AUTHORITY
STATEMENTS OF CASH FLOWS
Years Ended March 31, 2013 and 2012
RECONCILIATION OF OPERATING INCOME TO NET CASH
PROVIDED BY OPERATING ACTIVITIES
Operating income (loss) (233,275)$ (3,713,290)$
Other, non-operating revenue 408,133 729,996
Other, non-operating expenses - -
Adjustments to reconcile operating income to net cash
provided by operating activities
Depreciation 48,678,489 49,359,167
Changes in operating assets and liabilities
Accounts receivable 1,422,637 (1,172,053)
Inventories (342,906) -
Other current assets (13,670) 98,943
OPEB retiree health care liability 429,653 636,676
Separation allowance liability 475,933 389,325
Accounts payable (1,011,026) (687,292)
Accrued employee compensation (96,638) (147,300)
Unearned Rent Credit (780,493) (541,566)
Net cash provided by operating activities 48,936,837$ 44,952,606$
RECONCILIATION OF CASH AND CASH EQUIVALENTS
Current Assets
Cash and cash equivalents 62,147,244 89,016,719
Collateral for SEB loan program 1,500,000 1,500,000
Restricted cash and cash equivalents:
State of North Carolina Underground Storage Tank
Trust Fund Deductible 220,000 220,000
Passenger Facility Charge Cash and cash equivalents 10,787,581 15,504,835
General Airport Revenue Bonds Cash and cash equivalents - 98,537
Parity Reserve Fund 46,535,241 47,866,205
121,190,066$ 154,206,296$
Supplemental Cash Flow Information
Cash investing, capital and financing activities
Net change in grant receivable (406,086)$ 1,671,276$
Cash paid for interest 28,912,794$ 29,602,744$
Capitalized interest paid 725,740$ 309,920$
The accompanying notes are an integral part of these basic financial statements.
19
RALEIGH-DURHAM AIRPORT AUTHORITYNOTES TO BASIC FINANCIAL STATEMENTS
March 31, 2013 and 2012
20
Note 1 – The Authority
In 1939, the General Assembly of the State of North Carolina enacted legislation authorizing thegoverning bodies of the City of Durham, the City of Raleigh, the County of Durham, and the County ofWake jointly to acquire, establish and operate airports. It was provided that the governing bodies wouldappoint a joint board to carry out the provisions of the act, and the Raleigh-Durham Airport Authority(the “Authority”) is the board so appointed. Legal title to all properties is vested jointly in the governingbodies. Each of the four governing bodies makes an annual appropriation of $12,500, which isaccounted for as nonexchange transactions in accordance with Statement No. 33 of the GovernmentAccounting Standards Board (GASB).
Note 2 – Summary of significant accounting policies
Basis of presentation - fund accounting – The accounts of the Raleigh-Durham Airport Authority areorganized and operated on a fund basis. A fund is an independent fiscal and accounting entity with aself-balancing set of accounts recording its assets, liabilities, equity, revenues and expenses.
The Authority accounts for its operations in one fund type, the enterprise fund. An enterprise fund isused to account for operations that are (a) financed and operated in a manner similar to privatebusiness enterprises - where the intent of the governing body is that the costs of providing goods orservices to the general public on a continuing basis be financed or recovered primarily through usercharges; or (b) where the governing body has decided that periodic determination of revenues earned,expenses incurred, and/or net income is appropriate for capital maintenance, public policy,management control, accountability or other purposes.
Financial Reporting Framework – All assets and all liabilities associated with the operation of theAuthority are included on the statement of net position. As required for periods beginning after June15, 2000 by Statement 33 of GASB, Accounting and Financial Reporting for NonexchangeTransactions, the Authority recognizes capital contributions as revenue, rather than as contributedcapital. Nonexchange transactions for the Authority include Federal and State grants and contributionsby the Authority’s four governing bodies. The enterprise fund of the Authority is presented in thefinancial statements on the accrual basis of accounting. Under this basis, revenues are recognized inthe accounting period when earned and expenses are recognized in the period when incurred.
Budgetary control – The Authority adopts an annual budget ordinance as required by the LocalGovernment Budget and Fiscal Control Act of the North Carolina General Statutes. The OperatingBudget ordinance is prepared on the modified accrual basis of accounting as required by NorthCarolina law. This budget is adopted and amended at the total expense level with management controlmaintained on a departmental and complex basis. Operating expenses may not legally exceed thetotal expense level and Operating budget appropriations lapse at year-end. Project ordinances are alsoadopted annually, but do not lapse at year-end and may extend multiple years. Both Operating andProject ordinances are adopted by the Authority at its March meeting and are entered in the minuteswithin five days after adoption.
RALEIGH-DURHAM AIRPORT AUTHORITYNOTES TO BASIC FINANCIAL STATEMENTS
March 31, 2013 and 2012
21
Note 2 – Summary of significant accounting policies (continued)
Cash and cash equivalents – The Authority considers highly liquid investments, including restrictedassets, with a maturity of 90 days or less to be cash equivalents.
Investments – The Authority records its investments in marketable securities at their quoted estimatedfair value except for money market investments and U.S. Treasury and Agency obligations having aremaining maturity at purchase of one year or less, which are recorded at cost.
Grants receivable – Grants receivable from governmental agencies for capital construction projectsare recorded in the period actual costs are incurred. The actual amount of payment on these grants issubject to final audit by the applicable agency.
Inventory Policy – Inventory consists of parts related to its terminal baggage claim systems andpassenger boarding bridges as well as fuel for fleet vehicles and equipment. Materials and suppliesinventories are valued at lower of cost of market. Fuel inventories are accounted for at the lower ofcost of market.
Airport and facilities – The airport and facilities are recorded at cost. Provision for depreciation hasbeen made to amortize the cost of the assets over their estimated useful lives by the straight-linemethod.
Depreciation expense was $48,678,489 and $49,359,167 for the fiscal years ended 2013 and 2012,respectively.
A portion of internal engineering costs are capitalized in connection with related capital projects.
All capital projects are budgeted under project ordinances, which span more than one year. Theseappropriations continue until the related project is complete.
Capital Assets are defined by the Authority as assets with an initial individual cost of more than $5,000and an economic useful life of 3 years or more.
Depreciation of airfield and facilities is computed under the straight-line method at various ratesconsidered adequate to allocate the cost over the estimated useful lives of such assets.
The estimated lives by general classifications are as follows:
YearsLanding field and grounds 5 – 20Terminal buildings 5 – 45Other buildings 5 – 30Utilities 5 – 20Equipment 3 – 20
RALEIGH-DURHAM AIRPORT AUTHORITYNOTES TO BASIC FINANCIAL STATEMENTS
March 31, 2013 and 2012
22
Note 2 – Summary of significant accounting policies (continued)
The Authority’s net assets are classified as follows:
Invested in capital assets, net of related debt – This represents the Authority’s total investment incapital assets, net of outstanding debt obligations related to those capital assets. To the extent debthas been incurred but not yet expended for capital assets, such amounts are not included as acomponent of Invested in Capital assets, net of related debt.
Restricted net assets – Restricted net assets include resources in which the Authority is legally orcontractually obligated to spend the resources in accordance with restrictions imposed by externalparties. When both restricted and unrestricted assets are available for use, the Authority appliesrestricted assets first, and then applies unrestricted assets as needed.
Passenger facility charges are presented as Restricted Net Assets based on Federal AviationAdministration (FAA) regulations to be used only on approved capital projects.
State of North Carolina underground storage tank trust fund deductible represents cash requiredto be set aside by the North Carolina Department of Environment and Natural Resources related tounderground storage tank clean-up costs.
Aeronautical facilities revenue bonds represent cash and cash equivalents restricted by the MasterTrust Indenture to be expended for the construction of certain airport facilities and debt service reservefunds.
Vacation and sick leave compensation – The Authority allows full time employees to accumulate upto 30 days earned vacation leave, and such leave is fully vested when earned provided the employeehas completed a mandatory six month probationary period. Accumulated vacation pay is recorded as acurrent liability and reflected in accrued employee compensation.
Employees can accumulate an unlimited amount of sick leave. Unused sick leave accumulated at thetime of retirement may be used in determining length of service for retirement benefit purposes. Also,employees who voluntarily terminate employment prior to retirement may convert unused sick leave inexcess of 30 days to vacation leave at a rate of two days of sick leave for one day of vacation leave.This policy is limited to converting a maximum of 60 days of sick leave into 30 days of vacation leave.Since the resulting leave is fully vested when earned, it is recorded as a liability along with ordinaryvacation leave.
Revenues and expenses classifications – Revenues from airlines, concessions, rental cars andparking are reported as operating revenues. Transactions which are financing or investing related andpassenger facility charges are reported as non-operating revenues. All expenses related to operatingthe Authority are reported as operating expenses. Interest expense and financing costs are reported asnon-operating expenses.
Interest expense – The Authority capitalizes material interest costs related to construction projects.The objective of interest capitalization is to reflect the total asset cost and to provide the relateddepreciation charges against revenues of future periods that benefit from the asset use.
RALEIGH-DURHAM AIRPORT AUTHORITYNOTES TO BASIC FINANCIAL STATEMENTS
March 31, 2013 and 2012
23
Note 2 – Summary of significant accounting policies (continued)
Income tax status – Income of the Authority is excludable from federal income tax under Section 115of the Internal Revenue Code.
Concentration of credit risk – For the years ended March 31, 2013 and 2012, no air carrieraccounted for more than approximately 9% and 8% of the Authority’s operating revenues, respectively.
Use of estimates – The preparation of the basic financial statements in conformity with accountingprinciples generally accepted in the United States of America requires management to make estimatesand assumptions that affect the reporting amounts of assets and liabilities and disclosure of contingentassets and liabilities at the date of the basic financial statements and the reporting amounts ofrevenues and expenses during the reporting period. Actual results could differ from those estimates.
Reclassifications – The Authority implemented Government Accounting Standards Board (GASB)GASB 63 as required, and early implemented GASB 65 as allowed. These pronouncements requirethat certain assets and liabilities be classified as deferred outflows of resources and deferred inflows ofresources. As a result of these implementations, bond issuance costs were reclassified from assets toexpense for the periods presented.
Passenger facility charges – The Federal Aviation Administration (FAA) authorized the Authority tocollect Passenger Facility Charges (PFCs) of $3 per qualifying enplaned passenger commencing May1, 2003. Effective October 1, 2004, the FAA authorized the Authority to collect PFCs of $4.50 perqualifying enplaned passenger. The net receipts from PFCs are accounted for on the accrual basis ofaccounting and are restricted to use on FAA approved projects. Aggregate collections and interestthereon from inception through March 31, 2013 and 2012 were $184,998,607 and $165,552,542,respectively. Total PFC funds of $23,634,000 and $22,946,000 were expended during the fiscal yearsended March 31, 2013 and 2012, respectively, on FAA approved uses. Beginning in the fiscal year2005-06, a portion of PFCs have been irrevocably committed to directly offset Authority debt service foreligible projects. This irrevocable commitment for the fiscal year ending March 31, 2013 was$23,634,000. Irrevocable commitments to the extent not applied to debt service are carried forward forfuture application. Net assets related to PFCs are restricted for projects that are approved by the FAA.
New pronouncements – During the fiscal year ended March 31, 2013 and beyond, the Authority hasand will implement several new pronouncements of the GASB. These pronouncements are as follows:
GASB Statement No. 60 “Accounting and Financial Reporting for Service ConcessionArrangements” The Statement addresses how to account for and report service concessionarrangements (SCA's), a type of public-private partnership between state and local governments. Theprovisions of this statement are effective for financial statements for periods beginning after December15, 2011 and did not have a material effect on the Authority’s financial position or results of operations.
GASB Statement No. 61 “The Financial Reporting Entity: Omnibus-an amendment of GASBStatements No. 14 and No. 34” This is a result of a reexamination of the previous reporting entityguidance contained in Statement No. 14. The most significant effect is the increased emphasis on afinancial benefit or burden between the primary government and component units. The provisions ofthis statement are effective for financial statements for periods beginning after June 15, 2012 and the
RALEIGH-DURHAM AIRPORT AUTHORITYNOTES TO BASIC FINANCIAL STATEMENTS
March 31, 2013 and 2012
24
Note 2 – Summary of significant accounting policies (continued)
Authority does not expect that this statement will have a material effect on the Authority’s financialposition or results of operations.
GASB Statement No. 62 “Codification of Accounting and Financial Reporting GuidanceContained in Pre-November 30, 1989 FASB and AICPA Pronouncements” With this statement,government entities that are required to follow GASB standards can choose to follow accounting andfinancial guidance issued on or before November 30, 1989, which does not conflict with or contradictGASB pronouncements. The provisions of this statement are effective for financial statements forperiods beginning after December 15, 2011 and did not have a material effect on the Authority’sfinancial position or results of operations.
GASB Statement No. 63 “Financial Reporting of Deferred Outflows of Resources, DeferredInflows of Resources, and Net Position” This statement provides guidance for reporting deferredoutflows of resources and deferred inflows of resources within the financial statements of governmentalentities. Additionally, it renames the statement of net assets as the statement of net position. Thestatement of net position should report all assets, deferred outflows of resources, liabilities, deferredinflows of resources and net position. The provisions of this statement are effective for financialstatements for periods beginning after December 15, 2011. The Authority implemented this statementeffective for fiscal year ending March 31, 2013.
GASB Statement No. 64 “Derivative Instruments: Application of Hedge Accounting TerminationProvisions - an amendment of GASB Statement No. 53” This statement provides clarity anddesignates specific circumstances where hedge accounting may continue after the termination of thehedging derivative instrument. The provisions of this statement are effective for financial statements forperiods beginning after June 15, 2011 and did not have a material effect on the Authority’s financialposition or results of operations.
GASB Statement No. 65 “Items Previously Reported as Assets and Liabilities” This statementprovides guidance and establishes accounting and financial reporting standards that reclassify, asdeferred outflows of resources or deferred inflows of resources, certain items that were previouslyreported as assets and liabilities. The provisions of this statement are effective for financial statementsfor periods beginning after December 15, 2012. The Authority implemented this statement effective forfiscal year ending March 31, 2013.
GASB Statement No. 66 “Technical Corrections - 2012 - an amendment of GASB Statements No.10 and No. 62” This statement's objective is to improve accounting and financial reporting for agovernmental financial reporting entity by resolving conflicting guidance that resulted from the issuanceof two pronouncements, Statements No. 54, Fund Balance Reporting and Governmental Fund TypeDefinitions, and No. 62, Codification of Accounting and Financial Reporting Guidance Contained in Pre-November 30, 1989 FASB and AICPA Pronouncements. The provisions of this statement are effectivefor financial statements for periods beginning after December 15, 2012. The Authority is currentlyevaluating the effect this statement will have on the Authority’s financial position or results ofoperations.
GASB Statement No. 67 “Financial Reporting for Pension Plans - an amendment of GASB 25”The objective of GASB 67 is to improve financial reporting by state and local governmental pension
RALEIGH-DURHAM AIRPORT AUTHORITYNOTES TO BASIC FINANCIAL STATEMENTS
March 31, 2013 and 2012
25
Note 2 – Summary of significant accounting policies (continued)
plans. GASB 67 results from a comprehensive review of the effectiveness of existing standards ofaccounting and financial reporting for pensions with regard to providing decision-useful informationsupporting assessments of accountability and inter-period equity and creating additional transparency.GASB 67 replaces the requirements of Statements No. 25, Financial Reporting for Defined BenefitPension Plans and Note Disclosures for Defined Contribution Plans and No. 50, Pension Disclosures.The provisions of this statement are effective for financial statements for periods beginning after June15, 2013. The Authority is currently evaluating the effect this statement will have on the Authority’sfinancial position or results of operations.
GASB Statement No. 68 “Accounting and Financial Reporting for Pensions - an amendment ofGASB Statement No. 27” The primary objective of this Statement is to improve accounting andfinancial reporting by state and local governments for pensions. It also improves information providedby state and local governmental employers about financial support for pensions that is provided byother entities. The provisions of this statement are effective for financial statements for periodsbeginning after June 15, 2014. The Authority is currently evaluating the effect this statement will haveon the Authority’s financial position or results of operations.
Note 3 – Deposits and investments
Deposits – All the deposits of the Authority are either insured or collateralized by the Pooling Method.Under the Pooling Method, which is a collateral pool, all uninsured deposits are collateralized withsecurities held by the State Treasurer's agent in the name of the State Treasurer. Since the StateTreasurer is acting in a fiduciary capacity for the Authority, these deposits are considered to be held bythe Authority’s agents in its name. The amount of the pledged collateral is based on an approvedaveraging method for non-interest bearing deposits and the actual current balance for interest-bearingdeposits. Depositories using the Pooling Method report to the State Treasurer the adequacy of theirpooled collateral covering uninsured deposits. The State Treasurer does not confirm this informationwith the Authority, or the escrow agent. Because of the inability to measure the exact amounts ofcollateral pledged for the Authority under the Pooling Method, the potential exists for under-collateralization, and this risk may increase in periods of high cash flows. However, the State Treasurerof North Carolina enforces strict standards of financial stability for each depository that collateralizespublic deposits under the Pooling Method. The Authority has no formal policy regarding custodial creditrisk for deposits.
At March 31, 2013, the Authority's deposits had a carrying amount of $67,659,975 and a statementbalance of $69,021,225. Of this bank balance, $5,268,300 was covered by federal depositoryinsurance while the balance of $63,752,925 was covered by collateral held under the Pooling Method.The Authority is required to maintain a minimum balance of $250,000 in its checking account.
At March 31, 2012, the Authority's deposits had a carrying amount of $98,952,947 and a statementbalance of $100,754,195. Of this bank balance, $5,256,568 was covered by federal depositoryinsurance while the balance of $95,497,627 was covered by collateral held under the Pooling Method.The Authority is required to maintain a minimum balance of $250,000 in its checking account.
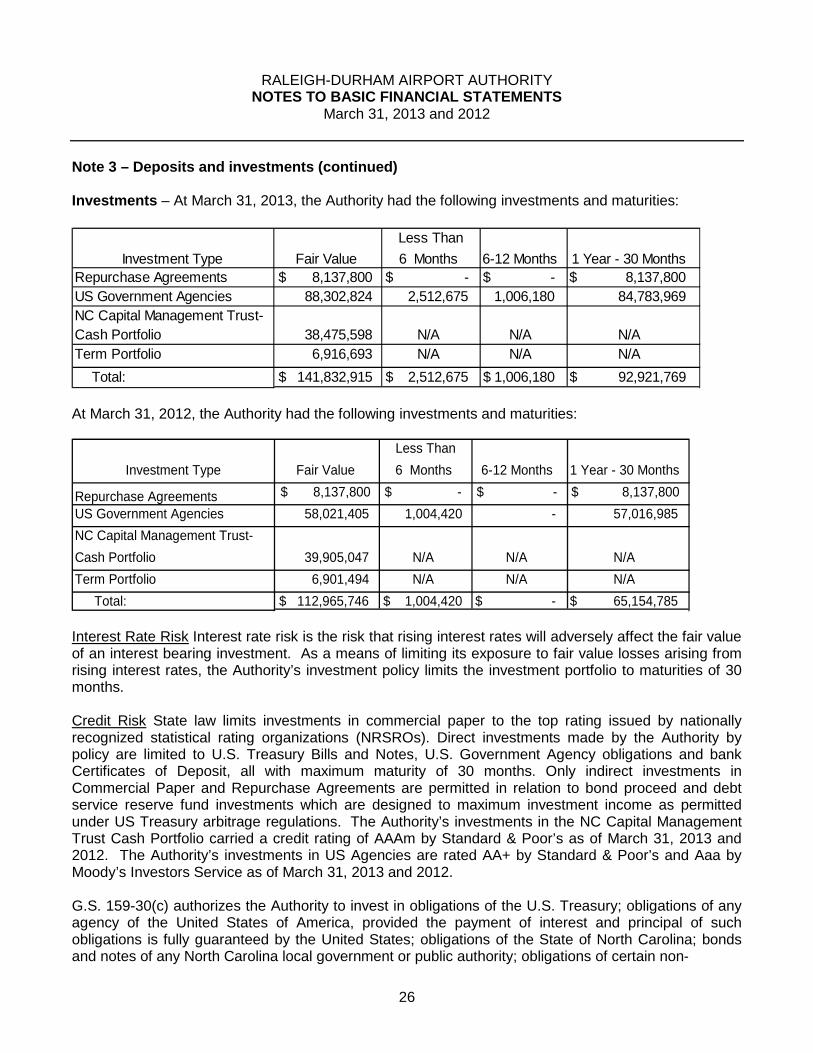
RALEIGH-DURHAM AIRPORT AUTHORITYNOTES TO BASIC FINANCIAL STATEMENTS
March 31, 2013 and 2012
26
Note 3 – Deposits and investments (continued)
Investments – At March 31, 2013, the Authority had the following investments and maturities:
Less Than
Investment Type Fair Value 6 Months 6-12 Months 1 Year - 30 Months
Repurchase Agreements $ 8,137,800 $ - $ - $ 8,137,800
US Government Agencies 88,302,824 2,512,675 1,006,180 84,783,969
NC Capital Management Trust-
Cash Portfolio 38,475,598 N/A N/A N/A
Term Portfolio 6,916,693 N/A N/A N/A
Total: $ 141,832,915 $ 2,512,675 $ 1,006,180 $ 92,921,769
At March 31, 2012, the Authority had the following investments and maturities:
Less Than
Investment Type Fair Value 6 Months 6-12 Months 1 Year - 30 Months
Repurchase Agreements $ 8,137,800 $ - $ - $ 8,137,800
US Government Agencies 58,021,405 1,004,420 - 57,016,985
NC Capital Management Trust-
Cash Portfolio 39,905,047 N/A N/A N/A
Term Portfolio 6,901,494 N/A N/A N/A
Total: $ 112,965,746 $ 1,004,420 $ - $ 65,154,785
Interest Rate Risk Interest rate risk is the risk that rising interest rates will adversely affect the fair valueof an interest bearing investment. As a means of limiting its exposure to fair value losses arising fromrising interest rates, the Authority’s investment policy limits the investment portfolio to maturities of 30months.
Credit Risk State law limits investments in commercial paper to the top rating issued by nationallyrecognized statistical rating organizations (NRSROs). Direct investments made by the Authority bypolicy are limited to U.S. Treasury Bills and Notes, U.S. Government Agency obligations and bankCertificates of Deposit, all with maximum maturity of 30 months. Only indirect investments inCommercial Paper and Repurchase Agreements are permitted in relation to bond proceed and debtservice reserve fund investments which are designed to maximum investment income as permittedunder US Treasury arbitrage regulations. The Authority’s investments in the NC Capital ManagementTrust Cash Portfolio carried a credit rating of AAAm by Standard & Poor’s as of March 31, 2013 and2012. The Authority’s investments in US Agencies are rated AA+ by Standard & Poor’s and Aaa byMoody’s Investors Service as of March 31, 2013 and 2012.
G.S. 159-30(c) authorizes the Authority to invest in obligations of the U.S. Treasury; obligations of anyagency of the United States of America, provided the payment of interest and principal of suchobligations is fully guaranteed by the United States; obligations of the State of North Carolina; bondsand notes of any North Carolina local government or public authority; obligations of certain non-
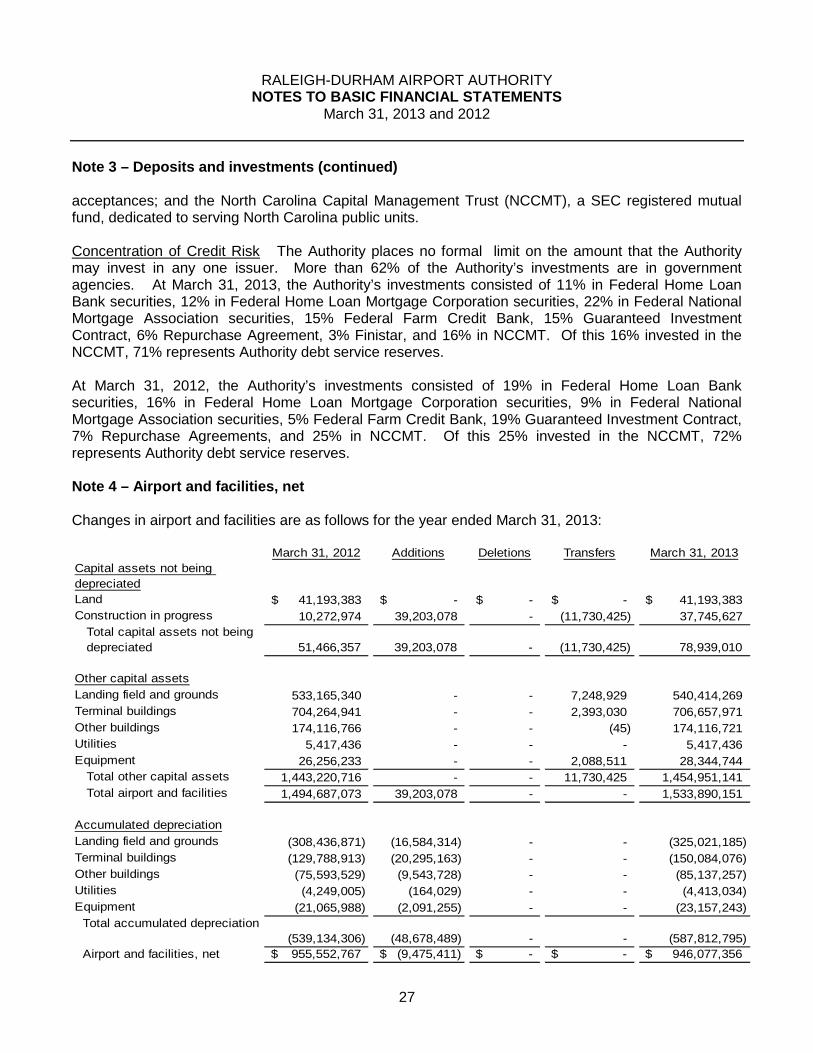
RALEIGH-DURHAM AIRPORT AUTHORITYNOTES TO BASIC FINANCIAL STATEMENTS
March 31, 2013 and 2012
27
Note 3 – Deposits and investments (continued)
acceptances; and the North Carolina Capital Management Trust (NCCMT), a SEC registered mutualfund, dedicated to serving North Carolina public units.
Concentration of Credit Risk The Authority places no formal limit on the amount that the Authoritymay invest in any one issuer. More than 62% of the Authority’s investments are in governmentagencies. At March 31, 2013, the Authority’s investments consisted of 11% in Federal Home LoanBank securities, 12% in Federal Home Loan Mortgage Corporation securities, 22% in Federal NationalMortgage Association securities, 15% Federal Farm Credit Bank, 15% Guaranteed InvestmentContract, 6% Repurchase Agreement, 3% Finistar, and 16% in NCCMT. Of this 16% invested in theNCCMT, 71% represents Authority debt service reserves.
At March 31, 2012, the Authority’s investments consisted of 19% in Federal Home Loan Banksecurities, 16% in Federal Home Loan Mortgage Corporation securities, 9% in Federal NationalMortgage Association securities, 5% Federal Farm Credit Bank, 19% Guaranteed Investment Contract,7% Repurchase Agreements, and 25% in NCCMT. Of this 25% invested in the NCCMT, 72%represents Authority debt service reserves.
Note 4 – Airport and facilities, net
Changes in airport and facilities are as follows for the year ended March 31, 2013:
March 31, 2012 Additions Deletions Transfers March 31, 2013
Capital assets not being
depreciated
Land 41,193,383$ -$ -$ -$ 41,193,383$
Construction in progress 10,272,974 39,203,078 - (11,730,425) 37,745,627
Total capital assets not being
depreciated 51,466,357 39,203,078 - (11,730,425) 78,939,010
Other capital assets
Landing field and grounds 533,165,340 - - 7,248,929 540,414,269
Terminal buildings 704,264,941 - - 2,393,030 706,657,971
Other buildings 174,116,766 - - (45) 174,116,721
Utilities 5,417,436 - - - 5,417,436
Equipment 26,256,233 - - 2,088,511 28,344,744
Total other capital assets 1,443,220,716 - - 11,730,425 1,454,951,141
Total airport and facilities 1,494,687,073 39,203,078 - - 1,533,890,151
Accumulated depreciation
Landing field and grounds (308,436,871) (16,584,314) - - (325,021,185)
Terminal buildings (129,788,913) (20,295,163) - - (150,084,076)
Other buildings (75,593,529) (9,543,728) - - (85,137,257)
Utilities (4,249,005) (164,029) - - (4,413,034)
Equipment (21,065,988) (2,091,255) - - (23,157,243)
Total accumulated depreciation
(539,134,306) (48,678,489) - - (587,812,795)
Airport and facilities, net 955,552,767$ (9,475,411)$ -$ -$ 946,077,356$
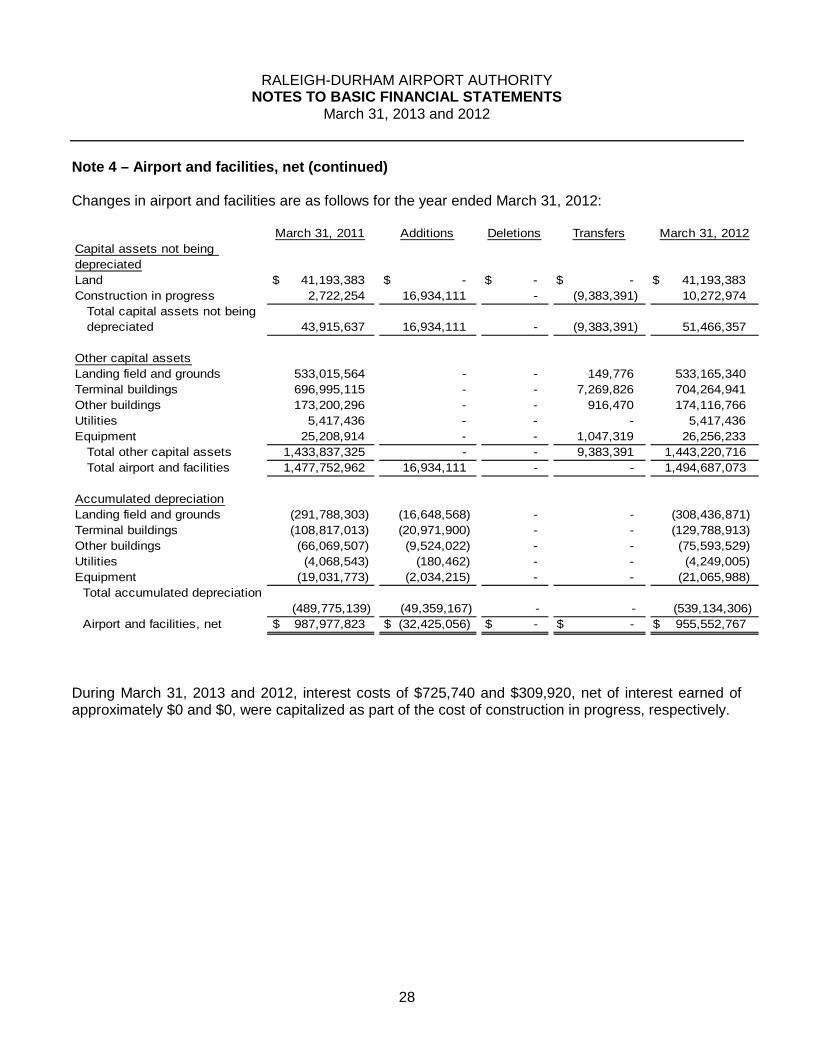
RALEIGH-DURHAM AIRPORT AUTHORITYNOTES TO BASIC FINANCIAL STATEMENTS
March 31, 2013 and 2012
28
Note 4 – Airport and facilities, net (continued)
Changes in airport and facilities are as follows for the year ended March 31, 2012:
March 31, 2011 Additions Deletions Transfers March 31, 2012
Capital assets not being
depreciated
Land 41,193,383$ -$ -$ -$ 41,193,383$
Construction in progress 2,722,254 16,934,111 - (9,383,391) 10,272,974
Total capital assets not being
depreciated 43,915,637 16,934,111 - (9,383,391) 51,466,357
Other capital assets
Landing field and grounds 533,015,564 - - 149,776 533,165,340
Terminal buildings 696,995,115 - - 7,269,826 704,264,941
Other buildings 173,200,296 - - 916,470 174,116,766
Utilities 5,417,436 - - - 5,417,436
Equipment 25,208,914 - - 1,047,319 26,256,233
Total other capital assets 1,433,837,325 - - 9,383,391 1,443,220,716
Total airport and facilities 1,477,752,962 16,934,111 - - 1,494,687,073
Accumulated depreciation
Landing field and grounds (291,788,303) (16,648,568) - - (308,436,871)
Terminal buildings (108,817,013) (20,971,900) - - (129,788,913)
Other buildings (66,069,507) (9,524,022) - - (75,593,529)
Utilities (4,068,543) (180,462) - - (4,249,005)
Equipment (19,031,773) (2,034,215) - - (21,065,988)
Total accumulated depreciation
(489,775,139) (49,359,167) - - (539,134,306)
Airport and facilities, net 987,977,823$ (32,425,056)$ -$ -$ 955,552,767$
During March 31, 2013 and 2012, interest costs of $725,740 and $309,920, net of interest earned ofapproximately $0 and $0, were capitalized as part of the cost of construction in progress, respectively.
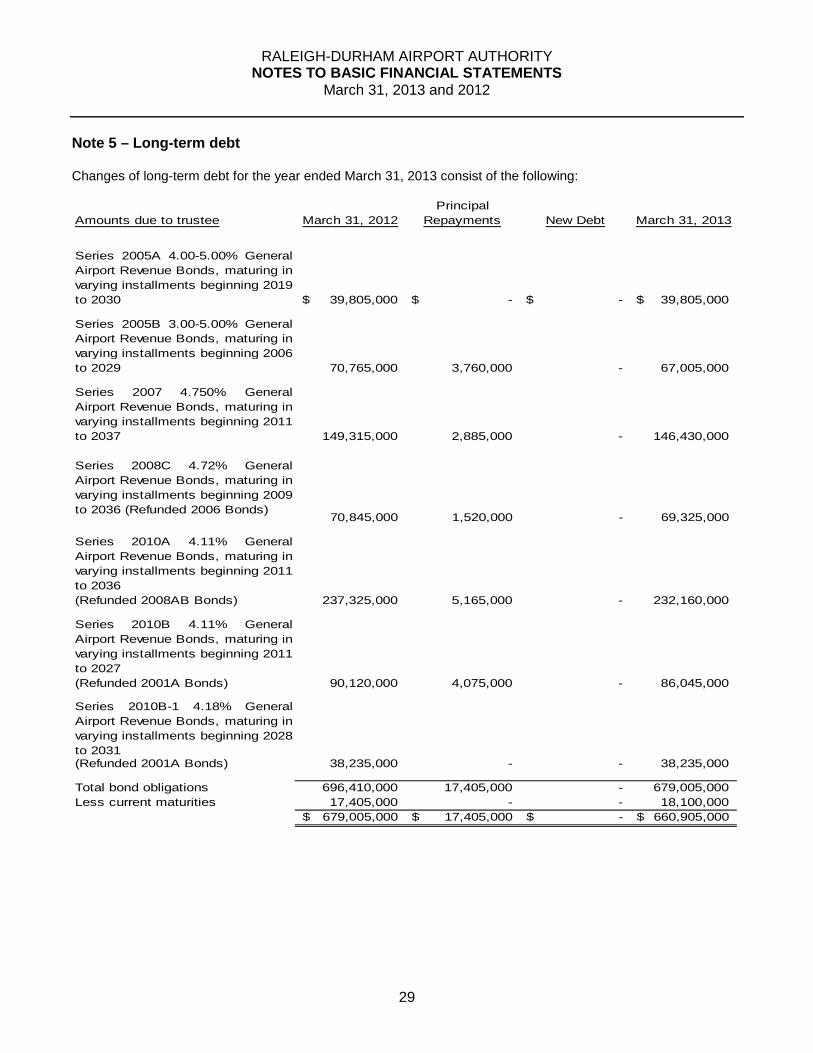
RALEIGH-DURHAM AIRPORT AUTHORITYNOTES TO BASIC FINANCIAL STATEMENTS
March 31, 2013 and 2012
29
Note 5 – Long-term debt
Changes of long-term debt for the year ended March 31, 2013 consist of the following:
Principal
Amounts due to trustee March 31, 2012 Repayments New Debt March 31, 2013
Series 2005A 4.00-5.00% General
Airport Revenue Bonds, maturing in
varying installments beginning 2019
to 2030 39,805,000$ -$ -$ 39,805,000$
Series 2005B 3.00-5.00% General
Airport Revenue Bonds, maturing in
varying installments beginning 2006
to 2029 70,765,000 3,760,000 - 67,005,000
Series 2007 4.750% General
Airport Revenue Bonds, maturing in
varying installments beginning 2011
to 2037 149,315,000 2,885,000 - 146,430,000
Series 2008C 4.72% General
Airport Revenue Bonds, maturing in
varying installments beginning 2009
to 2036 (Refunded 2006 Bonds)70,845,000 1,520,000 - 69,325,000
Series 2010A 4.11% General
Airport Revenue Bonds, maturing in
varying installments beginning 2011
to 2036
(Refunded 2008AB Bonds) 237,325,000 5,165,000 - 232,160,000
Series 2010B 4.11% General
Airport Revenue Bonds, maturing in
varying installments beginning 2011
to 2027
(Refunded 2001A Bonds) 90,120,000 4,075,000 - 86,045,000
Series 2010B-1 4.18% General
Airport Revenue Bonds, maturing in
varying installments beginning 2028
to 2031(Refunded 2001A Bonds) 38,235,000 - - 38,235,000
Total bond obligations 696,410,000 17,405,000 - 679,005,000
Less current maturities 17,405,000 - - 18,100,000
679,005,000$ 17,405,000$ -$ 660,905,000$
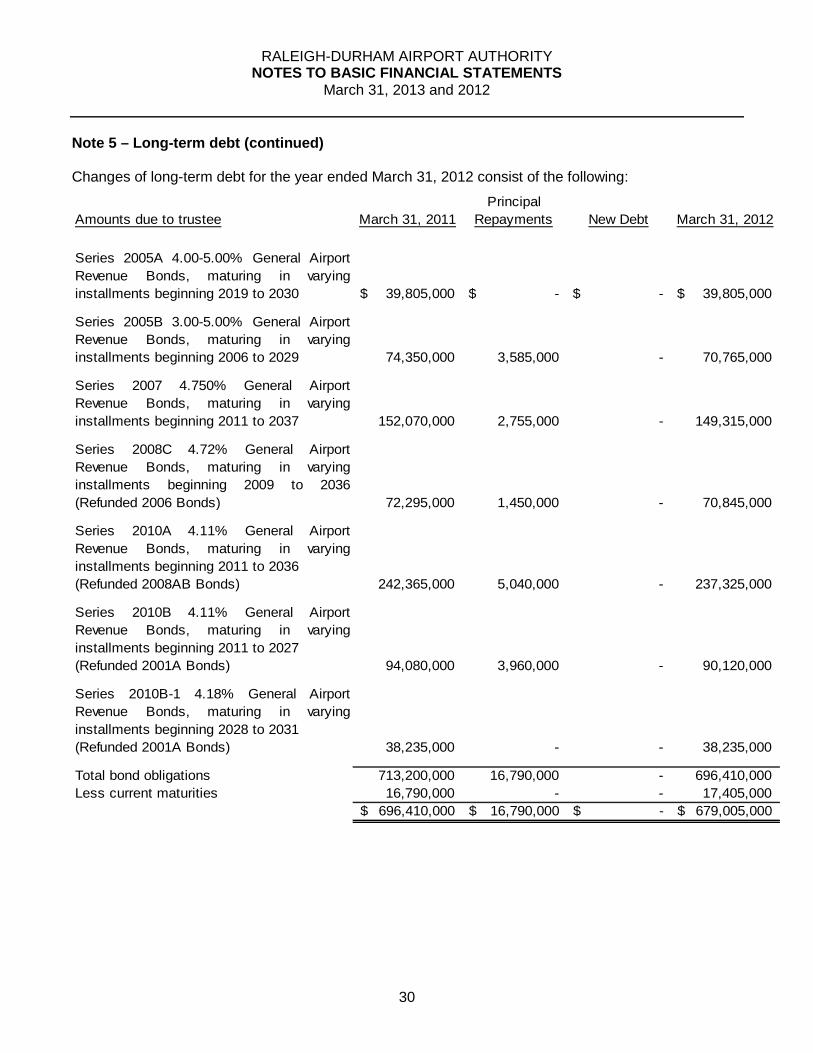
RALEIGH-DURHAM AIRPORT AUTHORITYNOTES TO BASIC FINANCIAL STATEMENTS
March 31, 2013 and 2012
30
Note 5 – Long-term debt (continued)
Changes of long-term debt for the year ended March 31, 2012 consist of the following:
Principal
Amounts due to trustee March 31, 2011 Repayments New Debt March 31, 2012
Series 2005A 4.00-5.00% General Airport
Revenue Bonds, maturing in varying
installments beginning 2019 to 2030 39,805,000$ -$ -$ 39,805,000$
Series 2005B 3.00-5.00% General Airport
Revenue Bonds, maturing in varying
installments beginning 2006 to 2029 74,350,000 3,585,000 - 70,765,000
Series 2007 4.750% General Airport
Revenue Bonds, maturing in varying
installments beginning 2011 to 2037 152,070,000 2,755,000 - 149,315,000
Series 2008C 4.72% General Airport
Revenue Bonds, maturing in varying
installments beginning 2009 to 2036
(Refunded 2006 Bonds) 72,295,000 1,450,000 - 70,845,000
Series 2010A 4.11% General Airport
Revenue Bonds, maturing in varying
installments beginning 2011 to 2036
(Refunded 2008AB Bonds) 242,365,000 5,040,000 - 237,325,000
Series 2010B 4.11% General Airport
Revenue Bonds, maturing in varying
installments beginning 2011 to 2027
(Refunded 2001A Bonds) 94,080,000 3,960,000 - 90,120,000
Series 2010B-1 4.18% General Airport
Revenue Bonds, maturing in varying
installments beginning 2028 to 2031
(Refunded 2001A Bonds) 38,235,000 - - 38,235,000
Total bond obligations 713,200,000 16,790,000 - 696,410,000
Less current maturities 16,790,000 - - 17,405,000
696,410,000$ 16,790,000$ -$ 679,005,000$
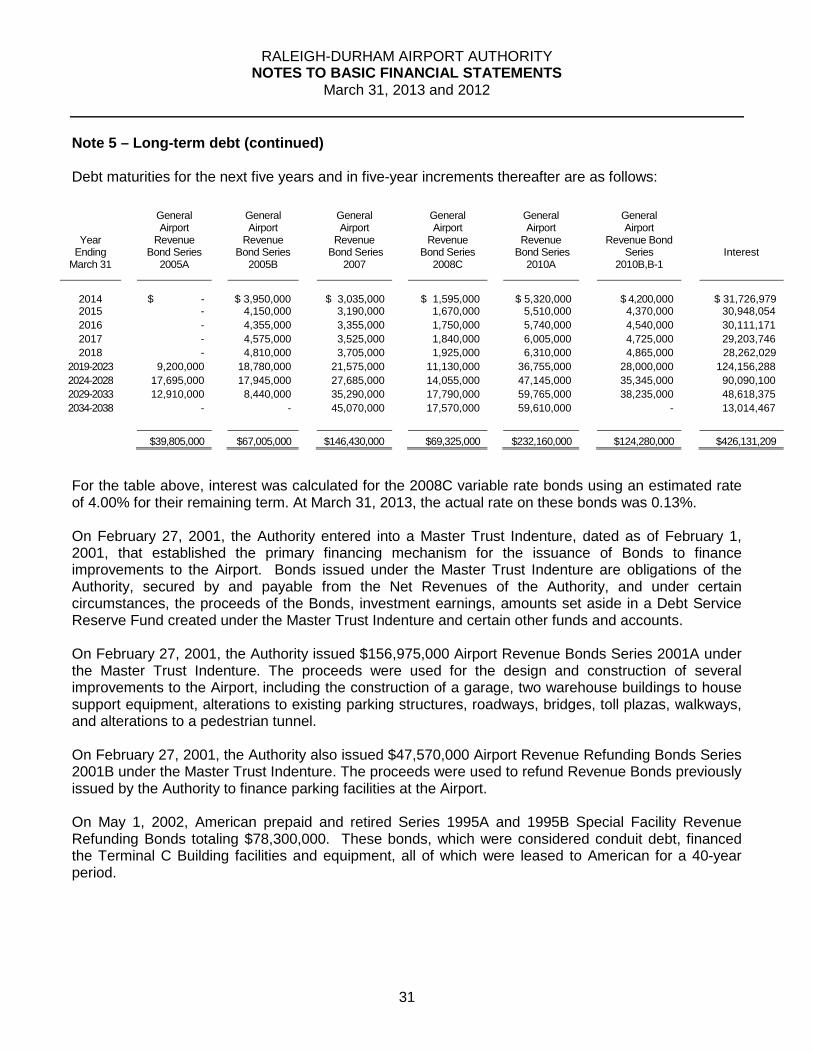
RALEIGH-DURHAM AIRPORT AUTHORITYNOTES TO BASIC FINANCIAL STATEMENTS
March 31, 2013 and 2012
31
Note 5 – Long-term debt (continued)
Debt maturities for the next five years and in five-year increments thereafter are as follows:
YearEnding
March 31
GeneralAirport
RevenueBond Series
2005A
GeneralAirport
RevenueBond Series
2005B
GeneralAirport
RevenueBond Series
2007
GeneralAirport
RevenueBond Series
2008C
GeneralAirport
RevenueBond Series
2010A
GeneralAirport
Revenue BondSeries
2010B,B-1Interest
2014 $ - $ 3,950,000 $ 3,035,000 $ 1,595,000 $ 5,320,000 $ 4,200,000 $ 31,726,9792015 - 4,150,000 3,190,000 1,670,000 5,510,000 4,370,000 30,948,054
2016 - 4,355,000 3,355,000 1,750,000 5,740,000 4,540,000 30,111,171
2017 - 4,575,000 3,525,000 1,840,000 6,005,000 4,725,000 29,203,746
2018 - 4,810,000 3,705,000 1,925,000 6,310,000 4,865,000 28,262,029
2019-2023 9,200,000 18,780,000 21,575,000 11,130,000 36,755,000 28,000,000 124,156,288
2024-2028 17,695,000 17,945,000 27,685,000 14,055,000 47,145,000 35,345,000 90,090,100
2029-2033 12,910,000 8,440,000 35,290,000 17,790,000 59,765,000 38,235,000 48,618,375
2034-2038 - - 45,070,000 17,570,000 59,610,000 - 13,014,467
$39,805,000 $67,005,000 $146,430,000 $69,325,000 $232,160,000 $124,280,000 $426,131,209
For the table above, interest was calculated for the 2008C variable rate bonds using an estimated rateof 4.00% for their remaining term. At March 31, 2013, the actual rate on these bonds was 0.13%.
On February 27, 2001, the Authority entered into a Master Trust Indenture, dated as of February 1,2001, that established the primary financing mechanism for the issuance of Bonds to financeimprovements to the Airport. Bonds issued under the Master Trust Indenture are obligations of theAuthority, secured by and payable from the Net Revenues of the Authority, and under certaincircumstances, the proceeds of the Bonds, investment earnings, amounts set aside in a Debt ServiceReserve Fund created under the Master Trust Indenture and certain other funds and accounts.
On February 27, 2001, the Authority issued $156,975,000 Airport Revenue Bonds Series 2001A underthe Master Trust Indenture. The proceeds were used for the design and construction of severalimprovements to the Airport, including the construction of a garage, two warehouse buildings to housesupport equipment, alterations to existing parking structures, roadways, bridges, toll plazas, walkways,and alterations to a pedestrian tunnel.
On February 27, 2001, the Authority also issued $47,570,000 Airport Revenue Refunding Bonds Series2001B under the Master Trust Indenture. The proceeds were used to refund Revenue Bonds previouslyissued by the Authority to finance parking facilities at the Airport.
On May 1, 2002, American prepaid and retired Series 1995A and 1995B Special Facility RevenueRefunding Bonds totaling $78,300,000. These bonds, which were considered conduit debt, financedthe Terminal C Building facilities and equipment, all of which were leased to American for a 40-yearperiod.
RALEIGH-DURHAM AIRPORT AUTHORITYNOTES TO BASIC FINANCIAL STATEMENTS
March 31, 2013 and 2012
32
Note 5 – Long-term debt (continued)
On June 13, 2002, the Authority issued $30,000,000 Adjustable Rate Airport Revenue Bonds, Series2002A under the Master Trust Indenture. The proceeds of the Series 2002A Bonds were used tofinance a portion of the cost of acquiring and purchasing certain rights and interests of AmericanAirlines, Inc. under the Raleigh-Durham Airport Facilities Lease and Use Agreement dated November1, 1985, to finance the cost of rehabilitation of certain buildings and equipment related to the forgoingacquisition and purchase, and to finance the cost of certain other capital improvements to aeronauticalfacilities located at the airport. Due to downgrades of the credit ratings of the bond insurer insuringpayment of the Series 2002A Bonds in March 2008, the Series 2002 Bonds could no longer beremarketed at interest rate levels corresponding to their tax exempt trading index, or SIFMA. On August12, 2008 the entire outstanding principal balance of Series 2002A, or $22,500,000 was retired withAuthority funds.
On December 18, 2002, the Authority issued $35,000,000 Bond Anticipation Notes (BAN) Series 2002Bunder the Master Trust Indenture. On December 17, 2003, the Authority paid off the $35,000,000Series 2002B BAN with the issuance of a $70,000,000 Bond Anticipation Note, Series 2003 ($35 millionnew funding), under the Master Trust Indenture. These BAN proceeds were used to fund the initialcosts of constructing a general aviation terminal and an operations center; constructing a rampexpansion, including the relocation of Taxiway D; and improving Terminal C and associated facilities,including architectural, pre-construction and construction. The Series 2003 BAN was retired in March2005 with the issuance of the Series 2005A&B bonds.
On March 1, 2005, the Authority issued $39,805,000 Airport Revenue Bond Series 2005A under theMaster Trust Indenture. The proceeds were used for the development of the new Terminal 2.
On March 1, 2005, the Authority issued $85,490,000 Airport Revenue Bond Series 2005B under theMaster Trust Indenture. These proceeds were also used for the development of Terminal 2, includingthe redevelopment of the north ramp general aviation area, an Authority Operations Center, and therelocation of Taxiway D and ramp expansion.
On May 4, 2005 the Authority executed two interest rate swap agreements in anticipation of theissuance of $300 million of Bonds to finance the continued development of Terminal 2. The effectivedate of the swaps was June 15, 2006 and the termination date of the swaps was May 1, 2036. Oneinterest rate swap agreement was entered into with Citibank, N.A. and one interest rate swapagreement was entered into with Lehman Brothers Special Financing Inc. The aggregate notionalamount of the swaps was $300,000,000 and the terms of the swaps are substantially similar. Under theswaps, the Authority agreed to pay the swap providers a fixed rate of 4.27% based on the notionalamount of the swaps and the swap providers agreed to pay the Authority the Bond Market AssociationMunicipal Swap Index (BMA or SIFMA) rate plus 5 basis points based on the notional amount of theswaps. Only the net difference in interest rate payments is actually exchanged. The $300 million inbond principal is not exchanged; it is only the basis on which the interest payments are calculated. Thenotional amount of the swaps was designed to amortize with the 2006 Bonds.
RALEIGH-DURHAM AIRPORT AUTHORITYNOTES TO BASIC FINANCIAL STATEMENTS
March 31, 2013 and 2012
33
Note 5 – Long-term debt (continued)
On June 15, 2006, the Authority issued $300 million of its Variable Rate Airport Revenue Bonds in fiveseries (Series 2006A, 2006B, 2006C, 2006D and 2006E). On May 2, 2008, the Authority refunded theSeries 2006 Bonds through the issuance of its Variable Rate Airport Revenue Bonds, also in theamount of $300 million, in three series (Series 2008A, 2008B and 2008C).The Series 2008 Bonds wereissued to refund the Series 2006 Bonds to correct a trading problem associated with the ratingsdowngrade of the bond insurer insuring payment of the Series 2006 Bonds. The Series 2008 Bondswere issued in the amount of $300 million and have the identical amortization schedule as the refundedSeries 2006 Bonds. The refunding of the Series 2006 Bonds by the Series 2008 Bonds resolved thetrading problems associated with the ratings downgrade of the bond insurer for the Series 2006 Bonds.
The Series 2006 Bonds, and later the Series 2008 Bonds, were issued as variable interest rate bonds,but the swaps converted the interest rate to a synthetic fixed rate. If the floating receipts from the swapcounterparties equaled the interest due on the hedged bonds, the Authority’s effective interest ratewould be the fixed swap rate. The Authority was exposed to additional interest expense payments ifthe variable interest rate on the Bonds exceeds BMA (or SIFMA) plus 5 basis points. The swapagreements utilized the International Swap Dealers Association Master Agreement. Termination couldresult in the Authority being required to make an unanticipated termination payment.
In connection with the 2008 refunding, the swaps associated with the Series 2006 Bonds were notchanged and there was no gain or loss on the refunding.
In September 2008 Lehman Brothers Special Financing, Inc. entered bankruptcy in connection with thebankruptcy filing by Lehman Brothers. This bankruptcy resulted in a default by Lehman BrothersSpecial Financing Inc. under its $150 million swap agreement with the Authority. At that time, theAuthority began exploring the possibility of terminating the interest rate swap with Lehman. OnFebruary 9, the Authority terminated the Lehman swap at a cost to the Airport Authority of $9.1 million.Simultaneously with terminating the swap agreement, the Authority entered into two new swapagreements for an aggregate notional amount of $75 million with Barclays Bank, Plc and MorganKeegan Financial Products, Inc. as swap counterparties. Performance by Morgan Keegan FinancialProducts, Inc. under its swap agreement was supported by a second agreement entered into by theAuthority and Morgan Keegan with Deutsche Bank. The Authority received $4,551,000 from BarclaysBank Plc and Morgan Keegan Financial Products, Inc. to offset the payment made to Lehman Brothers.The new swaps were negotiated with Barclays in the notional amount of $50 million and with MorganKeegan in the notional amount of $25 million. Fixed rate payments under these new swaps were set ata rate of 4.099 percent, down from the 4.27 percent Lehman swap rate, reducing the Airport Authority’sinterest cost on the hedged $75 million by approximately $128,000 per year. The remaining $75 millionof Series 2008 Bonds became un-hedged variable debt upon the termination of the Lehman swap.Subsequent to their default, Lehman had challenged the Authority’s calculations regarding thesetransactions and the Authority’s calculation of swap termination amounts. Through mediation withLehman in the fall of 2011, the Authority successfully negotiated a final settlement of this swaptermination amount and all other related matters between the two parties.
Each series of the Series 2008 Bonds was supported by credit or liquidity support provided by a letterof credit or standby bond purchase agreement of a financial institution. For the $75 million Series2008C Bonds, the Authority received a letter of credit from SunTrust Bank. Due to financial difficultiesencountered by SunTrust Bank in 2009, the Series 2008C Bonds could not be remarketed at variableinterest rates that corresponded to SIFMA. In November 2009, the Authority and SunTrust Bank
RALEIGH-DURHAM AIRPORT AUTHORITYNOTES TO BASIC FINANCIAL STATEMENTS
March 31, 2013 and 2012
34
Note 5 – Long-term debt (continued)
entered into arrangements with the Federal Home Loan Bank of Atlanta for the Federal Home LoanBank to deliver a standby letter of credit that supports the letter of credit of SunTrust Bank securing theSeries 2008C Bonds. The delivery of the Federal Home Bank letter of credit resulted in a return of thevariable interest rates on the Series 2008C Bonds to levels that approximate the SIFMA index.
On May 31, 2007, the Authority finalized financing of the Terminal 2 with the issuance by the Authorityof its Airport Revenue Bonds, Series 2007 in the principal amount of $152 million. The remainingTerminal 2 project costs were funded with $47 million in pay-as-go PFCs (from accumulated PFCbalances) and approximately $18 million in Authority cash. With the opening of the South Concourseon January 23, 2011, Terminal 2 became fully operational. In addition, this facility was now fully fundedand was completed on time and under its budget of $570 million.
On August 6, 2010 the Authority elected to terminate all three of its interest rate swap positions. Theseswaps with Citigroup, Barclays Capital, and Morgan Keegan had notational values totaling $216.87million at August 6, 2010. At this time, these swaps under existing market conditions had a collectivemarket termination value of $33,549,516. In conjunction with these terminations, the Authoritysimultaneously priced the 2010A refunding bonds in the amount of $242,365,000 which refunded the2008AB variable bonds (the swapped bonds), converting them to fixed rate non-AMT obligations.These swap positions had been undertaken in 2005 to lock in historically low interest rates on theTerminal 2 project in advance of its ability to access the bond markets. By eliminating its swappositions, the Authority sought to reduce its exposure to risks associated with the underlying variablerate demand obligations, particularly with regard to costs and availability of credit and liquidity supportfor the 2008A/B Bonds, and to risks associated with the interest rate swap agreements. Such risks hadincreased materially from 2005 when the Authority had entered into these swap agreements. As ofAugust 6, 2010 and additionally at March 31, 2013, the Authority had no interest rate swaps orderivatives in its debt portfolio.
During August 2010, the Authority also was able to advance refund the Series 2001A Bonds with theSeries 2010B and 2010B-1 Bonds in the amounts of $94,080,000 and $38,235,000, respectively. Theaggregate reduction in debt service payments between the original 2001A debt and the refunded2010B, B-1 bonds was $4.118 million. This equated to a net present value savings of $2.56 million.These bonds achieved present value savings of 7.80% and 6.70%, respectively. The total deposit tothe Escrow Fund to refund the Series 2001A Bonds totaled $145,691,630 (which included Bondpremiums of $10,818,873). This total was deposited into an escrow fund to be used, together withinvestment earnings thereon, to pay the interest on the Series 2001A Bonds until the redemptionthereof on May 1, 2011 and to pay the redemption price of the Series 2001A Bonds on such date. Thisescrow payment to the trustee defeased the remaining Series 2001A Bonds and the liability for thisdebt was removed from these financial statements.
Prior to the swap terminations, the Authority and the North Carolina Local Government Commissionplaced a limit or cap of 3% on the present value dis-savings on these transactions (calculated basedupon a comparison of the estimated all-in costs of the transaction if the Bonds were not refunded andthe swap agreements were not terminated and the cost of the fixed rate refunding transaction). TheAuthority achieved this goal with associated present value dis-savings of 2.36% on these swapterminations on August 6, 2010. In combination with present value savings from the refunding of theSeries 2001A Bonds, the Authority achieved overall present value savings of $5.2 million on thecollective transactions.
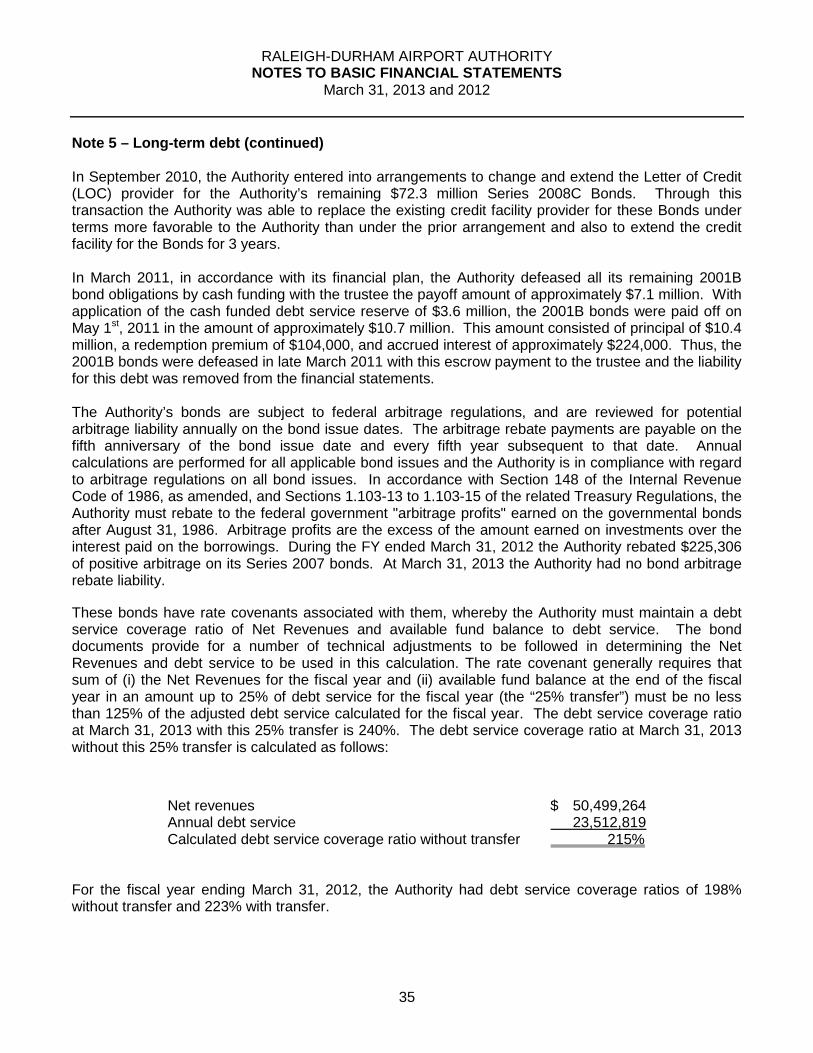
RALEIGH-DURHAM AIRPORT AUTHORITYNOTES TO BASIC FINANCIAL STATEMENTS
March 31, 2013 and 2012
35
Note 5 – Long-term debt (continued)
In September 2010, the Authority entered into arrangements to change and extend the Letter of Credit(LOC) provider for the Authority’s remaining $72.3 million Series 2008C Bonds. Through thistransaction the Authority was able to replace the existing credit facility provider for these Bonds underterms more favorable to the Authority than under the prior arrangement and also to extend the creditfacility for the Bonds for 3 years.
In March 2011, in accordance with its financial plan, the Authority defeased all its remaining 2001Bbond obligations by cash funding with the trustee the payoff amount of approximately $7.1 million. Withapplication of the cash funded debt service reserve of $3.6 million, the 2001B bonds were paid off onMay 1st, 2011 in the amount of approximately $10.7 million. This amount consisted of principal of $10.4million, a redemption premium of $104,000, and accrued interest of approximately $224,000. Thus, the2001B bonds were defeased in late March 2011 with this escrow payment to the trustee and the liabilityfor this debt was removed from the financial statements.
The Authority’s bonds are subject to federal arbitrage regulations, and are reviewed for potentialarbitrage liability annually on the bond issue dates. The arbitrage rebate payments are payable on thefifth anniversary of the bond issue date and every fifth year subsequent to that date. Annualcalculations are performed for all applicable bond issues and the Authority is in compliance with regardto arbitrage regulations on all bond issues. In accordance with Section 148 of the Internal RevenueCode of 1986, as amended, and Sections 1.103-13 to 1.103-15 of the related Treasury Regulations, theAuthority must rebate to the federal government "arbitrage profits" earned on the governmental bondsafter August 31, 1986. Arbitrage profits are the excess of the amount earned on investments over theinterest paid on the borrowings. During the FY ended March 31, 2012 the Authority rebated $225,306of positive arbitrage on its Series 2007 bonds. At March 31, 2013 the Authority had no bond arbitragerebate liability.
These bonds have rate covenants associated with them, whereby the Authority must maintain a debtservice coverage ratio of Net Revenues and available fund balance to debt service. The bonddocuments provide for a number of technical adjustments to be followed in determining the NetRevenues and debt service to be used in this calculation. The rate covenant generally requires thatsum of (i) the Net Revenues for the fiscal year and (ii) available fund balance at the end of the fiscalyear in an amount up to 25% of debt service for the fiscal year (the “25% transfer”) must be no lessthan 125% of the adjusted debt service calculated for the fiscal year. The debt service coverage ratioat March 31, 2013 with this 25% transfer is 240%. The debt service coverage ratio at March 31, 2013without this 25% transfer is calculated as follows:
Net revenues $ 50,499,264Annual debt service 23,512,819Calculated debt service coverage ratio without transfer 215%
For the fiscal year ending March 31, 2012, the Authority had debt service coverage ratios of 198%without transfer and 223% with transfer.
RALEIGH-DURHAM AIRPORT AUTHORITYNOTES TO BASIC FINANCIAL STATEMENTS
March 31, 2013 and 2012
36
Note 6 – Leases
The Authority leases land, buildings and terminal space with a cost of approximately $722 million and acarrying value of approximately $560 million to the airlines, car rental agencies, restaurant and otherbusinesses located at the airport. Revenues from these leases, which are included in buildings andgrounds and general aviation revenue, were approximately 41% and 42% of airport operating revenuesfor fiscal years ended March 31, 2013 and 2012, respectively. These leases cover periods ranging upto a maximum of 40 years and contain provisions for fixed and contingent rentals based on revenues.For the years ended March 31, 2013 and 2012, contingent rentals comprised $18.0 and $18.4 million ofthe total rental revenues, respectively.
Minimum future rentals on noncancelable operating leases for the next five fiscal years areapproximately:
Year EndingMarch 31 Amount
2014 13,080,000$2015 9,548,0002016 8,574,0002017 3,618,0002018 2,524,000
37,344,000$
Note 7 – Employee retirement plans
Local governmental employees' retirement system
Plan Description – The Authority contributes to the statewide Local Governmental Employees'Retirement System (LGERS), a cost-sharing multiple-employer defined benefit pension planadministered by the State of North Carolina. LGERS provides retirement and disability benefits to planmembers and beneficiaries. Article 3 of G.S. Chapter 128 assigns the Authority to establish and amendbenefit provisions to the North Carolina General Assembly. The Local Governmental Employees'Retirement System is included in the Comprehensive Annual Financial Report (CAFR) for the State ofNorth Carolina. The State's CAFR includes financial statements and required supplementaryinformation for LGERS. That report may be obtained by writing to the Office of the State Controller,1410 Mail Service Center, Raleigh, North Carolina 27699-1410, or by calling (919) 981-5454.
Funding Policy – Plan members are required to contribute 6.00% of their annual covered salary. TheAuthority is required to contribute at an actuarially determined rate. The current rate for employees notengaged in law enforcement and for law enforcement officers is 6.74% and 6.77% of annual coveredpayroll. The contribution requirements of members are established and may be amended by the NorthCarolina General Assembly. The Authority’s contributions to LGERS for the years ended March 31,2013, 2012 and 2011 were $2,077,533, $2,033,865, and $1,870,263, respectively. The contributionsmade by the Authority equaled the required contributions for each fiscal year.
RALEIGH-DURHAM AIRPORT AUTHORITYNOTES TO BASIC FINANCIAL STATEMENTS
March 31, 2013 and 2012
37
Note 7 – Employee retirement plans (continued)
Supplemental retirement income plan for law enforcement officers
Plan Description – The Authority contributes to the Supplemental Retirement Income Plan (Plan), adefined contribution pension plan administered by the Department of State Treasurer and a Board ofTrustees. The Plan provides retirement benefits to law enforcement officers employed by the Authority.Article 5 of G.S. Chapter 135 assigns the Authority to establish and amend benefit provisions to theNorth Carolina General Assembly.
Funding Policy – Article 12E of G.S. Chapter 143 requires the Authority to contribute each month anamount equal to five percent of each officer's salary, and all amounts contributed are vestedimmediately. Also, the law enforcement officers may make voluntary contributions to the plan.Contributions for the year ended March 31, 2013 were $196,535, which consisted of $90,258from the Authority, and $106,277 from the law enforcement officers. Contributions for the year endedMarch 31, 2012 were $195,819, which consisted of $113,300 from the Authority, and $82,519 from thelaw enforcement officers.
Law enforcement officer’s special separation allowance
Plan Description – The Authority administers a public employee retirement system (the “SeparationAllowance”), a single-employer defined benefit pension plan that provides retirement benefits to theAuthority’s qualified sworn law enforcement officers. The Separation Allowance is equal to .85 percentof the annual equivalent of the base rate of compensation most recently applicable to the officer foreach year of creditable service. The retirement benefits are not subject to any increases in salary orretirement allowances that may be authorized by the General Assembly. Article 12D of G.S. Chapter143 assigns the Authority to establish and amend benefit provisions to the North Carolina GeneralAssembly.
All full-time law enforcement officers of the Authority are covered by the Separation Allowance. AtMarch 31, 2013, the Separation Allowance’s membership consisted of:
Retirees receiving benefits 8Active plan members 33Total 41
A separate audited GAAP-basis postemployment benefit plan report was not issued for the plan.
Summary of Significant Accounting PoliciesBasis of Accounting – The Authority has chosen to fund the Separation Allowance on a pay as you gobasis. Pension expenditures are made from operating accounts, which are maintained on the accrualbasis of accounting.
Method Used to Value Investments – No funds are set aside to pay benefits and administration costs.These expenditures are paid as they come due.
RALEIGH-DURHAM AIRPORT AUTHORITYNOTES TO BASIC FINANCIAL STATEMENTS
March 31, 2013 and 2012
38
Note 7 – Employee retirement plans (continued)
Contributions – The Authority is required by Article 12D of G.S. Chapter 143 to provide these retirementbenefits and has chosen to fund the benefit payments on a pay as you go basis through appropriationsmade in the operating budget. The Authority’s obligation to contribute to this plan is established andmay be amended by the North Carolina General Assembly. There were no contributions made byemployees.
The Authority’s pension cost and net pension obligation to the separation allowance for the current yearwere as follows:
March 31, 2013 March 31, 2012
a - Employer annual required contribution 88,614$ 88,614$
b - Interest on net pension obligation 51,762 54,665
c - Adjustment to annual required contribution (60,897) (61,107)
d - Annual pension cost (a+b+c) 79,479 82,172
e - Employer contributions made for current fiscal year 155,221 140,234
f - Increase in net pension obligation (d-e) (75,742) (58,062)
g - Net pension obligation beginning of fiscal year 1,035,247 1,093,309
h - Net pension obligation end of fiscal year (f+g) 959,505$ 1,035,247$
The annual required contribution for the current year was determined by the December 31, 2011actuarial valuation using the projected unit credit actuarial cost method. The actuarial assumptionsincluded (a) 5.00% investment rate of return and (b) projected salary increases ranging from 4.25% to7.85% per year. Item (b) included an inflation component of 3.00%. The assumptions did not includepost-retirement benefit increases. The actuarial value of assets was market value. The unfundedactuarial accrued liability is being amortized as a level percentage of pay on a closed basis. Theremaining amortization period at December 31, 2011 was 19 years.
The trend information is as follows:
Fiscal
Year
Ending
March
Annual
Pension
Cost (APC)
Percentage
of
APC
Contributed
Net Pension
Obligation
End of Year
2009 99,769$ 24.63% 1,056,934$
2010 98,662 60.64% 1,095,770
2011 84,514 103.18% 1,093,084
2012 82,172 170.66% 1,035,247
2013 79,479 195.30% 959,505
RALEIGH-DURHAM AIRPORT AUTHORITYNOTES TO BASIC FINANCIAL STATEMENTS
March 31, 2013 and 2012
39
Note 7 – Employee retirement plans (continued)
Funding Status and Funding Progress - as of December 31, 2011, the most recent actuarial valuationdate, the plan was not funded. The present value of future accrued liability contributions and, thus, theunfunded actuarial accrued liability (UAAL) was $1,022,450. The schedule of funding progress,presented as required supplementary information following the notes to the financial statements,presents multiyear trend information about whether the actuarial value of plan assets is increasing ordecreasing over time relative to the actuarial accrued liabilities for benefits.
Other Post-Employment Benefits
Health Care Plan
Plan Description:Under the terms of an Authority resolution, the Authority administers a single-employer benefit HealthCare Plan (the “Plan”). The Plan provides postemployment healthcare benefits to retirees of theAuthority, provided they participate in the North Carolina Local Governmental Employees' RetirementSystem (System). While eligibility to draw retirement benefits from the System vests at 5 years,eligibility for post-retirement health benefits from the Authority requires: (1) all requirements forretirement from LGERS are met and (2) the final 5 years of service are worked with the Authority. TheAuthority pays the cost of the individual and dependent premiums (or same portion of the cost as itpays for non-retired employees) for the qualified retiree's health coverage through the Authority's grouphealth insurance plan. When the retiree reaches age 65, the Authority’s post-retirement benefitscease. At that time, the retiree is no longer covered by the Authority’s group health insurance program.The Plan does not issue a stand-alone report and is not included in the report of a public employeeretirement system or a report of another entity.
Membership in the plan included the following at December 31, 2011 the date of the last actuarialvaluation:
Retirees receiving benefits 53Active plan members 282Total 335
Funding Policy:As noted above, the Authority pays its share of the cost of coverage (premiums) for the health carebenefits provided to qualified retirees. The Authority’s members pay their share of the premiums. TheAuthority has chosen to fund the health care benefits on a pay as you go basis and no funds are setaside to pay these benefits.
The current annual required contribution rate is 4.16% of annual covered payroll. For the current year,the Authority contributed $239,192 (retiree claims paid less premiums received) or 1.77% of annualcovered payroll. The Authority provides health care coverage through a minimum premium plan. TheAuthority’s required contribution for employees and retirees is the actual expense incurred.Contributions (premiums) made by employees and retirees were 3.89% and .26% of covered payroll,respectively. The Authority’s obligation to contribute to the Plan is established and may be amended bythe Authority’s Board of Directors.
RALEIGH-DURHAM AIRPORT AUTHORITYNOTES TO BASIC FINANCIAL STATEMENTS
March 31, 2013 and 2012
40
Note 7 – Employee retirement plans (continued)
Life Insurance Benefit
Plan Description:Under the terms of an Authority resolution, the Authority administers a single-employer life insurancebenefit. The life insurance benefit provides postemployment life insurance coverage to retirees of theAuthority in the amount of $10,000. When the retiree reaches age 99, the Authority’s post-retirementbenefits cease. At that time, the retiree is no longer covered by the Authority’s life insurance policy.
Funding Policy:The Authority pays the full cost of life insurance premiums. The Authority has chosen to fund the lifeinsurance benefits on a pay as you go basis and no funds are set aside to pay these benefits. TheAuthority’s obligation to contribute to the life insurance benefit is established and may be amended bythe Authority’s Board of Directors.
Summary of Significant Accounting Policies:Postemployment expenditures for the Authority’s portion of the premiums are from the Authority’senterprise fund, which is maintained on the full accrual basis of accounting. No funds are set aside topay benefits and administrative costs. These expenditures are paid as they come due.
Annual OPEB Cost and Net OPEB Obligation:The Authority’s annual OPEB cost (expense) is calculated based on the annual required contribution ofthe employer (ARC), an amount actuarially determined in accordance with the parameters of GASBStatement 45. The ARC represents a level of funding that, if paid on an ongoing basis is projected tocover normal cost each year and amortize any unfunded actuarial liabilities (of funding excess) over aperiod not to exceed thirty years. The following table shows the components of the Authority’s annualOPEB cost for the year, the amount actually contributed to the Plan and changes in the Authority’s netOPEB obligation for the health care benefits:
March 31, 2013 March 31, 2012
Annual required contribution 663,839$ 950,981$
Interest on net OPEB obligation 112,029 38,039
Adjustment to annual required contribution 107,022 74,681
Annual OPEB cost 668,846 914,339
Contributions made 239,192 277,663
Increase in net OPEB obligation 429,654 636,676
Net OPEB obligation beginning of the year 2,800,736 2,164,060
Net OPEB obligation end of the year 3,230,390$ 2,800,736$
RALEIGH-DURHAM AIRPORT AUTHORITYNOTES TO BASIC FINANCIAL STATEMENTS
March 31, 2013 and 2012
41
Note 7 – Employee retirement plans (continued)
The Authority’s annual OPEB cost, the percentage of annual OPEB cost contributed to the Plan and thenet OPEB obligation for 2013 were as follows:
Percentage ofFor Year Ended Annual Annual OPEB Cost Net OPEB
March OPEB Cost Contributed Obligation2010 854,455$ 23.8% 650,820$2011 1,714,169 11.7% 2,164,0602012 914,339 30.4% 2,800,7362013 668,845 35.8% 3,230,390
Funded Status and Funding Progress:As of December 31, 2011, the most recent actuarial valuation date, the plan was not funded. Theactuarial accrued liability for benefits and, thus, the unfunded actuarial accrued liability (UAAL) was$6,007,588. The covered payroll (annual payroll of active employees covered by the Plan) was$15,938,472, and the ratio of the UAAL to the covered payroll was 37.7%. Actuarial valuations of anongoing plan involve estimates of the value of reported amounts and assumptions about the probabilityof occurrence of events far into the future. Examples include assumptions about future employment,mortality, and healthcare trends. Amounts determined regarding the funded status of the plan and theannual required contributions of the employer are subject to continual revision as actual results arecompared with past expectations and new estimates are made about the future. The schedule offunding progress, presented as required supplementary information following the notes to the financialstatements, presents multiyear trend information about whether the actuarial value of plan assets isincreasing or decreasing over time relative to the actuarial accrued liabilities for benefits.
Actuarial Methods and Assumptions.Projections of benefits for financial reporting purposes are based on the substantive plan (the plan asunderstood by the employer and the plan members) and include the types of benefits provided at thetime of each valuation and the historical pattern of sharing of benefit costs between the employer andplan members at that point. The actuarial methods and assumptions used include techniques that aredesigned to reduce the effects of short-term volatility in actuarial accrued liabilities and the actuarialvalue assets, consistent with the long-term perspective of the calculations.
In the December 31, 2011 actuarial valuation, the projected unit credit actuarial cost method was used.The actuarial assumptions included a 4.00 percent investment rate of return (net of administrativeexpenses), which is the expected long-term investment returns on the employer’s own investmentscalculated based on the funded level of the plan at the valuation date, and an annual medical cost trendincrease of 9.5 to 5.00 percent annually. Both rates included a 3.00 percent inflation assumption. TheUAAL is being amortized as a level percentage of projected payroll on an open basis. The remainingamortization period at December 31, 2011, was 30 years.
RALEIGH-DURHAM AIRPORT AUTHORITYNOTES TO BASIC FINANCIAL STATEMENTS
March 31, 2013 and 2012
42
Note 8 – Commitments and contingencies
Risk management – The Authority is exposed to various risks of loss related to torts; theft of, damageto, and destruction of assets, injuries to employees and the general public, and natural disasters. TheAuthority carries commercial insurance against risks of loss, including property and public liabilityinsurance and worker’s compensation. Settled claims from these risks have been far less thancommercial insurance coverage.
The Authority, in accordance with NC General Statute 159-29, maintains Public Official Bonds on theDeputy Airport Director for Finance, Business and Administration and the Director of Finance, each atthe statutory requirement of $50,000. In addition, the Authority carries a Blanket Fidelity Bond for allemployees in the amount of $1,000,000.
Construction commitments – At March 31, 2013 and 2012, the Authority has contractualcommitments for Authority expansion programs of approximately $46 million and $12 million,respectively.
Contingent liabilities – The Authority is a defendant in various lawsuits. Although the outcome ofthese lawsuits is not presently determinable, in the opinion of the Authority's counsel the resolution ofthese matters will not have a material adverse effect on the financial condition of the Authority.
Prior to the opening of Terminal 2, the Authority’s Small Emerging Business (SEB) program was usedto provide loan backing for two small business concessionaires. The Authority has capped the amountavailable for this program at $1.5 million.
Note 9 – Subsequent events
The Authority has evaluated subsequent events through June 12, 2013 in connection with thepreparation of these financial statements which is the date the financial statements were available to beissued. No subsequent events are noted.
Raleigh-Durham Airport AuthorityRDU Airport, North Carolina
Required Supplemental Information
Prepared by the Finance Department
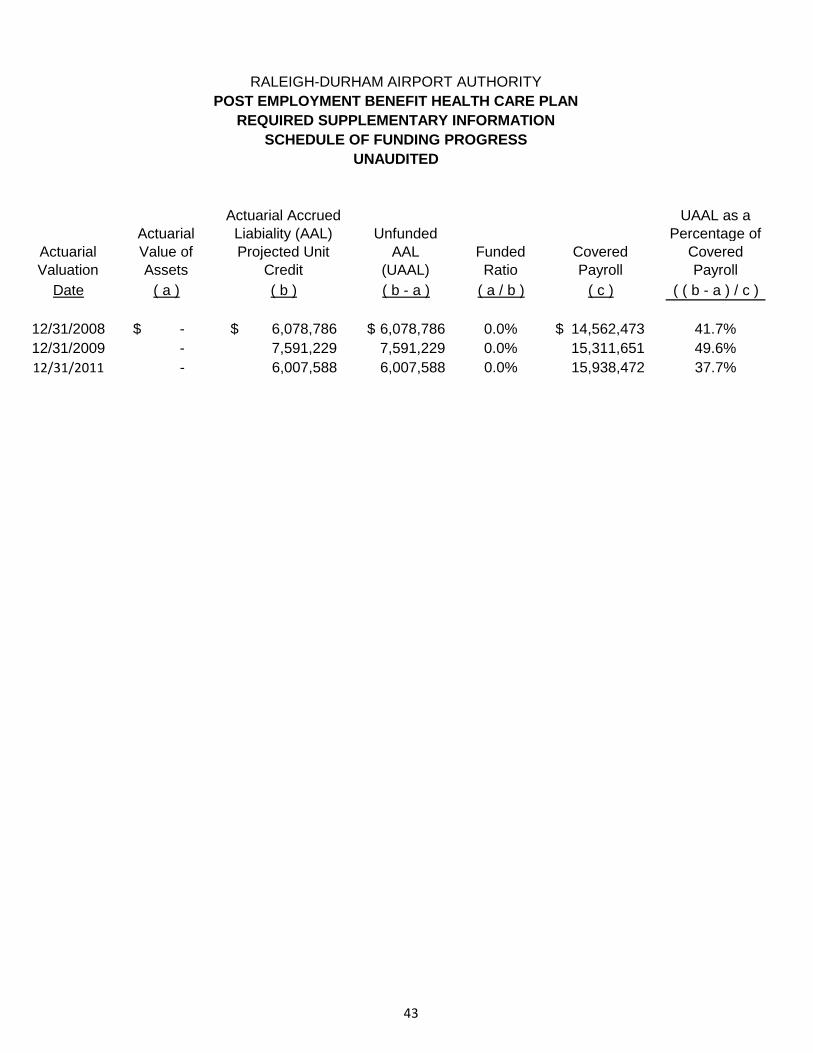
ActuarialValuation
ActuarialValue ofAssets
Actuarial AccruedLiabiality (AAL)Projected Unit
Credit
UnfundedAAL
(UAAL)FundedRatio
CoveredPayroll
UAAL as aPercentage of
CoveredPayroll
Date ( a ) ( b ) ( b - a ) ( a / b ) ( c ) ( ( b - a ) / c )
12/31/2008 -$ 6,078,786$ 6,078,786$ 0.0% 14,562,473$ 41.7%
12/31/2009 - 7,591,229 7,591,229 0.0% 15,311,651 49.6%
12/31/2011 - 6,007,588 6,007,588 0.0% 15,938,472 37.7%
RALEIGH-DURHAM AIRPORT AUTHORITY
POST EMPLOYMENT BENEFIT HEALTH CARE PLAN
REQUIRED SUPPLEMENTARY INFORMATION
SCHEDULE OF FUNDING PROGRESS
UNAUDITED
43
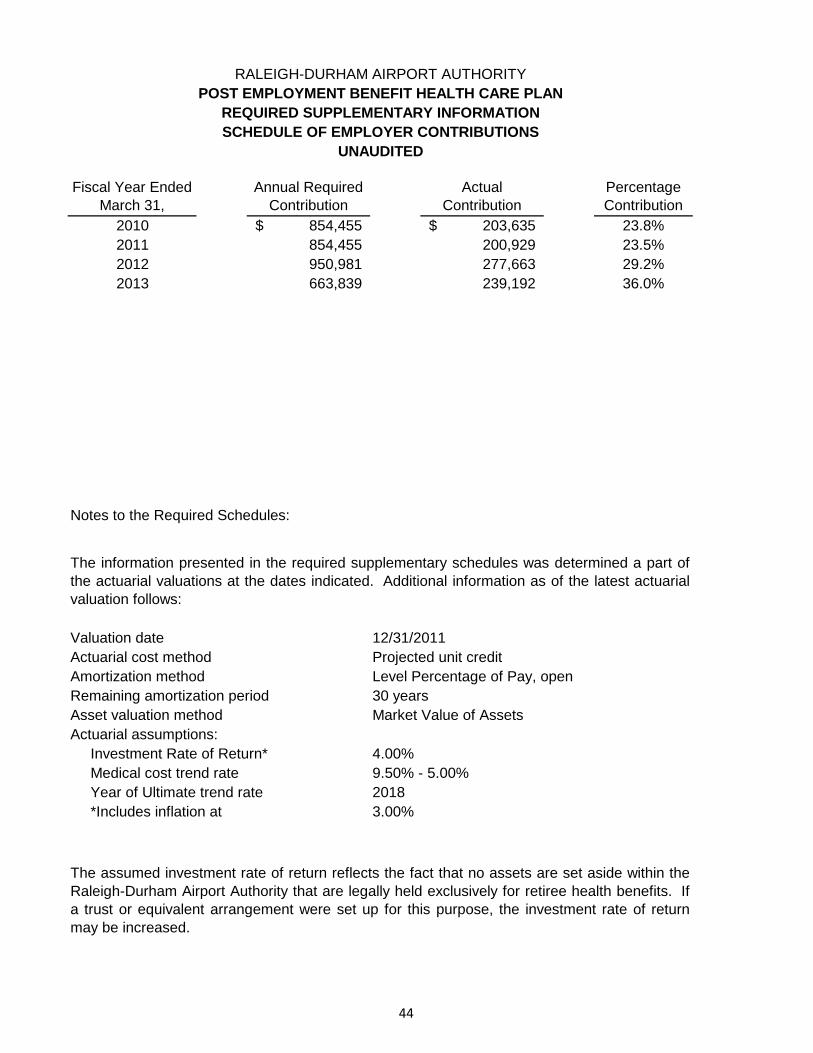
Fiscal Year EndedMarch 31,
Annual RequiredContribution
ActualContribution
PercentageContribution
2010 854,455$ 203,635$ 23.8%
2011 854,455 200,929 23.5%
2012 950,981 277,663 29.2%
2013 663,839 239,192 36.0%
Notes to the Required Schedules:
The assumed investment rate of return reflects the fact that no assets are set aside within theRaleigh-Durham Airport Authority that are legally held exclusively for retiree health benefits. Ifa trust or equivalent arrangement were set up for this purpose, the investment rate of returnmay be increased.
*Includes inflation at 3.00%
Investment Rate of Return* 4.00%
Medical cost trend rate 9.50% - 5.00%
Year of Ultimate trend rate 2018
Remaining amortization period 30 years
Asset valuation method Market Value of Assets
Actuarial assumptions:
Valuation date 12/31/2011
Actuarial cost method Projected unit credit
Amortization method Level Percentage of Pay, open
The information presented in the required supplementary schedules was determined a part ofthe actuarial valuations at the dates indicated. Additional information as of the latest actuarialvaluation follows:
RALEIGH-DURHAM AIRPORT AUTHORITY
POST EMPLOYMENT BENEFIT HEALTH CARE PLAN
REQUIRED SUPPLEMENTARY INFORMATION
SCHEDULE OF EMPLOYER CONTRIBUTIONS
UNAUDITED
44
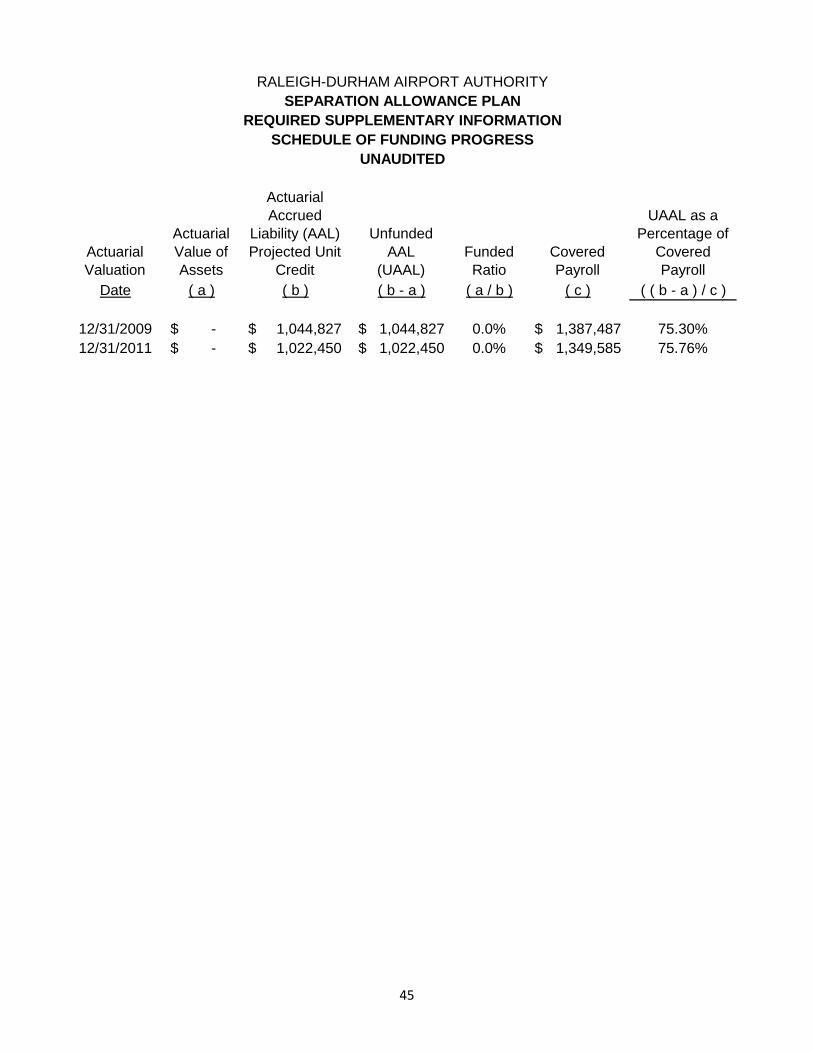
ActuarialValuation
ActuarialValue ofAssets
ActuarialAccrued
Liability (AAL)Projected Unit
Credit
UnfundedAAL
(UAAL)FundedRatio
CoveredPayroll
UAAL as aPercentage of
CoveredPayroll
Date ( a ) ( b ) ( b - a ) ( a / b ) ( c ) ( ( b - a ) / c )
12/31/2009 -$ 1,044,827$ 1,044,827$ 0.0% 1,387,487$ 75.30%
12/31/2011 -$ 1,022,450$ 1,022,450$ 0.0% 1,349,585$ 75.76%
RALEIGH-DURHAM AIRPORT AUTHORITY
SEPARATION ALLOWANCE PLAN
REQUIRED SUPPLEMENTARY INFORMATION
SCHEDULE OF FUNDING PROGRESS
UNAUDITED
45
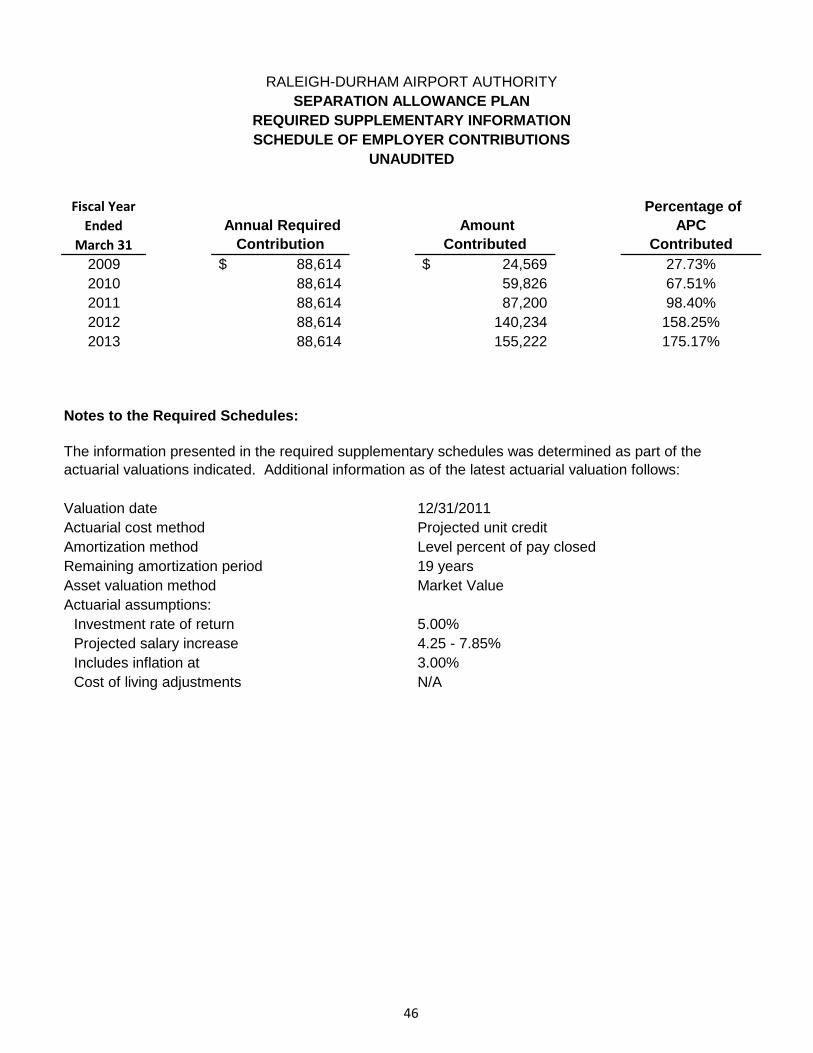
Fiscal Year
Ended
March 31
Annual Required
Contribution
Amount
Contributed
Percentage of
APC
Contributed
2009 88,614$ 24,569$ 27.73%
2010 88,614 59,826 67.51%
2011 88,614 87,200 98.40%
2012 88,614 140,234 158.25%
2013 88,614 155,222 175.17%
12/31/2011
Projected unit credit
Level percent of pay closed
19 years
Market Value
5.00%
4.25 - 7.85%
3.00%
N/A
Valuation date
Investment rate of return
Projected salary increase
Includes inflation at
Cost of living adjustments
Actuarial cost method
Amortization method
Remaining amortization period
Asset valuation method
Actuarial assumptions:
Notes to the Required Schedules:
The information presented in the required supplementary schedules was determined as part of theactuarial valuations indicated. Additional information as of the latest actuarial valuation follows:
RALEIGH-DURHAM AIRPORT AUTHORITY
SEPARATION ALLOWANCE PLAN
REQUIRED SUPPLEMENTARY INFORMATION
SCHEDULE OF EMPLOYER CONTRIBUTIONS
UNAUDITED
46
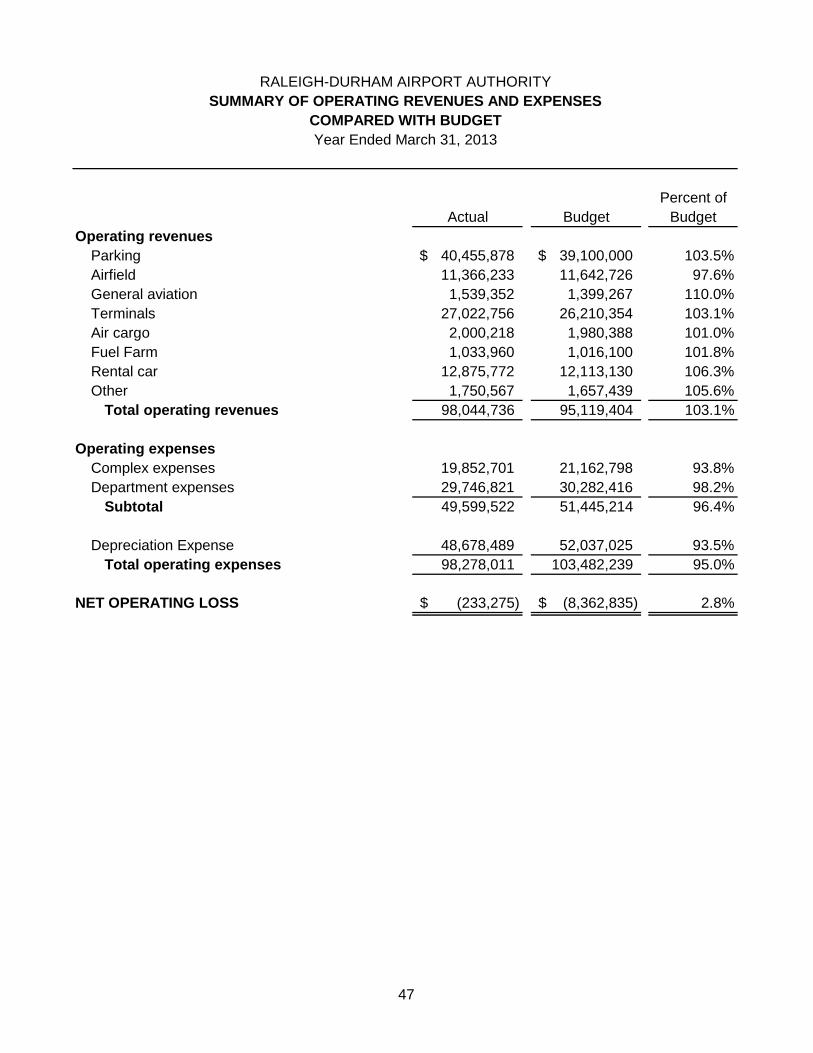
Percent of
Actual Budget Budget
Operating revenues
Parking 40,455,878$ 39,100,000$ 103.5%
Airfield 11,366,233 11,642,726 97.6%
General aviation 1,539,352 1,399,267 110.0%
Terminals 27,022,756 26,210,354 103.1%
Air cargo 2,000,218 1,980,388 101.0%
Fuel Farm 1,033,960 1,016,100 101.8%
Rental car 12,875,772 12,113,130 106.3%
Other 1,750,567 1,657,439 105.6%
Total operating revenues 98,044,736 95,119,404 103.1%
Operating expenses
Complex expenses 19,852,701 21,162,798 93.8%
Department expenses 29,746,821 30,282,416 98.2%
Subtotal 49,599,522 51,445,214 96.4%
Depreciation Expense 48,678,489 52,037,025 93.5%
Total operating expenses 98,278,011 103,482,239 95.0%
NET OPERATING LOSS (233,275)$ (8,362,835)$ 2.8%
RALEIGH-DURHAM AIRPORT AUTHORITY
SUMMARY OF OPERATING REVENUES AND EXPENSES
Year Ended March 31, 2013
COMPARED WITH BUDGET
47
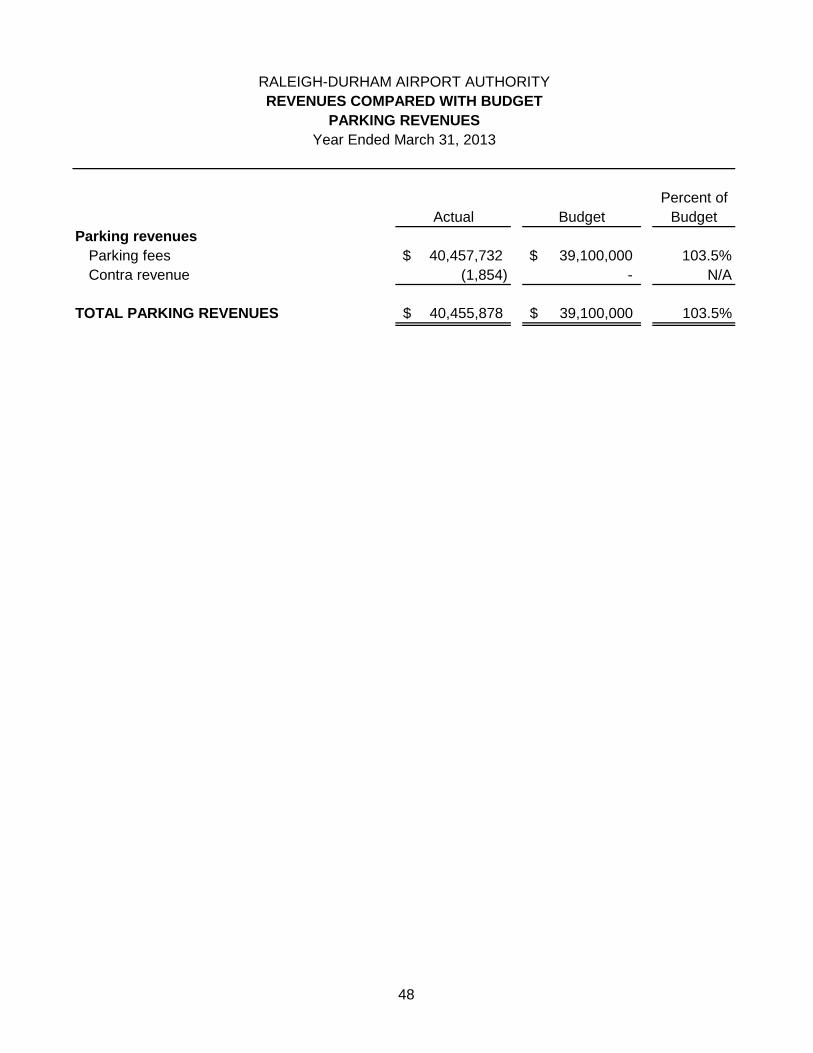
Percent of
Actual Budget Budget
Parking revenues
Parking fees 40,457,732$ 39,100,000$ 103.5%
Contra revenue (1,854) - N/A
TOTAL PARKING REVENUES 40,455,878$ 39,100,000$ 103.5%
RALEIGH-DURHAM AIRPORT AUTHORITY
REVENUES COMPARED WITH BUDGET
Year Ended March 31, 2013
PARKING REVENUES
48
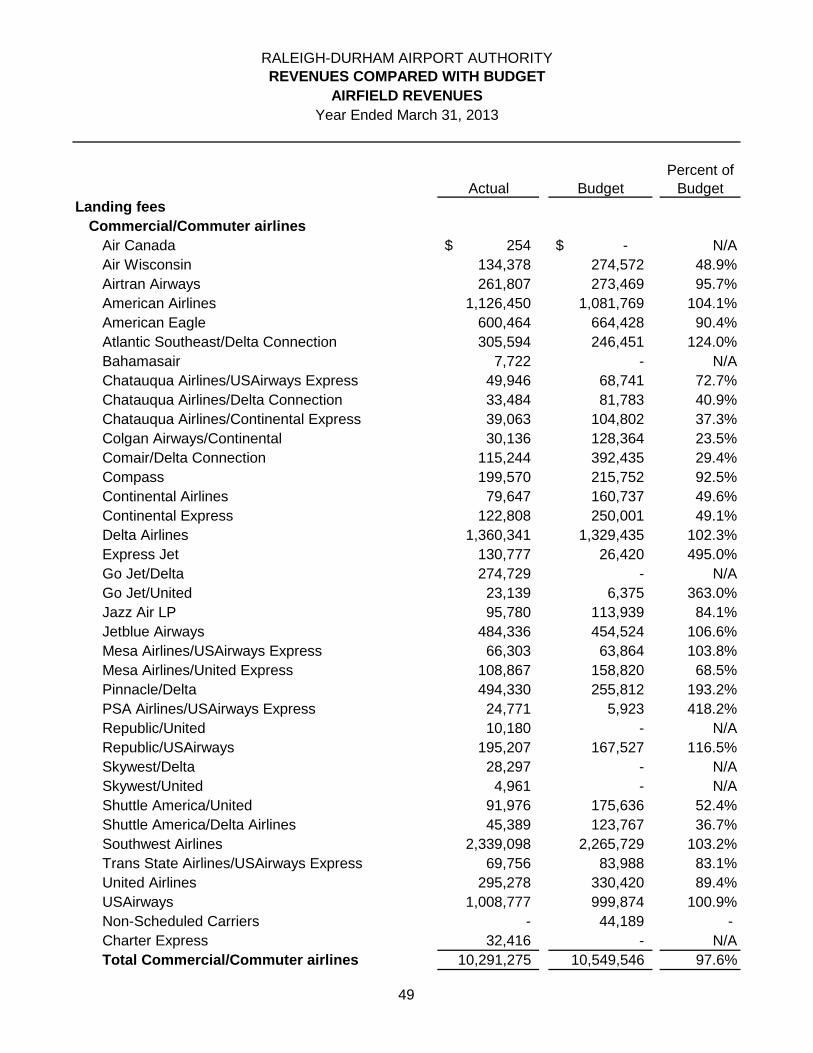
Percent of
Actual Budget Budget
Landing fees
Commercial/Commuter airlines
Air Canada 254$ -$ N/A
Air Wisconsin 134,378 274,572 48.9%
Airtran Airways 261,807 273,469 95.7%
American Airlines 1,126,450 1,081,769 104.1%
American Eagle 600,464 664,428 90.4%
Atlantic Southeast/Delta Connection 305,594 246,451 124.0%
Bahamasair 7,722 - N/A
Chatauqua Airlines/USAirways Express 49,946 68,741 72.7%
Chatauqua Airlines/Delta Connection 33,484 81,783 40.9%
Chatauqua Airlines/Continental Express 39,063 104,802 37.3%
Colgan Airways/Continental 30,136 128,364 23.5%
Comair/Delta Connection 115,244 392,435 29.4%
Compass 199,570 215,752 92.5%
Continental Airlines 79,647 160,737 49.6%
Continental Express 122,808 250,001 49.1%
Delta Airlines 1,360,341 1,329,435 102.3%
Express Jet 130,777 26,420 495.0%
Go Jet/Delta 274,729 - N/A
Go Jet/United 23,139 6,375 363.0%
Jazz Air LP 95,780 113,939 84.1%
Jetblue Airways 484,336 454,524 106.6%
Mesa Airlines/USAirways Express 66,303 63,864 103.8%
Mesa Airlines/United Express 108,867 158,820 68.5%
Pinnacle/Delta 494,330 255,812 193.2%
PSA Airlines/USAirways Express 24,771 5,923 418.2%
Republic/United 10,180 - N/A
Republic/USAirways 195,207 167,527 116.5%
Skywest/Delta 28,297 - N/A
Skywest/United 4,961 - N/A
Shuttle America/United 91,976 175,636 52.4%
Shuttle America/Delta Airlines 45,389 123,767 36.7%
Southwest Airlines 2,339,098 2,265,729 103.2%
Trans State Airlines/USAirways Express 69,756 83,988 83.1%
United Airlines 295,278 330,420 89.4%
USAirways 1,008,777 999,874 100.9%
Non-Scheduled Carriers - 44,189 -
Charter Express 32,416 - N/A
Total Commercial/Commuter airlines 10,291,275 10,549,546 97.6%
RALEIGH-DURHAM AIRPORT AUTHORITY
REVENUES COMPARED WITH BUDGET
Year Ended March 31, 2013
AIRFIELD REVENUES
49
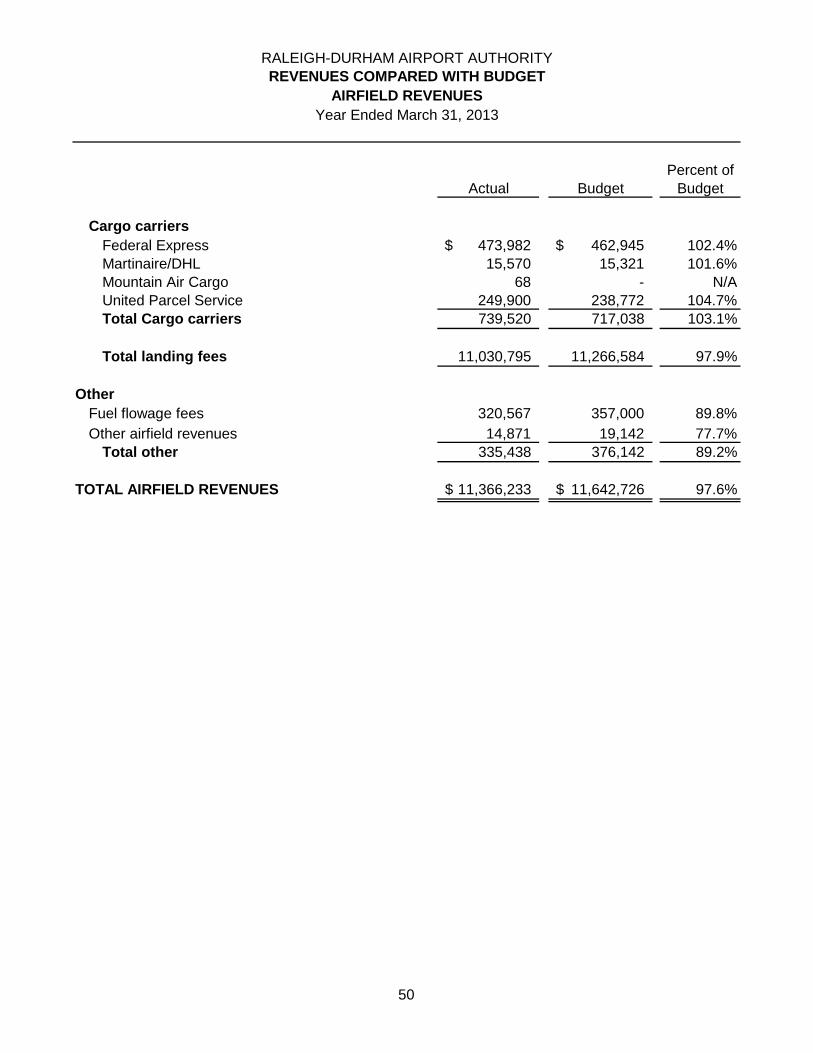
Percent of
Actual Budget Budget
RALEIGH-DURHAM AIRPORT AUTHORITY
REVENUES COMPARED WITH BUDGET
Year Ended March 31, 2013
AIRFIELD REVENUES
Cargo carriers
Federal Express 473,982$ 462,945$ 102.4%
Martinaire/DHL 15,570 15,321 101.6%
Mountain Air Cargo 68 - N/A
United Parcel Service 249,900 238,772 104.7%
Total Cargo carriers 739,520 717,038 103.1%
Total landing fees 11,030,795 11,266,584 97.9%
Other
Fuel flowage fees 320,567 357,000 89.8%
Other airfield revenues 14,871 19,142 77.7%
Total other 335,438 376,142 89.2%
TOTAL AIRFIELD REVENUES 11,366,233$ 11,642,726$ 97.6%
50
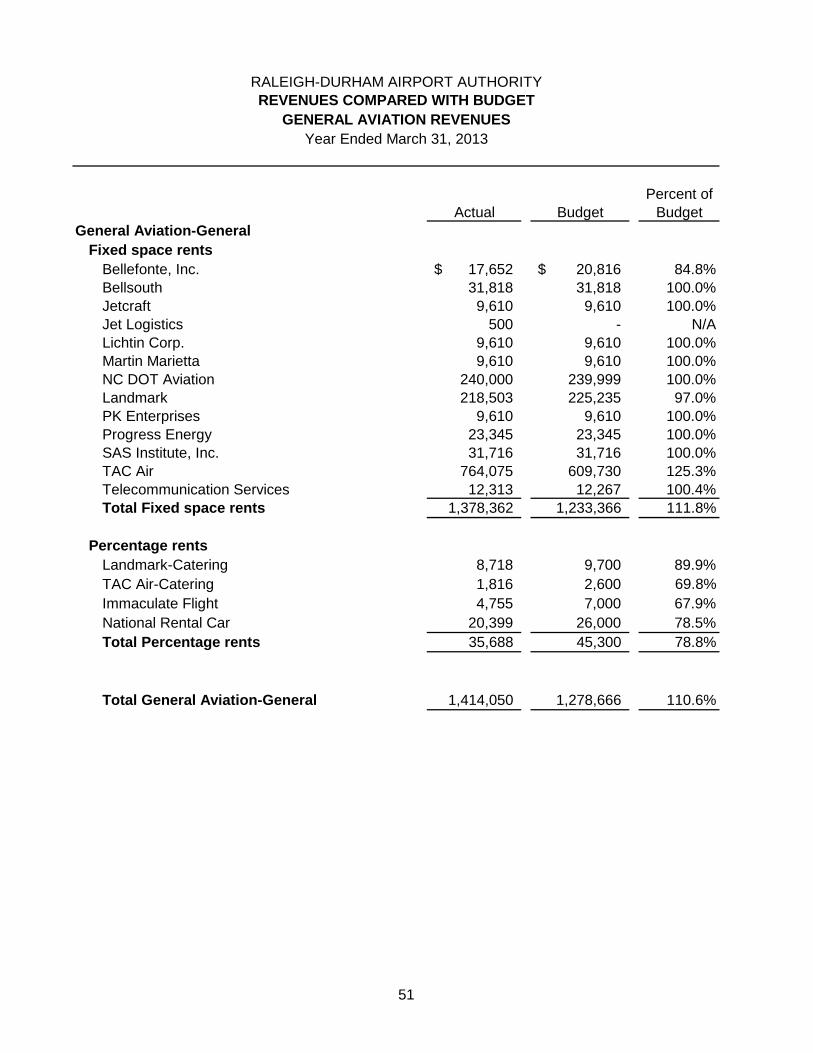
Percent of
Actual Budget Budget
General Aviation-General
Fixed space rents
Bellefonte, Inc. 17,652$ 20,816$ 84.8%
Bellsouth 31,818 31,818 100.0%
Jetcraft 9,610 9,610 100.0%
Jet Logistics 500 - N/A
Lichtin Corp. 9,610 9,610 100.0%
Martin Marietta 9,610 9,610 100.0%
NC DOT Aviation 240,000 239,999 100.0%
Landmark 218,503 225,235 97.0%
PK Enterprises 9,610 9,610 100.0%
Progress Energy 23,345 23,345 100.0%
SAS Institute, Inc. 31,716 31,716 100.0%
TAC Air 764,075 609,730 125.3%
Telecommunication Services 12,313 12,267 100.4%
Total Fixed space rents 1,378,362 1,233,366 111.8%
Percentage rents
Landmark-Catering 8,718 9,700 89.9%
TAC Air-Catering 1,816 2,600 69.8%
Immaculate Flight 4,755 7,000 67.9%
National Rental Car 20,399 26,000 78.5%
Total Percentage rents 35,688 45,300 78.8%
Total General Aviation-General 1,414,050 1,278,666 110.6%
RALEIGH-DURHAM AIRPORT AUTHORITY
REVENUES COMPARED WITH BUDGET
Year Ended March 31, 2013
GENERAL AVIATION REVENUES
51
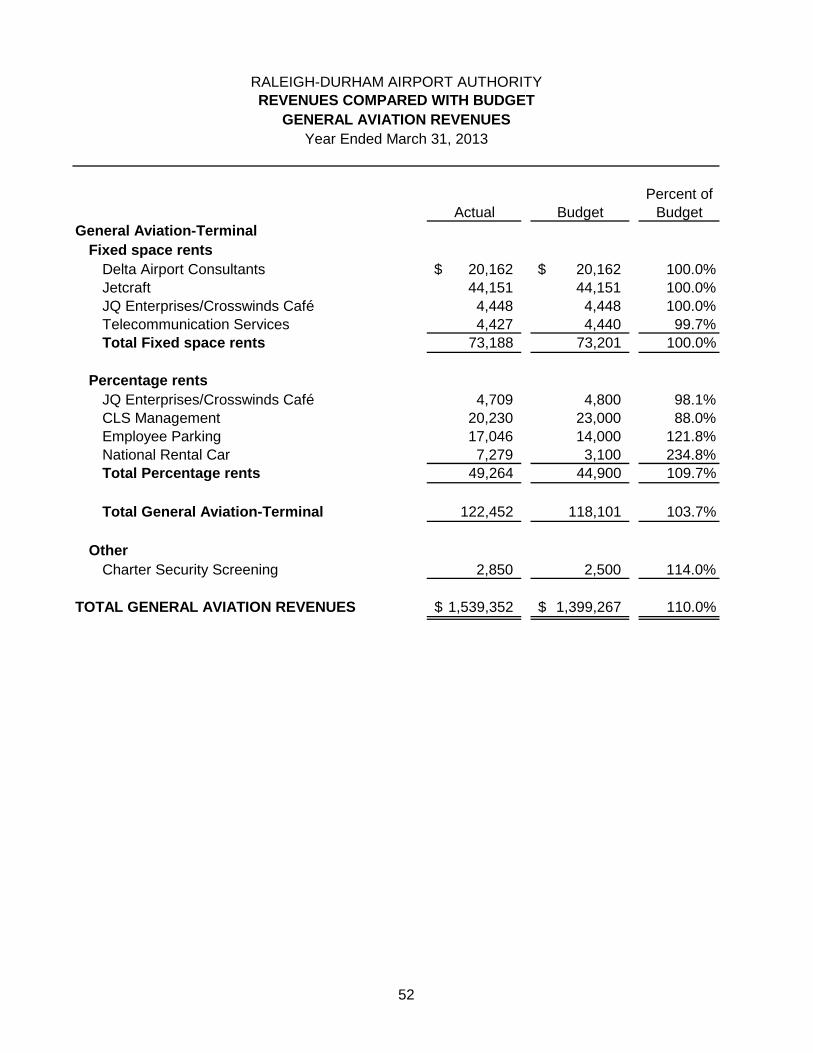
Percent of
Actual Budget Budget
RALEIGH-DURHAM AIRPORT AUTHORITY
REVENUES COMPARED WITH BUDGET
Year Ended March 31, 2013
GENERAL AVIATION REVENUES
General Aviation-Terminal
Fixed space rents
Delta Airport Consultants 20,162$ 20,162$ 100.0%
Jetcraft 44,151 44,151 100.0%
JQ Enterprises/Crosswinds Café 4,448 4,448 100.0%
Telecommunication Services 4,427 4,440 99.7%
Total Fixed space rents 73,188 73,201 100.0%
Percentage rents
JQ Enterprises/Crosswinds Café 4,709 4,800 98.1%
CLS Management 20,230 23,000 88.0%
Employee Parking 17,046 14,000 121.8%
National Rental Car 7,279 3,100 234.8%
Total Percentage rents 49,264 44,900 109.7%
Total General Aviation-Terminal 122,452 118,101 103.7%
Other
Charter Security Screening 2,850 2,500 114.0%
TOTAL GENERAL AVIATION REVENUES 1,539,352$ 1,399,267$ 110.0%
52
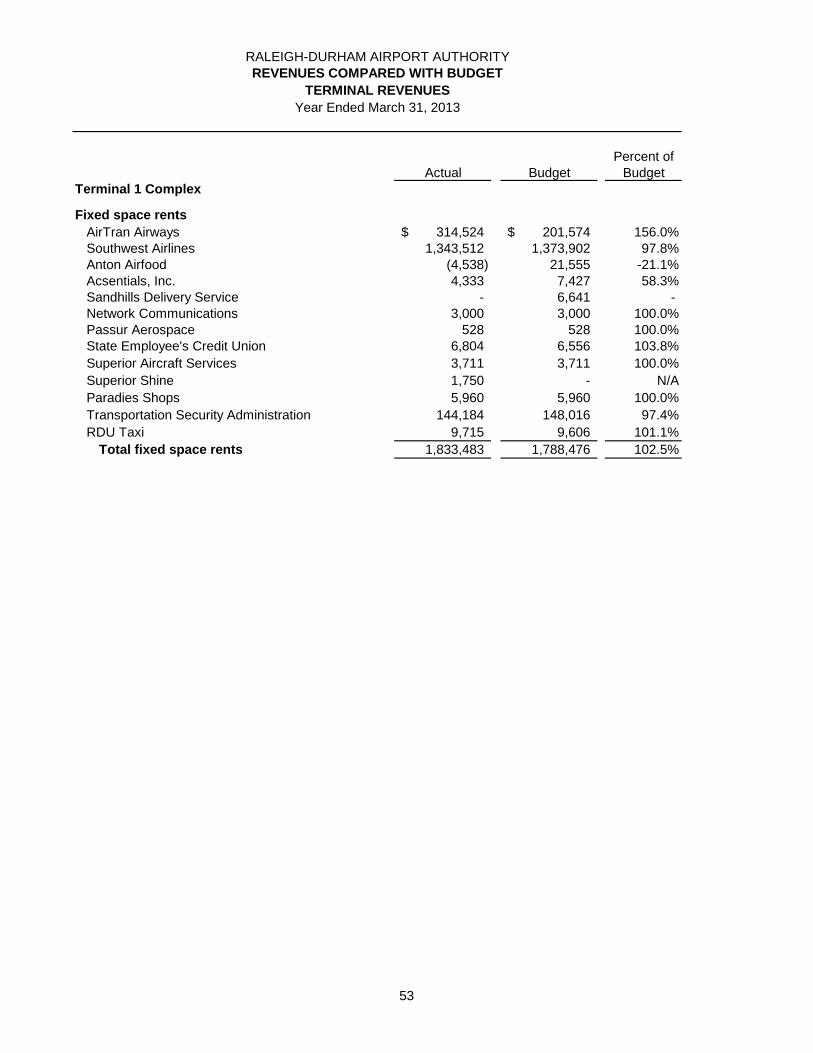
Percent ofActual Budget Budget
Terminal 1 Complex
Fixed space rents
AirTran Airways 314,524$ 201,574$ 156.0%Southwest Airlines 1,343,512 1,373,902 97.8%Anton Airfood (4,538) 21,555 -21.1%Acsentials, Inc. 4,333 7,427 58.3%Sandhills Delivery Service - 6,641 -Network Communications 3,000 3,000 100.0%Passur Aerospace 528 528 100.0%State Employee's Credit Union 6,804 6,556 103.8%
Superior Aircraft Services 3,711 3,711 100.0%
Superior Shine 1,750 - N/A
Paradies Shops 5,960 5,960 100.0%
Transportation Security Administration 144,184 148,016 97.4%
RDU Taxi 9,715 9,606 101.1%
Total fixed space rents 1,833,483 1,788,476 102.5%
RALEIGH-DURHAM AIRPORT AUTHORITYREVENUES COMPARED WITH BUDGET
Year Ended March 31, 2013
TERMINAL REVENUES
53
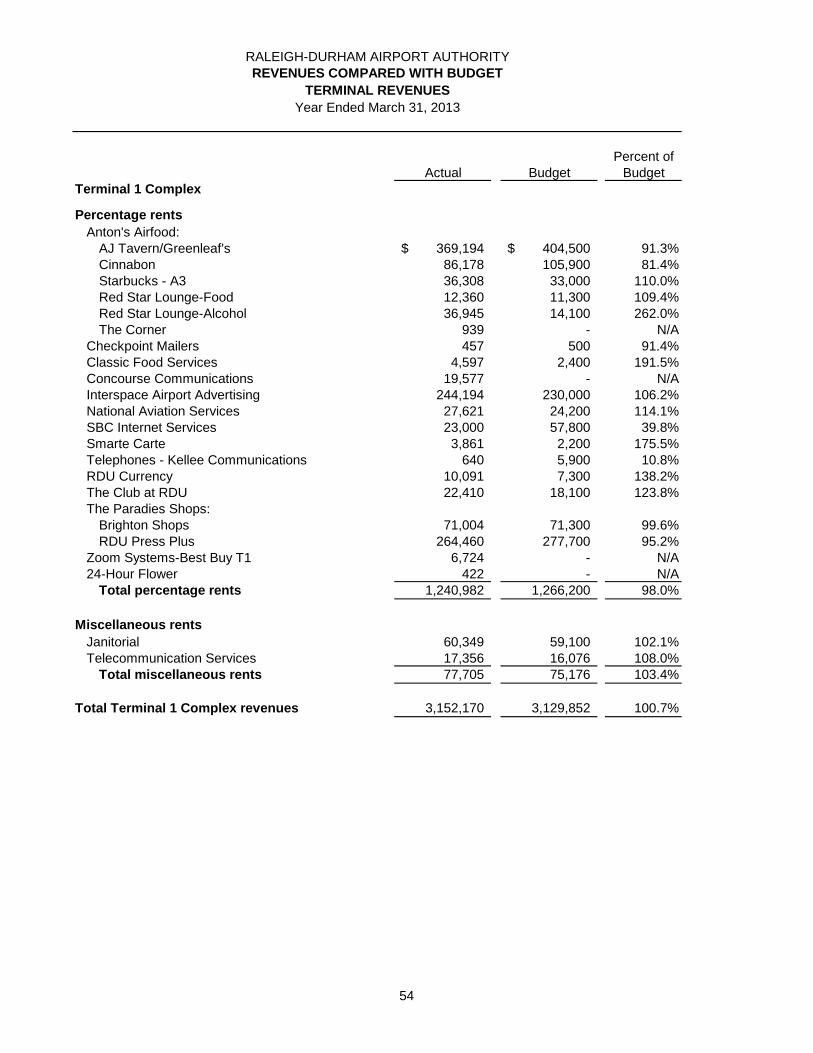
Percent ofActual Budget Budget
RALEIGH-DURHAM AIRPORT AUTHORITYREVENUES COMPARED WITH BUDGET
Year Ended March 31, 2013
TERMINAL REVENUES
Terminal 1 Complex
Percentage rents
Anton's Airfood:AJ Tavern/Greenleaf's 369,194$ 404,500$ 91.3%Cinnabon 86,178 105,900 81.4%Starbucks - A3 36,308 33,000 110.0%Red Star Lounge-Food 12,360 11,300 109.4%Red Star Lounge-Alcohol 36,945 14,100 262.0%The Corner 939 - N/A
Checkpoint Mailers 457 500 91.4%Classic Food Services 4,597 2,400 191.5%Concourse Communications 19,577 - N/AInterspace Airport Advertising 244,194 230,000 106.2%National Aviation Services 27,621 24,200 114.1%SBC Internet Services 23,000 57,800 39.8%Smarte Carte 3,861 2,200 175.5%Telephones - Kellee Communications 640 5,900 10.8%RDU Currency 10,091 7,300 138.2%The Club at RDU 22,410 18,100 123.8%The Paradies Shops:
Brighton Shops 71,004 71,300 99.6%RDU Press Plus 264,460 277,700 95.2%
Zoom Systems-Best Buy T1 6,724 - N/A24-Hour Flower 422 - N/A
Total percentage rents 1,240,982 1,266,200 98.0%
Miscellaneous rents
Janitorial 60,349 59,100 102.1%Telecommunication Services 17,356 16,076 108.0%
Total miscellaneous rents 77,705 75,176 103.4%
Total Terminal 1 Complex revenues 3,152,170 3,129,852 100.7%
54
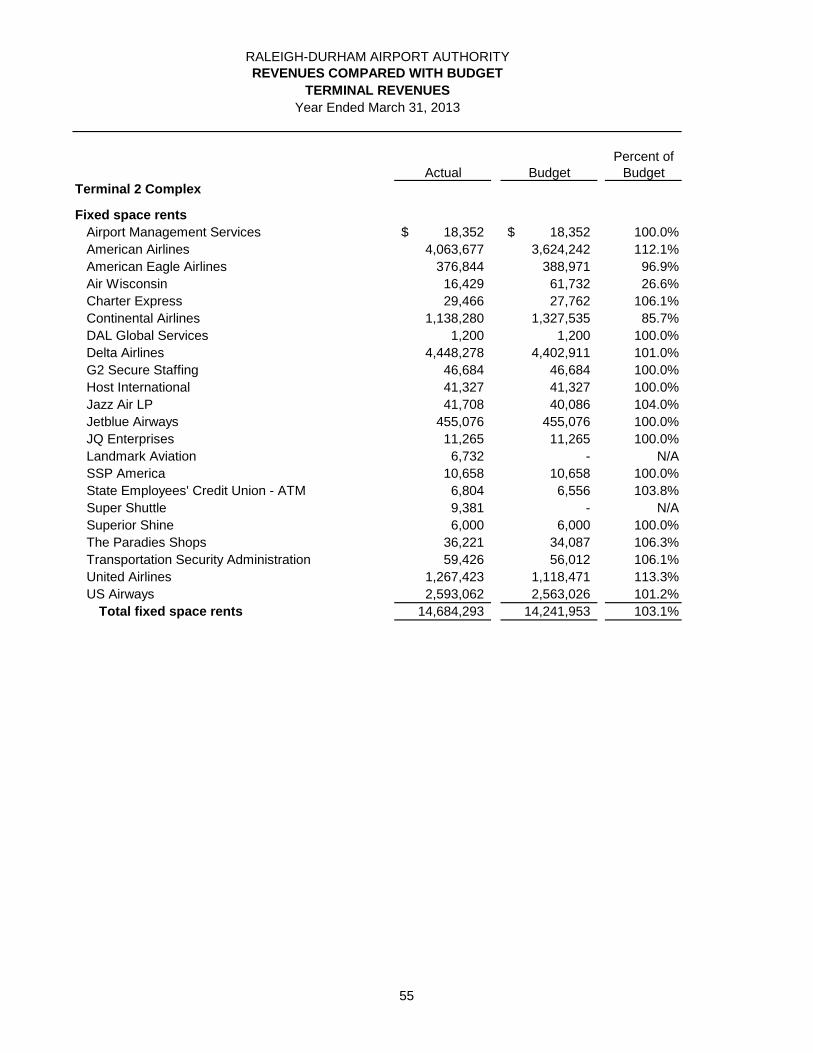
Percent ofActual Budget Budget
RALEIGH-DURHAM AIRPORT AUTHORITYREVENUES COMPARED WITH BUDGET
Year Ended March 31, 2013
TERMINAL REVENUES
Terminal 2 Complex
Fixed space rents
Airport Management Services 18,352$ 18,352$ 100.0%
American Airlines 4,063,677 3,624,242 112.1%
American Eagle Airlines 376,844 388,971 96.9%
Air Wisconsin 16,429 61,732 26.6%
Charter Express 29,466 27,762 106.1%
Continental Airlines 1,138,280 1,327,535 85.7%
DAL Global Services 1,200 1,200 100.0%
Delta Airlines 4,448,278 4,402,911 101.0%
G2 Secure Staffing 46,684 46,684 100.0%
Host International 41,327 41,327 100.0%
Jazz Air LP 41,708 40,086 104.0%
Jetblue Airways 455,076 455,076 100.0%
JQ Enterprises 11,265 11,265 100.0%
Landmark Aviation 6,732 - N/A
SSP America 10,658 10,658 100.0%
State Employees' Credit Union - ATM 6,804 6,556 103.8%
Super Shuttle 9,381 - N/A
Superior Shine 6,000 6,000 100.0%
The Paradies Shops 36,221 34,087 106.3%
Transportation Security Administration 59,426 56,012 106.1%
United Airlines 1,267,423 1,118,471 113.3%
US Airways 2,593,062 2,563,026 101.2%
Total fixed space rents 14,684,293 14,241,953 103.1%
55
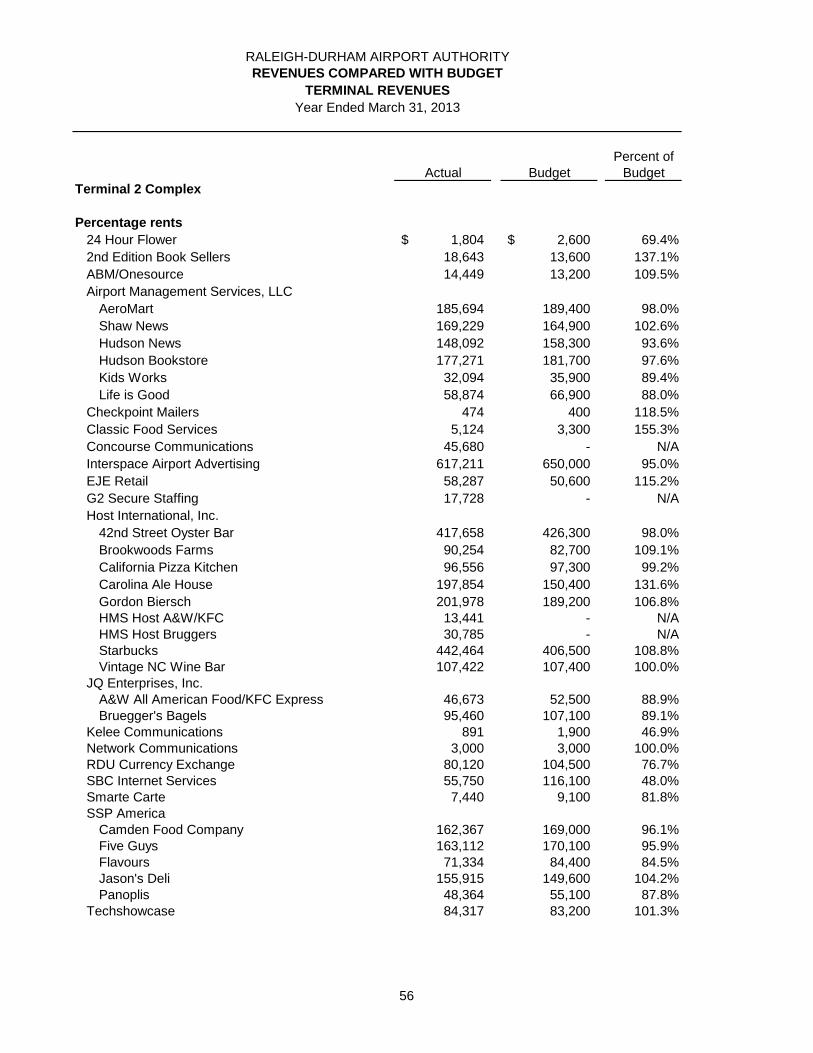
Percent ofActual Budget Budget
RALEIGH-DURHAM AIRPORT AUTHORITYREVENUES COMPARED WITH BUDGET
Year Ended March 31, 2013
TERMINAL REVENUES
Terminal 2 Complex
Percentage rents
24 Hour Flower 1,804$ 2,600$ 69.4%
2nd Edition Book Sellers 18,643 13,600 137.1%
ABM/Onesource 14,449 13,200 109.5%
Airport Management Services, LLC
AeroMart 185,694 189,400 98.0%
Shaw News 169,229 164,900 102.6%
Hudson News 148,092 158,300 93.6%
Hudson Bookstore 177,271 181,700 97.6%
Kids Works 32,094 35,900 89.4%
Life is Good 58,874 66,900 88.0%
Checkpoint Mailers 474 400 118.5%
Classic Food Services 5,124 3,300 155.3%
Concourse Communications 45,680 - N/A
Interspace Airport Advertising 617,211 650,000 95.0%
EJE Retail 58,287 50,600 115.2%
G2 Secure Staffing 17,728 - N/A
Host International, Inc.
42nd Street Oyster Bar 417,658 426,300 98.0%
Brookwoods Farms 90,254 82,700 109.1%
California Pizza Kitchen 96,556 97,300 99.2%
Carolina Ale House 197,854 150,400 131.6%
Gordon Biersch 201,978 189,200 106.8%HMS Host A&W/KFC 13,441 - N/AHMS Host Bruggers 30,785 - N/AStarbucks 442,464 406,500 108.8%Vintage NC Wine Bar 107,422 107,400 100.0%
JQ Enterprises, Inc.A&W All American Food/KFC Express 46,673 52,500 88.9%Bruegger's Bagels 95,460 107,100 89.1%
Kelee Communications 891 1,900 46.9%Network Communications 3,000 3,000 100.0%RDU Currency Exchange 80,120 104,500 76.7%SBC Internet Services 55,750 116,100 48.0%Smarte Carte 7,440 9,100 81.8%SSP America
Camden Food Company 162,367 169,000 96.1%Five Guys 163,112 170,100 95.9%Flavours 71,334 84,400 84.5%Jason's Deli 155,915 149,600 104.2%Panoplis 48,364 55,100 87.8%
Techshowcase 84,317 83,200 101.3%
56
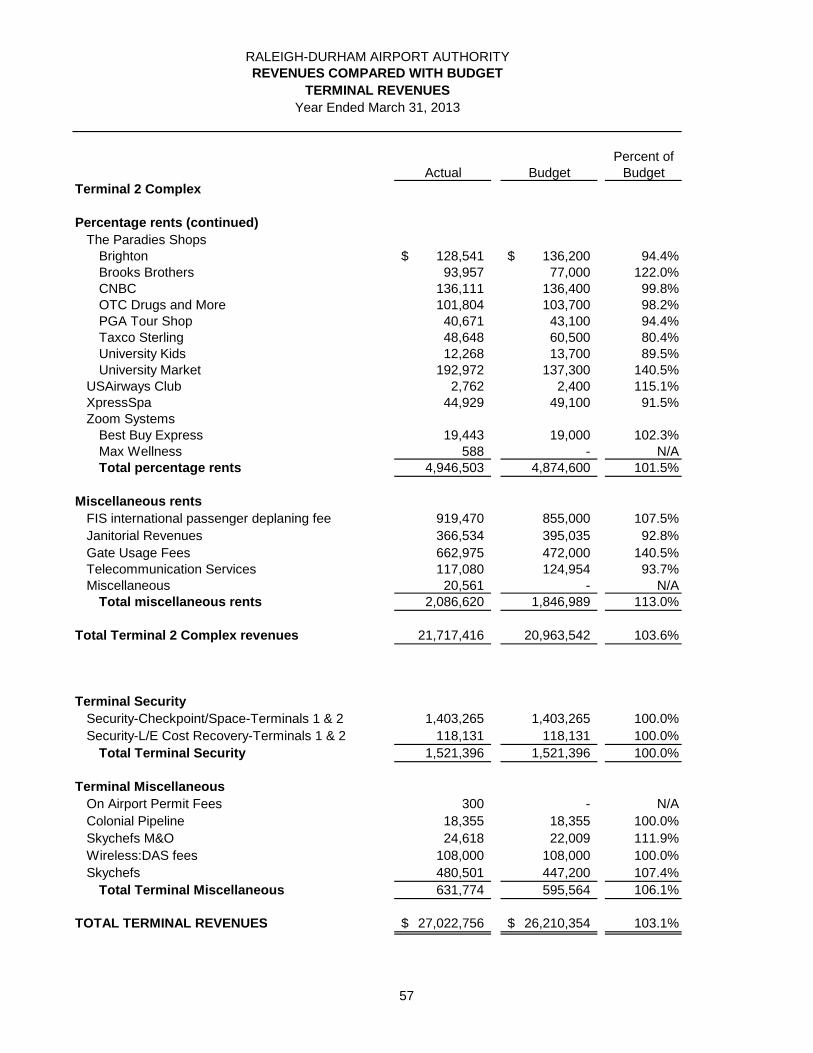
Percent ofActual Budget Budget
RALEIGH-DURHAM AIRPORT AUTHORITYREVENUES COMPARED WITH BUDGET
Year Ended March 31, 2013
TERMINAL REVENUES
Terminal 2 Complex
Percentage rents (continued)
The Paradies ShopsBrighton 128,541$ 136,200$ 94.4%Brooks Brothers 93,957 77,000 122.0%CNBC 136,111 136,400 99.8%OTC Drugs and More 101,804 103,700 98.2%PGA Tour Shop 40,671 43,100 94.4%Taxco Sterling 48,648 60,500 80.4%University Kids 12,268 13,700 89.5%University Market 192,972 137,300 140.5%
USAirways Club 2,762 2,400 115.1%XpressSpa 44,929 49,100 91.5%Zoom Systems
Best Buy Express 19,443 19,000 102.3%Max Wellness 588 - N/ATotal percentage rents 4,946,503 4,874,600 101.5%
Miscellaneous rents
FIS international passenger deplaning fee 919,470 855,000 107.5%
Janitorial Revenues 366,534 395,035 92.8%
Gate Usage Fees 662,975 472,000 140.5%Telecommunication Services 117,080 124,954 93.7%Miscellaneous 20,561 - N/A
Total miscellaneous rents 2,086,620 1,846,989 113.0%
Total Terminal 2 Complex revenues 21,717,416 20,963,542 103.6%
Terminal Security
Security-Checkpoint/Space-Terminals 1 & 2 1,403,265 1,403,265 100.0%
Security-L/E Cost Recovery-Terminals 1 & 2 118,131 118,131 100.0%
Total Terminal Security 1,521,396 1,521,396 100.0%
Terminal Miscellaneous
On Airport Permit Fees 300 - N/A
Colonial Pipeline 18,355 18,355 100.0%
Skychefs M&O 24,618 22,009 111.9%
Wireless:DAS fees 108,000 108,000 100.0%
Skychefs 480,501 447,200 107.4%
Total Terminal Miscellaneous 631,774 595,564 106.1%
TOTAL TERMINAL REVENUES 27,022,756$ 26,210,354$ 103.1%
57
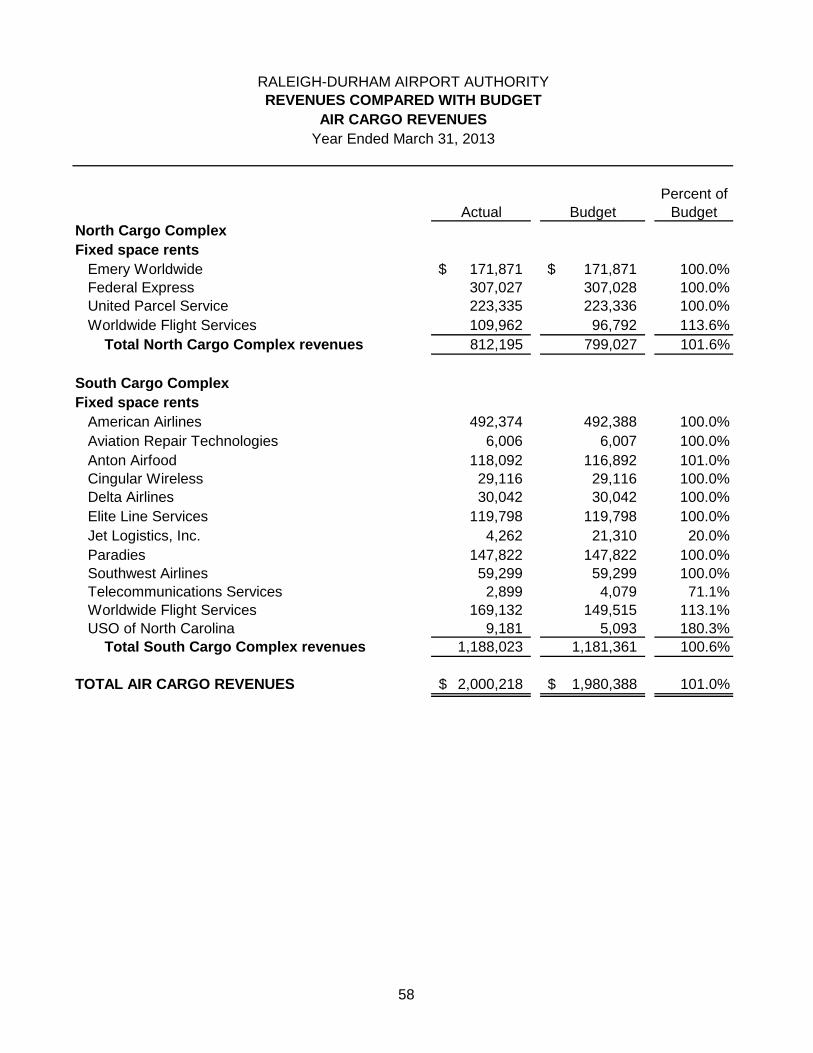
Percent of
Actual Budget Budget
North Cargo Complex
Fixed space rents
Emery Worldwide 171,871$ 171,871$ 100.0%
Federal Express 307,027 307,028 100.0%
United Parcel Service 223,335 223,336 100.0%
Worldwide Flight Services 109,962 96,792 113.6%
Total North Cargo Complex revenues 812,195 799,027 101.6%
South Cargo Complex
Fixed space rents
American Airlines 492,374 492,388 100.0%
Aviation Repair Technologies 6,006 6,007 100.0%
Anton Airfood 118,092 116,892 101.0%
Cingular Wireless 29,116 29,116 100.0%
Delta Airlines 30,042 30,042 100.0%
Elite Line Services 119,798 119,798 100.0%
Jet Logistics, Inc. 4,262 21,310 20.0%
Paradies 147,822 147,822 100.0%
Southwest Airlines 59,299 59,299 100.0%
Telecommunications Services 2,899 4,079 71.1%
Worldwide Flight Services 169,132 149,515 113.1%
USO of North Carolina 9,181 5,093 180.3%
Total South Cargo Complex revenues 1,188,023 1,181,361 100.6%
TOTAL AIR CARGO REVENUES 2,000,218$ 1,980,388$ 101.0%
RALEIGH-DURHAM AIRPORT AUTHORITY
REVENUES COMPARED WITH BUDGET
Year Ended March 31, 2013
AIR CARGO REVENUES
58
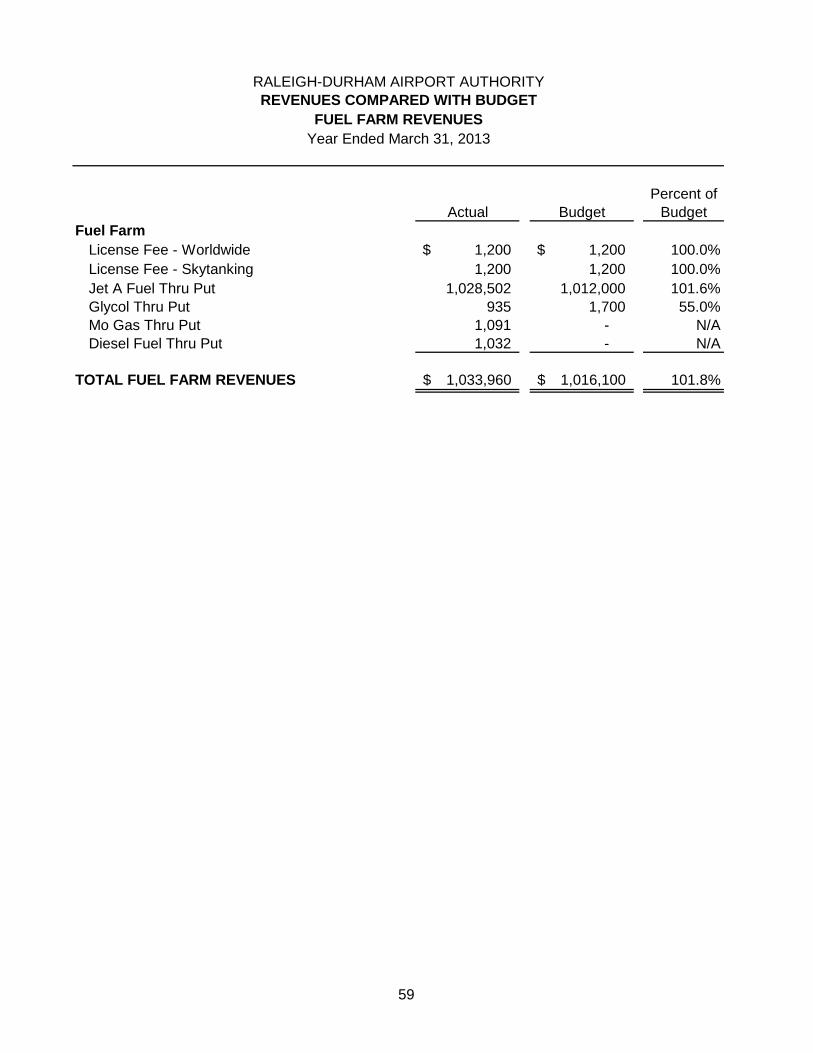
Percent of
Actual Budget Budget
Fuel Farm
License Fee - Worldwide 1,200$ 1,200$ 100.0%
License Fee - Skytanking 1,200 1,200 100.0%
Jet A Fuel Thru Put 1,028,502 1,012,000 101.6%
Glycol Thru Put 935 1,700 55.0%
Mo Gas Thru Put 1,091 - N/A
Diesel Fuel Thru Put 1,032 - N/A
TOTAL FUEL FARM REVENUES 1,033,960$ 1,016,100$ 101.8%
RALEIGH-DURHAM AIRPORT AUTHORITY
REVENUES COMPARED WITH BUDGET
FUEL FARM REVENUES
Year Ended March 31, 2013
59
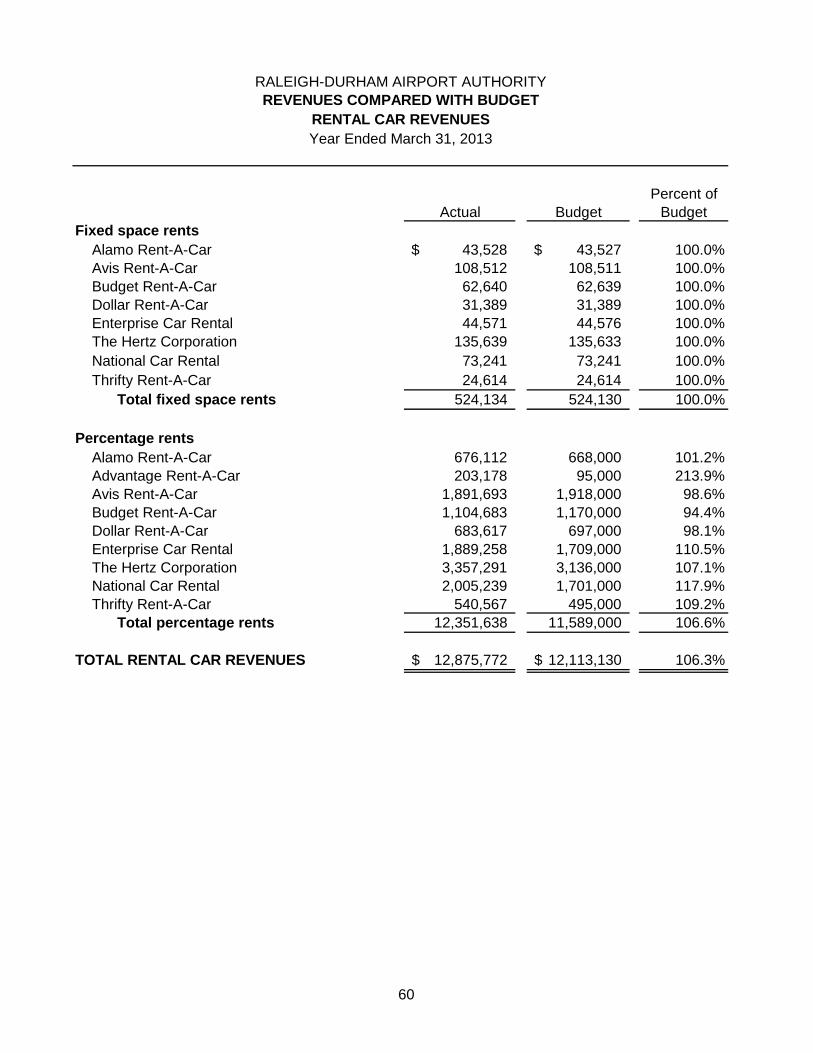
Percent of
Actual Budget Budget
Fixed space rents
Alamo Rent-A-Car 43,528$ 43,527$ 100.0%
Avis Rent-A-Car 108,512 108,511 100.0%
Budget Rent-A-Car 62,640 62,639 100.0%
Dollar Rent-A-Car 31,389 31,389 100.0%
Enterprise Car Rental 44,571 44,576 100.0%
The Hertz Corporation 135,639 135,633 100.0%
National Car Rental 73,241 73,241 100.0%
Thrifty Rent-A-Car 24,614 24,614 100.0%
Total fixed space rents 524,134 524,130 100.0%
Percentage rents
Alamo Rent-A-Car 676,112 668,000 101.2%
Advantage Rent-A-Car 203,178 95,000 213.9%
Avis Rent-A-Car 1,891,693 1,918,000 98.6%
Budget Rent-A-Car 1,104,683 1,170,000 94.4%
Dollar Rent-A-Car 683,617 697,000 98.1%
Enterprise Car Rental 1,889,258 1,709,000 110.5%
The Hertz Corporation 3,357,291 3,136,000 107.1%
National Car Rental 2,005,239 1,701,000 117.9%
Thrifty Rent-A-Car 540,567 495,000 109.2%
Total percentage rents 12,351,638 11,589,000 106.6%
TOTAL RENTAL CAR REVENUES 12,875,772$ 12,113,130$ 106.3%
RALEIGH-DURHAM AIRPORT AUTHORITY
REVENUES COMPARED WITH BUDGET
Year Ended March 31, 2013
RENTAL CAR REVENUES
60
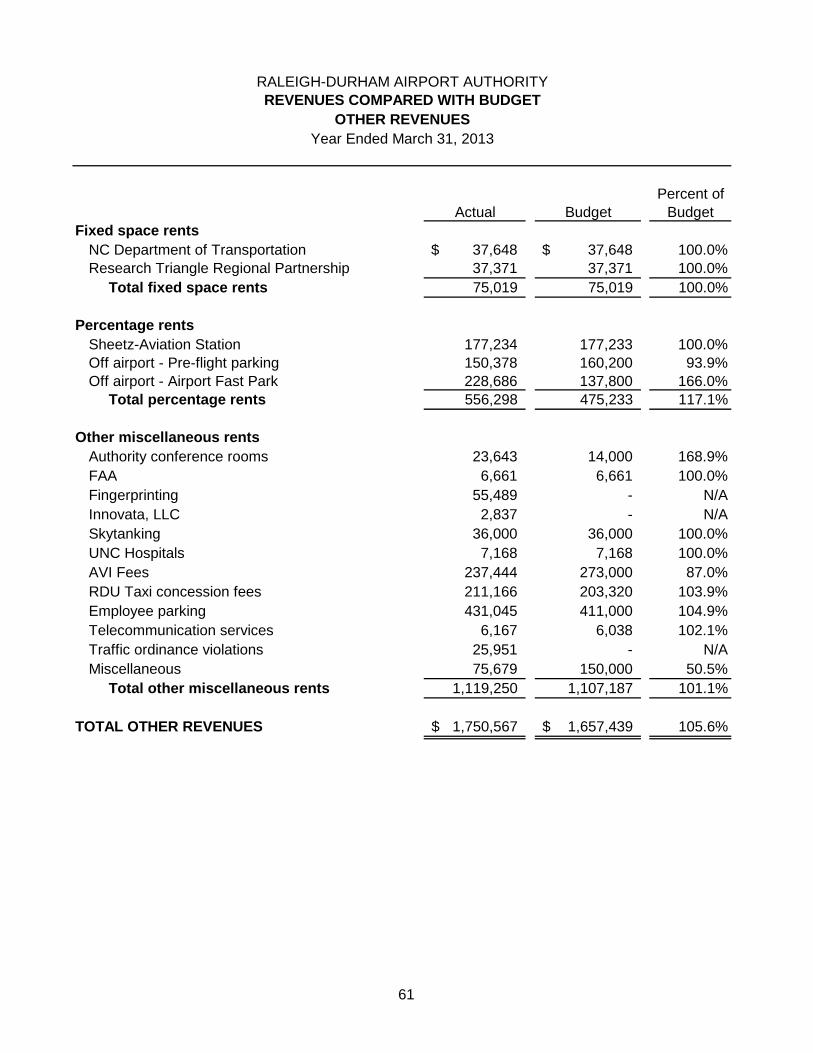
Percent of
Actual Budget Budget
Fixed space rents
NC Department of Transportation 37,648$ 37,648$ 100.0%
Research Triangle Regional Partnership 37,371 37,371 100.0%
Total fixed space rents 75,019 75,019 100.0%
Percentage rents
Sheetz-Aviation Station 177,234 177,233 100.0%
Off airport - Pre-flight parking 150,378 160,200 93.9%
Off airport - Airport Fast Park 228,686 137,800 166.0%
Total percentage rents 556,298 475,233 117.1%
Other miscellaneous rents
Authority conference rooms 23,643 14,000 168.9%
FAA 6,661 6,661 100.0%
Fingerprinting 55,489 - N/A
Innovata, LLC 2,837 - N/A
Skytanking 36,000 36,000 100.0%
UNC Hospitals 7,168 7,168 100.0%
AVI Fees 237,444 273,000 87.0%
RDU Taxi concession fees 211,166 203,320 103.9%
Employee parking 431,045 411,000 104.9%
Telecommunication services 6,167 6,038 102.1%
Traffic ordinance violations 25,951 - N/A
Miscellaneous 75,679 150,000 50.5%
Total other miscellaneous rents 1,119,250 1,107,187 101.1%
TOTAL OTHER REVENUES 1,750,567$ 1,657,439$ 105.6%
RALEIGH-DURHAM AIRPORT AUTHORITY
REVENUES COMPARED WITH BUDGET
Year Ended March 31, 2013
OTHER REVENUES
61
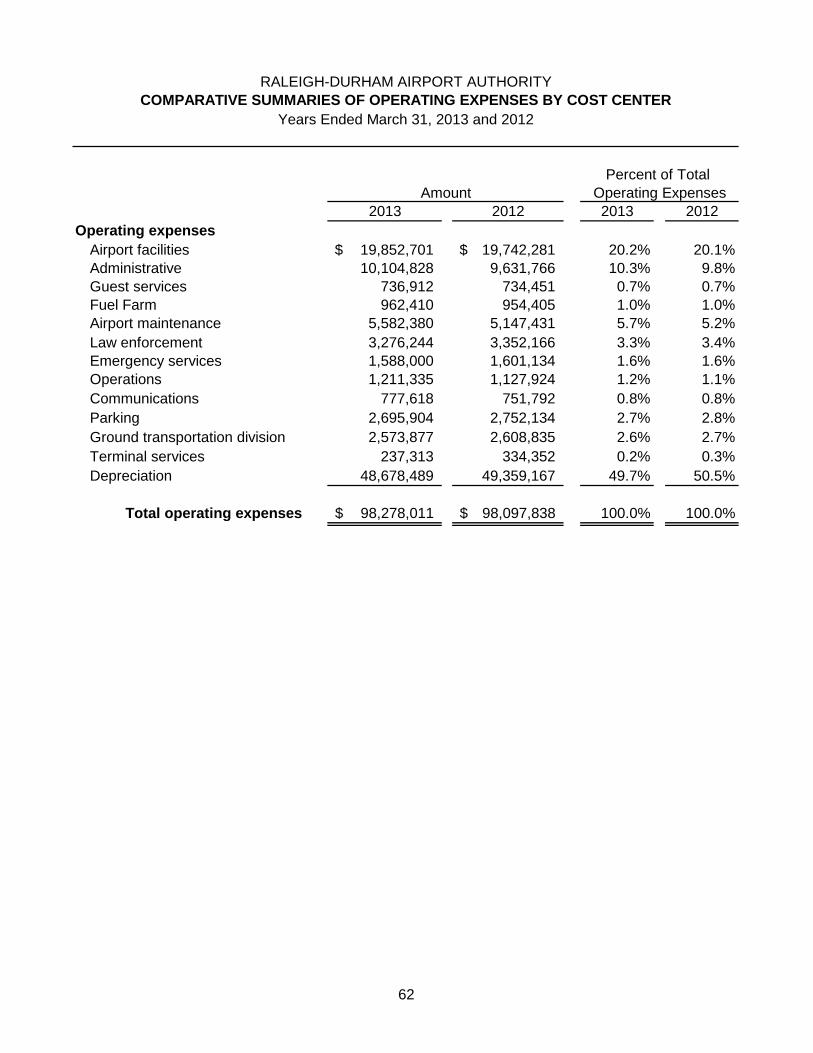
2013 2012 2013 2012
Operating expenses
Airport facilities 19,852,701$ 19,742,281$ 20.2% 20.1%
Administrative 10,104,828 9,631,766 10.3% 9.8%
Guest services 736,912 734,451 0.7% 0.7%
Fuel Farm 962,410 954,405 1.0% 1.0%
Airport maintenance 5,582,380 5,147,431 5.7% 5.2%
Law enforcement 3,276,244 3,352,166 3.3% 3.4%
Emergency services 1,588,000 1,601,134 1.6% 1.6%
Operations 1,211,335 1,127,924 1.2% 1.1%
Communications 777,618 751,792 0.8% 0.8%
Parking 2,695,904 2,752,134 2.7% 2.8%
Ground transportation division 2,573,877 2,608,835 2.6% 2.7%
Terminal services 237,313 334,352 0.2% 0.3%
Depreciation 48,678,489 49,359,167 49.7% 50.5%
Total operating expenses 98,278,011$ 98,097,838$ 100.0% 100.0%
COMPARATIVE SUMMARIES OF OPERATING EXPENSES BY COST CENTER
RALEIGH-DURHAM AIRPORT AUTHORITY
Amount
Percent of Total
Operating Expenses
Years Ended March 31, 2013 and 2012
62
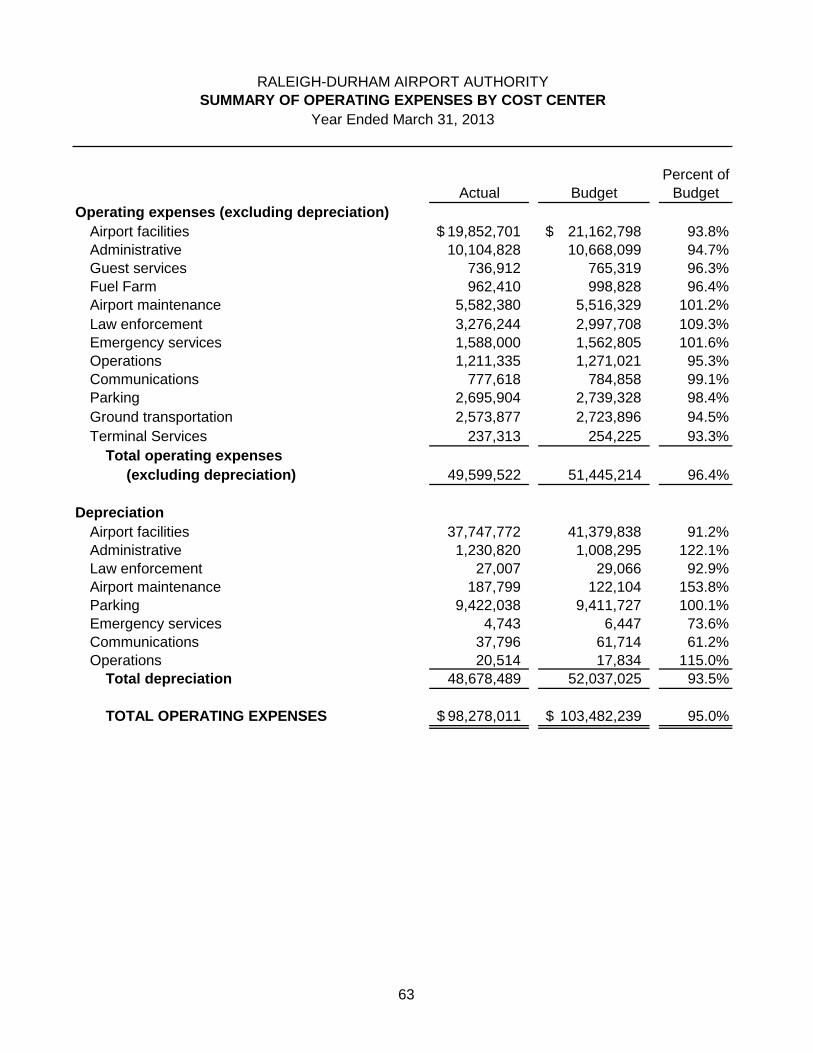
Percent of
Actual Budget Budget
Operating expenses (excluding depreciation)
Airport facilities 19,852,701$ 21,162,798$ 93.8%
Administrative 10,104,828 10,668,099 94.7%
Guest services 736,912 765,319 96.3%
Fuel Farm 962,410 998,828 96.4%
Airport maintenance 5,582,380 5,516,329 101.2%
Law enforcement 3,276,244 2,997,708 109.3%
Emergency services 1,588,000 1,562,805 101.6%
Operations 1,211,335 1,271,021 95.3%
Communications 777,618 784,858 99.1%
Parking 2,695,904 2,739,328 98.4%
Ground transportation 2,573,877 2,723,896 94.5%
Terminal Services 237,313 254,225 93.3%
Total operating expenses
(excluding depreciation) 49,599,522 51,445,214 96.4%
Depreciation
Airport facilities 37,747,772 41,379,838 91.2%
Administrative 1,230,820 1,008,295 122.1%
Law enforcement 27,007 29,066 92.9%
Airport maintenance 187,799 122,104 153.8%
Parking 9,422,038 9,411,727 100.1%
Emergency services 4,743 6,447 73.6%
Communications 37,796 61,714 61.2%
Operations 20,514 17,834 115.0%
Total depreciation 48,678,489 52,037,025 93.5%
TOTAL OPERATING EXPENSES 98,278,011$ 103,482,239$ 95.0%
RALEIGH-DURHAM AIRPORT AUTHORITY
SUMMARY OF OPERATING EXPENSES BY COST CENTER
Year Ended March 31, 2013
63
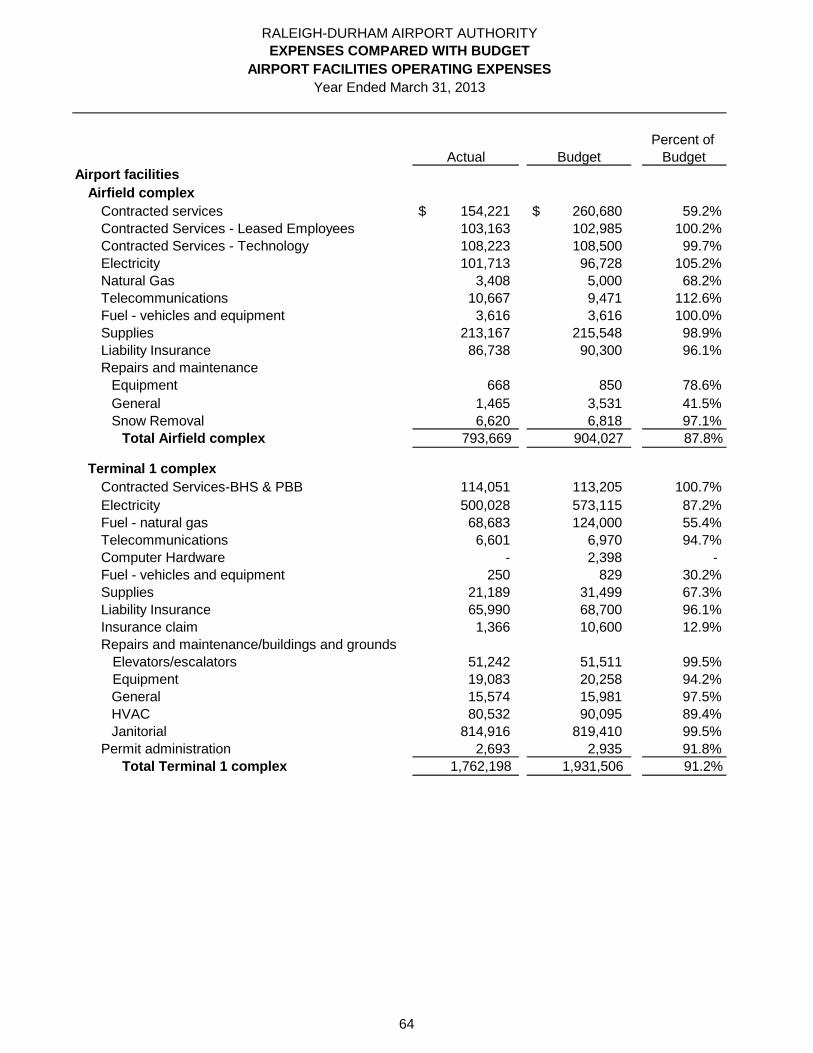
Percent of
Actual Budget Budget
Airport facilities
Airfield complex
Contracted services 154,221$ 260,680$ 59.2%
Contracted Services - Leased Employees 103,163 102,985 100.2%
Contracted Services - Technology 108,223 108,500 99.7%
Electricity 101,713 96,728 105.2%
Natural Gas 3,408 5,000 68.2%
Telecommunications 10,667 9,471 112.6%
Fuel - vehicles and equipment 3,616 3,616 100.0%
Supplies 213,167 215,548 98.9%
Liability Insurance 86,738 90,300 96.1%
Repairs and maintenance
Equipment 668 850 78.6%
General 1,465 3,531 41.5%
Snow Removal 6,620 6,818 97.1%
Total Airfield complex 793,669 904,027 87.8%
Terminal 1 complex
Contracted Services-BHS & PBB 114,051 113,205 100.7%
Electricity 500,028 573,115 87.2%
Fuel - natural gas 68,683 124,000 55.4%
Telecommunications 6,601 6,970 94.7%
Computer Hardware - 2,398 -
Fuel - vehicles and equipment 250 829 30.2%
Supplies 21,189 31,499 67.3%
Liability Insurance 65,990 68,700 96.1%
Insurance claim 1,366 10,600 12.9%
Repairs and maintenance/buildings and grounds
Elevators/escalators 51,242 51,511 99.5%
Equipment 19,083 20,258 94.2%
General 15,574 15,981 97.5%
HVAC 80,532 90,095 89.4%
Janitorial 814,916 819,410 99.5%
Permit administration 2,693 2,935 91.8%
Total Terminal 1 complex 1,762,198 1,931,506 91.2%
RALEIGH-DURHAM AIRPORT AUTHORITY
Year Ended March 31, 2013
EXPENSES COMPARED WITH BUDGET
AIRPORT FACILITIES OPERATING EXPENSES
64
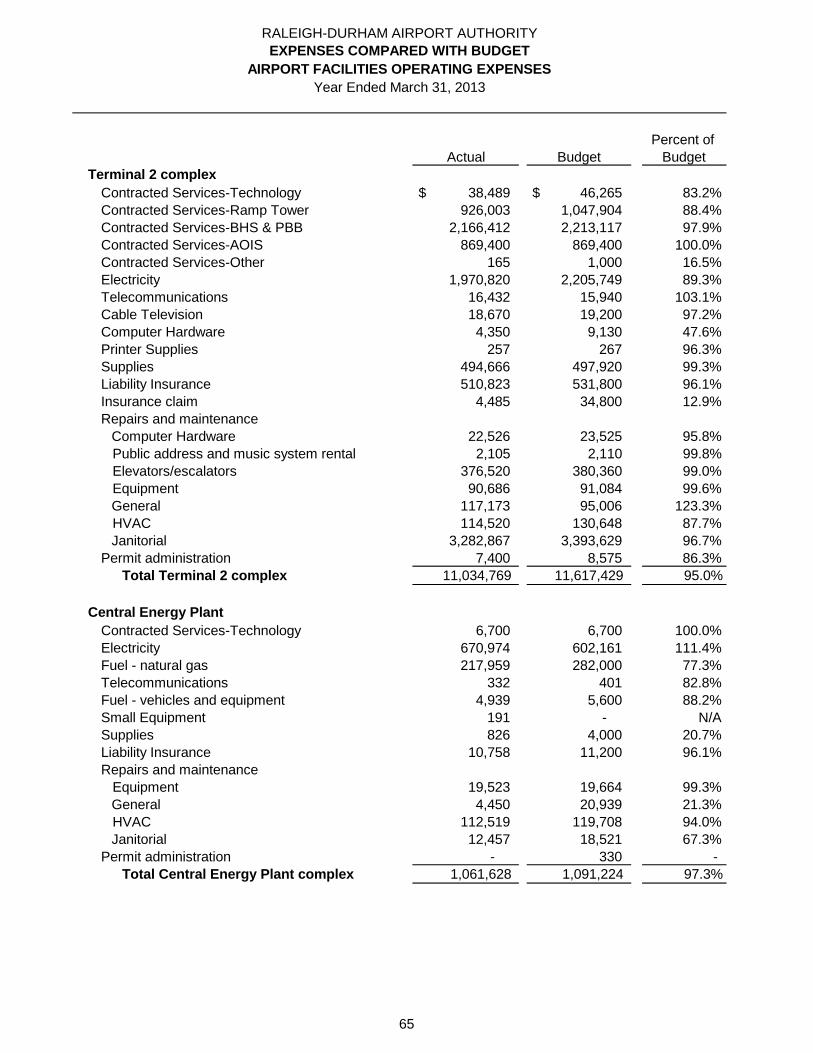
Percent of
Actual Budget Budget
RALEIGH-DURHAM AIRPORT AUTHORITY
Year Ended March 31, 2013
EXPENSES COMPARED WITH BUDGET
AIRPORT FACILITIES OPERATING EXPENSES
Terminal 2 complex
Contracted Services-Technology 38,489$ 46,265$ 83.2%
Contracted Services-Ramp Tower 926,003 1,047,904 88.4%
Contracted Services-BHS & PBB 2,166,412 2,213,117 97.9%
Contracted Services-AOIS 869,400 869,400 100.0%
Contracted Services-Other 165 1,000 16.5%
Electricity 1,970,820 2,205,749 89.3%
Telecommunications 16,432 15,940 103.1%
Cable Television 18,670 19,200 97.2%
Computer Hardware 4,350 9,130 47.6%
Printer Supplies 257 267 96.3%
Supplies 494,666 497,920 99.3%
Liability Insurance 510,823 531,800 96.1%
Insurance claim 4,485 34,800 12.9%
Repairs and maintenance
Computer Hardware 22,526 23,525 95.8%
Public address and music system rental 2,105 2,110 99.8%
Elevators/escalators 376,520 380,360 99.0%
Equipment 90,686 91,084 99.6%
General 117,173 95,006 123.3%
HVAC 114,520 130,648 87.7%
Janitorial 3,282,867 3,393,629 96.7%
Permit administration 7,400 8,575 86.3%
Total Terminal 2 complex 11,034,769 11,617,429 95.0%
Central Energy Plant
Contracted Services-Technology 6,700 6,700 100.0%
Electricity 670,974 602,161 111.4%
Fuel - natural gas 217,959 282,000 77.3%
Telecommunications 332 401 82.8%
Fuel - vehicles and equipment 4,939 5,600 88.2%
Small Equipment 191 - N/A
Supplies 826 4,000 20.7%
Liability Insurance 10,758 11,200 96.1%
Repairs and maintenance
Equipment 19,523 19,664 99.3%
General 4,450 20,939 21.3%
HVAC 112,519 119,708 94.0%
Janitorial 12,457 18,521 67.3%
Permit administration - 330 -
Total Central Energy Plant complex 1,061,628 1,091,224 97.3%
65
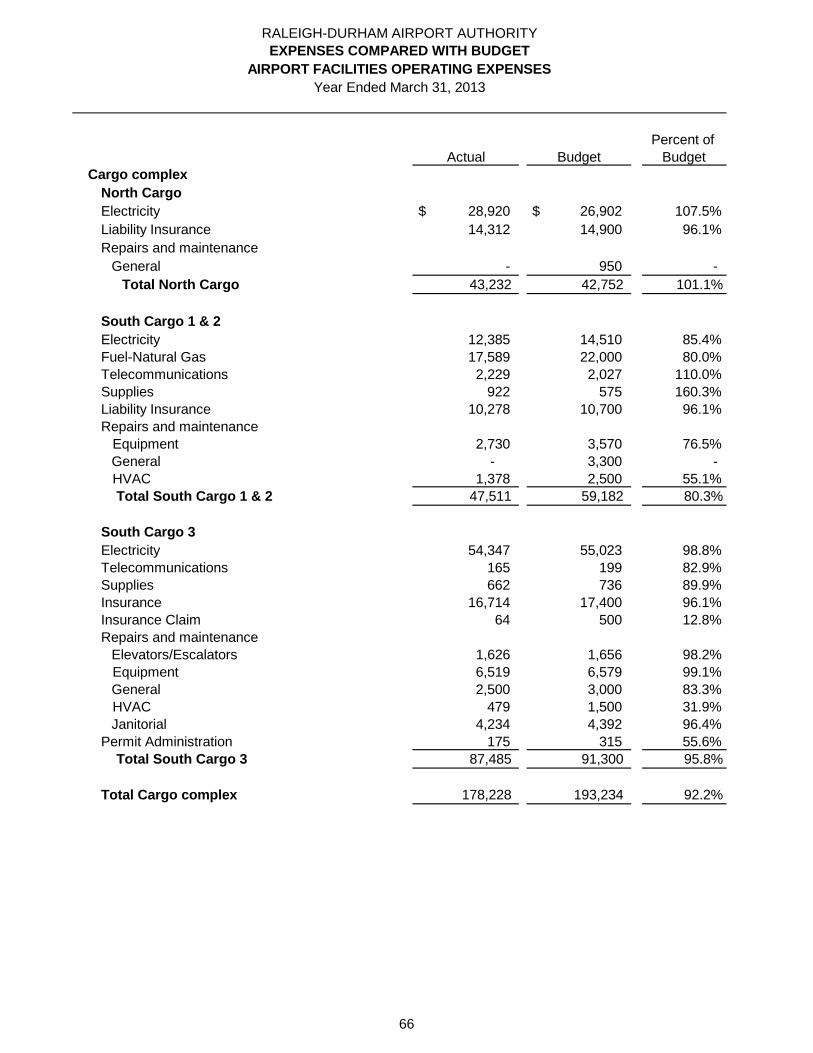
Percent of
Actual Budget Budget
RALEIGH-DURHAM AIRPORT AUTHORITY
Year Ended March 31, 2013
EXPENSES COMPARED WITH BUDGET
AIRPORT FACILITIES OPERATING EXPENSES
Cargo complex
North Cargo
Electricity 28,920$ 26,902$ 107.5%
Liability Insurance 14,312 14,900 96.1%
Repairs and maintenance
General - 950 -
Total North Cargo 43,232 42,752 101.1%
South Cargo 1 & 2
Electricity 12,385 14,510 85.4%
Fuel-Natural Gas 17,589 22,000 80.0%
Telecommunications 2,229 2,027 110.0%
Supplies 922 575 160.3%
Liability Insurance 10,278 10,700 96.1%
Repairs and maintenance
Equipment 2,730 3,570 76.5%
General - 3,300 -
HVAC 1,378 2,500 55.1%
Total South Cargo 1 & 2 47,511 59,182 80.3%
South Cargo 3
Electricity 54,347 55,023 98.8%
Telecommunications 165 199 82.9%
Supplies 662 736 89.9%
Insurance 16,714 17,400 96.1%
Insurance Claim 64 500 12.8%
Repairs and maintenance
Elevators/Escalators 1,626 1,656 98.2%
Equipment 6,519 6,579 99.1%
General 2,500 3,000 83.3%
HVAC 479 1,500 31.9%
Janitorial 4,234 4,392 96.4%
Permit Administration 175 315 55.6%
Total South Cargo 3 87,485 91,300 95.8%
Total Cargo complex 178,228 193,234 92.2%
66
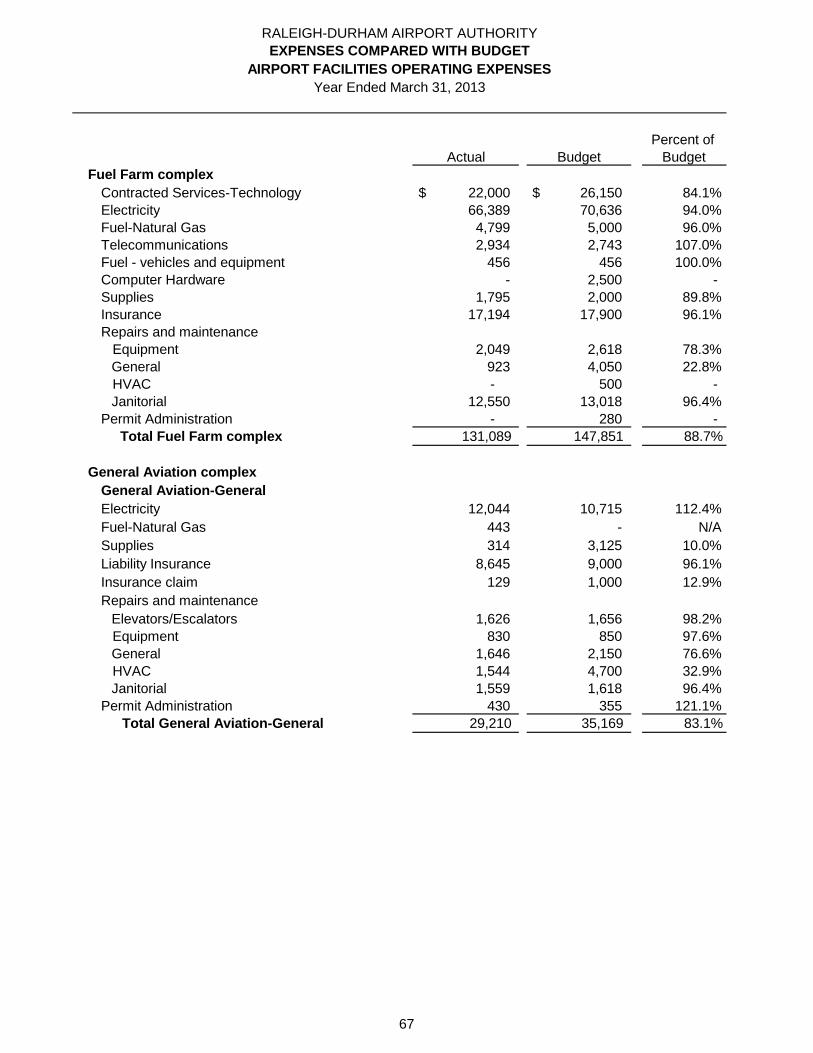
Percent of
Actual Budget Budget
RALEIGH-DURHAM AIRPORT AUTHORITY
Year Ended March 31, 2013
EXPENSES COMPARED WITH BUDGET
AIRPORT FACILITIES OPERATING EXPENSES
Fuel Farm complex
Contracted Services-Technology 22,000$ 26,150$ 84.1%
Electricity 66,389 70,636 94.0%
Fuel-Natural Gas 4,799 5,000 96.0%
Telecommunications 2,934 2,743 107.0%
Fuel - vehicles and equipment 456 456 100.0%
Computer Hardware - 2,500 -
Supplies 1,795 2,000 89.8%
Insurance 17,194 17,900 96.1%
Repairs and maintenance
Equipment 2,049 2,618 78.3%
General 923 4,050 22.8%
HVAC - 500 -
Janitorial 12,550 13,018 96.4%
Permit Administration - 280 -
Total Fuel Farm complex 131,089 147,851 88.7%
General Aviation complex
General Aviation-General
Electricity 12,044 10,715 112.4%
Fuel-Natural Gas 443 - N/A
Supplies 314 3,125 10.0%
Liability Insurance 8,645 9,000 96.1%
Insurance claim 129 1,000 12.9%
Repairs and maintenance
Elevators/Escalators 1,626 1,656 98.2%
Equipment 830 850 97.6%
General 1,646 2,150 76.6%
HVAC 1,544 4,700 32.9%
Janitorial 1,559 1,618 96.4%
Permit Administration 430 355 121.1%
Total General Aviation-General 29,210 35,169 83.1%
67
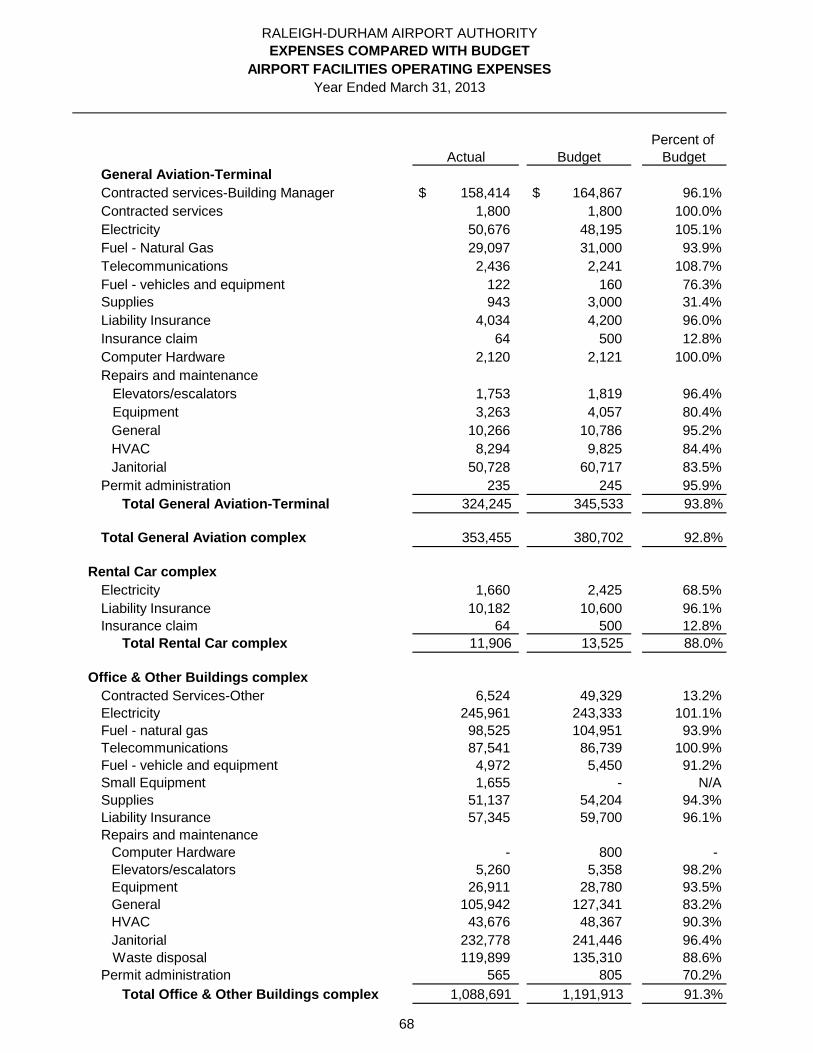
Percent of
Actual Budget Budget
RALEIGH-DURHAM AIRPORT AUTHORITY
Year Ended March 31, 2013
EXPENSES COMPARED WITH BUDGET
AIRPORT FACILITIES OPERATING EXPENSES
General Aviation-Terminal
Contracted services-Building Manager 158,414$ 164,867$ 96.1%
Contracted services 1,800 1,800 100.0%
Electricity 50,676 48,195 105.1%
Fuel - Natural Gas 29,097 31,000 93.9%
Telecommunications 2,436 2,241 108.7%
Fuel - vehicles and equipment 122 160 76.3%
Supplies 943 3,000 31.4%
Liability Insurance 4,034 4,200 96.0%
Insurance claim 64 500 12.8%
Computer Hardware 2,120 2,121 100.0%
Repairs and maintenance
Elevators/escalators 1,753 1,819 96.4%
Equipment 3,263 4,057 80.4%
General 10,266 10,786 95.2%
HVAC 8,294 9,825 84.4%
Janitorial 50,728 60,717 83.5%
Permit administration 235 245 95.9%
Total General Aviation-Terminal 324,245 345,533 93.8%
Total General Aviation complex 353,455 380,702 92.8%
Rental Car complex
Electricity 1,660 2,425 68.5%
Liability Insurance 10,182 10,600 96.1%
Insurance claim 64 500 12.8%
Total Rental Car complex 11,906 13,525 88.0%
Office & Other Buildings complex
Contracted Services-Other 6,524 49,329 13.2%
Electricity 245,961 243,333 101.1%
Fuel - natural gas 98,525 104,951 93.9%
Telecommunications 87,541 86,739 100.9%
Fuel - vehicle and equipment 4,972 5,450 91.2%
Small Equipment 1,655 - N/A
Supplies 51,137 54,204 94.3%
Liability Insurance 57,345 59,700 96.1%
Repairs and maintenance
Computer Hardware - 800 -
Elevators/escalators 5,260 5,358 98.2%
Equipment 26,911 28,780 93.5%
General 105,942 127,341 83.2%
HVAC 43,676 48,367 90.3%
Janitorial 232,778 241,446 96.4%
Waste disposal 119,899 135,310 88.6%
Permit administration 565 805 70.2%
Total Office & Other Buildings complex 1,088,691 1,191,913 91.3%
68
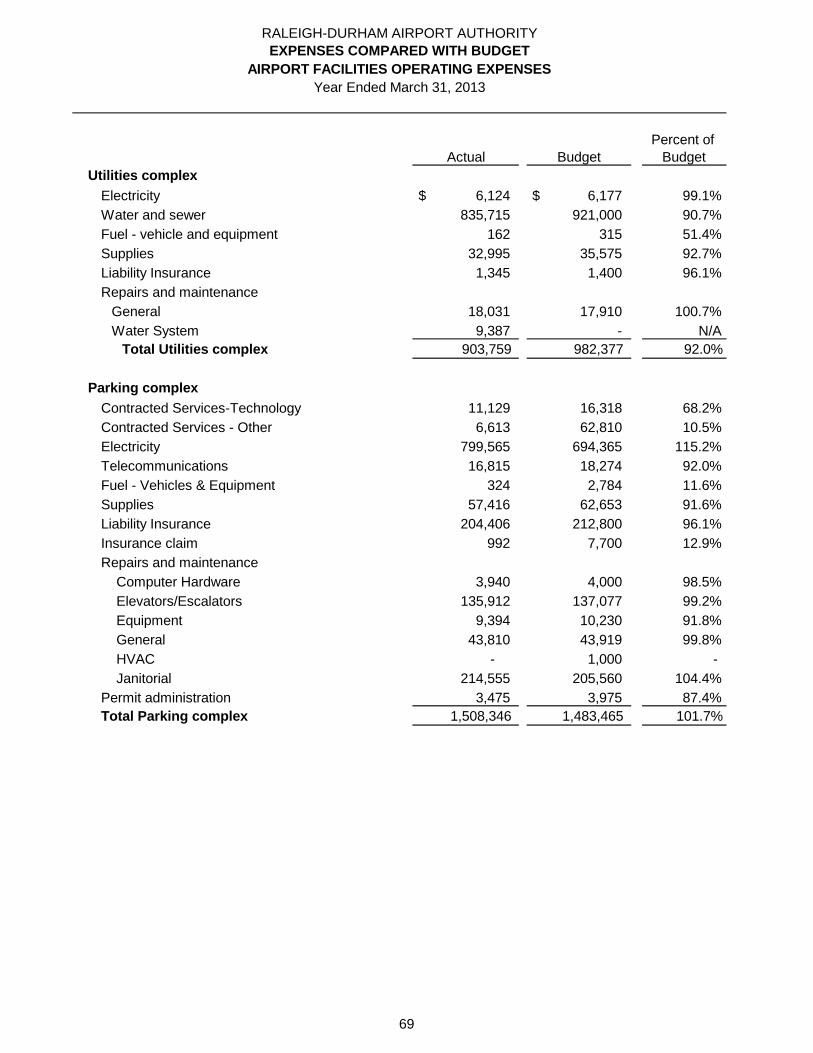
Percent of
Actual Budget Budget
RALEIGH-DURHAM AIRPORT AUTHORITY
Year Ended March 31, 2013
EXPENSES COMPARED WITH BUDGET
AIRPORT FACILITIES OPERATING EXPENSES
Utilities complex
Electricity 6,124$ 6,177$ 99.1%
Water and sewer 835,715 921,000 90.7%
Fuel - vehicle and equipment 162 315 51.4%
Supplies 32,995 35,575 92.7%
Liability Insurance 1,345 1,400 96.1%
Repairs and maintenance
General 18,031 17,910 100.7%
Water System 9,387 - N/A
Total Utilities complex 903,759 982,377 92.0%
Parking complex
Contracted Services-Technology 11,129 16,318 68.2%
Contracted Services - Other 6,613 62,810 10.5%
Electricity 799,565 694,365 115.2%
Telecommunications 16,815 18,274 92.0%
Fuel - Vehicles & Equipment 324 2,784 11.6%
Supplies 57,416 62,653 91.6%
Liability Insurance 204,406 212,800 96.1%
Insurance claim 992 7,700 12.9%
Repairs and maintenance
Computer Hardware 3,940 4,000 98.5%
Elevators/Escalators 135,912 137,077 99.2%
Equipment 9,394 10,230 91.8%
General 43,810 43,919 99.8%
HVAC - 1,000 -
Janitorial 214,555 205,560 104.4%
Permit administration 3,475 3,975 87.4%
Total Parking complex 1,508,346 1,483,465 101.7%
69
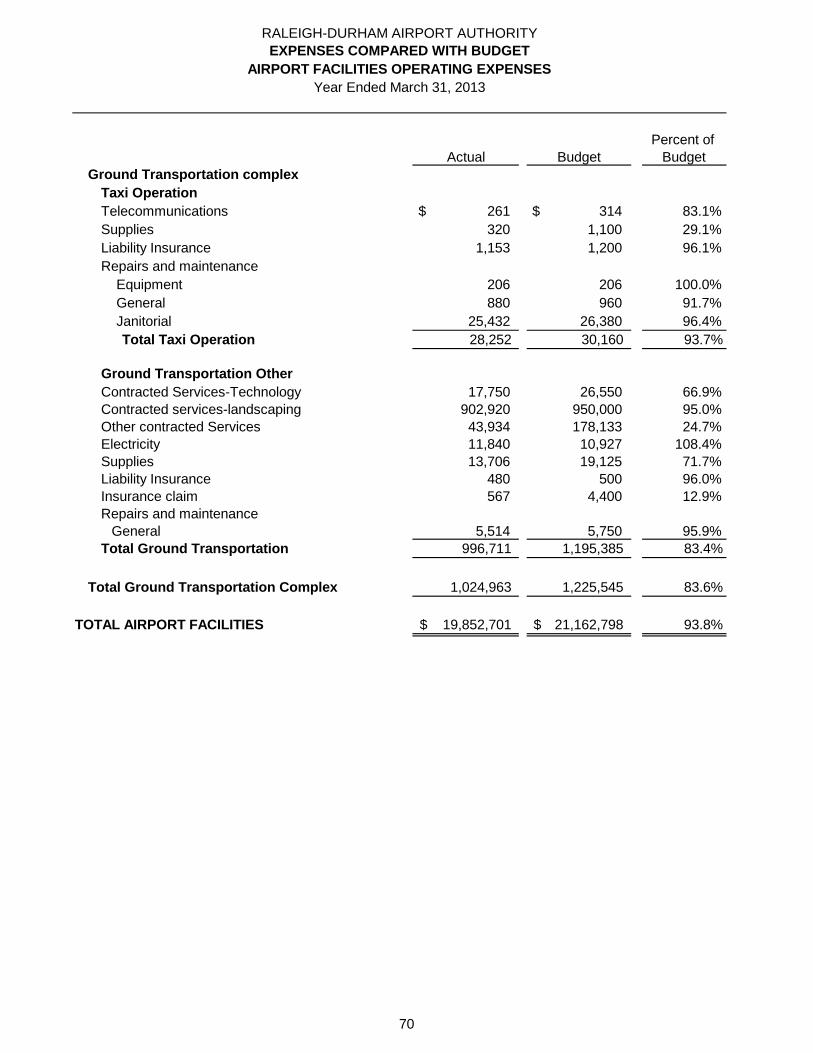
Percent of
Actual Budget Budget
RALEIGH-DURHAM AIRPORT AUTHORITY
Year Ended March 31, 2013
EXPENSES COMPARED WITH BUDGET
AIRPORT FACILITIES OPERATING EXPENSES
Ground Transportation complex
Taxi Operation
Telecommunications 261$ 314$ 83.1%
Supplies 320 1,100 29.1%
Liability Insurance 1,153 1,200 96.1%
Repairs and maintenance
Equipment 206 206 100.0%
General 880 960 91.7%
Janitorial 25,432 26,380 96.4%
Total Taxi Operation 28,252 30,160 93.7%
Ground Transportation Other
Contracted Services-Technology 17,750 26,550 66.9%
Contracted services-landscaping 902,920 950,000 95.0%
Other contracted Services 43,934 178,133 24.7%
Electricity 11,840 10,927 108.4%
Supplies 13,706 19,125 71.7%
Liability Insurance 480 500 96.0%
Insurance claim 567 4,400 12.9%
Repairs and maintenance
General 5,514 5,750 95.9%
Total Ground Transportation 996,711 1,195,385 83.4%
Total Ground Transportation Complex 1,024,963 1,225,545 83.6%
TOTAL AIRPORT FACILITIES 19,852,701$ 21,162,798$ 93.8%
70
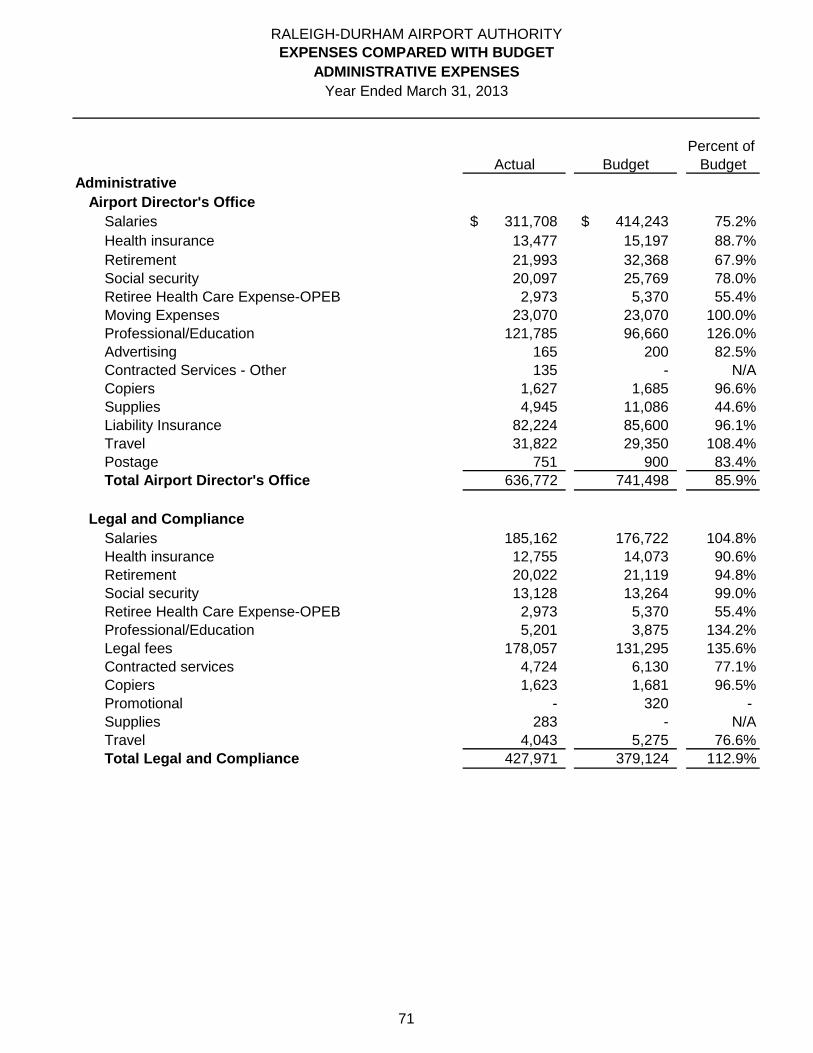
Percent of
Actual Budget Budget
Administrative
Airport Director's Office
Salaries 311,708$ 414,243$ 75.2%
Health insurance 13,477 15,197 88.7%
Retirement 21,993 32,368 67.9%
Social security 20,097 25,769 78.0%
Retiree Health Care Expense-OPEB 2,973 5,370 55.4%
Moving Expenses 23,070 23,070 100.0%
Professional/Education 121,785 96,660 126.0%
Advertising 165 200 82.5%
Contracted Services - Other 135 - N/A
Copiers 1,627 1,685 96.6%
Supplies 4,945 11,086 44.6%
Liability Insurance 82,224 85,600 96.1%
Travel 31,822 29,350 108.4%
Postage 751 900 83.4%
Total Airport Director's Office 636,772 741,498 85.9%
Legal and Compliance
Salaries 185,162 176,722 104.8%
Health insurance 12,755 14,073 90.6%
Retirement 20,022 21,119 94.8%
Social security 13,128 13,264 99.0%
Retiree Health Care Expense-OPEB 2,973 5,370 55.4%
Professional/Education 5,201 3,875 134.2%
Legal fees 178,057 131,295 135.6%
Contracted services 4,724 6,130 77.1%
Copiers 1,623 1,681 96.5%
Promotional - 320 -
Supplies 283 - N/A
Travel 4,043 5,275 76.6%
Total Legal and Compliance 427,971 379,124 112.9%
RALEIGH-DURHAM AIRPORT AUTHORITY
Year Ended March 31, 2013
EXPENSES COMPARED WITH BUDGET
ADMINISTRATIVE EXPENSES
71
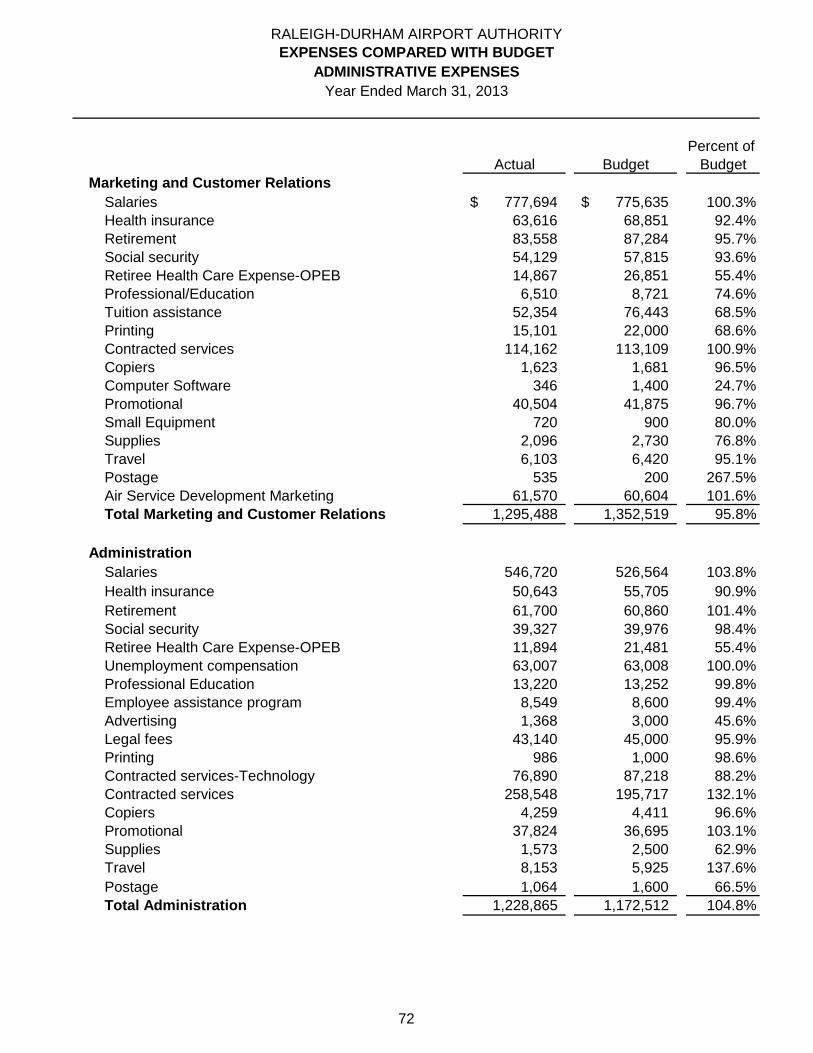
Percent of
Actual Budget Budget
RALEIGH-DURHAM AIRPORT AUTHORITY
Year Ended March 31, 2013
EXPENSES COMPARED WITH BUDGET
ADMINISTRATIVE EXPENSES
Marketing and Customer Relations
Salaries 777,694$ 775,635$ 100.3%
Health insurance 63,616 68,851 92.4%
Retirement 83,558 87,284 95.7%
Social security 54,129 57,815 93.6%
Retiree Health Care Expense-OPEB 14,867 26,851 55.4%
Professional/Education 6,510 8,721 74.6%
Tuition assistance 52,354 76,443 68.5%
Printing 15,101 22,000 68.6%
Contracted services 114,162 113,109 100.9%
Copiers 1,623 1,681 96.5%
Computer Software 346 1,400 24.7%
Promotional 40,504 41,875 96.7%
Small Equipment 720 900 80.0%
Supplies 2,096 2,730 76.8%
Travel 6,103 6,420 95.1%
Postage 535 200 267.5%
Air Service Development Marketing 61,570 60,604 101.6%
Total Marketing and Customer Relations 1,295,488 1,352,519 95.8%
Administration
Salaries 546,720 526,564 103.8%
Health insurance 50,643 55,705 90.9%
Retirement 61,700 60,860 101.4%
Social security 39,327 39,976 98.4%
Retiree Health Care Expense-OPEB 11,894 21,481 55.4%
Unemployment compensation 63,007 63,008 100.0%
Professional Education 13,220 13,252 99.8%
Employee assistance program 8,549 8,600 99.4%
Advertising 1,368 3,000 45.6%
Legal fees 43,140 45,000 95.9%
Printing 986 1,000 98.6%
Contracted services-Technology 76,890 87,218 88.2%
Contracted services 258,548 195,717 132.1%
Copiers 4,259 4,411 96.6%
Promotional 37,824 36,695 103.1%
Supplies 1,573 2,500 62.9%
Travel 8,153 5,925 137.6%
Postage 1,064 1,600 66.5%
Total Administration 1,228,865 1,172,512 104.8%
72
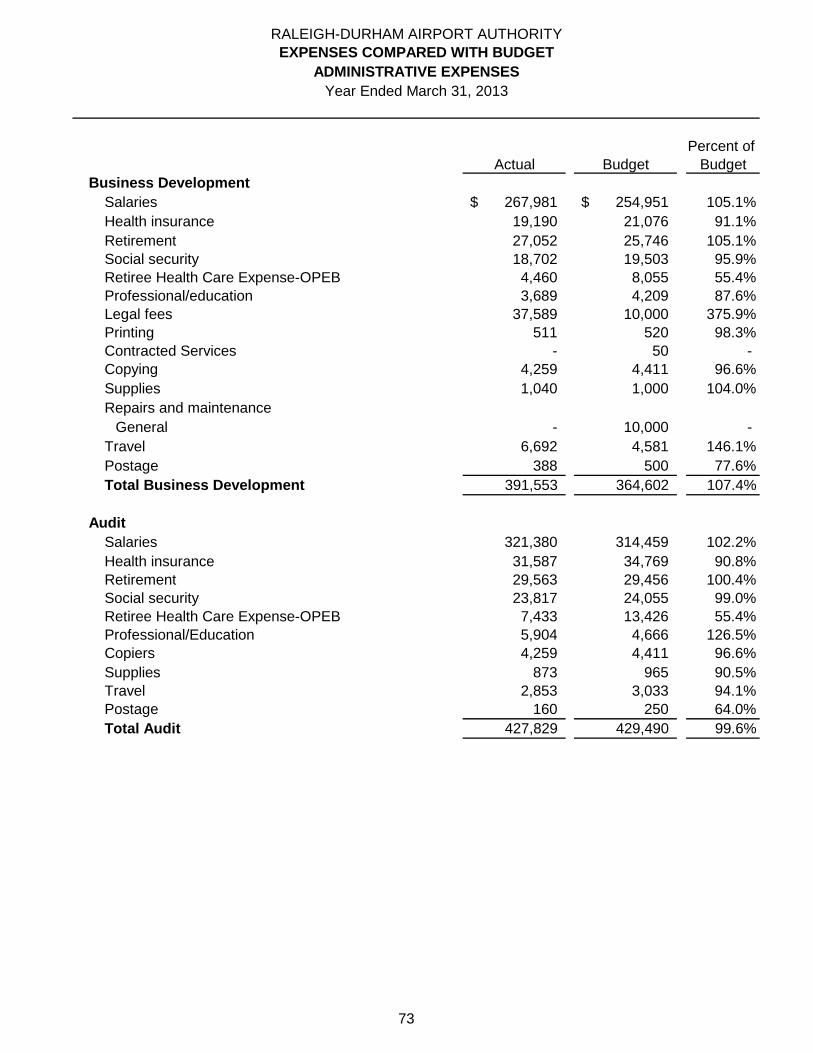
Percent of
Actual Budget Budget
RALEIGH-DURHAM AIRPORT AUTHORITY
Year Ended March 31, 2013
EXPENSES COMPARED WITH BUDGET
ADMINISTRATIVE EXPENSES
Business Development
Salaries 267,981$ 254,951$ 105.1%
Health insurance 19,190 21,076 91.1%
Retirement 27,052 25,746 105.1%
Social security 18,702 19,503 95.9%
Retiree Health Care Expense-OPEB 4,460 8,055 55.4%
Professional/education 3,689 4,209 87.6%
Legal fees 37,589 10,000 375.9%
Printing 511 520 98.3%
Contracted Services - 50 -
Copying 4,259 4,411 96.6%
Supplies 1,040 1,000 104.0%
Repairs and maintenance
General - 10,000 -
Travel 6,692 4,581 146.1%
Postage 388 500 77.6%
Total Business Development 391,553 364,602 107.4%
Audit
Salaries 321,380 314,459 102.2%
Health insurance 31,587 34,769 90.8%
Retirement 29,563 29,456 100.4%
Social security 23,817 24,055 99.0%
Retiree Health Care Expense-OPEB 7,433 13,426 55.4%
Professional/Education 5,904 4,666 126.5%
Copiers 4,259 4,411 96.6%
Supplies 873 965 90.5%
Travel 2,853 3,033 94.1%
Postage 160 250 64.0%
Total Audit 427,829 429,490 99.6%
73
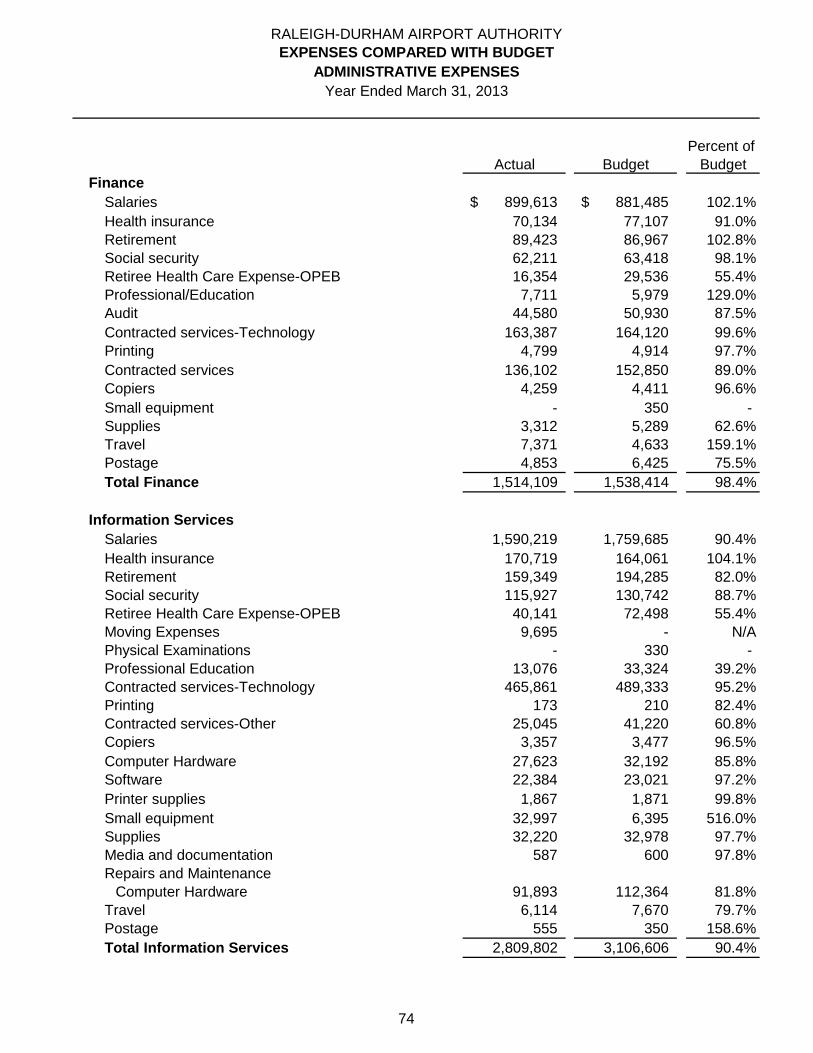
Percent of
Actual Budget Budget
RALEIGH-DURHAM AIRPORT AUTHORITY
Year Ended March 31, 2013
EXPENSES COMPARED WITH BUDGET
ADMINISTRATIVE EXPENSES
Finance
Salaries 899,613$ 881,485$ 102.1%
Health insurance 70,134 77,107 91.0%
Retirement 89,423 86,967 102.8%
Social security 62,211 63,418 98.1%
Retiree Health Care Expense-OPEB 16,354 29,536 55.4%
Professional/Education 7,711 5,979 129.0%
Audit 44,580 50,930 87.5%
Contracted services-Technology 163,387 164,120 99.6%
Printing 4,799 4,914 97.7%
Contracted services 136,102 152,850 89.0%
Copiers 4,259 4,411 96.6%
Small equipment - 350 -
Supplies 3,312 5,289 62.6%
Travel 7,371 4,633 159.1%
Postage 4,853 6,425 75.5%
Total Finance 1,514,109 1,538,414 98.4%
Information Services
Salaries 1,590,219 1,759,685 90.4%
Health insurance 170,719 164,061 104.1%
Retirement 159,349 194,285 82.0%
Social security 115,927 130,742 88.7%
Retiree Health Care Expense-OPEB 40,141 72,498 55.4%
Moving Expenses 9,695 - N/A
Physical Examinations - 330 -
Professional Education 13,076 33,324 39.2%
Contracted services-Technology 465,861 489,333 95.2%
Printing 173 210 82.4%
Contracted services-Other 25,045 41,220 60.8%
Copiers 3,357 3,477 96.5%
Computer Hardware 27,623 32,192 85.8%
Software 22,384 23,021 97.2%
Printer supplies 1,867 1,871 99.8%
Small equipment 32,997 6,395 516.0%
Supplies 32,220 32,978 97.7%
Media and documentation 587 600 97.8%
Repairs and Maintenance
Computer Hardware 91,893 112,364 81.8%
Travel 6,114 7,670 79.7%
Postage 555 350 158.6%
Total Information Services 2,809,802 3,106,606 90.4%
74
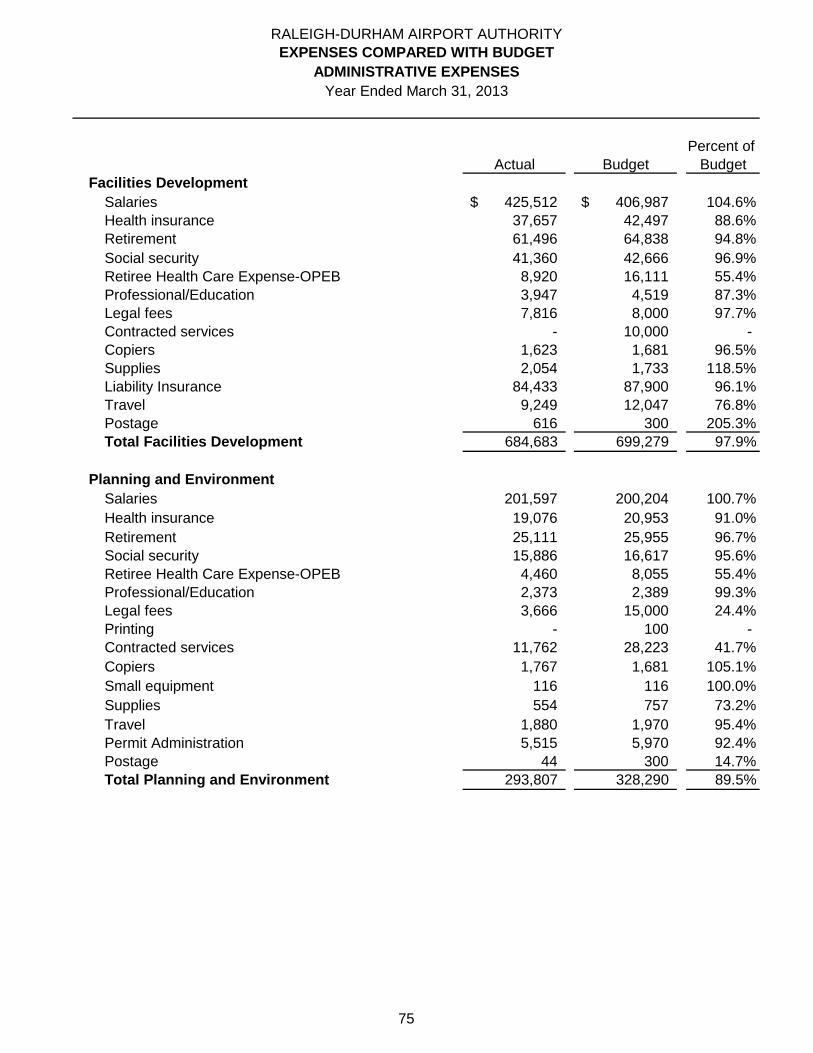
Percent of
Actual Budget Budget
RALEIGH-DURHAM AIRPORT AUTHORITY
Year Ended March 31, 2013
EXPENSES COMPARED WITH BUDGET
ADMINISTRATIVE EXPENSES
Facilities Development
Salaries 425,512$ 406,987$ 104.6%
Health insurance 37,657 42,497 88.6%
Retirement 61,496 64,838 94.8%
Social security 41,360 42,666 96.9%
Retiree Health Care Expense-OPEB 8,920 16,111 55.4%
Professional/Education 3,947 4,519 87.3%
Legal fees 7,816 8,000 97.7%
Contracted services - 10,000 -
Copiers 1,623 1,681 96.5%
Supplies 2,054 1,733 118.5%
Liability Insurance 84,433 87,900 96.1%
Travel 9,249 12,047 76.8%
Postage 616 300 205.3%
Total Facilities Development 684,683 699,279 97.9%
Planning and Environment
Salaries 201,597 200,204 100.7%
Health insurance 19,076 20,953 91.0%
Retirement 25,111 25,955 96.7%
Social security 15,886 16,617 95.6%
Retiree Health Care Expense-OPEB 4,460 8,055 55.4%
Professional/Education 2,373 2,389 99.3%
Legal fees 3,666 15,000 24.4%
Printing - 100 -
Contracted services 11,762 28,223 41.7%
Copiers 1,767 1,681 105.1%
Small equipment 116 116 100.0%
Supplies 554 757 73.2%
Travel 1,880 1,970 95.4%
Permit Administration 5,515 5,970 92.4%
Postage 44 300 14.7%
Total Planning and Environment 293,807 328,290 89.5%
75
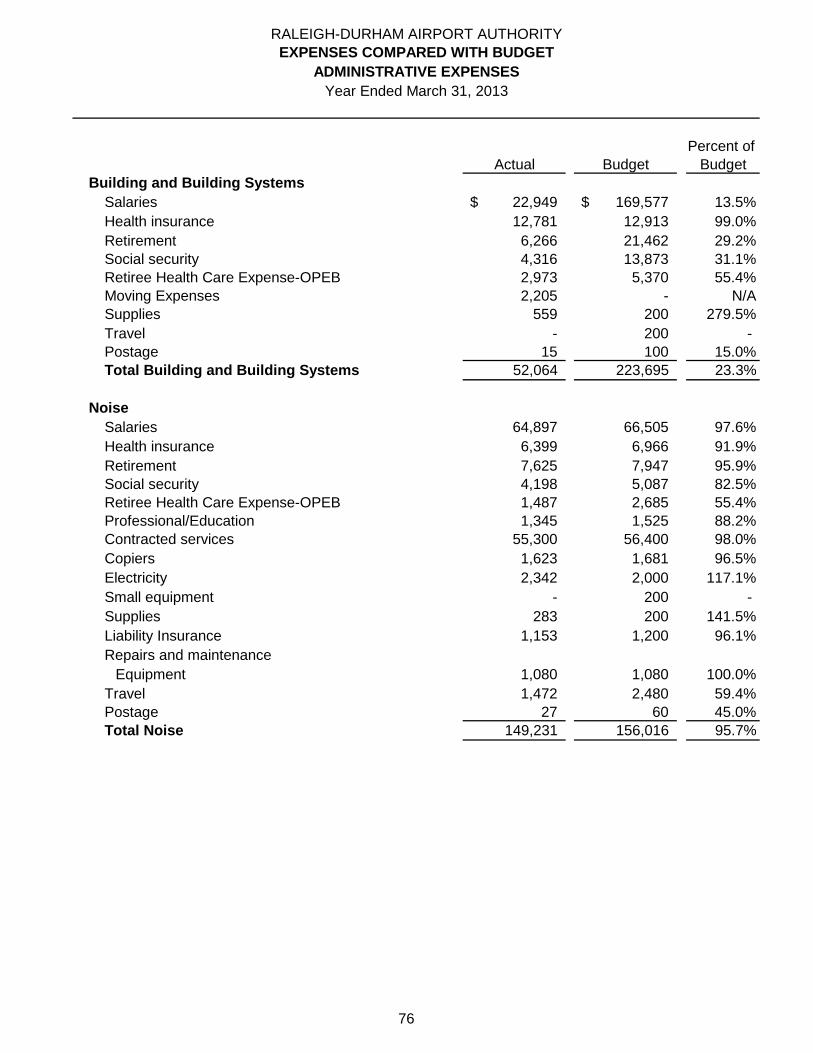
Percent of
Actual Budget Budget
RALEIGH-DURHAM AIRPORT AUTHORITY
Year Ended March 31, 2013
EXPENSES COMPARED WITH BUDGET
ADMINISTRATIVE EXPENSES
Building and Building Systems
Salaries 22,949$ 169,577$ 13.5%
Health insurance 12,781 12,913 99.0%
Retirement 6,266 21,462 29.2%
Social security 4,316 13,873 31.1%
Retiree Health Care Expense-OPEB 2,973 5,370 55.4%
Moving Expenses 2,205 - N/A
Supplies 559 200 279.5%
Travel - 200 -
Postage 15 100 15.0%
Total Building and Building Systems 52,064 223,695 23.3%
Noise
Salaries 64,897 66,505 97.6%
Health insurance 6,399 6,966 91.9%
Retirement 7,625 7,947 95.9%
Social security 4,198 5,087 82.5%
Retiree Health Care Expense-OPEB 1,487 2,685 55.4%
Professional/Education 1,345 1,525 88.2%
Contracted services 55,300 56,400 98.0%
Copiers 1,623 1,681 96.5%
Electricity 2,342 2,000 117.1%
Small equipment - 200 -
Supplies 283 200 141.5%
Liability Insurance 1,153 1,200 96.1%
Repairs and maintenance
Equipment 1,080 1,080 100.0%
Travel 1,472 2,480 59.4%
Postage 27 60 45.0%
Total Noise 149,231 156,016 95.7%
76
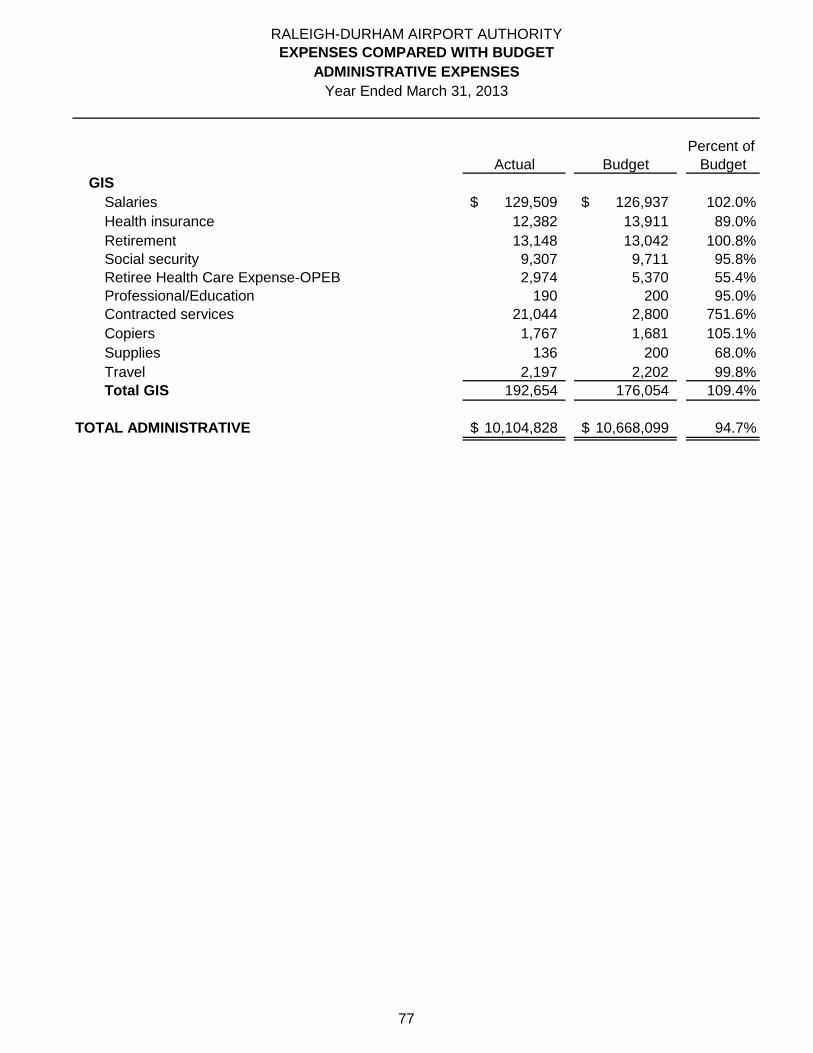
Percent of
Actual Budget Budget
RALEIGH-DURHAM AIRPORT AUTHORITY
Year Ended March 31, 2013
EXPENSES COMPARED WITH BUDGET
ADMINISTRATIVE EXPENSES
GIS
Salaries 129,509$ 126,937$ 102.0%
Health insurance 12,382 13,911 89.0%
Retirement 13,148 13,042 100.8%
Social security 9,307 9,711 95.8%
Retiree Health Care Expense-OPEB 2,974 5,370 55.4%
Professional/Education 190 200 95.0%
Contracted services 21,044 2,800 751.6%
Copiers 1,767 1,681 105.1%
Supplies 136 200 68.0%
Travel 2,197 2,202 99.8%
Total GIS 192,654 176,054 109.4%
TOTAL ADMINISTRATIVE 10,104,828$ 10,668,099$ 94.7%
77
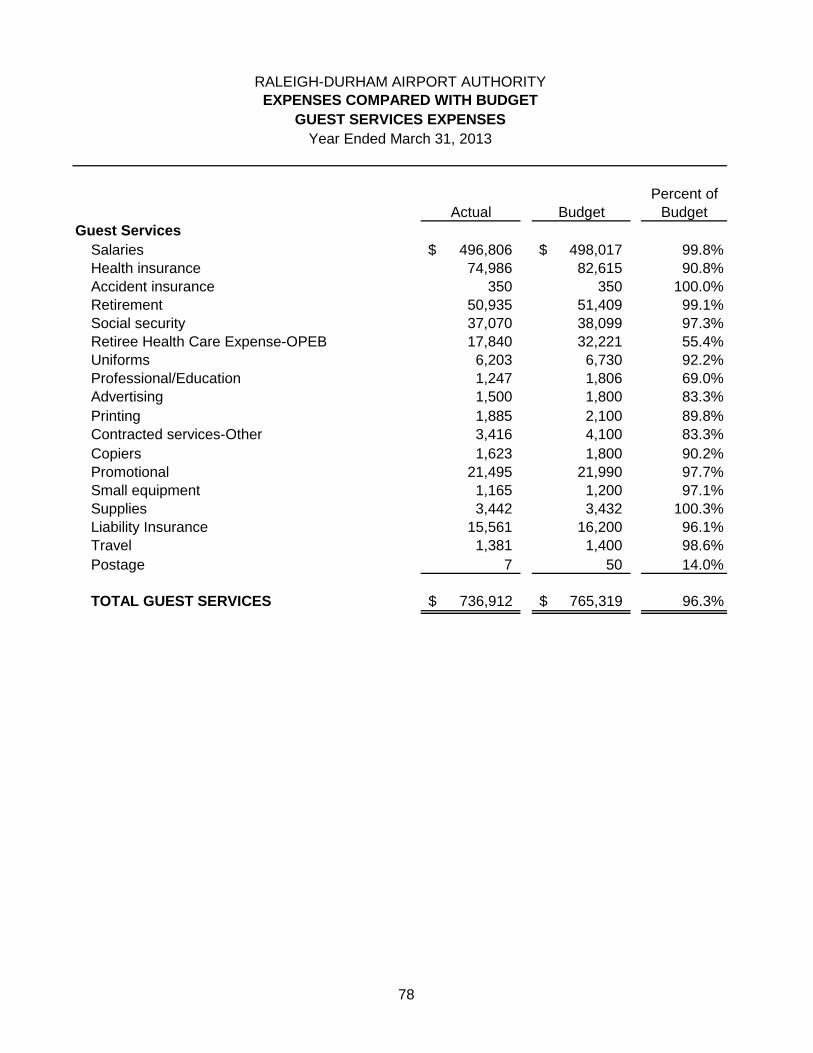
Percent of
Actual Budget Budget
Guest Services
Salaries 496,806$ 498,017$ 99.8%
Health insurance 74,986 82,615 90.8%
Accident insurance 350 350 100.0%
Retirement 50,935 51,409 99.1%
Social security 37,070 38,099 97.3%
Retiree Health Care Expense-OPEB 17,840 32,221 55.4%
Uniforms 6,203 6,730 92.2%
Professional/Education 1,247 1,806 69.0%
Advertising 1,500 1,800 83.3%
Printing 1,885 2,100 89.8%
Contracted services-Other 3,416 4,100 83.3%
Copiers 1,623 1,800 90.2%
Promotional 21,495 21,990 97.7%
Small equipment 1,165 1,200 97.1%
Supplies 3,442 3,432 100.3%
Liability Insurance 15,561 16,200 96.1%
Travel 1,381 1,400 98.6%
Postage 7 50 14.0%
TOTAL GUEST SERVICES 736,912$ 765,319$ 96.3%
RALEIGH-DURHAM AIRPORT AUTHORITY
Year Ended March 31, 2013
EXPENSES COMPARED WITH BUDGET
GUEST SERVICES EXPENSES
78
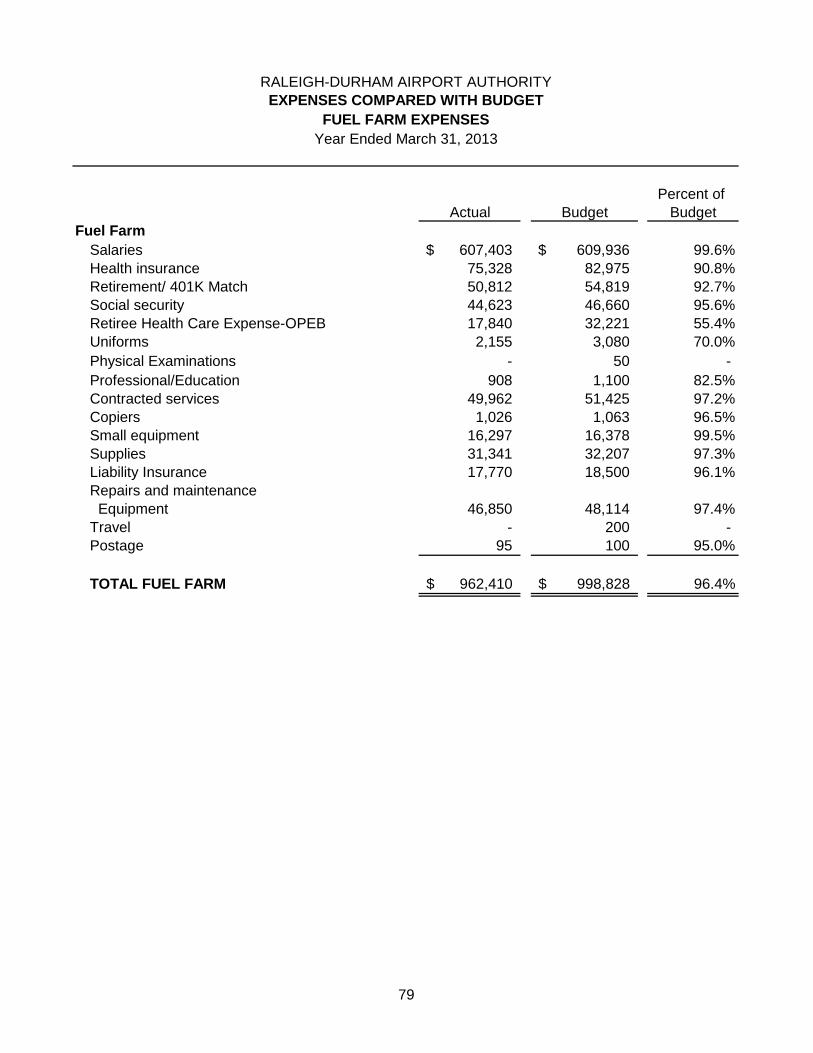
Percent of
Actual Budget Budget
Fuel Farm
Salaries 607,403$ 609,936$ 99.6%
Health insurance 75,328 82,975 90.8%
Retirement/ 401K Match 50,812 54,819 92.7%
Social security 44,623 46,660 95.6%
Retiree Health Care Expense-OPEB 17,840 32,221 55.4%
Uniforms 2,155 3,080 70.0%
Physical Examinations - 50 -
Professional/Education 908 1,100 82.5%
Contracted services 49,962 51,425 97.2%
Copiers 1,026 1,063 96.5%
Small equipment 16,297 16,378 99.5%
Supplies 31,341 32,207 97.3%
Liability Insurance 17,770 18,500 96.1%
Repairs and maintenance
Equipment 46,850 48,114 97.4%
Travel - 200 -
Postage 95 100 95.0%
TOTAL FUEL FARM 962,410$ 998,828$ 96.4%
RALEIGH-DURHAM AIRPORT AUTHORITY
EXPENSES COMPARED WITH BUDGET
FUEL FARM EXPENSES
Year Ended March 31, 2013
79
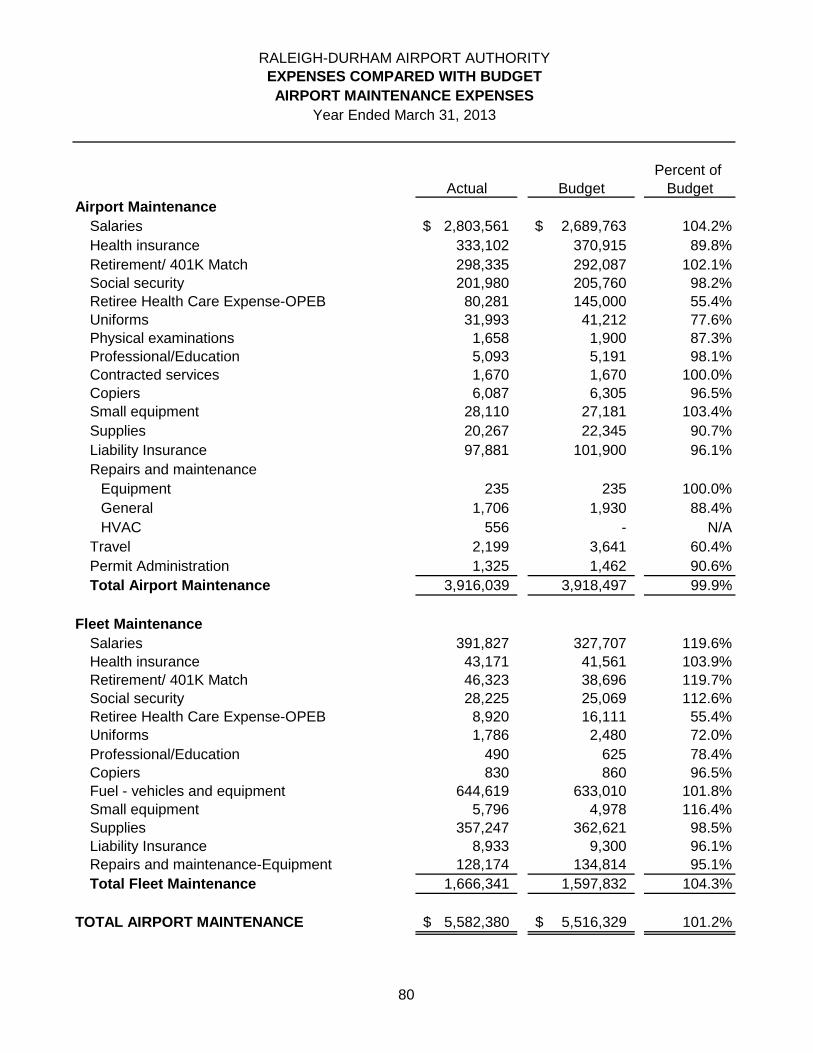
Percent of
Actual Budget Budget
Airport Maintenance
Salaries 2,803,561$ 2,689,763$ 104.2%
Health insurance 333,102 370,915 89.8%
Retirement/ 401K Match 298,335 292,087 102.1%
Social security 201,980 205,760 98.2%
Retiree Health Care Expense-OPEB 80,281 145,000 55.4%
Uniforms 31,993 41,212 77.6%
Physical examinations 1,658 1,900 87.3%
Professional/Education 5,093 5,191 98.1%
Contracted services 1,670 1,670 100.0%
Copiers 6,087 6,305 96.5%
Small equipment 28,110 27,181 103.4%
Supplies 20,267 22,345 90.7%
Liability Insurance 97,881 101,900 96.1%
Repairs and maintenance
Equipment 235 235 100.0%
General 1,706 1,930 88.4%
HVAC 556 - N/A
Travel 2,199 3,641 60.4%
Permit Administration 1,325 1,462 90.6%
Total Airport Maintenance 3,916,039 3,918,497 99.9%
Fleet Maintenance
Salaries 391,827 327,707 119.6%
Health insurance 43,171 41,561 103.9%
Retirement/ 401K Match 46,323 38,696 119.7%
Social security 28,225 25,069 112.6%
Retiree Health Care Expense-OPEB 8,920 16,111 55.4%
Uniforms 1,786 2,480 72.0%
Professional/Education 490 625 78.4%
Copiers 830 860 96.5%
Fuel - vehicles and equipment 644,619 633,010 101.8%
Small equipment 5,796 4,978 116.4%
Supplies 357,247 362,621 98.5%
Liability Insurance 8,933 9,300 96.1%
Repairs and maintenance-Equipment 128,174 134,814 95.1%
Total Fleet Maintenance 1,666,341 1,597,832 104.3%
TOTAL AIRPORT MAINTENANCE 5,582,380$ 5,516,329$ 101.2%
RALEIGH-DURHAM AIRPORT AUTHORITY
Year Ended March 31, 2013
EXPENSES COMPARED WITH BUDGET
AIRPORT MAINTENANCE EXPENSES
80
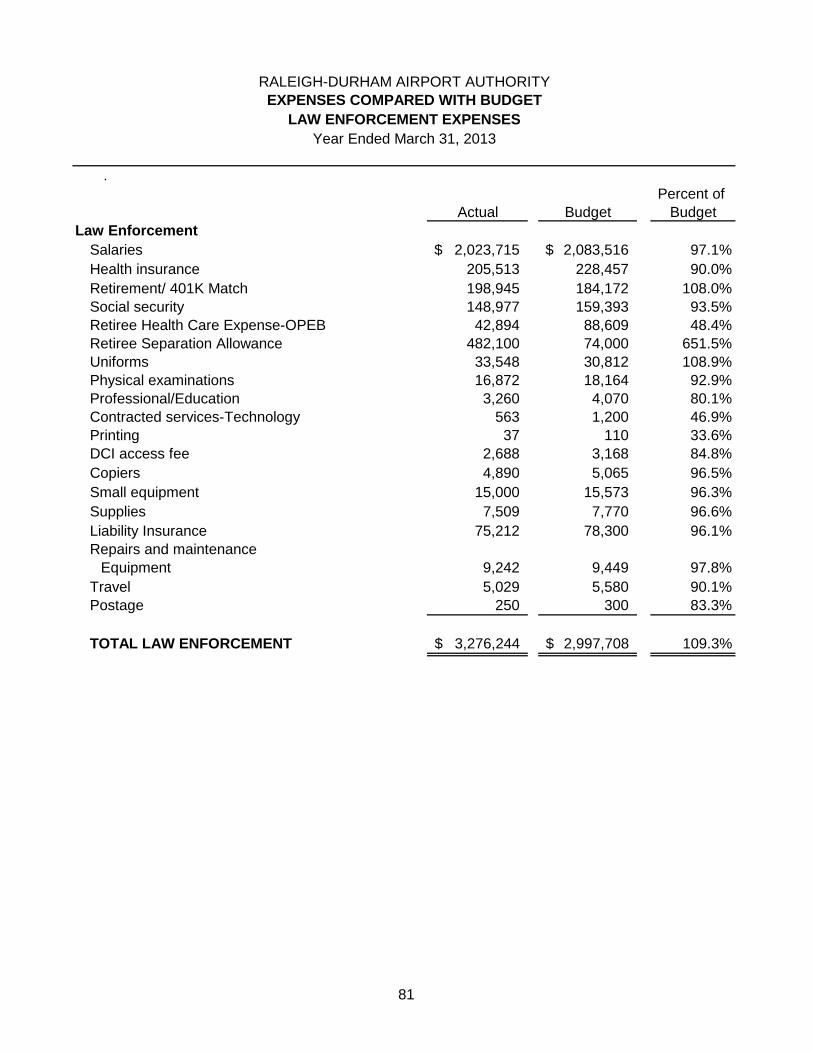
.
Percent of
Actual Budget Budget
Law Enforcement
Salaries 2,023,715$ 2,083,516$ 97.1%
Health insurance 205,513 228,457 90.0%
Retirement/ 401K Match 198,945 184,172 108.0%
Social security 148,977 159,393 93.5%
Retiree Health Care Expense-OPEB 42,894 88,609 48.4%
Retiree Separation Allowance 482,100 74,000 651.5%
Uniforms 33,548 30,812 108.9%
Physical examinations 16,872 18,164 92.9%
Professional/Education 3,260 4,070 80.1%
Contracted services-Technology 563 1,200 46.9%
Printing 37 110 33.6%
DCI access fee 2,688 3,168 84.8%
Copiers 4,890 5,065 96.5%
Small equipment 15,000 15,573 96.3%
Supplies 7,509 7,770 96.6%
Liability Insurance 75,212 78,300 96.1%
Repairs and maintenance
Equipment 9,242 9,449 97.8%
Travel 5,029 5,580 90.1%
Postage 250 300 83.3%
TOTAL LAW ENFORCEMENT 3,276,244$ 2,997,708$ 109.3%
RALEIGH-DURHAM AIRPORT AUTHORITY
Year Ended March 31, 2013
EXPENSES COMPARED WITH BUDGET
LAW ENFORCEMENT EXPENSES
81
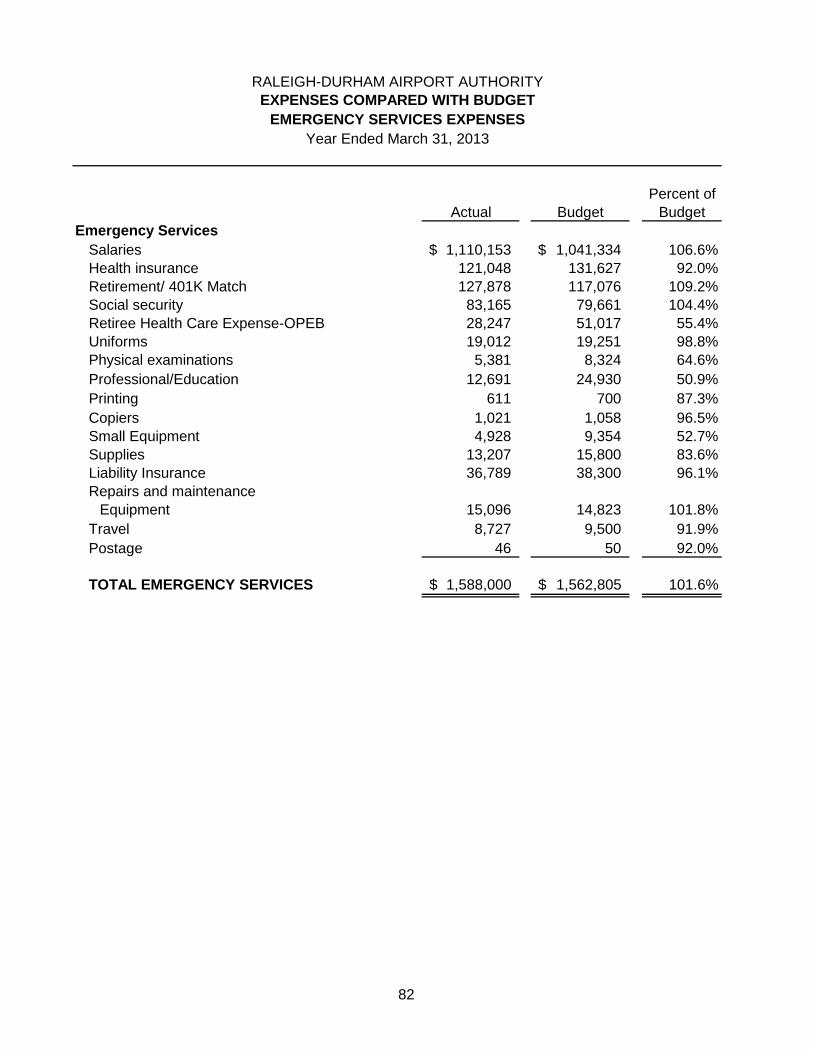
Percent of
Actual Budget Budget
Emergency Services
Salaries 1,110,153$ 1,041,334$ 106.6%
Health insurance 121,048 131,627 92.0%
Retirement/ 401K Match 127,878 117,076 109.2%
Social security 83,165 79,661 104.4%
Retiree Health Care Expense-OPEB 28,247 51,017 55.4%
Uniforms 19,012 19,251 98.8%
Physical examinations 5,381 8,324 64.6%
Professional/Education 12,691 24,930 50.9%
Printing 611 700 87.3%
Copiers 1,021 1,058 96.5%
Small Equipment 4,928 9,354 52.7%
Supplies 13,207 15,800 83.6%
Liability Insurance 36,789 38,300 96.1%
Repairs and maintenance
Equipment 15,096 14,823 101.8%
Travel 8,727 9,500 91.9%
Postage 46 50 92.0%
TOTAL EMERGENCY SERVICES 1,588,000$ 1,562,805$ 101.6%
RALEIGH-DURHAM AIRPORT AUTHORITY
Year Ended March 31, 2013
EXPENSES COMPARED WITH BUDGET
EMERGENCY SERVICES EXPENSES
82
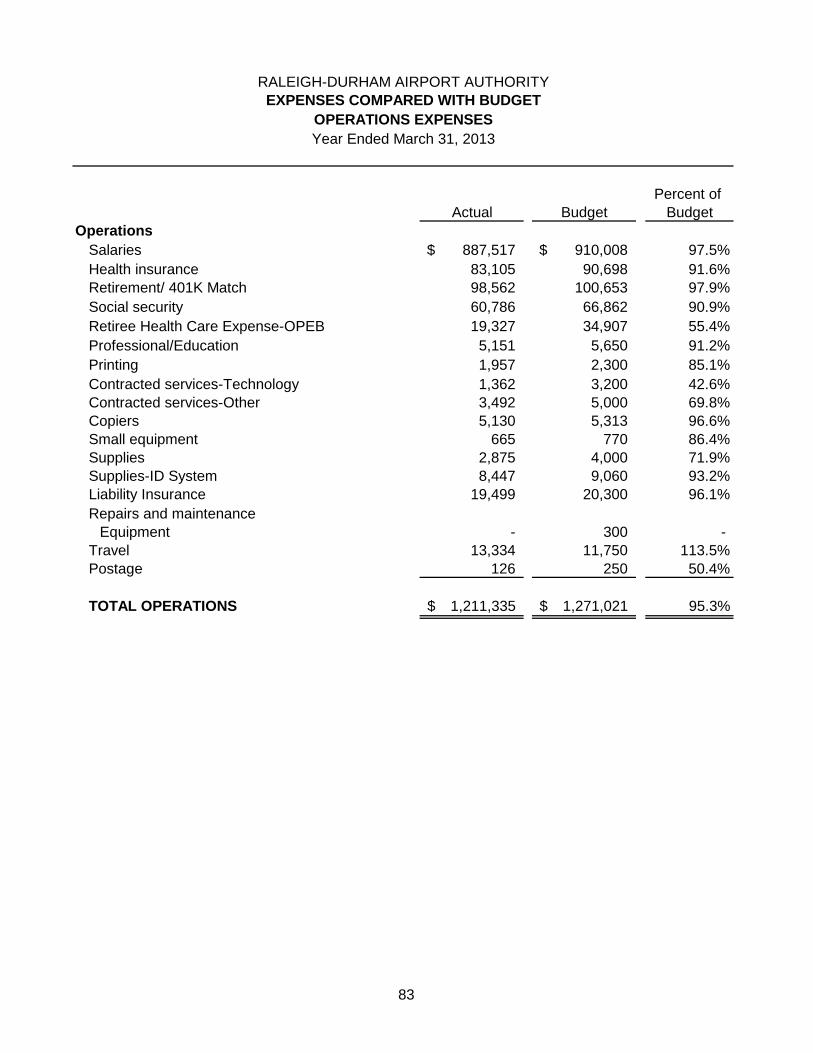
Percent of
Actual Budget Budget
Operations
Salaries 887,517$ 910,008$ 97.5%
Health insurance 83,105 90,698 91.6%
Retirement/ 401K Match 98,562 100,653 97.9%
Social security 60,786 66,862 90.9%
Retiree Health Care Expense-OPEB 19,327 34,907 55.4%
Professional/Education 5,151 5,650 91.2%
Printing 1,957 2,300 85.1%
Contracted services-Technology 1,362 3,200 42.6%
Contracted services-Other 3,492 5,000 69.8%
Copiers 5,130 5,313 96.6%
Small equipment 665 770 86.4%
Supplies 2,875 4,000 71.9%
Supplies-ID System 8,447 9,060 93.2%
Liability Insurance 19,499 20,300 96.1%
Repairs and maintenance
Equipment - 300 -
Travel 13,334 11,750 113.5%
Postage 126 250 50.4%
TOTAL OPERATIONS 1,211,335$ 1,271,021$ 95.3%
RALEIGH-DURHAM AIRPORT AUTHORITY
Year Ended March 31, 2013
EXPENSES COMPARED WITH BUDGET
OPERATIONS EXPENSES
83
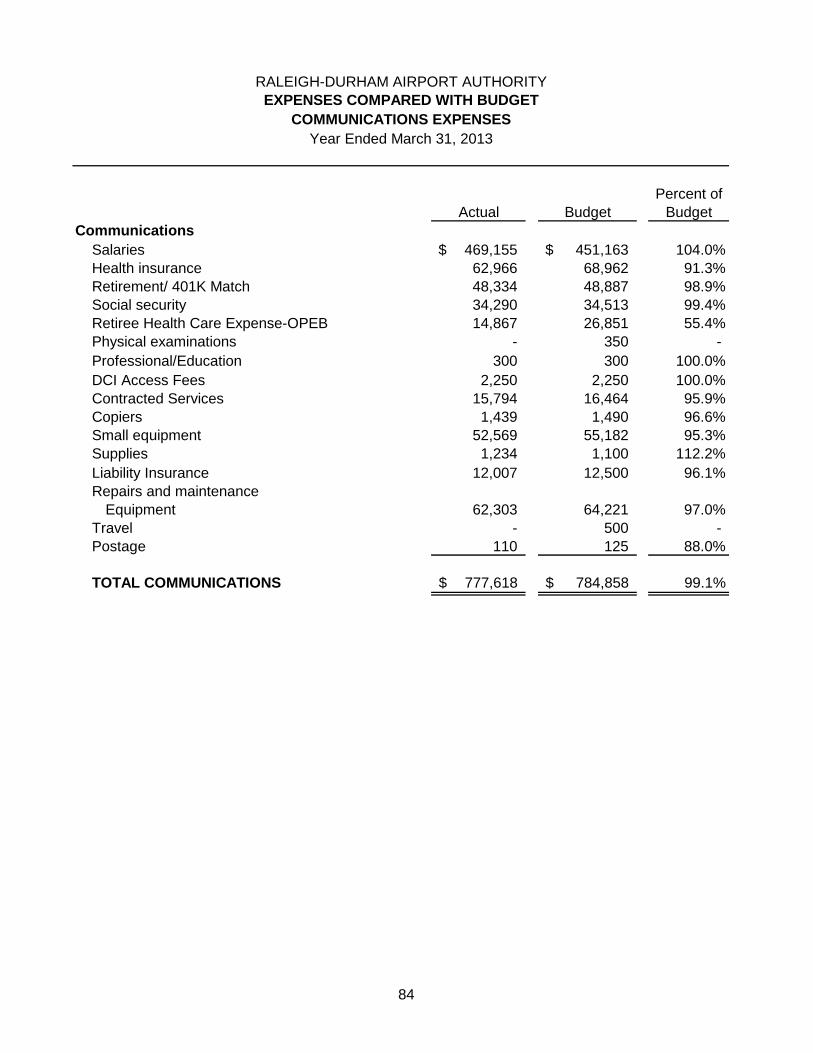
Percent of
Actual Budget Budget
Communications
Salaries 469,155$ 451,163$ 104.0%
Health insurance 62,966 68,962 91.3%
Retirement/ 401K Match 48,334 48,887 98.9%
Social security 34,290 34,513 99.4%
Retiree Health Care Expense-OPEB 14,867 26,851 55.4%
Physical examinations - 350 -
Professional/Education 300 300 100.0%
DCI Access Fees 2,250 2,250 100.0%
Contracted Services 15,794 16,464 95.9%
Copiers 1,439 1,490 96.6%
Small equipment 52,569 55,182 95.3%
Supplies 1,234 1,100 112.2%
Liability Insurance 12,007 12,500 96.1%
Repairs and maintenance
Equipment 62,303 64,221 97.0%
Travel - 500 -
Postage 110 125 88.0%
TOTAL COMMUNICATIONS 777,618$ 784,858$ 99.1%
RALEIGH-DURHAM AIRPORT AUTHORITY
Year Ended March 31, 2013
EXPENSES COMPARED WITH BUDGET
COMMUNICATIONS EXPENSES
84
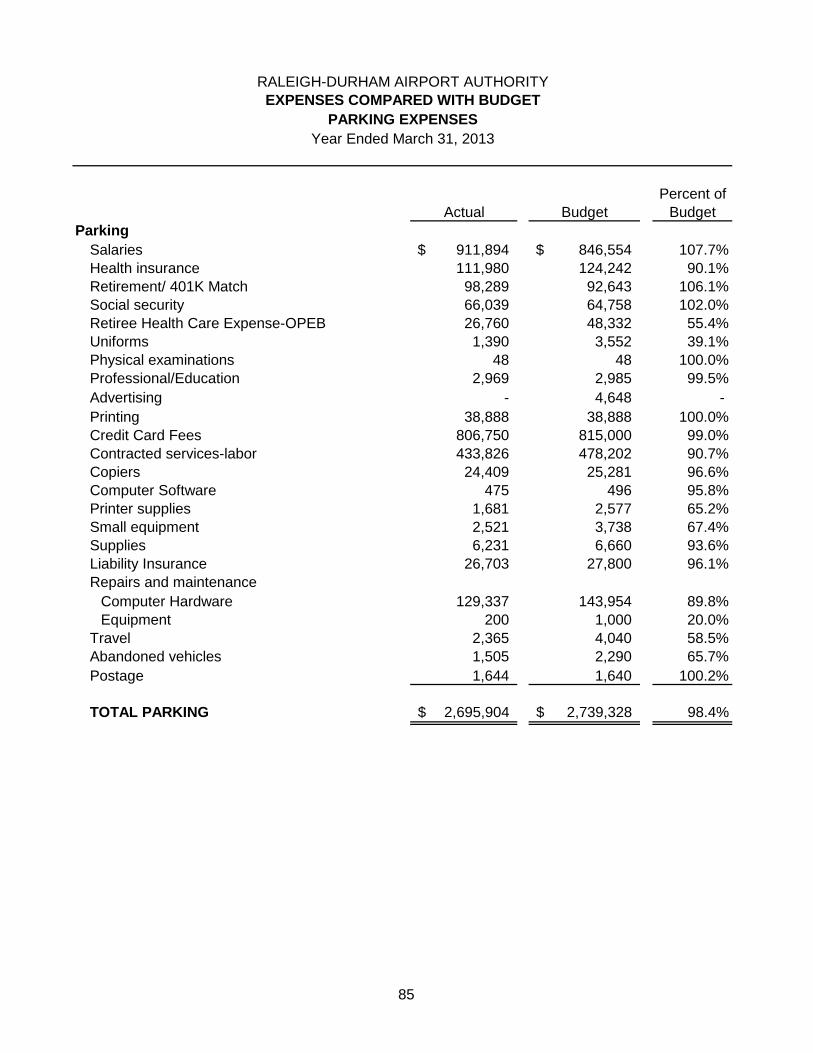
Percent of
Actual Budget Budget
Parking
Salaries 911,894$ 846,554$ 107.7%
Health insurance 111,980 124,242 90.1%
Retirement/ 401K Match 98,289 92,643 106.1%
Social security 66,039 64,758 102.0%
Retiree Health Care Expense-OPEB 26,760 48,332 55.4%
Uniforms 1,390 3,552 39.1%
Physical examinations 48 48 100.0%
Professional/Education 2,969 2,985 99.5%
Advertising - 4,648 -
Printing 38,888 38,888 100.0%
Credit Card Fees 806,750 815,000 99.0%
Contracted services-labor 433,826 478,202 90.7%
Copiers 24,409 25,281 96.6%
Computer Software 475 496 95.8%
Printer supplies 1,681 2,577 65.2%
Small equipment 2,521 3,738 67.4%
Supplies 6,231 6,660 93.6%
Liability Insurance 26,703 27,800 96.1%
Repairs and maintenance
Computer Hardware 129,337 143,954 89.8%
Equipment 200 1,000 20.0%
Travel 2,365 4,040 58.5%
Abandoned vehicles 1,505 2,290 65.7%
Postage 1,644 1,640 100.2%
TOTAL PARKING 2,695,904$ 2,739,328$ 98.4%
RALEIGH-DURHAM AIRPORT AUTHORITY
EXPENSES COMPARED WITH BUDGET
Year Ended March 31, 2013
PARKING EXPENSES
85
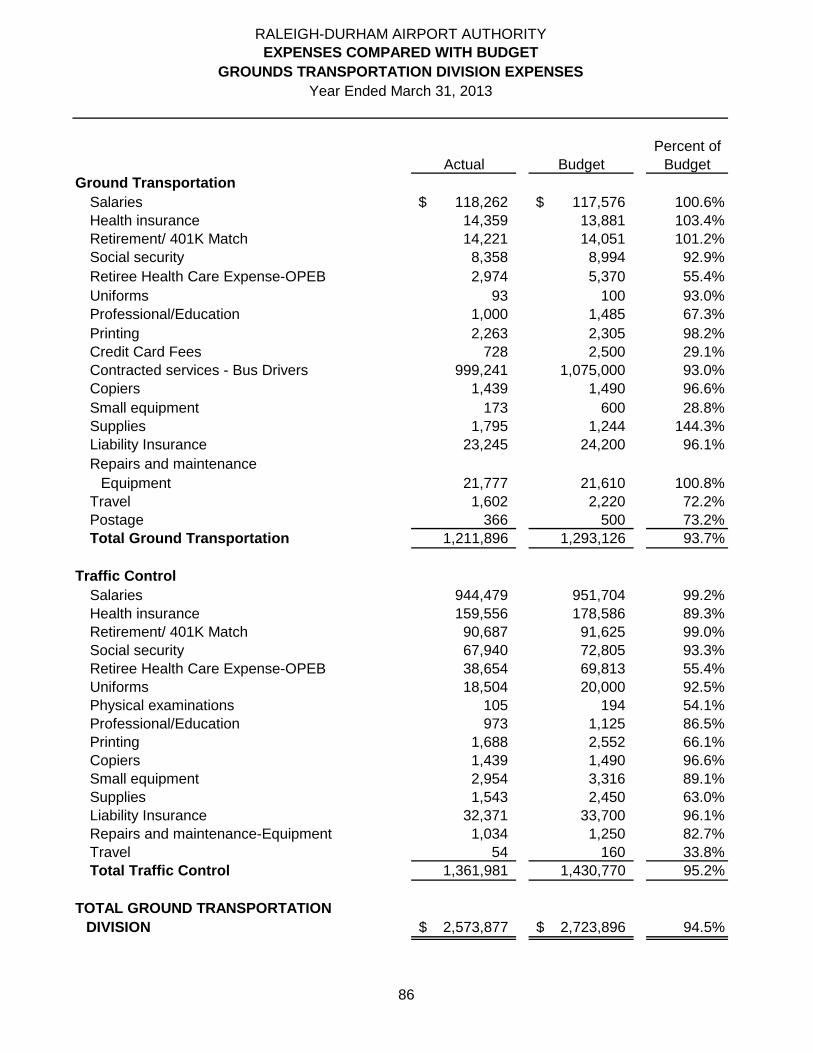
Percent of
Actual Budget Budget
Ground Transportation
Salaries 118,262$ 117,576$ 100.6%
Health insurance 14,359 13,881 103.4%
Retirement/ 401K Match 14,221 14,051 101.2%
Social security 8,358 8,994 92.9%
Retiree Health Care Expense-OPEB 2,974 5,370 55.4%
Uniforms 93 100 93.0%
Professional/Education 1,000 1,485 67.3%
Printing 2,263 2,305 98.2%
Credit Card Fees 728 2,500 29.1%
Contracted services - Bus Drivers 999,241 1,075,000 93.0%
Copiers 1,439 1,490 96.6%
Small equipment 173 600 28.8%
Supplies 1,795 1,244 144.3%
Liability Insurance 23,245 24,200 96.1%
Repairs and maintenance
Equipment 21,777 21,610 100.8%
Travel 1,602 2,220 72.2%
Postage 366 500 73.2%
Total Ground Transportation 1,211,896 1,293,126 93.7%
Traffic Control
Salaries 944,479 951,704 99.2%
Health insurance 159,556 178,586 89.3%
Retirement/ 401K Match 90,687 91,625 99.0%
Social security 67,940 72,805 93.3%
Retiree Health Care Expense-OPEB 38,654 69,813 55.4%
Uniforms 18,504 20,000 92.5%
Physical examinations 105 194 54.1%
Professional/Education 973 1,125 86.5%
Printing 1,688 2,552 66.1%
Copiers 1,439 1,490 96.6%
Small equipment 2,954 3,316 89.1%
Supplies 1,543 2,450 63.0%
Liability Insurance 32,371 33,700 96.1%
Repairs and maintenance-Equipment 1,034 1,250 82.7%
Travel 54 160 33.8%
Total Traffic Control 1,361,981 1,430,770 95.2%
TOTAL GROUND TRANSPORTATION
DIVISION 2,573,877$ 2,723,896$ 94.5%
RALEIGH-DURHAM AIRPORT AUTHORITY
Year Ended March 31, 2013
EXPENSES COMPARED WITH BUDGET
GROUNDS TRANSPORTATION DIVISION EXPENSES
86
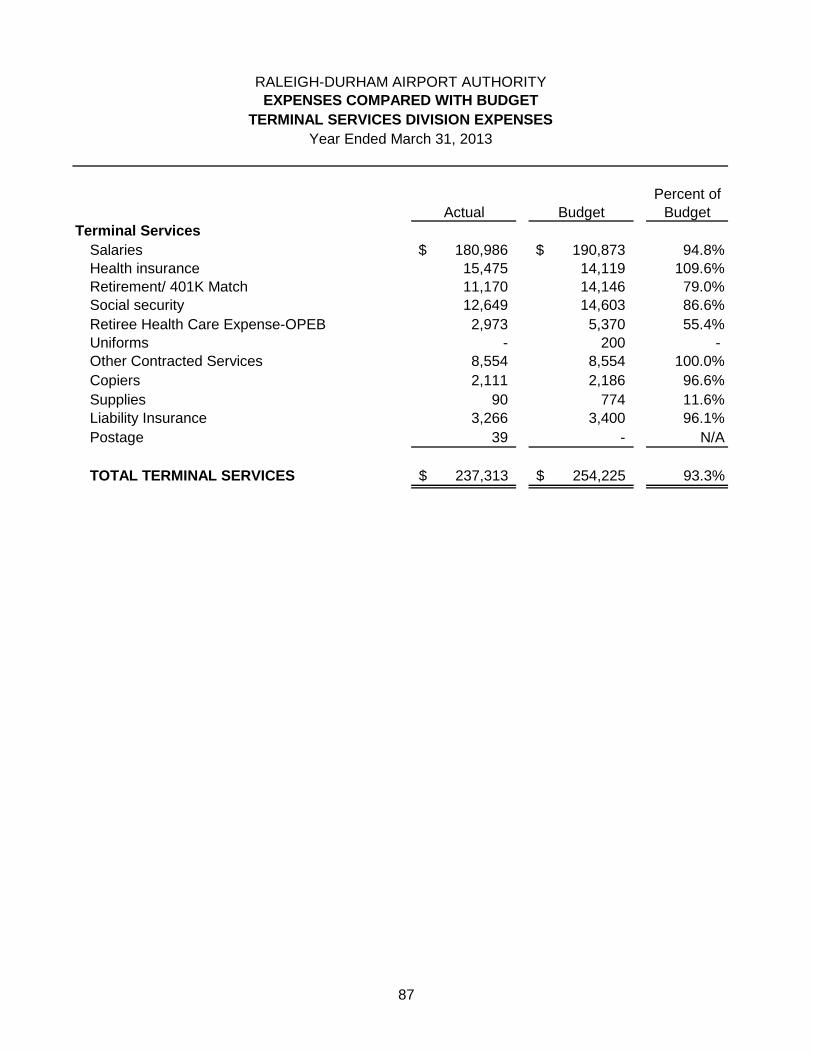
Percent of
Actual Budget Budget
Terminal Services
Salaries 180,986$ 190,873$ 94.8%
Health insurance 15,475 14,119 109.6%
Retirement/ 401K Match 11,170 14,146 79.0%
Social security 12,649 14,603 86.6%
Retiree Health Care Expense-OPEB 2,973 5,370 55.4%
Uniforms - 200 -
Other Contracted Services 8,554 8,554 100.0%
Copiers 2,111 2,186 96.6%
Supplies 90 774 11.6%
Liability Insurance 3,266 3,400 96.1%
Postage 39 - N/A
TOTAL TERMINAL SERVICES 237,313$ 254,225$ 93.3%
RALEIGH-DURHAM AIRPORT AUTHORITY
EXPENSES COMPARED WITH BUDGET
TERMINAL SERVICES DIVISION EXPENSES
Year Ended March 31, 2013
87
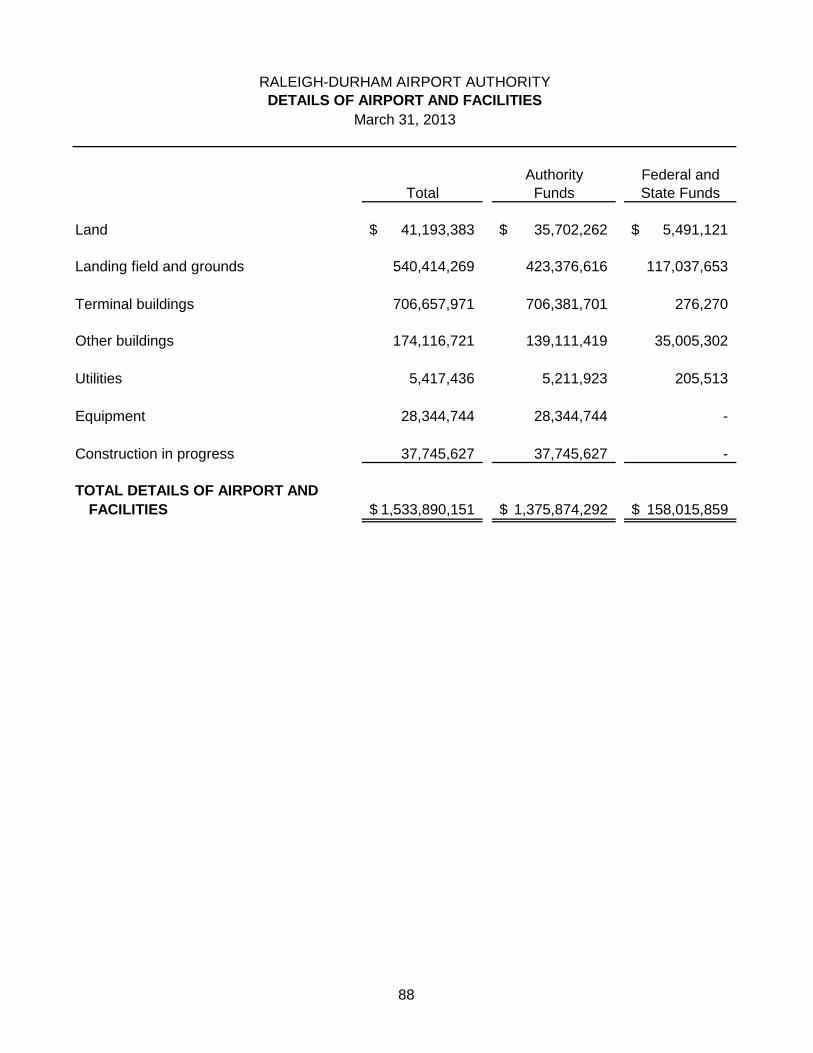
Authority Federal and
Total Funds State Funds
Land 41,193,383$ 35,702,262$ 5,491,121$
Landing field and grounds 540,414,269 423,376,616 117,037,653
Terminal buildings 706,657,971 706,381,701 276,270
Other buildings 174,116,721 139,111,419 35,005,302
Utilities 5,417,436 5,211,923 205,513
Equipment 28,344,744 28,344,744 -
Construction in progress 37,745,627 37,745,627 -
TOTAL DETAILS OF AIRPORT AND
FACILITIES 1,533,890,151$ 1,375,874,292$ 158,015,859$
RALEIGH-DURHAM AIRPORT AUTHORITY
March 31, 2013
DETAILS OF AIRPORT AND FACILITIES
88
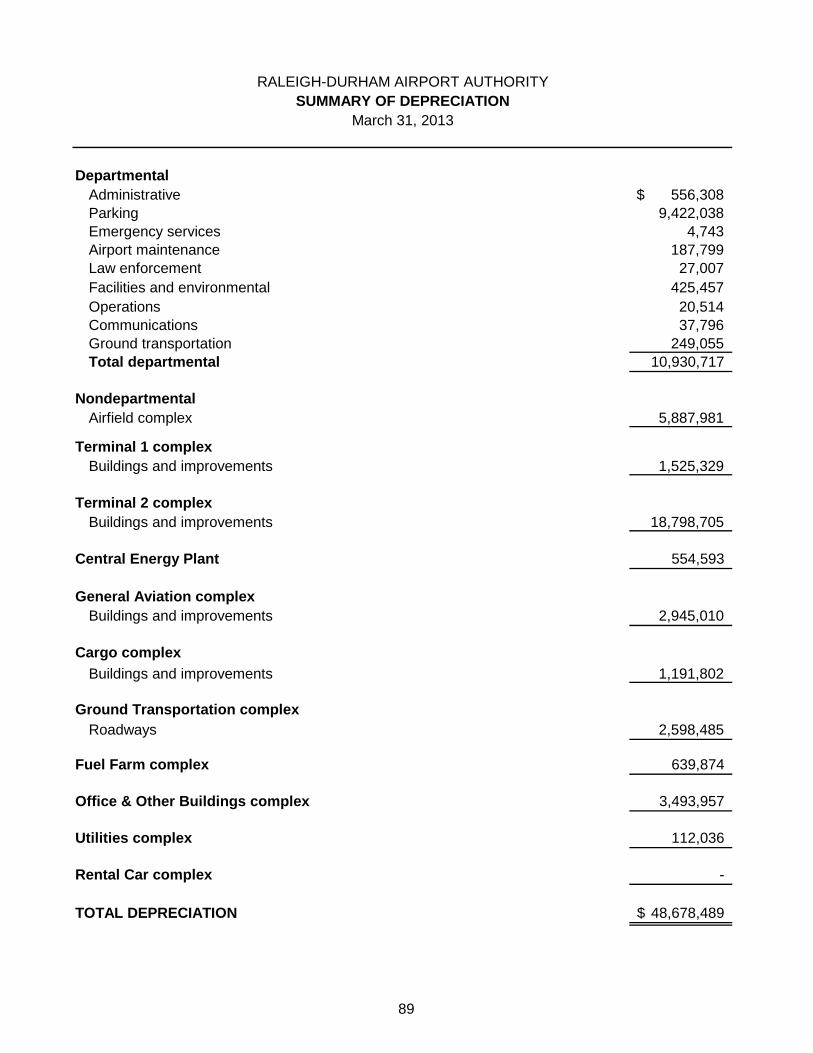
Departmental
Administrative 556,308$
Parking 9,422,038
Emergency services 4,743
Airport maintenance 187,799
Law enforcement 27,007
Facilities and environmental 425,457
Operations 20,514
Communications 37,796
Ground transportation 249,055
Total departmental 10,930,717
Nondepartmental
Airfield complex 5,887,981
Terminal 1 complex
Buildings and improvements 1,525,329
Terminal 2 complex
Buildings and improvements 18,798,705
Central Energy Plant 554,593
General Aviation complex
Buildings and improvements 2,945,010
Cargo complex
Buildings and improvements 1,191,802
Ground Transportation complex
Roadways 2,598,485
Fuel Farm complex 639,874
Office & Other Buildings complex 3,493,957
Utilities complex 112,036
Rental Car complex -
TOTAL DEPRECIATION 48,678,489$
March 31, 2013
SUMMARY OF DEPRECIATION
RALEIGH-DURHAM AIRPORT AUTHORITY
89
Statistical Section (Unaudited) Page
Financial Trends 91
These schedules contail trend information to help the reader understand how the Authority's
financial performance and well-being have changed over time.
Revenue Capacity 96
These schedules contain information to help the reader assess the Authority's most significant
revenue source.
Debt Capacity 98
These schedules present information to help the reader assess the affordability of the
Authority's current levels of outstanding debt and the Authority's ability to issue additional
debt in the future.
Demographic and Economic Information 100
These schedules offer demographic and economic indicators to help the reader undertand the
environment within which the Authority's financial activities take place.
Operating Information 102
These schedules contain service and infrastructure data to help the reader undertand how the
information in the Authority's financial report relates to the services the Authority provides
and the activities it performs.
RALEIGH-DURHAM AIRPORT AUTHORITY
STATISTICAL TABLE OF CONTENTS
FOR THE FISCAL YEAR ENDED MARCH 31, 2013
90
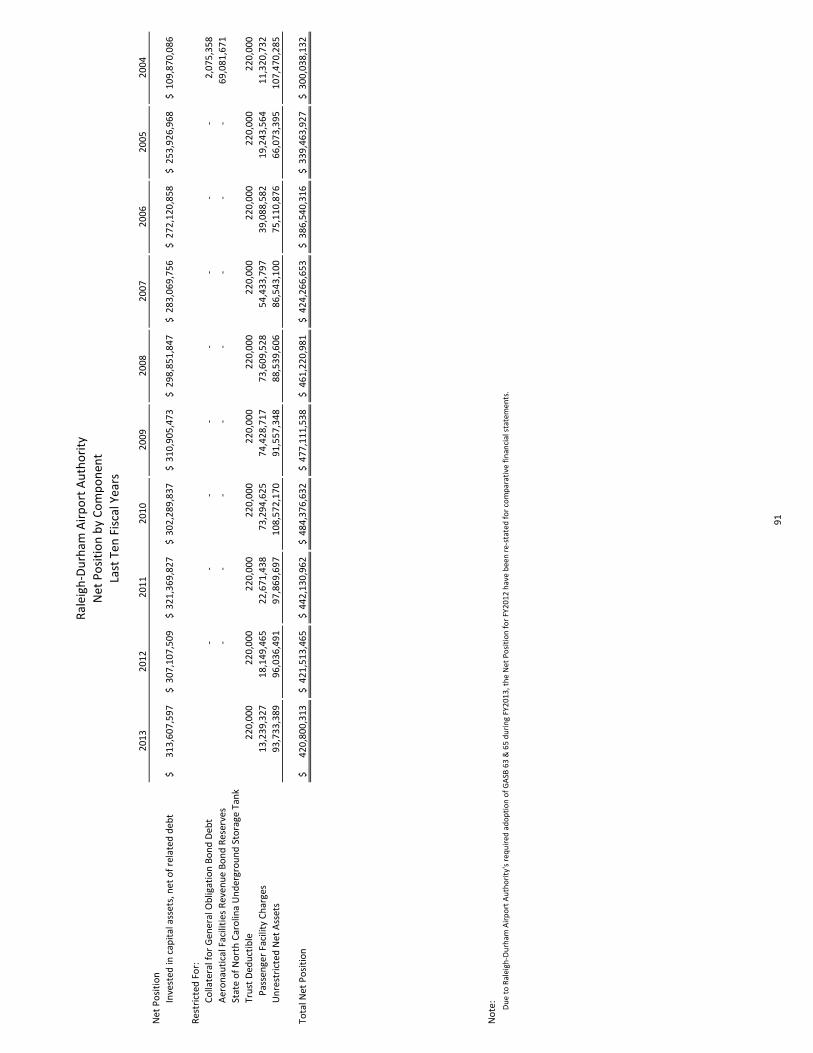
20
13
20
12
20
11
20
10
20
09
20
08
20
07
20
06
20
05
20
04
Net
Po
siti
on
Inve
sted
inca
pit
alas
sets
,net
of
rela
ted
deb
t3
13
,60
7,5
97
$3
07
,10
7,5
09
$3
21
,36
9,8
27
$3
02
,28
9,8
37
$3
10
,90
5,4
73
$2
98
,85
1,8
47
$2
83
,06
9,7
56
$2
72
,12
0,8
58
$2
53
,92
6,9
68
$1
09
,87
0,0
86
$
Res
tric
ted
For:
Co
llate
ralf
or
Gen
eral
Ob
ligat
ion
Bo
nd
Deb
t-
--
--
--
-2
,07
5,3
58
Aer
on
auti
calF
acili
ties
Rev
enu
eB
on
dR
eser
ves
--
--
--
--
69
,08
1,6
71
Stat
eo
fN
ort
hC
aro
lina
Un
der
gro
un
dSt
ora
geTa
nk
Tru
stD
edu
ctib
le2
20
,00
02
20
,00
02
20
,00
02
20
,00
02
20
,00
02
20
,00
02
20
,00
02
20
,00
02
20
,00
02
20
,00
0
Pas
sen
ger
Faci
lity
Ch
arge
s1
3,2
39
,32
71
8,1
49
,46
52
2,6
71
,43
87
3,2
94
,62
57
4,4
28
,71
77
3,6
09
,52
85
4,4
33
,79
73
9,0
88
,58
21
9,2
43
,56
41
1,3
20
,73
2
Un
rest
rict
edN
etA
sset
s9
3,7
33
,38
99
6,0
36
,49
19
7,8
69
,69
71
08
,57
2,1
70
91
,55
7,3
48
88
,53
9,6
06
86
,54
3,1
00
75
,11
0,8
76
66
,07
3,3
95
10
7,4
70
,28
5
Tota
lNet
Po
siti
on
42
0,8
00
,31
3$
42
1,5
13
,46
5$
44
2,1
30
,96
2$
48
4,3
76
,63
2$
47
7,1
11
,53
8$
46
1,2
20
,98
1$
42
4,2
66
,65
3$
38
6,5
40
,31
6$
33
9,4
63
,92
7$
30
0,0
38
,13
2$
No
te:
Du
eto
Ral
eigh
-Du
rham
Air
po
rtA
uth
ori
ty's
req
uir
edad
op
tio
no
fG
ASB
63
&6
5d
uri
ng
FY2
01
3,t
he
Net
Po
siti
on
for
FY2
01
2h
ave
bee
nre
-sta
ted
for
com
par
ativ
efi
nan
cial
stat
emen
ts.
Ral
eigh
-Du
rham
Air
po
rtA
uth
ori
ty
Net
Po
siti
on
by
Co
mp
on
ent
Last
Ten
Fisc
alYe
ars
91
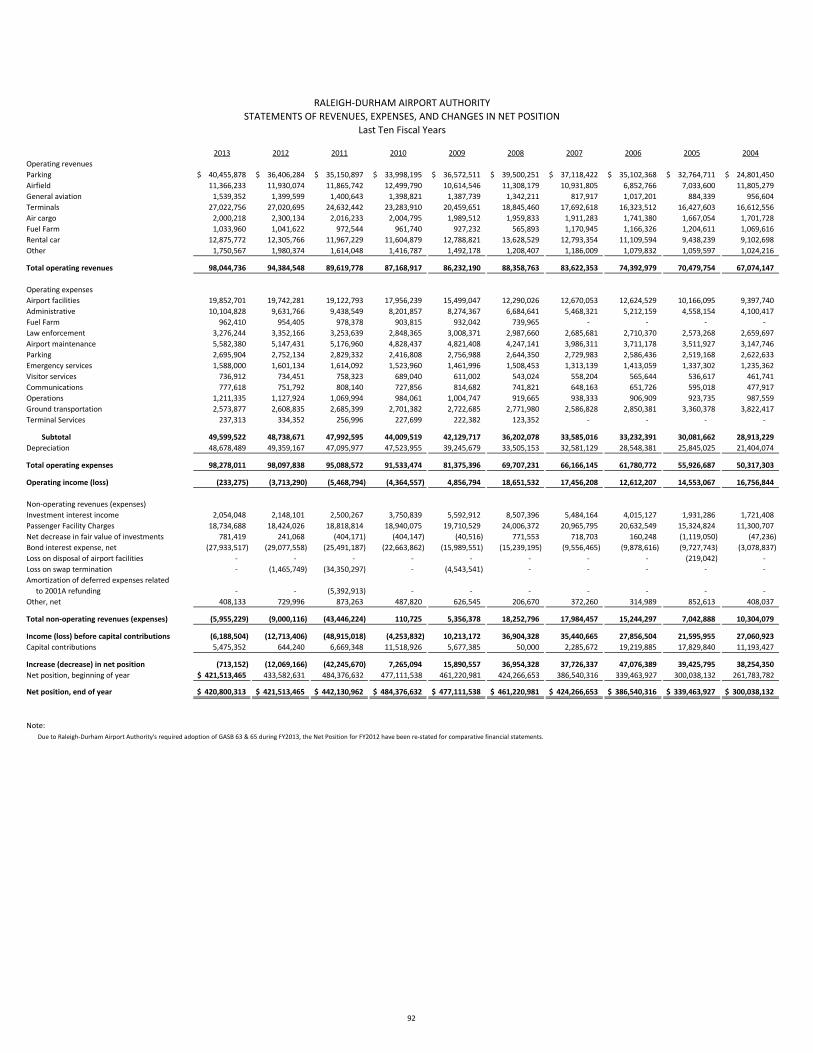
2013 2012 2011 2010 2009 2008 2007 2006 2005 2004
Operating revenues
Parking 40,455,878$ 36,406,284$ 35,150,897$ 33,998,195$ 36,572,511$ 39,500,251$ 37,118,422$ 35,102,368$ 32,764,711$ 24,801,450$
Airfield 11,366,233 11,930,074 11,865,742 12,499,790 10,614,546 11,308,179 10,931,805 6,852,766 7,033,600 11,805,279
General aviation 1,539,352 1,399,599 1,400,643 1,398,821 1,387,739 1,342,211 817,917 1,017,201 884,339 956,604
Terminals 27,022,756 27,020,695 24,632,442 23,283,910 20,459,651 18,845,460 17,692,618 16,323,512 16,427,603 16,612,556
Air cargo 2,000,218 2,300,134 2,016,233 2,004,795 1,989,512 1,959,833 1,911,283 1,741,380 1,667,054 1,701,728
Fuel Farm 1,033,960 1,041,622 972,544 961,740 927,232 565,893 1,170,945 1,166,326 1,204,611 1,069,616
Rental car 12,875,772 12,305,766 11,967,229 11,604,879 12,788,821 13,628,529 12,793,354 11,109,594 9,438,239 9,102,698
Other 1,750,567 1,980,374 1,614,048 1,416,787 1,492,178 1,208,407 1,186,009 1,079,832 1,059,597 1,024,216
Total operating revenues 98,044,736 94,384,548 89,619,778 87,168,917 86,232,190 88,358,763 83,622,353 74,392,979 70,479,754 67,074,147
Operating expenses
Airport facilities 19,852,701 19,742,281 19,122,793 17,956,239 15,499,047 12,290,026 12,670,053 12,624,529 10,166,095 9,397,740
Administrative 10,104,828 9,631,766 9,438,549 8,201,857 8,274,367 6,684,641 5,468,321 5,212,159 4,558,154 4,100,417
Fuel Farm 962,410 954,405 978,378 903,815 932,042 739,965 - - - -
Law enforcement 3,276,244 3,352,166 3,253,639 2,848,365 3,008,371 2,987,660 2,685,681 2,710,370 2,573,268 2,659,697
Airport maintenance 5,582,380 5,147,431 5,176,960 4,828,437 4,821,408 4,247,141 3,986,311 3,711,178 3,511,927 3,147,746
Parking 2,695,904 2,752,134 2,829,332 2,416,808 2,756,988 2,644,350 2,729,983 2,586,436 2,519,168 2,622,633
Emergency services 1,588,000 1,601,134 1,614,092 1,523,960 1,461,996 1,508,453 1,313,139 1,413,059 1,337,302 1,235,362
Visitor services 736,912 734,451 758,323 689,040 611,002 543,024 558,204 565,644 536,617 461,741
Communications 777,618 751,792 808,140 727,856 814,682 741,821 648,163 651,726 595,018 477,917
Operations 1,211,335 1,127,924 1,069,994 984,061 1,004,747 919,665 938,333 906,909 923,735 987,559
Ground transportation 2,573,877 2,608,835 2,685,399 2,701,382 2,722,685 2,771,980 2,586,828 2,850,381 3,360,378 3,822,417
Terminal Services 237,313 334,352 256,996 227,699 222,382 123,352 - - - -
Subtotal 49,599,522 48,738,671 47,992,595 44,009,519 42,129,717 36,202,078 33,585,016 33,232,391 30,081,662 28,913,229
Depreciation 48,678,489 49,359,167 47,095,977 47,523,955 39,245,679 33,505,153 32,581,129 28,548,381 25,845,025 21,404,074
Total operating expenses 98,278,011 98,097,838 95,088,572 91,533,474 81,375,396 69,707,231 66,166,145 61,780,772 55,926,687 50,317,303
Operating income (loss) (233,275) (3,713,290) (5,468,794) (4,364,557) 4,856,794 18,651,532 17,456,208 12,612,207 14,553,067 16,756,844
Non-operating revenues (expenses)
Investment interest income 2,054,048 2,148,101 2,500,267 3,750,839 5,592,912 8,507,396 5,484,164 4,015,127 1,931,286 1,721,408
Passenger Facility Charges 18,734,688 18,424,026 18,818,814 18,940,075 19,710,529 24,006,372 20,965,795 20,632,549 15,324,824 11,300,707
Net decrease in fair value of investments 781,419 241,068 (404,171) (404,147) (40,516) 771,553 718,703 160,248 (1,119,050) (47,236)
Bond interest expense, net (27,933,517) (29,077,558) (25,491,187) (22,663,862) (15,989,551) (15,239,195) (9,556,465) (9,878,616) (9,727,743) (3,078,837)
Loss on disposal of airport facilities - - - - - - - - (219,042) -
Loss on swap termination - (1,465,749) (34,350,297) - (4,543,541) - - - - -
Amortization of deferred expenses related
to 2001A refunding - - (5,392,913) - - - - - - -
Other, net 408,133 729,996 873,263 487,820 626,545 206,670 372,260 314,989 852,613 408,037
Total non-operating revenues (expenses) (5,955,229) (9,000,116) (43,446,224) 110,725 5,356,378 18,252,796 17,984,457 15,244,297 7,042,888 10,304,079
Income (loss) before capital contributions (6,188,504) (12,713,406) (48,915,018) (4,253,832) 10,213,172 36,904,328 35,440,665 27,856,504 21,595,955 27,060,923
Capital contributions 5,475,352 644,240 6,669,348 11,518,926 5,677,385 50,000 2,285,672 19,219,885 17,829,840 11,193,427
Increase (decrease) in net position (713,152) (12,069,166) (42,245,670) 7,265,094 15,890,557 36,954,328 37,726,337 47,076,389 39,425,795 38,254,350
Net position, beginning of year 421,513,465$ 433,582,631 484,376,632 477,111,538 461,220,981 424,266,653 386,540,316 339,463,927 300,038,132 261,783,782
Net position, end of year 420,800,313$ 421,513,465$ 442,130,962$ 484,376,632$ 477,111,538$ 461,220,981$ 424,266,653$ 386,540,316$ 339,463,927$ 300,038,132$
Note:
Due to Raleigh-Durham Airport Authority's required adoption of GASB 63 & 65 during FY2013, the Net Position for FY2012 have been re-stated for comparative financial statements.
RALEIGH-DURHAM AIRPORT AUTHORITY
STATEMENTS OF REVENUES, EXPENSES, AND CHANGES IN NET POSITION
Last Ten Fiscal Years
92
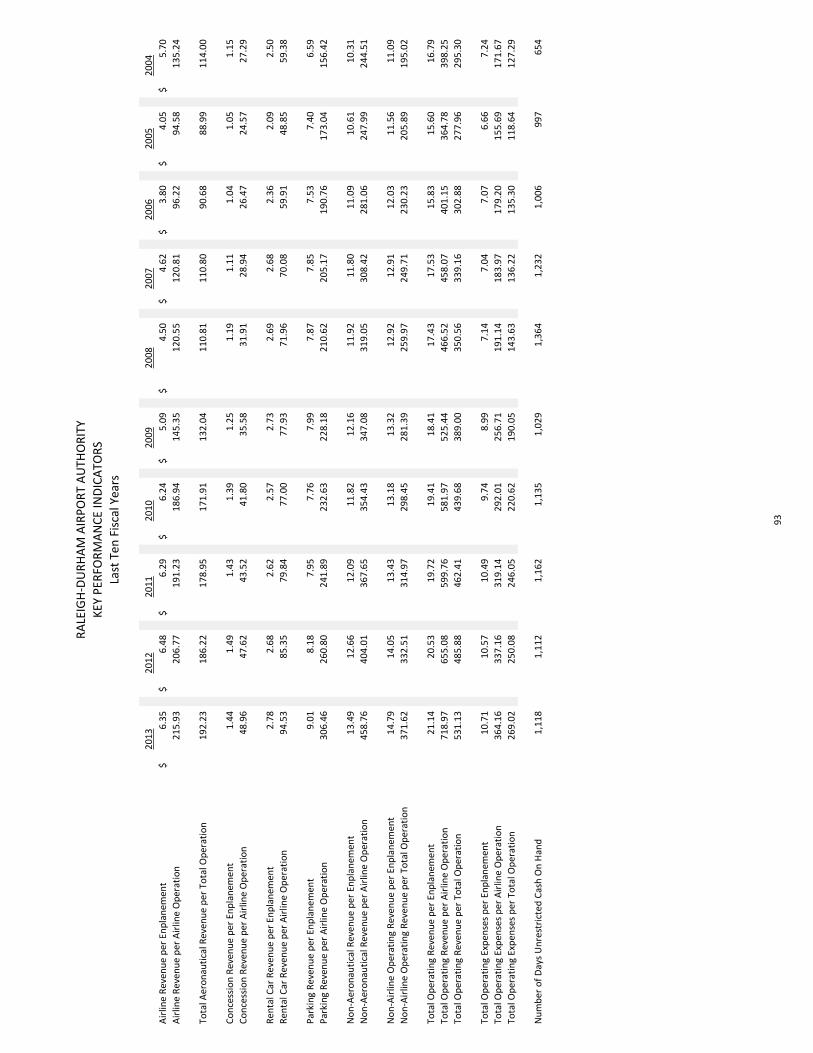
20
13
20
12
20
11
20
10
20
09
20
08
20
07
20
06
20
05
20
04
Air
line
Rev
enu
ep
erEn
pla
nem
ent
6.3
5$
6.4
8$
6.2
9$
6.2
4$
5.0
9$
4.5
0$
4.6
2$
3.8
0$
4.0
5$
5.7
0$
Air
line
Rev
enu
ep
erA
irlin
eO
per
atio
n2
15
.93
20
6.7
71
91
.23
18
6.9
41
45
.35
12
0.5
51
20
.81
96
.22
94
.58
13
5.2
4
Tota
lAer
on
auti
calR
even
ue
per
Tota
lOp
erat
ion
19
2.2
31
86
.22
17
8.9
51
71
.91
13
2.0
41
10
.81
11
0.8
09
0.6
88
8.9
91
14
.00
Co
nce
ssio
nR
even
ue
per
Enp
lan
emen
t1
.44
1.4
91
.43
1.3
91
.25
1.1
91
.11
1.0
41
.05
1.1
5
Co
nce
ssio
nR
even
ue
per
Air
line
Op
erat
ion
48
.96
47
.62
43
.52
41
.80
35
.58
31
.91
28
.94
26
.47
24
.57
27
.29
Ren
talC
arR
even
ue
per
Enp
lan
emen
t2
.78
2.6
82
.62
2.5
72
.73
2.6
92
.68
2.3
62
.09
2.5
0
Ren
talC
arR
even
ue
per
Air
line
Op
erat
ion
94
.53
85
.35
79
.84
77
.00
77
.93
71
.96
70
.08
59
.91
48
.85
59
.38
Par
kin
gR
even
ue
per
Enp
lan
emen
t9
.01
8.1
87
.95
7.7
67
.99
7.8
77
.85
7.5
37
.40
6.5
9
Par
kin
gR
even
ue
per
Air
line
Op
erat
ion
30
6.4
62
60
.80
24
1.8
92
32
.63
22
8.1
82
10
.62
20
5.1
71
90
.76
17
3.0
41
56
.42
No
n-A
ero
nau
tica
lRev
enu
ep
erEn
pla
nem
ent
13
.49
12
.66
12
.09
11
.82
12
.16
11
.92
11
.80
11
.09
10
.61
10
.31
No
n-A
ero
nau
tica
lRev
enu
ep
erA
irlin
eO
per
atio
n4
58
.76
40
4.0
13
67
.65
35
4.4
33
47
.08
31
9.0
53
08
.42
28
1.0
62
47
.99
24
4.5
1
No
n-A
irlin
eO
per
atin
gR
even
ue
per
Enp
lan
emen
t1
4.7
91
4.0
51
3.4
31
3.1
81
3.3
21
2.9
21
2.9
11
2.0
31
1.5
61
1.0
9
No
n-A
irlin
eO
per
atin
gR
even
ue
per
Tota
lOp
erat
ion
37
1.6
23
32
.51
31
4.9
72
98
.45
28
1.3
92
59
.97
24
9.7
12
30
.23
20
5.8
91
95
.02
Tota
lOp
erat
ing
Rev
enu
ep
erEn
pla
nem
ent
21
.14
20
.53
19
.72
19
.41
18
.41
17
.43
17
.53
15
.83
15
.60
16
.79
Tota
lOp
erat
ing
Rev
enu
ep
erA
irlin
eO
per
atio
n7
18
.97
65
5.0
85
99
.76
58
1.9
75
25
.44
46
6.5
24
58
.07
40
1.1
53
64
.78
39
8.2
5
Tota
lOp
erat
ing
Rev
enu
ep
erTo
talO
per
atio
n5
31
.13
48
5.8
84
62
.41
43
9.6
83
89
.00
35
0.5
63
39
.16
30
2.8
82
77
.96
29
5.3
0
Tota
lOp
erat
ing
Exp
ense
sp
erEn
pla
nem
ent
10
.71
10
.57
10
.49
9.7
48
.99
7.1
47
.04
7.0
76
.66
7.2
4
Tota
lOp
erat
ing
Exp
ense
sp
erA
irlin
eO
per
atio
n3
64
.16
33
7.1
63
19
.14
29
2.0
12
56
.71
19
1.1
41
83
.97
17
9.2
01
55
.69
17
1.6
7
Tota
lOp
erat
ing
Exp
ense
sp
erTo
talO
per
atio
n2
69
.02
25
0.0
82
46
.05
22
0.6
21
90
.05
14
3.6
31
36
.22
13
5.3
01
18
.64
12
7.2
9
Nu
mb
ero
fD
ays
Un
rest
rict
edC
ash
On
Han
d1
,11
81
,11
21
,16
21
,13
51
,02
91
,36
41
,23
21
,00
69
97
65
4
RA
LEIG
H-D
UR
HA
MA
IRP
OR
TA
UTH
OR
ITY
KEY
PER
FOR
MA
NC
EIN
DIC
ATO
RS
Last
Ten
Fisc
alYe
ars
93
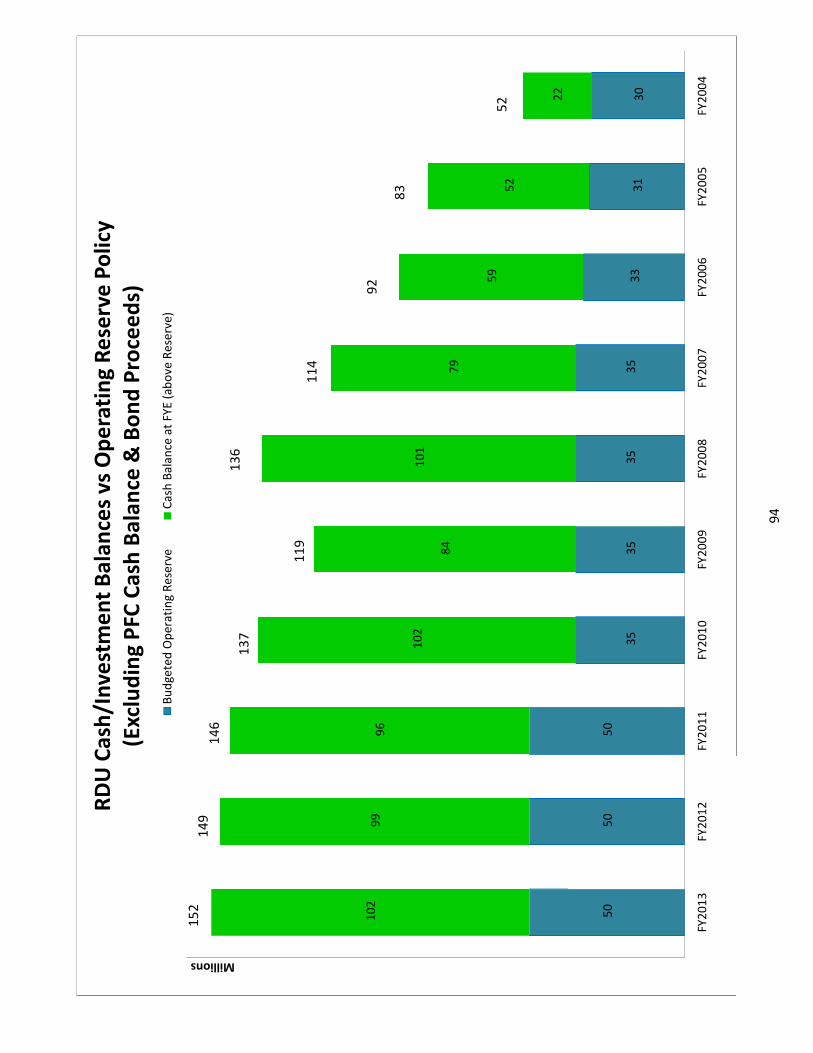
94
50
50
50
35
35
35
35
33
31
30
10
29
99
6
10
2
84
10
1
79
59
52
22
FY2
01
3FY
20
12
FY2
01
1FY
20
10
FY2
00
9FY
20
08
FY2
00
7FY
20
06
FY2
00
5FY
20
04
Millions
RD
UC
ash
/In
vest
me
nt
Bal
ance
svs
Op
era
tin
gR
ese
rve
Po
licy
(Exc
lud
ing
PFC
Cas
hB
alan
ce&
Bo
nd
Pro
cee
ds)
Bu
dge
ted
Op
erat
ing
Re
serv
eC
ash
Bal
ance
atFY
E(a
bo
veR
ese
rve)
15
21
49
14
6
13
7
11
9
13
6
11
4
92
83
52
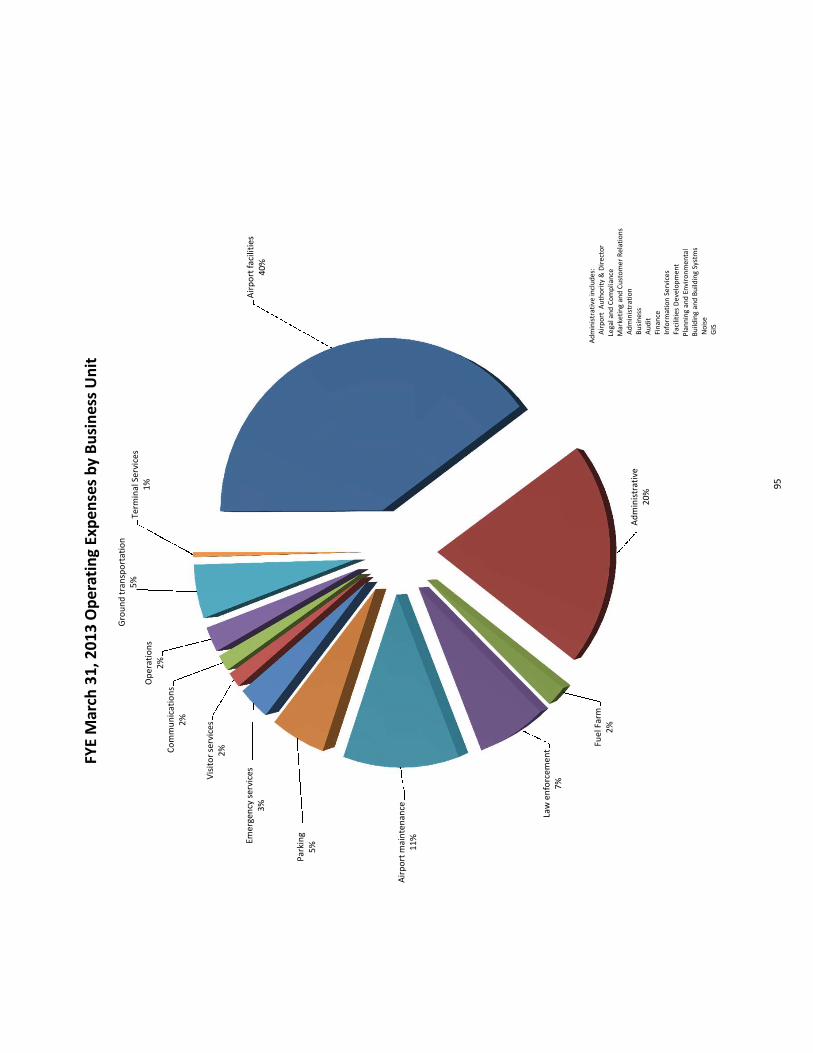
Air
po
rtfa
cilit
ies
40
%
Ad
min
istr
ativ
e2
0%
Fuel
Farm
2%
Law
en
forc
eme
nt
7%
Air
po
rtm
ain
ten
ance
11
%
Par
kin
g5
%Emer
gen
cyse
rvic
es
3%
Vis
ito
rse
rvic
es
2%Co
mm
un
icat
ion
s2
%
Op
erat
ion
s2
%
Gro
un
dtr
ansp
ort
atio
n5
%Te
rmin
alSe
rvic
es1
%
FYE
Mar
ch3
1,2
01
3O
per
atin
gEx
pen
ses
by
Bu
sin
ess
Un
it
Ad
min
istr
ativ
ein
clu
des
:A
irp
ort
Au
tho
rity
&D
irec
tor
Lega
lan
dC
om
plia
nce
Mar
keti
ng
and
Cu
sto
mer
Rel
atio
ns
Ad
min
istr
atio
nB
usi
nes
sA
ud
itFi
nan
ceIn
form
atio
nSe
rvic
esFa
cilit
ies
Dev
elo
pm
ent
Pla
nn
ing
and
Envi
ron
men
tal
Bu
ildin
gan
dB
uild
ing
Syst
ms
No
ise
GIS
95
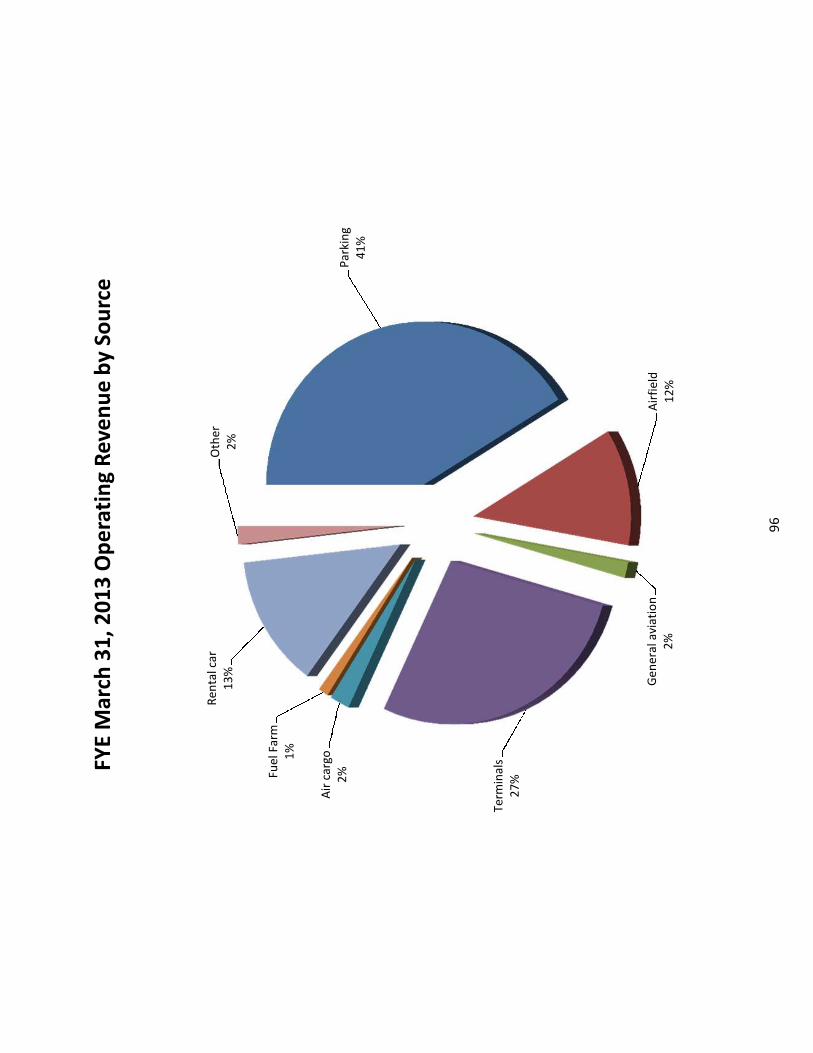
96
Par
kin
g4
1%
Air
fiel
d1
2%
Gen
eral
avia
tio
n2
%
Term
inal
s2
7%
Air
carg
o2
%Fuel
Farm
1%
Ren
talc
ar1
3%
Oth
er2
%
FYE
Mar
ch3
1,2
01
3O
pe
rati
ng
Re
ven
ue
by
Sou
rce
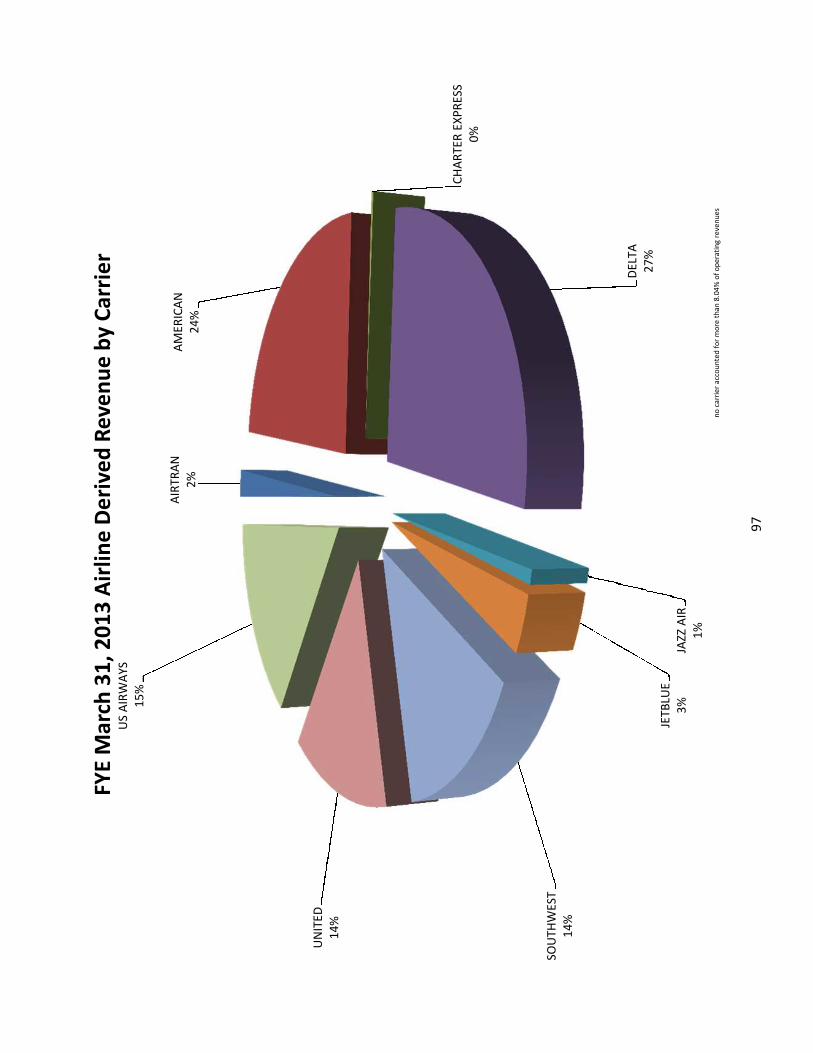
97
AIR
TRA
N2
%A
MER
ICA
N2
4%
CH
AR
TER
EXP
RES
S0
%
DEL
TA2
7%
JAZZ
AIR
1%
JETB
LUE
3%
SOU
THW
EST
14
%
UN
ITED
14
%
US
AIR
WA
YS1
5%
FYE
Mar
ch3
1,2
01
3A
irlin
eD
eri
ved
Re
ven
ue
by
Car
rie
r
no
carr
ier
acco
un
ted
for
mo
reth
an8.
04%
of
op
erat
ing
reve
nu
es
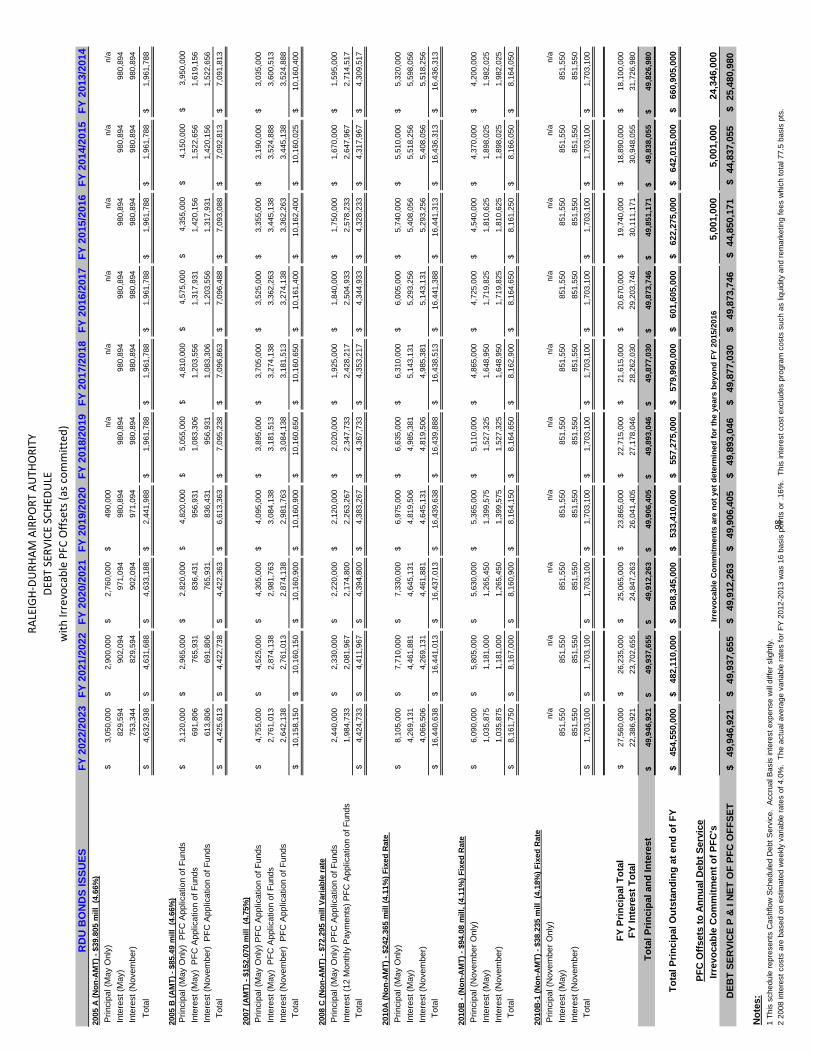
RD
UB
ON
DS
ISS
UE
SF
Y2022/2
023
FY
2021/2
022
FY
2020/2
021
FY
2019/2
020
FY
2018/2
019
FY
2017/2
018
FY
2016/2
017
FY
2015/2
016
FY
2014/2
015
FY
2013/2
014
2005
A(N
on
-AM
T)
-$39.8
05
mil
l(4
.66%
)
Pri
nci
pal(M
ay
Only
)3,0
50,0
00
$2,9
00,0
00
$2,7
60,0
00
$490,0
00
$n/a
n/a
n/a
n/a
n/a
n/a
Inte
rest
(May)
829,5
94
902,0
94
971,0
94
980,8
94
980,8
94
980,8
94
980,8
94
980,8
94
980,8
94
980,8
94
Inte
rest
(Nove
mber)
753,3
44
829,5
94
902,0
94
971,0
94
980,8
94
980,8
94
980,8
94
980,8
94
980,8
94
980,8
94
Tota
l4,6
32,9
38
$4,6
31,6
88
$4,6
33,1
88
$2,4
41,9
88
$1,9
61,7
88
$1,9
61,7
88
$1,9
61,7
88
$1,9
61,7
88
$1,9
61,7
88
$1,9
61,7
88
$
2005
B(A
MT
)-
$85.4
9m
ill
(4.6
6%
)
Pri
nci
pal(M
ay
Only
)P
FC
Applic
ation
ofF
unds
3,1
20,0
00
$2,9
65,0
00
$2,8
20,0
00
$4,8
20,0
00
$5,0
55,0
00
$4,8
10,0
00
$4,5
75,0
00
$4,3
55,0
00
$4,1
50,0
00
$3,9
50,0
00
$
Inte
rest
(May)
PF
CA
pplic
ation
ofF
unds
691,8
06
765,9
31
836,4
31
956,9
31
1,0
83,3
06
1,2
03,5
56
1,3
17,9
31
1,4
20,1
56
1,5
22,6
56
1,6
19,1
56
Inte
rest
(Nove
mber)
PF
CA
pplic
ation
ofF
unds
613,8
06
691,8
06
765,9
31
836,4
31
956,9
31
1,0
83,3
06
1,2
03,5
56
1,3
17,9
31
1,4
20,1
56
1,5
22,6
56
Tota
l4,4
25,6
13
$4,4
22,7
38
$4,4
22,3
63
$6,6
13,3
63
$7,0
95,2
38
$7,0
96,8
63
$7,0
96,4
88
$7,0
93,0
88
$7,0
92,8
13
$7,0
91,8
13
$
2007
(AM
T)
-$152.0
70
mil
l(4
.75%
)
Pri
nci
pal(M
ay
Only
)P
FC
Applic
ation
ofF
unds
4,7
55,0
00
$4,5
25,0
00
$4,3
05,0
00
$4,0
95,0
00
$3,8
95,0
00
$3,7
05,0
00
$3,5
25,0
00
$3,3
55,0
00
$3,1
90,0
00
$3,0
35,0
00
$
Inte
rest
(May)
PF
CA
pplic
ation
ofF
unds
2,7
61,0
13
2,8
74,1
38
2,9
81,7
63
3,0
84,1
38
3,1
81,5
13
3,2
74,1
38
3,3
62,2
63
3,4
45,1
38
3,5
24,8
88
3,6
00,5
13
Inte
rest
(Nove
mber)
PF
CA
pplic
ation
ofF
unds
2,6
42,1
38
2,7
61,0
13
2,8
74,1
38
2,9
81,7
63
3,0
84,1
38
3,1
81,5
13
3,2
74,1
38
3,3
62,2
63
3,4
45,1
38
3,5
24,8
88
Tota
l10,1
58,1
50
$10,1
60,1
50
$10,1
60,9
00
$10,1
60,9
00
$10,1
60,6
50
$10,1
60,6
50
$10,1
61,4
00
$10,1
62,4
00
$10,1
60,0
25
$10,1
60,4
00
$
2008
C(N
on
-AM
T)
-$72.2
95
mil
lV
ari
ab
lera
te
Pri
nci
pal(M
ay
Only
)P
FC
Applic
ation
ofF
unds
2,4
40,0
00
2,3
30,0
00
$2,2
20,0
00
$2,1
20,0
00
$2,0
20,0
00
$1,9
25,0
00
$1,8
40,0
00
$1,7
50,0
00
$1,6
70,0
00
$1,5
95,0
00
$
Inte
rest
(12
Month
lyP
aym
ents
)P
FC
Applic
ation
ofF
unds
1,9
84,7
33
2,0
81,9
67
2,1
74,8
00
2,2
63,2
67
2,3
47,7
33
2,4
28,2
17
2,5
04,9
33
2,5
78,2
33
2,6
47,9
67
2,7
14,5
17
Tota
l4,4
24,7
33
$4,4
11,9
67
$4,3
94,8
00
$4,3
83,2
67
$4,3
67,7
33
$4,3
53,2
17
$4,3
44,9
33
$4,3
28,2
33
$4,3
17,9
67
$4,3
09,5
17
$
2010A
(No
n-A
MT
)-
$242.3
65
mil
l(4
.11%
)F
ixed
Rate
Pri
nci
pal(M
ay
Only
)8,1
05,0
00
$7,7
10,0
00
$7,3
30,0
00
$6,9
75,0
00
$6,6
35,0
00
$6,3
10,0
00
$6,0
05,0
00
$5,7
40,0
00
$5,5
10,0
00
$5,3
20,0
00
$
Inte
rest
(May)
4,2
69,1
31
4,4
61,8
81
4,6
45,1
31
4,8
19,5
06
4,9
85,3
81
5,1
43,1
31
5,2
93,2
56
5,4
08,0
56
5,5
18,2
56
5,5
98,0
56
Inte
rest
(Nove
mber)
4,0
66,5
06
4,2
69,1
31
4,4
61,8
81
4,6
45,1
31
4,8
19,5
06
4,9
85,3
81
5,1
43,1
31
5,2
93,2
56
5,4
08,0
56
5,5
18,2
56
Tota
l16,4
40,6
38
$16,4
41,0
13
$16,4
37,0
13
$16,4
39,6
38
$16,4
39,8
88
$16,4
38,5
13
$16,4
41,3
88
$16,4
41,3
13
$16,4
36,3
13
$16,4
36,3
13
$
2010B
-(N
on
-AM
T)
-$94.0
8m
ill,
(4.1
1%
)F
ixed
Rate
Pri
nci
pal(N
ove
mber
Only
)6,0
90,0
00
$5,8
05,0
00
$5,6
30,0
00
$5,3
65,0
00
$5,1
10,0
00
$4,8
65,0
00
$4,7
25,0
00
$4,5
40,0
00
$4,3
70,0
00
$4,2
00,0
00
$
Inte
rest
(May)
1,0
35,8
75
1,1
81,0
00
1,2
65,4
50
1,3
99,5
75
1,5
27,3
25
1,6
48,9
50
1,7
19,8
25
1,8
10,6
25
1,8
98,0
25
1,9
82,0
25
Inte
rest
(Nove
mber)
1,0
35,8
75
1,1
81,0
00
1,2
65,4
50
1,3
99,5
75
1,5
27,3
25
1,6
48,9
50
1,7
19,8
25
1,8
10,6
25
1,8
98,0
25
1,9
82,0
25
Tota
l8,1
61,7
50
$8,1
67,0
00
$8,1
60,9
00
$8,1
64,1
50
$8,1
64,6
50
$8,1
62,9
00
$8,1
64,6
50
$8,1
61,2
50
$8,1
66,0
50
$8,1
64,0
50
$
2010B
-1(N
on
-AM
T)
-$38.2
35
mil
l(4
.18%
)F
ixed
Rate
Pri
nci
pal(N
ove
mber
Only
)n/a
n/a
n/a
n/a
n/a
n/a
n/a
n/a
n/a
n/a
Inte
rest
(May)
851,5
50
851,5
50
851,5
50
851,5
50
851,5
50
851,5
50
851,5
50
851,5
50
851,5
50
851,5
50
Inte
rest
(Nove
mber)
851,5
50
851,5
50
851,5
50
851,5
50
851,5
50
851,5
50
851,5
50
851,5
50
851,5
50
851,5
50
Tota
l1,7
03,1
00
$1,7
03,1
00
$1,7
03,1
00
$1,7
03,1
00
$1,7
03,1
00
$1,7
03,1
00
$1,7
03,1
00
$1,7
03,1
00
$1,7
03,1
00
$1,7
03,1
00
$
FY
Pri
ncip
al
To
tal
27,5
60,0
00
$26,2
35,0
00
$25,0
65,0
00
$23,8
65,0
00
$22,7
15,0
00
$21,6
15,0
00
$20,6
70,0
00
$19,7
40,0
00
$18,8
90,0
00
$18,1
00,0
00
$
FY
Inte
rest
To
tal
22,3
86,9
21
23,7
02,6
55
24,8
47,2
63
26,0
41,4
05
27,1
78,0
46
28,2
62,0
30
29,2
03,7
46
30,1
11,1
71
30,9
48,0
55
31,7
26,9
80
To
tal
Pri
ncip
al
an
dIn
tere
st
49,9
46,9
21
$49,9
37,6
55
$49,9
12,2
63
$49,9
06,4
05
$49,8
93,0
46
$49,8
77,0
30
$49,8
73,7
46
$49,8
51,1
71
$49,8
38,0
55
$49,8
26,9
80
$
To
tal
Pri
ncip
al
Ou
tsta
nd
ing
at
en
do
fF
Y454,5
50,0
00
$482,1
10,0
00
$508,3
45,0
00
$533,4
10,0
00
$557,2
75,0
00
$579,9
90,0
00
$601,6
05,0
00
$622,2
75,0
00
$642,0
15,0
00
$660,9
05,0
00
$
PF
CO
ffsets
toA
nn
ual
Deb
tS
erv
ice
Irre
vo
cab
leC
om
mit
men
to
fP
FC
'sIr
revo
cab
leC
om
mit
men
tsare
no
tyet
dete
rmin
ed
for
the
years
beyo
nd
FY
2015/2
016
5,0
01,0
00
5,0
01,0
00
24,3
46,0
00
DE
BT
SE
RV
ICE
P&
IN
ET
OF
PF
CO
FF
SE
T49,9
46,9
21
$49,9
37,6
55
$49,9
12,2
63
$49,9
06,4
05
$49,8
93,0
46
$49,8
77,0
30
$49,8
73,7
46
$44,8
50,1
71
$44,8
37,0
55
$25,4
80,9
80
$
No
tes:
1T
his
schedule
repre
sents
Cashflo
wS
chedule
dD
ebt
Serv
ice.
Accru
alB
asis
inte
rest
exp
ense
will
diff
er
slig
htly
.
22008
inte
rest
costs
are
based
on
estim
ate
dw
eekl
yvariable
rate
sof
4.0
%.
The
actu
ala
vera
ge
variable
rate
sfo
rF
Y2012-2
013
was
16
basis
poin
tsor
.16%
.T
his
inte
rest
cost
exc
ludes
pro
gra
mcosts
such
as
liquid
ityand
rem
ark
etin
gfe
es
whic
hto
tal7
7.5
basis
pts
.
RA
LEIG
H-D
UR
HA
MA
IRP
OR
TA
UTH
OR
ITY
DEB
TSE
RV
ICE
SCH
EDU
LE
wit
hIr
revo
cab
leP
FCO
ffse
ts(a
sco
mm
itte
d)
98
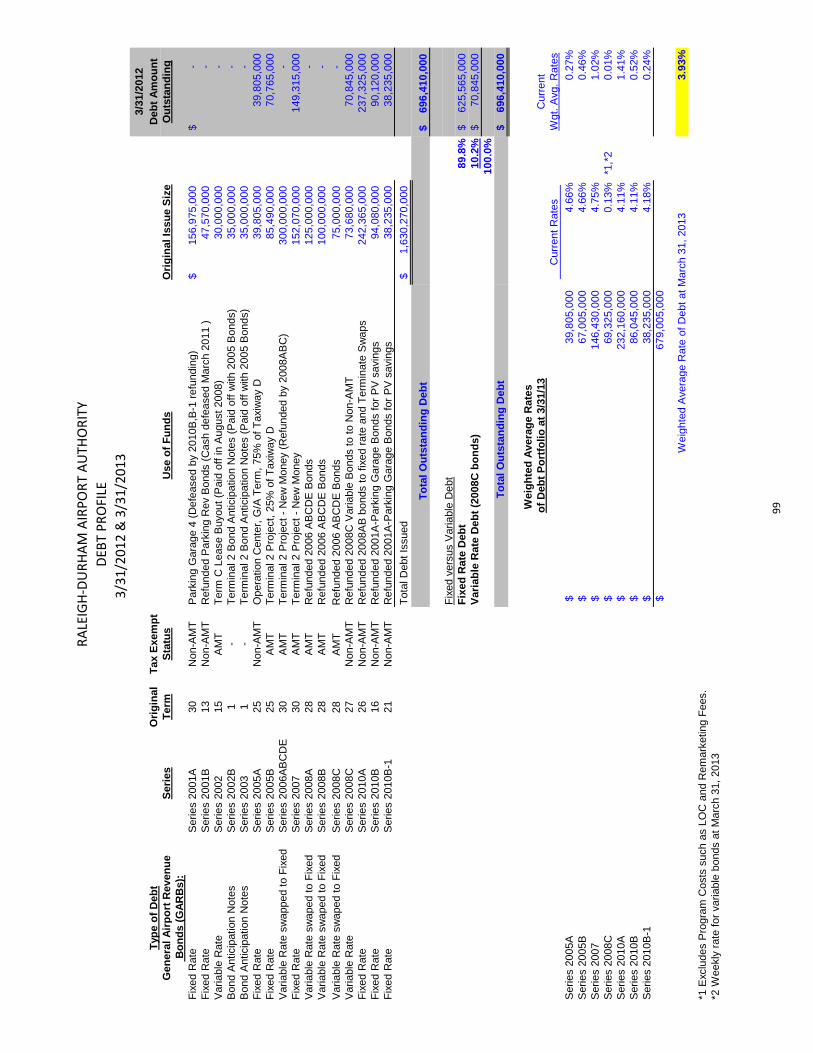
RA
LEIG
H-D
UR
HA
MA
IRP
OR
TA
UTH
OR
ITY
DEB
TP
RO
FILE
3/3
1/2
01
2&
3/3
1/2
01
33/3
1/2
012
Typ
eo
fD
eb
tO
rig
inal
Tax
Exem
pt
Deb
tA
mo
un
tG
en
era
lA
irp
ort
Reven
ue
Seri
es
Term
Sta
tus
Use
of
Fu
nd
sO
rig
inal
Issu
eS
ize
Ou
tsta
nd
ing
Bo
nd
s(G
AR
Bs):
Fix
ed
Rate
Series
2001A
30
Non-A
MT
Park
ing
Gara
ge
4(D
efe
ased
by
2010B
,B-1
refu
ndin
g)
156,9
75,0
00
$-
$F
ixed
Rate
Series
2001B
13
Non-A
MT
Refu
nded
Park
ing
Rev
Bonds
(Cash
defe
ased
Marc
h2011
)47,5
70,0
00
-V
ariable
Rate
Series
2002
15
AM
TT
erm
CLease
Buyo
ut
(Paid
off
inA
ugust
2008)
30,0
00,0
00
-B
ond
Anticip
ation
Note
sS
eries
2002B
1-
Term
inal2
Bond
Anticip
ation
Note
s(P
aid
off
with
2005
Bonds)
35,0
00,0
00
-B
ond
Anticip
ation
Note
sS
eries
2003
1-
Term
inal2
Bond
Anticip
ation
Note
s(P
aid
off
with
2005
Bonds)
35,0
00,0
00
-F
ixed
Rate
Series
2005A
25
Non-A
MT
Opera
tion
Cente
r,G
/AT
erm
,75%
of
Taxi
way
D39,8
05,0
00
39,8
05,0
00
Fix
ed
Rate
Series
2005B
25
AM
TT
erm
inal2
Pro
ject,
25%
of
Taxi
way
D85,4
90,0
00
70,7
65,0
00
Variable
Rate
sw
apped
toF
ixed
Series
2006A
BC
DE
30
AM
TT
erm
inal2
Pro
ject
-N
ew
Money
(Refu
nded
by
2008A
BC
)300,0
00,0
00
-F
ixed
Rate
Series
2007
30
AM
TT
erm
inal2
Pro
ject
-N
ew
Money
152,0
70,0
00
149,3
15,0
00
Variable
Rate
sw
aped
toF
ixed
Series
2008A
28
AM
TR
efu
nded
2006
AB
CD
EB
onds
125,0
00,0
00
-V
ariable
Rate
sw
aped
toF
ixed
Series
2008B
28
AM
TR
efu
nded
2006
AB
CD
EB
onds
100,0
00,0
00
-
Variable
Rate
sw
aped
toF
ixed
Series
2008C
28
AM
TR
efu
nded
2006
AB
CD
EB
onds
75,0
00,0
00
-V
ariable
Rate
Series
2008C
27
Non-A
MT
Refu
nded
2008C
Variable
Bonds
toto
Non-A
MT
73,6
80,0
00
70,8
45,0
00
Fix
ed
Rate
Series
2010A
26
Non-A
MT
Refu
nded
2008A
Bbonds
tofixe
dra
teand
Term
inate
Sw
aps
242,3
65,0
00
237,3
25,0
00
Fix
ed
Rate
Series
2010B
16
Non-A
MT
Refu
nded
2001A
-Park
ing
Gara
ge
Bonds
for
PV
savi
ngs
94,0
80,0
00
90,1
20,0
00
Fix
ed
Rate
Series
2010B
-121
Non-A
MT
Refu
nded
2001A
-Park
ing
Gara
ge
Bonds
for
PV
savi
ngs
38,2
35,0
00
38,2
35,0
00
Tota
lD
ebt
Issued
1,6
30,2
70,0
00
$
To
tal
Ou
tsta
nd
ing
Deb
t696,4
10,0
00
$
Fix
ed
vers
us
Variable
Debt
Fix
ed
Rate
Deb
t89.8
%625,5
65,0
00
$V
ari
ab
leR
ate
Deb
t(2
008C
bo
nd
s)
10.2
%70,8
45,0
00
$100.0
%T
ota
lO
uts
tan
din
gD
eb
t696,4
10,0
00
$
Weig
hte
dA
vera
ge
Rate
so
fD
eb
tP
ort
foli
oat
3/3
1/1
3C
urr
ent
Curr
ent
Rate
sW
gt.
Avg
.R
ate
s
Series
2005A
39,8
05,0
00
$4.6
6%
0.2
7%
Series
2005B
67,0
05,0
00
$4.6
6%
0.4
6%
Series
2007
146,4
30,0
00
$4.7
5%
1.0
2%
Series
2008C
69,3
25,0
00
$0.1
3%
*1,*
20.0
1%
Series
2010A
232,1
60,0
00
$4.1
1%
1.4
1%
Series
2010B
86,0
45,0
00
$4.1
1%
0.5
2%
Series
2010B
-138,2
35,0
00
$4.1
8%
0.2
4%
679,0
05,0
00
$
Weig
hte
dA
vera
ge
Rate
of
Debt
at
Marc
h31,
2013
3.9
3%
*1E
xclu
des
Pro
gra
mC
osts
such
as
LO
Cand
Rem
ark
eting
Fees.
*2W
eekly
rate
for
variable
bonds
at
Marc
h31,
2013
99
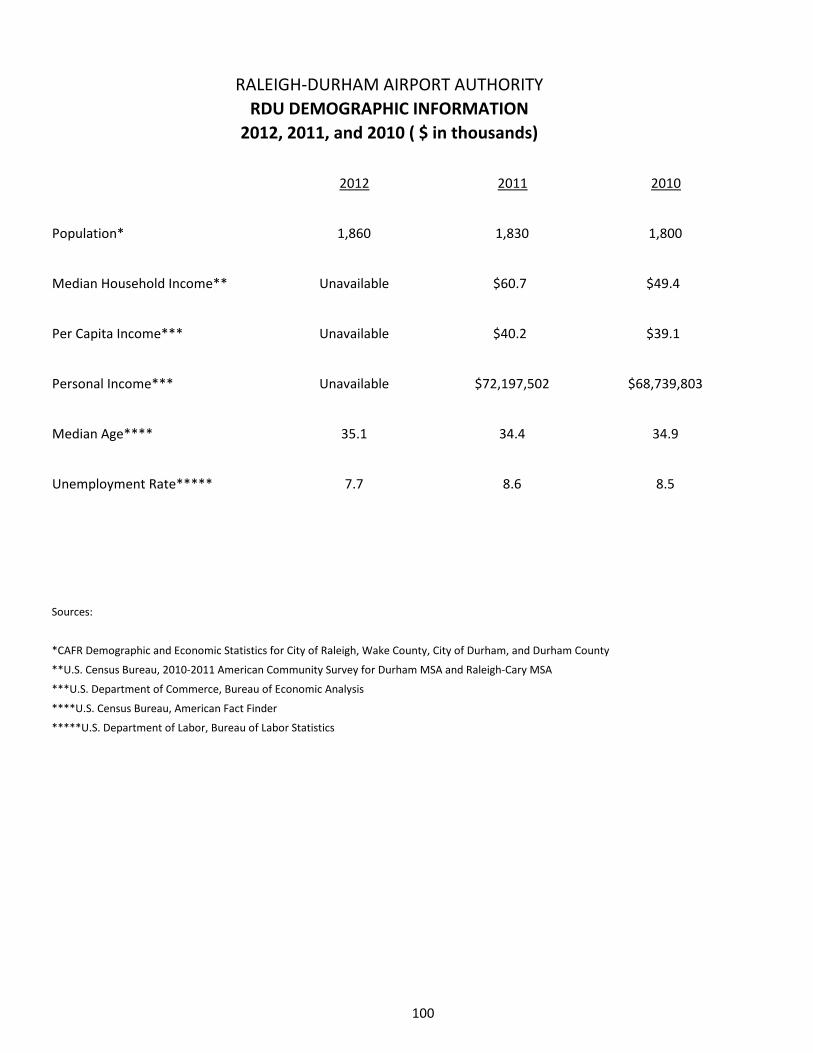
2012 2011 2010
Population* 1,860 1,830 1,800
Median Household Income** Unavailable $60.7 $49.4
Per Capita Income*** Unavailable $40.2 $39.1
Personal Income*** Unavailable $72,197,502 $68,739,803
Median Age**** 35.1 34.4 34.9
Unemployment Rate***** 7.7 8.6 8.5
Sources:
**U.S. Census Bureau, 2010-2011 American Community Survey for Durham MSA and Raleigh-Cary MSA
***U.S. Department of Commerce, Bureau of Economic Analysis
****U.S. Census Bureau, American Fact Finder
*****U.S. Department of Labor, Bureau of Labor Statistics
*CAFR Demographic and Economic Statistics for City of Raleigh, Wake County, City of Durham, and Durham County
RALEIGH-DURHAM AIRPORT AUTHORITY
RDU DEMOGRAPHIC INFORMATION
2012, 2011, and 2010 ( $ in thousands)
100
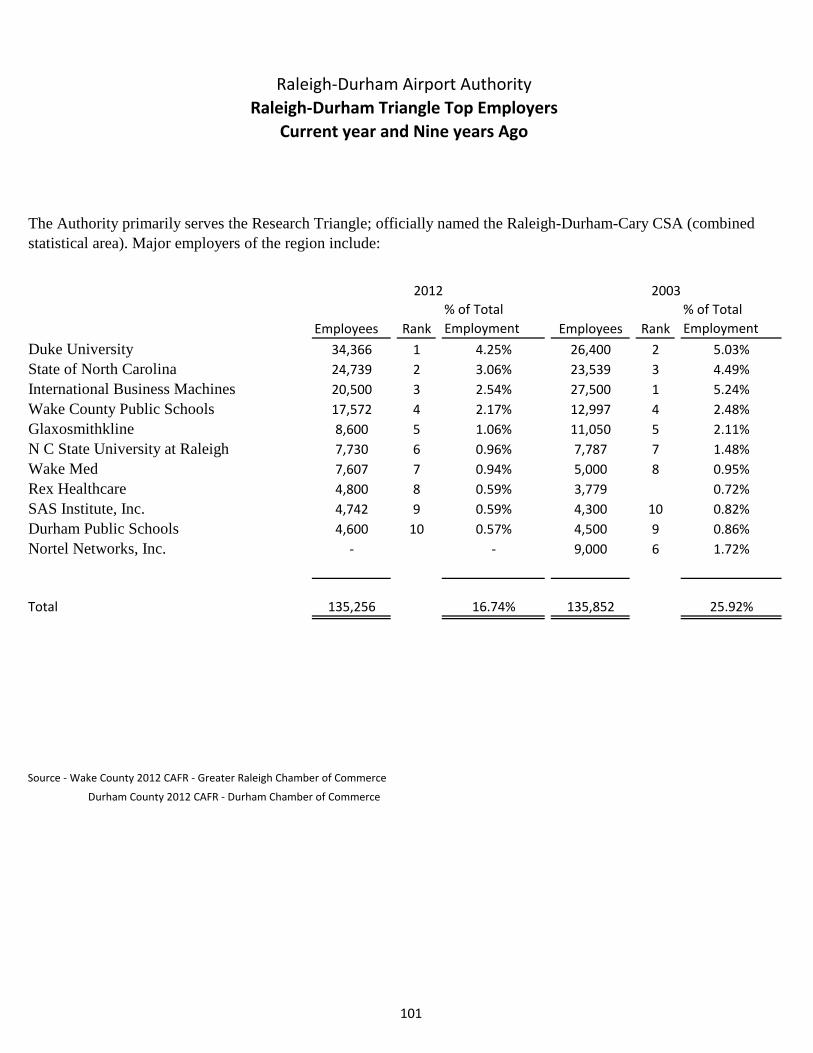
Employees Rank
% of Total
Employment Employees Rank
% of Total
Employment
Duke University 34,366 1 4.25% 26,400 2 5.03%
State of North Carolina 24,739 2 3.06% 23,539 3 4.49%
International Business Machines 20,500 3 2.54% 27,500 1 5.24%
Wake County Public Schools 17,572 4 2.17% 12,997 4 2.48%
Glaxosmithkline 8,600 5 1.06% 11,050 5 2.11%
N C State University at Raleigh 7,730 6 0.96% 7,787 7 1.48%
Wake Med 7,607 7 0.94% 5,000 8 0.95%
Rex Healthcare 4,800 8 0.59% 3,779 0.72%
SAS Institute, Inc. 4,742 9 0.59% 4,300 10 0.82%
Durham Public Schools 4,600 10 0.57% 4,500 9 0.86%
Nortel Networks, Inc. - - 9,000 6 1.72%
Total 135,256 16.74% 135,852 25.92%
Source - Wake County 2012 CAFR - Greater Raleigh Chamber of Commerce
Durham County 2012 CAFR - Durham Chamber of Commerce
Raleigh-Durham Airport Authority
2012 2003
The Authority primarily serves the Research Triangle; officially named the Raleigh-Durham-Cary CSA (combined
statistical area). Major employers of the region include:
Raleigh-Durham Triangle Top Employers
Current year and Nine years Ago
101
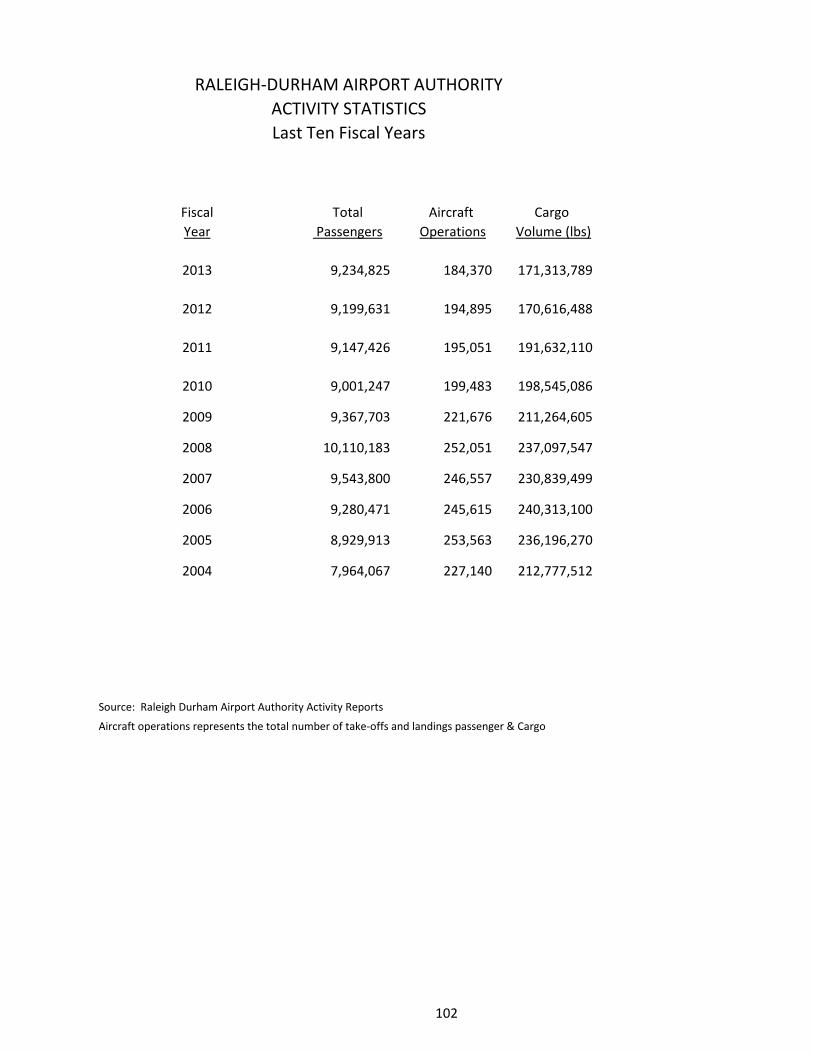
Fiscal Total Aircraft Cargo
Year Passengers Operations Volume (lbs)
2013 9,234,825 184,370 171,313,789
2012 9,199,631 194,895 170,616,488
2011 9,147,426 195,051 191,632,110
2010 9,001,247 199,483 198,545,086
2009 9,367,703 221,676 211,264,605
2008 10,110,183 252,051 237,097,547
2007 9,543,800 246,557 230,839,499
2006 9,280,471 245,615 240,313,100
2005 8,929,913 253,563 236,196,270
2004 7,964,067 227,140 212,777,512
Source: Raleigh Durham Airport Authority Activity Reports
Aircraft operations represents the total number of take-offs and landings passenger & Cargo
RALEIGH-DURHAM AIRPORT AUTHORITY
ACTIVITY STATISTICS
Last Ten Fiscal Years
102
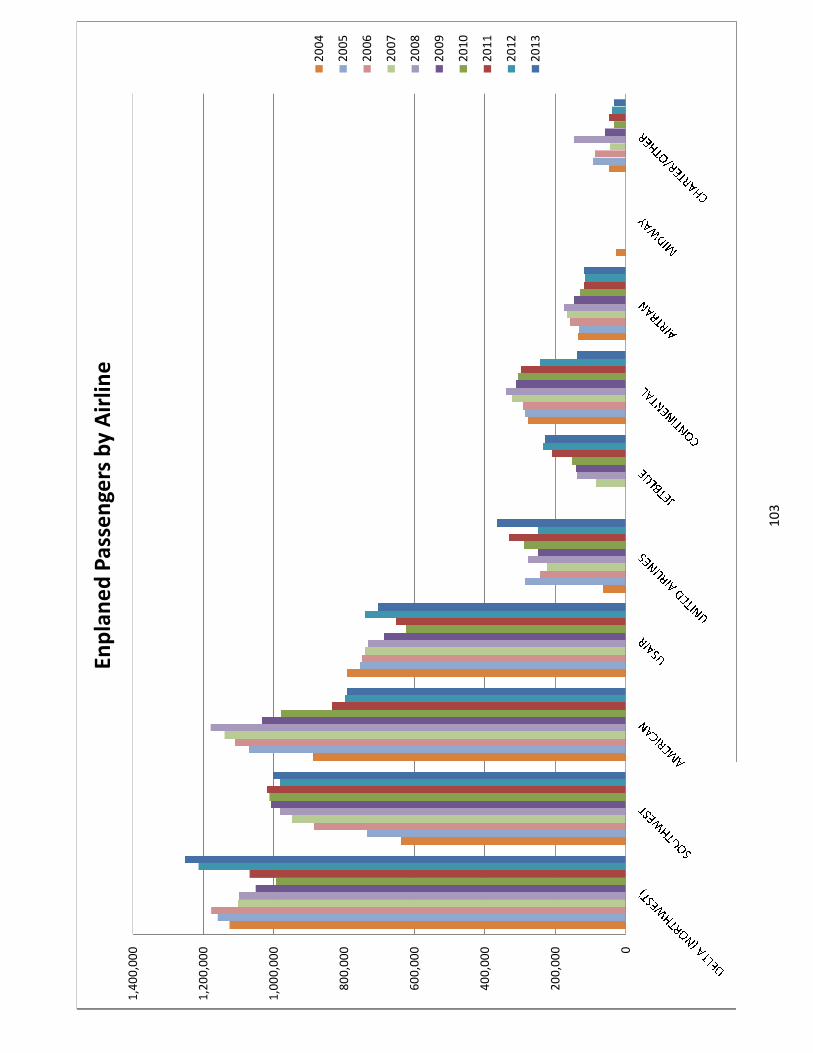
10
3
0
20
0,0
00
40
0,0
00
60
0,0
00
80
0,0
00
1,0
00
,00
0
1,2
00
,00
0
1,4
00
,00
0
Enp
lan
ed
Pas
sen
gers
by
Air
line
20
04
20
05
20
06
20
07
20
08
20
09
20
10
20
11
20
12
20
13
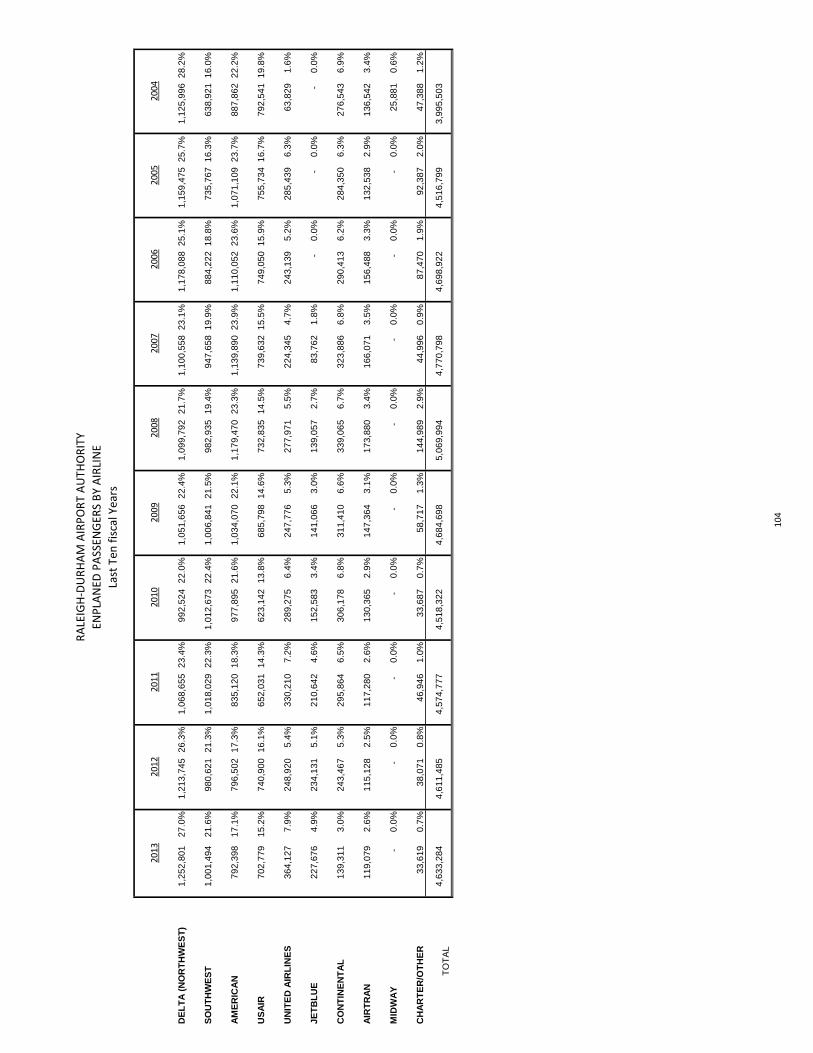
201
320
12
2011
2010
2009
2008
20
07
20
06
20
05
20
04
DE
LT
A(N
OR
TH
WE
ST
)1
,25
2,8
01
27
.0%
1,2
13
,74
52
6.3
%1
,06
8,6
55
23
.4%
99
2,5
24
22
.0%
1,0
51
,65
62
2.4
%1
,09
9,7
92
21
.7%
1,1
00
,55
82
3.1
%1
,17
8,0
88
25
.1%
1,1
59
,47
52
5.7
%1
,12
5,9
96
28
.2%
SO
UT
HW
ES
T1
,00
1,4
94
21
.6%
98
0,6
21
21
.3%
1,0
18
,02
92
2.3
%1
,01
2,6
73
22
.4%
1,0
06
,84
12
1.5
%9
82
,93
51
9.4
%9
47
,65
81
9.9
%8
84
,22
21
8.8
%7
35
,76
71
6.3
%6
38
,92
11
6.0
%
AM
ER
ICA
N7
92
,39
81
7.1
%7
96
,50
21
7.3
%8
35
,12
01
8.3
%9
77
,89
52
1.6
%1
,03
4,0
70
22
.1%
1,1
79
,47
02
3.3
%1
,13
9,8
90
23
.9%
1,1
10
,05
22
3.6
%1
,07
1,1
09
23
.7%
88
7,8
62
22
.2%
US
AIR
70
2,7
79
15
.2%
74
0,9
00
16
.1%
65
2,0
31
14
.3%
62
3,1
42
13
.8%
68
5,7
98
14
.6%
73
2,8
35
14
.5%
73
9,6
32
15
.5%
74
9,0
50
15
.9%
75
5,7
34
16
.7%
79
2,5
41
19
.8%
UN
ITE
DA
IRL
INE
S3
64
,12
77
.9%
24
8,9
20
5.4
%3
30
,21
07
.2%
28
9,2
75
6.4
%2
47
,77
65
.3%
27
7,9
71
5.5
%2
24
,34
54
.7%
24
3,1
39
5.2
%2
85
,43
96
.3%
63
,82
91
.6%
JE
TB
LU
E2
27
,67
64
.9%
23
4,1
31
5.1
%2
10
,64
24
.6%
15
2,5
83
3.4
%1
41
,06
63
.0%
13
9,0
57
2.7
%8
3,7
62
1.8
%-
0.0
%-
0.0
%-
0.0
%
CO
NT
INE
NT
AL
13
9,3
11
3.0
%2
43
,46
75
.3%
29
5,8
64
6.5
%3
06
,17
86
.8%
31
1,4
10
6.6
%3
39
,06
56
.7%
32
3,8
86
6.8
%2
90
,41
36
.2%
28
4,3
50
6.3
%2
76
,54
36
.9%
AIR
TR
AN
11
9,0
79
2.6
%1
15
,12
82
.5%
11
7,2
80
2.6
%1
30
,36
52
.9%
14
7,3
64
3.1
%1
73
,88
03
.4%
16
6,0
71
3.5
%1
56
,48
83
.3%
13
2,5
38
2.9
%1
36
,54
23
.4%
MID
WA
Y-
0.0
%-
0.0
%-
0.0
%-
0.0
%-
0.0
%-
0.0
%-
0.0
%-
0.0
%-
0.0
%2
5,8
81
0.6
%
CH
AR
TE
R/O
TH
ER
33
,61
90
.7%
38
,07
10
.8%
46
,94
61
.0%
33
,68
70
.7%
58
,71
71
.3%
14
4,9
89
2.9
%4
4,9
96
0.9
%8
7,4
70
1.9
%9
2,3
87
2.0
%4
7,3
88
1.2
%
TO
TA
L4
,63
3,2
84
4,6
11
,48
54
,57
4,7
77
4,5
18
,32
24
,68
4,6
98
5,0
69
,99
44
,77
0,7
98
4,6
98
,92
24
,51
6,7
99
3,9
95
,50
3
RA
LEIG
H-D
UR
HA
MA
IRP
OR
TA
UTH
OR
ITY
ENP
LAN
EDP
ASS
ENG
ERS
BY
AIR
LIN
E
Last
Ten
fisc
alYe
ars
104
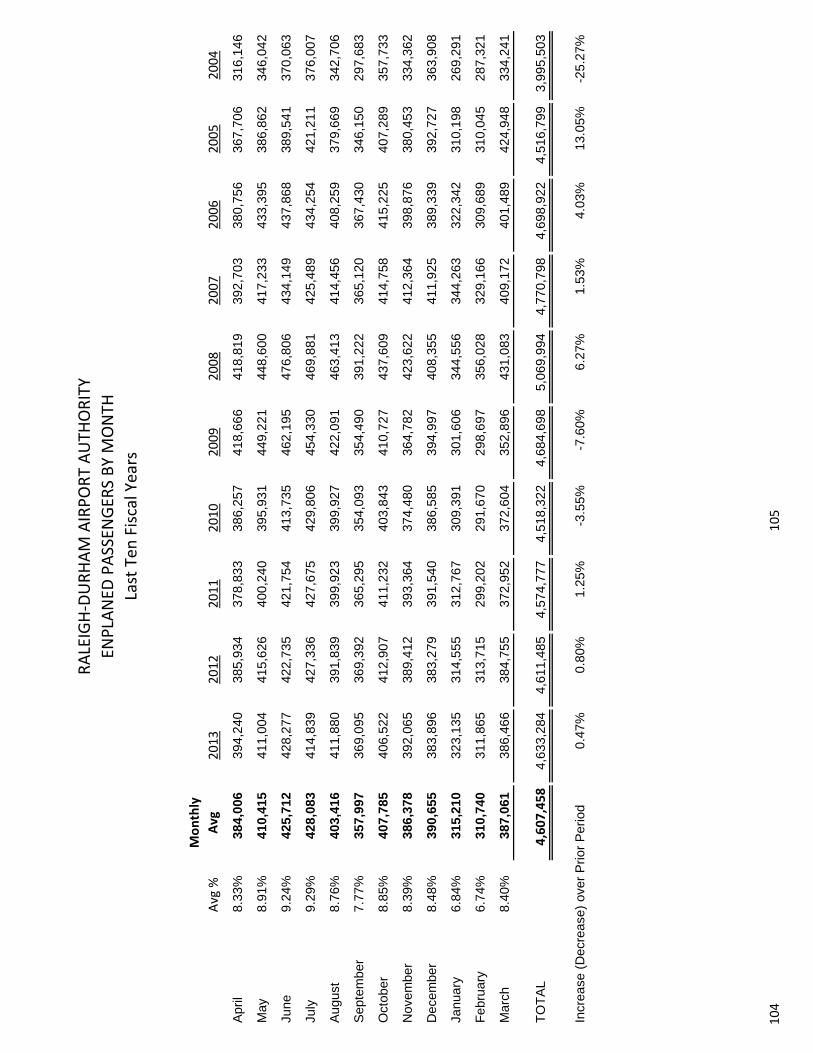
Avg
%
Mo
nth
ly
Avg
20
13
20
12
20
11
20
10
20
09
20
08
20
07
20
06
20
05
20
04
April
8.3
3%
384,0
06
394,2
40
385,9
34
378,8
33
386,2
57
418,6
66
418,8
19
392,7
03
380,7
56
367,7
06
316,1
46
May
8.9
1%
410,4
15
411,0
04
415,6
26
400,2
40
395,9
31
449,2
21
448,6
00
417,2
33
433,3
95
386,8
62
346,0
42
June
9.2
4%
425,7
12
428,2
77
422,7
35
421,7
54
413,7
35
462,1
95
476,8
06
434,1
49
437,8
68
389,5
41
370,0
63
July
9.2
9%
428,0
83
414,8
39
427,3
36
427,6
75
429,8
06
454,3
30
469,8
81
425,4
89
434,2
54
421,2
11
376,0
07
August
8.7
6%
403,4
16
411,8
80
391,8
39
399,9
23
399,9
27
422,0
91
463,4
13
414,4
56
408,2
59
379,6
69
342,7
06
Septe
mber
7.7
7%
357,9
97
369,0
95
369,3
92
365,2
95
354,0
93
354,4
90
391,2
22
365,1
20
367,4
30
346,1
50
297,6
83
Octo
ber
8.8
5%
407,7
85
406,5
22
412,9
07
411,2
32
403,8
43
410,7
27
437,6
09
414,7
58
415,2
25
407,2
89
357,7
33
Novem
ber
8.3
9%
386,3
78
392,0
65
389,4
12
393,3
64
374,4
80
364,7
82
423,6
22
412,3
64
398,8
76
380,4
53
334,3
62
Decem
ber
8.4
8%
390,6
55
383,8
96
383,2
79
391,5
40
386,5
85
394,9
97
408,3
55
411,9
25
389,3
39
392,7
27
363,9
08
January
6.8
4%
315,2
10
323,1
35
314,5
55
312,7
67
309,3
91
301,6
06
344,5
56
344,2
63
322,3
42
310,1
98
269,2
91
Febru
ary
6.7
4%
310,7
40
311,8
65
313,7
15
299,2
02
291,6
70
298,6
97
356,0
28
329,1
66
309,6
89
310,0
45
287,3
21
Marc
h8.4
0%
387,0
61
386,4
66
384,7
55
372,9
52
372,6
04
352,8
96
431,0
83
409,1
72
401,4
89
424,9
48
334,2
41
TO
TA
L4
,60
7,4
58
4,6
33,2
84
4,6
11,4
85
4,5
74,7
77
4,5
18,3
22
4,6
84,6
98
5,0
69,9
94
4,7
70,7
98
4,6
98,9
22
4,5
16,7
99
3,9
95,5
03
Incre
ase
(Decre
ase)
over
Prior
Period
0.4
7%
0.8
0%
1.2
5%
-3.5
5%
-7.6
0%
6.2
7%
1.5
3%
4.0
3%
13.0
5%
-25.2
7%
RA
LEIG
H-D
UR
HA
MA
IRP
OR
TA
UTH
OR
ITY
ENP
LAN
EDP
ASS
ENG
ERS
BY
MO
NTH
Last
Ten
Fisc
alYe
ars
10
41
05
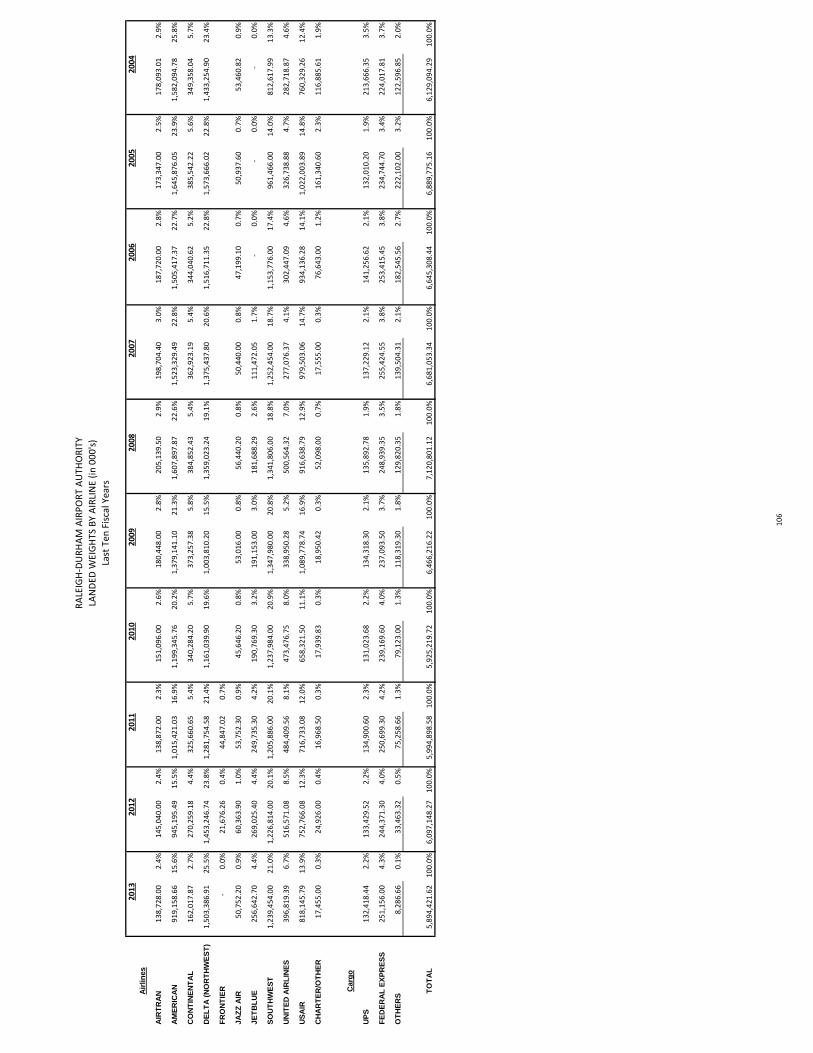
20
13
20
12
20
11
20
10
20
09
20
08
20
07
20
06
20
05
20
04
Air
lin
es
AIR
TR
AN
13
8,7
28
.00
2.4
%1
45
,04
0.0
02
.4%
13
8,8
72
.00
2.3
%1
51
,09
6.0
02
.6%
18
0,4
48
.00
2.8
%2
05
,13
9.5
02
.9%
19
8,7
04
.40
3.0
%1
87
,72
0.0
02
.8%
17
3,3
47
.00
2.5
%1
78
,09
3.0
12
.9%
AM
ER
ICA
N9
19
,15
8.6
61
5.6
%9
45
,19
5.4
91
5.5
%1
,01
5,4
21
.03
16
.9%
1,1
99
,34
5.7
62
0.2
%1
,37
9,1
41
.10
21
.3%
1,6
07
,89
7.8
72
2.6
%1
,52
3,3
29
.49
22
.8%
1,5
05
,41
7.3
72
2.7
%1
,64
5,8
76
.05
23
.9%
1,5
82
,09
4.7
82
5.8
%
CO
NT
INE
NT
AL
16
2,0
17
.87
2.7
%2
70
,25
9.1
84
.4%
32
5,6
60
.65
5.4
%3
40
,28
4.2
05
.7%
37
3,2
57
.38
5.8
%3
84
,85
2.4
35
.4%
36
2,9
23
.19
5.4
%3
44
,04
0.6
25
.2%
38
5,5
42
.22
5.6
%3
49
,35
8.0
45
.7%
DE
LT
A(N
OR
TH
WE
ST
)1
,50
3,3
86
.91
25
.5%
1,4
53
,24
6.7
42
3.8
%1
,28
1,7
54
.58
21
.4%
1,1
61
,03
9.9
01
9.6
%1
,00
3,8
10
.20
15
.5%
1,3
59
,02
3.2
41
9.1
%1
,37
5,4
37
.80
20
.6%
1,5
16
,71
1.3
52
2.8
%1
,57
3,6
66
.02
22
.8%
1,4
33
,25
4.9
02
3.4
%
FR
ON
TIE
R-
0.0
%2
1,6
76
.26
0.4
%4
4,8
47
.02
0.7
%
JA
ZZ
AIR
50
,75
2.2
00
.9%
60
,36
3.9
01
.0%
53
,75
2.3
00
.9%
45
,64
6.2
00
.8%
53
,01
6.0
00
.8%
56
,44
0.2
00
.8%
50
,44
0.0
00
.8%
47
,19
9.1
00
.7%
50
,93
7.6
00
.7%
53
,46
0.8
20
.9%
JE
TB
LU
E2
56
,64
2.7
04
.4%
26
9,0
25
.40
4.4
%2
49
,73
5.3
04
.2%
19
0,7
69
.30
3.2
%1
91
,15
3.0
03
.0%
18
1,6
88
.29
2.6
%1
11
,47
2.0
51
.7%
-0
.0%
-0
.0%
-0
.0%
SO
UT
HW
ES
T1
,23
9,4
54
.00
21
.0%
1,2
26
,81
4.0
02
0.1
%1
,20
5,8
86
.00
20
.1%
1,2
37
,98
4.0
02
0.9
%1
,34
7,9
80
.00
20
.8%
1,3
41
,80
6.0
01
8.8
%1
,25
2,4
54
.00
18
.7%
1,1
53
,77
6.0
01
7.4
%9
61
,46
6.0
01
4.0
%8
12
,61
7.9
91
3.3
%
UN
ITE
DA
IRL
INE
S3
96
,81
9.3
96
.7%
51
6,5
71
.08
8.5
%4
84
,40
9.5
68
.1%
47
3,4
76
.75
8.0
%3
38
,95
0.2
85
.2%
50
0,5
64
.32
7.0
%2
77
,07
6.3
74
.1%
30
2,4
47
.09
4.6
%3
26
,73
8.8
84
.7%
28
2,7
18
.87
4.6
%
US
AIR
81
8,1
45
.79
13
.9%
75
2,7
66
.08
12
.3%
71
6,7
33
.08
12
.0%
65
8,3
21
.50
11
.1%
1,0
89
,77
8.7
41
6.9
%9
16
,63
8.7
91
2.9
%9
79
,50
3.0
61
4.7
%9
34
,13
6.2
81
4.1
%1
,02
2,0
03
.89
14
.8%
76
0,3
29
.26
12
.4%
CH
AR
TE
R/O
TH
ER
17
,45
5.0
00
.3%
24
,92
6.0
00
.4%
16
,96
8.5
00
.3%
17
,93
9.8
30
.3%
18
,95
0.4
20
.3%
52
,09
8.0
00
.7%
17
,55
5.0
00
.3%
76
,64
3.0
01
.2%
16
1,3
40
.60
2.3
%1
16
,88
5.6
11
.9%
Carg
o
UP
S1
32
,41
8.4
42
.2%
13
3,4
29
.52
2.2
%1
34
,90
0.6
02
.3%
13
1,0
23
.68
2.2
%1
34
,31
8.3
02
.1%
13
5,8
92
.78
1.9
%1
37
,22
9.1
22
.1%
14
1,2
56
.62
2.1
%1
32
,01
0.2
01
.9%
21
3,6
66
.35
3.5
%
FE
DE
RA
LE
XP
RE
SS
25
1,1
56
.00
4.3
%2
44
,37
1.3
04
.0%
25
0,6
99
.30
4.2
%2
39
,16
9.6
04
.0%
23
7,0
93
.50
3.7
%2
48
,93
9.3
53
.5%
25
5,4
24
.55
3.8
%2
53
,41
5.4
53
.8%
23
4,7
44
.70
3.4
%2
24
,01
7.8
13
.7%
OT
HE
RS
8,2
86
.66
0.1
%3
3,4
63
.32
0.5
%7
5,2
58
.66
1.3
%7
9,1
23
.00
1.3
%1
18
,31
9.3
01
.8%
12
9,8
20
.35
1.8
%1
39
,50
4.3
12
.1%
18
2,5
45
.56
2.7
%2
22
,10
2.0
03
.2%
12
2,5
96
.85
2.0
%
TO
TA
L5
,89
4,4
21
.62
10
0.0
%6
,09
7,1
48
.27
10
0.0
%5
,99
4,8
98
.58
10
0.0
%5
,92
5,2
19
.72
10
0.0
%6
,46
6,2
16
.22
10
0.0
%7
,12
0,8
01
.12
10
0.0
%6
,68
1,0
53
.34
10
0.0
%6
,64
5,3
08
.44
10
0.0
%6
,88
9,7
75
.16
10
0.0
%6
,12
9,0
94
.29
10
0.0
%
RA
LEIG
H-D
UR
HA
MA
IRP
OR
TA
UTH
OR
ITY
LAN
DED
WEI
GH
TSB
YA
IRLI
NE
(in
00
0's
)
Last
Ten
Fisc
alYe
ars
10
6
About the Airport: Raleigh-Durham International Airport (the Airport or RDU) is owned and operated by the Raleigh-
Durham Airport Authority (the Authority). The General Assembly of North Carolina enacted
legislation on March 9, 1939 enabling the Cities of Raleigh and Durham, and the Counties of Wake
and Durham to jointly establish, operate and maintain an airport and to appoint members to a
board to be known as the "Aeronautics Authority for the City of Raleigh, City of Durham, County of
Durham and County of Wake". The enabling act further authorized the Aeronautics Authority to "act
in an administrative capacity and be vested with the Authority to control, lease, maintain, improve,
operate, and regulate the joint airport or landing field." In 1941 , the name of the Aeronautics
Authority was changed to the "Raleigh-Durham Airport Authority." Amendments to the Authority's
enabling legislation have been enacted from time to time to define and expand the Authority's
powers to operate the Airport.
RDU serves 9.2 million passengers on 7 major airlines and serves 38 international and nonstop
destinations with an average of 180 daily flights. In the fiscal year 2012 98% of all passengers at
the airport enplaned on domestic flights and 2% enplaned on international flights.
Location: The Airport is located midway between the cities of Raleigh and Durham, primarily in Wake County,
approximately 11 miles southeast of Durham and 11 miles northwest of Raleigh. The Airport
encompasses approximately 5,100 acres, of which approximately 2,075 acres are developed.
Terminals: Passenger terminal facilities at the Airport are located in two separate buildings known as Terminal
1 and Terminal 2. Terminal 1 (previously called Terminal A) includes an area once known as
"Terminal B," which was the site of the passenger terminal originally opened in October 1955.
Terminal 1 was placed in service in January 1982 and consisted of approximately 296,000 square
feet of floor space and had provided 23 contact gates served by loading bridges. The Authority has
begun a project to renovate and modernize Terminal 1. Construction on this $68 million project is
scheduled to be complete in early 2014. Terminal 1 as configured during the construction period
currently operates with 5 gates and is home to Southwest Airlines and AirTran. Terminal 1, once
renovated, will be home to Southwest Airlines and potentially other carriers and operate with 9
gates.
Terminal 2 (replacement for Terminal C), is a $573 million state-of-the-art, common use, passenger
terminal that opened on October 26, 2008. The second phase of the Terminal, the South
Concourse, opened January 23, 2011. The completed Terminal consists of approximately 920,000
square feet, with a total of 36 gates. Terminal 2 currently serves Air Canada, American Airlines,
Continental Airlines, Delta Airlines, JetBlue Airways, United Airlines, US Airways and Charter
Express.
Runways: RDU has two primary runways and one secondary runway.
Runway One: 5L/23R 10,000' L, 150' W; CAT II (5L), CAT III (23R)
Runway Two: 5R/23L 7,500' L, 150' W; CAT I (5R), CAT II (23L)Runway Three: 14/32 3,550' L, 100' W; not equipped to handle most commercial aircraft.
Parking Spaces: The airports total parking capacity is approximately 20,350 vehicles.
4 - Parking Garages 11,000 spaces approximately
4 - Park & Ride Parking Lots 9,100 spaces approximatelyGeneral Aviation Parking Lot 250 spaces approximately
Raleigh-Durham Airport Authority
Capital Assets and Other Airport Information
107
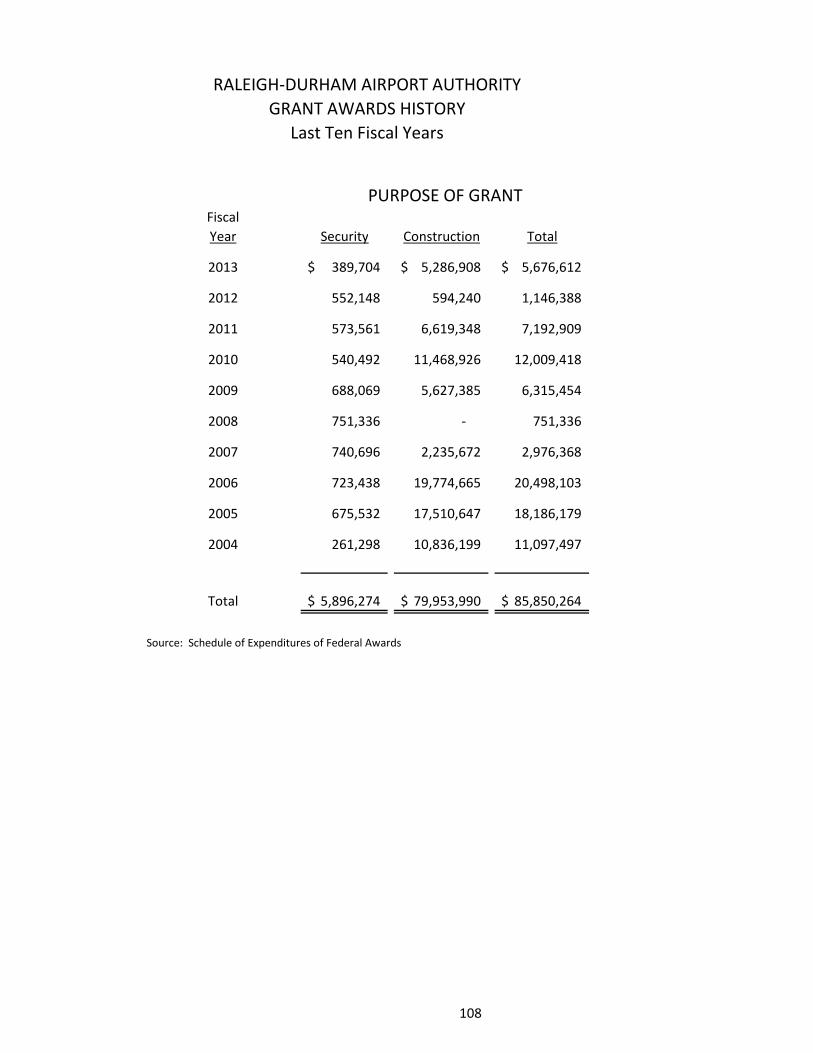
Fiscal
Year Security Construction Total
2013 389,704$ 5,286,908$ 5,676,612$
2012 552,148 594,240 1,146,388
2011 573,561 6,619,348 7,192,909
2010 540,492 11,468,926 12,009,418
2009 688,069 5,627,385 6,315,454
2008 751,336 - 751,336
2007 740,696 2,235,672 2,976,368
2006 723,438 19,774,665 20,498,103
2005 675,532 17,510,647 18,186,179
2004 261,298 10,836,199 11,097,497
Total 5,896,274$ 79,953,990$ 85,850,264$
Source: Schedule of Expenditures of Federal Awards
PURPOSE OF GRANT
RALEIGH-DURHAM AIRPORT AUTHORITY
GRANT AWARDS HISTORY
Last Ten Fiscal Years
108
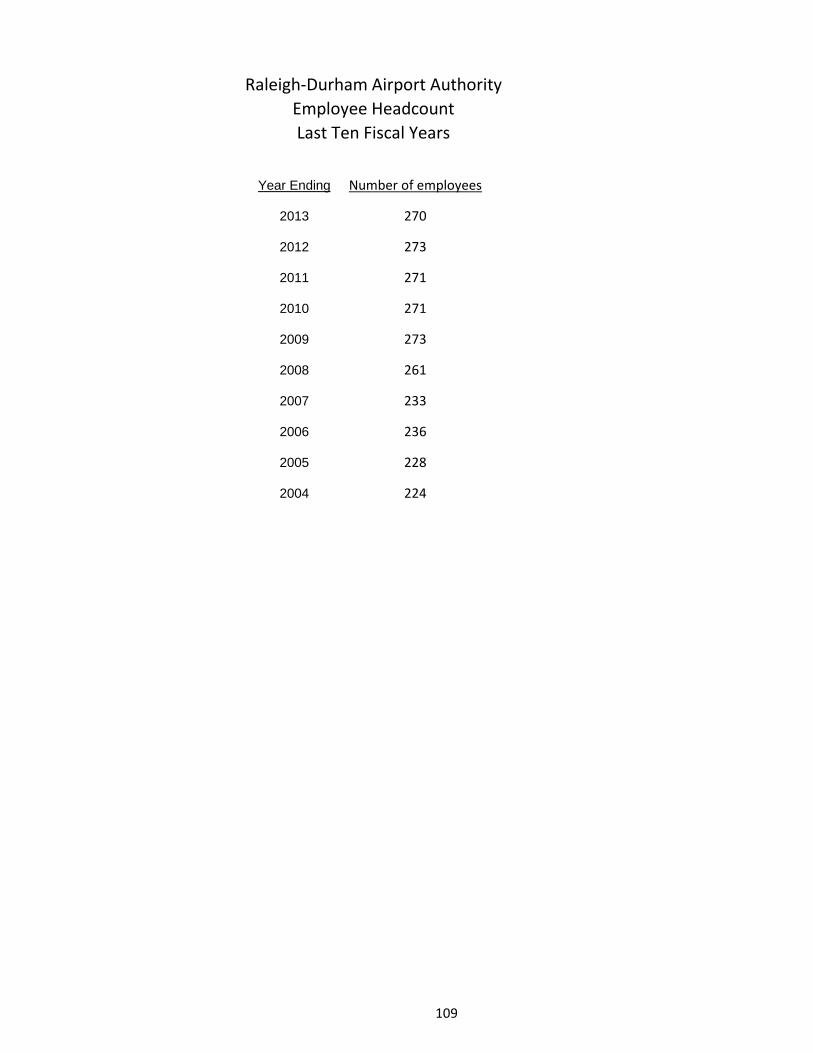
Year Ending Number of employees
2013 270
2012 273
2011 271
2010 271
2009 273
2008 261
2007 233
2006 236
2005 228
2004 224
Raleigh-Durham Airport Authority
Employee Headcount
Last Ten Fiscal Years
109