Embed Size (px)
Citation preview

THE CITY OF NORMAN, OKLAHOMATHE CITY OF NORMAN, OKLAHOMA
FISCAL YEAR ENDING JUNE 30, 2018FISCAL YEAR ENDING JUNE 30, 2018
COMPREHENSIVE ANNUAL FINANCIAL REPORT

ON THE COVER: Norman is known throughout Oklahoma and the mid-southwestern United States as “a city of festivals”. Each year, millions of people visit Norman and its wide diversity of events and festivals, including the Norman Music Festival and Lion’s Club Carnival held in April; the Me-dieval Fair; Earth Day; MayFair; Midsummer Night’s Fair; Jazz in June; Fall Festival; Mix on Main Street; GrooveFest; Downtown Porch Festival; 2nd Friday Art Walk in the Walker Arts District; Oklahoma Sooner Football and other University-sponsored events; Norman Day (4th of July Festival); National Weather Center Biennale; “Beats and Bites” Festival; Aviation Festival; and many smaller events held in City parks, neighborhoods and lo-cal businesses. Norman has many large and small entertainment and sport-ing venues, and more are planned or under construction. Information and event calendars can be obtained from www.visitnorman.com.
Photos throughout this document are mostly curtesy of “Cody Giles / Norman Transcript & Norman Magazine”

The City of
Norman, Oklahoma
Comprehensive Annual Financial Report
Fiscal Year Ended June 30, 2018
Prepared by: City of Norman
Finance Department

THE CITY OF NORMAN, OKLAHOMA
TABLE OF CONTENTS
INTRODUCTORY SECTION
FINANCIAL SECTION:
INDEPENDENT AUDITOR'S REPORT
MANAGEMENT'S DISCUSSION AND ANALYSIS
BASIC FINANCIAL STATEMENTS:
Government-wide Financial Statements:
Statement of Net Position
Statement of Activities
Fund Financial Statements:
Balance Sheet - Governmental Funds
Statement of Revenues, Expenditures, and Changes in Fund Balances -Governmental Funds
Reconciliation of the Statement of Revenues, Expenditures, and Changes in Fund Balances of Governmental Funds to the Statement of Activities
Statement of Net Position- Proprietary Funds
Statement of Revenues, Expenses, and Changes in Fund Net Position-Proprietary Funds
Statement of Cash Flows -Proprietary Funds
Statement of Fiduciary Net Position- Fiduciary Funds
Statement of Changes in Fiduciary Net Position- Fiduciary Funds
Notes to the Financial Statements
Page
1- IX
1-3
4- 16
17
18
19
20
21
22
23
24
25
26
27-72

REQUIRED SUPPLEMENTARY INFORMATON:
Schedule of the City's Proportionate Share of the Net Pension Liability (Asset)
Schedule ofthe City's Contributions
Schedule of Changes in the City's Total OPEB Liability and Related Ratios-Last Ten Fiscal Years
Budgetary Comparison Schedule - General Fund
Budgetary Comparison Schedule- Public Safety Sales Tax Fund
Notes to Required Supplementary Information on Budgetary Comparison Schedule-General Fund
OTHER SUPPLEMENTARY INFORMATION:
Combining Balance Sheet- Nonmajor Governmental Funds
Combining Statement of Revenues, Expenditures and Changes in Fund Balances -Nonmajor Governmental Funds
Budgetary Comparison Schedule - Special Revenue Funds: Norman Room Tax Fund Community Development Fund Special Grants Fund Park Land Fund Seizures and Restitutions Fund Cleet Fund Art in Public Places Fund
Budgetary Comparison Schedule - Debt Service Fund
Budgetary Comparison Schedule - Capital Projects Fund
Budgetary Comparison Schedule- NORMAN FORWARD Fund
Notes to Other Supplementary Information on Budgetary Comparison Schedules-Nonmajor Special Revenue Funds, Debt Service Fund, Capital Projects Fund and NORMAN FORWARD Fund
Combining Financial Schedules and Statements -Enterprise Funds and Fiduciary Funds:
Norman Municipal Authority: Combining Statement ofNet Position Combining Statement of Revenues, Expenses and Changes in Net Position Combining Statement of Cash Flows
Page
73
74
75
76-80
81
82
83
84
85 86
87- 88 89 90 91 92
93
94
95
96
97 98 99

Norman Utilities Authority: Combining Statement ofNet Position Combining Statement of Revenues, Expenses and Changes in Net Position Combining Statement of Cash Flows
Fiduciary Funds: Combining Statement of Fiduciary Net Position Combining Statement of Changes in Fiduciary Net Position Statement of Changes in Assets and Liabilities - Agency Funds
STATISTICAL SECTION (UNAUDITED):
Statistical Section Table of Contents
Net Position by Component
Changes in Net Position
Fund Balances of Governmental Funds
Changes in Fund Balances of Governmental Funds
Taxable Sales by Category
Direct and Overlapping Sales Tax Rates
Sales Tax Revenue Payers by Industry
Ratios of Outstanding Debt by Type
Ratios of General Bonded Debt Outstanding
Direct and Overlapping Governmental Activities Debt
Legal Debt Margin Information
Pledged-Revenue Coverage
Demographic and Economic Statistics
Principal Employers
Full-Time Equivalent City Employees by Function
Operating Indicators by Function
Capital Asset Statistics by Function
Page
100 101 102
103 104 105
106
107
108- 110
Ill
112
113
114
115
116
117
118
119
120
121
122
123
124
125

This page left intentionally blank.


The City of
NORMAN 201 West Gray • P.O. Box 370 Norman, Oklahoma 73069 • 73070
Citizens ofthe City ofNonnan, Oklahoma Honorable Mayor and City Council
CITY MANAGER'S OFFICE Phone: 405-366-5402
State law requires that every general-purpose local government publish, within six months of the close of each fiscal year, a complete set of audited financial statements. This report is published to fulfill that requirement for the fiscal year ended June 30, 2018.
Management assumes full responsibility for the completeness and reliability of the information contained in this report, based upon a comprehensive framework of internal control that it has established for this purpose. Because the cost of internal control should not exceed the anticipated benefits of providing the control , the objective is to provide reasonable, rather than absolute, assurance that the financial statements are free of any material misstatements.
BKD, LLP has issued an unmodified ("clean") opinion on the City of Norman ("City") financial statements for the year ended June 30, 2018. The independent auditors' report is located at the front of the financial section of this report.
Management's Discussion and Analysis ("MD&A") immediately follows the independent auditor's report and provides a narrative introduction, overview, and analysis of the basic financial statements. The MD&A complements this Letter of Transmittal and should be read in conjunction with it. We are pleased to report that the financial position of the City of Norman and its component units is strong.
Profile of the Government
An elected Mayor and eight-member Council govern the City of Norman. Daily operations of the City are administered by a City Manager appointed by majority vote of the City Council.
The Basic Financial Statements of the City include all governmental and business-type activities, organizations and functions , including those legally separate organizations for which the City is financially accountable as defined by the Governmental Accounting Standards Board ("GASB").
Building an Inclusive Community

The City provides a full range of municipal government services to over 122,000 residents and numerous visitors annually. Municipal services provided include: traffic control; water production and distribution; stormwater management and flood control; wastewater collection and treatment (water reclamation); solid waste collection and disposal; emergency response services; city code enforcement; crime prevention, enforcement and adjudication; construction and maintenance of streets and bridges; maintenance of park land; and public recreational facilities.
The City does not operate hospitals, schools, or public transportation systems. Special districts and govern mental entities with independent authority administer the public hospital, public schools and the university within the City. The City contributes to a city-wide public transportation system operated by the University of Oklahoma and provides School Resource Police Officers through a cost-sharing agreement with the Norman Public Schools.
The Council is required to adopt a final budget by no later than ten days before the close of the fiscal year. This annual budget serves as the fo undation for the City's financial planning and control. The budget is prepared by fund, department and category (e.g., salary and benefits). Department managers may transfer resources within their department as they see fit. Transfers between departments, however, need special approval from the City Manager. City Council approval is needed for transfers between funds or between capital projects.
Local Economy; Relevant Financial Policies
The City of Norman is located in the geographic center of Oklahoma and is within the Oklahoma City metropolitan area. Norman's high quality of life is sought by people of all ages and walks of life, and is demonstrated by population growth in recent years. The University of Oklahoma, Nati.onal Severe Storms Laboratory and National Weather Service, Hitachi Computer Products, U.S. Postal Service Technical Center, Immuno Mycologies Incorporated, SYSCO Food Services, A vara Pharmaceutical Technologies, and Johnson Controls Unitary Products Group are some of the leading institutions and businesses located in Norman. Several of these businesses have recently expanded, helping to sustain the health of the local economy for years to come.
One of the best indicators of the economic condition of the City is the evaluation of trends in some key factors. Sales and use taxes and franchise fees collectively represent 72% of the City's total General Fund revenue. Sales tax receipts increase in proportion to the level of retail sales and therefore provide a good indication of the economic condition of the community. Overall, sales tax collections increased .85% from FYE 2017 levels. Collections from the City's franchise fees (charges to private electric, natural gas and cable companies to operate within the City' s rights-of-way) increased 4 .2% from FYE 2017 levels.
II

8.00%
-4.00%
-6.00%
General Purpose Sales Tax 15-Year Collection Trend, In% Change
%Change
-3.74%
Since sales and use taxes and building permit revenues are a primary source of the City's general governmental revenue, are by nature volatile, and because Norman is subject to extreme weather conditions which can necessitate significant unexpected expenditures during the course of the budget year, the City must budget conservatively and maintain sufficient fund balances to absorb any shortfalls that may occur. As a result, prudent reserve policies have been codified in a Net Revenue Stabilization ("Rainy Day") Fund Ordinance. The Ordinance requires a budgetary fund balance of at least three percent (3%) of budgeted expenditures in the General Fund; a General Fund "Emergency Reserve" appropriation of 1 %; and a minimum of 4% of General Fund expenditures to be maintained in a separate "Rainy Day" Fund (a minimum total of 8 percent of General Fund expenditures are mandated to be held in reserve fund balances or appropriations). The Ordinance sets a Targeted Rainy Day Fund balance of 5% of General Fund expenditures (the total Targeted Reserve Fund Balance is 9% of General Fund expenditures).
Fund balance in the Net Revenue Stabilization Fund can only be appropriated for expenditure in case of federally-declared disasters or extraordinary capital expense requirements in the General Fund, or if the General Fund balance falls below one percent. The Ordinance requires that the Net Revenue Stabilization Fund balance be built or rebuilt to its minimum level withjn three years of the establishment of the Fund, or within three years of any expenditure of Rainy Day Fund balances. The City of Norman's Rainy Day Fund is being maintained at its Targeted level as of June 30, 2018.
The City also targets a fund balance level in other operating funds of at least eight percent (8%) of budgeted expenditures to protect citizen/customer service delivery from unexpected revenue shortfalls or cost overruns. The City also seeks to set utility rates within utility enterprise funds at a level to meet average net income and reserve requirements over a five-year period without the need for interim adjustments. The City's unique Charter requirement that utility rate increases must be approved by a majority vote of the people of Norman makes this policy more difficult to achieve. The voters of Norman have not approved a water rate increase since 2015; wastewater, since 2013; and sanitation, since 2011. Norman is also one of the few cities of its size that does not have stormwater utility fee to pay for the costs of federally-mandated pollutant discharge programs. Norman ' s ali-in utility rates are among the lowest in the region:
Ill

Total Utility Rates (as of 6/2018) fot>J 11o<a17 Rts.IOo."'!W 11:1811 his
(&U"'""-"'Q lOt. Qlllon ... ait r u._ &..:~ 5/ror J.lr r»ier, - · t bfm.,a!ar IHs) ... ....... _IE!iiT ....... ~ -.:
~-...c
·.u : ... alt • .,..
t • Wftol
•...uo" ...... .......... ... ._.. ... S!!E!E!!EE!Ia==++ ; .,. ·-.......
Long-term Financial Planning
The City provides very competitive employee benefit packages, particularly for health insurance and retirement (information on employee benefits is given in the Notes to Financial Statements Section). Much of the City' s long-term financial planning efforts in the general governmental service areas relate to controlling the rate of growth in these employee costs. The City continues to provide adequate service levels, but the ability to maintain these service levels without new revenue sources to support increased staffing will become doubtful. The Council continues to consider alternative revenue sources.
The financial status of the City' s utility enterprise funds is dri ven by major capital expenditures. The Council, acting as Trustees of the Norman Utilities Authority, has approved major expansion and improvements to the Norman Water Treatment Plant and expansion of the City's groundwater supplies. These major water fac ility improvements are the first major phase of the program laid out in the NUA' s Strategic Water Supply Plan , which was approved in 2014.
Major Initiatives
The citizens of Norman approved an earmarked, temporary (15-year term) sales tax of one-half percent (112%) to fund major quality of life improvements in October, 2015; the NORMAN FORWARD initiative. The City' s Norman Municipal Authority issued Tax Revenue Notes to finance the major facilities included in the Norman Forward program, and major facilities have been completed or are under construction, including the new Westwood Family Aquatic Center; the new Norman Public Library, East Branch; the expanded Westwood Tennis Center; the Griffin Park Soccer Complex; the new Norman Public Library, Central Branch; and community and neighborhood park improvement city-wide. Future projects that are in preliminary phases include the reconstructed Reaves Park Youth Softball/Baseball Complex; a new Adult Football/Softball Complex; extension of James Garner Boulevard; construction of a new Indoor Aquatics Complex; a new Indoor Multi-Spmt Facility; a potential new Senior Citizen's Center; and supporting traffic and roadway improvements.
IV

7
A wards and Acknowledgements
The Government Finance Officers Association ("GFOA") awarded a Certificate of Achievement for Excellence in Financial Reporting to the City for its Comprehensive Annual Financial Report ("CAFR") for the fiscal year ended June 30, 201 . In order to be awarded a Certificate of Achievement, a government must publish an easily readable and efficiently organized CAFR. This report must satisfy both accounting principles generally accepted in the United States of America and applicable legal requirements. A Certificate of Achievement is valid for a period of one year only. We believe our current report continues to conform to the Certificate of Achievement program requirements, and we will submit it to the GFOA to determine its eligibility for certification.
Preparation of a CAFR is a complex task and one that requires considerable expertise and experience. More important, the ongoing maintenance and reporting of the City's financial condition at the level to which Norman has been accustomed requires professionalism and dedication far beyond what could be expected from a paycheck. The City is fortunate to have a very talented accounting staff willing to undertake these magnanimous efforts year after year. It is our pleasure to express sincere thanks to the accounting staff of the City. Chief Accountant Clint Mercer, CPA, CPFO, and Municipal Accountant Debbie Whitaker deserve particular recognition for their efforts in preparing representative financial statements. We would also like to thank BKD, LLP, independent auditors of the City, for their guidance and technical assistance.
Finally, we would like to express our gratitude and appreciation to the members of the Norman City Council and the Council's Finance and Audit Committee for your policy guidance which is contained in this document. As the governing body, your commitment to ensure accurate and reliable financial accounting and reporting systems, and to provide adequate staffing levels to ensure them, establishes an environment influencing all other decisions that are made. We are proud to convey the City Council 's commitment to excellence to our citizens and all readers of the FYE 20 18 CAFR.
Mru~~ Interim City Manager
Respectfully submitted,
Anthony ranc1sco, CPFO, CTP, CPFA, ACPFIM Director of Finance/City Controller
v

Government Finance Officers Association
Certificate of Achievement for Excellence
in Financial Reporting
Presented to
City of Norman
Oklahoma
For its Comprehensive Annual Financial Report
for the Fiscal Year Ended
June 30, 2017
Executive Director/CEO

vii
I CITIZENS OF NORMAN I 11---r- CITY COUNCIL
I BOARDS AND COMMISSIONS I CITY MANAGER
Community Relations
l MUNICIPAL COURT l LEGAL ~ I
r ~. FIRE ~~--OF THE CITY CLERK ~
I Emergency Management
Prevention Facility Maintenance Suppression Custodial Services
·ramint> ,..r"
r POLICE I PUBLIC WORKS 1 L I
Engineering Animal Welfare -., Streets
Criminal Investigations Special Investigations Stornnwater)}rainage Patrol Staff Servkes Traflic Control
Fleet •
r PARKS AND ~ I I RECREATION II L FINANCE
I Park Maintenance
Forestry Accounting Office Services
Recreation Budget Treasury ~T I Park IIIWrmation Technology Utility Servil:es
r~unb AND r""~ .. 'rUNITY I I ~ H.6!. V.6!.J ~..,~NT I l HUMAN RESOURCES
I I Comprehemive Planning l UTILITIES I )}evelopment Servil:es Compensation and Benefits
Revitamation I Safety
Geographk: ln10rmation Systems Selection and )}evelopment
Current Planning 1-Water Employee Assistance
CUBG Water Ret:bmation Sanitation
Ward 1
Ward 2
Ward 3
Ward 4
CITY OFFICIALS
Kate Bierman
Aleisha Karjala
MAYOR Lynne Miller
Robert Castleberry
Bill Hickman
Ward 5
Ward 6
Ward 7
Ward 8
City Manager Steve Lewis
viii
Sereta Wilson
Breea Clark
Stephen Holman
Kyle Allison

ACCOUNTING & RESEARCH STAFF
Anthony Francisco, CPFO, CTP, CPFA Finance Director
Clint Mercer, CPA, CPFO Chief Accountant
Debbie Whitaker Municipal Accountant Ill
Mary Anne Kirkland Administrative Technician IV
Kim Coffman Budget Manager
Mindy Aynes Municipal Accountant I
Lisa Woods Municipal Accountant I
This document was prepared by the City of Norman Finance Department For additional information please contact:
City of Norman Finance Department P.O. Box 370
Norman, OK 73070 (405) 366-5413
ix


Independent Auditor’s Report
Honorable Mayor and City Council City of Norman, Oklahoma Norman, Oklahoma Report on the Financial Statements
We have audited the accompanying financial statements of the governmental activities, the business-type activities, each major fund and the aggregate remaining fund information of the City of Norman, Oklahoma (the City), as of and for the year ended June 30, 2018, and the related notes to the financial statements, which collectively comprise the City’s basic financial statements, as listed in the table of contents.
Management’s Responsibility for the Financial Statements
Management is responsible for the preparation and fair presentation of these financial statements in accordance with accounting principles generally accepted in the United States of America; this includes the design, implementation and maintenance of internal control relevant to the preparation and fair presentation of financial statements that are free from material misstatement, whether due to fraud or error.
Auditor’s Responsibility
Our responsibility is to express opinions on these financial statements based on our audit. We conducted our audit in accordance with auditing standards generally accepted in the United States of America and the standards applicable to financial audits contained in Government Auditing Standards, issued by the Comptroller General of the United States. Those standards require that we plan and perform the audit to obtain reasonable assurance about whether the financial statements are free from material misstatement.
An audit involves performing procedures to obtain audit evidence about the amounts and disclosures in the financial statements. The procedures selected depend on the auditor’s judgment, including the assessment of the risks of material misstatement of the financial statements, whether due to fraud or error. In making those risk assessments, the auditor considers internal control relevant to the entity’s preparation and fair presentation of the financial statements in order to design audit procedures that are appropriate in the circumstances, but not for the purpose of expressing an opinion on the effectiveness of the entity’s internal control. Accordingly, we express no such opinion. An audit also includes evaluating the appropriateness of accounting policies used and the reasonableness of significant accounting estimates made by management, as well as evaluating the overall presentation of the financial statements.
We believe that the audit evidence we have obtained is sufficient and appropriate to provide a basis for our audit opinions.

Honorable Mayor and City Council City of Norman, Oklahoma Page 2
Opinions
In our opinion, the financial statements referred to above present fairly, in all material respects, the respective financial position of the governmental activities, the business-type activities, each major fund and the aggregate remaining fund information of the City, as of June 30, 2018, and the respective changes in financial position and, where applicable, cash flows thereof for the year then ended in accordance with accounting principles generally accepted in the United States of America.
Emphasis of Matter
As discussed in Note 1 to the financial statements, in 2018, the City adopted Governmental Accounting Standards Board Statement No. 75, Accounting and Financial Reporting for Postemployment Benefits Other Than Pensions. Our opinion is not modified with respect to this matter.
Other Matters
Required Supplementary Information
Accounting principles generally accepted in the United States of America require that the management’s discussion and analysis, budgetary comparison, pension and other postemployment information, as listed in the table of contents, be presented to supplement the basic financial statements. Such information, although not a part of the basic financial statements, is required by the Governmental Accounting Standards Board, who considers it to be an essential part of financial reporting for placing the basic financial statements in an appropriate operational, economic or historical context. We have applied certain limited procedures to the required supplementary information in accordance with auditing standards generally accepted in the United States of America, which consisted of inquiries of management about the methods of preparing the information and comparing the information for consistency with management’s responses to our inquiries, the basic financial statements and other knowledge we obtained during our audit of the basic financial statements. We do not express an opinion or provide any assurance on the information because the limited procedures do not provide us with sufficient evidence to express an opinion or provide any assurance.
Other Information
Our audit was conducted for the purpose of forming opinions on the financial statements that collectively comprise the City’s basic financial statements. The other supplementary information, consisting of combining statements and budgetary comparison schedules, and the introductory section and the statistical section, as listed in the table of contents, are presented for purposes of additional analysis and are not a required part of the basic financial statements.
The other supplementary information, as listed in the table of contents, is the responsibility of management and was derived from and relates directly to the underlying accounting and other records used to prepare the basic financial statements. Such information has been subjected to the auditing procedures applied in the audit of the basic financial statements and certain additional procedures, including comparing and reconciling such information directly to the underlying accounting and other records used to prepare the basic financial statements or to the basic financial statements themselves, and other additional procedures in accordance with auditing standards generally accepted in the United States

Honorable Mayor and City Council City of Norman, Oklahoma Page 3
of America. In our opinion, the other supplementary information, as listed in the table of contents, is fairly stated, in all material respects, in relation to the basic financial statements as a whole.
The introductory and statistical sections, as listed in the table of contents, have not been subjected to the auditing procedures applied in the audit of the basic financial statements and, accordingly, we do not express an opinion or provide any assurance on them.
Other Reporting Required by Government Auditing Standards
In accordance with Government Auditing Standards, we also have issued our report dated December 7, 2018, on our consideration of the City’s internal control over financial reporting and on our tests of its compliance with certain provisions of laws, regulations, contracts and grant agreements and other matters. The purpose of that report is solely to describe the scope of our testing of internal control over financial reporting and compliance and the results of that testing, and not to provide an opinion on the effectiveness of the City’s internal control over financial reporting or on compliance. That report is an integral part of an audit performed in accordance with Government Auditing Standards in considering the City’s internal control over financial reporting and compliance.
Oklahoma City, Oklahoma December 7, 2018

Management's Discussion and Analysis
As management of the City ofNorman (the "City"), we offer readers of the City's financial statements this narrative overview and analysis of the financial activities of the City for the fiscal year ended June 30, 2018. We encourage readers to consider the information presented here in conjunction with additional information that we have furnished in our letter of transmittal, which can be found on pages i-ix of this report.
Financial Highlights
• The assets and deferred outflow of resources of the City exceeded its liabilities and deferred inflows at the close of the most recent fiscal year by $639,459,056 (net position).
• The City's total net position increased by $37,548,395. • As of the close of the current fiscal year, the City's governmental funds reported combined ending fund
balances of $179,431,370, a decrease of $17,193,704 in comparison with the prior year. Approximately 93% or $166,384,849 was nonspendable, restricted, committed or assigned for specific purposes. Approximately 7% or $13,046,521 was unassigned at fiscal year end.
• At the end of the current fiscal year, unassigned fund balance for the general fund was $13,046,521 or 18% of total general fund expenditures.
• The City's total debt decreased by $1,052,426 (0.5 percent) during the current fiscal year. Key factors of this change were issuance of the Norman Municipal Authority, Sales Tax Revenue Note, Series 2017B ($6,105,000). The City also drew $8,651,446 and $6,891,969 on the Oklahoma Water Resources Board, Series 2014 loan and Oklahoma Water Resources Board, Series 2018 loan, respectively. Also, the City made its normally scheduled payments.
Overview of the Financial Statements
This discussion and analysis is intended to serve as an introduction to the City's basic financial statements. The City's basic financial statements comprise three components: 1) government-wide financial statements, 2) fund financial statements, and 3) notes to the financial statements. This report also contains other supplementary information in addition to the basic financial statements themselves. A brief description of the basic financial statements follows.
Government-wide financial statements - The government-wide financial statements are designed to provide readers with a broad overview of the City's finances, in a manner similar to a private-sector business.
The statement of net position presents information on all the City's assets, deferred outflow of resources, liabilities and deferred inflow of resources with the difference between the assets plus deferred outflows of resources less liabilities and deferred inflows of resources reported as net position. Over time, increases or decreases in net position may serve as a useful indicator of whether the financial position of the City is improving or deteriorating.
The statement of activities presents information showing how the government's net position changed during the most recent fiscal year. All changes in net position are reported as soon as the underlying event giving rise to the change occurs, regardless of the timing of related cash flows. Thus, revenues and expenses are reported in this statement for some items that will only result in cash flows in future fiscal periods (e.g., uncollected taxes and earned but unused vacation leave).
Both of the government-wide financial statements distinguish functions of the City that are principally supported by taxes and intergovernmental revenues (governmental activities) from other functions that are
- 4-

intended to recover all or a significant portion of their costs through user fees and charges (business-type activities). The governmental activities of the City include general government, planning, city controller, parks and recreation, public works, public service and public safety. The business-type activities of the City include the Norman Municipal Authority (the ''NMA"), the Norman Utilities Authority (the "NUA'') and the Norman Economic Development Authority (the "NEDA"). The NMA operates Westwood Park and the City's sanitation services. Westwood Park includes golf, tennis and swimming facilities. The NUA operates the City's water and wastewater services. The NEDA includes financing and operating economic development activities for the City.
The government-wide financial statements can be found on pages 17-18 ofthis report.
Fund financial statements- A fund is a group of related accounts that is used to maintain control over resources that have been segregated for specific activities or objectives. The City, like other state and local governments, uses fund accounting to ensure and demonstrate compliance with finance-related legal requirements. All of the funds of the City can be divided into three categories: governmental funds, proprietary funds and fiduciary funds. A brief description of these funds follows.
Governmental funds - Governmental funds are used to account for essentially the same functions reported as governmental activities in the government-wide financial statements. However, unlike the government-wide financial statements, governmental fund financial statements focus on near-term inflows and outflows of spendable resources, as well as balances of spendable resources available at the end of the fiscal year. Such information may be useful in evaluating a government's near-term financing requirements.
Because the focus of governmental funds is narrower than that of the government-wide financial statements, it is useful to compare the information presented for governmental funds with similar information presented for governmental activities in the government-wide financial statements. By doing so, readers may better understand the long-term impact of the government's near-term financing decisions. Both the governmental fund balance sheet and the governmental fund statement of revenues, expenditures and changes in fund balances provide a reconciliation to facilitate this comparison between governmental funds and governmental activities.
The City maintains twelve individual governmental funds. Information is presented separately in the governmental fund balance sheet and in the governmental fund statement of revenues, expenditures and changes in fund balances for the general fund, public safety sales tax fund, debt service fund, capital projects fund and NORMAN FORWARD fund, all ofwhich are considered to be major funds. Data from the other seven governmental funds are combined into a single, aggregated presentation. Individual fund data for each of these nonmajor governmental funds is provided in the form of combining statements elsewhere in this report.
The City adopts an annual appropriated budget for its General Fund. A budgetary comparison statement has been provided for the general fund to demonstrate compliance with the budget.
The basic governmental fund financial statements can be found on pages 19-21 of this report.
Proprietary funds - The City maintains two different types of proprietary funds. Enterprise funds report the same functions presented as business-type activities in the government-wide financial statements. The City uses enterprise funds to account for NMA and NUA activities, which are both presented as major proprietary funds. The components of these funds are presented in additional detail in the form of combining statements elsewhere in this report. The City uses one other type of proprietary fund, an internal service fund to account for its retained risks. These services predominantly benefit governmental rather
- 5-

than business-type functions and have been included within governmental activities in the government-wide financial statements.
Proprietary funds provide the same type of information as the government-wide financial statements, only in more detail.
The basic proprietary fund financial statements can be found on pages 22-24 of this report.
Fiduciary funds - Fiduciary funds are used to account for resources held for the benefit of parties outside the government. Fiduciary funds are not reflected in the government-wide financial statement because the resources of those funds are not available to support the City's own programs. The accounting used for fiduciary funds is much like that used for proprietary funds.
The basic fiduciary fund financial statements can be found on pages 25-26 of this report.
Notes to the financial statements - The notes provide additional information that is essential to a full understanding of the data provided in the government-wide and fund financial statements. The notes to the financial statements can be found on pages 27-72 of this report.
Other information - In addition to the basic financial statements and accompanying notes, this report also presents certain required supplementary information concerning the City's progress in funding its obligation to provide pension and other post-employment benefits to its employees and budgetary comparison schedules for the general fund and public safety sales tax fund. Required supplementary information can be found on pages 73-82 of this report. Also, this report presents certain other supplementary information such as combining financial information for non-major governmental funds, budgetary comparison schedules for non-major governmental funds and combining financial statements for enterprise funds and fiduciary funds. Other supplementary information can be found on pages 83-105 of this report.
Government-wide Financial Analysis
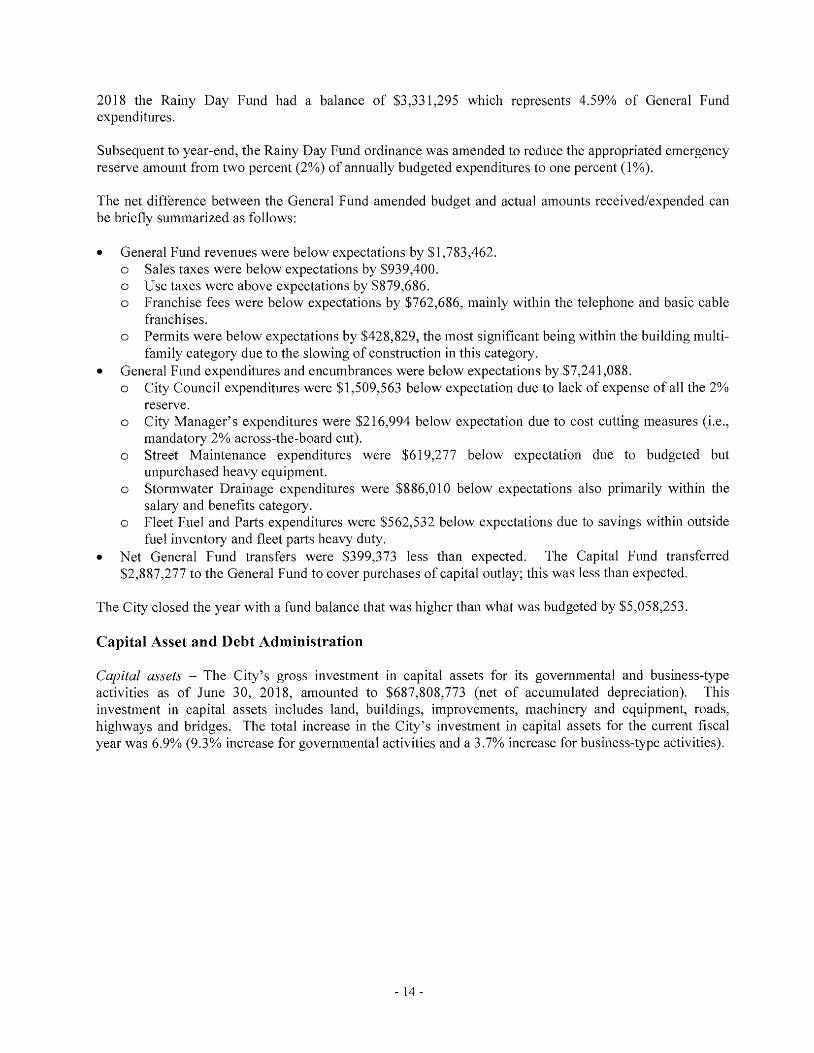
As noted earlier, net position may serve over time as a useful indicator of a government's financial position. In the case of the City, assets and deferred outflows exceeded liabilities and deferred inflows by $639,459,056 at the close of the most recent fiscal year.
- 6-

Net Position As of June30
Governmental activities Business-type activities Total 2018 2017 2018 2017 2018 2017
Current and other assets $ 196,635,453 $ 218,393,192 $ 68,670,087 $ 54,087,142 $ 265,305,540 $ 272,480,334 Capital assets 408,359,667 373,690,856 279,449,106 269,348,865 687,808,773 643,039,721
Total assets 604,995,120 592,084,048 348,119,193 323,436,007 953,114,313 915,520,055 Deferred outflows 15,106,409 15,583,741 813,689 924,823 15,920,098 16,508,564 Long-term liabilities 214,155,050 230,440,689 60,831,369 52,923,793 274,986,419 283,364,482 Other liabilities 35,837,801 35,172,173 14,177,989 10,579,487 50,015,790 45,751,660
Total liabilities 249,992,851 265,612,862 75,009,358 63,503,280 325,002,209 329,116,142 Deferred inflows 4,573,146 1,001,816 4,573,146 1,001,816 Net position: Net investment in capital assets 313,981,902 256,880,446 212,565,194 211,414,863 526,547,096 468,295,309 Restricted 90,270,821 128,695,200 16,958,115 6,629,187 107,228,936 135,324,387 Unrestricted (38,717,191) ( 44,522,535) 44,400,215 42,813,500 5,683,024 (1,709,035)
Total net position $ 365,535,532 $ 341,053,111 $ 273,923,524 $ 260,857,550 $ 639,459,056 $ 601,910,661
By far the largest portion of the City's net position (82 percent) reflect its investment in capital assets (e.g., land, buildings, machinery and equipment and infrastructure), less any related debt used to acquire those assets to provide services to citizens; consequently, these assets are not available for future spending. Although the City's investment in its capital assets is reported net of related debt, it should be noted that the resources needed to repay this debt must be provided from other sources, since the capital assets themselves cannot be used to liquidate these liabilities.
An additional portion of the City's net position (17 percent) represents resources that are subject to external restrictions on how they may be used. The remaining balance of net position is unrestricted.
There was an increase of $13 million in the net position reported in connection with the City's business-type activities. This increase was due to several factors. See below for more information.
The governmental net position increased by $24.5 million during the current fiscal year. This increase was due to several factors. See below for more information. .
- 7-

Change in Net Position For the Year Ended June 30
Governmental activities Business-type activities Total 2018 2017 2018 2017 2018 2017
Program Revenues: Charges for services $ 8,196,637 $ 7,896,054 $ 53,438,006 $ 53,021,473 $ 61,634,643 $ 60,917,527 Operating grants &
contributions 14,570,508 12,379,368 14,570,508 12,379,368 Capital grants &
contributions 9,476,361 3,813,991 5,263,425 2,324,230 14,739,786 6,138,221 General revenues:
Sales and excise taxes 73,967,709 73,345,458 1,319,885 1,530,490 75,287,594 74,875,948 Franchise taxes 7,094,490 6,807,860 7,094,490 6,807,860 Property taxes 11,971,525 14,739,604 11,971,525 14,739,604 Use taxes 5,148,317 3,797,125 5,148,317 3,797,125 Other taxes 3,038,354 2,969,956 3,038,354 2,969,956 Investment earnings 1,586,732 513,238 472,025 163,961 2,058,757 677,199 Miscellaneous 3,627,956 2,275,838 (940,246) 501,033 2,687,710 2,776,871
Total revenues 138,678,589 128,538,492 59,553,095 57,541,187 198,231,684 186,079,679
Expenses: General government 12,859,373 10,763,028 12,859,373 10,763,028 Planning 3,477,364 3,315,422 3,477,364 3,315,422 City controller 2,449,352 1,231,508 2,449,352 1,231,508 Parks and recreation 6,502,407 7,087,981 6,502,407 7,087,981 Public works 26,682,973 30,953,789 26,682,973 30,953,789 Public service 2,627,283 3,892,316 2,627,283 3,892,316 Public safety 55,817,838 53,613,442 55,817,838 53,613,442 Interest on long-term debt 4,937,107 4,734,646 4,937,107 4,734,646 Westwood park 1,500,752 1,256,295 1,500,752 1,256,295 Water 16,321,995 14,535,092 16,321,995 14,535,092 Wastewater 14,627,959 15,448,412 14,627,959 15,448,412 Sanitation 12,878,886 12,005,272 12,878,886 12,005,272
Total expenses 115,353,697 115,592,132 45,329,592 43,245,071 160,683,289 158,837,203
Change in net position before transfers 23,324,892 12,946,360 14,223,503 14,296,116 37,548,395 27,242,476 Transfers 1,157,529 1,294,541 (1,157,529) (1,294,541)
Change in net position 24,482,421 14,240,901 13,065,974 13,001,575 37,548,395 27,242,476 Net position, beginning 341,053,111 326,812,210 260,857,550 247,855,975 601,910,661 574,668,185 Net position, ending $ 365,535,532 $ 341,053,111 $ 273,923,524 $ 260,857,550 $ 639,459,056 $ 601,910,661
Governmental activities -Governmental activities increased the City's net position by $24.5 million. In the prior year, governmental activities increased the City's net position by $14.2 million. Key elements of this change are as follows:
• Sales tax revenue within the governmental activities (the City's primary fund source) increased by $622,251 or 0.8% over the prior fiscal year. The City and State's economy began to make a recovery in the last fiscal year as energy prices have improved.
• Franchise taxes increased $286,630 or 4.2% over the prior fiscal year. As stated above, favorable increases in energy prices have begun a recovery within the City and State.
- 8-

- 9 -
Use tax revenue has increased $1,351,192 or 35.6% over the prior fiscal year. This increase is directly related to agreements states have made with on-line retailers such as Amazon to begin paying use tax.
Capital grants and contributions increased $5,662,370 or 148.5% from the prior fiscal year. Most of this figure in both years is donated infrastructure (i.e., roads) within developments by private developers. The increase can be attributed to increased development activity.
General government expenses increased $2,096,345 or 19.5% from the prior year. The City is self-insured for employee health benefits. Approximately $2.9 million of this increase is due to increases within this health benefit plan.
Public works expenses decreased $4,270,816 or 13.8% from the prior year. Most of this decrease related to street maintenance projects completed in the prior year.
Expenses and Program Revenues – Governmental Activities
$-
$2,000,000
$4,000,000
$6,000,000
$8,000,000
$10,000,000
$12,000,000
$14,000,000
$16,000,000
$18,000,000
$20,000,000
$22,000,000
$24,000,000
$26,000,000
$28,000,000
$30,000,000
$32,000,000
$34,000,000
$36,000,000
$38,000,000
$40,000,000
$42,000,000
$44,000,000
$46,000,000
$48,000,000
$50,000,000
$52,000,000
$54,000,000
$56,000,000
$58,000,000
$60,000,000
general government planning city controller parks & recreation public works public service public safety
program revenues expenses
Although governmental expenses exceed program revenue, most governmental activities are financed through general revenues such as taxes.

- 10 -
Revenues by Source - Governmental Activities
charges for service6%
other taxes20%
capital grants and contributions7%
sales taxes53%
operating grants and contributions10%
investment earnings1%
miscellaneous3%
Business-type activities – Business-type activities increased the City’s net position by $13.1 million. In the prior year, business-type activities increased the City’s net position by $13 million. Key elements of this change are as follows: Capital grants and contributions increased $2,939,195 or 126.5% from the prior fiscal year. Most of
this figure in both years is donated infrastructure (i.e., water and sewer lines) within developments by private developers. The increase can be attributed to increased development activity.
Tax revenue decreased $210,605 or 13.8% from the prior fiscal year. This tax represents an excise tax on development to fund wastewater improvements. The decrease is directly attributable to development activity although at a different point in the development process.

- 11 -
Water expenses increased $1,786,903 or 12.3% from the prior fiscal year. Most of this increase was due to the completion of several maintenance water projects in the current fiscal year.
Expenses and Program Revenues – Business-type Activities
$-
$1,000,000
$2,000,000
$3,000,000
$4,000,000
$5,000,000
$6,000,000
$7,000,000
$8,000,000
$9,000,000
$10,000,000
$11,000,000
$12,000,000
$13,000,000
$14,000,000
$15,000,000
$16,000,000
$17,000,000
$18,000,000
$19,000,000
$20,000,000
$21,000,000
$22,000,000 $23,000,000
$24,000,000
$25,000,000
$26,000,000
$27,000,000
$28,000,000
$29,000,000
$30,000,000
Westwood Water Wastewater Sanitation
program revenues expenses

- 12 -
Revenues by Source – Business-type Activities
charges for service88%
capital grants and contributions9%
investment earnings1%
taxes2%
Miscellaneous0%
Financial Analysis of the Government’s Funds As noted earlier, the City uses fund accounting to ensure and demonstrate compliance with finance-related legal requirements. Governmental funds – The focus of the City’s governmental funds is to provide information on near-term inflows, outflows and balances of spendable resources. Such information is useful in assessing the City’s financing requirements. In particular, unassigned fund balance may serve as a useful measure of a government’s net resources available for spending at the end of a fiscal year. As of end of the current fiscal year, the City’s governmental funds reported combined ending fund balances of $179,431,370, a decrease of $17,193,704 from the prior year. Approximately 7 percent of this total amount ($13,046,521) constitutes unassigned fund balance, which is available for spending at the government’s discretion. The remainder of fund balance is either nonspendable, restricted, committed or assigned to indicate that it is not available for new spending. The General Fund is the chief operating fund of the City. At the end of the current fiscal year, unassigned fund balance of the General Fund was $13,046,521 while total fund balance reached $18,905,836. As a measure of the General Fund’s liquidity, it may be useful to compare both unassigned fund balance and total fund balance to total fund expenditures. Unassigned fund balance represents 17.9 percent of total General Fund expenditures, while total fund balance represents 26 percent of that same amount. The fund balance of the City’s General Fund increased by $6,109,225 during the current fiscal year compared to a decrease of $1,593,794 in the previous year. Key factors in the current year change are as follows:

• Sales tax revenues within the General Fund increased $1,625,379 or 4.3% from the prior fiscal year. • Use tax revenues within the General Fund increased $1,005,619 or 36.1% from the prior fiscal year. • The UNP TIF Fund transfened $4,275,508 to the General Fund to return over apportioned funds.
The Public Safety Sales Tax Fund has a total fund balance of $23,889,024 all of which is restricted for public safety activities. The net decrease in fund balance during the current year was ($2,752,961). A portion of this decrease was due to spending of note proceeds for the Emergency Communications System Project ($854,498) received in prior years.
The Debt Service Fund has a total fund balance of $5,769,156 all of which is restricted for the payment of debt service. The net decrease in the fund balance during the current year was ($2,869,002) due to normally scheduled payments.
The Capital Projects Fund has a total fund balance of $66,255,511. The net increase in fund balance during the current year was $4,645,727. This net increase was due to the issuance of a new $6,105,000 loan to fund the upgrade of City computer systems offset by the spending down of general obligation bond monies received in previous years.
The NORMAN FORWARD Fund has a total fund balance of $54,663,144. The net decrease in fund balance during the current year was ($15,357,050). This net decrease was due to spending down of previous note monies received in the previous year.
Proprietary funds The City's proprietary funds provide the same type of information found in the government-wide financial statements, but in more detail.
Unrestricted net position of the NMA and NUA funds were $12,746,464 and $31,653,751 respectively. The total growth in net position for these funds was $1,954,405 and $11,111,569, respectively. Other factors concerning the finances of these two funds have already been addressed in the discussion of the City's business-type activities.
General Fund Budgetary Highlights
During the year there was a $2,911,221 increase in appropriations between the original and final amended budget. Following are the main components of the increase:
• $1,072,962 in increases to the general government budget. Legal Administration received $389,659 in increases with $403,112 relating to legal fees. Also, the Information Technology Department received $336,911 in increases with the most significant being $130,002 from various sources to purchase computer software.
• $916,499 in increases to the public works budget. The Stormwater Drainage Department received $415,558 in increases with the most significant being $412,008 representing roll-over encumbrances from the prior year for the purchase of heavy equipment.
• $741,115 in increases to the public safety budget. Fire Suppression received $207,621 in increases with $132,291 relating to the purchase of fire fighting equipment.
On June 28, 2011, the City adopted ordinance 0-1011-58 changing the City's reserve policy. The ordinance establishes that the General Fund will have an unappropriated reserve of at least three percent (3o/o) of annually budgeted expenditures, in addition to an appropriated emergency reserve of two percent (2%) of annually budgeted expenditures. In addition, the ordinance establishes the Net Revenue Stabilization Fund (i.e., "Rainy Day Fund") which has a targeted balance of not less than three percent (3%) but not more than six percent (6%) of annually budgeted General Fund expenditures. As of June 30,
- 13 -
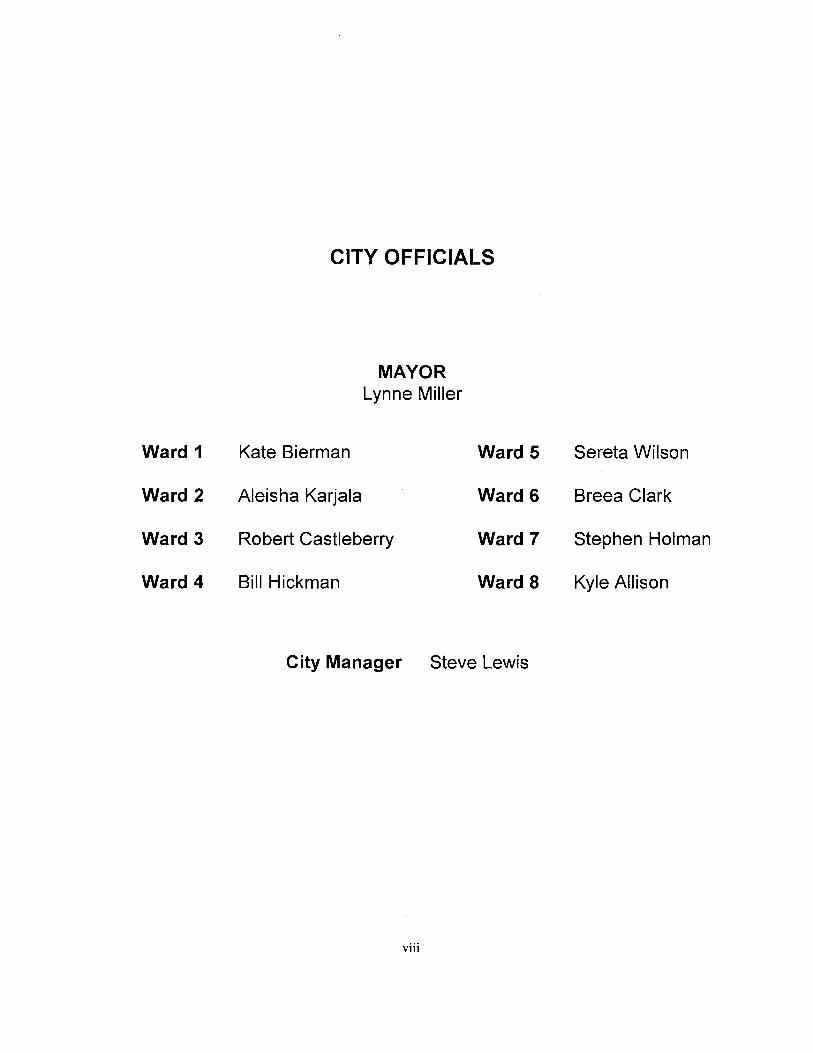
2018 the Rainy Day Fund had a balance of $3,331,295 which represents 4.59% of General Fund expenditures.
Subsequent to year-end, the Rainy Day Fund ordinance was amended to reduce the appropriated emergency reserve amount from two percent (2%) of annually budgeted expenditures to one percent (1 %).
The net difference between the General Fund amended budget and actual amounts received/expended can be briefly summarized as follows:
• General Fund revenues were below expectations by $1,783,462. o Sales taxes were below expectations by $939,400. o Use taxes were above expectations by $879,686. o Franchise fees were below expectations by $762,686, mainly within the telephone and basic cable
franchises. o Permits were below expectations by $428,829, the most significant being within the building multi-
family category due to the slowing of construction in this category. • General Fund expenditures and encumbrances were below expectations by $7,241,088.
o City Council expenditures were $1,509,563 below expectation due to lack of expense of all the 2% reserve.
o City Manager's expenditures were $216,994 below expectation due to cost cutting measures (i.e., mandatory 2% across-the-board cut).
o Street Maintenance expenditures were $619,2 77 below expectation due to budgeted but unpurchased heavy equipment.
o Stonnwater Drainage expenditures were $886,010 below expectations also primarily within the salary and benefits category.
o Fleet Fuel and Parts expenditures were $562,532 below expectations due to savings within outside fuel inventory and fleet parts heavy duty.
• Net General Fund transfers were $399,373 less than expected. The Capital Fund transferred $2,887,277 to the General Fund to cover purchases of capital outlay; this was less than expected.
The City closed the year with a fund balance that was higher than what was budgeted by $5,058,253.
Capital Asset and Debt Administration
Capital assets - The City's gross investment in capital assets for its governmental and business-type activities as of June 30, 2018, amounted to $687,808,773 (net of accumulated depreciation). This investment in capital assets includes land, buildings, improvements, machinery and equipment, roads, highways and bridges. The total increase in the City's investment in capital assets for the current fiscal year was 6.9% (9.3o/o increase for governmental activities and a 3.7% increase for business-type activities).
- 14-

Capital Assets As of June 30
Govermnental activities Business-type activities Total 2018 2017 2018 2017 2018 2017
Land $ 64,275,203 $ 63,348,053 $ 10,344,901 $ 10,344,901 $ 74,620,104 $ 73,692,954 Buildings and improvements 80,069,897 66,225,695 192,709,102 188,311 ,397 272,778,999 254,537,092 Machinery and equipment 57,640,920 55,763,801 162,714,967 154,054,153 220,355,887 209,817,954 Infrastructure 537,745,330 522,919,532 537,745,330 522,919,532 Construction in progress 86,391,702 66,823,373 87,034,673 78,775,426 173,426,375 145,598,799 Less: Accumulated depreciation ( 417, 763,385) ( 40 I ,389,598) ( 173,354,537) (162,137,012) (591,117,922) (563,526,610) Total $ 408,359,667 $ 373,690,856 $ 279,449, I 06 $ 269,348,865 $ 687,808,773 $ 643,039,721
Major capital asset events during the current fiscal year included the following:
• A significant water line was completed at a cost of $5,706,288. • A new aquatic center was completed at a cost of$11,907,286. • A variety ofNorman Forward construction projects were underway; construction in progress related to
Norman Forward projects as of the end of the current fiscal year had reached $25,656,715. • A variety of street and roadway construction projects were underway; governmental construction in
progress as of the end ofthe current fiscal year had reached $56,699,346. • A variety of water and sewer projects were underway; NUA construction in progress as of the end of
the current fiscal year was $86,993,006.
Additional information on the City's capital assets can be found in note 4 on page 43-44 of this report.
Long-term debt At the end of the current fiscal year, the City had total bonded debt outstanding of $52,480,852. Of this amount, $51,788,267 comprises debt backed by the full faith and credit of the government. The remainder of the City's bonded debt represents bonds secured solely by specified revenue sources (i.e., revenue bonds) of $692,585. The City also had notes payable and capital leases outstanding of $172,911,753 and $413,971, respectively, at the end of the current fiscal year which were secured by capital assets and specified revenue sources.
Outstanding Debt As of June30
Governmental activities Business-type activities Total 2018 2017 2018 2017 2018 2017
General obligation bonds $ 51,788,267 $ 63,101,119 $ - $ - $ 51,788,267 $ 63,101,119 Revenue bonds 692,585 839,481 692,585 839,481 Capital leases 413,971 819,121 413,971 819,121 Notes payable 107,790,000 106,440,000 65,121,753 55,659,281 172,911,753 162,099,281 Total $ 159,992,238 $ 170,360,240 $ 65,814,338 $ 56,498,762 $ 225,806,576 $ 226,859,002
The City's total debt decreased by $1,052,426 (0.5 percent) during the current fiscal year. Key factors of
- 15 -

this change were issuance of the Norman Municipal Authority, Sales Tax Revenue Note, Series 2017B ($6,105,000). The City also drew $8,651,446 and $6,891,969 on the Oklahoma Water Resources Board, Series 2014loan and Oklahoma Water Resources Board, Series 2018 loan, respectively. Also, the City made its normally scheduled payments.
The City maintained an "Aa2" rating from Moody's for those general obligation debt issues that are rated by the service. The NUA maintained an "Aa3" rating from Moody's for those debt issues that they rate.
Additional information on the City's long-term debt can be found in note 4 on pages 59-65 of this report .
.Economic Factors and Next Year's Budgets and Rates
• The unemployment rate for the Oklahoma City metropolitan area which includes Norman is currently 3.5 percent. This is the same as the state's average unemployment rate of 3.5 percent and compare favorably to the national average rate of 4.0 percent.
• Inflationary trends in the region compare favorably to national indices. • The City's major source of revenue is sales tax revenue. Sales tax revenue increased 0.8% over the
prior year total.
All of these factors were considered in preparing the City's budget for the 2019 fiscal year.
Requests for Information
This financial report is designed to provide a general overview of the City's finances for all those with an interest in the government's finances. Questions concerning any of the information provided in this report or requests for additional financial information should be addressed to the Office of the Finance Director, 201 West Gray, Building C, Norman, Oklahoma, 73069.
- 16-
THE CITY OF NORMAN, OKLAHOMA STATEMENT OF NET POSITION JUNE 2018
ASSETS Current assets:
Cash and cash equivalents Restricted cash and cash equivalents Investments Restricted investments Receivables: Taxes Accounts, net of allowance for estimated
uncollectible Business-Type accounts of$1,073,316 Interest Other
Due from Federal Government Internal balances Inventory
Total current assets Non-current assets:
Restricted cash and cash equivalents Restricted investments Capital assets not subject to depreciation Capital assets, net
Total non-current assets
Total assets
DEFERRED OUTFLOW OF RESOURCES Deferred resources related to pensions Deferred resources related to OPEB Deferred charge on refunding
Total deferred outflows of resources
LIABILITIES Current liabilities:
Accounts payable and other accrued liabilities Payroll payable Accrued interest payable Retainage payable Guaranty deposits Current portion of long-term debt
Total current liabilities
Non-current liabilities: Long-term debt and other liabilities
Total non-current liabilities
Total liabilities DEFERRED INFLOW OF RESOURCES Deferred resources related to pensions Deferred resources related to OPEB
Total deferred inflows of resources
NET POSITION Net investment in capital assets Restricted for:
Debt service Capital improvements Public safety Public parks and recreation Public service Public works
Unrestricted (deficit) Total net position
See notes to financial statements.
$
Governmental
Activities
- 17-
28,686,559 106,525,897 38,466,544
5,477,572
14,612,468
2,283,512 230,609
17,537 1,523,423
(1,213,566)
196,635,453
14,099,335 883,148
4,549,301 1,590,542 1,482,853 1,527,915 6,763,378
249,992,851
3,570,874 1,002,272
4,573,146
313,981,902
5,769,156 51,122,910 25,073,264
1,437,105 5,564,619 1,303,767
$
Business-Type
Activities
12,894,481 2,450,063
38,571,03 I
5,002,447 148,651
1,213,566
542,261 7,847,587
96,904,515
4,454,921 321,072 417,109
1,041,115 1,642,992
75,009,358
212,565,194
1,043,774 15,914,341
$
Total
41,581,040 108,975,960 77,037,575
5,477,572
14,612,468
7,285,959 379,260
17,537 1,523,423
542,261 7,847,587
247,571,420
14,099,335 883,148
9,004,222 1,911,614 1,899,962 2,569,030 8,406,370
274,986,419 274,986,419
325,002,209
3,570,874 1,002,272
4,573,146
526,547,096

THE CITY OF NORMAN, OKLAHOMA STATEMENT OF ACTIVITIES FOR THE YEAR ENDED JUNE 30, 2018
Net (Expense) Revenue and Program Revenues Changes in Net Assets
Operating Capital Primary Government Charges for Grants and Grants and Governmental Business-Type
Function/Programs Expenses Services Contributions Contributions Activities Activities Total Primary government Governmental activities:
General government $ 12,859,373 $ 2,767,032 $ - $ $ (10,092,341) $ $ (10,092,341) Planning 3,477,364 992,383 - (2,484,981) (2,484,981) City controller 2,449,352 683,215 - - (1,766,137) - (1,766,137) Parks and recreation 6,502,407 497,538 10,492 - {5,994,377) (5,994,377) Public works 26,682,973 1,440,442 9,476,361 (15, 766, 170) (15,766,170) Public service 2,627,283 - 7,389,845 4,762,562 4,762,562 Public safety 55,817,838 3,256,469 5,729,729 (46,831,640) ( 46,831 ,640)
Interest on long-term debt 4,937,107 - - (4,937,107) (4,937,107) Total governmental activities 115,353,697 8)96,637 14,570,508 9,476,361 (83,110)91) (83,110,191)
Business-type activities: Westwood Park 1,500,752 1,264,059 - - (236,693) (236,693) Water 16,321,995 21,843,184 - 2,506,439 8,027,628 8,027,628 Wastewater 14,627,959 15,781,490 - 2,756,986 - 3,910,517 3,910,517 Sanitation 12,878,886 14549,273 - 1,670,387 1,670,387
Total business-type activities 45,329,592 53,438,006 5,263,425 13,371,839 13,371,839 Total primary government $ 160,683,289 $ 61,634,643 $ 14,570,508 $ 14,739,786 (83,110,191) 13,371,839 (69, 738,352)
General revenues: Taxes (unrestricted unless otherwise noted):
Sales taxes 39,638,374 39,638,374 Sales taxes - restricted 34,329,335 34,329,335 Excise taxes -restricted 1,319,885 1,319,885 Franchise taxes 7,094,490 7,094,490 Property taxes -restricted 11,971,525 - 11,971,525 Use taxes 3,792,258 - 3,792,258 Use taxes - restricted 1,356,059 1,356,059 Hotel/Motel taxes 1,879,453 1,879,453 Alcoholic beverage taxes 324,252 - 324,252 Cigarette taxes 834,649 834,649
Investment earnings 1,586,732 472,025 2,058,757 Miscellaneous 3,627,956 (940,246) 2,687,710 Transfers 1,157,529 (1,157,529)
Total general revenues and transfers 107,592,612 (305,865) 107,286,747
Change in net position 24,482,421 13,065,974 37,548,395 Net position - beginning 341,053,111 260,857,550 601,910,661 Net position - ending $ 365,535,532 $ 273,923,524 $ 639,459,056
See notes to financial statements.
- 18-

THE CITY OF NORMAN, OKLAHOMA
BALANCE SHEET
GOVERNMENTAL FUNDS
JUNE 30, 2018 Other
Public Safety Debt Capital Norman Governmental General Sales Tax Service Projects
ASSETS
Cash and cash equivalents $ 3,754,462 $ $ $ 13,082,083 Investments 7,370,941 7,490,632 9,784,503 Receivables: Taxes 8,421,094 1,675,593 2,653,145
Accounts 1.,502,845
Interest 23,423 31,868 23,802 56,959 Other 17,537
Due from Federal Government 147,343 153,648
Due from other funds 296,585 701,445 Inventory 24,898 Restricted Assets: Cash and cash equivalents 2,412,953 43,128,428 Investments
Total assets
LIABILITIES AND FUND BALANCES
LIABILITIES
Accounts payable and other accrued liabilities $ 1,305,833 $ 1.17,921 $ $ 1,487,308
Payroll payable I ,337,255 207,630 24,645
Due to other funds 80,619 1,745,278 Retainage payable Guaranty deposits 5,135,240
Total liabilities 7,778,328 406,170 1,745,278
FUND BALANCES
Nonspendable 24,898 Restricted 23,889,024 5,769,156 62,788,293
Committed 3,331,295 Assigned 2,503,122 3,467,218 Unassigned
Total fund balances
Total liabilities and fund balances balances
Amounts reported for governmental activities in the statement of net position are different because: Capital assets used in governmental activities are not financial resources and, therefore, are not reported
in the funds.
Forward
$ 5,581,892 $ 7,902,846
I ,675,593
75,753
523,926
41,144,735
$ 1,268,643 $
972,958
54,048,738
614,406
Internal service funds are used by management to charge the costs of risk management activities to individual funds. The assets, deferred outflow of resources, liabilities and deferred inflows of the internal service funds arc included in governmental activities in the statement of net position.
Funds
6,268,122 2,358,501
187,043
346 7,494
1,222,432
539,145
247,747 13,826
372,811
9,489,731
458,968
Long-term liabilities, including bonds payable and net pension liability (including related deferred outflows/inflows of resources) are not due and payable in the current period and, therefore, are not reported in the funds.
Net position of governmental activities Sec notes to financial statements.
- 19 -
Total
Governmental Funds
$ 28,686,559 34,907,423
14,612,468
1,503,191 219,299
17,537 1,523,423 2,061,101
24,898
$ 4,427,452
I ,583,356 1,825,897 1,527,915
24,898 15 5,984,942
3,331,295 7,043,714
179,431,3 70
408,359,667
236,249

THE CITY OF NORMAN, OKLAHOMA
STATEMENT OF REVENUES, EXPENDITURES AND CHANGES IN FUND BALANCES-GOVERNMENTAL FUNDS
THE YEAR ENDED Other Total
Public Safety Debt Capital Norman Governmental Governmental
General Sales Tax Service Projects Forward Funds Funds Revenues:
Taxes $ 50,525,122 $ 9,889,503 $ 10,404,106 $17,473,807 $ 9,889,503 $ 1,879,453 $ 100,061,494
Licenses and permits 1,103,706 1,103,706
Intergovernmental revenues 2,233,277 507,621 7,759,943 10,500,841
Charges for services 11,587,710 69,389 11,657,099
Fines and forfeitures 2,365,632 2,365,632
Investment earnings 64,931 215,696 71,645 423,715 519,735 34,489 1,330,211
Other 2,019,710 651,752 8,500 3,465,535
Total revenues 69,900,088 10,756,951 10,475,751 18,942,527 10,417,738 130,484,518
Expenditures: Current:
General government 9,769,537 108,017 803,347 10,680,901
Planning 3,420,577 216,700 3,637,277
City controller 3,399,023 103,875 3,502,898
Parks and recreation 4,285,600 736,079 151,013 76,446 5,249,138
Public works 13,973,280 4,887,946 36,152 9,354 18,906,732
Public service 2,661,647 2,661,647
Public safety 35,630,450 9,645,091 145,917 343,084 45,764,542
Capital outlay 2,117,875 1,517,935 11,177,329 21,722,775 6,561,391 43,097,305
Debt service:
Principal retirement 1,865,000 11,085,000 1,895,150 1,400,000 16,245,150
Interest and fiscal charges 481,886 I ,607,990 1,661,501 4,544,564
Total expenditures 13,509,912 12,692,990 20,064,200 25,774,788 9,651,922 154,290, !54
Excess (deficiency) of revenues
over (under) expenditures (2,696,254) {2,752,961) (2,21 7,239) (15,357 ,050) 339,541 (23,805,636)
Other financing sources (uses):
Transfers in 9,085,566 7,643,687 16,729,253
Transfers out (280,087) (651,763) (7,981,287) (7,309,184) ( 16,222,321)
Issuance of debt 6,105,000 6,105,000
Net other financing
sources (uses) 8,805,479 (651,763) (7,309,1 84) 6,611,932
Net change in fund balances 6,109,225 (2,869,002) 4,645,727 ( 15,357 ,050) (6,969,643) (17,193,704)
Fund balances, July 1 , 20 I 7 12,796,611 26,641,985 8,638,158 61,609,784 70,020,194 16,918,342 196,625,074
Fund balances, June 30, 2018
See notes to financial statements.
- 20-

THE CITY OF NORMAN, OKLAHOMA
RECONCILIATION OF THE STATEMENT OF REVENUES, EXPENDITURES, AND CHANGES IN FUND BALANCES OF GOVERNMENTAL FUNDS TO THE STATEMENT OF ACTIVITIES FOR THE YEAR ENDED JUNE 30, 2018
Amounts reported for governmental activities in the statement of activities are different because:
Net change in fund balances- total governmental funds
Governmental funds report capital outlay as expenditures. However, in the statement of activities the cost of those assets is allocated over their estimated useful lives and reported as depreciation expense. This is the amount by which capital outlays exceeded depreciation in the current period.
Contributed capital assets (land, buildings and infrastructure) and other miscellaneous capital asset transactions recorded in government-wide financial statements but not recorded in fund level financial statements
The issuance of long-term debt (e.g., bonds, leases) provides current financial resources to governmental funds, while the repayment of the principal of long-term debt consumes the current financial resources of governmental funds. Neither transaction, however, has any effect on the net position. Also, governmental funds report the effect of premiums, discounts, and similar items when debt is first issued, whereas these amounts are deferred and amortized in the statement of activities. This amount is the net effect of these differences in the treatment of long-term debt and related items.
Some expenses reported in the statement of activities do not require the use of current financial resources and, therefore are not reported as expenditures in the govenmental funds
Increase in liability for incurred claims and compensated absences and miscellaneous expenses in government-wide financial statements
The cost of pension benefits earned, net of contributions made, are reported as an element of pension expense in government-wide financial statements. In the fund-level financial statements only the contributions made are reported as expenditures
Internal service funds are used by management to charge the costs of insurance services to individual funds. The net loss of the internal service fund is reported with governmental activities.
Change in net position of governmental activities
See notes to financial statements
- 21 -
$ (17, 193,704)
25,449,850
9,218,961
10,140,150
(666,341)
59,621
(815,063)
$ 24,482,421

THE CITY OF NORMAN, OKLAHOMA STATEMENT OF NET POSITION- PROPRIETARY FUNDS JUNE 30, 2018
Business-type Activities
Norman Norman Municipal Utilities Authority Authority
ASSETS Current assets:
Cash and cash equivalents $ 2,165,219 $ 10,729,262 $ Restricted cash and cash equivalents 566,455 1,883,608 Investments 10,174,534 28,396,497 Receivables:
Accounts, net of allowance for estimated uncollectible accounts 1,235,290 3,767,157 Interest 32,882 115,769
Due from other funds 182,504 1,031,062 Total current assets 14,356,884 45,923,355
Non current assets: Restricted cash and cash equivalents 542,261 Restricted investments 7,847,587 Capital assets, net 261,898,985
Total noncurrent assets 18,092,382 269,746,572 Total assets 32,449,266 315,669,927
DEFERRED OUTFLOW OF RESOURCES
Deferred charge on refunding Total deferred outflows of resources
LIABILITIES Current liabilities:
Accounts payable and accrued liabilities 425,366 4,029,555 Payroll payable 153,061 168,011 Due to other funds Accrued interest payable 19,899 397,210 Retainage payable 1 ,041,115 Guaranty deposits 398,319 1,244,673 Revenue bonds payable 160,000 Notes payable 420,000 5,634,829 Compensated absences
Total current liabilities 12,570,171 Noncurrent liabilities:
Notes payable, net 1,580,000 57,486,924 Compensated absences 446,781 785,079 Liability for incurred claims Revenue bonds payable, net
Total noncurrent liabilities Total liabilities
NET POSITION Net investment in capital assets 14,845,121 197,720,073 Restricted for debt service 690,497 353,277 Restricted for capital projects 15,914,341 Unrestricted
Total net position
See notes to financial statements.
-22-
Governmental Activities
Internal Total Service Fund
12,894,481 $ 2,450,063
38,571,031 3,559,121
5,002,447 780,321 148,651 11,310
1 60,280,239
542,261 7,847,587
279,449,106 287,838,954
4,454,921 121,971 321,072 7,186
1,448,770 417,109
1,041 '115 1,642,992
160,000 6,054,829
85,951 2,385 14,177,989 1,580,312
59,066,924 1,231,860 34,191
2,500,000
212,565,194 1,043,774
15,914,341 5

THE CITY OF NORMAN, OKLAHOMA STATEMENT OF REVENUES, EXPENSES, AND CHANGES IN FUND NET POSITIONPROPRIETARY FUNDS FOR THE YEAR ENDED JUNE 30,2018
Operating revenues: Golf and pool fees Water service, net Wastewater net Sanitation services, net Self-insurance charges:
Charges for services Risk management administration Workers' compensation Unemployment compensation
Other
Total operating revenues
Operating expenses: Salaries and benefits Supplies and materials Services, maintenance and claims Depreciation and amortization
Total operating expenses
Operating income (loss)
Nonoperating revenues (expenses): Excise tax revenue Investment earnings Interest and fiscal charges Miscellaneous income (expense)
Net nonoperating revenues (expenses)
Capital contributions - donated water and sewer distribution systems
Transfers in Transfers out
Net capital contributions and transfers
Net income (loss)
Net position - beginning
Net position- ending
See notes to financial statements
$
Norman Municipal Authority
1,264,059 $
14,348,188
15,810,342
5,225,041 1,102,092 5,962,489 1,934,867
1,585,853
110,338 (129,815) 187,061
246,968
1,954,405
26,327,677
- 23-
Norman Utilities
Authority
- $ 23,042,347 15,781,490
39,202,398
7,214,687 2,543,766
11,666,331 10,301,361
7,476,253
1,319,885 361,687
(1,448,086) (503,098)
5,263,425 689,265
3,904,928
11,111,569
234,529,873
Total
Governmental Activities
Internal Service Fund
1,264,059 $ 23,042,347 15,781,490 14,348,188
12,439,728 3,645,858
17,628,820 12,236,228
45,950,634
9,062, I 06
1,319,885 472,025
(1,577,901) (316,037)
5,263,425 936,233
4,105,896
13,065,974
260,857,550
13,239,126 269,635
74,999 7,506
13,730,332
636,337
15,498,084
16,134,421
(2,404,089)
42,439
(2,361 ,650)
731,850 (81,253)
650,597
(1,711,053)
1,947,302

THE CITY OF NORMAN, OKLAHOMA STATEMENT OF CASH FLOWS· PROPRIETARY FUNDS FOR THE YEAR ENDED JUNE 30, 2018
Cash flows from operating activities: Cash received from customers Cash received from interfund charges for health insurance Cash received from interfund charges for risk management services Cash paid to employees for services Cash paid to suppliers Other receipts (payments) Net cash provided by (used for) operating activities
Cash flows from noncapital financing activities: Transfers in Transfers out
Net cash provided by (used for) noncapital financing activities Cash flows from capital and related financing activities:
Proceeds from disposal of capital assets Payments for the acquisition of capital assets Proceeds from taxes Principal payments on revenue bonds Proceeds from notes payable Principal payments on notes payable Interest and fiscal charges paid Net cash used for capital
and related financing activities Cash flows from investing activities: Proceeds from maturity of investments Payments for purchases of investments Investment earnings received Net cash provided by investing activities
Net change in ca<;h and cash equivalents Cash and cash equivalents - beginning Cash and cash equivalents - ending
$
Reconciliation of operating income to net cash provided by operating activities: Operating income (loss) $ Adjustments to reconcile operating income (loss) to net
cash provided by (used for) operating activities; Miscellaneous revenue (expense) Bad debt expense Depreciation (Gain) loss on disposal of property, plant and equipment Increase in accounts receivable, net Decrease in due from Federal Government Increase (decrease) in due from other funds Increase in accounts payable and accrued liabilities Increase in payroll payable Increase in other payable Decrease in liability for incurred claims Decrease in retainage payable Increase in guaranty deposits Increase (decrease) in compensated absences Net cash provided by (used for) operating activities
NONCASH ACTIVITIES: Donated water and sewer distribution systems Change in unrealized loss on investments
See notes to financial statements.
Business-type Activities
Norman Municipal Authority
15,607,141
(5,190,499) (6,917,123)
246,968
146,687 (1 ,402,578)
(150,000)
(575,000)
3,706,243 (2,857,439)
2,074,844
1,585,853
187,061 96,274
1,934,867 (25,334)
(308,905) 225,630
(926,207) 147,458 35,811
9,430
$
$
Norman Utilities
Authority
39,140,100
(7,193,055) (12,327,260)
689,265
23,261 (16,354,09I)
1,3I9,885
15,543,414 (5,507,726)
10,964,938 (1 0,178,872)
10,755,620
7,476,253
(503,098) 275,219
I0,301,36I 539,012
(362,669) 100,623
(2,790,737) 2,213,823
3,309
(330,986) 25,152
$
$
Total
54,747,241
936,233
I69,948 (17,756,669)
1,319,885 (150,000)
15,543,414 (6,082, 726)
l4,67I,181 (13,036,311)
12,830,464
9,062,106
(316,037) 371,493
I2,236,228 513,678
(671,574) 326,253
(3,716,944) 2,361,281
39,120
(330,986) 34,582
-24-
Governmental Activities
lnteral Service Fund
$
$
12,619,223 352,140
(634,448) (16,647,083)
1,606,495
2,881,331 (999,552)
(108,735)
(2,404,089)
(758,969) 128,113 29,612 51,001
304 1,448,770
(1,200,000)

THE CITY OF NORMAN, OKLAHOMA
STATEMENT OF FIDUCIARY NET POSITION
FIDUCIARY FUNDS
JUNE 30, 2018
ASSETS
Cash and cash equivalents
Investments Mutual funds U.S. Agencies
Interest receivable
Loans to 401 (a) Plan participants
Total assets
LIABILITIES AND
NET POSITION
Funds held for others
Net position restricted for defined benefit pensions Net position restricted for defined contribution pensions
Total liabilities and net position
See notes to financial statements.
- 25-
$
Pension
Trust
Fund
90,874,192
$ 94,727,521
$
247,932 94,479,589
Centennial
Agency
Fund
$ 1,623
7,558
24
$ 9,205
$ 9,205

THE CITY OF NORMAN, OKLAHOMA
STATEMENT OF CHANGES IN FIDUCIARY NET POSITIONFIDUCIARY FUNDS FOR THE YEAR ENDED JUNE
ADDITIONS:
Contributions: Employer Employee
Total contributions
Investment income
Total additions
DEDUCTIONS:
Pension benefits paid Administration costs
Total deductions
NET INCREASE
2018
Net position restricted for pension and retirement benefits, Beginning of year
End ofyear
See notes to financial statements.
- 26-
Pension Trust Fund
$ 2,520,077 1,956,255
4,476,332
9,828,725
14,305,057
7,296,514

THE CITY OF NORMAN, OKLAHOMA
NOTES TO FINANCIAL STATEMENTS FOR THE YEAR ENDED JUNE 30, 2018
1. SUMMARY OF SIGNIFICANT ACCOUNTING POLICIES
The accounting and reporting policies of the City of Norman, Oklahoma (the "City") conform to accounting principles generally accepted in the United States of America for state and local governments. Generally accepted accounting principles for municipalities are defined as those principles promulgated by the Governmental Accounting Standards Board ("GASB"). The following represent the more significant accounting and reporting policies and practices of the City.
Reporting Entity - The City is a municipal corporation governed by an elected mayor and eight-member council. The accompanying financial statements present the government and its component units, entities for which the City is considered to be financially accountable. Blended component units, although legally separate entities, are, in substance, part of the City's operations and therefore data from these units are combined with data of the City. Each blended component unit has a June 30 year end.
Blended Component Units - The Norman Municipal Authority ("NMA") was established in April 1965. Activities of the NMA include financing and operating the Westwood Park recreational facilities and sanitation services for the City. The governing body of the NMA is the same as the City's governing body. The City is the sole beneficiary of the NMA and receives all trust properties and resulting revenues upon retirement of all trust indebtedness. The City maintains all accounting records. The NMA is reported as an enterprise fund and does not issue separate financial statements.
The Norman Utilities Authority ("NUA") was established February 2, 1970. Activities ofthe NUA include financing and operating certain utility systems for the City. The governing body of the NUA is the same as the City's governing body. The City is the sole beneficiary of the NUA and receives all trust properties upon termination. The City maintains all accounting records. The NUA is presented as an enterprise fund and does not issue separate financial statements.
The Norman Tax Increment Finance Authority ("NTIF") was established July 11, 2006. Activities of the NTIF include financing Tax Increment Financing District #2- University North Park. The governing body of the NTIF is the same as the City's goven1ing body. The City is the sole beneficiary of the NTIF and receives all trust properties upon termination. The City maintains all accounting records. The NTIF is presented within the Capital Project Fund in the governmental funds balance sheet and does not issue separate financial statements.
The Norman Economic Development Authority ("NEDA") was established June 12, 2012. Activities of the NEDA include financing and operating ecomonic development activities for the City. The governing body of the NEDA is the same as the City's governing body. The City is the sole beneficiary ofthe NEDA and receives all trust properties upon termination. The City maintains all accounting records. As of June 30, 2018, NEDA had no transcations.
Basis ofpresentation -The City follows Governmental Accounting Standards Board ("GASB") statements in the preparation of its financial statements. Additional information regarding the basis of accounting and the differences in presentation are contained in the Management's Discussion and Analysis, which preceded the financial statements.
- 27-

Government-wide and fund financial statements- The goven1ment-wide financial statements (i.e., the statement of net position and the statement of activities) repmi information on all of the nonfiduciary activities of the primary government and its component units. For the most part, the effect of interfund activity has been removed from these statements. Governmental activities, which normally are supported by taxes, intergovernmental revenues and other nonexchange transactions are reported separately from business-type activities, which rely to a significant extent on fees and charges to exten1al customers for support.
The statement of activities demonstrates the degree to which the direct expenses of a given function or segment are offset by program revenues. Direct expenses are those that are clearly identifiable with a specific function or segment. Program revenues include 1) charges to customers or applicants who purchase, use, or directly benefit from goods, services, or privileges provided by a given function or segment and 2) grants and contributions that are restricted to meeting the operational or capital requirements of a particular function or segment. Taxes and other items not properly included among program revenues are reported instead as general revenues.
Separate financial statements are provided for governmental funds, proprietary funds, and fiduciary funds, even though the latter are excluded from the government-wide financial statements. Major individual governmental funds and major individual enterprise funds are reported as separate columns in the fund financial statements. All remaining governmental and enterprise funds are aggregated and reported as non-major funds.
Measurement focus, basis of accounting, and financial statement presentation- The government-wide financial statements are reported using the economic resources measurententfocus and the accrual basis of accounting, as are the proprietary fund and fiduciary fund financial statements with the exception of agency funds which have no measurement focus. Revenues are recorded when earned and expenses are recorded when a liability is incurred, regardless of the timing of related cash flows. Property taxes are recognized as revenues in the year for which they are levied. Grants and similar items are recognized as revenue as soon as all eligibility requirements imposed by the provider have been met.
Governmental fund financial statements are reported using the current financial resources measurement focus and the modified accrual basis of accounting. Revenues are recognized as soon as they are both measurable and available. Revenues are considered to be available when they are collectible within the current period or soon enough thereafter to pay liabilities of the current period. For this purpose, the government considers revenues to be available if they are collected within 60 days of the end of the current fiscal period. Expenditures generally are recorded when a liability is incurred, as under accrual accounting. However, debt service expenditures, as well as expenditures related to compensated absences and claims and judgments are recorded only when payment is due.
Sales taxes, excise taxes, franchise taxes, licenses, and interest associated with the current fiscal period are all considered to be susceptible to accrual and have been recognized as revenues of the current fiscal period. Only the portion of special assessments receivable due within the current fiscal period is considered to be susceptible to accrual as revenue of the current period. Expenditure driven grants are recognized as revenue when the qualifying expenditures have been incurred and all other eligibility requirements have been met. All other revenue items are considered to be measurable and available only when cash is received by the City.
The City reports the following major goven1mental funds:
General Fund- The General Fund is the principal fund of the City which accounts for the general operations of the City and all other financial transactions not reported in other funds.
- 28-

Public Safety Sales Tax Fund- A special revenue fund established to receive revenues from a special half-cent sales tax dedicated to public safety activities.
Debt Service Fund- The Debt Service Fund accounts for the accumulation of financial resources that are restricted or assigned for the payment of interest and principal on the general long-term debt of the City, other than debt service payments made by enterprise funds. Ad valorem taxes and interest earned on investments of the Debt Service Fund are used for the payment of principal, interest and commission to fiscal agents on the City's general obligation bonds and judgments.
Capital Projects Fund- The Capital Projects Fund is used to account for all major capital improvements which have been financed by designated resources, except those accounted for in proprietary funds. Activities of the NTIF are included in this fund.
NORMAN FORWARD Fund A special revenue fund established to receive revenues from a special half-cent sales tax dedicated to quality-of-life projects including multiple recreation facilities, libraries, parks, athletic venues, public art, trails, and swim complexes.
The City reports the following non-major governmental funds:
Special Revenue Funds Special Revenue Funds are used to account for the proceeds of government grants or specific revenue sources (other than grants applicable to enterprise fund activities, expendable trusts or major capital projects) that are legally restricted, commiteed or assigned to expenditures for specified purposes. The City has seven nonmajor special revenue funds including:
• Norman Room Tax Fund- Established by City ordinance to receive revenues from the City hotel/motel occupancy tax. Tax receipts are required to be used for promoting and fostering convention and tourism development in the City.
• Community Development Fund- Established to account for the City's Community Development Block Grants, Home Ownership Made Easy ("HOME") Grants, Rental Rehabilitation and Emergency Shelter Grants received from the US Department of Housing and Urban Development ("HUD").
• Special Grants Fund- Established to account for revenues and expenditures of other miscellaneous grants received from various sources.
• Park Land Fund- Established by City ordinance to receive revenues from developer fees dedicated to the acquisition of park land around the City.
• Seizures and Restitutions Fund- Established to account for the revenue available as a result of property seizures resulting from criminal investigations.
• Cleet Fund- Established to account for revenue derived by provision of State law to be utilized for law enforcement education and training.
• Art in Public Places Fund- Established to account for donations made to provide public art displays throughout the City.
The City repmis the following major proprietary funds:
Norman Municipal Authority A blended component unit established to account for the construction and operation of Westwood Park recreational facilities and the City's sanitation services.
- 29-

Norman Utilities Authority A blended component unit established to account for the water and wastewater utility systems for the City.
Risk Management Internal Service Fund- Established to account for the resources utilized by departments to provide for the self-insurance of Workers' Compensation and Unemployment Insurance and to pay claims and receive premiums on insurance for employee health and property loss on a long-term cost-reimbursement basis.
The City reports the following fiduciary funds:
Pension Trust Funds - The Pension Trust Funds are used to account for the receipt, investment and distribution of retirement contributions to the Annuity Pool portion of the Employee Retirement System of the City. The Employee Retirement System Annuity Pool is a contributory defined benefit plan. The Pension Trust Funds are also used to account for the receipt, investment and distribution of retirement contributions from the City and employees to the Section 40l(a) portion of the Employee Retirement System of the City. The Section 401(a) plan is a defined contribution plan for qualifying City employees.
Agency Funds - Agency Funds are custodial in nature and do not present results of operations or have a measurement focus. Agency Funds are accounted for using the accrual basis of accounting. These funds are used to account for assets that the City holds for others in an agency capacity. The City has one agency fund, the Centennial Fund, which was created to account for assets held for the City's firefighters to develop a yearbook celebrating the centennial anniversary of the City ofNorman Firefighters.
As a general rule the effect of interfund activity has been eliminated from the government-wide financial statements. Exceptions to the general rule are payments-in-lieu of taxes and other charges between the government's enterprise funds. Elimination of these charges would distort the direct costs and program revenues reported for the various functions concerned.
Amounts reported as program revenues include 1) charges to customers or applicants for goods, services, or privileges provided, 2) operating grants and contributions, and 3) capital grants and contributions, including special assessments that are restricted to meeting the operational or capital requirements of a particular function or segment. Internally dedicated resources are reported as general revenues rather than as program revenues. Likewise, general revenues include all taxes.
Proprietary funds distinguish operating revenues and expenses from nonoperating items. Operating revenues and expenses generally result from providing services and producing and delivering goods in connection with a proprietary fund's principal ongoing operations. The principal operating revenues of the City's enterprise funds are charges to customers for sales and services. Operating expenses for the enterprise funds and the internal service fund include the cost of sales and services, administrative expenses, and depreciation on capital assets. All revenues and expenses not meeting this definition are reported as nonoperating revenues and expenses.
Accounting Policies- The City's significant accounting policies related to the following financial statement categories are summarized below:
Assets, Liabilities, and Fund Equity
a. Cash and Cash Equivalents- The City considers all highly liquid investments with an original maturity of three months or less when purchased to be cash and cash equivalents.
- 30-

b. Pooled Cash and Investments- The City Charter requires all cash belonging to the City to be placed in the custody of the Financial Services Department of the City. A "Pooled Cash" concept is used in maintaining the cash and investment accounts in the accounting records. Under this method, all cash is pooled for investment purposes and each fund has equity in the pooled amounts. Investments are allocated to the individual participating funds based upon a percentage determined by the Financial Services Department of the City. An interfund receivable/payable is recognized if the allocation of investments to a particular fund exceeds the fund's pooled cash amount before the allocation of the pooled investments.
Purchases and maturities of the pooled investments, as reported in the fund's statement of cash flows, are allocated to the participating proprietary funds based on their portion of total pooled investments.
c. Investments Investments are stated at fair value. Fair value is the amount at which a financial instrument could be exchanged in a current transaction between willing parties. The City considers quoted market price at June 30,2018, to be the fair value of its investments.
Oklahoma Statutes authorize the City to invest in obligations of the United States government, its agencies and instrumentalities; collateralized or insured certificates of deposit and other evidences of deposit at banks, savings banks, savings and loan associations and credit unions located in this state, or fully insured certificates of deposit at banks, savings banks, savings and loan associations and credit unions located out of state; negotiable certificates of deposit issued by a nationally or state-chartered bank, a savings bank, a savings and loan association or a state-licensed branch of a foreign bank; prime banker's acceptances which are eligible for purchase by the Federal Reserve System and which do not exceed 270 days' maturity; prime commercial paper which shall not have a maturity that exceeds 180 days nor represent more than 10% of the outstanding paper of an issuing corporation; repurchase agreements that have underlying collateral consisting of those items specified above; and money market funds regulated by the Securities and Exchange Commission and which investments consist of those items noted above.
The Pension Trust Fund is invested based on guidelines established by its separate Board of Trustees.
d. Receivables and payables In the government-wide financial statements, receivables consist of all revenues earned at year-end and not yet received. Allowances for uncollectible accounts receivable are based upon historical trends and the periodic aging of accounts receivable.
In the governmental fund financial statements, receivables are recorded when they are both measurable and available. Proprietary fund receivables consist of all revenues earned at year-end and not yet received.
e. Interfund Receivables and Payables Activity between funds that are representative of lending/borrowing arrangements outstanding at the end of the fiscal year are referred to as either "due to I due from other funds" (i.e., the current portion of interfund loans) or "advances to I from other funds" (i.e., the non-current portion of interfund loans). All other outstanding balances between funds are reported as "due to I from other funds." Any residual balances outstanding between the governmental activities and business-type activities are reported in the govenlment-wide financial statements as "internal balances."
f. Restricted Assets Restricted assets include cash and investments of both governmental activities and business-type activities that are legally restricted as to their use. The restricted assets are primarily related to debt trustee accounts and guaranty deposits.
- 31 -

g. Capital Assets Capital assets, which include property, plant and equipment and infrastructure assets (e.g., roads, bridges, sidewalks, and similar items), are reported in the applicable governmental or business-type activities columns in the government-wide financial statements. Capital assets are defined by the government as assets with an initial, individual cost of more than $2,500 (amount not rounded) and an estimated useful life in excess of two years. Such assets are recorded at historical cost or estimated historical cost if purchased or constructed. Donated capital assets, the majority of which generally consist of donated land and infrastructure which is recorded in the governmental funds and donated water and sewer distribution systems which are recorded in the proprietaty funds, are recorded at acquisition value at the date of donation.
The costs of normal maintenance and repairs that do not add to the value of the asset or materially extend assets lives are not capitalized.
Land and construction in progress are not depreciated. The other property, plant, equipment and infrastructure are depreciated using the straight line method over the following estimated useful lives:
Buildings Infrastructure Improvements other than buildings & infrastructure Machinery and equipment Vehicles
40-65 years 25 50 years 10 20 years 3 20 years
3 7 years
h. Inventory- The City records parts and fuel inventory within the General fund. Parts inventory is valued at actual cost using the first-in/first out method. Fuel inventory is recorded using average cost. The cost of such inventories is recorded as expenditures/expenses when consumed rather than when purchased.
1. Long-term Debt- In the government-wide financial statements and proprietary fund types in the fund financial statements, long-term debt is reported as liabilities in the applicable governmental activities, business-type activities, or proprietary fund type statement of net position. Bond premiums and discounts, and losses on refunding are deferred and amortized over the life of the bonds using the effective interest method. Bonds payable are reported net of the applicable bond premium or discount and deferred losses on refunding. Bond issuance costs are expensed during the current period.
In the fund financial statements, governmental fund types recognize bond premiums and discounts, as well as bond issuance costs, during the current period. The face amount of debt issued is reported as other financing sources. Premiums received on debt issuances are reported as other financing sources while discounts on debt issuances are reported as other financing uses. Issuance costs, whether or not withheld from the actual debt proceeds received, are reported as debt service expenditures.
j. Liability for Incurred Claims - The liability for incurred claims represents estimated claims (including future claim adjustment expenses) incurred but unpaid for workers compensation, group medical and dental, and unemployment claims as of the fiscal year end. The estimate includes claims reported as of June 3 0, 2018, as well as an estimated amount representing claims incurred but not reported. The City utilizes the services of an actuary in computation of the incurred but unpaid workers compensation portion of the liability.
k. Claims and Judgments Payable - Under state law, judgments against the City can be paid over three years or can be paid immediately. The General Fund pays all claims and judgments. A liability has been recorded within the government-wide statements for claims and judgments
- 32-

payable. A liability for these amounts is reported in governmental funds when they become due and payable.
1. Compensated Absences - Under the terms of union contracts and City personnel policies, City employees are granted vacation and sick leave in varying amounts. In the event of termination, an employee is paid for vacation leave accumulated and vested accumulated sick leave. Vesting of sick leave by employees and the maximum number of hours that can be accumulated for vacation and sick leave are dependent upon an employee's years of service. Upon retirement, one-half of accumulated sick leave is converted to vacation time, subject to the above limitation for maximum compensation for unused compensated absences.
A liability has been recorded within the government-wide and proprietary financial statements for accrued vacation and sick leave and certain salary related payments associated with the payment of compensated absences. A liability for these amounts is reported in governmental funds only if they have matured, for example, as a result of employee resignations and retirements.
m. Fund Equity- In the government-wide financial statements, equity is classified as net position and displayed in three components:
1. Net investment in capital assets Consists of capital assets, net of accumulated depreciation and reduced by the outstanding balances of any notes or other borrowings attributable to those assets.
2. Restricted net position Consists of net position with constraints placed on the use either by external groups, such as grantors or laws and regulations of other governments, or law through constitutional provisions or enabling legislation.
3. Unrestricted net position All other assets that do not meet the definition of "restricted" or "net investment in capital assets."
When both restricted and unrestricted net positions are available for use, generally it is the City's policy to use restricted resources first. For projects funded with tax-exempt debt proceeds and other sources, the debt proceeds are used first.
Governmental fund equity is classified as fund balance. Fund balance is further classified as follows and based on the nature of any limitations requiring the use of resources for specific purposes.
a) Nonspendable- Includes fund balance amounts that cannot be spent either because it is not in spendable form or because of legal or contractual requirements.
b) Restricted Includes fund balance amounts that are constrained for specific purposes which are externally imposed by providers, such as creditors or amounts constrained due to constitutional provisions or enabling legislation.
c) Committed- Includes fund balance amounts that are constrained for specific purposes that are intemally imposed by the City through formal action of the highest level of decision making authority. The City Council is the highest level of decision making authority that can, by adoption of an Ordinance prior to the end of the fiscal year, commit fund balance. Once adopted, the limitation imposed by the ordinance remains in place until a similar action by City Council is taken (the adoption of another ordinance) to remove or revise the limitation.
- 33-

d) Assigned- Amounts in the assigned fund balance classification are intended to be used by the government for specific purposes but do not meet the criteria to be classified as committed. The City Council may assign fund balance as it does when appropriating fund balance to cover a gap between estimated revenue and appropriations in the subsequent year's appropriated budget. Unlike commitments, assignments generally only exist temporarily. In other words, an additional action does not normally have to be taken for the removal of an assignment. Conversely, as discussed above, an additional action is essential to either remove or revise a commitment.
e) Unassigned- Includes the residual balance of the General Fund that has not been assigned to other funds and that has not been restricted, committed, or assigned to specific purposes with the General Fund.
When both restricted and unrestricted sources (the total of committed, assigned, and unassigned fund balance) are available for use, generally it is the City's policy to use restricted resources first. Further, when the components of unrestricted fund balance can be used for the same purpose, committed fund balance is depleted first, followed by assigned fund balance. Unassigned fund balance is applied last.
Cost Sharing Defined Benefit Pension Plans
The City participates in two cost-sharing multiple-employer defined benefit pension plans, the Oklahoma Firefighters Pension & Retirement System (OFPRS) and the Oklahoma Police Pension and Retirement System (OPPRS) (the Plans). For purposes of measuring the net pension asset, liability, deferred outflows of resources and deferred inflows of resources related to the pensions, and pension expense, information about the fiduciary net position of the Plan and additions to/deductions from the: Plan's fiduciary net position have been determined on the same basis as they are reported by the Plan. For this purpose, benefit payments (including refunds of employee contributions) are recognized when due and payable in accordance with the benefit terms. Investments are reported at fair value.
Defined Benefit Other Postemployment Benefit Plan
The City has a single-employer defined benefit other postemployment benefit (OPEB) plan, (the OPEB Plan). For purposes of measuring the total OPEB liability, deferred outflows of resources and deferred inflows of resources related to OPEB, and OPEB expense, these line items have been determined on the same basis as they are reported by the OPEB Plan. For this purpose, benefit payments are recognized when due and payable in accordance with the benefit terms.
Deferred outflows/inflows of resources
Deferred outflows of resources represent a consumption of net position that applies to a future period(s) and so will not be recognized as an outflow of resources (expense) until then. The City has a deferred outflow for a bond refunding, which is the difference in the carrying value of refunded debt and its reacquisition price. This amount is deferred or amortized to interest expense over the shorter of the life of the refunded or new debt. In addition, the City has deferred outflows related to pensions or other post employment benefits (OPEB), with one being the amount of contributions made to the pension plans after the measurement date, and the other the difference in investment experience between actual earnings and projected earnings on pension plan investments and the difference in assumption changes. Deferred outflows related to contributions made after the measurement date will be recognized as a reduction of net pension or OPEB
- 34-

liability in the following year. The remaining amounts will be amortized to pension expense over future periods as shown in Note 4(b) and 4(c).
Deferred inflows of resources represent an acquisition of net position that applies to a future period(s) and so will be recognized as an inflow of resources (revenue) until then. The City has a deferred inflow related to pensions and OPEB plans. This consists of the difference between the expected and actual experience related to the pension plans as well as the difference in assumption changes. These amounts are amortized over future periods to pension expense.
Revenues, Expenditures and Expenses
a. Property Tax Revenue- Property taxes attach an enforceable lien on property as of January 1. Taxes are levied annually on November 1 and are due one-half by December 31 and one-half by March 31. The Tax Assessor's office bills and collects the property taxes and remits to the City its portion. Property taxes not paid prior to April are considered delinquent. Such delinquent tax payments have not historically been material. Delinquent tax payments are received throughout the year and are recognized as revenue in the year received, except for those received within 60 days of year end, which are recognized as revenues as of June 30, 2018 in both the government-wide and fund financial statements.
b. Sales Taxes- Sales taxes are collected by vendors and required to be remitted to the State of Oklahoma by the 20th of the month following collection. The tax is then paid to the City by the 1Oth of the next month. A two month lag exists between collection by the vendor and payment to the City by the State. Revenue received in July and August from sales made in May and June, respectively, is available for prior year expenses and is accrued in both the government-wide and fund financial statements.
c. Charges for Service Charges for services consist primarily of charges made by the General Fund for services such as motor pool usage, printing, accounting, data processing, facilities usage and other benefits provided to the other funds of the City.
d. Intergovernmental Revenues/Capital Grants Earned- Revenues from Federal and State operating grants are recognized when expenditures are made. Similarly, capital grants are considered earned when the expenditures are made. The earned portion of capital grants in Proprietary Funds is treated as a capital contribution within the statement of revenues, expenses and changes in fund net position.
e. Investment Earnings- Investment earnings on pooled cash and investments are allocated on a pro-rata basis to the City's funds based on the percentage of each fund's average month-end pooled cash balance.
Use of Estimates - The preparation of financial statements in conformity with accounting principles generally accepted in the United States of America requires management to make estimates and assumptions that affect the reported amounts of assets, deferred outflows of resources, liabilities and deferred inflows of resources and disclosure of contingent assets and liabilities at the date of the financial statements and the reported amounts of revenues and expenses during the reporting period. Actual results could differ from those estimates.
Adoption of Accounting Principles-
GASB Statement No. 75 Accounting and Financial Reporting for Postemployment Benefits Other than Pensions
- 35-

The City implemented Governmental Accounting Standard Board (GASB) Statement No. 75, Accounting and Financial Reporting for Postemployment Benefits other than Pensions, for 2018. The statement includes guidance for accounting for participating employers both defined benefit and defined contribution other postemployment benefit plans (OPEB) that are administered through trusts or equivalent arrangements. The note disclosure and required supplementary information requirements for employers whose employees are provided with other postemployment benefits through plans that are not administered through trusts also are addressed. Finally, the statement includes guidance on accounting for special funding situations where an entity other than the employer government is legally responsible for plan contributions.
The Statement also requires employers participating in cost-sharing multiple-employer plans to recognize their proportional share of the plan's collective total OPEB liability, OPEB expense and deferred outflows of resources and deferred inflows of resources in the employer's financial statements. The OPEB expense is no longer based on the contractually required contribution or contributions actually made, but is actuarially determined. This results in the OPEB expense and liability being recognized as benefits are earned by employees, and increases current OPEB expense along with the recognition of the proportional share of the total OPEB liability. This information has been added to Note 4 and to the required supplementary information, as required. It was deemed not necessary to restate periods prior to 2018 because the impact was not significant to those periods.
2. RECONCILIATION OF GOVERNMENT-WIDE AND FUND FINANCIAL STATEMENTS
Explanation of certain differences between the governmental fund balance sheet and the governmentwide statement of net position - The governmental fund balance sheet includes a reconciliation between fund balance total governmental funds and net position governmental activities as reported in the government-wide statement of net position. One element of that reconciliation explains that "long-term liabilities, including bonds payable and net pension and OPEB liabilities (including related deferred outflows/inflows of resources), are not due and payable in the current period and therefore are not reported in the funds." The details ofthis $222,491,754 difference are as follows:
General obligation bonds payable Deferred charge on refunding Revenue bonds payable Notes payable Capital leases payable Compensated absences Net OPEB obligation Net pension liability Deferred outflows of resources Deferred inflow of resources Accrued interest payable Net adjustment to reduce fund balance- total governmental funds to arrive at
net assets - governmental activities
$ 51' 788,267 (123,926)
91,360,000 16,430,000
413,971 8,185,061
10,999,326 52,365,539
(14,982,483) 4,573,146 1,482,853
Explanation of certain d!fferences between the governmental fund statement of revenues, expenditures, and changes in fund balances and the government-wide statement of activities- The governmental fund statement of revenues, expenditures, and changes in fund balances includes a reconciliation between net changes in fund balances - total governmental funds and changes in net
- 36-

position of governmental activities as reported in the government-wide statement of activities. One element of that reconciliation explains that "Governmental funds report capital outlays as expenditures. However, in the statement of activities the cost of those assets is allocated over their estimated useful lives and reported as depreciation expense." The details of this $25,449,850 difference are as follows:
Capital outlay Depreciation expense Net adjustment to increase net changes in fund balances- total governmental funds
to arrive at changes in net position of governmental activities
$ 43,097,305 (17,647,455)
$ 25,449,850
Another element of that reconciliation states that "Contributed capital assets (land, buildings, and infrastructure) and other miscellaneous capital asset transactions recorded in government-wide financial statements but not recorded in fund level financial statements." The details of this $9,218,961 difference are as follows:
Donations of capital assets increase net position in the statement of activities, but do not appear in the governmental funds because they are not financial resouces.
In the statement of activities, only the gain on the sale of capital assets is reported. However, in the governmental funds, the proceeds from the sale increase financial resources. Thus, the change in net position differs from the change in fund balance by the cost of the capital asset sold.
The statement of activities reports gains arising from the trade-in of existing capital assets to acquire new capital assets. Conversely, governmental funds do not report any gain or loss on a trade-in of capital assets.
Net adjustment to increase net changes in fund balances- total governmental funds to arrive at changes in net position of governmental activities
$ 9,229,361
123,835
Another element of that reconciliation states that "Some expenses reported in the statement of activities do not require the use of current financial resources and, therefore are not reported as expenditures in the governmental funds." The details ofthis $666,341 difference are as follows:
Accrued interest payable Change in net pension and OPEB obligations Change in debt issuance premium or discount Net adjustment to increase net change in fund balances total goven1mental funds
to arrive at changes in net assets of governmental activities
3. STEWARDSHIP, COMPLIANCE AND ACCOUNTABILITY
$
$
392,543 487,880
(214,082)
666,341
Budgets and Budgetary Accounting- The City Manager is required by City Charter and the Oklahoma Municipal Budget Act to prepare and submit an annual budget to the City Council. A budget is prepared
- 37-

and legally adopted for the General Fund; Special Revenue Funds, Debt Service Fund, and Capital Projects Fund. These budgets are prepared on a cash basis for revenues, except for accrued interest receivable and other receivables. For budget purposes, expenditures include amounts paid and encumbered, as well as amounts in accounts payable at the end of the fiscal year. Purchase orders, contracts and other commitments for the expenditure of funds are recorded as encumbrances to reserve a portion ofthe applicable appropriation.
Budgeted expenditures and encumbrances for the budgeted funds cannot exceed the estimated revenues and fund balance, and it is unlawful for the City to create or authorize creation of a deficit in any of these funds. Budgetary control is exercised by function at the fund level. These functional categories include salaries and benefits; supplies and materials; services and maintenance; debt service; and capital outlay. Amendments must be approved by the City Council. The City Manager is authorized to transfer budgeted appropriations within individual funds, but cannot alter the appropriations on a fund level without City Council approval. Supplemental appropriations within all funds by the City Council during the fiscal year ended June 30, 2018 amounted to $15,659,810. Unencumbered appropriations lapse at year end while encumbered appropriations are carried over to the ensuing fiscal year until utilized or canceled and are classified within the restricted, committed or assigned fund balance category, as appropriate, based on the criteria of the fund balance classifications.
Oklahoma Statutes also require the City Council each year to make an ad valorem tax levy for a sinking fund (Debt Service Fund) which shall, with cash and investments in the fund, be sufficient to pay all the bonded indebtedness, interest and one-third of all outstanding judgments coming due in the following year.
4. DETAIL NOTES ON ALL FUNDS
Deposits and Investments
Custodial Credit Risk- Deposits Custodial credit risk is the risk that in the event of a bank failure, the City's deposits may not be returned to it. The City's policy for collateralization is that pledged securities will have a market value of at least 102% of the value of funds on deposit and that collateral be limited to either 1) U.S. Treasury, agency and instrumentality securities or 2) direct debt obligations of municipalities, counties, and school districts in Oklahoma. As of June 30,2018, none ofthe City's bank balance of$61,733,248 was exposed to custodial credit risk. As of June 30,2018, the City's carrying balance of these deposits was $62,150,297.
- 38-

Interest Rate Risk As of June 30, 2018, the City had the following investments subject to interest rate risk:
Weighted Average Maturity
Investment Type Fair Value (Years)
Money Market Mutual Funds $ 92,678,584 0.07 U.S. Treasury Notes 17,981,229 1.85 Federal Home Loan Bank 16,877,505 2.29 Federal Farm Credit Bank 7,428,980 0.73 Federal National Mortgage Association 18,948,498 0.91 Federal Agricultural Mortgage Corporation 11,862,150 2.19 Tennessee Valley Authority 3,346,298 2.63 Federal Home Loan Mortgage Corporation 10,188,454 1.19 Total fair value $ 179,311,698
Portfolio weighted average maturity 0.91
In accordance with its investment policy, the City manages its exposure to declines in fair values by limiting investment maturities to not more than ten years from the date of purchase.
The following schedules reconcile the carrying amounts of deposits and investments above to the government-wide statement of net position:
- 39-

Primary Government:
Carrying value of deposits -Pooled and nonpooled funds Money market mutual funds Less: Certificates or deposits classified as investments
Cash as reported on the government-wide statement of net position -
Cash and cash equivalents Restricted cash and cash equivalents - current Restricted cash and cash equivalents - long-term
Carrying value of investments -Pooled and nonpooled funds Site development certificate of deposits Less: Money market mutual funds classified as cash equivalent
As reported on the government-wide statement of net position -
Investments Restricted investments - current Restricted investments - long-term
$
$
62,150,297 92,678,584 (3,729,620)
41,581,040 108,975,960
1
$ 151,099,261
$
$
179,311,698 3,729,620
(92,678,584)
77,037,575 5,477,572 7,847,587
Credit Risk-The City's investment policy does not cover credit risk. The City's investments as of June 30, 2018 were rated by Moody's Investor Service and Standard & Poor's as follows:
Moody's S&P
Federal Farm Credit Bank Aaa AA+ Federal Home Loan Mortgage Corporation Aaa AA+ Federal Home Loan Bank Aaa AA+ Federal National Mortgage Association Aaa AA+ Federal Agricultural Mortgage Corporation Aaa AA+ Tennessee Valley Authority Aaa AA+ U.S. Treasury Notes Unrated Unrated Money Market Mutual Funds Unrated Unrated
Concentration of Credit Risk The City's investment policy places no limit on the amount the City may invest in any one issuer. More than 5% of the City's investments are in Federal Home Loan Bank,
- 40-

Federal Farm Credit Bank, Federal National Mortgage Association, United States Treasury Notes, Federal Home Loan Mortgage Corporation and Federal Agricultural Mortgage Corporation. These investments are 19%, 8%, 21%, 20%, 11% and 13%, respectively, of the City's total investments.
Fiduciary Funds- The City's fiduciary funds are not included in the risks and amounts identified above and are invested in mutual funds traded on public exchanges and have substantially the same risks as the primary government.
Custodial Credit Risk -Investments- For an investment, this is the risk that, in the event of the failure of the counterparty, the City will not be able to recover the value of its investments or collateral securities that are in the possession of an outside party. It is the City's policy to maintain investment securities that are insured or registered in the City's name and held by the City or its agent in the City's name whenever possible. As of June 30, 2018, the City's investment were not exposed to custodial credit risk as all of the City's investments were registered in the name ofthe City and held by a counterparty.
Investments Measured at Fair Value
The City categorizes its fair value measurements within the fair value hierarchy established by generally accepted accounting principles. The hierarchy is based on the valuation inputs used to measure the fair value of the asset. Level 1 inputs are quoted prices in active markets for identical Level 2 inputs are significant other observable inputs; Level 3 inputs are significant unobservable inputs.
The City has the following recurring fair value measurements as of June 30, 2018:
• US Treasury securities of$17,981,229 are valued using quoted market prices (Level 1 inputs).
• Federal government agencies securities of $68,651,885 are valued using quoted market prices of similar assets in an active market (Level 2 inputs).
• Money market mutual funds of $92,678,584 are valued using quoted market prices (Level 1 inputs).
• Mutual funds of $90,87 4,192 reported in the Statement of Fiduciary Net Position are valued using quoted market prices (Level 1 inputs).
Anwunt Due From Federal Government- The amount shown in both the government-wide and fund financial statements as due from the Federal government represents $1,523,423 of allowable expenditures under various direct and pass through grants for which the City has requested reimbursement.
Loan Receivable- On April25, 2017, trustees of the Norman Tax Increment Finance Authority approved a $3,000,000 loan to the Norman Economic Development Coalition (NEDC) that was used to payoff a loan between NEDC and Republic Bank & Trust Company. The original loan was made to purchase and make improvements to land within the University North Park area to attract potential employers. The balance of the loan has been offset by an equal allowance for an uncollectible amount within the government-wide financial statements.
- 41 -

lnterfund receivables and payables -lnterfund receivables and payables for the year ended June 30, 2018:
Due From
Non major Norman Total
Due General Government Capital Forward Enterprise Due al
To Fund Funds Fund Fund Funds From
Debt Service $ 296,585 $ 539,145 $ 701,445 $ 208,103 $ - $ 1,745,278 Fund Internal Service 315,823 1,132,947 1,448,770 Funds Public Safety Sales Tax Fund Total Due To $ 296,585 j__ 701 445 $ 3 274 667
Transfers- Transfers for the year ended June 30, 2018 consisted of the following: Transfers In
Capital Internal Total
Transfers General Projects Enterprise Service Transfers
Out Fund Fund Funds Fund Out
General Fund $ - $ 200,000 $ - $ 80,087 $ 280,087
Nonmajor Governmental Funds 7,105,565 203,619 7,309,184
Debt Svs Fund 651,763 651,763
Capital Projects Fund 7,248,673 732,614 7,981,287
Internal Service Fund 81,253 81,253
Enterprise Funds 1 755 640 338,122 2 093 762
Total Transfers In $ 9 085 566 $ 7 643 687 ~ 936 233 $ 731 850 $ 18,397,336
Transfers are used for varying reasons including but not limited to moving unrestricted general fund revenues to finance various programs that the City must account for in other funds in accordance with budgetary authorizations, including amounts provided as subsidies or matching funds for various grant programs.
The most significant transfers were initiated by the City for the following reasons:
• The Capital Projects Fund transferred $2,818,416 to the General Fund to pay for the purchase of vehicles and equipment and fund street maintenance projects.
• The UNP TIF Fund transferred $4,275,508 to the General Fund to return over apportioned funds. • The Community Development Fund transferred $6,926,065 to the Capital Fund to reimburse for
up-front payment of Community Development Block Grant Disaster Recovery (CDBG-DR) grant fund expenses stemming from 2015 spring storms.
• The Debt Services Fund transferred $651,763 to the Risk Management Internal Service Fund to pay for judgments awarded against the City and funded via the property tax rolls over a three year period.
• The Enterprise Funds transferred $1,755,640 to the General Fund as a fee in lieu of franchise fees.
-42-

Capital Assets- Capital asset activity for the fiscal year ended June 3 0, 2018 was as follows:
Beginning Ending
Balance Additions Deletions Balance
Governmental activities:
Capital assets, not being depreciated:
Land $ 63,348,053 $ 927,150 $ - $ 64,275,203 Construction in progress 66,823,373 40,406,640 (20,838,311) 86,391,702 Capital assets, being depreciated:
Buildings 39,288,315 3,431,279 42,719,594 Improvements other than buildings 26,937,380 10,426,842 (13,919) 37,350,303 Machinery and equipment 34,986,784 1,587,458 (744,1 05) 35,830,137 Vehicles 20,777,017 1,559,812 (526,046) 21,810,783 Infrastructure 522,919,532 14,825,798 537,745,330
Totals at historical cost 826,123,052 Less accumulated depreciation
Buildings (15,371,036) (I ,320,072) (16,691, 108) Improvements other than buildings (12,867,940) (918,062) 13,919 (13,772,083) Machinery and equipment (22,467,813) (3,112,479) 733,704 (24,846,588) Vehicles (11,863,011) (1,825,367) 526,046 (13,162,332) Infrastructure (338,819, 798} (349,291,274)
Total accumulated depreciation ( 40 I ,389,598)
Governmental activities capital assets, net $ 313 62Q 856 Business~type activities:
Capital assets, not being depreciated:
Land $ 10,344,901 $ - $ - $ 10,344,901
Construction in progress 78,775,426 15,979,801 (7,720,554) 87,034,673
Capital assets, being depreciated:
Buildings and improvements 188,311,397 5,371,998 (974,293) 192,709,102
Machinery and equipment 154,054,153 9 571 708 162,714,967 Totals at historical cost
Less accumulated depreciation
Buildings and improvements (1 00,862,277) ( 4,578,804) 213,657 (105,227,424)
Machinery and equipment (61 ,274, 735) (7,657,424) 805 046
Total accumulated depreciation
Business-type activities capital assets, net
- 43 -

Depreciation expense was charged to functions/programs of the primary government as follows:
Governmental activities:
General government
Planning
City controller
Parks and recreation
Public works
Public service
Public safety
Total depreciation expense
Business-type activities:
Westwood park
Utilities authority
Sanitation services
governmental activities
Total depreciation expense- business-type activities
$905,014
89,105
340,098
1,353,113
12,118,687
200
2,841,238
$163,466
10,301,361
Pension Plan Obligations- Each qualified employee participates in one of the three retirement plans in which the City participates. These are The Employee Retirement System of the City ofNonnan, The Oklahoma Firefighters Pension and Retirement System, and The Oklahoma Police Pension and Retirement System. The City does not maintain the accounting records, hold the investments nor administer the firefighters' or police retirement funds. The police officers' and firefighters' plans are statewide systems administered by the State of Oklahoma. The municipal employees' plan is managed by a separate board of trustees, and the assets are held in custody and administered by two asset managers.
A summary of significant data for each of the retirement plans follows:
a. Employee Retirement System of the City of Norman -Plan Description- The Employee Retirement System ("ERS") of the City ofNorman is a single-employer public employee retirement system which was established on November l, 1967 by a City ordinance and amended on January 29, 1985 and July l, 1991. The ERS was originally established as a defined benefit plan. On July 1, 1991, the City converted that portion of the ERS which related to unretired participants to a money purchase plan under Section 40l(a) ofthe Internal Revenue Code (the "401(a) Plan"). An amount equal to the greater of the participants vested benefits under the ERS or their account balance in the ERS was transferred to a participant account in the 401(a) Plan. The portion of the ERS that relates to retired participants at July 1, 1991 ("the Annuity Pool") remains in existence to pay benefits to those retired employees receiving benefits at July 1, 1991. The activities of the Annuity Pool and the 40l(a) Plan are recorded in separate Pension Trust Funds which are included within the City's financial statements.
The ERS does not issue a stand-alone financial report. Overall the defined benefit portion of the ERS plan is not entrical to the City's financial statement as a whole. Therefore the information provided is for informational purposes only and is not intended to comply with the provisions of GASB Statement 68, Accounting and Financial Reporting for Pensions- An Amendment ofGASB Statement 27.
-44

The ERS is managed by a Board of Trustees, composed of six members, meeting once a month. Members by position include the City Manager, Finance Director and Personnel Director. One additional member is elected by the City Council and the final two members are elected by the American Federation of State, County and Municipal Employees Union membership.
Basis of Accounting The ERS's financial statements are prepared using the accrual basis of accounting. Employer and plan member contributions are recognized in the period that the contributions are due. Benefits and refunds are recognized when due and payable in accordance with the terms of each plan.
Method Used to Value Investments ERS plan investments are reported at fair value. Short-term investments are reported at cost, which approximates fair value. Securities traded on national exchanges are valued at the last reported sales price. Investments that do not have an established market are reported at estimated fair value.
As of June 30, 2018, and for the year ended, the ERS held no securities issued by the City or other related parties.
1. Annuity Pool- As of July 1, 2017, the date of the last actuarial study, the Annuity Pool participants included eight retirees and other beneficiaries who are entitled retirement benefits including a death benefit equal to a lump sum amount equal to the normal retirement as projected for a ten year period of time.
At July 1, 2017 the Actuarial Accrued Liability for the Annuity Pool was $303,044 and the market value of assets in the Annuity Pool was $287,009. The City's actuary has suggested an annual contribution for a period often years commencing July 1, 2018. The actuarial assumptions included (a) 7.25% investment rate ofretm11 (net of administrative expenses), (b) no projected salary increases, and (c) no cost of living increases. The actuarial value of assets was determined using techniques that smooth the effects of short-term volatility in the market value of investments over a five-year period. The City did not make a contribution to the plan in 2018. The City will make future contributions as needed to make benefit payments should present plan assets be insufficient to do so.
2. The 401 (a) Plan- The 40 1(a) Plan is a money purchase defined contribution plan under section 401 (a) of the Internal Revenue Code. All non-voluntary contributions have been designated by the City as "picked up contributions" pursuant to Internal Revenue Code section 414(h)(2) and are treated as employer contributions for federal income tax purposes.
The City's payroll for employees covered by the 401 (a) Plan for the year ended June 30, 2018 was $29,647,965, and total City payroll was $58,143,467.
Substantially all full-time, non-uniformed employees of the City are required to participate in the 401(a) Plan. At June 30, 2018, there were 583 plan participants. Participants are required to contribute 6.5% of their compensation to the 401(a) Plan each pay period. This contribution is matched by the City at a rate of 8.5% of payroll. Administrative costs are financed through investment earnings. Participants become vested in the City's contribution as follows:
- 45-

Years of Service Vesting Percentage
Less than 2 2 3 4 5
0% 25% 50% 75% 100%
The amount forfeited for the year ended June 30, 2018 was $79,146. Contributions to the 401(a) Plan for 2018 were $4,476,332. The contributions expressed in dollars and percent of covered payroll were: City- $2,520,077, 8.5%, participants- $1,956,255, 6.5%. The contribution requirements are in accordance with the City ordinance. Plan provisions and contribution requirements are established and may be amended by the City Council.
Trend Information
401(a) Plan
City's City's Fiscal Required Percentage Year Contribution Contributed
2016 2,397,541 100% 2017 2,555,989 100% 2018 2,520,077 100%
Financial Reports- Neither the Annuity Pool nor the 401(a) Plan issues stand-alone financial reports and are not included in the report of a public employee retirement system or a report of another entity. Their financial statements are as follows:
Assets
Statement of Net Position June 30, 2018
Investments - mutual funds Loans to 40 1 (a) Plan participants
Annuity Pool Fund $ 247,932
Total assets Liabilities and Net Position
401(a) Plan Fund
$ 90,626,260 3,853,329
Total $ 90,874,192
Net position restricted for pension benefits 247,932 $ 94,479,589 $ 94,727,521 Total liabilities and net position $ 94,479,589
-46-

Statement of Changes in Fiduciary Net Position For the Year Ended June 30, 2018
Additions: Contributions - employer Contributions - employee Investment income (loss)
Total additions
Deductions: Pension benefits paid Administration costs
Total deductions
Net increase (decrease)
Annuity Pool Fund
$
20,868
20,868
58,782
60,059
(39,191) Net position restricted for pension and retirement benefits:
Beginning ofyear 287,123 End ofyear
b. Oklahoma Firefighters Pension and Retirement System, (OFP RS)
401(a) Plan
$
Fund
2,520,077 1,956,255 9,807,857
189
7,070,884 ( 122,400)
6,948,484
7,335,705
Total
$ 2,520,077 1,956,255
14,305,057
7,129,666
7,008,543 7,296,514
Plan Description- Members of the City's Fire Department are covered by the Oklahoma Firefighters Pension and Retirement System (OFPRS), which is a statewide cost sharing multiple-employer public employee retirement system (the OFPRS Plan). The plan is administered by a board of trustees (the Board) appointed under state statute. Benefit provisions are contained in the Plan document and were established and can be amended by action of the OFPRS' board of trustees. The plan issues a publicly available financial report that can be obtained at
Benefits Provided- In general, the OFPRS Plan provides defined retirement benefits based on members' final average compensation, age, and term of service. In addition, the retirement program provides for benefits upon disability and to survivors upon death of eligible members. The Plan's benefits are established and amended by state statute. Retirement provisions are as follows:
Hired Prior to November 1, 2013 Normal retirement is attained upon completing 20 years of service. The normal retirement benefit is equal to 50% of the member's final average compensation. Final average compensation is defined as the monthly average of the highest 30 consecutive months of the last 60 months of participating service.
Normal retirement is attained upon completing 22 years of service. The normal retirement benefit is equal to 55% of the member's final average compensation. Final average compensation is defined as the monthly average of the highest 30 consecutive months of the last 60 months of participating service. Also must be age 50 to begin receiving benefits.
-47-

All firefighters are eligible for immediate disability benefits. For paid firefighters, the disability in-the-line-of-duty benefit for firefighters with less than 20 years of service is equal to 50% of final average monthly compensation, based on the most recent 30 months of service. For firefighters with over 20 years of service, a disability in-the-line-of-duty is calculated based on 2.5% of final average monthly compensation, based on the most recent 30 months, per year of service, with a maximum of 30 years of service. For disabilities not-in-the-line-of-duty, the benefit is limited to only those with less than 20 years of service and is 50% of final average monthly compensation, based on the most recent 60-month salary as opposed to 30 months.
A $5,000 lump sum death benefit is payable to the qualified spouse or designated recipient upon the participant's death. The $5,000 death benefit does not apply to members electing the vested benefit.
Firefighters hired prior to November 1, 2013, with 20 or more years of service may elect to participate in the Oklahoma Firefighters Deferred Retirement Option Plan (the "Deferred Option Plan"). Firefighters hired after November 1, 2013, with 22 or more years of service may elect to participate in the Deferred Option Plan. Active participation (having benefit payments credited to the account) in the Deferred Option Plan shall not exceed 5 years. Under the Deferred Option Plan, retirement benefits are calculated based on compensation and service at the time of election. The retirement benefits plus half of the municipal contributions on behalf of the participant are deposited into a deferred retirement account. The Deferred Option Plan accounts are credited with interest at a rate of 2% below the rate of return on the investment portfolio of the Plan, with a guaranteed minimum interest rate equal to the assumed actuarial interest rate of 7 .5%, as approved by the Board. The participant is no longer required to make contributions. Upon retirement, the firefighter receives his/her monthly retirement benefit as calculated at the time of election. The member can elect to either leave the account balance accumulated in the Deferred Option Plan account or they can elect to have the balance paid to them either as a lump sum or in specified monthly payments. If the member elects to leave their account balance in the Deferred Option Plan account, they will continue to earn interest on their balance at the rate described above; however, no more benefit payments will be credited to their account. The member can leave their account balance in the Deferred Option Plan account until the age of 70'ii. When the member reaches 70Yz years of age, they must either begin receiving regular monthly payments, based on the annuity method, or a lump sum distribution.
The Deferred Option Plan was modified effective November 1, 2013, to limit post-retirement interest for new members to a rate of return on the portfolio, less a 1% administrative In addition, the members participating must withdraw all money by the age of 70Y2 .
In the 2003 Legislative Session, Senate Bill 286 and House Bill 1464 created a "Back" DROP for members of the System effective July 1, 2003. The "Back" DROP is a modified deferred retirement option plan. The "Back" DROP allows the member flexibility by not having to commit to terminate employment within 5 years. Once a member has met their normal retirement period of20 years for those hired prior to November 1, 2013, and 22 years for those hired after November 1, 2013, the member can choose, upon retirement, to be treated as if the member had entered into the Deferred Option Plan. A member, however, cannot receive credit to the Deferred Option Plan account based upon any years prior to when the member reached their normal retirement date. Once a member is ready to retire, the member can make the election to participate in the "Back" DROP and can receive a Deferred Option Plan benefit based upon up to 5 years of participation. The member's regular retirement benefit will not
-48

take into account any years of service credited to the "Back" DROP. Firefighters with 20 years of service or who were receiving pension benefits as of May 26, 1983, are entitled to post-retirement adjustments equal to one-half the increase or decrease for top-step firefighters. Pensions will not be adjusted below the level at which the firefighter retired.
Contributions- The Board has the authority to establish and amend the contribution requirements of the City and active employees. Members of the OFPRS are required to pay 9% of their base pay to the pension plan (starting November 1, 2013) until they reach 20 years of service, after which no contributions are required. The City is contractually required to pay 14% of base salary (statiing November 1, 2013). For the year ended June 30, 2018, the total contribution to the system amounted to $2,811,323 of which $1,711,565 was made by the City and $1,099,758 was made by the employees. These contributions represent 14% (City) and 9% (member) of covered payroll, actuarially determined as an amount that is expected to finance the costs of benefits earned by employees during the year, with any additional amount to finance any unfunded accrued liability. The total amount contributed to the system by the State of Oklahoma on behalf of the City was approximately $3,648,000 and does not meet the criteria of a special funding situation.
Pension Liabilities, Pension Expense, and Deferred Outflows of Resources and Deferred Inflows of Resources Related to Pensions At June 30, 2018, the City reported a liability of $52,055,202, for its proportionate share of the net pension liability. The net pension liability was measured as of June 30, 2017, and the total pension liability used to calculate the net pension liability was determined by an actuarial valuation as of July 1, 2017. The City's proportion ofthe net pension liability was based on a projection of the City's long-term share of contributions to the pension plan relative to the projected contributions of all participating employers, actuarially determined. At June 30,2017, the City's propotiion was 4.138843%
For the year ended June 30, 2018, the City recognized pension expense of $5,753,312. At June 30, 2018, the City reported deferred outflows of resources and deferred inflows of resources related to pensions from the following sources:
Differences between expected and actual experience
Employer change in proportion and differences between contributions recognized and proportionate share of contributions
Net difference between projected and actual earnings on pension plan investments
City's contributions subsequent to the measurement date
Total
$
Deferred Outflows of Resources
Deferred Inflows of Resources
6,953,679 $
1,444,683 204,142
1,450,601
1,711,565
At June 30,2018, the City reported $1,711,565 as deferred outflows ofresources related to pensions resulting from City's contributions subsequent to the measurement date that will be recognized as a
-49-
reduction of the net pension liability in the year ending June 30, 2019. Other amounts reported as deferred outflows of resources and deferred inflows of resources totaling $6,743,619 related to pensions will be recognized as a (reduction) or increase in pension expense as follows:
2018 $ 782,886 2019 2,393,555 2020 1,885,248 2021 243,253 2022 1,173,671 Thereafter 265,006
Actuarial Assumptions- The total pension liability in the July 1, 2017, actuarial valuations was determined using the following actuarial assumptions, applied to all periods included in the measurement:
Inflation Salary increases Ad hoc cost of living adjustments
Investment rate of return
3% 3.5% to 9.0%, average, including inflation Half of the dollar amount of a 3% assumed increase in base pay for retirees with 20 years of service as of May 26, 1983 7 .5%, net of pension plan investment expense, including an inflation rate of 3%
Mortality rates were based on the RP-2000 Blue Collar Healthy Combined with generational mortality improvement using Scale AA for healthy lives and no mortality improvement for disabled lives.
The actuarial assumptions used in the July I, 2017 valuation were based on the results of an actuarial experience study for the period July 1, 2007 through June 30, 2012.
The long-term expected rate of return on pension plan investments was determined using a building-block method in which best-estimate ranges of expected future real rates of return (expected returns, net of pension plan investment expense and inflation) are developed for each major asset class. These ranges are combined to produce the long-term expected rate of return by weighting the expected future real rates of return by the target asset allocation percentage and by adding expected inflation. The target allocation and best estimates of arithmetic real rates of return for each major asset class are summaried in the following table:
-50-

Long-• erm
Expected Target Real Rate of
Asset Class Allocation Return
Fixed Income 20% 4.38% Domestic Equity 37% 7.72% International Equity 20% 9.70% Real Estate 10% 6.96% Other Assets 5.75%
100%
Discount Rate The single discount rate used to measure the total pension liability was 7.5% for the year ended June 30, 2017. The projection of cash flows used to determine the discount rate assumed that employee contributions will be made at the current contribution rate and that participating employer contributions will be made at contractually required rates, actuarially determined. Based on these assumptions, the penion plan's fiduciary net position was projected to be available to make all projected future benefit payments of current active and inactive employees. Therefore, the long-term expected rate of return on pension plan investments was applied to all periods of projected benefit payments to determine the total pension liability.
Sensitivity of the City's Proportionate Share ofthe Net Pension Liability to Changes in the Discount Rate- The City's proportionate share of the net pension liability has been calculated using a discount rate of7.5%. The following presents the City's proportionate share ofthe net pension liability calculated using a discount rate 1% higher and 1% lower than the current rate.
City's proportionate share of the net pension liability
L;Urrent 1% Decrease Discount Rate 1% Increase
(6.5%) (7.5%) (8.5%)
$ 68,288,812 $ 52,055,202 $ 38,297,597
Pension Plan Fiduciary Net Position- Detailed information about the pension plan's fiduciary net position is available in the separately issued OFPRS Plan financial report, which can be located at www.ok.gov/fprs/.
b. Oklahoma Police Pension and Retirement System (OPPR))
Plan Description- Members of the City's Police Department are covered by the Oklahoma Police Pension and Retirement System (OPPRS), which is a statewide cost sharing multiple-employer public employee retirement system (the OPPRS Plan). The plan is administered by a board of trustees (the Board) appointed under state statute. Benefit provisions are contained in the Plan document and were established and can be amended by action of the OPPRS' board of trustees. The plan issues a publicly available financial report that can be obtained at www.ok.gov/OPPRS/.
Benefits Provided- In general, the OPPRS Plan provides defined retirement benefits based on members' final average compensation, age, and term of service. In addition, the retirement program provides for benefits upon disability and to survivors upon death of eligible members.
- 51 -

The Plan's benefits are established and amended by state statute. Retirement provisions are as follows:
• The normal retirement date under the Plan is the date upon which the participant completes 20 years of credited service, regardless of age. Participants become vested upon completing 10 years of credited service as a contributing participant of the Plan. No vesting occurs prior to completing 10 years of credited service. Participants' contributions are refundable, without interest, upon termination prior to normal retirement. Participants who have completed 10 years of credited service may elect a vested benefit in lieu of having their accumulated contributions refunded. If the vested benefit is elected, the participant is entitled to a monthly retirement benefit commencing on the date the participant reaches 50 years of age or the date the participant would have had 20 years of credited service had employment continued uninterrupted, whichever is later.
• Monthly retirement benefits are calculated at 2.5% ofthe final average salary (defined as the average paid base salary of the officer over the highest 30 consecutive months of the last 60 months of credited service) multiplied by the years of credited service, with a maximum of 30 years of credited service considered.
• Monthly benefits for participants due to permanent disability incurred in the line of duty are 2.5% of the participants' final average salary multiplied by 20 years. This disability benefit is reduced by stated percentages for partial disability based on the percentage of impairment. After 10 years of credited service, participants who retire due to disability incurred from any cause are eligible for a monthly benefit based on 2.5o/o of their final average salary multiplied by the years of service. This disability benefit is also reduced by stated percentages for partial disability based on the percentage of impairment. Effective July 1, 1998, once a disability benefit is granted to a participant, that participant is no longer allowed to apply for an increase in the dollar amount of the benefit at a subsequent date.
• Survivor's benefits are payable in full to the participant's beneficiary upon the death of a retired participant. The beneficiary of any active participant killed in the line of duty is entitled to a pension benefit. Effective July 1, 1999, a $5,000 death benefit is also paid, in addition to any survivor's pension benefits under the Plan, to the participant's beneficiary or estate for active or retired members.
• The Deferred Option allows participants otherwise eligible for a normal retirement benefit to defer terminating employment and drawing retirement benefits for a period not to exceed 5 years. Under the Deferred Option, retirement benefits are calculated based on compensation and service at the time of election and a separate account is established for each patiicipant. During the participation period, the employee's retirement benefit is credited to the participant's account along with a portion of the employer's contribution and interest. Interest is credited at a rate of 2% below the rate of return on the investment portfolio of the Plan, with a guaranteed minimum interest equal to the assumed actuarial interest of 7.5%. Employee contributions cease once participation in the Deferred Option is elected. At the conclusion of participation in the Deferred Option, the participant will receive the balance in the separate account under payment terms allowed by the Deferred Option and will then begin receiving retirement benefit payments as calculated at the time of election.
• In the 2003 Legislative Session, Senate Bill 688 and House Bill 1464 created a "Back" DROP for members of the System. The "Back" DROP is a modified deferred retirement option plan. The "Back" DROP allows the member flexibility by not having to commit to terminate
-52-

employment within 5 years. Once a member has met their normal retirement period of 20 years, the member can choose, upon retirement, to be treated as if the member had entered into the "Back" DROP. A member, however, cannot receive credit to the "Back" DROP account based upon any years prior to when the member reached their normal retirement date. Once a member is ready to retire, the member can make the election to participate in the "Back" DROP and can receive a "Back" DROP benefit based upon up to 5 years of participation. The member's regular retirement benefit will not take into account any years of service credited to the "Back" DROP.
• In 2006, the Board approved a method of payment called the Deferred Option Payout Provision (the "Payout Provision"). The Payout Provision allows a retired member who has completed participation in the Deferred Option or the "Back" DROP the ability to leave their account balance in the Plan. The retired member's account balance will be commingled and reinvested with the total assets, and therefore the member will not be able to direct their personal investments. Written election must be made to the Board no more than 30 days following the termination of employment.
• Upon participating in the Payout Provision, a retired member shall not be guaranteed a minimum rate of return on their investment. A retired member shall earn interest on their account as follows:
a) The retired member shall ean1 two percentage points below the net annual rate of return of the investment portfolio of the System.
b) If the portfolio earns less than a 2% rate of return, but more than zero, the retired member shall earn zero percentage points.
c) Ifthe portfolio earns less than zero percentage points, there shall be a deduction from the retired member's balance equal to the net annual rate of return of the investment portfolio of the System.
Interest as earned above shall be credited to the retired member's account.
The Oklahoma Legislature has the authority to grant percentage increases or special one-time payments to persons receiving benefits from the Plan. Additionally, certain retirees are entitled to receive a cost-of-living adjustment (COLA) when a COLA is granted to active police officers in the retiree's city. Participants eligible to receive both types of benefit increases are to receive the greater of the legislative increase or the benefit increase the participant would receive pursuant to the COLA provision.
Contributions The Board has the authority to establish and amend the contribution requirements of the City and active employees. Members of the OPPRS are required to pay 8% of their base pay to the pension plan. The City is contractually required to pay 13% of base salary. For the year ended June 30, 2018, the total contribution to the system amounted to $2,595,464 of which $1,606,716 was made by the City and $988,748 was made by the employees. These contributions represent 13°/o (City) and 8% (member) of covered payroll, actuarially determined as an amount that is expected to finance the costs of benefits earned by employees during the year, with an additional amount to finance any unfunded accrued liability. The total amount contributed to the system by the State of Oklahoma on behalf of the City was approximately $1 ,3 83,000 and does not meet the criteria of a special funding situation.
-53-

Pension Liabilities, Pension Expense, and Deferred Outflows of Resources and Deferred Inflows of Resources Related to Pensions At June 30, 2018, the City reported a liability of $310,337, for its proportionate share of the net pension liability. The net pension liability was measured as of June 30, 2017, and the total pension asset used to calculate the net pension liability was detem1ined by an actuarial valuation as of July 1, 2017. The City's proportion of the net pension liability was based on a projection of the City's long-term share of contributions to the pension plan relative to the projected contributions of all participating employers, actuarially determined. At June 30, 2017, the City's proportion was 4.0345%
For the year ended June 30, 2018, the City recognized pension expense of $1,895,317. At June 30, 2018, the City reported deferred outflows of resources and deferred inflows of resources related to pensions from the following sources:
Differences between expected and actual experience
Employer change in proportion and differences between contributions recognized and proportionate share of contributions
Net difference between projected and actual earnings on pension plan investments
City's contributions subsequent to the measurement date
Total
$
$
Deferred Outflows of Resources
Deferred Inflows of Resources
15,586 $ 1,876,212
55,635 39,919
2,311,471
1,606,716
3,989,408 131
At June 30, 2018, the City reported $1,606,716 as deferred outflows of resources related to pensions resulting from City's contributions subsequent to the measurement date that will be recognized as a reduction of the net pension liability in the year ending June 30, 2019. Other amounts reported as deferred outflows of resources and deferred inflows of resources totaling $466,561 related to pensions will be recognized as a (reduction) or increase in pension expense as follows:
2018 $ (65,411) 2019 1,149,693 2020 533,696 2021 (938,545) 2022
-54-

Actuarial Assumptions The total pension liability in the July 1, 2017, actuarial valuations was determined using the following actuarial assumptions, applied to all periods included in the measurement:
Inflation Salary increases Cost of living adjustments
Investment rate of return
3% 4.5% to 17.0%, average, including inflation Police officers eligible to receive increased benefits according to repealed Section 50-120 of Title 11 of the Oklahoma Statutes pursuant to a court order receive an adjustment of 113 to 1/2 of the increase or decrease of any adjustment to the base salary of a regular police officer, based on an increase in base salary. 7 .5%, net of pension plan investment expense.
Mortality rates were based on the RP-2000 Blue Collar Healthy Combined with generational mortality improvement using Scale AA with age set back four years for active, pre-retirement employees. For active post-retirement employees, mortality rates were based on the RP-2000 Blue Collar Healthy Combined index with generational mortality improvement using Scale AA. For disabled pensioners, mortality rates index were based on the RP-2000 Blue Collar Healthy Combined index with age set forward four years.
The actuarial assumptions used in the July 1, 2017 valuation was based on the results of an actuarial experience study for the period July 1, 2007 through June 30, 2012.
The long-term expected rate of return on pension plan investments was determined using a building-block method in which best-estimate ranges of expected future real rates of return (expected returns, net of pension plan investment expense and inflation) are developed for each major asset class. These ranges are combined to produce the long-term expected rate of return by weighting the expected future real rates of return by the target asset allocation percentage and by adding expected inflation. The target allocation and best estimates of arithmetic real rates of return for each major asset class are summaried in the following table:
Long-Term Expected
Target Real Rate of
Asset Class Allocation Return
Fixed Income 25% 4.51% Domestic Equity 35% 6.62% International Equity 15% 9.70% Real Estate 10% 6.96% Private Equity 10% 9.86% Other Assets 5% 5.18%
100%
Discount Rate- The single discount rate used to measure the total pension liability was 7.5% for the year ended June 30, 2017. The projection of cash flows used to determine the discount rate assumed that employee contributions will be made at the current contribution rate and that participating employer contributions will be made at contractually required rates, actuarially
-55-

determined. Based on these assumptions, the penion plan's fiduciary net position was projected to be available to make all projected future benefit payments of current active and inactive employees. Therefore, the long-term expected rate of return on pension plan investments was applied to all periods of projected benefit payments to determine the total pension liability.
Sensitivity of the City's Proportionate Share of the Net Pension Liability (Asset) to Changes in the Discount Rate- The City's proportionate share ofthe net pension liability (asset) has been calculated using a discount rate of7.5%. The following presents the City's proportionate share of the net pension liability (asset) calculated using a discount rate 1% higher and 1% lower than the current rate.
Current 1 °/o Decrease Discount Rate
(6.5°/o) (7.5°/o) 1 °/o Increase
(8.5°/o)
City's proportionate share of the net pension liability (asset) $ 10,488,449 $ 310,337 $ (8,286,704)
Pension Plan Fiduciary Net Position Detailed information about the pension plan's fiduciary net position is available in the separately issued OPPRS Plan financial report, which can be located at www.ok.gov/OPPRS/.
Other Postemployment Benefits
Plan Description The City provides postemployment healthcare benefits (OPEB) for retired employees and their dependents through the City ofNorman Postretirement Medical Plan (the Plan), a single-employer defined benefit healthcare plan. The benefits, coverage levels, employee contributions and employer contributions are governed by the City and can be amended by the City through its personnel manual and union contracts.
Benefits Provided- The City provides postretirement healthcare benefits to its retirees. The Plan covers all current retirees who elected postretirement medical coverage through the City and future retired general employees, police officers and firefighters.
All healthcare benefits are provided through the City's self insured health plan. The benefit levels are the same as those afforded to active employees. Benefits include general inpatient and outpatient medical services and prescriptions. General employees are eligible for membership in the Plan if they retire from the City with eight years of service and with age and service totaling 70 points. Police officers and firefighters are eligible for benefits under the Plan if they retire from the City with 20 years of service. Coverage for dependants can continue upon the death of the retiree. Spouses of employees who die in active service eligible for benefits can receive coverage.
Membership- At July 1, 2018, membership consisted of:
Retirees and beneficiaries currently receiving benefits Tenninated employees entitled to benefits but not yet receiving them Active employees
Total
-56-
100 0
757

Funding Policy- The plan participants are responsible for paying the full cost of their medical premium and the City is responsible for the claims and expenses in excess of participant contributions. As of June 30, 2018, no assets are accumulated in a trust that meets the criteria in paragraph 4 of Statement 75 has been established. The net claims and expenses paid by the City are funded on a pay-as-you-go basis.
OPEB Liabilities, OPEB Expense, and Deferred Outflows of Resources and Deferred Inflows of Resources Related to OPEB- At June 30, 2018, the City reported a liability of $10,999,326, for net OPEB liability. The net OPEB liability was measured as of June 30, 2018, the net OPEB liability was determined by an actuarial valuation as of July 1, 2017 calculated based on the discount rate and actuarial assumptions and was then projected forward to the measurement date. No acturarial experience study has been performed.
For the year ended June 30,2018, the City recognized OPEB expense of$776,361. At June 30,2018, the City reported deferred outflows of resources and deferred inflows of resources related to OPEB from the following sources:
Differences between expected and actual experience $
Change in assumptions
Total
Deferred Outflows of Resources
Deferred Inflows of Resources
883,148 $
At June 30, 2018, the City reported amounts as deferred outflows of resources and deferred inflows of resources totaling $119,124 related to OPEB will be recognized as a (reduction) or increase in OPEB expense as follows:
2019 $ (11,133) 2020 (11,133) 2021 (11,133) 2022 (11,133) 2023 (11,133) Thereafter (63A59)
Actuarial Assumptions- The total OPEB liability in the July 1, 2017, actuarial valuations was determined using the following actuarial assumptions, applied to all periods included in the measurement:
-57-

Acturial cost method Amortization method
Level percent or level dollar Closed, open, or layered periods Amortization period at July 1, 2017 Amortization growth rate
Inflation Discount rate for valuing liabilities
Healthcare cost trend rates
Mortality rates
Balance, beginning of year
Changes for the year: Service Cost Interest on total OPEB Liability
Entry Age Normal
Level percent Open 30 years 2.50% 2.30% 3 .87%, based on the Bond Buyer 20 year General Obligation Index 4.3%17.4% for non-Medicare/Medicare claims in 2017, gradually decreasing to an ultimate rate of 3.9%/4.0% for 2087 and beyond. 3.0% for dental claims in 2017 and future RP-20 14 Blue Collar Mortality with separate pre-and post-commencement rates projected generationally using scale MP-20 17
6/30/2018 Total OPEB Liability
$ 11,073,763
Differences between expected and actual experience Effect of assumptions changes or inputs
363,920 423,574 965,685
(1,095,942) Benefit payments
Net changes
Balance, end of year $ 10,999,326
Sensitivity of the City's Net OPEB Liability to Changes in the Discount Rate- The City's net OPEB liability has been calculated using a discount rate of3.87%. The following presents the City's net OPEB liability calculated using a discount rate 1% higher and 1% lower than the current rate.
Current 1 °/o Decrease Discount Rate 1 °/o Increase
(2.87°/o) (3.87°/o) (4.87%,)
Net OPEB liability $ 12,201,013 $ 10,999,326 $ 9,943,731
Sensitivity of the City's Net OPEB Liability to Changes in the current healthcare cost trend rates ~The City's net OPEB liability has been calculated using a current healthcare cost trend rates (see assumptions). The following presents the City's net OPEB liability calculated using a current health care cost trend rate 1% higher and 1% lower than the current rate.
-58-

1 °/o Decrease Current Rate 1 °/o Increase
Net OPEB liability $ 9,681,165 $ 10,999,326 $ 12,563,264
Guaranty Deposits- At June 30, 2018, the guaranty deposit accounts of the City included the following deposit liabilities:
Governmental activities:
Oil and gas drilling escrow Site improvements Contractor's escrow Park improvement Court fines and bond deposits Others
Total governmental activities
Business-type activities:
Utility deposits
$239,600 6,045,933
111,248 8,615
30,548
$1,642,992
The above liabilities and related cash and cash equivalents have been presented as restricted assets in both the government-wide and fund financial statements.
Long-Term Debt
a. General Obligation Bonds- General obligation bonds have been approved by the voters and issued by the City for various municipal improvements. These bonds are required to be fully paid within 25 years from the date of issue and are backed by the full faith and credit of the City.
Bonds, backed by property taxes, whose proceeds are dedicated to streets, rights-of-way, and limited access facilities, together with outstanding judgments against the City, are limited in total by State statute to 10 percent ofthe net assessed valuation oftaxable property in the City. At June 30, 2018, the net assessed valuation approximated $993,914,000. The City had no such bonds outstanding at June 30, 2018. There is no such limit on the issuance of other types of general obligation bonds.
General obligation bonds outstanding as of June 30, 2018 are as follows:
-59-

$5,210,000 2008A Combined Purpose General Obligation bonds, due in annual installments of $575,000 to $610,000 beginning June 1, 2010 through December 1, 2018 at interest rates ranging from 3.375% to 4.25% (for various street improvements) $
$20,050,000 2012D General Obligation bonds, due in annual installments of $1,055,000 to $1,060,000 beginning December 1, 2014 through December 1, 2032 at interest rates ranging from 2.5% to 3.0% (for various street reconstruction projects)
$22,525,000 2015 General Obligation bonds, due in annual installments of $1,185,000 to $1,195,000 beginning June 1, 2017 through June 1, 2035 at interest rates ranging from 0.5o/o to 4.00% (for various street reconstruction projects)
$15,000,000 2016 General Obligation bonds, due in annual installments of $7,500,000 beginning June 1, 2018 through June 1, 2019 at interest rates ranging from 1.5% to 2.0% (for various street reconstruction projects)
$7,775,000 2016A General Obligation bonds, due in annual installments of $365,000 to $795,000 beginning June 1, 2017 through July 1, 2027 at interest rates ranging from 4.0°/o to 5.0% (for refunding of the City's Series 2005A and 2007 A Combined Purpose General Obligation Bonds)
Total general obligation bonds
- 60-
610,000
15,830,000
20,155,000
7,500,000
6,265,000

Annual debt service requirements to maturity for general obligation bonds are as follows:
b. Revenue Bonds- Revenue Bonds outstanding consist of debt issued by the NUA. The bonds are not indebtedness ofthe State of Oklahoma or of the City, but are obligations payable solely from resources of the NUA.
The revenue bonds outstanding as of June 30, 2018 are as follows:
$2,315,000 Norman Municipal Authority, Recreation Facilities Revenue Bonds, Series 2002, due in annual installments of $75,000 to $195,000 from June 1, 2004 through June 1, 2022 at interest rates from 3.5% to 6.125% $ _____ .:______
Total revenue bonds $ 705,000
Annual debt service requirements to maturity for revenue notes/bonds are as follows:
Fiscal Year Principal Interest Total
2019 $ 160,000 $ 43,181 $ 203,181 2020 170,000 33,381 203,381 2021 180,000 22,969 202,969 2022 195,000 11 206,944
Total
The Municipal Revenue Bonds Series 2002 ($2,315,000) are collateralized by the revenues from the operation of the Westwood facility and room tax revenue collected by the City as defined in the bond indenture. Proceeds were used to complete capital project improvements to the golf course property. As stated above, the bonds are payable solely from Westwood facility operations and room tax collections and are payable through 2022. Annual principal and interest payments on the bonds are expected to require approximately 12 percent of net revenues. The total principal and
- 61 -

interest remaining to be paid on the bonds is $816,475. Principal and interest paid for the current year was $202,369. Total Westwood revenues and room tax collections were $3,186,198 for the current year.
Certain of the bonds may be called for redemption prior to maturity at the option ofNUA in accordance with the redemption terms stated in the bond indentures.
c. Notes Payable- Notes payable as of June 30, 2018 are as follows:
$4,850,000 Clean Water SRF loan payable to the OWRB due in semi-annual installments ranging from $124,677 to $136,239 beginning September 15, 2000 through September 15,2019. The loan has a 0% interest rate plus an administrative fee of 0.5% per annum.
$3,590,000 sanitation system loan payable to various holders due in semi-annual installments ranging from $95,000 to $155,000 beginning October 1, 2010 through October 1, 2024. The loan has a 3.45% interest rate.
$14,215,000 Norman Tax Increment Finance Authority Tax Increment Revenue Note, Taxable Series 2013, due in annual payments ranging from $750,000 to $2,790,000 beginning September 1, 2014 through September 1, 2023. The loan has a 3.81% interest rate.
$4,964,024 Clean Water SRF loan payable to the OWRB due in annual installments ranging between $212,595 and $349,740 beginning September 15, 2013 through March 15, 2031. The loan has a 2.91% interest rate.
$50,300,000 Clean Water SRF loan payable to the OWRB due in annual installments ranging from $1,410,000 to $3,880,000 beginning March 15, 2015 and ending September 15,2029. The loan has a 1.75% interest rate with a .5o/o administration fee. As of June 30, 2018 only $42,121,030 has been drawndown.
$17,505,000 Norman Utilities Authority, Utility Revenue Notes, Refunding Series 2015, due in annual installments of$730,000 to $1,315,000 from November 1, 2015 to November 1, 2026, at an interest rate of2.13%
$22,825,000 Norman Municipal Authority Revenue Note, Taxable Series 2015, due in annual payments ranging from $900,000 to $1,185,000 beginning September 1, 2016 through March 1, 2027. The loan has a 2.330% interest rate.
- 62-
$ 373,077
1,835,000
10,815,000
3,836,337
31,901,414
11,795,000
19,150,000

Authorized, but not fully issued, $31,000,000 Drinking Water SRF loan payable to the OWRB due in annual payments ranging from $1,140,000 to $1,935,000 beginning October 1, 2019 through October 1, 2039. The loan has a 2.82% interest rate. As of June 30, 2018 only $6,891,969 has been drawndown.
$1,620,000 sanitation system loan payable to various holders due in semi-annual installments ranging from $30,000 to $165,000 beginning October 1, 2013 through October 1, 2018. The loan has a 1.145 5o/o interest rate.
$43,160,000 Nonnan Municipal Authority Revenue Note, Taxable Series 20 15B, due in annual payments ranging from $500,000 to $5,845,000 beginning January 1, 2017 through January 1, 2029. The loan has a 2.98% interest rate.
$30,950,000 Norman Municipal Authority Revenue Note, Taxable Series 2017, due in annual payments ranging from $400,000 to $3,450,000 beginning January 1, 2018 through July 1, 2030. The loan has a 3.00% interest rate.
$9,380,000 Norman Utilities Authority Revenue Note, Refunding Series 2016, due in annual installments ranging from $190,000 to $755,000 beginning September 1, 2016 through September 1, 2030. The loan has a $2.23% interest rate.
$6,105,000 Norman Municipal Authority Revenue Note, Taxable Series 2017B, due in annual payments ranging from $490,000 to $655,000 beginning June 1, 2018 through December 1, 2022. The loan has a 2.16% interest rate.
Authorized, but not issued, $8,250,000 Norman Tax Increment Finance Authority Norman University North Park Project Plan Tax Apportionment Revenue Note, Series 2011, due in annual installments beginning July 1, 2012 through June 30, 2031, at interest rates not to exceed 8%.
Authorized, but not issued, $8,250,000 Nonnan Tax Increment Finance Authority Norman University North Park Project Plan Revenue Note, Series 2011, due in annual installments beginning July 1, 2012 through June 30, 2031, at interest rates not to exceed 8%.
Total notes payable
- 63-
6,891,969
165,000
41,660,000
30,550,000
8,340,000
5,615,000
$

Annual debt service requirements to maturity for notes payable are as follows:
Fiscal Year Principal Interest Total
2019 $ 13,293,418 $ 5,177,618 $ 18,471,036 2020 14,586,629 5,055,059 19,641,688 2021 15,525,268 4,679,818 20,205,086 2022 16,418,254 4,280,552 20,698,806 2023 17,566,505 3,848,910 21,415,415
2024-2028 89,590,752 12,136,179 101,726,931 2029 2033 38,905,427 3,386,678 42,292,105 2034-2038 13,222,786 1,202,070 14,424,856 2039 2040 2,915,000 82,556 2,997,556
Less unfunded notes * ( 49,096,242) ( 49,096,242)
Total $ 39~849A40
d. Capital Leases Payable- Capital leases payable as of June 30, 2018 are as follows:
$1,240,322 capital lease payable in annual installments of $422,984 beginning August 1, 2016 through August 1 , 2018. The capital lease has a 2.18% interest rate. $ 413,971
The City entered into a lease agreement as lessee for financing the acquisition of new data storage equipment. The assets acquired (machinery and equipment) totaled $1,240,322. As of June 30, 201 7 accumulated depreciation totaled zero on the data storage system since it was not yet placed into service.
Fiscal Year Principal Interest Total
2019
Total $ 9,013 $ 422,984 ==="'===
e. Applicability of Federal Arbitrage Regulations Debt issuances of the City and Authorities issued after the Tax Reform Act of 1986 are subject to the federal arbitrage regulations. The arbitrage rebate regulations require that all earnings from the investment of gross proceeds of a bond issue in excess of the amount that could have been earned had the yield on the investment been equal to the yield on the bonds be remitted to the federal government. These carry strict penalties for noncompliance including taxability of interest retroactive to the date of the issue. The City's management believes the City is in compliance with these rules and regulations.
*-Relates to $50,300,000 Clean Water SRF loan and $31,000,000 Drinking Water SRF loan
- 64-

Changes in Long-term Liabilities- Long-term liability activity for the year ended June 30, 2018, was as follows:
Beginning Ending Due Within
Balance Additions Reductions Balance One Year
Governmental activities:
Bonds payable: General obligation bonds $ 61,445,000 $ $ (11 ,085,000) $ 50,360,000 $ 11,130,000 Issuance premium/( discount) 1
Total bonds payable 63,101' 119 (11,312,852) 51,788,267 11,130,000 Sales tax revenue notes 94,625,000 (3,265,000) 91,360,000 3,715,000 Notes payab 1 e 11,815,000 6,105,000 (I ,490,000) 16,430,000 2,445,000 Capital leases 819,121 (405,150) 413,971 413,971 Liability for incurred claims 3,700,122 (1 ,200,000) 2,500,122 1,500,000 Net OPEB obligation 9,471,273 2,259,727 (731,674) 10,999,326 Net pension liability 56,625,541 ( 4,260,002) 52,365,539 Compensated absences
Government activity long-term liabilities $ 19,923,812
Business-type activities:
Bonds payable: Revenue bonds $ 855,000 $ $ (150,000) $ 705,000 $ 160,000 Less deferred amounts:
For issuance premium and (discount) (15,519) 3,104 (12,415)
Total bonds payable 839,481 3,104 (150,000) 692,585 160,000 Notes payable 55,677,108 15,543,415 (6,082,726) 65,137,797 6,054,829
Less deferred amounts: For issuance premium and (discount) (17,827) 1,783 (16,044)
Total notes payable 55,659,281 15,545,198 (6,082,726) 65,121,753 6,054,829 Compensated absences
Business-type activity long-term liabilities $ 16,500,499 $ (7, 167,869) $ 6,300,780
For governmental activities, liability for incurred claims, compensated absences, net pension liability and net OPEB obligation are generally liquidated by the General Fund.
5. FUND BALANCE
The following table shows the fund balance classifications as shown on the governmental funds balance sheet as of June 30, 2018:
- 65-

Other Total
Public Safety Debt Capital Norman Governmental Governmental General Sales Tax Service Projects Forward Funds Funds
FUND BALANCES
Nonspendable: Inventory $ 24,898 $ $ $ $ $ $ 24,898
Restricted: Debt service reserve 5,769,156 5,769,156
Arts and humanities 2,300 2,300
Grant activities 507,621 7,247,853 7,755,474
Bond capital projects 24,023,030 34,405,830 58,428,860
Other capital projects 38,257,642 19,642,908 1,458,448 59,358,998 Seizures 771,386 771,386
CLEET 9,744 9,744
Public safety 23,889,024 23,889,024 Committed:
Economic stablization 3,331,295 3,331,295 Assigned: Other capital projects 3,467,218 614,406 4,081,624 Grant activities 458,968 458,968 Orders on purchase 2,503,122 2,503,122
Unassigned: 13,046,521 13,046,521
Total fund balances
On June 28, 2011, the City adopted ordinance 0-1011-58 changing the City's reserve policy. The ordinance establishes that the General Fund will have an unappropriated reserve of at least three percent (3 o/o) of annually budgeted expenditures, in addition to an appropriated emergency reserve of two percent (2%) of annually budgeted expenditures. In addition, the ordinance establishes the Net Revenue Stabilization Fund (i.e., "Rainy Day Fund") which has a targeted balance of not less than three percent (3%) but not more than six percent (6%) of annually budgeted General Fund expenditures. Fmiher, expenditures of the reserved amounts may occur only when specific circumstances exist. As of June 30,2018 the Rainy Day Fund had a balance of$3,331,295.
- 66 ~

6. RISK MANAGEMENT
The City is self-insured against the following risks:
• Employee health claims to a maximum liability of $250,000 per employee per year.
• Workers compensation claims.
• Unemployment benefits.
• General liability and property damage, except for buildings and contents and employee surety bonds for which the City has purchased commercial insurance.
Employee health claims in excess of the $250,000 limit are covered by insurance. The City's unpaid claims liability of $2,5 00,122 reported at June 3 0, 2018 is based on the requirements of GASB Statement No. 10, which requires that a liability for claims be reported if information prior to the issuance of the financial statements indicates that it is probable that a liability has been incurred at the date of the financial statements and the amount of the loss can be reasonably estimated. However, events could occur that would cause the estimate for unpaid claims liability to differ materially in the near term. The claims liability for health claims incurred but not reported is estimated by management using a three-month claims lag analysis. These amounts are recorded as a current liability within both the government-wide and governmental fund financial statements. The claims liability for workers compensation claims and judgments is estimated using legal counsel's opinion of probable outcome of litigation plus an estimate of claims experience for incurred but unreported claims. These amounts are recorded as long-term liabilities within the government-wide financial statements. A liability for these amounts are recorded in governmental funds when they become due and payable. As of June 30, 2018, no liability has been recognized in the governmental fund financial statements. There are no allocated or unallocated claim adjustment expenditures/expenses included in the liability for unpaid claims.
At June 30, 2018, the City maintained commercial insurance coverage for building and contents and employee theft. In the past three years, the City has had no losses that exceeded commercial insurance coverage. Changes in the reported liability are as follows:
Fiscal year 2017
Fiscal year 2018
7. SEGMENT INFORMATION
Balance at
Beginning of Year
Current Year Claims and
Changes in
Estimates
Claim
Payments
$ (11,151,720)
Balance
at End of Year
The City operates various segments within its enterprise funds. Condensed financial statement information for these segments for the year ended June 30, 2018 was as follows:
- 67-

Norman Municipal Authority Sanitation
Westwood Park Services Total
Current assets: Cash and cash equivalents $ 246,032 $ 1,919,187 $ 2,165,219 Restricted cash and cash equivalents 3,599 562,856 566,455 Investments 10,174,534 10,174,534 Receivables:
Accounts, net of allowance 1,235,290 1,235,290 Due from other funds 182,504 182,504 Interest 12
Total current assets
Noncurrent assets: Restricted assets:
Cash and cash equivalents 223,415 318,846 542,261 Capital assets, net 7,153,529 10,396,592 17,550,121
Total noncurrent assets
Total assets
Current liabilities:
Accounts payable and accrued expenses $ 165,866 $ 259,500 $ 425,366 Payroll payable 56,414 96,647 153,061 Due to other funds Accrued interest payable 3,599 16,300 19,899 Guaranty deposits 398,319 398,319 Revenue bonds payable 160,000 160,000 Notes payable 420,000 420,000 Compensated absences 8,014 23,159 31,173
Total current liabilities 393,893 1,213,925 1,607,818 Non-current liabilities:
Long-term debt and other liabilities 647,447 1,911,919 2,559,366 Total liabilities 1,041,340 3,125,844 4,167,184
Net investment in capital assets 6,448,529 8,396,592 14,845,121 Restricted for debt service 223,415 467,082 690,497 Unrestricted (86,697) 12,746,464
Total net assets
continued
- 68-

Norman Municipal Authority
Sanitation Westwood Park Services Total
Charges for services and goods, net 1,264,059 14,348,188 15,612,247 Other 1 198,095
Total operating revenues 1,298,980
Operating expenses 1,277,786 11,011,836 12,289,622 Depreciation 1 1,771,401 1,934,867
Total operating expenses 1 14,224,489 Operating income (loss) 1
Investment earnings 110,338 Interest expense (55,958) (129,815) Miscellaneous income (expense) 1 (expenses)
Income before capital
contributions and transfers (190,465) 1,943,902 I ,753,437 Transfers, net
Change in net position 56,503 1,897,902 1,954,405 Total net position - beginning Total net position - ending
Net cash provided (used) by: Operating activities 159,142 2,801,527 2,960,669 Noncapital financing activities 246,968 (46,000) 200,968
Capital and related financing activities (265,741) (1,845,684) (2, 111 ,425) Investing activities 4,299 1,020,333 1,024,632 Beginning cash and cash equivalents 328,378 Ending cash and cash equivalents $ 2,800,889 $ 3,273,935
concluded
8. COMMITMENTS AND CONTINGENCIES
Litigation -The City is party to various legal proceedings which normally occur in governmental operations. Management and management's counsel do not believe these legal proceedings will have a material adverse impact on the affected funds of the City. However, events could occur in the near term that would cause these estimates to change materially. Resulting judgments will be paid from ad valorem taxes to be received over a three-year period. At June 30, 2018, the City maintained a litigation reserve, includingjudgments that have been awarded but not yet paid, of approximately $1,409,000.
Federal Grants - In the normal course of operations, the City receives grant funds from various federal agencies. The grant programs are subject to audit by agents of the granting authority, the purpose of which is to insure compliance with conditions precedent to the granting of funds. Management does not believe any liability for reimbursement which may arise as the result of these audits will be material.
- 69-

Lease Commitments - The City has entered into a number of operating leases, all of which contain cancellation provisions that are subject to annual appropriations by the City Council. For the year ended June 30, 2018, rent expenditures approximated $494,000 for all operating leases. These expenditures were made primarily from the General Fund.
Water Revenues- The City entered into a contract with the Central Oklahoma Master Conservancy District (the "District") in 1961 (subsequently modified in 1963) for the purchase of water and operation of water facilities. In general, the contract provides for reimbursing the District for costs of providing the City with water from Lake Thunderbird. The contract is effective for a term of fifty years beginning with the first calendar year during which water was used by the City ( 1965). During the year ended June 30, 2018, the City paid the District $1,196,802.
Construction In Progress- Construction in progress is authorized by actions of the City Council (governing body). A summary of construction in progress as of June 30, 2018 is as follows:
Total
Construction Total Remaining In Progress Project To Complete
General Government $ 86,391,702 $ 186,911,585 $ 100,519,883 Norman Municipal Authority:
Sanitation 41,667 281,750 240,083 Norman Utilities Authority:
Water Fund 23,257,148 65,589,427 42,332,279 Wastewater Fund 63)35,858 66,988,976 3,253,118
The City also contributes to certain State and Federal aid projects which are administered by the State of Oklahoma Department of Highway. The City is billed by the Highway Department for these projects at various stages of completion, subject to Federal audits of the project costs.
Encumbrances As discussed in note three above, budgetary information, budgetary basis of accounting, encumbrance accounting is utilized to the extent necessary to assure effective budgetary control and accountability and to facilitate effective cash planning and control. At June 30, 2018 the amount of encumbrances expected to be honored upon performance by the vendor in the next year were as follows:
General fund $ 2,503,122 Public safety sales tax fund 12,611,192 Capital projects fund 7,185,239 Norman forward fund 18,160,117 Nonmajor governmental funds Total $ 45,789,206
9. RECENTLY ISSUED ACCOUNTING STANDARDS
The following accounting standards have been recently issued and will be adopted as applicable by the
- 70-

City in future years.
GASB Statement No. 83, Certain Asset Retirement Obligations
GASB Statement No. 83 establishes uniform criteria for governments to recognize and measure certain asset retirement obligations (ARO). An ARO is defined as a legally enforceable liability associated with the retirement of a tangible capital asset. Examples could be costs associated with decommissioning a nuclear power plant or disposal of an x-ray machine. An ARO is recognized when the liability is incurred, which is manifested by the occurrence of both an external obligating event (such as a legally binding contract or a court judgment) and an internal obligating event (such as placing a tangible capital asset into service). A government also recognizes a deferred outflow of resources when it recognizes an ARO liability. The ARO is measured at the best estimate of the current value of outlays expected to be incurred. Additional note disclosures are required.
GASB Statement No. 83 is effective for financial statements for fiscal years beginning after June 15, 2018 (effective for the City's June 30, 2019, year-end). Earlier application is encouraged.
GASB Statement No. 84, Fiduciary Activities
GASB Statement No. 84 establishes criteria for identifying fiduciary activities. It presents separate criteria for evaluating component units, pension and other postemployment benefit arrangements, and other fiduciary activities. The focus is on a government controlling the assets of the fiduciary activity and identification of the beneficiaries of those assets. Fiduciary activities are reported in one of four types of funds: pension (and other employee benefit) trust funds, investment trust funds, private-purpose trust funds or custodial funds. Custodial funds are used to report fiduciary activities that are not held in a trust. The agency fund designation will no longer be used. GASB Statement No. 84 also provides guidance on fiduciary fund statements and timing of recognition of a liability to beneficiaries.
GASB Statement No. 84 is effective for financial statements for fiscal years beginning after December 15, 2018 (effective for the City's June 30, 2020, year-end). Earlier application is encouraged.
GASB Statement No. 87, Leases
The objective of GASB Statement No. 87 is to better meet the information needs of financial statement users by improving accounting and financial reporting for leases by governments. GASB Statement No. 87 increases the usefulness of governments' financial statements by requiring recognition of certain lease assets and liabilities for leases that previously were classified as operating leases and recognized as inflows of resources or outflows of resources based on the payment provisions of the contract. It establishes a single model for lease accounting based on the foundational principle that leases are financings of the right to use an underlying asset. Under GASB Statement No. 87, a lessee is required to recognize a lease liability and an intangible right-to-use lease asset, and a lessor is required to recognize a lease receivable and a deferred inflow of resources, thereby enhancing the relevance and consistency of information about governments' leasing activities.
GASB Statement No. 87 is effective for financial statements for fiscal years beginning after December 15, 2019 (effective for the City's June 30, 2021, year-end). Earlier application is encouraged.
GASB Statement No. 88, Certain Disclosures Related to Debt, including Direct Borrowings and Direct Placements
- 71 -

The primary objective of GASB Statement No. 88 is to improve the information that is disclosed in notes to government financial statements related to debt, including direct borrowings and direct placements. It also clarifies which liabilities governments should include when disclosing infom1ation related to debt. GASB Statement No. 88 defines debt for the purposes of disclosure in notes to the financial statements as a liability that arises from a contractual obligation to pay cash (or other assets) in one or more payments to settle an amount that is fixed at the date the contractual obligation is established. GASB Statement No. 88 requires additional essential information related to debt be disclosed, including unused lines of credit; assets pledged as collateral for the debt; and terms specified in debt agreements related to significant events of default with finance- related consequences, significant termination events with finance-related consequences, and significant subjective acceleration clauses.
GASB Statement No. 88 is effective for reporting periods beginning after June 15, 2018 (effective for the City's June 30, 2019, year-end). Earlier application is encouraged.
* * * * *
- 72-

This page left intentionally blank.

Tree Lighting &
Winter Fest
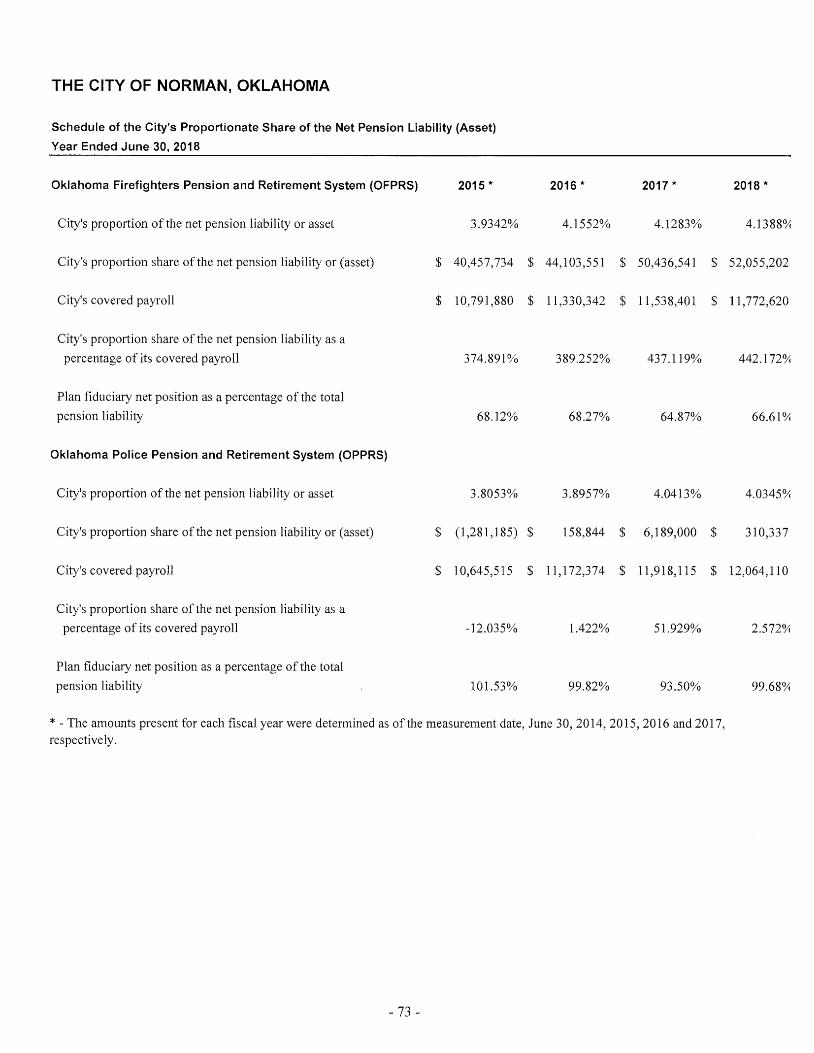
THE CITY OF NORMAN, OKLAHOMA
Schedule of the City's Proportionate Share of the Net Pension Liability (Asset)
Year Ended June 2018
Oklahoma Firefighters Pension and Retirement System (OFPRS) 2015 * 2016 * 2017 * 2018 *
City's proportion of the net pension liability or asset 3.9342% 4.1552% 4.1283% 4.1388~
City's proportion share of the net pension liability or (asset) $ 40,457,734 $ 44, I 03,551 $ 50,436,541 $ 52,055,202
City's covered payroll $ 10,791,880 $ 11,330,342 $ 11,538,401 $ 11,772,620
City's proportion share of the net pension liability as a percentage of its covered payroll 374.891% 389.252% 437.119% 442.172~
Plan fiduciary net position as a percentage of the total pension liability 68.12% 68.27% 64.87% 66.61~
Oklahoma Police Pension and Retirement System (OPPRS)
City's proportion of the net pension liability or asset 3.8053% 3.8957% 4.0413% 4.0345~
City's proportion share of the net pension liability or (asset) $ (1,281,185) $ 158,844 $ 6,189,000 $ 310,337
City's covered payroll $ 10,645,515 $ 11,172,374 $ 11 ,918,115 $ 12,064,110
City's proportion share of the net pension liability as a percentage of its covered payroll -12.035% 1.422% 51.929% 2.572~
Plan fiduciary net position as a percentage of the total pension liability 101.53% 99.82% 93.50% 99.68~
* The amounts present for each fiscal year were determined as of the measurement date, June 30, 2014, 2015, 2016 and 2017, respectively.
- 73-

THE CITY OF NORMAN, OKLAHOMA
Schedule of the City's Contributions
Year Ended June 2018
2015 2016 2017 2018 Oklahoma Firefighers Pension and Retirement System (OFPRS)
Contractually required contribution $ I ,586,248 $ 1,615,405 $ 1,650,048 $ 1,711,565
Contributions in relation to the contractually required contribution 1,586,248 1,711,565
Contribution deficiency (excess)
City's covered payroll $ 11,330,342 $ 11,538,401 $ 11,772,620 $ 12,225,464
Contributions as a percentage of covered payroll 14% 14% 14% 14%
Oklahoma Police Pension and Retirement System (OPPRS)
Contractually required contribution $ I ,452,409 $ 1,550,235 $ 1,568,335 $ 1,606,716
Contributions in relation to the contractually required contribution 1,606,716
Contribution deficiency (excess)
City's covered payroll $ I1, 172,374 $ 11,918,115 $ 12,064,110 $ 12,359,354
Contributions as a percentage of covered payroll 13% 13% 13% 13%
Note to Schedule: Only fiscal year 2015, 2016, 2017 and 2018 are presented because 10 year data is not yet available.
- 74-

THE CITY OF NORMAN, OKLAHOMA
SCHEDULE OF CHANGES IN THE CITY'S TOTAL OPEB LIABILITY AND RELATED RATIOS
LAST TEN FISCAL YEARS
Total OPEB Liability Service cost Interest Differences between expected and actual experience Changes of assumptions or other inputs Benefit payments
Net Change in Total OPEB Liability
City's Total OPEB Liability- Beginning
City's Total OPEB Liability- Ending
Covered Payroll
City's Total OPEB Liability as a Percentage of Covered Payroll
Notes to Schedule:
2018
$ 363,920 423,574 965,685
(1 ,095,942) (731,674)
(74,437)
I 1
10,999,326
$ 49,743,998
22.11%
This schedule is presented as of the measurement date for the fiscal year. Only the current fiscal year is presented because 1 0-year data is not available.
- 75-

THE CITY OF NORMAN, OKLAHOMA
GENERAL FUND SCHEDULE OF REVENUES, EXPENDITURES, ENCUMBRANCES AND CHANGES IN FUND BALANCE -BUDGET AND ACTUAL (NON-GAAP BUDGETARY BASIS) FOR THE YEAR ENDED JUNE 2018
Variance-
Original Revised Encum· Positive
Budget Revisions Budget Expenditures brances Actual (Negative)
Taxes: Sales taxes $ 40,128,750 $ $ 40,128,750 $ $
Franchise taxes 7,828,000 7,828,000 State use taxes
Total taxes
Licenses and permits: Licenses 321,305 321,305 308,540 (12, 765) Permits 1,223,995 (428,829)
Total licenses and permits 1,103,706 (441,594)
State Shared Revenues: State motor fuel 277,840 277,840 230,022 (47,818) Alcoholic beverage 315,117 315,117 322,234 7,117 Cigarette 855,804 855,804 877,008 21,204 State motor vehicle
registration 888,260
Total intergovern-mental revenues 2,337,021 2,278,602
Charges for services: Zoning & subdivision 168,086 168,086 105,484 (62,602) Public safety 441,954 441,954 323,324 (118,630) Health 219,900 219,900 118,588 (101,312) Recreation fees 490,700 490,700 428,149 (62,551) Credit card confcnience fees 753,000 753,000 683,215 (69,785) 911 emergency fees 34,973
Total charges for services (76,871)
Fines and forfeitures: Police court fines 2,188,750 2,188,750 2,377,602 188,852 Miscellaneous forfeitures
Total fines and forfeits 2,188,750 2,188, 750 2,365,632
Investment earnings 25,000
Other revenue: Contributions 28,000 349,580 377,580 343,431 (34,149) Rents and royalties 276,855 276,855 214,568 (62,287) Cost allocations 9, 750,058 9,750,058 9,536,241 (213,817) Sale of fixed assets 163,000 163,000 116,619 (46,381) Miscellaneous revenues 1,411,819
Total other revenue 349,580 __ 1_1 ,979,312 (618,105)
Total revenues 70,623,666 69,189,784
(Continued)
- 76-

THE CITY OF NORMAN, OKLAHOMA
GENERAL FUND
SCHEDULE OF REVENUES, EXPENDITURES, ENCUMBRANCES AND CHANGES IN FUND BALANCE -
BUDGET AND ACTUAL (NON-GAAP BUDGETARY BASIS) FOR THE YEAR ENDED JUNE 30, 2018
Variance-
Original Revised En cum- Positive Budget Revisions Budget Expenditures brances Actual (Negative)
General government: City council $ 2,505,923 $ 32,416 $ 2,538,339 $ 1,018,186 $ 10,590 $ 1,028,776 $ 1,509,563 City manager's office 436,212 149,307 585,519 368,525 368,525 216,994 Community relations 274,027 (14,349) 259,678 227,668 24,820 252,488 7,190 Communications 114,270 62,674 176,944 150,097 150,097 26,847 City clerk's office 596,370 (12,413) 583,957 582,567 568 583,135 822 Municipal court 1,106,794 (21,748) 1,085,046 1,058,738 3,300 1,062,038 23,008 Legal administration 1, 171,137 389,659 1,560,796 1,427,374 1,427,374 133,422 Information Technology 2,270,002 336,911 2,606,913 2,133,696 104,142 2,237,838 369,075 Human resource admin 745,138 80,941 826,079 723,009 2,493 725,502 100,577 Safety administration 154,951 (8,860) 146,091 124,192 3,578 127,770 18,321 Building services admin 115,936 2,380 118,316 107,839 60 107,899 10,417 Custodial services 223,557 (30,282) 193,275 190,446 (60) 190,386 2,889 Building repair services 612,470 10,640 623,110 552,991 2,937 555,928 67,182 Human rights commission 230 230 66 66 164 Children's rights commission 176 176 175 175 1 Social & voluntary services 175,000 3,738 178,738 161,462 13,539 175,001 3,737 Norman public library 344,876 27,257 372,133 372,132 372,132 1 Firehouse art center 85,147 (1,438) 83,709 74,574 74,574 9,135 Historical museum 40,618 40,618 37,961 37,961 2,657 Sooner theatre 91,843 91,843 89,919 89,919 1,924 Juvenile services 46,146 46,146 25,514 25,514 20,632 Employee training 3,726 2,530 6,256 6,177 6,177 79 Employee assitance program 29,444 29,444 29,400 29,400 44 Special studies & contributions 35,000 58,267 93,267 76,470 13,520 89,990 3,277 Municipal elections 82,115 5,236 87,351 68,595 68,595 18,756 Sister cities program 1,000 1,570 2,570 1,570 1,570 1,000 Holiday decorations 26,970 (1,474)
Total general government 179,972
Planning: Planning commission 347 (37) 310 310 310 Historic district commission 5,837 (1,000) 4,837 1,897 1,897 2,940 Greenbelt commission 490 (490) Planning administration 585,518 (3,957) 581,561 575,386 1,032 576,418 5,143 Geographic information 435,123 (9,435) 425,688 405,358 405,358 20,330 Development services 1,611,429 5,800 1,617,229 1,532,436 18,343 1,550,779 66,450 Revitalization 774,414 (1,048) 773,366 694,478 814 695,292 78,074 Current planning 1 23 231,898 75
Total planning 3,634,964 3,441,763 20,189 3,461,952 173,012
(Continued)
- 77-

THE CITY OF NORMAN, OKLAHOMA
GENERAL FUND SCHEDULE OF REVENUES, EXPENDITURES, ENCUMBRANCES AND CHANGES IN FUND BALANCE-BUDGET AND ACTUAL (NON-GAAP BUDGETARY BASIS) FOR THE YEAR ENDED JUNE 30, 2018
Variance-Original Revised Encum- Positive Budget Revisions Budget Expenditures brances Actual (Negative)
City controller: Finance administration $ 306,823 $ 4,682 $ 311,505 $ 313,049 $ $ 313,049 $ (1,544) Accounting services 681,357 (3,328) 678,029 654,490 13,700 668,190 9,839 Printing services 257,530 (41,798) 215,732 181,951 107 182,058 33,674 Budget services 138,768 (4,875) 133,893 131,331 131,331 2,562 Treasury services 664,112 167,851 831,963 827,256 600 827,856 4,107 Utility services 1,329,178
Total city controller
Parks and recreation: Parks board 767 (36) 731 245 245 486 Mosquito control program 15,977 (2, 1 09) 13,868 4,124 4,124 9,744 Santa Fe Depot 9,134 9,134 5,727 78 5,805 3,329 Administration 607,888 (13,286) 594,602 591,228 56 591,284 3,318 Park maintenance 2,461,962 (14,135) 2,447,827 2,152,024 49,585 2,201,609 246,218 Forestry 20,850 (10,352) 10,498 10,089 10,089 409 Recreation little league 305,842 (16,804) 289,038 143,363 752 144,115 144,923 Recreation programs 1,228,639 73,714 1,302,353 1,262,153 2,520 1,264,673 37,680 Senior citizens center 159,986 1
Total parks & recreation
Public works: Public works administratic 319,473 9,352 328,825 309,079 13,483 322,562 6,263 Engineering department I ,241, 798 172,087 1,413,885 1,163,558 9,781 1,173,339 240,546 Street maintenance 4,342,904 28,171 4,371,075 3,328,789 423,009 3,751,798 619,277 Stormwater drainage 2,348,565 415,558 2,764,123 1,844,957 33,156 1,878,113 886,010 Stormwater quality 423,644 16,229 439,873 367,432 6,370 373,802 66,071 Traffic control 3,612,102 226,164 3,838,266 3,402,392 124,343 3,526,735 311,531 Fleet maintenance admin 404,863 23,692 428,555 415,021 646 415,667 12,888 Fleet repair light duty 491,349 6,444 497,793 478,152 478,152 19,641 Fleet repair heavy duty 779,707 (8,900) 770,807 747,770 1,226 748,996 21,811 Fleet fuel and parts 2,827,882 7,469 2,835,351 2,216,137 56,682 2,272,819 562,532 CNG Station 41 19,289 301,389 117,373
Total public works 17,190,816 916,499 18,107,315 14,555,387
Public safety: Police department admin l ,435,593 162,397 1,597,990 1,593,553 1,859 1,595,412 2,578 Staff services 2,313,693 32,222 2,345,915 2,268,732 50,566 2,319,298 26,617 Criminal investigations 2,923,923 (6,300) 2,917,623 2,772,855 60,005 2,832,860 84,763 Patrol 10,084,356 79,522 10,163,878 9,723,919 20,490 9,744,409 419,469 Special Investigations 1 '145,858 138,476 1,284,334 1,241,404 4,057 1,245,461 38,873 Animal control 1,406,525 38,473 1,444,998 1,356,245 45,891 1,402,136 42,862 91 l services 2,038,704 (42,236) 1,996,468 1,909,272 25,954 1,935,226 61,242 Fire department admin 582,251 67,384 649,635 609,809 16 609,825 39,810 Training- fire department 322,958 16,304 339,262 301,276 5,481 306,757 32,505 Fire prevention 891,024 9,262 900,286 884,885 5,919 890,804 9,482 Fire suppression 13,414,135 207,621 13,621,756 13,101,314 185,462 13,286,776 334,980 Diaster preparedness servi1 2 1
Total public safety 36,733,608 741,115 37,474,723 444,642 36,377,179 1,097,544
Total expenditures and encumbrances
(Continued)
- 78-

THE CITY OF NORMAN, OKLAHOMA
GENERAL FUND SCHEDULE OF REVENUES, EXPENDITURES, ENCUMBRANCES AND CHANGES IN FUND BALANCE· BUDGET AND ACTUAL (NON-GAAP BUDGETARY BASIS) FOR THE YEAR ENDED JUNE 30, 2018
Excess (deficiency) of revenues over cxpendi" tures and encumbrances
OTHER FINANCING SOURCES (USES): Transfers in: Norman Utilities
Authority Sanitation Fund Capital Projects Fund UNP TIF Fund Center City TIF Fund Insurance Fund
Total transfers in
Transfers out: Insurance Fund Westwood Fund Center City TIF Fund
Total transfers out
Net other financing sources
Original
Budget
1,664,877 46,000
3,656,410
Revisions
3,972,075 85,888
4,157,804
(80,087) (40,152)
(200,000)
Revised
Budget
1,664,877 46,000
3,656,410 3,972,075
85,888
9,525,091
(80,087) (40,152)
(200,000)
- 79-
Actual
1,709,640 46,000
2,887,277 4,275,508
85,888
(80,087)
(280,087)
8,805,479
Variance
Positive
(Negative)
44,763
(769,133) 303,433
40,152
(399,373)
(Continued)

THE CITY OF NORMAN, OKLAHOMA
GENERAL FUND SCHEDULE OF REVENUES, EXPENDITURES, ENCUMBRANCES AND CHANGES IN FUND BALANCEBUDGET AND ACTUAL (NON-GAAP BUDGETARY BASIS) FOR THE YEAR ENDED JUNE 30, 2018
Excess (deficiency) of revenues and other sources over (under) expenditures, encumbrances, and other uses
Fund balance, July 1, 2017 (N on-GAAP budgetary basis)
Fund balance, June 30, 2018 (N on-GAAP budgetary basis)
Original
Budget
(1,064,021)
Revisions
1,275,924
$ 1,275,924
Revised
Budget
211,903
$ 338,128
- 80-
Actual
5,270,156
Variance
Positive
(Negative)
5,058,253
(Concluded)

THE CITY OF NORMAN, OKLAHOMA
PUBLIC SAFETY SALES TAX FUND SCHEDULE OF REVENUES, EXPENDITURES, ENCUMBRANCES AND CHANGES IN FUND BALANCEBUDGET AND ACTUAL (NONMGAAP BUDGETARY BASIS) FOR THE YEAR ENDED JUNE 30, 2018
Original Revised En cum-Budget Revisions Budget Expenditures brances
REVENUES: Taxes:
Sales tax $ 9,613,475 $ $ 9,613,475 Use tax __ 4<D~2.~
Total taxes I 0,074,967 10,074,967
SRO reimbursement-NPS 648,694 648,694 Investment earnings 50,000 50,000 Miscellaneous income -----
Total revenues
EXPENDITURES AND ENCUMBRANCES: Public safety:
Police staff services 92,531 411,125 503,656 $ (227,511) $ 299,494 Police criminal investigations 630,814 62,865 693,679 627,488 41,092 Police patrol 5,175,167 444,111 5,619,278 5,232,564 114,616 911 1 I 0,536 19,928 130,464 130,383 Fire suppression 4,662,831 (378,529) 4,284,302 3,891,557 237,871 Capital projects 70,000 20,456,054 20,526,054 113,369 33,513 Debt services
Total expenditures and encumbrances 34,104,320
Excess (deficiency) of revenues over (under) expenditures
and encumbrances (2,314,592) (21 ,016,067) (23,330,659)
Excess (deficiency) of revenues and other sources over (under) expenditures, encumbrances
and other sources (uses)
Fund balance, July I, 2017 (Non-GAAP budgetary basis) 12,015,948
Fund balance, June 30,2018 (Non-GAAP budgetary (basis)
M 81 -
Variance-Positive
Actual (Negative)
$ 9,193,369 $ (420,1 06) 618,698
9,812,067 (262,900)
648,694 226,141 176,141
10,689,960
71,983 431,673 668,580 25,099
5,347,180 272,098 130,383 81
4,129,428 154,874 146,882 20,379,172
2,346,886
21 ,262,998_
(2, 151 ,362) 21,179,297

NOTES TO REQUIRED SUPPLEMENTARY INFORMATION ON BUDGETARY COMPARISON SCHEDULE- GENERAL FUND AND PUBLIC SAFETY SALES TAX FUND
Budget Reconciliation,\'- Items required to adjust actual revenues, expenditures, and fund balances reported on the budgetary basis to those reported within the fund financial statements as of and for the year ended June 30, 2018, are as follows:
Public Safety
General Sales Tax
Fund Fund
Fund balances- budgetary basis, June 30,2018 $ 5,396,381 $ 9,864,586 Current year encumbrances included in expenditures 1,402,066 726,586 Prior year encumbrances outstanding 1,113,996 11,864,292 Current year revenue accrual 8,999,353 1,641,189 Current year expenditure accrual (1,337,255) (207,629) Rainy Day Fund Balance 3,331,295
Fund balances -fund financial statements, June 30, 2018
Revenues- budgetary basis $ 69,189,784 $ 10,689,960 Current year revenue accrual 8,999,353 1,641,189 Prior year revenue accrual (8,317,688) (1,574,198) Interest earned within Rainy Day Fund
Revenues - fund financial statements $ 69,900,088 $ 10,756,951
Expenditures budgetary basis $ 72,725,107 $ 12,841,322 Current year encumbrances included in expenditures ( 1 ,402, 066) (726,586) Prior year encumbrances paid 1,184,475 1,383,050 Current year expenditure accrual 1,337,255 207,629 Prior year expenditure accrual (1 ,248,429) (195,503)
Expenditures - fund financial statements $ 72,596,342 $ 13,509,912
- 82-

May 2018 Art Walk

THE CITY OF NORMAN, OKLAHOMA
COMBINING BALANCE SHEET NONMAJOR GOVERNMENTAL FUNDS JUNE 30, 2018
Art in Total
Norman Community Special Park Seizures and Public Nonmajor Room Development Grants Land Restitutions Cleet Places Governmental
Tax Fund Fund Fund Fund Fund Fund Fund Total ASSETS
Cash and cash equivalents $ 183,794 $ 4,776,710 $ 646,998 $ 155,036 $ 497,892 $ 5,833 $ 1,859 $ 6,268,122
Investments 200,051 - 1,110,568 710,813 331,976 5,093 - 2,358,501 Receivables:
Taxes 187,043 - - - - - - 187,043 Accounts - - - - - 346 346 Interest 635 - 3,529 2,259 1,055 16 - 7,494
Due from Federal Government - 888,405 334,027 - - - 1,222,432
Due from other funds 17,233 443,615 58,793 14,698 4,136 546 124 539,145
Total assets $ 588,756 $ 6,108,730 $ 2,153,915 $ 882,806 $ 835,059 $ 11,488 $ 2,329 $ 10,583,083 LIABILITIES AND
FUND BALANCE
Liabilities: Accounts payable and other
accrued liabilities $ - $ 214,548 $ 1,162 $ - $ 31,260 $ 777 $ - $ 247,747 payable - 7,701 6,125 - - - - 13,826
Retainage payable - 372,811 - - - - - 372,811
Total liabilities - 595,060 7,287 - 31,260 777 - 634,384
Fund balance: Restricted 583,583 5,513,670 1,734,183 874,865 771,386 9,744 2,300 9,489,731 Assigned 5,173 - 412,445 7,941 32,413 967 29 458,968
Total fund balance 588,756 5,513,670 2,146,628 882,806 803,799 10,711 2,329 9,948,699
Total liabilities and fund balance $ 588,756 $ 6,108,730 $ 2,153,915 $ 882,806 $ 835,059 $ 11,488 $ 2,329 $ 10,583,083
- 83-

THE CITY OF NORMAN, OKLAHOMA
COMBINING STATEMENT OF REVENUES, EXPENDITURES, AND CHANGES IN FUND BALANCES NONMAJOR GOVERNMENTAL FUNDS FOR THE YEAR ENDED JUNE 30, 2018
Art in Total
Norman Community Special Park Seizures and Public Nonmajor Room Development Grants Land Restitutions Cleet Places Governmental
Tax Fund Fund Fund Fund Fund Fund Fund Total Revenues:
Taxes $ 1,879,453 $ - $ - $ - $ - $ - $ - $ 1,879,453
revenues - 7,389,845 345,273 - - 24,825 - 7,759,943 Charges for services - - 69,389 - - - 69,389 Investment earnings 2,262 - 15,348 7,941 8,836 74 28 34,489 Other - - - 819 236,582 296 10,492 248,189
Total revenues 1,881,715 7,389,845 360,621 78,149 245,418 25,195 10,520 9,991,463
Expenditures: Current:
Parks and recreation 65,004 - - - - - 11,442 76,446 Public service 1,357,635 1,292,763 11,249 - - - - 2,661,647 Public safety - - 184,531 - 130,762 27,791 - 343,084 Public works - - 9,354 - - - 9,354
Capital outlay 14,596 6,288,734 184,496 58,293 15,272 - - 6,561,391 1,437,235 7,581,497 389,630 58,293 146,034 27,791 _____!_1442 9,651,922
Excess of revenues over (under) expenditures 444,480 (191,652) (29,009) 19,856 99,384 (2,596) (922) 339,541
Other sources (uses
Transfers in Transfers out {203,619) (6,923,065) (100,000) - (82,500) - - (7,309, 184)
Net other ~
sources (uses) (203,619) (6,923,065) (100,000) - (82,500) - (7,309,184)
Net change in fund balances 240,861 (7,114,717) (129,009) 19,856 16,884 (2,596) (922) (6,969,643)
Fund balance - beginning 347,895 12,628,387 2,275,637 862,950 786,915 13,307 3,251 16,918,342
Fund balance - endin£ $ 588,756 $ 5,513,670 $ 2,146,628 $ 882,806 $ 803,799 $ 10,711 $ 2,329 $ 9,948,699
- 84-

THE CITY OF NORMAN, OKLAHOMA
NORMAN ROOM TAX FUND SCHEDULE OF REVENUES, EXPENDITURES, ENCUMBRANCES AND CHANGES IN FUND BALANCE~ BUDGET AND ACTUAL (NON-GAAP BUDGETARY BASIS) FOR THE YEAR ENDED JUNE 30, 2018
REVENUES: Taxes:
Original
Budget Revisions
Revised
Budget Expenditures
Encum
brances Actual
Variance
Positive
(Negative)
Hotel/motel tax Investment earnings
$ 1,797,350 $ ~ $ 1,797,350 $ 1,874,828 $ 77,478
Total revenues
EXPENDITURES AND ENCUMBRANCES: Public service:
Room tax
Total and
encumbrances 1,719,524
Excess (deficiency) ofrevenues
over (under) expenditures and encumbrances
OTHER FINANCING USES: Transfers out:
Westwood
Net other financing sources (uses)
Excess (deficiency) ofrevenues and other sources over (under) expenditures, encumbrances and other uses
Fund balance, July 1, 2017 (Non-GAAP budgetary basis)
Fund balance, June 30, 2018 (Non-GAAP budgetary basis)
(99,827)
(18,751) (343,014) (361 ,765)
- 85 -
144,785 506,550
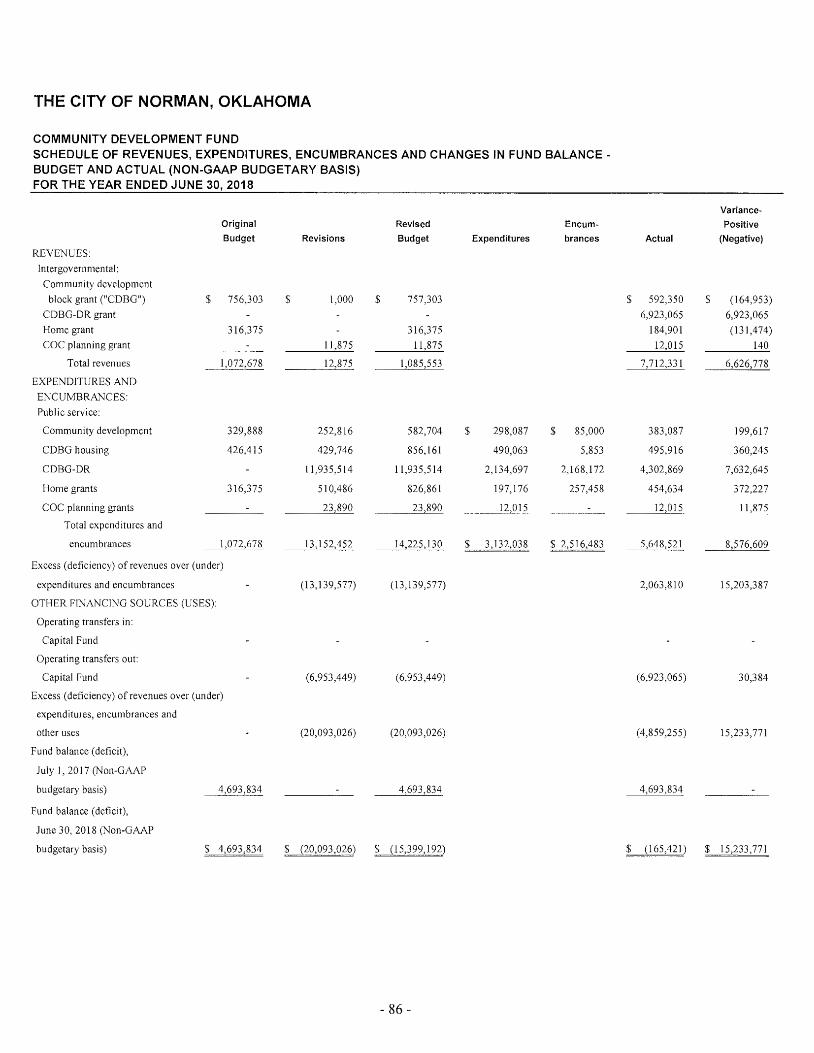
THE CITY OF NORMAN, OKLAHOMA
COMMUNITY DEVELOPMENT FUND SCHEDULE OF REVENUES, EXPENDITURES, ENCUMBRANCES AND CHANGES IN FUND BALANCEBUDGET AND ACTUAL (NON-GAAP BUDGETARY BASIS) FOR THE YEAR ENDED JUNE 30, 2018
Original Revised Encum·
Budget Revisions Budget Expenditures brances
REVENUES: Intergovernmental: Community development
block grant ("CDBG") $ 756,303 $ 1,000 $ 757,303 CDBG-DR grant Home grant 316,375 316,375 COC planning grant 11,875
Total revenues
EXPENDITURES AND ENCUMBRANCES: Public service:
Community development 329,888 252,816 582,704 $ 298,087 $ 85,000
CDBG housing 426,415 429,746 856,161 490,063 5,853
CDBG-DR 11,935,514 11,935,514 2,134,697 2,168,172
Home grants 316,375 510,486 826,861 197,176 257,458
COC planning grants 12,015 ----Total expenditures and
encumbrances 1,072,678
Excess (deficiency) of revenues over (under)
expenditures and encumbrances (13,139,577) ( 13, 139,577)
OTHER FINANCING SOURCES (USES):
Operating transfers in:
Capital Fund
Operating transfers out:
Capital Fund (6,953,449) (6,953,449)
Excess (deficiency) of revenues over (under)
expenditures, encumbrances and
other uses (20,093,026) (20,093,026)
Fund balance (deficit),
July 1, 2017 (Non-GAAP
budgetary basis) 4,693,834
Fund balance (deficit),
June 30, 2018 (Non-GAAP
budgetary basis)
- 86-
Variance·
Positive
Actual (Negative)
$ 592,350 $ (164,953) 6,923,065 6,923,065
184,901 (131,474) 140
6,626,778
383,087 199,617
495,916 360,245
4,302,869 7,632,645
454,634 372,227
2,063,810 15,203,387
(6,923,065) 30,384
(4,859,255) 15,233,771

THE CITY OF NORMAN, OKLAHOMA
SPECIAL GRANTS FUND SCHEDULE OF REVENUES, EXPENDITURES, ENCUMBRANCES AND CHANGES IN FUND BALANCE-BUDGET AND ACTUAL (NON-GAAP BUDGETARY BASIS)
Variance-
Original Revised Encum- Positive
Budget Revisions Budget Expenditures brances Actual (Negative)
REVENUES:
Intergovernmental: County Court DUI $ 62,834 $ $ 62,834 $ 31,391 $ (31,443)
Public safety grants 156,650 156,650 173,687 17,037 Public service grants 23,658 23,658
Public works grants
Total intergovernmental 62,834 156,650 219,484 722,356 502,872
Investment earnings 19,973
Total revenues 62,834
EXPENDITURES AND
ENCUMBRANCES:
our enforcement 62,834 616 63,450 $ 30,234 $ 758 30,992 32,458
Traffic & alcohol enforcement 110,173 110,173 70,209 70,209 39,964
Shelter rebate grant 96,606 96,606 40,830 40,830 55,776
Homeland security grant 23,450 23,450 23,450 23,450
Emergency management 2,562 2,562 2,080 2,080 482
Miscellaneous police grants 96 96 96
SHPO I CLG grant 11,250 11,250 11,249 11,249
Firehouse art grant 25,000 25,000 25,000
CNG facility 21 21 (21) (21) 42
ACOG fleet conversion grant 124 124 (124) (124) 248
Legacy trail improvement grant 558,425 558,425 (1 ,046) (1,046) 559,471
Sutton Wilderness grant 160,000 160,000 160,000
Drug evaluation/recognition 83,797 83,797 41,029 41,029 42,768
Traffic grant 1,314,615 1,314,615 10,400 10,400 1,304,215
School Zone Imp grant 15,000 15,000
Total expenditures and
encumbrances
(Continued)
87

THE CITY OF NORMAN, OKLAHOMA
SPECIAL GRANTS FUND SCHEDULE OF REVENUES, EXPENDITURES, ENCUMBRANCES AND CHANGES IN FUND BALANCEBUDGET AND ACTUAL (NON~GAAP BUDGETARY BASIS) FOR THE YEAR ENDED JUNE 2018
Original
Budget
Excess (deficiency) of revenues and
other sources over (under) expenditures,
encumbrances
OTHER FINANCING SOURCES (USES):
Operating transfers in:
Capital Fund
General Fund
Operating transfers out:
General Fund
Net other financing sources
sources
Excess (deficiency) ofrevenucs and
other sources over (under) expenditures,
encumbrances and other sources (25,000)
Fund balance (deficit), July 1, 2017
(Non-GAAP budgetary
basis)
Fund balance (deficit), June 30, 2018
(Non-GAAP budgetary
basis)
Revisions
(2,220,085)
(1 00,000)
(2,320,085)
Revised
Budget
(2,245,085)
(1 00,000)
. (l 00,000)
(2,345,085)
- 88-
Expenditures
Encum
brances Actual
513,281
(100,000)
(l 00,000)
413,281
Variance
Positive
(Negative)
2,758,366
(Concluded)

THE CITY OF NORMAN, OKLAHOMA
PARK LAND FUND SCHEDULE OF REVENUES, EXPENDITURES, ENCUMBRANCES AND CHANGES IN FUND BALANCEBUDGET AND ACTUAL (NON-GAAP BUDGETARY BASIS) FOR THE YEAR ENDED JUNE 30, 2017
Original
Budget Revisions
Revised
Budget Expenditures
Encum
brances Actual
REVENUES: Investment earnings Charges for services
Total revenues
EXPENDITURES AND
ENCUMBRANCES:
Parks and recreation
Total expenditures
and encumbrances
Excess (deficiency) of
$
revenues over (under) expenditures
and encumbrances and other
Fund balance, July 1, 2017 (Non-GAAP budgetary basis)
Fund balance, June 30, 2018 (Non-GAAP budgetary basis)
10,000 $ $ 10,000 $ 13,468
130,000 130,000
130,000 (178,679) (48,679) 45,131
- 89-
$
Variance
Positive
(Negative)
3,468
140,953
140,953
93,810
$ 93,810

THE CITY OF NORMAN, OKLAHOMA
SEIZURES AND RESTITUTIONS FUND SCHEDULE OF REVENUES, EXPENDITURES, ENCUMBRANCES AND CHANGES IN FUND BALANCEBUDGET AND ACTUAL (NON~GAAP BUDGETARY BASIS) FOR THE YEAR ENDED JUNE 30, 2018
Original Revised Encum-
Budget Revisions Budget Expenditures brances
REVENUES: Intergovernmental: State Seizure/Restitution $ 9,000 $ $ 9,000 Federal Seizure/Restitution 6,000 6,000
Investment earnings 500 500 Miscellaneous income
Total revenues 15,500
EXPENDITURES AND ENCUMBRANCES: Public Safety:
State seizures 156,560 63,198 219,758 $ 138,543 $ 27,994 Federal seizures 82,693 82,993 492
Total expenditures and encumbrances 145,891
Excess (deficiency) of revenues over (under) expenditures and encumbrances
OTHER FINANCING SOURCES (USES): Transfers out:
General Fund
Net other financing sources
Excess (deficiency) of revenues over (under) expenditures and encumbrances and other financing sources (uses) (141,360) (145,891) (287,251)
Fund balance, July 1, 2017 (Non-GAAP budgetary basis)
Fund balance, June 30, 2018 (Non-GAAP budgetary basis)
90-
Variance·
Positive
Actual (Negative)
$ 161,754 $ 152,754 68,976 62,976 11,351 10,851
166,537 53,221
492 82,501
368,155
(~Q,500) (~Q,500)
un,soo) UQ,500)
(1,596) 285,655
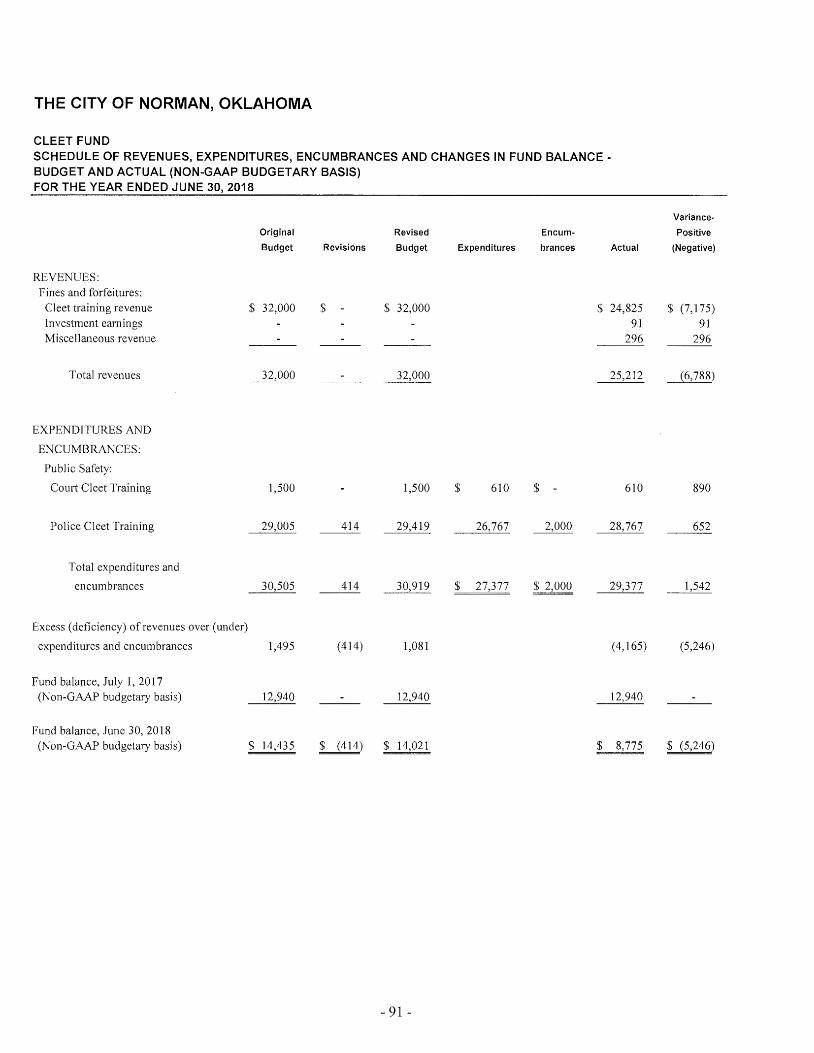
THE CITY OF NORMAN, OKLAHOMA
CLEET FUND SCHEDULE OF REVENUES, EXPENDITURES, ENCUMBRANCES AND CHANGES IN FUND BALANCEBUDGET AND ACTUAL (NON-GAAP BUDGETARY BASIS) FOR THE YEAR ENDED JUNE 30, 2018
REVENUES: Fines and forfeitures:
Cleet training revenue Investment earnings Miscellaneous revenue
Total revenues
EXPENDITURES AND
ENCUMBRANCES:
Public Safety:
Court Clcet Training
Police Cleet Training
Total expenditures and
encumbrances
Excess (deficiency) of revenues over (under)
expenditures and encumbrances
Fund balance, July 1, 2017 (Non-GAAP budgetary basis)
Fund balance, June 30, 2018 (Non-GAAP budgetary basis)
Original
Budget
$ 32,000
1,500
1,495
12,940
Revisions
$
414
(414)
---
Revised
Budget
$ 32,000
1,500
1,081
12,940
- 91 -
Expenditures
$ 610 $
Encum
brances Actual
$ 24,825 91
610
( 4, 165)
12,940
Variance
Positive
(Negative)
$ (7,175) 91
(6,788)
890
(5,246)

THE CITY OF NORMAN, OKLAHOMA
ART IN PUBLIC PLACES FUND SCHEDULE OF REVENUES, EXPENDITURES, ENCUMBRANCES AND CHANGES IN FUND BALANCEBUDGET AND ACTUAL (NON-GAAP BUDGETARY BASIS) FOR THE YEAR ENDED JUNE 30, 2018
REVENUES:
Original
Budget
Other revenue $ 16,000
Total revenues
EXPENDITURES AND
ENCUMBRANCES:
Parks & recreation
Donation
Total expenditures and
encumbrances
Excess (deficiency) of revenues over (under)
expenditures and encumbrances
OTHER FINANCING SOURCES (USES):
Transfers in:
General Fund
Excess (deficiency) of revenues over (under)
expenditures and encumbrances
and other financing sources (uses)
Fund balance, July 1, 2017 (Non-GAAP budgetary basis)
16,000
16,000
Revisions
(3,251)
(3,251)
Revised
Budget
$ 16,000
(3,251)
(3,251)
Expenditures
Encum
brances Actual
$ 10,520
(5,481)
(5,481)
Variance
Positive
(Negative)
(2,230)
(2,230)
Fund balance, June 30,2018 (Non-GAAP budgetary basis) $ $ (3,251) $ (3,251) $ (5,481) $ (2,230)
- 92-

THE CITY OF NORMAN, OKLAHOMA
DEBT SERVICE FUND SCHEDULE OF REVENUES, EXPENDITURES, ENCUMBRANCES AND CHANGES IN FUND BALANCEBUDGET AND ACTUAL (NON-GAAP BUDGETARY BASIS) FOR THE YEAR ENDED JUNE 30, 2018
REVENUES: Taxes:
Original
Budget Revisions
Revised
Budget Expenditures
Encum
brances Actual
Property tax Sales tax
$14,197,672 $ $14,197,672 $ 1 0,404,1 06
Total taxes
Investment earnings
Other revenue: Special assessments
Total revenues
EXPENDITURES AND ENCUMBRANCES:
Debt service: Principal Interest and 1iscal charges
Total expenditures and encumbrances
Excess (deficiency) of revenues over (under) expenditures and encumbrances
OTHER FINANCING SOURCES (USES):
Transfers out: Insurance fund
Net other 1inancing sources (uses)
Excess (deficiency) ofrevenues and other sources over (under) exclen<jJtulres encumbrances and other sources (uses)
Fund balance, July 1, 2017 (Non-GAAP budgetary basis)
Fund balance, June 30, 2018 (Non-GAAP budgetary (basis)
14,197,672 14,197,672 10,404,106
25,000 25,000 133,297
14,222,672 14,222,672
11,085,000 11,085,000 $ 11,085,000 $ - 11,085,000
1,526,081
(825,000)
(825,000) (825,000)
701,081 701,081 (2,807,350)
8,670,288 8,670,288 8,670,288
-93
Variance
Positive
(Negative)
$ (3, 793,566)
(3, 793,566)
108,297
(3,508,431)

THE CITY OF NORMAN, OKLAHOMA
CAPITAL PROJECTS FUND SCHEDULE OF REVENUES, EXPENDITURES, ENCUMBRANCES AND CHANGES IN FUND BALANCEBUDGET AND ACTUAL (NON-GAAP BUDGETARY BASIS) FOR THE YEAR ENDED JUNE 30, 2018
Original Revised Encum-
Budget Revisions Budget Expenditures brances REVENUES: Taxes: Sales tax $ 12,469,125 $ $ 12,469,125 $
Sales tax- UNP TIF 5,653,079 5,653,079 Property tax UNP TIF 835,000 835,000
Special assessment 100,000 100,000 Investment earnings 167,500 Miscellaneous 425,000 794,516
Total revenues 19,594,220 425,000 ~_1_0,0 19,220 EXPENDITURES AND ENCUMBRANCES:
Personnel costs 1,203,552 2,192 1,205,744 $ 1,158,383 $ Services and maintenance 144,355 176,916 321,271 213,402 77,226 Cost allocation charges 239,916 74,164 314,080 314,080 Capital equipment 20,000 20,000 19,611 Capital projects 14,129,717 37,306,375 51,436,092 11,393,023 5,794,983 Capital proJects -
UNP TIF 624,983 2,579,430 3,204,413 648,822 111,054 Debt service - UNP TIF I ,433,602 166,095 I ,599,697 I ,599,697 Debt service 665,762 665,762 665,657 -----
Total expenditures and encumbrances 17,776,125 40,990,934
Excess (deficiency) of revenues over (under) expenditures and encumbrances 1,818,095 ( 40,565,934) (38,747,839)
OTHER FINANCING SOURCES (USES): Transfers Out: General fund (3,656,41 0) (3,363,587) (7,019,997) Westwood fund (81 ,200) (81,200) Water fund (689,265) (689,265)
Transfers In: General fund 200,000 200,000 CDBG fund 6,953,449 6,953,449 Water fund Special grants fund Seizures fund 82,500 82,500 Debt service fund
Debt proceeds 6,105,000 6,105,000
Net other financing sources (uses) (3,655, II 0) 9,205,597 5,550,487
Excess (deficiency) of revenues over expenditures and encumbrances and other sources (uses) (1,837,015) (31 ,360,33 7) (33, 197 ,352)
Fund balance, July 1, 2017 (Non-GAAP budgetary basis) 53,587,045
Fund balance, June 30, 2018 (Non-GAAP budgetary basis)
94-
Variance-
Positive
Actual (Negative)
11,927,194 $ (541,931) 4,043,676 (1,609,403) 1,567,419 732,419
94,614 (5,386)
18,994,779
I, 158,383 47,361 290,628 30,643 314,080
19,611 389 17,188,006 34,248,086
759,876 2,444,537 1,599,697
665,657 105
36,771,121
(3,001,159) 35,746,680
(7,248,673) (228,676) (43,349) 37,851
(689,265)
200,000 6,923,065 (30,384)
338,122 338,122 100,000 100,000 82,500
6,105,000
5,767,400 216,913
2,766,241 35,963,593
53,587,045

THE CITY OF NORMAN, OKLAHOMA
NORMAN FORWARD FUND SCHEDULE OF REVENUES, EXPENDITURES, ENCUMBRANCES AND CHANGES IN FUND BALANCE -BUDGET AND ACTUAL (NON-GAAP BUDGETARY BASIS) FOR THE YEAR ENDED JUNE 2018
Original Revised Encum-
Budget Revisions Budget Expenditures brances
REVENUES: Taxes:
Sales tax $ 9,613,475 $ $ 9,613,475 $ Use tax 493,225 493,225
Investment earnings 15,000 15,000 Miscellaneous
Total revenues 10,121,700 10,121,700 EXPENDITURES AND
ENCUMBRANCES: Services and maintenance 4,000 I ,273,052 1,277,052 $ $
Capital projects 23,640,900 50,135,153 73,776,053 2,502,325 I ,815,393 Debt service ~3,263 ~~.§1,501
Total expenditures and encumbrances 29,638,163 51,408,205 81,046,368
Excess ( def1ciency) of revenues over (under) expenditures and encumbrances (19,516,463) (51 ,408,205) (70,924,668)
OTHER FINANCING SOURCES (USES):
Transfers Out: Capital fund
Transfers fn: Capital fund
Debt proceeds 25,840,000 25,840,000
Net other financing sources (uses) 25,840,000 25,840,000
Excess (deficiency) of revenues over expenditures and encumbrances and other sources (uses) 6,323,537 (51 ,408,205) ( 45,084,668)
Fund balance, July 1, 2017 (Non-GAAP budgetary basis) 32,862,557 32,862,557
Fund balance, June 30, 2018 (Non-GAAP budgetary basis)
- 95-
Variance-
Positive
Actual (Negative)
9,101,396 $ (512,079) 710,671 217,446
10,415,998 294,298
1,277,052 4,317,718 69,458,335 3,061,501
7,379,219 73,667,149
3,036,779 73,961,447
(25,840,000)
(25,840,000)
3,036,779 48,121,447
32,862,557

NOTES TO OTHER SUPPLEMENTARY INFORMATION ON BUDGETARY COMPARISON SCHEDULES- NONMAJOR SPECIAL REVENUE FUNDS, DEBT SERVICE FUND, CAPITAL PROJECTS FUND AND NORMAN FORWARD FUND
Budget Reconciliations- Items required to adjust actual revenues, expenditures, and fund balances reported on the budgetary basis to those reported within the fund financial statements as of and for the year ended June 30, 2018, are as follows:
Special Debt Capital Norman
Revenue Service Projects Forward
Funds Fund Fund Fund
Fund balances, June 30, 2018 (Non-GAAP budgetary basis) $ 3,785,043 $ 5,862,938 $ 56,353,286 $ 35,899,336
Current year encumbrances included in expenditures 2,652,857 5,983,262 1,815,393
Prior year encumbrances outstanding 2,677,482 1,441'] 78 16,344,723 Current year revenue accrual 1,219,944 (93,782) 2,684,576 1,576,650 Current year expenditure accrual (386,627) (206,791) (972,958)
GAAP basis fund balances, June 30,2018 144
Budgetary basis revenues $ 10,699,570 $ 10,537,403 $ 18,994,779 $ 10,415,998 Current year revenue accrual 1)19,944 (93,782) 2,684,576 1,576,650 Prior year revenue accrual (1,928,051) 32,130 (2, 736,828) (1,574,910)
GAAP basis revenues $ 9,991,463 $ 10,475,751 $ ] 8,942,527 $ 10,417,738
Budgetary basis expenditures $ 7,657,686 $ 12,692,990 $ 21,995,938 $ 7,379,219 Current year encumbrances
included in expenditures (2,652,857) (5,983,262) (1,815,393) Prior year encumbrances paid 4,277,245 4,101,561 19,605,619 Current year expenditure accrual 386,627 206,791 972,958 Prior year expenditure accrual 1 (256,828) (367,615)
GAAP basis expenditures $ 9,651,922
- 96-

THE CITY OF NORMAN, OKLAHOMA
COMBINING STATEMENT OF NET POSITION
ENTERPRISE FUND- NORMAN MUNICIPAL AUTHORITY JUNE 2018
Westwood Sanitation ASSETS Park Services Total Current assets:
Cash and cash equivalents $ 246,032 $ 1,919,187 $ 2,165,219 Restricted cash and cash equivalents 3,599 562,856 566,455 Investments 10,174,534 10,174,534 Receivables: Accounts, net of allowance for estimated uncollectible accounts 1,235,290 1,235,290 Interest 12 32,870 32,882
Due from other Federal Government 182,504
Total current assets
Noncurrent assets: Restricted cash and cash equivalents 223,415 318,846 542,261 Capital assets, net 10,396,592
Total noncurrent assets 7,376,944 10,715,438
Total assets 7,626,587 24,822,679 32,449,266
LIABILITIES Current liabilities:
Accounts payable and accrued liabilities 165,866 259,500 425,366 Payroll payable 56,414 96,647 153,061 Due to other funds Accrued interest payable 3,599 16,300 19,899 Guaranty deposits 398,319 398,319 Revenue bonds payable 160,000 160,000 Notes payable 420,000 420,000 Compensated absences 8,014 23,159 31,173
Total current liabilities
Noncurrent liabilities: Notes payable 1,580,000 1,580,000 Compensated absences 114,862 331,919 446,781 Revenue bonds payable, net
Total noncurrent liabilities 647,447 1,91 I ,919
Total liabilities 1,041,340 3,125,844
NET POSITION Net invested in capital assets 6,448,529 8,396,592 14,845,121 Restricted for debt service 223,415 467,082 690,497 Unrestricted 12,833,161 12,746,464
Total net position $ 28,282,082
- 97-

THE CITY OF NORMAN, OKLAHOMA
COMBINING STATEMENT OF REVENUES, EXPENSES AND CHANGES IN FUND NET POSITION ENTERPRISE FUND~ NORMAN MUNICIPAL AUTHORITY FOR THE YEAR ENDED JUNE 30, 2018
Westwood Sanitation Park Services Total
Operating revenues: Golf and pool fees $ 1,264,059 $ ~ $ 1,264,059 Sanitation services, net 14,348,188 14,348,188 Other
Total operating revenues 1,298,980
Operating expenses: Salaries and benefits 882,736 4,342,305 5,225,041 Supplies and materials 154,654 947,438 1,102,092 Services and maintenance 240,396 5,722,093 5,962,489 Depreciation and amortization 163,466 1,771,401 1,934,867
Total operating expenses 12,783,237 14,224,489
Operating income (loss)
Nonoperating revenues (expenses): Investment earnings 4,223 106,115 110,338 Interest and fiscal charges (55,958) (73,857) (129,815) Miscellaneous income (expense) 187,061
Net nonoperating revenues (expenses) (48,193) 21
Income (loss) before transfers (190,465)
Transfers in (out): Transfers in 246,968 246,968
Transfers out (46,000) (46,000)
Net transfers 200,968
Net income 56,503 1,897,902 1,954,405
Net position~ beginning 6,528,744 19,798,933 26,327,677
Net position~ ending $ 21,696,835 $ 28,282,082
~ 98-

THE CITY OF NORMAN, OKLAHOMA COMBINING STATEMENT OF CASH FLOWS
ENTERPRISE FUND- NORMAN MUNICIPAL AUTHORITY FOR THE YEAR ENDED JUNE 30, 2018
Westwood Sanitation Park Services Total
Cash flows from operating activities: Cash received from customers $ 1,298,980 $ $
Cash paid to employees for services (845,353) Cash paid to suppliers (294,485) Other payments
Net cash provided by operating activities
Cash flows from noncapital financing activities: Transfers in 246,968 246,968 Transfers out
Net cash provided by (used for) noncapital financing activities 200,968
Cash flows from capital and related financing activities: Proceeds from disposal of capital assets 22,950 123,737 146,687 Payments for the acquisition of capital assets (85,072) (I ,317,506) (I ,402,578) Principal payments on revenue bonds payable (150,000) (150,000) Principal payments on notes payable (575,000) (575,000) Interest and fiscal charges paid
Net cash used for capital and related financing activities (265, 741) (1 ,845,684) (2, 111 ,425)
Cash flows from investing activities: Proceeds from maturity of investments 3,706,243 3,706,243 Payments for purchases of investments (2,857,439) (2,857,439) Investment earnings received 171,529 175,828
Net cash provided by (used for) investing activities
Net change in cash and cash equivalents 144,668 1,930,176 2,074,844
Cash and cash equivalents - beginning 328,378 870,713 1,199,091
Cash and cash equivalents - ending $ 473,046 $ 2,800,889 $ 3,273,935
Reconciliation of operating income (loss) to net cash provided by activities: Operating income (loss) $ (142,272) $ 1,728,125 $ I ,585,853 Adjustments to reconcile operating income (loss)
to net cash provided by operating activities: Miscellaneous revenue 3,542 183,519 187,061 Bad debt expense 96,274 96,274 Depreciation 163,466 1,771,401 1,934,867 Gain on disposal of property, plant and equipment (3,542) (21,792) (25,334) Increase in accounts receivable, net (308,905) (308,905) Decrease in due from Federal Government 225,630 225,630 Increase in due from other funds (926,207) (926,207) Increase in accounts payable and accrued liabilities 100,565 46,893 147,458 Increase (decrease) in payroll payable 37,558 (1 '747) 35,811 Increase in guaranty deposits 9,430 9,430 Decrease in compensated absences (1 ,094) (1,269)
Net cash provided by (used for) operating activities $ 2,960,669
NONCASH ACTIVITIES: Change in unrealized loss on investments
- 99-

THE CITY OF NORMAN, OKLAHOMA
COMBINING STATEMENT OF NET POSITION
ENTERPRISE FUND R NORMAN UTILITIES AUTHORITY JUNE 30, 2018
ASSETS Water Wastewater Total
Current assets: Cash and cash equivalents $ 4,258,614 $ 6,470,648 $ 10,729,262 Restricted cash and cash equivalents 1,357,279 526,329 1,883,608 Investments 22,088,326 6,308,171 28,396,497 Receivables:
Accounts, net of allowance for estimated uncollectible accounts 2,661,579 1,105,578 3,767,157 Interest 70,679 45,090 115,769 Due from other funds 422,689 1,031,062
Total current assets 30,859,166 15,064,189 45,923,355
Noncurrent assets: Restricted investments 7,847,587 7,847,587 Capital assets, net 111,745,482 150,153,503 261,898,985
Total noncurrent assets 111 158,001,090
Total assets 173,065,279 315,669,927
DEFERRED OUTFLOW OF RESOURCES
Deferred charge on refunding
Total deferred outflows of resources 60,410 813,689
LIABILITIES
Current liabilities: Accounts payable and accrued liabilities 3,638,728 390,827 4,029,555 Payroll payable 92,589 75,422 168,011 Accrued interest payable 151,010 246,200 397,210 Retainage payable 657,700 383,415 1,041' 115 Guaranty deposits 852,994 391,679 1,244,673 Notes payable 1,825,000 3,809,829 5,634,829 Compensated absences 24,499
Total current liabilities
Non current liabilities: Notes payable, net 24,826,370 32,660,554 Compensated absences 351,114
Total noncurrent liabilities 25,260,335 33,011,668
Total liabilities
NET POSITION Net invested in capital assets 84,425,813 113,294,260 197,720,073 Restricted for debt service 353,277 353,277 Restricted for capital projects Unrestricted
Total net position $ 11 0,849,29Y
- 100-

THE CITY OF NORMAN, OKLAHOMA
COMBINING STATEMENT OF REVENUES, EXPENSES AND CHANGES IN NET POSITION
ENTERPRISE FUND- NORMAN UTILITIES AUTHORITY FOR THE YEAR ENDED JUNE 2018
Water Wastewater
Operating revenues: Water service, net $ 23,042,347 $ Wastewater service, net 15,781,490 Other
Total operating revenues
Operating expenses: Salaries and benefits 3,996,636 3,218,051 Supplies and materials 2,080,870 462,896 Services and maintenance 6,354,986 5,311,345 Depreciation and ammiization
Total operating expenses 17,234,140 14,492,005
Operating income
Nonoperating revenues (expenses): Tax revenue 1,319,885 Investment earnings 224,105 137,582 Interest and fiscal charges (613,257) (834,829) Miscellaneous income (expense) 128,458
Net nonoperating revenues (expenses) (260,694)
Income before capital contributions and operating transfers
Capital contributions- donated water and sewer distribution systems 2,506,439 2,756,986 Transfers in 689,265 Transfers out ( 1 ,434,085)
Net capital contributions and transfers 1,761,619
Net income 7,687,693 3,423,876
Net position beginning
Net position -ending
- 10 l -
Total
$ 23,042,347 15,781,490
7,214,687 2,543,766
11,666,331
31,726,145
1,319,885 361,687
(1,448,086)
7,206,641
5,263,425 689,265
11,111,569

THE CITY OF NORMAN, OKLAHOMA
COMBINING STATEMENT OF CASH FLOWS
ENTERPRISE FUND· NORMAN UTILITIES AUTHORITY FOR THE YEAR ENDED JUNE 2018
Cash flows from operating activities: Cash received from customers $ 23,415,588 $ 15,724,512 $ 39,140,100 Cash paid to employees for services (3,988,870) (3,204, 185) (7, 193,055) Cash paid to suppliers (5,596,490) (6, 730, 770) (12,327,260) Other payments
Net cash provided by operating activities 12,381,039 4,584,546 Cash flows from noncapital financing activities:
Transfers in 689,265 0 689,265 Transfers out
Net cash used for noncapital financing activities (744,820) (613,677) Cash flows from capital and related financing activities:
Proceeds from disposal of capital assets 10,543 12,718 23,261 Payments for the acquisition of capital assets (13,817,059) (2,537,032) (16,354,091) Proceeds from taxes 1,319,885 1,319,885 Proceeds from notes payable 6,891,968 8,651,446 15,543,414 Principal payments on notes payable (1,785,000) (3, 722, 726) (5,507, 726) Interest and fiscal charges paid (491,814) (770,081) (1,261,895)
Net cash provided by (used for) capital and related financing activities (9, 191,362) 2,954,210 (6,237,152) Cash flows from investing activities:
Proceeds from maturity of investments 7,662,270 3,302,668 10,964,938 Payments for purchases of investments ( 6,203,3 3 6) (3,975,536) ( 10, 178,872) Investment earnings received
Net cash provided by (used for) investing activities 1,385,684
Net change in cash and cash equivalents 4,271,032 6,484,588 10,755,620
Cash and cash equivalents - beginning
Cash and cash equivalents - ending
Reconciliation of operating income to net cash provided by operating activities: Operating income $ 6,186,768 $ 1,289,485 $ 7,476,253 Adjustments to reconcile operating income
to net cash provided by operating activities: Miscellaneous income (expense) 128,458 (631,556) (503,098) Bad debt expense 179,608 95,611 Depreciation 4,801,648 5,499,713 10,301,361 Gain (Loss) on disposal of property, plant and equipment (171 ,301) 710,313 539,012 Increase in accounts receivable, net (192,504) (170, 165) (362,669) Decrease due from Federal Government 100,623 0 100,623 Increase due from other funds (1,506,969) (1,283,768) (2, 790,73 7) Increase (decrease) in accounts payable and accrued liabilities 2,329,779 (115,956) 2,213,823 Increase in payroll payable 2,895 414 3,309 Increase (decrease) in retainage payable 509,587 (840,573) (330,986) Increase in guaranty deposits 7,576 17,576 25,152 Increase in compensated absences
Net cash provided by operating activities
NONCASH ACTIVITIES: Donated water and sewer distribution systems Change in unrealized (gain) loss on investments $ 154,188 $ 105,755 $ 259,943
- 102-

THE CITY OF NORMAN, OKLAHOMA
COMBINING STATEMENT OF FIDUCIARY NET POSITION JUNE 2018
ASSETS
Investments - mutual funds
Loans to 401 (a) Plan participants
Total assets
LIABILITIES AND NET POSITION
Net position: Restricted for pension benefits
Restricted for retirement benefits
Total liabilities and net position
- 103
Annuity Pool Fund
401(a) Plan Fund Total
$247,932 $90,626,260 $90,874,192
$ 247,932 $ - $ 247,932
94,479,589 94,479,589
$ 247,932 $ 94,479,589

THE CITY OF NORMAN, OKLAHOMA
COMBINING STATEMENT OF CHANGES IN FIDUCIARY NET POSITION FOR THE YEAR ENDED JUNE 2018
ADDITIONS:
Contributions: Employer Employee
Total contributions
Investment income (loss)
Total additions
DEDUCTIONS:
Pension benefits paid Administration costs
Total deductions
NET (DECREASE) INCREASE
Net position restricted for pension and retirement benefits, Beginning of year
End ofyear
$
Annuity Pool Fund
58,782 1,277
60,059
(39,191)
123
- 104-
401 (a) Fund
$ 2,520,077 1
4,476,332
7,070,884 (122,400)
6,948,484
7,335,705
87,143,884
Total
$ 2,520,077
4,476,332
7,129,666 (121 ,123)
7,008,543
7,296,514
87,431,007

THE CITY OF NORMAN, OKLAHOMA
STATEMENT OF CHANGES IN ASSETS AND LIABILITIES~
AGENCY FUNDS
FOR THE YEAR ENDED JUNE 30,2018
Balance Balance
July 1, 2017 Additions Deletions June 30, 2018
CENTENNIAL AGENCY FUND:
ASSETS
Cash $ $ 1,623 $ $ 1,623
Investments 9,120 (1,562) 7,558
Interest receivable 23 24
Total assets
LIABILITIES
Funds held for others
- 105 -

This page left intentionally blank.


STATISTICAL SECTION
This part of the City's comprehensive annual financial report presents detailed information as a context for understanding what the information in the financial statements, note disclosures, and required supplementary information says about the City's overall financial health.
Contents
Financial Trends
These schedules contain trend information to help the reader understand how the City's financial performance and well-being have changed over time.
Revenue Capacity
These schedules contain information to help the reader assess the City's most significant local revenue source, the sales tax.
Debt Capacity
These schedules present information to help the reader assess the affordability of the City's current levels of outstanding debt and the City's ability to issue additional debt in the future.
Demographic and Economic Information
These schedules offer demographic and economic indicators to help the reader understand the environment within which the City's financial activities take place.
Operating Information
These schedules contain service and infrastructure data to help the reader understand how the information in the City's financial report relates to the services the City provides and the activities it performs.
- 106-
Page
107-112
113-115
116-120
121-122
123-125

THE CITY OF NORMAN, OKLAHOMA
NET POSITION BY COMPONENT
LAST TEN FISCAL YEARS
(accrual basis of accounting)
Fiscal Year
2018 2017 2016 2015 2014 2013 2012 2011 2010 2009
Governmental activities
Net investment in captial assets $ 313,981,902 $ 256,880,446 $ 283,831 ,364 $ 282,047,232 $ 244,461,034 $ 230,316,125 $ 226,301,248 $ 206,982,527 $ 175,482,607 $ 168,461,960
Restricted 90,270,821 128,695,200 86,079,582 62,156,755 59,573,841 59,450,003 46,103,535 42,431,883 33,165,081 26,111,498
Unrestricted (38,717,191) ( 44,522,535) ( 43,098, 736) (48, 153,075} (6,068,605) (6,704,318) (2,190,465) ( 1 ,500,859) {259,210) 8,974,819
Total governmental activities net position $ 365,535,532 $ 341,053, Ill $ 326,812,210 $ 296,050,912 $ 297,966,270 $ 283,061,810 $ 270,214,318 $ 247,913,551 $ 208,388,478 $ 203,548,277
Business-type activities
Net investment in captial assets $ 212,565,194 $ 211,414,863 $ 198,638,260 $ 183,385,272 $ 159,760,362 $ 153,645,303 $ 149,661,248 $ 149,829,383 $ 146,472,150 $ 135,025,019
Restricted 16,958,115 6,629,187 1,067,921 10,023,153 23,214,855 23,764,771 23,888,626 22,568,084 23,202,532 22,411,356
Unrestricted 44,400,215 42,813,500 48,149,794 34,949,967 30,864,543 31,874,629 29,032,825 22,177,807 17,147,722 17,475,856
Total business-type activities net position $ 273,923,524 $ 260,857,550 $ 247,855,975 $ 228,358,392 $ 213,839,760 $ 209,284,703 $ 202,582,699 $ 194,575,274 $ 186,822,404 $ !74,912,231
Primary government
Net investment in captial assets $ 526,547,096 $ 468,295,309 $ 482,469,624 $ 465,432,504 $ 404,221,396 $ 383,961,428 $ 375,962,496 $ 356,811,910 $ 321,954,757 $ 303,486,979
Restricted 107,228,936 135,324,387 87,147,503 72,179,908 82,788,696 83,214,774 69,992,161 64,999,967 56,367,613 48,522,854
Unrestricted 5,683,024 (1,709,035) 5,051,058 (13,203, l 08) 24,795,938 25,170,311 26,842,360 20,676,948 16,888,512 26,450,675
Total primary government net position $ 639,459,056 $ 601,910,661 $ 574,668,185 $ 524,409,304 $ 511 ,806,030 $ 492,346,513 $ 472,797,017 $ 442,488,825 $ 395,210,882 $ 378,460,508
- 107-

THE CITY OF NORMAN, OKLAHOMA
CHANGES IN NET POSITION
LAST TEN FISCAL YEARS
(accrual basis of accounting)
Fiscal Year
2018 2017 2016 2015 2014 2013 2012 2011 2010 2009
EXPENSES
Governmental activities:
General government $ 12,859,373 $ 10,763,028 $ 7,999,471 $ 8,500,923 $ 11,353,764 $ 10,067,554 $ 10,443,931 $ 6,904,076 $ 5,830,137 $ 3,751,170
Planning 3,477,364 3,315,422 3,320,979 3,297,788 3,208,350 3,334,674 3,063,260 2,944,363 3,345,225 3,139,732
City controller 2,449,352 1,231,508 893,000 706,793 3,337,932 3,256,464 2,404,401 2,299,619 3,487,837 3,317,241
Parks and recreation 6,502,407 7,087,981 5,936,777 5,194,010 5,555,796 5,251,598 5,076,388 4,951,495 5,909,298 5,441,885
Public works 26,682,973 30,953,789 25,389,053 22,130,634 21,530,165 21,126,808 19,810,834 17,384,501 17,665,244 18,412,370
Public service 2,627,283 3,892,316 2,976,064 2,875,451 2,841,186 2,242,861 2,368,850 2,777,749 2,964,057 3,871,811
Public safety 55,817,838 53,613,442 50,921,384 47,480,003 47,819,597 46,133,723 44,528,493 41,050,651 41,750,244 38,223,543
Interest on long-term debt 4,937,107 4,734,646 5,277,210 2,325,103 1,901,483 1,812,032 1,715,040 1,306,589 1,175,941 1,022,021
Total governmental
activities expenses 115,353,697 115,592,132 102,713,938 92,510,705 97,548,273 93,225,714 89,40,197 79,619,043 82,127,983 77,179,773
Business-type activities:
Westwood Park 1,500,752 1,256,295 1,340,514 1,352,050 1,456,266 1,451,959 1,477,312 1,475,445 1,458,522 1,498,891
Water 16,321,995 14,535,092 14,843,372 13,258,111 13,261,728 13,776,395 13,630,489 10,479,592 10,307,362 10,650,815
Wastewater 14,627,959 15,448,412 17,222,233 15,477,741 15,658,935 12,229,767 11,846,247 12,736,928 10,794,791 11,534,123
Sanitation 12,878,886 12,005,272 12,135,886 12,298,641 13,580,465 12,325,246 11,679,875 11,055,474 10,802,282 10,395,098
Total business-type
activities expenses 45,329,592 43,245,071 45,542,005 42,386,543 43,957,394 39,783,367 38,633,923 35,747,439 33,362,957 34,078,927
Total primary government
expenses $ 160,683,289 $ 158,837,203 $ 148,255,943 $ 134,897,248 $ 141,505,667 $ 133,009,081 $ 128,045,120 $ 115,366,482 $ 115,490,940 $ 111,258,700
- 108-

THE CITY OF NORMAN, OKLAHOMA
CHANGES IN NET POSITION
LAST TEN FISCAL YEARS
(accrual basis of accounting)
Fiscal Year
2018 2017 2016 2015 2014 2013 2012 2011 2010 2009
PROGRAM REVENUES
Governmental activities:
Charges for services:
General government $ 2,767,032 $ 2,730,336 $ 2,612,495 $ 2,644,776 $ 2,554,566 $ 2,431,538 $ 2,297,341 $ 186,094 $ 244,495 $ 253,409
Planning 992,383 1,061,776 1,353,411 1,369,582 1,376,330 1,213,106 1,123,524 1,009,561 1,080,835 893,633
City controller 683,215 661,162 642,726 624,135 214,838 165,969 155,226 66,093
Parks and receation 497,538 530,140 653,613 609,175 587,433 506,358 568,817 592,238 586,611 426,476
Public safety, 3,256,469 2,912,640 3,097,858 3,296,808 3,125,456 3,040,640 3,208,642 3,066,665 2,815,951 2,877,921
Operating grants and contributions 14,570,508 12,379,368 10,375,508 7,758,836 7,533,947 6,893,726 8,241,861 6,771,145 8,143,742 6,427,085
Capital grants and contributions 9,476,361 3,813,991 15,614,024 29,958,311 5,501,318 5,754,538 13,944,754 30,934,491 2,513,839 8,102,826
Total governmental activities
program revenues 32,243,506 24,089,413 34,349,635 46,261,623 20,893,888 20,005,875 29,540,165 42,626,287 15,385,473 18,981,350
Business-type activities:
Charges for services
Westwood Park 1,264,059 933,853 1,098,470 1,065,318 1,102,085 1,141,661 1,167,227 1,143,973 1,067,800 1,089,329
Water 21,843,184 21,735,237 21,496,086 16,050,007 14,053,978 14,817,012 15,460,504 14,185,492 13,267,513 12,881,381
Wastewater 15,781,490 15,767,530 15,923,396 15,715,128 13,906,530 11,383,549 11,451,634 11,075,566 11,012,593 11,000,250
Sanitation 14,549,273 14,584,853 14,338,856 13,991,281 14,006,612 13,546,341 13,501,474 11,820,912 11,028,021 11,035,050
Capital grants and contributions 5,263,425 2,324,230 10,525,831 7,703,017 3,721,838 5,006,692 4,291,238 4,474,408 7,215,720 2,055,411
Total business-type activities
program revenues 58,701,431 55,345,703 63,382,639 54,524,751 46,791,043 45,895,255 45,872,077 42,700,351 43,591,647 38,061,421
Total primary government revenues $ 90,944,937 $ 79,435,116 $ 97,732,274 $ 100,786,374 $ 67,684,931 $ 65,901,130 $ 75,412,242 $ 85,326,638 $ 58,977,120 $ 57,042,771
NET (EXPENSE)/REVENUE
Governmental activities $ (83,110,191) $ (91,502,719) $ (68,364,303) $ (46,249,082) $ (76,654,385) $ (73,219,839) $ (59,871,032) $ (36,992,756) $ (66,742,510) $ (58,198,423)
Business-type activities 13,371,839 12,100,632 17,840,634 12,138,208 2,833,649 6,111,888 7,238,154 6,952,912 10,201,690 3,982,494
Total primary government net expense $ (69,738,352) $ (79,402,087) $ (50,523,669) $ (34,1JQ,874) $ (73,820,736) $ (67>-1QL251) $ (52,632,878) $ (30,039,844) $ (56,540,820) $ (54,215,929)
- 109-

THE CITY OF NORMAN, OKLAHOMA
CHANGES IN NET POSITION
LAST TEN FISCAL YEARS
(accrual basis of accounting)
Fiscal Year
2018 2017 2016 2015 2014 2013 2012 2011 2010 2009 GENERAL REVENUE AND
OTHER CHANGES IN NET ASSETS Governmental activities:
Sales taxes $ 73,967,709 $ 73,345,458 $ 70,981,084 $ 65,778,553 $ 63,580,323 $ 60,558,342 $ 58,777,068 $ 56,146,152 $ 53,601,698 $ 52,261,757 Franchise taxes 7,094,490 6,807,860 6,743,712 7,155,689 6,782,746 6,572,686 6,584,853 6,228,264 6,262,225 6,215,692 Property taxes 11,971,525 14,739,604 9,794,490 11,620,098 12,481,940 11,532,189 7,931,992 7,684,537 6,111,415 3,373,306 Use taxes 5,148,317 3,797,125 3,467,863 2,864,048 2,504,136 2,428,484 2,393,708 2,187,289 2,179,503 2,401,933 Hotel/Motel taxes 1,879,453 1,759,851 1,825,087 1,785,788 1,648,452 1,352,311 1,130,488 1,068,000 1,033,060 991,435 Alcoholic beverage taxes 324,252 316,013 306,225 301,618 272,697 285,339 271,359 247,014 232,016 231,077
taxes 834,649 894,092 839,492 771,946 746,900 764,653 845,149 816,503 744,416 705,377 Investment earnings 1,586,732 513,238 1,965,790 323,863 379,805 208,763 701,524 396,095 490,604 1,074,489 Miscellaneous 3,627,956 2,275,838 1,943,106 2,196,990 2,458,091 2,319,411 2,761,766 962,203 838,558 1,003,269 Transfers 1,157,529 1,294,541 1,258,752 1,085,283 703,755 734,795 773,892 781,772 89,216 690,763
Total governmental activities 107,592,612 105,7 43,620 99,125,601 93,883,876 91,558,845 86,756,973 82,171,799 76,517,829 71,582,711 68,949,098
Business-type activities: Sales taxes Excise taxes 1,319,885 1,530,490 1,709,914 2,149,079 1, 769,195 1,432,321 1,597,960 1,038,715 1,562,722 1,251,242 State use taxes Investment earnings 472,025 163,961 515,716 250,382 342,984 187,837 278,75 I 355,657 440,118 1,109,011 Miscellaneous (940,246) 501,033 690,071 1,066,246 312,984 241,978 (333,548) 187,358 (205,141) 53,097 Transfers (1,157,529) (1,294,541) (1,258,752) (1 ,085,283) (703,755) (734,795) (773,892) (781,772) (89,216) (690,763)
Total business-tvne activities (305,865) 900,943 1,656,949 2,380,424 1,721,408 1,127,341 769,271 799,958 1,708,483 1,722,587
Total nrimarv government $107,286,747 $106,644,563 $100,782,550 $ 96,264,300 $ 93,280,253 $ 87,884,314 $ 82,941,070 $ 77,317,787 $ 73,291,194 $ 70,671,685
CHANGE IN NET POSITION Governmental activities $ 23,282,421 $ 14,240,901 $ 30,761,298 $ 47,634,794 $ 14,904,460 $ 13,537,134 $ 22,300,767 $ 39,525,073 $ 4,840,201 $ 10,750,675 Business-type activities 13,065,974 13,001,575 19,497,583 14,518,632 4,555,057 7,239,229 8,007,425 7,752,870 11,910,173 5,705,081 Total primary government $ 36,348,395 $ 27,242,476 $ 50,258,881 $ 62,153,426 $ 19,459,517 $ 20,776,363 $ 30,308,192 $ 47,277,943 $ 16,750,374 $ 16,455,756
- 110-

THE CITY OF NORMAN, OKLAHOMA
FUND BALANCES OF GOVERNMENTAL FUNDS
LAST TEN FISCAL YEARS
(modified accrual basis of accounting}
2018
General fund
Reserved $ - $ Unreserved -
24,898
Restricted -
Committed 3,331,295
2,503,122
13,046,521
2017
--
29,473
-3,302,656
2,298,057
7,166,425
Total general fund $ 18,905,836 $ 12,796,611
All other governmental funds Reserved
Encumbrances $ - $ -Debt service - -
Unreserved, reported in:
Public safety sales tax fund
projects fund - -Special revenue funds - -
Restricted 155,984,942 180,115,682
4,540,592 3,712,781
Total all other 2:ovemmental funds $160,525,534 $183,828,463
Fiscal Year
2016 2015 2014 2013
$ - $ - $ - $ -
- - - -
20,896 26,642 47,131 337,642
- - - -3,226,149 3,191,393 2,554,596 1,510,323
2,281,428 2,890,768 2,152,746 2,169,071
8,861,932 8,290,555 8,384,756 8,405,617
$ 14,390,405 $ 14,399,358 $ 13,139,229 $ 12,422,653
$ - $ - $ - $ -- - - -
- - -
- - - -
162,761,288 123,475,384 86,328,836 95,384,952
3,436,379 2,148,078 1,834,631 1,350,473
$166,197,667 $125,623,462 $ 88,163,467 $ 96,735,425
Note: Prior year amounts have not been restated for the implementation of Statement 54.
- 111 -
2012 2011 2010 2009
$ - $ - $ 1,826,810 $ 1,819,264
- 19,530,033 17,472,575
320,512 334,339
- 14,307
1,503,429
1,467,574 1,037,294
10,184,006 12,283,864
$ 13,475,521 $ 13,669,804 $ 21,356,843 $ 19,291,839
$ - $ - $ 7,865,963 $ 5,682,896
- - 2,512,584 1,590,705
- - 21,127,319 30,098,079
- 2,647,787 2,800,254
68,041,077 48,791,046
1,059,369 587,163
$ 69,100,446 $ 49,378,209 $ 34,153,653 $ 40,171,934

THE CITY OF NORMAN, OKLAHOMA
CHANGES IN FUND BALANCES OF GOVERNMENTAL FUNDS
LAST TEN FISCAL YEARS
(modified accrual basis of accounting)
(Dollars in Thousands) 2018 2017 2016 2015 2014 2013 2012 2011 2010 2009
REVENUES Taxes $ 100,061 $ 100,450 $ 92,812 $ 89,204 $ 86,998 $ 82,444 $ 76,818 $ 73,314 $ 69,188 $ 65,244
1,104 1,162 1,399 1,393 1,426 1,212 1,190 1,086 1,156 968 revenues 10,501 8,358 6,396 4,553 8,773 8,637 9,370 9,608 8,354 7,456
for services 11,657 10,427 10,966 11,484 10,918 10,684 10,268 11,775 11,836 10,874 Fines and forfeitures 2,366 2,300 2,425 2,644 2,461 2,352 2,554 2,490 2,176 2,204 Investment earnings 1,330 278 334 278 365 194 517 389 491 1,075
assessment revenue - - - - - - 26 38 50 57 Other 3,466 2,652 1,762 2,403 2,424 1,424 2,381 1,006 969 1,196 Total revenues 130,4!55 125,627 116,094 _____!___!__1959 113,365 106,947 103,124 99,706 94,220 89,074
EXPENDITURES General government 10,681 10,022 9,742 9,431 10,218 7,963 8,571 8,036 8,960 6,399
3,637 3,429 3,454 3,416 3,379 3,387 3,261 3,112 3,394 3,237 3,503 3,353 3,141 2,940 4,492 4,957 4,405 6,009 5,645 5,360
Parks & recreation 5,249 5,999 5,167 4,665 4,930 4,520 4,598 4,760 5,372 5,034 Public works 18,907 22,634 18,572 18,137 18,054 17,481 17,240 15,863 16,151 16,519 Public service 2,662 3,892 2,963 2,920 2,803 2,239 2,401 2,772 2,961 3,749 Public safety 45,765 43,913 46,079 43,780 45,846 42,780 40,310 37,997 37,312 34,643
Outlay 43,097 31,375 32,910 22,358 20,897 18,152 16,449 16,150 15,654 18,043 Debt Service:
16,245 11,671 9,668 9,542 22,949 5,655 4,319 3,750 2,647 2,510 lnterest and tiscal charges 4,545 4,839 3,905 2,180 2,400 1,578 1,315 1,223 1,004 1,022
Total expenditures 154,291 141,127 135,601 119,369 135,968 108,712 102,869 99,672 99,100 96,516 Excess of revenues over
expenditures (23,806) (15,500) (I 9,507) (7,410) (22,603) (1,765) 255 34 (4,8!50) (7,442)
OTHER FINANCING SOURCES (USES) Bonds issued 6,105 30,950 65,935 45,909 14,971 28,175 19,861 7,559 15,166 Premium on issuance of debt - - 1,426 - - 179 19,861 7,559 - 15,166 Payment to refunded bond escrow agent Transfers in 16,729 10,533 35,034 7,456 5,486 8,863 7,404 9,564 6,900 8,867 Transfers out (16,222) (9,946) (34,616) (7,235) (5,710) (8,870) (7,992) (!5,782) (6,!511) (8,177) Total other tinancing sources (uses) 6,612 31,537 60,072 46,130 14,747 28,347 39,134 15,900 89 31,022
Net change in fund balances $ (17,194) $ 16,037 $ 40,565 $ 38,720 $ (7,856) $ 26,582 $ 39,389 $ 15,934 $ (4,791) $ 23,580
Debt service as a percentage of expenditures 23.00% 17.71% 15.23% 13.74% 28.25% 8.68% 6.97% 6.33% 4.58% 4.71%
- 112 -

THE CITY OF NORMAN, OKLAHOMA
TAXABLE SALES BY CATEGORY
LAST TEN FISCAL YEARS
(Dollars in Thousands)
2018 2017 2016 2015 2014 2013 2012 2011 2010 2009
General merchandise $ 17,324 $ 16,869 $ 15,678 $ 15,047 $ 14,991 $ 10,174 $ 14,697 $ 14,515 $ 14,138 $ 13,656 Eating and drinking establishments 12,558 12,011 11,366 10,708 10,096 10,372 9,350 8,973 8,498 8,015 Miscellaneous retail 9,253 9,063 9,060 8,518 7,899 17,001 6,177 5,696 5,017 4,444
materials and farm tools 5,133 5,241 5,948 4,487 4,742 2,708 3,985 3,421 3,535 3,630 Electric, gas & sanitary services 4,242 3,864 3,460 3,586 3,512 3,393 3,538 3,304 3,377 3,170 Home furnishings and appliances 3,704 3,785 3,480 3,507 3,166 1,963 3,156 3,246 3,045 3,306
Food stores 4,019 4,158 4,062 3,849 4,058 2,430 3,470 3,136 2,933 2,756 and accessory stores 3,527 3,547 3,642 3,549 3,531 2,423 3,050 2,983 2,765 2,613
Communications 2,503 2,585 2,429 2,349 2,322 1,494 2,480 2,463 2,576 2,398 Wholesale trade-durable goods 4,571 4,657 4,392 4,042 3,341 2,487 2,018 1,687 1,561 1,623 All other outlets 7,204 8,097 7,377 6,327 6,484 5,477 7,267 7,043 6,366 6,498
Total $ 74,038 $ 73,877 $ 70,894 $ 65,969 $ 64,142 $ 59,922 $ 59,188 $ 56,467 $ 53,811 $ 52,109
City direct sales tax rate 4.00% 4.00% 4.00% 3.50% 3.50% 3.50% 3.50% 3.50% 3.50% 3.50%
Sources: Oklahoma Tax Commission
Note: Beginning January 1, 2016 sales tax increased by 0.5% for Norman Forward projects.
- 113 -
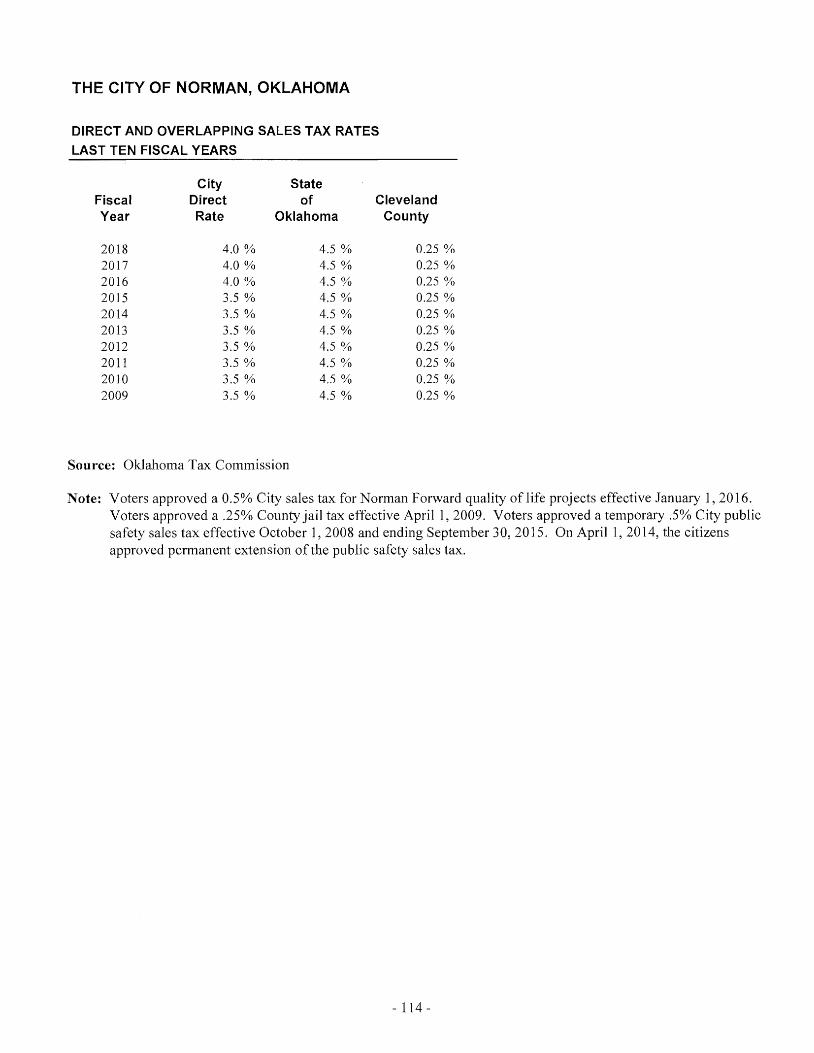
THE CITY OF NORMAN, OKLAHOMA
DIRECT AND OVERLAPPING SALES TAX RATES
LAST TEN FISCAL YEARS
City State Fiscal Direct of Cleveland Year Rate Oklahoma County
2018 4.0% 4.5% 0.25% 2017 4.0% 4.5% 0.25% 2016 4.0% 4.5% 0.25% 2015 3.5 % 4.5% 0.25% 2014 3.5% 4.5% 0.25% 2013 3.5% 4.5% 0.25% 2012 3.5% 4.5% 0.25% 2011 3.5% 4.5% 0.25% 2010 3.5% 4.5% 0.25% 2009 3.5% 4.5% 0.25%
Source: Oklahoma Tax Commission
Note: Voters approved a 0.5% City sales tax for Norman Forward quality of life projects effective January 1, 2016. Voters approved a .25% County jail tax effective April 1, 2009. Voters approved a temporary .5% City public safety sales tax effective October 1, 2008 and ending September 30, 2015. On April 1, 2014, the citizens approved permanent extension of the public safety sales tax.
- 114 -

THE CITY OF NORMAN, OKLAHOMA
SALES TAX REVENUE PAYERS BY INDUSTRY
FISCAL YEARS 2018 AND 2017
(Dollars in Thousands)
Fiscal Year 2018 Fiscal Year 2017
Number Percentage Tax Percentage Number Percentage Tax Percentage
of Filers of Total Liability of Total of Filers of Total Liability of Total
Retail trade 1)06 37.4% $ 42,960 58.0% 1,182 39.9% $ 42,663 57.6% Accommodation and food service 284 9.6% 14,513 19.6% 303 10.2% 13,789 18.6% Real estate and rental and leasing 188 6.4% 1,081 1.5% 198 6.7% 1,107 1.5% Wholesale trade 520 17.6% 4,571 6.2% 542 18.3% 4,657 6.3% Manufacturing 225 7.6% 1,619 2.2% 219 7.4% 1,757 2.4% Information 151 5.1% 2,503 3.4% 151 5.1% 2,585 3.5% Other services (except public administration) 118 4.0% 653 0.9% 115 3.9% 623 0.8% Professional, scientific, and technical services 72 2.4% 269 0.4% 72 2.4% 206 0.3% Arts, entertainment, and recreation 36 1.2% 448 0.6% 32 1.1% 478 0.6% Admin, support, waste mgmt and remediation services 46 1.6% 86 0.1% 44 1.5% 79 OJ% Construction 37 1.3% 68 0.1% 28 0.9% 66 0.1% Transportation and warehousing 33 l.l% 140 0.2% 22 0.7% 126 0.2% Finance and insurance 19 0.6% 75 0.1% 17 0.6% 68 0.1% Utilities 9 0.3% 4,242 5.7% 7 0.2% 3,864 5.2% Agricultural, forestry, fishing and hunting 3 0.1% 8 0.0% 5 0.2% 10 0.0% Educational services 20 0.7% 534 0.7% 21 0.7% 1,014 1.4% Health care and social assistance 9 0.3% 22 0.0% 9 0.3% 15 0.0% Mining, quarring, and oil and gas extraction 4 0.1% 22 0.0% 6 0.2% 86 0.1% Public administration I 0.0% - 0.0% I 0.0% 0.0% Nonclassifiable 79 2.7 ~ 224 0.3 ~ 83 2.8 ~ 684 0.9~
Total 2,960 100.0% $ 74,038 100.0% 3,057 103.3 % $ 73,877 99.8%
Sources: Oklahoma Tax Commission
Notes: Due to confidentiality issues, the names of the ten largest revenue payers are not available. The categories presented are intended to provide alternative information regarding the sources of the City's revenue.
- 115 -

THE CITY OF NORMAN, OKLAHOMA
RATIOS OF OUTSTANDING DEBT BY TYPE
LAST TEN FISCAL YEARS
(dollars in thousands, except per capita)
Governmental Activities
General Special
Fiscal Obligation Revenue Assessment Capital
Year Bonds Bonds Debt Leases
2009 $ 28,370 - $ 399 $ -
2010 25,915 - 319 -
2011 28,495 - 239 -
2012 43,140 - - -2013 58,790 - - -2014 49,657 - - 491 2015 64,196 - - 226 2016 71,419 - - -
2017 63,101 - - 819 2018 51,788 - - 414
Business-Type Activities
Term Revenue Term Capital
Loans Bonds Loans Leases
$ 4,481 $ 30,135 $ 5,162 -4,481 28,335 10,816 -
5,789 26,480 20,088 -6,925 24,570 22,025 -
13,965 22,632 22,868 -14,356 20,593 21,243 -36,411 18,597 41,009 -78,650 981 54,470 -
106,440 839 55,677 -107,790 693 65,138 -
Note: Details regarding the City's outstanding debt can be found in the notes to the financial statements.
Total
Primary
Government
$ 68,547 69,866 81,091 96,660
118,255 106,340 160,439 205,520 226,876 225,823
1 See the Schedule of Demographic and Economic Statistics on page 120 for personal income and population data.
- 116-
Percentage
of Personal Per
lncome1 Capita1
0.8% 622.72 0.8% 614.30 0.9% 733.26 1.1 % 853.34 1.2% 915.95 1.0% 899.68 1.3% 1,211.08 1.8% 1,708.66 1.9% 1,843.48 1.9% 1,843.48
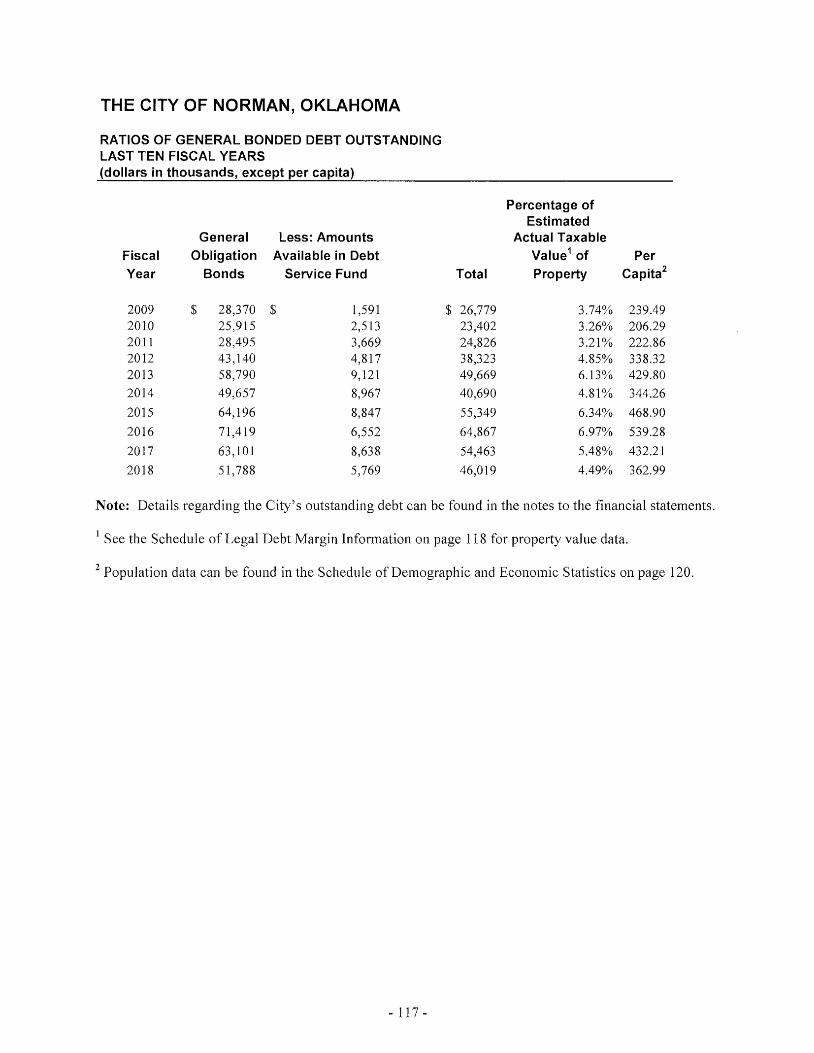
THE CITY OF NORMAN, OKLAHOMA
RATIOS OF GENERAL BONDED DEBT OUTSTANDING LAST TEN FISCAL YEARS
General Less: Amounts Fiscal Obligation Available in Debt Year Bonds Service Fund
2009 $ 28,370 $ 1,591 2010 25,915 2,513 2011 28,495 3,669 2012 43,140 4,817 2013 58,790 9,121 2014 49,657 8,967 2015 64,196 8,847 2016 71,419 6,552 2017 63,101 8,638 2018 51,788 5,769
Percentage of Estimated
Actual Taxable Value1 of Per
Total Property Capita2
$ 26,779 3.74% 239.49 23,402 3.26% 206.29 24,826 3.21% 222.86 38,323 4.85% 338.32 49,669 6.13°/h 429.80 40,690 4.81% 344.26 55,349 6.34% 468.90 64,867 6.97% 539.28 54,463 5.48% 432.21 46,019 4.49% 362.99
Note: Details regarding the City's outstanding debt can be found in the notes to the financial statements.
1 See the Schedule of Legal Debt Margin Information on page 118 for property value data.
2 Population data can be found in the Schedule of Demographic and Economic Statistics on page 120.
- 117-
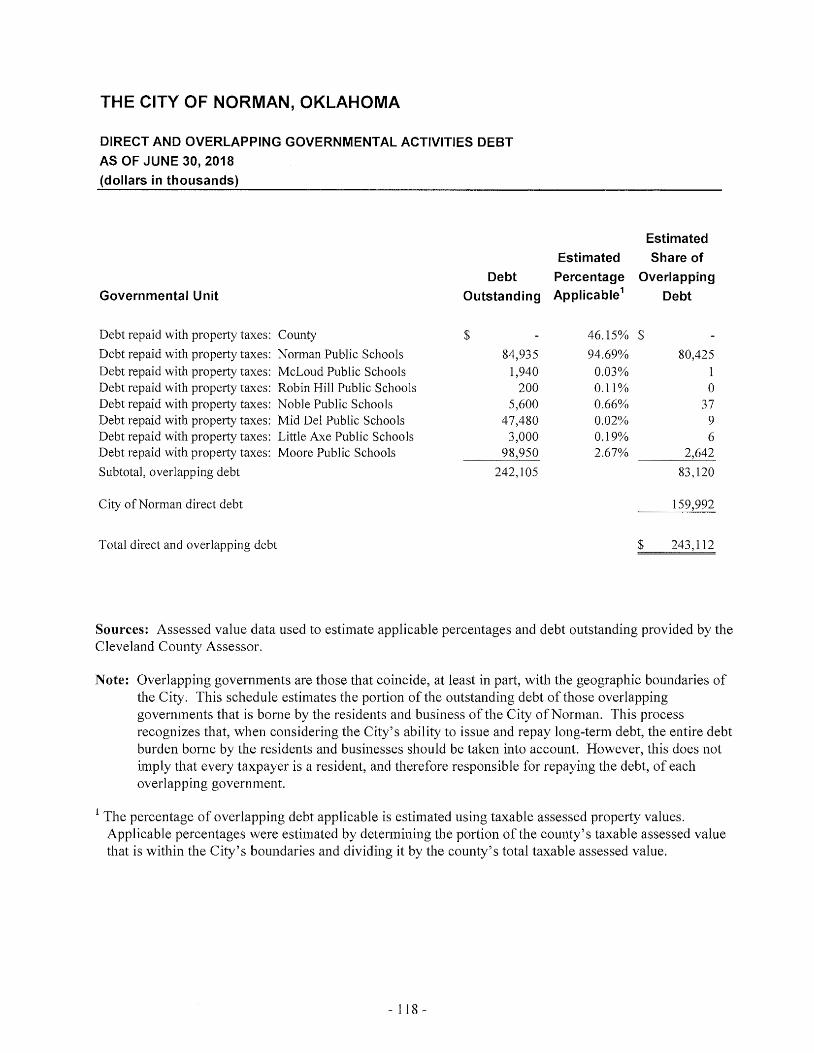
THE CITY OF NORMAN, OKLAHOMA
DIRECT AND OVERLAPPING GOVERNMENTAL ACTIVITIES DEBT
AS OF JUNE 30, 2018
(dollars in thousands)
Governmental Unit
Debt repaid with property taxes: County Debt repaid with property taxes: Nonnan Public Schools Debt repaid with property taxes: McLoud Public Schools Debt repaid with property taxes: Robin Hill Public Schools Debt repaid with property taxes: Noble Public Schools Debt repaid with property taxes: Mid Del Public Schools Debt repaid with property taxes: Little Axe Public Schools Debt repaid with property taxes: Moore Public Schools Subtotal, overlapping debt
City ofNorrnan direct debt
Total direct and overlapping debt
Debt
Outstanding
$ 84,935
1,940 200
5,600 47,480
3,000 98,950
242,105
Estimated
Estimated Share of
Percentage Overlapping Applicable 1
Debt
46.15% $ 94.69% 80,425
0.03% 1 0.11% 0 0.66% 37 0.02% 9 0.19% 6 2.67% 2,642
83,120
112
Sources: Assessed value data used to estimate applicable percentages and debt outstanding provided by the Cleveland County Assessor.
Note: Overlapping governments are those that coincide, at least in part, with the geographic boundaries of the City. This schedule estimates the portion of the outstanding debt of those overlapping governments that is bon1e by the residents and business of the City ofNorman. This process recognizes that, when considering the City's ability to issue and repay long-term debt, the entire debt burden borne by the residents and businesses should be taken into account. However, this does not imply that every taxpayer is a resident, and therefore responsible for repaying the debt, of each overlapping government.
1 The percentage of overlapping debt applicable is estimated using taxable assessed property values. Applicable percentages were estimated by determining the portion of the county's taxable assessed value that is within the City's boundaries and dividing it by the county's total taxable assessed value.
- 118 -

THE CITY OF NORMAN, OKLAHOMA
LEGAL DEBT MARGIN INFORMATION LAST TEN FISCAL YEARS (dollars in thousands)
Fiscal Year 2018 2017 2016 2015 2014 2013 2012 2011 2010 2009
Assessed value of orooertv $ 993,913 $ 963,371 $ 930,798 $ 873,553 $ 843,440 $ 807,370 $ 790,324 $ 773,094 $ 719,235 $ 715,777
Debt limif, I 0% of assessed value 99,391 96,337 93,080 87,355 84,344 80,737 79,032 77,309 71,924 71,578 Amount of debt applicable to limit:
General Obligation Bonds back by property taxes Less: Resources restricted to paying principal
Total net debt applicable to limit
debt man!in $ 99,391 $ 96,337 $ 93,080 $ 87,355 $ 84,344 $ 80,737 $ 79,032 $ 77,309 $ 71,924 $ 71,578
Total net debt applicable to the limit as a percentage of debt limit 0.00% 0.00% 0.00% 0.00% 0.00% 0.00% 0.00% 0.00% 0.00% 0.00%
Debt limit2, 30% of assessed value $ 298) 74 $ 289,011 $ 279,239 $ 262,066 $ 253,032 $ 242,211 $ 237,097 $ 231,928 $ 215,771 $ 214,733
Amount of debt applicable to limit: General Obligation Bonds 50,360 61,445 71,419 64,196 49,495 58,620 43,140 28,495 25,915 28,370 Less: Resources restricted to paying principal (5,769) (8,638) (6,552) (8,847) (8,967) (9,121) (4,817) (3,669) (2,513) (1,591)
Total net debt aoolicable to limit 44,591 52,807 64,867 55,349 40,528 49,499 38,323 24,826 23,402 26,779
debt mar!!in $ 253,583 $ 236,204 $ 214,372 $ 206,717 $ 212,504 $ 192,712 $ 198,774 $ 207)02 $ 192,369 $ 187,954
Total net debt applicable to the limit as a percentage of debt limit 14.95% 18.27% 23.23% 21.12% 16.02% 20.44% 16.16% 10.70% 10.85% 12.47%
1 Article X, Section 26 of the Oklahoma Constitution states that bonds issued for road and/or bridge improvements cannot exceed ten percent ( 10%) of the net assessed valuation (gross valuation minus homestead) of the City.
2 Article X, Section 27 of the Oklahoma Constitution authorizes cities and towns to issue bonds for utilities. The courts have defmed utilities broadly as anything used by the public. If the City's debt exceeds 30% of its net assessed valuation, the City can still sell its general obligation bonds; however, due to collateralization requirements, it may be difficult to attract Oklahoma banks to bid on the bonds and therefore affect the marketability of the bonds.
- 119-

THE CITY OF NORMAN, OKLAHOMA
PLEDGED-REVENUE COVERAGE LAST TEN FISCAL YEARS (dollars in thousands)
NUA Revenue Bonds & Term Loans Less: Net
Fiscal Gross Operating Available Debt Service Year Revenue1 Expenses2 Revenue Principal Interest Coverage
2009 $ 27,662 $ 13,513 $ 14,149 $ 2,193 $ 1,358 3 98 2010 33,559 10,873 22,686 2,242 1,251 6.49 2011 30,345 11,793 18,552 1,807 1,354 5.87 2012 31,347 14,361 16,986 3,153 1,667 3.52 2013 31,037 17,001 14,036 3,163 1,430 3.06 2014 31,562 17,096 14,466 3,150 1,709 2.98 2015 32,212 14,381 17,831 4,447 2,544 2.55 2016 37,308 11,657 25,651 6,508 1,287 3.29 2017 33,834 18,055 15,779 5,943 1,053 2.26 2018 34,050 17,747 16,303 5,508 1,262 2.41
Gross Revenue1
$ 12,384 12,659 i3,382 15,124 15,057 15,632 15,476 16,021 16,315 16,624
NMA Revenue Bonds and Term Loans Less: Net
Operating Available Debt Service Expenses2 Revenue Principal Interest
$ 10,630 $ 1,754 $ 220 $ 136 10,947 1,712 375 194 11,243 2,139 295 204 11,800 3,324 310 291 12,459 2,598 325 231 13,474 2,158 575 203 12,075 3,401 665 189 11,781 4,240 680 171 11,603 4,712 705 151 12,346 4,278 725 131
Notes: Details regarding the City's outstanding debt can be found in the notes to the financial statements.
Coverage
4.93 3 01 4.29 5.53 4.67 2.77 3.98 4.98 5.50 5.00
1 Total revenues (including interest and transfers in) exclusive of sewer sales and use taxes and capital improvement charges.
Special Assessment Term Loans Special
Assessment Debt Service Collections Principal Interest Coverage
$ 57 $ 80 $ 20 0.57 50 80 17 0.52 38 80 14 0.40 32 239 37 0.12
2 Total operating expenses exclusive of depreciation, amortization, Sewer Maintenance Fund expenses and Sewer Sales and Use Tax Fund expenses.
- 120-

THE CITY OF NORMAN, OKLAHOMA
DEMOGRAPHIC AND ECONOMIC STATISTICS LAST TEN FISCAL YEARS
Personal Income
Fiscal (billions Per Capita Median School Unemployment
year Population 1 of dollars)5 lncome2 Age2 Enrollmene Rate4
2009 111,817 $8.1 26,371 29.4 13,563 4.80%
2010 113,733 8.7 26,371 29.4 14,025 5.30%
2011 111,398 8.7 24,586 30.4 14,644 5.00%
2012 113,273 9.1 26,058 29.6 15,022 4.40%
2013 115,562 9.6 27,343 29.7 15,510 5.00%
2014 118,197 10.4 26,267 29.9 15,739 4.20%
2015 118,040 10.6 27,749 30.2 15,745 3.80%
2016 120,284 11.2 28,273 30.1 15,944 4.20%
2017 122,180 11.9 28,458 30.3 16,363 4.20%
2018 122,843 11.8 30,168 30.3 16,162 3.50%
Data Sources 1 Years 2009-1 0 estimated by the City of Norman Planning Depatiment. Years 2011- 18 obtained from census
data
2 U.S. Census Bureau, American Community Survey 2009-2018 estimated
3 Norman Public Schools
4 U.S. Department of Labor
5 Personal income estimated except for 201 0 Census data
- 121 -

THE CITY OF NORMAN, OKLAHOMA
PRINCIPAL EMPLOYERS
CURRENT YEAR AND NINE YEARS AGO
201 2009
of Total City ofT otal City Employer Employees Rank Employment Employees Rank Employment
The University of Oklahoma 11,172 1 18.25% 12,098 23.15%
Norman Regional Hospital 3,040 2 4.97% 2,506 2 4.79%
Norman Public Schools 1,872 3 3.06% 1,715 3 3.28%
York International/Johnson Controls 1,030 4 1.68% 974 4 1.86%
Walmart 950 5 1.55%
City ofNorman 865 6 1.41% 780 5 1.49%
Department of Mental Health & Substance Abuse 549 7 0.09% 775 6 1.48%
Hitachi 460 8 0.75%
NOAA National Severe Storm Laboratory 400 9 0.65% 400 8 0.77%
Oklahoma Veteran's Center 350 10 0.57%
USPS National Center for Employee Development 350 10 0.57% 640 7 1.22%
Moore-Norman Technology Center 399 9 0.76%
ClientLogic/Site 1 380 10 0.73%
Total 21 33.55% 20,667
Source: Various employers within the City of Norman and the Bureau of Labor and Statistics.
- 122-

THE CITY OF NORMAN, OKLAHOMA
FULL-TIME EQUIVALENT CITY EMPLOYEES BY FUNCTION
LAST TEN FISCAL YEARS
Full-time Equivalent Employees as of June 30 2018 2017 2016 2015 2014 2013 2012 2011 2010 2009
FUNCTION
General government 60 64 61 59 40 38 36 36 49 48 Planning 36 38 37 36 37 36 36 37 39 39 City controller 30 30 29 28 35 37 38 38 38 38 Parks & recreation 59 58 53 52 47 52 54 53 60 63 Public works 116 119 112 112 110 108 106 104 107 107 Public safety
Police 262 259 245 235 231 240 229 237 216 192 Fire 171 173 163 162 163 157 142 137 134 133
Westwood 18 16 17 17 18 18 19 18 18 20 Water 48 50 49 47 49 49 49 48 47 50 Wastewater 45 46 43 43 42 42 40 41 42 42 Sanitation 58 60 58 55 58 57 55 56 52 53
Total 903 913 867 846 830 834 804 805 802 785
Source: City Payroll Office
Notes: A full-time employee is scheduled to work 2,080 hours per year (including vacation and sick leave). Full-time equivalent employment is calculated by dividing total labor hours by 2,080.
- 123 -

THE CITY OF NORMAN, OKLAHOMA
OPERATING INDICATORS BY FUNCTION
LAST TEN FISCAL YEARS
Fiscal Year
2018 2017 2016 2015 2014 2013 2012 2011 2010 2009
FUNCTION Planning
Building permits issued 1,540 1,575 2,418 2,493 3,437 1,997 1,661 1,212 1)43 1,252 Building inspections conducted 23,799 25,846 26,556 29,348 26,699 26,410 21,572 24,001 24,489 25,925
Police Physical arrests 6,076 5,594 5,709 5,637 6,529 5,922 5,740 6,005 8,596 8,227 Parking violations 14,836 17,438 13,433 15,616 12,422 10,053 5,883 4,848 6,791 14,332 Traffic violations 14,985 16,988 16,249 16,330 16,803 16,295 17,531 19,102 19,215 17,349 Non-traffic violations 3,792 4,704 4,012 4,444 4,619 4,423 4,996 4,260 4,531 4,745
Fire Calls answered 15,491 14,425 13,761 12,650 12,234 11,560 11,129 11,198 10,530 10,376 Inspections 2,331 2,972 2,983 3,456 2,083 2,700 2,814 2,623 3,050 2,815
Sanitation Refuse collected (tons per day) 288 272 316 286 286 298 279 292 289 276 Recyclables collected (tons per day) 22 28 32 32 27 28 22 11 13 12
Highways and streets Street resurfacing (miles) 19 8 17 16 15 19 26 19 9 11 Street patching (tons of asphalt used) 1,611 2,502 2,767 1,814 2,364 1,178 792 2,651 2,621 3,521
Parks and recreation Athletic field permits issued 150,173 119,904 146,641 143,878 154,596 159,817 170,291 174,268 168,648 154,757 Community center admissions 127,239 129,705 127,522 138,650 121,791 138,109 142,738 145,828 155,380 152,071
Water New connections 407 458 496 649 504 919 364 649 632 562 Water main breaks 166 160 159 185 191 268 308 177 163 143 Average daily consumption
(thousands of gallons) 13,250 12,730 12,180 12,500 12,470 12,390 13,220 13,060 15,800 12,420 Peak daily consumption
(thousands of gallons) 20,560 22,290 19,870 21,800 20,610 24,820 23,940 22,290 22,240 23,380 Wastewater
Average daily sewage treatment (thousands of gallons) 11,000 9,700 9,800 9,500 9,800 10,300 9,500 10,500 10,800 10,800
Sources: Various city departments. Note: No indicators are available for the general government function.
- 124-

THE CITY OF NORMAN, OKLAHOMA
CAPITAL ASSET STATISTICS BY FUNCTION LAST TEN FISCAL YEARS
Fiscal year
2018 2017 2016 2015 2014 2013 2012 2011 2010 2009 FUNCTION Public safety Police
Stations 2 2 2 2 2 I Patrol units 117 116 117 116 119 120 118 108 105 100
Fire stations 9 9 9 9 9 8 8 8 7 7 Sanitation Collection trucks 43 40 41 45 41 41 41 41 42 42
Highways and streets Streets (miles) 768 765 763 783 753 752 749 745 740 738 Streetlights 6,605 6,565 6,478 6,339 6,296 6,191 6,115 5,585 5,577 5,497 Traftlc signals 256 256 250 246 241 189 185 176 170 170
Parks and recreation Acreage 1,158 1,158 1,158 1,158 1,156 1,150 1,150 1,142 1,142 1,133 Playgrounds 53 53 52 52 52 52 52 51 50 50 Swimming pools 6 6 5 5 5 5 5 Tennis courts 24 24 24 24 22 22 22 22 22 22 Community centers 5 5 Golf courses
Water Water mains (miles) 600 600 597 593 576 566 562 547 536 531 Fire hydrants 5,986 5,988 5,921 5,860 5,618 5,498 5,392 5,337 5,158 5,038 Water towers 5 5 4 4 4 4 4 4 4 Maximum daily capacity
(thousands of gallons) 23,300 23,300 23,500 23,500 23,500 22,600 22,600 20,300 20,300 19,577 Wastewater Sanitary sewers (miles) 508 511 500 494 491 485 479 476 466 462 Manholes 11,927 11,928 11,656 11,625 11,530 11,387 11,228 11,154 10,885 10,665 Maximum daily treatment capacity
(thousands of gallons) 36,000 36,000 30,000 30,000 30,000 30,000 24,000 24,000 24,000 24,000
Sources: Various city departments. Note: No capital asset indicators are available for the general government function.
- 125 -

This page left intentionally blank.


City of Norman, Oklahoma
Single Audit Reports
June 30, 2018


City of Norman, Oklahoma June 30, 2018
Contents
Schedule of Expenditures of Federal Awards ............................................................................. 1
Notes to Schedule of Expenditures of Federal Awards ............................................................ 3
Report on Internal Control over Financial Reporting and on Compliance and Other Matters Based on an Audit of Financial Statements Performed in Accordance with Government Auditing Standards – Independent Auditor’s Report ................................... 4
Report on Compliance for the Major Federal Program; Report on Internal Control over Compliance; and Report on Schedule of Expenditures of Federal Awards Required by the Uniform Guidance – Independent Auditor’s Report ................................................. 6
Schedule of Findings and Questioned Costs.............................................................................. 9
Summary Schedule of Prior Audit Findings .............................................................................. 11

City of Norman, Oklahoma Schedule of Expenditures of Federal Awards
Year Ended June 30, 2018
The accompanying notes are an integral part of this Schedule. 1
Federal Passed TotalFederal Grantor/Pass-Through Grantor/ CFDA Pass-Through Entity Grant or Other Through to Federal
Program or Cluster Title Number Identifying Number Identifying Number Subrecipients Expenditures
Research & Development
U.S. Department of the Interior
Water Desalination Research and Development 15.506 None R16AP00028 -$ 45,695$
Total Research & Development - 45,695
U.S. Department of Housing and Urban Development
CDBG – Entitlement Cluster
Community Development Block Grants/ 14.218 None B-14 MC-40-0002 - 182,298 Entitlement Grants None B-16 MC-40-0002 - 146,298
None B-17 MC-40-0002 - 459,171 Total CDBG – Entitlement Cluster - 787,767
Oklahoma State Department of Commerce/Community Development Block Grants/State’s 14.228 16604 CDBG-DR 13 None - 3,845,233 Program and Non-Entitlement Grants in Hawaii 16570 CDBG-DR 13 None - 2,512,841
16912 CDBG-DR 13 None - 33,450 Total CFDA 14.228 - 6,391,524
HOME Investment Partnerships Program 14.239 None M-14 MC-40-0204 - 25,136 None M-15 MC-40-0204 - 134,696 None M-16 MC-40-0204 - 12,373 None M-17 MC-40-0204 - 24,971
Total CFDA 14.239 - 197,176
Continuum of Care (CoC) Program 14.267 None OK0133L61041600 - 12,015
Total U.S. Department of Housing and Urban Development - 7,388,482
U.S. Department of Interior
Oklahoma State Historic Perservation Office/Historic Preservation Fund 15.904 17-612 None - 11,249
Total U.S. Department of Interior - 11,249
U.S. Department of Justice
Edward Byrne Memorial Justice AssistanceGrants Program 16.738 None 2016-DJ-BX-0676 - 594
Equitable Sharing Program 16.922 None Unknown - 494
Total U.S. Department of Justice - 1,088

City of Norman, Oklahoma Schedule of Expenditures of Federal Awards, continued
Year Ended June 30, 2018
The accompanying notes are an integral part of this Schedule. 2
Federal Passed TotalFederal Grantor/Pass-Through Grantor/ CFDA Pass-Through Entity Grant or Other Through to Federal
Program or Cluster Title Number Identifying Number Identifying Number Subrecipients Expenditures
U.S. Department of Transportation
Highway Planning and Construction Cluster
Oklahoma Department of Transportation/Highway Planning and Construction 20.205 J/P 11767(32) None -$ 10,400$
Oklahoma Department of Transportation/Recreational Trails Program 20.219 NRT-2015(100) None - 160,000
Total Highway Planning and Construction Cluster - 170,400
Highway Safety Cluster
Oklahoma State Highway Safety Office/ 20.600 PT-18-03-16-0 None - 45,681 State and Community Highway Safety AL-17-02-01-17 None - 18,781
AL-17-03-08-09 None - 11,579 AL-18-02-01-18 None - 23,358
- 99,399
Oklahoma State Highway Safety Office/ 20.616 M5OT-17-03-02-01P None - 8,800 National Priority Safety Programs F5OT-18-03-01-02N None - 3,248
- 12,048 Total Highway Safety Cluster - 111,447
Total U.S. Department of Transportation - 281,847
Environmental Protection Agency
Clean Water State Revolving Funds Cluster
Oklahoma Water Resources Board/Capitalization 66.458 ORF-14-0005-CW None - 4,305,034 Grants for Clean Water State Revolving Funds ORF-17-0016-CW None - 110,618
Total Clean Water State Revolving Funds Cluster - 4,415,652
Total Environmental Protection Agency - 4,415,652
U.S. Department of Homeland Security
Oklahoma Department of Civil Emergency Management/Disaster Grants – Public Assistance (PresidentiallyDeclared Disasters) 97.036 FEMA 4222 DR OK None - 448,792
Oklahoma State Office of Homeland Security/Hazard Mitigation Grant Program (HMGP) 97.039 FEMA-4117 DR OK 23 None - 36,073
Oklahoma State Office of Homeland Security/ 97.067 780.503 None - 2,080 Homeland Security Grant Program 860.15 None - 23,450
Total CFDA 97.067 - 25,530
Total U.S. Department of Homeland Security - 510,395
Total Expenditures of Federal Awards -$ 12,654,408$

City of Norman, Oklahoma Notes to Schedule of Expenditures of Federal Awards
Year Ended June 30, 2018
3
Notes to Schedule
1. The accompanying schedule of expenditures of federal awards (the Schedule) includes the federal award activity of the City of Norman, Oklahoma (the City) under programs of the federal government for the year ended June 30, 2018. The information in this Schedule is presented in accordance with the requirements of Title 2 U.S. Code of Federal Regulations Part 200, Uniform Administrative Requirements, Cost Principles, and Audit Requirements for Federal Awards (Uniform Guidance). Because the Schedule presents only a selected portion of the operations of the City, it is not intended to and does not present the financial position, changes in net position or cash flows of the City.
2. Expenditures reported on the Schedule are reported on the modified accrual basis of accounting. Such expenditures are recognized following, as applicable, either the cost principles in the U.S. Office of Management and Budget Circular A-87, Cost Principles for State, Local and Indian Tribal Governments, or the cost principles contained in the Uniform Guidance, wherein certain types of expenditures are not allowable or are limited as to reimbursement. The City has elected not to use the 10 percent de minimis indirect cost rate allowed under the Uniform Guidance.

4
Report on Internal Control over Financial Reporting and on Compliance and Other Matters Based on an Audit of Financial Statements Performed in Accordance with
Government Auditing Standards
Independent Auditor’s Report
Honorable Mayor and City Council City of Norman, Oklahoma Norman, Oklahoma We have audited, in accordance with auditing standards generally accepted in the United States of America and the standards applicable to financial audits contained in Government Auditing Standards, issued by the Comptroller General of the United States, the financial statements of the governmental activities, the business-type activities, each major fund and the aggregate remaining fund information of the City of Norman, Oklahoma (the City), as of and for the year ended June 30, 2018, and the related notes to the financial statements, which collectively comprise the City’s basic financial statements, and have issued our report thereon dated December 7, 2018, which contained an Emphasis of Matter paragraph regarding a change in accounting principle.
Internal Control over Financial Reporting
In planning and performing our audit of the financial statements, we considered the City’s internal control over financial reporting (internal control) to determine the audit procedures that are appropriate in the circumstances for the purpose of expressing our opinions on the financial statements, but not for the purpose of expressing an opinion on the effectiveness of the City’s internal control. Accordingly, we do not express an opinion on the effectiveness of the City’s internal control.
A deficiency in internal control exists when the design or operation of a control does not allow management or employees, in the normal course of performing their assigned functions, to prevent, or detect and correct, misstatements on a timely basis. A material weakness is a deficiency, or a combination of deficiencies, in internal control, such that there is a reasonable possibility that a material misstatement of the entity’s financial statements will not be prevented, or detected and corrected, on a timely basis. A significant deficiency is a deficiency, or a combination of deficiencies, in internal control that is less severe than a material weakness, yet important enough to merit attention by those charged with governance.
Our consideration of internal control was for the limited purpose described in the first paragraph of this section and was not designed to identify all deficiencies in internal control that might be material weaknesses or significant deficiencies. Given these limitations, during our audit, we did not identify any deficiencies in internal control that we consider to be material weaknesses. However, material weaknesses may exist that have not been identified.

Honorable Mayor and City Council City of Norman, Oklahoma
5
Compliance and Other Matters
As part of obtaining reasonable assurance about whether the City’s financial statements are free from material misstatement, we performed tests of its compliance with certain provisions of laws, regulations, contracts and grant agreements, noncompliance with which could have a direct and material effect on the determination of financial statement amounts. However, providing an opinion on compliance with those provisions was not an objective of our audit and, accordingly, we do not express such an opinion. The results of our tests disclosed no instances of noncompliance or other matters that are required to be reported under Government Auditing Standards.
Purpose of This Report
The purpose of this report is solely to describe the scope of our testing of internal control and compliance and the results of that testing, and not to provide an opinion on the effectiveness of the entity’s internal control or on compliance. This report is an integral part of an audit performed in accordance with Government Auditing Standards in considering the entity’s internal control and compliance. Accordingly, this communication is not suitable for any other purpose.
Oklahoma City, Oklahoma December 7, 2018

6
Report on Compliance for the Major Federal Program; Report on Internal Control over Compliance; and Report
on Schedule of Expenditures of Federal Awards Required by the Uniform Guidance
Independent Auditor’s Report
Honorable Mayor and City Council City of Norman, Oklahoma Norman, Oklahoma Report on Compliance for the Major Federal Program
We have audited the City of Norman, Oklahoma’s (the City) compliance with the types of compliance requirements described in the OMB Compliance Supplement that could have a direct and material effect on the City’s major federal program for the year ended June 30, 2018. The City’s major federal program is identified in the summary of auditor’s results section of the accompanying schedule of findings and questioned costs.
Management’s Responsibility
Management is responsible for compliance with federal statutes, regulations and the terms and conditions of its federal awards applicable to its federal programs.
Auditor’s Responsibility
Our responsibility is to express an opinion on compliance for the City’s major federal program based on our audit of the types of compliance requirements referred to above. We conducted our audit of compliance in accordance with auditing standards generally accepted in the United States of America; the standards applicable to financial audits contained in Government Auditing Standards, issued by the Comptroller General of the United States; and the audit requirements of Title 2 U.S. Code of Federal Regulations Part 200, Uniform Administrative Requirements, Cost Principles, and Audit Requirements for Federal Awards (Uniform Guidance). Those standards and the Uniform Guidance require that we plan and perform the audit to obtain reasonable assurance about whether noncompliance with the types of compliance requirements referred to above that could have a direct and material effect on a major federal program occurred. An audit includes examining, on a test basis, evidence about the City’s compliance with those requirements and performing such other procedures as we considered necessary in the circumstances.
We believe that our audit provides a reasonable basis for our opinion on compliance for the major federal program. However, our audit does not provide a legal determination of the City’s compliance.

Honorable Mayor and City Council City of Norman, Oklahoma
7
Opinion on the Major Federal Program
In our opinion, the City of Norman, Oklahoma, complied, in all material respects, with the types of compliance requirements referred to above that could have a direct and material effect on its major federal program for the year ended June 30, 2018.
Report on Internal Control over Compliance
Management of the City is responsible for establishing and maintaining effective internal control over compliance with the types of compliance requirements referred to above. In planning and performing our audit of compliance, we considered the City’s internal control over compliance with the types of requirements that could have a direct and material effect on its major federal program to determine the auditing procedures that are appropriate in the circumstances for the purpose of expressing an opinion on compliance for each major federal program and to test and report on internal control over compliance in accordance with the Uniform Guidance, but not for the purpose of expressing an opinion on the effectiveness of internal control over compliance. Accordingly, we do not express an opinion on the effectiveness of the City’s internal control over compliance.
A deficiency in internal control over compliance exists when the design or operation of a control over compliance does not allow management or employees, in the normal course of performing their assigned functions, to prevent, or detect and correct, noncompliance with a type of compliance requirement of a federal program on a timely basis. A material weakness in internal control over compliance is a deficiency, or a combination of deficiencies, in internal control over compliance, such that there is a reasonable possibility that material noncompliance with a type of compliance requirement of a federal program will not be prevented, or detected and corrected, on a timely basis. A significant deficiency in internal control over compliance is a deficiency, or a combination of deficiencies, in internal control over compliance with a type of compliance requirement of a federal program that is less severe than a material weakness in internal control over compliance, yet important enough to merit attention by those charged with governance.
Our consideration of internal control over compliance was for the limited purpose described in the first paragraph of this section and was not designed to identify all deficiencies in internal control over compliance that might be material weaknesses or significant deficiencies. We did not identify any deficiencies in internal control over compliance that we consider to be material weaknesses. However, material weaknesses may exist that have not been identified.
The purpose of this report on internal control over compliance is solely to describe the scope of our testing of internal control over compliance and the results of that testing based on the requirements of the Uniform Guidance. Accordingly, this report is not suitable for any other purpose.
Report on Schedule of Expenditures of Federal Awards Required by Uniform Guidance
We have audited the financial statements of the governmental activities, the business-type activities, each major fund and the aggregate remaining fund information of the City, as of and for the year ended June 30, 2018, and the related notes to the financial statements, which collectively comprise the City’s basic financial statements. We issued our report thereon dated December 7, 2018, which contained an unmodified opinion and an Emphasis of Matter paragraph regarding a change in accounting principle. Our audit was conducted for the purpose of forming opinions on the financial statements that collectively comprise the basic financial statements. The accompanying schedule of expenditures of federal awards is presented for purposes of additional analysis as required by the Uniform Guidance and is not a required

Honorable Mayor and City Council City of Norman, Oklahoma
8
part of the basic financial statements. Such information is the responsibility of management and was derived from and relates directly to the underlying accounting and other records used to prepare the basic financial statements. The information has been subjected to the auditing procedures applied in the audit of the financial statements and certain additional procedures, including comparing and reconciling such information directly to the underlying accounting and other records used to prepare the basic financial statements or to the basic financial statements themselves, and other additional procedures in accordance with auditing standards generally accepted in the United States of America. In our opinion, the schedule of expenditures of federal awards is fairly stated in all material respects in relation to the basic financial statements as a whole.
Oklahoma City, Oklahoma December 7, 2018

City of Norman, Oklahoma Schedule of Findings and Questioned Costs
Year Ended June 30, 2018
9
Summary of Auditor’s Results
Financial Statements
1. The type of report the auditor issued on whether the financial statements audited were prepared in accordance with accounting principles generally accepted in the United States of America (GAAP) was:
Unmodified Qualified Adverse Disclaimer
2. The independent auditor’s report on internal control over financial reporting disclosed:
Significant deficiencies? Yes None reported
Material weaknesses? Yes No
3. Noncompliance considered material to the financial statements was disclosed by the audit?
Yes
No
Federal Awards
4. The independent auditor’s report on internal control over compliance for the major federal award program disclosed:
Significant deficiencies? Yes None reported
Material weaknesses? Yes No
5. The opinion expressed in the independent auditor’s report on compliance for the major federal award program was:
Unmodified Qualified Adverse Disclaimer
6. The audit disclosed findings required to be reported by 2 CFR 200.516(a)?
Yes
No
7. The City’s major program was:
Cluster/Program CFDA Number Oklahoma State Department of Commerce/Community Development Block
Grants/State’s Program and Non-Entitlement Grants in Hawaii 14.228
8. The threshold used to distinguish between Type A and Type B programs was $750,000.
9. The City qualified as a low-risk auditee? Yes No

City of Norman, Oklahoma Schedule of Findings and Questioned Costs, continued
Year Ended June 30, 2018
10
Findings Required to be Reported by Government Auditing Standards
No matters are reportable.
Findings Required to be Reported by the Uniform Guidance
No matters are reportable.
City of Norman, Oklahoma Summary Schedule of Prior Audit Findings
Year Ended June 30, 2018
11
Reference Number Summary of Finding Status
No matters are reportable.