Embed Size (px)
Citation preview
Comprehensive Annual Financial Report
For the Fiscal Years Ended June 30, 2016 and 2015

Gold Coast Transit District
Oxnard, California
Comprehensive Annual Financial Report
For the Fiscal Years Ended June 30, 2016 and 2015


Gold Coast Transit District Board of Directors – June 30, 2016
Douglas A. Breeze, Chair
Mayor, City of Port Hueneme Alternate Director, Councilmember Sylvia Munoz Schnopp
Bryan A. MacDonald, Vice-Chair
Councilman, City of Oxnard Alternate Director, Mayor Pro Tem Carmen Ramirez, Esq.
Paul Blatz, Director Mayor, City of Ojai
Alternate Director, Councilmember Betsy Clapp
Carl E. Morehouse, Director
Councilmember, City of Ventura Alternate Director, Councilmember James L. Monahan
John C. Zaragoza, Director Supervisor, 5th District, County of Ventura

This page intentionally left blank
Gold Coast Transit District Comprehensive Annual Financial Report
For the Fiscal Years Ended June 30, 2016 and 2015

This page intentionally left blank
Gold Coast Transit District Comprehensive Annual Financial Report
For the Fiscal Years Ended June 30, 2016 and 2015
Table of Contents
i
Page Board of Directors – June 30, 2016 Table of Contents ........................................................................................................................................................ i INTRODUCTORY SECTION (Unaudited)
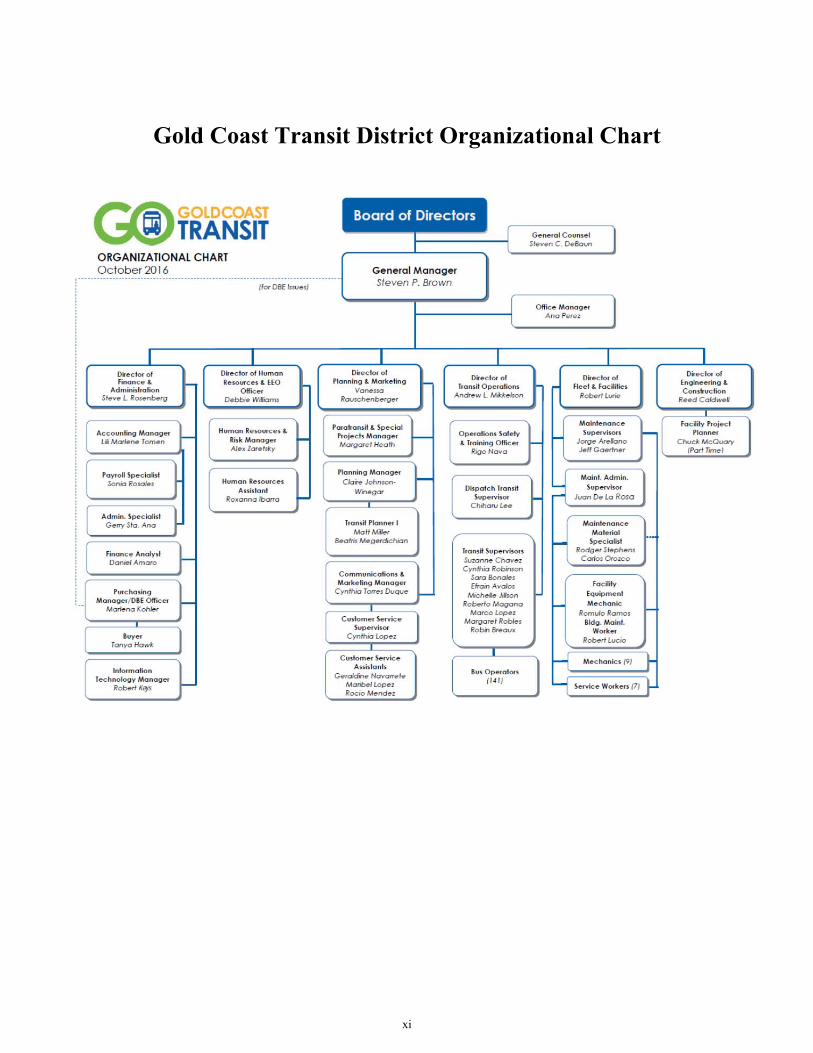
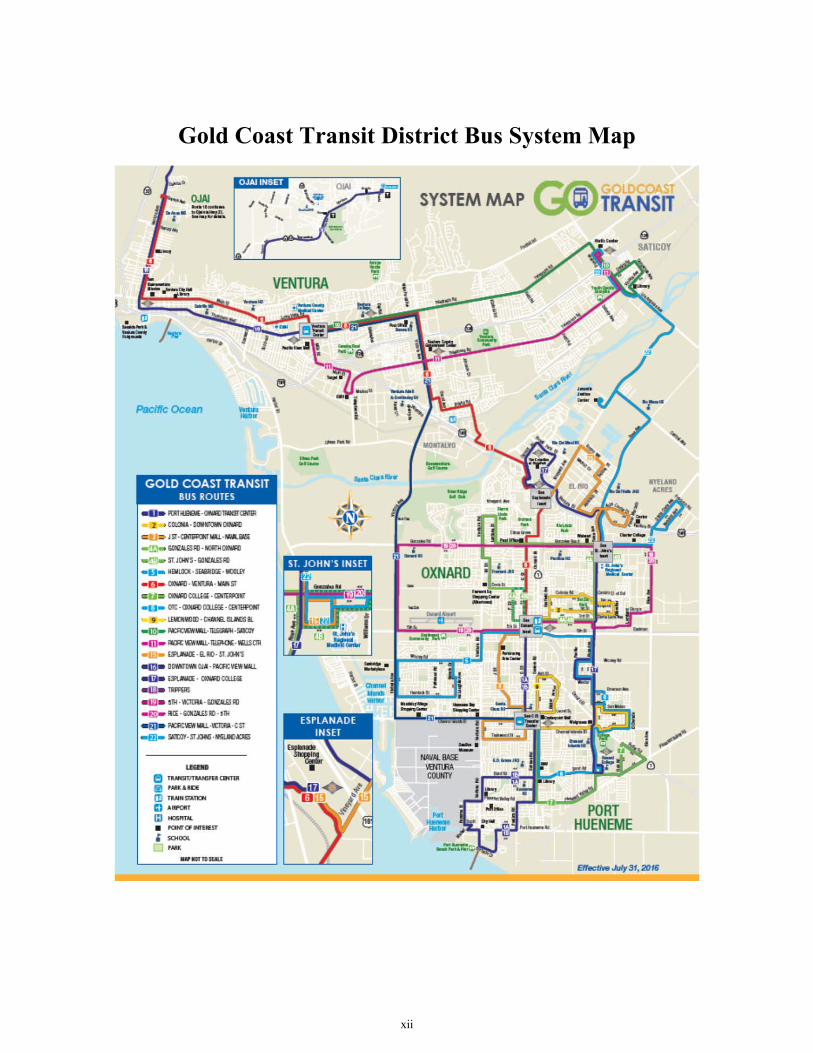
Letter of Transmittal – General Manager .................................................................................................................... v Letter of Transmittal – Director of Finance and Administration ............................................................................... vii Organizational Information ......................................................................................................................................... ix Organizational Chart ................................................................................................................................................... xi Bus System Map ........................................................................................................................................................ xii FINANCIAL SECTION
Independent Auditors' Report on the Financial Statements ................................................................................. 1 Report on Internal Control over Financial Reporting
and on Compliance and Other Matters Based on an Audit of Financial Statements Performed in Accordance with Government Auditing Standards ................................................... 5
Management’s Discussion and Analysis – Required Supplementary Information (Unaudited) ........................ 7 Basic Financial Statements:
Statements of Net Position ......................................................................................................................................... 23 Statements of Revenues, Expenses and Changes in Net Position .............................................................................. 24 Statements of Cash Flows .......................................................................................................................................... 26 Statements of Fiduciary Net Position ........................................................................................................................ 28 Statements of Changes in Fiduciary Net Position ..................................................................................................... 30 Notes to the Basic Financial Statements .................................................................................................................... 33 Required Supplementary Information (Unaudited):
Schedule of Changes in Net Pension Liability and Related Ratios ........................................................................... 65 Schedule of Contributions – Pension Plan ................................................................................................................ 66 Schedule of Funding Progress – Other Post-Employment Benefits Plan ................................................................. 67 Supplementary Information:
Schedule of Changes in Local Transportation Funding Activity of the District ....................................................... 71 STATISTICAL SECTION (Unaudited)
Financial Ratios ......................................................................................................................................................... 75 Revenues and Expenses – Ten Year Comparison ...................................................................................................... 76 Operational Statistics:
Passenger Cost By Mode – Ten Year Comparison ............................................................................................. 78 Service Cost By Mode – Ten Year Comparison ................................................................................................. 80 Ridership and Service – Ten Year Comparison .................................................................................................. 88

ii
This page intentionally left blank

iii
INTRODUCTORY SECTION

iv
This page intentionally left blank
December 31, 2016 The Board of Directors Gold Coast Transit District Oxnard, California Members of the Board: It continues to be my pleasure to serve as Gold Coast Transit’s General Manager. In FY 2015-2016, Gold Coast Transit District delivered over 3.8 million passenger trips and operated 2.6 million miles of revenue service in western Ventura County. In addition, our ACCESS paratransit service provided over 93,000 trips to seniors and people with disabilities, a 10% increase over the previous year. Over the past year we have continued to focus on providing high quality bus service to the community, all the while continuing to prepare for the future. Key developments at GCTD during the FY 2015-16 include:
Received eight new Gillig buses complete with the new GO branding, and made significant progress toward
rebranding the entire fleet. Board Approval of the Short Range Transit Plan, which guides service improvements over the next five years. Implementation of a new demonstration service from east Ventura/Wells Center to north Oxnard/St. John’s
Hospital began. While new routes typically take about 3 years to fully mature, we are seeing steady increases each month.
Completion of the Customer Service Center Remodel. The improvements made as part of this project included
security measures as well as necessary ADA improvements. A successful triennial review was conducted and GCTD did very well, receiving a very limited number of findings
that were well below the national average.
Title VI – Civil Rights Program Update was approved and later accepted by the FTA.
Improved on-time performance on both fixed-route and access paratransit services.
Continued to make progress on the new facility project, including finalizing the prequalification list for potential contractors.
Applied for and received funds through the Low Carbon Transportation Operations Program (LCTOP) for ticket
vending machines.
Increased our IT efficiency by implementing a virtualized server and storage environment.
vi
Initiated an annual Wellness Fair to help foster a more healthy work force In the next year, staff will continue working on projects including updating bus stop signage upgrades, installing Automatic Voice Annunciators, conducting preliminary planning for the new Route 23 identified in the SRTP and applying for grant funding. We will also be expanding our work with the cities to identify areas for bus stop improvement and increased coordination for transit friendly development. As we prepare to break ground on our agency’s most critically important project, the new Administration, Operations and Maintenance facility, we will be working at all levels of the organization to prepare for the move. Led by our Director of Engineering and Construction, staff will be working on a comprehensive review of our organizational procedures to ensure we meet the challenges and opportunities that the new facility will provide. The Gold Coast Transit District team is very proud of its accomplishments to date and we remain committed to upholding the organization’s mission: to provide safe, responsive, convenient, efficient, and environmentally responsible public transportation that serves the diverse needs of our community. Sincerely,
December 31, 2016 Board of Directors Gold Coast Transit District 301 E. Third St. Oxnard, California 93030 Members of the Board: This is Gold Coast Transit District’s Comprehensive Annual Financial Report (CAFR) covering the fiscal years ended June 30, 2016 and 2015. This completes the District’s second year as the successor agency to the GCT Joint Powers Authority. The CAFR has been prepared by the Office of the Director of Finance and Administration, working with our independent auditors, The Pun Group, LLP, in conformance with the principles and standards for financial reporting set forth by the Governmental Accounting Standards Board (GASB). As this completes the second year incorporating the District’s net pension liability into the financial statements as required by GASB 68 and 71, the District is able to resume providing relevant year-to-year comparisons in the financial section of this document. This Office is responsible for both the accuracy of the presented data and the completeness and fairness of the presentation, including all disclosures. We believe that the data, as presented, is accurate in all material respects and presented in a manner designed to fairly set forth the financial position and results of operations of the District as of June 30, 2016 and 2015. All disclosures necessary to enable the reader to gain the maximum understanding of the District’s financial affairs have been included. The CAFR represents the culmination of all budgeting, financial and accounting activities engaged in by the District during the fiscal year. The CAFR is organized into three sections: 1. The Introductory Section is intended to familiarize the reader with the organizational structure of the District and the nature and scope of the provided services. 2. The Financial Section includes a Management’s Discussion and Analysis narrative to introduce the financial statements and analyze the financial activities during the fiscal year. This section also includes the Independent Auditor’s Report, audited financial statements, disclosure notes, supplementary budget information, supporting statements and schedules necessary to fairly present the financial position and the results of the operations of the District in conformity with generally accepted accounting principles. 3. The Statistical Section contains comparative statistical data on the District’s financial, physical, economic and social characteristics.
viii
The preparation of this Comprehensive Annual Financial Report required the cooperation of the District management, staff and our independent auditors, The Pun Group, LLP, led by the audit engagement partner, Paul J. Kaymark, CPA. I wish to express my thanks and appreciation to the GCTD Accounting and Finance staff; Finance Analyst Daniel Amaro, Administrative Specialist Gerry Sta. Ana, Payroll Specialist Sonia Rosales, and especially Accounting Manager Lili Marlene T. Tomen. Ms. Tomen’s hard work and expertise is most responsible for the Accounting Department’s continued success as the growth and evolution of GCTD as a District has made the administration function larger and more complex. This skilled and dedicated group continues to work diligently to keep the agency compliant and moving forward.
ix
About Gold Coast Transit District - Organizational Information
About Us
Gold Coast Transit District (District) provides public fixed-route and paratransit service in the cities of Ojai, Oxnard, Port Hueneme, Ventura and the unincorporated areas of Ventura County. With nearly 4 million passenger trips provided each year, the District is the largest public transportation operator in Ventura County. The fleet includes 56 buses and 24 paratransit vehicles all powered by clean natural gas supplied by an on-site CNG fueling station.
Our Mission
The District's mission is to provide safe, responsive, convenient, efficient, and environmentally responsible public transportation that serves the diverse needs of our community.
History
The District was founded in 1973 as the "South Coast Area Transit" when the cities of Ojai, Oxnard, Port Hueneme and San Buenaventura executed a Joint Powers Agreement that created "SCAT" to develop and operate local and intercity public transportation in western Ventura County.
Prior to 1973, Ventura Transit City Lines operated local service in Ventura and Ojai, and Oxnard Municipal Bus Lines served Oxnard and Port Hueneme. Following a national trend, the bus systems that flourished through the mid-century began to decline in the 1960's. The outlook for public transit systems in California brightened in 1971 when the State Legislature created a source of dedicated transportation funding through passage of the Transportation Development Act (TDA). The availability of TDA funds to local governments provided an impetus for forming a single regional transit entity to operate coordinated transit services across municipal boundaries and in some unincorporated areas of western Ventura County. The County of Ventura joined SCAT in October of 1977. By February of 1980 the transit functions in western Ventura County were consolidated into a single administrative, operating and maintenance facility on a three-acre site at 301 East Third Street in Downtown Oxnard.
In the 1990's SCAT began operation of ACCESS, a regional paratransit service providing curb-to-curb transportation for people with disabilities and senior citizens.
In June 2007, SCAT's Joint Powers Agreement was amended to rename the agency from South Coast Area Transit to Gold Coast Transit. The change in name was intended to help distinguish the agency from the 11 other agencies named SCAT around the nation and to better connect the service to the community it served.
In October 2013, Governor Brown signed into law Assembly Bill AB 664, which formed the Gold Coast Transit District. The district legislation was initiated in response to Senate Bill SB 716, which required that all TDA funds in Ventura County be used solely for public transit purposes. Formation of a transit district allows the District’s Board of Directors and staff to have greater flexibility in implementing service improvements by looking beyond jurisdictional borders in order to efficiently and effectively meet the public’s transit needs.
In 2014, the District was named Small Agency of the Year by the California Transit Association. In 2015, the District unveiled a new logo and bus paint scheme to coincide with the purchase of replacement buses. The new colors reflect the District’s commitment to quality public transportation, and evokes the agency’s vision of a more modern, clean and efficient future.
x
In FY 2016-17 the District plans to break ground on a New Administration and Operations Facility that will allow the District to continue to meet the growing transit needs of the community.
Statistics
Service Area: Ojai, Oxnard, Port Hueneme, Ventura & County of Ventura Population Served: 375,000 Average Weekday Passengers: (FY 15-16) 11,659 Fixed-Route Annual Passengers: (FY 15-16) 3.8 million Fixed-Route Annual Revenue Miles: (approx.) 2.1 million ACCESS Paratransit Annual Passengers: 93,274 56 - fixed-route buses 24 - paratransit buses and vans Fuel Type: 100% Clean Natural Gas
Board of Directors
The District is governed by a Board of Directors. Each of the District’s five member agencies appoints one elected official from its governing body to serve on the Board of Directors and a second to serve as an alternate member. The Board of Directors regular monthly meetings are held on the first Wednesday of each month at 10 a.m.
GCTD's Leadership
The District’s General Manager is appointed by, and reports to, the Board of Directors. The General Manager is charged with carrying out the Board’s policies and directives, and has full charge of the operation of the District’s services, facilities, and administration of business affairs. The District's Management Team is comprised of: (Listed in alphabetical order by Department)
General Manager - Steven P. Brown Director of Engineering and Construction - Reed Caldwell Director of Finance and Administration - Steve L. Rosenberg Director of Fleet and Facilities - Robert Lurie Director of Human Resources - Debbie Williams Director of Planning and Marketing - Vanessa Rauschenberger Director of Transit Operations - Andrew Mikkelson
Employees
The District has nearly 200 employees, the majority of whom operate or maintain buses. Service Employees International Union Local 721 represents all bus operators, most maintenance employees and five administrative staff members. GCTD contracts with MV Transportation for the operation of ACCESS Paratransit.
xi
Gold Coast Transit District Organizational Chart
xii
Gold Coast Transit District Bus System Map

FINANCIAL SECTION

This page intentionally left blank
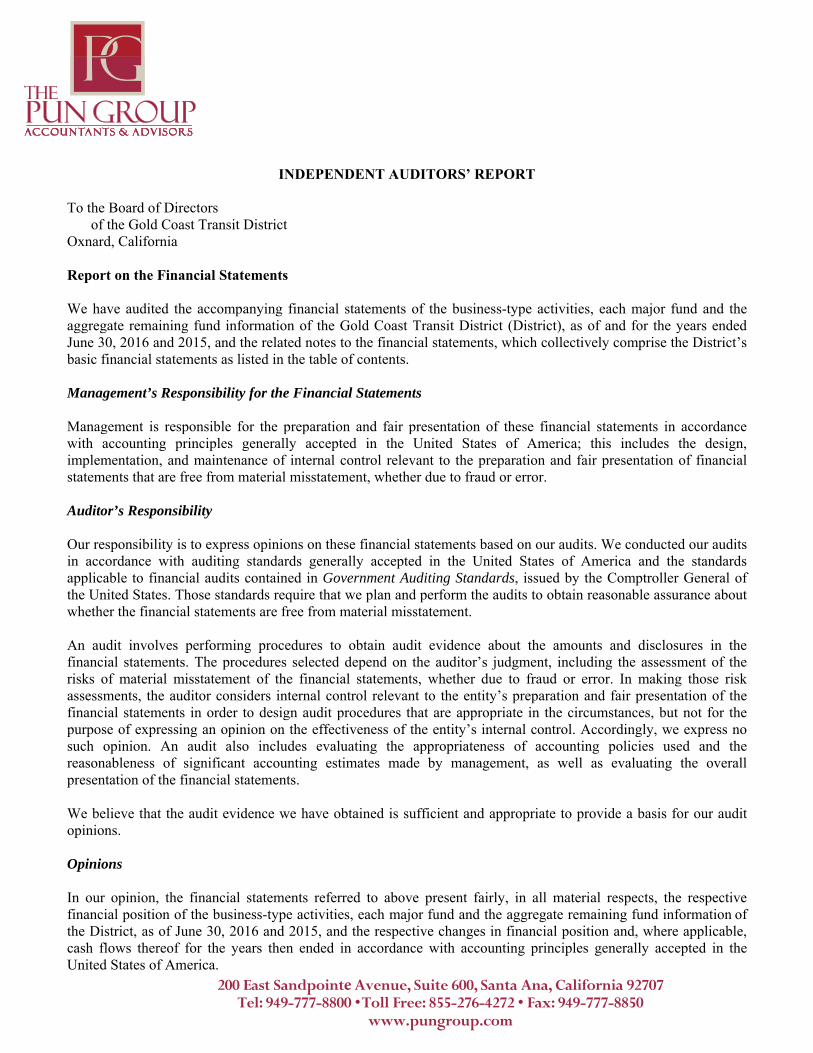
INDEPENDENT AUDITORS’ REPORT To the Board of Directors
of the Gold Coast Transit District Oxnard, California Report on the Financial Statements We have audited the accompanying financial statements of the business-type activities, each major fund and the aggregate remaining fund information of the Gold Coast Transit District (District), as of and for the years ended June 30, 2016 and 2015, and the related notes to the financial statements, which collectively comprise the District’s basic financial statements as listed in the table of contents. Management’s Responsibility for the Financial Statements Management is responsible for the preparation and fair presentation of these financial statements in accordance with accounting principles generally accepted in the United States of America; this includes the design, implementation, and maintenance of internal control relevant to the preparation and fair presentation of financial statements that are free from material misstatement, whether due to fraud or error. Auditor’s Responsibility Our responsibility is to express opinions on these financial statements based on our audits. We conducted our audits in accordance with auditing standards generally accepted in the United States of America and the standards applicable to financial audits contained in Government Auditing Standards, issued by the Comptroller General of the United States. Those standards require that we plan and perform the audits to obtain reasonable assurance about whether the financial statements are free from material misstatement. An audit involves performing procedures to obtain audit evidence about the amounts and disclosures in the financial statements. The procedures selected depend on the auditor’s judgment, including the assessment of the risks of material misstatement of the financial statements, whether due to fraud or error. In making those risk assessments, the auditor considers internal control relevant to the entity’s preparation and fair presentation of the financial statements in order to design audit procedures that are appropriate in the circumstances, but not for the purpose of expressing an opinion on the effectiveness of the entity’s internal control. Accordingly, we express no such opinion. An audit also includes evaluating the appropriateness of accounting policies used and the reasonableness of significant accounting estimates made by management, as well as evaluating the overall presentation of the financial statements. We believe that the audit evidence we have obtained is sufficient and appropriate to provide a basis for our audit opinions. Opinions In our opinion, the financial statements referred to above present fairly, in all material respects, the respective financial position of the business-type activities, each major fund and the aggregate remaining fund information of the District, as of June 30, 2016 and 2015, and the respective changes in financial position and, where applicable, cash flows thereof for the years then ended in accordance with accounting principles generally accepted in the United States of America.
200 East Sandpointe Avenue, Suite 600, Santa Ana, California 92707 Tel: 949-777-8800 • Toll Free: 855-276-4272 • Fax: 949-777-8850
www.pungroup.com
3939352 Pun & McGeady_L_final.pdf 1 1/14/14 3:48 PM
To the Board of Directors of the Gold Coast Transit District
Oxnard, California Page 2
2
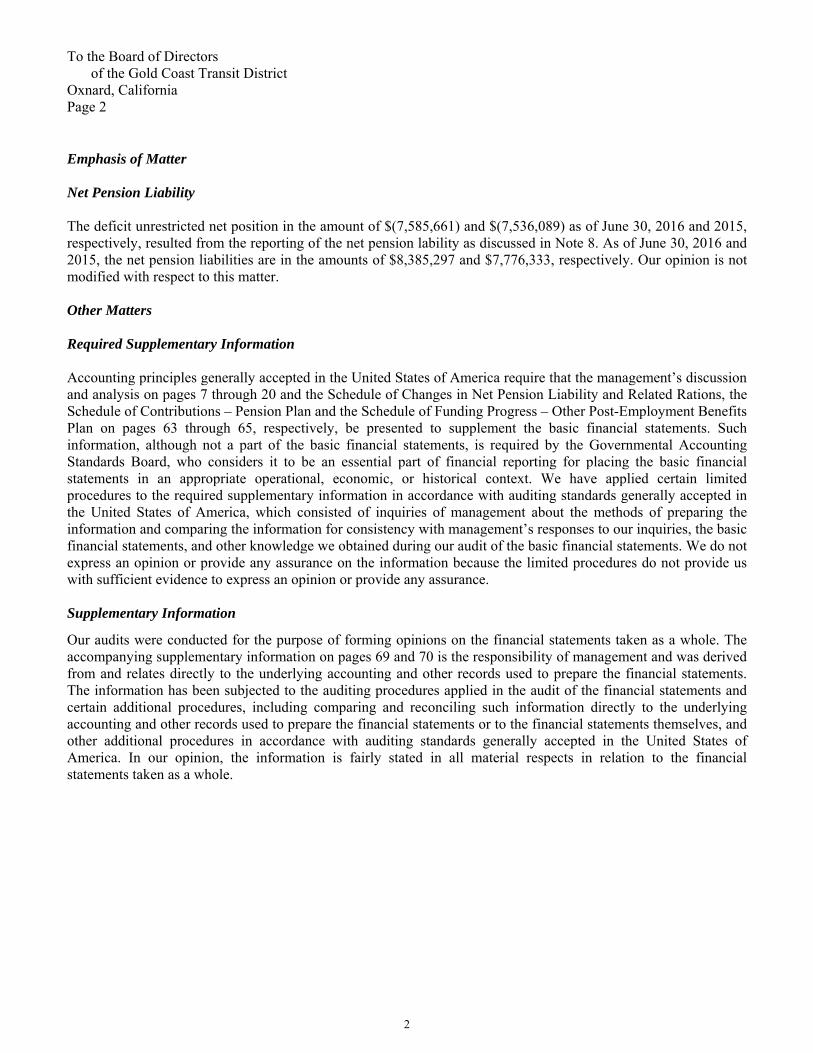
Emphasis of Matter Net Pension Liability The deficit unrestricted net position in the amount of $(7,585,661) and $(7,536,089) as of June 30, 2016 and 2015, respectively, resulted from the reporting of the net pension lability as discussed in Note 8. As of June 30, 2016 and 2015, the net pension liabilities are in the amounts of $8,385,297 and $7,776,333, respectively. Our opinion is not modified with respect to this matter. Other Matters Required Supplementary Information Accounting principles generally accepted in the United States of America require that the management’s discussion and analysis on pages 7 through 20 and the Schedule of Changes in Net Pension Liability and Related Rations, the Schedule of Contributions – Pension Plan and the Schedule of Funding Progress – Other Post-Employment Benefits Plan on pages 63 through 65, respectively, be presented to supplement the basic financial statements. Such information, although not a part of the basic financial statements, is required by the Governmental Accounting Standards Board, who considers it to be an essential part of financial reporting for placing the basic financial statements in an appropriate operational, economic, or historical context. We have applied certain limited procedures to the required supplementary information in accordance with auditing standards generally accepted in the United States of America, which consisted of inquiries of management about the methods of preparing the information and comparing the information for consistency with management’s responses to our inquiries, the basic financial statements, and other knowledge we obtained during our audit of the basic financial statements. We do not express an opinion or provide any assurance on the information because the limited procedures do not provide us with sufficient evidence to express an opinion or provide any assurance. Supplementary Information
Our audits were conducted for the purpose of forming opinions on the financial statements taken as a whole. The accompanying supplementary information on pages 69 and 70 is the responsibility of management and was derived from and relates directly to the underlying accounting and other records used to prepare the financial statements. The information has been subjected to the auditing procedures applied in the audit of the financial statements and certain additional procedures, including comparing and reconciling such information directly to the underlying accounting and other records used to prepare the financial statements or to the financial statements themselves, and other additional procedures in accordance with auditing standards generally accepted in the United States of America. In our opinion, the information is fairly stated in all material respects in relation to the financial statements taken as a whole.
To the Board of Directors of the Gold Coast Transit District
Oxnard, California Page 3
3
Other Information Our audits were conducted for the purpose of forming opinions on the financial statements that collectively comprise the District’s basic financial statements as a whole. The introductory and statistical sections are presented for purposes of additional analysis and are not required parts of the basic financial statements. The introductory and statistical sections have not been subjected to the auditing procedures applied in the audit of the basic financial statements and, accordingly, we do not express an opinion or provide any assurance on them. Management has not presented certain accrual-based information that accounting principles generally accepted in the United States of America require to be presented in the statistical section of the basic financial statements. Such missing information, although not part of the basic financial statements, is required by the Governmental Accounting Standards Board, who considers it to improve consistency and comparability in reporting and provide clearer guidance regarding the applicability of the standards for the statistical section to all types of governmental entities. Our opinion on the basic financial statements is not affected by this missing information. Other Reporting Required by Government Auditing Standards In accordance with Government Auditing Standards, we have also issued our report dated December 31, 2016, on our consideration of the District’s internal control over financial reporting and on our tests of its compliance with certain provisions of laws, regulations, contracts, and grant agreements and other matters. The purpose of that report is to describe the scope of our testing of internal control over financial reporting and compliance and the results of that testing, and not to provide an opinion on internal control over financial reporting or on compliance. That report is an integral part of an audit performed in accordance with Government Auditing Standards in considering the District’s internal control over financial reporting and compliance. This report can be found on pages 5 and 6.
Santa Ana, California December 31, 2016

4
This page intentionally left blank
REPORT ON INTERNAL CONTROL OVER FINANCIAL REPORTING AND ON COMPLIANCE AND
OTHER MATTERS BASED ON AN AUDIT OF FINANCIAL STATEMENTS PERFORMED IN ACCORDANCE WITH GOVERNMENT AUDITING STANDARDS
Independent Auditors’ Report
To the Board of Directors
of the Gold Coast Transit District Oxnard, California We have audited, in accordance with the auditing standards generally accepted in the United States of America and the standards applicable to financial audits contained in Government Auditing Standards issued by the Comptroller General of the United States, the financial statements of the Gold Coast Transit District (District) as of and for the year ended June 30, 2016, and the related notes to the financial statements, which collectively comprises the District’s basic financial statements, and have issued our report thereon dated December 31, 2016. Internal Control Over Financial Reporting In planning and performing our audit of the financial statements, we considered the District’s internal control over financial reporting (internal control) to determine the audit procedures that are appropriate in the circumstances for the purpose of expressing our opinions on the financial statements, but not for the purpose of expressing an opinion on the effectiveness of the District’s internal control. Accordingly, we do not express an opinion on the effectiveness of the District’s internal control. A deficiency in internal control exists when the design or operation of a control does not allow management or employees, in the normal course of performing their assigned functions, to prevent, or detect and correct, misstatements on a timely basis. A material weakness is a deficiency, or a combination of deficiencies, in internal control, such that there is a reasonable possibility that a material misstatement of the entity’s financial statements will not be prevented, or detected and corrected on a timely basis. A significant deficiency is a deficiency, or a combination of deficiencies, in internal control that is less severe than a material weakness, yet important enough to merit attention by those charged with governance. Our consideration of internal control was for the limited purpose described in the first paragraph of this section and was not designed to identify all deficiencies in internal control that might be material weaknesses or, significant deficiencies. Given these limitations, during our audit we did not identify any deficiencies in internal control that we consider to be material weaknesses. However, material weaknesses may exist that have not been identified. Compliance and Other Matters As part of obtaining reasonable assurance about whether the District’s financial statements are free from material misstatement, we performed tests of its compliance with certain provisions of laws, regulations, contracts, and grant agreements, noncompliance with which could have a direct and material effect on the determination of financial statement amounts. However, providing an opinion on compliance with those provisions was not an objective of our audit, and accordingly, we do not express such an opinion. The results of our tests disclosed no instances of noncompliance or other matters that are required to be reported under Government Auditing Standards.
200 East Sandpointe Avenue, Suite 600, Santa Ana, California 92707 Tel: 949-777-8800 • Toll Free: 855-276-4272 • Fax: 949-777-8850
www.pungroup.com
3939352 Pun & McGeady_L_final.pdf 1 1/14/14 3:48 PM
To the Board of Directors of the Gold Coast Transit District
Oxnard, California Page 2
6
Purpose of this Report The purpose of this report is solely to describe the scope of our testing of internal control and compliance and the results of that testing, and not to provide an opinion on the effectiveness of the entity’s internal control or on compliance. This report is an integral part of an audit performed in accordance with Government Auditing Standards in considering the entity’s internal control and compliance. Accordingly, this communication is not suitable for any other purpose.
Santa Ana, California December 31, 2016
Gold Coast Transit District Management’s Discussion and Analysis (Unaudited)
For the Year Ended June 30, 2016
7
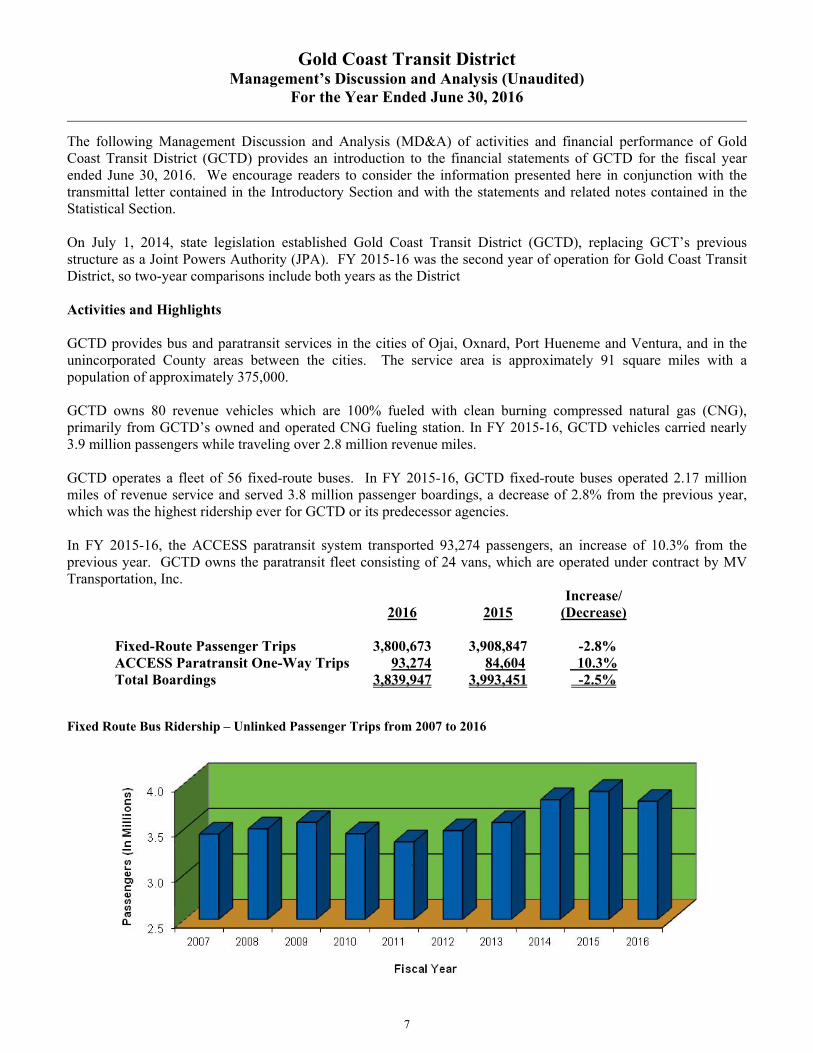
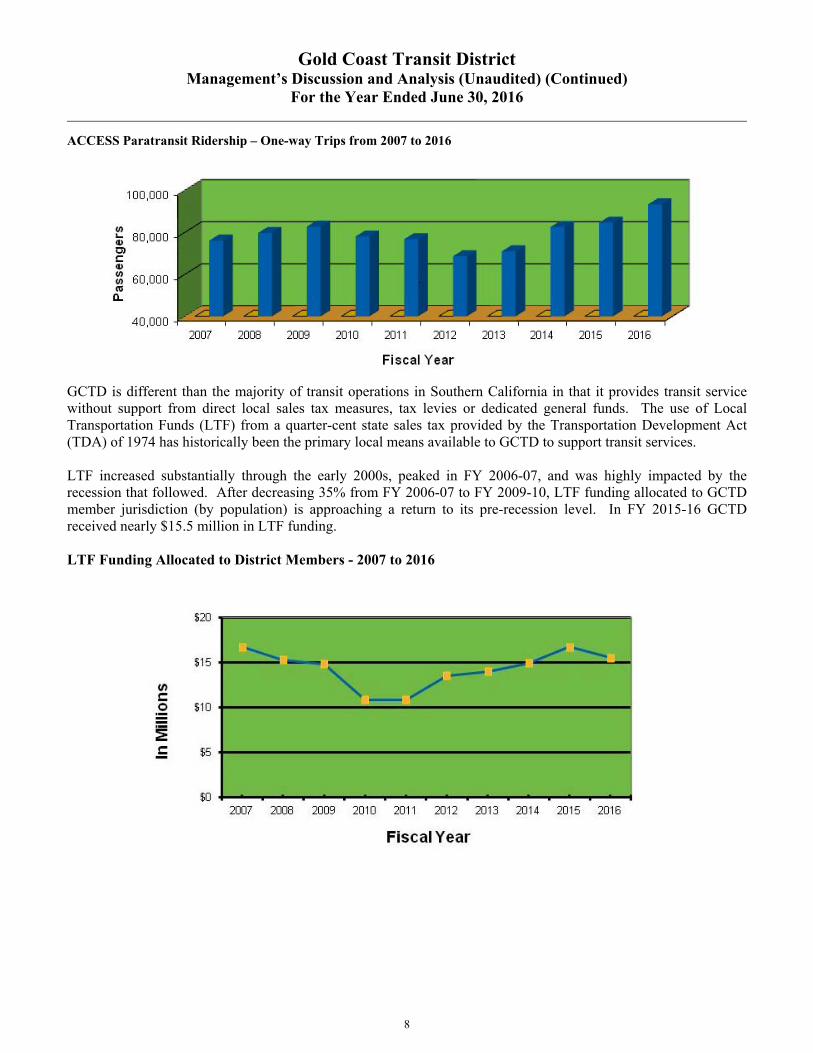
The following Management Discussion and Analysis (MD&A) of activities and financial performance of Gold Coast Transit District (GCTD) provides an introduction to the financial statements of GCTD for the fiscal year ended June 30, 2016. We encourage readers to consider the information presented here in conjunction with the transmittal letter contained in the Introductory Section and with the statements and related notes contained in the Statistical Section. On July 1, 2014, state legislation established Gold Coast Transit District (GCTD), replacing GCT’s previous structure as a Joint Powers Authority (JPA). FY 2015-16 was the second year of operation for Gold Coast Transit District, so two-year comparisons include both years as the District Activities and Highlights GCTD provides bus and paratransit services in the cities of Ojai, Oxnard, Port Hueneme and Ventura, and in the unincorporated County areas between the cities. The service area is approximately 91 square miles with a population of approximately 375,000. GCTD owns 80 revenue vehicles which are 100% fueled with clean burning compressed natural gas (CNG), primarily from GCTD’s owned and operated CNG fueling station. In FY 2015-16, GCTD vehicles carried nearly 3.9 million passengers while traveling over 2.8 million revenue miles. GCTD operates a fleet of 56 fixed-route buses. In FY 2015-16, GCTD fixed-route buses operated 2.17 million miles of revenue service and served 3.8 million passenger boardings, a decrease of 2.8% from the previous year, which was the highest ridership ever for GCTD or its predecessor agencies. In FY 2015-16, the ACCESS paratransit system transported 93,274 passengers, an increase of 10.3% from the previous year. GCTD owns the paratransit fleet consisting of 24 vans, which are operated under contract by MV Transportation, Inc. Increase/ 2016 2015 (Decrease) Fixed-Route Passenger Trips 3,800,673 3,908,847 -2.8% ACCESS Paratransit One-Way Trips 93,274 84,604 10.3% Total Boardings 3,839,947 3,993,451 -2.5% Fixed Route Bus Ridership – Unlinked Passenger Trips from 2007 to 2016
Gold Coast Transit District Management’s Discussion and Analysis (Unaudited) (Continued)
For the Year Ended June 30, 2016
8
ACCESS Paratransit Ridership – One-way Trips from 2007 to 2016
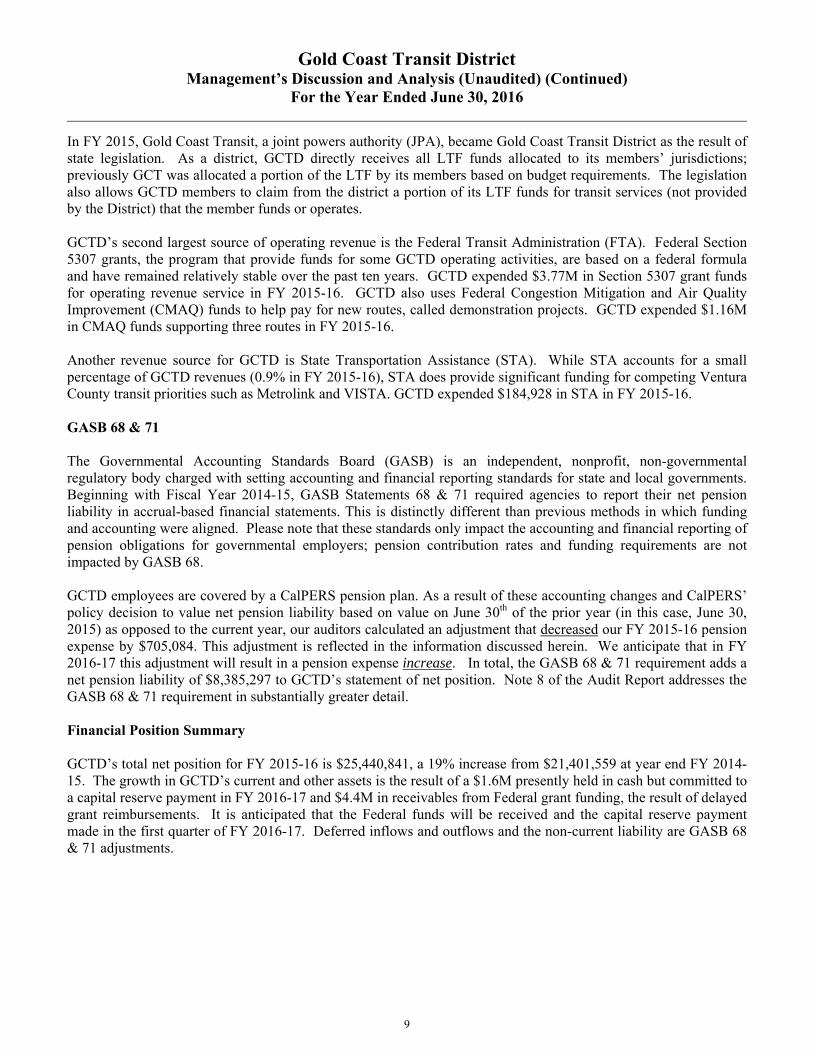
GCTD is different than the majority of transit operations in Southern California in that it provides transit service without support from direct local sales tax measures, tax levies or dedicated general funds. The use of Local Transportation Funds (LTF) from a quarter-cent state sales tax provided by the Transportation Development Act (TDA) of 1974 has historically been the primary local means available to GCTD to support transit services. LTF increased substantially through the early 2000s, peaked in FY 2006-07, and was highly impacted by the recession that followed. After decreasing 35% from FY 2006-07 to FY 2009-10, LTF funding allocated to GCTD member jurisdiction (by population) is approaching a return to its pre-recession level. In FY 2015-16 GCTD received nearly $15.5 million in LTF funding. LTF Funding Allocated to District Members - 2007 to 2016
Gold Coast Transit District Management’s Discussion and Analysis (Unaudited) (Continued)
For the Year Ended June 30, 2016
9
In FY 2015, Gold Coast Transit, a joint powers authority (JPA), became Gold Coast Transit District as the result of state legislation. As a district, GCTD directly receives all LTF funds allocated to its members’ jurisdictions; previously GCT was allocated a portion of the LTF by its members based on budget requirements. The legislation also allows GCTD members to claim from the district a portion of its LTF funds for transit services (not provided by the District) that the member funds or operates. GCTD’s second largest source of operating revenue is the Federal Transit Administration (FTA). Federal Section 5307 grants, the program that provide funds for some GCTD operating activities, are based on a federal formula and have remained relatively stable over the past ten years. GCTD expended $3.77M in Section 5307 grant funds for operating revenue service in FY 2015-16. GCTD also uses Federal Congestion Mitigation and Air Quality Improvement (CMAQ) funds to help pay for new routes, called demonstration projects. GCTD expended $1.16M in CMAQ funds supporting three routes in FY 2015-16. Another revenue source for GCTD is State Transportation Assistance (STA). While STA accounts for a small percentage of GCTD revenues (0.9% in FY 2015-16), STA does provide significant funding for competing Ventura County transit priorities such as Metrolink and VISTA. GCTD expended $184,928 in STA in FY 2015-16. GASB 68 & 71 The Governmental Accounting Standards Board (GASB) is an independent, nonprofit, non-governmental regulatory body charged with setting accounting and financial reporting standards for state and local governments. Beginning with Fiscal Year 2014-15, GASB Statements 68 & 71 required agencies to report their net pension liability in accrual-based financial statements. This is distinctly different than previous methods in which funding and accounting were aligned. Please note that these standards only impact the accounting and financial reporting of pension obligations for governmental employers; pension contribution rates and funding requirements are not impacted by GASB 68. GCTD employees are covered by a CalPERS pension plan. As a result of these accounting changes and CalPERS’ policy decision to value net pension liability based on value on June 30th of the prior year (in this case, June 30, 2015) as opposed to the current year, our auditors calculated an adjustment that decreased our FY 2015-16 pension expense by $705,084. This adjustment is reflected in the information discussed herein. We anticipate that in FY 2016-17 this adjustment will result in a pension expense increase. In total, the GASB 68 & 71 requirement adds a net pension liability of $8,385,297 to GCTD’s statement of net position. Note 8 of the Audit Report addresses the GASB 68 & 71 requirement in substantially greater detail. Financial Position Summary GCTD’s total net position for FY 2015-16 is $25,440,841, a 19% increase from $21,401,559 at year end FY 2014-15. The growth in GCTD’s current and other assets is the result of a $1.6M presently held in cash but committed to a capital reserve payment in FY 2016-17 and $4.4M in receivables from Federal grant funding, the result of delayed grant reimbursements. It is anticipated that the Federal funds will be received and the capital reserve payment made in the first quarter of FY 2016-17. Deferred inflows and outflows and the non-current liability are GASB 68 & 71 adjustments.
Gold Coast Transit District Management’s Discussion and Analysis (Unaudited) (Continued)
For the Year Ended June 30, 2016
10
Financial Position Summary, continued
2016 2015 Change
Assets:Current assets 19,423,635$ 15,531,471$ 3,892,164$ Non-current assets - 33,964 (33,964) Capital assets, net 24,938,691 22,375,098 2,563,593
Total assets 44,362,326 37,940,533 6,421,793
Deferred outflows of resources 3,062,166 1,301,199 1,760,967
Liabilities:Current liabilities 10,432,628 7,406,526 3,026,102 Non-current liabilities 8,765,770 8,095,313 670,457
Total liabilities 19,198,398 15,501,839 3,696,559
Deferred inflows of resources 2,785,253 2,338,334 446,919
Net position:Net investment in capital assets 24,938,691 22,375,098 2,563,593 Restricted for capital projects 8,087,811 6,562,550 1,525,261 Unrestricted (7,585,661) (7,536,089) (49,572)
Total net position 25,440,841$ 21,401,559$ 4,039,282$
Condensed Statement of Net Position
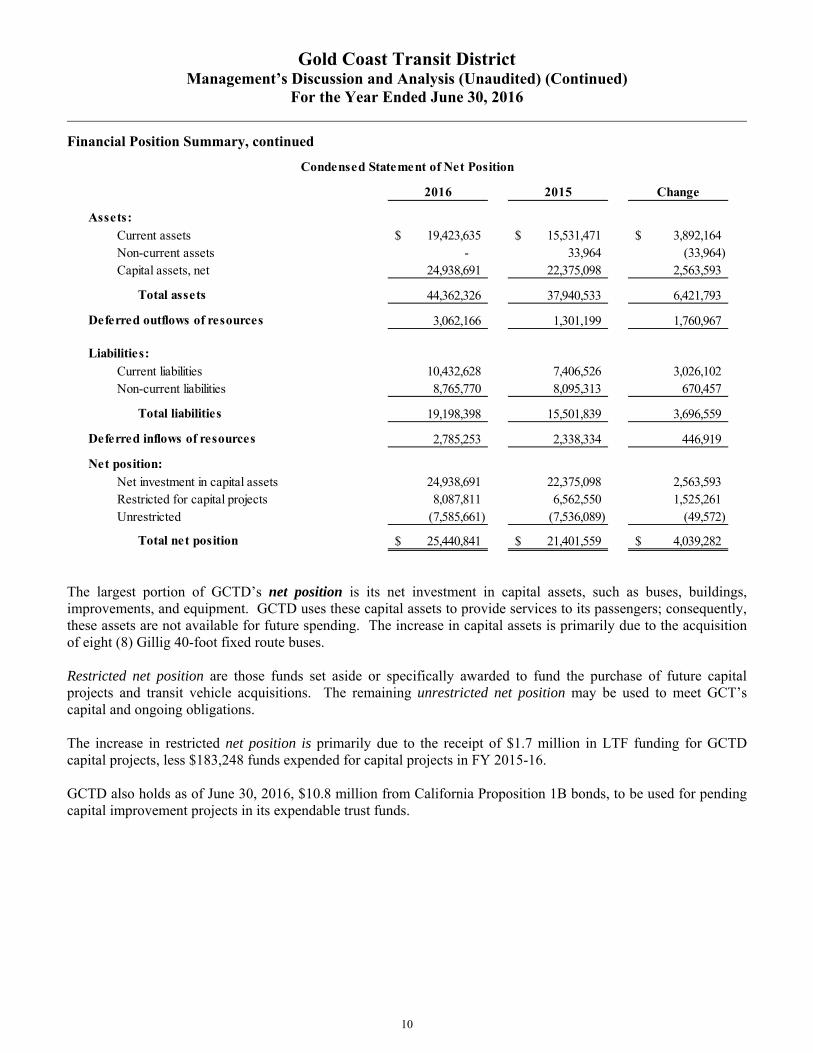
The largest portion of GCTD’s net position is its net investment in capital assets, such as buses, buildings, improvements, and equipment. GCTD uses these capital assets to provide services to its passengers; consequently, these assets are not available for future spending. The increase in capital assets is primarily due to the acquisition of eight (8) Gillig 40-foot fixed route buses. Restricted net position are those funds set aside or specifically awarded to fund the purchase of future capital projects and transit vehicle acquisitions. The remaining unrestricted net position may be used to meet GCT’s capital and ongoing obligations. The increase in restricted net position is primarily due to the receipt of $1.7 million in LTF funding for GCTD capital projects, less $183,248 funds expended for capital projects in FY 2015-16. GCTD also holds as of June 30, 2016, $10.8 million from California Proposition 1B bonds, to be used for pending capital improvement projects in its expendable trust funds.
Gold Coast Transit District Management’s Discussion and Analysis (Unaudited) (Continued)
For the Year Ended June 30, 2016
11
The following chart shows GCT’s total assets by percentage.
Passenger Fares Passenger fares are set by the Board of Directors and changed when determined necessary by the Board. The most recent fare increase was approved during FY 2009-10, when the Board of Directors approved a two-phase fare increase. The first phase took effect on January 24, 2010, and the second phase took effect on August 21, 2011. The base cash fare for GCTD fixed route buses is $1.50, and by policy the paratransit fare is automatically set at twice the amount of the fixed route fare, or $3.00. GCTD last restructured its multi-ride ticket and monthly pass program in October 2013. GCTD’s current fare structure is as follows:
GCTD FIXED ROUTE FARES
Cash Fares (One Way) Fare Amount Multi-Ride Ticket or Monthly Pass Fare Amount
Adult $1.50 Adult
Youth (through age 18) $1.50 15-Ride $20.00
Seniors (65-74 years of age with GCTD I.D or proof of age) $0.75 31-Day Pass $50.00
Medicare (with Medicare Card) $0.75 Youth
Disabled (ADA card or GCTD I.D.) $0.75 15-Ride $15.00
Seniors 75+ (with GCTD I.D or proof of age) Free 31-Day Pass $40.00
Children under 45” tall (when accompanied by paid fare) Free Reduced Fare (Senior/Disabled)
Day Pass (One-Day/Unlimited Boardings) $4.00 15-Ride $10.00
Day Pass for Seniors/Medicare/Disabled $2.00 31-Day Pass $25.00
GCTD ACCESS (Paratransit) FARESCash Fares (One Way) Multi-Ride Ticket or Monthly Pass
ADA Certified or Senior $3.00 Book of Ten Tickets - ADA Certified or Senior $30.00
Senior Nutrition (registered with County program) Donation
Gold Coast Transit District Management’s Discussion and Analysis (Unaudited) (Continued)
For the Year Ended June 30, 2016
12
Financial Operations Highlights Operating revenues decreased 16%, from $4,022,983 in FY 2014-15 to $3,369,769 in FY 2015-16. Fixed route revenues decreased 13.8% as the result of having ceased a program whereby GCTD member jurisdictions provided local fare support ($350,000 in FY 14-15) in exchange or Local Transportation Funds (LTF). Actual fare media sales revenue decreased 4.4%, in line with a 2.8% decrease in boardings. Paratransit revenues decreased 35% as the result of having booked some additional prior year revenue from the Medi-Cal Administrative Activities (MAA) program into FY 2014-15. Actual paratransit fare media sales revenue increased 23%, from a 10.3% increase in boardings and some large year-end fare media orders. GCTD achieved its TDA-mandated minimum fare box recovery ratio of 20% overall or 20% for fixed route and 10% for paratransit. Operating expenses before depreciation increased 6.3% from $19,381,448 to $20,547,884. If we exclude the GASB 68 & 71 adjustments then operating expenditures increased 7.9% from $19,695,493 to $21,252,965. FY 2015-16 operating expenditures were still considerably lower than the approved budget of $22,096,000. The year-to-year increase was driven by:
1. A 10.8% increase in salaries and wages, driven by staffing additions to accommodate the growth of the agency and a 4% wage increase in July 2015 for the second year of a four-year Memorandum of Understanding (MOU) between GCTD and SEIU Local 721. The MOU also included increasing employee pension contributions and decreasing employer pension contributions from (pre-2013) employees by 2% per year for each of the first three years of the contract. GCTD increased the fixed route Revenue Service Hours (RSH) it provides to the public by 1.25%, from 199,418 in FY 2014-15 to 201,905 in FY 2015-16. Operator labor is GCTD’s largest single cost driver, and GCTD’s Operator labor costs increased 7.4% from FY 2014-15 to FY 2015-16.
2. A 3.9% increase in medical benefit contribution costs, resulting from additions to staff as well as a 4%
increase in GCTD’s medical benefit contribution on January 1, 2016 as negotiated in the referenced MOU.
3. A 24% decrease in pension expense, primarily as the result of required GASB 68 & 71 adjustments. It is anticipated that next year these non-cash adjustments will increase GCTD’s pension expense. Excluding these adjustments for both FY 2014-15 and FY 2015-16, pension expense decreased 0.6% in FY 2015-16, the result of increased wages offset by reductions as the result of moving a portion of pension costs from the employer to the employees and an increase in the number of new employees hired into the lower-cost PEPRA CalPERS retirement tier.
4. A 58% increase in insurance costs, primarily the result of substantially increased costs for liability
insurance to cover GCTD’s fleet operations. The transit liability insurance market became much harder over the past two years, and GCTD’s costs as part of the California Transit Indemnity Pool (CalTIP) increased substantially in FY 2015-16 and will do so again in FY 2016-17.
5. A 7.9% increase in the cost for contracted ADA Paratransit service, driven primarily by a 10.2% increase in
ridership.
6. A 79% increase in contracted maintenance repairs and services, primarily the result of increased bus engine overhaul activity and a program to paint and update the graphics on our bus and service vehicle fleet to reflect GCTD’s new colors and logo.
7. An 8.9% increase in repair parts expense, resulting from increased repair activity as our largest fleet, the
26-bus New Flyer fleet, passes its midlife stage. 8. A 75% decrease in legal expenses resulting from an exceptionally light year in terms of legal activity. 9. GCTD’s fleet operates exclusively on compressed natural gas (CNG). Natural gas continue to experience
Gold Coast Transit District Management’s Discussion and Analysis (Unaudited) (Continued)
For the Year Ended June 30, 2016
13
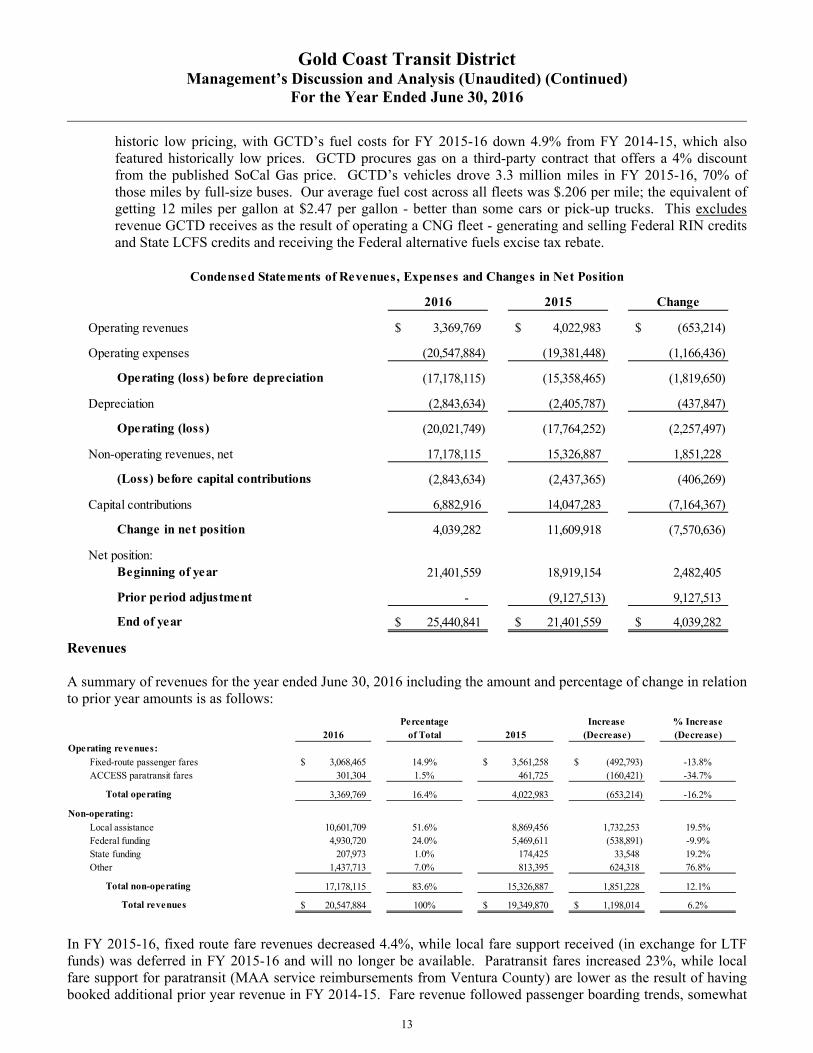
historic low pricing, with GCTD’s fuel costs for FY 2015-16 down 4.9% from FY 2014-15, which also featured historically low prices. GCTD procures gas on a third-party contract that offers a 4% discount from the published SoCal Gas price. GCTD’s vehicles drove 3.3 million miles in FY 2015-16, 70% of those miles by full-size buses. Our average fuel cost across all fleets was $.206 per mile; the equivalent of getting 12 miles per gallon at $2.47 per gallon - better than some cars or pick-up trucks. This excludes revenue GCTD receives as the result of operating a CNG fleet - generating and selling Federal RIN credits and State LCFS credits and receiving the Federal alternative fuels excise tax rebate.
2016 2015 Change
Operating revenues 3,369,769$ 4,022,983$ (653,214)$
Operating expenses (20,547,884) (19,381,448) (1,166,436)
Operating (loss) before depreciation (17,178,115) (15,358,465) (1,819,650)
Depreciation (2,843,634) (2,405,787) (437,847)
Operating (loss) (20,021,749) (17,764,252) (2,257,497)
Non-operating revenues, net 17,178,115 15,326,887 1,851,228
(Loss) before capital contributions (2,843,634) (2,437,365) (406,269)
Capital contributions 6,882,916 14,047,283 (7,164,367)
Change in net position 4,039,282 11,609,918 (7,570,636)
Net position:Beginning of year 21,401,559 18,919,154 2,482,405
Prior period adjustment - (9,127,513) 9,127,513
End of year 25,440,841$ 21,401,559$ 4,039,282$
Condensed Statements of Revenues, Expenses and Changes in Net Position
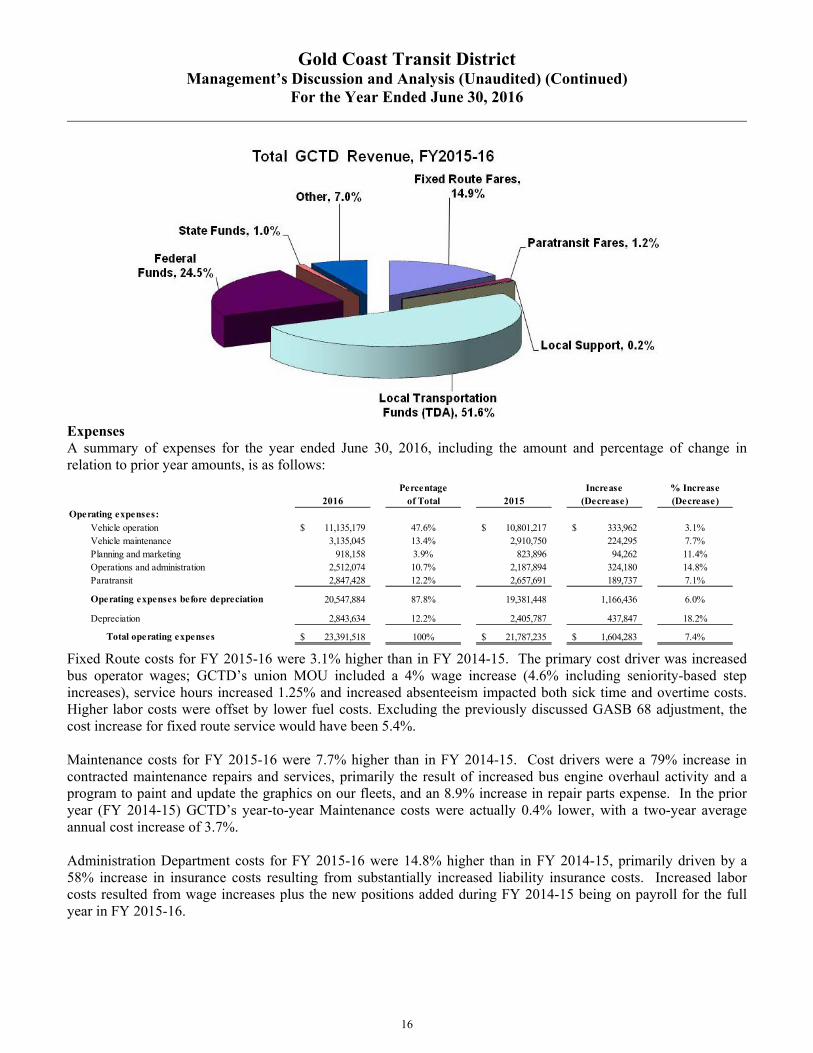
Revenues A summary of revenues for the year ended June 30, 2016 including the amount and percentage of change in relation to prior year amounts is as follows:
Percentage Increase % Increase2016 of Total 2015 (Decrease) (Decrease)
Operating revenues:Fixed-route passenger fares 3,068,465$ 14.9% 3,561,258$ (492,793)$ -13.8%ACCESS paratransit fares 301,304 1.5% 461,725 (160,421) -34.7%
Total operating 3,369,769 16.4% 4,022,983 (653,214) -16.2%
Non-operating:Local assistance 10,601,709 51.6% 8,869,456 1,732,253 19.5%Federal funding 4,930,720 24.0% 5,469,611 (538,891) -9.9%State funding 207,973 1.0% 174,425 33,548 19.2%Other 1,437,713 7.0% 813,395 624,318 76.8%
Total non-operating 17,178,115 83.6% 15,326,887 1,851,228 12.1%
Total revenues 20,547,884$ 100% 19,349,870$ 1,198,014$ 6.2%
In FY 2015-16, fixed route fare revenues decreased 4.4%, while local fare support received (in exchange for LTF funds) was deferred in FY 2015-16 and will no longer be available. Paratransit fares increased 23%, while local fare support for paratransit (MAA service reimbursements from Ventura County) are lower as the result of having booked additional prior year revenue in FY 2014-15. Fare revenue followed passenger boarding trends, somewhat
Gold Coast Transit District Management’s Discussion and Analysis (Unaudited) (Continued)
For the Year Ended June 30, 2016
14
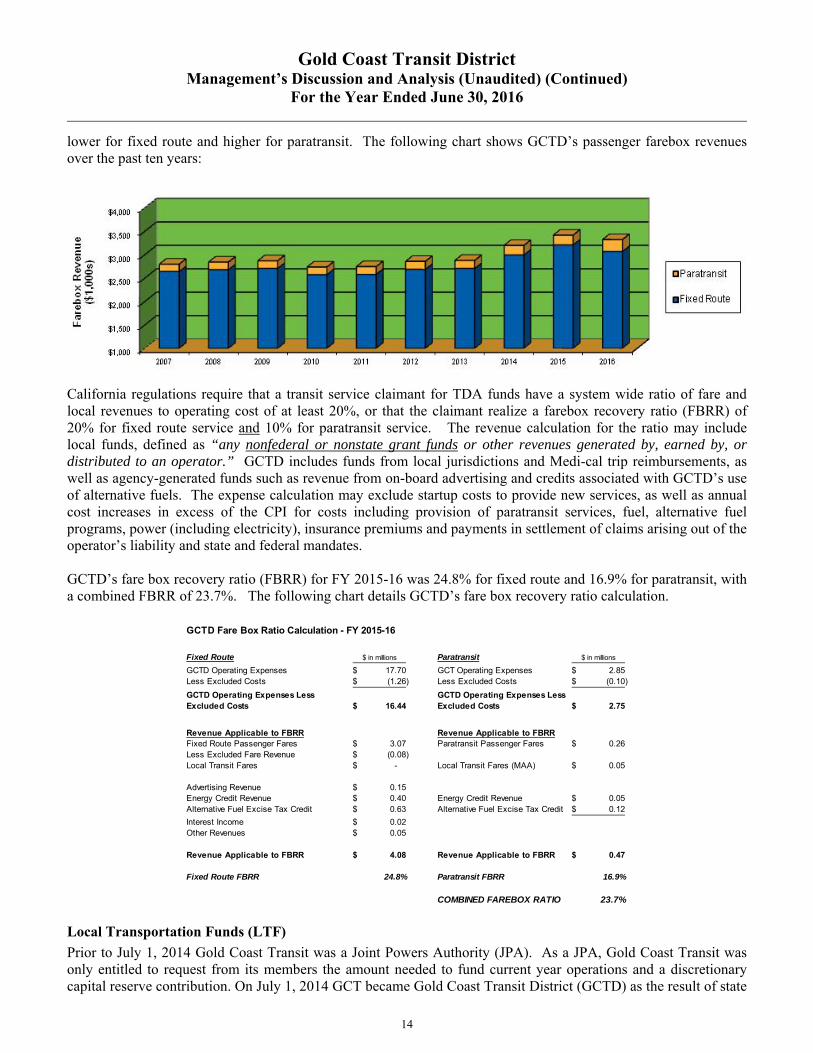
lower for fixed route and higher for paratransit. The following chart shows GCTD’s passenger farebox revenues over the past ten years:
California regulations require that a transit service claimant for TDA funds have a system wide ratio of fare and local revenues to operating cost of at least 20%, or that the claimant realize a farebox recovery ratio (FBRR) of 20% for fixed route service and 10% for paratransit service. The revenue calculation for the ratio may include local funds, defined as “any nonfederal or nonstate grant funds or other revenues generated by, earned by, or distributed to an operator.” GCTD includes funds from local jurisdictions and Medi-cal trip reimbursements, as well as agency-generated funds such as revenue from on-board advertising and credits associated with GCTD’s use of alternative fuels. The expense calculation may exclude startup costs to provide new services, as well as annual cost increases in excess of the CPI for costs including provision of paratransit services, fuel, alternative fuel programs, power (including electricity), insurance premiums and payments in settlement of claims arising out of the operator’s liability and state and federal mandates. GCTD’s fare box recovery ratio (FBRR) for FY 2015-16 was 24.8% for fixed route and 16.9% for paratransit, with a combined FBRR of 23.7%. The following chart details GCTD’s fare box recovery ratio calculation.
Local Transportation Funds (LTF)
Prior to July 1, 2014 Gold Coast Transit was a Joint Powers Authority (JPA). As a JPA, Gold Coast Transit was only entitled to request from its members the amount needed to fund current year operations and a discretionary capital reserve contribution. On July 1, 2014 GCT became Gold Coast Transit District (GCTD) as the result of state
GCTD Fare Box Ratio Calculation - FY 2015-16
Fixed Route $ in millions Paratransit $ in millions
GCTD Operating Expenses 17.70$ GCT Operating Expenses 2.85$ Less Excluded Costs (1.26)$ Less Excluded Costs (0.10)$
GCTD Operating Expenses Less Excluded Costs 16.44$
GCTD Operating Expenses Less Excluded Costs 2.75$
Revenue Applicable to FBRR Revenue Applicable to FBRRFixed Route Passenger Fares 3.07$ Paratransit Passenger Fares 0.26$ Less Excluded Fare Revenue (0.08)$ Local Transit Fares -$ Local Transit Fares (MAA) 0.05$
Advertising Revenue 0.15$ Energy Credit Revenue 0.40$ Energy Credit Revenue 0.05$ Alternative Fuel Excise Tax Credit 0.63$ Alternative Fuel Excise Tax Credit 0.12$
Interest Income 0.02$ Other Revenues 0.05$
Revenue Applicable to FBRR 4.08$ Revenue Applicable to FBRR 0.47$
Fixed Route FBRR 24.8% Paratransit FBRR 16.9%
COMBINED FAREBOX RATIO 23.7%
Gold Coast Transit District Management’s Discussion and Analysis (Unaudited) (Continued)
For the Year Ended June 30, 2016
15
legislation signed by Governor Brown in October 2013. As a District, GCTD is entitled to claim the entire amount of state Local Transportation Funds (LTF) apportioned by population to its member jurisdictions. GCTD’s enabling legislation also allows GCTD members to claim from the district a portion of its LTF funds for transit services (not provided by the District) that the member funds or operates.
For FY 2015-16 GCTD claimed $15,472,479 in LTF funds; of that amount, $10,601,709 was used for current year operations, $2,791,498 was claimed by GCTD’s members for their transit service requirements, $1,657,000 was retained for a deferred contribution to GCTD’s Capital Reserve in FY 2016-17 and the remaining $422,272 was deferred for future operating requirements.
Federal and State Funds
GCTD’s second largest source of operating revenue is the Federal Transit Administration (FTA). In FY 2015-16, GCTD expended $3,742,700 in Section 5307 grant funds for operating revenue purposes and $1,188,020 in CMAQ and JARC funds to defray the cost of adding new service and spare parts for our new CMAQ-funded bus fleet. In FY 2015-16 GCTD’s new federal grants were delayed by a combination of FTA’s computer system conversion and the conflict between the State of California and the U.S. Department of Labor of the applicability of California’s PEPRA pension reform to transit employees. These issues have been resolved and GCTD executed the largest of these long-delayed grants before the October 1st Federal year-end system shutdown.
GCTD also receives State Transportation Assistance (STA). In FY 2015-16 GCTD received $184,928 in STA funds. Allocation of remaining FY 2015-16 STA funds was frozen during much of FY 2015-16 by an action initiated by the State Controller’s Office (SCO) that proposed to change the methodology of the STA funding formula. This was recently resolved when Governor Brown signed SB 838, which directed the SCO to temporarily return to the long-understood methodology for allocating any unallocated STA funding in FY 2015-16, and for all funds to be allocated in FY 2016-17 and FY 2017-18.
Other Revenue
Advertising Income - GCTD has been selling commercial bus advertising since FY 2006-07, and continues to attract advertising contracts from both local and national entities. In FY 2015-16, GCTD generated $153,164 in advertising revenues; this is the lowest advertising revenue level in six years as a result of having lost our largest advertising customer at the beginning of the fiscal year. GCTD anticipates a gradual recovery to previous revenue levels.
Medi-Cal Reimbursement - GCTD receives through Ventura County Public Health partial reimbursement under the Medi-Cal Administrative Activities (MAA) program for providing Medi-Cal eligible trips on the GCTD ACCESS service. Funding is based on establishing eligibility on a trip-by-trip basis and is received in arrears. In FY 2015-16 GCTD realized $46,547 from this program; this is lower than in FY 2014-15 because additional prior year funds were booked in FY 2014-15. GCTD anticipates reimbursements from this program will typically exceed $100,000 per year.
Energy Credit Revenue - Commencing in FY 2014-15 GCTD generates and sells both Low Carbon Fuel Standard (LCFS) credits (State of California) and Renewable Identification Number (RIN) credits (U.S. EPA) from its use of natural gas to fuel the fleet. In FY 2015-16 GCTD realized $292,366 from the first full year of this program. This was considerably higher than our forecast. GCTD budgeted for additional modest growth in the value of LCFS credits, however this market is volatile and we have seen some pullback during the first quarter of FY 2016-17. To this point the value of Federal RIN credits have remained high.
Interest and Other Income - Interest is earned on temporary investments with the State of California Local Agency Investment Fund (LAIF) and on money market funds held at Union Bank. GCTD earned $15,815 in interest in FY 2015-16. Other income consists primarily of the sale of miscellaneous surplus property and is largely unanticipated activity. GCTD earned $54,938 in other income in FY 2015-16.
The following chart shows the major sources of operating and non-operating revenues for the year ended June 30, 2016, as a percentage of total revenues.
Gold Coast Transit District Management’s Discussion and Analysis (Unaudited) (Continued)
For the Year Ended June 30, 2016
16
Expenses A summary of expenses for the year ended June 30, 2016, including the amount and percentage of change in relation to prior year amounts, is as follows:
Percentage Increase % Increase2016 of Total 2015 (Decrease) (Decrease)
Operating expenses:Vehicle operation 11,135,179$ 47.6% 10,801,217$ 333,962$ 3.1%Vehicle maintenance 3,135,045 13.4% 2,910,750 224,295 7.7%Planning and marketing 918,158 3.9% 823,896 94,262 11.4%Operations and administration 2,512,074 10.7% 2,187,894 324,180 14.8%Paratransit 2,847,428 12.2% 2,657,691 189,737 7.1%
Operating expenses before depreciation 20,547,884 87.8% 19,381,448 1,166,436 6.0%
Depreciation 2,843,634 12.2% 2,405,787 437,847 18.2%
Total operating expenses 23,391,518$ 100% 21,787,235$ 1,604,283$ 7.4%
Fixed Route costs for FY 2015-16 were 3.1% higher than in FY 2014-15. The primary cost driver was increased bus operator wages; GCTD’s union MOU included a 4% wage increase (4.6% including seniority-based step increases), service hours increased 1.25% and increased absenteeism impacted both sick time and overtime costs. Higher labor costs were offset by lower fuel costs. Excluding the previously discussed GASB 68 adjustment, the cost increase for fixed route service would have been 5.4%. Maintenance costs for FY 2015-16 were 7.7% higher than in FY 2014-15. Cost drivers were a 79% increase in contracted maintenance repairs and services, primarily the result of increased bus engine overhaul activity and a program to paint and update the graphics on our fleets, and an 8.9% increase in repair parts expense. In the prior year (FY 2014-15) GCTD’s year-to-year Maintenance costs were actually 0.4% lower, with a two-year average annual cost increase of 3.7%. Administration Department costs for FY 2015-16 were 14.8% higher than in FY 2014-15, primarily driven by a 58% increase in insurance costs resulting from substantially increased liability insurance costs. Increased labor costs resulted from wage increases plus the new positions added during FY 2014-15 being on payroll for the full year in FY 2015-16.
Gold Coast Transit District Management’s Discussion and Analysis (Unaudited) (Continued)
For the Year Ended June 30, 2016
17
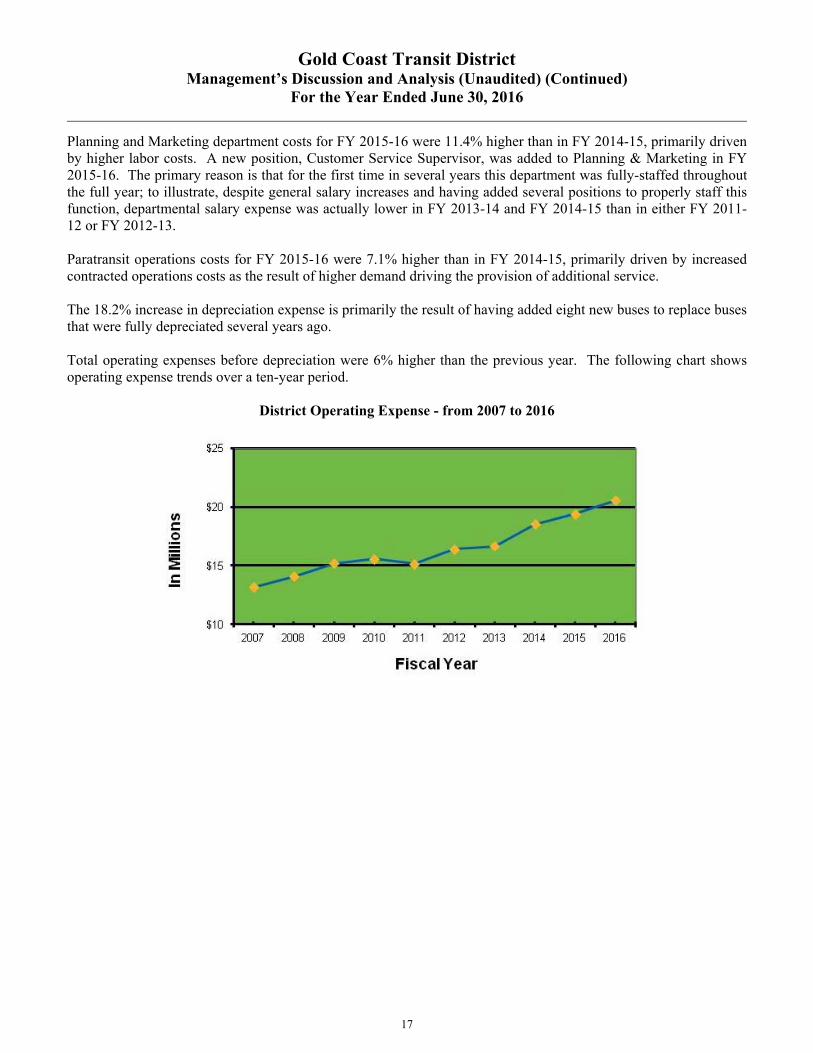
Planning and Marketing department costs for FY 2015-16 were 11.4% higher than in FY 2014-15, primarily driven by higher labor costs. A new position, Customer Service Supervisor, was added to Planning & Marketing in FY 2015-16. The primary reason is that for the first time in several years this department was fully-staffed throughout the full year; to illustrate, despite general salary increases and having added several positions to properly staff this function, departmental salary expense was actually lower in FY 2013-14 and FY 2014-15 than in either FY 2011-12 or FY 2012-13. Paratransit operations costs for FY 2015-16 were 7.1% higher than in FY 2014-15, primarily driven by increased contracted operations costs as the result of higher demand driving the provision of additional service. The 18.2% increase in depreciation expense is primarily the result of having added eight new buses to replace buses that were fully depreciated several years ago. Total operating expenses before depreciation were 6% higher than the previous year. The following chart shows operating expense trends over a ten-year period.
District Operating Expense - from 2007 to 2016
Gold Coast Transit District Management’s Discussion and Analysis (Unaudited) (Continued)
For the Year Ended June 30, 2016
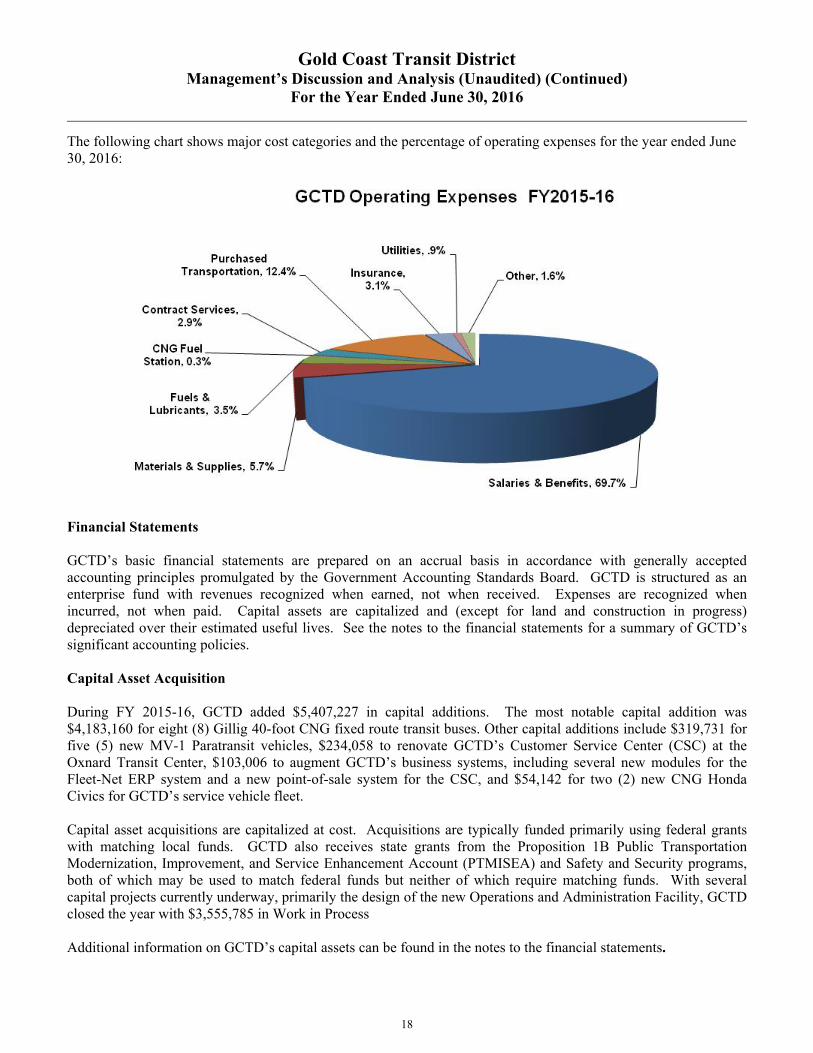
18
The following chart shows major cost categories and the percentage of operating expenses for the year ended June 30, 2016:
Financial Statements GCTD’s basic financial statements are prepared on an accrual basis in accordance with generally accepted accounting principles promulgated by the Government Accounting Standards Board. GCTD is structured as an enterprise fund with revenues recognized when earned, not when received. Expenses are recognized when incurred, not when paid. Capital assets are capitalized and (except for land and construction in progress) depreciated over their estimated useful lives. See the notes to the financial statements for a summary of GCTD’s significant accounting policies. Capital Asset Acquisition During FY 2015-16, GCTD added $5,407,227 in capital additions. The most notable capital addition was $4,183,160 for eight (8) Gillig 40-foot CNG fixed route transit buses. Other capital additions include $319,731 for five (5) new MV-1 Paratransit vehicles, $234,058 to renovate GCTD’s Customer Service Center (CSC) at the Oxnard Transit Center, $103,006 to augment GCTD’s business systems, including several new modules for the Fleet-Net ERP system and a new point-of-sale system for the CSC, and $54,142 for two (2) new CNG Honda Civics for GCTD’s service vehicle fleet. Capital asset acquisitions are capitalized at cost. Acquisitions are typically funded primarily using federal grants with matching local funds. GCTD also receives state grants from the Proposition 1B Public Transportation Modernization, Improvement, and Service Enhancement Account (PTMISEA) and Safety and Security programs, both of which may be used to match federal funds but neither of which require matching funds. With several capital projects currently underway, primarily the design of the new Operations and Administration Facility, GCTD closed the year with $3,555,785 in Work in Process Additional information on GCTD’s capital assets can be found in the notes to the financial statements.
Gold Coast Transit District Management’s Discussion and Analysis (Unaudited) (Continued)
For the Year Ended June 30, 2016
19
Economic and Strategic Factors GCTD has now completed two full years as a Transit District, having been formed as the successor to GCT joint powers authority (JPA) agency effective July 1, 2014. The economic outlook for California public transit seems promising. Local Transportation Funds, GCTD’s most important funding source, have now stabilized following the economic recession. In December 2015, the Federal government passed the Fixing America's Surface Transportation Act, or "FAST Act." The FAST Act is the first new transit funding authorization legislation in over ten years. It provides a modest increase in federal transit funding and most importantly, long-term funding certainty to the industry. State cap-and-trade funding programs have provided another potential funding source for transit projects, and the California legislature continues to steadily work on bills (ABX-1 26, SBX-1 1) to provide new revenue streams to support public transportation. Locally Ventura County voters will have the opportunity in November 2016 to pass Measure AA, a one-half cent sales tax to fund needed transportation improvements. GCTD looks ahead toward an exciting future. GCTD anticipates starting construction on its new Operations and Administration facility, located on a 15-acre site in North Oxnard, on the corner of Auto Center Drive and Paseo Mercado, before the end of 2016. GCTD accumulated over $26 million in direct grant funds for the project, and has been working with the California Transit Finance Corporation (CTFC) to issue Certificates of Participation (COPs) to provide the remaining funds. In August 2016 Moody’s assigned a rating of A2 to GCTD’s proposed COP issue. GCTD continues to benefit from low natural gas commodity prices resulting from GCTD’s use of compressed natural gas (CNG) for all of its bus and paratransit fleet and most of its service vehicles. GCTD owns and operates its compression station. GCTD contracts with GHI Energy, a third-party provider that provides GCTD renewable natural gas at a discount from the published SoCal Gas commodity price and administers GCTD’s sale of Low Carbon Fuel Standard (LCFS) credits (State of California) and Renewable Identification Number (RIN) credits (U.S. EPA) generated from its use of renewable natural gas. By mid-year of FY 2016-17 GCTD’s oldest eleven (11) fixed route buses will have been retired over an eighteen month period, replaced by thirteen (13) new 40-foot Gillig CNG buses paid for with a combination of federal and state grant funds to cover 100% of the cost. The last five of these new buses are scheduled to be delivered to GCTD in October 2016. Additionally, GCTD is in the process of replacing all twenty-four (24) vehicles in the ACCESS paratransit fleet, all in service well beyond their minimum useful life, using state grant funds to cover 100% of the cost. The replacement will take place over three years. GCTD has taken delivery of thirteen MV-1 paratransit vans and the GCTD Board recently authorized the purchase of eight (8) Starcraft cutaway vans. From a labor perspective, GCTD has in place a Memorandum of Understanding (MOU) with Service Employees International Union (SEIU) Local 721, which represents approximately 80% of GCTD’s employees, providing labor cost certainty through November 2017. GCTD has historically carried no long-term debt and has fully-funded it’s relatively modest other post-employment benefits (OPEB) obligations by participating in the California Employers' Retiree Benefit Trust Fund (CERBT). GCTD ended FY 2015-16 with a capital reserve in excess of $6.4 million, with another $1.66 million committed to the capital reserve as soon as a large Federal grants receivable is resolved. The District has maintained a solid cash flow position for many years, backed up by a one million dollar line of credit with MUFG Union Bank from which GCTD has never needed to draw. GCTD’s debt-free status will be changing in FY 2016-17 as the District is authorized and prepared to enter into an agreement with the California Transit Finance Corporation (CTFC) to issue up to $22 million in Certificates of Participation (COPs) to fund the construction of its new Operations and Administration Facility. This is anticipated to occur before the end of calendar 2016. GCTD enters this new era in a relatively strong financial position.
Gold Coast Transit District Management’s Discussion and Analysis (Unaudited) (Continued)
For the Year Ended June 30, 2016
20
Economic and Strategic Factors (Continued) GCTD anticipates that the demand for transit services in western Ventura County will continue to increase. GCTD’s fixed route boardings decreased from the previous year in FY 2015-16, partly in response to sharply lower gas prices; however this was still the third highest ridership year in our history (behind the past two years). Throughout its history, GCTD (and its predecessor agencies GCT and SCAT) has been constrained from growth by the limitations of both its revenue and its facility. Increased revenue, primarily from access to additional LTF funds as a District, has allowed GCTD to proceed with debt funding to complete a new facility to prepare for future growth. Without new or additional revenue sources GCTD will be challenged to increase the level of service we are now able to provide to the people of Western Ventura County. GCTD actively pursues all relevant grant opportunities; however discretionary grants do not provide recurring revenue. GCTD has undertaken several initiatives to increase revenues, such as on-board advertising sales, reimbursement for Medi-Cal eligible paratransit transportation and the generation and sale of low carbon fuel standard and renewal fuel (RIN) credits. GCTD will continue to aggressively seek revenue opportunities from initiatives such as these; they are increasingly important but are not of the scale necessary to impact the growing imbalance between transit demand and transit funding in our service area. Ventura County is the most populated county in California that does not have a dedicated transportation tax. On November 8, 2016, Ventura County voters will decide whether to support Measure AA, a one-half cent sales tax to support the County’s transportation infrastructure, including local streets and roads, freeway improvements to the 101 and 118, port/military access & goods movement, environmental preservation, bus transit, commuter rail and bicycle & pedestrian programs. The expansion and improvement of Ventura County’s transportation infrastructure has for many years been searching for an increased commitment from our citizens. A substantial recurring revenue source such as this would have a positive impact on GCTD’s financial position. Requests for Information This financial report is designed to provide GCTD’s members, customers, stakeholders and other interested parties with an overview of GCTD’s financial operations and financial condition. Should the reader have questions regarding the information included in this report or wish to request additional financial information, please contact Steve Rosenberg, Director of Finance and Administration, at Gold Coast Transit District, 301 E. Third St., Oxnard, California, 93030-6048.
21
BASIC FINANCIAL STATEMENTS

22
This page intentionally left blank
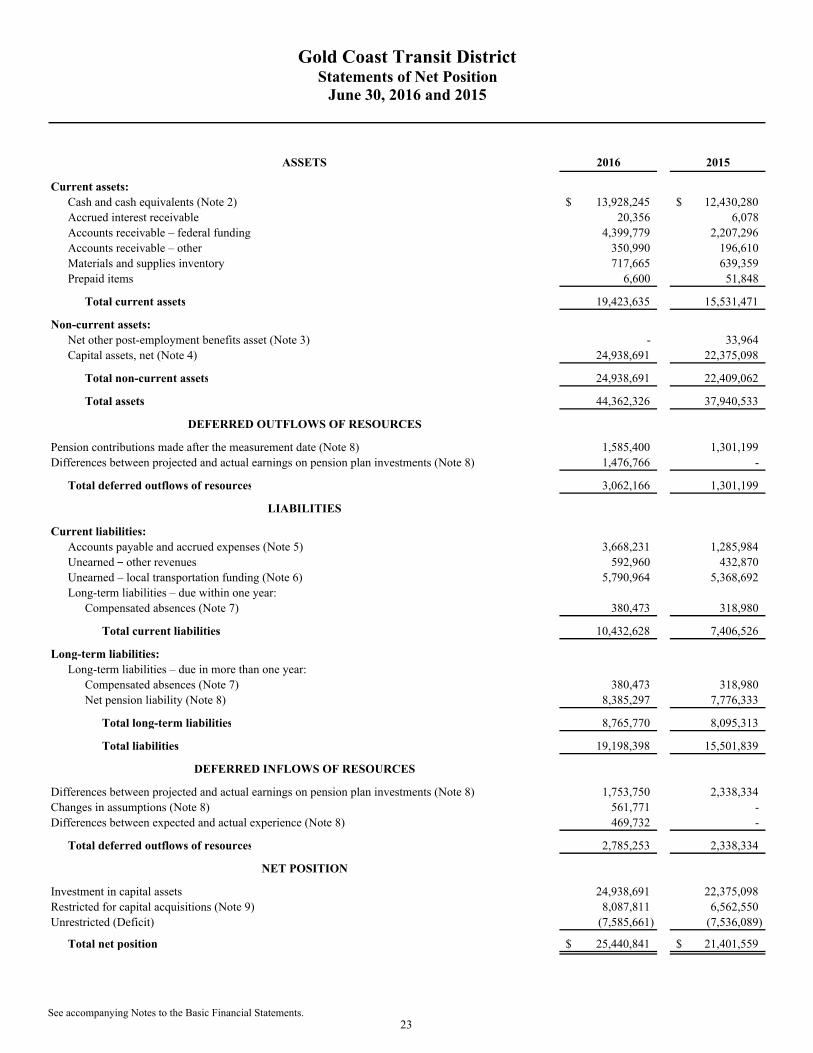
2016 2015
Current assets:Cash and cash equivalents (Note 2) 13,928,245$ 12,430,280$ Accrued interest receivable 20,356 6,078 Accounts receivable – federal funding 4,399,779 2,207,296 Accounts receivable – other 350,990 196,610 Materials and supplies inventory 717,665 639,359 Prepaid items 6,600 51,848
Total current assets 19,423,635 15,531,471
Non-current assets:Net other post-employment benefits asset (Note 3) - 33,964 Capital assets, net (Note 4) 24,938,691 22,375,098
Total non-current assets 24,938,691 22,409,062
Total assets 44,362,326 37,940,533
Pension contributions made after the measurement date (Note 8) 1,585,400 1,301,199 Differences between projected and actual earnings on pension plan investments (Note 8) 1,476,766 -
Total deferred outflows of resources 3,062,166 1,301,199
Current liabilities:Accounts payable and accrued expenses (Note 5) 3,668,231 1,285,984 Unearned – other revenues 592,960 432,870 Unearned – local transportation funding (Note 6) 5,790,964 5,368,692 Long-term liabilities – due within one year:
Compensated absences (Note 7) 380,473 318,980
Total current liabilities 10,432,628 7,406,526
Long-term liabilities:Long-term liabilities – due in more than one year:
Compensated absences (Note 7) 380,473 318,980 Net pension liability (Note 8) 8,385,297 7,776,333
Total long-term liabilities 8,765,770 8,095,313
Total liabilities 19,198,398 15,501,839
Differences between projected and actual earnings on pension plan investments (Note 8) 1,753,750 2,338,334 Changes in assumptions (Note 8) 561,771 - Differences between expected and actual experience (Note 8) 469,732 -
Total deferred outflows of resources 2,785,253 2,338,334
Investment in capital assets 24,938,691 22,375,098 Restricted for capital acquisitions (Note 9) 8,087,811 6,562,550 Unrestricted (Deficit) (7,585,661) (7,536,089)
Total net position 25,440,841$ 21,401,559$
DEFERRED INFLOWS OF RESOURCES
NET POSITION
LIABILITIES
Gold Coast Transit DistrictStatements of Net Position
June 30, 2016 and 2015
ASSETS
DEFERRED OUTFLOWS OF RESOURCES
See accompanying Notes to the Basic Financial Statements.23
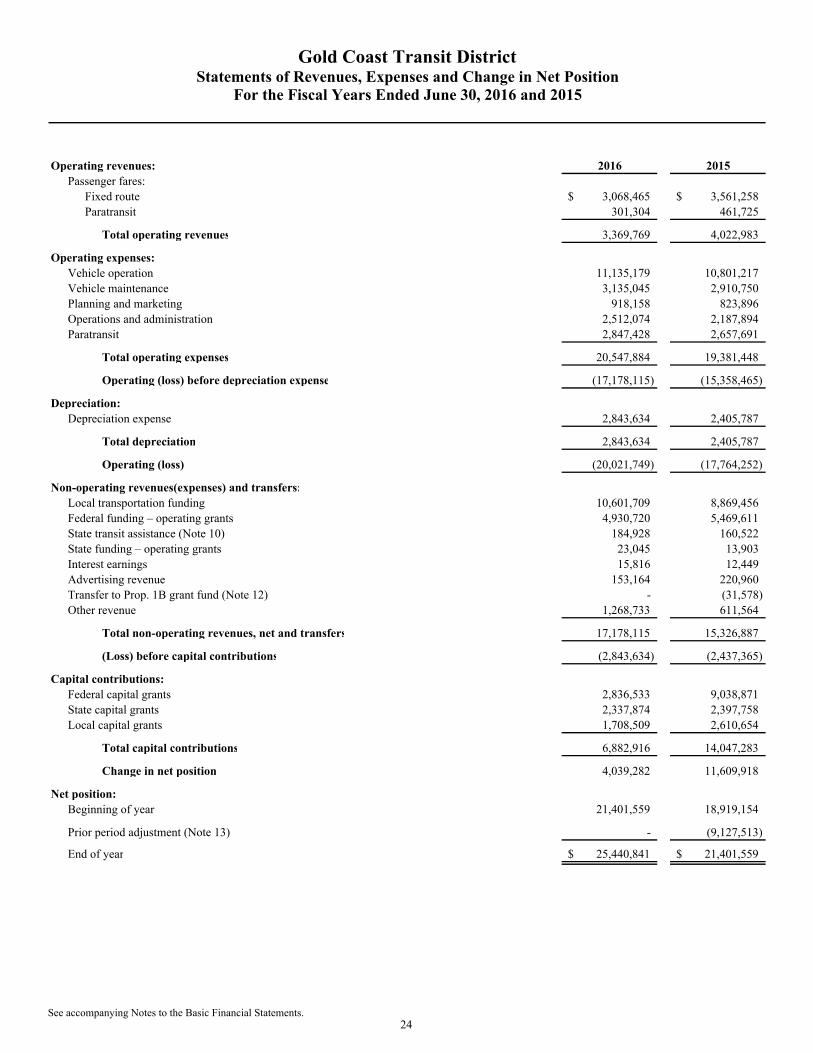
Operating revenues: 2016 2015Passenger fares:
Fixed route 3,068,465$ 3,561,258$ Paratransit 301,304 461,725
Total operating revenues 3,369,769 4,022,983
Operating expenses:Vehicle operation 11,135,179 10,801,217 Vehicle maintenance 3,135,045 2,910,750 Planning and marketing 918,158 823,896 Operations and administration 2,512,074 2,187,894 Paratransit 2,847,428 2,657,691
Total operating expenses 20,547,884 19,381,448
Operating (loss) before depreciation expense (17,178,115) (15,358,465)
Depreciation:Depreciation expense 2,843,634 2,405,787
Total depreciation 2,843,634 2,405,787
Operating (loss) (20,021,749) (17,764,252)
Non-operating revenues(expenses) and transfers:Local transportation funding 10,601,709 8,869,456 Federal funding – operating grants 4,930,720 5,469,611 State transit assistance (Note 10) 184,928 160,522 State funding – operating grants 23,045 13,903 Interest earnings 15,816 12,449 Advertising revenue 153,164 220,960 Transfer to Prop. 1B grant fund (Note 12) - (31,578) Other revenue 1,268,733 611,564
Total non-operating revenues, net and transfers 17,178,115 15,326,887
(Loss) before capital contributions (2,843,634) (2,437,365)
Capital contributions:Federal capital grants 2,836,533 9,038,871 State capital grants 2,337,874 2,397,758 Local capital grants 1,708,509 2,610,654
Total capital contributions 6,882,916 14,047,283
Change in net position 4,039,282 11,609,918
Net position:Beginning of year 21,401,559 18,919,154
Prior period adjustment (Note 13) - (9,127,513)
End of year 25,440,841$ 21,401,559$
Gold Coast Transit DistrictStatements of Revenues, Expenses and Change in Net Position
For the Fiscal Years Ended June 30, 2016 and 2015
See accompanying Notes to the Basic Financial Statements.24

This page intentionally left blank
25
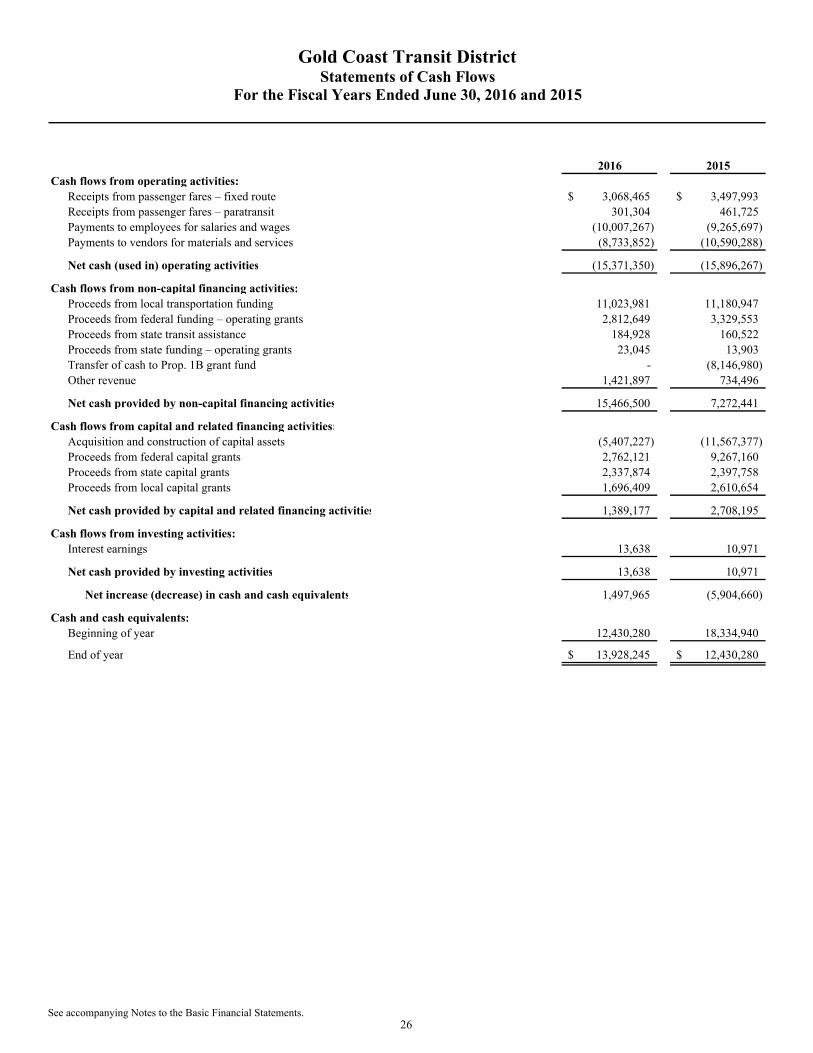
2016 2015Cash flows from operating activities:
Receipts from passenger fares – fixed route 3,068,465$ 3,497,993$ Receipts from passenger fares – paratransit 301,304 461,725 Payments to employees for salaries and wages (10,007,267) (9,265,697) Payments to vendors for materials and services (8,733,852) (10,590,288)
Net cash (used in) operating activities (15,371,350) (15,896,267)
Cash flows from non-capital financing activities:Proceeds from local transportation funding 11,023,981 11,180,947 Proceeds from federal funding – operating grants 2,812,649 3,329,553 Proceeds from state transit assistance 184,928 160,522 Proceeds from state funding – operating grants 23,045 13,903 Transfer of cash to Prop. 1B grant fund - (8,146,980) Other revenue 1,421,897 734,496
Net cash provided by non-capital financing activities 15,466,500 7,272,441
Cash flows from capital and related financing activities:Acquisition and construction of capital assets (5,407,227) (11,567,377) Proceeds from federal capital grants 2,762,121 9,267,160 Proceeds from state capital grants 2,337,874 2,397,758 Proceeds from local capital grants 1,696,409 2,610,654
Net cash provided by capital and related financing activities 1,389,177 2,708,195
Cash flows from investing activities:Interest earnings 13,638 10,971
Net cash provided by investing activities 13,638 10,971
Net increase (decrease) in cash and cash equivalents 1,497,965 (5,904,660)
Cash and cash equivalents:Beginning of year 12,430,280 18,334,940
End of year 13,928,245$ 12,430,280$
Gold Coast Transit DistrictStatements of Cash Flows
For the Fiscal Years Ended June 30, 2016 and 2015
See accompanying Notes to the Basic Financial Statements.26
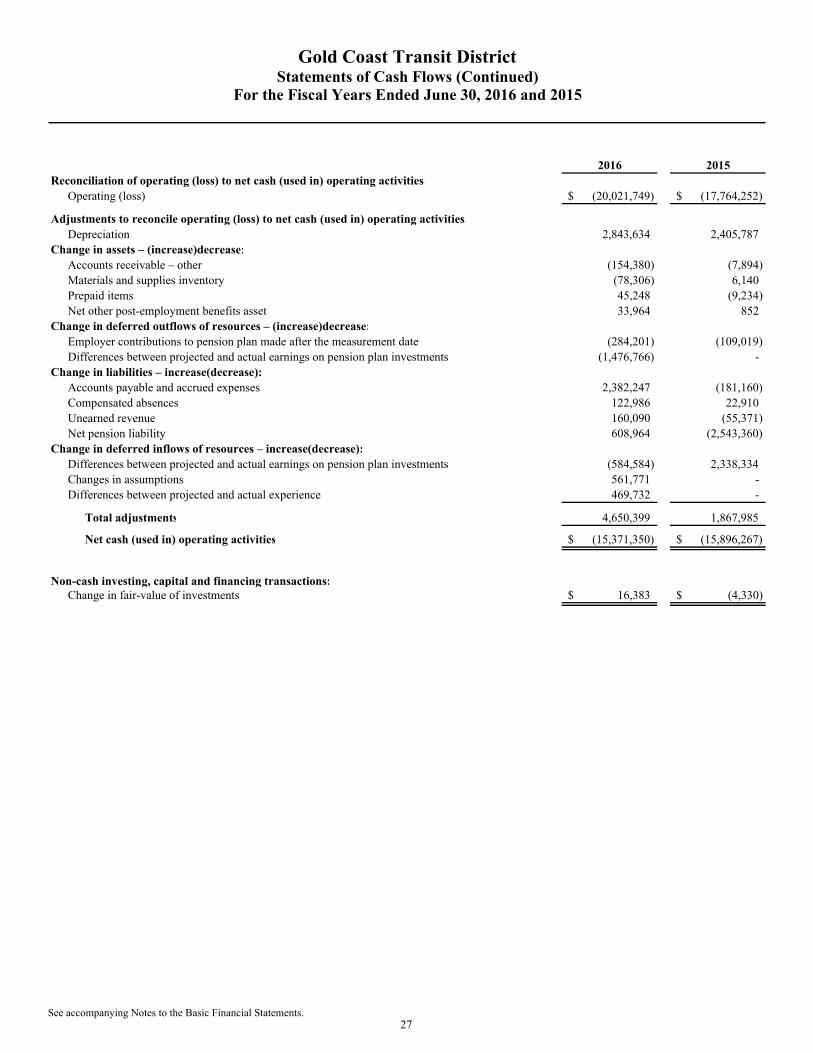
2016 2015Reconciliation of operating (loss) to net cash (used in) operating activities:
Operating (loss) (20,021,749)$ (17,764,252)$
Adjustments to reconcile operating (loss) to net cash (used in) operating activities:Depreciation 2,843,634 2,405,787
Change in assets – (increase)decrease:Accounts receivable – other (154,380) (7,894) Materials and supplies inventory (78,306) 6,140 Prepaid items 45,248 (9,234) Net other post-employment benefits asset 33,964 852
Change in deferred outflows of resources – (increase)decrease:Employer contributions to pension plan made after the measurement date (284,201) (109,019) Differences between projected and actual earnings on pension plan investments (1,476,766) -
Change in liabilities – increase(decrease):Accounts payable and accrued expenses 2,382,247 (181,160) Compensated absences 122,986 22,910 Unearned revenue 160,090 (55,371) Net pension liability 608,964 (2,543,360)
Change in deferred inflows of resources – increase(decrease):Differences between projected and actual earnings on pension plan investments (584,584) 2,338,334 Changes in assumptions 561,771 - Differences between projected and actual experience 469,732 -
Total adjustments 4,650,399 1,867,985
Net cash (used in) operating activities (15,371,350)$ (15,896,267)$
Non-cash investing, capital and financing transactions:Change in fair-value of investments 16,383$ (4,330)$
Gold Coast Transit DistrictStatements of Cash Flows (Continued)
For the Fiscal Years Ended June 30, 2016 and 2015
See accompanying Notes to the Basic Financial Statements.27
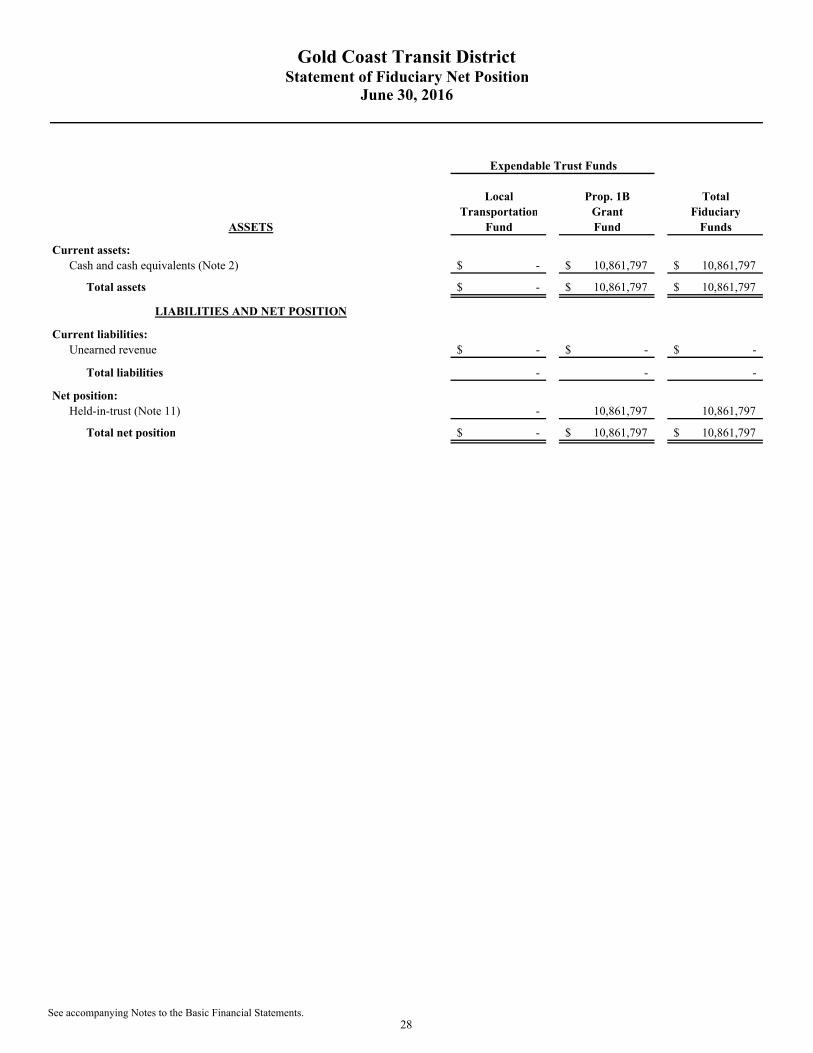
Local Prop. 1B TotalTransportation Grant Fiduciary
Fund Fund Funds
Current assets:Cash and cash equivalents (Note 2) -$ 10,861,797$ 10,861,797$
Total assets -$ 10,861,797$ 10,861,797$
Current liabilities:Unearned revenue -$ -$ -$
Total liabilities - - -
Net position:Held-in-trust (Note 11) - 10,861,797 10,861,797
Total net position -$ 10,861,797$ 10,861,797$
Expendable Trust Funds
ASSETS
LIABILITIES AND NET POSITION
Gold Coast Transit DistrictStatement of Fiduciary Net Position
June 30, 2016
See accompanying Notes to the Basic Financial Statements.28
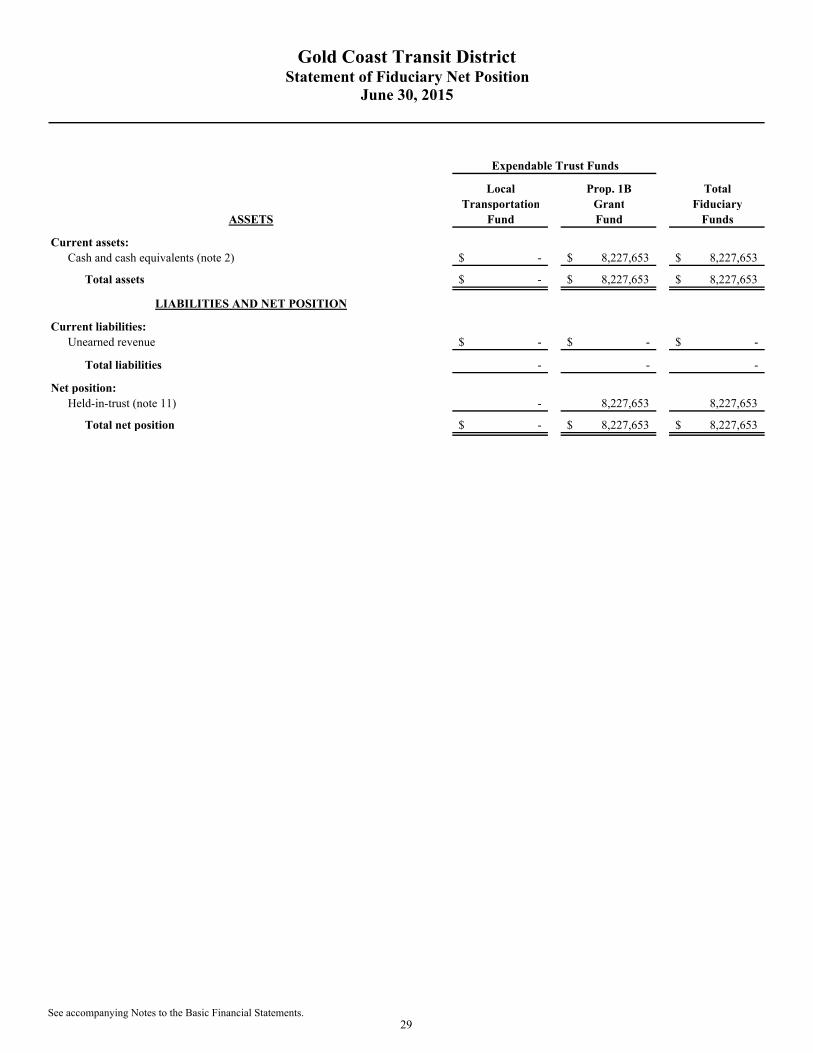
Local Prop. 1B TotalTransportation Grant Fiduciary
Fund Fund Funds
Current assets:Cash and cash equivalents (note 2) -$ 8,227,653$ 8,227,653$
Total assets -$ 8,227,653$ 8,227,653$
Current liabilities:Unearned revenue -$ -$ -$
Total liabilities - - -
Net position:Held-in-trust (note 11) - 8,227,653 8,227,653
Total net position -$ 8,227,653$ 8,227,653$
LIABILITIES AND NET POSITION
Gold Coast Transit DistrictStatement of Fiduciary Net Position
June 30, 2015
Expendable Trust Funds
ASSETS
See accompanying Notes to the Basic Financial Statements.29
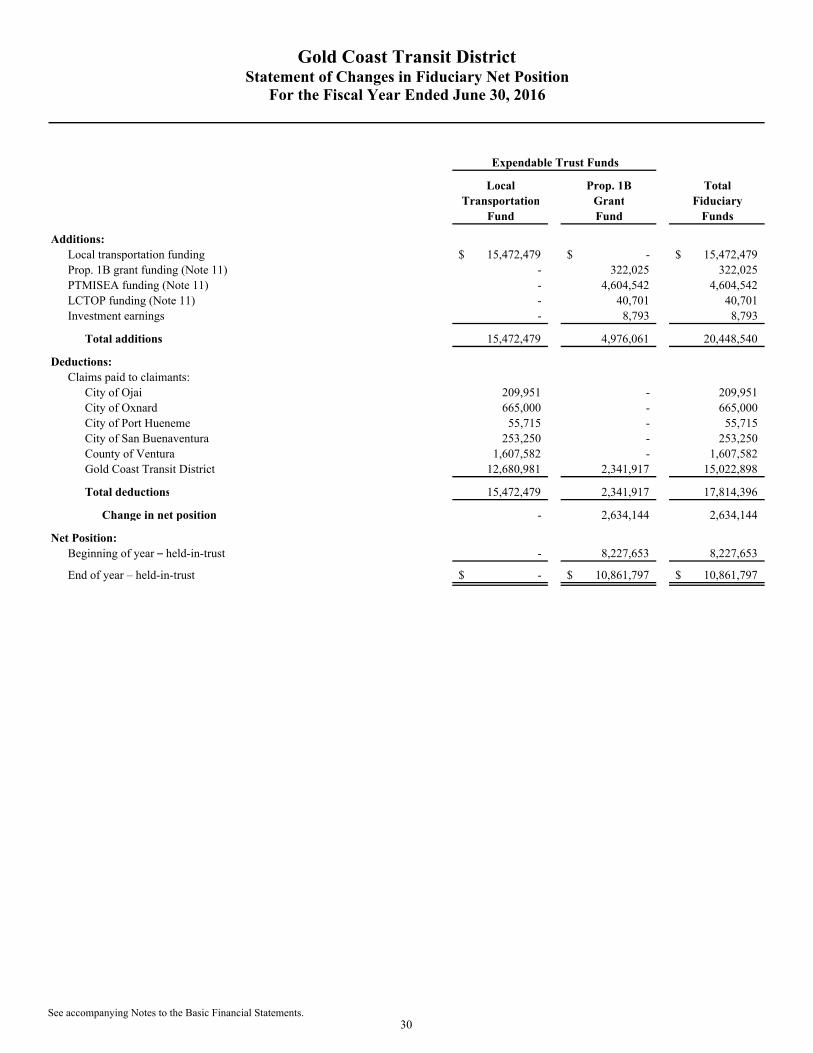
Local Prop. 1B TotalTransportation Grant Fiduciary
Fund Fund Funds
Additions:Local transportation funding 15,472,479$ -$ 15,472,479$ Prop. 1B grant funding (Note 11) - 322,025 322,025 PTMISEA funding (Note 11) - 4,604,542 4,604,542 LCTOP funding (Note 11) - 40,701 40,701 Investment earnings - 8,793 8,793
Total additions 15,472,479 4,976,061 20,448,540
Deductions:Claims paid to claimants:
City of Ojai 209,951 - 209,951 City of Oxnard 665,000 - 665,000 City of Port Hueneme 55,715 - 55,715 City of San Buenaventura 253,250 - 253,250 County of Ventura 1,607,582 - 1,607,582 Gold Coast Transit District 12,680,981 2,341,917 15,022,898
Total deductions 15,472,479 2,341,917 17,814,396
Change in net position - 2,634,144 2,634,144
Net Position:Beginning of year – held-in-trust - 8,227,653 8,227,653
End of year – held-in-trust -$ 10,861,797$ 10,861,797$
Expendable Trust Funds
Gold Coast Transit DistrictStatement of Changes in Fiduciary Net Position
For the Fiscal Year Ended June 30, 2016
See accompanying Notes to the Basic Financial Statements.30
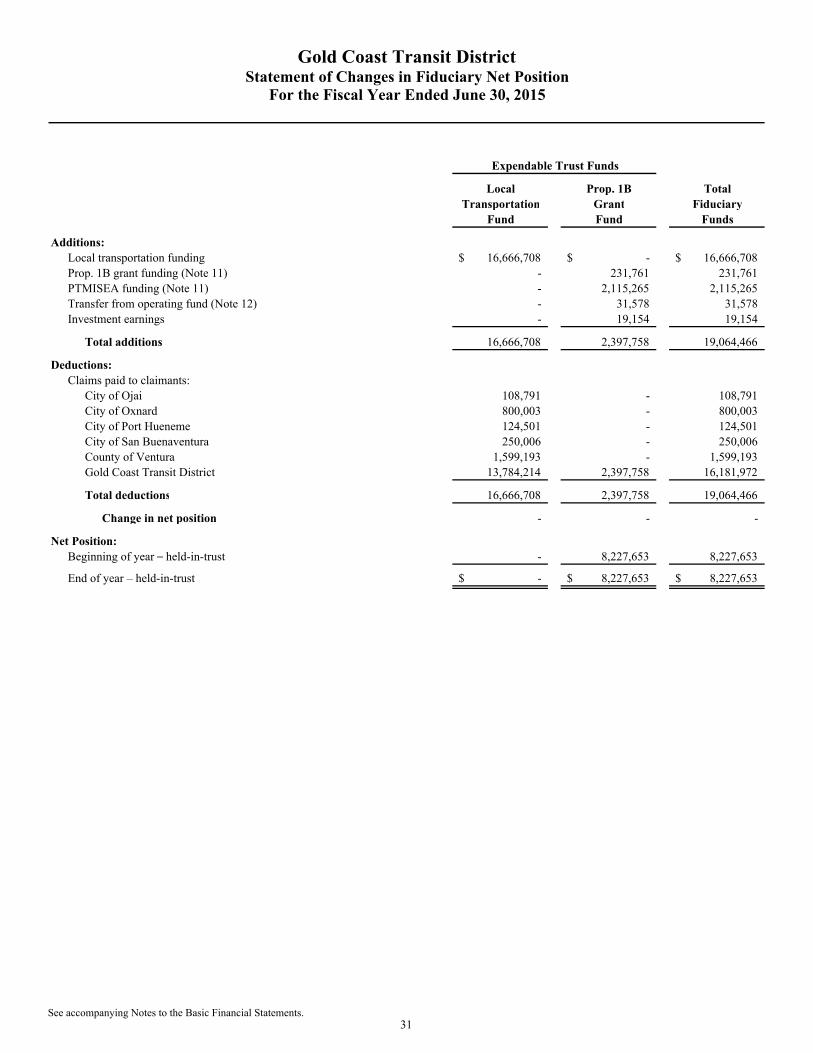
Local Prop. 1B TotalTransportation Grant Fiduciary
Fund Fund Funds
Additions:Local transportation funding 16,666,708$ -$ 16,666,708$ Prop. 1B grant funding (Note 11) - 231,761 231,761 PTMISEA funding (Note 11) - 2,115,265 2,115,265 Transfer from operating fund (Note 12) - 31,578 31,578 Investment earnings - 19,154 19,154
Total additions 16,666,708 2,397,758 19,064,466
Deductions:Claims paid to claimants:
City of Ojai 108,791 - 108,791 City of Oxnard 800,003 - 800,003 City of Port Hueneme 124,501 - 124,501 City of San Buenaventura 250,006 - 250,006 County of Ventura 1,599,193 - 1,599,193 Gold Coast Transit District 13,784,214 2,397,758 16,181,972
Total deductions 16,666,708 2,397,758 19,064,466
Change in net position - - -
Net Position:Beginning of year – held-in-trust - 8,227,653 8,227,653
End of year – held-in-trust -$ 8,227,653$ 8,227,653$
Gold Coast Transit DistrictStatement of Changes in Fiduciary Net Position
For the Fiscal Year Ended June 30, 2015
Expendable Trust Funds
See accompanying Notes to the Basic Financial Statements.31

This page intentionally left blank
32
33
NOTES TO THE FINANCIAL STATEMENTS

34
This page intentionally left blank
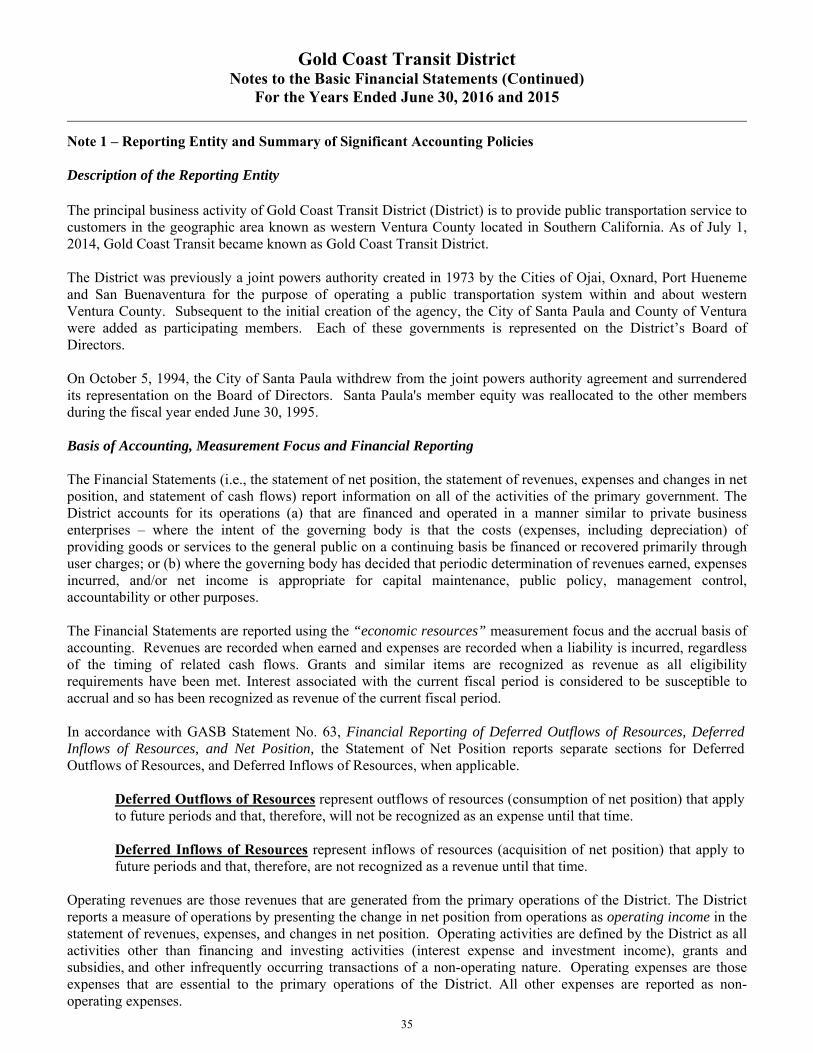
Gold Coast Transit District Notes to the Basic Financial Statements (Continued)
For the Years Ended June 30, 2016 and 2015
35
Note 1 – Reporting Entity and Summary of Significant Accounting Policies Description of the Reporting Entity The principal business activity of Gold Coast Transit District (District) is to provide public transportation service to customers in the geographic area known as western Ventura County located in Southern California. As of July 1, 2014, Gold Coast Transit became known as Gold Coast Transit District. The District was previously a joint powers authority created in 1973 by the Cities of Ojai, Oxnard, Port Hueneme and San Buenaventura for the purpose of operating a public transportation system within and about western Ventura County. Subsequent to the initial creation of the agency, the City of Santa Paula and County of Ventura were added as participating members. Each of these governments is represented on the District’s Board of Directors. On October 5, 1994, the City of Santa Paula withdrew from the joint powers authority agreement and surrendered its representation on the Board of Directors. Santa Paula's member equity was reallocated to the other members during the fiscal year ended June 30, 1995. Basis of Accounting, Measurement Focus and Financial Reporting The Financial Statements (i.e., the statement of net position, the statement of revenues, expenses and changes in net position, and statement of cash flows) report information on all of the activities of the primary government. The District accounts for its operations (a) that are financed and operated in a manner similar to private business enterprises – where the intent of the governing body is that the costs (expenses, including depreciation) of providing goods or services to the general public on a continuing basis be financed or recovered primarily through user charges; or (b) where the governing body has decided that periodic determination of revenues earned, expenses incurred, and/or net income is appropriate for capital maintenance, public policy, management control, accountability or other purposes. The Financial Statements are reported using the “economic resources” measurement focus and the accrual basis of accounting. Revenues are recorded when earned and expenses are recorded when a liability is incurred, regardless of the timing of related cash flows. Grants and similar items are recognized as revenue as all eligibility requirements have been met. Interest associated with the current fiscal period is considered to be susceptible to accrual and so has been recognized as revenue of the current fiscal period. In accordance with GASB Statement No. 63, Financial Reporting of Deferred Outflows of Resources, Deferred Inflows of Resources, and Net Position, the Statement of Net Position reports separate sections for Deferred Outflows of Resources, and Deferred Inflows of Resources, when applicable.
Deferred Outflows of Resources represent outflows of resources (consumption of net position) that apply to future periods and that, therefore, will not be recognized as an expense until that time. Deferred Inflows of Resources represent inflows of resources (acquisition of net position) that apply to future periods and that, therefore, are not recognized as a revenue until that time.
Operating revenues are those revenues that are generated from the primary operations of the District. The District reports a measure of operations by presenting the change in net position from operations as operating income in the statement of revenues, expenses, and changes in net position. Operating activities are defined by the District as all activities other than financing and investing activities (interest expense and investment income), grants and subsidies, and other infrequently occurring transactions of a non-operating nature. Operating expenses are those expenses that are essential to the primary operations of the District. All other expenses are reported as non-operating expenses.
Gold Coast Transit District Notes to the Basic Financial Statements (Continued)
For the Years Ended June 30, 2016 and 2015
36
Note 1 – Reporting Entity and Summary of Significant Accounting Policies (Continued) Basis of Accounting, Measurement Focus and Financial Reporting (Continued) The District reports the following funds:
Operating Fund accounts for all revenues and other receipts that are not allocated by law or contractual agreements to some other funds to be accounted for in this fund. General operating costs and capital improvement costs which are not paid through other funds, are paid from this fund.
Fiduciary Funds:
Local Transportation Fund is used to account for local transportation funding (Article No. 4) received by the County of Ventura from the State of California and then subsequently distributed to the District and its member entities based on their requested appropriation throughout the fiscal year. Proposition 1B Grant Fund is used to account for all advanced grant funding received by the District from the State of California Proposition 1B funds for the Public Transportation Modernization, Improvement, and Service Enhancement Account (PTMISEA) and the Safety and Security programs.
Use of Estimates The preparation of the basic financial statements in conformity with generally accepted accounting principles requires management to make estimates and assumptions that affect the reported amounts of assets and liabilities they also include disclosures of contingent assets and liabilities at the date of the financial statements and the reported changes in net position during the reporting period. Actual results could differ from those estimates. Cash and Cash Equivalents
Substantially all of the District’s cash is invested in interest bearing cash accounts. The District considers all highly liquid investments with initial maturities of three months or less to be cash equivalents. Investments and Investment Earnings Changes in fair value that occur during a fiscal year are recognized as unrealized gains or losses and reported for that fiscal year. Investment earnings comprise interest earnings, changes in fair value, and any gains or losses realized upon the liquidation or sale of investments. Materials and Supplies Inventory Materials and supplies inventory consists primarily of bus replacement parts, supplies for vehicle maintenance, tires, and oil. Inventory is valued at cost using a weighted average method. Inventory items are charged to expense at the time that individual items are withdrawn from inventory or consumed. Prepaid Items Certain payments to vendors reflects costs or deposits applicable to future accounting periods and are recorded as prepaid items in the basic financial statements.
Gold Coast Transit District Notes to the Basic Financial Statements (Continued)
For the Years Ended June 30, 2016 and 2015
37
Note 1 – Reporting Entity and Summary of Significant Accounting Policies (Continued) Capital Assets Capital assets acquired and/or constructed are capitalized at historical cost. District policy has set the capitalization threshold for reporting capital assets at $5,000. Donated assets are recorded at estimated fair market value at the date of donation. Depreciation is recorded on a straight-line basis over the estimated useful lives of the assets as follows:
Revenue vehicles – fixed route – 10 to 12 years Facilities – 15 to 30 years Equipment and furniture – 3 to 10 years Revenue vehicles – paratransit – 4 to 5 years Paratransit equipment – 3 to 5 years
Compensated Absences District policy is to permit employees to accumulate earned vacation and sick leave. Accumulated vacation time is accrued at year-end to account for the District’s obligation to the employees for the amount owed. Sick leave can be accumulated, but, under District policy, is not paid until termination or retirement with a minimum of ten years of service. Payment shall be made in an amount of 50% of accrued sick leave upon termination, retirement or death of the employee. Accordingly, 50% of the accumulated sick leave is accrued at year-end to account for the District's obligation to qualified employees for the amount owed. Pensions For purposes of measuring the net pension liability, deferred outflows of resources and deferred inflows of resources related to pensions, and pension expense, information about the fiduciary net position of the plans and additions to/deductions from the plans’ fiduciary net position have been determined on the same basis as they are reported by the plans (Note 8). For this purpose, benefit payments (including refunds of employee contributions) are recognized when due and payable in accordance with benefit terms. Investments are reported at fair value. The following timeframes are used for pension reporting:
CalPERS 2016 2015 Valuation date June 30, 2014 June 30, 2013 Measurement date June 30, 2015 June 30, 2014 Measurement period July, 1, 2014 to June 30, 2015 July 1, 2013 to June 30, 2014
Gains and losses related to changes in total pension liability and fiduciary net position are recognized in pension expense systematically over time. The first amortized amounts are recognized in pension expense for the year the gain or loss occurs. The remaining amounts are categorized as deferred outflows and deferred inflows of resources related to pensions and are to be recognized in future pension expense. The amortization period differs depending on the source of the gain or loss. The difference between projected and actual earnings is amortized straight-line over 5 years. All other amounts are amortized straight-line over the average expected remaining service lives of all members that are provided with benefits (active, inactive, and retired) as of the beginning of the measurement period.
Gold Coast Transit District Notes to the Basic Financial Statements (Continued)
For the Years Ended June 30, 2016 and 2015
38
Note 1 – Reporting Entity and Summary of Significant Accounting Policies (Continued) Unearned – Local Transportation Funding Authorized and received Local Transportation Funds that exceed current year expenditure requirements are deferred to future periods. Grant Funding Grants for operating assistance and capital acquisitions are included in their respective non-operating and capital contribution sections of the statement of revenues, expenses and changes in net position. Grant funds are claimed on a reimbursement basis and receivables for grant funds are recorded as the related obligations are incurred. Grant funds advanced but not yet earned are treated as unearned revenue until the respective obligations these grants were funded for are incurred. Non-Operating Revenues and Capital Contributions The District receives Local Transportation Funds (LTF) under provisions of the State of California's Transportation Development Act of 1971. This act provides that a portion of state sales tax proceeds be made available for support and development of public transportation. These funds are generated within Ventura County and are allocated based on annual claims filed by the District and approved by the Ventura County Transportation Commission (VCTC). A portion of these proceeds (at the discretion of the District's Board of Directors) is set aside to fund capital acquisitions and is classified as local capital grants in the capital contribution section of the statement of revenues, expenses and changes in net position. The remaining portion of local transportation funding is used to subsidize current operations and is included in the non-operating revenue section of the statement of revenues, expense and changes in net position. Under provisions of the Moving Ahead for Progress in the 21st Century Act (MAP-21) signed into law on July 6, 2012, Federal planning and capital assistance grants (under Section 5307) are made available to local urbanized mass transportation systems on a formula basis. Federal operating and matching grants provided to the District under this act are included in the non-operating revenue section of the statement of revenues, expenses and changes in net position. Federal, state and local operating grants are included in the non-operating revenue section of the statement of revenues, expenses and changes in net position. Federal, state and local capital grants are reported in the capital contribution section of the statement of revenues, expenses and changes in net position. Net Position The financial statements utilize a net position presentation. Net position is categorized as follows:
Net Investment in Capital Assets – This component of net position consists of capital assets, net of accumulated depreciation and reduced by any outstanding debt against the acquisition, construction or improvement of those assets.
Gold Coast Transit District Notes to the Basic Financial Statements (Continued)
For the Years Ended June 30, 2016 and 2015
39
Note 1 – Reporting Entity and Summary of Significant Accounting Policies (Continued) Net Position (Continued)
Restricted Net Position – This component of net position consists of constraints placed on net position use through external constraints imposed by creditors, grantors, contributors, or laws or regulations of other governments or constraints imposed by law through constitutional provisions or enabling legislation. Unrestricted Net Position – This component of net position consists of net position that does not meet the definition of restricted or net investment in capital assets.
Accounting Changes GASB has issued Statement No. 68, Accounting and Financial Reporting for Pensions – an amendment of GASB Statement No. 27). This Statement establishes standards for measuring and recognizing liabilities, deferred outflow of resources, deferred inflows of resources, and expense/expenditures for pension plans. This Statement identifies the methods and assumptions that should be used to project benefit payments, discount projected benefit payments to their actuarial present value, and attribute that present value to periods of employee service. This statement became effective for periods beginning after June 15, 2014. See note 9 and 14 for the net pension liability and the prior period adjustment, respectively, as a result of the implementation. GASB has issued Statement No. 69, Government Combinations and Disposals of Government Operations. This Statement establishes accounting and financial reporting standards related to government combinations and disposals of government operations. As used in this Statement, the term government combinations includes a variety of transactions referred to as mergers, acquisitions, and transfers of operations This statement became effective for periods beginning after December 15, 2013 and did not have a significant impact on the District’s financial statements for year ended June 30, 2015. GASB has issued Statement No. 71, Pension Transition for Contributions Made Subsequent to the Measurement Date – an amendment of GASB Statement No. 68. This statement establishes standards relates to amounts associated with contributions, if any, made by a state or local government employer or nonemployer contributing entity to a defined benefit pension plan after the measurement date of the government's beginning net pension liability. This statement became effective for periods beginning after June 15, 2014. See note 9 and 14 for the net pension liability and the prior period adjustment, respectively, as a result of the implementation. GASB has issued Statement No. 72, Fair Value Measurement and Application. This statement addresses accounting and financial reporting issues related to fair value measurements. This statement becomes effective for periods beginning after June 15, 2015. Note 2 – Cash and Investments Cash and cash equivalents as June 30, 2016 are classified in the accompanying financial statements as follows:
June 30, 2016 June 30, 2015
Cash and cash equivalents 13,928,245$ 12,430,280$ Cash and cash equivalents – statement of fiduciary net position 10,861,797 8,227,653
Total 24,790,042$ 20,657,933$
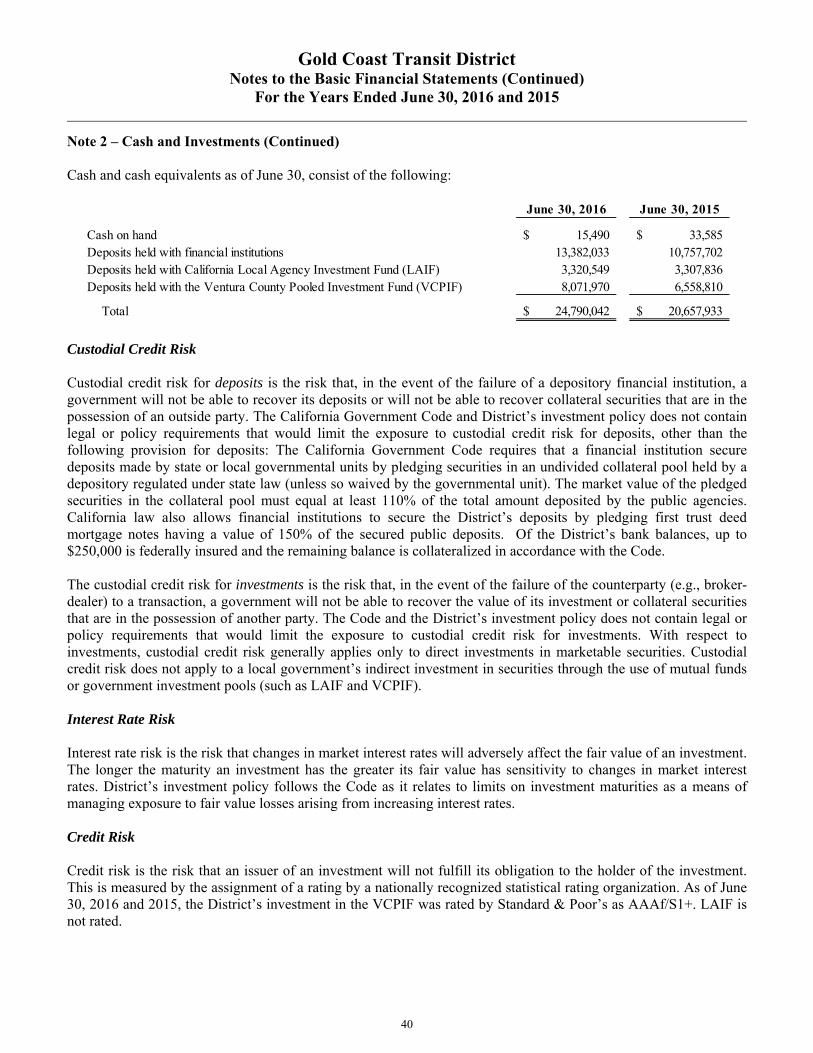
Gold Coast Transit District Notes to the Basic Financial Statements (Continued)
For the Years Ended June 30, 2016 and 2015
40
Note 2 – Cash and Investments (Continued) Cash and cash equivalents as of June 30, consist of the following:
June 30, 2016 June 30, 2015
Cash on hand 15,490$ 33,585$ Deposits held with financial institutions 13,382,033 10,757,702 Deposits held with California Local Agency Investment Fund (LAIF) 3,320,549 3,307,836 Deposits held with the Ventura County Pooled Investment Fund (VCPIF) 8,071,970 6,558,810
Total 24,790,042$ 20,657,933$
Custodial Credit Risk Custodial credit risk for deposits is the risk that, in the event of the failure of a depository financial institution, a government will not be able to recover its deposits or will not be able to recover collateral securities that are in the possession of an outside party. The California Government Code and District’s investment policy does not contain legal or policy requirements that would limit the exposure to custodial credit risk for deposits, other than the following provision for deposits: The California Government Code requires that a financial institution secure deposits made by state or local governmental units by pledging securities in an undivided collateral pool held by a depository regulated under state law (unless so waived by the governmental unit). The market value of the pledged securities in the collateral pool must equal at least 110% of the total amount deposited by the public agencies. California law also allows financial institutions to secure the District’s deposits by pledging first trust deed mortgage notes having a value of 150% of the secured public deposits. Of the District’s bank balances, up to $250,000 is federally insured and the remaining balance is collateralized in accordance with the Code. The custodial credit risk for investments is the risk that, in the event of the failure of the counterparty (e.g., broker-dealer) to a transaction, a government will not be able to recover the value of its investment or collateral securities that are in the possession of another party. The Code and the District’s investment policy does not contain legal or policy requirements that would limit the exposure to custodial credit risk for investments. With respect to investments, custodial credit risk generally applies only to direct investments in marketable securities. Custodial credit risk does not apply to a local government’s indirect investment in securities through the use of mutual funds or government investment pools (such as LAIF and VCPIF). Interest Rate Risk Interest rate risk is the risk that changes in market interest rates will adversely affect the fair value of an investment. The longer the maturity an investment has the greater its fair value has sensitivity to changes in market interest rates. District’s investment policy follows the Code as it relates to limits on investment maturities as a means of managing exposure to fair value losses arising from increasing interest rates. Credit Risk Credit risk is the risk that an issuer of an investment will not fulfill its obligation to the holder of the investment. This is measured by the assignment of a rating by a nationally recognized statistical rating organization. As of June 30, 2016 and 2015, the District’s investment in the VCPIF was rated by Standard & Poor’s as AAAf/S1+. LAIF is not rated.
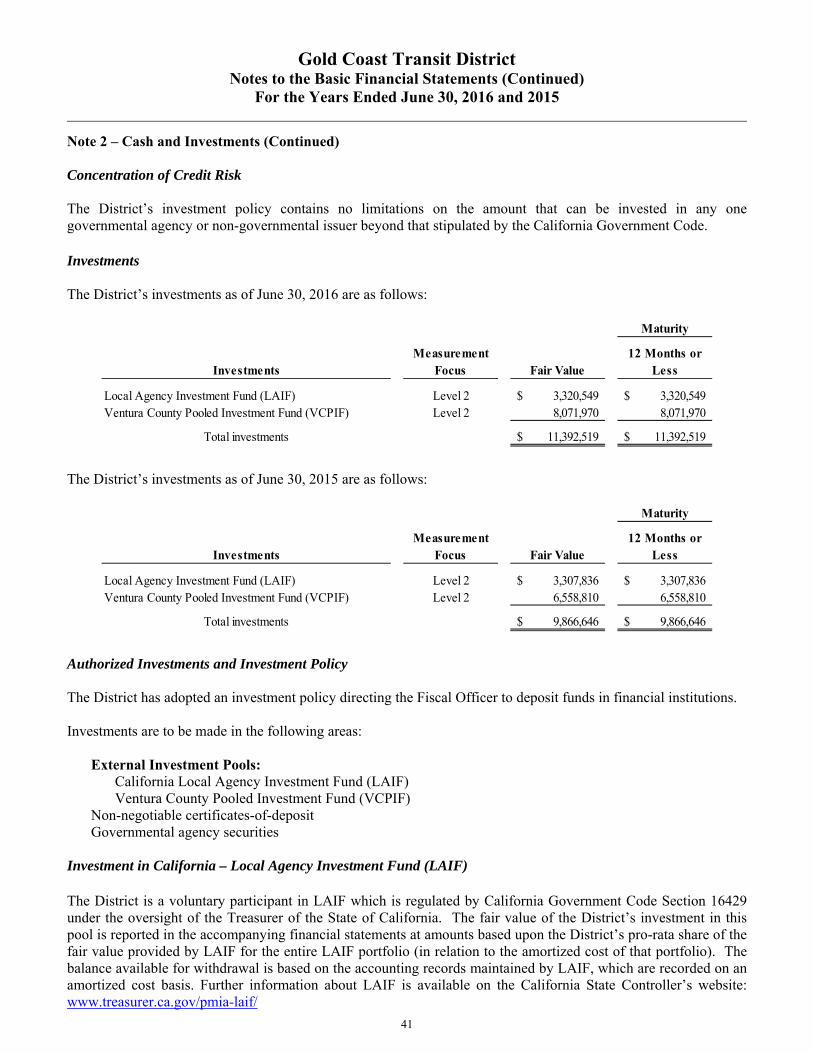
Gold Coast Transit District Notes to the Basic Financial Statements (Continued)
For the Years Ended June 30, 2016 and 2015
41
Note 2 – Cash and Investments (Continued) Concentration of Credit Risk The District’s investment policy contains no limitations on the amount that can be invested in any one governmental agency or non-governmental issuer beyond that stipulated by the California Government Code. Investments The District’s investments as of June 30, 2016 are as follows:
Maturity
Measurement 12 Months orInvestments Focus Fair Value Less
Local Agency Investment Fund (LAIF) Level 2 3,320,549$ 3,320,549$ Ventura County Pooled Investment Fund (VCPIF) Level 2 8,071,970 8,071,970
Total investments 11,392,519$ 11,392,519$
The District’s investments as of June 30, 2015 are as follows:
Maturity
Measurement 12 Months orInvestments Focus Fair Value Less
Local Agency Investment Fund (LAIF) Level 2 3,307,836$ 3,307,836$ Ventura County Pooled Investment Fund (VCPIF) Level 2 6,558,810 6,558,810
Total investments 9,866,646$ 9,866,646$
Authorized Investments and Investment Policy
The District has adopted an investment policy directing the Fiscal Officer to deposit funds in financial institutions. Investments are to be made in the following areas:
External Investment Pools: California Local Agency Investment Fund (LAIF) Ventura County Pooled Investment Fund (VCPIF)
Non-negotiable certificates-of-deposit Governmental agency securities
Investment in California – Local Agency Investment Fund (LAIF) The District is a voluntary participant in LAIF which is regulated by California Government Code Section 16429 under the oversight of the Treasurer of the State of California. The fair value of the District’s investment in this pool is reported in the accompanying financial statements at amounts based upon the District’s pro-rata share of the fair value provided by LAIF for the entire LAIF portfolio (in relation to the amortized cost of that portfolio). The balance available for withdrawal is based on the accounting records maintained by LAIF, which are recorded on an amortized cost basis. Further information about LAIF is available on the California State Controller’s website: www.treasurer.ca.gov/pmia-laif/
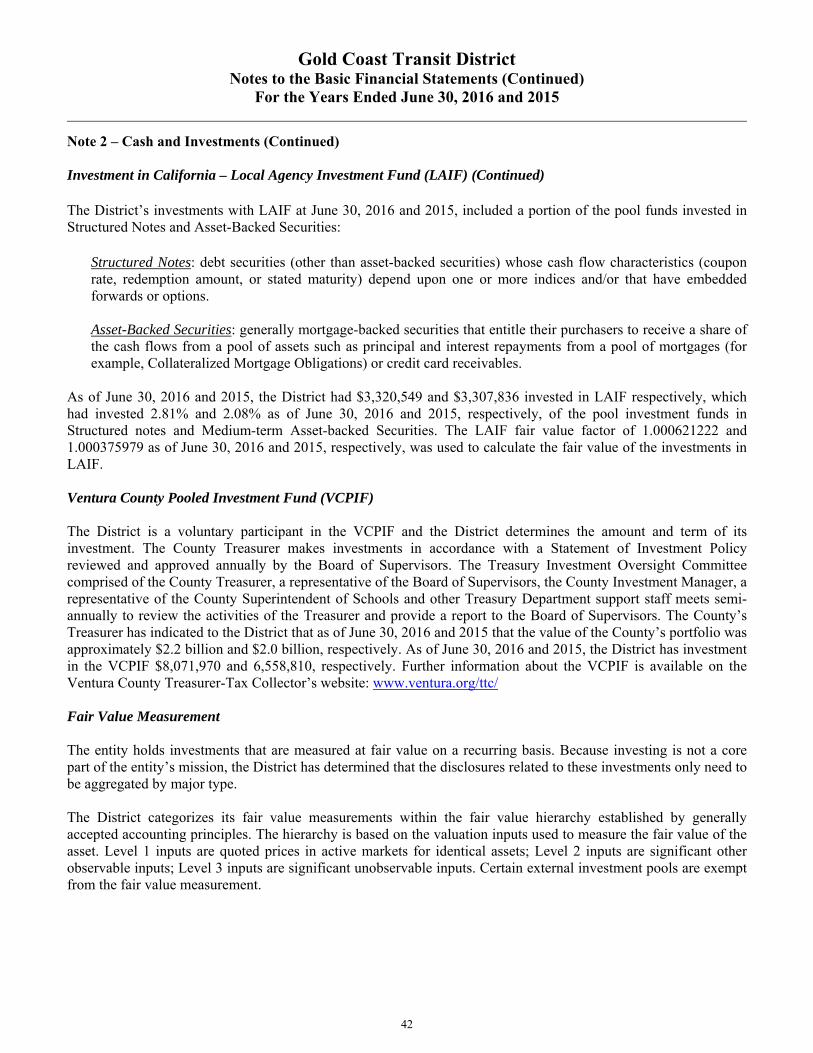
Gold Coast Transit District Notes to the Basic Financial Statements (Continued)
For the Years Ended June 30, 2016 and 2015
42
Note 2 – Cash and Investments (Continued) Investment in California – Local Agency Investment Fund (LAIF) (Continued) The District’s investments with LAIF at June 30, 2016 and 2015, included a portion of the pool funds invested in Structured Notes and Asset-Backed Securities:
Structured Notes: debt securities (other than asset-backed securities) whose cash flow characteristics (coupon rate, redemption amount, or stated maturity) depend upon one or more indices and/or that have embedded forwards or options. Asset-Backed Securities: generally mortgage-backed securities that entitle their purchasers to receive a share of the cash flows from a pool of assets such as principal and interest repayments from a pool of mortgages (for example, Collateralized Mortgage Obligations) or credit card receivables.
As of June 30, 2016 and 2015, the District had $3,320,549 and $3,307,836 invested in LAIF respectively, which had invested 2.81% and 2.08% as of June 30, 2016 and 2015, respectively, of the pool investment funds in Structured notes and Medium-term Asset-backed Securities. The LAIF fair value factor of 1.000621222 and 1.000375979 as of June 30, 2016 and 2015, respectively, was used to calculate the fair value of the investments in LAIF. Ventura County Pooled Investment Fund (VCPIF) The District is a voluntary participant in the VCPIF and the District determines the amount and term of its investment. The County Treasurer makes investments in accordance with a Statement of Investment Policy reviewed and approved annually by the Board of Supervisors. The Treasury Investment Oversight Committee comprised of the County Treasurer, a representative of the Board of Supervisors, the County Investment Manager, a representative of the County Superintendent of Schools and other Treasury Department support staff meets semi-annually to review the activities of the Treasurer and provide a report to the Board of Supervisors. The County’s Treasurer has indicated to the District that as of June 30, 2016 and 2015 that the value of the County’s portfolio was approximately $2.2 billion and $2.0 billion, respectively. As of June 30, 2016 and 2015, the District has investment in the VCPIF $8,071,970 and 6,558,810, respectively. Further information about the VCPIF is available on the Ventura County Treasurer-Tax Collector’s website: www.ventura.org/ttc/ Fair Value Measurement The entity holds investments that are measured at fair value on a recurring basis. Because investing is not a core part of the entity’s mission, the District has determined that the disclosures related to these investments only need to be aggregated by major type. The District categorizes its fair value measurements within the fair value hierarchy established by generally accepted accounting principles. The hierarchy is based on the valuation inputs used to measure the fair value of the asset. Level 1 inputs are quoted prices in active markets for identical assets; Level 2 inputs are significant other observable inputs; Level 3 inputs are significant unobservable inputs. Certain external investment pools are exempt from the fair value measurement.
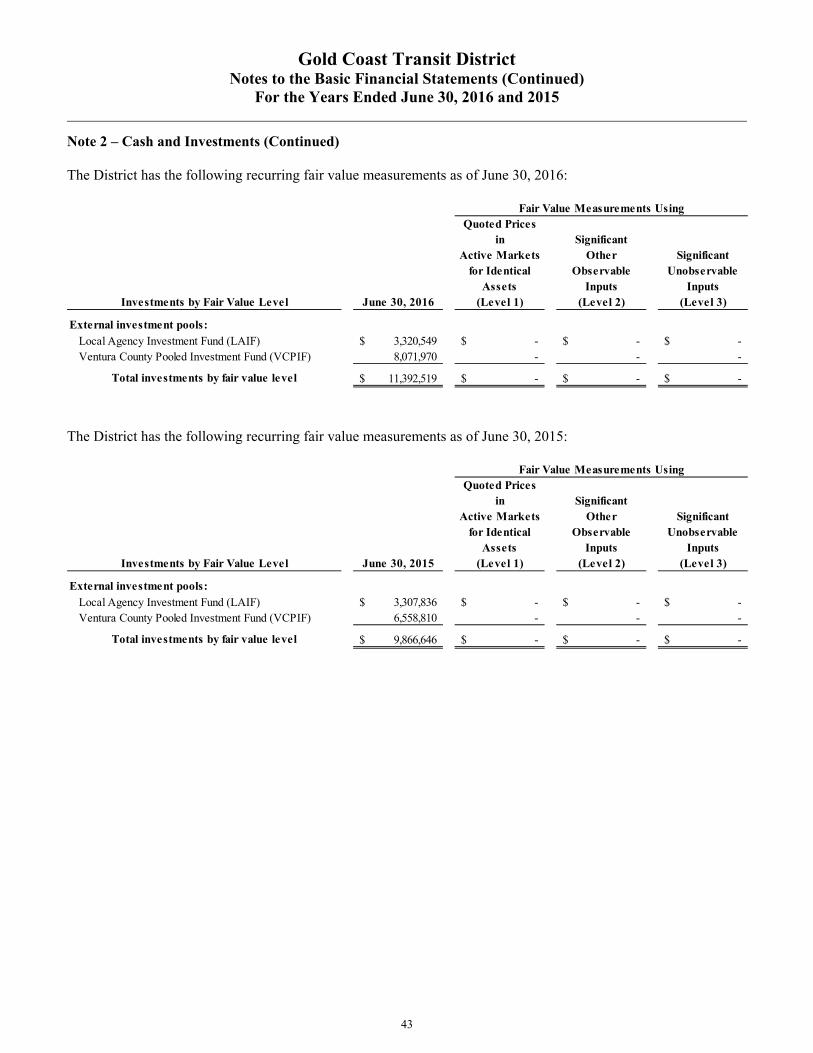
Gold Coast Transit District Notes to the Basic Financial Statements (Continued)
For the Years Ended June 30, 2016 and 2015
43
Note 2 – Cash and Investments (Continued) The District has the following recurring fair value measurements as of June 30, 2016:
Quoted Pricesin Significant
Active Markets Other Significantfor Identical Observable Unobservable
Assets Inputs InputsInvestments by Fair Value Level June 30, 2016 (Level 1) (Level 2) (Level 3)
External investment pools:Local Agency Investment Fund (LAIF) 3,320,549$ -$ -$ -$ Ventura County Pooled Investment Fund (VCPIF) 8,071,970 - - -
Total investments by fair value level 11,392,519$ -$ -$ -$
Fair Value Measurements Using
The District has the following recurring fair value measurements as of June 30, 2015:
Quoted Pricesin Significant
Active Markets Other Significantfor Identical Observable Unobservable
Assets Inputs InputsInvestments by Fair Value Level June 30, 2015 (Level 1) (Level 2) (Level 3)
External investment pools:Local Agency Investment Fund (LAIF) 3,307,836$ -$ -$ -$ Ventura County Pooled Investment Fund (VCPIF) 6,558,810 - - -
Total investments by fair value level 9,866,646$ -$ -$ -$
Fair Value Measurements Using
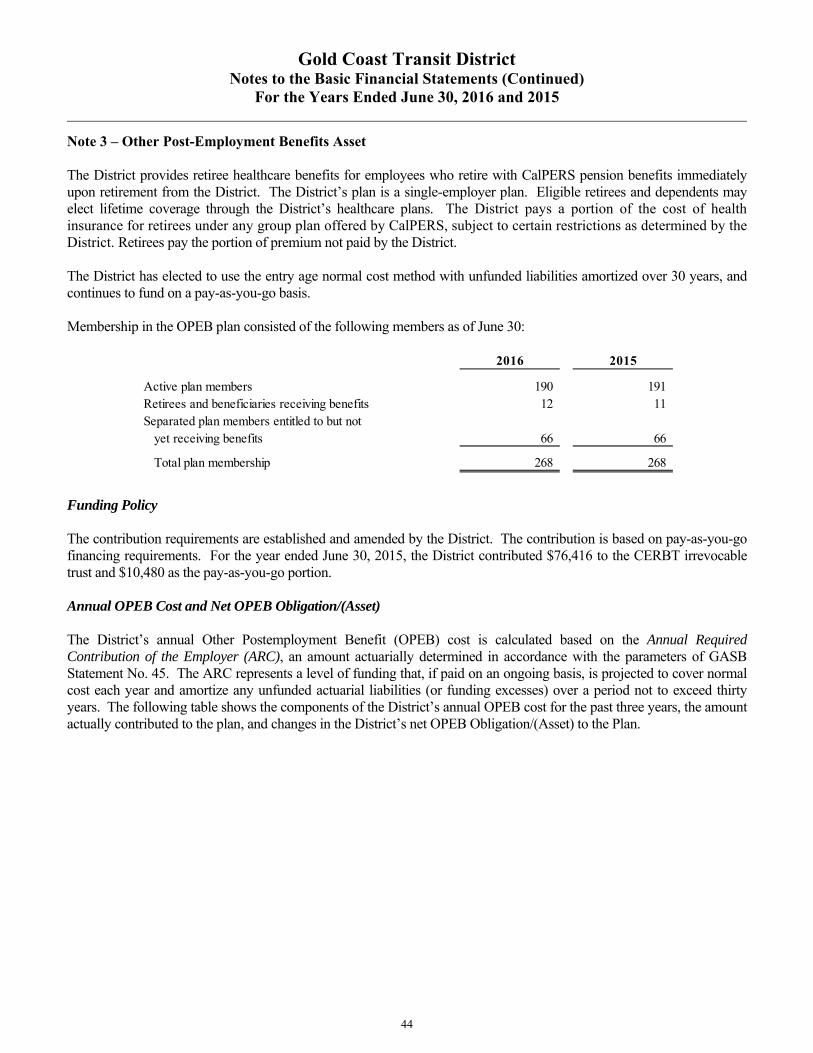
Gold Coast Transit District Notes to the Basic Financial Statements (Continued)
For the Years Ended June 30, 2016 and 2015
44
Note 3 – Other Post-Employment Benefits Asset The District provides retiree healthcare benefits for employees who retire with CalPERS pension benefits immediately upon retirement from the District. The District’s plan is a single-employer plan. Eligible retirees and dependents may elect lifetime coverage through the District’s healthcare plans. The District pays a portion of the cost of health insurance for retirees under any group plan offered by CalPERS, subject to certain restrictions as determined by the District. Retirees pay the portion of premium not paid by the District. The District has elected to use the entry age normal cost method with unfunded liabilities amortized over 30 years, and continues to fund on a pay-as-you-go basis. Membership in the OPEB plan consisted of the following members as of June 30:
2016 2015
Active plan members 190 191 Retirees and beneficiaries receiving benefits 12 11 Separated plan members entitled to but not yet receiving benefits 66 66
Total plan membership 268 268
Funding Policy The contribution requirements are established and amended by the District. The contribution is based on pay-as-you-go financing requirements. For the year ended June 30, 2015, the District contributed $76,416 to the CERBT irrevocable trust and $10,480 as the pay-as-you-go portion. Annual OPEB Cost and Net OPEB Obligation/(Asset) The District’s annual Other Postemployment Benefit (OPEB) cost is calculated based on the Annual Required Contribution of the Employer (ARC), an amount actuarially determined in accordance with the parameters of GASB Statement No. 45. The ARC represents a level of funding that, if paid on an ongoing basis, is projected to cover normal cost each year and amortize any unfunded actuarial liabilities (or funding excesses) over a period not to exceed thirty years. The following table shows the components of the District’s annual OPEB cost for the past three years, the amount actually contributed to the plan, and changes in the District’s net OPEB Obligation/(Asset) to the Plan.
Gold Coast Transit District Notes to the Basic Financial Statements (Continued)
For the Years Ended June 30, 2016 and 2015
45
Note 3 – Other Post-Employment Benefits Asset (Continued)
2016 2015
Annual OPEB expense:Annual required contribution (ARC) 85,913$ 86,896$ Interest on net OPEB obligation - - Adjustment to annual required contribution - -
Total OPEB expense 85,913 86,896
Contributions made:Contributions (51,949) (86,044)
Total contributions made (51,949) (86,044)
Change in net OPEB payable obligation 33,964 852
Net other post-employment benefits payable(asset):Beginning of year (33,964) (34,816)
End of year -$ (33,964)$
The District’s annual OPEB cost, the percentage of annual OPEB cost contributed to the plan, and the net OPEB obligation for the year ended June 30, 2016 plus the two preceding years were as follows:
Fiscal Annual Percentage Net OPEBYear OPEB Contributions of Annual OPEB Obligation
Ended Cost Made Cost Contributed Payable(Asset)
June 30, 2016 85,913$ 51,949$ 60.47% -$ June 30, 2015 86,896 86,044 99.02% (33,964) June 30, 2014 84,570 119,386 141.17% (34,816)
Three-Year History of Net OPEB Obligation
Funded Status and Funding Progress As of July 1, 2015, the Actuarial Accrued Liability for benefits was $845,683, and the actuarial value of assets was $353,596, resulting in an UAAL of $492,087. The covered payroll (annual payroll of active employees covered by the plan) was $8,564,231 and the ratio of UAAL to the covered payroll was 5.75 percent. Actuarial valuations of an ongoing plan involve estimates of the value of reported amounts and assumptions about the probability of occurrence of events far into the future. Examples include assumptions about future employment, mortality, and the healthcare cost trend. Amounts determined regarding the funded status of the plan and the annual required contributions of the employer are subject to continual revision as actual results are compared with past expectations and new estimates are made about the future. The schedule of funding progress, presented as Required Supplementary Information following the notes to the financial statements, presents multi-year trend information about whether the actuarial value of plan assets is increasing or decreasing over time relative to the Actuarial Accrued Liabilities for benefits.
Gold Coast Transit District Notes to the Basic Financial Statements (Continued)
For the Years Ended June 30, 2016 and 2015
46
Note 3 – Other Post-Employment Benefits Asset (Continued) Actuarial Methods and Assumptions Projections of benefits for financial reporting purposes are based on the substantive plan (the plan as understood by the employer and the plan members) and include the types of benefits provided at the time of each valuation and the historical pattern of sharing of benefit costs between the employer and plan members to that point. The actuarial methods and assumptions used include techniques that are designed to reduce the effects of short-term volatility in actuarial accrued liabilities and the actuarial value of assets, consistent with the long-term perspective of the calculations. For July 1, 2015 actuarial valuation, the entry age normal cost method was used. The actuarial assumptions include a 7.0% discount rate, 2.75% inflation rate, and an annual healthcare cost trend rate of 4.0% per year. The UAAL is being amortized as level percentage of future payroll on a 30 year closed amortization period. Note 4 – Capital Assets During fiscal year 2016, the District added $5,407,227 in construction–in-process or depreciable capital asset additions. The changes in capital assets for the year ended June 30, 2016 were as follows:
Balance Deletions/ BalanceJuly 1, 2015 Additions Transfers June 30, 2016
Non-depreciable assets:
Land 8,959,491$ -$ -$ 8,959,491$ Construction-in-process 3,042,653 5,087,497 (4,574,365) 3,555,785
Total non-depreciable assets 12,002,144 5,087,497 (4,574,365) 12,515,276
Depreciable assets:
Revenue vehicles – fixed route 21,542,653 4,183,159 (1,991,373) 23,734,439 Facilities 6,752,515 234,057 - 6,986,572 Equipment and furniture 3,993,842 157,149 (46,092) 4,104,899 Intangible assets 39,401 - - 39,401 Paratransit revenue vehicles 2,476,511 319,730 (759,969) 2,036,272 Paratransit equipment 166,576 - - 166,576
Total depreciable assets 34,971,498 4,894,095 (2,797,434) 37,068,159
Accumulated depreciation
Revenue vehicles – fixed route (14,191,909) (1,864,070) 1,991,373 (14,064,606) Facilities (5,745,293) (500,442) - (6,245,735) Equipment and furniture (2,235,112) (331,560) 46,092 (2,520,580) Intangible assets (39,401) - - (39,401) Paratransit revenue vehicles (2,220,253) (147,562) 759,969 (1,607,846) Paratransit equipment (166,576) - - (166,576)
Total depreciation (24,598,544) (2,843,634) 2,797,434 (24,644,744)
Total depreciable assets 10,372,954 2,050,461 - 12,423,415
Total capital assets, net 22,375,098$ 7,137,958$ (4,574,365)$ 24,938,691$
Gold Coast Transit District Notes to the Basic Financial Statements (Continued)
For the Years Ended June 30, 2016 and 2015
47
Note 4 – Capital Assets (Continued) During fiscal year 2015, the District added $8,659,193 in a non-depreciable asset of land for the new transit facility and $2,908,184 in construction–in-process or depreciable capital asset additions. The changes in capital assets for the year ended June 30, 2015 were as follows:
Balance Deletions/ BalanceJuly 1, 2014 Additions Transfers June 30, 2015
Non-depreciable assets:Land 300,298$ 8,659,193$ -$ 8,959,491$ Construction-in-process 953,669 2,908,184 (819,200) 3,042,653
Total non-depreciable assets 1,253,967 11,567,377 (819,200) 12,002,144
Depreciable assets:Revenue vehicles – fixed route 21,542,653 - - 21,542,653 Facilities 6,645,151 107,364 - 6,752,515 Equipment and furniture 3,643,973 455,578 (105,709) 3,993,842 Intangible assets 39,401 - - 39,401 Paratransit revenue vehicles 2,220,253 256,258 - 2,476,511 Paratransit equipment 166,576 - - 166,576
Total depreciable assets 34,258,007 819,200 (105,709) 34,971,498
Accumulated depreciation Revenue vehicles – fixed route (12,587,507) (1,604,402) - (14,191,909) Facilities (5,254,338) (490,955) - (5,745,293) Equipment and furniture (2,039,146) (301,675) 105,709 (2,235,112) Intangible assets (30,646) (8,755) - (39,401) Paratransit revenue vehicles (2,220,253) - - (2,220,253) Paratransit equipment (166,576) - - (166,576)
Total depreciation (22,298,466) (2,405,787) 105,709 (24,598,544)
Total depreciable assets 11,959,541 (1,586,587) - 10,372,954
Total capital assets, net 13,213,508$ 9,980,790$ (819,200)$ 22,375,098$
Note 5 – Accounts Payable and Accrued Expenses Accounts payable and accrued expenses balance consists of the following amounts:
June 30, 2016 June 30, 2015
Accounts payable 3,327,168$ 1,019,634$ Accrued wages and benefits 341,063 266,350
3,668,231$ 1,285,984$
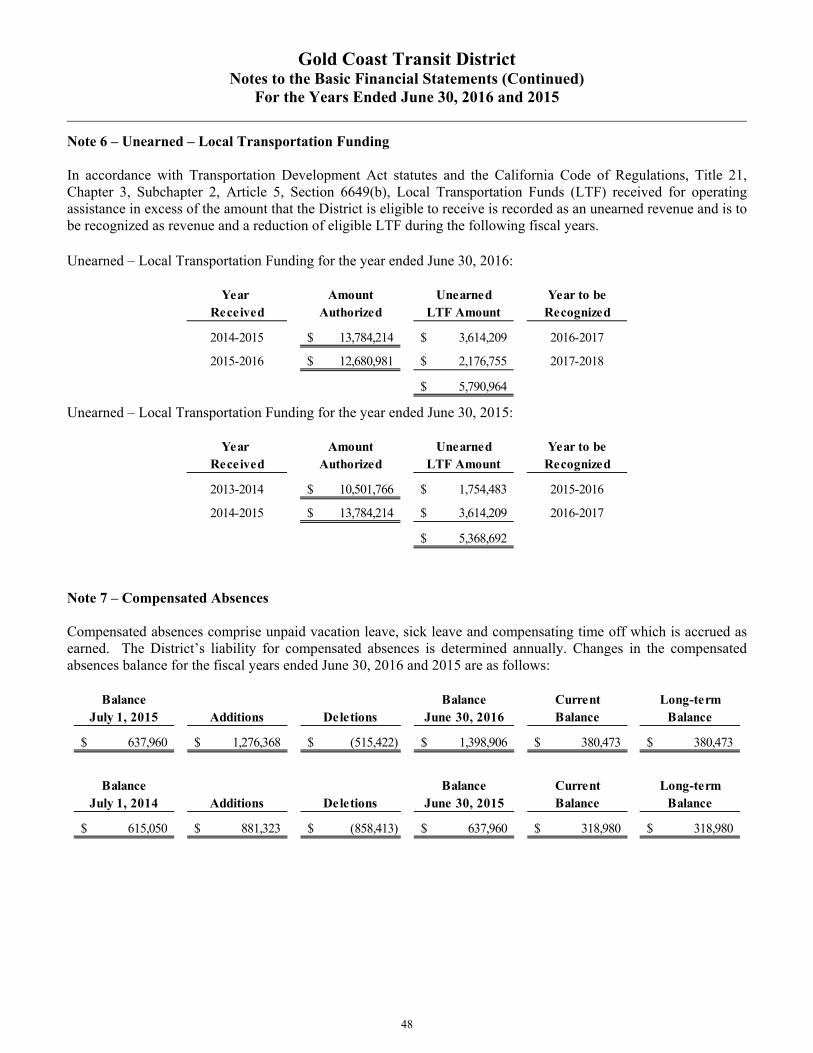
Gold Coast Transit District Notes to the Basic Financial Statements (Continued)
For the Years Ended June 30, 2016 and 2015
48
Note 6 – Unearned – Local Transportation Funding In accordance with Transportation Development Act statutes and the California Code of Regulations, Title 21, Chapter 3, Subchapter 2, Article 5, Section 6649(b), Local Transportation Funds (LTF) received for operating assistance in excess of the amount that the District is eligible to receive is recorded as an unearned revenue and is to be recognized as revenue and a reduction of eligible LTF during the following fiscal years. Unearned – Local Transportation Funding for the year ended June 30, 2016:
Year Amount Unearned Year to beReceived Authorized LTF Amount Recognized
2014-2015 13,784,214$ 3,614,209$ 2016-2017
2015-2016 12,680,981$ 2,176,755$ 2017-2018
5,790,964$
Unearned – Local Transportation Funding for the year ended June 30, 2015:
Year Amount Unearned Year to beReceived Authorized LTF Amount Recognized
2013-2014 10,501,766$ 1,754,483$ 2015-2016
2014-2015 13,784,214$ 3,614,209$ 2016-2017
5,368,692$
Note 7 – Compensated Absences Compensated absences comprise unpaid vacation leave, sick leave and compensating time off which is accrued as earned. The District’s liability for compensated absences is determined annually. Changes in the compensated absences balance for the fiscal years ended June 30, 2016 and 2015 are as follows:
Balance Balance Current Long-termJuly 1, 2015 Additions Deletions June 30, 2016 Balance Balance
637,960$ 1,276,368$ (515,422)$ 1,398,906$ 380,473$ 380,473$
Balance Balance Current Long-termJuly 1, 2014 Additions Deletions June 30, 2015 Balance Balance
615,050$ 881,323$ (858,413)$ 637,960$ 318,980$ 318,980$
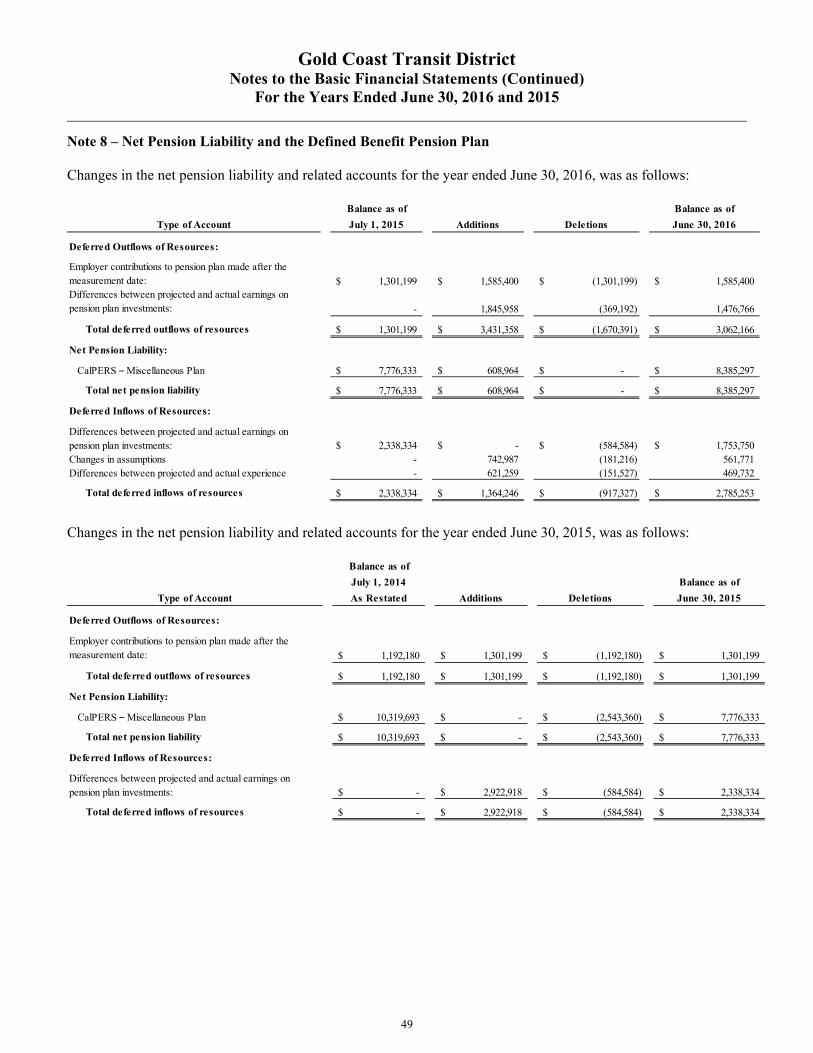
Gold Coast Transit District Notes to the Basic Financial Statements (Continued)
For the Years Ended June 30, 2016 and 2015
49
Note 8 – Net Pension Liability and the Defined Benefit Pension Plan Changes in the net pension liability and related accounts for the year ended June 30, 2016, was as follows:
Balance as of Balance as of
Type of Account July 1, 2015 Additions Deletions June 30, 2016
Deferred Outflows of Resources:
Employer contributions to pension plan made after the measurement date: 1,301,199$ 1,585,400$ (1,301,199)$ 1,585,400$ Differences between projected and actual earnings on pension plan investments: - 1,845,958 (369,192) 1,476,766
Total deferred outflows of resources 1,301,199$ 3,431,358$ (1,670,391)$ 3,062,166$
Net Pension Liability:
CalPERS – Miscellaneous Plan 7,776,333$ 608,964$ -$ 8,385,297$
Total net pension liability 7,776,333$ 608,964$ -$ 8,385,297$
Deferred Inflows of Resources:
Differences between projected and actual earnings on pension plan investments: 2,338,334$ -$ (584,584)$ 1,753,750$ Changes in assumptions - 742,987 (181,216) 561,771 Differences between projected and actual experience - 621,259 (151,527) 469,732
Total deferred inflows of resources 2,338,334$ 1,364,246$ (917,327)$ 2,785,253$
Changes in the net pension liability and related accounts for the year ended June 30, 2015, was as follows:
Balance as of
July 1, 2014 Balance as of
Type of Account As Restated Additions Deletions June 30, 2015
Deferred Outflows of Resources:
Employer contributions to pension plan made after the measurement date: 1,192,180$ 1,301,199$ (1,192,180)$ 1,301,199$
Total deferred outflows of resources 1,192,180$ 1,301,199$ (1,192,180)$ 1,301,199$
Net Pension Liability:
CalPERS – Miscellaneous Plan 10,319,693$ -$ (2,543,360)$ 7,776,333$
Total net pension liability 10,319,693$ -$ (2,543,360)$ 7,776,333$
Deferred Inflows of Resources:
Differences between projected and actual earnings on pension plan investments: -$ 2,922,918$ (584,584)$ 2,338,334$
Total deferred inflows of resources -$ 2,922,918$ (584,584)$ 2,338,334$
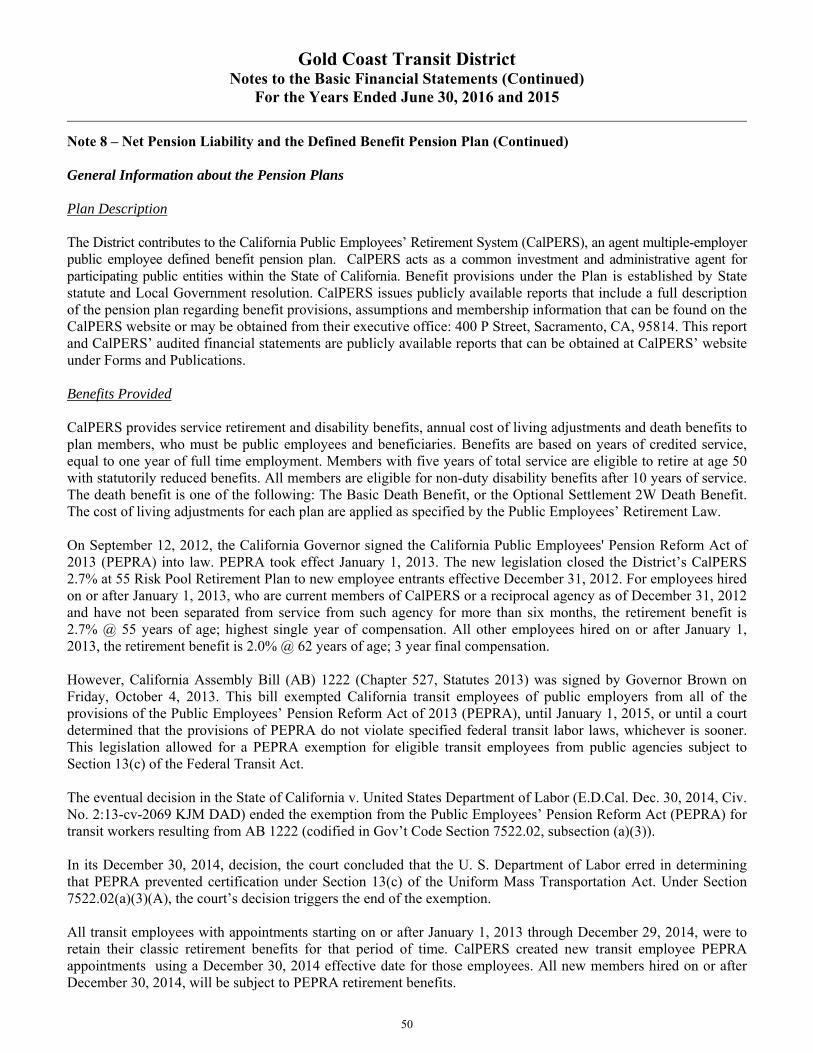
Gold Coast Transit District Notes to the Basic Financial Statements (Continued)
For the Years Ended June 30, 2016 and 2015
50
Note 8 – Net Pension Liability and the Defined Benefit Pension Plan (Continued) General Information about the Pension Plans Plan Description The District contributes to the California Public Employees’ Retirement System (CalPERS), an agent multiple-employer public employee defined benefit pension plan. CalPERS acts as a common investment and administrative agent for participating public entities within the State of California. Benefit provisions under the Plan is established by State statute and Local Government resolution. CalPERS issues publicly available reports that include a full description of the pension plan regarding benefit provisions, assumptions and membership information that can be found on the CalPERS website or may be obtained from their executive office: 400 P Street, Sacramento, CA, 95814. This report and CalPERS’ audited financial statements are publicly available reports that can be obtained at CalPERS’ website under Forms and Publications. Benefits Provided CalPERS provides service retirement and disability benefits, annual cost of living adjustments and death benefits to plan members, who must be public employees and beneficiaries. Benefits are based on years of credited service, equal to one year of full time employment. Members with five years of total service are eligible to retire at age 50 with statutorily reduced benefits. All members are eligible for non-duty disability benefits after 10 years of service. The death benefit is one of the following: The Basic Death Benefit, or the Optional Settlement 2W Death Benefit. The cost of living adjustments for each plan are applied as specified by the Public Employees’ Retirement Law. On September 12, 2012, the California Governor signed the California Public Employees' Pension Reform Act of 2013 (PEPRA) into law. PEPRA took effect January 1, 2013. The new legislation closed the District’s CalPERS 2.7% at 55 Risk Pool Retirement Plan to new employee entrants effective December 31, 2012. For employees hired on or after January 1, 2013, who are current members of CalPERS or a reciprocal agency as of December 31, 2012 and have not been separated from service from such agency for more than six months, the retirement benefit is 2.7% @ 55 years of age; highest single year of compensation. All other employees hired on or after January 1, 2013, the retirement benefit is 2.0% @ 62 years of age; 3 year final compensation. However, California Assembly Bill (AB) 1222 (Chapter 527, Statutes 2013) was signed by Governor Brown on Friday, October 4, 2013. This bill exempted California transit employees of public employers from all of the provisions of the Public Employees’ Pension Reform Act of 2013 (PEPRA), until January 1, 2015, or until a court determined that the provisions of PEPRA do not violate specified federal transit labor laws, whichever is sooner. This legislation allowed for a PEPRA exemption for eligible transit employees from public agencies subject to Section 13(c) of the Federal Transit Act. The eventual decision in the State of California v. United States Department of Labor (E.D.Cal. Dec. 30, 2014, Civ. No. 2:13-cv-2069 KJM DAD) ended the exemption from the Public Employees’ Pension Reform Act (PEPRA) for transit workers resulting from AB 1222 (codified in Gov’t Code Section 7522.02, subsection (a)(3)). In its December 30, 2014, decision, the court concluded that the U. S. Department of Labor erred in determining that PEPRA prevented certification under Section 13(c) of the Uniform Mass Transportation Act. Under Section 7522.02(a)(3)(A), the court’s decision triggers the end of the exemption. All transit employees with appointments starting on or after January 1, 2013 through December 29, 2014, were to retain their classic retirement benefits for that period of time. CalPERS created new transit employee PEPRA appointments using a December 30, 2014 effective date for those employees. All new members hired on or after December 30, 2014, will be subject to PEPRA retirement benefits.
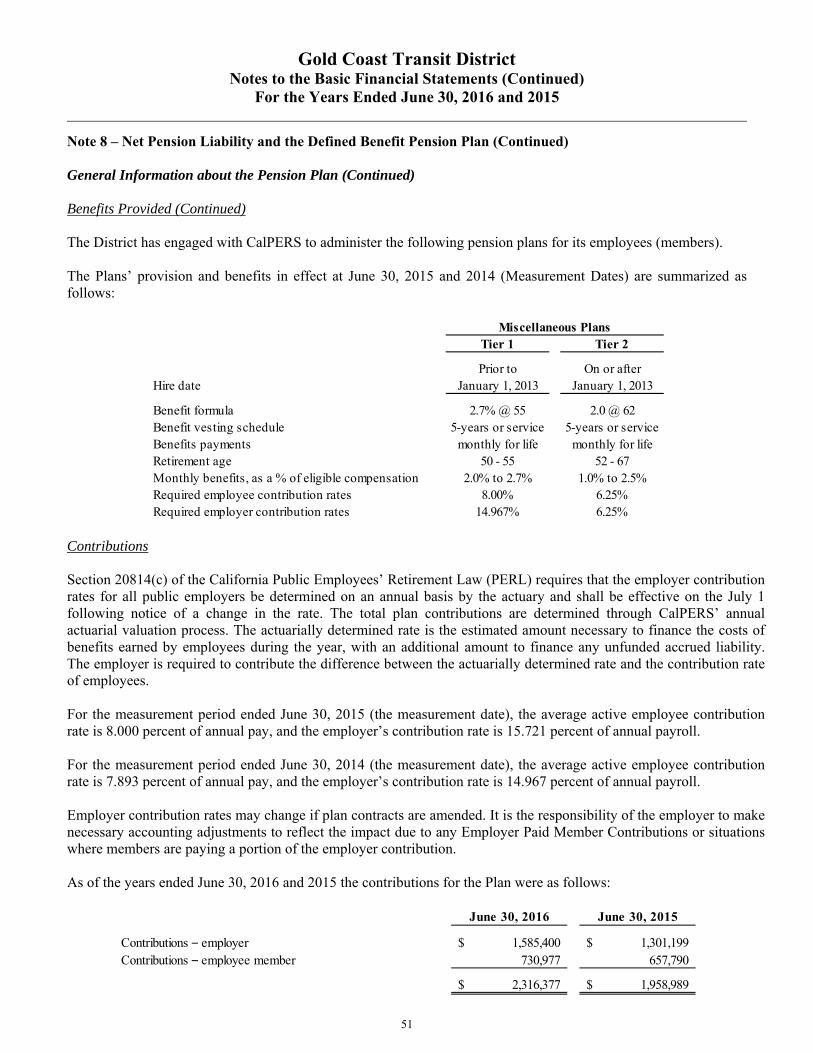
Gold Coast Transit District Notes to the Basic Financial Statements (Continued)
For the Years Ended June 30, 2016 and 2015
51
Note 8 – Net Pension Liability and the Defined Benefit Pension Plan (Continued) General Information about the Pension Plan (Continued) Benefits Provided (Continued) The District has engaged with CalPERS to administer the following pension plans for its employees (members). The Plans’ provision and benefits in effect at June 30, 2015 and 2014 (Measurement Dates) are summarized as follows:
Tier 1 Tier 2
Prior to On or afterHire date January 1, 2013 January 1, 2013
Benefit formula 2.7% @ 55 2.0 @ 62Benefit vesting schedule 5-years or service 5-years or serviceBenefits payments monthly for life monthly for lifeRetirement age 50 - 55 52 - 67Monthly benefits, as a % of eligible compensation 2.0% to 2.7% 1.0% to 2.5%Required employee contribution rates 8.00% 6.25%Required employer contribution rates 14.967% 6.25%
Miscellaneous Plans
Contributions Section 20814(c) of the California Public Employees’ Retirement Law (PERL) requires that the employer contribution rates for all public employers be determined on an annual basis by the actuary and shall be effective on the July 1 following notice of a change in the rate. The total plan contributions are determined through CalPERS’ annual actuarial valuation process. The actuarially determined rate is the estimated amount necessary to finance the costs of benefits earned by employees during the year, with an additional amount to finance any unfunded accrued liability. The employer is required to contribute the difference between the actuarially determined rate and the contribution rate of employees. For the measurement period ended June 30, 2015 (the measurement date), the average active employee contribution rate is 8.000 percent of annual pay, and the employer’s contribution rate is 15.721 percent of annual payroll. For the measurement period ended June 30, 2014 (the measurement date), the average active employee contribution rate is 7.893 percent of annual pay, and the employer’s contribution rate is 14.967 percent of annual payroll. Employer contribution rates may change if plan contracts are amended. It is the responsibility of the employer to make necessary accounting adjustments to reflect the impact due to any Employer Paid Member Contributions or situations where members are paying a portion of the employer contribution. As of the years ended June 30, 2016 and 2015 the contributions for the Plan were as follows:
June 30, 2016 June 30, 2015
Contributions – employer 1,585,400$ 1,301,199$ Contributions – employee member 730,977 657,790
2,316,377$ 1,958,989$
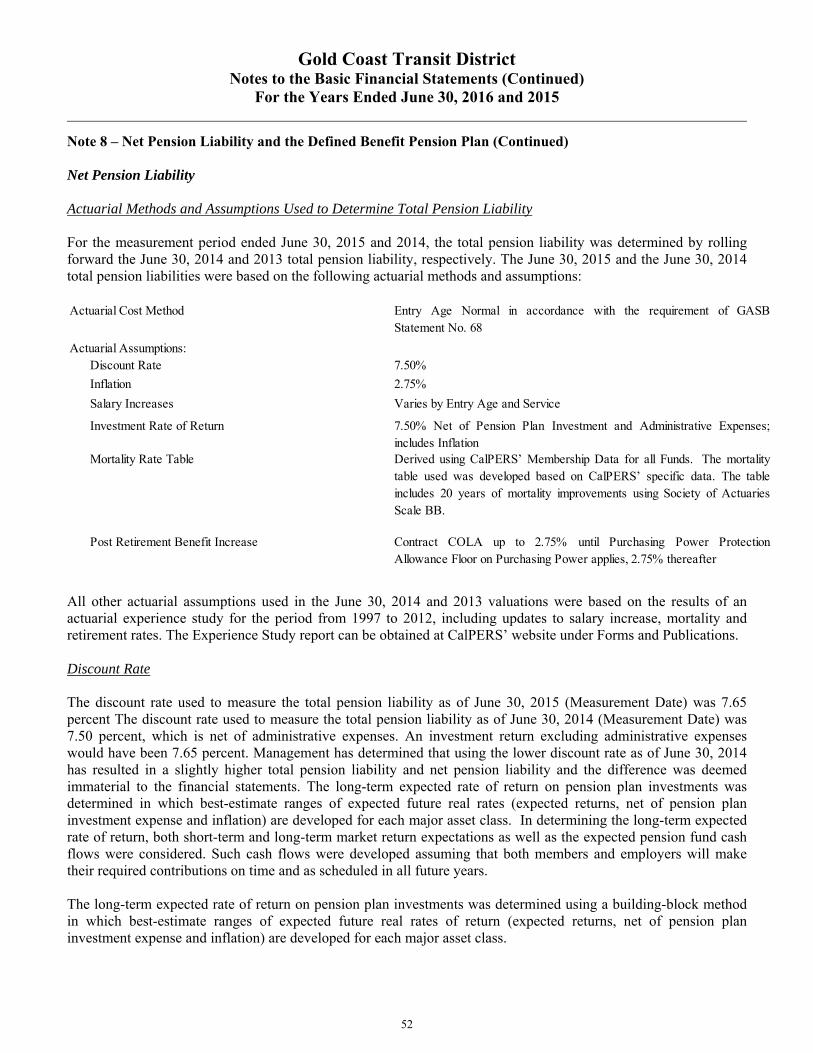
Gold Coast Transit District Notes to the Basic Financial Statements (Continued)
For the Years Ended June 30, 2016 and 2015
52
Note 8 – Net Pension Liability and the Defined Benefit Pension Plan (Continued) Net Pension Liability Actuarial Methods and Assumptions Used to Determine Total Pension Liability For the measurement period ended June 30, 2015 and 2014, the total pension liability was determined by rolling forward the June 30, 2014 and 2013 total pension liability, respectively. The June 30, 2015 and the June 30, 2014 total pension liabilities were based on the following actuarial methods and assumptions: Actuarial Cost Method
Actuarial Assumptions:Discount Rate
Inflation
Salary Increases
Investment Rate of Return
Mortality Rate Table
Post Retirement Benefit Increase
7.50% Net of Pension Plan Investment and Administrative Expenses;includes Inflation
Entry Age Normal in accordance with the requirement of GASBStatement No. 68
7.50%
2.75%
Varies by Entry Age and Service
Derived using CalPERS’ Membership Data for all Funds. The mortalitytable used was developed based on CalPERS’ specific data. The tableincludes 20 years of mortality improvements using Society of ActuariesScale BB.
Contract COLA up to 2.75% until Purchasing Power ProtectionAllowance Floor on Purchasing Power applies, 2.75% thereafter
All other actuarial assumptions used in the June 30, 2014 and 2013 valuations were based on the results of an actuarial experience study for the period from 1997 to 2012, including updates to salary increase, mortality and retirement rates. The Experience Study report can be obtained at CalPERS’ website under Forms and Publications. Discount Rate The discount rate used to measure the total pension liability as of June 30, 2015 (Measurement Date) was 7.65 percent The discount rate used to measure the total pension liability as of June 30, 2014 (Measurement Date) was 7.50 percent, which is net of administrative expenses. An investment return excluding administrative expenses would have been 7.65 percent. Management has determined that using the lower discount rate as of June 30, 2014 has resulted in a slightly higher total pension liability and net pension liability and the difference was deemed immaterial to the financial statements. The long-term expected rate of return on pension plan investments was determined in which best-estimate ranges of expected future real rates (expected returns, net of pension plan investment expense and inflation) are developed for each major asset class. In determining the long-term expected rate of return, both short-term and long-term market return expectations as well as the expected pension fund cash flows were considered. Such cash flows were developed assuming that both members and employers will make their required contributions on time and as scheduled in all future years. The long-term expected rate of return on pension plan investments was determined using a building-block method in which best-estimate ranges of expected future real rates of return (expected returns, net of pension plan investment expense and inflation) are developed for each major asset class.
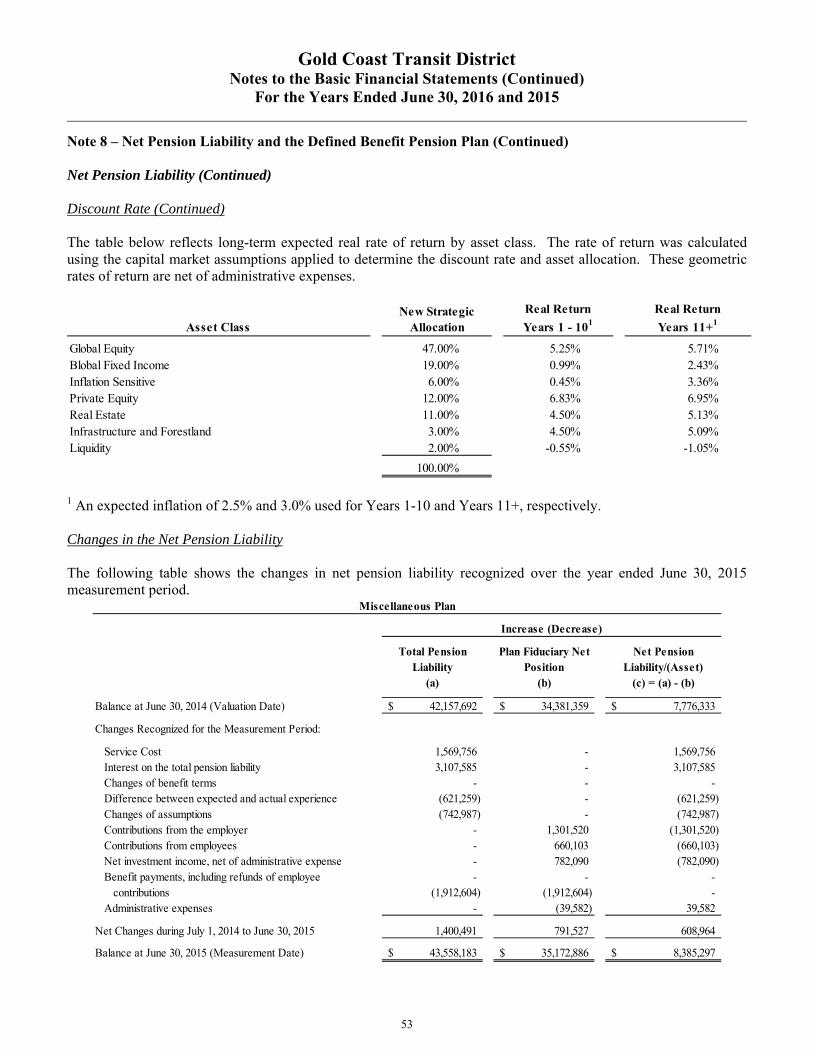
Gold Coast Transit District Notes to the Basic Financial Statements (Continued)
For the Years Ended June 30, 2016 and 2015
53
Note 8 – Net Pension Liability and the Defined Benefit Pension Plan (Continued) Net Pension Liability (Continued) Discount Rate (Continued) The table below reflects long-term expected real rate of return by asset class. The rate of return was calculated using the capital market assumptions applied to determine the discount rate and asset allocation. These geometric rates of return are net of administrative expenses.
Asset ClassNew Strategic
Allocation
Real Return
Years 1 - 101
Real Return
Years 11+1
Global Equity 47.00% 5.25% 5.71%Blobal Fixed Income 19.00% 0.99% 2.43%Inflation Sensitive 6.00% 0.45% 3.36%Private Equity 12.00% 6.83% 6.95%Real Estate 11.00% 4.50% 5.13%Infrastructure and Forestland 3.00% 4.50% 5.09%Liquidity 2.00% -0.55% -1.05%
100.00%
1 An expected inflation of 2.5% and 3.0% used for Years 1-10 and Years 11+, respectively. Changes in the Net Pension Liability The following table shows the changes in net pension liability recognized over the year ended June 30, 2015 measurement period.
Total Pension Plan Fiduciary Net Net PensionLiability Position Liability/(Asset)
(a) (b) (c) = (a) - (b)
Balance at June 30, 2014 (Valuation Date) 42,157,692$ 34,381,359$ 7,776,333$
Changes Recognized for the Measurement Period:
Service Cost 1,569,756 - 1,569,756 Interest on the total pension liability 3,107,585 - 3,107,585 Changes of benefit terms - - - Difference between expected and actual experience (621,259) - (621,259) Changes of assumptions (742,987) - (742,987) Contributions from the employer - 1,301,520 (1,301,520) Contributions from employees - 660,103 (660,103) Net investment income, net of administrative expense - 782,090 (782,090) Benefit payments, including refunds of employee - - -
contributions (1,912,604) (1,912,604) - Administrative expenses - (39,582) 39,582
Net Changes during July 1, 2014 to June 30, 2015 1,400,491 791,527 608,964
Balance at June 30, 2015 (Measurement Date) 43,558,183$ 35,172,886$ 8,385,297$
Miscellaneous Plan
Increase (Decrease)
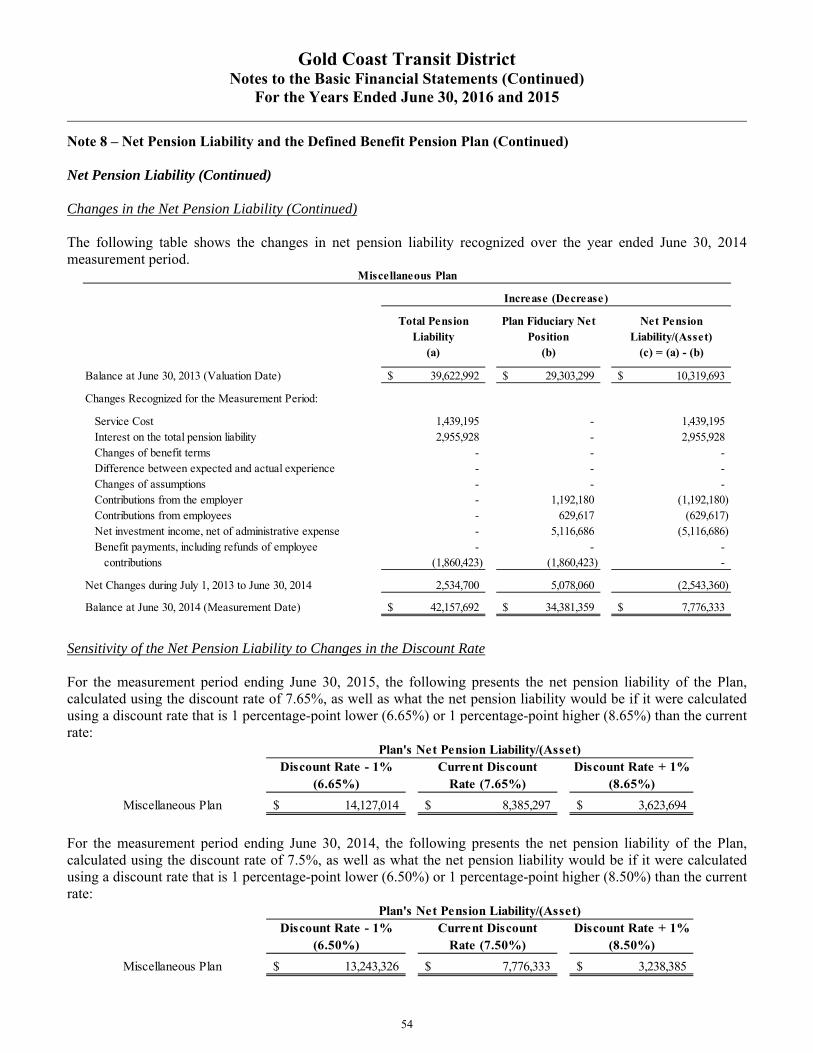
Gold Coast Transit District Notes to the Basic Financial Statements (Continued)
For the Years Ended June 30, 2016 and 2015
54
Note 8 – Net Pension Liability and the Defined Benefit Pension Plan (Continued) Net Pension Liability (Continued) Changes in the Net Pension Liability (Continued) The following table shows the changes in net pension liability recognized over the year ended June 30, 2014 measurement period.
Total Pension Plan Fiduciary Net Net PensionLiability Position Liability/(Asset)
(a) (b) (c) = (a) - (b)
Balance at June 30, 2013 (Valuation Date) 39,622,992$ 29,303,299$ 10,319,693$
Changes Recognized for the Measurement Period:
Service Cost 1,439,195 - 1,439,195 Interest on the total pension liability 2,955,928 - 2,955,928 Changes of benefit terms - - - Difference between expected and actual experience - - - Changes of assumptions - - - Contributions from the employer - 1,192,180 (1,192,180) Contributions from employees - 629,617 (629,617) Net investment income, net of administrative expense - 5,116,686 (5,116,686) Benefit payments, including refunds of employee - - -
contributions (1,860,423) (1,860,423) -
Net Changes during July 1, 2013 to June 30, 2014 2,534,700 5,078,060 (2,543,360)
Balance at June 30, 2014 (Measurement Date) 42,157,692$ 34,381,359$ 7,776,333$
Miscellaneous Plan
Increase (Decrease)
Sensitivity of the Net Pension Liability to Changes in the Discount Rate For the measurement period ending June 30, 2015, the following presents the net pension liability of the Plan, calculated using the discount rate of 7.65%, as well as what the net pension liability would be if it were calculated using a discount rate that is 1 percentage-point lower (6.65%) or 1 percentage-point higher (8.65%) than the current rate:
Discount Rate - 1% Current Discount Discount Rate + 1%(6.65%) Rate (7.65%) (8.65%)
Miscellaneous Plan 14,127,014$ 8,385,297$ 3,623,694$
Plan's Net Pension Liability/(Asset)
For the measurement period ending June 30, 2014, the following presents the net pension liability of the Plan, calculated using the discount rate of 7.5%, as well as what the net pension liability would be if it were calculated using a discount rate that is 1 percentage-point lower (6.50%) or 1 percentage-point higher (8.50%) than the current rate:
Discount Rate - 1% Current Discount Discount Rate + 1%(6.50%) Rate (7.50%) (8.50%)
Miscellaneous Plan 13,243,326$ 7,776,333$ 3,238,385$
Plan's Net Pension Liability/(Asset)
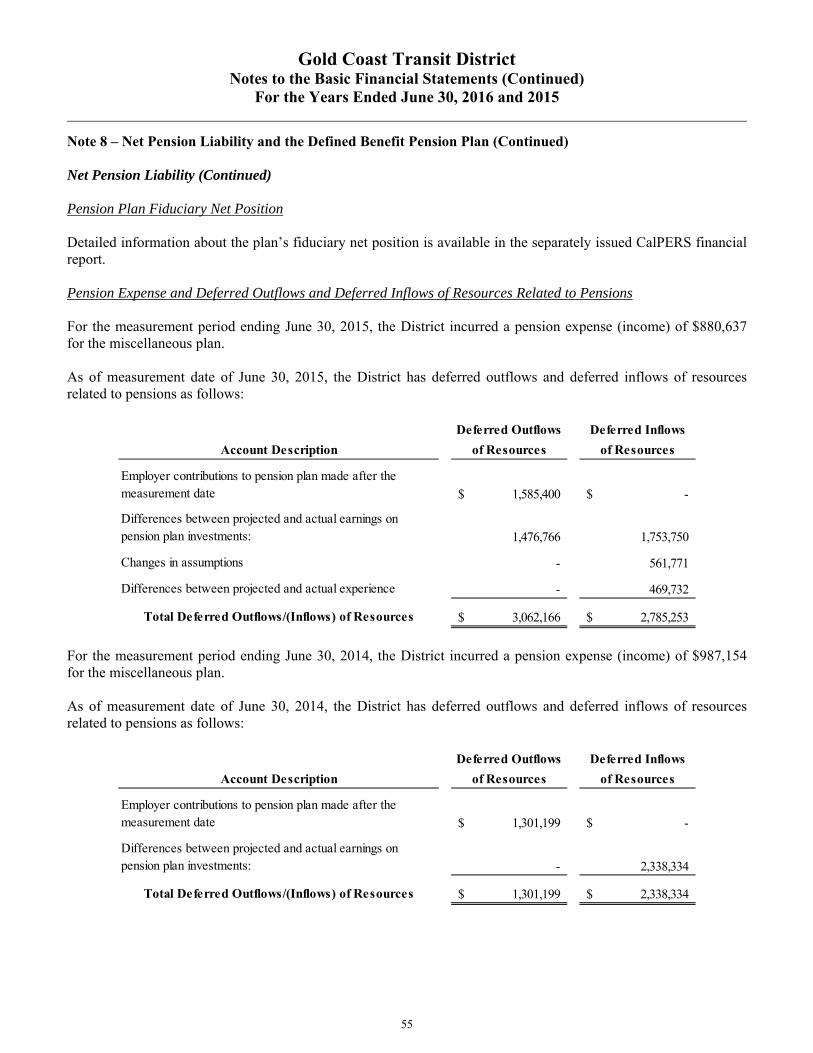
Gold Coast Transit District Notes to the Basic Financial Statements (Continued)
For the Years Ended June 30, 2016 and 2015
55
Note 8 – Net Pension Liability and the Defined Benefit Pension Plan (Continued) Net Pension Liability (Continued) Pension Plan Fiduciary Net Position Detailed information about the plan’s fiduciary net position is available in the separately issued CalPERS financial report.
Pension Expense and Deferred Outflows and Deferred Inflows of Resources Related to Pensions For the measurement period ending June 30, 2015, the District incurred a pension expense (income) of $880,637 for the miscellaneous plan. As of measurement date of June 30, 2015, the District has deferred outflows and deferred inflows of resources related to pensions as follows:
Deferred Outflows Deferred Inflows
Account Description of Resources of Resources
Employer contributions to pension plan made after the measurement date 1,585,400$ -$
Differences between projected and actual earnings on pension plan investments: 1,476,766 1,753,750
Changes in assumptions - 561,771
Differences between projected and actual experience - 469,732
Total Deferred Outflows/(Inflows) of Resources 3,062,166$ 2,785,253$
For the measurement period ending June 30, 2014, the District incurred a pension expense (income) of $987,154 for the miscellaneous plan. As of measurement date of June 30, 2014, the District has deferred outflows and deferred inflows of resources related to pensions as follows:
Deferred Outflows Deferred Inflows
Account Description of Resources of Resources
Employer contributions to pension plan made after the measurement date 1,301,199$ -$
Differences between projected and actual earnings on pension plan investments: - 2,338,334
Total Deferred Outflows/(Inflows) of Resources 1,301,199$ 2,338,334$
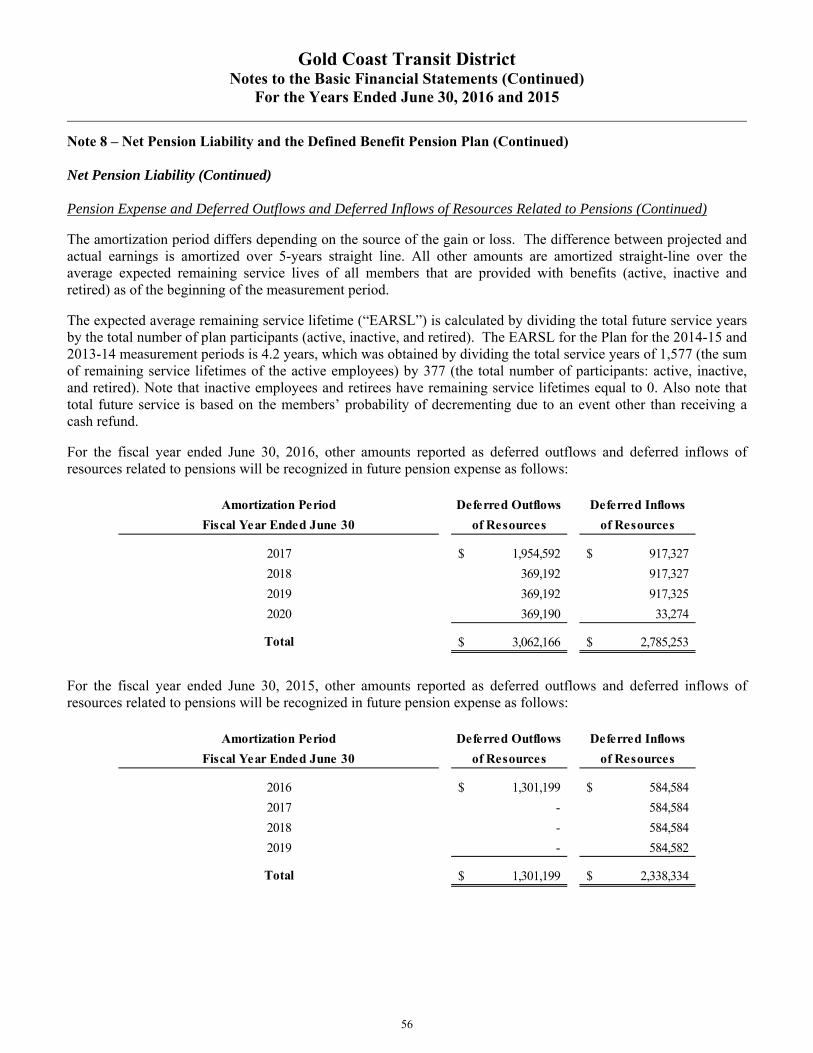
Gold Coast Transit District Notes to the Basic Financial Statements (Continued)
For the Years Ended June 30, 2016 and 2015
56
Note 8 – Net Pension Liability and the Defined Benefit Pension Plan (Continued) Net Pension Liability (Continued) Pension Expense and Deferred Outflows and Deferred Inflows of Resources Related to Pensions (Continued) The amortization period differs depending on the source of the gain or loss. The difference between projected and actual earnings is amortized over 5-years straight line. All other amounts are amortized straight-line over the average expected remaining service lives of all members that are provided with benefits (active, inactive and retired) as of the beginning of the measurement period. The expected average remaining service lifetime (“EARSL”) is calculated by dividing the total future service years by the total number of plan participants (active, inactive, and retired). The EARSL for the Plan for the 2014-15 and 2013-14 measurement periods is 4.2 years, which was obtained by dividing the total service years of 1,577 (the sum of remaining service lifetimes of the active employees) by 377 (the total number of participants: active, inactive, and retired). Note that inactive employees and retirees have remaining service lifetimes equal to 0. Also note that total future service is based on the members’ probability of decrementing due to an event other than receiving a cash refund. For the fiscal year ended June 30, 2016, other amounts reported as deferred outflows and deferred inflows of resources related to pensions will be recognized in future pension expense as follows:
Amortization Period Deferred Outflows Deferred Inflows
Fiscal Year Ended June 30 of Resources of Resources
2017 1,954,592$ 917,327$
2018 369,192 917,327
2019 369,192 917,325
2020 369,190 33,274
Total 3,062,166$ 2,785,253$
For the fiscal year ended June 30, 2015, other amounts reported as deferred outflows and deferred inflows of resources related to pensions will be recognized in future pension expense as follows:
Amortization Period Deferred Outflows Deferred Inflows
Fiscal Year Ended June 30 of Resources of Resources
2016 1,301,199$ 584,584$
2017 - 584,584
2018 - 584,584
2019 - 584,582
Total 1,301,199$ 2,338,334$
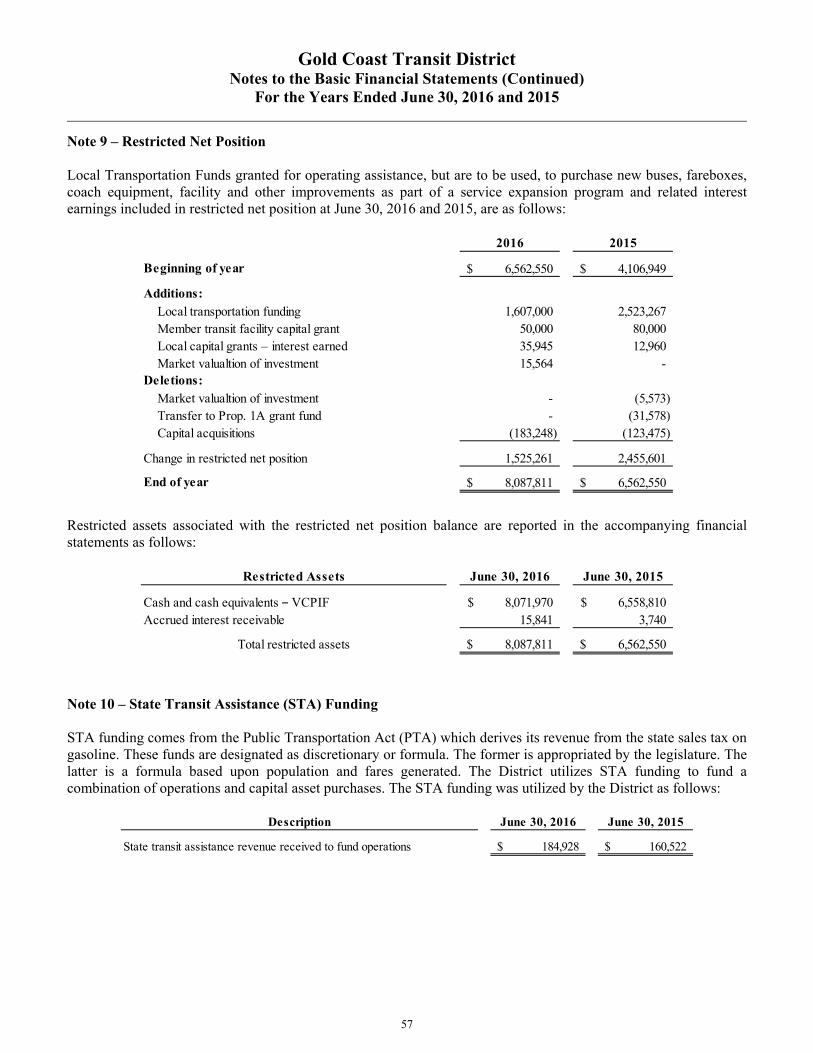
Gold Coast Transit District Notes to the Basic Financial Statements (Continued)
For the Years Ended June 30, 2016 and 2015
57
Note 9 – Restricted Net Position Local Transportation Funds granted for operating assistance, but are to be used, to purchase new buses, fareboxes, coach equipment, facility and other improvements as part of a service expansion program and related interest earnings included in restricted net position at June 30, 2016 and 2015, are as follows:
2016 2015
Beginning of year 6,562,550$ 4,106,949$
Additions: Local transportation funding 1,607,000 2,523,267 Member transit facility capital grant 50,000 80,000 Local capital grants – interest earned 35,945 12,960 Market valualtion of investment 15,564 - Deletions: Market valualtion of investment - (5,573) Transfer to Prop. 1A grant fund - (31,578) Capital acquisitions (183,248) (123,475)
Change in restricted net position 1,525,261 2,455,601
End of year 8,087,811$ 6,562,550$
Restricted assets associated with the restricted net position balance are reported in the accompanying financial statements as follows:
Restricted Assets June 30, 2016 June 30, 2015
Cash and cash equivalents – VCPIF 8,071,970$ 6,558,810$ Accrued interest receivable 15,841 3,740
Total restricted assets 8,087,811$ 6,562,550$
Note 10 – State Transit Assistance (STA) Funding STA funding comes from the Public Transportation Act (PTA) which derives its revenue from the state sales tax on gasoline. These funds are designated as discretionary or formula. The former is appropriated by the legislature. The latter is a formula based upon population and fares generated. The District utilizes STA funding to fund a combination of operations and capital asset purchases. The STA funding was utilized by the District as follows:
June 30, 2016 June 30, 2015
State transit assistance revenue received to fund operations 184,928$ 160,522$
Description
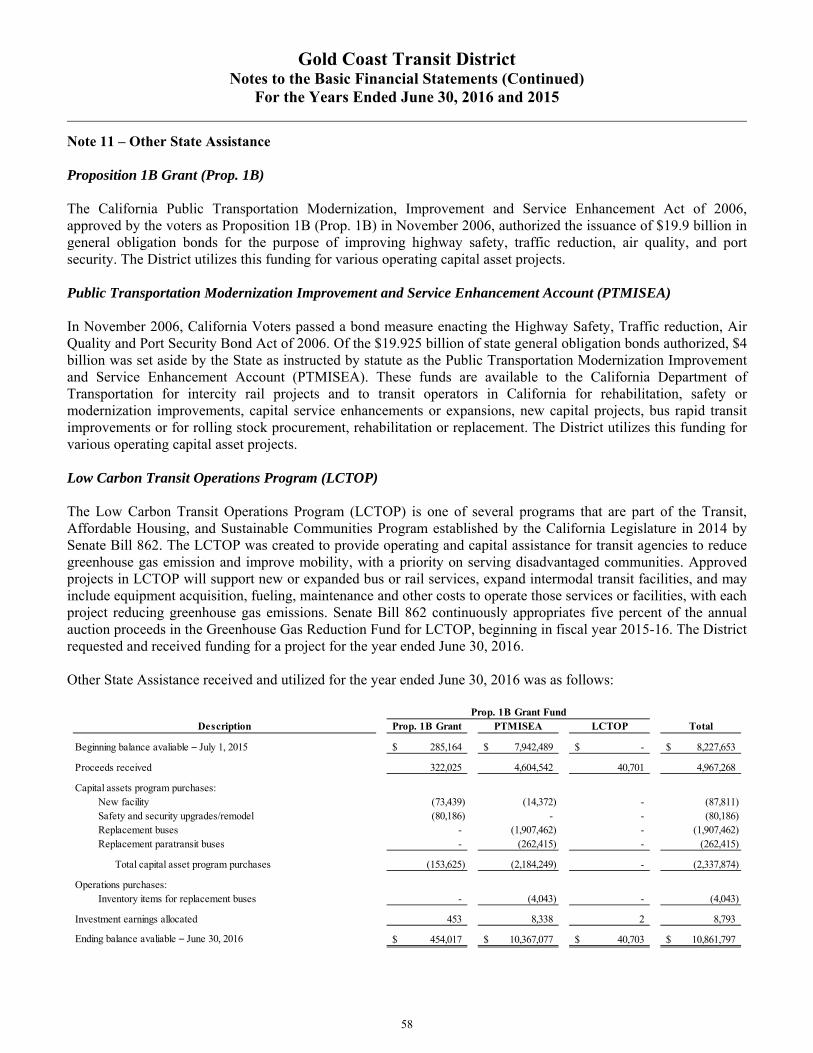
Gold Coast Transit District Notes to the Basic Financial Statements (Continued)
For the Years Ended June 30, 2016 and 2015
58
Note 11 – Other State Assistance Proposition 1B Grant (Prop. 1B) The California Public Transportation Modernization, Improvement and Service Enhancement Act of 2006, approved by the voters as Proposition 1B (Prop. 1B) in November 2006, authorized the issuance of $19.9 billion in general obligation bonds for the purpose of improving highway safety, traffic reduction, air quality, and port security. The District utilizes this funding for various operating capital asset projects. Public Transportation Modernization Improvement and Service Enhancement Account (PTMISEA) In November 2006, California Voters passed a bond measure enacting the Highway Safety, Traffic reduction, Air Quality and Port Security Bond Act of 2006. Of the $19.925 billion of state general obligation bonds authorized, $4 billion was set aside by the State as instructed by statute as the Public Transportation Modernization Improvement and Service Enhancement Account (PTMISEA). These funds are available to the California Department of Transportation for intercity rail projects and to transit operators in California for rehabilitation, safety or modernization improvements, capital service enhancements or expansions, new capital projects, bus rapid transit improvements or for rolling stock procurement, rehabilitation or replacement. The District utilizes this funding for various operating capital asset projects. Low Carbon Transit Operations Program (LCTOP) The Low Carbon Transit Operations Program (LCTOP) is one of several programs that are part of the Transit, Affordable Housing, and Sustainable Communities Program established by the California Legislature in 2014 by Senate Bill 862. The LCTOP was created to provide operating and capital assistance for transit agencies to reduce greenhouse gas emission and improve mobility, with a priority on serving disadvantaged communities. Approved projects in LCTOP will support new or expanded bus or rail services, expand intermodal transit facilities, and may include equipment acquisition, fueling, maintenance and other costs to operate those services or facilities, with each project reducing greenhouse gas emissions. Senate Bill 862 continuously appropriates five percent of the annual auction proceeds in the Greenhouse Gas Reduction Fund for LCTOP, beginning in fiscal year 2015-16. The District requested and received funding for a project for the year ended June 30, 2016. Other State Assistance received and utilized for the year ended June 30, 2016 was as follows:
Prop. 1B Grant PTMISEA LCTOP Total
Beginning balance avaliable – July 1, 2015 285,164$ 7,942,489$ -$ 8,227,653$
Proceeds received 322,025 4,604,542 40,701 4,967,268
Capital assets program purchases:New facility (73,439) (14,372) - (87,811) Safety and security upgrades/remodel (80,186) - - (80,186) Replacement buses - (1,907,462) - (1,907,462) Replacement paratransit buses - (262,415) - (262,415)
Total capital asset program purchases (153,625) (2,184,249) - (2,337,874)
Operations purchases:Inventory items for replacement buses - (4,043) - (4,043)
Investment earnings allocated 453 8,338 2 8,793
Ending balance avaliable – June 30, 2016 454,017$ 10,367,077$ 40,703$ 10,861,797$
Prop. 1B Grant FundDescription
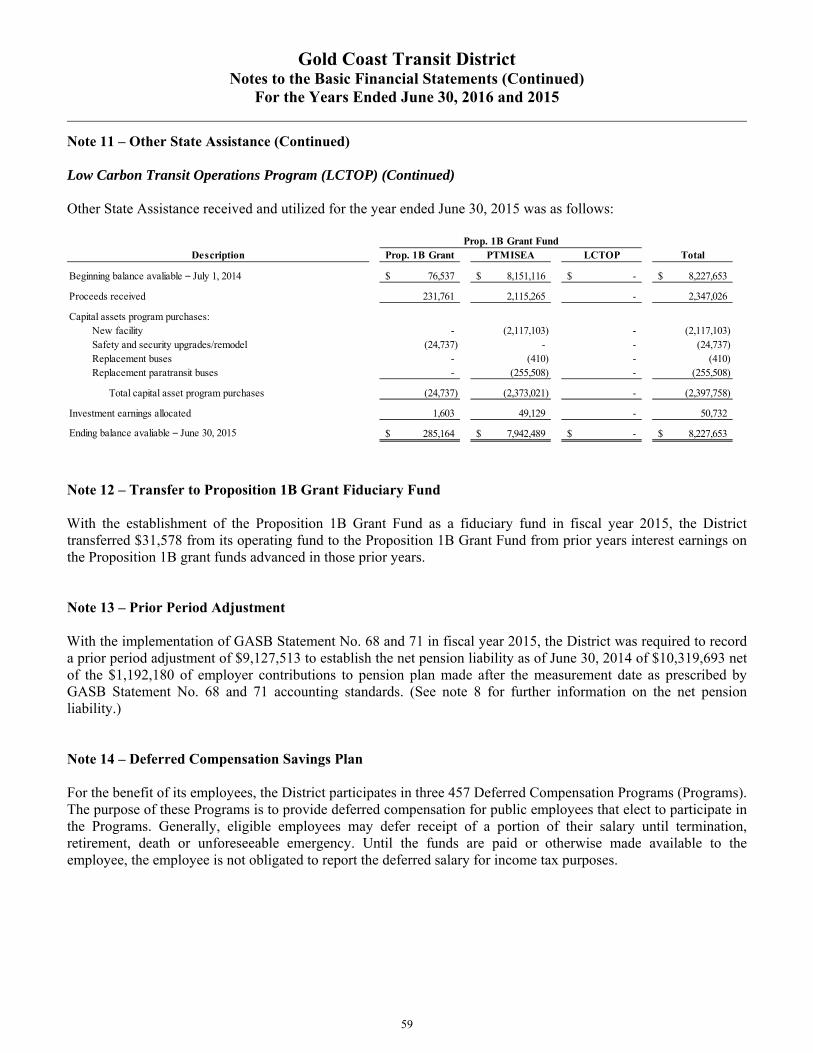
Gold Coast Transit District Notes to the Basic Financial Statements (Continued)
For the Years Ended June 30, 2016 and 2015
59
Note 11 – Other State Assistance (Continued) Low Carbon Transit Operations Program (LCTOP) (Continued) Other State Assistance received and utilized for the year ended June 30, 2015 was as follows:
Prop. 1B Grant PTMISEA LCTOP Total
Beginning balance avaliable – July 1, 2014 76,537$ 8,151,116$ -$ 8,227,653$
Proceeds received 231,761 2,115,265 - 2,347,026
Capital assets program purchases:New facility - (2,117,103) - (2,117,103) Safety and security upgrades/remodel (24,737) - - (24,737) Replacement buses - (410) - (410) Replacement paratransit buses - (255,508) - (255,508)
Total capital asset program purchases (24,737) (2,373,021) - (2,397,758)
Investment earnings allocated 1,603 49,129 - 50,732
Ending balance avaliable – June 30, 2015 285,164$ 7,942,489$ -$ 8,227,653$
DescriptionProp. 1B Grant Fund
Note 12 – Transfer to Proposition 1B Grant Fiduciary Fund With the establishment of the Proposition 1B Grant Fund as a fiduciary fund in fiscal year 2015, the District transferred $31,578 from its operating fund to the Proposition 1B Grant Fund from prior years interest earnings on the Proposition 1B grant funds advanced in those prior years. Note 13 – Prior Period Adjustment With the implementation of GASB Statement No. 68 and 71 in fiscal year 2015, the District was required to record a prior period adjustment of $9,127,513 to establish the net pension liability as of June 30, 2014 of $10,319,693 net of the $1,192,180 of employer contributions to pension plan made after the measurement date as prescribed by GASB Statement No. 68 and 71 accounting standards. (See note 8 for further information on the net pension liability.) Note 14 – Deferred Compensation Savings Plan For the benefit of its employees, the District participates in three 457 Deferred Compensation Programs (Programs). The purpose of these Programs is to provide deferred compensation for public employees that elect to participate in the Programs. Generally, eligible employees may defer receipt of a portion of their salary until termination, retirement, death or unforeseeable emergency. Until the funds are paid or otherwise made available to the employee, the employee is not obligated to report the deferred salary for income tax purposes.
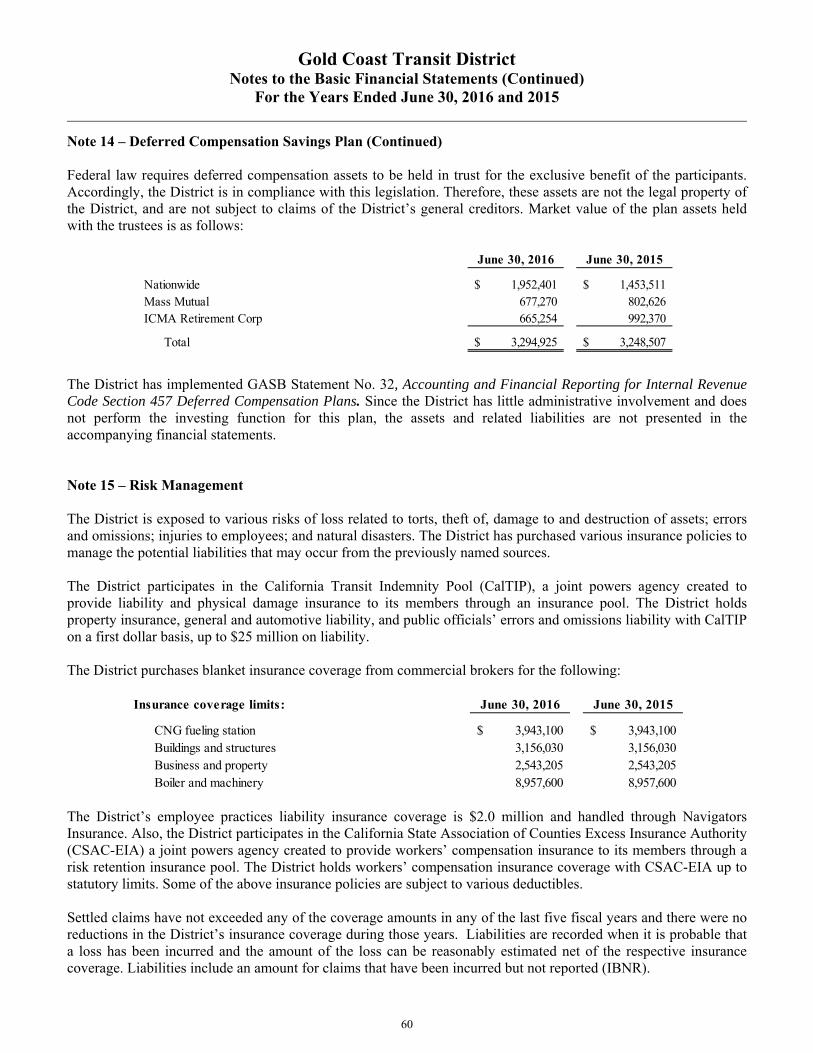
Gold Coast Transit District Notes to the Basic Financial Statements (Continued)
For the Years Ended June 30, 2016 and 2015
60
Note 14 – Deferred Compensation Savings Plan (Continued) Federal law requires deferred compensation assets to be held in trust for the exclusive benefit of the participants. Accordingly, the District is in compliance with this legislation. Therefore, these assets are not the legal property of the District, and are not subject to claims of the District’s general creditors. Market value of the plan assets held with the trustees is as follows:
June 30, 2016 June 30, 2015
Nationwide 1,952,401$ 1,453,511$ Mass Mutual 677,270 802,626 ICMA Retirement Corp 665,254 992,370
Total 3,294,925$ 3,248,507$
The District has implemented GASB Statement No. 32, Accounting and Financial Reporting for Internal Revenue Code Section 457 Deferred Compensation Plans. Since the District has little administrative involvement and does not perform the investing function for this plan, the assets and related liabilities are not presented in the accompanying financial statements. Note 15 – Risk Management The District is exposed to various risks of loss related to torts, theft of, damage to and destruction of assets; errors and omissions; injuries to employees; and natural disasters. The District has purchased various insurance policies to manage the potential liabilities that may occur from the previously named sources. The District participates in the California Transit Indemnity Pool (CalTIP), a joint powers agency created to provide liability and physical damage insurance to its members through an insurance pool. The District holds property insurance, general and automotive liability, and public officials’ errors and omissions liability with CalTIP on a first dollar basis, up to $25 million on liability. The District purchases blanket insurance coverage from commercial brokers for the following:
Insurance coverage limits: June 30, 2016 June 30, 2015
CNG fueling station 3,943,100$ 3,943,100$ Buildings and structures 3,156,030 3,156,030 Business and property 2,543,205 2,543,205 Boiler and machinery 8,957,600 8,957,600
The District’s employee practices liability insurance coverage is $2.0 million and handled through Navigators Insurance. Also, the District participates in the California State Association of Counties Excess Insurance Authority (CSAC-EIA) a joint powers agency created to provide workers’ compensation insurance to its members through a risk retention insurance pool. The District holds workers’ compensation insurance coverage with CSAC-EIA up to statutory limits. Some of the above insurance policies are subject to various deductibles. Settled claims have not exceeded any of the coverage amounts in any of the last five fiscal years and there were no reductions in the District’s insurance coverage during those years. Liabilities are recorded when it is probable that a loss has been incurred and the amount of the loss can be reasonably estimated net of the respective insurance coverage. Liabilities include an amount for claims that have been incurred but not reported (IBNR).
Gold Coast Transit District Notes to the Basic Financial Statements (Continued)
For the Years Ended June 30, 2016 and 2015
61
Note 16 – Commitments Operating Lease Beginning October 1, 2001, the District entered into a lease agreement with the City of Oxnard to rent office space in the Oxnard Transportation Center (OTC) for customer service and administrative purposes. In 2016 the District is in the final process of negotiating a 10-year extension of the OTC lease that is anticipated to commence on December 1, 2016, as follows: During the term, Tenant agrees to pay Landlord as “Base Rent” for the Leased Premises, the sum of $997.14 per month, (subject to adjustment as hereinafter provided). The Base Rent shall be due and payable to the Landlord on the first day of each and every calendar month during the Term. Base Rent for the first month of the Term, or portion thereof, shall be paid concurrent with the execution of this Lease. If the Commencement Date is not the first day of a calendar month, or if the Term ends on a day other than the last day of a calendar month, then the rental for such partial month(s) shall be prorated based on a 30-day month. The Base Rent shall be increased every twelve (12) months after the Commencement Date (“Adjustment Date(s)”) during the Term in an amount equal to two percent (2%) for each new twelve (12) month period until November 30, 2019. Beginning on December 1, 2019, the Base Rent shall be increased during the Term in an amount equal to the Consumer Price Index for All Urban Consumers (CPI-U) for the Los Angeles-Riverside-Orange County California area published by the United States Department of Labor, Bureau of Labor Statistics for each new twelve (12) month period provided, however, that no annual increase will be greater than three percent (3%). All amounts due from Tenant to Landlord under this Lease other than Base Rent shall constitute “Additional Rent.” The Base Rent and Additional Rent are sometimes collectively referred to hereinafter as “Rent.” Rent shall be paid to Landlord, without deduction or offset, in lawful money of the United States of America, which shall be legal tender at the time of payment, at the office of Landlord or to such other person or at such other place as Landlord may from time to time designate in writing. Litigation In the ordinary course of operations, the District is subject to claims and litigation from outside parties. After consultation with legal counsel, the District believes the ultimate outcome of such matters, if any, will not materially affect its financial condition. Grant Funding Grant funds received by the District are subject to review by the grantor agencies. Such audit could lead to requests for reimbursements to the grantor agencies for expenditures disallowed under terms of the grant. The management of the District believes that such disallowances, if any, would not be significant. Operating Fare Revenue Ratio The District is required to maintain a ratio of fares to operating costs of at least 20% for either the combined service of fixed route and paratransit service or meeting the goals separately (i.e. 20% for fixed route and 10% for paratransit service) to continue to be eligible for Local Transportation Funds. For the years ended June 30, 2016 and 2015, the District met this requirement with fares to operating costs ratio of combined service of 23.7% and 25.1%, respectively.

62
This page intentionally left blank
63
REQUIRED SUPPLEMENTARY INFORMATION

64
This page intentionally left blank
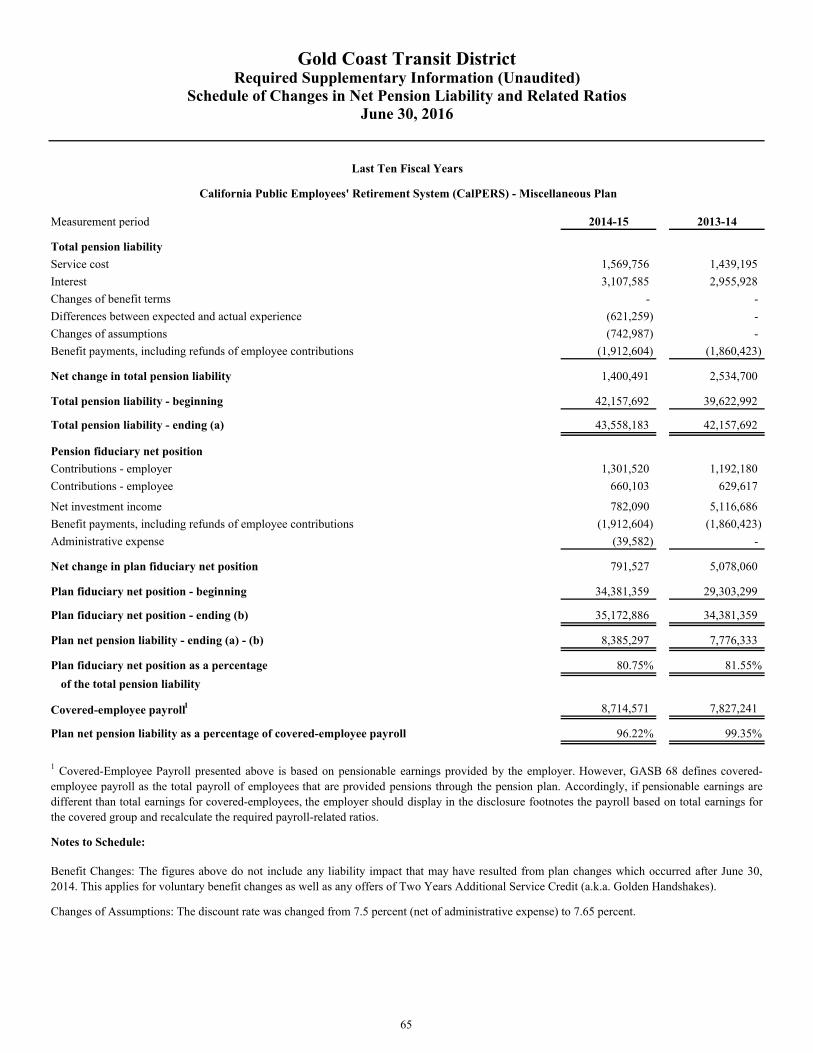
Measurement period 2014-15 2013-14
Total pension liability
Service cost 1,569,756 1,439,195
Interest 3,107,585 2,955,928
Changes of benefit terms - -
Differences between expected and actual experience (621,259) -
Changes of assumptions (742,987) -
Benefit payments, including refunds of employee contributions (1,912,604) (1,860,423)
Net change in total pension liability 1,400,491 2,534,700
Total pension liability - beginning 42,157,692 39,622,992
Total pension liability - ending (a) 43,558,183 42,157,692
Pension fiduciary net position
Contributions - employer 1,301,520 1,192,180
Contributions - employee 660,103 629,617
Net investment income 782,090 5,116,686
Benefit payments, including refunds of employee contributions (1,912,604) (1,860,423)
Administrative expense (39,582) -
Net change in plan fiduciary net position 791,527 5,078,060
Plan fiduciary net position - beginning 34,381,359 29,303,299
Plan fiduciary net position - ending (b) 35,172,886 34,381,359
Plan net pension liability - ending (a) - (b) 8,385,297 7,776,333
Plan fiduciary net position as a percentage 80.75% 81.55%
of the total pension liability
Covered-employee payroll1 8,714,571 7,827,241
Plan net pension liability as a percentage of covered-employee payroll 96.22% 99.35%
Notes to Schedule:
Benefit Changes: The figures above do not include any liability impact that may have resulted from plan changes which occurred after June 30,2014. This applies for voluntary benefit changes as well as any offers of Two Years Additional Service Credit (a.k.a. Golden Handshakes).
Changes of Assumptions: The discount rate was changed from 7.5 percent (net of administrative expense) to 7.65 percent.
Gold Coast Transit DistrictRequired Supplementary Information (Unaudited)
Schedule of Changes in Net Pension Liability and Related RatiosJune 30, 2016
Last Ten Fiscal Years
California Public Employees' Retirement System (CalPERS) - Miscellaneous Plan
1 Covered-Employee Payroll presented above is based on pensionable earnings provided by the employer. However, GASB 68 defines covered-employee payroll as the total payroll of employees that are provided pensions through the pension plan. Accordingly, if pensionable earnings aredifferent than total earnings for covered-employees, the employer should display in the disclosure footnotes the payroll based on total earnings forthe covered group and recalculate the required payroll-related ratios.
65
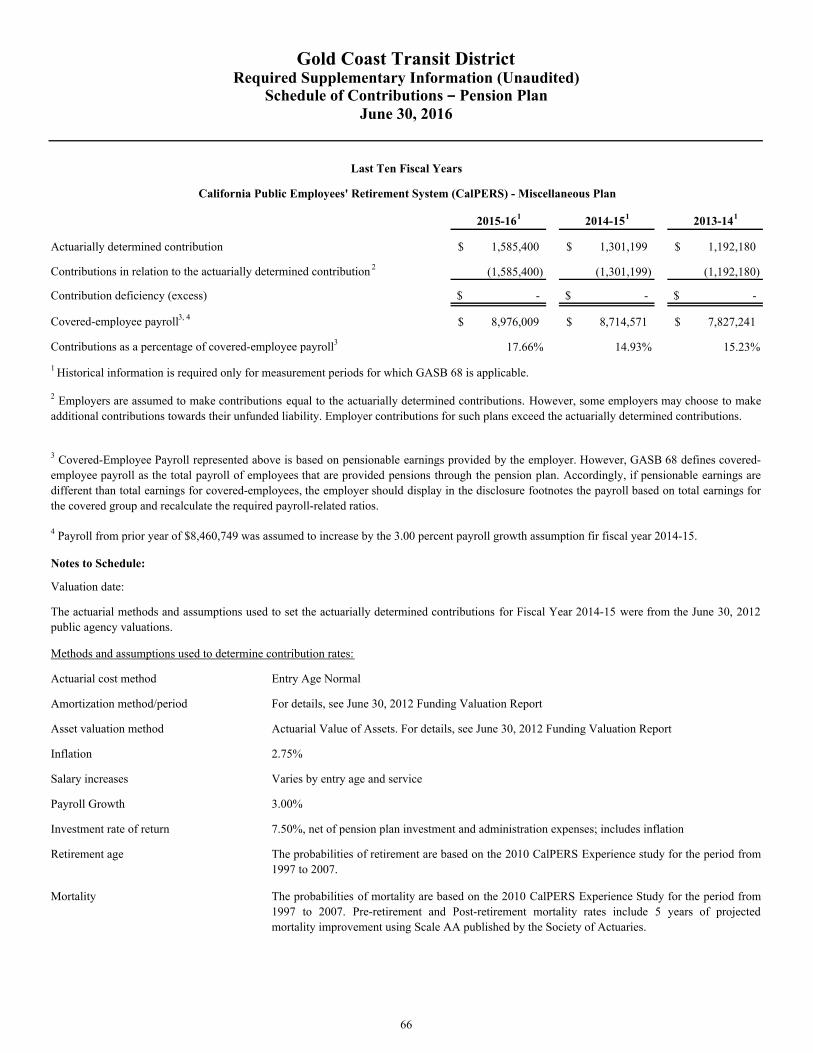
2015-161 2014-151 2013-141
Actuarially determined contribution 1,585,400$ 1,301,199$ 1,192,180$
Contributions in relation to the actuarially determined contribution 2 (1,585,400) (1,301,199) (1,192,180)
Contribution deficiency (excess) -$ -$ -$
Covered-employee payroll3, 4 8,976,009$ 8,714,571$ 7,827,241$
Contributions as a percentage of covered-employee payroll3 17.66% 14.93% 15.23%
Notes to Schedule:
Valuation date:
Methods and assumptions used to determine contribution rates:
Actuarial cost method Entry Age Normal
Amortization method/period For details, see June 30, 2012 Funding Valuation Report
Asset valuation method Actuarial Value of Assets. For details, see June 30, 2012 Funding Valuation Report
Inflation 2.75%
Salary increases Varies by entry age and service
Payroll Growth 3.00%
Investment rate of return
Retirement age
Mortality
The actuarial methods and assumptions used to set the actuarially determined contributions for Fiscal Year 2014-15 were from the June 30, 2012public agency valuations.
The probabilities of retirement are based on the 2010 CalPERS Experience study for the period from1997 to 2007.
The probabilities of mortality are based on the 2010 CalPERS Experience Study for the period from1997 to 2007. Pre-retirement and Post-retirement mortality rates include 5 years of projectedmortality improvement using Scale AA published by the Society of Actuaries.
7.50%, net of pension plan investment and administration expenses; includes inflation
4 Payroll from prior year of $8,460,749 was assumed to increase by the 3.00 percent payroll growth assumption fir fiscal year 2014-15.
3 Covered-Employee Payroll represented above is based on pensionable earnings provided by the employer. However, GASB 68 defines covered-employee payroll as the total payroll of employees that are provided pensions through the pension plan. Accordingly, if pensionable earnings aredifferent than total earnings for covered-employees, the employer should display in the disclosure footnotes the payroll based on total earnings forthe covered group and recalculate the required payroll-related ratios.
2 Employers are assumed to make contributions equal to the actuarially determined contributions. However, some employers may choose to makeadditional contributions towards their unfunded liability. Employer contributions for such plans exceed the actuarially determined contributions.
1 Historical information is required only for measurement periods for which GASB 68 is applicable.
Gold Coast Transit DistrictRequired Supplementary Information (Unaudited)
Schedule of Contributions – Pension PlanJune 30, 2016
Last Ten Fiscal Years
California Public Employees' Retirement System (CalPERS) - Miscellaneous Plan
66
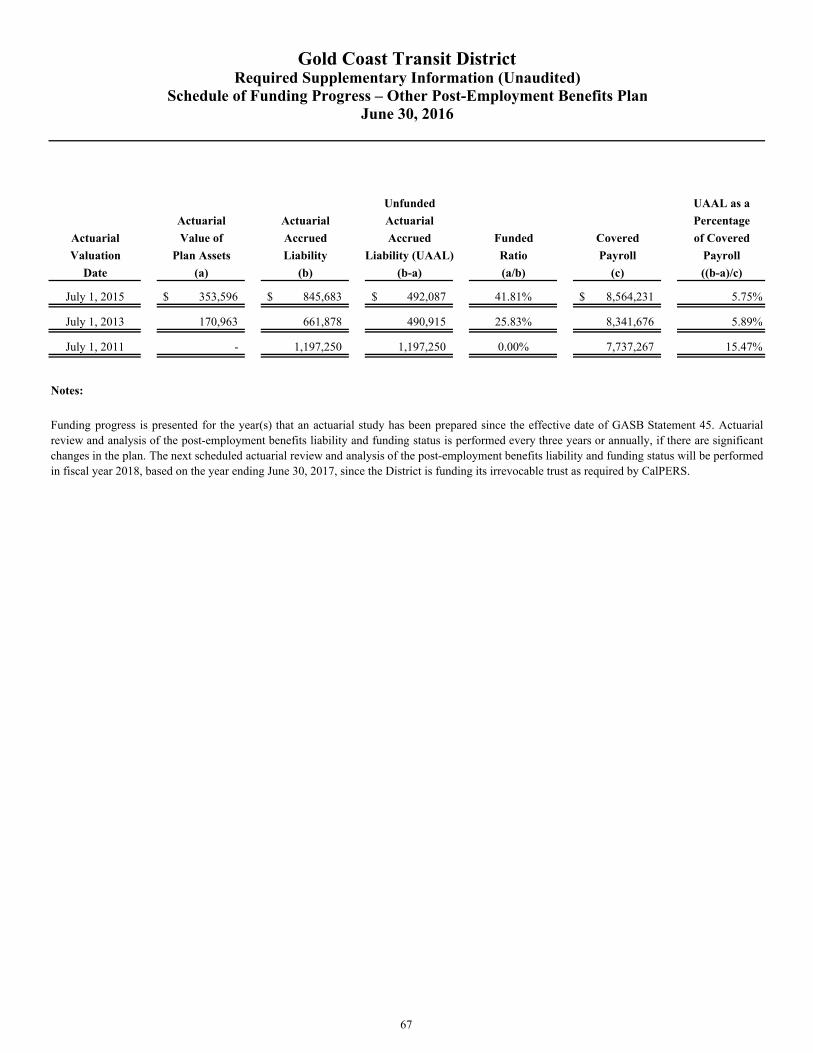
Unfunded UAAL as a
Actuarial Actuarial Actuarial Percentage
Actuarial Value of Accrued Accrued Funded Covered of Covered
Valuation Plan Assets Liability Liability (UAAL) Ratio Payroll Payroll
Date (a) (b) (b-a) (a/b) (c) ((b-a)/c)
July 1, 2015 353,596$ 845,683$ 492,087$ 41.81% 8,564,231$ 5.75%
July 1, 2013 170,963 661,878 490,915 25.83% 8,341,676 5.89%
July 1, 2011 - 1,197,250 1,197,250 0.00% 7,737,267 15.47%
Notes:
Funding progress is presented for the year(s) that an actuarial study has been prepared since the effective date of GASB Statement 45. Actuarialreview and analysis of the post-employment benefits liability and funding status is performed every three years or annually, if there are significantchanges in the plan. The next scheduled actuarial review and analysis of the post-employment benefits liability and funding status will be performedin fiscal year 2018, based on the year ending June 30, 2017, since the District is funding its irrevocable trust as required by CalPERS.
Gold Coast Transit DistrictRequired Supplementary Information (Unaudited)
Schedule of Funding Progress – Other Post-Employment Benefits PlanJune 30, 2016
67

This page intentionally left blank
68
69
SUPPLEMENTARY INFORMATION

70
This page intentionally left blank

Local Transportation Funding: Balance
Beginning balance:
Liability:
Unearned local transportation funding – June 30, 2015 5,368,692$
Net Position:
Restricted for capital acquisitions – June 30, 2015 6,562,550
Total beginning balance 11,931,242$ 11,931,242$
Current year operating revenue:
Local transportation funding 12,680,981$ 12,680,981
Fiscal year 2013-2014 unearned local transportation funding portion recognized as revenue 1,754,483
Fiscal year 2015-2016 unearned local transportation funding portion (2,176,755)
Fiscal year 2015-2016 local transportation funding recognized as a local capital grant (1,607,000)
Fiscal year 2015-2016 local transportation funding recognized as a member transit facility capital grant (50,000)
Fiscal year 2015-2016 local transportation funds revenue recognized 10,601,709$ (10,601,709)
Current year capital revenue:
Fiscal year 2015-2016 local transportation funding recognized as a local capital grant 1,607,000$
Fiscal year 2015-2016 local transportation funding recognized as a member transit facility capital grant 50,000
Local capital grants – interest earnings 35,945 35,945
Local capital grants – market valuation of investment 15,564 15,564
Fiscal year 2015-2016 local capital grants revenue recognized 1,708,509$
Current year capital acquisitions:Capital acquisitions – current year use of local transportation funds (183,248)$ (183,248)
Total ending balance 13,878,775$
Ending balance:
Liability:
Unearned – local transportation funding – June 30, 2016 5,790,964$
Net Position:
Restricted for capital acquisitions – June 30, 2016 8,087,811
Total ending balance 13,878,775$ 13,878,775$
Gold Coast Transit DistrictSchedule of Changes in Local Transportation Funding Activity of the District
For the Fiscal Year Ended June 30, 2016
71
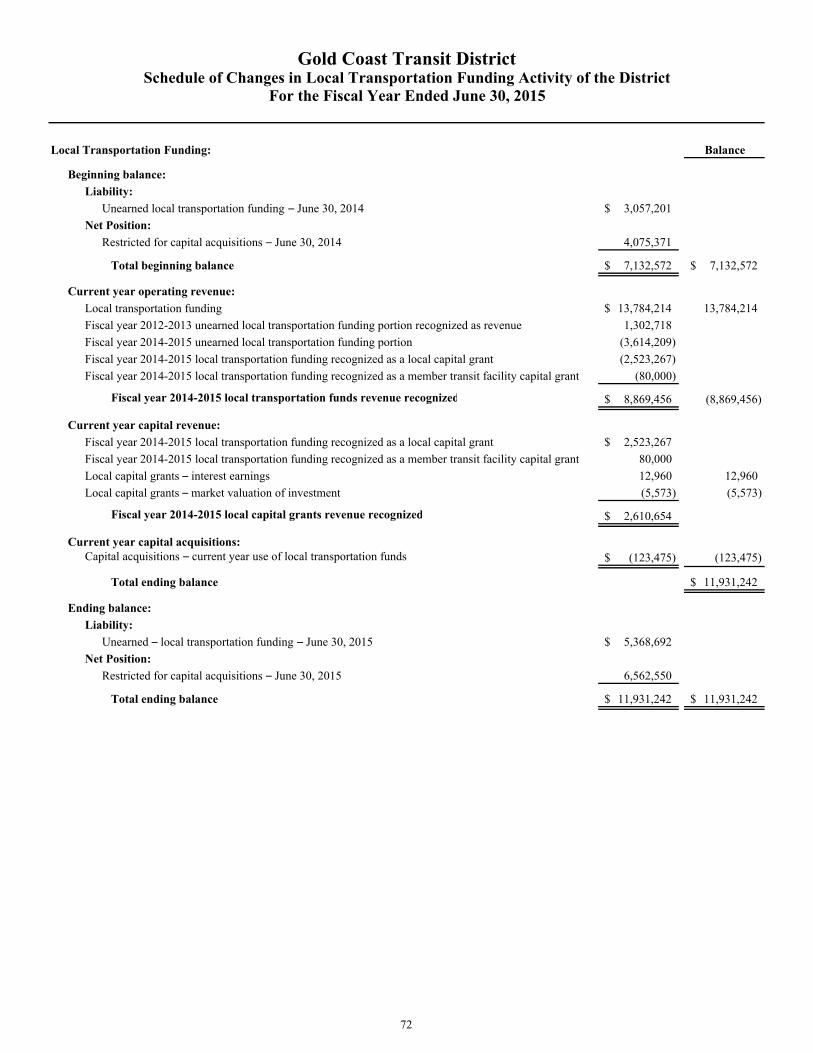
Local Transportation Funding: Balance
Beginning balance:
Liability:
Unearned local transportation funding – June 30, 2014 3,057,201$
Net Position:
Restricted for capital acquisitions – June 30, 2014 4,075,371
Total beginning balance 7,132,572$ 7,132,572$
Current year operating revenue:
Local transportation funding 13,784,214$ 13,784,214
Fiscal year 2012-2013 unearned local transportation funding portion recognized as revenue 1,302,718
Fiscal year 2014-2015 unearned local transportation funding portion (3,614,209)
Fiscal year 2014-2015 local transportation funding recognized as a local capital grant (2,523,267)
Fiscal year 2014-2015 local transportation funding recognized as a member transit facility capital grant (80,000)
Fiscal year 2014-2015 local transportation funds revenue recognized 8,869,456$ (8,869,456)
Current year capital revenue:
Fiscal year 2014-2015 local transportation funding recognized as a local capital grant 2,523,267$
Fiscal year 2014-2015 local transportation funding recognized as a member transit facility capital grant 80,000
Local capital grants – interest earnings 12,960 12,960
Local capital grants – market valuation of investment (5,573) (5,573)
Fiscal year 2014-2015 local capital grants revenue recognized 2,610,654$
Current year capital acquisitions:Capital acquisitions – current year use of local transportation funds (123,475)$ (123,475)
Total ending balance 11,931,242$
Ending balance:
Liability:
Unearned – local transportation funding – June 30, 2015 5,368,692$
Net Position:
Restricted for capital acquisitions – June 30, 2015 6,562,550
Total ending balance 11,931,242$ 11,931,242$
Gold Coast Transit DistrictSchedule of Changes in Local Transportation Funding Activity of the District
For the Fiscal Year Ended June 30, 2015
72
73
STATISTICAL SECTION

74
This page intentionally left blank
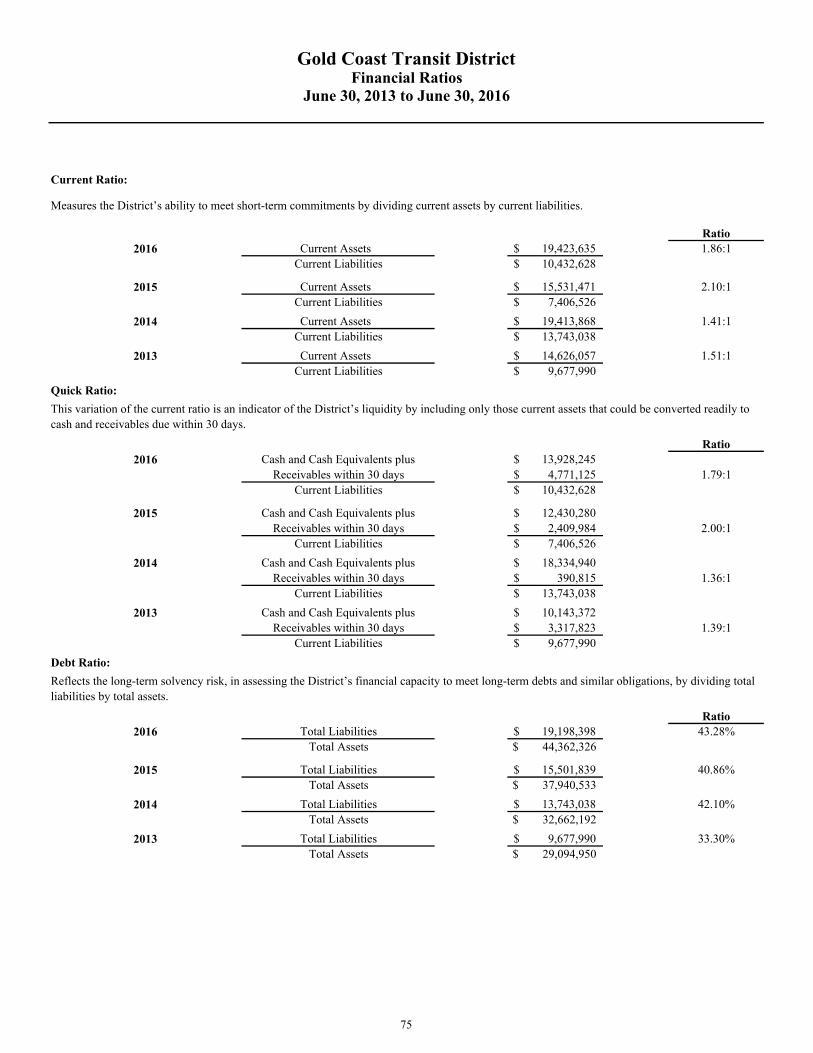
Current Ratio:
Ratio2016 Current Assets 19,423,635$ 1.86:1
Current Liabilities 10,432,628$
2015 Current Assets 15,531,471$ 2.10:1Current Liabilities 7,406,526$
2014 Current Assets 19,413,868$ 1.41:1Current Liabilities 13,743,038$
2013 Current Assets 14,626,057$ 1.51:1Current Liabilities 9,677,990$
Quick Ratio:
Ratio2016 Cash and Cash Equivalents plus 13,928,245$
Receivables within 30 days 4,771,125$ 1.79:1Current Liabilities 10,432,628$
2015 Cash and Cash Equivalents plus 12,430,280$ Receivables within 30 days 2,409,984$ 2.00:1
Current Liabilities 7,406,526$
2014 Cash and Cash Equivalents plus 18,334,940$ Receivables within 30 days 390,815$ 1.36:1
Current Liabilities 13,743,038$
2013 Cash and Cash Equivalents plus 10,143,372$ Receivables within 30 days 3,317,823$ 1.39:1
Current Liabilities 9,677,990$
Debt Ratio:
Ratio2016 Total Liabilities 19,198,398$ 43.28%
Total Assets $ 44,362,326
2015 Total Liabilities 15,501,839$ 40.86%Total Assets $ 37,940,533
2014 Total Liabilities 13,743,038$ 42.10%Total Assets $ 32,662,192
2013 Total Liabilities 9,677,990$ 33.30%Total Assets $ 29,094,950
Measures the District’s ability to meet short-term commitments by dividing current assets by current liabilities.
This variation of the current ratio is an indicator of the District’s liquidity by including only those current assets that could be converted readily to cash and receivables due within 30 days.
Reflects the long-term solvency risk, in assessing the District’s financial capacity to meet long-term debts and similar obligations, by dividing total liabilities by total assets.
Gold Coast Transit DistrictFinancial Ratios
June 30, 2013 to June 30, 2016
75
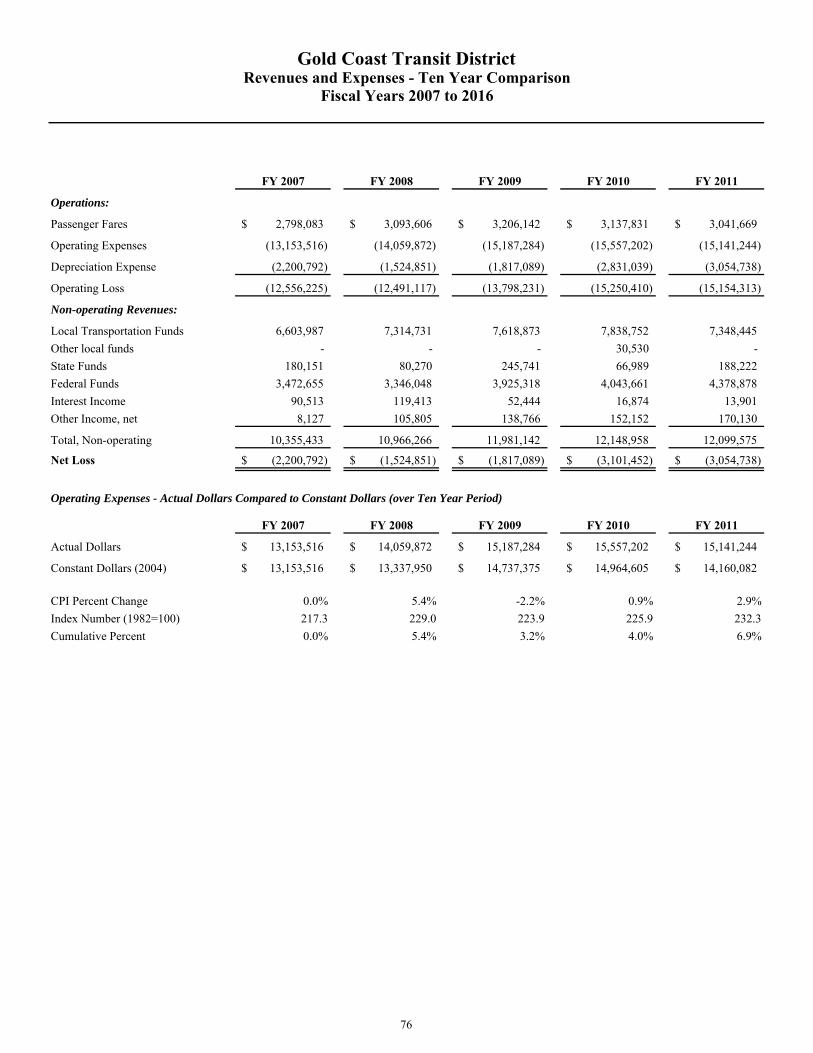
FY 2007 FY 2008 FY 2009 FY 2010 FY 2011
Operations:
Passenger Fares 2,798,083$ 3,093,606$ 3,206,142$ 3,137,831$ 3,041,669$
Operating Expenses (13,153,516) (14,059,872) (15,187,284) (15,557,202) (15,141,244)
Depreciation Expense (2,200,792) (1,524,851) (1,817,089) (2,831,039) (3,054,738)
Operating Loss (12,556,225) (12,491,117) (13,798,231) (15,250,410) (15,154,313)
Non-operating Revenues:
Local Transportation Funds 6,603,987 7,314,731 7,618,873 7,838,752 7,348,445
Other local funds - - - 30,530 -
State Funds 180,151 80,270 245,741 66,989 188,222
Federal Funds 3,472,655 3,346,048 3,925,318 4,043,661 4,378,878
Interest Income 90,513 119,413 52,444 16,874 13,901
Other Income, net 8,127 105,805 138,766 152,152 170,130
Total, Non-operating 10,355,433 10,966,266 11,981,142 12,148,958 12,099,575
Net Loss (2,200,792)$ (1,524,851)$ (1,817,089)$ (3,101,452)$ (3,054,738)$
Operating Expenses - Actual Dollars Compared to Constant Dollars (over Ten Year Period)
FY 2007 FY 2008 FY 2009 FY 2010 FY 2011
Actual Dollars 13,153,516$ 14,059,872$ 15,187,284$ 15,557,202$ 15,141,244$
Constant Dollars (2004) 13,153,516$ 13,337,950$ 14,737,375$ 14,964,605$ 14,160,082$
CPI Percent Change 0.0% 5.4% -2.2% 0.9% 2.9%
Index Number (1982=100) 217.3 229.0 223.9 225.9 232.3
Cumulative Percent 0.0% 5.4% 3.2% 4.0% 6.9%
Gold Coast Transit DistrictRevenues and Expenses - Ten Year Comparison
Fiscal Years 2007 to 2016
76
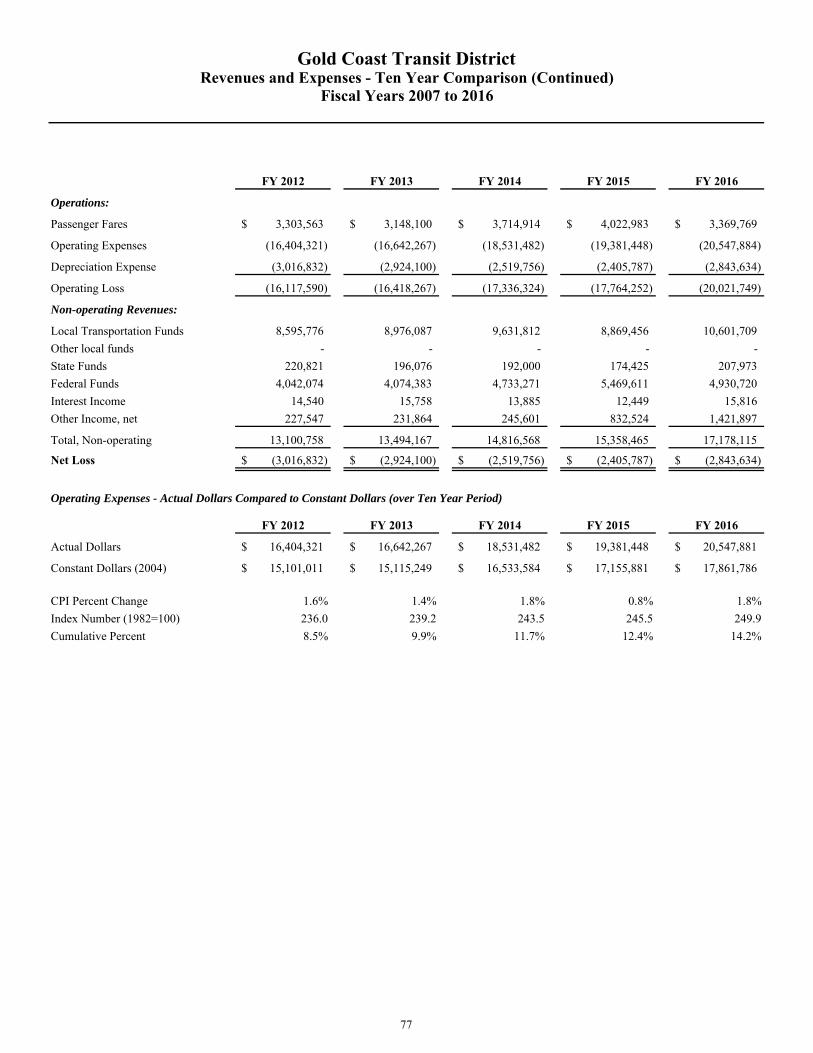
FY 2012 FY 2013 FY 2014 FY 2015 FY 2016
Operations:
Passenger Fares 3,303,563$ 3,148,100$ 3,714,914$ 4,022,983$ 3,369,769$
Operating Expenses (16,404,321) (16,642,267) (18,531,482) (19,381,448) (20,547,884)
Depreciation Expense (3,016,832) (2,924,100) (2,519,756) (2,405,787) (2,843,634)
Operating Loss (16,117,590) (16,418,267) (17,336,324) (17,764,252) (20,021,749)
Non-operating Revenues:
Local Transportation Funds 8,595,776 8,976,087 9,631,812 8,869,456 10,601,709
Other local funds - - - - -
State Funds 220,821 196,076 192,000 174,425 207,973
Federal Funds 4,042,074 4,074,383 4,733,271 5,469,611 4,930,720
Interest Income 14,540 15,758 13,885 12,449 15,816
Other Income, net 227,547 231,864 245,601 832,524 1,421,897
Total, Non-operating 13,100,758 13,494,167 14,816,568 15,358,465 17,178,115
Net Loss (3,016,832)$ (2,924,100)$ (2,519,756)$ (2,405,787)$ (2,843,634)$
Operating Expenses - Actual Dollars Compared to Constant Dollars (over Ten Year Period)
FY 2012 FY 2013 FY 2014 FY 2015 FY 2016
Actual Dollars 16,404,321$ 16,642,267$ 18,531,482$ 19,381,448$ 20,547,881$
Constant Dollars (2004) 15,101,011$ 15,115,249$ 16,533,584$ 17,155,881$ 17,861,786$
CPI Percent Change 1.6% 1.4% 1.8% 0.8% 1.8%
Index Number (1982=100) 236.0 239.2 243.5 245.5 249.9
Cumulative Percent 8.5% 9.9% 11.7% 12.4% 14.2%
Gold Coast Transit DistrictRevenues and Expenses - Ten Year Comparison (Continued)
Fiscal Years 2007 to 2016
77
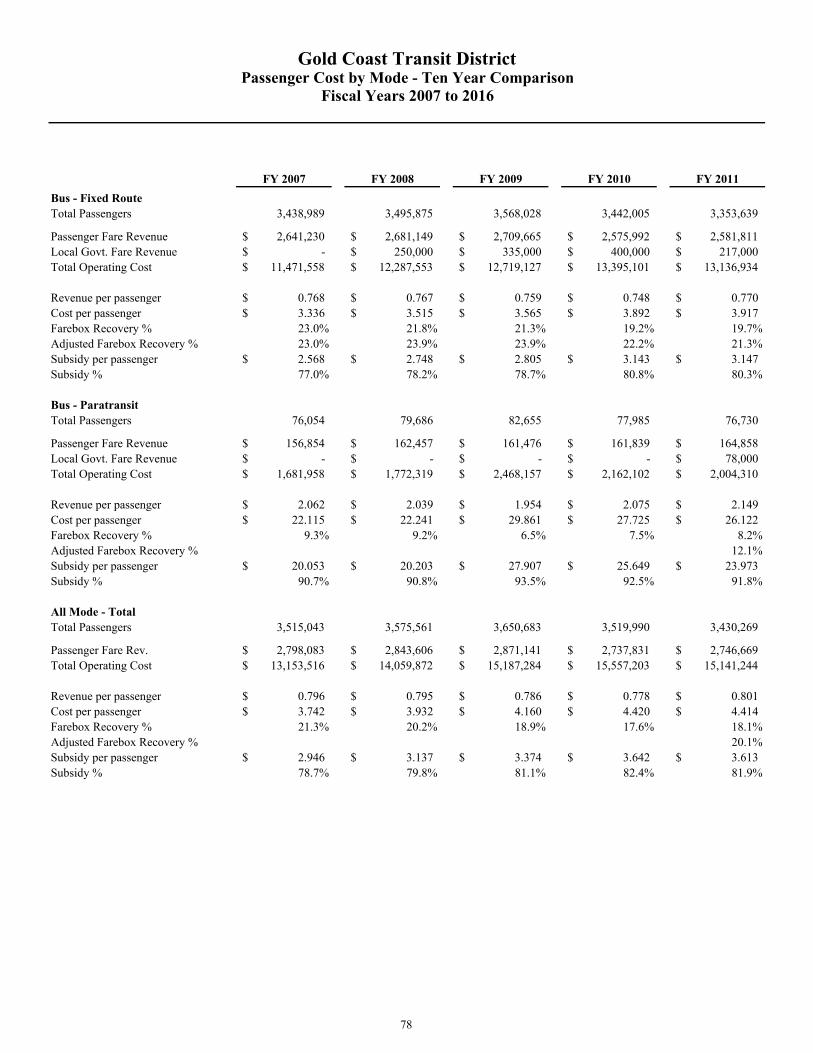
FY 2007 FY 2008 FY 2009 FY 2010 FY 2011
Bus - Fixed RouteTotal Passengers 3,438,989 3,495,875 3,568,028 3,442,005 3,353,639
Passenger Fare Revenue 2,641,230$ 2,681,149$ 2,709,665$ 2,575,992$ 2,581,811$ Local Govt. Fare Revenue -$ 250,000$ 335,000$ 400,000$ 217,000$ Total Operating Cost 11,471,558$ 12,287,553$ 12,719,127$ 13,395,101$ 13,136,934$
Revenue per passenger 0.768$ 0.767$ 0.759$ 0.748$ 0.770$ Cost per passenger 3.336$ 3.515$ 3.565$ 3.892$ 3.917$ Farebox Recovery % 23.0% 21.8% 21.3% 19.2% 19.7%Adjusted Farebox Recovery % 23.0% 23.9% 23.9% 22.2% 21.3%Subsidy per passenger 2.568$ 2.748$ 2.805$ 3.143$ 3.147$ Subsidy % 77.0% 78.2% 78.7% 80.8% 80.3%
Bus - ParatransitTotal Passengers 76,054 79,686 82,655 77,985 76,730
Passenger Fare Revenue 156,854$ 162,457$ 161,476$ 161,839$ 164,858$ Local Govt. Fare Revenue -$ -$ -$ -$ 78,000$ Total Operating Cost 1,681,958$ 1,772,319$ 2,468,157$ 2,162,102$ 2,004,310$
Revenue per passenger 2.062$ 2.039$ 1.954$ 2.075$ 2.149$ Cost per passenger 22.115$ 22.241$ 29.861$ 27.725$ 26.122$ Farebox Recovery % 9.3% 9.2% 6.5% 7.5% 8.2%Adjusted Farebox Recovery % 12.1%Subsidy per passenger 20.053$ 20.203$ 27.907$ 25.649$ 23.973$ Subsidy % 90.7% 90.8% 93.5% 92.5% 91.8%
All Mode - TotalTotal Passengers 3,515,043 3,575,561 3,650,683 3,519,990 3,430,269
Passenger Fare Rev. 2,798,083$ 2,843,606$ 2,871,141$ 2,737,831$ 2,746,669$ Total Operating Cost 13,153,516$ 14,059,872$ 15,187,284$ 15,557,203$ 15,141,244$
Revenue per passenger 0.796$ 0.795$ 0.786$ 0.778$ 0.801$ Cost per passenger 3.742$ 3.932$ 4.160$ 4.420$ 4.414$ Farebox Recovery % 21.3% 20.2% 18.9% 17.6% 18.1%Adjusted Farebox Recovery % 20.1%Subsidy per passenger 2.946$ 3.137$ 3.374$ 3.642$ 3.613$ Subsidy % 78.7% 79.8% 81.1% 82.4% 81.9%
Gold Coast Transit DistrictPassenger Cost by Mode - Ten Year Comparison
Fiscal Years 2007 to 2016
78
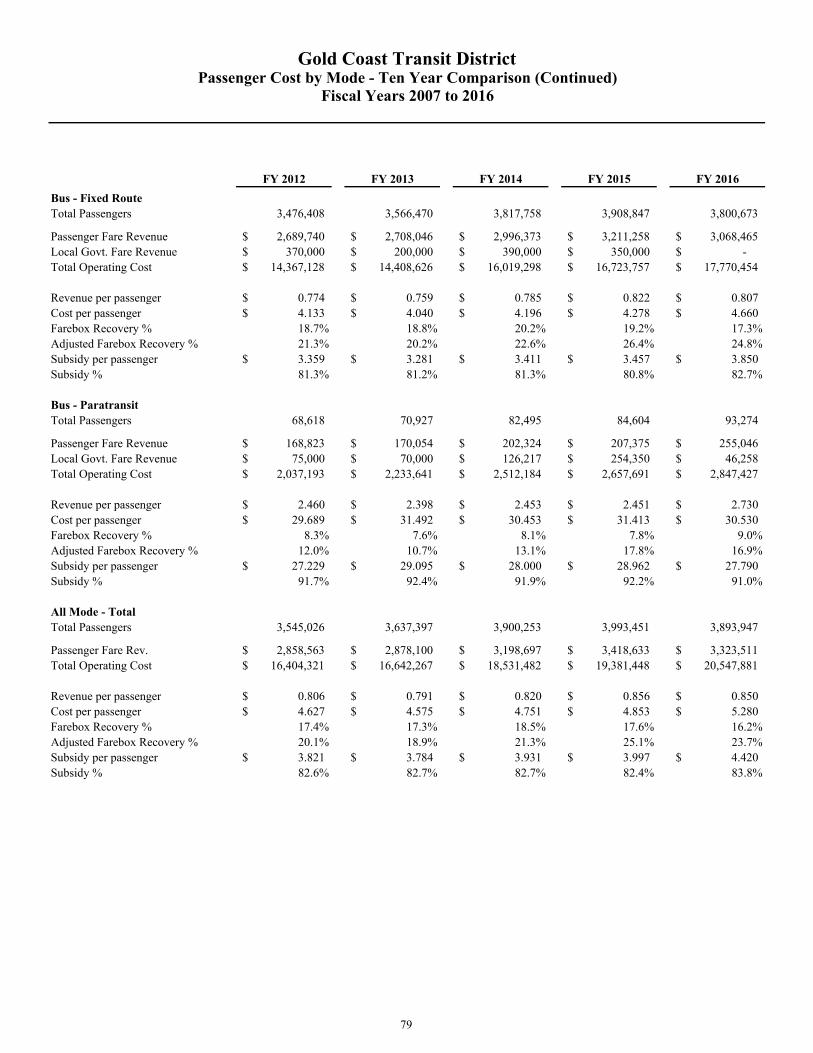
FY 2012 FY 2013 FY 2014 FY 2015 FY 2016
Bus - Fixed RouteTotal Passengers 3,476,408 3,566,470 3,817,758 3,908,847 3,800,673
Passenger Fare Revenue 2,689,740$ 2,708,046$ 2,996,373$ 3,211,258$ 3,068,465$ Local Govt. Fare Revenue 370,000$ 200,000$ 390,000$ 350,000$ -$ Total Operating Cost 14,367,128$ 14,408,626$ 16,019,298$ 16,723,757$ 17,770,454$
Revenue per passenger 0.774$ 0.759$ 0.785$ 0.822$ 0.807$ Cost per passenger 4.133$ 4.040$ 4.196$ 4.278$ 4.660$ Farebox Recovery % 18.7% 18.8% 20.2% 19.2% 17.3%Adjusted Farebox Recovery % 21.3% 20.2% 22.6% 26.4% 24.8%Subsidy per passenger 3.359$ 3.281$ 3.411$ 3.457$ 3.850$ Subsidy % 81.3% 81.2% 81.3% 80.8% 82.7%
Bus - ParatransitTotal Passengers 68,618 70,927 82,495 84,604 93,274
Passenger Fare Revenue 168,823$ 170,054$ 202,324$ 207,375$ 255,046$ Local Govt. Fare Revenue 75,000$ 70,000$ 126,217$ 254,350$ 46,258$ Total Operating Cost 2,037,193$ 2,233,641$ 2,512,184$ 2,657,691$ 2,847,427$
Revenue per passenger 2.460$ 2.398$ 2.453$ 2.451$ 2.730$ Cost per passenger 29.689$ 31.492$ 30.453$ 31.413$ 30.530$ Farebox Recovery % 8.3% 7.6% 8.1% 7.8% 9.0%Adjusted Farebox Recovery % 12.0% 10.7% 13.1% 17.8% 16.9%Subsidy per passenger 27.229$ 29.095$ 28.000$ 28.962$ 27.790$ Subsidy % 91.7% 92.4% 91.9% 92.2% 91.0%
All Mode - TotalTotal Passengers 3,545,026 3,637,397 3,900,253 3,993,451 3,893,947
Passenger Fare Rev. 2,858,563$ 2,878,100$ 3,198,697$ 3,418,633$ 3,323,511$ Total Operating Cost 16,404,321$ 16,642,267$ 18,531,482$ 19,381,448$ 20,547,881$
Revenue per passenger 0.806$ 0.791$ 0.820$ 0.856$ 0.850$ Cost per passenger 4.627$ 4.575$ 4.751$ 4.853$ 5.280$ Farebox Recovery % 17.4% 17.3% 18.5% 17.6% 16.2%Adjusted Farebox Recovery % 20.1% 18.9% 21.3% 25.1% 23.7%Subsidy per passenger 3.821$ 3.784$ 3.931$ 3.997$ 4.420$ Subsidy % 82.6% 82.7% 82.7% 82.4% 83.8%
Gold Coast Transit DistrictPassenger Cost by Mode - Ten Year Comparison (Continued)
Fiscal Years 2007 to 2016
79
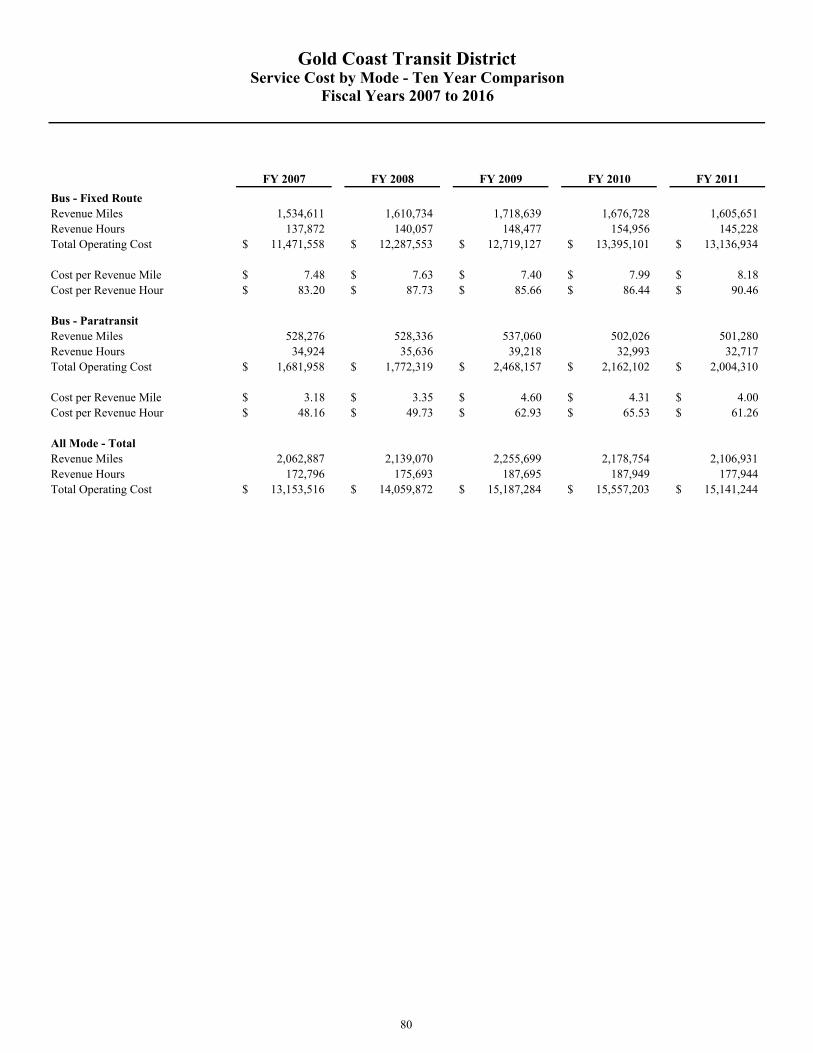
FY 2007 FY 2008 FY 2009 FY 2010 FY 2011
Bus - Fixed RouteRevenue Miles 1,534,611 1,610,734 1,718,639 1,676,728 1,605,651 Revenue Hours 137,872 140,057 148,477 154,956 145,228 Total Operating Cost 11,471,558$ 12,287,553$ 12,719,127$ 13,395,101$ 13,136,934$
Cost per Revenue Mile 7.48$ 7.63$ 7.40$ 7.99$ 8.18$ Cost per Revenue Hour 83.20$ 87.73$ 85.66$ 86.44$ 90.46$
Bus - ParatransitRevenue Miles 528,276 528,336 537,060 502,026 501,280 Revenue Hours 34,924 35,636 39,218 32,993 32,717 Total Operating Cost 1,681,958$ 1,772,319$ 2,468,157$ 2,162,102$ 2,004,310$
Cost per Revenue Mile 3.18$ 3.35$ 4.60$ 4.31$ 4.00$ Cost per Revenue Hour 48.16$ 49.73$ 62.93$ 65.53$ 61.26$
All Mode - TotalRevenue Miles 2,062,887 2,139,070 2,255,699 2,178,754 2,106,931 Revenue Hours 172,796 175,693 187,695 187,949 177,944 Total Operating Cost 13,153,516$ 14,059,872$ 15,187,284$ 15,557,203$ 15,141,244$
Gold Coast Transit DistrictService Cost by Mode - Ten Year Comparison
Fiscal Years 2007 to 2016
80
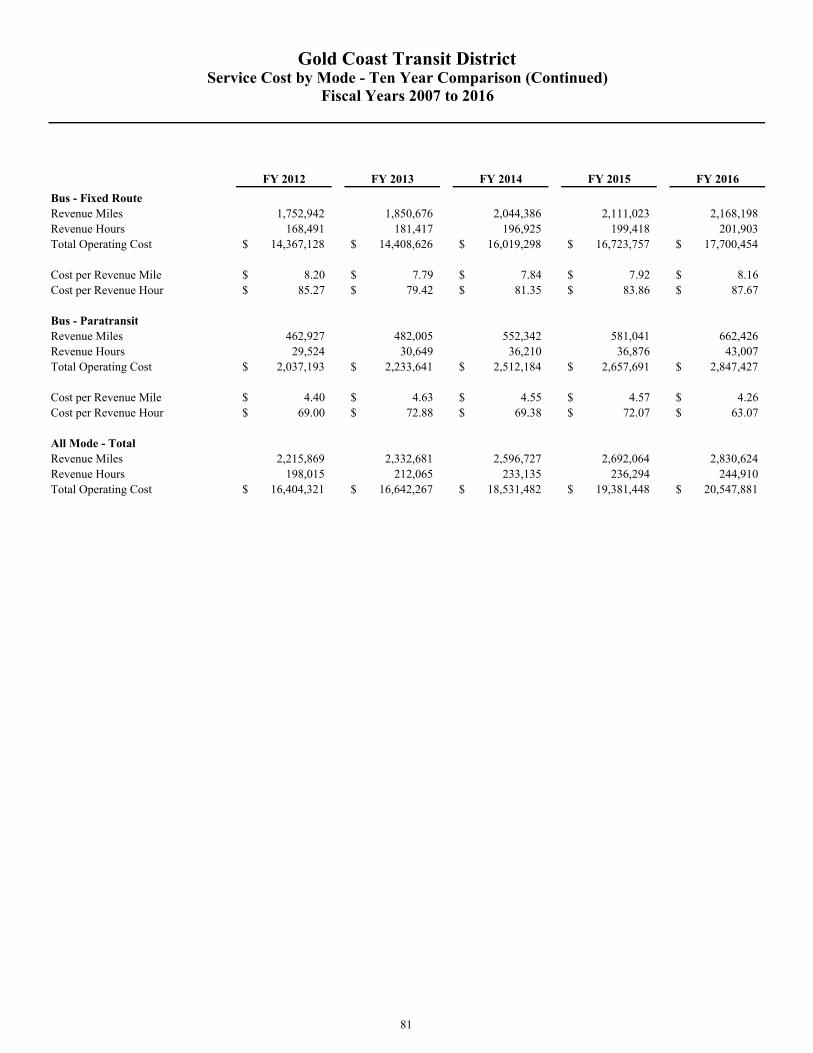
FY 2012 FY 2013 FY 2014 FY 2015 FY 2016
Bus - Fixed RouteRevenue Miles 1,752,942 1,850,676 2,044,386 2,111,023 2,168,198 Revenue Hours 168,491 181,417 196,925 199,418 201,903 Total Operating Cost 14,367,128$ 14,408,626$ 16,019,298$ 16,723,757$ 17,700,454$
Cost per Revenue Mile 8.20$ 7.79$ 7.84$ 7.92$ 8.16$ Cost per Revenue Hour 85.27$ 79.42$ 81.35$ 83.86$ 87.67$
Bus - ParatransitRevenue Miles 462,927 482,005 552,342 581,041 662,426 Revenue Hours 29,524 30,649 36,210 36,876 43,007 Total Operating Cost 2,037,193$ 2,233,641$ 2,512,184$ 2,657,691$ 2,847,427$
Cost per Revenue Mile 4.40$ 4.63$ 4.55$ 4.57$ 4.26$ Cost per Revenue Hour 69.00$ 72.88$ 69.38$ 72.07$ 63.07$
All Mode - TotalRevenue Miles 2,215,869 2,332,681 2,596,727 2,692,064 2,830,624 Revenue Hours 198,015 212,065 233,135 236,294 244,910 Total Operating Cost 16,404,321$ 16,642,267$ 18,531,482$ 19,381,448$ 20,547,881$
Gold Coast Transit DistrictService Cost by Mode - Ten Year Comparison (Continued)
Fiscal Years 2007 to 2016
81
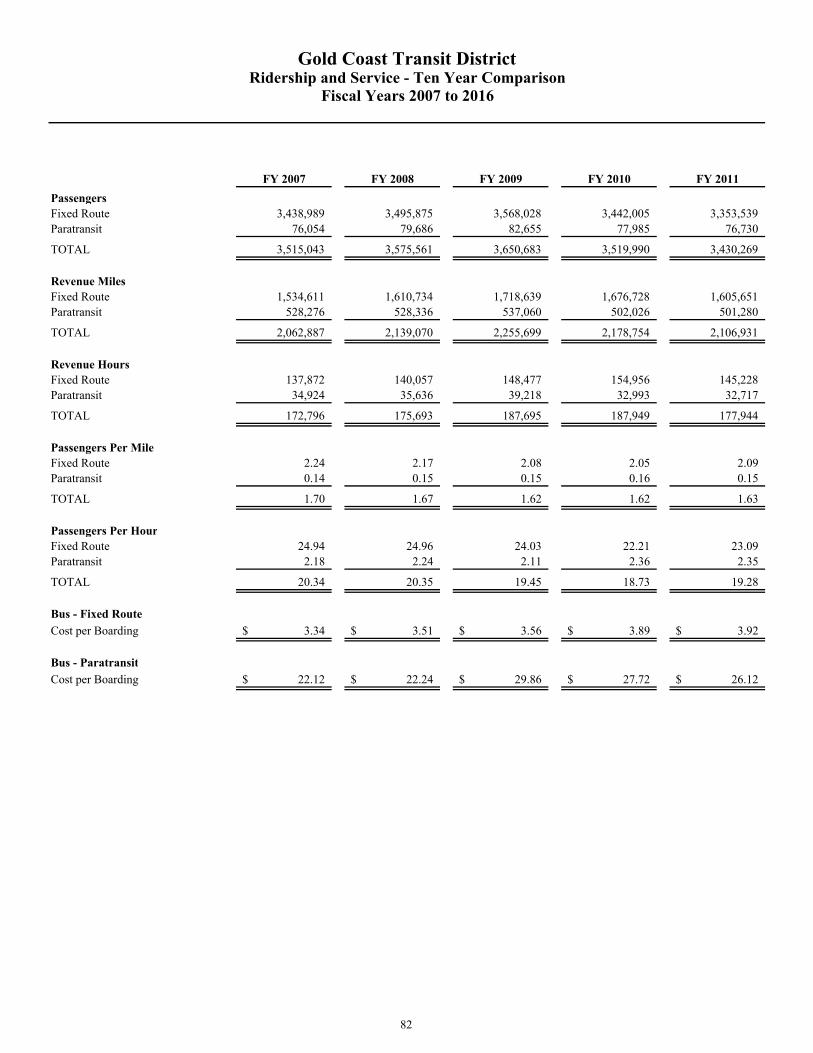
FY 2007 FY 2008 FY 2009 FY 2010 FY 2011
PassengersFixed Route 3,438,989 3,495,875 3,568,028 3,442,005 3,353,539 Paratransit 76,054 79,686 82,655 77,985 76,730
TOTAL 3,515,043 3,575,561 3,650,683 3,519,990 3,430,269
Revenue MilesFixed Route 1,534,611 1,610,734 1,718,639 1,676,728 1,605,651 Paratransit 528,276 528,336 537,060 502,026 501,280
TOTAL 2,062,887 2,139,070 2,255,699 2,178,754 2,106,931
Revenue HoursFixed Route 137,872 140,057 148,477 154,956 145,228 Paratransit 34,924 35,636 39,218 32,993 32,717
TOTAL 172,796 175,693 187,695 187,949 177,944
Passengers Per MileFixed Route 2.24 2.17 2.08 2.05 2.09 Paratransit 0.14 0.15 0.15 0.16 0.15
TOTAL 1.70 1.67 1.62 1.62 1.63
Passengers Per HourFixed Route 24.94 24.96 24.03 22.21 23.09 Paratransit 2.18 2.24 2.11 2.36 2.35
TOTAL 20.34 20.35 19.45 18.73 19.28
Bus - Fixed Route
Cost per Boarding 3.34$ 3.51$ 3.56$ 3.89$ 3.92$
Bus - Paratransit
Cost per Boarding 22.12$ 22.24$ 29.86$ 27.72$ 26.12$
Gold Coast Transit DistrictRidership and Service - Ten Year Comparison
Fiscal Years 2007 to 2016
82
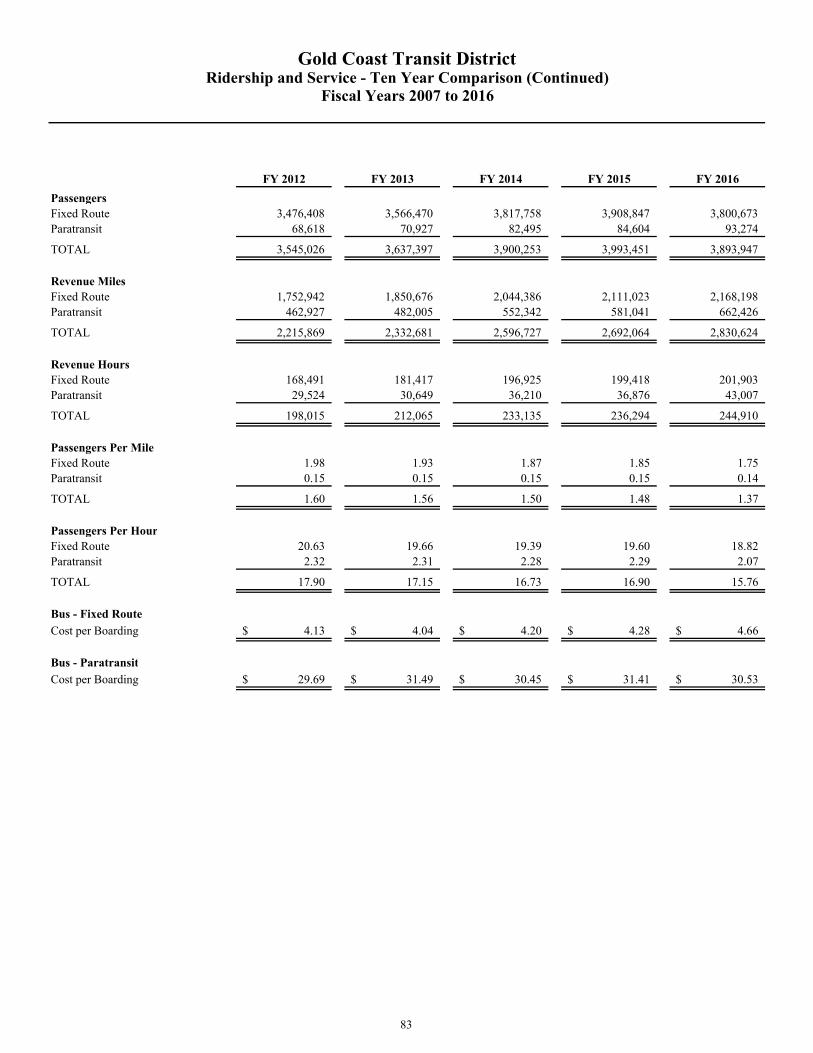
FY 2012 FY 2013 FY 2014 FY 2015 FY 2016
PassengersFixed Route 3,476,408 3,566,470 3,817,758 3,908,847 3,800,673 Paratransit 68,618 70,927 82,495 84,604 93,274
TOTAL 3,545,026 3,637,397 3,900,253 3,993,451 3,893,947
Revenue MilesFixed Route 1,752,942 1,850,676 2,044,386 2,111,023 2,168,198 Paratransit 462,927 482,005 552,342 581,041 662,426
TOTAL 2,215,869 2,332,681 2,596,727 2,692,064 2,830,624
Revenue HoursFixed Route 168,491 181,417 196,925 199,418 201,903 Paratransit 29,524 30,649 36,210 36,876 43,007
TOTAL 198,015 212,065 233,135 236,294 244,910
Passengers Per MileFixed Route 1.98 1.93 1.87 1.85 1.75 Paratransit 0.15 0.15 0.15 0.15 0.14
TOTAL 1.60 1.56 1.50 1.48 1.37
Passengers Per HourFixed Route 20.63 19.66 19.39 19.60 18.82 Paratransit 2.32 2.31 2.28 2.29 2.07
TOTAL 17.90 17.15 16.73 16.90 15.76
Bus - Fixed Route
Cost per Boarding 4.13$ 4.04$ 4.20$ 4.28$ 4.66$
Bus - Paratransit
Cost per Boarding 29.69$ 31.49$ 30.45$ 31.41$ 30.53$
Gold Coast Transit DistrictRidership and Service - Ten Year Comparison (Continued)
Fiscal Years 2007 to 2016
83