Embed Size (px)
Citation preview
2018FINANCIALREPORT
2018 Annual f inancial report

1Cofiroute_2018 Annual financial report
2018 Annual financial report
Board of Directors’ Management report 3
IFRS individual financial statements at 31 December 2018 23
Report of the Statutory Auditors on the IFRS individual financial statements 58
Parent company financial statements 59
Report of the Statutory Auditors on the parent company financial statements 73
Persons responsible for the document 77
Contents

2 Cofiroute_2018 Annual financial report
3Cofiroute_2018 Annual financial report
Board of Directors’ Management report
BOARD OF DIRECTORS’ MANAGEMENT REPORT 3
1. The Company’s position and business in 2018 4
2. Traffic 4
3. Toll revenue 4
4. Maintenance of the network in service 4
5. Network operation and customer safety 5
6. Financial risks related to the effects of climate change 5
7. Internal control 6
8. Risk management procedures 9
9. Financing 10
10. Research and development 10
11. Activity of subsidiaries and affiliated companies 10
12. IFRS individual financial statements 11
13. Group management report 11
14. Parent company financial statements 12
15. Information on payment terms 13
16. Post-balance sheet events 14
17. Change in the Company’s business, earnings and financial position 14
18. Agreements covered by article L.225-38 of the French Commercial Code 14
19. Share buyback programme 14
20. Employee share ownership 14
21. Observations from the Works Council 14
22. Report of the Statutory Auditors 15
23. Board of Director’s report on corporate governance 15
ANNEX 18
Terms of office and duties of corporate officers 18
4 Cofiroute_2018 Annual financial report
Board of Directors’ Management report
The Company’s position and business in 2018
1. The Company’s position and business in 2018
Cofiroute had 2018 revenue of €1,441.1 million, up 2.9%. This consisted mainly of toll receipts, which rose due to a 1.0% increase in traffic on the interurban network.
As a proportion of revenue, EBITDA (1) was 74.6% versus 74.9% in 2017.
Capital expenditure on the network in service amounted to €170 million in 2018. It related primarily to the implementation of the various programmes laid out in contracts with the French government, the concession grantor, including the completion of work under the 3rd master contract, the continuation of the two redevelopment phases on the interurban network (ERI 2) and the implementation of the motorway stimulus plan signed in 2015.
Net financial debt at 31 December 2018 was €3.6 billion.
(1) Cash flows (used in)/from operations before tax and financing costs.
2. Traffic
The traffic on Cofiroute’s intercity network increased 1.0% in 2018; growth was +0.6% for light vehicles (LV) and +3.5% for heavy vehicles (HV). Average traffic intensity on the network was 29,752 vehicles per day in 2018.
While heavy vehicles traffic increased sharply under the momentum of the French and Spanish economies, light vehicles traffic grew only moderately, largely because of higher fuel prices.
Duplex A86 traffic showed growth of 3.5% in the number of transactions, with slightly higher growth on weekends and holidays (+4.8%) than on weekdays (+3.0%). Average weekday traffic in 2018 was 36,707 vehicles a day.
3. Toll revenue
Toll revenue was €1,422.1 million in 2018, split between €1,352.7 million for the intercity network (up +2.7% from 2017) and €69.4 million for the Duplex A86 (up +7.1% from 2017).
Revenue from ancillary activities in 2018 were €19.1 million.
4. Maintenance of the network in service
In-service network investments amounted to €170 million in 2018, of which €31 million in roadwork and equipment for existing motorways.
4.1. Duplex A86Capital expenditure in 2018 included the completion of final work (basically directional signage, landscaping and flood management works) and the start of the equipment replacement plan (project management assistance, selection of the general contractor and system improvements).
4.2. Intercity network improvement worksThe phase 3 work of the contract (CDP3) undertaken in 2012 finished with the operational start-up on 27 July 2018 of the widening of the A10 motorway on the Chambray-Veigné section and construction of the 73/7 overpass on the A71 motorway.
As part of the second development phase of the intercity network (ERI2), work was completed on circulation improvements on the A10/A85 interchange put in service on 20 December and the doubling of the la Sauldre viaduct on the A85. Work is proceeding on the final cross-section of the A28 and the doubling of the Cher viaducts, the Cher relief lanes and three other viaducts on the A85 north of Tours (Langeais, La Perrée and La Roumer). Studies continue on widening the Angers North bypass on the A11.
5Cofiroute_2018 Annual financial report
Board of Directors’ Management report
Financial risks related to the effects of climate change
As part of the motorway stimulus plan, work was started to widen the A10 north of Orléans and between Poitiers and Veigné. Environmental improvements continued, bringing to 27 the number of ecological continuity restoration projects completed and to 410 the number of car-sharing parking spaces created by the end of 2018. Hydraulic redevelopment on the A71 began. Lastly, work continued on the mineralisation of the central reservation on the A10 between Sainte Maure de Touraine and Poitiers Sud, with more than 56 kilometres completed by the end of 2018.
4.2.1. Motorway investment planThe motorway investment plan was approved by the decree of 28 August 2018, published 30 August 2018. It calls for a programme of five construction operations to improve mobility in the regions, particularly travel in urban and suburban areas. The bulk of these projects will be covered by special agreements between the Company and the regional municipalities.
The studies deal with the four new interchanges (Porte de Gesvres, Gidy, Laval, Connerré) and the three eco-bridges have been started.
5. Network operation and customer safety
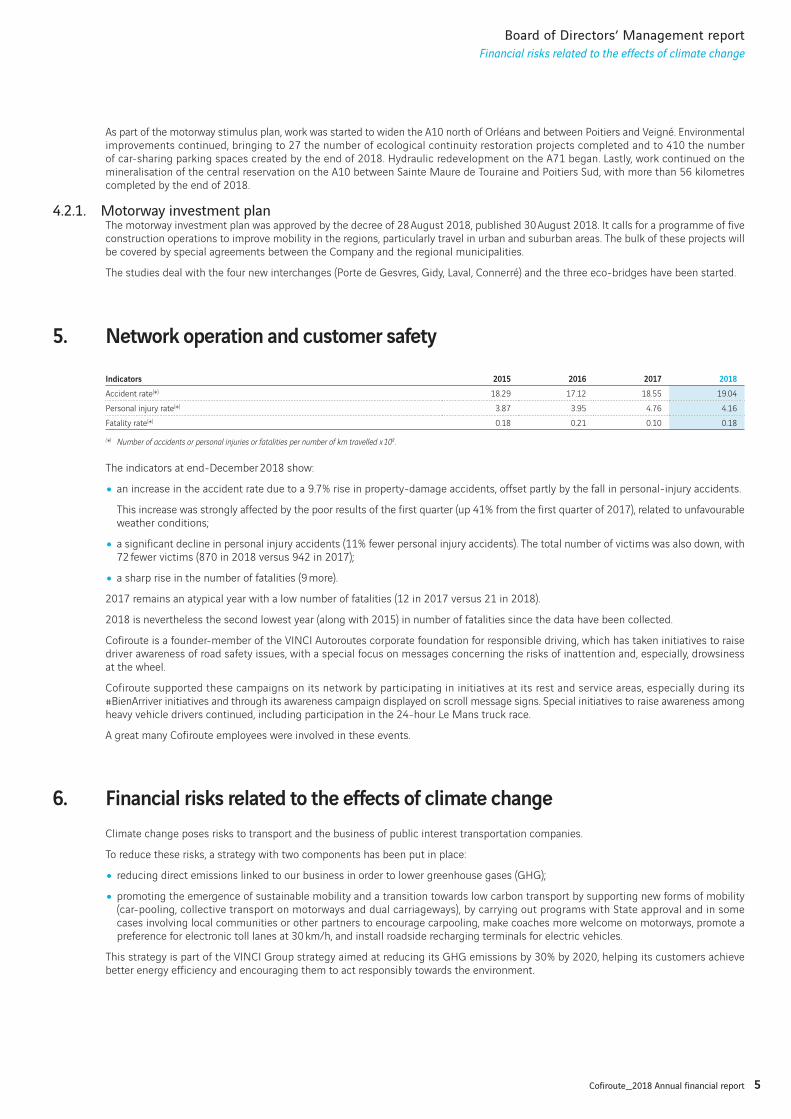
Indicators 2015 2016 2017 2018
Accident rate(*) 18.29 17.12 18.55 19.04
Personal injury rate(*) 3.87 3.95 4.76 4.16
Fatality rate(*) 0.18 0.21 0.10 0.18
(*) Number of accidents or personal injuries or fatalities per number of km travelled x 108.
The indicators at end-December 2018 show:
• an increase in the accident rate due to a 9.7% rise in property-damage accidents, offset partly by the fall in personal-injury accidents.
This increase was strongly affected by the poor results of the first quarter (up 41% from the first quarter of 2017), related to unfavourable weather conditions;
• a significant decline in personal injury accidents (11% fewer personal injury accidents). The total number of victims was also down, with 72 fewer victims (870 in 2018 versus 942 in 2017);
• a sharp rise in the number of fatalities (9 more).
2017 remains an atypical year with a low number of fatalities (12 in 2017 versus 21 in 2018).
2018 is nevertheless the second lowest year (along with 2015) in number of fatalities since the data have been collected.
Cofiroute is a founder-member of the VINCI Autoroutes corporate foundation for responsible driving, which has taken initiatives to raise driver awareness of road safety issues, with a special focus on messages concerning the risks of inattention and, especially, drowsiness at the wheel.
Cofiroute supported these campaigns on its network by participating in initiatives at its rest and service areas, especially during its #BienArriver initiatives and through its awareness campaign displayed on scroll message signs. Special initiatives to raise awareness among heavy vehicle drivers continued, including participation in the 24-hour Le Mans truck race.
A great many Cofiroute employees were involved in these events.
6. Financial risks related to the effects of climate change
Climate change poses risks to transport and the business of public interest transportation companies.
To reduce these risks, a strategy with two components has been put in place:
• reducing direct emissions linked to our business in order to lower greenhouse gases (GHG);
• promoting the emergence of sustainable mobility and a transition towards low carbon transport by supporting new forms of mobility (car-pooling, collective transport on motorways and dual carriageways), by carrying out programs with State approval and in some cases involving local communities or other partners to encourage carpooling, make coaches more welcome on motorways, promote a preference for electronic toll lanes at 30 km/h, and install roadside recharging terminals for electric vehicles.
This strategy is part of the VINCI Group strategy aimed at reducing its GHG emissions by 30% by 2020, helping its customers achieve better energy efficiency and encouraging them to act responsibly towards the environment.
6 Cofiroute_2018 Annual financial report
Board of Directors’ Management report
Internal control
7. Internal control
The Company’s internal control structure is based on:
• formal definition of company strategy and decision-making procedures;
• co-ordination and monitoring of business activities;
• notification and co-ordination between different company entities.
7.1. Objectives of internal controlThe internal control procedures applied within the Company aim to:
• ensure that management practices, operations and employee behaviour are consistent with the Company’s business strategy as defined by its governing bodies, its values, standards and internal rules as well as all applicable laws and regulations;
• verify that the accounting, financial and management information given to the Company’s governing bodies and third parties fairly presents the Company’s situation and business.
One of the objectives of internal control is to prevent and manage risks arising from the Company’s business operations and the risks of error and fraud, particularly in accounting and finance. No control system can provide absolute assurance that all risk will be eliminated.
7.2. Principles governing conduct and behaviour
7.2.1. DecentralisationGiven the decentralised structure of the Company’s operations, which are organised in appropriately resourced geographical sectors, local management can act rapidly by making any necessary operational decisions.
7.2.2. Delegation of authorityThe Company’s system for delegating authority is applied in compliance with the following principles for conduct and behaviour:
• strict adherence to the rules laid down by the Chief Executive Officer, in particular as regards delegation, commitments and financial and accounting information;
• employee transparency and loyalty towards their line management and functional departments. All managers must, in particular, inform their line managers of any difficulties encountered in performing their duties. An integral part of operational managers’ role is to make decisions alone on matters falling within their area of expertise. However, these difficulties should be handled with the assistance, if necessary, of their line managers or functional departments;
• compliance with the laws and regulations in force in the countries where the Company operates;
• responsibility of operational executives to communicate these principles by appropriate means (orally and/or in writing) and set an example;
• safety of property and individuals;
• a rigorous approach and management culture.
7.2.3. VINCI Code of ”Ethics and Conduct”This code, which applies to all managers and now appended to the Company’s internal regulations, defines the rules of good conduct applicable to all employees and sets out the professional ethical principles that should govern their behaviour.
7.2.4. The VINCI anti-corruption code of conductThis code, appended to the Company’s internal regulations and sent to all employees concerned, who must confirm receipt of it and agree to it, defines the rules articulated in the Code of Ethics and Conduct in terms of measures to fight corruption in its various forms.
7.2.5. VINCI Subcontractor relations guidelinesThese guidelines, which were sent out to all managers in 2013, stipulate the importance of fairness in relationships with its subcontractors and suppliers. To this end, the Group’s contracting agents give six fundamental commitments and ensure that they are adhered to.
7Cofiroute_2018 Annual financial report
Board of Directors’ Management report
Internal control
7.2.6. Safety of individualsThe safety of people is a top priority for the Company. Its management of work-related risks is reflected in the zero workplace accident objective, a policy integrated into all company procedures. Resources and tools (education, training, procedures, indicators) are adapted to this business policy.
7.2.7. Internal guidelinesInternally, the internal control framework is structured around several guidelines:
• the rules to be followed by company employees, set out primarily in the internal rules, departmental procedures and any other documents issued by Executive Management or its representatives;
• an information technology charter, which informs users of the rules and conditions that apply to information system resources, particularly as regards data security and protection. This document was supplemented in 2012 by a code of conduct for IT administrators.
7.3. Internal committees within the Company
7.3.1. Executive CommitteeThe Executive Committee is a forum for information, discussion, co-ordination and decision-making; it brings together the Chief Executive Officer and certain Senior Managers for fortnightly meetings.
7.3.2. The Commitments CommitteeAny significant financial and/or contractual commitment made by Cofiroute or any investment in excess of €240,000 is examined by the Commitments Committee prior to approval. The Committee is chaired by the Chief Executive Officer and examines every aspect — including financial, technical and legal aspects — of Cofiroute’s commitments (guarantees, sureties and off-balance sheet commitments), investment opportunities and their impact on the Company’s financial position.
7.4. Executive Management reviews
7.4.1. Concession reviewsFour concession reviews were held in 2018 to monitor obligations resulting from concession agreements and their riders and the regulatory environment, and also to review discussions with the government in relation to these operations.
7.4.2. Quality, Safety and Environment reviewsEvery year, management reviews study the results of the Company’s QSE policy and set its future priorities based on the audits and analysis of the efficiency of the operational and support processes.
The Company’s QSE management system, which includes these management reviews, has obtained ISO 9001 (Quality management) and ISO 14001 (Environmental management) certification for the construction, operation and maintenance of its motorway network.
To foster continuous improvement, a safety and prevention plan is drawn up every year for the Company’s staff. It contains initiatives covering all the Company’s processes in relation to training, communications and improvements in prevention systems. Its ultimate objective is to achieve a zero workplace injury rate for all employees. It draws on the VINCI Autoroutes Accident Prevention policy adopted in June 2016. It is monitored on a regular basis.
The zero accident approach to project management is adopted by all operational departments for subcontracting companies performing work on the Cofiroute network.
7.5. Control processes
7.5.1. The accounting system
Expenditure control systemThe Company’s information and management system is based on SAP software. It comprises various functionalities, including accounting, management control, purchasing, invoicing and investment management.
The following restrictions have been put in place:
• disbursements (expenses and investments) are authorised subject to personalised thresholds configured in the software. This authorisation is required before an item of expenditure can be accounted for or a disbursement made;
• accounts payable accounting and creation and modification of supplier records, along with payments, are centralised;
• the supplier invoice processing and supplier invoice payment functions are kept separate.
8 Cofiroute_2018 Annual financial report
Board of Directors’ Management report
Internal control
Income and expense accounting processing procedures Accounting and management system procedures have been drawn up and are available to all users on the Company’s intranet.
Prior to processing toll revenue, the control function is separated from the production function: this procedure involves the Finance Department, Operational Systems Department and Operations Department performing cross-checks and compiling a monthly report.
Preparation and verification of financial statementsThe Finance Department is in charge of preparing and approving the Company’s interim and annual financial statements, ensuring compliance with accounting policies and the procedures applied by the Company’s various departments.
As part of their assignment, the Statutory Auditors perform checks on procedures and compliance with accounting principles.
7.5.2. Drafting and monitoring of budgetsThe Management Control Department implements and co-ordinates the budget process for the entire Group. Each department inputs its budget proposals into the SAP system on the required dates, along with explanatory notes aligning budget proposals with business forecasts, identified risks and unforeseen events.
The budget, its three annual updates and an analysis by every Group department are presented to the Chief Executive Officer and Chief Financial Officer. The budgets allocated to each department are then formally approved by Executive Management and regularly monitored throughout the year.
7.5.3. Cash managementCash management complies with the Group’s cash management guidelines. Cash is invested by VINCI Autoroutes under a cash management agreement signed in October 2011.
Interest-rate risk is managed according to prudential rules defined by the VINCI Group.
Cofiroute uses derivative financial instruments in managing its debt, and market risk exposure in particular, as described in the notes ”Data on net financial debt” and ”Information on financial risk management” to the IFRS individual financial statements.
Decisions about the main financing and debt management transactions are made in Treasury Committee meetings, which are held regularly and before any material transaction.
Bank mandates are granted on a restricted basis, in compliance with the Group’s cash management guidelines. The nature of the authorisations granted and the list of beneficiaries are regularly reviewed.
The VINCI Group’s instructions and information guides to prevent the risks of fraud were circulated throughout the financial services department.
7.6. Reporting
7.6.1. Reporting to Executive Management and shareholdersThe Finance Department reports every month to the Company’s Executive Management and shareholders regarding the Company’s revenue, key operating indicators and net financial debt.
Its reporting also includes:
• interim and annual financial statements;
• financial forecasts for the current year (initial version in November of the previous year followed by four updates in March, May, September and November each year);
• the three-year plan, which is revised every year.
7.6.2. Reporting to the concession-granting authorityUnder its two concession contracts, Cofiroute regularly reports to the concession-granting authority on its commitments. In June 2018, Cofiroute sent its 2017 parent company financial statements, reports on the performance of each of its concession contracts and an annual review of operations. The results of the annual user satisfaction survey are also sent every year, together with a review of safety matters. As part of its turn-around plan, Cofiroute also prepares quarterly progress assessments of operations as well as a biennial report. Quarterly meetings are held with the concession grantor about the progress made on all the redevelopment/reconfiguration projects and the policies for maintaining the assets. Half-yearly meetings are held to discuss operations. An annual overview meeting to track contract performance is held with the grantor early in the year.
7.6.3. Report to the French rail and road operators’ regulatory authority known as ARAFERA report on the activity of the Contracting Commission must be sent to ARAFER each year. To this end, Cofiroute submitted a report on Contracting Commission activities in 2017 on 21 March 2018.
9Cofiroute_2018 Annual financial report
Board of Directors’ Management report
Risk management procedures
8. Risk management procedures
8.1. Procedures relating to the preparation and treatment of accounting and financial information for the parent company and IFRS individual financial statementsThe Finance Department, which reports to Executive Management, is in charge of producing and analysing the parent company and consolidated financial information, disclosed within and outside the Company. In particular, it is in charge of:
• drawing up, validating and analysing interim and annual parent company and separate IFRS statements;
• defining and monitoring accounting procedures and implementing IFRS.
The Statutory Auditors are involved in discussions and work related to the implementation of complex accounting operations. They present their observations and comments on the interim and annual financial statements to the Finance Department before these financial statements are presented to the Board of Directors.
The Statutory Auditors obtain a representation letter signed by the Chief Executive Officer and Chief Financial Officer before signing their reports.
8.2. Procedures implemented to prevent and manage the Company’s operational riskAs part of the quality, safety and environment management system, which is ISO 9001 and ISO 14001 certified and covers all of Cofiroute’s activities, the risks and opportunities of all processes have been identified and an action plan relating to them is reviewed once a year.
Internal and external procedures, set out in the ”Technical and Operational Handbook”, apply to the operation of the network in service. Interventions are formally set out in the Intervention and Back-up Plan (”Plan d’Intervention et de Secours” or PIS) for every motorway in the network. The Plan defines and facilitates the co-ordination and implementation of back-up and operational measures. It ranges from coping with minor, daily events to handling serious disruptions in cases where the Prefect has not decided to launch an emergency plan or an Orsec Plan (the French basic emergency plan implemented in the event of a disaster, when local resources are not sufficient).
An emergency procedure covers the entire network. Under this procedure, a crisis management cell is manned by operational employees 24 hours a day, while Executive Management, represented by one of the members of the Executive Committee, and the Communication Department is also available around-the-clock.
Critical systems have full redundancy. An information system recovery plan has been drawn up to handle a system shut-down or a disaster.
8.3. Procedures implemented to safeguard operation of the Information SystemA joint Head of Information System Security (RSSI) was appointed in 2013 with responsibility for all VINCI Autoroutes entities. The RSSI’s main duties are to harmonise the information system policies, management systems and standards across the entities, in particular by preparing VINCI Autoroutes’ Information Systems Security Policy and overseeing its application within Cofiroute.
The RSSI is also in charge of identifying and assessing risks. He or she defines and controls the implementation of response plans to security incidents. The RSSI ensures that security aspects are dealt with in various IT projects. An information security officer from the French Ministry of Ecology, Sustainable Development, Transport and Housing has also been appointed.
8.4. Procedures related to internal controlThe Chief Executive Officer has stipulated that internal control should consist of:
• a toll fraud prevention officer;
• a revenue certification manager;
• a head of information system security (RSSI); and
• a head of internal control.
Where necessary, these officers use external providers for any independent audits they deem necessary. These four have drawn up coordinated action plans and report directly to the Chief Executive Officer.
10 Cofiroute_2018 Annual financial report
Board of Directors’ Management report
Financing
9. Financing
As at 31 December 2018, Cofiroute’s available resources amounted to €1,337.6 million, breaking down as €237.6 million in net cash under management and €1,100 million of an undrawn internal credit line with VINCI.
Net financial debt amounted to €3,637 million at 31 December 2018, of which 52% was indexed to a fixed rate and 48% at a variable rate.
10. Research and development
During 2018 the development programme involved innovative digital projects to improve the level of service delivered to customers and, gradually, operational management in terms of operations and assets.
In particular, an experiment concerning the Traffic Information Performance project was conducted on the network, allowing safety & security companies to have real-time access to the data supplied by the transportation companies. This project makes it possible to get an overview of the different events occurring on the network in addition to the existing procedures. The software developed also makes it possible to improve the classification and broadcasting of traffic information on VINCI Autoroutes radio and on social networks. Moreover, a job-specific application for the use of the roadway agents is being tested so that information from the field about an event can be reported in real time.
The FULL BIM project continued in 2018. The aim of this is to organise all of the occupational processes, methods and work applications into one unified information and management system for infrastructures and roadway equipment. The FULL BIM project is used into every phase of our infrastructure projects: design, production, delivery, and operation, with the following objectives:
• improve the oversight and management of our infrastructure;
• develop dialogue among all external and internal parties;
• facilitate the continuity of information and the transfer of knowledge at each phase of a project, ensure better control of risks, deadlines and costs of projects throughout the life cycle of the infrastructures and equipment.
Finally, a new Ulys application was introduced in July 2018 to inform users of events in progress on the network, give them real-time access to the services offered on their journey and, notably at the rest areas, provide them with a rewards programme and enable them to access their subscriber page.
11. Activity of subsidiaries and affiliated companies
11.1. Toll CollectToll Collect GmbH (TC) is a German company owned by Cofiroute (10%), Daimler Financial Services (DFS) (45%) and Deutsche Telekom (DT) (45%). Until August 2018, TC was the holder of a contract with the German Bund to operate a satellite-based toll payment service for heavy vehicles of 7.5 tonnes or more on the 12,900 km motorway network and 2,350 km of the German national trunk road network.
The MAB 40K contract for the construction and installation of a system to extend the means of applying the heavy goods vehicle tax over the 40,000 km of the federal network enabled the system to come into service on 1 July 2018.
An agreement between the Bund and the shareholders was signed in July 2018. Cofiroute is not involved in the payment of €3.2 billion that Daimler and Telekom must make as an offset to the transaction.
This dispute did not affect Cofiroute’s financial statements, since the upper limit on its financial contribution to the project was reached in December 2004.
In August 2018, Toll Collect paid Cofiroute €7.2 million, consisting of €8.5 million in investment income, from which €1.3 million was withheld for taxes by the German government.
As it was contractually entitled to do, on 31 August 2018 the German government exercised its call option on the shares of Toll Collect. Cofiroute thus divested its ownership of Toll Collect, worth €47 million and fully impaired, with no impact on profit and loss.
11Cofiroute_2018 Annual financial report
Board of Directors’ Management report
Group management report
12. IFRS individual financial statements
12.1. RevenueConsolidated revenue includes operating revenue, i.e. toll receipts, and construction revenue from building infrastructure facilities, payable in respect of construction services undertaken on behalf of the French government.
Operating revenue grew by +2.9% to €1,441.1 million in 2018, from €1,400.4 million in 2017.
Construction revenue rose by 15.7% to €139.9 million from €121 million in 2017. This amount corresponds to the construction work outsourced, as Cofiroute does not apply any mark-up on its project management activities.
Total revenue (operation/construction) amounted to €1,581.1 million, compared with €1,521.4 million in 2017.
12.2. Operating incomeOperating income rose by 1.8% to €816.8 million as against €802.5 million in 2017.
12.3. Financial profit or lossNet financial expense decreased by €18 million to €74.6 million in 2018, from €92.6 million in 2017. The main cause was a €14.2 million improvement in the cost of net financial debt.
12.4. Net incomeIncome tax expense was €253 million, stable from 2017 (€252.9 million).
This mainly comprises:
• a favourable basis effect following the tax law changes made in late 2017 (see the one-time additional 5% on the income tax rate); and
• a less favourable non-current variation in deferred tax compared with 2017.
Net income came to €489.3 million, up €32.2 million compared with 2017 (€457.1 million).
12.5. Balance sheetNet financial debt amounted to €3,637.0 million at 31 December 2018, compared with €3,772.8 million at the end of 2017.
13. Group management report
Pursuant to article L.233-16 I of the French Commercial Code, the information provided in the Group’s management report is available below.
(in € millions) 2018 2017 2016 2015 2014
Operating revenue 1,441.1 1,400.4 1,363.5 1,306.4 1,283.6
Revenue - construction of new infrastructure assets under concession 139.9 121.0 94.1 80.9 100.3
Total revenue 1,581.1 1,521.4 1,457.7 1,387.3 1,383.9Net income attributable to owners of the parent 489.3 457.1 476.8 375.9 337.0Net financial debt (3,637) (3,773) (4,115) (1,856) (2,374)
12 Cofiroute_2018 Annual financial report
Board of Directors’ Management report
Parent company financial statements
14. Parent company financial statements
In 2018, Cofiroute decided to stop recognizing deferred taxes in its parent company financial statements in order to provide clearer financial information.
Pursuant to French GAAP and ANC Regulation No. 2018-01, this constitutes a change in accounting policies, which is calculated retrospectively at 1 January 2018 and results in the reversal of the provision for deferred taxes and a credit to shareholder’s equity in the amount of €94.6 million.
14.1. Income statementRevenue rose by €40,7 million or 2.9% to €1,441.1 million.
Operating income increased by €12.9 million or 1.6% to €807.6 million.
Net income of €490.3 million was up from 2017 (up €41.5 million), largely a consequence of higher revenue.
14.2. Five-year performanceIn accordance with article R.225-102 of the French Commercial Code, the following table shows the Company’s results over the past five years:
(in €)
Type of information 2014 2015 2016 2017 2018
1. FINANCIAL POSITION AT YEAR-END
• Share capital 158,282,124 158,282,124 158,282,124 158,282,124 158,282,124
• Number of shares outstanding 4,058,516 4,058,516 4,058,516 4,058,516 4,058,516
2. TOTAL COMPREHENSIVE INCOME OF OPERATIONS CARRIED OUT
• Revenue 1,271,951,368 1,306,366,245 1,363,549,599 1,400,415,619 1,441,144,343
• Income before tax, employee profit-sharing, amortisation and provisions 838,273,912 875,091,942 918,844,493 976,759,596 976,021,187
• Income tax expenses 186,603,823 202,117,413 234,579,314 240,955,096 249,027,594
• Additional corporate income tax 26,099,356 28,271,259 7,715,938 44,069,603 8,192,732
• Earnings after tax, contributions, employee profit-sharing, amortisation and provisions 347,019,977 384,197,177 449,538,878 448,772,769 490,261,966
• Distributed earnings 2,917,261,301 446,355,590 582,843,483
• Long-term debt 3,178,892,481 2,618,534,505 3,862,563,137 3,878,926,740 3,624,463,023
• Cost of concession 8,914,306,897 9,013,567,871 9,026,995,021 9,158,765,875 9,324,967,905
3. PER SHARE OPERATING EARNINGS
• Earnings after tax and employee profit-sharing but prior to depreciation, amortisation and provisions 153.32 158.00 165.68 168.78 175.03
• Earnings after tax and employee profit-sharing, amortisation and provisions 85.50 94.66 110.76 110.58 120.80
• Dividend per share 0.00 0.00 718.80 109.98 143.61
4. EMPLOYEE INFORMATION
• Average number of employees during the year 1,560 1,482 1,455 1,408 1,360
• Total payroll 60,448,192 57,694,572 55,685,936 53,422,239 50,912,502
• Total amount paid in respect of employee benefits 35,366,232 34,447,855 33,735,150 34,596,891 34,151,890
14.3. Proposed distribution of 2018 incomeThe following distribution of income has been proposed:
Net earnings 490,261,966
Retained earnings from previous year 105,662,805
Earnings available for distribution 595,924,771
Allocation to the statutory reserve -
Payment of the interim dividend on 30/08/2018 96,470,925
Proposed payment of final dividend 486,372,557
13Cofiroute_2018 Annual financial report
Board of Directors’ Management report
Information on payment terms
The dividend distribution presented here relates to a dividend of €143.61 per share for each of the 4,058,516 shares, i.e.:
• as per the decision of the Board of Directors at its meeting of 25 July 2018, an interim dividend of €23.77 per share representing €96,470,925 paid on 30 August 2018;
• it is proposed that the final dividend of €119.84 per share be paid, representing a total of €486,372,557.
In application of article 243 bis of the French General Tax Code, the following dividends have been paid out with respect to the past three financial years.
Dividend in respect of 2017
• Payment of an interim dividend of €81,292,075 on 31 August 2017.
• Payment of the final dividend of €365,063,514 on 29 March 2018.
Dividend in respect of 2016
• Payment of an interim dividend of €1,314,147,481 on 7 September 2016.
• Payment of an interim dividend of €1,492,032,237 on 15 December 2016.
• Payment of the final dividend of €111,081,583 on 7 April 2017.
Dividend in respect of 2015
• No dividend distribution
The Statutory Auditors will provide the findings of their audit and the specific verifications required by law in their general report.
15. Information on payment terms
In compliance with the order of 6 April 2016 issued pursuant to article D.441-4 of the French Commercial Code, information on the payment terms of suppliers and customers is provided in the table below.
Article D.441 I - 1.: past due invoices received but unpaid at the balance sheet date for the year
Article D.441 I - 2.: past due invoices issued but unpaid at the balance sheet date for the year
0 days (for information
only) 1-30 days31-60
days61-90
days91 days or more
Total (1 day
or more)
0 days (for information
only) 1-30 days 31-60 days 61-90 days91 days or more
Total (1 day
or more)
(A) Late payment trancheNumber of invoices covered 55 24 43 869 243 172 1,282 2,566
Total amount of invoices concerned incl. of tax 1,668,141 € 686,427 € 23,462 € 15,219 € 0 € 725,109 € 16,432,569 € 1,407,906 € 506,279 € 4,843 € 388,001 € 2,307,029 €
Percentage of total amount of purchases incl. tax for the year 0.4% 0.2% 0.0% 0.0% 0.0% 0.2% 1.0% 0.1% 0.0% 0.0% 0.0% 0.1%
Percentage of revenue incl. tax for the year
(B) Invoices excluded from (A) for debts and contested claimsNumber of excluded invoices 779 26 36 41 285 388 11,384 11,384
Total amount of invoices excluded 1,365,802 € 84,355 € 41,276 € 53,950 € 500,860 € 680,442 € 2,554,982 € 2,554,982 €
(C) Contractual or legal benchmark payment periods used - article L.441-6 or article L.443-1 of the French Commercial CodePayment periods used to calculate payment delays
Statutory period: 60 days from invoice issue date according to French Act on the modernisation of the economy (LME) Statutory period: 30 days from invoice date
14 Cofiroute_2018 Annual financial report
Board of Directors’ Management report
Post-balance sheet events
16. Post-balance sheet events
Toll rates on the Duplex A86 increased on 1 January 2019 pursuant to the Interministerial Decree of 26 December 2018.
Toll rates for the intercity network increased on 1 February 2019 pursuant to the Concessions Contract and the Contract Plan. The average rise in the rate per kilometre was +1.65%.
On its intercity network, from 1 February 2019 Cofiroute will introduce a special rate for regular users thanks to a new subscription: drivers making at least 10 round-trips in the month on the same route will enjoy a 30% discount on tolls for all trips made.
17. Change in the Company’s business, earnings and financial position
In accordance with article L.225-100 of the French Commercial Code, an analysis of changes in the Company’s business, earnings and financial position is provided below.
Concession contracts with remaining terms of 15.5 years for the interurban network and 68 years for the A86, as well as the master contracts signed with the French government, give Cofiroute good visibility as to its business outlook and help drive its financial performance.
Cofiroute’s major risks include the dependency of toll revenue on users’ acceptance of toll prices and on trends in traffic. Heavy vehicle traffic shows correlation with economic activity and, to a lesser extent, light vehicle traffic shows correlation with consumer spending and retail fuel prices.
The level of financial debt (€3,637.0 million) should be seen in the light of the investments made to build the motorway network in concession, i.e. a net value of €4,702.4 million, and the recurrence of strong cash flows. Cofiroute’s debt management policy addresses the financial risk resulting from this level of debt, and includes the use of financial instruments. This policy and the prudential rules applied are described in the notes to the IFRS annual financial statements disclosing information on net financial debt and financial risk management.
18. Agreements covered by article L.225-38 of the French Commercial Code
No agreement referred to in article L.225-38 of the French Commercial Code needed approval in 2018.
19. Share buyback programme
No authorisations to buy back company shares were granted at the Shareholders’ General Meeting.
20. Employee share ownership
Pursuant to article L.225-102 of the French Commercial Code, we report that employees hold no equity in the Company.
21. Observations from the Works Council
Pursuant to article L.2323-8 of the French Labour Code (Code du Travail), all documents submitted at the Shareholders’ General Meeting are sent to the Works Council.
15Cofiroute_2018 Annual financial report
Board of Directors’ Management report
Board of Director’s report on corporate governance
22. Report of the Statutory Auditors
The Statutory Auditors’ report provides further details on the audit performed.
23. Board of Director’s report on corporate governance
23.1. Board membership and gender balanceAt 31 December 2018, Cofiroute’s Board of Directors included:
• Pierre Coppey;
• Cofiroute Holding;
• VINCI Autoroutes;
• VINCI Concessions;
• VINCI Autoroutes Services;
• VINCI Autoroutes Projets 4;
• Pierre Trotot;
• Alexandra Serizay beginning 25/07/2018;
• Marianne Laigneau;
• Sylvain Lefol.
The Board of Directors has 10 Directors, including five female directors, and therefore meets the balanced representation requirement prescribed by article L.225-18-1 of the French Commercial Code (employee representatives on the Board are not included in this ratio, in compliance with the French Commercial Code).
23.2. Preparation and organisation of work performed by the Board of DirectorsThe Board of Directors meets regularly. Directors receive all the information necessary for their work and decisions in advance of meetings, in accordance with the provisions of law, the regulations, the articles of association and contractual agreements. Directors are also free to review, if necessary, all available information about the Company.
The Statutory Auditors are invited to attend Board meetings held to approve the interim and annual financial statements.
Directors are appointed for four years.
23.3. Potential limitations on the powers of Executive Management• No limitations impair or prevent the Chief Executive Officer’s full and complete exercise of the powers that come with his duties.
• In compliance with articles L.225-35 and R.225-28 of the French Commercial Code, the Board of Directors authorised the Chief Executive Officer at its 12 December 2018 meeting to grant guarantees and sureties for a total of up to €100 million on behalf of the Company, for a period of one year from 13 December 2018.
• In compliance with paragraphs 2 and 3 of article L.228-40 of the French Commercial Code, the Board of Directors authorised the Chief Executive Officer to issue up to €1.5 billion in one or more bond issues, for a period of one year from 13 December 2018. The Chief Executive Officer shall be accountable to the Board for any such bond issues.
• At the Board of Directors’ meeting on 12 December 2018, the aforementioned authorisations were renewed for a period of one year for the benefit of Marc Bouron, the Chief Executive Officer.
16 Cofiroute_2018 Annual financial report
Board of Directors’ Management report
Board of Director’s report on corporate governance
23.4. Operational organisation
23.4.1. Corporate governance
The Board of DirectorsThe Board of Directors met three times in 2018, with an average attendance rate of 84.17%.
The Board assessed the composition and operation of the Board of Directors with the aid of questionnaires sent to the Directors. The Directors showed a high level of satisfaction with the organisation of meetings, the information provided and presentations made to them.
In accordance with its internal rules, the Board included a discussion on its own procedures in its agenda for the meeting held on 2 February 2018.
23.5. Shareholders’ participation at Shareholders’ General MeetingsArrangements for shareholders’ participation at Shareholders’ General Meetings are laid down in Section V of the articles of association, as reproduced below:
”SECTION V/GENERAL SHAREHOLDERS’ MEETINGSArticle 21
General Shareholders’ Meetings are convened under the terms set by the law.
The meetings take place on the date, time and place indicated in the meeting notification.
Article 22
General Shareholders’ Meetings may be attended by all shareholders whose shares are fully paid up at that date, irrespective of the number of shares owned by each of them.
Shareholders who attend the meeting via videoconference or other means of telecommunication by which they can be identified, the nature and conditions of application of which are determined by decree, are deemed to be present for the calculation of the quorum and majority.
In all the meetings, the owners of shares are entitled to attend the meeting or be represented without any prior formalities, if their shares are registered five days at the latest before the date of the meeting.
The Board of Directors has the right to shorten or to remove this time limit.
General Shareholders’ Meetings are chaired by the Chairman or one of the Vice-Chairmen of the Board of Directors, or by a Director specially designated by the Board for this purpose. Failing this, the meeting elects its Chairman itself.
Article 23
Ordinary or Extraordinary General Shareholders’ Meetings, deliberating in accordance with the statutory quorum and majority voting requirements, exercise the powers granted to them by the laws in force.
Article 24
The resolutions of the General Shareholders’ Meetings are recorded in minutes drawn up and kept in accordance with the provisions of law.
Copies or extracts of these minutes are validly certified either by the Chairman of the Board of Directors or by a Director fulfilling the office of Chief Executive Officer. They may also be certified by the Secretary of the meeting.
If the Company is being liquidated, they may validly be certified by a single liquidator”.
23.6. Agreements between a senior executive or major shareholder and a subsidiaryDuring the 2018 financial year, no agreements were entered into between a senior executive or major shareholder on the one hand, and a subsidiary of the Company on the other.
23.7. Information on corporate officersThe list of each corporate officer’s appointments and terms of office held in 2018 is shown in Appendix 1 of this report.
17Cofiroute_2018 Annual financial report
Board of Directors’ Management report
Board of Director’s report on corporate governance
23.8. Remuneration of corporate officersIn compliance with the provisions of article L.225-37-3 of the French Commercial Code, we hereby report on the total remuneration and benefits paid during the period to each corporate officer, by the Company and by the companies it controls within the meaning of article L.233-16 of the French Commercial Code, and by the company that controls the Company.
The following tables show all remuneration and benefits received during the period by:
• Marc Bouron, Chief Executive Officer
Remuneration paid during the period
Fixed remuneration 160,000 €
Variable remuneration 100,000 €
Directors’ fees -
Benefits in kind 3,770 €
LTI 2015 274,304 €
Existing performance share plansNumber of performance shares granted to the executive corporate officers
2018
No. and date of planAP 2018
17/04/2018
Number of free shares 5,000
Value of shares based on the method used for the consolidated financial statements 320,600 €
Vesting date 17/04/2021
End of lock-up period 17/04/2021
Performance condition yes
Stock options granted during the periodMarc Bouron did not receive any allocation of stock options in 2018.
Share subscription and purchase options exercised during the periodMarc Bouron did not exercise any option in 2018.
For 2018, Cofiroute paid a total annual amount of €12,250 as directors’ fees, distributed among the members in compliance with the rules of distribution adopted by the Board of Directors.
23.9. Information likely to have an impact in the event of a public offeringPursuant to article L.225-37-5 of the French Commercial Code, the following points may have an impact in the event of a public offering.
Ownership of Cofiroute’s share capital at 31 December 2018 was as follows:
• VINCI Autoroutes 65.33%
• Cofiroute Holding 34.65%
• Others 0.00015%
To the knowledge of the members of the Board of Directors, there is no information likely to have an impact in the event of a public offering.
23.10. Delegations of authority and powers granted to the Board of Directors in the area of capital increasesNo delegation was granted.
The Chairman
Pierre COPPEY
18 Cofiroute_2018 Annual financial report
Annex
Terms of office and duties of corporate officers
Terms of office and duties of corporate officers
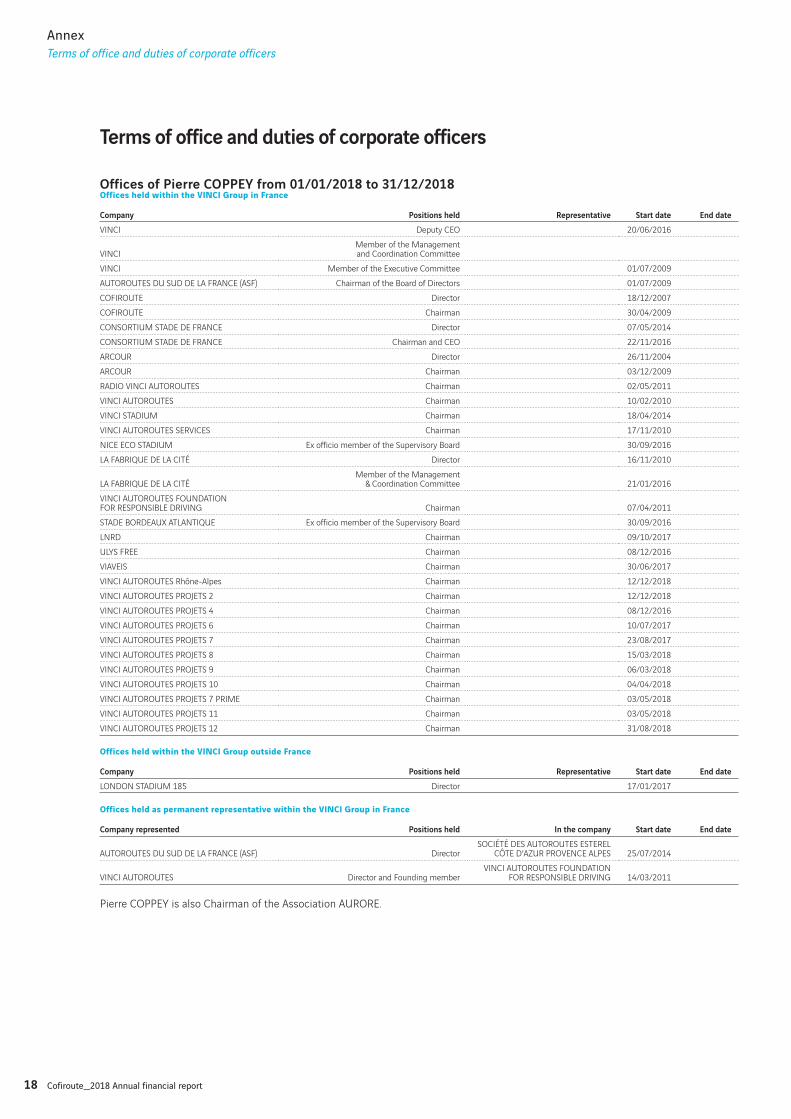
Offices of Pierre COPPEY from 01/01/2018 to 31/12/2018Offices held within the VINCI Group in France
Company Positions held Representative Start date End date
VINCI Deputy CEO 20/06/2016
VINCIMember of the Management and Coordination Committee
VINCI Member of the Executive Committee 01/07/2009
AUTOROUTES DU SUD DE LA FRANCE (ASF) Chairman of the Board of Directors 01/07/2009
COFIROUTE Director 18/12/2007
COFIROUTE Chairman 30/04/2009
CONSORTIUM STADE DE FRANCE Director 07/05/2014
CONSORTIUM STADE DE FRANCE Chairman and CEO 22/11/2016
ARCOUR Director 26/11/2004
ARCOUR Chairman 03/12/2009
RADIO VINCI AUTOROUTES Chairman 02/05/2011
VINCI AUTOROUTES Chairman 10/02/2010
VINCI STADIUM Chairman 18/04/2014
VINCI AUTOROUTES SERVICES Chairman 17/11/2010
NICE ECO STADIUM Ex officio member of the Supervisory Board 30/09/2016
LA FABRIQUE DE LA CITÉ Director 16/11/2010
LA FABRIQUE DE LA CITÉMember of the Management
& Coordination Committee 21/01/2016
VINCI AUTOROUTES FOUNDATION FOR RESPONSIBLE DRIVING Chairman 07/04/2011
STADE BORDEAUX ATLANTIQUE Ex officio member of the Supervisory Board 30/09/2016
LNRD Chairman 09/10/2017
ULYS FREE Chairman 08/12/2016
VIAVEIS Chairman 30/06/2017
VINCI AUTOROUTES Rhône-Alpes Chairman 12/12/2018
VINCI AUTOROUTES PROJETS 2 Chairman 12/12/2018
VINCI AUTOROUTES PROJETS 4 Chairman 08/12/2016
VINCI AUTOROUTES PROJETS 6 Chairman 10/07/2017
VINCI AUTOROUTES PROJETS 7 Chairman 23/08/2017
VINCI AUTOROUTES PROJETS 8 Chairman 15/03/2018
VINCI AUTOROUTES PROJETS 9 Chairman 06/03/2018
VINCI AUTOROUTES PROJETS 10 Chairman 04/04/2018
VINCI AUTOROUTES PROJETS 7 PRIME Chairman 03/05/2018
VINCI AUTOROUTES PROJETS 11 Chairman 03/05/2018
VINCI AUTOROUTES PROJETS 12 Chairman 31/08/2018
Offices held within the VINCI Group outside France
Company Positions held Representative Start date End date
LONDON STADIUM 185 Director 17/01/2017
Offices held as permanent representative within the VINCI Group in France
Company represented Positions held In the company Start date End date
AUTOROUTES DU SUD DE LA FRANCE (ASF) DirectorSOCIÉTÉ DES AUTOROUTES ESTEREL
CÔTE D’AZUR PROVENCE ALPES 25/07/2014
VINCI AUTOROUTES Director and Founding memberVINCI AUTOROUTES FOUNDATION
FOR RESPONSIBLE DRIVING 14/03/2011
Pierre COPPEY is also Chairman of the Association AURORE.
19Cofiroute_2018 Annual financial report
Annex
Terms of office and duties of corporate officers
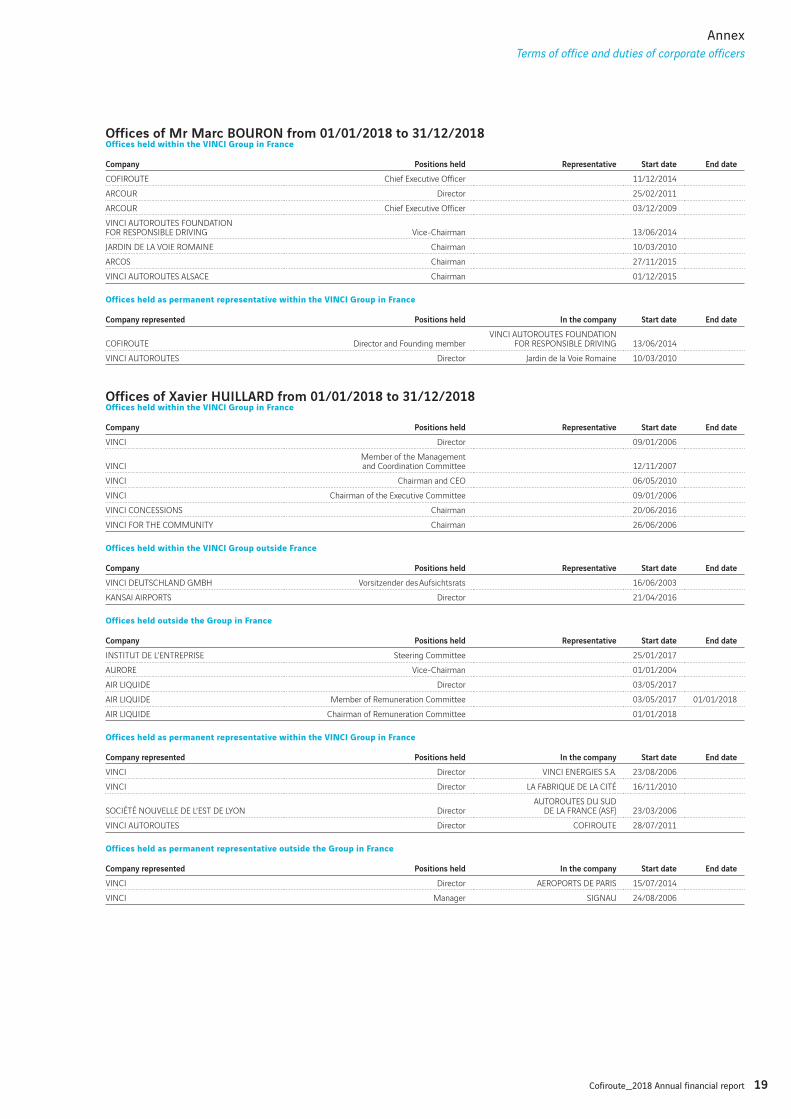
Offices of Mr Marc BOURON from 01/01/2018 to 31/12/2018Offices held within the VINCI Group in France
Company Positions held Representative Start date End date
COFIROUTE Chief Executive Officer 11/12/2014
ARCOUR Director 25/02/2011
ARCOUR Chief Executive Officer 03/12/2009
VINCI AUTOROUTES FOUNDATION FOR RESPONSIBLE DRIVING Vice-Chairman 13/06/2014
JARDIN DE LA VOIE ROMAINE Chairman 10/03/2010
ARCOS Chairman 27/11/2015
VINCI AUTOROUTES ALSACE Chairman 01/12/2015
Offices held as permanent representative within the VINCI Group in France
Company represented Positions held In the company Start date End date
COFIROUTE Director and Founding memberVINCI AUTOROUTES FOUNDATION
FOR RESPONSIBLE DRIVING 13/06/2014
VINCI AUTOROUTES Director Jardin de la Voie Romaine 10/03/2010
Offices of Xavier HUILLARD from 01/01/2018 to 31/12/2018Offices held within the VINCI Group in France
Company Positions held Representative Start date End date
VINCI Director 09/01/2006
VINCIMember of the Management and Coordination Committee 12/11/2007
VINCI Chairman and CEO 06/05/2010
VINCI Chairman of the Executive Committee 09/01/2006
VINCI CONCESSIONS Chairman 20/06/2016
VINCI FOR THE COMMUNITY Chairman 26/06/2006
Offices held within the VINCI Group outside France
Company Positions held Representative Start date End date
VINCI DEUTSCHLAND GMBH Vorsitzender des Aufsichtsrats 16/06/2003
KANSAI AIRPORTS Director 21/04/2016
Offices held outside the Group in France
Company Positions held Representative Start date End date
INSTITUT DE L’ENTREPRISE Steering Committee 25/01/2017
AURORE Vice-Chairman 01/01/2004
AIR LIQUIDE Director 03/05/2017
AIR LIQUIDE Member of Remuneration Committee 03/05/2017 01/01/2018
AIR LIQUIDE Chairman of Remuneration Committee 01/01/2018
Offices held as permanent representative within the VINCI Group in France
Company represented Positions held In the company Start date End date
VINCI Director VINCI ENERGIES S.A. 23/08/2006
VINCI Director LA FABRIQUE DE LA CITÉ 16/11/2010
SOCIÉTÉ NOUVELLE DE L’EST DE LYON DirectorAUTOROUTES DU SUD
DE LA FRANCE (ASF) 23/03/2006
VINCI AUTOROUTES Director COFIROUTE 28/07/2011
Offices held as permanent representative outside the Group in France
Company represented Positions held In the company Start date End date
VINCI Director AEROPORTS DE PARIS 15/07/2014
VINCI Manager SIGNAU 24/08/2006
20 Cofiroute_2018 Annual financial report
Annex
Terms of office and duties of corporate officers
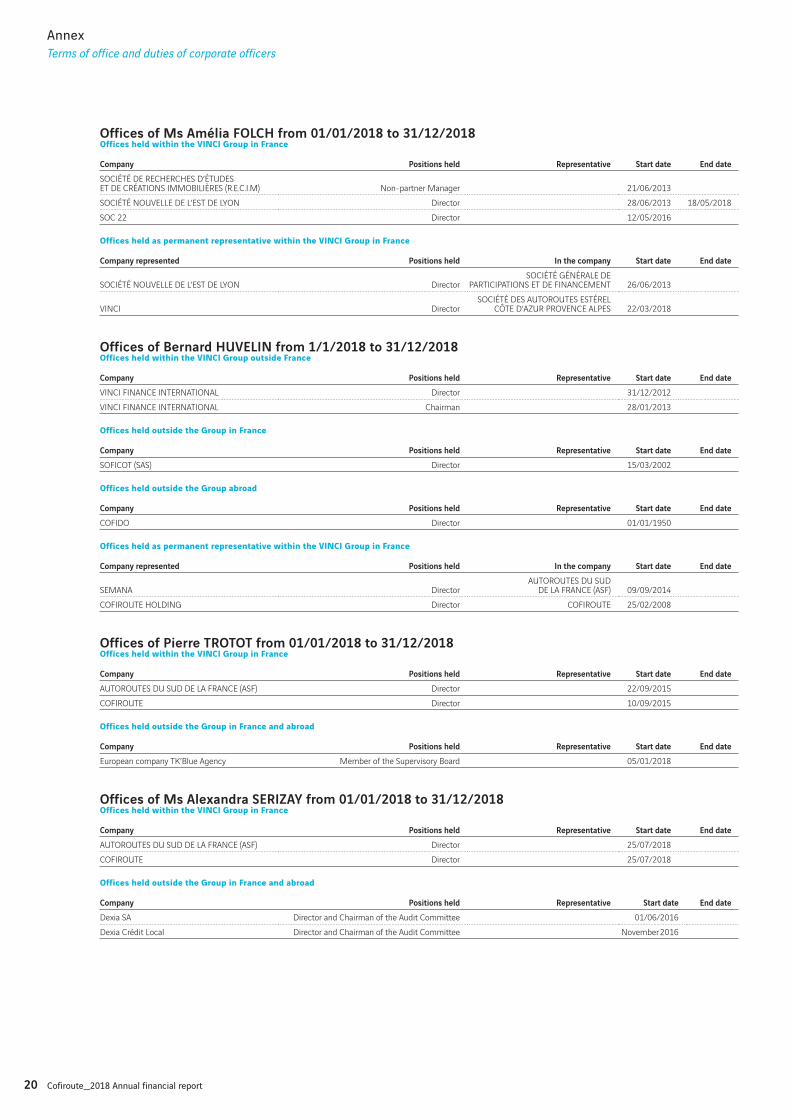
Offices of Ms Amélia FOLCH from 01/01/2018 to 31/12/2018Offices held within the VINCI Group in France
Company Positions held Representative Start date End date
SOCIÉTÉ DE RECHERCHES D’ÉTUDES ET DE CRÉATIONS IMMOBILIÈRES (R.E.C.I.M) Non-partner Manager 21/06/2013
SOCIÉTÉ NOUVELLE DE L’EST DE LYON Director 28/06/2013 18/05/2018
SOC 22 Director 12/05/2016
Offices held as permanent representative within the VINCI Group in France
Company represented Positions held In the company Start date End date
SOCIÉTÉ NOUVELLE DE L’EST DE LYON DirectorSOCIÉTÉ GÉNÉRALE DE
PARTICIPATIONS ET DE FINANCEMENT 26/06/2013
VINCI DirectorSOCIÉTÉ DES AUTOROUTES ESTÉREL
CÔTE D’AZUR PROVENCE ALPES 22/03/2018
Offices of Bernard HUVELIN from 1/1/2018 to 31/12/2018Offices held within the VINCI Group outside France
Company Positions held Representative Start date End date
VINCI FINANCE INTERNATIONAL Director 31/12/2012
VINCI FINANCE INTERNATIONAL Chairman 28/01/2013
Offices held outside the Group in France
Company Positions held Representative Start date End date
SOFICOT (SAS) Director 15/03/2002
Offices held outside the Group abroad
Company Positions held Representative Start date End date
COFIDO Director 01/01/1950
Offices held as permanent representative within the VINCI Group in France
Company represented Positions held In the company Start date End date
SEMANA DirectorAUTOROUTES DU SUD
DE LA FRANCE (ASF) 09/09/2014
COFIROUTE HOLDING Director COFIROUTE 25/02/2008
Offices of Pierre TROTOT from 01/01/2018 to 31/12/2018Offices held within the VINCI Group in France
Company Positions held Representative Start date End date
AUTOROUTES DU SUD DE LA FRANCE (ASF) Director 22/09/2015
COFIROUTE Director 10/09/2015
Offices held outside the Group in France and abroad
Company Positions held Representative Start date End date
European company TK’Blue Agency Member of the Supervisory Board 05/01/2018
Offices of Ms Alexandra SERIZAY from 01/01/2018 to 31/12/2018Offices held within the VINCI Group in France
Company Positions held Representative Start date End date
AUTOROUTES DU SUD DE LA FRANCE (ASF) Director 25/07/2018
COFIROUTE Director 25/07/2018
Offices held outside the Group in France and abroad
Company Positions held Representative Start date End date
Dexia SA Director and Chairman of the Audit Committee 01/06/2016
Dexia Crédit Local Director and Chairman of the Audit Committee November 2016
21Cofiroute_2018 Annual financial report
Annex
Terms of office and duties of corporate officers
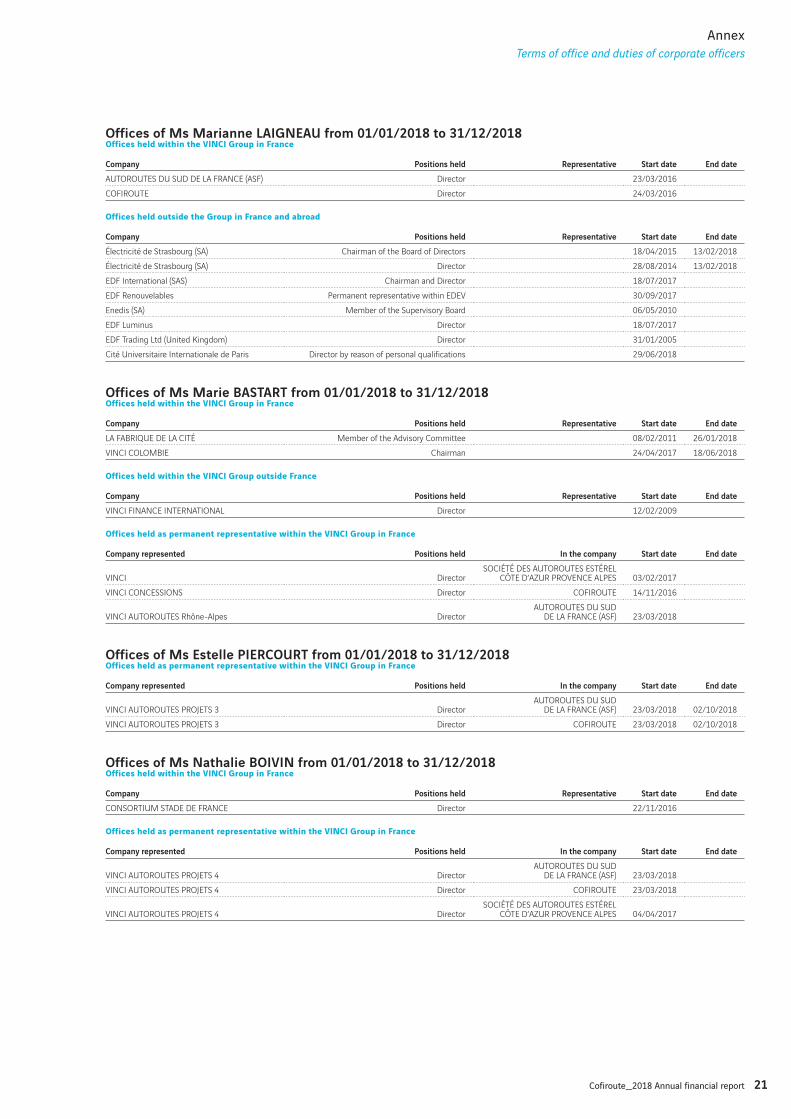
Offices of Ms Marianne LAIGNEAU from 01/01/2018 to 31/12/2018Offices held within the VINCI Group in France
Company Positions held Representative Start date End date
AUTOROUTES DU SUD DE LA FRANCE (ASF) Director 23/03/2016
COFIROUTE Director 24/03/2016
Offices held outside the Group in France and abroad
Company Positions held Representative Start date End date
Électricité de Strasbourg (SA) Chairman of the Board of Directors 18/04/2015 13/02/2018
Électricité de Strasbourg (SA) Director 28/08/2014 13/02/2018
EDF International (SAS) Chairman and Director 18/07/2017
EDF Renouvelables Permanent representative within EDEV 30/09/2017
Enedis (SA) Member of the Supervisory Board 06/05/2010
EDF Luminus Director 18/07/2017
EDF Trading Ltd (United Kingdom) Director 31/01/2005
Cité Universitaire Internationale de Paris Director by reason of personal qualifications 29/06/2018
Offices of Ms Marie BASTART from 01/01/2018 to 31/12/2018Offices held within the VINCI Group in France
Company Positions held Representative Start date End date
LA FABRIQUE DE LA CITÉ Member of the Advisory Committee 08/02/2011 26/01/2018
VINCI COLOMBIE Chairman 24/04/2017 18/06/2018
Offices held within the VINCI Group outside France
Company Positions held Representative Start date End date
VINCI FINANCE INTERNATIONAL Director 12/02/2009
Offices held as permanent representative within the VINCI Group in France
Company represented Positions held In the company Start date End date
VINCI DirectorSOCIÉTÉ DES AUTOROUTES ESTÉREL
CÔTE D’AZUR PROVENCE ALPES 03/02/2017
VINCI CONCESSIONS Director COFIROUTE 14/11/2016
VINCI AUTOROUTES Rhône-Alpes DirectorAUTOROUTES DU SUD
DE LA FRANCE (ASF) 23/03/2018
Offices of Ms Estelle PIERCOURT from 01/01/2018 to 31/12/2018Offices held as permanent representative within the VINCI Group in France
Company represented Positions held In the company Start date End date
VINCI AUTOROUTES PROJETS 3 DirectorAUTOROUTES DU SUD
DE LA FRANCE (ASF) 23/03/2018 02/10/2018
VINCI AUTOROUTES PROJETS 3 Director COFIROUTE 23/03/2018 02/10/2018
Offices of Ms Nathalie BOIVIN from 01/01/2018 to 31/12/2018Offices held within the VINCI Group in France
Company Positions held Representative Start date End date
CONSORTIUM STADE DE FRANCE Director 22/11/2016
Offices held as permanent representative within the VINCI Group in France
Company represented Positions held In the company Start date End date
VINCI AUTOROUTES PROJETS 4 DirectorAUTOROUTES DU SUD
DE LA FRANCE (ASF) 23/03/2018
VINCI AUTOROUTES PROJETS 4 Director COFIROUTE 23/03/2018
VINCI AUTOROUTES PROJETS 4 DirectorSOCIÉTÉ DES AUTOROUTES ESTÉREL
CÔTE D’AZUR PROVENCE ALPES 04/04/2017

22 Cofiroute_2018 Annual financial report
Annex
23Cofiroute_2018 Annual financial report
IFRS individual financial statements at 31 December 2018
IFRS INDIVIDUAL FINANCIAL STATEMENTS AT 31 DECEMBER 2018 24
IFRS income statement 24
IFRS comprehensive income statement for the period 24
IFRS Balance sheet - Assets 25
IFRS Balance sheet - Equity and liabilities 25
IFRS cash flows statement 26
IFRS statement of changes in equity 27
NOTES TO THE IFRS INDIVIDUAL FINANCIAL STATEMENTS 28
A. General principles and use of estimates 29
B. Key events of the period 33
C. Main income statement items 33
D. Service Concession Contracts 38
E. Other balance sheet items and commitments related to the business 39
F. Equity 43
G. Financing and financial risk management 44
H. Employee benefits and share-based payments 53
I. Other notes 56
J. Post-balance sheet events 57
K. Note on litigation 57
REPORT OF THE STATUTORY AUDITORS ON THE IFRS INDIVIDUAL FINANCIAL STATEMENTS 58
24 Cofiroute_2018 Annual financial report
IFRS individual financial statements at 31 December 2018
IFRS individual financial statements
IFRS INDIVIDUAL FINANCIAL STATEMENTS AT 31 DECEMBER 2018
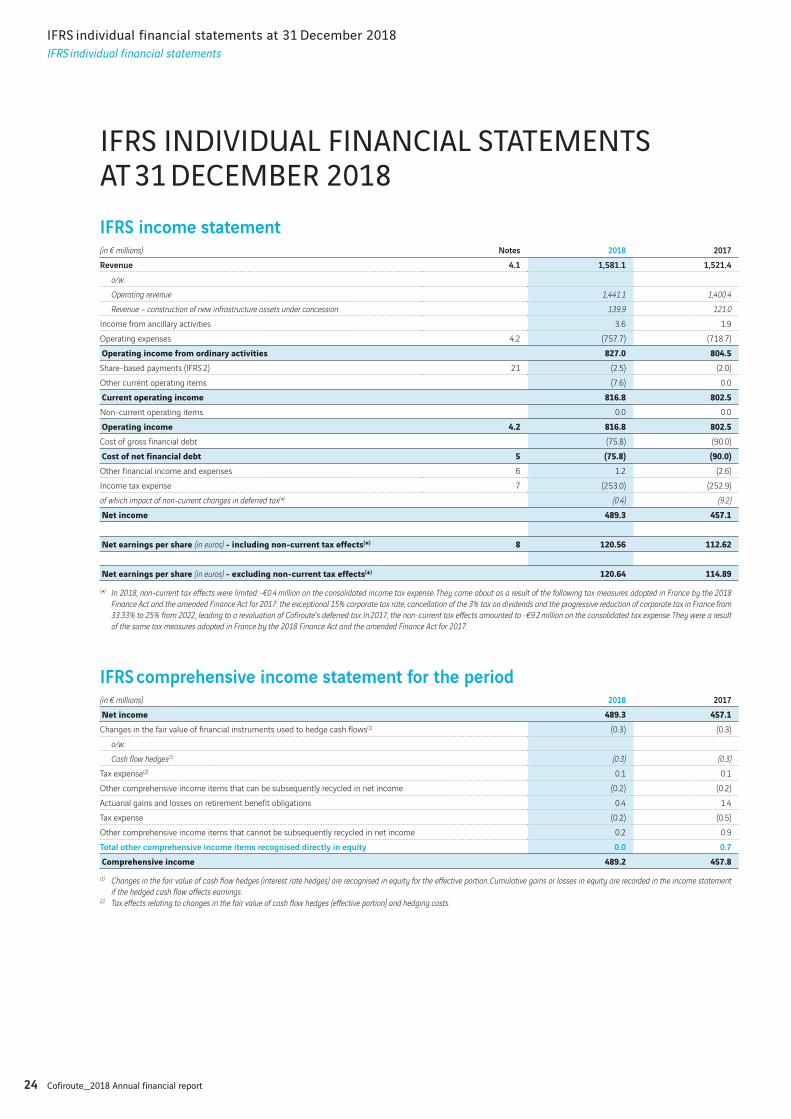
IFRS income statement(in € millions) Notes 2018 2017
Revenue 4.1 1,581.1 1,521.4
o/w:
Operating revenue 1,441.1 1,400.4
Revenue – construction of new infrastructure assets under concession 139.9 121.0
Income from ancillary activities 3.6 1.9
Operating expenses 4.2 (757.7) (718.7)
Operating income from ordinary activities 827.0 804.5Share-based payments (IFRS 2) 21 (2.5) (2.0)
Other current operating items (7.6) 0.0
Current operating income 816.8 802.5Non-current operating items 0.0 0.0
Operating income 4.2 816.8 802.5Cost of gross financial debt (75.8) (90.0)
Cost of net financial debt 5 (75.8) (90.0)Other financial income and expenses 6 1.2 (2.6)
Income tax expense 7 (253.0) (252.9)
of which impact of non-current changes in deferred tax(*) (0.4) (9.2)
Net income 489.3 457.1
Net earnings per share (in euros) - including non-current tax effects(*) 8 120.56 112.62
Net earnings per share (in euros) - excluding non-current tax effects(*) 120.64 114.89(*) In 2018, non-current tax effects were limited: -€0.4 million on the consolidated income tax expense. They came about as a result of the following tax measures adopted in France by the 2018
Finance Act and the amended Finance Act for 2017: the exceptional 15% corporate tax rate, cancellation of the 3% tax on dividends and the progressive reduction of corporate tax in France from
33.33% to 25% from 2022, leading to a revaluation of Cofiroute’s deferred tax. In 2017, the non-current tax effects amounted to -€9.2 million on the consolidated tax expense. They were a result
of the same tax measures adopted in France by the 2018 Finance Act and the amended Finance Act for 2017.
IFRS comprehensive income statement for the period (in € millions) 2018 2017
Net income 489.3 457.1Changes in the fair value of financial instruments used to hedge cash flows(1) (0.3) (0.3)
o/w:
Cash flow hedges(1) (0.3) (0.3)
Tax expense(2) 0.1 0.1
Other comprehensive income items that can be subsequently recycled in net income (0.2) (0.2)
Actuarial gains and losses on retirement benefit obligations 0.4 1.4
Tax expense (0.2) (0.5)
Other comprehensive income items that cannot be subsequently recycled in net income 0.2 0.9
Total other comprehensive income items recognised directly in equity 0.0 0.7
Comprehensive income 489.2 457.8(1) Changes in the fair value of cash flow hedges (interest rate hedges) are recognised in equity for the effective portion. Cumulative gains or losses in equity are recorded in the income statement
if the hedged cash flow affects earnings.(2) Tax effects relating to changes in the fair value of cash flow hedges (effective portion) and hedging costs.
25Cofiroute_2018 Annual financial report
IFRS individual financial statements at 31 December 2018
IFRS individual financial statements
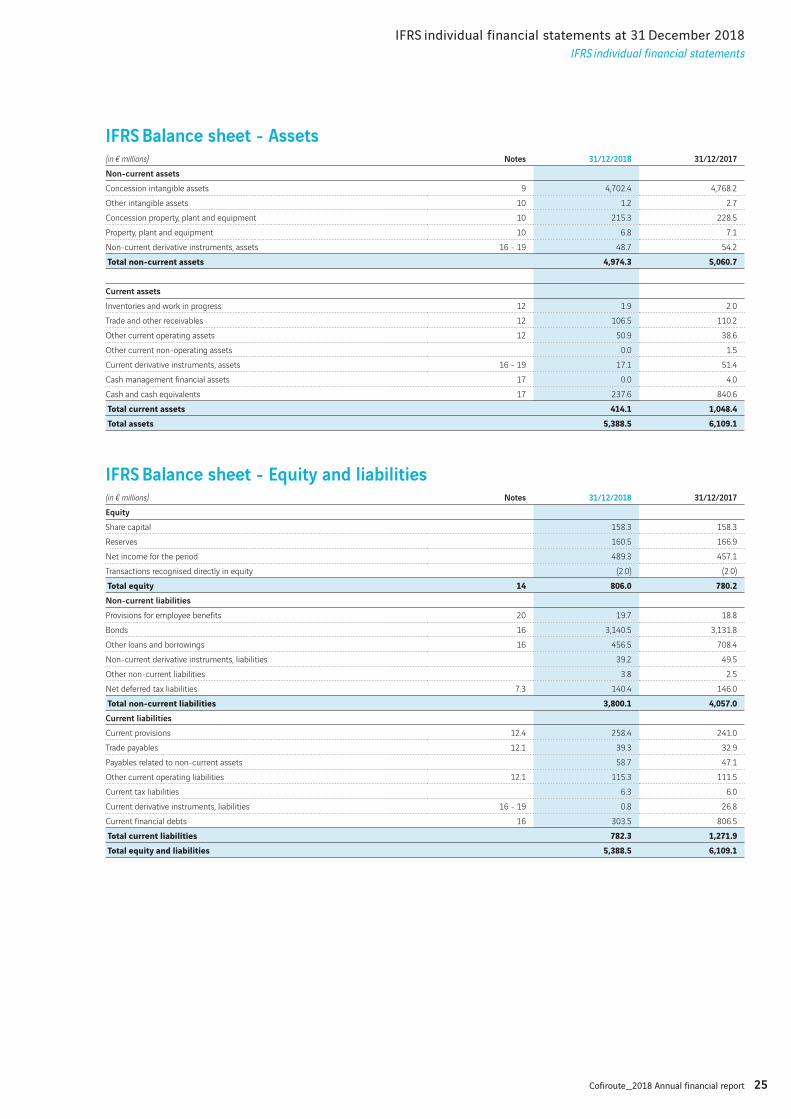
IFRS Balance sheet - Assets (in € millions) Notes 31/12/2018 31/12/2017
Non-current assets
Concession intangible assets 9 4,702.4 4,768.2
Other intangible assets 10 1.2 2.7
Concession property, plant and equipment 10 215.3 228.5
Property, plant and equipment 10 6.8 7.1
Non-current derivative instruments, assets 16 - 19 48.7 54.2
Total non-current assets 4,974.3 5,060.7
Current assets
Inventories and work in progress 12 1.9 2.0
Trade and other receivables 12 106.5 110.2
Other current operating assets 12 50.9 38.6
Other current non-operating assets 0.0 1.5
Current derivative instruments, assets 16 - 19 17.1 51.4
Cash management financial assets 17 0.0 4.0
Cash and cash equivalents 17 237.6 840.6
Total current assets 414.1 1,048.4Total assets 5,388.5 6,109.1
IFRS Balance sheet - Equity and liabilities (in € millions) Notes 31/12/2018 31/12/2017
Equity
Share capital 158.3 158.3
Reserves 160.5 166.9
Net income for the period 489.3 457.1
Transactions recognised directly in equity (2.0) (2.0)
Total equity 14 806.0 780.2Non-current liabilities
Provisions for employee benefits 20 19.7 18.8
Bonds 16 3,140.5 3,131.8
Other loans and borrowings 16 456.5 708.4
Non-current derivative instruments, liabilities 39.2 49.5
Other non-current liabilities 3.8 2.5
Net deferred tax liabilities 7.3 140.4 146.0
Total non-current liabilities 3,800.1 4,057.0Current liabilities
Current provisions 12.4 258.4 241.0
Trade payables 12.1 39.3 32.9
Payables related to non-current assets 58.7 47.1
Other current operating liabilities 12.1 115.3 111.5
Current tax liabilities 6.3 6.0
Current derivative instruments, liabilities 16 - 19 0.8 26.8
Current financial debts 16 303.5 806.5
Total current liabilities 782.3 1,271.9Total equity and liabilities 5,388.5 6,109.1
26 Cofiroute_2018 Annual financial report
IFRS individual financial statements at 31 December 2018
IFRS individual financial statements
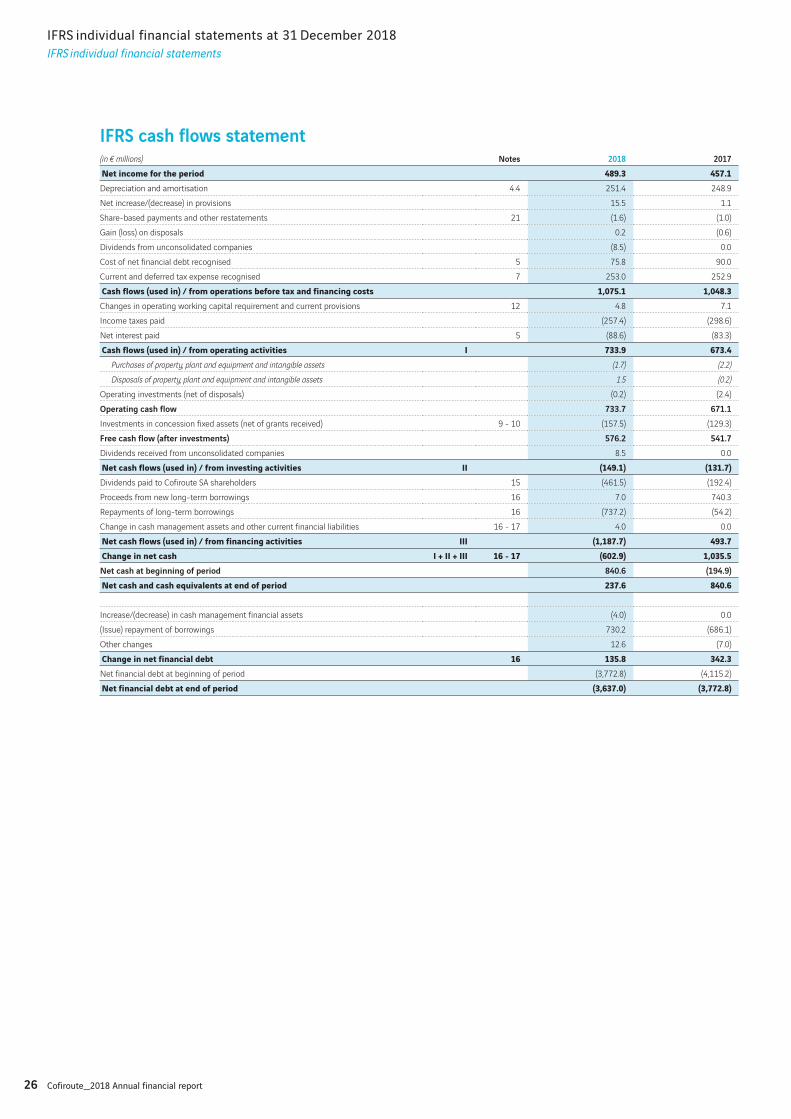
IFRS cash flows statement (in € millions) Notes 2018 2017
Net income for the period 489.3 457.1Depreciation and amortisation 4.4 251.4 248.9
Net increase/(decrease) in provisions 15.5 1.1
Share-based payments and other restatements 21 (1.6) (1.0)
Gain (loss) on disposals 0.2 (0.6)
Dividends from unconsolidated companies (8.5) 0.0
Cost of net financial debt recognised 5 75.8 90.0
Current and deferred tax expense recognised 7 253.0 252.9
Cash flows (used in) / from operations before tax and financing costs 1,075.1 1,048.3Changes in operating working capital requirement and current provisions 12 4.8 7.1
Income taxes paid (257.4) (298.6)
Net interest paid 5 (88.6) (83.3)
Cash flows (used in) / from operating activities I 733.9 673.4Purchases of property, plant and equipment and intangible assets (1.7) (2.2)
Disposals of property, plant and equipment and intangible assets 1.5 (0.2)
Operating investments (net of disposals) (0.2) (2.4)
Operating cash flow 733.7 671.1
Investments in concession fixed assets (net of grants received) 9 - 10 (157.5) (129.3)
Free cash flow (after investments) 576.2 541.7
Dividends received from unconsolidated companies 8.5 0.0
Net cash flows (used in) / from investing activities II (149.1) (131.7)Dividends paid to Cofiroute SA shareholders 15 (461.5) (192.4)
Proceeds from new long-term borrowings 16 7.0 740.3
Repayments of long-term borrowings 16 (737.2) (54.2)
Change in cash management assets and other current financial liabilities 16 - 17 4.0 0.0
Net cash flows (used in) / from financing activities III (1,187.7) 493.7Change in net cash I + II + III 16 - 17 (602.9) 1,035.5Net cash at beginning of period 840.6 (194.9)
Net cash and cash equivalents at end of period 237.6 840.6
Increase/(decrease) in cash management financial assets (4.0) 0.0
(Issue) repayment of borrowings 730.2 (686.1)
Other changes 12.6 (7.0)
Change in net financial debt 16 135.8 342.3Net financial debt at beginning of period (3,772.8) (4,115.2)
Net financial debt at end of period (3,637.0) (3,772.8)
27Cofiroute_2018 Annual financial report
IFRS individual financial statements at 31 December 2018
IFRS individual financial statements
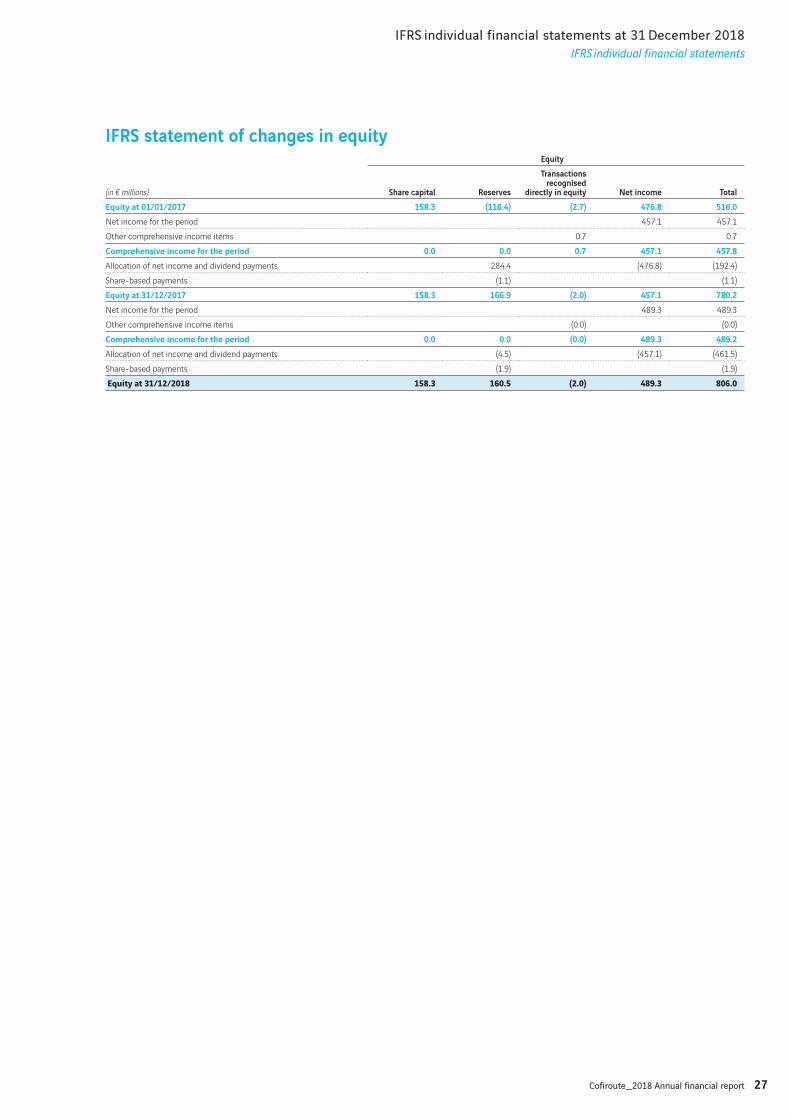
IFRS statement of changes in equity
(in € millions)
Equity
Share capital Reserves
Transactions recognised
directly in equity Net income Total
Equity at 01/01/2017 158.3 (116.4) (2.7) 476.8 516.0
Net income for the period 457.1 457.1
Other comprehensive income items 0.7 0.7
Comprehensive income for the period 0.0 0.0 0.7 457.1 457.8
Allocation of net income and dividend payments 284.4 (476.8) (192.4)
Share-based payments (1.1) (1.1)
Equity at 31/12/2017 158.3 166.9 (2.0) 457.1 780.2
Net income for the period 489.3 489.3
Other comprehensive income items (0.0) (0.0)
Comprehensive income for the period 0.0 0.0 (0.0) 489.3 489.2
Allocation of net income and dividend payments (4.5) (457.1) (461.5)
Share-based payments (1.9) (1.9)
Equity at 31/12/2018 158.3 160.5 (2.0) 489.3 806.0
28 Cofiroute_2018 Annual financial report
IFRS individual financial statements at 31 December 2018
Notes to the IFRS individual financial statements
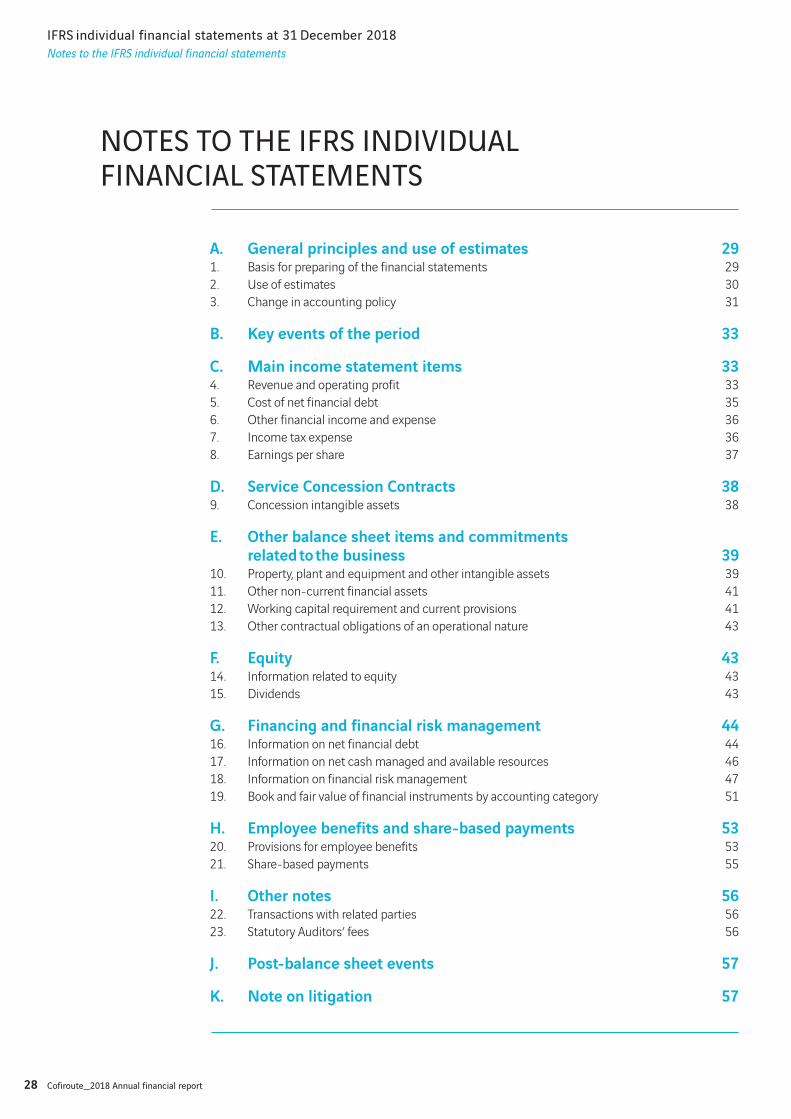
NOTES TO THE IFRS INDIVIDUAL FINANCIAL STATEMENTS
A. General principles and use of estimates 291. Basis for preparing of the financial statements 29
2. Use of estimates 30
3. Change in accounting policy 31
B. Key events of the period 33
C. Main income statement items 334. Revenue and operating profit 33
5. Cost of net financial debt 35
6. Other financial income and expense 36
7. Income tax expense 36
8. Earnings per share 37
D. Service Concession Contracts 389. Concession intangible assets 38
E. Other balance sheet items and commitments related to the business 39
10. Property, plant and equipment and other intangible assets 39
11. Other non-current financial assets 41
12. Working capital requirement and current provisions 41
13. Other contractual obligations of an operational nature 43
F. Equity 4314. Information related to equity 43
15. Dividends 43
G. Financing and financial risk management 4416. Information on net financial debt 44
17. Information on net cash managed and available resources 46
18. Information on financial risk management 47
19. Book and fair value of financial instruments by accounting category 51
H. Employee benefits and share-based payments 5320. Provisions for employee benefits 53
21. Share-based payments 55
I. Other notes 5622. Transactions with related parties 56
23. Statutory Auditors’ fees 56
J. Post-balance sheet events 57
K. Note on litigation 57
29Cofiroute_2018 Annual financial report
IFRS individual financial statements at 31 December 2018
Notes to the IFRS individual financial statements
A. General principles and use of estimates
1. Basis for preparing of the financial statementsAs required by European regulation No. 1606/2002 of 19 July 2002, Cofiroute’s IFRS individual financial statements for the year ended 31 December 2018 have been prepared and presented in accordance with the International Financial Reporting Standards (IFRS) as adopted by the European Union at 31 December 2018(1).
The accounting policies retained at 31 December 2018 are the same as those used in preparing the IFRS individual financial statements at 31 December 2017, except for the standards and/or amendments to standards described below, adopted by the European Union and mandatories as from 1 January 2018.
The IFRS individual financial statements were approved by the Board of Directors on 1 February 2019 and will be submitted for shareholder approval at the Shareholders’ General Meeting on 22 March 2019.
1.1. New standards and interpretations applicable from 1 January 2018The impact of the application from 1 January 2018 of IFRS 15 ”Revenue from contracts with customers” and IFRS 9 ”Financial instruments” is described in Note A.3.
The other applicable standards and interpretations that are mandatory from 1 January 2018 do not have a significant impact on the consolidated financial statements of Cofiroute at 31 December 2018. They mainly include:
• amendments to IFRS 2 ”Classification and Measurement of Share-based Payment Transactions”;
• annual improvements, 2014-2016 cycle.
1.2. Standards and interpretations adopted by the IASB but not yet applicable at 31 December 2018Cofiroute did not opt for the early adoption of any of the new standards and interpretations listed below, which may relate to it, but whose application was not mandatory at 1 January 2016:
• IFRS 16 ”Leases”;
• IFRIC 23 ”Uncertainty over income tax treatments”;
• amendments to IAS 19 ”Plan amendment, curtailment or settlement”;
• amendments to IFRS 9 ”Prepayment features with negative compensation”;
• annual improvements, 2015-2017 cycle.
An analysis of the impacts and practical consequences of application of these standards, amendments and interpretations is currently underway.
IFRS 16 ”Leases” changes the recognition of leases by lessees. It will replace IAS 17, IFRIC 4, SIC 15 and SIC 27. IFRS 16, which will come into effect on 1 January 2019, requires that leases be accounted for in a single manner by lessees, impacting the balance sheet in a similar way to current finance leases.
Given the relatively short term of asset leases (primarily transport equipment), the current estimate of the effect on the Cofiroute financial statements may not be representative of the impact that will be recognised upon first-time application of IFRS 16.
Due to the features of certain leases (in particular in terms of renewal conditions), the periods used to measure contracts under IFRS 16 could, in some cases, be different from those used to measure those off-balance-sheet commitments where only the firm commitment period is taken into account. The commitments mentioned in Note 13. ”Other contractual obligations of an operational nature” could therefore differ from the liabilities that will be recognised under IFRS 16.
Cofiroute should opt for the retrospective approach, recognising the cumulative effect of the initial application of the standard on the date of first-time application.
IFRIC 23 ”Uncertainty over Income Tax Treatments” supplements IAS 12 Income Taxes by laying out the ways to measure and recognise uncertainties related to income taxes. This interpretation is mandatory for reporting periods beginning from 1 January 2019. Cofiroute does not expect implementation of this interpretation to have a material effect on opening equity at 1 January 2019.
(1) Available at: https://ec.europa.eu/info/business-economy-euro/company-reporting-and-auditing/company-reporting_en
30 Cofiroute_2018 Annual financial report
IFRS individual financial statements at 31 December 2018
Notes to the IFRS individual financial statements
Amendments to IAS 19 ”Plan Amendment, Curtailment or Settlement”, mandatory starting 1 January 2019, subject to approval by the European Union. These new amendments to IAS 19 state that in the event of amendment, curtailment or settlement of a defined-benefit plan occurring in the period, the cost of services rendered and net interest must be re-measured for the following period using the same assumptions used to remeasure the net liability or asset. The requirements regarding the capping of the asset during this remeasurement have been clarified.
Our analyses confirm that the clarifications made by these new amendments to IAS 19 are consistent with the methods and assumptions currently in use by Cofiroute to measure retirement plans.
2. Use of estimatesThe preparation of financial statements under IFRS requires estimates to be used and assumptions to be made that affect the amounts shown in these financial statements.
These estimates assume the operation is a going concern and are drawn up on the basis of the information available at the time. Estimates may be revised if the circumstances on which they were based change or if new information becomes available. Actual results may be different from these estimates.
Values used in impairment testsThe assumptions and estimates drawn upon to determine the recoverable amount of intangible assets and property, plant and equipment relate in particular to the market outlook required to assess the cash flow and discount rates applied. Any change in these assumptions could have a material effect on the recoverable amount.
Measurement of provisionsThe factors that materially influence provision amounts include:
• forecasts for medium- to long-term maintenance expenditure and for major repairs, which serve as a basis for provisions for the obligation to maintain infrastructure assets under concession in good condition. These forecasts are estimated by taking into account the indexing clauses of construction contracts (primarily the TP01, TP02 and TP09 indices);
• the discount rates used to discount these provisions to present value.
Measurement at fair valueCofiroute mainly uses fair value in measuring, on a consistent basis, derivative instruments, cash and cash equivalents and cash management financial assets. Fair values of other financial instruments (debt instruments and loans and receivables at amortised cost in particular) are disclosed in Note G.19. ”Carrying amount and fair value by accounting category” of the notes to the IFRS individual financial statements.
Fair value is the price that would be received from selling an asset or paid to transfer a liability in a normal transaction. It is recognised on the basis of the asset or liability’s main market (or the most advantageous market if there is no main market), i.e. the one that offers the highest volume and activity levels. The fair value of derivative financial instruments includes a ”counterparty risk” component for derivatives carried as assets and an ”own credit risk” component for derivatives carried as liabilities.
To determine these fair values, Cofiroute mainly uses the following measurement methods:
• market-based approaches, based on observable market prices or transactions;
• revenue-based approaches, which convert future cash flows into a single present value;
• cost-based approaches, which take the physical, technological and economic obsolescence of the measured asset into account.
The following three-level ranking of fair values is used:
• level 1: quoted prices in an active market. Marketable securities and listed bonds are valued in this way;
• level 2: internal model using observable factors based on internal valuation techniques: these techniques are based on standard mathematical computation methods, which incorporate observable market data (forward prices, yield curves, etc.). Most derivatives (swaps, caps, floors, etc.) traded on markets are measured on the basis of models commonly used by market practitioners in pricing these financial instruments. Internal valuations of derivatives are checked quarterly for consistency with the valuations sent by counterparties;
• level 3: internal model using non-observable inputs: this model applies in particular to holdings of unlisted shares, which are assessed at their acquisition cost plus transaction costs, in the absence of an active market;
31Cofiroute_2018 Annual financial report
IFRS individual financial statements at 31 December 2018
Notes to the IFRS individual financial statements
Measurement of retirement benefit obligations
• Cofiroute subscribes to defined-contribution and defined-benefit retirement plans. Its obligations in connection with these defined benefit plans are measured using the actuarial projected unit credit method based on assumptions such as the discount rate, future increases in wages and salaries, employee turnover, mortality rates and the healthcare expenditure growth rate.
• These assumptions are generally updated annually. Cofiroute considers that the actuarial assumptions used are appropriate and justified in current conditions. Obligations may, however, change in the event of changes in assumptions.
Valuation of share-based paymentsCofiroute recognises a share-based payment expense for the granting of performance share plans to certain employees and the VINCI Group savings plan. This expense is measured using actuarial calculations based on estimated behavioural assumptions arising from observation of past behaviour.
The main actuarial assumptions (volatility, return on shares) used by Cofiroute are described by plan in Note H.21. ”Share-based payments”.
3. Change in accounting policy
3.1. IFRS 15 ”Revenue from Contracts with Customers”Cofiroute adopted IFRS 15 on 1 January 2018, the date on which it came into force in the European Union. With regard to non-material impacts identified, IFRS 15 was applied retrospectively to contracts in effect using the so-called ”simplified retrospective” transition method. The 2017 data, presented for comparative purposes, were not adjusted and continue to be presented according to the previous accounting guidelines (IAS 11 ”Construction Contracts” and IAS 18 ”Revenue”).
At 1 January 2018 the first-time application of the standard did not cause Cofiroute to alter the amount of its opening equity.
Since 1 January 2018 Cofiroute has applied IFRS 15 to measure and recognise consolidated revenue. The new accounting policies are described in Note C.4. ”Revenue” and D. ”Concession contracts”.
The addition of references to IFRS 15 in the provisions of IFRIC 12 has not resulted in Cofiroute identifying any differences with its revenue recognition practice either in terms of identifying new performance obligations or the timing of revenue recognition.
3.2. IFRS 9 ”Financial instruments”As from 1 January 2018, Cofiroute has applied the provisions of IFRS 9 ”Financial Instruments”.
IFRS 9 ”Financial instruments” sets out the relevant rules for the recognition and measurement of financial assets and liabilities and of certain contracts to buy or sell non-financial items. This standard supersedes IAS 39 ”Financial instruments”, which was applied up to 31 December 2017.
Phase I – Classification and measurement of financial assetsThe provisions of IFRS 9 regarding the classification and measurement of financial assets are based on the business management model and the contractual characteristics of the financial assets.
When applying this standard, Cofiroute reviewed the characteristics, in particular remuneration, of its financial assets. In light of Cofiroute’s practices in how it manages its financial assets, not holding complex financial instruments, it was concluded that all of the financial assets of Cofiroute respected the Solely Payment of Principal and Interest (SPPI) criterion as defined by IFRS 9. There was therefore no change in accounting policy for the financial assets recognised at amortised cost pursuant to IAS 39 upon first-time application of IFRS 9.
Cofiroute also reviewed its portfolio of equity instruments, primarily comprising non-consolidated investments in subsidiaries and affiliates, in order to determine the measurement method for each security (either at fair value through profit and loss or fair value through equity). The securities in the portfolio as at 1 January 2018 were measured at fair value through equity.
For the shares of listed companies, this fair value is determined on the basis of the stock market price on the reporting date. For unlisted securities, if the fair value cannot be reliably determined at each reporting date, they are kept in the balance sheet at their initial fair value, namely at their acquisition cost plus transaction costs, adjusted for any increase or decrease in value determined by an analysis of the change in the percentage of equity held.
Every time equity securities are acquired, a similar analysis will be done to determine Cofiroute’s management intent, thereby characterising the manner in which changes in fair value are recognised.
Loans and receivables are henceforth classified as ”Financial assets at amortised cost” and available-for-sale financial assets are classified under ”Equity instruments” and remain on the balance sheet under ”Other financial assets” (see details in Note G.19. ”Carrying amount and fair value of financial assets and liabilities by accounting category”).

32 Cofiroute_2018 Annual financial report
IFRS individual financial statements at 31 December 2018
Notes to the IFRS individual financial statements
Phase II – Impairment model for financial assetsThe standard also changed the methods for recording impairment of Cofiroute financial assets, as IFRS 9 proposes a new model based on expected losses. An analysis of the portfolios of trade and financial receivables, as well as of loans granted, in particular to companies accounted for under the equity method, has been carried out.
Cofiroute opted for a simplified method for measuring the impairment of its trade receivables.
Credit risk from financial receivables and loans was measured on the basis of the IFRS 9 full mode. No significant increase in credit risk was identified.
In order to estimate the likelihood of non-recovery of Cofiroute’s financial assets, an analysis of the losses recognised over the period will be done annually in order to adjust the impairment rates if necessary.
Phase III – Hedge accountingThe provisions relating to hedge accounting will allow Cofiroute to bring the accounting into line with its risk management policy.
The provisions of IFRS 9 allow changes in the value of all hedging costs to be recognised (swap points, basis swaps and option premiums) under other comprehensive income and to recycle them through profit and loss on a straight-line basis in the event of hedging over a period of time or, in the case of transaction hedging, at the same rate as the recognition of the hedged transaction.
The ineffective portion of hedging by Cofiroute was recognised under Cost of net financial debt, and recycling will therefore also be presented in the income statement under Cost of financial debt.
New accounting model for regociated financingCofiroute analysed the substance of the debt refinancing that took place prior to 1 January 2018. No transaction was dealt with on a debt continuity basis, and so no impact from this new model was recognised at 1 January 2018.
Just like under IAS 39, the analysis of changes in debt will be based both on quantitative criteria (10% test) and qualitative criteria (change in covenant, currency or rate structure, etc.). If the analysis gives rise to debt continuity, the carrying amount thereof will be adjusted in accordance with the provisions of IFRS 9.
The transition approach used was the simplified approach. The 2017 financial statements were therefore not adjusted, with only the opening balance sheet at 1 January 2018 being adjusted to reflect all these impacts, mostly on presentation.
The effects of the first-time application of IFRS 15 and IFRS 9 at 1 January 2018 had no impact on the subtotals presented on the asset and liability sides of the balance sheet.
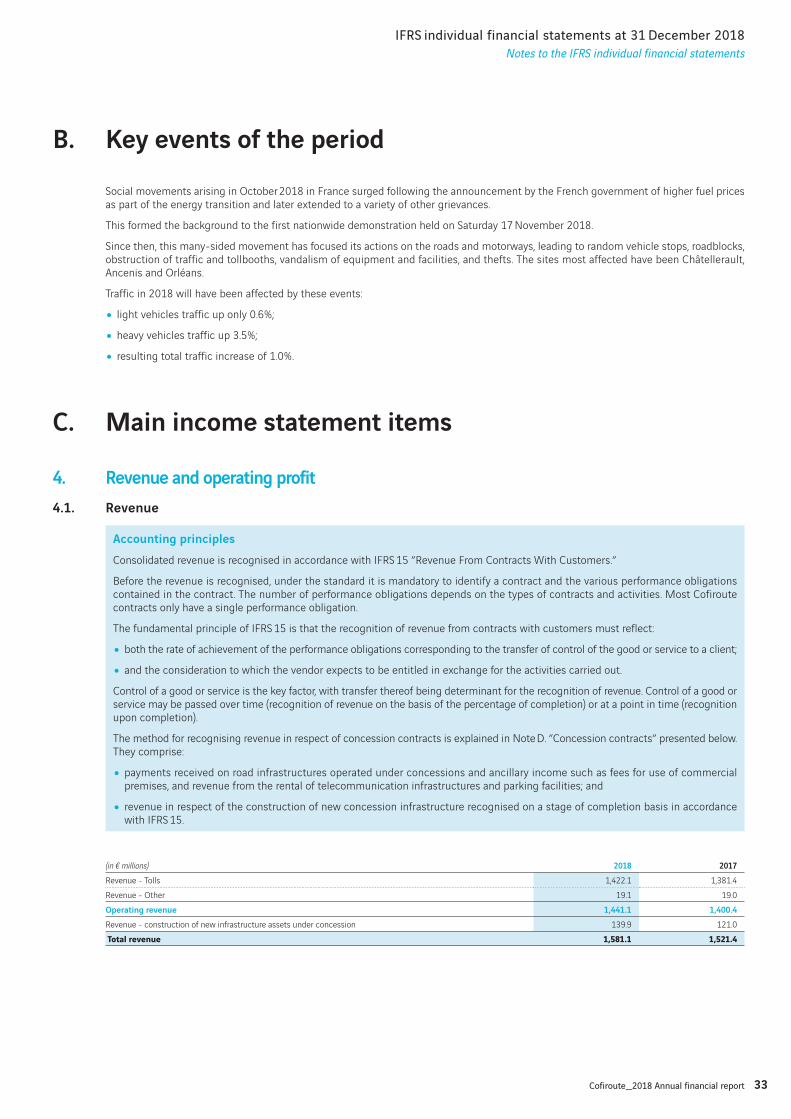
33Cofiroute_2018 Annual financial report
IFRS individual financial statements at 31 December 2018
Notes to the IFRS individual financial statements
B. Key events of the period
Social movements arising in October 2018 in France surged following the announcement by the French government of higher fuel prices as part of the energy transition and later extended to a variety of other grievances.
This formed the background to the first nationwide demonstration held on Saturday 17 November 2018.
Since then, this many-sided movement has focused its actions on the roads and motorways, leading to random vehicle stops, roadblocks, obstruction of traffic and tollbooths, vandalism of equipment and facilities, and thefts. The sites most affected have been Châtellerault, Ancenis and Orléans.
Traffic in 2018 will have been affected by these events:
• light vehicles traffic up only 0.6%;
• heavy vehicles traffic up 3.5%;
• resulting total traffic increase of 1.0%.
C. Main income statement items
4. Revenue and operating profit
4.1. Revenue
Accounting principles
Consolidated revenue is recognised in accordance with IFRS 15 ”Revenue From Contracts With Customers.”
Before the revenue is recognised, under the standard it is mandatory to identify a contract and the various performance obligations contained in the contract. The number of performance obligations depends on the types of contracts and activities. Most Cofiroute contracts only have a single performance obligation.
The fundamental principle of IFRS 15 is that the recognition of revenue from contracts with customers must reflect:
• both the rate of achievement of the performance obligations corresponding to the transfer of control of the good or service to a client;
• and the consideration to which the vendor expects to be entitled in exchange for the activities carried out.
Control of a good or service is the key factor, with transfer thereof being determinant for the recognition of revenue. Control of a good or service may be passed over time (recognition of revenue on the basis of the percentage of completion) or at a point in time (recognition upon completion).
The method for recognising revenue in respect of concession contracts is explained in Note D. ”Concession contracts” presented below. They comprise:
• payments received on road infrastructures operated under concessions and ancillary income such as fees for use of commercial premises, and revenue from the rental of telecommunication infrastructures and parking facilities; and
• revenue in respect of the construction of new concession infrastructure recognised on a stage of completion basis in accordance with IFRS 15.
(in € millions) 2018 2017
Revenue - Tolls 1,422.1 1,381.4
Revenue - Other 19.1 19.0
Operating revenue 1,441.1 1,400.4
Revenue - construction of new infrastructure assets under concession 139.9 121.0
Total revenue 1,581.1 1,521.4
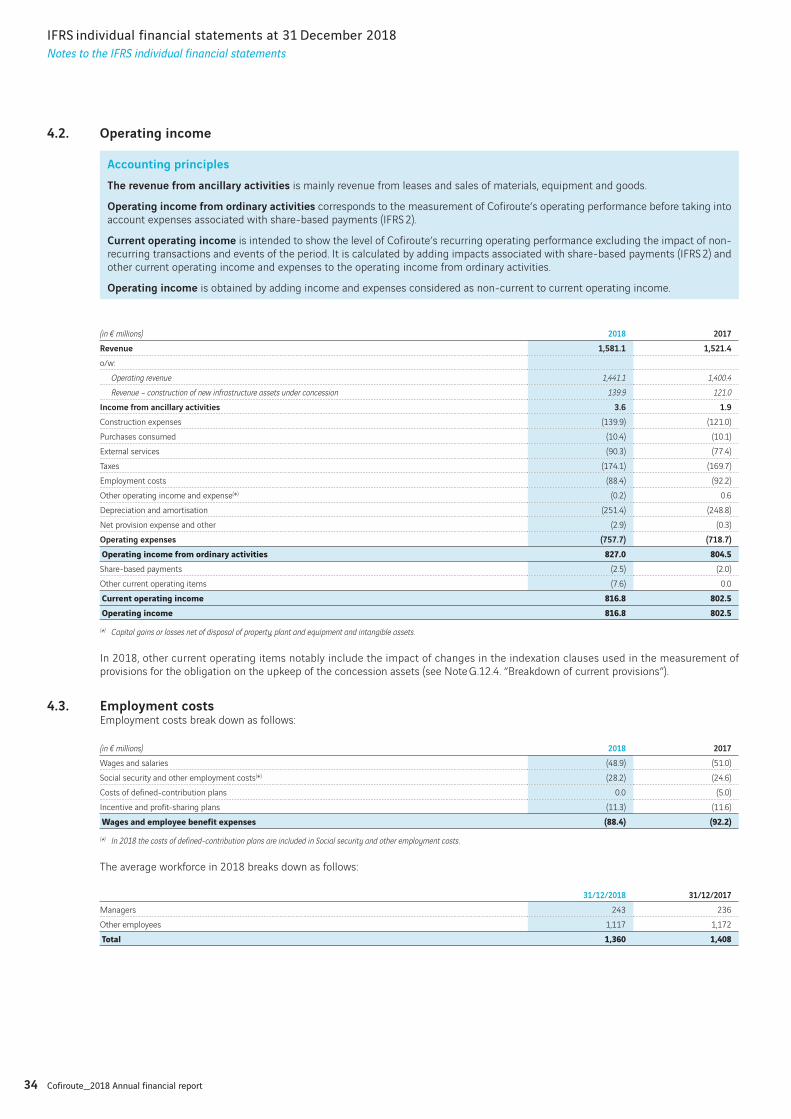
34 Cofiroute_2018 Annual financial report
IFRS individual financial statements at 31 December 2018
Notes to the IFRS individual financial statements
4.2. Operating income
Accounting principles
The revenue from ancillary activities is mainly revenue from leases and sales of materials, equipment and goods.
Operating income from ordinary activities corresponds to the measurement of Cofiroute’s operating performance before taking into account expenses associated with share-based payments (IFRS 2).
Current operating income is intended to show the level of Cofiroute’s recurring operating performance excluding the impact of non- recurring transactions and events of the period. It is calculated by adding impacts associated with share-based payments (IFRS 2) and other current operating income and expenses to the operating income from ordinary activities.
Operating income is obtained by adding income and expenses considered as non-current to current operating income.
(in € millions) 2018 2017
Revenue 1,581.1 1,521.4
o/w:
Operating revenue 1,441.1 1,400.4
Revenue – construction of new infrastructure assets under concession 139.9 121.0
Income from ancillary activities 3.6 1.9
Construction expenses (139.9) (121.0)
Purchases consumed (10.4) (10.1)
External services (90.3) (77.4)
Taxes (174.1) (169.7)
Employment costs (88.4) (92.2)
Other operating income and expense(*) (0.2) 0.6
Depreciation and amortisation (251.4) (248.8)
Net provision expense and other (2.9) (0.3)
Operating expenses (757.7) (718.7)
Operating income from ordinary activities 827.0 804.5Share-based payments (2.5) (2.0)
Other current operating items (7.6) 0.0
Current operating income 816.8 802.5Operating income 816.8 802.5
(*) Capital gains or losses net of disposal of property, plant and equipment and intangible assets.
In 2018, other current operating items notably include the impact of changes in the indexation clauses used in the measurement of provisions for the obligation on the upkeep of the concession assets (see Note G.12.4. ”Breakdown of current provisions”).
4.3. Employment costsEmployment costs break down as follows:
(in € millions) 2018 2017
Wages and salaries (48.9) (51.0)
Social security and other employment costs(*) (28.2) (24.6)
Costs of defined-contribution plans 0.0 (5.0)
Incentive and profit-sharing plans (11.3) (11.6)
Wages and employee benefit expenses (88.4) (92.2)(*) In 2018 the costs of defined-contribution plans are included in Social security and other employment costs.
The average workforce in 2018 breaks down as follows:
31/12/2018 31/12/2017
Managers 243 236
Other employees 1,117 1,172
Total 1,360 1,408
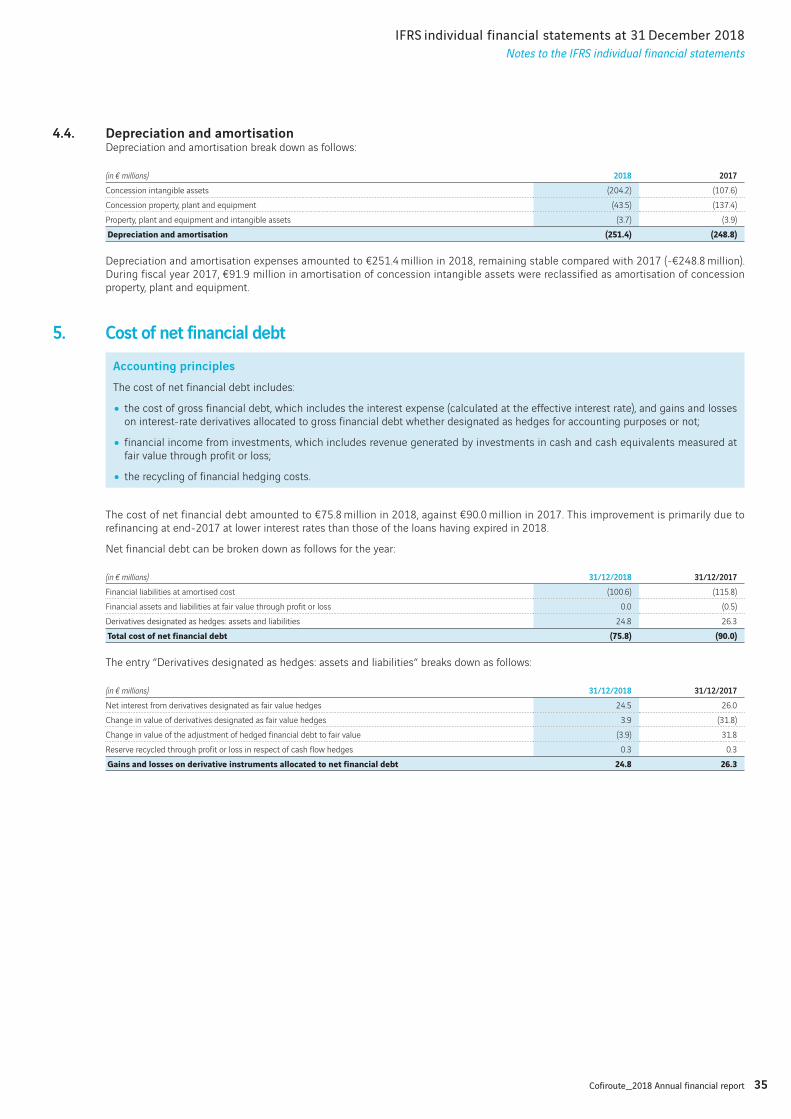
35Cofiroute_2018 Annual financial report
IFRS individual financial statements at 31 December 2018
Notes to the IFRS individual financial statements
4.4. Depreciation and amortisationDepreciation and amortisation break down as follows:
(in € millions) 2018 2017
Concession intangible assets (204.2) (107.6)
Concession property, plant and equipment (43.5) (137.4)
Property, plant and equipment and intangible assets (3.7) (3.9)
Depreciation and amortisation (251.4) (248.8)
Depreciation and amortisation expenses amounted to €251.4 million in 2018, remaining stable compared with 2017 (-€248.8 million). During fiscal year 2017, €91.9 million in amortisation of concession intangible assets were reclassified as amortisation of concession property, plant and equipment.
5. Cost of net financial debt
Accounting principles
The cost of net financial debt includes:
• the cost of gross financial debt, which includes the interest expense (calculated at the effective interest rate), and gains and losses on interest-rate derivatives allocated to gross financial debt whether designated as hedges for accounting purposes or not;
• financial income from investments, which includes revenue generated by investments in cash and cash equivalents measured at fair value through profit or loss;
• the recycling of financial hedging costs.
The cost of net financial debt amounted to €75.8 million in 2018, against €90.0 million in 2017. This improvement is primarily due to refinancing at end-2017 at lower interest rates than those of the loans having expired in 2018.
Net financial debt can be broken down as follows for the year:
(in € millions) 31/12/2018 31/12/2017
Financial liabilities at amortised cost (100.6) (115.8)
Financial assets and liabilities at fair value through profit or loss 0.0 (0.5)
Derivatives designated as hedges: assets and liabilities 24.8 26.3
Total cost of net financial debt (75.8) (90.0)
The entry ”Derivatives designated as hedges: assets and liabilities” breaks down as follows:
(in € millions) 31/12/2018 31/12/2017
Net interest from derivatives designated as fair value hedges 24.5 26.0
Change in value of derivatives designated as fair value hedges 3.9 (31.8)
Change in value of the adjustment of hedged financial debt to fair value (3.9) 31.8
Reserve recycled through profit or loss in respect of cash flow hedges 0.3 0.3
Gains and losses on derivative instruments allocated to net financial debt 24.8 26.3
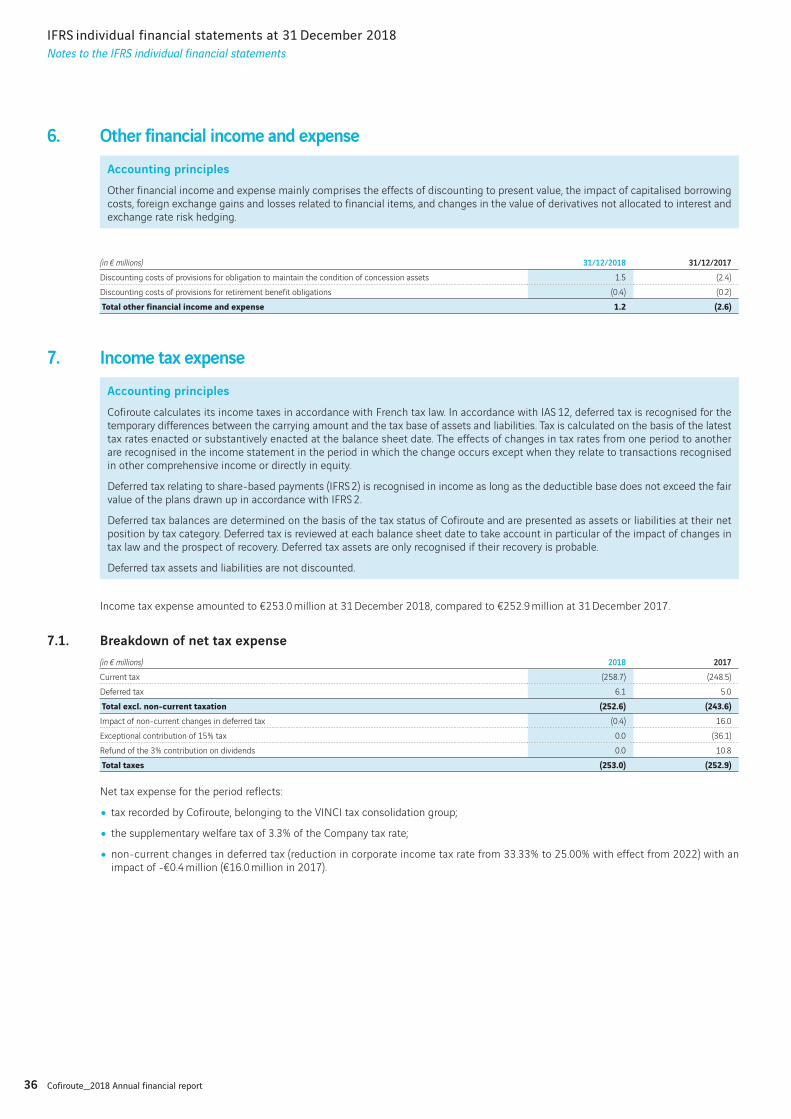
36 Cofiroute_2018 Annual financial report
IFRS individual financial statements at 31 December 2018
Notes to the IFRS individual financial statements
6. Other financial income and expense
Accounting principles
Other financial income and expense mainly comprises the effects of discounting to present value, the impact of capitalised borrowing costs, foreign exchange gains and losses related to financial items, and changes in the value of derivatives not allocated to interest and exchange rate risk hedging.
(in € millions) 31/12/2018 31/12/2017
Discounting costs of provisions for obligation to maintain the condition of concession assets 1.5 (2.4)
Discounting costs of provisions for retirement benefit obligations (0.4) (0.2)
Total other financial income and expense 1.2 (2.6)
7. Income tax expense
Accounting principles
Cofiroute calculates its income taxes in accordance with French tax law. In accordance with IAS 12, deferred tax is recognised for the temporary differences between the carrying amount and the tax base of assets and liabilities. Tax is calculated on the basis of the latest tax rates enacted or substantively enacted at the balance sheet date. The effects of changes in tax rates from one period to another are recognised in the income statement in the period in which the change occurs except when they relate to transactions recognised in other comprehensive income or directly in equity.
Deferred tax relating to share-based payments (IFRS 2) is recognised in income as long as the deductible base does not exceed the fair value of the plans drawn up in accordance with IFRS 2.
Deferred tax balances are determined on the basis of the tax status of Cofiroute and are presented as assets or liabilities at their net position by tax category. Deferred tax is reviewed at each balance sheet date to take account in particular of the impact of changes in tax law and the prospect of recovery. Deferred tax assets are only recognised if their recovery is probable.
Deferred tax assets and liabilities are not discounted.
Income tax expense amounted to €253.0 million at 31 December 2018, compared to €252.9 million at 31 December 2017.
7.1. Breakdown of net tax expense
(in € millions) 2018 2017
Current tax (258.7) (248.5)
Deferred tax 6.1 5.0
Total excl. non-current taxation (252.6) (243.6)Impact of non-current changes in deferred tax (0.4) 16.0
Exceptional contribution of 15% tax 0.0 (36.1)
Refund of the 3% contribution on dividends 0.0 10.8
Total taxes (253.0) (252.9)
Net tax expense for the period reflects:
• tax recorded by Cofiroute, belonging to the VINCI tax consolidation group;
• the supplementary welfare tax of 3.3% of the Company tax rate;
• non-current changes in deferred tax (reduction in corporate income tax rate from 33.33% to 25.00% with effect from 2022) with an impact of -€0.4 million (€16.0 million in 2017).
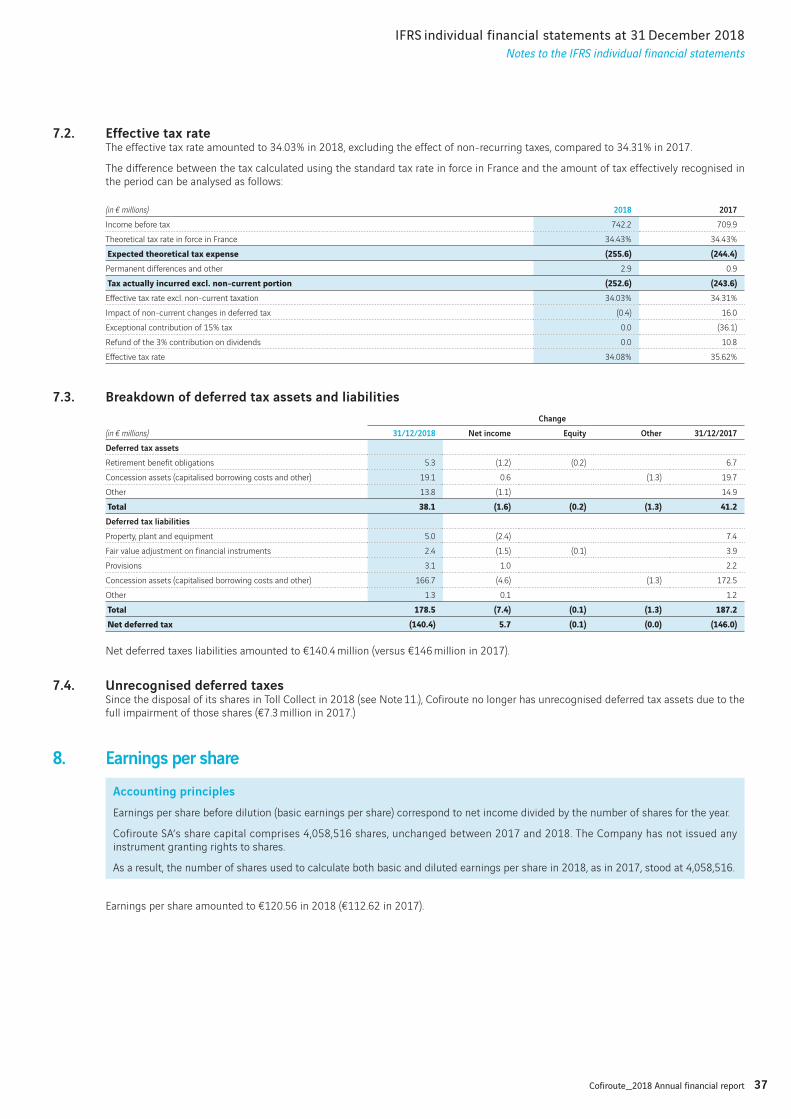
37Cofiroute_2018 Annual financial report
IFRS individual financial statements at 31 December 2018
Notes to the IFRS individual financial statements
7.2. Effective tax rateThe effective tax rate amounted to 34.03% in 2018, excluding the effect of non-recurring taxes, compared to 34.31% in 2017.
The difference between the tax calculated using the standard tax rate in force in France and the amount of tax effectively recognised in the period can be analysed as follows:
(in € millions) 2018 2017
Income before tax 742.2 709.9
Theoretical tax rate in force in France 34.43% 34.43%
Expected theoretical tax expense (255.6) (244.4)Permanent differences and other 2.9 0.9
Tax actually incurred excl. non-current portion (252.6) (243.6)Effective tax rate excl. non-current taxation 34.03% 34.31%
Impact of non-current changes in deferred tax (0.4) 16.0
Exceptional contribution of 15% tax 0.0 (36.1)
Refund of the 3% contribution on dividends 0.0 10.8
Effective tax rate 34.08% 35.62%
7.3. Breakdown of deferred tax assets and liabilities
(in € millions)
Change
31/12/2018 Net income Equity Other 31/12/2017
Deferred tax assets
Retirement benefit obligations 5.3 (1.2) (0.2) 6.7
Concession assets (capitalised borrowing costs and other) 19.1 0.6 (1.3) 19.7
Other 13.8 (1.1) 14.9
Total 38.1 (1.6) (0.2) (1.3) 41.2Deferred tax liabilities
Property, plant and equipment 5.0 (2.4) 7.4
Fair value adjustment on financial instruments 2.4 (1.5) (0.1) 3.9
Provisions 3.1 1.0 2.2
Concession assets (capitalised borrowing costs and other) 166.7 (4.6) (1.3) 172.5
Other 1.3 0.1 1.2
Total 178.5 (7.4) (0.1) (1.3) 187.2Net deferred tax (140.4) 5.7 (0.1) (0.0) (146.0)
Net deferred taxes liabilities amounted to €140.4 million (versus €146 million in 2017).
7.4. Unrecognised deferred taxesSince the disposal of its shares in Toll Collect in 2018 (see Note 11.), Cofiroute no longer has unrecognised deferred tax assets due to the full impairment of those shares (€7.3 million in 2017.)
8. Earnings per share
Accounting principles
Earnings per share before dilution (basic earnings per share) correspond to net income divided by the number of shares for the year.
Cofiroute SA’s share capital comprises 4,058,516 shares, unchanged between 2017 and 2018. The Company has not issued any instrument granting rights to shares.
As a result, the number of shares used to calculate both basic and diluted earnings per share in 2018, as in 2017, stood at 4,058,516.
Earnings per share amounted to €120.56 in 2018 (€112.62 in 2017).
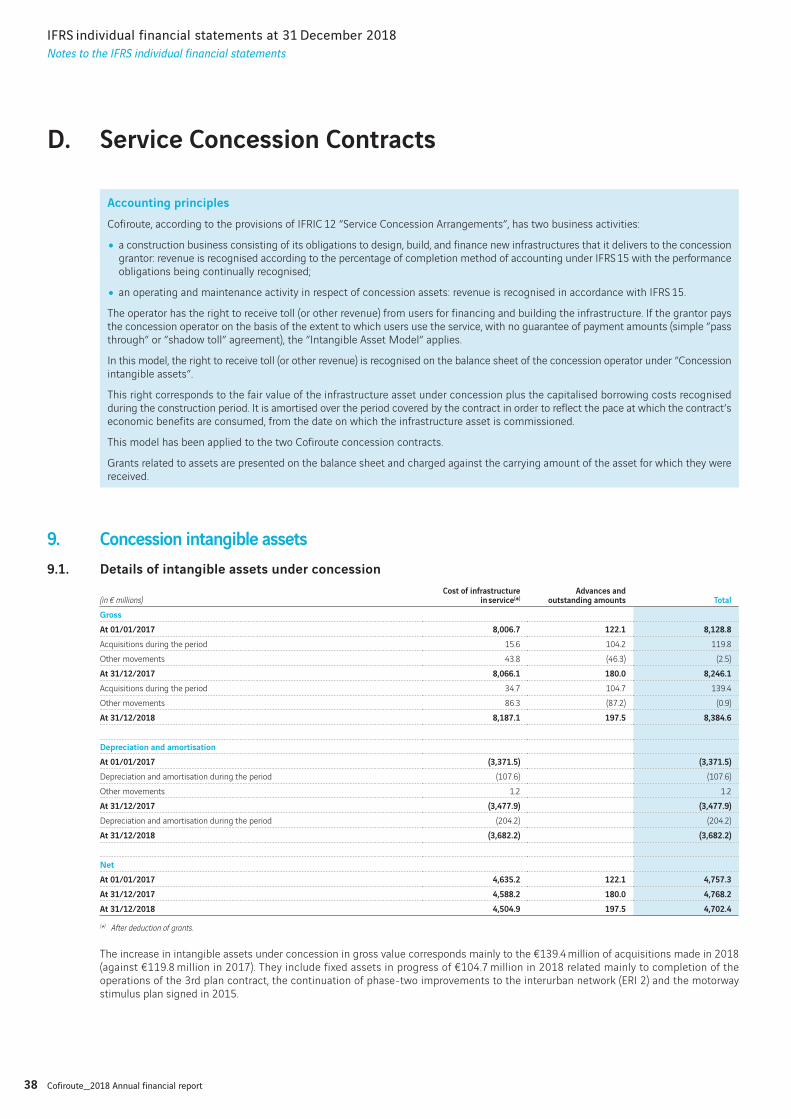
38 Cofiroute_2018 Annual financial report
IFRS individual financial statements at 31 December 2018
Notes to the IFRS individual financial statements
D. Service Concession Contracts
Accounting principles
Cofiroute, according to the provisions of IFRIC 12 ”Service Concession Arrangements”, has two business activities:
• a construction business consisting of its obligations to design, build, and finance new infrastructures that it delivers to the concession grantor: revenue is recognised according to the percentage of completion method of accounting under IFRS 15 with the performance obligations being continually recognised;
• an operating and maintenance activity in respect of concession assets: revenue is recognised in accordance with IFRS 15.
The operator has the right to receive toll (or other revenue) from users for financing and building the infrastructure. If the grantor pays the concession operator on the basis of the extent to which users use the service, with no guarantee of payment amounts (simple ”pass through” or ”shadow toll” agreement), the ”Intangible Asset Model” applies.
In this model, the right to receive toll (or other revenue) is recognised on the balance sheet of the concession operator under ”Concession intangible assets”.
This right corresponds to the fair value of the infrastructure asset under concession plus the capitalised borrowing costs recognised during the construction period. It is amortised over the period covered by the contract in order to reflect the pace at which the contract’s economic benefits are consumed, from the date on which the infrastructure asset is commissioned.
This model has been applied to the two Cofiroute concession contracts.
Grants related to assets are presented on the balance sheet and charged against the carrying amount of the asset for which they were received.
9. Concession intangible assets
9.1. Details of intangible assets under concession
(in € millions)Cost of infrastructure
in service(*)Advances and
outstanding amounts Total
Gross
At 01/01/2017 8,006.7 122.1 8,128.8
Acquisitions during the period 15.6 104.2 119.8
Other movements 43.8 (46.3) (2.5)
At 31/12/2017 8,066.1 180.0 8,246.1
Acquisitions during the period 34.7 104.7 139.4
Other movements 86.3 (87.2) (0.9)
At 31/12/2018 8,187.1 197.5 8,384.6
Depreciation and amortisation
At 01/01/2017 (3,371.5) (3,371.5)
Depreciation and amortisation during the period (107.6) (107.6)
Other movements 1.2 1.2
At 31/12/2017 (3,477.9) (3,477.9)
Depreciation and amortisation during the period (204.2) (204.2)
At 31/12/2018 (3,682.2) (3,682.2)
Net
At 01/01/2017 4,635.2 122.1 4,757.3
At 31/12/2017 4,588.2 180.0 4,768.2
At 31/12/2018 4,504.9 197.5 4,702.4
(*) After deduction of grants.
The increase in intangible assets under concession in gross value corresponds mainly to the €139.4 million of acquisitions made in 2018 (against €119.8 million in 2017). They include fixed assets in progress of €104.7 million in 2018 related mainly to completion of the operations of the 3rd plan contract, the continuation of phase-two improvements to the interurban network (ERI 2) and the motorway stimulus plan signed in 2015.
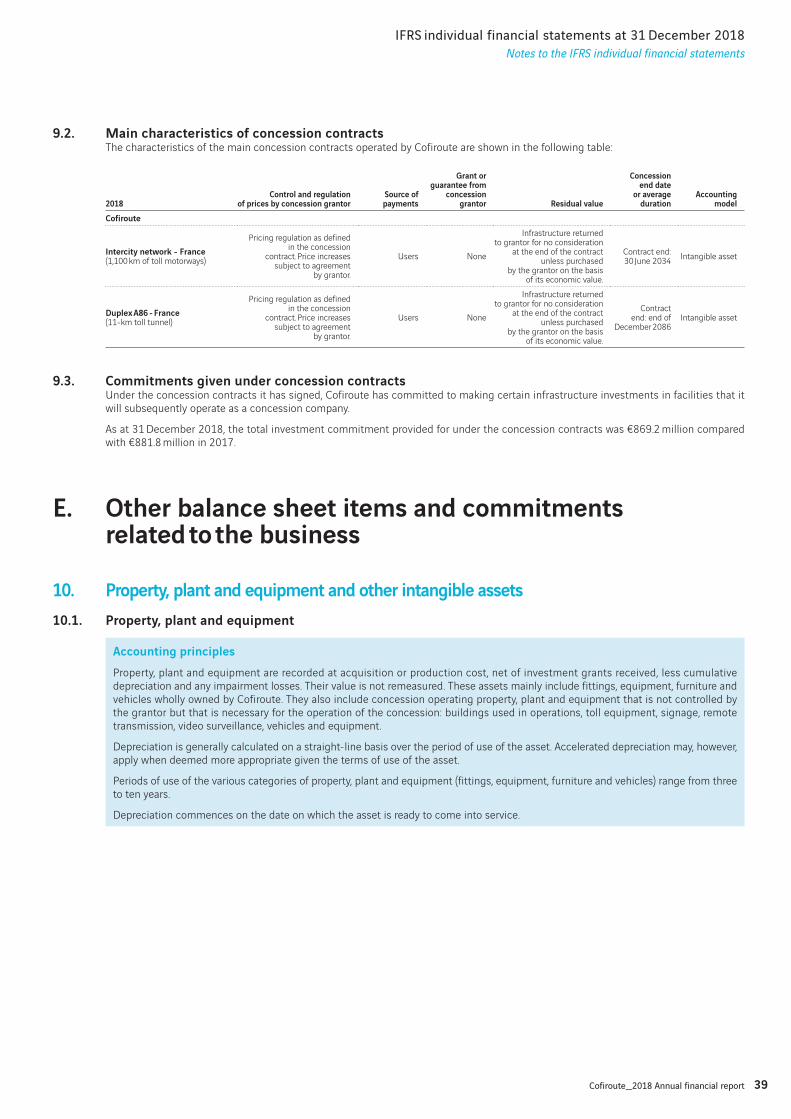
39Cofiroute_2018 Annual financial report
IFRS individual financial statements at 31 December 2018
Notes to the IFRS individual financial statements
9.2. Main characteristics of concession contractsThe characteristics of the main concession contracts operated by Cofiroute are shown in the following table:
2018Control and regulation
of prices by concession grantorSource of payments
Grant or guarantee from
concession grantor Residual value
Concession end date
or average duration
Accounting model
Cofiroute
Intercity network - France(1,100 km of toll motorways)
Pricing regulation as defined in the concession
contract. Price increases subject to agreement
by grantor.
Users None
Infrastructure returned to grantor for no consideration
at the end of the contract unless purchased
by the grantor on the basis of its economic value.
Contract end: 30 June 2034
Intangible asset
Duplex A86 - France(11-km toll tunnel)
Pricing regulation as defined in the concession
contract. Price increases subject to agreement
by grantor.
Users None
Infrastructure returned to grantor for no consideration
at the end of the contract unless purchased
by the grantor on the basis of its economic value.
Contract end: end of
December 2086Intangible asset
9.3. Commitments given under concession contractsUnder the concession contracts it has signed, Cofiroute has committed to making certain infrastructure investments in facilities that it will subsequently operate as a concession company.
As at 31 December 2018, the total investment commitment provided for under the concession contracts was €869.2 million compared with €881.8 million in 2017.
E. Other balance sheet items and commitments related to the business
10 . Property, plant and equipment and other intangible assets
10.1. Property, plant and equipment
Accounting principles
Property, plant and equipment are recorded at acquisition or production cost, net of investment grants received, less cumulative depreciation and any impairment losses. Their value is not remeasured. These assets mainly include fittings, equipment, furniture and vehicles wholly owned by Cofiroute. They also include concession operating property, plant and equipment that is not controlled by the grantor but that is necessary for the operation of the concession: buildings used in operations, toll equipment, signage, remote transmission, video surveillance, vehicles and equipment.
Depreciation is generally calculated on a straight-line basis over the period of use of the asset. Accelerated depreciation may, however, apply when deemed more appropriate given the terms of use of the asset.
Periods of use of the various categories of property, plant and equipment (fittings, equipment, furniture and vehicles) range from three to ten years.
Depreciation commences on the date on which the asset is ready to come into service.

40 Cofiroute_2018 Annual financial report
IFRS individual financial statements at 31 December 2018
Notes to the IFRS individual financial statements
(in € millions)
Property, plant and equipment related to concession contracts Land
Plant, equipment, fixtures and fittings Total
Gross
At 01/01/2017 862.7 1.4 20.1 884.2
Acquisitions during the period 22.4 0.0 2.2 24.6
Disposals during the period (10.8) (0.0) (2.7) (13.5)
Other movements 2.4 (0.0) 0.2 2.6
At 31/12/2017 876.7 1.3 19.8 897.8
Acquisitions during the period 3.2 0.0 1.5 4.7
Disposals during the period (3.1) (0.0) (0.0) (3.2)
Other movements 27.1 0.2 0.1 27.5
At 31/12/2018 903.9 1.5 21.4 926.8
Depreciation and amortisation
At 01/01/2017 (520.5) (13.1) (533.6)
Depreciation and amortisation during the period (137.4) (2.4) (139.8)
Other movements 9.6 1.5 11.0
At 31/12/2017 (648.3) (14.0) (662.3)
Depreciation and amortisation during the period (43.5) (2.1) (45.6)
Other movements 3.1 0.0 3.1
At 31/12/2018 (688.7) (16.1) (704.8)
Net
At 01/01/2017 342.3 1.4 7.0 350.6
At 31/12/2017 228.5 1.3 5.8 235.5
At 31/12/2018 215.3 1.5 5.3 222.0
In 2018, the gross value of property, plant and equipment was up €29 million versus 2017.
10.2. Other intangible assetsThey mainly include software licenses and software. They are stated in the balance sheet at acquisition cost less amortisation and any accumulated impairment losses. They are amortised on a straight-line basis over their useful life.
The net value of the other intangible assets amounted to €1.2 million at 31 December 2018. These include software, patents, licences and other intangible assets, representing a gross value of €29.7 million.
Cumulative amortisation recorded at the end of 2018 stood at €28.5 million.
10.3. Impairment of non-financial non-current assets
Accounting principles
Impairment tests are performed on property, plant and equipment and intangible assets where evidence of a loss of value arises. For intangible assets with an indefinite useful life and construction work in progress, a test is performed at least annually and whenever there is an indication of a loss of value.
Assets tested for impairment are grouped within cash-generating units (CGUs), defined as homogenous assets that generate identifiable cash inflows.
In accordance with IAS 36, the criteria adopted to assess indications that an asset might be impaired will either be external (e.g. a material change in market conditions) or internal (e.g. a material reduction in revenue, etc.).
Cofiroute did not find any material impairment of its tangible or intangible non-current assets in 2018 or 2017.
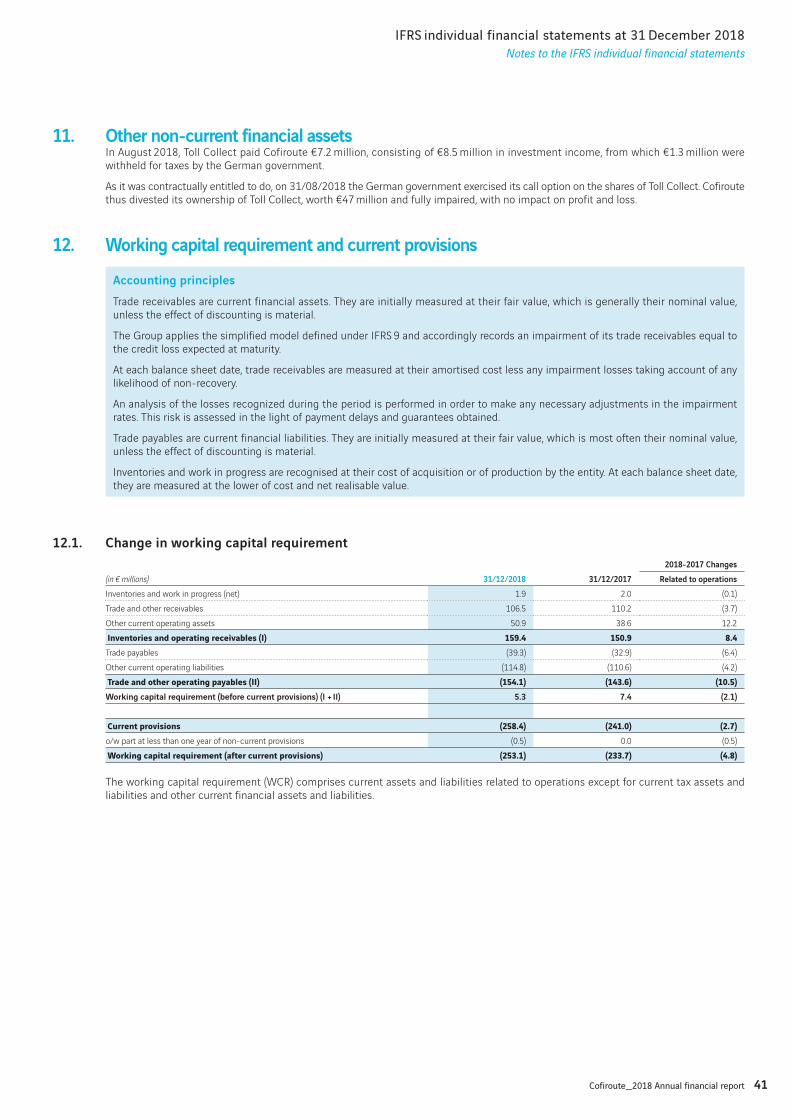
41Cofiroute_2018 Annual financial report
IFRS individual financial statements at 31 December 2018
Notes to the IFRS individual financial statements
11. Other non-current financial assetsIn August 2018, Toll Collect paid Cofiroute €7.2 million, consisting of €8.5 million in investment income, from which €1.3 million were withheld for taxes by the German government.
As it was contractually entitled to do, on 31/08/2018 the German government exercised its call option on the shares of Toll Collect. Cofiroute thus divested its ownership of Toll Collect, worth €47 million and fully impaired, with no impact on profit and loss.
12. Working capital requirement and current provisions
Accounting principles
Trade receivables are current financial assets. They are initially measured at their fair value, which is generally their nominal value, unless the effect of discounting is material.
The Group applies the simplified model defined under IFRS 9 and accordingly records an impairment of its trade receivables equal to the credit loss expected at maturity.
At each balance sheet date, trade receivables are measured at their amortised cost less any impairment losses taking account of any likelihood of non-recovery.
An analysis of the losses recognized during the period is performed in order to make any necessary adjustments in the impairment rates. This risk is assessed in the light of payment delays and guarantees obtained.
Trade payables are current financial liabilities. They are initially measured at their fair value, which is most often their nominal value, unless the effect of discounting is material.
Inventories and work in progress are recognised at their cost of acquisition or of production by the entity. At each balance sheet date, they are measured at the lower of cost and net realisable value.
12.1. Change in working capital requirement
(in € millions) 31/12/2018 31/12/2017
2018-2017 Changes
Related to operations
Inventories and work in progress (net) 1.9 2.0 (0.1)
Trade and other receivables 106.5 110.2 (3.7)
Other current operating assets 50.9 38.6 12.2
Inventories and operating receivables (I) 159.4 150.9 8.4Trade payables (39.3) (32.9) (6.4)
Other current operating liabilities (114.8) (110.6) (4.2)
Trade and other operating payables (II) (154.1) (143.6) (10.5)Working capital requirement (before current provisions) (I + II) 5.3 7.4 (2.1)
Current provisions (258.4) (241.0) (2.7)o/w part at less than one year of non-current provisions (0.5) 0.0 (0.5)
Working capital requirement (after current provisions) (253.1) (233.7) (4.8)
The working capital requirement (WCR) comprises current assets and liabilities related to operations except for current tax assets and liabilities and other current financial assets and liabilities.

42 Cofiroute_2018 Annual financial report
IFRS individual financial statements at 31 December 2018
Notes to the IFRS individual financial statements
12.2. Current operating assets and liabilitiesThe components of working capital requirement break down with respect to maturity in the following manner:
(in € millions) 31/12/2018
Maturity
< 1 year
From 1 to 5 years > 5 years1 to 3 months 3 to 6 months 6 to 12 months
Inventories and work in progress (net) 1.9 1.9
Trade and other receivables 106.5 106.5
Other current operating assets 50.9 44.9 0.1 0.2 2.0 3.7
Inventories and operating receivables (I) 159.4 153.4 0.1 0.2 2.0 3.7Trade payables (39.3) (39.3)
Other current operating liabilities (114.8) (103.3) (11.5)
Trade and other operating payables (II) (154.1) (142.6) (11.5) 0.0 0.0 0.0Working capital requirement (before current provisions) (I + II) 5.3 10.8 (11.4) 0.2 2.0 3.7
12.3. Breakdown of trade receivablesThe following table presents invoiced trade receivables and any possible depreciation:
(in € millions) 31/12/2018 31/12/2017
Trade receivables invoiced 21.3 23.1
Allowances against trade receivables (9.6) (10.0)
Trade receivables, net 11.7 13.1
On 31 December 2018 the breakdown of trade receivables and impairment was as follows:
(in € millions) 31/12/2018
< 1 year
From 1 to 5 years1 to 3 months 3 to 6 months 6 to 12 months
Trade receivables invoiced 21.3 18.4 0.0 0.3 2.6
Allowances against trade receivables (9.6) (7.5) (0.0) (0.0) (2.1)
12.4. Breakdown of current provisionsCurrent provisions are directly linked to the operating cycle, irrespective of their expected maturity. They are accounted for in accordance with IAS 37. They also include the current part (maturing in less than one year) of provisions not directly linked to the operating cycle.
Provisions are recognised for the contractual commitments to keep the facilities under concession in good working order. They are calculated on the basis of a medium to long-term expenditure programme that is reviewed annually. This expenditure is remeasured using the appropriate indices (primarily the TP01, TP02 and TP09 indices).
Provisions are also booked when structures have been identified with established problems. These provisions are recognised at their discounted amounts. The discounted cost is recorded under ”Other financial income and expenses”.
In 2018 and 2017, current provisions recognised as liabilities on the balance sheet changed in the following manner:
(in € millions) Opening Provisions taken Provisions usedOther reversals
not used Other Closing
01/01/2017 245.7 21.7 (1.5) (7.8) (19.9) 238.2
Obligation to maintain the condition of concession intangible assets 233.6 33.1 (21.3) (5.4) 240.0
Other liabilities 4.6 0.6 (0.9) (3.4) 0.2 1.0
31/12/2017 238.2 33.7 (22.2) (8.8) 0.2 241.0
Obligation to maintain the condition of concession intangible assets 240.0 30.4 (23.4) (5.7) 16.2 257.5
Other liabilities 1.0 0.0 (0.1) (0.1) 0.9
31/12/2018 241.0 30.5 (23.5) (5.8) 16.2 258.4
Current provisions relate directly to the operating cycle. The above provisions amounted to €258.4 million at 31 December 2018 (compared with €241 million at 31 December 2017) and mainly relate to provisions for the obligation to maintain the condition of concession assets.
Provisions for the obligation to maintain infrastructure assets under concession in good condition mainly relate to spending on road- surface repairs (surfacing, restructuring of slow lanes, etc.), engineering structures, hydraulic structures and specific equipment for the A86 motorway Duplex. These provisions totalled €257.5 million at 31 December 2018, up from €240 million at 31 December 2017.
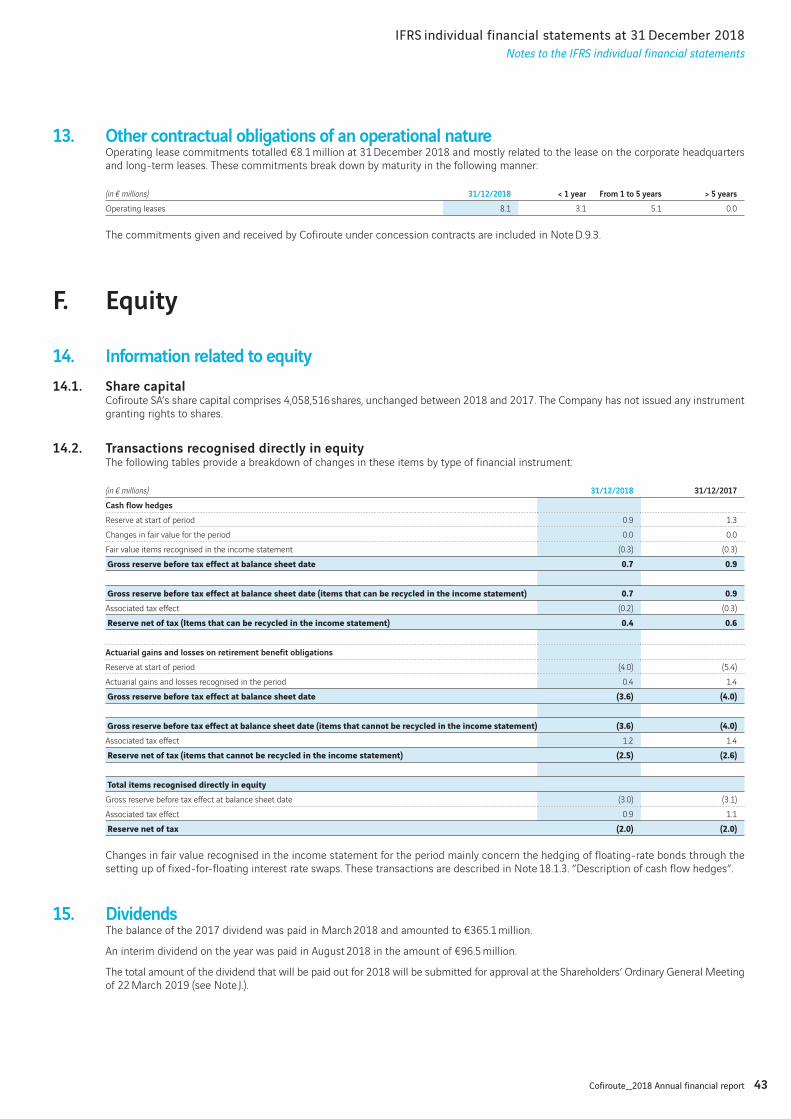
43Cofiroute_2018 Annual financial report
IFRS individual financial statements at 31 December 2018
Notes to the IFRS individual financial statements
13. Other contractual obligations of an operational natureOperating lease commitments totalled €8.1 million at 31 December 2018 and mostly related to the lease on the corporate headquarters and long-term leases. These commitments break down by maturity in the following manner:
(in € millions) 31/12/2018 < 1 year From 1 to 5 years > 5 years
Operating leases 8.1 3.1 5.1 0.0
The commitments given and received by Cofiroute under concession contracts are included in Note D.9.3.
F. Equity
14. Information related to equity
14.1. Share capitalCofiroute SA’s share capital comprises 4,058,516 shares, unchanged between 2018 and 2017. The Company has not issued any instrument granting rights to shares.
14.2. Transactions recognised directly in equityThe following tables provide a breakdown of changes in these items by type of financial instrument:
(in € millions) 31/12/2018 31/12/2017
Cash flow hedges
Reserve at start of period 0.9 1.3
Changes in fair value for the period 0.0 0.0
Fair value items recognised in the income statement (0.3) (0.3)
Gross reserve before tax effect at balance sheet date 0.7 0.9
Gross reserve before tax effect at balance sheet date (items that can be recycled in the income statement) 0.7 0.9Associated tax effect (0.2) (0.3)
Reserve net of tax (Items that can be recycled in the income statement) 0.4 0.6
Actuarial gains and losses on retirement benefit obligations
Reserve at start of period (4.0) (5.4)
Actuarial gains and losses recognised in the period 0.4 1.4
Gross reserve before tax effect at balance sheet date (3.6) (4.0)
Gross reserve before tax effect at balance sheet date (items that cannot be recycled in the income statement) (3.6) (4.0)Associated tax effect 1.2 1.4
Reserve net of tax (items that cannot be recycled in the income statement) (2.5) (2.6)
Total items recognised directly in equityGross reserve before tax effect at balance sheet date (3.0) (3.1)
Associated tax effect 0.9 1.1
Reserve net of tax (2.0) (2.0)
Changes in fair value recognised in the income statement for the period mainly concern the hedging of floating-rate bonds through the setting up of fixed-for-floating interest rate swaps. These transactions are described in Note 18.1.3. ”Description of cash flow hedges”.
15. DividendsThe balance of the 2017 dividend was paid in March 2018 and amounted to €365.1 million.
An interim dividend on the year was paid in August 2018 in the amount of €96.5 million.
The total amount of the dividend that will be paid out for 2018 will be submitted for approval at the Shareholders’ Ordinary General Meeting of 22 March 2019 (see Note J.).
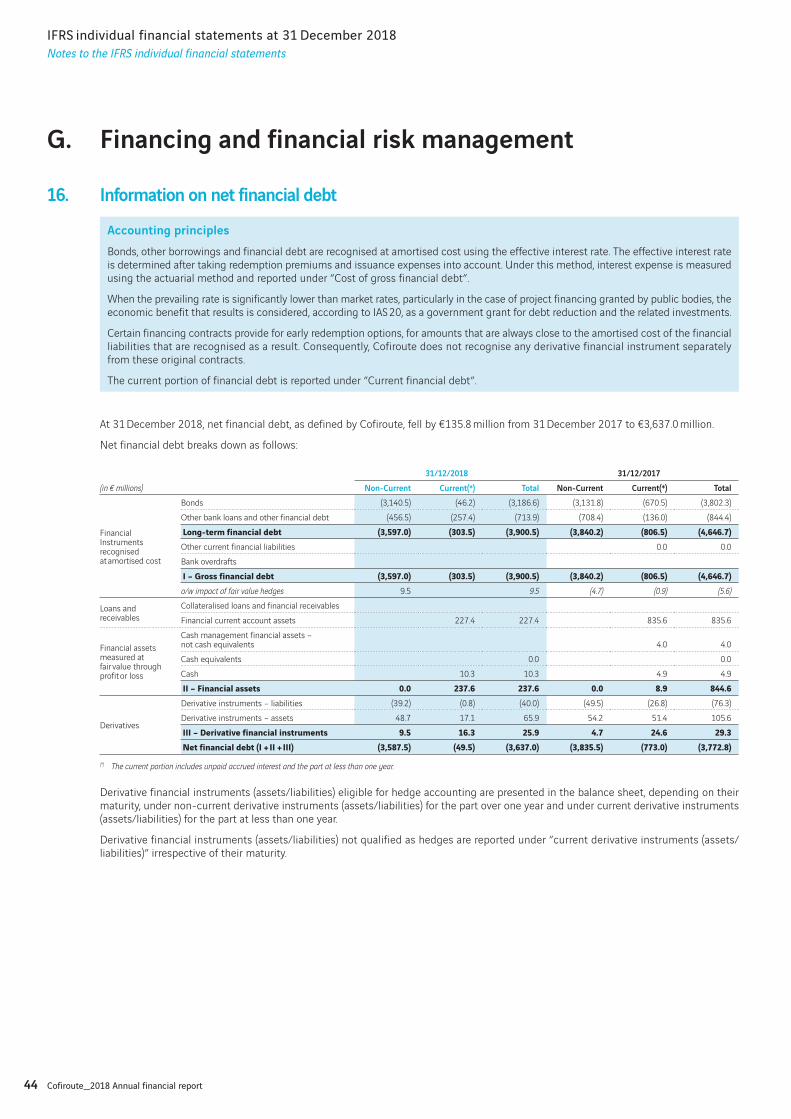
44 Cofiroute_2018 Annual financial report
IFRS individual financial statements at 31 December 2018
Notes to the IFRS individual financial statements
G. Financing and financial risk management
16. Information on net financial debt
Accounting principles
Bonds, other borrowings and financial debt are recognised at amortised cost using the effective interest rate. The effective interest rate is determined after taking redemption premiums and issuance expenses into account. Under this method, interest expense is measured using the actuarial method and reported under ”Cost of gross financial debt”.
When the prevailing rate is significantly lower than market rates, particularly in the case of project financing granted by public bodies, the economic benefit that results is considered, according to IAS 20, as a government grant for debt reduction and the related investments.
Certain financing contracts provide for early redemption options, for amounts that are always close to the amortised cost of the financial liabilities that are recognised as a result. Consequently, Cofiroute does not recognise any derivative financial instrument separately from these original contracts.
The current portion of financial debt is reported under ”Current financial debt”.
At 31 December 2018, net financial debt, as defined by Cofiroute, fell by €135.8 million from 31 December 2017 to €3,637.0 million.
Net financial debt breaks down as follows:
(in € millions)
31/12/2018 31/12/2017
Non-Current Current(*) Total Non-Current Current(*) Total
Financial Instruments recognised at amortised cost
Bonds (3,140.5) (46.2) (3,186.6) (3,131.8) (670.5) (3,802.3)
Other bank loans and other financial debt (456.5) (257.4) (713.9) (708.4) (136.0) (844.4)
Long-term financial debt (3,597.0) (303.5) (3,900.5) (3,840.2) (806.5) (4,646.7)Other current financial liabilities 0.0 0.0
Bank overdrafts
I – Gross financial debt (3,597.0) (303.5) (3,900.5) (3,840.2) (806.5) (4,646.7)o/w impact of fair value hedges 9.5 9.5 (4.7) (0.9) (5.6)
Loans and receivables
Collateralised loans and financial receivables
Financial current account assets 227.4 227.4 835.6 835.6
Financial assets measured at fair value through profit or loss
Cash management financial assets – not cash equivalents 4.0 4.0
Cash equivalents 0.0 0.0
Cash 10.3 10.3 4.9 4.9
II – Financial assets 0.0 237.6 237.6 0.0 8.9 844.6
Derivatives
Derivative instruments – liabilities (39.2) (0.8) (40.0) (49.5) (26.8) (76.3)
Derivative instruments – assets 48.7 17.1 65.9 54.2 51.4 105.6
III – Derivative financial instruments 9.5 16.3 25.9 4.7 24.6 29.3Net financial debt (I + II + III) (3,587.5) (49.5) (3,637.0) (3,835.5) (773.0) (3,772.8)
(*) The current portion includes unpaid accrued interest and the part at less than one year.
Derivative financial instruments (assets/liabilities) eligible for hedge accounting are presented in the balance sheet, depending on their maturity, under non-current derivative instruments (assets/liabilities) for the part over one year and under current derivative instruments (assets/liabilities) for the part at less than one year.
Derivative financial instruments (assets/liabilities) not qualified as hedges are reported under ”current derivative instruments (assets/ liabilities)” irrespective of their maturity.
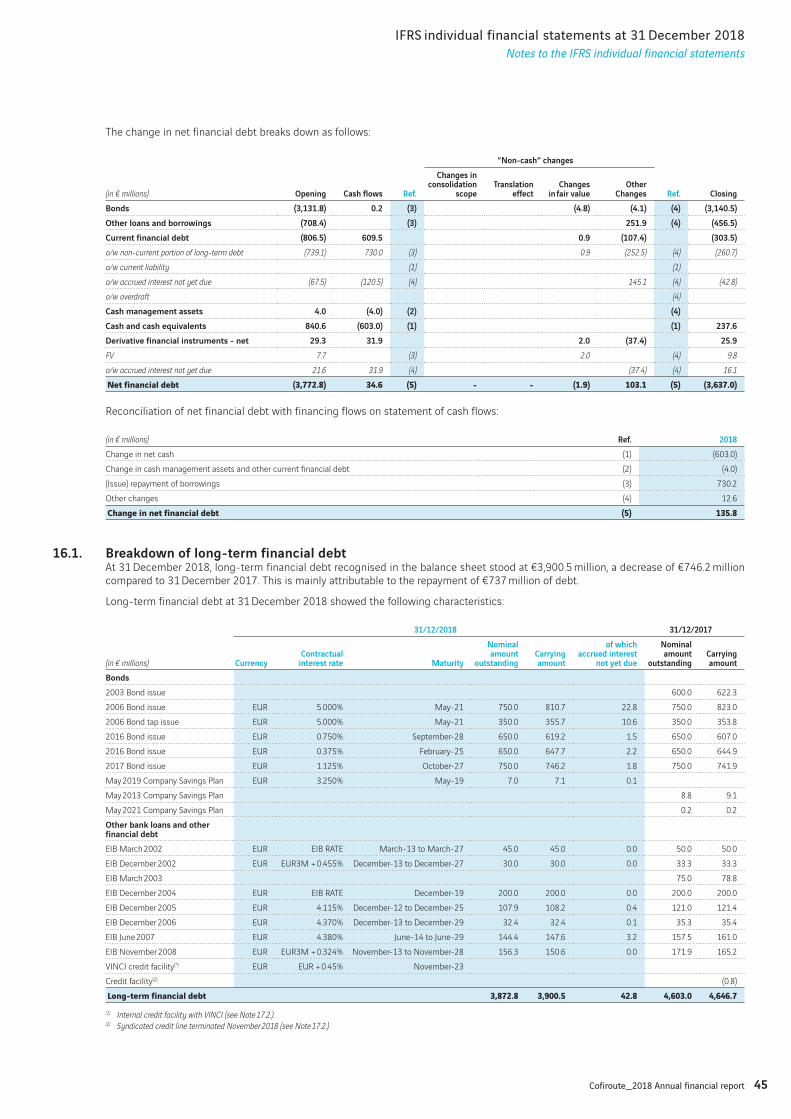
45Cofiroute_2018 Annual financial report
IFRS individual financial statements at 31 December 2018
Notes to the IFRS individual financial statements
The change in net financial debt breaks down as follows:
(in € millions) Opening Cash flows Ref.
”Non-cash” changes
Ref. Closing
Changes in consolidation
scopeTranslation
effectChanges
in fair valueOther
Changes
Bonds (3,131.8) 0.2 (3) (4.8) (4.1) (4) (3,140.5)
Other loans and borrowings (708.4) (3) 251.9 (4) (456.5)
Current financial debt (806.5) 609.5 0.9 (107.4) (303.5)
o/w non-current portion of long-term debt (739.1) 730.0 (3) 0.9 (252.5) (4) (260.7)
o/w current liability (1) (1)
o/w accrued interest not yet due (67.5) (120.5) (4) 145.1 (4) (42.8)
o/w overdraft (4)
Cash management assets 4.0 (4.0) (2) (4)
Cash and cash equivalents 840.6 (603.0) (1) (1) 237.6
Derivative financial instruments - net 29.3 31.9 2.0 (37.4) 25.9
FV 7.7 (3) 2.0 (4) 9.8
o/w accrued interest not yet due 21.6 31.9 (4) (37.4) (4) 16.1
Net financial debt (3,772.8) 34.6 (5) - - (1.9) 103.1 (5) (3,637.0)
Reconciliation of net financial debt with financing flows on statement of cash flows:
(in € millions) Ref. 2018
Change in net cash (1) (603.0)
Change in cash management assets and other current financial debt (2) (4.0)
(Issue) repayment of borrowings (3) 730.2
Other changes (4) 12.6
Change in net financial debt (5) 135.8
16.1. Breakdown of long-term financial debtAt 31 December 2018, long-term financial debt recognised in the balance sheet stood at €3,900.5 million, a decrease of €746.2 million compared to 31 December 2017. This is mainly attributable to the repayment of €737 million of debt.
Long-term financial debt at 31 December 2018 showed the following characteristics:
(in € millions)
31/12/2018 31/12/2017
CurrencyContractual
interest rate Maturity
Nominal amount
outstandingCarrying amount
of which accrued interest
not yet due
Nominal amount
outstandingCarrying amount
Bonds
2003 Bond issue 600.0 622.3
2006 Bond issue EUR 5.000% May-21 750.0 810.7 22.8 750.0 823.0
2006 Bond tap issue EUR 5.000% May-21 350.0 355.7 10.6 350.0 353.8
2016 Bond issue EUR 0.750% September-28 650.0 619.2 1.5 650.0 607.0
2016 Bond issue EUR 0.375% February-25 650.0 647.7 2.2 650.0 644.9
2017 Bond issue EUR 1.125% October-27 750.0 746.2 1.8 750.0 741.9
May 2019 Company Savings Plan EUR 3.250% May-19 7.0 7.1 0.1
May 2013 Company Savings Plan 8.8 9.1
May 2021 Company Savings Plan 0.2 0.2
Other bank loans and other financial debt
EIB March 2002 EUR EIB RATE March-13 to March-27 45.0 45.0 0.0 50.0 50.0
EIB December 2002 EUR EUR3M + 0.455% December-13 to December-27 30.0 30.0 0.0 33.3 33.3
EIB March 2003 75.0 78.8
EIB December 2004 EUR EIB RATE December-19 200.0 200.0 0.0 200.0 200.0
EIB December 2005 EUR 4.115% December-12 to December-25 107.9 108.2 0.4 121.0 121.4
EIB December 2006 EUR 4.370% December-13 to December-29 32.4 32.4 0.1 35.3 35.4
EIB June 2007 EUR 4.380% June-14 to June-29 144.4 147.6 3.2 157.5 161.0
EIB November 2008 EUR EUR3M + 0.324% November-13 to November-28 156.3 150.6 0.0 171.9 165.2
VINCI credit facility(*) EUR EUR + 0.45% November-23
Credit facility(2) (0.8)
Long-term financial debt 3,872.8 3,900.5 42.8 4,603.0 4,646.7(1) Internal credit facility with VINCI (see Note 17.2.).(2) Syndicated credit line terminated November 2018 (see Note 17.2.).
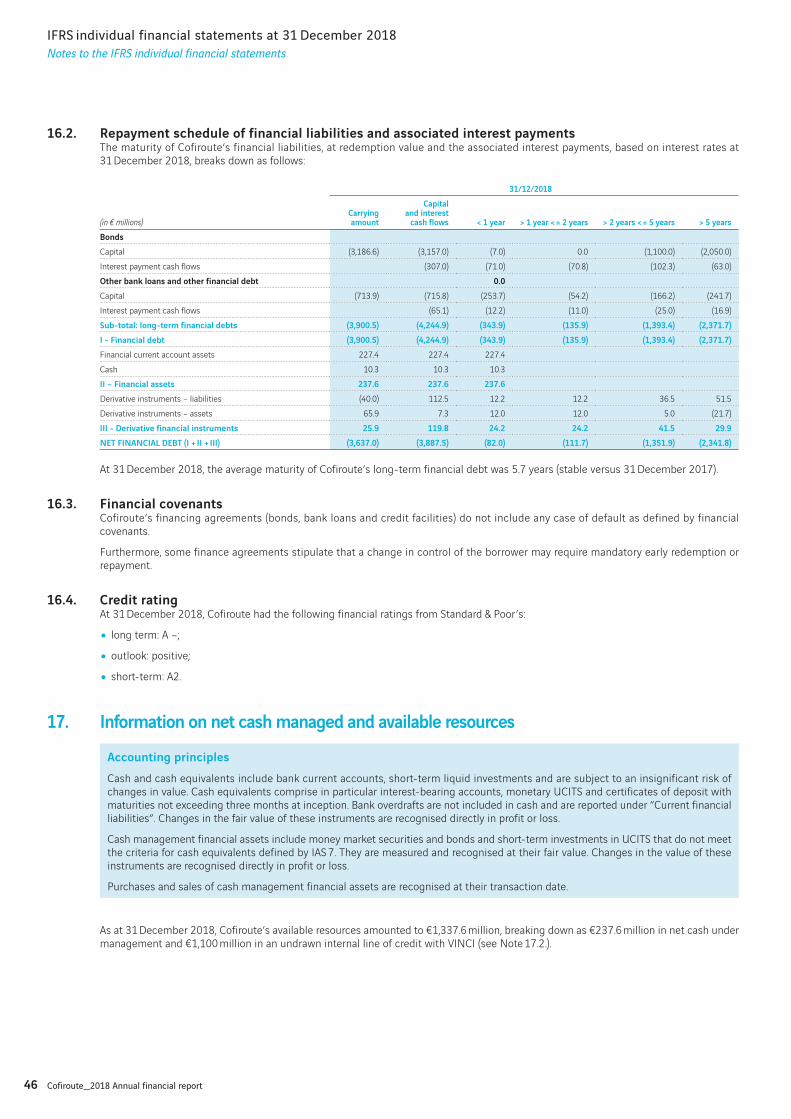
46 Cofiroute_2018 Annual financial report
IFRS individual financial statements at 31 December 2018
Notes to the IFRS individual financial statements
16.2. Repayment schedule of financial liabilities and associated interest paymentsThe maturity of Cofiroute’s financial liabilities, at redemption value and the associated interest payments, based on interest rates at 31 December 2018, breaks down as follows:
(in € millions)
31/12/2018
Carrying amount
Capital and interest
cash flows < 1 year > 1 year < = 2 years > 2 years < = 5 years > 5 years
Bonds
Capital (3,186.6) (3,157.0) (7.0) 0.0 (1,100.0) (2,050.0)
Interest payment cash flows (307.0) (71.0) (70.8) (102.3) (63.0)
Other bank loans and other financial debt 0.0
Capital (713.9) (715.8) (253.7) (54.2) (166.2) (241.7)
Interest payment cash flows (65.1) (12.2) (11.0) (25.0) (16.9)
Sub-total: long-term financial debts (3,900.5) (4,244.9) (343.9) (135.9) (1,393.4) (2,371.7)
I - Financial debt (3,900.5) (4,244.9) (343.9) (135.9) (1,393.4) (2,371.7)
Financial current account assets 227.4 227.4 227.4
Cash 10.3 10.3 10.3
II – Financial assets 237.6 237.6 237.6
Derivative instruments – liabilities (40.0) 112.5 12.2 12.2 36.5 51.5
Derivative instruments – assets 65.9 7.3 12.0 12.0 5.0 (21.7)
III - Derivative financial instruments 25.9 119.8 24.2 24.2 41.5 29.9
NET FINANCIAL DEBT (I + II + III) (3,637.0) (3,887.5) (82.0) (111.7) (1,351.9) (2,341.8)
At 31 December 2018, the average maturity of Cofiroute’s long-term financial debt was 5.7 years (stable versus 31 December 2017).
16.3. Financial covenantsCofiroute’s financing agreements (bonds, bank loans and credit facilities) do not include any case of default as defined by financial covenants.
Furthermore, some finance agreements stipulate that a change in control of the borrower may require mandatory early redemption or repayment.
16.4. Credit ratingAt 31 December 2018, Cofiroute had the following financial ratings from Standard & Poor’s:
• long term: A –;
• outlook: positive;
• short-term: A2.
17. Information on net cash managed and available resources
Accounting principles
Cash and cash equivalents include bank current accounts, short-term liquid investments and are subject to an insignificant risk of changes in value. Cash equivalents comprise in particular interest-bearing accounts, monetary UCITS and certificates of deposit with maturities not exceeding three months at inception. Bank overdrafts are not included in cash and are reported under ”Current financial liabilities”. Changes in the fair value of these instruments are recognised directly in profit or loss.
Cash management financial assets include money market securities and bonds and short-term investments in UCITS that do not meet the criteria for cash equivalents defined by IAS 7. They are measured and recognised at their fair value. Changes in the value of these instruments are recognised directly in profit or loss.
Purchases and sales of cash management financial assets are recognised at their transaction date.
As at 31 December 2018, Cofiroute’s available resources amounted to €1,337.6 million, breaking down as €237.6 million in net cash under management and €1,100 million in an undrawn internal line of credit with VINCI (see Note 17.2.).
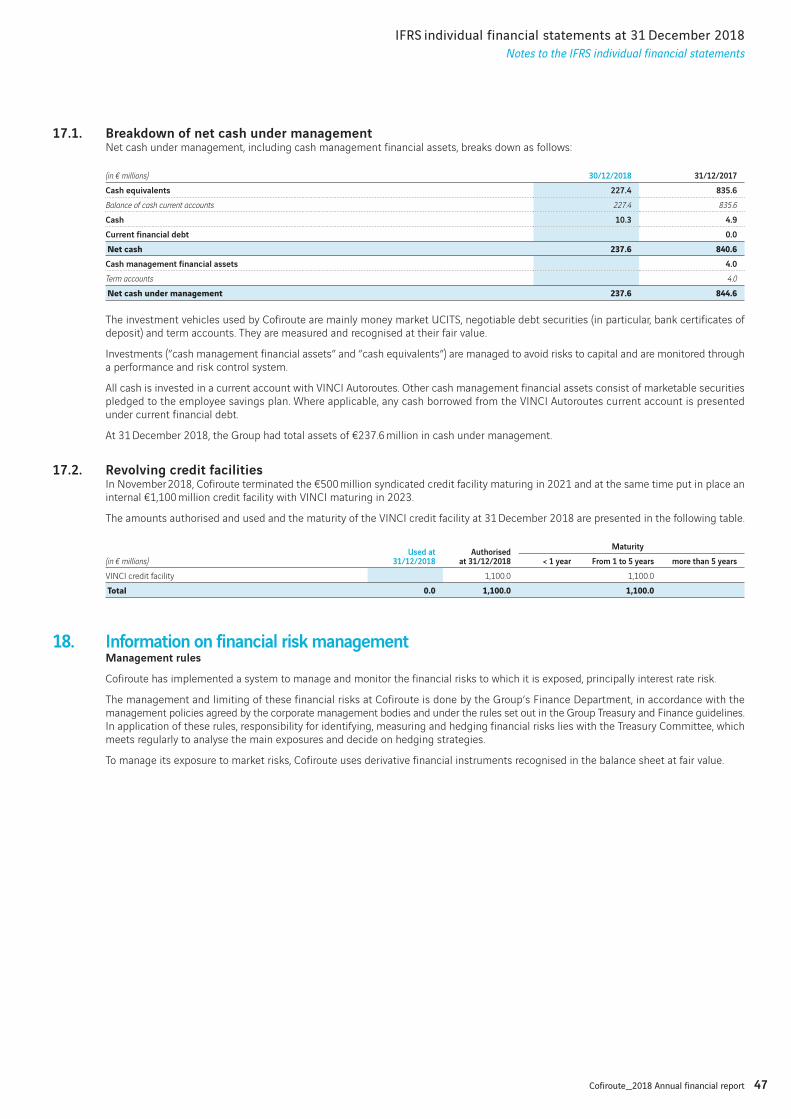
47Cofiroute_2018 Annual financial report
IFRS individual financial statements at 31 December 2018
Notes to the IFRS individual financial statements
17.1. Breakdown of net cash under managementNet cash under management, including cash management financial assets, breaks down as follows:
(in € millions) 30/12/2018 31/12/2017
Cash equivalents 227.4 835.6
Balance of cash current accounts 227.4 835.6
Cash 10.3 4.9
Current financial debt 0.0
Net cash 237.6 840.6Cash management financial assets 4.0
Term accounts 4.0
Net cash under management 237.6 844.6
The investment vehicles used by Cofiroute are mainly money market UCITS, negotiable debt securities (in particular, bank certificates of deposit) and term accounts. They are measured and recognised at their fair value.
Investments (”cash management financial assets” and ”cash equivalents”) are managed to avoid risks to capital and are monitored through a performance and risk control system.
All cash is invested in a current account with VINCI Autoroutes. Other cash management financial assets consist of marketable securities pledged to the employee savings plan. Where applicable, any cash borrowed from the VINCI Autoroutes current account is presented under current financial debt.
At 31 December 2018, the Group had total assets of €237.6 million in cash under management.
17.2. Revolving credit facilitiesIn November 2018, Cofiroute terminated the €500 million syndicated credit facility maturing in 2021 and at the same time put in place an internal €1,100 million credit facility with VINCI maturing in 2023.
The amounts authorised and used and the maturity of the VINCI credit facility at 31 December 2018 are presented in the following table.
(in € millions)Used at
31/12/2018Authorised
at 31/12/2018
Maturity
< 1 year From 1 to 5 years more than 5 years
VINCI credit facility 1,100.0 1,100.0
Total 0.0 1,100.0 1,100.0
18. Information on financial risk managementManagement rules
Cofiroute has implemented a system to manage and monitor the financial risks to which it is exposed, principally interest rate risk.
The management and limiting of these financial risks at Cofiroute is done by the Group’s Finance Department, in accordance with the management policies agreed by the corporate management bodies and under the rules set out in the Group Treasury and Finance guidelines. In application of these rules, responsibility for identifying, measuring and hedging financial risks lies with the Treasury Committee, which meets regularly to analyse the main exposures and decide on hedging strategies.
To manage its exposure to market risks, Cofiroute uses derivative financial instruments recognised in the balance sheet at fair value.
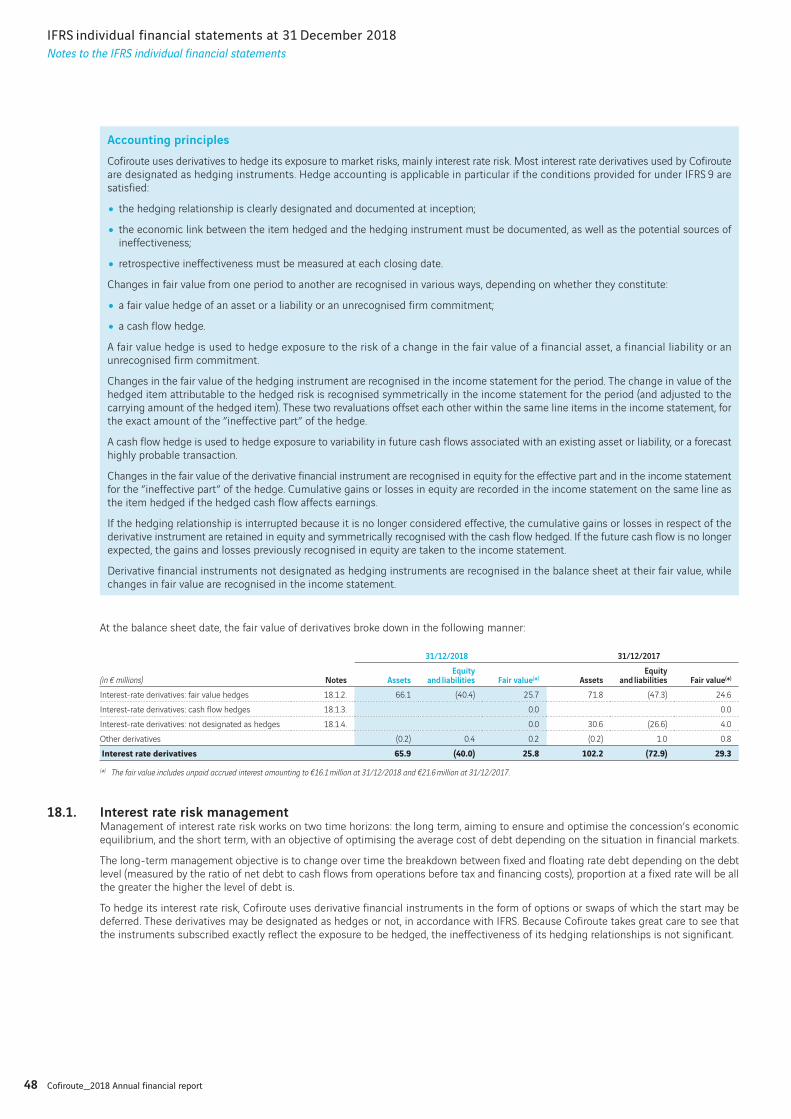
48 Cofiroute_2018 Annual financial report
IFRS individual financial statements at 31 December 2018
Notes to the IFRS individual financial statements
Accounting principles
Cofiroute uses derivatives to hedge its exposure to market risks, mainly interest rate risk. Most interest rate derivatives used by Cofiroute are designated as hedging instruments. Hedge accounting is applicable in particular if the conditions provided for under IFRS 9 are satisfied:
• the hedging relationship is clearly designated and documented at inception;
• the economic link between the item hedged and the hedging instrument must be documented, as well as the potential sources of ineffectiveness;
• retrospective ineffectiveness must be measured at each closing date.
Changes in fair value from one period to another are recognised in various ways, depending on whether they constitute:
• a fair value hedge of an asset or a liability or an unrecognised firm commitment;
• a cash flow hedge.
A fair value hedge is used to hedge exposure to the risk of a change in the fair value of a financial asset, a financial liability or an unrecognised firm commitment.
Changes in the fair value of the hedging instrument are recognised in the income statement for the period. The change in value of the hedged item attributable to the hedged risk is recognised symmetrically in the income statement for the period (and adjusted to the carrying amount of the hedged item). These two revaluations offset each other within the same line items in the income statement, for the exact amount of the ”ineffective part” of the hedge.
A cash flow hedge is used to hedge exposure to variability in future cash flows associated with an existing asset or liability, or a forecast highly probable transaction.
Changes in the fair value of the derivative financial instrument are recognised in equity for the effective part and in the income statement for the ”ineffective part” of the hedge. Cumulative gains or losses in equity are recorded in the income statement on the same line as the item hedged if the hedged cash flow affects earnings.
If the hedging relationship is interrupted because it is no longer considered effective, the cumulative gains or losses in respect of the derivative instrument are retained in equity and symmetrically recognised with the cash flow hedged. If the future cash flow is no longer expected, the gains and losses previously recognised in equity are taken to the income statement.
Derivative financial instruments not designated as hedging instruments are recognised in the balance sheet at their fair value, while changes in fair value are recognised in the income statement.
At the balance sheet date, the fair value of derivatives broke down in the following manner:
(in € millions) Notes
31/12/2018 31/12/2017
AssetsEquity
and liabilities Fair value(*) AssetsEquity
and liabilities Fair value(*)
Interest-rate derivatives: fair value hedges 18.1.2. 66.1 (40.4) 25.7 71.8 (47.3) 24.6
Interest-rate derivatives: cash flow hedges 18.1.3. 0.0 0.0
Interest-rate derivatives: not designated as hedges 18.1.4. 0.0 30.6 (26.6) 4.0
Other derivatives (0.2) 0.4 0.2 (0.2) 1.0 0.8
Interest rate derivatives 65.9 (40.0) 25.8 102.2 (72.9) 29.3(*) The fair value includes unpaid accrued interest amounting to €16.1 million at 31/12/2018 and €21.6 million at 31/12/2017.
18.1. Interest rate risk managementManagement of interest rate risk works on two time horizons: the long term, aiming to ensure and optimise the concession’s economic equilibrium, and the short term, with an objective of optimising the average cost of debt depending on the situation in financial markets.
The long-term management objective is to change over time the breakdown between fixed and floating rate debt depending on the debt level (measured by the ratio of net debt to cash flows from operations before tax and financing costs), proportion at a fixed rate will be all the greater the higher the level of debt is.
To hedge its interest rate risk, Cofiroute uses derivative financial instruments in the form of options or swaps of which the start may be deferred. These derivatives may be designated as hedges or not, in accordance with IFRS. Because Cofiroute takes great care to see that the instruments subscribed exactly reflect the exposure to be hedged, the ineffectiveness of its hedging relationships is not significant.
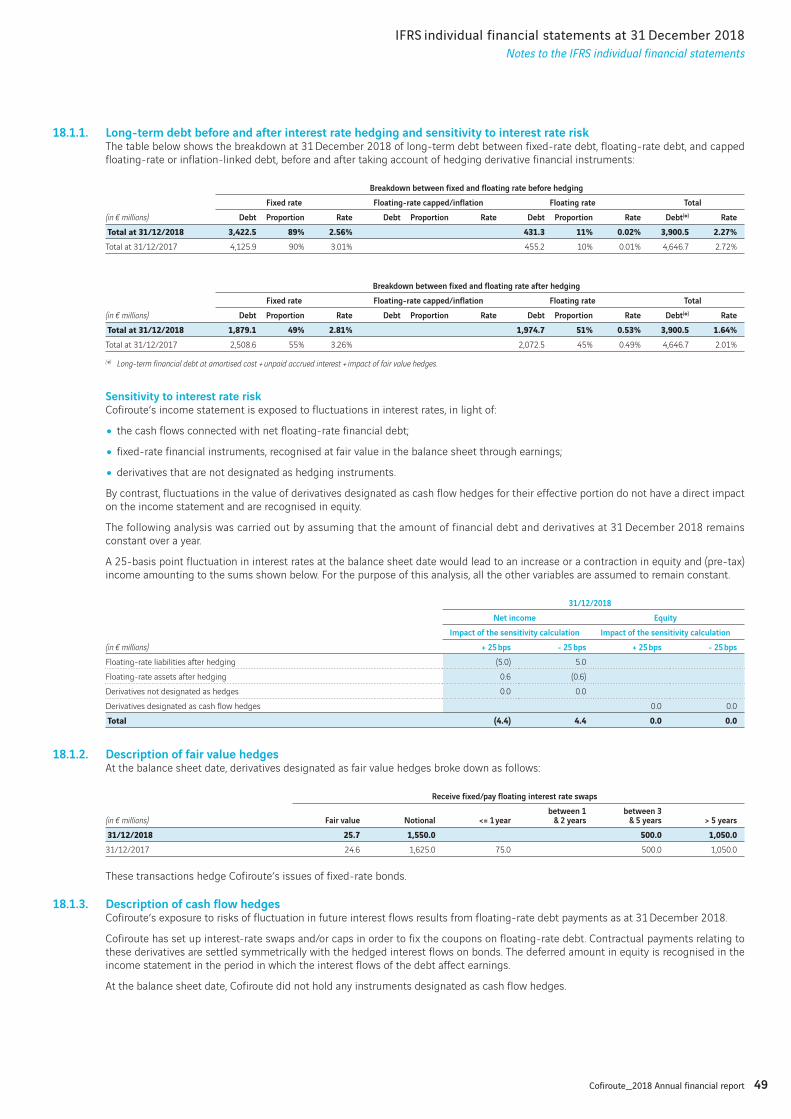
49Cofiroute_2018 Annual financial report
IFRS individual financial statements at 31 December 2018
Notes to the IFRS individual financial statements
18.1.1. Long-term debt before and after interest rate hedging and sensitivity to interest rate riskThe table below shows the breakdown at 31 December 2018 of long-term debt between fixed-rate debt, floating-rate debt, and capped floating-rate or inflation-linked debt, before and after taking account of hedging derivative financial instruments:
(in € millions)
Breakdown between fixed and floating rate before hedging
Fixed rate Floating-rate capped/inflation Floating rate Total
Debt Proportion Rate Debt Proportion Rate Debt Proportion Rate Debt(*) Rate
Total at 31/12/2018 3,422.5 89% 2.56% 431.3 11% 0.02% 3,900.5 2.27%Total at 31/12/2017 4,125.9 90% 3.01% 455.2 10% 0.01% 4,646.7 2.72%
(in € millions)
Breakdown between fixed and floating rate after hedging
Fixed rate Floating-rate capped/inflation Floating rate Total
Debt Proportion Rate Debt Proportion Rate Debt Proportion Rate Debt(*) Rate
Total at 31/12/2018 1,879.1 49% 2.81% 1,974.7 51% 0.53% 3,900.5 1.64%Total at 31/12/2017 2,508.6 55% 3.26% 2,072.5 45% 0.49% 4,646.7 2.01%
(*) Long-term financial debt at amortised cost + unpaid accrued interest + impact of fair value hedges.
Sensitivity to interest rate riskCofiroute’s income statement is exposed to fluctuations in interest rates, in light of:
• the cash flows connected with net floating-rate financial debt;
• fixed-rate financial instruments, recognised at fair value in the balance sheet through earnings;
• derivatives that are not designated as hedging instruments.
By contrast, fluctuations in the value of derivatives designated as cash flow hedges for their effective portion do not have a direct impact on the income statement and are recognised in equity.
The following analysis was carried out by assuming that the amount of financial debt and derivatives at 31 December 2018 remains constant over a year.
A 25-basis point fluctuation in interest rates at the balance sheet date would lead to an increase or a contraction in equity and (pre-tax) income amounting to the sums shown below. For the purpose of this analysis, all the other variables are assumed to remain constant.
(in € millions)
31/12/2018
Net income Equity
Impact of the sensitivity calculation Impact of the sensitivity calculation
+ 25 bps - 25 bps + 25 bps - 25 bps
Floating-rate liabilities after hedging (5.0) 5.0
Floating-rate assets after hedging 0.6 (0.6)
Derivatives not designated as hedges 0.0 0.0
Derivatives designated as cash flow hedges 0.0 0.0
Total (4.4) 4.4 0.0 0.0
18.1.2. Description of fair value hedgesAt the balance sheet date, derivatives designated as fair value hedges broke down as follows:
(in € millions)
Receive fixed/pay floating interest rate swaps
Fair value Notional <= 1 yearbetween 1
& 2 yearsbetween 3
& 5 years > 5 years
31/12/2018 25.7 1,550.0 500.0 1,050.031/12/2017 24.6 1,625.0 75.0 500.0 1,050.0
These transactions hedge Cofiroute’s issues of fixed-rate bonds.
18.1.3. Description of cash flow hedgesCofiroute’s exposure to risks of fluctuation in future interest flows results from floating-rate debt payments as at 31 December 2018.
Cofiroute has set up interest-rate swaps and/or caps in order to fix the coupons on floating-rate debt. Contractual payments relating to these derivatives are settled symmetrically with the hedged interest flows on bonds. The deferred amount in equity is recognised in the income statement in the period in which the interest flows of the debt affect earnings.
At the balance sheet date, Cofiroute did not hold any instruments designated as cash flow hedges.
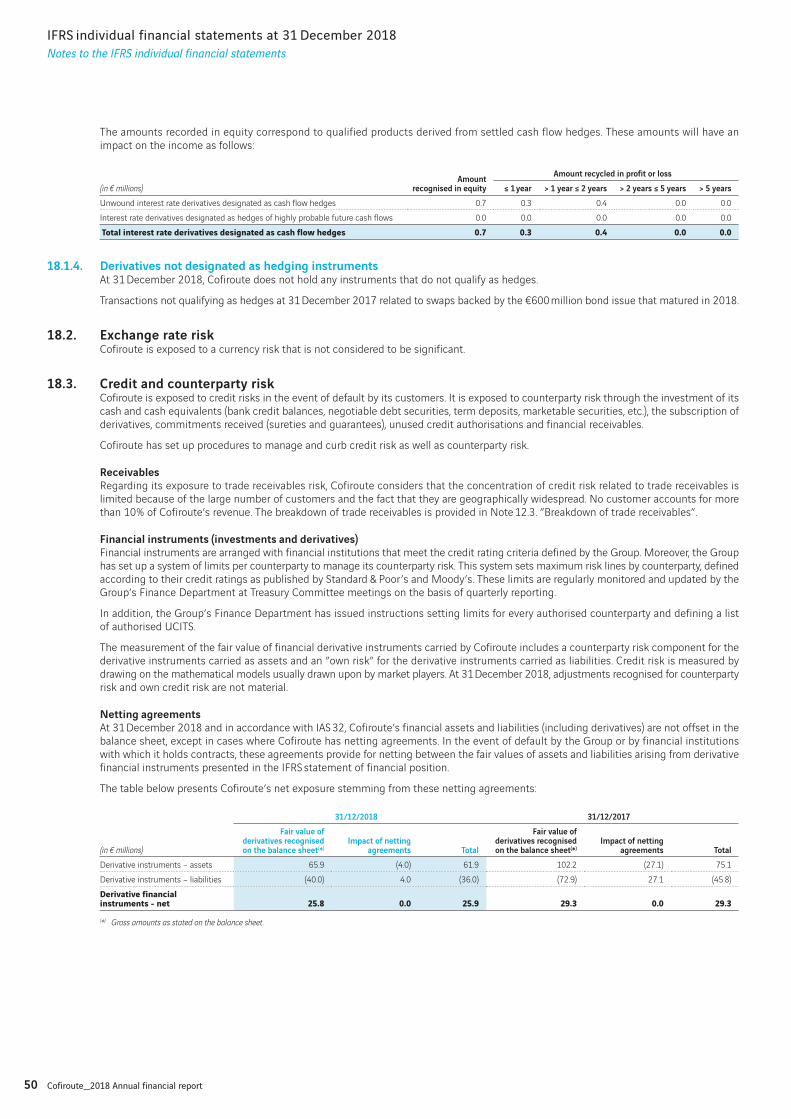
50 Cofiroute_2018 Annual financial report
IFRS individual financial statements at 31 December 2018
Notes to the IFRS individual financial statements
The amounts recorded in equity correspond to qualified products derived from settled cash flow hedges. These amounts will have an impact on the income as follows:
(in € millions)Amount
recognised in equity
Amount recycled in profit or loss
≤ 1 year > 1 year ≤ 2 years > 2 years ≤ 5 years > 5 years
Unwound interest rate derivatives designated as cash flow hedges 0.7 0.3 0.4 0.0 0.0
Interest rate derivatives designated as hedges of highly probable future cash flows 0.0 0.0 0.0 0.0 0.0
Total interest rate derivatives designated as cash flow hedges 0.7 0.3 0.4 0.0 0.0
18.1.4. Derivatives not designated as hedging instrumentsAt 31 December 2018, Cofiroute does not hold any instruments that do not qualify as hedges.
Transactions not qualifying as hedges at 31 December 2017 related to swaps backed by the €600 million bond issue that matured in 2018.
18.2. Exchange rate riskCofiroute is exposed to a currency risk that is not considered to be significant.
18.3. Credit and counterparty riskCofiroute is exposed to credit risks in the event of default by its customers. It is exposed to counterparty risk through the investment of its cash and cash equivalents (bank credit balances, negotiable debt securities, term deposits, marketable securities, etc.), the subscription of derivatives, commitments received (sureties and guarantees), unused credit authorisations and financial receivables.
Cofiroute has set up procedures to manage and curb credit risk as well as counterparty risk.
ReceivablesRegarding its exposure to trade receivables risk, Cofiroute considers that the concentration of credit risk related to trade receivables is limited because of the large number of customers and the fact that they are geographically widespread. No customer accounts for more than 10% of Cofiroute’s revenue. The breakdown of trade receivables is provided in Note 12.3. ”Breakdown of trade receivables”.
Financial instruments (investments and derivatives)Financial instruments are arranged with financial institutions that meet the credit rating criteria defined by the Group. Moreover, the Group has set up a system of limits per counterparty to manage its counterparty risk. This system sets maximum risk lines by counterparty, defined according to their credit ratings as published by Standard & Poor’s and Moody’s. These limits are regularly monitored and updated by the Group’s Finance Department at Treasury Committee meetings on the basis of quarterly reporting.
In addition, the Group’s Finance Department has issued instructions setting limits for every authorised counterparty and defining a list of authorised UCITS.
The measurement of the fair value of financial derivative instruments carried by Cofiroute includes a counterparty risk component for the derivative instruments carried as assets and an ”own risk” for the derivative instruments carried as liabilities. Credit risk is measured by drawing on the mathematical models usually drawn upon by market players. At 31 December 2018, adjustments recognised for counterparty risk and own credit risk are not material.
Netting agreementsAt 31 December 2018 and in accordance with IAS 32, Cofiroute’s financial assets and liabilities (including derivatives) are not offset in the balance sheet, except in cases where Cofiroute has netting agreements. In the event of default by the Group or by financial institutions with which it holds contracts, these agreements provide for netting between the fair values of assets and liabilities arising from derivative financial instruments presented in the IFRS statement of financial position.
The table below presents Cofiroute’s net exposure stemming from these netting agreements:
(in € millions)
31/12/2018 31/12/2017
Fair value of derivatives recognised on the balance sheet(*)
Impact of netting agreements Total
Fair value of derivatives recognised on the balance sheet(*)
Impact of netting agreements Total
Derivative instruments – assets 65.9 (4.0) 61.9 102.2 (27.1) 75.1
Derivative instruments – liabilities (40.0) 4.0 (36.0) (72.9) 27.1 (45.8)
Derivative financial instruments - net 25.8 0.0 25.9 29.3 0.0 29.3(*) Gross amounts as stated on the balance sheet.
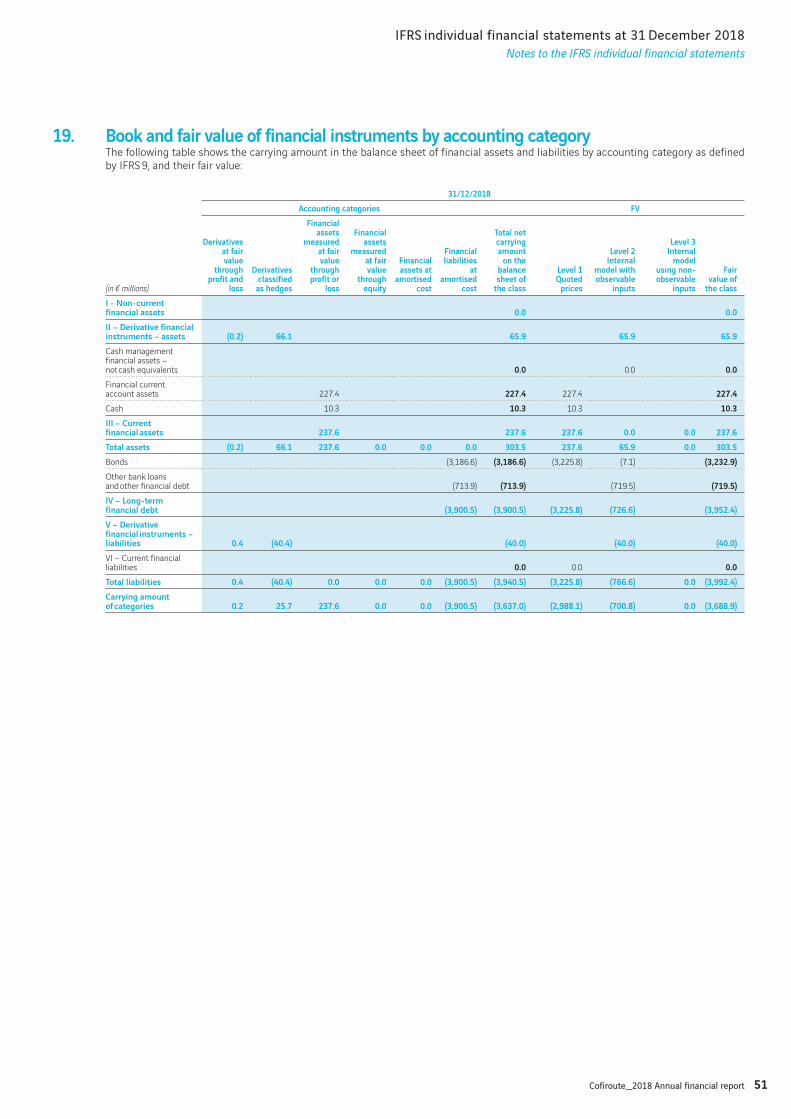
51Cofiroute_2018 Annual financial report
IFRS individual financial statements at 31 December 2018
Notes to the IFRS individual financial statements
19. Book and fair value of financial instruments by accounting categoryThe following table shows the carrying amount in the balance sheet of financial assets and liabilities by accounting category as defined by IFRS 9, and their fair value:
(in € millions)
31/12/2018
Accounting categories FV
Derivatives at fair value
through profit and
loss
Derivatives classified
as hedges
Financial assets
measured at fair value
through profit or
loss
Financial assets
measured at fair value
through equity
Financial assets at
amortised cost
Financial liabilities
at amortised
cost
Total net carrying amount
on the balance sheet of
the class
Level 1 Quoted
prices
Level 2 Internal
model with observable
inputs
Level 3 Internal
model using non-observable
inputs
Fair value of
the class
I - Non-current financial assets 0.0 0.0
II – Derivative financial instruments – assets (0.2) 66.1 65.9 65.9 65.9
Cash management financial assets – not cash equivalents 0.0 0.0 0.0
Financial current account assets 227.4 227.4 227.4 227.4
Cash 10.3 10.3 10.3 10.3
III – Current financial assets 237.6 237.6 237.6 0.0 0.0 237.6
Total assets (0.2) 66.1 237.6 0.0 0.0 0.0 303.5 237.6 65.9 0.0 303.5
Bonds (3,186.6) (3,186.6) (3,225.8) (7.1) (3,232.9)
Other bank loans and other financial debt (713.9) (713.9) (719.5) (719.5)
IV – Long-term financial debt (3,900.5) (3,900.5) (3,225.8) (726.6) (3,952.4)
V – Derivative financial instruments – liabilities 0.4 (40.4) (40.0) (40.0) (40.0)
VI – Current financial liabilities 0.0 0.0 0.0
Total liabilities 0.4 (40.4) 0.0 0.0 0.0 (3,900.5) (3,940.5) (3,225.8) (766.6) 0.0 (3,992.4)
Carrying amount of categories 0.2 25.7 237.6 0.0 0.0 (3,900.5) (3,637.0) (2,988.1) (700.8) 0.0 (3,688.9)
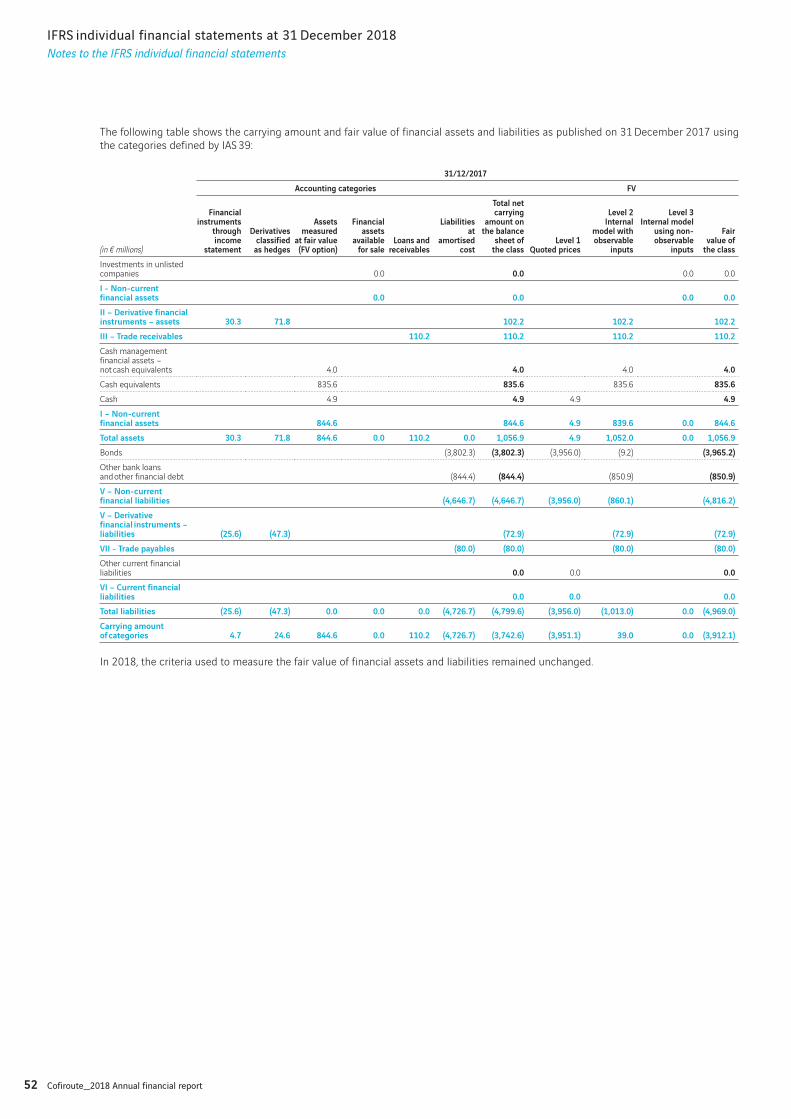
52 Cofiroute_2018 Annual financial report
IFRS individual financial statements at 31 December 2018
Notes to the IFRS individual financial statements
The following table shows the carrying amount and fair value of financial assets and liabilities as published on 31 December 2017 using the categories defined by IAS 39:
(in € millions)
31/12/2017
Accounting categories FV
Financial instruments
through income
statement
Derivatives classified
as hedges
Assets measured
at fair value (FV option)
Financial assets
available for sale
Loans and receivables
Liabilities at
amortised cost
Total net carrying
amount on the balance
sheet of the class
Level 1 Quoted prices
Level 2 Internal
model with observable
inputs
Level 3 Internal model
using non-observable
inputs
Fair value of
the class
Investments in unlisted companies 0.0 0.0 0.0 0.0
I - Non-current financial assets 0.0 0.0 0.0 0.0
II – Derivative financial instruments – assets 30.3 71.8 102.2 102.2 102.2
III – Trade receivables 110.2 110.2 110.2 110.2
Cash management financial assets – not cash equivalents 4.0 4.0 4.0 4.0
Cash equivalents 835.6 835.6 835.6 835.6
Cash 4.9 4.9 4.9 4.9
I – Non-current financial assets 844.6 844.6 4.9 839.6 0.0 844.6
Total assets 30.3 71.8 844.6 0.0 110.2 0.0 1,056.9 4.9 1,052.0 0.0 1,056.9
Bonds (3,802.3) (3,802.3) (3,956.0) (9.2) (3,965.2)
Other bank loans and other financial debt (844.4) (844.4) (850.9) (850.9)
V – Non-current financial liabilities (4,646.7) (4,646.7) (3,956.0) (860.1) (4,816.2)
V – Derivative financial instruments – liabilities (25.6) (47.3) (72.9) (72.9) (72.9)
VII - Trade payables (80.0) (80.0) (80.0) (80.0)
Other current financial liabilities 0.0 0.0 0.0
VI – Current financial liabilities 0.0 0.0 0.0
Total liabilities (25.6) (47.3) 0.0 0.0 0.0 (4,726.7) (4,799.6) (3,956.0) (1,013.0) 0.0 (4,969.0)
Carrying amount of categories 4.7 24.6 844.6 0.0 110.2 (4,726.7) (3,742.6) (3,951.1) 39.0 0.0 (3,912.1)
In 2018, the criteria used to measure the fair value of financial assets and liabilities remained unchanged.
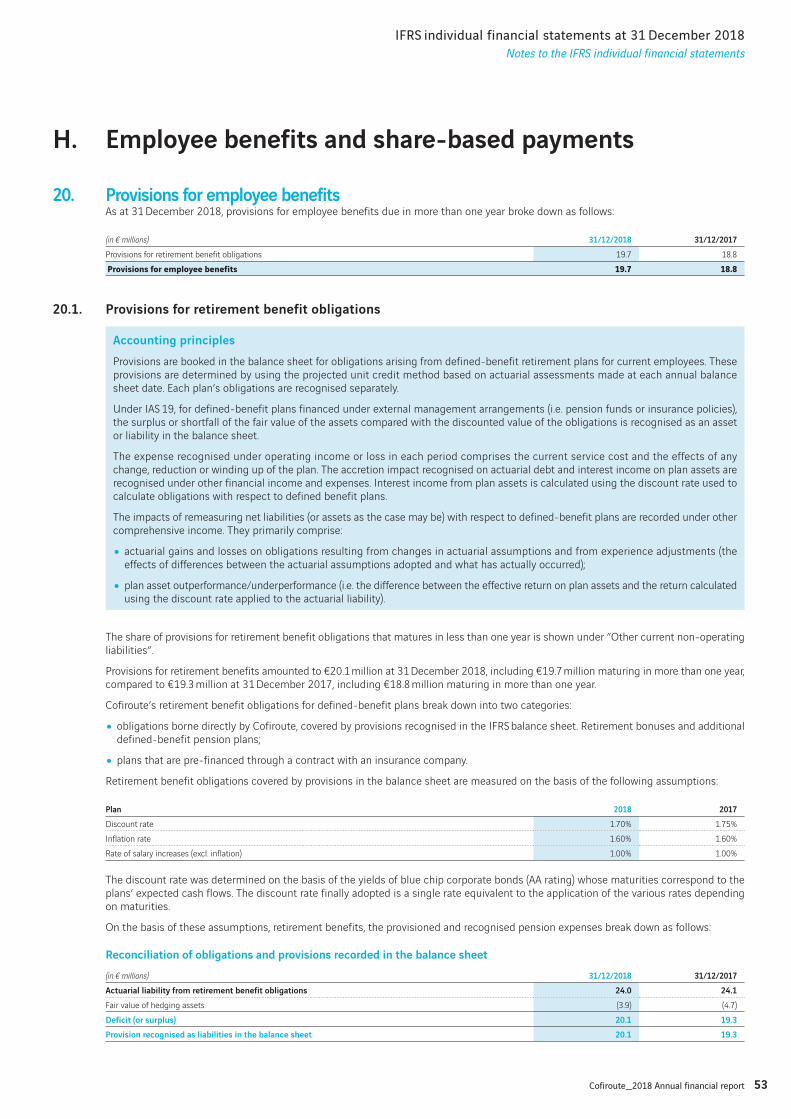
53Cofiroute_2018 Annual financial report
IFRS individual financial statements at 31 December 2018
Notes to the IFRS individual financial statements
H. Employee benefits and share-based payments
20. Provisions for employee benefitsAs at 31 December 2018, provisions for employee benefits due in more than one year broke down as follows:
(in € millions) 31/12/2018 31/12/2017
Provisions for retirement benefit obligations 19.7 18.8
Provisions for employee benefits 19.7 18.8
20.1. Provisions for retirement benefit obligations
Accounting principles
Provisions are booked in the balance sheet for obligations arising from defined-benefit retirement plans for current employees. These provisions are determined by using the projected unit credit method based on actuarial assessments made at each annual balance sheet date. Each plan’s obligations are recognised separately.
Under IAS 19, for defined-benefit plans financed under external management arrangements (i.e. pension funds or insurance policies), the surplus or shortfall of the fair value of the assets compared with the discounted value of the obligations is recognised as an asset or liability in the balance sheet.
The expense recognised under operating income or loss in each period comprises the current service cost and the effects of any change, reduction or winding up of the plan. The accretion impact recognised on actuarial debt and interest income on plan assets are recognised under other financial income and expenses. Interest income from plan assets is calculated using the discount rate used to calculate obligations with respect to defined benefit plans.
The impacts of remeasuring net liabilities (or assets as the case may be) with respect to defined-benefit plans are recorded under other comprehensive income. They primarily comprise:
• actuarial gains and losses on obligations resulting from changes in actuarial assumptions and from experience adjustments (the effects of differences between the actuarial assumptions adopted and what has actually occurred);
• plan asset outperformance/underperformance (i.e. the difference between the effective return on plan assets and the return calculated using the discount rate applied to the actuarial liability).
The share of provisions for retirement benefit obligations that matures in less than one year is shown under ”Other current non-operating liabilities”.
Provisions for retirement benefits amounted to €20.1 million at 31 December 2018, including €19.7 million maturing in more than one year, compared to €19.3 million at 31 December 2017, including €18.8 million maturing in more than one year.
Cofiroute’s retirement benefit obligations for defined-benefit plans break down into two categories:
• obligations borne directly by Cofiroute, covered by provisions recognised in the IFRS balance sheet. Retirement bonuses and additional defined-benefit pension plans;
• plans that are pre-financed through a contract with an insurance company.
Retirement benefit obligations covered by provisions in the balance sheet are measured on the basis of the following assumptions:
Plan 2018 2017
Discount rate 1.70% 1.75%
Inflation rate 1.60% 1.60%
Rate of salary increases (excl. inflation) 1.00% 1.00%
The discount rate was determined on the basis of the yields of blue chip corporate bonds (AA rating) whose maturities correspond to the plans’ expected cash flows. The discount rate finally adopted is a single rate equivalent to the application of the various rates depending on maturities.
On the basis of these assumptions, retirement benefits, the provisioned and recognised pension expenses break down as follows:
Reconciliation of obligations and provisions recorded in the balance sheet
(in € millions) 31/12/2018 31/12/2017
Actuarial liability from retirement benefit obligations 24.0 24.1
Fair value of hedging assets (3.9) (4.7)
Deficit (or surplus) 20.1 19.3
Provision recognised as liabilities in the balance sheet 20.1 19.3
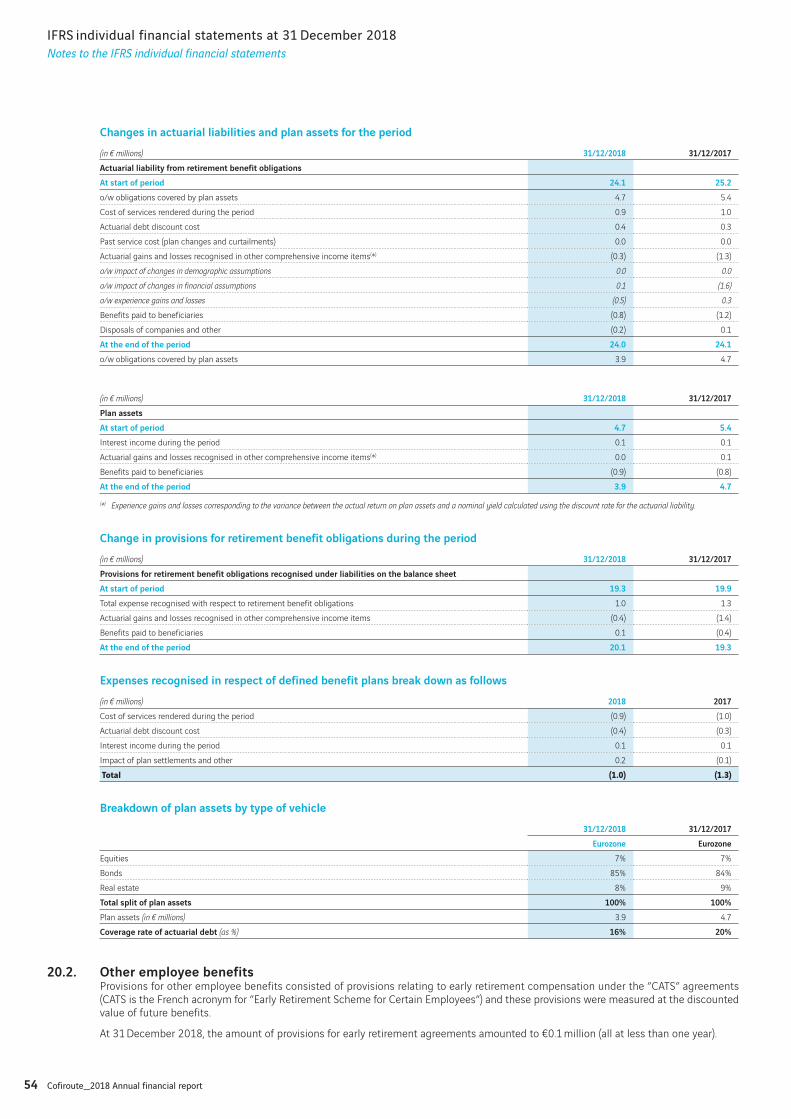
54 Cofiroute_2018 Annual financial report
IFRS individual financial statements at 31 December 2018
Notes to the IFRS individual financial statements
Changes in actuarial liabilities and plan assets for the period
(in € millions) 31/12/2018 31/12/2017
Actuarial liability from retirement benefit obligations
At start of period 24.1 25.2
o/w obligations covered by plan assets 4.7 5.4
Cost of services rendered during the period 0.9 1.0
Actuarial debt discount cost 0.4 0.3
Past service cost (plan changes and curtailments) 0.0 0.0
Actuarial gains and losses recognised in other comprehensive income items(*) (0.3) (1.3)
o/w impact of changes in demographic assumptions 0.0 0.0
o/w impact of changes in financial assumptions 0.1 (1.6)
o/w experience gains and losses (0.5) 0.3
Benefits paid to beneficiaries (0.8) (1.2)
Disposals of companies and other (0.2) 0.1
At the end of the period 24.0 24.1
o/w obligations covered by plan assets 3.9 4.7
(in € millions) 31/12/2018 31/12/2017
Plan assets
At start of period 4.7 5.4
Interest income during the period 0.1 0.1
Actuarial gains and losses recognised in other comprehensive income items(*) 0.0 0.1
Benefits paid to beneficiaries (0.9) (0.8)
At the end of the period 3.9 4.7
(*) Experience gains and losses corresponding to the variance between the actual return on plan assets and a nominal yield calculated using the discount rate for the actuarial liability.
Change in provisions for retirement benefit obligations during the period
(in € millions) 31/12/2018 31/12/2017
Provisions for retirement benefit obligations recognised under liabilities on the balance sheet
At start of period 19.3 19.9
Total expense recognised with respect to retirement benefit obligations 1.0 1.3
Actuarial gains and losses recognised in other comprehensive income items (0.4) (1.4)
Benefits paid to beneficiaries 0.1 (0.4)
At the end of the period 20.1 19.3
Expenses recognised in respect of defined benefit plans break down as follows
(in € millions) 2018 2017
Cost of services rendered during the period (0.9) (1.0)
Actuarial debt discount cost (0.4) (0.3)
Interest income during the period 0.1 0.1
Impact of plan settlements and other 0.2 (0.1)
Total (1.0) (1.3)
Breakdown of plan assets by type of vehicle
31/12/2018 31/12/2017
Eurozone Eurozone
Equities 7% 7%
Bonds 85% 84%
Real estate 8% 9%
Total split of plan assets 100% 100%
Plan assets (in € millions) 3.9 4.7
Coverage rate of actuarial debt (as %) 16% 20%
20.2. Other employee benefitsProvisions for other employee benefits consisted of provisions relating to early retirement compensation under the ”CATS” agreements (CATS is the French acronym for ”Early Retirement Scheme for Certain Employees”) and these provisions were measured at the discounted value of future benefits.
At 31 December 2018, the amount of provisions for early retirement agreements amounted to €0.1 million (all at less than one year).
55Cofiroute_2018 Annual financial report
IFRS individual financial statements at 31 December 2018
Notes to the IFRS individual financial statements
21. Share-based payments
Accounting principles
Cofiroute employees may be granted performance shares by parent company VINCI, or may subscribe to the VINCI Group savings plans (in France and abroad).
The measurement and recognition methods for the VINCI Group savings plans and performance share plans are defined by IFRS 2 ”Share-based Payments”. The granting of performance shares and offers to subscribe to Group savings plans in France and abroad represent a benefit granted to their beneficiaries and therefore constitute supplementary remuneration borne by the Group. Because such transactions do not give rise to monetary transactions, the benefits granted in this way are recognised as expenses in the period in which the rights are acquired, with a corresponding increase in equity. Benefits are measured on the basis of the fair value, at the grant date, of the equity instruments granted.
Benefits granted under performance share grants and the Group savings plan are implemented as decided by VINCI SA’s Board of Directors after their approval by the Shareholders’ General Meeting, and are not, in general, systematically renewed. Moreover, their measurement is not directly related to the business lines’ operating activities. Consequently, Cofiroute considered it appropriate not to exclude the corresponding expense from the operating income from ordinary activities, which is an indicator of business lines’ performance, and instead to report it on a separate line, labelled ”Share-based payments (IFRS 2)”, in current operating income.
Performance share plansSince financial criteria may have to be met for these shares to vest, the fair value of VINCI performance shares is measured at the share value on the grant date, according to the likelihood of the financial criteria being met, as recommended by IFRS 2.
VINCI’s Board of Directors’ meeting held on 7 February 2018 decided to allocate definitively all the original performance share allocations to beneficiaries of the 14 April 2015 long-term incentive plan, after fulfilment of the performance and presence conditions.
VINCI’s Board of Directors’ meeting held on 17 April 2018 decided to implement a new performance share plan that consists of granting certain employees a conditional performance share award. These shares will only be allocated definitively after a vesting period of three years. To qualify, the beneficiary must be employed by the Group until the end of the vesting period and meet the performance conditions.
VINCI Group savings planWith regard to the Group savings plan, the VINCI Board of Directors defines the subscription conditions in accordance with the authorisations granted by the Shareholders’ General Meeting. VINCI issues new shares in France three times a year reserved for VINCI Group employees, with a subscription price that includes a 5% discount against the average stock market price of the VINCI share during the last 20 business days preceding the authorisation by the Board of Directors. Subscribers also benefit from a matching employer’s contribution, which is capped at an annual maximum of €2,500 per person and per year until 31 December 2017. Starting 1 January 2018, the maximum amount of the matching contribution that employees may receive by subscribing to the France Group savings plans is increased to €3,500. The benefits granted in this way to employees of the Group are recognised in profit or loss and are valued in accordance with IFRS 2, on the basis of the following assumptions:
• subscription period: four months;
• lock-up period: five years.
The number of shares estimated as subscribed at the end of the subscription period is calculated using linear regression based on historical observations of the 2007-2017 plans, taking into account a cost for the unavailability of mutual fund shares.
The lock-up cost is estimated by a third party who will hold a diversified portfolio and will be prepared to purchase the blocked securities at a discounted rate. This will correspond to the profitability sought by an investor on the allocated equity for the purposes of hedging against market risk during the five-year lock-up period. The market risk is measured on an annual basis using a value at risk approach.
The total share-based payment expense recognised at 31 December 2018 totalled €2.5 million, including €0.7 million for the Group Savings Plan, compared with €2 million in 2017, including €0.6 million for the Group Savings Plan.
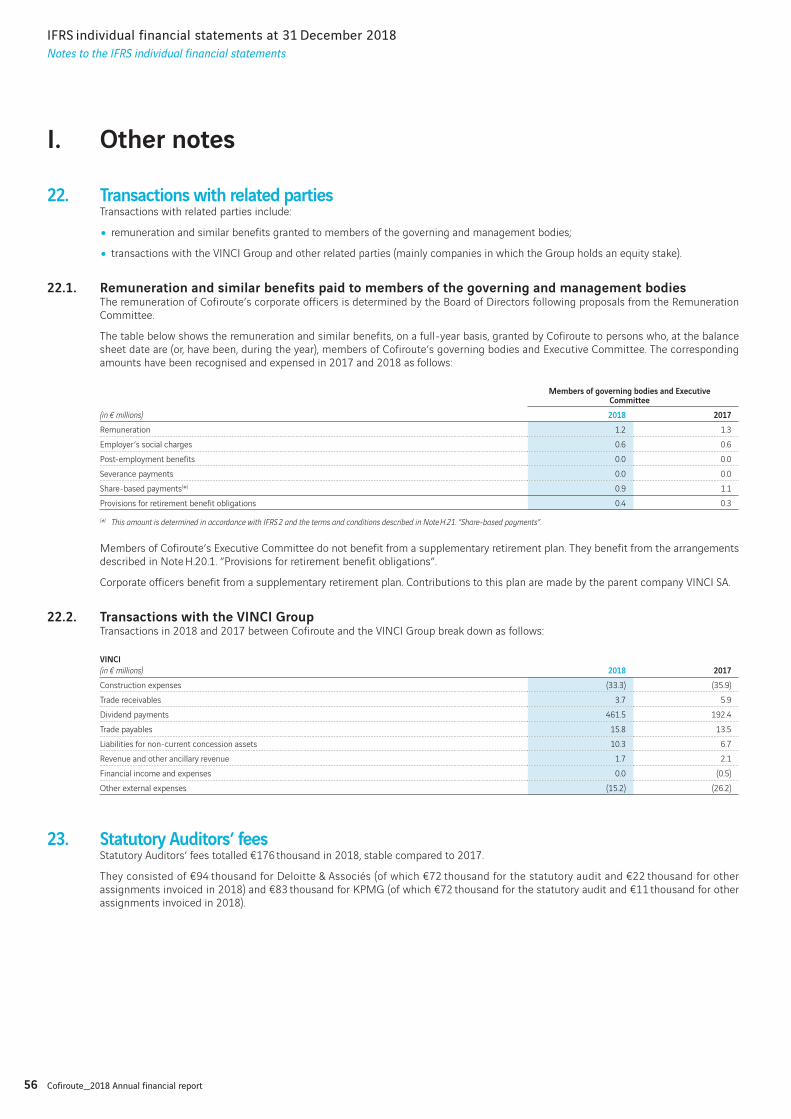
56 Cofiroute_2018 Annual financial report
IFRS individual financial statements at 31 December 2018
Notes to the IFRS individual financial statements
I. Other notes
22. Transactions with related partiesTransactions with related parties include:
• remuneration and similar benefits granted to members of the governing and management bodies;
• transactions with the VINCI Group and other related parties (mainly companies in which the Group holds an equity stake).
22.1. Remuneration and similar benefits paid to members of the governing and management bodiesThe remuneration of Cofiroute’s corporate officers is determined by the Board of Directors following proposals from the Remuneration Committee.
The table below shows the remuneration and similar benefits, on a full-year basis, granted by Cofiroute to persons who, at the balance sheet date are (or, have been, during the year), members of Cofiroute’s governing bodies and Executive Committee. The corresponding amounts have been recognised and expensed in 2017 and 2018 as follows:
(in € millions)
Members of governing bodies and Executive Committee
2018 2017
Remuneration 1.2 1.3
Employer’s social charges 0.6 0.6
Post-employment benefits 0.0 0.0
Severance payments 0.0 0.0
Share-based payments(*) 0.9 1.1
Provisions for retirement benefit obligations 0.4 0.3
(*) This amount is determined in accordance with IFRS 2 and the terms and conditions described in Note H.21. ”Share-based payments”.
Members of Cofiroute’s Executive Committee do not benefit from a supplementary retirement plan. They benefit from the arrangements described in Note H.20.1. ”Provisions for retirement benefit obligations”.
Corporate officers benefit from a supplementary retirement plan. Contributions to this plan are made by the parent company VINCI SA.
22.2. Transactions with the VINCI GroupTransactions in 2018 and 2017 between Cofiroute and the VINCI Group break down as follows:
VINCI
(in € millions) 2018 2017
Construction expenses (33.3) (35.9)
Trade receivables 3.7 5.9
Dividend payments 461.5 192.4
Trade payables 15.8 13.5
Liabilities for non-current concession assets 10.3 6.7
Revenue and other ancillary revenue 1.7 2.1
Financial income and expenses 0.0 (0.5)
Other external expenses (15.2) (26.2)
23. Statutory Auditors’ feesStatutory Auditors’ fees totalled €176 thousand in 2018, stable compared to 2017.
They consisted of €94 thousand for Deloitte & Associés (of which €72 thousand for the statutory audit and €22 thousand for other assignments invoiced in 2018) and €83 thousand for KPMG (of which €72 thousand for the statutory audit and €11 thousand for other assignments invoiced in 2018).
57Cofiroute_2018 Annual financial report
IFRS individual financial statements at 31 December 2018
Notes to the IFRS individual financial statements
J. Post-balance sheet events
Rates
Toll rates on the Duplex A86 increased on 1 January 2019 pursuant to the Interministerial Decree of 26 December 2018.
Toll rates for the intercity network increased on 1 February 2019 pursuant to the Concessions Contract and the Contract Plan. The average rise in the rate per kilometre was +1.65%.
On its intercity network, from 1 February 2019 Cofiroute will introduce a special rate for regular users thanks to a new subscription: drivers making at least 10 round-trips in the month on the same route will enjoy a 30% discount on tolls for all trips made.
Appropriation of 2018 net income
The Board of Directors approved the IFRS individual financial statements for the year ended 31 December 2018 on 1 February 2019. These financial statements will only become definitive when approved by the Shareholders’ General Meeting. A proposal will be made to the Shareholders’ Ordinary General Meeting of 22 March 2019 for a dividend of €143.61 per share for this year, which, given the interim dividend already paid on 30 August 2018 (€23.77 per share), would bring the balance of the dividend payable to €119.84 per share, to be paid no later than 29 March 2019.
K. Note on litigation
To Cofiroute’s knowledge, there are no disputes likely to have a material impact on the Company’s business, earnings, assets or financial position.
58 Cofiroute_2018 Annual financial report
Report of the Statutory Auditors on the IFRS individual financial statements
Report of the Statutory Auditors on the IFRS individual financial statements
For the year ended 31 December 2018
CofirouteA French limited liability company (Société Anonyme)Registered office: 12-14, rue Louis Blériot92500 Rueil-MalmaisonShare capital: €158,282,124
To the Chairman of the Board of Directors,
In our capacity as Statuto ry Auditors for the company Cofiroute and further to your request, we have performed an audit of the Cofiroute IFRS individual financial statements for the year ended 31 December 2018, as attached hereto.
These IFRS individual financial statements were prepared under the responsibility of the Board of Directors. Our role is to express an opinion on these financial statements, based on our audit.
We have conducted our audit in accordance with the professional auditing standards applicable in France and with CNCC guidelines on this procedure; these standards require us to take reasonable steps to ensure that the IFRS individual financial statements are free from material misstatements. An audit involves examining, on a test basis or by means of other selection methods, the evidence supporting the amounts and disclosures in the financial statements. An audit also includes assessing the accounting principles used and significant estimates made by management, as well as evaluating the overall presentation of the IFRS individual financial statements. We believe that our audit provides a reasonable basis for our opinion, which follows.
In our opinion, the IFRS individual financial statements provide, in all material respects, a true and fair view of the Company’s financial position, assets and liabilities and results for the year ended 31 December 2018, in accordance with the International Financial Reporting Standards as adopted by the European Union.
Paris La Défense, 1 February 2019
KPMG Audit Deloitte & Associés
Department of KPMG SA
Philippe BOURHIS Frédéric SOULIARD
Partner Partner
59Cofiroute_2018 Annual financial report
Parent company financial statements
Balance sheet – Assets 60
Balance sheet – Equity and liabilities 61
Income statement 62
Cash flow statement 63
NOTES TO THE PARENT COMPANY FINANCIAL STATEMENTS AT 31 DECEMBER 2018 64
1. Measurement rules and methods 641.1. Non-current assets 64
1.2. Inventories 65
1.3. Trade and other operating receivables 65
1.4. Marketable securities 65
1.5. Borrowings 65
1.6. Financial instruments 65
1.7. Investment subsidies 65
1.8. Contingencies and loss provisions 65
1.9. Share-based payment 65
1.10. Income tax 66
1.11. Consolidation 66
1.12. Key events of the period 66
2. Notes to the financial statements 672.1. Assets 67
2.2. Equity and liabilities 68
2.3. Income statement 70
2.4. Additional information 71
3. Other information 723.1. Remuneration and similar benefits paid to members of the governing
and management bodies 72
3.2. Transactions with the VINCI Group 72
4. Post-balance sheet events 72
REPORT OF THE STATUTORY AUDITORS ON THE PARENT COMPANY FINANCIAL STATEMENTS 73
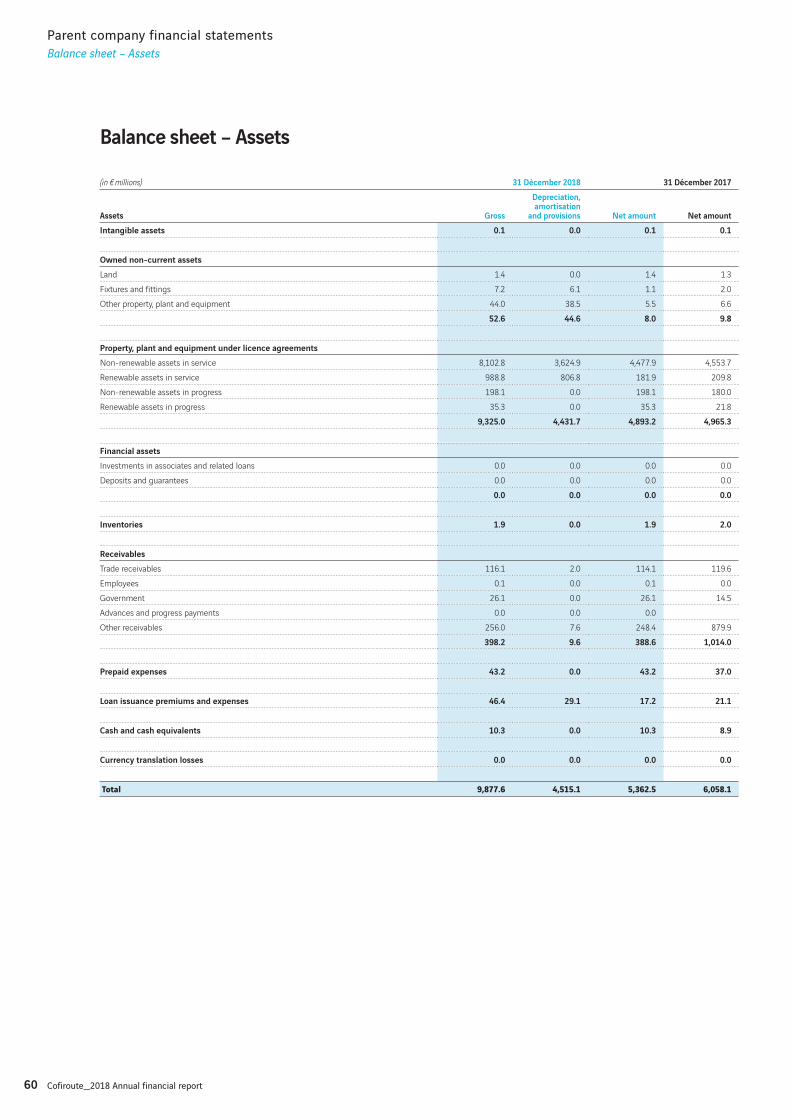
60 Cofiroute_2018 Annual financial report
Parent company financial statements
Balance sheet – Assets
Balance sheet – Assets
(in € millions) 31 Décember 2018 31 Décember 2017
Assets Gross
Depreciation, amortisation
and provisions Net amount Net amount
Intangible assets 0.1 0.0 0.1 0.1
Owned non-current assets
Land 1.4 0.0 1.4 1.3
Fixtures and fittings 7.2 6.1 1.1 2.0
Other property, plant and equipment 44.0 38.5 5.5 6.6
52.6 44.6 8.0 9.8
Property, plant and equipment under licence agreements
Non-renewable assets in service 8,102.8 3,624.9 4,477.9 4,553.7
Renewable assets in service 988.8 806.8 181.9 209.8
Non-renewable assets in progress 198.1 0.0 198.1 180.0
Renewable assets in progress 35.3 0.0 35.3 21.8
9,325.0 4,431.7 4,893.2 4,965.3
Financial assets
Investments in associates and related loans 0.0 0.0 0.0 0.0
Deposits and guarantees 0.0 0.0 0.0 0.0
0.0 0.0 0.0 0.0
Inventories 1.9 0.0 1.9 2.0
Receivables
Trade receivables 116.1 2.0 114.1 119.6
Employees 0.1 0.0 0.1 0.0
Government 26.1 0.0 26.1 14.5
Advances and progress payments 0.0 0.0 0.0
Other receivables 256.0 7.6 248.4 879.9
398.2 9.6 388.6 1,014.0
Prepaid expenses 43.2 0.0 43.2 37.0
Loan issuance premiums and expenses 46.4 29.1 17.2 21.1
Cash and cash equivalents 10.3 0.0 10.3 8.9
Currency translation losses 0.0 0.0 0.0 0.0
Total 9,877.6 4,515.1 5,362.5 6,058.1
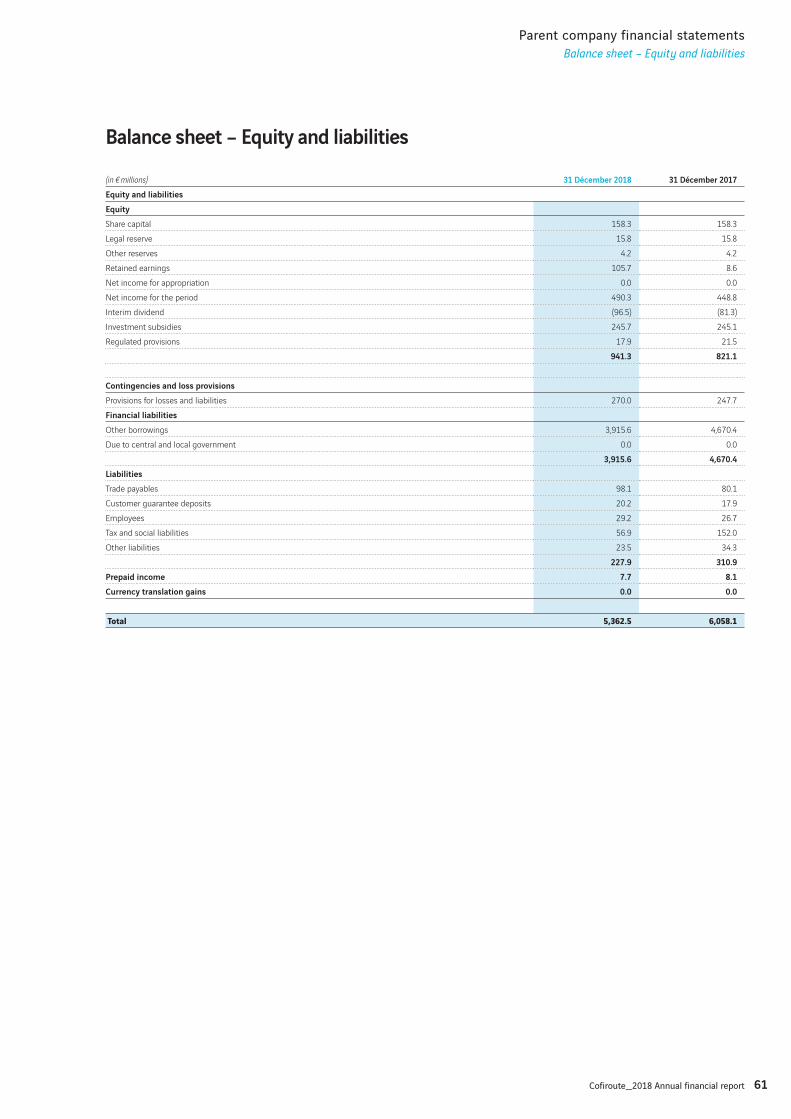
61Cofiroute_2018 Annual financial report
Parent company financial statements
Balance sheet – Equity and liabilities
Balance sheet – Equity and liabilities
(in € millions) 31 Décember 2018 31 Décember 2017
Equity and liabilities
Equity
Share capital 158.3 158.3
Legal reserve 15.8 15.8
Other reserves 4.2 4.2
Retained earnings 105.7 8.6
Net income for appropriation 0.0 0.0
Net income for the period 490.3 448.8
Interim dividend (96.5) (81.3)
Investment subsidies 245.7 245.1
Regulated provisions 17.9 21.5
941.3 821.1
Contingencies and loss provisions
Provisions for losses and liabilities 270.0 247.7
Financial liabilities
Other borrowings 3,915.6 4,670.4
Due to central and local government 0.0 0.0
3,915.6 4,670.4
Liabilities
Trade payables 98.1 80.1
Customer guarantee deposits 20.2 17.9
Employees 29.2 26.7
Tax and social liabilities 56.9 152.0
Other liabilities 23.5 34.3
227.9 310.9
Prepaid income 7.7 8.1
Currency translation gains 0.0 0.0
Total 5,362.5 6,058.1
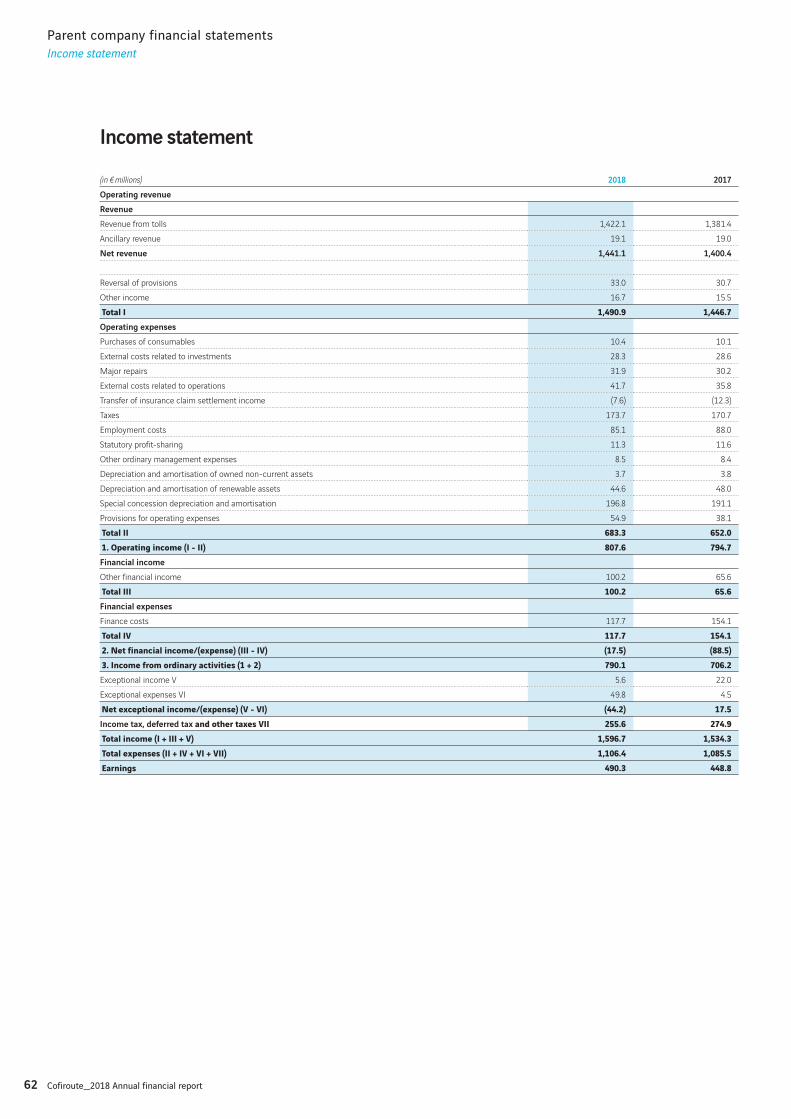
62 Cofiroute_2018 Annual financial report
Parent company financial statements
Income statement
Income statement
(in € millions) 2018 2017
Operating revenue
Revenue
Revenue from tolls 1,422.1 1,381.4
Ancillary revenue 19.1 19.0
Net revenue 1,441.1 1,400.4
Reversal of provisions 33.0 30.7
Other income 16.7 15.5
Total I 1,490.9 1,446.7Operating expenses
Purchases of consumables 10.4 10.1
External costs related to investments 28.3 28.6
Major repairs 31.9 30.2
External costs related to operations 41.7 35.8
Transfer of insurance claim settlement income (7.6) (12.3)
Taxes 173.7 170.7
Employment costs 85.1 88.0
Statutory profit-sharing 11.3 11.6
Other ordinary management expenses 8.5 8.4
Depreciation and amortisation of owned non-current assets 3.7 3.8
Depreciation and amortisation of renewable assets 44.6 48.0
Special concession depreciation and amortisation 196.8 191.1
Provisions for operating expenses 54.9 38.1
Total II 683.3 652.01. Operating income (I - II) 807.6 794.7Financial income
Other financial income 100.2 65.6
Total III 100.2 65.6Financial expenses
Finance costs 117.7 154.1
Total IV 117.7 154.12. Net financial income/(expense) (III - IV) (17.5) (88.5)3. Income from ordinary activities (1 + 2) 790.1 706.2Exceptional income V 5.6 22.0
Exceptional expenses VI 49.8 4.5
Net exceptional income/(expense) (V - VI) (44.2) 17.5Income tax, deferred tax and other taxes VII 255.6 274.9Total income (I + III + V) 1,596.7 1,534.3Total expenses (II + IV + VI + VII) 1,106.4 1,085.5Earnings 490.3 448.8
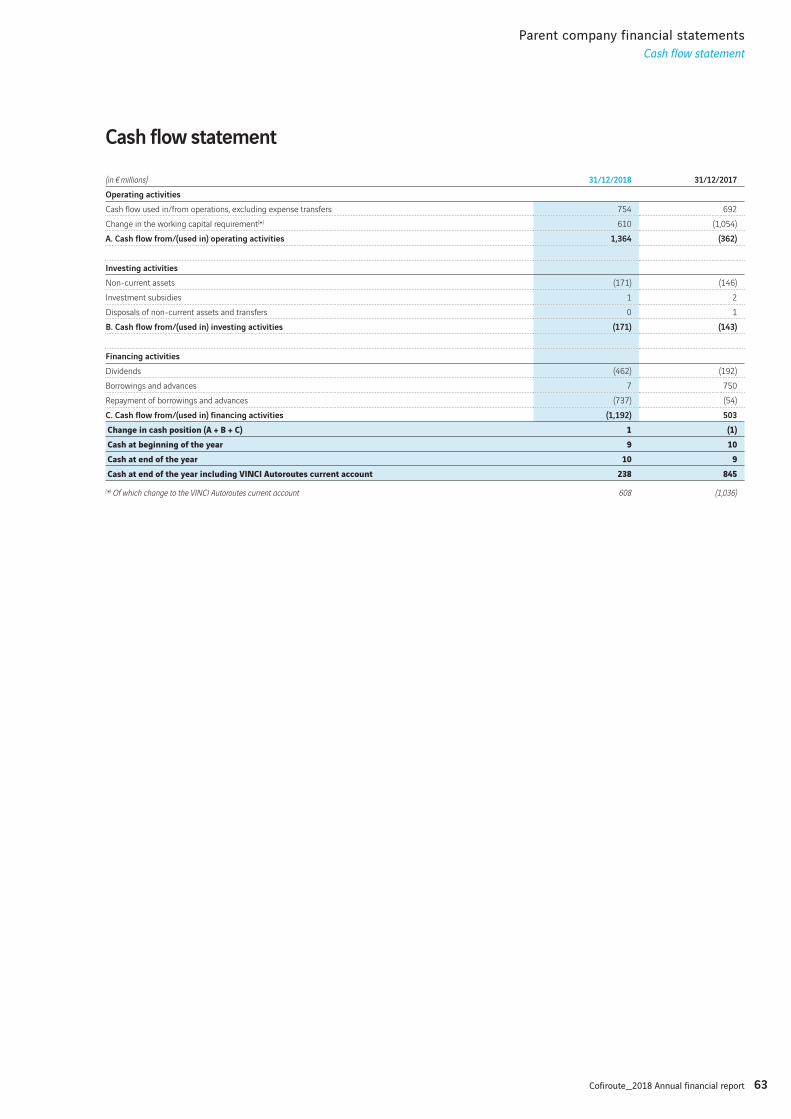
63Cofiroute_2018 Annual financial report
Parent company financial statements
Cash flow statement
Cash flow statement
(in € millions) 31/12/2018 31/12/2017
Operating activities
Cash flow used in/from operations, excluding expense transfers 754 692
Change in the working capital requirement(*) 610 (1,054)
A. Cash flow from/(used in) operating activities 1,364 (362)
Investing activities
Non-current assets (171) (146)
Investment subsidies 1 2
Disposals of non-current assets and transfers 0 1
B. Cash flow from/(used in) investing activities (171) (143)
Financing activities
Dividends (462) (192)
Borrowings and advances 7 750
Repayment of borrowings and advances (737) (54)
C. Cash flow from/(used in) financing activities (1,192) 503
Change in cash position (A + B + C) 1 (1)Cash at beginning of the year 9 10Cash at end of the year 10 9Cash at end of the year including VINCI Autoroutes current account 238 845
(*) Of which change to the VINCI Autoroutes current account 608 (1,036)
64 Cofiroute_2018 Annual financial report
Parent company financial statements
Measurement rules and methods
NOTES TO THE PARENT COMPANY FINANCIAL STATEMENTS AT 31 DECEMBER 2018
1. Measurement rules and methods
The financial statements of parent company Cofiroute are prepared in euros in compliance with the chart of accounts set forth by ANC (French Accounting Board) Regulation No. 2014-3, amended by ANC Regulation No. 2016-07.
1.1. Non-current assetsThese fall into three categories: concession assets, the Company’s own assets and financial assets.
1.1.1. Non-current concession assetsNon-current concession assets are the movable and immovable property directly necessary for the design, construction and operation of the motorway network. They are financed by the concession operator and will be returned free of charge to the French government at the end of the concession.
They are recognised at their historical cost and comprise:
• land, studies, works and subsequent improvements;
• pre-operational expenses and borrowing costs: loan issuance expenses and premiums, redemption premiums and capitalised interest;
• the cost of staff assigned to monitoring the construction of the infrastructure asset.
They are subject to special concession depreciation and amortisation charges calculated over the remaining period of the concession.
Non-current concession assets fall into two categories:
• non-renewable non-current assets: their useful life extends beyond the length of the concession contract, and they may require major repairs. They relate in particular to the network infrastructure, tunnels and bridges;
• renewable non-current assets: since their economic life is shorter than the term of the concession, they must be renewed at least once during the term of the concession. These assets include plant and equipment needed to ensure safety, maintain usable road surfaces and collect tolls.
Depreciation and amortisationSpecial concession depreciation and amortisation charges are applied to non-renewable assets in service and non-current operating assets. The purpose of the special concession depreciation and amortisation charges is to reduce the carrying amount of these assets to zero by the end of the concession term, rather than to recognise any wear or obsolescence of the assets.
• The special concession depreciation and amortisation charges for non-renewable assets are applied on a straight-line basis to the cost of the assets net of any grants received between the date of their entry into service and the end of the concession;
• These charges applied to non-current operating assets are calculated based on their carrying amount and the period remaining until the end of the concession.
No provision is booked for the renewal of assets when a difference arises between the replacement value and the purchase price of renewable assets, because their net amount is depreciated or amortised using this special method.
Normal depreciation and amortisation charges are applied to assets with a useful life shorter than the length of the concession contract. They are calculated using a straight-line or diminishing balance method pursuant to section 39A of the CGI. The difference between depreciation for accounting and for tax purposes is booked under”Tax-regulated provisions”, under liabilities.
Depreciation and amortisation periods range between 10 and 20 years for buildings and from 3 to 10 years for fittings, and equipment, furniture and vehicles. Software is written off over one year for tax purposes.
1.1.2. Owned non-current assetsThese assets belong to Cofiroute and are the default type of asset. They comprise all the fixed assets not used for operating the motorway concession. They are recorded at cost and are amortised using the linear method over their useful life. Depreciation periods are 3 to 10 years for software, fittings, equipment, furniture and vehicles.
65Cofiroute_2018 Annual financial report
Parent company financial statements
Measurement rules and methods
1.1.3. Financial assetsInvestments in subsidiaries and associates are recognised in the balance sheet at their historical cost. A provision is recognised if their value, based primarily on that Company’s net assets, is lower than cost.
1.2. InventoriesStocks of chlorides and fuel are measured on a weighted average unit cost method. Any differences with physical inventory are recognised in the income statement for the period.
1.3. Trade and other operating receivablesThis item includes fees due from other motorway companies under multi-company revenue-sharing agreements.
Trade and other operating receivables are measured at their nominal value less provisions taking account of the probability of recovery.
1.4. Marketable securitiesMarketable securities (money market SICAVs) are recorded at their acquisition cost. Impairment is recognised if their market price is lower than cost. Where they exist, unrealised capital gains are not recognised.
1.5. BorrowingsDebt issue costs, including issuance premiums, are amortised on a straight-line basis over the life of the debt.
1.6. Financial instrumentsThe Company uses derivatives such as interest rate swaps and caps to manage the interest rate risk on its borrowings. As these transactions are carried out for hedging purposes, any gains and losses are recognised in the same period as the hedged item.
1.7. Investment grantsGrants received to finance fixed assets are recognised in shareholders’ equity. They are deducted from non-current concession assets to calculate the special concession amortisation.
1.8. Contingencies and loss provisionsContingencies and loss provisions are liabilities of uncertain timing or amount, but are intended to cover expenses that have become likely or certain to occur at the balance sheet date as a result of a past or present event.
A provision for major repairs is calculated at the end of each period, based on a medium- to long-term works plan drawn up by the Company’s technical department and revised annually to adjust for changes in costs and in the corresponding spending plans.
1.9. Share-based paymentThe measurement and recognition methods for share subscription and purchase plans, the VINCI Group Savings Plans and performance share plans are those defined by the VINCI Group. The grant of performance shares and offers to subscribe to the Group Savings Plan, pursuant to the decision by VINCI SA’s Board of Directors after approval by the General Shareholders’ Meeting, represent a benefit granted to their beneficiaries and therefore constitute supplementary remuneration. Because such transactions do not give rise to cash transactions, the benefits granted in this way are expensed over the vesting period of the rights, with a corresponding accrued expense. Benefits are measured on the basis of the fair value at the grant date of the equity instruments. Adjustments may be made at each closing date in relation to any items whose definitive grant is subject to the attainment of financial targets.
VINCI’s Board of Directors defines the conditions for subscribing to the Group Savings Plan in accordance with the authorisations granted to it by the General Shareholders’ Meeting. VINCI issues new shares in France three times a year reserved for VINCI Group employees, with a subscription price that includes a maximum 5% discount against the average stock market price of the VINCI share during
66 Cofiroute_2018 Annual financial report
Parent company financial statements
Measurement rules and methods
the last 20 business days preceding the setting by the Board of Directors of the subscription price. Subscribers also benefit from a matching employer’s contribution, which is capped at an annual maximum of €2,500 per person and per year until 31 December 2017. Starting 1 January 2018, the maximum amount of the matching contribution that employees will receive by subscribing to the France Group savings plans is increased to €3,500. The benefits granted in this way to employees of the Group are recognised in profit or loss and are valued in accordance with IFRS 2, on the basis of the following assumptions:
• length of subscription period: four months;
• length of period during which funds are frozen: five years.
1.10. Income taxAs part of the tax consolidation agreement signed on 30 January 2015, the Company is liable to pay income tax in respect of VINCI SA, the tax group parent company. The tax expense recognised in the Company’s financial statements is equal to what it would have paid if it were not part of the tax group. Any savings, other than those relating to tax loss carry-forwards, are retained by the parent company.
Cofiroute recognised a provision for deferred tax in its parent company financial statements based on the applicable tax rate at year-end.
In 2018, Cofiroute decided to stop recognizing deferred taxes in its parent company financial statements in order to provide clearer financial information.
Pursuant to French GAAP and ANC Regulation No. 2018-01, this constitutes a change in accounting policies, which is calculated retrospectively at 1 January 2018 and results in the reversal of the provision for deferred taxes and a credit to shareholder’s equity in the amount of €94.6 million.
The CICE competitiveness and jobs tax credit introduced from 1 January 2013 was recognised as a reduction in tax expense. For 2014 to 2016 it was calculated on the basis of 6% of the wages and salaries paid during the year up to 2.5 times the SMIC minimum wage. This rate went up to 7% in 2017 and reduced to 6% in 2018.
In 2018 the CICE amounted to €2.1 million.
The CICE is allocated in full to the financing of investments associated with efforts contributing to energy transition and sustainable development, innovation and competitiveness for digital economy, collaborative tools and innovations for business lines, territorial new business activity and training for employees.
1.11. ConsolidationCofiroute’s IFRS individual financial statements are fully consolidated in the consolidated financial statements for the period ended 31 December 2018 of VINCI SA, a French limited liability company, with share capital of €1,493,789,960, headquartered at 1, cours Ferdinand de Lesseps, 92851 Rueil-Malmaison Cedex, France.
1.12. Key events of the periodSocial movements arising in October 2018 in France surged following the announcement by the French government of higher fuel prices as part of the energy transition and later extended to a variety of other grievances.
This formed the background to the first nationwide demonstration held on Saturday 17 November 2018.
Since then, this many-sided movement has focused its actions on the roads and motorways, leading to random vehicle stops, roadblocks, obstruction of traffic and tollbooths, vandalism of equipment and facilities, and thefts. The sites most affected have been Châtellerault, Ancenis and Orléans.
Traffic in 2018 will have been affected by these events:
• light vehicles traffic up only 0.6%;
• heavy vehicles traffic up 3.5%;
• resulting total traffic increase of 1.0%.
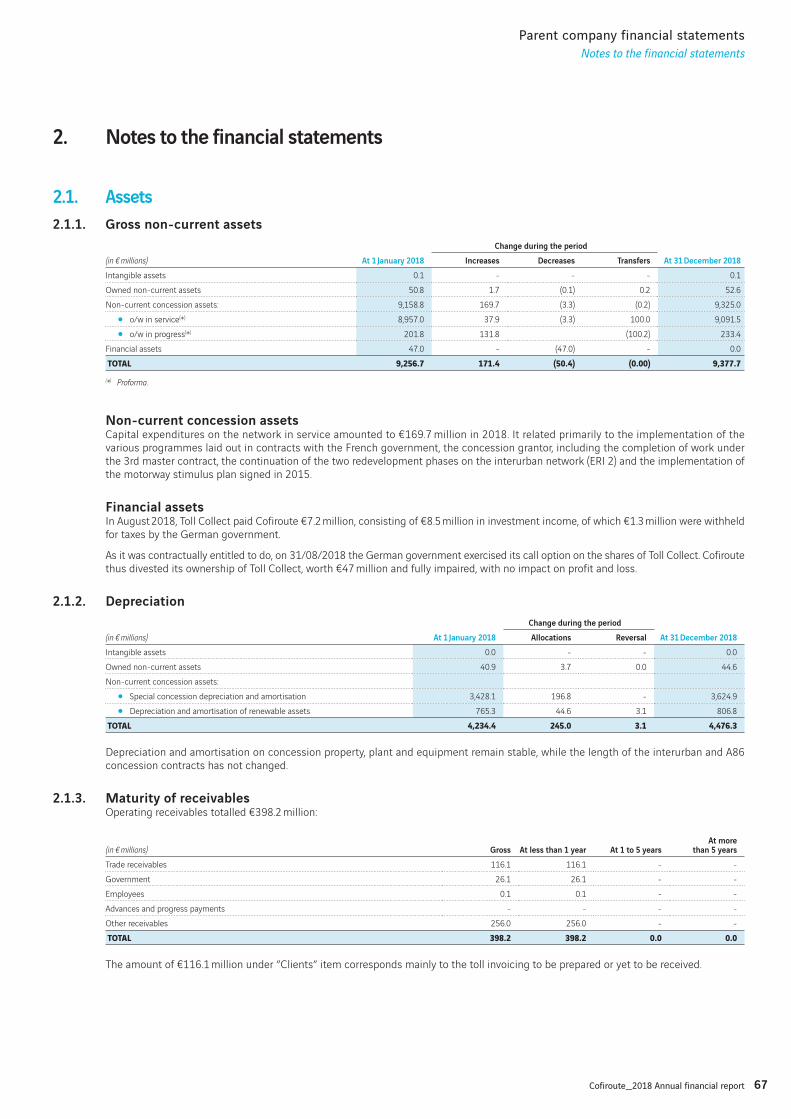
67Cofiroute_2018 Annual financial report
Parent company financial statements
Notes to the financial statements
2. Notes to the financial statements
2.1. Assets
2.1.1. Gross non-current assets
(in € millions) At 1 January 2018
Change during the period
At 31 December 2018Increases Decreases Transfers
Intangible assets 0.1 - - - 0.1
Owned non-current assets 50.8 1.7 (0.1) 0.2 52.6
Non-current concession assets: 9,158.8 169.7 (3.3) (0.2) 9,325.0
• o/w in service(*) 8,957.0 37.9 (3.3) 100.0 9,091.5
• o/w in progress(*) 201.8 131.8 (100.2) 233.4
Financial assets 47.0 - (47.0) - 0.0
TOTAL 9,256.7 171.4 (50.4) (0.00) 9,377.7(*) Proforma.
Non-current concession assetsCapital expenditures on the network in service amounted to €169.7 million in 2018. It related primarily to the implementation of the various programmes laid out in contracts with the French government, the concession grantor, including the completion of work under the 3rd master contract, the continuation of the two redevelopment phases on the interurban network (ERI 2) and the implementation of the motorway stimulus plan signed in 2015.
Financial assetsIn August 2018, Toll Collect paid Cofiroute €7.2 million, consisting of €8.5 million in investment income, of which €1.3 million were withheld for taxes by the German government.
As it was contractually entitled to do, on 31/08/2018 the German government exercised its call option on the shares of Toll Collect. Cofiroute thus divested its ownership of Toll Collect, worth €47 million and fully impaired, with no impact on profit and loss.
2.1.2. Depreciation
(in € millions) At 1 January 2018
Change during the period
At 31 December 2018Allocations Reversal
Intangible assets 0.0 - - 0.0
Owned non-current assets 40.9 3.7 0.0 44.6
Non-current concession assets:
• Special concession depreciation and amortisation 3,428.1 196.8 - 3,624.9
• Depreciation and amortisation of renewable assets 765.3 44.6 3.1 806.8
TOTAL 4,234.4 245.0 3.1 4,476.3
Depreciation and amortisation on concession property, plant and equipment remain stable, while the length of the interurban and A86 concession contracts has not changed.
2.1.3. Maturity of receivablesOperating receivables totalled €398.2 million:
(in € millions) Gross At less than 1 year At 1 to 5 yearsAt more
than 5 years
Trade receivables 116.1 116.1 - -
Government 26.1 26.1 - -
Employees 0.1 0.1 - -
Advances and progress payments - - - -
Other receivables 256.0 256.0 - -
TOTAL 398.2 398.2 0.0 0.0
The amount of €116.1 million under ”Clients” item corresponds mainly to the toll invoicing to be prepared or yet to be received.

68 Cofiroute_2018 Annual financial report
Parent company financial statements
Notes to the financial statements
2.1.4. Impairment provisionsProvisions for impairment break down as follows:
(in € millions) At 1 January 2018
Change during the period
At 31 December 2018Increases Decreases
Renewable assets - - - -
Investments in subsidiaries and affiliates(*) 47.0 - 47.0 0.0
Trade receivables 2.1 0.0 0.1 2.0
Claims from losses 7.9 3.1 3.4 7.6
TOTAL 57.0 3.1 50.5 9.6(*) The €47 million reduction in the line ”Equity investments” refers to the reversal of the provision for impairment of the shares in Toll Collect Gmbh that were disposed of in 2018 (see § 2.1.1.).
2.1.5. Prepaid expensesPrepaid expenses totalled €43 million. They primarily comprise:
• the State fee of €23 million paid in July 2018 for the first half of 2019;
• the Exceptional Voluntary Contribution of €19 million to be staggered according to a schedule agreed with the French government.
2.1.6. Loan issuance premiums and expensesLoan issuance premiums and expenses were as €46.4 million with a gross depreciated value of €29.1 million.
2.1.7. Cash and cash equivalentsCash and cash equivalents of €10.2 million correspond to cash available on bank current accounts.
2.2. Equity and liabilities
2.2.1. Share capitalThe share capital breaks down into 4,058,516 fully paid-up shares with a par value of €39.
2.2.2. Shareholders’ equity
(in € millions) At 1 January 2018
Change during the period
At 31 December 2018Increases Decreases
Share capital 158.3 - - 158.3
Legal reserve 15.8 - - 15.8
Other reserves 4.2 - - 4.2
Retained earnings(*) 8.6 97.1 105.7
Profit or loss 448.8 490.3 448.8 490.3
Interim dividend (81.3) (96.5) (81.3) (96.5)
Investment subsidies 245.1 0.5 245.7
Tax-regulated provisions 21.5 1.7 5.3 17.9
TOTAL 821.1 493.1 372.8 941.3(*) The change of accounting policy from ceasing to recognize deferred taxes created an increase in retained earnings of €94.6 million (see §1.10).
2.2.3. Contingencies and loss provisionsContingencies and loss provisions break down as follows over the period:
(in € millions) At 1 January 2018
Change during the period
At 31 December 2018Allocations
Reversal
Used Unused Total reversals
Provisions for major repairs 246.3 51.8 23.4 5.7 29.1 269.0
Provisions for obligations under CATS (early retirement) agreement 0.3 0.1 0.2 0.3 0.1
Provisions for other liabilities 1.0 0.0 0.1 0.1 0.2 0.9
TOTAL 247.7 51.8 29.5 270.0
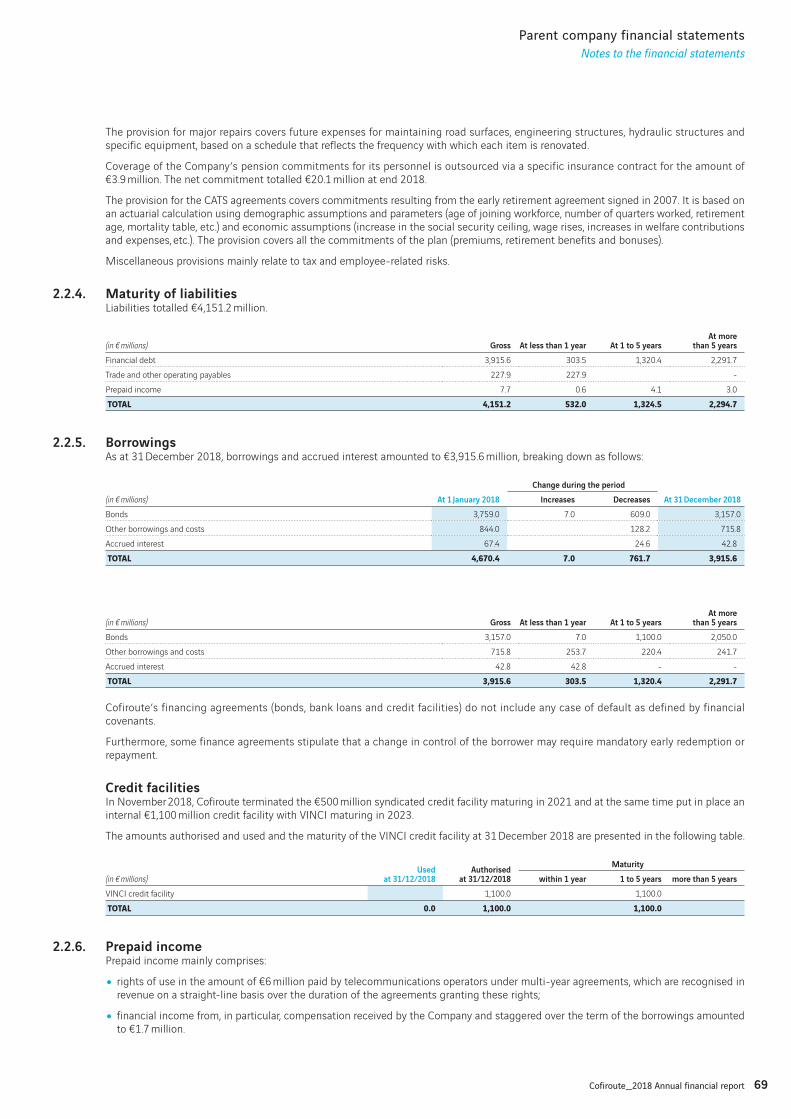
69Cofiroute_2018 Annual financial report
Parent company financial statements
Notes to the financial statements
The provision for major repairs covers future expenses for maintaining road surfaces, engineering structures, hydraulic structures and specific equipment, based on a schedule that reflects the frequency with which each item is renovated.
Coverage of the Company’s pension commitments for its personnel is outsourced via a specific insurance contract for the amount of €3.9 million. The net commitment totalled €20.1 million at end 2018.
The provision for the CATS agreements covers commitments resulting from the early retirement agreement signed in 2007. It is based on an actuarial calculation using demographic assumptions and parameters (age of joining workforce, number of quarters worked, retirement age, mortality table, etc.) and economic assumptions (increase in the social security ceiling, wage rises, increases in welfare contributions and expenses, etc.). The provision covers all the commitments of the plan (premiums, retirement benefits and bonuses).
Miscellaneous provisions mainly relate to tax and employee-related risks.
2.2.4. Maturity of liabilitiesLiabilities totalled €4,151.2 million.
(in € millions) Gross At less than 1 year At 1 to 5 yearsAt more
than 5 years
Financial debt 3,915.6 303.5 1,320.4 2,291.7
Trade and other operating payables 227.9 227.9 -
Prepaid income 7.7 0.6 4.1 3.0
TOTAL 4,151.2 532.0 1,324.5 2,294.7
2.2.5. BorrowingsAs at 31 December 2018, borrowings and accrued interest amounted to €3,915.6 million, breaking down as follows:
(in € millions) At 1 January 2018
Change during the period
At 31 December 2018Increases Decreases
Bonds 3,759.0 7.0 609.0 3,157.0
Other borrowings and costs 844.0 128.2 715.8
Accrued interest 67.4 24.6 42.8
TOTAL 4,670.4 7.0 761.7 3,915.6
(in € millions) Gross At less than 1 year At 1 to 5 yearsAt more
than 5 years
Bonds 3,157.0 7.0 1,100.0 2,050.0
Other borrowings and costs 715.8 253.7 220.4 241.7
Accrued interest 42.8 42.8 - -
TOTAL 3,915.6 303.5 1,320.4 2,291.7
Cofiroute’s financing agreements (bonds, bank loans and credit facilities) do not include any case of default as defined by financial covenants.
Furthermore, some finance agreements stipulate that a change in control of the borrower may require mandatory early redemption or repayment.
Credit facilitiesIn November 2018, Cofiroute terminated the €500 million syndicated credit facility maturing in 2021 and at the same time put in place an internal €1,100 million credit facility with VINCI maturing in 2023.
The amounts authorised and used and the maturity of the VINCI credit facility at 31 December 2018 are presented in the following table.
(in € millions)Used
at 31/12/2018Authorised
at 31/12/2018
Maturity
within 1 year 1 to 5 years more than 5 years
VINCI credit facility 1,100.0 1,100.0
TOTAL 0.0 1,100.0 1,100.0
2.2.6. Prepaid incomePrepaid income mainly comprises:
• rights of use in the amount of €6 million paid by telecommunications operators under multi-year agreements, which are recognised in revenue on a straight-line basis over the duration of the agreements granting these rights;
• financial income from, in particular, compensation received by the Company and staggered over the term of the borrowings amounted to €1.7 million.
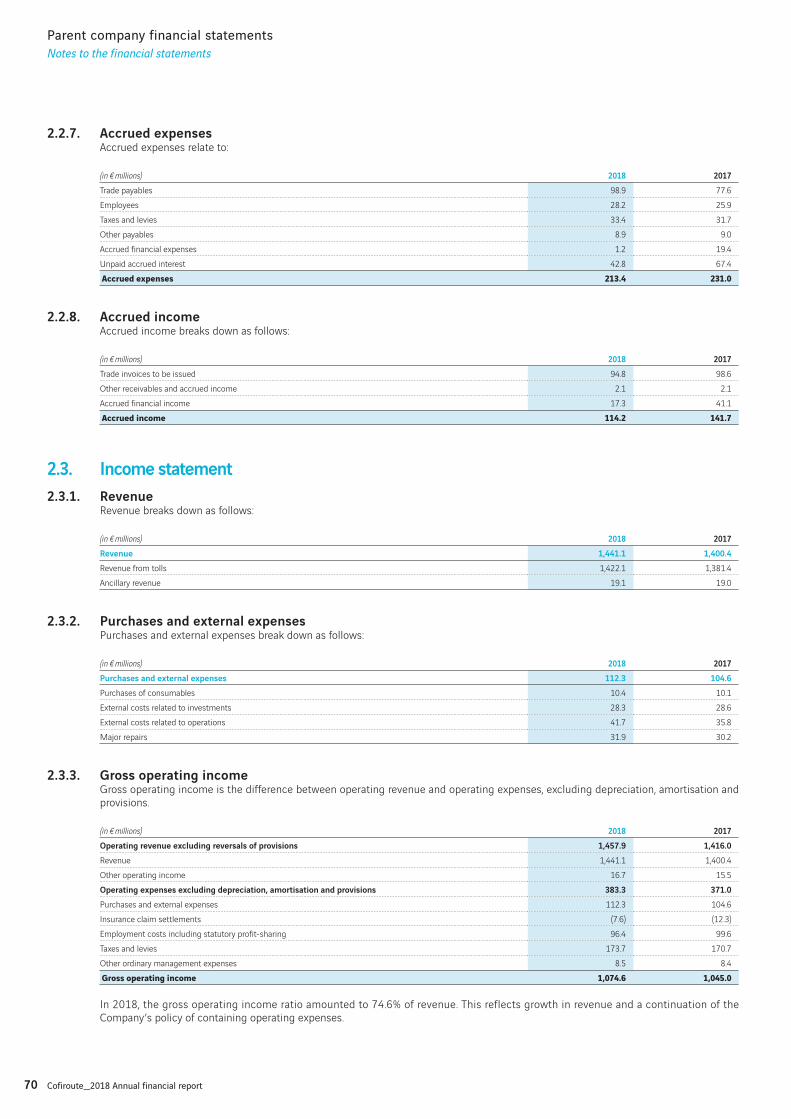
70 Cofiroute_2018 Annual financial report
Parent company financial statements
Notes to the financial statements
2.2.7. Accrued expensesAccrued expenses relate to:
(in € millions) 2018 2017
Trade payables 98.9 77.6
Employees 28.2 25.9
Taxes and levies 33.4 31.7
Other payables 8.9 9.0
Accrued financial expenses 1.2 19.4
Unpaid accrued interest 42.8 67.4
Accrued expenses 213.4 231.0
2.2.8. Accrued incomeAccrued income breaks down as follows:
(in € millions) 2018 2017
Trade invoices to be issued 94.8 98.6
Other receivables and accrued income 2.1 2.1
Accrued financial income 17.3 41.1
Accrued income 114.2 141.7
2.3. Income statement
2.3.1. RevenueRevenue breaks down as follows:
(in € millions) 2018 2017
Revenue 1,441.1 1,400.4
Revenue from tolls 1,422.1 1,381.4
Ancillary revenue 19.1 19.0
2.3.2. Purchases and external expensesPurchases and external expenses break down as follows:
(in € millions) 2018 2017
Purchases and external expenses 112.3 104.6
Purchases of consumables 10.4 10.1
External costs related to investments 28.3 28.6
External costs related to operations 41.7 35.8
Major repairs 31.9 30.2
2.3.3. Gross operating incomeGross operating income is the difference between operating revenue and operating expenses, excluding depreciation, amortisation and provisions.
(in € millions) 2018 2017
Operating revenue excluding reversals of provisions 1,457.9 1,416.0
Revenue 1,441.1 1,400.4
Other operating income 16.7 15.5
Operating expenses excluding depreciation, amortisation and provisions 383.3 371.0
Purchases and external expenses 112.3 104.6
Insurance claim settlements (7.6) (12.3)
Employment costs including statutory profit-sharing 96.4 99.6
Taxes and levies 173.7 170.7
Other ordinary management expenses 8.5 8.4
Gross operating income 1,074.6 1,045.0
In 2018, the gross operating income ratio amounted to 74.6% of revenue. This reflects growth in revenue and a continuation of the Company’s policy of containing operating expenses.
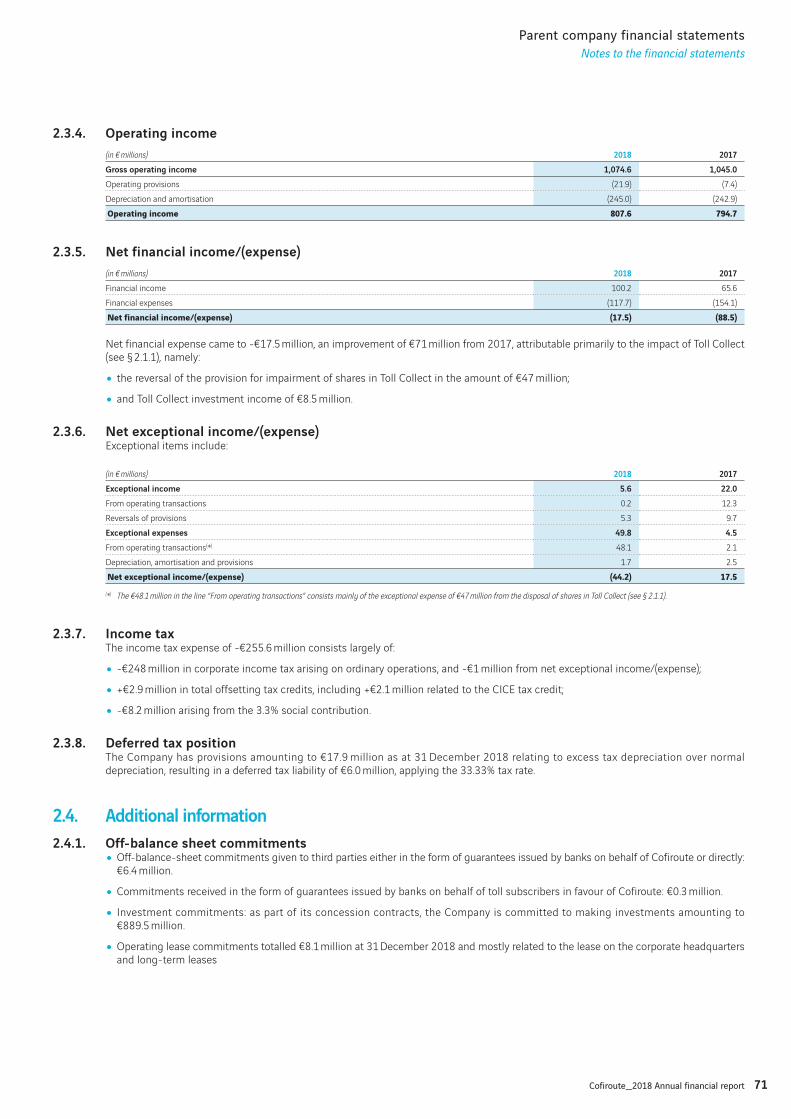
71Cofiroute_2018 Annual financial report
Parent company financial statements
Notes to the financial statements
2.3.4. Operating income
(in € millions) 2018 2017
Gross operating income 1,074.6 1,045.0
Operating provisions (21.9) (7.4)
Depreciation and amortisation (245.0) (242.9)
Operating income 807.6 794.7
2.3.5. Net financial income/(expense)
(in € millions) 2018 2017
Financial income 100.2 65.6
Financial expenses (117.7) (154.1)
Net financial income/(expense) (17.5) (88.5)
Net financial expense came to -€17.5 million, an improvement of €71 million from 2017, attributable primarily to the impact of Toll Collect (see § 2.1.1), namely:
• the reversal of the provision for impairment of shares in Toll Collect in the amount of €47 million;
• and Toll Collect investment income of €8.5 million.
2.3.6. Net exceptional income/(expense)Exceptional items include:
(in € millions) 2018 2017
Exceptional income 5.6 22.0
From operating transactions 0.2 12.3
Reversals of provisions 5.3 9.7
Exceptional expenses 49.8 4.5
From operating transactions(*) 48.1 2.1
Depreciation, amortisation and provisions 1.7 2.5
Net exceptional income/(expense) (44.2) 17.5(*) The €48.1 million in the line “From operating transactions” consists mainly of the exceptional expense of €47 million from the disposal of shares in Toll Collect (see § 2.1.1).
2.3.7. Income taxThe income tax expense of -€255.6 million consists largely of:
• -€248 million in corporate income tax arising on ordinary operations, and -€1 million from net exceptional income/(expense);
• +€2.9 million in total offsetting tax credits, including +€2.1 million related to the CICE tax credit;
• -€8.2 million arising from the 3.3% social contribution.
2.3.8. Deferred tax positionThe Company has provisions amounting to €17.9 million as at 31 December 2018 relating to excess tax depreciation over normal depreciation, resulting in a deferred tax liability of €6.0 million, applying the 33.33% tax rate.
2.4. Additional information
2.4.1. Off-balance sheet commitments
• Off-balance-sheet commitments given to third parties either in the form of guarantees issued by banks on behalf of Cofiroute or directly: €6.4 million.
• Commitments received in the form of guarantees issued by banks on behalf of toll subscribers in favour of Cofiroute: €0.3 million.
• Investment commitments: as part of its concession contracts, the Company is committed to making investments amounting to €889.5 million.
• Operating lease commitments totalled €8.1 million at 31 December 2018 and mostly related to the lease on the corporate headquarters and long-term leases
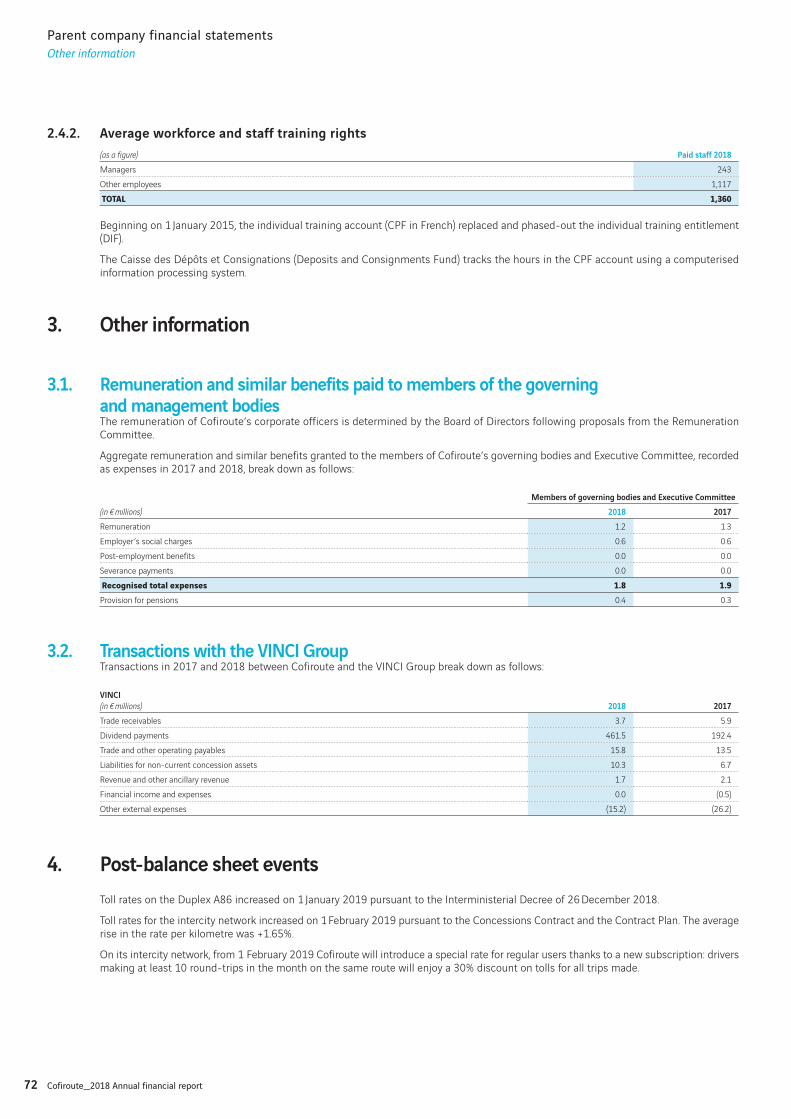
72 Cofiroute_2018 Annual financial report
Parent company financial statements
Other information
2.4.2. Average workforce and staff training rights
(as a figure) Paid staff 2018
Managers 243
Other employees 1,117
TOTAL 1,360
Beginning on 1 January 2015, the individual training account (CPF in French) replaced and phased-out the individual training entitlement (DIF).
The Caisse des Dépôts et Consignations (Deposits and Consignments Fund) tracks the hours in the CPF account using a computerised information processing system.
3. Other information
3. 1. Remuneration and similar benefits paid to members of the governing and management bodiesThe remuneration of Cofiroute’s corporate officers is determined by the Board of Directors following proposals from the Remuneration Committee.
Aggregate remuneration and similar benefits granted to the members of Cofiroute’s governing bodies and Executive Committee, recorded as expenses in 2017 and 2018, break down as follows:
(in € millions)
Members of governing bodies and Executive Committee
2018 2017
Remuneration 1.2 1.3
Employer’s social charges 0.6 0.6
Post-employment benefits 0.0 0.0
Severance payments 0.0 0.0
Recognised total expenses 1.8 1.9Provision for pensions 0.4 0.3
3.2. Transactions with the VINCI GroupTransactions in 2017 and 2018 between Cofiroute and the VINCI Group break down as follows:
VINCI
(in € millions) 2018 2017
Trade receivables 3.7 5.9
Dividend payments 461.5 192.4
Trade and other operating payables 15.8 13.5
Liabilities for non-current concession assets 10.3 6.7
Revenue and other ancillary revenue 1.7 2.1
Financial income and expenses 0.0 (0.5)
Other external expenses (15.2) (26.2)
4. Post-balance sheet events
Toll rates on the Duplex A86 increased on 1 January 2019 pursuant to the Interministerial Decree of 26 December 2018.
Toll rates for the intercity network increased on 1 February 2019 pursuant to the Concessions Contract and the Contract Plan. The average rise in the rate per kilometre was +1.65%.
On its intercity network, from 1 February 2019 Cofiroute will introduce a special rate for regular users thanks to a new subscription: drivers making at least 10 round-trips in the month on the same route will enjoy a 30% discount on tolls for all trips made.
73Cofiroute_2018 Annual financial report
Report of the Statutory Auditors on the parent company financial statements
Basis of our opinion
Report of the Statutory Auditors on the parent company financial statements
For the year ended 31 December 2018
CofirouteA French Limited Liability Company (Société Anonyme)Registered office: 12-14 rue Louis Blériot92506 Rueil Malmaison CedexShare capital: €158,282,124
To Cofiroute’s Shareholders’ General Meeting,
Opinion
In accordance with our appointment as Statutory Auditors by your General Shareholders’ Meetings, we have performed an audit of the Cofiroute parent company financial statements for the year ended 31 December 2018, as attached hereto.
In our opinion, the parent company financial statements give a true and fair view of the Company’s financial position and assets and liabilities as of 31 December 2018 and the results of its operations for the year then ended, in accordance with accounting principles generally accepted in France.
Basis of our opinion
Audit guidelinesWe conducted our audit in accordance with the prevailing standards of the profession in France. We believe that the information that we have collected provides a sufficient and appropriate basis for our opinion.
Our responsibilities pursuant to these standards are indicated in the section ”Responsibilities of the Statutory Auditors relating to the audit of the parent company financial statements” of this report.
IndependenceWe performed our audit assignment in compliance with the rules of independence that apply to us, for the period from 1 January 2018 to the issue date of our report; and in particular we have not provided services prohibited by Article 5, paragraph 1, of Regulation (EU) No. 537/2014 or by the Professional Code of Ethics of Statutory Auditors.
Furthermore, non-audit services that we provided during the financial year to your company and the entities that it controls and which are not mentioned in the management report or the notes to the financial statements are as follows: issues of comfort letters, of a report prepared at the time of the planned distribution of interim dividends, certification of covenant ratios, certification of costs and the report on employee-related, environmental and societal data contained in the management report for 2017.
Comments Without questionning the opinion expressed above, we draw your attention to Note 1.10 “Corporate Income Tax” of the notes to the parent company financial statements, which describes the change in accounting policy relating to ceasing to recognize deferred taxes starting 1 January 2018.
74 Cofiroute_2018 Annual financial report
Report of the Statutory Auditors on the parent company financial statements
Justification of our assessments – Key points of the audit
Justification of our assessments – Key points of the audit
Pursuant to the provisions of articles L.823-9 and R.823-7 of the French Commercial code relating to the justification of our assessments, we inform you of the key point of the audit relating to the risk of material misstatements that, according to our professional judgement, has been the most significant for the audit of the financial statements for the year, as well as our response to this risk.
This conclusion was formed in the context of the audit of the financial statements, taken as a whole, and the forming of our opinion, as stated above. We do not express any opinion on elements of these financial statements taken individually.
Assessment of provisions for the obligation to maintain the condition of concession assets(Notes 1.8 and 2.2.3. ”Contingencies and loss provisions”)
Risk identifiedProvisions are taken for contractual obligations to maintain the condition of concession assets and principally to cover the expense of major road repairs (surface courses, restructuring of slow lanes, etc.), bridges, tunnels and hydraulic infrastructure. Provisions are also taken whenever recognised signs of defects are encountered on identified infrastructures.
These provisions, recorded for an amount of €269.0 million at 31 December 2018, are calculated on the basis of a medium to long-term expenditure programme that is reviewed annually. Forecasts are estimated, notably taking account of indexation clauses included in construction contracts (mainly the TP01 and TP09 public works indices).
We considered that the evaluation of the provisions for maintaining the condition of concession assets, which represent a significant amount on the balance sheet liabilities, was a key point of the audit insofar as these provisions are based on the management’s judgment for estimating the major maintenance expenditure over several years, and on account of their sensitivity to the assumptions used, particularly in terms of public works indices.
Our response to riskOur work notably consisted of:
• taking note of the procedures implemented by the company for the assessment of the provisions for the obligation to maintain the condition of concession assets;
• comparing the expenses planned at the end of the preceding year for 2018 in 2018 with the actual expenses recorded during 2018;
• performing a critical analysis of the expenses taken into account when making provisions, by comparing estimates in the multi-year spending forecast for major maintenance as at 31 December 2018 with those used to 31 December 2017;
• performing a critical examination of the estimates in the multi-year spending forecasts for major maintenance in comparison with the technical documentation available;
• test the proper arithmetic application of the indexation clauses included in construction contracts (mainly the TP01 and TP09 indices).
Specific verifications
We have also carried out, in compliance with the professional standards applicable in France, the specific verifications required by legislation and regulations.
Information given in the management report and the other documents sent to the shareholders We have no comments to make as to the fair presentation and consistency with the financial statements of the information given in the report of the Board of Directors and in the other documents sent to the shareholders, with respect to the financial position and the financial statements.
We certify the accuracy and the consistency with the annual statements of the information concerning payment terms mentioned in article D. 441-4 of the French Commercial Code.
75Cofiroute_2018 Annual financial report
Report of the Statutory Auditors on the parent company financial statements
Responsibilities of the Statutory Auditors relating to the audit of the parent company financial statements
Information resulting from other legal and regulatory obligations
Designation of Statutory AuditorsWe were appointed as Cofiroute’s Statutory Auditors by the Shareholders’ General Meeting of 27 April 2000 for KPMG and 8 January 2008 for Deloitte & Associés, taking into account the acquisitions or mergers for these firms since that date.
As at 31 December 2018, KPMG was in the 19th year of its uninterrupted mission and Deloitte & Associés was in the 12th year of its uninterrupted mission.
Responsibilities of the management and persons constituting the corporate governance relating to the financial statements
It is the management’s responsibility to draw up the financial statements presenting a true and fair view in compliance with the French accounting rules and principles as well as to implement the internal control that it deems necessary for drawing up parent company financial statements that are free from material misstatements, whether these are a result of fraud or errors.
When preparing the financial statements, it is the responsibility of management to assess the ability of the Company to continue as a going concern, to present in these financial statements, where appropriate, the necessary information relating to the going concern and apply the going concern accounting policy, unless there are plans to wind up the business or discontinue operations.
These parent company financial statements have been approved by the Board of Directors.
Responsibilities of the Statutory Auditors relating to the audit of the parent company financial statements
It is our responsibility to draw up a report on the financial statements. Our objective is to obtain reasonable assurance that the parent company financial statements are free of material misstatement. Reasonable assurance means a high level of assurance, without; however, guaranteeing that an audit conducted in accordance with the standards of professional practice can systematically detect all material misstatements. Misstatements may arise from fraud or be the result of error and are considered material when one can reasonably expect that, taken individually or in combination, they may influence the economic decisions that users of the financial statements take when relying upon them.
As specified by article L.823-10-1 of the French Commercial Code, our audit engagement for the certification of the financial statements does not consist of giving an opinion on the viability or quality of the management of your company.
As part of an audit carried out in accordance with professional standards applicable in France, the Statutory Auditor exercises his professional judgement throughout this audit. In addition:
• it identifies and assesses the risks that the financial statements may contain material misstatements, whether due to fraud or error, defines and implements audit procedures to address such risks, and collects elements that it considers sufficient and appropriate as a basis for its opinion. The risk of not detecting a material misstatement arising from fraud is greater than that of a material misstatement resulting from error, because fraud may involve collusion, falsification, wilful omission, false statements or circumvention of the internal control system;
• the auditor shall examine the internal control system that bears on the audit in order to define the audit procedures that are appropriate in the circumstances, and not in order to express an opinion on the effectiveness of the internal control system;
Corporate governanceWe certify the existence of information required by articles L.225-37-3 and L.225-37-4 of the French Commercial Code in the section of the Board of Directors’ management report on corporate governance.
Concerning the information provided pursuant to the provisions of article L.225-37-3 of the French Commercial Code on remuneration and benefits paid to corporate officers as well as the commitments made in their favour, we have verified their consistency with the accounts or data used to draw up these financial statements and, where applicable, with the elements gathered by your company from companies controlling your company or controlled by it. Based on this work, we certify the accuracy and fair presentation of this information.
76 Cofiroute_2018 Annual financial report
Report of the Statutory Auditors on the parent company financial statements
Responsibilities of the Statutory Auditors relating to the audit of the parent company financial statements
• it assesses the appropriateness of the accounting methods used and the reasonable nature of the accounting estimates made by the Management, as well as the information related thereto provided in the financial statements;
• it assesses the appropriateness of management’s application of the going concern accounting policy and, depending on the elements collected, the existence or non-existence of major uncertainty related to events or circumstances that are likely to question the Company’s ability to continue as a going concern. This evaluation is based on the material collected up to the date of the auditor’s report, bearing in mind that circumstances or subsequent events could call the going-concern assumption into question. If it concludes that there is a significant uncertainty, it draws the attention of the readers of its report to the information provided in the financial statements about this uncertainty or, if this information is not provided or is not relevant, it formulates a qualified certification or a refusal to certify;
• it assesses the overall presentation of the financial statements and evaluates whether the financial statements reflect the underlying transactions and events so as to give a true and fair view.
Paris-La Défense, 25 February 2019
The Statutory Auditors
KPMG Audit A department of KPMG SA
Deloitte & Associés
Philippe Bourhis
PartnerFrederic Souliard
Partner
77Cofiroute_2018 Annual financial report
Persons responsible for the document
Persons responsible for financial information
Persons responsible for the document1. Certification by the person responsible for this document
I certify, to the best of my knowledge, that the IFRS individual financial statements for the year ended 31 December 2018 forming part of the annual financial report have been prepared in compliance with the applicable accounting standards, and that they provide accurate information on the assets, financial position and income of Cofiroute. I also certify that the management report provides an accurate table of key events that occurred during 2018, their impact on the financial statements and a description of the primary risks and uncertainties for the year.
Marc BOURON
Chief Executive Officer
2. Statutory Auditors
The Company’s Statutory Auditors are registered with France’s official Statutory Auditors’ representative body (Compagnie Nationale des Commissaires aux Comptes) and are subject to the authority of the French Higher Council of Statutory Audit (Haut Conseil du Commissariat aux Comptes).
Primary AuditorsKPMG SA Deloitte & Associés
2, avenue GambettaTour Eqho92066 Paris La Défense CedexFrance
6, place de la PyramideTour Majunga92908 Paris la Défense CedexFrance
Current term began:AG du 23 mars 2018:GM of 23 March 2018.
Current term began:GM of 20 March 2013.
Current term expires:At close of GM to approve the 2023 financial statements.
Current term expires:at close of GM to approve the 2018 financial statements.
Alternate AuditorsKPMG AUDIT ID Cabinet Beas
2, avenue Gambetta, Tour Eqho92066 Paris La Défense CedexFrance
195, avenue Charles de Gaulle92524 Neuilly-sur-SeineFrance
Current term began:GM of 23 March 2018.
Current term began:GM of 20 March 2013.
Current term expires:At close of GM to approve the 2023 financial statements.
Current term expires:At close of GM to approve the 2018 financial statements.
3. Persons responsible for financial information
Frédéric Vautier, Chief Financial Officer and Member of the Executive Committee (+ 33 1 55 94 70 00).
78 Cofiroute_2018 Annual financial report
Persons responsible for the document
Documents available for consultation by the public
4. Documents available for consultation by the public
The following documents are available on the Company’s website (www.vinci-autoroutes.com):
• the 2018 financial report;
• the half-year 2018 financial report;
• financial, annual and half-year reports for 2008 to 2017.
Cofiroute’s Articles of Association may be consulted at Cofiroute’s registered office, 12 rue Louis Blériot – CS 30035 – 92506 Rueil Malmaison Cedex (+33 1 55 94 70 00).
79Cofiroute_2018 Annual financial report
Persons responsible for the document
80 Cofiroute_2018 Annual financial report
Persons responsible for the document

Copyright: A10 Orléans - Photo library of VINCI Autoroutes’ / Guillaume Souvant.
Head off ice
12, rue Louis Blériot
CS 30035
92506 Rueil-Malmaison Cedex
Tél. : 01 55 94 70 00
www.vinci-autoroutes.com