Embed Size (px)
Citation preview
Comprehensive Annual Financial Report
Fiscal Year Ended June 30, 2015

Comprehensive Annual Financial Report Fiscal Year Ended June 30, 2015
Asa Hutchinson Governor
Larry Walther
Director Department of Finance and Administration
Prepared By
The Department of Finance and Administration Office of Accounting
Act 501 of 2013 reduced the requirements of state agencies to print annual reports, as such; the State of Arkansas’s Comprehensive Annual Financial Report is available in electronic format at http://www.dfa.arkansas.gov/ offices/accounting/pages/CAFR.aspx. The photograph of Governor Asa Hutchinson is courtesy of the Governor’s Office.
Governor Asa Hutchinson
500 WOODLANE STREET, SUITE 250 · LITTLE ROCK, AR 72201 TELEPHONE (501) 682-2345
www.governor.arkansas.gov
STATE OF ARKANSAS ASA HUTCHINSON
GOVERNOR
ACKNOWLEDGMENTS
The Comprehensive Annual Financial Report was prepared by the Department of Finance and Administration Office of Accounting:
Larry Walther
Director
Tim Leathers Deputy Director/Commissioner of Revenue
Paul S. Louthian, CPA
Administrator of Office of Accounting
Financial Reporting Staff:
Brenda Horner, CPA, CGFM Assistant Administrator of Office of Accounting
Gary Puls, CPA – CAFR Accounting Manager
Dan Brassart, CPA – SEFA Accounting Manager Gerald Plafcan, CPA, CFE, CGFM – Technical Accounting Manager
David Paes, CPA – CAFR Coordinator Rhonda Harris, CPA – CAFR Coordinator Jessica Primm, CPA – CAFR Coordinator
Ed Niday, CPA – CAFR Coordinator Kate Hickey, CPA – CAFR Coordinator
Becky Salewski Mark Troillett, CPA
Lisa Bucks, CPA John Joyner
Jason Hogland George Williams, CPA
Tommy Leitmeyer Marilyn Cook, CPA
Josh Loy, CPA Linda Hensley
Kathy Crawford
Special appreciation is given to all personnel throughout the State whose extra effort to contribute accurate, timely financial data for their agencies made this report possible.
COMPREHENSIVE ANNUAL FINANCIAL REPORT
FOR THE YEAR ENDED JUNE 30, 2015
TABLE OF CONTENTS Page
Introductory Section Letter of Transmittal i GFOA – Certificate of Achievement for Excellence in Financial Reporting xi Organizational Chart xii Principal Officials xiii
Financial Section Independent Auditor’s Report 1 Management’s Discussion and Analysis 5 Basic Financial Statements Government-Wide Financial Statements Statement of Net Position 18 Discretely Presented Component Units Consolidated Statement of Financial Position 20 Statement of Activities 22 Discretely Presented Component Units Consolidated Statement of Activities 24 Fund Financial Statements Governmental Fund Financial Statements Balance Sheet 26 Reconciliation of the Governmental Fund Balance Sheet to the Statement of Net Position 27 Statement of Revenues, Expenditures and Changes in Fund Balance 28
Reconciliation of the Statement of Revenues, Expenditures and Changes in Fund Balance of the Governmental Fund to the Statement of Activities 29
Proprietary Fund Financial Statements Statement of Fund Net Position 30 Statement of Revenues, Expenses and Changes in Fund Net Position 32 Statement of Cash Flows 33 Fiduciary Fund Financial Statements Statement of Fiduciary Net Position 35 Statement of Changes in Fiduciary Net Position 36
Notes to the Financial Statements – Table of Contents 37
Required Supplementary Information Pension Funds Schedules 137 Schedule of Expenditures – Budget and Actual – General Fund 149 Notes to Schedule of Expenditures – Budget and Actual – General Fund 150 Ten-Year Claims Development Information – Employee Benefits Division – Public School Employee Health and Life Benefit Plan 152 Ten-Year Claims Development Information – Workers’ Compensation
Commission – Death and Permanent Total Disability Trust Fund 154 Ten-Year Claims Development Information – Workers’ Compensation
Commission – Second Injury Trust Fund 156 Other Postemployment Benefits – Schedule of Funding Progress 158
Page Combining Financial Statements Non-major Enterprise Funds 159 Combining Statement of Fund Net Position 160 Combining Statement of Revenues, Expenses and Changes in Fund Net Position 162 Combining Statement of Cash Flows 163 Fiduciary Funds 164 Combining Statement of Fiduciary Net Position – Pension Trust Funds 165 Combining Statement of Changes in Fiduciary Net Position – Pension Trust Funds 166 Combining Statement of Fiduciary Net Position – Agency Funds 167 Combining Statement of Changes in Assets and Liabilities – Agency Funds 168
Statistical Section Statistical Section 171 Financial Trends Schedule 1 Net Position by Component 172 Schedule 2 Changes in Net Position 174 Schedule 3 Fund Balances, Governmental Fund 178 Schedule 4 Changes in Fund Balance, Governmental Fund 180 Revenue Capacity Information Schedule 5 Revenue Base – Sales and Use Tax Collections by Industry 182 Schedule 6 Revenue Payers 184 Debt Capacity Information Schedule 7 Ratios of Outstanding Debt by Type 185 Schedule 8 Pledged Revenue Bond Coverage 186 Demographic and Economic Information Schedule 9 Demographic and Economic Indicators 188 Schedule 10 Principal Employers 189 Schedule 11 State Employees by Function 190 Operating Information Schedule 12 Operating Indicators by Function 192 Schedule 13 Capital Asset Statistics by Function 196 Other Information Schedule 14 Miscellaneous Statistics 197

Introductory Section

i
December 31, 2015
The Honorable Asa Hutchinson, Governor The Honorable Members of the Arkansas General Assembly The Citizens of Arkansas In accordance with the requirements set forth in Arkansas Code of 1987 Annotated (ACA) § 19-4-517, it is my pleasure to transmit to you the Comprehensive Annual Financial Report (CAFR) of the State of Arkansas (the State) for the fiscal year ended June 30, 2015. This report has been prepared by the Department of Finance and Administration (DFA) in conformance with Generally Accepted Accounting Principles (GAAP) for governments as promulgated by the Governmental Accounting Standards Board (GASB). The accuracy of agency level data that supports these financial statements is the responsibility of agency management. The completeness and fairness of the presentation, including all disclosures, rests with DFA. To the best of our knowledge and belief, the enclosed data is accurate in all material respects, and is reported in a manner designed to present fairly the financial position of the State. All disclosures necessary to enable the reader to gain an understanding of the State’s financial activities have been included. The management of the State is responsible for establishing and maintaining an internal control structure designed to ensure that the assets of the State are protected from loss, theft, or misuse, and that adequate accounting data is compiled to allow the preparation of the financial statements. The internal control structure has been designed to provide reasonable, but not absolute, assurance regarding the reliability of financial records for preparing financial statements and maintaining accountability for the safeguarding of public assets. The concept of reasonable assurance recognizes that the cost of a control should not exceed the benefits likely to be derived, and that the valuation of costs and benefits require estimates and judgments by management. Arkansas Legislative Audit performed the audit for the fiscal year ended June 30, 2015. Auditing standards generally accepted in the United States of America were used by the auditors in conducting the engagement. The auditors’ report on the basic financial statements is included in the financial section of this report. The Management’s Discussion and Analysis (MD&A) introduces the basic financial statements and provides an analytical overview of the government’s financial activities. This letter of transmittal complements the MD&A and should be read in conjunction with it. The State’s MD&A can be found in the financial section immediately following the report of the independent auditor. PROFILE OF THE GOVERNMENT Originally part of the Louisiana Purchase of 1803, Arkansas was organized into a territory in 1819 with the same northern, eastern, and southern borders it shares today. In 1836, Arkansas became the 25th state of the United States of America with a new border on the west. It currently stands as the 29th state in size with an area of 53,179 square miles. Arkansas has grown from a vast wilderness to a thriving state with a population of 2.9 million, propagating industries ranging from agriculture to technology to commerce. Nicknamed “The Natural State,” Arkansas is known throughout the country for its natural beauty, clear waters, and abundance of natural wildlife.
ii
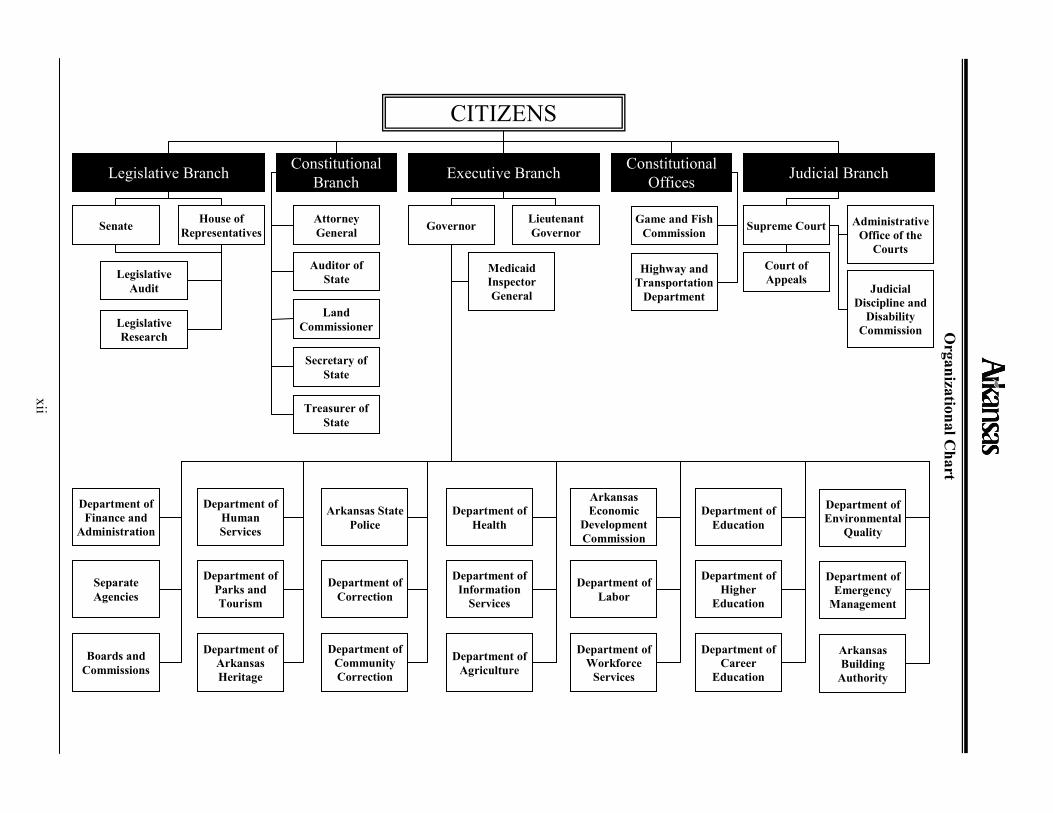
The Constitution of the State provides for three distinct branches of government: executive, legislative, and judicial. The executive branch is comprised of the Governor, Lieutenant Governor, Attorney General, Secretary of State, Treasurer of State, Auditor of State, and State Land Commissioner; all of whom are elected by state-wide vote to serve four-year terms. The legislative branch is comprised of 35 state senators and 100 state representatives. Known collectively as the General Assembly, the senators and representatives begin the Regular Legislative Session in January of every odd-numbered year and the Fiscal Legislative Session in February of every even-numbered year. The judicial branch is comprised of three levels of courts. They are the District Courts, the Circuit Courts, and the Appellate Courts, which are the Court of Appeals and the Supreme Court. Budgetary control is maintained through legislative appropriation. Agencies submit budgetary requests to DFA, which compiles the executive budget on behalf of the Governor, who then submits it to the Legislature for approval. DFA maintains control over the spending patterns of the State through control at the line-item level. See Note to Required Supplementary Information (RSI) - (Budgetary Basis Reporting – Budgetary Process) for further discussion of budgetary controls. The State provides a full range of services including: education; health and human services; transportation; law, justice, and public safety; recreation and resource development; regulation of business and professionals; and, general government. All agencies, divisions, departments, boards, and commissions that represent the State’s reporting entities are included in this report. In addition to these primary government activities, this report includes information related to component units that are financially accountable to the State. Although such information is provided in this report, the focus of the MD&A and the financial statements is on the primary government and its activities. Separately issued financial statements are available from the discretely presented component units and should be read to obtain a better understanding of their respective financial conditions. Additional information on all discretely presented component units can be found in the notes to the financial statements. FACTORS AFFECTING ECONOMIC CONDITION The information presented in the financial statements is perhaps better understood when it is considered from the broader perspective of the specific environment within which the State operates. Local Economy Arkansas is noted as a leader in the South for its favorable business climate and low cost of doing business. The average cost of living for all of the State’s metropolitan statistical areas is consistently below the national average. Businesses also enjoy low tax obligations through a variety of incentives, exemptions, credits, and refunds. Centrally located half-way between Canada and Mexico, California and the Carolinas, Arkansas is only a short distance away from one-third of the nation’s population. Arkansas is very proud of the four Fortune 500 companies that got their start and are headquartered here: Dillard’s, Murphy Oil, Tyson Foods, and Wal-Mart. This year, the State has continued to attract new businesses. Big River Steel officially closed on its financing and commenced construction of its $1.3 billion steel mill in Mississippi County. The mill will employ more than 500 people. Midcontinent Independent System Operator (MISO) opened a regional operations center for the electric grid in West Little Rock, employing 42 in the high-tech sector. Zilkha Biomass Energy, a producer of biomass solutions to electric utility customers, announced that it will open a facility in Monticello, investing $90 million and creating 52 new jobs. Highland Pellets, an Arkansas-based wood pellet manufacturer, announced plans to build a $130 million facility, creating 35 jobs in the Pine Bluff area. A leading global provider of marketing technology, TeleTech Holdings, announced further expansion to Jonesboro, after establishing a center in Sherwood. Georgia-Pacific announced plans to invest $37 million at its Gurdon
iii
lumber operations. Three technology companies; Big Cloud Analytics, Metova, Inc., and Eyenalyze all announced plans to locate in Conway. The three companies will invest a combined $2.5 million and create 140 new jobs in the area. The aviation and defense manufacturer, Aerojet Rocketdyne, announced plans to invest $18 million and add 85 new positions, expanding its facility in Calhoun County. Southwest Steel Processing also announced plans to expand its Newport facility. The company plans to invest $18 million while adding 100 jobs. Several other companies announced expansion plans in the state; including cleaning products manufacturer, Awesome Products, in West Memphis; building automation systems provider, Wachter, in Lowell; plastic manufacturer, Plastic Ingenuity, in Maumelle; and aviation manufacturers, Galley Support Innovations, in Sherwood and Dassault-Falcon, in Little Rock. Targeted business incentives provide start-up companies a 33.0 percent transferable income tax credit for research and development. Businesses targeted are those that grow knowledge-based businesses from intellectual property that is primarily generated by the State’s research universities. To date, 41 businesses have signed financial incentive agreements with the State, bringing in a total investment of over $100 million. ECONOMIC CONDITION AND OUTLOOK Arkansas’s economy continued a positive trend in fiscal year 2015. Personal income, wage disbursements, and net available general revenues all increased in fiscal year 2015 as compared to fiscal year 2014, while unemployment continued to decline. State Personal Income: Personal income consists of wages and salaries, dividends, interest, rent, and transfer payments, such as social security and other retirement incomes. Personal income does not include realized capital gains from the sale of assets. Personal income, measured in current dollars, reached a total of $114.0 billion in fiscal year 2015. This represented an increase of $4.4 billion, or 4.0 percent, from fiscal year 2014. Fiscal year 2016 is estimated at $118.1 billion (current dollars), an increase of $4.0 billion, or 3.5 percent, from fiscal year 2015. Arkansas Wage and Salary Disbursements: Measured in current dollars, wage and salary income rose to $51.1 billion in fiscal year 2015, an increase of $1.7 billion, or 3.5 percent, from fiscal year 2014. Fiscal year 2016 is estimated at $52.7 billion (current dollars), an increase of $1.6 billion or 3.0 percent from fiscal year 2015. Employment: In fiscal year 2015, revised payroll employment in Arkansas averaged 1.2 million jobs. This represented an increase of approximately 21 thousand jobs, or 1.8 percent, from fiscal year 2014. In fiscal year 2016, payroll employment is expected to average 1.2 million jobs. This represents a projected increase of approximately 20 thousand jobs, or 1.7 percent, from fiscal year 2015. Fiscal Year 2015 Net Available General Revenues: Actual net available general revenues collected totaled $5.2 billion with a $191.6 million surplus above net available distribution. The net available collected was $228.1 million, or 4.5 percent, above the net available in fiscal year 2014. Fiscal year 2016 net available general revenue collections are estimated at $5.1 billion, a decrease of $64.3 million, or 1.2 percent, from fiscal year 2015 and equal to net available distribution. The projected decrease is a result of several factors; however three of those factors stand out. To begin, the top tax rate was cut from 7 percent to 6.9 percent during the legislative session in 2015. Also, insurance license renewals collected from the Insurance Department are on a two-year cycle. Fiscal year 2016 is the down year part of that cycle. Lastly, the Attorney General settled a lawsuit with Standard & Poor’s (S&P) in fiscal year 2015, resulting in a $14.4 million settlement. There is no anticipated similar settlement in fiscal year 2016.
iv
Selected Special Revenues: Voters approved Issue I in November 2012, raising the sales tax from 6 to 6.5 percent, effective July 1, 2013. Revenue from the half-cent increase will finance a $1.3 billion bond issue, which will be combined with existing revenue to pay for $1.8 billion in improvements and construction of four-lane highways that will connect all areas of the State. The increase will expire 10 years from the effective date. Act 87 of 2007 designated a portion of the 6-cent per gallon dyed diesel tax to the Educational Adequacy Fund to partially offset the exemption of dyed diesel from sales tax. Starting in fiscal year 2013, a portion of motor fuel taxes is also deposited to the Educational Adequacy Fund to offset the revenue loss from exempting truck tractors and semitrailers from sales tax. These revenues are deposited to the Educational Adequacy Fund to provide an adequate educational system. In fiscal year 2015, $460.2 million in net tax collections was deposited to the Educational Adequacy Fund, with the fiscal year 2016 net tax collections estimated to be $473.1 million. RELEVANT FINANCIAL POLICIES Balanced Budget: According to data released by S&P in May 2015, Arkansas is one of twenty-four states that do not have a projected budget gap for fiscal year 2016. This is largely due to the fact that Arkansas Code Title 19 (Public Finance) provides for a balanced budget. Title 19 also requires the Director of DFA, who is the Chief Fiscal Officer (CFO) of the State, to be aware of the actual and estimated funds available at all times in order to ensure that they are sufficient to maintain the State on a sound financial basis without incurring a deficit. Additionally, there are requirements for the executive branch to report to the legislative branch on a regular basis regarding the status of the State’s finances. The law provides that sixty days prior to the convening of the General Assembly each year, the Governor shall issue a general revenue forecast. This forecast is based upon the aggregate revenue forecasts of each individual agency. It identifies the expected level of general revenue collections and the net distributions of those revenues for the year, as required by the Revenue Stabilization Act. The General Assembly then authorizes the level of funded appropriation each year based upon the annual general revenue distribution along with other special and federal revenue sources. Each appropriation is required to have at least one funding source. These funding sources are categorized as general, special, federal, or other. State spending is limited to available cash and available appropriation. The Office of Economic Analysis and Tax Research compares the actual revenue collections to the forecast on an ongoing basis. If shortfalls in general revenue collections are anticipated, the “funded appropriation” levels are appropriately reduced to maintain a balanced budget for general revenues. Special, federal, and other revenue collections are monitored by DFA Office of Budget. Each agency provides an annual revenue forecast which is the basis for establishing the agency’s “funded appropriation.” This funded appropriation will be adjusted by the Office of Budget as necessary for shortfalls in anticipated revenue collection. General revenue collections in excess of the original general revenue forecast are placed into a revenue allotment reserve fund. The General Assembly then determines how the funds will be spent. This general revenue one-time funding source is rarely used to finance general operation appropriations. Special, federal, and other revenues generally remain with the recipient agency as funding for its operations. MAJOR INITIATIVES Education: Arkansas continued its commitment to ensuring that every student in Arkansas is prepared to succeed in post-secondary education and careers. Schools implemented rigorous, robust, and research-based academic standards that define what students should know and be able to do at each grade level.
v
To ensure that students are ready for the challenges of a 21st Century economy, the State launched the Computer Science Initiative in fiscal year 2015. Four courses were approved by the Arkansas Department of Education (ADE) to meet the requirements set forth by Act 187 of 2015. Starting with the 2015-2016 school year, all public high schools and public charter high schools will offer at least one computer science course as part of their curriculum. The success of every student is important for a vibrant economy and society. With this in mind, the ADE launched the Response to Intervention (RTI) model in fiscal year 2015. This resource gives students who are at risk for learning and behavior challenges a tool to seek support and monitor progress. Students can gain access to individualized instructional plans that may include small group instruction, custom assessments, progress monitoring, and attention to behavior factors so they have a better chance for success in the classroom and beyond. Highway and Transportation: The Arkansas Highway and Transportation Department’s (AHTD) mission is to provide a safe, efficient, aesthetically pleasing and environmentally sound intermodal transportation system for the user. Efficient and orderly movement of goods and people is essential for a thriving population. With this aim in mind, AHTD completed a number of construction projects in fiscal year 2015; among them was a new interchange on Interstate 40 at Lonoke, completed in December 2014. The $7.9 million project connects Highway 89 to the Interstate. This provides a needed update to a connecting route between the commuting and shipping thoroughfares of U.S. 67-167 at Cabot and Interstate 40 just to the east of manufacturing centers in the Little Rock Metro. In an effort to accommodate traffic between two commerce centers, a new segment of Interstate 49 in southern Miller County was opened to traffic this year. The new lanes complete a section of the Interstate that now connects Texarkana and Shreveport, Louisiana. A total of 21 projects were involved in completing the 42-mile section from the Arkansas/Louisiana state line to Highway 71 just north of Texarkana. The Prairie Grove Bypass was officially opened in northwest Arkansas, providing needed relief for a rapidly growing population center. Work began on construction of the project in 2011 after completing various planning stages. Also in northwest Arkansas, ground was broken on the Highway 412 Bypass north of Springdale. The project will carry traffic from Interstate 49 westward to Highway 112 when completed. The first leg of the bypass will be a four-lane, divided highway 4.5 miles in length. Also in north Arkansas, a new barge for Arkansas’s last remaining ferry boat was christened and put into service on Bull Shoals Lake. The barge can hold up to 100 passengers and 12 vehicles, doubling the capacity of the old barge. The barge crosses Bull Shoals Lake just north of the town of Peel, connecting Highway 125 at each shore. Consistent with its purpose to provide safe transportation systems for all users, AHTD commenced work on a new statewide Bicycling and Pedestrian Transportation Plan this year. The plan will address State policies related to bicycling and walking as well as the development of roads, trains, sidewalks and other infrastructure that serve pedestrians and bicyclists. Also consistent with this multi-user objective, the final draft on a new State Rail Plan has been completed. Public meetings were held in September and October. The new plan, in addition to a High-Speed Passenger Rail Feasibility Study, serves as an important step in charting a direction for rail transportation in Arkansas for the next 20 to 30 years. In April, AHTD staff in the Transportation Planning and Policy Division began work producing a new Statewide Long-Range Intermodal Transportation Plan (LRITP) for the AHTD. Through an extensive public and stakeholder involvement process, the plan will set strategic directions on the future of Arkansas’s transportation system and the level of transportation investments required.
vi
The first meeting of the Governor’s Working Group on Highway Funding took place in June. Their purpose is to serve as an investigative and advisory body for the Governor in determining adequate financing of the present and future needs of the State highways, county roads and city streets. State Parks: Arkansas’s 52 state parks are natural treasures set on gorgeous mountains, lakes, streams, and forests. Encompassing 54,466 acres of wetlands, forests, fish and wildlife habitats, recreational facilities, and unique historic and cultural resources, the state parks provide a hands-on opportunity to experience why Arkansas is the Natural State. Within the parks are 1,781 campsites, 4 lodges, 209 fully equipped cabins, 10 marinas, 11 swimming pools, 8 restaurants, 18- and 27- hole golf courses, over 120 miles of roads, hundreds of miles of utilities, and an assortment of 142 hiking, mountain bike, backpack, equestrian and multi-use trails, covering 390 miles. Over 8.9 million visitors came to the state parks with 1 million visitors participating in more than 48 thousand educational and recreational programs and special events throughout the park system in the fiscal year ended June 30, 2015. Over $173.0 million in capital improvements and major maintenance projects have been completed throughout the Arkansas State Park system, funded by Amendment 75, the one-eighth per-cent Conservation Tax, since its passage in 1996. Seventeen construction and major renovation projects totaling $5.2 million were completed during fiscal year 2015, including a complete renovation of Queen Wilhelmina Lodge, construction of new 1800s historic buildings at Davidsonville, renovation of the Civilian Conservation Corp dining hall at Crowley’s Ridge State Park, construction of a new day-use bath house at Prairie Grove Battlefield, renovation of the bath house at White Oak Lake, and Phase I of the renovations to the Craft Village at the Ozark Folk Center. The popularity of the State parks’ family of websites and social networking sites continues to grow, bringing visitors to experience park programs, events, quality facilities, and natural, historical and cultural resources. Arkansas State Parks has over 80 thousand “friends” on Facebook, over 10 thousand followers on Twitter, over 1 thousand followers on Instagram, and over 500 followers on Pinterest taking advantage of the benefits and values of their State park system. Social networking sites are great marketing tools that help the public’s utilization of park facilities, provide testimonials to others, and connect visitors and stakeholders to recreation and education program opportunities and facilities. Updates to www.arkansas.com’s mobile website provide users location and driving directions, trail locations, accommodations information, and information on park programs and special events. Tourism: The tourism and hospitality industry is one of the largest sectors of the Arkansas economy. The industry experienced another solid year in 2015. Tourism tax collections showed resilience as the national economy continued its recovery and consumer confidence increased. The State’s 2 percent tourism tax revenues have grown at a pace approximately four to five times the rate of inflation. Several of the State’s key marketing areas – places such as Dallas, Houston, Oklahoma City, and Tulsa – showed strength despite the downturn in the energy sector. In actuality, five of the fastest growing communities in the country are located within the State’s primary marketing area. Intrastate regions, such as northwest Arkansas and central Arkansas, also exhibited gains. The state’s tourism industry gained new resources with the opening of the new Scott Family Amazeum in Bentonville, the ribbon-cutting at the completely renovated Queen Wilhelmina State Park Lodge in western Arkansas, the $7.8 million renovation of Mid-America Museum in Hot Springs, a multi-million dollar expansion at Oaklawn Racing & Gaming in Hot Springs, dedication of Battery C Park in Helena, and the $37 million expansion at Southland Park Gaming & Racing in West Memphis. There are also several key tourism projects still in development. The Little Rock Convention and Visitors Bureau is overseeing an $85 million renovation of the Robinson Auditorium complex, which is scheduled to re-open in November 2016. Work continues on the US Marshal Museum in Fort Smith, which will
vii
provide a major boost for western Arkansas. Also, the Crystal Bridges Museum of American Art in Bentonville acquired the Bachman Wilson House (a significant Frank Lloyd Wright structure) and will open the historic building to the public in November 2015 on the museum grounds in northwest Arkansas. Plans for a boutique hotel on Central Avenue in downtown Hot Springs have been announced and investors are said to be considering additional lodging developments in Little Rock’s River Market District. Wildlife Conservation: Like the Department of Parks & Tourism, the Arkansas Game and Fish Commission (AGFC) also plays an important role in keeping the Natural State true to its name. March 11, 2015, commemorated the 100th anniversary of Act 124 of 1915, which created the Arkansas Game and Fish Commission. During the last 100 years, the agency has overseen the protection, conservation and preservation of various species of fish and wildlife in Arkansas. This is done through habitat management, fish stocking, hunting and fishing regulations, and a host of other programs. Through agency programs geared toward the public, the Arkansas Game and Fish Commission also works to generate awareness of ethical and sound management principles. The agency does this through educational programs, fishing and hunting regulations, and environmental awareness. In fiscal year 2015, the AGFC coordinated a large communications campaign in celebration of its centennial, including the production of a special video to memorialize the work of countless Arkansas conservationists. The video was distributed through the AGFC’s YouTube channel and at speaking engagements and displays. Additionally, a 132-page cookbook and a 180-page photo history book were produced and sold online, at nature centers, and at events celebrating aspects of the outdoors. In March, full page ads were placed in a special centennial issue of the AGFC’s magazine, Arkansas Wildlife, as well as independent publications to help announce the celebration. The celebration also included displays, which were placed at the Arkansas State Capitol. Additionally, Governor Asa Hutchinson recognized the anniversary in a press conference and, later that same day, Senator John Boozman entered a formal recognition of the anniversary into the Congressional Record in our Nation’s capital. The celebration also stretched beyond the borders of AGFC buildings. Displays and booths represented the AGFC at the Arkansas State Fair, the Arkansas Big Buck Classic, the Little Rock Marathon, state tournaments for the Arkansas National Archery in the Schools Program and Arkansas Youth Shooting Sports Program, Toad Suck Daze in Conway, Crawdad Days in Harrison, Riverfest in Little Rock, the Jasper Elk Festival and many other town festivals and gatherings. It is the AGFC’s belief that working with people is just as important to wildlife management as any other endeavor. Human Services: The Arkansas Department of Human Services (DHS) is Arkansas’s largest state agency, with more than 7,400 employees working to ensure that citizens are healthy, safe, and enjoy a high quality of life. In this capacity, DHS serves more than 1.3 million Arkansans each year. The staff is organized into ten major service-delivery divisions and four support offices headquartered in the Donaghey Plaza Complex in Little Rock, with 83 county offices throughout the State. The Department continues to invest in new initiatives and improvements to existing services. DHS recently awarded more than $5 million to 19 primary care providers from across the State for their work to improve the quality of care they provided patients, while also helping save the State about $34 million in Medicaid costs in 2014. The primary care providers who received checks are enrolled in the State’s Patient-Centered Medical Home (PCMH) program, which is part of the Arkansas Health Care Payment Improvement Initiative that began in 2012. This initiative moves the State’s health care payment system away from a fee-for-service model to one that pays physicians for providing high-quality care at an appropriate price. The first phases of the initiative reduced inappropriate use of antibiotics and increased prenatal screening for pregnant women. In addition to these efforts, the DHS Division of Medical Services is establishing a Payment Integrity Unit, which is tasked with strengthening Arkansas’s Medicaid program, preventing improper use of Medicaid funds, and increasing recoveries when the funds are inappropriately used. The new unit will focus on prevention and recoveries by using data analytics and industry best practices to identify systemic
viii
sources of waste. DHS and the Office of the Medicaid Inspector General will then collaborate on correcting the existing policies, new training for DHS and provider staff, and addressing shortcomings in the current claim processing procedures. The Division of Children and Family Services, in cooperation with the Governor’s Office, is beginning a major focus to improve the foster care system that serves the approximately 4,000 children in foster care throughout the State. As part of a statewide meeting called the Recall Hope Summit, the State’s faith-based leaders and communities were asked to become involved by helping to increase available foster care homes and expanding mentoring programs for children in foster care. The Summit offered faith leaders, clergy and lay leaders alike, the tools and the ability to expand, refine, or even begin ministries from their local houses of worship and congregations. DHS is constantly looking at better ways to serve the citizens of Arkansas. Changes made in the past year will allow the agency to provide services every day to the most vulnerable Arkansans in the most efficient way possible. Information Technology: The information technology provider for public entities, the Arkansas Department of Information Systems (DIS) was established in 1977 to provide information technology solutions to better serve the citizens of Arkansas. DIS continually works on improving access to new technologies resulting in improved efficiency across state agencies, boards, commissions, K-12 public schools, higher education, municipal, and county government, allowing them to work more efficiently across state government and use state resources more wisely. DIS has identified and is addressing several trends in today’s evolving technological world. DIS is currently developing the state’s K-12 public schools high-bandwidth broadband project. The primary objective of this project is increasing internet speed at public and public charter schools. The K-12 broadband project will result in the vast majority of the state’s K-12 schools having sufficient Internet access by the completion of the 2015-2016 school year and overall implementation should be completed by June 30, 2017. The project will convert schools to a new network that will provide district hub sites with Internet access. The project will also provide Metropolitan Area Network (MAN) services that can connect buildings within the district and provide high-bandwidth and high-value to all of its K-12 users. DIS is also working to generate significant cost savings by reducing IT infrastructure costs through the State Data Center West. The facility enables the live backup of critical public data and allows for the immediate recoverability of data to the secondary site if an event impacts an agency’s primary site. Related to this, DIS is developing disaster recovery plans and continuity of operations plans for state agencies through the Arkansas Continuity of Operations Program (ACOOP). The State Cyber Security Office (SCSO) of DIS oversees the ACOOP which provides methodology, hardware, software, training, and user assistance for the development, maintenance, and testing of all-hazards plans for Arkansas state agencies. SCSO also serves as the focal point for all cyber security related issues, monitoring organizations on the state network for the presence of malware and infected computers. In addition to preparing agencies for disasters, DIS is also providing a reliable means of communication for first responders through the Arkansas Wireless Information Network (AWIN). AWIN is a multi-phased program to leverage new and existing wireless resources to maintain and expand a statewide interoperable wireless communication system for emergency responders and Arkansas public service entities. There are currently over 28 thousand AWIN users consisting of law enforcement, fire, first responders, and other emergency services at the municipal, county, state, and federal levels. This major initiative continues through 2016. Arkansas Scholarship Lottery: With the purpose to help build an educated and capable population, the voters passed an amendment to the Arkansas Constitution in November 2008, authorizing the legislature to establish a lottery. The net proceeds of the lottery would be used to fund scholarships for Arkansas
ix
students to in-state two-year and four-year higher education institutions. Subsequently, Acts 605 and 606 of the 87th General Assembly established the Arkansas Lottery Commission (ALC) for the purpose of establishing, operating and regulating State lotteries. The ALC was charged with overseeing the lottery operations of the State. The ALC consisted of nine members with three members appointed by each of the following: the Governor, the Speaker of the House of Representatives, and the President Pro Tempore of the Senate. The lottery also operates using its other legal (DBA) entity name of Arkansas Scholarship Lottery. The ALC commenced sales of instant scratch-off tickets on September 28, 2009, Powerball® on October 31, 2009, Cash 3 on December 14, 2009, Mega Millions® on January 31, 2010, Cash 4 on July 12, 2010, Arkansas Million Dollar Raffle on July 14, 2010, Fast Play games on October 25, 2010, Decades of Dollars on May 3, 2011, Arkansas 50/50 Raffle on October 1, 2011, Natural State Jackpot on August 27, 2012; Arkansas Million Dollar Raffle was re-introduced on September 1, 2013, Monopoly Millionaires’ Club™ on October 19, 2014, and Lucky for Life commenced sales on January 27, 2015. During the 90th General Assembly, Act 218 of 2015, which became effective on February 26, 2015, was enacted. Act 218 eliminated the Arkansas Lottery Commission and established the lottery as the Office of the Arkansas Lottery (OAL) under the Administrative Services division of the Arkansas Department of Finance and Administration. For the year ended June 30, 2015, OAL had operating revenues of $409.2 million, paid gaming prizes of $280.5 million, paid selling commissions to Arkansas retailers of $23.3 million and provided $72.6 million in scholarship funds, after payment of other lottery expenses. Health: Working in an ever-changing landscape, the Arkansas Department of Health (ADH) continues its mission to protect the health and well-being of all Arkansans. Even though improved public health conditions and advances made in modern medicine have eliminated many of the threats from days gone by, those problems have been replaced by new challenges that pose major obstacles to healthy living in today’s world. Numbered among the significant health challenges before Arkansans are the obesity epidemic, tobacco use, teen pregnancy, poor dental health, high infant mortality, abuse and misuse of prescription drugs, injuries, and poor health literacy. Dedicated public health professionals working in a variety of scientifically-based disciplines are already addressing these problems. Arkansas’s public health workforce is working every day at the local level through a statewide service network to provide prevention services and to address threats to the public’s health. For instance, placing high risk pregnant mothers and infants in the right birthing facility for delivery and care is an important way to reduce infant and maternal morbidity and mortality and improve birth outcomes. ADH has worked as part of the Arkansas Perinatal Regionalization Committee to develop levels of care that indicate the type of services birthing hospitals are best able to provide. The recent Ebola virus outbreak and other new and emerging infectious diseases are why ADH has an ‘always on’ surveillance, investigation, and control system. Information received through reporting and surveillance programs help monitor disease trends and identify groups that may be at high risk for illness. This ensures that ADH is ready to quickly and appropriately respond to threats to the public’s health. ADH has been working closely with health care providers, hospitals, emergency medical services, and other partners to prepare for the possibility of Ebola or any other serious communicable disease entering our state. In the spring of 2015, ADH received an additional $4.9 million in grant funds from the Centers for Disease Control and Prevention (CDC) for these efforts. The agency is assisting designated hospitals and health care professionals across the State to develop the capacity to assess and treat patients with the Ebola virus. The department is also developing communication networks among healthcare providers to aid in information sharing, as well as assessing the capabilities of ADH health units to address the possibility of a patient arriving with a highly infectious disease such as the Ebola virus. Additionally, ADH is working to ensure that health units have appropriate equipment, supplies and training and providing educational assistance to workers both at the ADH and in the private sector to ensure that they are adequately protected from exposures to highly infectious disease such as Ebola. ADH is ready to rapidly identify, assess, and properly manage any potential threats. This is core public health and what ADH does every day.
x
Just as the advances of the first century of the department were not made without the cooperative efforts of many other dedicated health professionals, ADH knows that all of the State’s health problems will not be solved by one individual or group. ADH continuously collaborates with a wide variety of partners in the public and private sectors to address the health problems facing Arkansans. As an example, ADH was awarded a Garrett Lee Smith State and Tribal Suicide Prevention Grant, with $3.7 million in federal funding over five years, to focus on youth suicide prevention with the help of key stakeholders. AWARDS AND ACKNOWLEDGEMENTS The Government Finance Officers Association of the United States and Canada (GFOA) awarded a Certificate of Achievement for Excellence in Financial Reporting to the State for its CAFR for the fiscal year ended June 30, 2014. This was the seventeenth year that the State has achieved this prestigious award. In order to be awarded a Certificate of Achievement, a government unit must publish an easily readable and efficiently organized CAFR. The report must satisfy both accounting principles generally accepted in the United States of America and applicable legal requirements. The Certificate of Achievement is valid for a period of one year. Governor Asa Hutchinson, by making fiscal responsibility a top priority, has provided excellent leadership in the accurate and timely financial reporting by the State. His administration has developed policies and acquired the resources necessary to ensure strict compliance with the reporting requirements of the entities that govern financial reporting for governments. The information generated by and distributed through the State’s reporting structure is used by the General Assembly and other decision makers within the State. The level of detail and degree of accuracy with which information in this report is presented would not be possible without the time and efforts of dedicated staff of all state agencies that provide their financial packages on a timely basis. Their efforts are appreciated by all of the people responsible for preparing the CAFR.
xi
O
rganizational Chart
xii
CITIZENS
Executive Branch Legislative Branch Judicial Branch
Lieutenant Governor Senate House of
Representatives Supreme Court
Court of Appeals
Administrative Office of the
Courts
Judicial Discipline and
Disability Commission
Constitutional Branch
Attorney General
Auditor of State
Land Commissioner
Secretary of State
Treasurer of State
Arkansas Economic
Development Commission
Department of Labor
Department of Workforce
Services
Department of Education
Department of Higher
Education
Department of Career
Education
Department of Environmental
Quality
Department of Emergency
Management
Arkansas Building
Authority
Arkansas State Police
Department of Human Services
Department of Correction
Department of Community Correction
Legislative Audit
Legislative Research
Constitutional Offices
Game and Fish Commission
Highway and Transportation
Department
Governor
Department of Health
Department of Information
Services
Department of Agriculture
Department of Finance and
Administration
Department of Parks and Tourism
Department of Arkansas Heritage
Separate Agencies
Boards and Commissions
Medicaid Inspector General
xiii
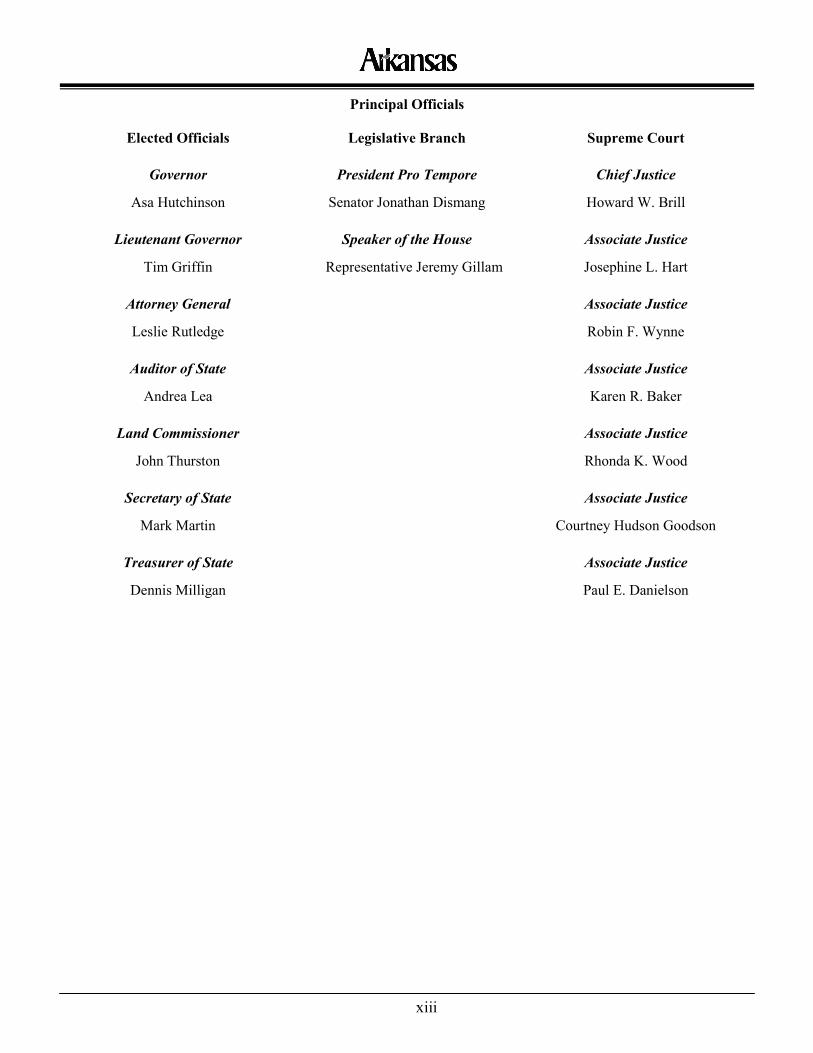
Principal Officials
Elected Officials Legislative Branch Supreme Court
Governor President Pro Tempore Chief Justice Asa Hutchinson Senator Jonathan Dismang Howard W. Brill
Lieutenant Governor Speaker of the House Associate Justice Tim Griffin Representative Jeremy Gillam Josephine L. Hart
Attorney General Associate Justice Leslie Rutledge Robin F. Wynne
Auditor of State Associate Justice Andrea Lea Karen R. Baker
Land Commissioner Associate Justice John Thurston Rhonda K. Wood
Secretary of State Associate Justice Mark Martin Courtney Hudson Goodson
Treasurer of State Associate Justice Dennis Milligan Paul E. Danielson


Financial Section

500 WOODLANE STREET, SUITE 172 • LITTLE ROCK, ARKANSAS 72201-1099 • PHONE: (501) 683-8600 • FAX: (501) 683-8605 www.arklegaudit.gov
Independent Auditor’s Report The Honorable Asa Hutchinson, Governor and Members of the Legislative Joint Auditing Committee State of Arkansas: Report on the Financial Statements We have audited the accompanying financial statements of the governmental activities, the business-type activities, the aggregate discretely presented component units, each major fund, and the aggregate remaining fund information of the State of Arkansas (the State), as of and for the year ended June 30, 2015, and the related notes to the financial statements, which collectively comprise the State’s basic financial statements as listed in the table of contents. Management’s Responsibility for the Financial Statements Management is responsible for the preparation and fair presentation of these financial statements in accordance with accounting principles generally accepted in the United States of America; this includes the design, implementation, and maintenance of internal control relevant to the preparation and fair presentation of financial statements that are free from material misstatement, whether due to fraud or error. Auditor’s Responsibility Our responsibility is to express opinions on these financial statements based on our audit. We did not audit the financial statements of:
♦ The discretely presented component units, which represent 100% of the assets and revenues of the aggregate discretely presented component units opinion unit.
♦ The University of Arkansas for Medical Sciences, a portion of the Higher Education Fund, which represents 15% of the assets and 32% of the revenues of the business-type activities opinion unit and 18% of the assets and 48% of the revenues of the Higher Education major enterprise fund opinion unit.
♦ The Department of Workforce Services (Administrative), a portion of the General Fund, which represents less than 1% of the assets and 1% of the revenues of the governmental activities opinion unit and 1% of the assets and 1% of the revenues of the General Fund opinion unit.
♦ The Department of Workforce Services (Unemployment Insurance Fund), a major enterprise fund, which represents 6% of the assets and 10% of the revenues of the business-type activities opinion unit and 100% of the assets and revenues of the Department of Workforce Services major enterprise fund opinion unit.
♦ The Construction Assistance Revolving Loan Fund or the Other Revolving Loan Funds (non-major enterprise funds) which, on a combined basis, represent 8% of the assets and 1% of the revenues of the business-type activities opinion unit and 2% of the assets and 1% of the revenues of the aggregate remaining fund information opinion unit.
2
Those financial statements were audited by other auditors, whose reports have been furnished to us, and our opinions, insofar as they relate to the amounts included for the aforementioned funds and entities, are based solely on the reports of the other auditors. We conducted our audit in accordance with auditing standards generally accepted in the United States of America and the standards applicable to financial audits contained in Government Auditing Standards, issued by the Comptroller General of the United States. Those standards require that we plan and perform the audit to obtain reasonable assurance about whether the financial statements are free from material misstatement. The financial statements of the University of Arkansas Foundation, Inc. and the University of Arkansas Fayetteville Campus Foundation, Inc. (discretely presented component units) were not audited in accordance with Government Auditing Standards. An audit involves performing procedures to obtain audit evidence about the amounts and disclosures in the financial statements. The procedures selected depend on the auditor’s judgment, including the assessment of the risks of material misstatement of the financial statements, whether due to fraud or error. In making those risk assessments, the auditor considers internal control relevant to the entity’s preparation and fair presentation of the financial statements in order to design audit procedures that are appropriate in the circumstances, but not for the purpose of expressing an opinion on the effectiveness of the entity’s internal control. Accordingly, we express no such opinion. An audit also includes evaluating the appropriateness of accounting policies used and the reasonableness of significant accounting estimates made by management, as well as evaluating the overall presentation of the financial statements. We believe that the audit evidence we have obtained is sufficient and appropriate to provide a basis for our audit opinions. Opinions In our opinion, based on our audit and the reports of other auditors, the financial statements referred to above present fairly, in all material respects, the respective financial position of the governmental activities, the business-type activities, the aggregate discretely presented component units, each major fund, and the aggregate remaining fund information of the State of Arkansas, as of June 30, 2015, and the respective changes in financial position and, where applicable, cash flows thereof for the year then ended in accordance with accounting principles generally accepted in the United States of America. Emphasis of Matter As discussed in Note 1 (d) to the financial statements, in fiscal year 2015 the State adopted new accounting guidance, Governmental Accounting Standards Board Statement No. 68, Accounting and Financial Reporting for Pensions, by restating beginning net position. Our opinion is not modified with respect to this matter. Other Matters Required Supplementary Information Accounting principles generally accepted in the United States of America require that the management’s discussion and analysis and required supplementary information, listed in the accompanying table of contents, be presented to supplement the basic financial statements. Such information, although not a part of the basic financial statements, is required by the Governmental Accounting Standards Board who considers it to be an essential part of financial reporting for placing the basic financial statements in an appropriate operational, economic, or historical context. We and the other auditors have applied certain limited procedures to the required supplementary information in accordance with auditing standards generally accepted in the United States of America, which consisted of inquiries of management about the methods of preparing the information and comparing the information for consistency with management’s responses to our inquiries, the basic financial statements, and other knowledge we obtained during our audit of the basic financial statements. We do not express an opinion or provide any assurance on the information because the limited procedures do not provide us with sufficient evidence to express an opinion or provide any assurance.
3
Other Information Our audit was conducted for the purpose of forming opinions on the financial statements that collectively comprise the State of Arkansas’s basic financial statements. The combining financial statements, introductory section, and statistical section are presented for purposes of additional analysis and are not a required part of the basic financial statements. The combining financial statements are the responsibility of management and were derived from and relate directly to the underlying accounting and other records used to prepare the basic financial statements. Such information has been subjected to the auditing procedures applied in the audit of the basic financial statements and certain additional procedures, including comparing and reconciling such information directly to the underlying accounting and other records used to prepare the basic financial statements or to the basic financial statements themselves, and other additional procedures in accordance with auditing standards generally accepted in the United States of America by us and other auditors. In our opinion, based on our audit, the procedures performed as described above, and the reports of the other auditors, the combining financial statements are fairly stated, in all material respects, in relation to the basic financial statements taken as a whole. The introductory section and statistical section have not been subjected to the auditing procedures applied in the audit of the basic financial statements, and accordingly, we do not express an opinion or provide any assurance on them. Other Reporting Required by Government Auditing Standards In accordance with Government Auditing Standards, we have also issued our report dated December 31, 2015, on our consideration of the State of Arkansas’s internal control over financial reporting and on our tests of its compliance with certain provisions of laws, regulations, contracts, and grant agreements and other matters. That report will be issued under separate cover in the State of Arkansas Single Audit Report. The purpose of that report is to describe the scope of our testing of internal control over financial reporting and compliance and the results of that testing, and not to provide an opinion on internal control over financial reporting or on compliance. That report, upon its issuance, is an integral part of an audit performed in accordance with Government Auditing Standards in considering the State of Arkansas’s internal control over financial reporting and compliance. DIVISION OF LEGISLATIVE AUDIT
Roger A. Norman, JD, CPA, CFE, CFF Legislative Auditor Little Rock, Arkansas December 31, 2015 CAFR00115


Management’s Discussion and Analysis

5
MANAGEMENT’S DISCUSSION AND ANALYSIS (Introduction) Management of the State of Arkansas (the State) provides this Management’s Discussion and Analysis (MD&A) of the State’s Comprehensive Annual Financial Report (CAFR) for readers of the State’s financial statements. This narrative, overview and analysis of the financial activities of the State are for the year ended June 30, 2015. The State’s June 30, 2015, financial statements received an unmodified opinion (see Independent Auditors’ Report for more information). We believe that the State is making great strides in building a reporting structure that will produce more timely and accurate financial statements in the future. Management has aggressively addressed audit areas of concern by adding professional accounting staff, strengthening internal control, training agency staff, and by further defining processes and implementing additional policies and procedures. We encourage readers to consider this information in conjunction with the additional information that is furnished in the letter of transmittal that can be found preceding this narrative and with the State’s financial statements that follow this narrative. The first section of the MD&A is intended to familiarize readers with the accounting terminology and methods relevant to reporting financial information for the State. The second section of the MD&A is a summary of financial and statistical information that should be more meaningful because the readers have been exposed to the accounting terminology and methods used by the State. FINANCIAL HIGHLIGHTS Government-Wide Highlights Net Position – Primary Government may serve over time as a useful indicator of a government’s financial position. The assets and deferred outflows of resources of the State exceeded its liabilities and deferred inflows of resources for the year ended June 30, 2015, by $14.8 billion (presented as “Total net position”). The net position of the State increased by $856.3 million during the year. The governmental activities net position increased by $595.9 million and the business-type activities increased by $260.4 million. Of the total net position, $12.4 billion (83.9%), reflects its investment in capital assets such as land, buildings, equipment, intangibles and infrastructure (road, bridges and other immovable assets), less any related outstanding debt used to acquire these assets. An additional portion of the State’s net position, $2.7 billion (18.1%), represents resources that are subject to restrictions on how they may be used and are therefore termed “restricted.” The remaining net position considered as unrestricted was negative $293.0 million. This is primarily due to the State’s net pension liability recorded in accordance with Governmental Accounting Standards Board GASB Statement No. 68 and the increase in other post-employment benefit obligations. Long-term debt payable for bonds, capital leases and notes as of June 30, 2015, was $4.1 billion. Additional debt totaling $1.0 billion was entered into during the year. $390.0 million of that increase was attributable to increases in college and university revenue bonds, $206.5 million of that increase was attributable to the General Obligation Four-Lane Highway Construction and Improvement Bonds, $125.9 million of that increase was attributable to the Higher Education General Obligation Bonds and $124.4 million of that increase was attributable to the General Obligation Amendment 82 Bonds. Fund Highlights As of the close of business on June 30, 2015, the State’s General Fund reported a fund balance of $4.1 billion. Of this balance, $124.8 million (3.1%) of the total fund balance is nonspendable, $1.4 billion (34.7%) of the total fund balance is restricted, $1.5 billion (35.7%) of the total fund balance is committed, $267.3 million (6.6%) of the total fund balance is assigned and $811.3 million (19.9%) of the total fund balance is unassigned as required by GASB Statement 54, Fund Balance Reporting and Governmental Fund Type Definitions. The fund balance in the General Fund increased $357.6 million during the year.
6
OVERVIEW OF THE FINANCIAL STATEMENTS This discussion and analysis is intended to serve as an introduction to the detailed financial information contained within the State’s CAFR. The State’s basic financial statements include Government-Wide Financial Statements, Fund Financial Statements, Notes to the Financial Statements and Required Supplementary Information. The components of the basic financial statements and the supplemental information are described below. Basic Financial Statements Government-Wide Financial Statements provide a broad view of the State’s operations in a manner similar to a private sector business. The statements provide both short-term and long-term information about the State’s financial position, which assists in assessing the State’s economic condition at June 30, 2015. The government-wide financial statements are prepared using the full accrual basis of accounting. This basically means methods used are similar to the methods used by most businesses. All assets, deferred outflows of resources, liabilities, deferred inflow of resources, revenues and expenses associated with the year ended June 30, 2015, are accounted for, even if the cash involved was not received or paid by June 30, 2015. These statements include the Statement of Net Position and the Statement of Activities.
The Statement of Net Position presents all of the government’s assets and liabilities; the difference between the assets and liabilities is reported as “net position.” Over time, increases or decreases in the State’s net position may serve as a useful indicator of whether the overall financial position of the State is improving.
The Statement of Activities presents information showing how the State’s net position changed during the most recent year ended June 30, 2015, and a comparison between program revenues and direct expenses for each function of the State.
The Statement of Net Position and the Statement of Activities have separate sections for the three different types of State programs or activities: governmental activities, business-type activities and discretely presented component units.
Governmental activities are primarily supported by taxes and intergovernmental revenues, also known as federal grants. Most services normally associated with State government fall into this category and include Education (elementary and secondary); Health and human services; Transportation; Law, justice and public safety; Recreation and resources development; General government; and Regulation of business and professionals.
Business-type activities are the functions that operate more like those of commercial enterprises. These activities normally intend to recover all or a significant portion of their costs through user fees and charges to external users of goods and services and operate with minimal assistance from the governmental activities of the State. The business-type activities of the State include Higher Education, Workers’ Compensation Commission, Department of Workforce Services, Office of the Arkansas Lottery, War Memorial Stadium Commission, Public School Employee Health and Life Benefit Plan, Construction Assistance Revolving Loan Fund and Other Revolving Loan Funds.
Discretely presented component units are legally separate organizations established for a specific purpose and managed independently with their powers generally vested in a governing board. Discretely presented component units are financially accountable to the State and include Arkansas Student Loan Authority (ASLA), Arkansas Development
7
Finance Authority (ADFA), The University of Arkansas Foundation, Inc. and The University of Arkansas Fayetteville Campus Foundation, Inc. Complete financial statements of ASLA, ADFA, The University of Arkansas Foundation, Inc. and The University of Arkansas Fayetteville Campus Foundation, Inc. can be obtained from their administrative offices. Addresses and other additional information about the State’s component units are presented in the notes to the financial statements.
Fund Financial Statements focus on individual parts of state government and report the State’s operations in more detail than the government-wide financial statements. A fund is a grouping of related accounts that is used to maintain control over resources that have been segregated for specific activities or objectives. The State of Arkansas, like other state and local governments, uses fund accounting to ensure and demonstrate compliance with finance-related legal requirements. All of the funds of the State can be divided into three categories: Governmental Funds, Proprietary Funds and Fiduciary Funds.
Governmental Fund Financial Statements are used to show essentially the same functions reported as governmental activities in the government-wide financial statements. However, the focus of the governmental fund financial statements is the short-term information about the State’s financial position rather than both short-term and long-term information that is the focus of the government-wide financial statements. Therefore, the governmental fund financial statements are prepared on the modified-accrual basis of accounting as compared to the full accrual basis of accounting used for the government-wide financial statements. The governmental fund financial statements include a balance sheet and a statement of revenues, expenditures and changes in fund balance. The State of Arkansas has one governmental fund, which is the General Fund. Reconciliation is provided that facilitates a comparison of the financial statements for the General Fund with the government-wide financial statements and can be found on the pages immediately following the governmental fund financial statements. Proprietary Funds’ Financial Statements are used to show the activities of the State that operate more like those of a commercial business, essentially the same functions reported as business-type activities. Proprietary funds charge fees for services provided to outside customers, including local governments. Proprietary funds report the same type of information as the government-wide financial statements. However, the proprietary funds’ financial statements report the fund net position and the revenues, expenses and changes in fund net position for each significant proprietary fund rather than report a combined amount of all the proprietary funds as is done for the government-wide financial statements. Proprietary fund financial statements, like the government-wide financial statements, use the full accrual basis of accounting. Therefore, reconciliation is not necessary for the information contained in the government-wide financial statements and the proprietary fund financial statements. The State of Arkansas has eight proprietary funds: the Higher Education Fund, the Workers’ Compensation Commission, the Department of Workforce Services, the Office of the Arkansas Lottery, the War Memorial Stadium Commission, the Public School Employee Health and Life Benefit Plan, the Construction Assistance Revolving Loan Fund and other Revolving Loan Funds (Safe Drinking Water, Community/Technical College, Employer Assisted Home Energy Assistance Loan Program, Assisted Living Incentive, Industrial Energy Technology, Venture Capital Investment Trust Fund, Energy Efficient and Conservation Block Grant/Residential Loan Program and Arkansas Housing Trust).
8
Fiduciary Funds’ Financial Statements show the activity of the funds used to account for resources held for the benefit of parties outside state government. Fiduciary funds are not reflected in the government-wide financial statements because the resources of these funds are not available to support the State’s own programs. Fiduciary funds, like proprietary funds, use the full accrual basis of accounting. The State’s fiduciary funds include pension trust funds: Arkansas Public Employees Retirement Systems (which includes District Judges), Arkansas State Police Retirement System, Judicial Retirement System, Teacher Retirement System and State Highway Employees Retirement System and also the State Insurance Department agency funds and other agency funds.
Notes to the Financial Statements The notes to the financial statements provide additional information that is essential for a full understanding of the data provided in the government-wide and the fund financial statements. The notes to the financial statements can be found immediately following the fiduciary funds’ financial statements. Required Supplementary Information The basic financial statements are followed by a section of required supplementary information. This section includes schedules of pension and other post-employment benefits information, a schedule of 10-year claims development information for three public entity risk pools and a budgetary comparison schedule, which includes a reconciliation between the statutory expenditures for budgetary purposes and the expenditures for the General Fund as presented in the governmental fund financial statements. Combining Financial Statements The combining financial statements for proprietary funds and fiduciary funds are presented following the required supplementary information.
9
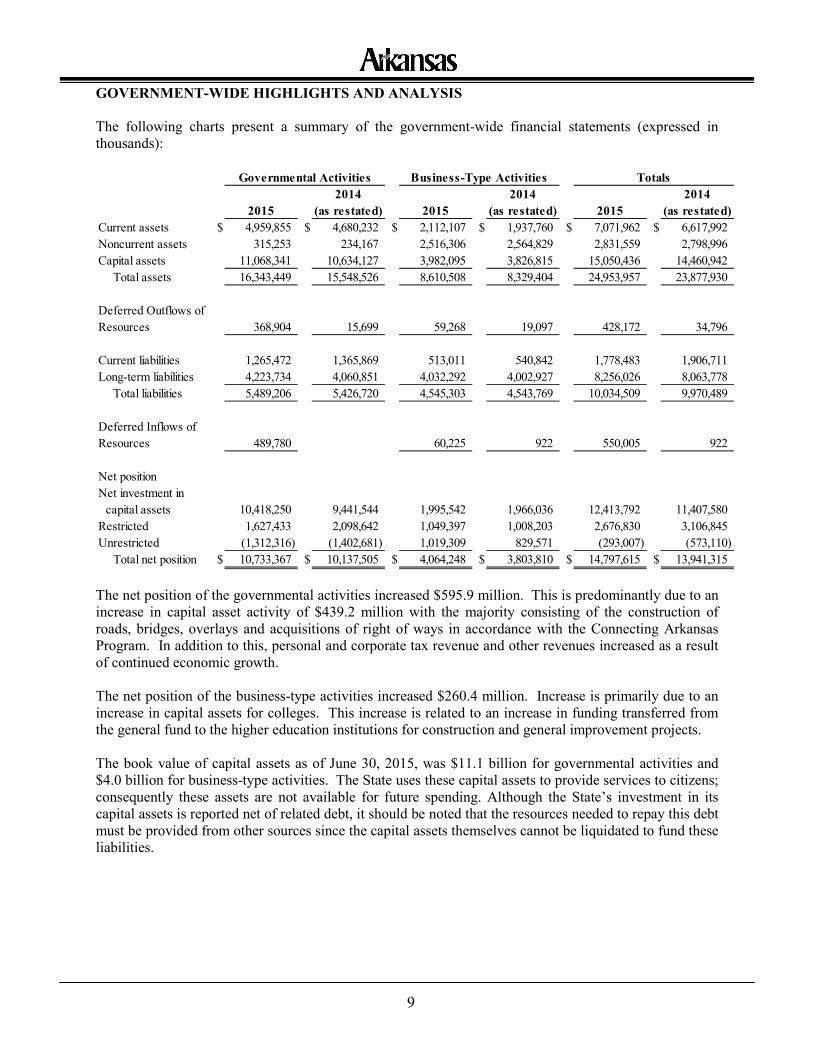
GOVERNMENT-WIDE HIGHLIGHTS AND ANALYSIS The following charts present a summary of the government-wide financial statements (expressed in thousands):
The net position of the governmental activities increased $595.9 million. This is predominantly due to an increase in capital asset activity of $439.2 million with the majority consisting of the construction of roads, bridges, overlays and acquisitions of right of ways in accordance with the Connecting Arkansas Program. In addition to this, personal and corporate tax revenue and other revenues increased as a result of continued economic growth. The net position of the business-type activities increased $260.4 million. Increase is primarily due to an increase in capital assets for colleges. This increase is related to an increase in funding transferred from the general fund to the higher education institutions for construction and general improvement projects. The book value of capital assets as of June 30, 2015, was $11.1 billion for governmental activities and $4.0 billion for business-type activities. The State uses these capital assets to provide services to citizens; consequently these assets are not available for future spending. Although the State’s investment in its capital assets is reported net of related debt, it should be noted that the resources needed to repay this debt must be provided from other sources since the capital assets themselves cannot be liquidated to fund these liabilities.
Governmental Activities Business-Type Activities Totals2014 2014 2014
2015 (as restated) 2015 (as restated) 2015 (as restated)Current assets $ 4,959,855 $ 4,680,232 $ 2,112,107 $ 1,937,760 $ 7,071,962 $ 6,617,992Noncurrent assets 315,253 234,167 2,516,306 2,564,829 2,831,559 2,798,996Capital assets 11,068,341 10,634,127 3,982,095 3,826,815 15,050,436 14,460,942
Total assets 16,343,449 15,548,526 8,610,508 8,329,404 24,953,957 23,877,930
Deferred Outflows of Resources 368,904 15,699 59,268 19,097 428,172 34,796
Current liabilities 1,265,472 1,365,869 513,011 540,842 1,778,483 1,906,711Long-term liabilities 4,223,734 4,060,851 4,032,292 4,002,927 8,256,026 8,063,778
Total liabilities 5,489,206 5,426,720 4,545,303 4,543,769 10,034,509 9,970,489
Deferred Inflows of Resources 489,780 60,225 922 550,005 922
Net positionNet investment in
capital assets 10,418,250 9,441,544 1,995,542 1,966,036 12,413,792 11,407,580Restricted 1,627,433 2,098,642 1,049,397 1,008,203 2,676,830 3,106,845Unrestricted (1,312,316) (1,402,681) 1,019,309 829,571 (293,007) (573,110)
Total net position $ 10,733,367 $ 10,137,505 $ 4,064,248 $ 3,803,810 $ 14,797,615 $ 13,941,315
10
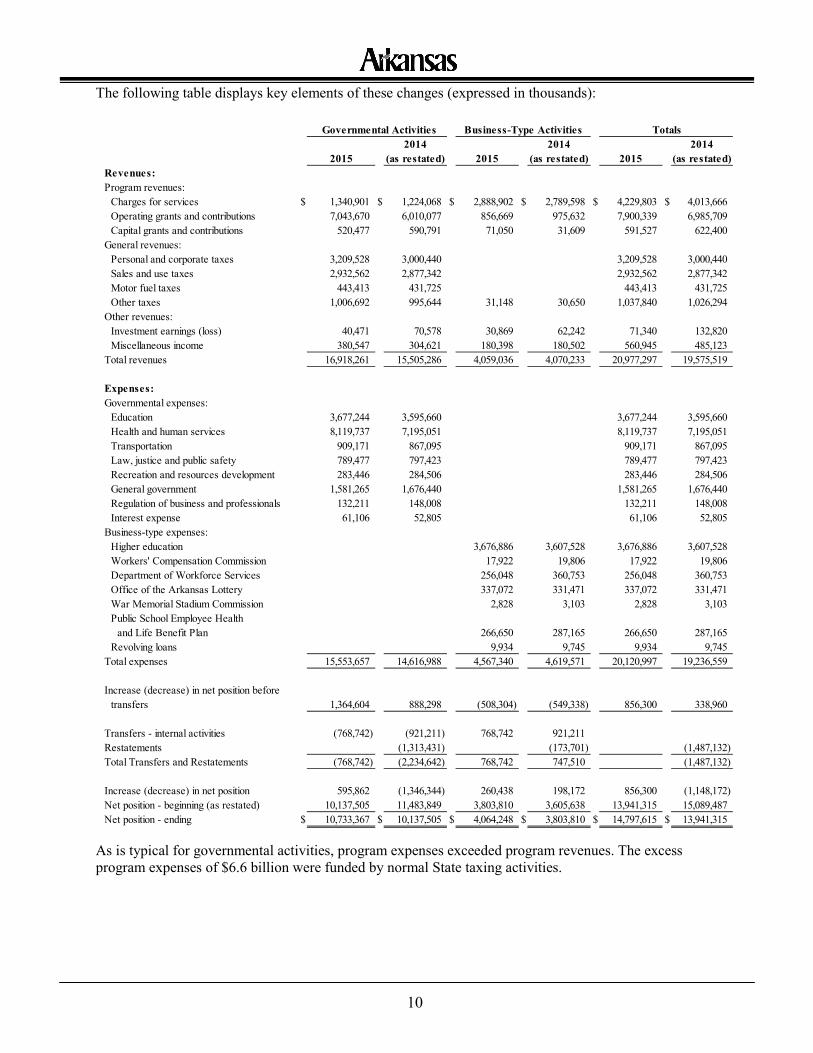
The following table displays key elements of these changes (expressed in thousands):
As is typical for governmental activities, program expenses exceeded program revenues. The excess program expenses of $6.6 billion were funded by normal State taxing activities.
Governmental Activities Business-Type Activities Totals2014 2014 2014
2015 (as restated) 2015 (as restated) 2015 (as restated)Revenues:Program revenues:
Charges for services $ 1,340,901 $ 1,224,068 $ 2,888,902 $ 2,789,598 $ 4,229,803 $ 4,013,666Operating grants and contributions 7,043,670 6,010,077 856,669 975,632 7,900,339 6,985,709Capital grants and contributions 520,477 590,791 71,050 31,609 591,527 622,400
General revenues:Personal and corporate taxes 3,209,528 3,000,440 3,209,528 3,000,440Sales and use taxes 2,932,562 2,877,342 2,932,562 2,877,342Motor fuel taxes 443,413 431,725 443,413 431,725Other taxes 1,006,692 995,644 31,148 30,650 1,037,840 1,026,294
Other revenues:Investment earnings (loss) 40,471 70,578 30,869 62,242 71,340 132,820Miscellaneous income 380,547 304,621 180,398 180,502 560,945 485,123
Total revenues 16,918,261 15,505,286 4,059,036 4,070,233 20,977,297 19,575,519
Expenses:Governmental expenses:
Education 3,677,244 3,595,660 3,677,244 3,595,660Health and human services 8,119,737 7,195,051 8,119,737 7,195,051Transportation 909,171 867,095 909,171 867,095Law, justice and public safety 789,477 797,423 789,477 797,423Recreation and resources development 283,446 284,506 283,446 284,506General government 1,581,265 1,676,440 1,581,265 1,676,440Regulation of business and professionals 132,211 148,008 132,211 148,008Interest expense 61,106 52,805 61,106 52,805
Business-type expenses:Higher education 3,676,886 3,607,528 3,676,886 3,607,528Workers' Compensation Commission 17,922 19,806 17,922 19,806Department of Workforce Services 256,048 360,753 256,048 360,753Office of the Arkansas Lottery 337,072 331,471 337,072 331,471War Memorial Stadium Commission 2,828 3,103 2,828 3,103Public School Employee Health
and Life Benefit Plan 266,650 287,165 266,650 287,165Revolving loans 9,934 9,745 9,934 9,745
Total expenses 15,553,657 14,616,988 4,567,340 4,619,571 20,120,997 19,236,559
Increase (decrease) in net position beforetransfers 1,364,604 888,298 (508,304) (549,338) 856,300 338,960
Transfers - internal activities (768,742) (921,211) 768,742 921,211Restatements (1,313,431) (173,701) (1,487,132)Total Transfers and Restatements (768,742) (2,234,642) 768,742 747,510 (1,487,132)
Increase (decrease) in net position 595,862 (1,346,344) 260,438 198,172 856,300 (1,148,172)Net position - beginning (as restated) 10,137,505 11,483,849 3,803,810 3,605,638 13,941,315 15,089,487Net position - ending $ 10,733,367 $ 10,137,505 $ 4,064,248 $ 3,803,810 $ 14,797,615 $ 13,941,315
11
FUND HIGHLIGHTS AND ANALYSIS
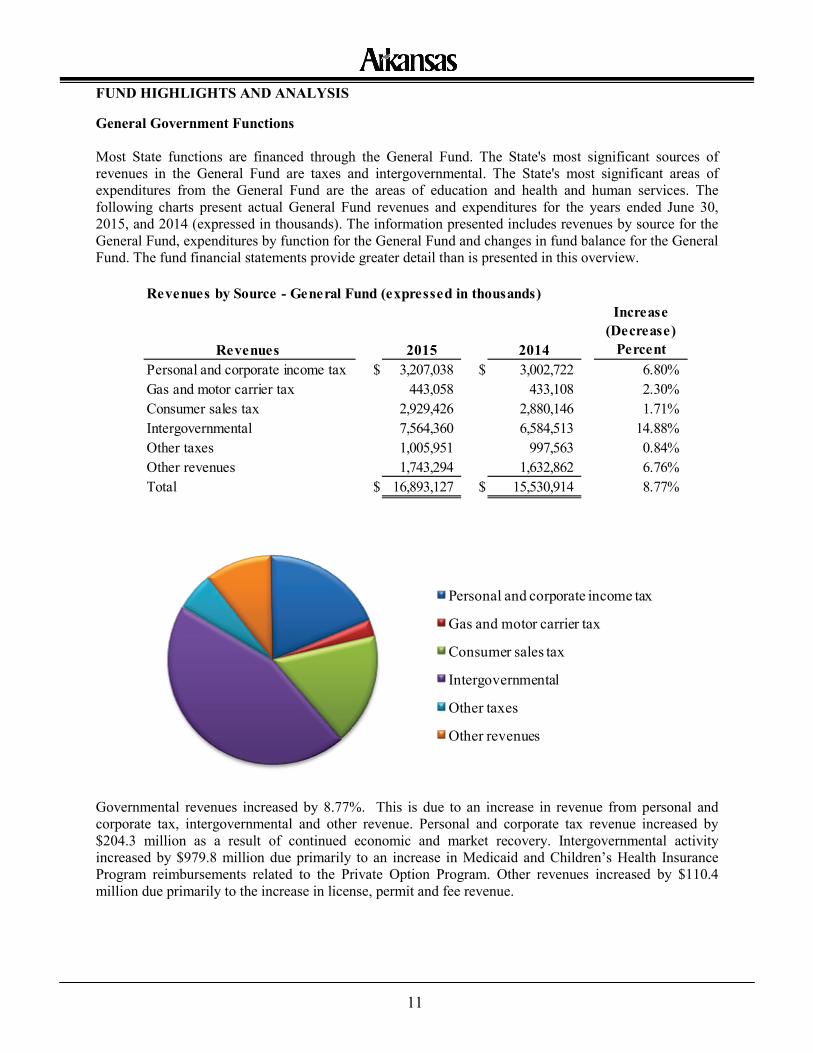
General Government Functions Most State functions are financed through the General Fund. The State's most significant sources of revenues in the General Fund are taxes and intergovernmental. The State's most significant areas of expenditures from the General Fund are the areas of education and health and human services. The following charts present actual General Fund revenues and expenditures for the years ended June 30, 2015, and 2014 (expressed in thousands). The information presented includes revenues by source for the General Fund, expenditures by function for the General Fund and changes in fund balance for the General Fund. The fund financial statements provide greater detail than is presented in this overview.
Governmental revenues increased by 8.77%. This is due to an increase in revenue from personal and corporate tax, intergovernmental and other revenue. Personal and corporate tax revenue increased by $204.3 million as a result of continued economic and market recovery. Intergovernmental activity increased by $979.8 million due primarily to an increase in Medicaid and Children’s Health Insurance Program reimbursements related to the Private Option Program. Other revenues increased by $110.4 million due primarily to the increase in license, permit and fee revenue.
Revenues by Source - General Fund (expressed in thousands)
Revenues 2015 2014
Increase (Decrease)
PercentPersonal and corporate income tax $ 3,207,038 $ 3,002,722 6.80%Gas and motor carrier tax 443,058 433,108 2.30%Consumer sales tax 2,929,426 2,880,146 1.71%Intergovernmental 7,564,360 6,584,513 14.88%Other taxes 1,005,951 997,563 0.84%Other revenues 1,743,294 1,632,862 6.76%Total $ 16,893,127 $ 15,530,914 8.77%
Personal and corporate income tax
Gas and motor carrier tax
Consumer sales tax
Intergovernmental
Other taxes
Other revenues
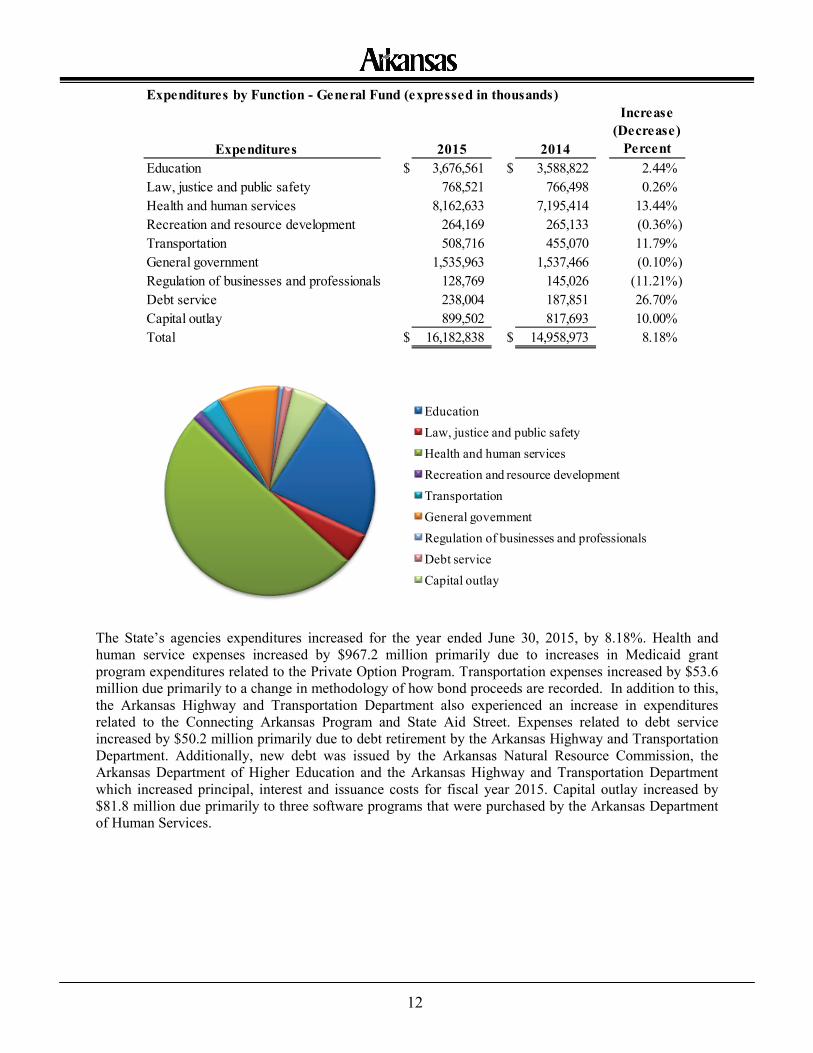
12
The State’s agencies expenditures increased for the year ended June 30, 2015, by 8.18%. Health and human service expenses increased by $967.2 million primarily due to increases in Medicaid grant program expenditures related to the Private Option Program. Transportation expenses increased by $53.6 million due primarily to a change in methodology of how bond proceeds are recorded. In addition to this, the Arkansas Highway and Transportation Department also experienced an increase in expenditures related to the Connecting Arkansas Program and State Aid Street. Expenses related to debt service increased by $50.2 million primarily due to debt retirement by the Arkansas Highway and Transportation Department. Additionally, new debt was issued by the Arkansas Natural Resource Commission, the Arkansas Department of Higher Education and the Arkansas Highway and Transportation Department which increased principal, interest and issuance costs for fiscal year 2015. Capital outlay increased by $81.8 million due primarily to three software programs that were purchased by the Arkansas Department of Human Services.
Expenditures by Function - General Fund (expressed in thousands)
Expenditures 2015 2014
Increase (Decrease)
PercentEducation $ 3,676,561 $ 3,588,822 2.44%Law, justice and public safety 768,521 766,498 0.26%Health and human services 8,162,633 7,195,414 13.44%Recreation and resource development 264,169 265,133 (0.36%)Transportation 508,716 455,070 11.79%General government 1,535,963 1,537,466 (0.10%)Regulation of businesses and professionals 128,769 145,026 (11.21%)Debt service 238,004 187,851 26.70%Capital outlay 899,502 817,693 10.00%Total $ 16,182,838 $ 14,958,973 8.18%
EducationLaw, justice and public safetyHealth and human servicesRecreation and resource developmentTransportationGeneral governmentRegulation of businesses and professionalsDebt serviceCapital outlay
13
Changes in Fund Balance – General Fund The focus of the State’s General Fund is to provide information on near-term inflows, outflows and balances of resources that can be spent. Such information is useful in assessing the State’s financing requirements. In particular, unassigned fund balance may serve as a useful measure of a government’s net resources available for spending at June 30, 2015. At June 30, 2015, the State’s General Fund reported an ending fund balance of $4.1 billion, which is an increase of $357.6 million in comparison to June 30, 2014. This increase is due primarily to an increase in bond proceeds related to the Federal Highway Grant Anticipation and Tax Revenue Bonds. In addition to this, personal and corporate tax revenue and other revenues increased as a result of continued economic growth. The classifications and amounts of fund balance were determined according to the provisions of GASB Statement No. 54, Fund Balance Reporting and Governmental Fund Type Definitions, which the State was required to implement for the year ended June 30, 2011. Note 1 provides an explanation of the various classifications. Fund balance consisted of the following:
• Nonspendable, $124.8 million or 3.1% • Restricted, $1.4 billion or 34.7% • Committed, $1.5 billion or 35.7% • Assigned, $267.3 million or 6.6% • Unassigned, $811.3 million or 19.9%
Capital Assets and Debt Administration Capital Assets The investment in capital assets includes land, buildings, improvements, equipment, intangibles, infrastructure and construction in progress. Infrastructure assets are items that are normally immovable and of value only to the State, such as roads, bridges, streets and sidewalks, drainage systems, lighting systems and similar items. The investment in capital assets for the governmental and business-type activities was $26.1 billion, and the accumulated depreciation was $11.1 billion at June 30, 2015. The net book value was $15.1 billion. Depreciation expense was $525.4 million for the governmental activities and $249.4 million for the business-type activities. Major capital asset events during the current year ended June 30, 2015, included the following:
• The Department of Human Services expended $89.3 million on various types of computer software and $2.6 million on cottage renovations.
• Arkansas Department of Veterans Affairs expended $1.1 million on the North Little Rock cemetery expansion and $1.3 on the North Little Rock Veterans’ Home construction.
• Arkansas Department of Correction expended $8.0 million on the North Central Unit Barracks expansion, Ester Unit renovation, Cummins poultry houses, East Arkansas Regional Unit vo-tech facility, Malvern Unit maintenance/vo-tech facility, Tucker Unit renovation and various improvements at the Tucker and Wrightsville Units.
• Arkansas Military Department spent $1.7 million on renovations to the Russellville and Lonoke Armories, $2.6 million on the Searcy field maintenance shop, $2.8 million for
14
Robinson Maneuver Training Center building and range renovations and $1.0 million on various building improvements.
• Arkansas Game and Fish Commission expended $4.1 million in land purchases that included the Robinwood Tract, Cypert Tract, Triple H Farms and the Jasper Elk Center; and $2.5 million on renovations to various Wildlife Management Areas.
• Arkansas Department of Parks and Tourism expended $9.1 million on improvements to various parks and $3.0 million on the construction of cabins and residences for parks.
• Arkansas Rehabilitative Services spent $6.7 million on the Arkansas Career Training Institute water system project and renovations to the former Army Reserve Center.
• Arkansas Department of Highway and Transportation constructed roads, bridges and overlays for $671.7 million and purchased right-of-ways for $18.9 million.
Additional information on the State’s capital assets can be found in Note 7 of the notes to the financial statements of this report. Debt Administration The State issues both general obligation bonds and revenue bonds. General obligation bonds are backed by the full faith and credit of the State. Revenue bonds are backed by a revenue source and restricted funds as specified in the bond resolution. Revenue bonds are generally designed to be self-supporting from the revenue source related to the program financed. Depending on the issuing entity, the State’s bonds are rated between Aaa and A1 by Moody’s Investor Service, with general obligation bonds generally rated Aa2. The Aa rating indicates very strong creditworthiness compared to similar issues. The bonds issued by the following agencies and organizations have not been rated: Henderson State University, Southern Arkansas University, Southern Arkansas University – Tech branch, East Arkansas Community College, Arkansas Northeastern College, Rich Mountain Community College, South Arkansas Community College, Black River Technical College, Ozarka College, Arkansas Tech University, and North Arkansas College. Governmental Activities The State’s governmental activities had $1.9 billion in bonds, notes payable and capital leases outstanding at June 30, 2015, versus $1.7 billion at June 30, 2014. The net increase is approximately $244.0 million. For year ended June 30, 2015, bonds payable had a net increase of $267.2 million. Principal payments on these bonds totaled $265.6 million. Capital leases to outside entities had a net decrease of $366 thousand. Notes payable, installment sales payable and capital leases to component units had a net decrease of $12.8 million during the year ended June 30, 2015. New debt resulted primarily from the issuance of revenue and general obligation bonds. The most significant increases are listed below:
• The Arkansas Highway and Transportation Department issued $206.5 million in tax exempt grant anticipation and tax revenue bonds, Series 2014, for interstate reconstruction and rehabilitation.
• The Arkansas Natural Resource Commission issued $40.0 million in taxable general obligation bonds, Series 2014A and Series 2014B, for the development of water, waste disposal, pollution control, abatement and prevention, drainage, irrigation, flood control and wetland and aquatic resources.
• The Arkansas Department of Higher Education issued $125.9 million in tax exempt revenue refunding bonds, Series 2015, to refund Series 2007B Bonds.
15
• The Arkansas Economic Development Commission issued $74.4 million in taxable revenue bonds, Series 2014A, to provide financing for the site preparation for the Big River Steel Manufacturing facility and $50.0 million in taxable revenue bonds, Series 2014B, to provide financing for the operating equipment for the Big River Steel Manufacturing facility.
The State’s governmental activities had approximately $227.1 million of claims and judgments outstanding at June 30, 2015, compared to $242.5 million at June 30, 2014. Other obligations include $143.3 million for accrued sick leave and vacation pay and $41.1 million for pollution remediation at June 30, 2015. The State’s governmental activities also had $1.0 billion recorded for net other postemployment benefits obligations at June 30, 2015. Business-type Activities The State’s business-type activities had $2.2 billion in bonds, notes payable and capital leases outstanding at June 30, 2015, and $2.1 billion at June 30, 2014. The net increase was approximately $28.0 million. New debt resulted primarily from the issuance of revenue and general obligation bonds. Although there were increases in bonds, notes payable and capital leases, the most significant increases are listed below:
• The Henderson State University issued $33.0 million in tax exempt revenue bonds, Series 2014, to construct and renovate student housing facilities and sport facilities; $3.8 million in tax exempt revenue refunding bonds, Series 2015, to refund Series 2009 Bonds; $6.5 million in Qualified Energy Conservation Bonds, Series 2015A and $3.6 million in Educational Facilities Energy Conservation Bonds, Series 2015B.
• The Arkansas State University Beebe campus issued $1.9 million in taxable revenue refunding bonds, Series 2015A, to refund Series 2005 Bonds; $9.2 million in tax exempt revenue refunding bonds, Series 2015B, to refund Series 2006 Bonds; $8.0 million in tax exempt revenue refunding bonds, Series 2015 (Beebe Campus), to refund Series 2010 Bonds and $12.9 million in tax exempt revenue refunding bonds, Series 2015 (Beebe-Heber Springs Campus), to refund Series 2005B Bonds.
• The University of Arkansas at Fayetteville issued $70.4 million in tax exempt revenue refunding bonds, Refunding Series 2015A, to refund various bonds and $14.2 million in tax exempt revenue refunding bonds, Series 2015A, to refund Series 2006 and Series 2011 Athletic Bonds.
• The Arkansas Tech University issued $16.3 million in tax exempt revenue refunding bonds, Series 2014A, to refund Series 2008, 2008B and 2009 Bonds; $6.0 million in tax exempt revenue bonds, Series 2014B, to construct and equip Allied Health Building and complete roofing projects and $11.0 million in tax exempt revenue refunding bonds, Series 2014, to refund Series 2006 and 2009 Bonds.
• The University of Arkansas Medical Sciences issued $86.0 million in tax exempt revenue refunding bonds, Series 2014, to refund Series 2006 Bonds.
• The University of Central Arkansas issued $17.5 million in tax exempt revenue bonds, Series 2015A and Series 2015B, for improvements to the Donaghey Hall; $13.5 million in tax exempt revenue bonds, Series 2014, for improvements to the Lewis Science Center; $18.2 million in tax exempt revenue refunding bonds, Series 2015, to refund Series 2006E and 2007B Bonds and $6.9 million in taxable auxiliary revenue refunding bonds, Series 2015, to refund Series 2006D and 2007 Bonds.
• The Southern Arkansas University issued $7.5 million in tax exempt revenue refunding bonds, Series 2015, to refund Series 2005A and 2009 and $10.0 million in tax exempt revenue bonds, Series 2014, to construct and renovate student housing facilities.
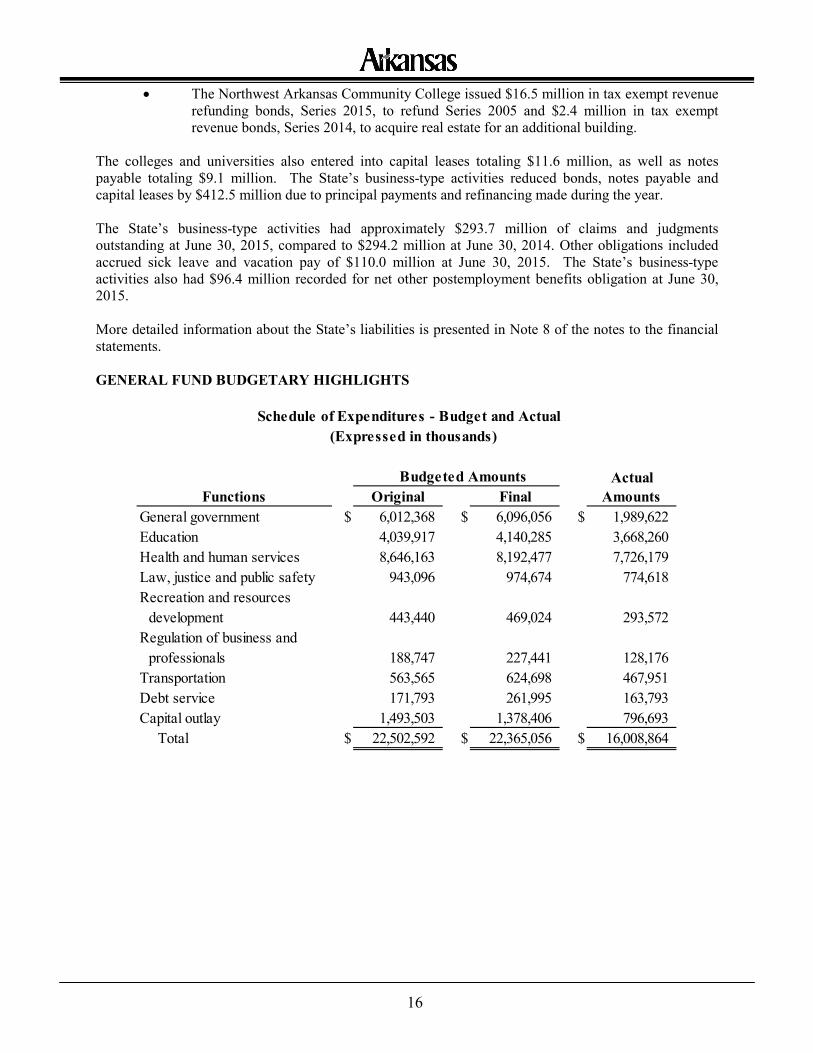
16
• The Northwest Arkansas Community College issued $16.5 million in tax exempt revenue refunding bonds, Series 2015, to refund Series 2005 and $2.4 million in tax exempt revenue bonds, Series 2014, to acquire real estate for an additional building.
The colleges and universities also entered into capital leases totaling $11.6 million, as well as notes payable totaling $9.1 million. The State’s business-type activities reduced bonds, notes payable and capital leases by $412.5 million due to principal payments and refinancing made during the year. The State’s business-type activities had approximately $293.7 million of claims and judgments outstanding at June 30, 2015, compared to $294.2 million at June 30, 2014. Other obligations included accrued sick leave and vacation pay of $110.0 million at June 30, 2015. The State’s business-type activities also had $96.4 million recorded for net other postemployment benefits obligation at June 30, 2015. More detailed information about the State’s liabilities is presented in Note 8 of the notes to the financial statements. GENERAL FUND BUDGETARY HIGHLIGHTS
Schedule of Expenditures - Budget and Actual(Expressed in thousands)
Budgeted AmountsFunctions Original Final
General government $ 6,012,368 $ 6,096,056 $ 1,989,622Education 4,039,917 4,140,285 3,668,260Health and human services 8,646,163 8,192,477 7,726,179Law, justice and public safety 943,096 974,674 774,618Recreation and resources
development 443,440 469,024 293,572Regulation of business and
professionals 188,747 227,441 128,176Transportation 563,565 624,698 467,951Debt service 171,793 261,995 163,793Capital outlay 1,493,503 1,378,406 796,693
Total $ 22,502,592 $ 22,365,056 $ 16,008,864
Actual Amounts
17
The amounts reported as budgeted reflect appropriations made by the General Assembly of the State. Appropriations made to programs and agencies are only maximum authorizations to spend. Actual expenditures are limited to the lesser of monies flowing into programs and agencies’ funds maintained by the State Treasurer or the maximum appropriation by the General Assembly. The significant variances between budgeted amounts and actual amounts are due to the appropriations exceeding available funding sources or delays in timing of expenditures. The original budget exceeded the final budget by $137.5 million. The increases in general government; education; law, justice and public safety; recreation and resource development and regulation of businesses and professionals were primarily due to unanticipated federal grants received by the State after the original budget was established. The decrease in health and human services was mainly due to the transfer of appropriation for the payment of benefits from a governmental fund to an enterprise fund. The increase in transportation was primarily due to an increase in expenditures related to the state aid road fund and the state aid street fund after the original budget was established. The increase in debt service was primarily due to new debt that required additional appropriation for debt service expenditures. REQUESTS FOR INFORMATION This financial report is designed to provide a general overview of the State of Arkansas’s finances for all of Arkansas’s citizens, taxpayers, customers, investors and creditors. This financial report seeks to demonstrate the State's accountability for the money it receives. Questions concerning any of the information provided in this report or requests for additional information should be addressed to: State of Arkansas, Department of Finance and Administration, PO Box 3278, Little Rock, Arkansas, 72203.


Basic Financial Statements
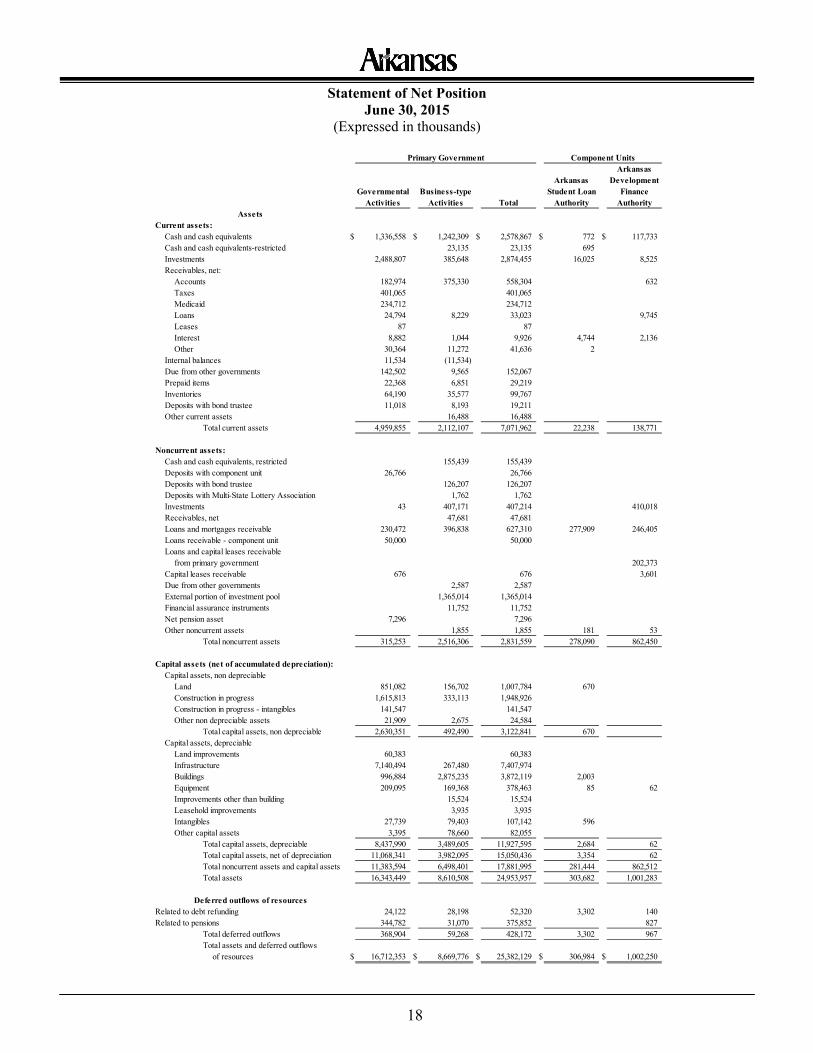
18
Statement of Net Position June 30, 2015
(Expressed in thousands)
Primary Government Component UnitsArkansas
Arkansas DevelopmentGovernmental Business-type Student Loan Finance
Activities Activities Total Authority Authority
Current assets:Cash and cash equivalents $ 1,336,558 $ 1,242,309 $ 2,578,867 $ 772 $ 117,733Cash and cash equivalents-restricted 23,135 23,135 695Investments 2,488,807 385,648 2,874,455 16,025 8,525Receivables, net:
Accounts 182,974 375,330 558,304 632Taxes 401,065 401,065Medicaid 234,712 234,712Loans 24,794 8,229 33,023 9,745Leases 87 87Interest 8,882 1,044 9,926 4,744 2,136Other 30,364 11,272 41,636 2
Internal balances 11,534 (11,534) Due from other governments 142,502 9,565 152,067Prepaid items 22,368 6,851 29,219Inventories 64,190 35,577 99,767Deposits with bond trustee 11,018 8,193 19,211Other current assets 16,488 16,488
Total current assets 4,959,855 2,112,107 7,071,962 22,238 138,771
Noncurrent assets:Cash and cash equivalents, restricted 155,439 155,439Deposits with component unit 26,766 26,766Deposits with bond trustee 126,207 126,207Deposits with Multi-State Lottery Association 1,762 1,762Investments 43 407,171 407,214 410,018Receivables, net 47,681 47,681Loans and mortgages receivable 230,472 396,838 627,310 277,909 246,405Loans receivable - component unit 50,000 50,000Loans and capital leases receivable
from primary government 202,373Capital leases receivable 676 676 3,601Due from other governments 2,587 2,587External portion of investment pool 1,365,014 1,365,014Financial assurance instruments 11,752 11,752Net pension asset 7,296 7,296Other noncurrent assets 1,855 1,855 181 53
Total noncurrent assets 315,253 2,516,306 2,831,559 278,090 862,450
Capital assets (net of accumulated depreciation):Capital assets, non depreciable
Land 851,082 156,702 1,007,784 670Construction in progress 1,615,813 333,113 1,948,926Construction in progress - intangibles 141,547 141,547Other non depreciable assets 21,909 2,675 24,584
Total capital assets, non depreciable 2,630,351 492,490 3,122,841 670Capital assets, depreciable
Land improvements 60,383 60,383Infrastructure 7,140,494 267,480 7,407,974Buildings 996,884 2,875,235 3,872,119 2,003Equipment 209,095 169,368 378,463 85 62 Improvements other than building 15,524 15,524Leasehold improvements 3,935 3,935Intangibles 27,739 79,403 107,142 596Other capital assets 3,395 78,660 82,055
Total capital assets, depreciable 8,437,990 3,489,605 11,927,595 2,684 62Total capital assets, net of depreciation 11,068,341 3,982,095 15,050,436 3,354 62Total noncurrent assets and capital assets 11,383,594 6,498,401 17,881,995 281,444 862,512Total assets 16,343,449 8,610,508 24,953,957 303,682 1,001,283
Related to debt refunding 24,122 28,198 52,320 3,302 140 Related to pensions 344,782 31,070 375,852 827
Total deferred outflows 368,904 59,268 428,172 3,302 967 Total assets and deferred outflows
of resources $ 16,712,353 $ 8,669,776 $ 25,382,129 $ 306,984 $ 1,002,250
Assets
Deferred outflows of resources
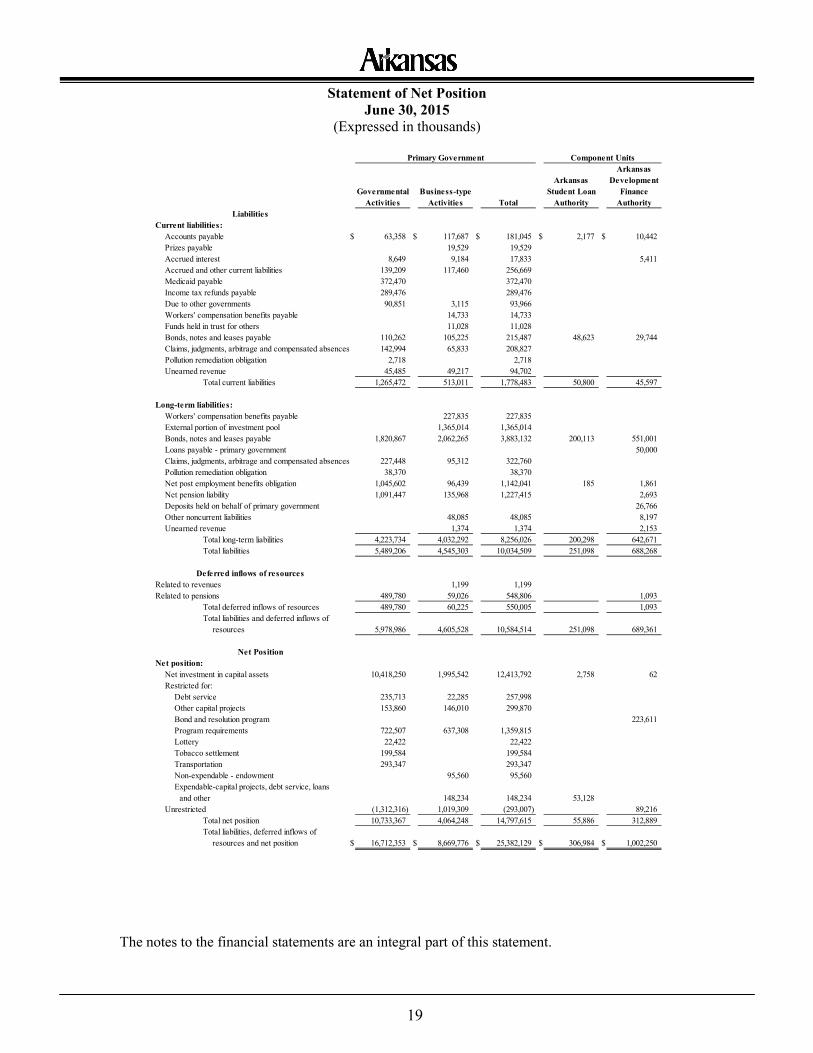
19
Statement of Net Position June 30, 2015
(Expressed in thousands)
Primary Government Component UnitsArkansas
Arkansas DevelopmentGovernmental Business-type Student Loan Finance
Activities Activities Total Authority Authority
Current liabilities:Accounts payable $ 63,358 $ 117,687 $ 181,045 $ 2,177 $ 10,442Prizes payable 19,529 19,529Accrued interest 8,649 9,184 17,833 5,411Accrued and other current liabilities 139,209 117,460 256,669Medicaid payable 372,470 372,470Income tax refunds payable 289,476 289,476Due to other governments 90,851 3,115 93,966Workers' compensation benefits payable 14,733 14,733Funds held in trust for others 11,028 11,028Bonds, notes and leases payable 110,262 105,225 215,487 48,623 29,744Claims, judgments, arbitrage and compensated absences 142,994 65,833 208,827Pollution remediation obligation 2,718 2,718Unearned revenue 45,485 49,217 94,702
Total current liabilities 1,265,472 513,011 1,778,483 50,800 45,597
Long-term liabilities:Workers' compensation benefits payable 227,835 227,835External portion of investment pool 1,365,014 1,365,014Bonds, notes and leases payable 1,820,867 2,062,265 3,883,132 200,113 551,001Loans payable - primary government 50,000Claims, judgments, arbitrage and compensated absences 227,448 95,312 322,760Pollution remediation obligation 38,370 38,370Net post employment benefits obligation 1,045,602 96,439 1,142,041 185 1,861Net pension liability 1,091,447 135,968 1,227,415 2,693Deposits held on behalf of primary government 26,766Other noncurrent liabilities 48,085 48,085 8,197Unearned revenue 1,374 1,374 2,153
Total long-term liabilities 4,223,734 4,032,292 8,256,026 200,298 642,671Total liabilities 5,489,206 4,545,303 10,034,509 251,098 688,268
Related to revenues 1,199 1,199Related to pensions 489,780 59,026 548,806 1,093
Total deferred inflows of resources 489,780 60,225 550,005 1,093Total liabilities and deferred inflows of
resources 5,978,986 4,605,528 10,584,514 251,098 689,361
Net PositionNet position:
Net investment in capital assets 10,418,250 1,995,542 12,413,792 2,758 62Restricted for: Debt service 235,713 22,285 257,998
Other capital projects 153,860 146,010 299,870 Bond and resolution program 223,611Program requirements 722,507 637,308 1,359,815 Lottery 22,422 22,422 Tobacco settlement 199,584 199,584 Transportation 293,347 293,347 Non-expendable - endowment 95,560 95,560 Expendable-capital projects, debt service, loans
and other 148,234 148,234 53,128Unrestricted (1,312,316) 1,019,309 (293,007) 89,216
Total net position 10,733,367 4,064,248 14,797,615 55,886 312,889Total liabilities, deferred inflows of
resources and net position $ 16,712,353 $ 8,669,776 $ 25,382,129 $ 306,984 $ 1,002,250
Liabilities
Deferred inflows of resources
The notes to the financial statements are an integral part of this statement.
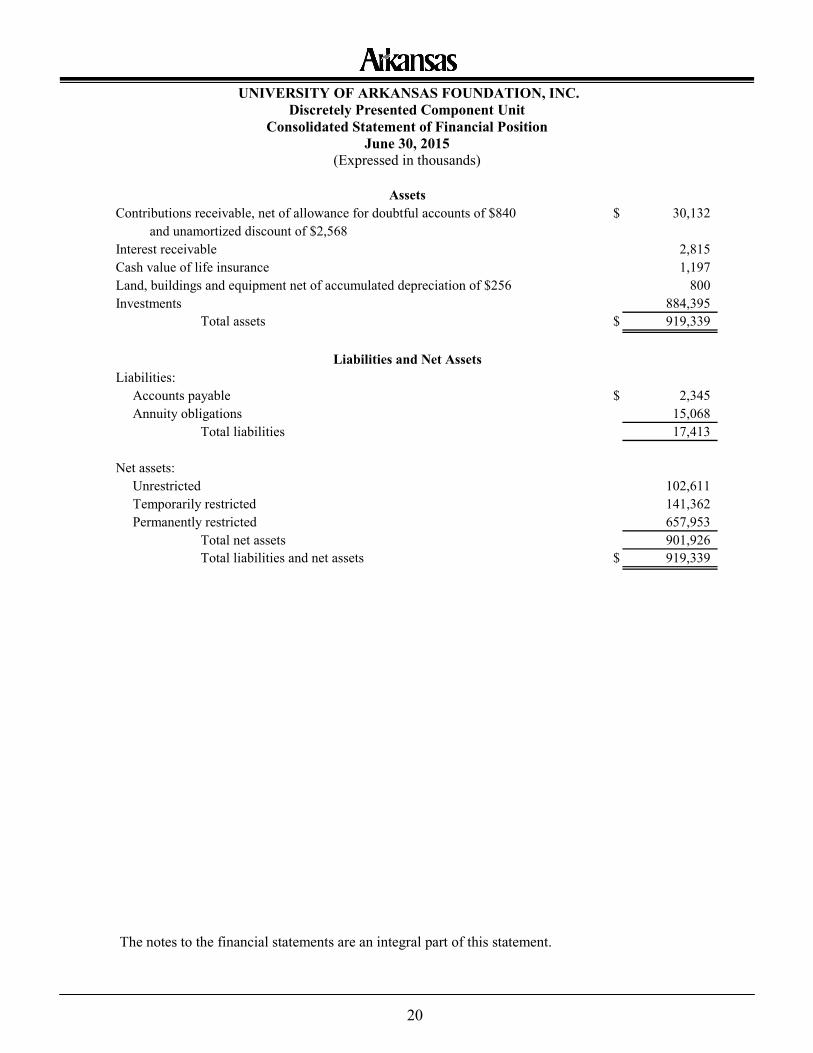
20
UNIVERSITY OF ARKANSAS FOUNDATION, INC. Discretely Presented Component Unit
Consolidated Statement of Financial Position June 30, 2015
(Expressed in thousands)
Contributions receivable, net of allowance for doubtful accounts of $840 $ 30,132and unamortized discount of $2,568
Interest receivable 2,815Cash value of life insurance 1,197Land, buildings and equipment net of accumulated depreciation of $256 800Investments 884,395
Total assets $ 919,339
Liabilities:Accounts payable $ 2,345Annuity obligations 15,068
Total liabilities 17,413
Net assets:Unrestricted 102,611Temporarily restricted 141,362Permanently restricted 657,953
Total net assets 901,926Total liabilities and net assets $ 919,339
Liabilities and Net Assets
Assets
The notes to the financial statements are an integral part of this statement.
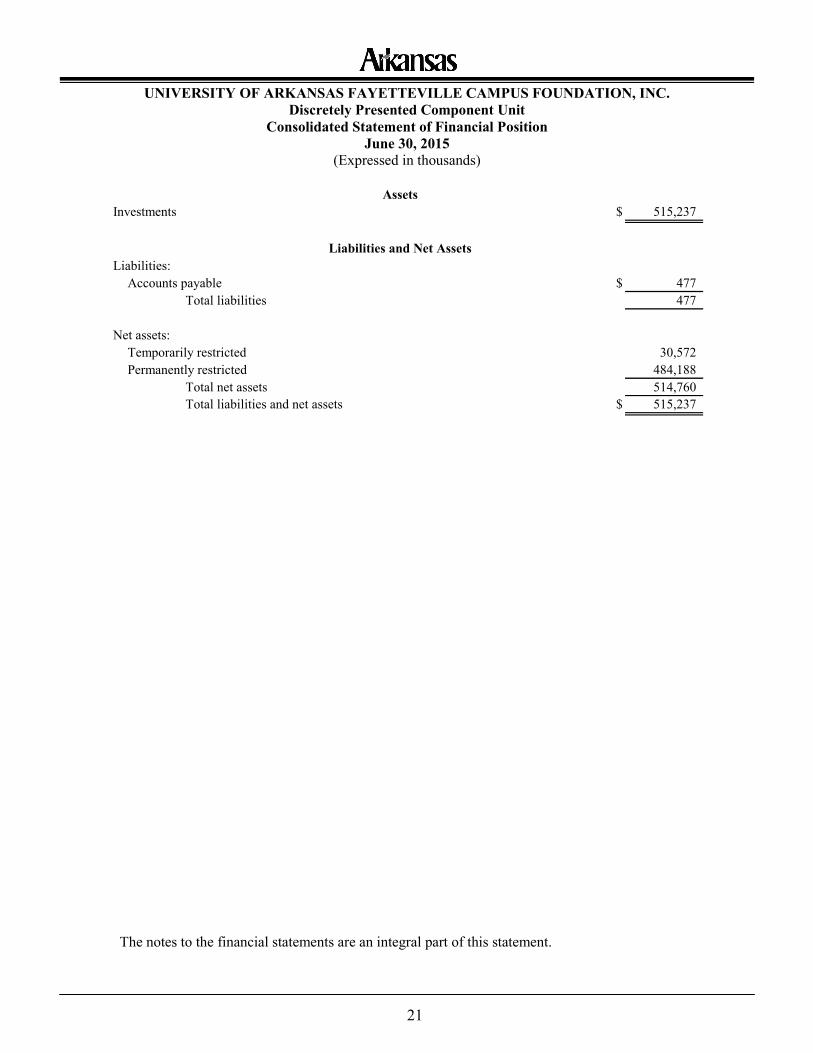
21
UNIVERSITY OF ARKANSAS FAYETTEVILLE CAMPUS FOUNDATION, INC. Discretely Presented Component Unit
Consolidated Statement of Financial Position June 30, 2015
(Expressed in thousands)
Investments $ 515,237
Liabilities:Accounts payable $ 477
Total liabilities 477
Net assets:Temporarily restricted 30,572Permanently restricted 484,188
Total net assets 514,760Total liabilities and net assets $ 515,237
Liabilities and Net Assets
Assets
The notes to the financial statements are an integral part of this statement.
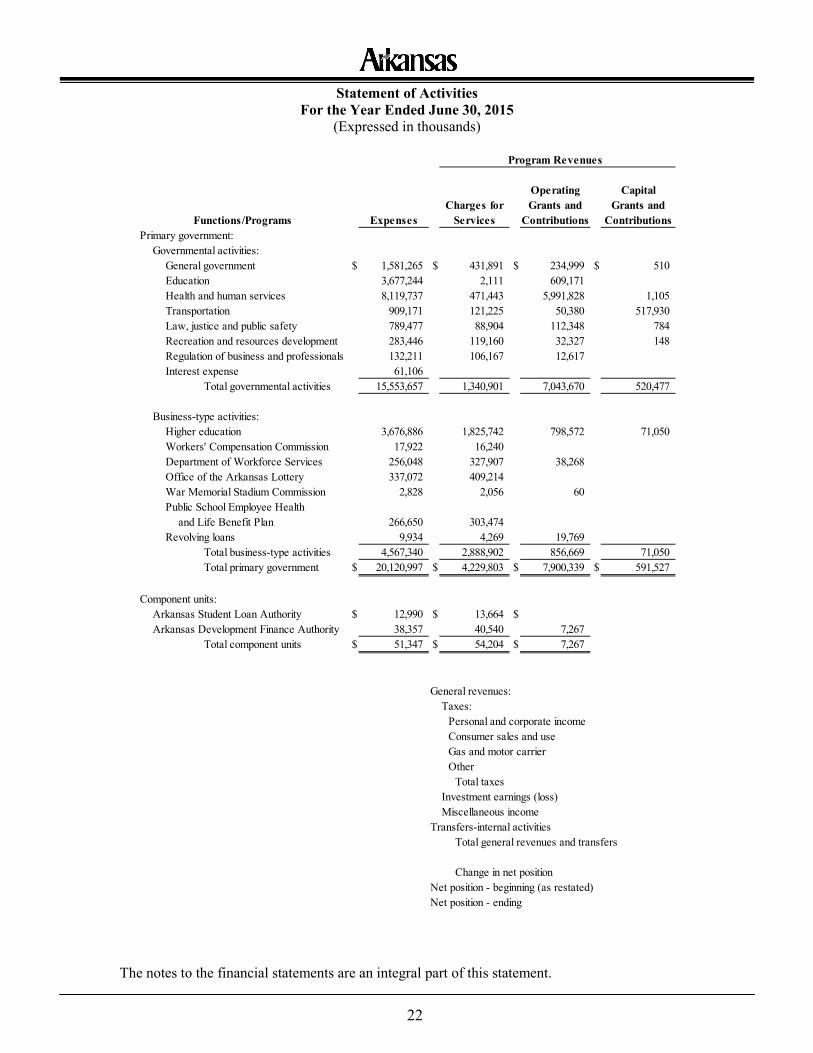
22
Statement of Activities For the Year Ended June 30, 2015
(Expressed in thousands)
Program Revenues
Operating CapitalCharges for Grants and Grants and
Expenses Services Contributions ContributionsPrimary government:
Governmental activities:General government $ 1,581,265 $ 431,891 $ 234,999 $ 510Education 3,677,244 2,111 609,171Health and human services 8,119,737 471,443 5,991,828 1,105Transportation 909,171 121,225 50,380 517,930Law, justice and public safety 789,477 88,904 112,348 784Recreation and resources development 283,446 119,160 32,327 148Regulation of business and professionals 132,211 106,167 12,617Interest expense 61,106
Total governmental activities 15,553,657 1,340,901 7,043,670 520,477
Business-type activities:Higher education 3,676,886 1,825,742 798,572 71,050Workers' Compensation Commission 17,922 16,240Department of Workforce Services 256,048 327,907 38,268Office of the Arkansas Lottery 337,072 409,214War Memorial Stadium Commission 2,828 2,056 60Public School Employee Health
and Life Benefit Plan 266,650 303,474Revolving loans 9,934 4,269 19,769
Total business-type activities 4,567,340 2,888,902 856,669 71,050Total primary government $ 20,120,997 $ 4,229,803 $ 7,900,339 $ 591,527
Component units:Arkansas Student Loan Authority $ 12,990 $ 13,664 $Arkansas Development Finance Authority 38,357 40,540 7,267
Total component units $ 51,347 $ 54,204 $ 7,267
General revenues:Taxes:
Personal and corporate incomeConsumer sales and useGas and motor carrierOther
Total taxesInvestment earnings (loss)Miscellaneous income
Transfers-internal activitiesTotal general revenues and transfers
Change in net positionNet position - beginning (as restated)Net position - ending
Functions/Programs
The notes to the financial statements are an integral part of this statement.
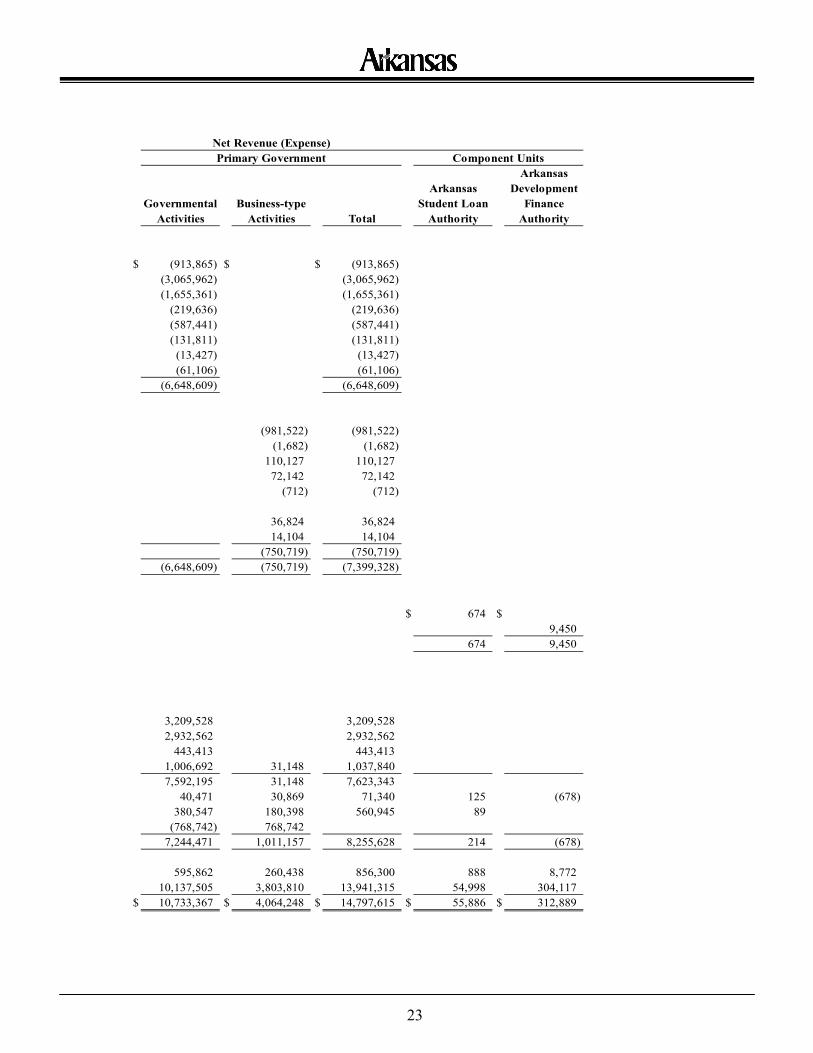
23
Net Revenue (Expense)Primary Government Component Units
ArkansasArkansas Development
Governmental Business-type Student Loan FinanceActivities Activities Total Authority Authority
$ (913,865) $ $ (913,865)(3,065,962) (3,065,962)(1,655,361) (1,655,361)
(219,636) (219,636)(587,441) (587,441)(131,811) (131,811)(13,427) (13,427)(61,106) (61,106)
(6,648,609) (6,648,609)
(981,522) (981,522)(1,682) (1,682)
110,127 110,12772,142 72,142
(712) (712)
36,824 36,82414,104 14,104
(750,719) (750,719)(6,648,609) (750,719) (7,399,328)
$ 674 $9,450
674 9,450
3,209,528 3,209,5282,932,562 2,932,562
443,413 443,4131,006,692 31,148 1,037,8407,592,195 31,148 7,623,343
40,471 30,869 71,340 125 (678) 380,547 180,398 560,945 89
(768,742) 768,742 7,244,471 1,011,157 8,255,628 214 (678)
595,862 260,438 856,300 888 8,77210,137,505 3,803,810 13,941,315 54,998 304,117
$ 10,733,367 $ 4,064,248 $ 14,797,615 $ 55,886 $ 312,889
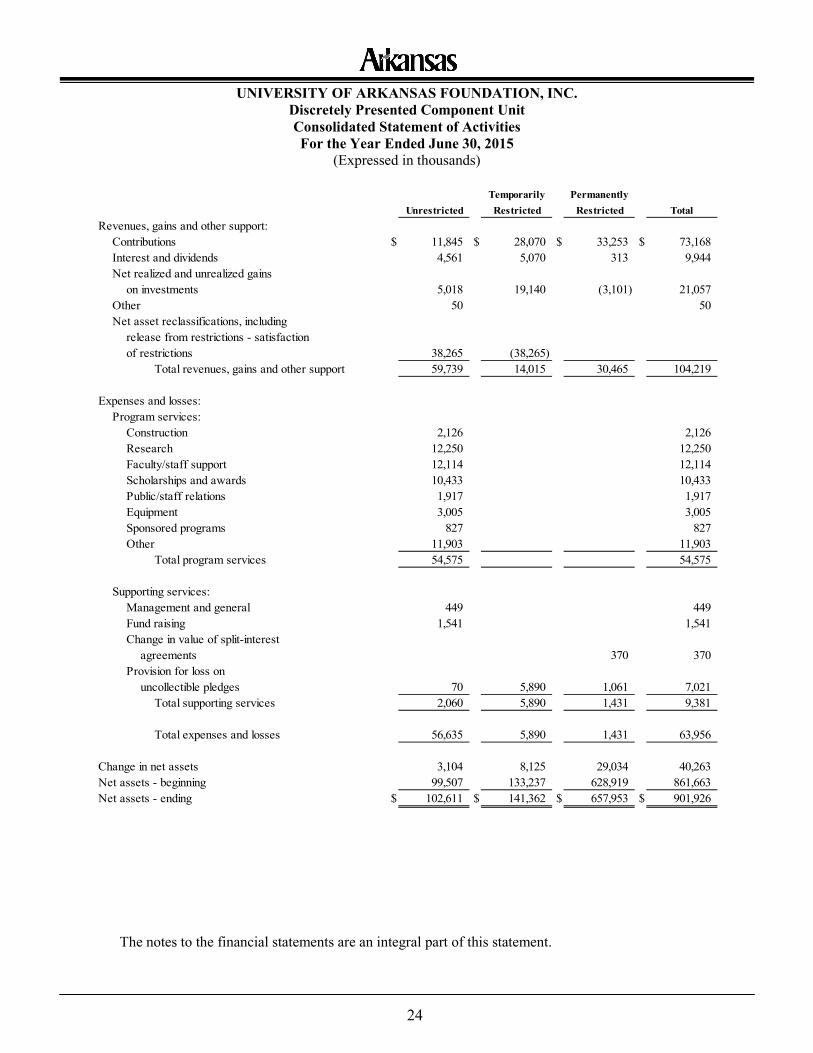
24
UNIVERSITY OF ARKANSAS FOUNDATION, INC. Discretely Presented Component Unit Consolidated Statement of Activities For the Year Ended June 30, 2015
(Expressed in thousands)
Temporarily PermanentlyUnrestricted Restricted Restricted Total
Revenues, gains and other support:Contributions $ 11,845 $ 28,070 $ 33,253 $ 73,168Interest and dividends 4,561 5,070 313 9,944Net realized and unrealized gains
on investments 5,018 19,140 (3,101) 21,057Other 50 50Net asset reclassifications, including
release from restrictions - satisfactionof restrictions 38,265 (38,265)
Total revenues, gains and other support 59,739 14,015 30,465 104,219
Expenses and losses:Program services:
Construction 2,126 2,126Research 12,250 12,250Faculty/staff support 12,114 12,114Scholarships and awards 10,433 10,433Public/staff relations 1,917 1,917Equipment 3,005 3,005Sponsored programs 827 827Other 11,903 11,903
Total program services 54,575 54,575
Supporting services:Management and general 449 449Fund raising 1,541 1,541Change in value of split-interest
agreements 370 370Provision for loss on
uncollectible pledges 70 5,890 1,061 7,021Total supporting services 2,060 5,890 1,431 9,381
Total expenses and losses 56,635 5,890 1,431 63,956
Change in net assets 3,104 8,125 29,034 40,263Net assets - beginning 99,507 133,237 628,919 861,663Net assets - ending $ 102,611 $ 141,362 $ 657,953 $ 901,926
The notes to the financial statements are an integral part of this statement.
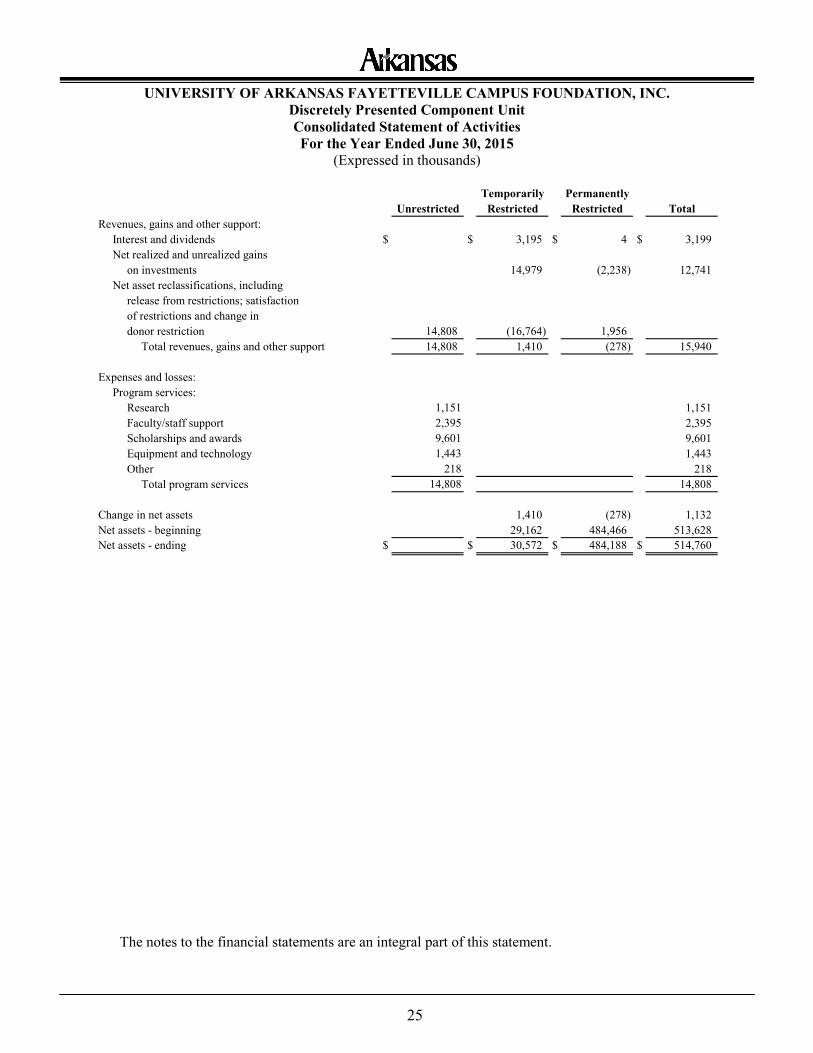
25
UNIVERSITY OF ARKANSAS FAYETTEVILLE CAMPUS FOUNDATION, INC. Discretely Presented Component Unit Consolidated Statement of Activities For the Year Ended June 30, 2015
(Expressed in thousands)
Temporarily PermanentlyUnrestricted Restricted Restricted Total
Revenues, gains and other support:Interest and dividends $ $ 3,195 $ 4 $ 3,199Net realized and unrealized gains
on investments 14,979 (2,238) 12,741Net asset reclassifications, including
release from restrictions; satisfactionof restrictions and change in donor restriction 14,808 (16,764) 1,956
Total revenues, gains and other support 14,808 1,410 (278) 15,940
Expenses and losses:Program services:
Research 1,151 1,151Faculty/staff support 2,395 2,395Scholarships and awards 9,601 9,601Equipment and technology 1,443 1,443Other 218 218
Total program services 14,808 14,808
Change in net assets 1,410 (278) 1,132Net assets - beginning 29,162 484,466 513,628Net assets - ending $ $ 30,572 $ 484,188 $ 514,760
The notes to the financial statements are an integral part of this statement.
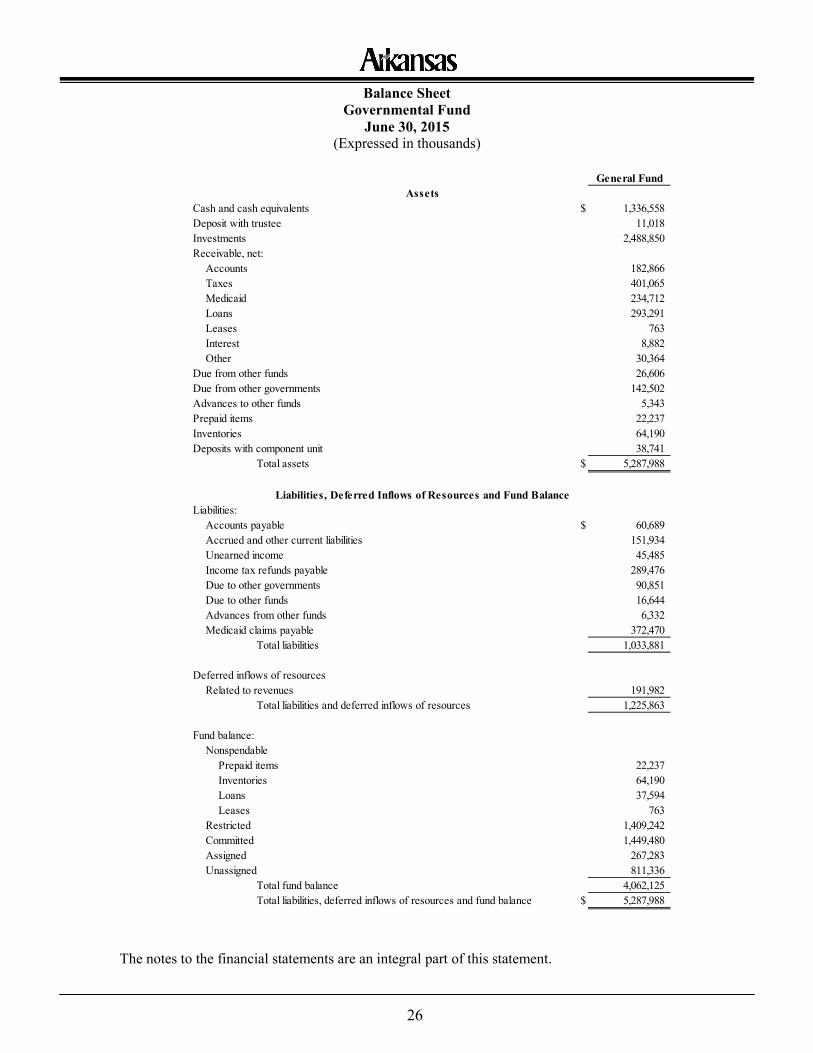
26
Balance Sheet Governmental Fund
June 30, 2015 (Expressed in thousands)
General FundAssets
Cash and cash equivalents $ 1,336,558Deposit with trustee 11,018Investments 2,488,850Receivable, net:
Accounts 182,866Taxes 401,065Medicaid 234,712Loans 293,291Leases 763Interest 8,882Other 30,364
Due from other funds 26,606Due from other governments 142,502Advances to other funds 5,343Prepaid items 22,237Inventories 64,190Deposits with component unit 38,741
Total assets $ 5,287,988
Liabilities, Deferred Inflows of Resources and Fund BalanceLiabilities:
Accounts payable $ 60,689Accrued and other current liabilities 151,934Unearned income 45,485Income tax refunds payable 289,476Due to other governments 90,851Due to other funds 16,644Advances from other funds 6,332Medicaid claims payable 372,470
Total liabilities 1,033,881
Deferred inflows of resourcesRelated to revenues 191,982
Total liabilities and deferred inflows of resources 1,225,863
Fund balance:Nonspendable
Prepaid items 22,237Inventories 64,190Loans 37,594Leases 763
Restricted 1,409,242Committed 1,449,480Assigned 267,283Unassigned 811,336
Total fund balance 4,062,125Total liabilities, deferred inflows of resources and fund balance $ 5,287,988
The notes to the financial statements are an integral part of this statement.
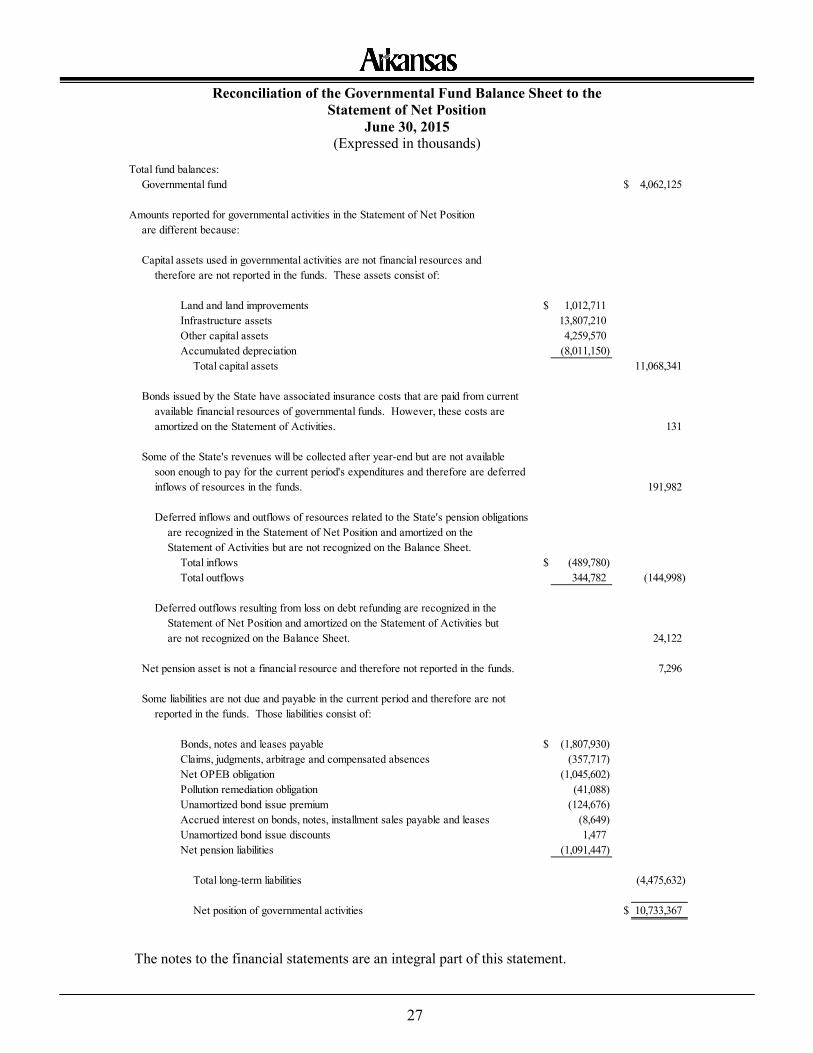
27
Reconciliation of the Governmental Fund Balance Sheet to the Statement of Net Position
June 30, 2015 (Expressed in thousands)
Total fund balances:Governmental fund $ 4,062,125
Amounts reported for governmental activities in the Statement of Net Positionare different because:
Capital assets used in governmental activities are not financial resources and therefore are not reported in the funds. These assets consist of:
Land and land improvements $ 1,012,711Infrastructure assets 13,807,210Other capital assets 4,259,570Accumulated depreciation (8,011,150)
Total capital assets 11,068,341
Bonds issued by the State have associated insurance costs that are paid from current available financial resources of governmental funds. However, these costs are amortized on the Statement of Activities. 131
Some of the State's revenues will be collected after year-end but are not availablesoon enough to pay for the current period's expenditures and therefore are deferredinflows of resources in the funds. 191,982
Deferred inflows and outflows of resources related to the State's pension obligationsare recognized in the Statement of Net Position and amortized on theStatement of Activities but are not recognized on the Balance Sheet.
Total inflows $ (489,780)Total outflows 344,782 (144,998)
Deferred outflows resulting from loss on debt refunding are recognized in the Statement of Net Position and amortized on the Statement of Activities butare not recognized on the Balance Sheet. 24,122
Net pension asset is not a financial resource and therefore not reported in the funds. 7,296
Some liabilities are not due and payable in the current period and therefore are not reported in the funds. Those liabilities consist of:
Bonds, notes and leases payable $ (1,807,930)Claims, judgments, arbitrage and compensated absences (357,717)Net OPEB obligation (1,045,602)Pollution remediation obligation (41,088)Unamortized bond issue premium (124,676)Accrued interest on bonds, notes, installment sales payable and leases (8,649)Unamortized bond issue discounts 1,477Net pension liabilities (1,091,447)
Total long-term liabilities (4,475,632)
Net position of governmental activities $ 10,733,367
The notes to the financial statements are an integral part of this statement.
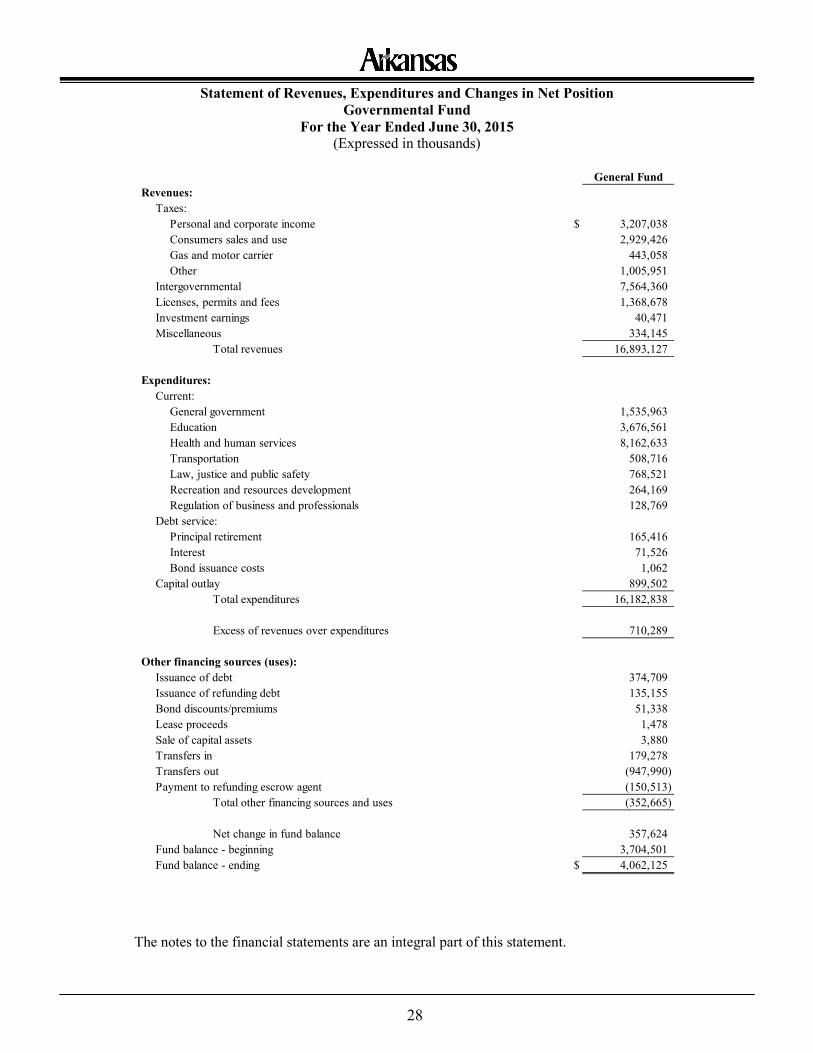
28
Statement of Revenues, Expenditures and Changes in Net Position Governmental Fund
For the Year Ended June 30, 2015 (Expressed in thousands)
General FundRevenues:
Taxes:Personal and corporate income $ 3,207,038Consumers sales and use 2,929,426Gas and motor carrier 443,058Other 1,005,951
Intergovernmental 7,564,360Licenses, permits and fees 1,368,678Investment earnings 40,471Miscellaneous 334,145
Total revenues 16,893,127
Expenditures:Current:
General government 1,535,963Education 3,676,561Health and human services 8,162,633Transportation 508,716Law, justice and public safety 768,521Recreation and resources development 264,169Regulation of business and professionals 128,769
Debt service:Principal retirement 165,416Interest 71,526Bond issuance costs 1,062
Capital outlay 899,502Total expenditures 16,182,838
Excess of revenues over expenditures 710,289
Other financing sources (uses):Issuance of debt 374,709Issuance of refunding debt 135,155Bond discounts/premiums 51,338Lease proceeds 1,478Sale of capital assets 3,880Transfers in 179,278Transfers out (947,990)Payment to refunding escrow agent (150,513)
Total other financing sources and uses (352,665)
Net change in fund balance 357,624Fund balance - beginning 3,704,501Fund balance - ending $ 4,062,125
The notes to the financial statements are an integral part of this statement.
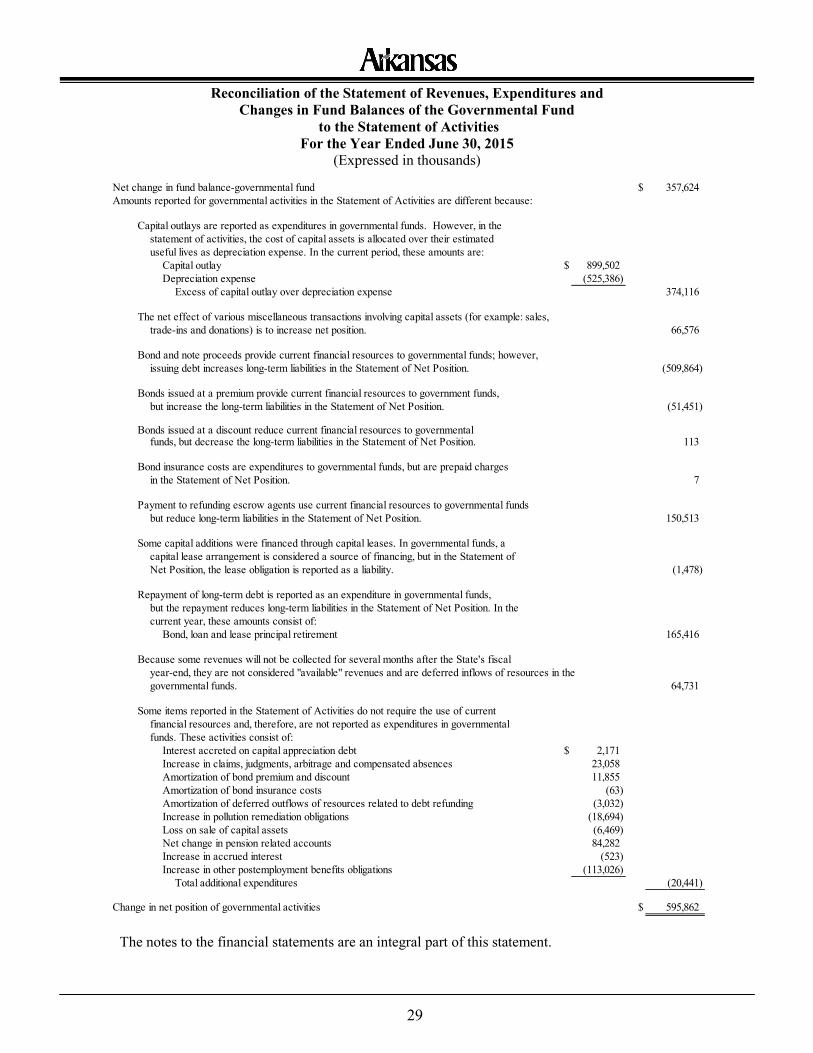
29
Reconciliation of the Statement of Revenues, Expenditures and Changes in Fund Balances of the Governmental Fund
to the Statement of Activities For the Year Ended June 30, 2015
(Expressed in thousands)
Net change in fund balance-governmental fund $ 357,624Amounts reported for governmental activities in the Statement of Activities are different because:
Capital outlays are reported as expenditures in governmental funds. However, in the statement of activities, the cost of capital assets is allocated over their estimateduseful lives as depreciation expense. In the current period, these amounts are:
Capital outlay $ 899,502Depreciation expense (525,386)
Excess of capital outlay over depreciation expense 374,116
The net effect of various miscellaneous transactions involving capital assets (for example: sales,trade-ins and donations) is to increase net position. 66,576
Bond and note proceeds provide current financial resources to governmental funds; however,issuing debt increases long-term liabilities in the Statement of Net Position. (509,864)
Bonds issued at a premium provide current financial resources to government funds,but increase the long-term liabilities in the Statement of Net Position. (51,451)
Bonds issued at a discount reduce current financial resources to governmentalfunds, but decrease the long-term liabilities in the Statement of Net Position. 113
Bond insurance costs are expenditures to governmental funds, but are prepaid chargesin the Statement of Net Position. 7
Payment to refunding escrow agents use current financial resources to governmental fundsbut reduce long-term liabilities in the Statement of Net Position. 150,513
Some capital additions were financed through capital leases. In governmental funds, a capital lease arrangement is considered a source of financing, but in the Statement ofNet Position, the lease obligation is reported as a liability. (1,478)
Repayment of long-term debt is reported as an expenditure in governmental funds,but the repayment reduces long-term liabilities in the Statement of Net Position. In thecurrent year, these amounts consist of:
Bond, loan and lease principal retirement 165,416
Because some revenues will not be collected for several months after the State's fiscalyear-end, they are not considered "available" revenues and are deferred inflows of resources in thegovernmental funds. 64,731
Some items reported in the Statement of Activities do not require the use of currentfinancial resources and, therefore, are not reported as expenditures in governmentalfunds. These activities consist of:
Interest accreted on capital appreciation debt $ 2,171Increase in claims, judgments, arbitrage and compensated absences 23,058Amortization of bond premium and discount 11,855Amortization of bond insurance costs (63)Amortization of deferred outflows of resources related to debt refunding (3,032)Increase in pollution remediation obligations (18,694)Loss on sale of capital assets (6,469)Net change in pension related accounts 84,282Increase in accrued interest (523)Increase in other postemployment benefits obligations (113,026)
Total additional expenditures (20,441)
Change in net position of governmental activities $ 595,862
The notes to the financial statements are an integral part of this statement.
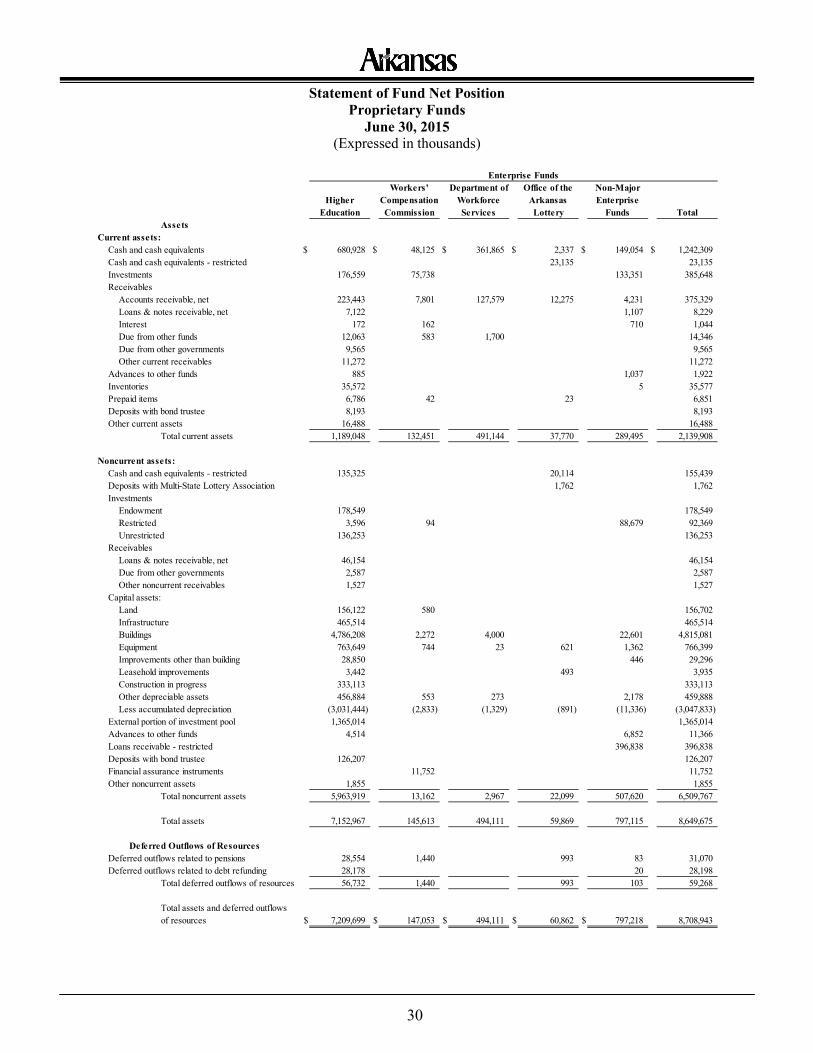
30
Statement of Fund Net Position Proprietary Funds
June 30, 2015 (Expressed in thousands)
Enterprise FundsWorkers' Department of Office of the Non-Major
Higher Compensation Workforce Arkansas EnterpriseEducation Commission Services Lottery Funds Total
AssetsCurrent assets:
Cash and cash equivalents $ 680,928 $ 48,125 $ 361,865 $ 2,337 $ 149,054 $ 1,242,309Cash and cash equivalents - restricted 23,135 23,135Investments 176,559 75,738 133,351 385,648Receivables
Accounts receivable, net 223,443 7,801 127,579 12,275 4,231 375,329Loans & notes receivable, net 7,122 1,107 8,229Interest 172 162 710 1,044Due from other funds 12,063 583 1,700 14,346Due from other governments 9,565 9,565Other current receivables 11,272 11,272
Advances to other funds 885 1,037 1,922Inventories 35,572 5 35,577Prepaid items 6,786 42 23 6,851Deposits with bond trustee 8,193 8,193Other current assets 16,488 16,488
Total current assets 1,189,048 132,451 491,144 37,770 289,495 2,139,908
Noncurrent assets:Cash and cash equivalents - restricted 135,325 20,114 155,439Deposits with Multi-State Lottery Association 1,762 1,762Investments
Endowment 178,549 178,549Restricted 3,596 94 88,679 92,369Unrestricted 136,253 136,253
Receivables Loans & notes receivable, net 46,154 46,154Due from other governments 2,587 2,587Other noncurrent receivables 1,527 1,527
Capital assets: Land 156,122 580 156,702Infrastructure 465,514 465,514Buildings 4,786,208 2,272 4,000 22,601 4,815,081Equipment 763,649 744 23 621 1,362 766,399Improvements other than building 28,850 446 29,296Leasehold improvements 3,442 493 3,935Construction in progress 333,113 333,113Other depreciable assets 456,884 553 273 2,178 459,888Less accumulated depreciation (3,031,444) (2,833) (1,329) (891) (11,336) (3,047,833)
External portion of investment pool 1,365,014 1,365,014Advances to other funds 4,514 6,852 11,366Loans receivable - restricted 396,838 396,838Deposits with bond trustee 126,207 126,207Financial assurance instruments 11,752 11,752Other noncurrent assets 1,855 1,855
Total noncurrent assets 5,963,919 13,162 2,967 22,099 507,620 6,509,767
Total assets 7,152,967 145,613 494,111 59,869 797,115 8,649,675
Deferred Outflows of ResourcesDeferred outflows related to pensions 28,554 1,440 993 83 31,070Deferred outflows related to debt refunding 28,178 20 28,198
Total deferred outflows of resources 56,732 1,440 993 103 59,268
Total assets and deferred outflowsof resources $ 7,209,699 $ 147,053 $ 494,111 $ 60,862 $ 797,218 8,708,943
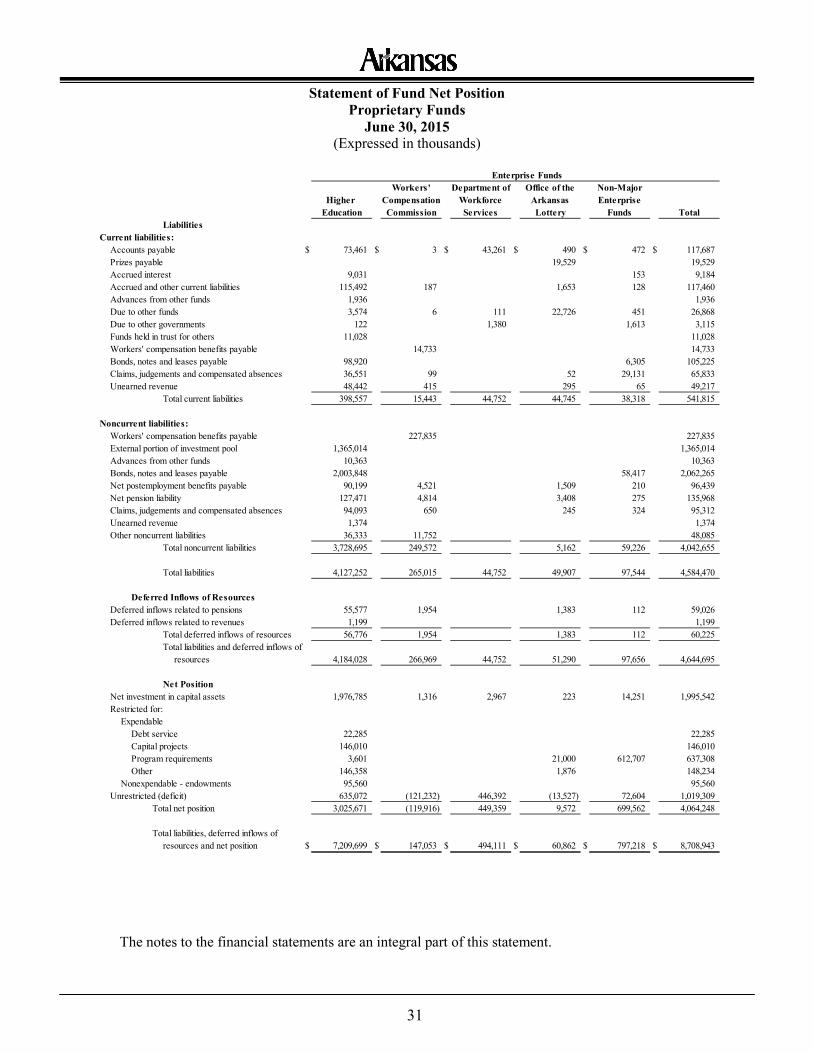
31
Statement of Fund Net Position Proprietary Funds
June 30, 2015 (Expressed in thousands)
Enterprise FundsWorkers' Department of Office of the Non-Major
Higher Compensation Workforce Arkansas EnterpriseEducation Commission Services Lottery Funds Total
LiabilitiesCurrent liabilities:
Accounts payable $ 73,461 $ 3 $ 43,261 $ 490 $ 472 $ 117,687Prizes payable 19,529 19,529Accrued interest 9,031 153 9,184Accrued and other current liabilities 115,492 187 1,653 128 117,460Advances from other funds 1,936 1,936Due to other funds 3,574 6 111 22,726 451 26,868Due to other governments 122 1,380 1,613 3,115Funds held in trust for others 11,028 11,028Workers' compensation benefits payable 14,733 14,733Bonds, notes and leases payable 98,920 6,305 105,225Claims, judgements and compensated absences 36,551 99 52 29,131 65,833Unearned revenue 48,442 415 295 65 49,217
Total current liabilities 398,557 15,443 44,752 44,745 38,318 541,815
Noncurrent liabilities:Workers' compensation benefits payable 227,835 227,835External portion of investment pool 1,365,014 1,365,014Advances from other funds 10,363 10,363Bonds, notes and leases payable 2,003,848 58,417 2,062,265Net postemployment benefits payable 90,199 4,521 1,509 210 96,439Net pension liability 127,471 4,814 3,408 275 135,968Claims, judgements and compensated absences 94,093 650 245 324 95,312Unearned revenue 1,374 1,374Other noncurrent liabilities 36,333 11,752 48,085
Total noncurrent liabilities 3,728,695 249,572 5,162 59,226 4,042,655
Total liabilities 4,127,252 265,015 44,752 49,907 97,544 4,584,470
Deferred Inflows of ResourcesDeferred inflows related to pensions 55,577 1,954 1,383 112 59,026Deferred inflows related to revenues 1,199 1,199
Total deferred inflows of resources 56,776 1,954 1,383 112 60,225Total liabilities and deferred inflows of
resources 4,184,028 266,969 44,752 51,290 97,656 4,644,695
Net PositionNet investment in capital assets 1,976,785 1,316 2,967 223 14,251 1,995,542Restricted for:
Expendable Debt service 22,285 22,285Capital projects 146,010 146,010Program requirements 3,601 21,000 612,707 637,308Other 146,358 1,876 148,234
Nonexpendable - endowments 95,560 95,560Unrestricted (deficit) 635,072 (121,232) 446,392 (13,527) 72,604 1,019,309
Total net position 3,025,671 (119,916) 449,359 9,572 699,562 4,064,248
Total liabilities, deferred inflows of resources and net position $ 7,209,699 $ 147,053 $ 494,111 $ 60,862 $ 797,218 $ 8,708,943
The notes to the financial statements are an integral part of this statement.
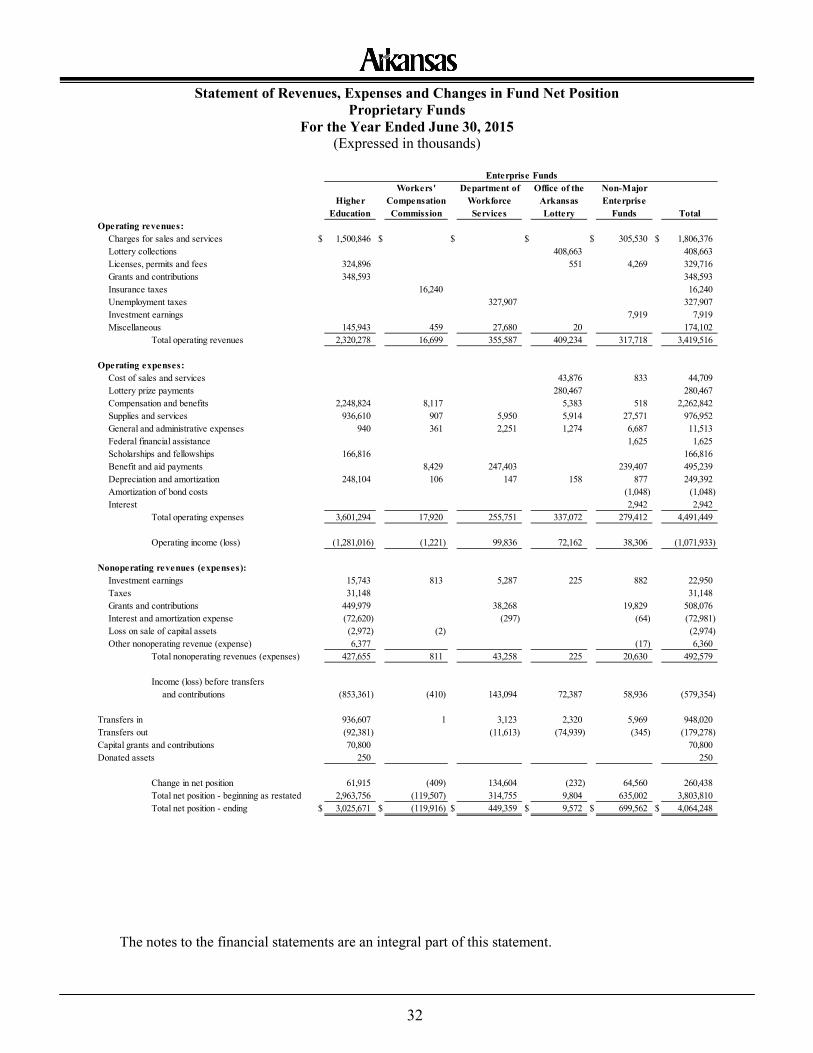
32
Statement of Revenues, Expenses and Changes in Fund Net Position Proprietary Funds
For the Year Ended June 30, 2015 (Expressed in thousands)
Enterprise Funds
Workers' Department of Office of the Non-MajorHigher Compensation Workforce Arkansas Enterprise
Education Commission Services Lottery Funds TotalOperating revenues:
Charges for sales and services $ 1,500,846 $ $ $ $ 305,530 $ 1,806,376Lottery collections 408,663 408,663Licenses, permits and fees 324,896 551 4,269 329,716Grants and contributions 348,593 348,593Insurance taxes 16,240 16,240Unemployment taxes 327,907 327,907Investment earnings 7,919 7,919Miscellaneous 145,943 459 27,680 20 174,102
Total operating revenues 2,320,278 16,699 355,587 409,234 317,718 3,419,516
Operating expenses:Cost of sales and services 43,876 833 44,709Lottery prize payments 280,467 280,467Compensation and benefits 2,248,824 8,117 5,383 518 2,262,842Supplies and services 936,610 907 5,950 5,914 27,571 976,952General and administrative expenses 940 361 2,251 1,274 6,687 11,513Federal financial assistance 1,625 1,625Scholarships and fellowships 166,816 166,816Benefit and aid payments 8,429 247,403 239,407 495,239Depreciation and amortization 248,104 106 147 158 877 249,392Amortization of bond costs (1,048) (1,048)Interest 2,942 2,942
Total operating expenses 3,601,294 17,920 255,751 337,072 279,412 4,491,449
Operating income (loss) (1,281,016) (1,221) 99,836 72,162 38,306 (1,071,933)
Nonoperating revenues (expenses):Investment earnings 15,743 813 5,287 225 882 22,950Taxes 31,148 31,148Grants and contributions 449,979 38,268 19,829 508,076Interest and amortization expense (72,620) (297) (64) (72,981)Loss on sale of capital assets (2,972) (2) (2,974)Other nonoperating revenue (expense) 6,377 (17) 6,360
Total nonoperating revenues (expenses) 427,655 811 43,258 225 20,630 492,579
Income (loss) before transfersand contributions (853,361) (410) 143,094 72,387 58,936 (579,354)
Transfers in 936,607 1 3,123 2,320 5,969 948,020Transfers out (92,381) (11,613) (74,939) (345) (179,278)Capital grants and contributions 70,800 70,800Donated assets 250 250
Change in net position 61,915 (409) 134,604 (232) 64,560 260,438Total net position - beginning as restated 2,963,756 (119,507) 314,755 9,804 635,002 3,803,810Total net position - ending $ 3,025,671 $ (119,916) $ 449,359 $ 9,572 $ 699,562 $ 4,064,248
The notes to the financial statements are an integral part of this statement.
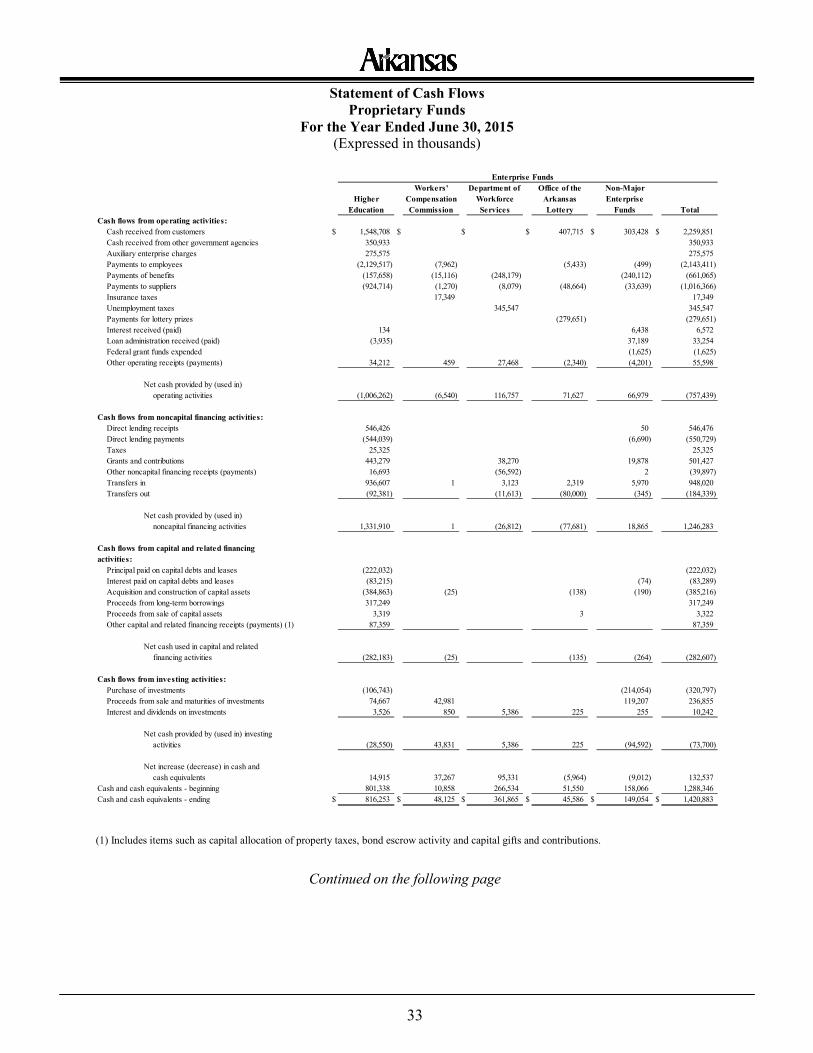
33
Statement of Cash Flows Proprietary Funds
For the Year Ended June 30, 2015 (Expressed in thousands)
(1) Includes items such as capital allocation of property taxes, bond escrow activity and capital gifts and contributions.
Enterprise FundsWorkers' Department of Office of the Non-Major
Higher Compensation Workforce Arkansas EnterpriseEducation Commission Services Lottery Funds Total
Cash flows from operating activities:Cash received from customers $ 1,548,708 $ $ $ 407,715 $ 303,428 $ 2,259,851Cash received from other government agencies 350,933 350,933Auxiliary enterprise charges 275,575 275,575Payments to employees (2,129,517) (7,962) (5,433) (499) (2,143,411)Payments of benefits (157,658) (15,116) (248,179) (240,112) (661,065)Payments to suppliers (924,714) (1,270) (8,079) (48,664) (33,639) (1,016,366)Insurance taxes 17,349 17,349Unemployment taxes 345,547 345,547Payments for lottery prizes (279,651) (279,651)Interest received (paid) 134 6,438 6,572Loan administration received (paid) (3,935) 37,189 33,254Federal grant funds expended (1,625) (1,625)Other operating receipts (payments) 34,212 459 27,468 (2,340) (4,201) 55,598
Net cash provided by (used in)operating activities (1,006,262) (6,540) 116,757 71,627 66,979 (757,439)
Cash flows from noncapital financing activities:Direct lending receipts 546,426 50 546,476Direct lending payments (544,039) (6,690) (550,729)Taxes 25,325 25,325Grants and contributions 443,279 38,270 19,878 501,427Other noncapital financing receipts (payments) 16,693 (56,592) 2 (39,897)Transfers in 936,607 1 3,123 2,319 5,970 948,020Transfers out (92,381) (11,613) (80,000) (345) (184,339)
Net cash provided by (used in)noncapital financing activities 1,331,910 1 (26,812) (77,681) 18,865 1,246,283
Cash flows from capital and related financingactivities:
Principal paid on capital debts and leases (222,032) (222,032)Interest paid on capital debts and leases (83,215) (74) (83,289)Acquisition and construction of capital assets (384,863) (25) (138) (190) (385,216)Proceeds from long-term borrowings 317,249 317,249Proceeds from sale of capital assets 3,319 3 3,322Other capital and related financing receipts (payments) (1) 87,359 87,359
Net cash used in capital and related financing activities (282,183) (25) (135) (264) (282,607)
Cash flows from investing activities:Purchase of investments (106,743) (214,054) (320,797)Proceeds from sale and maturities of investments 74,667 42,981 119,207 236,855Interest and dividends on investments 3,526 850 5,386 225 255 10,242
Net cash provided by (used in) investingactivities (28,550) 43,831 5,386 225 (94,592) (73,700)
Net increase (decrease) in cash and cash equivalents 14,915 37,267 95,331 (5,964) (9,012) 132,537
Cash and cash equivalents - beginning 801,338 10,858 266,534 51,550 158,066 1,288,346Cash and cash equivalents - ending $ 816,253 $ 48,125 $ 361,865 $ 45,586 $ 149,054 $ 1,420,883
Continued on the following page
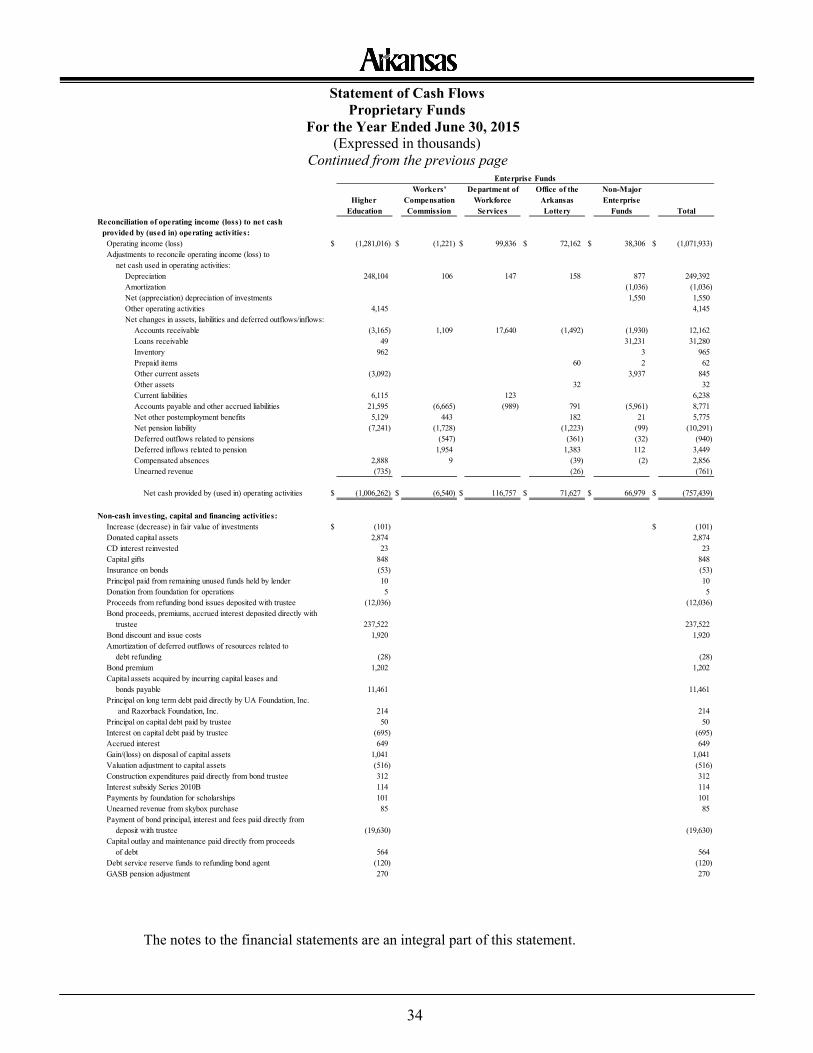
34
Statement of Cash Flows Proprietary Funds
For the Year Ended June 30, 2015 (Expressed in thousands)
The notes to the financial statements are an integral part of this statement.
Continued from the previous page
Workers' Department of Office of the Non-MajorHigher Compensation Workforce Arkansas Enterprise
Education Commission Services Lottery Funds TotalReconciliation of operating income (loss) to net cash
provided by (used in) operating activities:Operating income (loss) $ (1,281,016) $ (1,221) $ 99,836 $ 72,162 $ 38,306 $ (1,071,933)Adjustments to reconcile operating income (loss) to
net cash used in operating activities: Depreciation 248,104 106 147 158 877 249,392Amortization (1,036) (1,036)Net (appreciation) depreciation of investments 1,550 1,550Other operating activities 4,145 4,145Net changes in assets, liabilities and deferred outflows/inflows:
Accounts receivable (3,165) 1,109 17,640 (1,492) (1,930) 12,162Loans receivable 49 31,231 31,280Inventory 962 3 965Prepaid items 60 2 62Other current assets (3,092) 3,937 845Other assets 32 32Current liabilities 6,115 123 6,238Accounts payable and other accrued liabilities 21,595 (6,665) (989) 791 (5,961) 8,771Net other postemployment benefits 5,129 443 182 21 5,775Net pension liability (7,241) (1,728) (1,223) (99) (10,291)Deferred outflows related to pensions (547) (361) (32) (940)Deferred inflows related to pension 1,954 1,383 112 3,449Compensated absences 2,888 9 (39) (2) 2,856Unearned revenue (735) (26) (761)
Net cash provided by (used in) operating activities $ (1,006,262) $ (6,540) $ 116,757 $ 71,627 $ 66,979 $ (757,439)
Non-cash investing, capital and financing activities:Increase (decrease) in fair value of investments $ (101) $ (101)Donated capital assets 2,874 2,874CD interest reinvested 23 23Capital gifts 848 848Insurance on bonds (53) (53)Principal paid from remaining unused funds held by lender 10 10Donation from foundation for operations 5 5Proceeds from refunding bond issues deposited with trustee (12,036) (12,036)Bond proceeds, premiums, accrued interest deposited directly with
trustee 237,522 237,522Bond discount and issue costs 1,920 1,920Amortization of deferred outflows of resources related to
debt refunding (28) (28)Bond premium 1,202 1,202Capital assets acquired by incurring capital leases and
bonds payable 11,461 11,461Principal on long term debt paid directly by UA Foundation, Inc.
and Razorback Foundation, Inc. 214 214Principal on capital debt paid by trustee 50 50Interest on capital debt paid by trustee (695) (695)Accrued interest 649 649Gain/(loss) on disposal of capital assets 1,041 1,041Valuation adjustment to capital assets (516) (516)Construction expenditures paid directly from bond trustee 312 312Interest subsidy Series 2010B 114 114Payments by foundation for scholarships 101 101Unearned revenue from skybox purchase 85 85Payment of bond principal, interest and fees paid directly from
deposit with trustee (19,630) (19,630)Capital outlay and maintenance paid directly from proceeds
of debt 564 564Debt service reserve funds to refunding bond agent (120) (120)GASB pension adjustment 270 270
Enterprise Funds
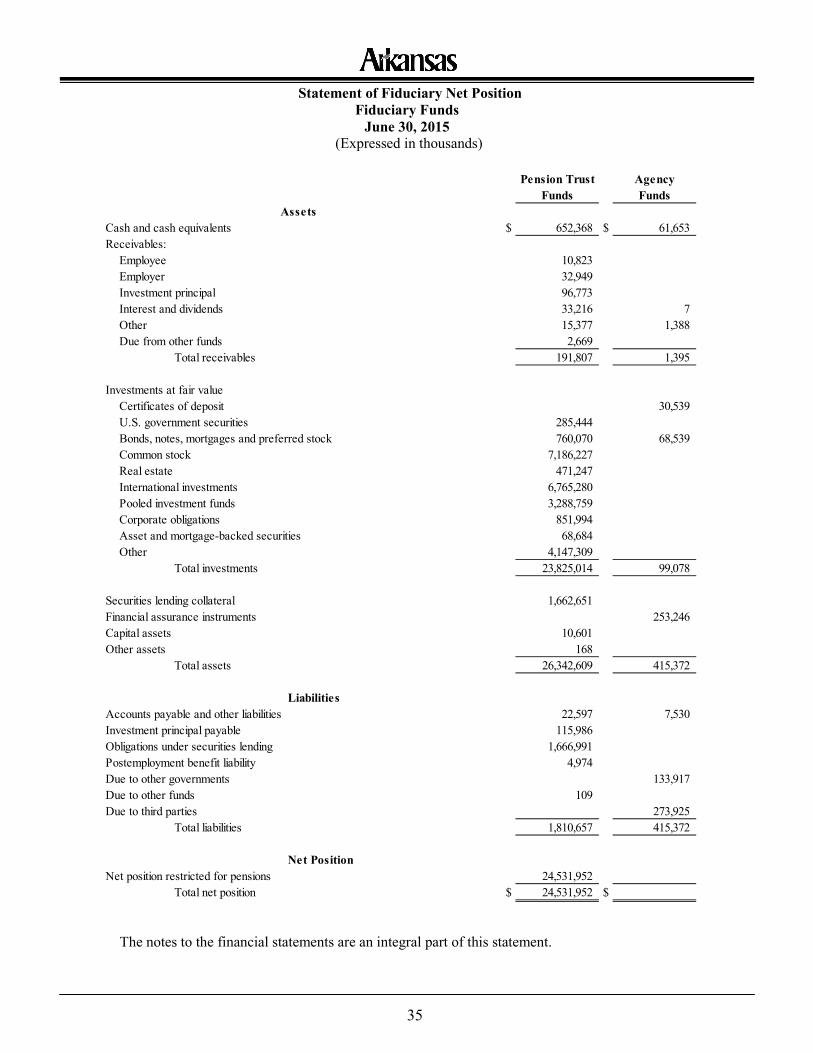
35
Statement of Fiduciary Net Position Fiduciary Funds
June 30, 2015 (Expressed in thousands)
Pension Trust AgencyFunds Funds
AssetsCash and cash equivalents $ 652,368 $ 61,653Receivables:
Employee 10,823Employer 32,949Investment principal 96,773Interest and dividends 33,216 7Other 15,377 1,388Due from other funds 2,669
Total receivables 191,807 1,395
Investments at fair valueCertificates of deposit 30,539U.S. government securities 285,444Bonds, notes, mortgages and preferred stock 760,070 68,539Common stock 7,186,227Real estate 471,247International investments 6,765,280Pooled investment funds 3,288,759Corporate obligations 851,994Asset and mortgage-backed securities 68,684Other 4,147,309
Total investments 23,825,014 99,078
Securities lending collateral 1,662,651Financial assurance instruments 253,246Capital assets 10,601Other assets 168
Total assets 26,342,609 415,372
LiabilitiesAccounts payable and other liabilities 22,597 7,530Investment principal payable 115,986Obligations under securities lending 1,666,991Postemployment benefit liability 4,974Due to other governments 133,917Due to other funds 109Due to third parties 273,925
Total liabilities 1,810,657 415,372
Net PositionNet position restricted for pensions 24,531,952
Total net position $ 24,531,952 $
The notes to the financial statements are an integral part of this statement.
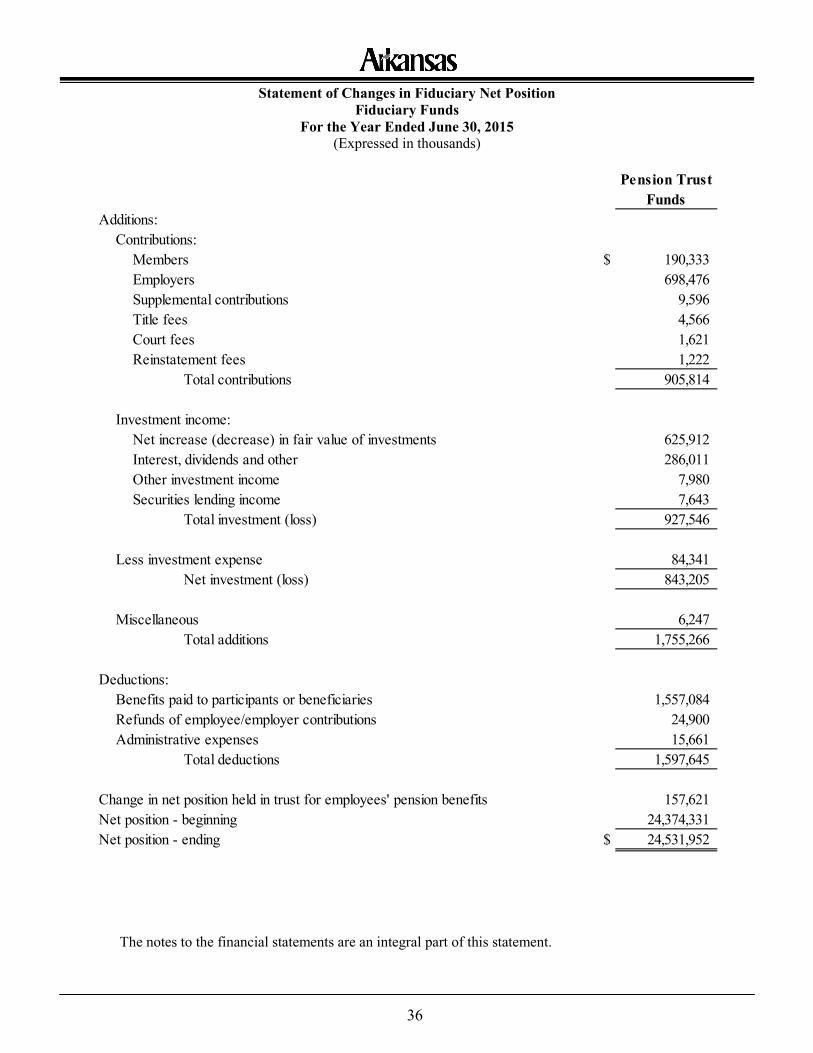
36
Statement of Changes in Fiduciary Net Position Fiduciary Funds
For the Year Ended June 30, 2015 (Expressed in thousands)
Pension Trust
FundsAdditions:
Contributions:Members $ 190,333Employers 698,476Supplemental contributions 9,596Title fees 4,566Court fees 1,621Reinstatement fees 1,222
Total contributions 905,814
Investment income:Net increase (decrease) in fair value of investments 625,912Interest, dividends and other 286,011Other investment income 7,980Securities lending income 7,643
Total investment (loss) 927,546
Less investment expense 84,341Net investment (loss) 843,205
Miscellaneous 6,247Total additions 1,755,266
Deductions:Benefits paid to participants or beneficiaries 1,557,084Refunds of employee/employer contributions 24,900Administrative expenses 15,661
Total deductions 1,597,645
Change in net position held in trust for employees' pension benefits 157,621Net position - beginning 24,374,331Net position - ending $ 24,531,952
The notes to the financial statements are an integral part of this statement.
37
Notes to the Financial Statements – Table of Contents
Note Description Page 1 Summary of Significant Accounting Policies 38 2 Deposits and Investments 51 3 Derivatives 58 4 Securities Lending Transactions 60 5 Receivables 60 6 Intergovernmental Activity 61 7 Capital Assets 63 8 Long-Term Liabilities 67 9 Pledged Revenues 85 10 Arbitrage Rebate and Excess Earnings Liability 87 11 Leases 87 12 Pollution Remediation 90 13 Fund Balance/Net Position 91 14 Pensions 93 15 Postemployment Benefits Other Than Pensions 106 16 Additional Information – Enterprise Funds 117 17 Risk Management Programs 118 18 Commitments and Contingencies 126 19 Joint Ventures 131 20 Subsequent Events 133
38
Notes to the Financial Statements For the Year Ended June 30, 2015
(1) Summary of Significant Accounting Policies
(a) Basis of Presentation
The accompanying financial statements have been prepared in conformity with generally accepted accounting principles (GAAP). The Governmental Accounting Standards Board (GASB) is the accepted standard-setting body for governmental accounting and financial reporting in the United States of America. The basic financial statements have been prepared primarily from accounts maintained by the Department of Finance and Administration and the State Treasurer. Additional data has been derived from the audited financial statements of certain entities and from reports and data prepared by various state agencies and departments based on independent or subsidiary accounting records maintained by them.
(b) Reporting Entity
For financial reporting purposes, the State of Arkansas (the State) includes all funds, departments and agencies of the State as well as boards, commissions, authorities and colleges and universities for which the State is financially accountable. The State also includes component units to the extent necessary for complete financial statement presentation.
(c) Component Units
Component units are legally separate organizations for which the State’s elected officials are financially accountable or are other organizations for which the nature and significance of their relationship with the State are such that exclusion would cause the State’s financial statements to be misleading. Two component units meet the criteria to be discretely presented in the financial statements. The financial information of the organizations is presented in separate columns in the government-wide financial statements to emphasize that the organizations are legally separate from the State. The State is financially accountable for these organizations because the board members are appointed by the governor or other elected officials and the State is able to impose its will on their operations.
Arkansas Student Loan Authority (ASLA) was established pursuant to Act 873 of 1977. ASLA provides access to, and information about, educational funding for all Arkansas students interested in attending institutions of higher education. The board consists of seven members appointed by the governor. Bonds cannot be issued by ASLA without the consent of the State Board of Finance and approval of the governor.
39
Complete financial statements for ASLA can be obtained by contacting:
Arkansas Student Loan Authority 3801 Woodland Heights Road, Suite 200 Little Rock, AR 72212 Website: http://www.asla.info/
Arkansas Development Finance Authority (ADFA) was established pursuant to Act 1062 of 1985, as amended. ADFA provides financing through the issuance of taxable and tax-exempt bonds and other debt instruments for economic development, homeownership and affordable rental housing. The affairs of the Authority are governed by a board of directors composed of the State Treasurer, Director of the Department of Finance and Administration and eleven public members appointed by the governor. The board has the authority to hire a president who serves at the will of the governor.
Complete financial statements of ADFA can be obtained by contacting:
Arkansas Development Finance Authority 900 West Capitol, Suite 310 P. O. Box 8023 Little Rock, AR 72203 Website: http://www.arkansas.gov/adfa/
In addition, two nonprofit foundations are included as discretely presented component units following the government-wide financial statements. Although the State does not control the timing or amount of receipts from either of these foundations, the economic resources which the foundations hold and invest are almost entirely restricted by the donors for distribution and use benefiting the State and are significant to the State. As a result, these foundations are considered component units of the State in accordance with GASB Statement No. 14, as amended by GASB Statements No. 39 and 61.
The University of Arkansas Foundation, Inc. operates for charitable and educational purposes, including administering and investing gifts and other amounts received directly or indirectly for the benefit of the University of Arkansas. The Board of Directors of the foundation has twenty-two members, four of whom are current or previous members of the University of Arkansas Board of Trustees. The University of Arkansas Fayetteville Campus Foundation, Inc. was established by the Walton Family Charitable Support Foundation, Inc., for the exclusive benefit of the University of Arkansas, Fayetteville campus. The foundation was established on March 11, 2003, and exists primarily to support the Honors College, the Graduate School and the University’s library. The Board of Trustees of the foundation is made up of seven members, three of whom are also employees of the University of Arkansas at Fayetteville.
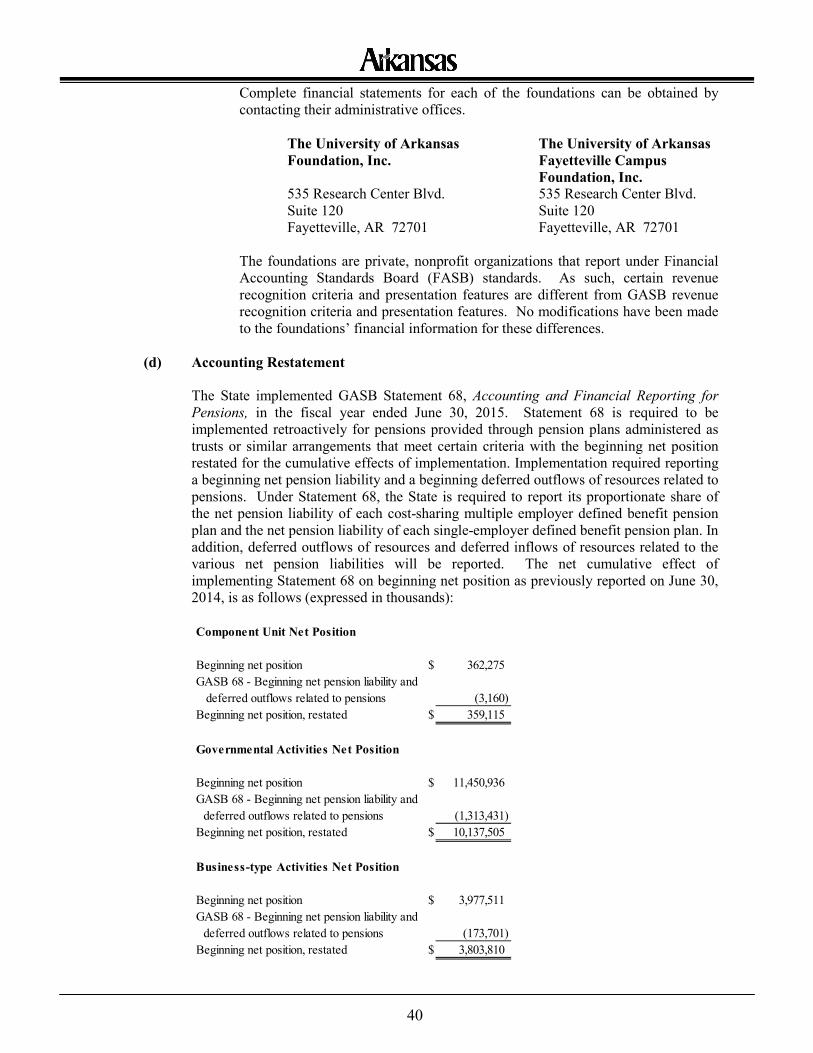
40
Complete financial statements for each of the foundations can be obtained by contacting their administrative offices.
The University of Arkansas Foundation, Inc.
The University of Arkansas Fayetteville Campus Foundation, Inc.
535 Research Center Blvd. Suite 120
535 Research Center Blvd. Suite 120
Fayetteville, AR 72701 Fayetteville, AR 72701 The foundations are private, nonprofit organizations that report under Financial Accounting Standards Board (FASB) standards. As such, certain revenue recognition criteria and presentation features are different from GASB revenue recognition criteria and presentation features. No modifications have been made to the foundations’ financial information for these differences.
(d) Accounting Restatement
The State implemented GASB Statement 68, Accounting and Financial Reporting for Pensions, in the fiscal year ended June 30, 2015. Statement 68 is required to be implemented retroactively for pensions provided through pension plans administered as trusts or similar arrangements that meet certain criteria with the beginning net position restated for the cumulative effects of implementation. Implementation required reporting a beginning net pension liability and a beginning deferred outflows of resources related to pensions. Under Statement 68, the State is required to report its proportionate share of the net pension liability of each cost-sharing multiple employer defined benefit pension plan and the net pension liability of each single-employer defined benefit pension plan. In addition, deferred outflows of resources and deferred inflows of resources related to the various net pension liabilities will be reported. The net cumulative effect of implementing Statement 68 on beginning net position as previously reported on June 30, 2014, is as follows (expressed in thousands):
Component Unit Net Position
Beginning net position $ 362,275GASB 68 - Beginning net pension liability and deferred outflows related to pensions (3,160)Beginning net position, restated $ 359,115
Governmental Activities Net Position
Beginning net position $ 11,450,936GASB 68 - Beginning net pension liability and
deferred outflows related to pensions (1,313,431)Beginning net position, restated $ 10,137,505
Business-type Activities Net Position
Beginning net position $ 3,977,511GASB 68 - Beginning net pension liability and
deferred outflows related to pensions (173,701)Beginning net position, restated $ 3,803,810
41
(e) Measurement Focus and Basis of Accounting
The accrual basis of accounting, with a “flow of economic resources” measurement focus, is utilized in the government-wide financial statements, proprietary funds, fiduciary funds and discretely presented component units. Under this accounting basis, revenues are recognized when earned and expenses are recognized when incurred, regardless of the timing of the related cash flows. Significant revenues susceptible to accrual include: individual and corporate income taxes, sales and use taxes, gas and other taxes, federal reimbursements, federal grants and other reimbursements for use of materials and services. In general, tax revenue is recognized on the government-wide statement of activities when assessed or levied.
The governmental fund financial statements are prepared using a “flow of current financial resources” measurement focus and the modified accrual basis of accounting. Revenues are recognized when they become both measurable and available. “Available” means expected to be collected within the current period or soon enough thereafter to be used to pay liabilities of the current period (i.e., 45 days). Tax revenue is recognized to the extent that it is both measurable and available. Revenues from federal grants and federal reimbursements are recognized when all applicable eligibility requirements and the availability criteria of 45 days have been met, except for Medicaid and State Children’s Health Insurance Program revenues, which are recognized using a one-year availability criterion. Revenues from other sources are recognized when received. Expenditures are recorded at the time fund liabilities are incurred except (1) inventories generally are recorded as expenditures when consumed and (2) principal and interest on long-term debt, claims, judgments and compensated absences are recorded when payment is due. Proprietary funds distinguish operating revenues and expenses from non-operating items. Operating revenues and expenses generally result from providing services or producing and delivering goods. All other revenues and expenses are reported as non-operating revenues and expenses. For the pension trust funds, employee contributions are recognized in the period in which contributions are due. Employer contributions are recognized when due and the employer has made a formal commitment to provide the contributions. Contributions from employees and employers for service through June 30 are accrued. These contributions are considered to be fully collectible and, accordingly, no allowance for uncollectible receivables is reflected in the financial statements. Benefits and refunds are recognized when due and payable in accordance with provisions set forth in the Arkansas Code.
(f) Government-Wide Financial Statements
The statement of net position and the statement of activities report information on all non-fiduciary activities of the primary government and its component units. Primary government activities are identified as either governmental or business-type activities. Governmental activities generally are financed through taxes, intergovernmental revenues and other non-exchange revenues. Business-type activities are financed, in whole or in part, by fees charged to external parties for goods or services.
42
The statement of net position presents the State’s non-fiduciary assets and liabilities, with the difference reported as net position. Net position is reported in three categories:
• Net investment in capital assets consists of capital assets, net of accumulated depreciation, reduced by outstanding balances for bonds, notes and other debt that are attributed to the acquisition, construction or improvement of those assets, and adjusted for any deferred outflows of resources and deferred inflows of resources that are attributable to the acquisition, construction or improvement of those assets or related debt.
• Restricted net position results when constraints placed on asset use are either externally imposed by creditors, grantors, contributors or the like or imposed by law through constitutional provision or enabling legislation. The amount of restricted assets is reduced by liabilities and deferred inflows of resources related to those assets.
• Unrestricted net position does not meet the definition of the two preceding categories and is generally available for government purposes.
In the government-wide statement of activities, revenues and expenses are segregated by activity (governmental or business-type), then further by function (e.g., general government, education, health and human services, etc.). Direct expenses are those that are clearly identifiable with a specific function. Revenues are classified as either program or general revenues. Program revenues include: (1) charges to customers for goods, services or privileges provided; (2) operating grants and contributions and (3) capital grants and contributions. Internally, dedicated resources are reported as general revenues rather than as program revenue. Taxes and other items not meeting the definition of program revenues are instead reported as general revenue. Certain indirect costs are included in the program expenses reported for individual functions and activities. As a general rule, the effect of interfund activity has been eliminated from the government-wide financial statements. Exceptions to the rule are: (1) activities between funds reported as governmental activities and funds reported as business-type activities and (2) activities between funds that are reported in different functional categories in either the governmental or business-type activities column. Elimination of these activities would distort the direct costs and program revenues for the functions concerned. When both restricted and unrestricted resources are available for use, it is the State’s policy to use restricted resources first, then unrestricted resources as they are needed.
(g) Fund Financial Statements
Separate financial statements are provided for the governmental fund (i.e., the General Fund), proprietary funds and fiduciary funds, even though the latter are excluded from the government-wide financial statements. The major individual governmental fund (General Fund) and the major individual proprietary funds (i.e., the Higher Education Fund, Workers’ Compensation Commission, Department of Workforce Services and the Office of the Arkansas Lottery) are reported as separate columns in the fund financial statements, with non-major funds being combined into a single column for the proprietary funds. In the fund financial statements, transfers represent flows of cash or assets without equivalent flows of assets in return or a requirement for repayment. In addition, transfers
43
are recorded when a fund receiving revenue provides the revenue to the fund which expends the resources. The following describes the major funds and categories used in the accompanying financial statements: Governmental Fund
The General Fund is the major Governmental Fund of the State. As the general operating fund of the State, it is used to account for all financial resources obtained and expended for those services normally provided by the State which is not accounted for in other funds. The focus of Governmental Fund measurement (in the fund financial statements) is upon determination of financial position and changes in financial position (sources, uses and balances of financial resources) rather than upon net income. Proprietary Funds The focus of Proprietary Fund measurement is upon determination of operating income, changes in net position, financial position and cash flows; which is similar to a business. These funds are used to account for operations of those state agencies providing goods or services to the general public on a user-charge basis, or where the State has decided that periodic determination of revenues earned, expenses incurred and/or income is appropriate for capital maintenance, public policy, management control, accountability or other purposes. The following are descriptions of the major proprietary funds of the State: Higher Education Fund The financial statements of the Higher Education Fund, which accounts for the activities of the State’s higher education system, are prepared as a business-type activity with the accounting guidance and reporting practices applicable to colleges and universities.
Workers’ Compensation Commission Fund The Workers’ Compensation Commission Fund accounts for the activities of the Workers’ Compensation Commission (WCC), which is responsible for providing a prompt and equitable system of compensation for injury or illness sustained during the course of employment. Operating revenues include assessments, fees and charges paid by insurance carriers, self-insured employers and public employers. Operating expenses include benefit and aid payments, administrative expenses and depreciation and amortization of capital assets. Department of Workforce Services - Unemployment Insurance Fund The Unemployment Insurance Fund reports the Unemployment Insurance Program administered by the Department of Workforce Services. Operating revenues include contributions from employers for unemployment insurance and other charges. Operating expenses include benefit and aid payments, administrative expenses and depreciation and amortization of capital assets.
44
Office of the Arkansas Lottery Fund The Office of the Arkansas Lottery Fund’s primary purpose is to supplement higher education scholarships with net proceeds from the State’s lotteries. Non-Major Enterprise Funds The Non-Major Enterprise Funds consist of the War Memorial Stadium Commission, which is responsible for the operation of the War Memorial Stadium, a facility available for use to all the schools, colleges and universities in the State under the supervision of the agency; the Construction Assistance Revolving Loan Fund, which is responsible for providing a perpetual fund for financing the construction of waste water treatment facilities for municipalities and other public entities; and the Public School Employee Health and Life Benefit Plan, which is responsible for providing health and life insurance along with a prescription drug benefit to participating public school employees. Other Non-Major Enterprise Funds are the Other Revolving Loan Funds, which are responsible for the planning, design, acquisition, construction, expansion, equipping and/or rehabilitation for water systems; for the financing of capitalizable educational and general projects for community and technical colleges; for the financing of energy efficiency and conservation projects for residential homes; for the establishment of a cooperative pilot program with the Clinton Climate Initiative to increase the energy efficiency of Arkansas companies and provide audit and retrofit opportunities for their employees; to incentivize development of affordable assisted living housing in Arkansas and to strengthen the financial feasibility of such developments; to finance energy efficiency retrofits and green energy implementation for industries and to hold equity investments made by the Risk Capital Matching Fund. Fiduciary Funds
Fiduciary Funds are used to account for resources held for the benefit of parties outside the State. Fiduciary Funds are not reflected in the government-wide financial statements because the resources of these funds are not available to support the State’s own programs. These funds include Pension Trust and Agency Funds. The Pension Trust Funds account for the activities of the Arkansas Judicial Retirement System, the Arkansas State Highway Employees Retirement System, the Arkansas Teacher Retirement System, the Arkansas Public Employee Retirement System and the Arkansas State Police Retirement System, which accumulate resources required to be held in trust for members and beneficiaries of the respective plans. Agency Funds are custodial in nature (assets equal liabilities) and do not involve the measurement of results of operations. These funds account for the collection and disbursement of sales and use taxes to local governments within the State, the collection of assets of bankrupt insurance companies and the payment of claims against those companies, and for other miscellaneous accounts for the benefit of other parties.
(h) Assets, Liabilities, Deferred Outflows of Resources, Deferred Inflows of Resources and Net Position or Fund Balance
Cash and Cash Equivalents
Cash and cash equivalents include demand accounts, imprest accounts, cash on hand, all certificates of deposit with maturities at purchase of 90 days or less and all short-term instruments with maturities at purchase of 90 days or less. Short-term investments for the
45
Arkansas State Highway Employees Retirement System are stated at amortized cost. All other short-term investments are stated at fair value. Investments
Investments include U.S. Government and government agency obligations, repurchase agreements, mutual funds, real estate, limited partnerships, foreign currency contracts, asset-backed securities, guaranteed investment contracts, state and local government obligations and corporate debt and equity obligations. Investments are reported at fair value. Investments in the Pension Trust Funds are reported at fair value as determined by the custodial agents. The agents’ determination of fair value includes, among other things, using pricing services or prices quoted by independent brokers at current exchange rates. Securities on loan for cash collateral and the related liabilities are reported in the statement of net position. Security lending transactions are discussed in Note 4. Unrealized gains and losses on investments are included in investment earnings on the respective operating statements. The University of Arkansas System (the System) and the University of Arkansas (UA) Foundation has established an external investment pool (the Pool). The investments in the Pool are managed by the UA Foundation. The University of Arkansas Board of Trustees and the University of Arkansas Foundation, Inc. Board of Trustees are the sponsors of this investment pool and are responsible for the operation and oversight. Participation in the Pool is voluntary. At June 30, 2015, five campuses and five foundations participate in the Pool. The foundations hold approximately $1.4 billion (external portion) of the investments in the Pool. The Pool issues a publicly available financial report, which may be obtained by writing the University of Arkansas Foundation, 535 Research Center Boulevard, Suite 120, Fayetteville, AR, 72701.
Interfund Receivables and Payables
Activity between funds that are representative of lending/borrowing arrangements outstanding at the end of the fiscal year are referred to as either “due to/from other funds” (current portion) or “advances to/from other funds” (noncurrent portion). All other outstanding balances between funds are reported as “due to/from other funds.” Any residual balances outstanding between the governmental activities and business-type activities are reported in the government-wide financial statements as “internal balances.” Inventories and Prepaid Items Inventories of materials and supplies are valued at cost, principally using the first-in/first-out method. The costs of governmental fund-type inventories are recorded using the consumption method which records expenditures when consumed. Certain payments to vendors reflect costs applicable to future accounting periods and are recorded as prepaid items in the government-wide and fund financial statements. Inventory and prepaid balances, as reported in the general fund financial statements, are recorded as nonspendable components of fund balance indicating that they do not constitute “available, spendable financial resources.”
46
Noncurrent Cash and Investments
Cash and investments that are externally restricted to make debt service payments, to maintain sinking or reserve funds or to purchase capital or other noncurrent assets are classified as noncurrent assets in the statement of net position. Cash, cash equivalents and investments relating to university endowments are also reflected as noncurrent assets in the statement of net position.
Capital Assets
Methods Used to Value Capital Assets
Capital assets, which include property, plant, equipment, infrastructure items (e.g., roads, bridges, ramps and similar items) and intangible assets are reported in the applicable governmental or business-type activity columns of the government-wide financial statements. Such assets are recorded at historical cost or estimated historical cost if purchased or constructed. Donated capital assets are recorded at fair value at the date of donation. Capitalization Policies
All land and other non-depreciable assets are capitalized, regardless of cost. Buildings and building improvements are capitalized when the cost of the building, or an improvement which becomes an integral part of a building, exceeds $100 thousand. All other tangible assets, including equipment, are capitalized when the cost of an individual item exceeds $5 thousand and the estimated useful life exceeds one year. Intangible assets are recorded at historical cost and depreciated using the same method for tangible assets. It is the State’s policy to capitalize when the individual item’s cost exceeds $1.0 million for internally generated software or $5 thousand for all other intangible assets and the estimated useful life exceeds one year. The costs of normal maintenance and repairs that do not significantly add to the value of assets or materially extend asset lives are not capitalized. The State reported a significant portion of their infrastructure assets for the first time in fiscal year 2002. Estimated costs were retroactive to 1971. The State’s current policy is to record new infrastructure acquisitions at historical cost and to use the depreciation method in reporting long-term infrastructure assets.
The University of Arkansas adopted the following separate policy for capitalization of intangible assets:
Asset ClassCapitalization
Threshold Useful LifeSoftware – Purchased $ 500,000 5-10 yearsSoftware – Internally developed 1,000,000 10 yearsEasements 250,000 15 yearsLand use rights 250,000 15 yearsTrademarks and Copyrights 250,000 15 yearsPatents 250,000 20 years
47
Items not Capitalized and Depreciated
The State possesses certain capital assets that have not been capitalized and depreciated because the assets cannot be reasonably valued and/or the assets have inexhaustible useful lives. These assets include works of art and historical treasures such as: statues, monuments, historical documents, paintings, rare library books, miscellaneous capital-related artifacts and furnishings and the like. GASB Statement No. 34 does not require these items to be capitalized because (1) the items are held for reasons other than financial gain; (2) the items are protected, kept unencumbered, cared for, and preserved; and (3) the items are subject to a State policy requiring that the proceeds from the sales of collection items be used to acquire other items for collections. The State also acts as an agent for the tracking and disbursement of federal surplus property. The assigned value of this property at June 30, 2015, is $39.4 million and is not reflected in the financial statements. Depreciation and Useful Lives
Applicable capital assets are depreciated using the straight-line method, with a full month charged for assets acquired in the first half of the month and a half-month charged for assets acquired in the second half of the month. Assets were assigned estimated useful lives most suitable for the particular assets. Estimated useful lives generally assigned are as follows:
Accrued and Other Current Liabilities The State has established a liability for both reported and unreported insured events in the government-wide financial statements, which includes estimates of future payments of claims and related claim adjustment expenses, based on the estimated ultimate cost of settling claims. In estimating its liability for incurred but unpaid claims, the State considers prior experience, industry information and currently recognized trends affecting data specific to the State. Actual claim costs depend upon such factors as duration of worker disability, medical cost trends, occupational disease and inflation. The process used in computing the ultimate cost of settling claims and expense for administering claims is necessarily based on estimates. The Internal Revenue Code of 1986 limits the amount of income that issuers of certain tax-exempt bonds can earn from investing the bond proceeds. Such excess, called arbitrage rebates, must be remitted to the federal government. The Construction Assistance Revolving Loan Fund, ADFA and ASLA make provision for arbitrage rebates as they are incurred.
Assets YearsEquipment 5-20Buildings & building improvements 20-50Infrastructure 10-40Land improvements 10-100Intangibles 4-95Other capital assets 10-15
48
Income Tax Refunds Payable Income tax refunds are accounted for as a reduction in the appropriate tax revenue category. The amount reported as income tax refunds payable at June 30, 2015, is related to projected refund estimates attributable to fiscal year 2015 tax revenues. Compensated Absences
In the government-wide and proprietary fund financial statements, the State accrues liabilities for compensated absences as services are incurred and benefits accrue to employees.
In the governmental fund financial statements, liabilities for compensated absences are accrued only if they have matured and are recorded in the fund only for separations or transfers that occur before year-end. Deferred Outflows of Resources and Deferred Inflows of Resources
Deferred outflows of resources represent a decrease of net position that applies to future periods. Thus, these items will not be recognized as an outflow of resources (an expense or expenditure) until a future period. Deferred inflows of resources represent an increase of net position that applies to future periods. These items will not be recognized as an inflow of resources (revenue) until a future period.
Pensions
For purposes of measuring the net pension liability, deferred outflows of resources related to pensions, deferred inflows of resources related to pensions and pension expense, information about the fiduciary net positions of the various pension funds and the additions to and deductions from their respective fiduciary net positions have been determined on the same basis as they are reported by the retirement systems. For this purpose, benefit payments (including refunds of employee contributions) are recognized when due and payable in accordance with the benefit terms. Investments are reported at fair value. Bond-Related Items
In the government-wide financial statements and proprietary fund financial statements, long-term debt and long-term liabilities are reported as liabilities. Bond premiums, discounts and insurance costs are reported and amortized over the life of the bonds using the straight-line method. Bond issuance costs other than insurance are recognized in the period of issuance. Bonds payable are reported net of the applicable bond premium or discount.
In the governmental fund financial statements, bond premiums, discounts and bond issuance costs are recognized in the period of issuance. The face amount of the debt issued is reported as other financing sources. Premiums received on debt issuances are reported as other financing sources, while discounts on debt issuances are reported as other financing uses. Issuance costs, whether or not withheld from the actual debt proceeds, are reported as debt service expenditures.
49
Net Position/Fund Balance
The difference between total assets, total deferred outflows of resources, total liabilities and total deferred inflows of resources is presented as “Net Position” on the government-wide, proprietary and fiduciary fund financial statements and as “Fund Balance” on the governmental fund financial statements.
Fund Balance Classifications
In the governmental fund financial statements, fund balance is reported in one of five classifications based on the constraints imposed on the use of the resources.
The non-spendable fund balance includes amounts that cannot be spent because they are either not in spendable form (for example, prepaid items and inventories) or legally or contractually required to be maintained intact. The spendable portion of fund balance comprises the remaining four classifications: restricted, committed, assigned and unassigned.
Restricted fund balance This classification reflects constraints imposed on resources either (1) externally by creditors, grantors, contributors, or laws or regulations of other governments; or (2) imposed by law through constitutional provisions or enabling legislation. Committed fund balance These amounts can only be used for specific purposes according to constraints imposed by legislation of the General Assembly – the government’s highest level of decision-making authority. Committed amounts cannot be used for any other purpose unless the General Assembly removes or changes the constraint by legislation. Assigned fund balance This classification reflects amounts constrained by the State’s “intent” to be used for specific purposes, but are neither restricted nor committed. The General Assembly has the authority to assign amounts to be used for specific purposes by legislation or by approved methods of financing. Unassigned fund balance This amount is the residual classification for the General Fund.
When more than one spendable classification is available for use, it is the State’s policy to use the resources in this order: restricted, committed, assigned and unassigned.
See Note 13 for additional information about fund balances.
Restricted Assets/Net Position
Assets and net position are reported as restricted when constraints placed on the asset or net position use are either (1) externally imposed by creditors (such as through debt covenants), grantors, contributors, or laws or regulations of other governments; or (2)
50
imposed by law through constitutional provision or enabling legislation. Restricted net position primarily consists of unemployment compensation, bond resolution programs, tobacco settlement, debt service, capital projects, and various other purposes and may be used only for the legally restricted purposes as allowed by law.
Reclassifications
Certain amounts presented in the prior year data have been reclassified in order to be consistent with the current year presentation.
(i) Use of Estimates The preparation of financial statements in conformity with GAAP requires management to make estimates and assumptions that affect the reported amounts of assets and liabilities, disclosure of contingent assets and liabilities at the date of the financial statements and the reported amount of revenue and expenditures/expenses during the reporting period. Actual results could differ from those estimates.
(j) New Accounting Pronouncements Not Yet Required to be Adopted GASB Statement No. 72, Fair Value Measurement and Application, provides guidance for determining fair value measurement for financial reporting. In addition, Statement 72 provides guidance for determining fair value for certain investments and making note disclosures related to fair value measurements. The requirements of this Statement are effective for reporting periods beginning after June 15, 2015 (i.e. fiscal year 2016). GASB Statement No. 73, Accounting and Financial Reporting for Pensions and Related Assets That Are Not within the Scope of GASB Statement 68, and Amendments to Certain Provisions of GASB Statements 67 and 68, establishes accounting and financial reporting requirements for defined benefit pensions and defined contribution pensions that are not covered by Statement 68. This Statement also provides guidance for reporting assets accumulated to provide defined benefit pensions. The requirements in Statement 73 are similar to those in Statement No. 68 with modifications that address the requirement that the resources accumulated for pensions within the scope of this Statement should not be accounted for as pension plan assets. This Statement also provides amendments to Statements 67 and 68 that clarify note disclosure requirements for required supplementary information, accounting and financial reporting for separately financed specific liabilities, and employer recognition of support from nonemployer contributing entities not in a special funding situation. Provisions in this Statement are effective in three parts. (1) The provisions that address accounting and financial reporting by employers and governmental nonemployer contributing entities for pensions not within the scope of Statement 68 are effective for fiscal years beginning after June 15, 2016 (i.e. fiscal year 2017). (2) The provisions related to financial reporting for assets accumulated for purposes of providing those pensions are effective for fiscal years beginning after June 15, 2015 (i.e. fiscal year 2016). (3) The requirements of this Statement related to amendments to Statements 67 and 68 are effective for fiscal years beginning after June 15, 2015 (i.e. fiscal year 2016). GASB Statement No. 74, Financial Reporting for Postemployment Benefit Plans Other Than Pension Plans, addresses the financial reporting by defined benefit post-employment benefit plans other than pensions (other post-employment benefits or OPEB) that are administered through trust that meet specified criteria. This Statement will supersede the requirements in Statement No. 43, Financial Reporting for
51
Postemployment Benefit Plans Other Than Pension Plans and Statement No. 57, OPEB Measurements by Agent Employers and Agent Multiple-Employer Plans. The Statement also establishes note disclosure requirements for defined contribution OPEB plans that replace the requirements in Statement 25, Financial Reporting for Defined Benefit Pension Plans and Note Disclosures for Defined Contribution Plans, Statement No. 43, and Statement No. 50, Pension Disclosures. This Statement also provides guidance for financial reporting of assets accumulated to provide defined benefit OPEB through plans that are not administered through trusts that meet the specified criteria. The requirements of this Statement are effective for fiscal years beginning after June 15, 2016 (i.e. fiscal year 2017). GASB Statement No. 75, Accounting and Financial Reporting for Postemployment Benefits Other Than Pensions, addresses accounting and financial reporting by state and local governments that provide OPEB to their employees and for state and local governments that finance OPEB for employees of other governments. This Statement will supersede the requirements in Statement No. 45, Accounting and Financial Reporting by Employers for Postemployment Benefits Other Than Pension Plans, and Statement No. 57, OPEB Measurements by Agent Employers and Agent Multiple-Employer Plans. This Statement requires governments to report a liability on the face of the financial statements for the OPEB as well as related deferred outflows of resources, deferred inflows of resources, and expense/expenditures. This Statement requires extensive note disclosures and required supplementary information schedules. The requirements of this Statement are effective for reporting periods beginning after June 15, 2017 (i.e. fiscal year 2018).
GASB Statement No. 76, The Hierarchy of Generally Accepted Accounting Principles for State and Local Governments, identifies the sources of generally accepted accounting principles (GAAP) and the framework for selecting the principles used to prepare financial statements of state and local governments in conformity with GAAP. This Statement will supersede the requirements in Statement No. 55, The Hierarchy of Generally Accepted Accounting Principles for State and Local Governments. The requirements of this Statement are effective for reporting periods beginning after June 15, 2015 (i.e. fiscal year 2016).
GASB Statement No. 77, Tax Abatement Disclosures, requires disclosure of information about the tax abatement agreements that affect the reporting government’s tax revenues. The disclosures required are general descriptive information about the agreements, the number of agreements, the gross dollar amount of taxes abated during the reporting period and commitments made by the government in addition to abatement of taxes. The requirements of this Statement are effective for reporting periods beginning after December 15, 2015 (i.e. fiscal year 2017).
(2) Deposits and Investments
The deposits and investments of the State are exposed to risks that have the potential to result in losses. The following information discloses risks related to custodial credit, interest rate and foreign currency, as well as policies related to these risks. The higher education component units are not included in the following information. The Foundations are private nonprofit organizations that report under Financial Accounting Standards Board standards and are not required to report under Governmental Accounting Standards Board standards. As such, the Foundations are not required to report deposit and investment risks.
52
(a) Deposits
Custodial credit risk for deposits is the risk that in the event of a financial institution failure, the State may not recover deposits or collateral securities that are in the possession of an outside party. The State’s Board of Finance policy states that collateralizing deposits in excess of FDIC deposit insurance coverage with securities pledged to a cash fund agency by a financial institution to be held by a third party custodian is required to protect public funds in case of a default by the financial institution. Institutions of higher education and the Arkansas Public Employees Retirement System do not have a deposit policy for custodial credit risk. At June 30, 2015, the reported bank balances of the general fund were $845,418,536. Of this amount, $6,543,921 was uninsured and uncollateralized and $1,140,593 was uninsured and collateralized with securities held by the pledging financial institution. At June 30, 2015, the reported bank balances of the enterprise funds were $994,464,560. Of this amount, $816,976 was uninsured and uncollateralized, $22,781,933 was uninsured and collateralized with securities held by the pledging financial institution’s trust department or agent but not in the State’s name and $18,628,571 was uninsured and collateralized with securities held by the pledging financial institution. At June 30, 2015, the reported bank balances of the fiduciary funds were $605,648,796. Of this amount, $5,033,805 was uninsured and uncollateralized. At June 30, 2015, the reported bank balances of the component units were $6,648,196. Of this amount, $3,155,000 was uninsured and uncollateralized and $881,000 was uninsured and collateralized with securities held by the pledging financial institution’s trust department or agent but not in the State’s name.
(b) Investments
Interest Rate Risk Interest rate risk is defined as the risk that changes in interest rates will adversely affect the fair value of an investment. Also, the terms of a debt investment may cause its fair value to be highly sensitive to interest rate changes. The State Treasury’s interest rate risk policy is that the average maturity of the total portfolio will not exceed ten years except securities used as collateral in repurchase agreements, Arkansas Capital Corporation Bonds, and State Board of Finance and State Building Services Certificates of Indebtedness. The investment policy for funds managed by the State Treasurer for the State Money Management Trust Fund states that the average maturity of the portfolio will not exceed 90 days, and the expected maturity of any security will not exceed five years, except securities used as collateral in repurchase agreements. The State Board of Finance requires that every effort should be made to match maturity of investments with expenditure requirements. The institutions of higher education and the retirement systems do not have formal investment policies that limit the investment maturities as a means of managing the exposure to fair value losses arising from increased interest rates.
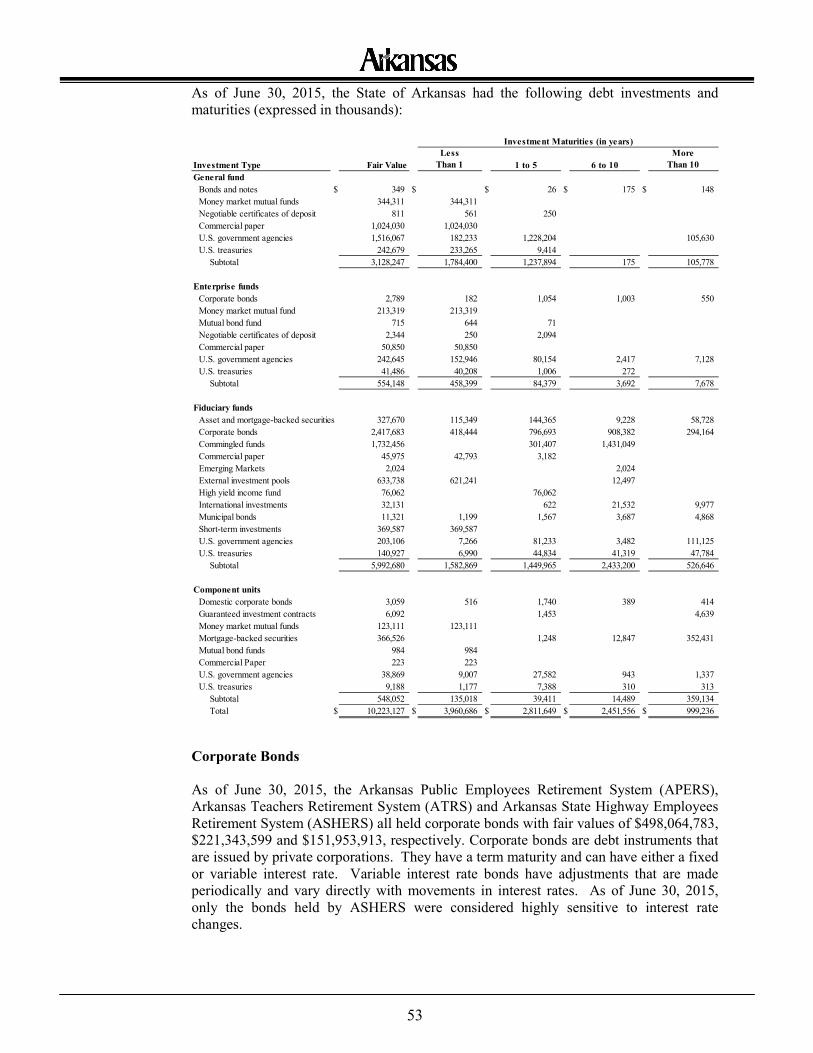
53
As of June 30, 2015, the State of Arkansas had the following debt investments and maturities (expressed in thousands):
Corporate Bonds
As of June 30, 2015, the Arkansas Public Employees Retirement System (APERS), Arkansas Teachers Retirement System (ATRS) and Arkansas State Highway Employees Retirement System (ASHERS) all held corporate bonds with fair values of $498,064,783, $221,343,599 and $151,953,913, respectively. Corporate bonds are debt instruments that are issued by private corporations. They have a term maturity and can have either a fixed or variable interest rate. Variable interest rate bonds have adjustments that are made periodically and vary directly with movements in interest rates. As of June 30, 2015, only the bonds held by ASHERS were considered highly sensitive to interest rate changes.
Investment Type Fair ValueLess
Than 1 1 to 5 6 to 10More
Than 10General fund
Bonds and notes $ 349 $ $ 26 $ 175 $ 148Money market mutual funds 344,311 344,311Negotiable certificates of deposit 811 561 250Commercial paper 1,024,030 1,024,030U.S. government agencies 1,516,067 182,233 1,228,204 105,630U.S. treasuries 242,679 233,265 9,414
Subtotal 3,128,247 1,784,400 1,237,894 175 105,778
Enterprise fundsCorporate bonds 2,789 182 1,054 1,003 550Money market mutual fund 213,319 213,319Mutual bond fund 715 644 71Negotiable certificates of deposit 2,344 250 2,094Commercial paper 50,850 50,850U.S. government agencies 242,645 152,946 80,154 2,417 7,128U.S. treasuries 41,486 40,208 1,006 272
Subtotal 554,148 458,399 84,379 3,692 7,678
Fiduciary fundsAsset and mortgage-backed securities 327,670 115,349 144,365 9,228 58,728Corporate bonds 2,417,683 418,444 796,693 908,382 294,164Commingled funds 1,732,456 301,407 1,431,049Commercial paper 45,975 42,793 3,182Emerging Markets 2,024 2,024External investment pools 633,738 621,241 12,497High yield income fund 76,062 76,062International investments 32,131 622 21,532 9,977Municipal bonds 11,321 1,199 1,567 3,687 4,868Short-term investments 369,587 369,587U.S. government agencies 203,106 7,266 81,233 3,482 111,125U.S. treasuries 140,927 6,990 44,834 41,319 47,784
Subtotal 5,992,680 1,582,869 1,449,965 2,433,200 526,646
Component unitsDomestic corporate bonds 3,059 516 1,740 389 414Guaranteed investment contracts 6,092 1,453 4,639Money market mutual funds 123,111 123,111Mortgage-backed securities 366,526 1,248 12,847 352,431Mutual bond funds 984 984Commercial Paper 223 223U.S. government agencies 38,869 9,007 27,582 943 1,337U.S. treasuries 9,188 1,177 7,388 310 313
Subtotal 548,052 135,018 39,411 14,489 359,134Total $ 10,223,127 $ 3,960,686 $ 2,811,649 $ 2,451,556 $ 999,236
Investment Maturities (in years)
54
Convertible Corporate Bonds As of June 30, 2015, APERS and ATRS held convertible bonds with fair values of $195,538,208 and $437,327,280, respectively. Convertible bonds convey an option to the bondholder to exchange each bond for a specified number of shares of common stock of the corporation. Convertible bonds offer lower coupon rates and promised yields to maturity than do nonconvertible bonds. A variable coupon varies directly with movements in interest rates. As of June 30, 2015, none of the retirement systems held convertible securities that were considered highly sensitive to changes in interest rates. Credit Risk
Credit risk of investments is the risk that an issuer or other counterparty to an investment will not fulfill its obligations. The State Treasury’s credit risk policy is that bankers’ acceptances and commercial paper carry an investment rating of P-1 or better by Moody’s Investors Service (MIS) and a rating of A-1 or better by Standard and Poor’s (S&P) for maturities exceeding 90 days but not exceeding 180 days. For maturities not exceeding 90 days, the ratings for commercial paper should be P-2 or better by MIS and A-2 or better by S&P. The Treasury’s policy for corporate bonds is that they be rated A or better by MIS and S&P for maturities of less than one year and that they be rated AA or better for maturities over one year. ASHERS’ policy is that debt securities purchased shall carry an investment rating of Baa or better by MIS and a rating of BBB or better by S&P. The other retirement systems and the institutions of higher education do not have a credit risk policy.
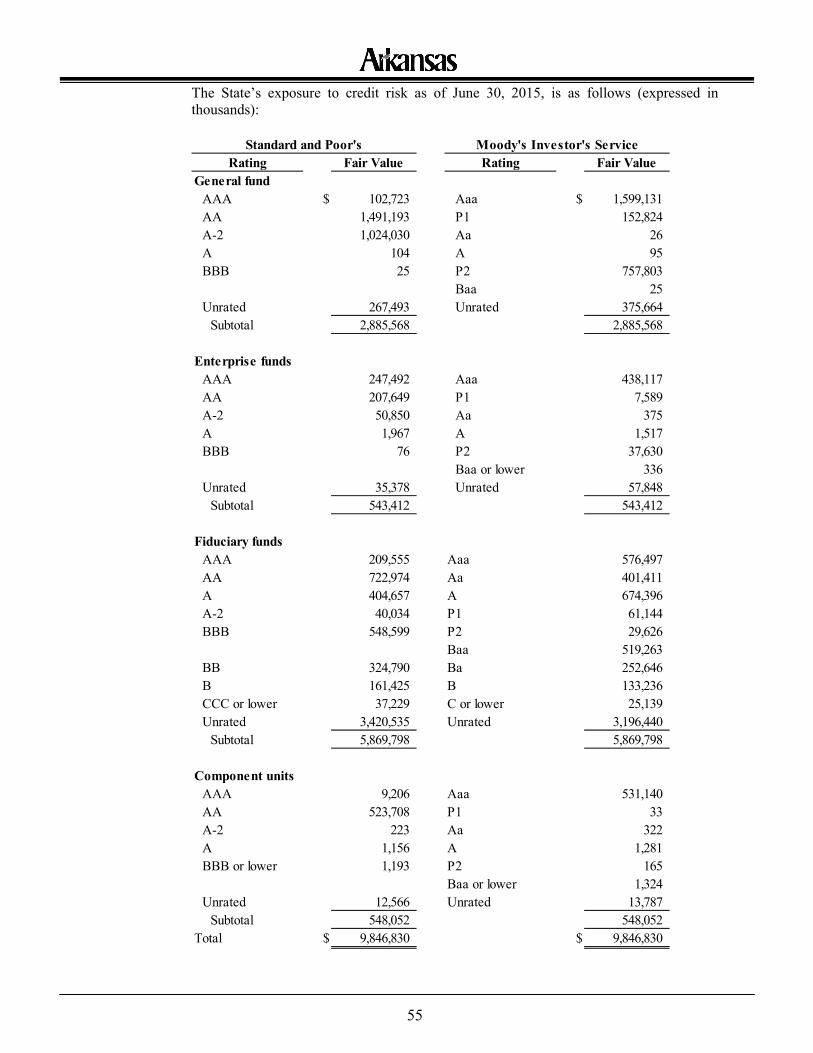
55
The State’s exposure to credit risk as of June 30, 2015, is as follows (expressed in thousands):
Rating Fair Value Rating Fair ValueGeneral fund
AAA $ 102,723 Aaa $ 1,599,131AA 1,491,193 P1 152,824A-2 1,024,030 Aa 26A 104 A 95BBB 25 P2 757,803
Baa 25Unrated 267,493 Unrated 375,664
Subtotal 2,885,568 2,885,568
Enterprise fundsAAA 247,492 Aaa 438,117AA 207,649 P1 7,589A-2 50,850 Aa 375A 1,967 A 1,517BBB 76 P2 37,630
Baa or lower 336Unrated 35,378 Unrated 57,848
Subtotal 543,412 543,412
Fiduciary fundsAAA 209,555 Aaa 576,497AA 722,974 Aa 401,411A 404,657 A 674,396A-2 40,034 P1 61,144BBB 548,599 P2 29,626
Baa 519,263BB 324,790 Ba 252,646B 161,425 B 133,236CCC or lower 37,229 C or lower 25,139Unrated 3,420,535 Unrated 3,196,440
Subtotal 5,869,798 5,869,798
Component unitsAAA 9,206 Aaa 531,140AA 523,708 P1 33A-2 223 Aa 322A 1,156 A 1,281BBB or lower 1,193 P2 165
Baa or lower 1,324Unrated 12,566 Unrated 13,787
Subtotal 548,052 548,052Total $ 9,846,830 $ 9,846,830
Standard and Poor's Moody's Investor's Service
56
Custodial Credit Risk
Custodial credit risk for investments is the risk that, in the event of failure of the counterparty, the State will not be able to recover the value of its investments or collateral securities that are in the possession of an outside party. The State Board of Finance requires that investment instruments should be held in safekeeping by financial institutions and that the cash fund manager should obtain safekeeping receipts. The institutions of higher education do not have a formal custodial credit risk policy. At June 30, 2015, the reported amount of the fiduciary funds’ investments was $5,992,680,361. Of this amount, $353,338 was uninsured and unregistered with securities held by the counterparty’s trust department or agent but not in the government’s name. At June 30, 2015, the reported amount of the enterprise funds’ investments was $1,021,680,920. Of this amount, $3,751,213 was uninsured and unregistered with securities held by the counterparty and $10,288,051 was uninsured and unregistered with securities held by the counterparty’s trust department or agent but not in the government’s name. Concentration of Credit Risk
Concentration of credit risk is the risk of loss attributable to the magnitude of the State’s investment in any one issuer that represents 5% or more of total investments. The State Treasury’s concentration of credit risk policy is that the investments, exclusive of funds managed by a securities lending agent, will not exceed the following percentages of the total portfolio: 15% in Bankers Acceptances, 30% in Total Debt of Corporations, including Bonds and Commercial Paper, and 10% in Certificates of Deposit.
The State places no limit on the amount the State Treasury may invest in U.S. government agency securities. The State’s investments representing greater than 5% of total investments of the general fund included Federal Home Loan Bank securities of $366,261,166; Federal Farm Credit Bank securities of $167,644,837; Federal National Mortgage Association securities of $668,816,006; and Federal Home Loan Mortgage Corporation securities of $288,250,621 or 11.63%, 5.32%, 21.24% and 9.15%, respectively. The State’s investments representing greater than 5% of total investments of the enterprise fund included Federal Home Loan Bank securities of $125,362,294 and Federal National Mortgage Association securities of $54,686,077 or 12.27% and 5.35%, respectively. The Arkansas Development Finance Authority (ADFA) and the Arkansas Student Loan Authority (ASLA), component units of the State, place no limit on the amount that may be invested in any one issuer. The component units’ investments in Federal National Mortgage Association securities represented $38,987,720 or 7.11% of total component units’ investments. Foreign Currency Risk
Foreign currency risk is the risk that changes in exchange rates will adversely affect the fair value of an investment or a deposit. The State does not have a formal investment policy for foreign currency risk.
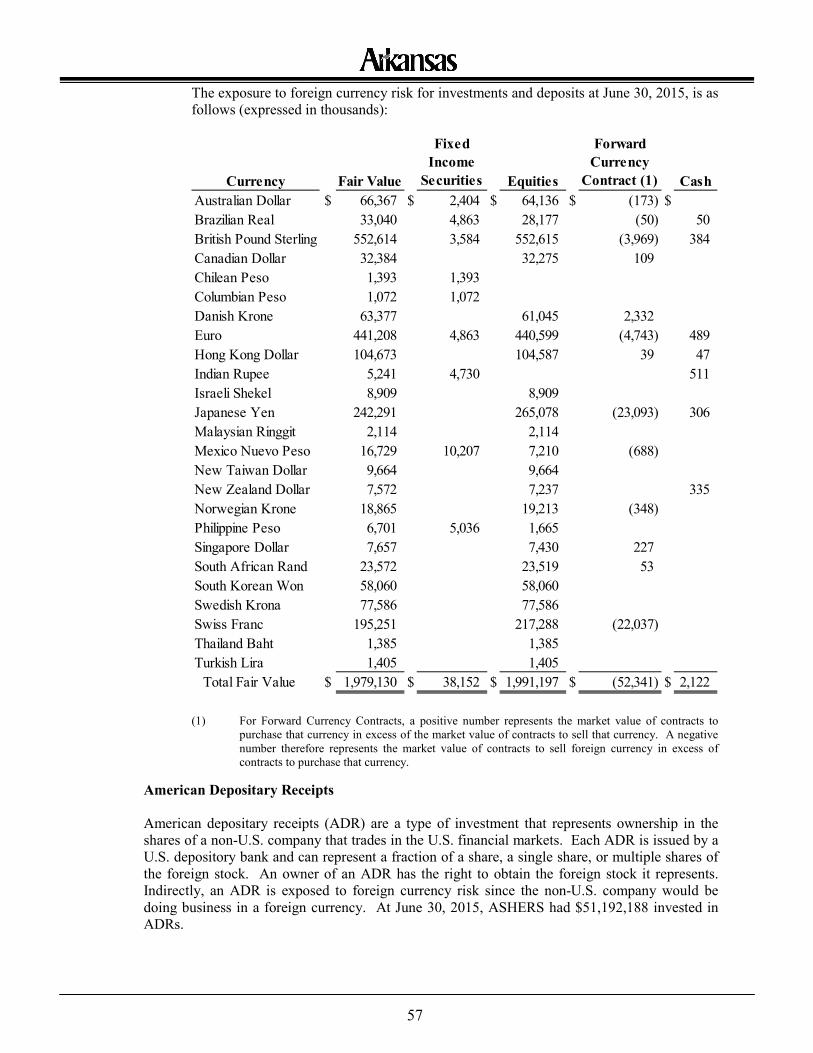
57
The exposure to foreign currency risk for investments and deposits at June 30, 2015, is as follows (expressed in thousands):
(1) For Forward Currency Contracts, a positive number represents the market value of contracts to
purchase that currency in excess of the market value of contracts to sell that currency. A negative number therefore represents the market value of contracts to sell foreign currency in excess of contracts to purchase that currency.
American Depositary Receipts American depositary receipts (ADR) are a type of investment that represents ownership in the shares of a non-U.S. company that trades in the U.S. financial markets. Each ADR is issued by a U.S. depository bank and can represent a fraction of a share, a single share, or multiple shares of the foreign stock. An owner of an ADR has the right to obtain the foreign stock it represents. Indirectly, an ADR is exposed to foreign currency risk since the non-U.S. company would be doing business in a foreign currency. At June 30, 2015, ASHERS had $51,192,188 invested in ADRs.
Currency Fair Value
Fixed Income
Securities Equities
Forward Currency
Contract (1) CashAustralian Dollar $ 66,367 $ 2,404 $ 64,136 $ (173) $Brazilian Real 33,040 4,863 28,177 (50) 50British Pound Sterling 552,614 3,584 552,615 (3,969) 384Canadian Dollar 32,384 32,275 109Chilean Peso 1,393 1,393Columbian Peso 1,072 1,072Danish Krone 63,377 61,045 2,332Euro 441,208 4,863 440,599 (4,743) 489Hong Kong Dollar 104,673 104,587 39 47Indian Rupee 5,241 4,730 511Israeli Shekel 8,909 8,909Japanese Yen 242,291 265,078 (23,093) 306Malaysian Ringgit 2,114 2,114Mexico Nuevo Peso 16,729 10,207 7,210 (688)New Taiwan Dollar 9,664 9,664New Zealand Dollar 7,572 7,237 335Norwegian Krone 18,865 19,213 (348)Philippine Peso 6,701 5,036 1,665Singapore Dollar 7,657 7,430 227South African Rand 23,572 23,519 53South Korean Won 58,060 58,060Swedish Krona 77,586 77,586Swiss Franc 195,251 217,288 (22,037)Thailand Baht 1,385 1,385Turkish Lira 1,405 1,405
Total Fair Value $ 1,979,130 $ 38,152 $ 1,991,197 $ (52,341) $ 2,122
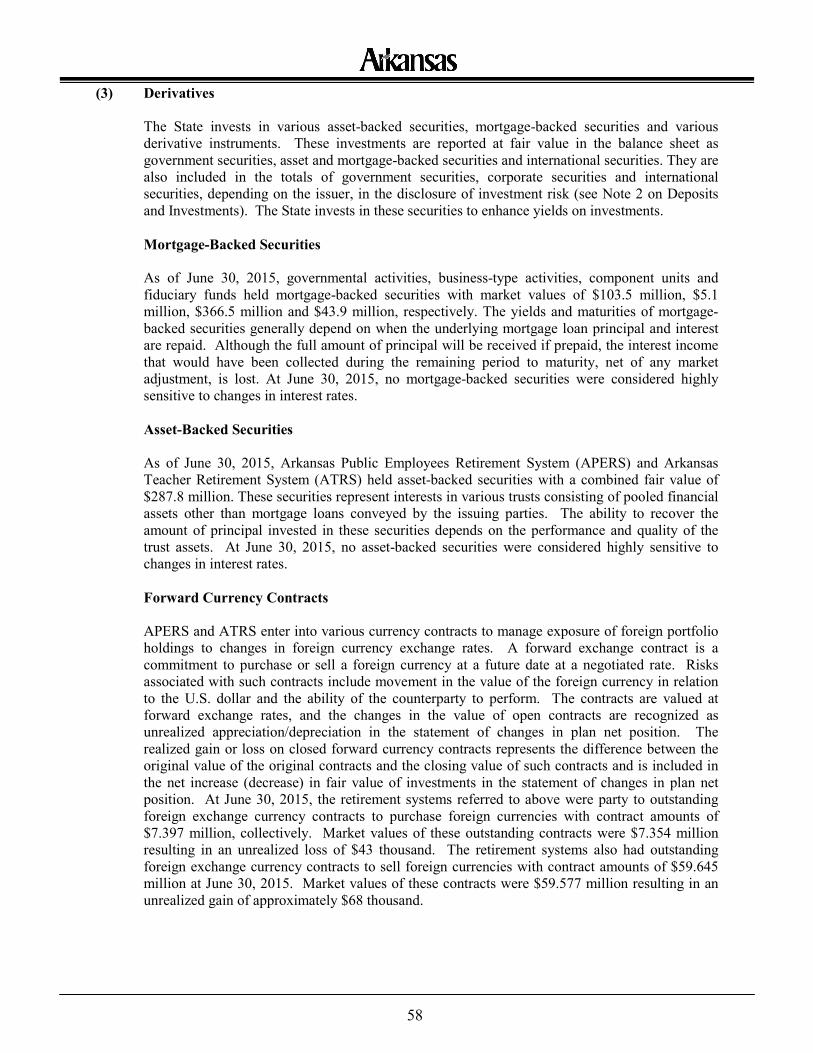
58
(3) Derivatives
The State invests in various asset-backed securities, mortgage-backed securities and various derivative instruments. These investments are reported at fair value in the balance sheet as government securities, asset and mortgage-backed securities and international securities. They are also included in the totals of government securities, corporate securities and international securities, depending on the issuer, in the disclosure of investment risk (see Note 2 on Deposits and Investments). The State invests in these securities to enhance yields on investments. Mortgage-Backed Securities As of June 30, 2015, governmental activities, business-type activities, component units and fiduciary funds held mortgage-backed securities with market values of $103.5 million, $5.1 million, $366.5 million and $43.9 million, respectively. The yields and maturities of mortgage-backed securities generally depend on when the underlying mortgage loan principal and interest are repaid. Although the full amount of principal will be received if prepaid, the interest income that would have been collected during the remaining period to maturity, net of any market adjustment, is lost. At June 30, 2015, no mortgage-backed securities were considered highly sensitive to changes in interest rates. Asset-Backed Securities As of June 30, 2015, Arkansas Public Employees Retirement System (APERS) and Arkansas Teacher Retirement System (ATRS) held asset-backed securities with a combined fair value of $287.8 million. These securities represent interests in various trusts consisting of pooled financial assets other than mortgage loans conveyed by the issuing parties. The ability to recover the amount of principal invested in these securities depends on the performance and quality of the trust assets. At June 30, 2015, no asset-backed securities were considered highly sensitive to changes in interest rates. Forward Currency Contracts APERS and ATRS enter into various currency contracts to manage exposure of foreign portfolio holdings to changes in foreign currency exchange rates. A forward exchange contract is a commitment to purchase or sell a foreign currency at a future date at a negotiated rate. Risks associated with such contracts include movement in the value of the foreign currency in relation to the U.S. dollar and the ability of the counterparty to perform. The contracts are valued at forward exchange rates, and the changes in the value of open contracts are recognized as unrealized appreciation/depreciation in the statement of changes in plan net position. The realized gain or loss on closed forward currency contracts represents the difference between the original value of the original contracts and the closing value of such contracts and is included in the net increase (decrease) in fair value of investments in the statement of changes in plan net position. At June 30, 2015, the retirement systems referred to above were party to outstanding foreign exchange currency contracts to purchase foreign currencies with contract amounts of $7.397 million, collectively. Market values of these outstanding contracts were $7.354 million resulting in an unrealized loss of $43 thousand. The retirement systems also had outstanding foreign exchange currency contracts to sell foreign currencies with contract amounts of $59.645 million at June 30, 2015. Market values of these contracts were $59.577 million resulting in an unrealized gain of approximately $68 thousand.
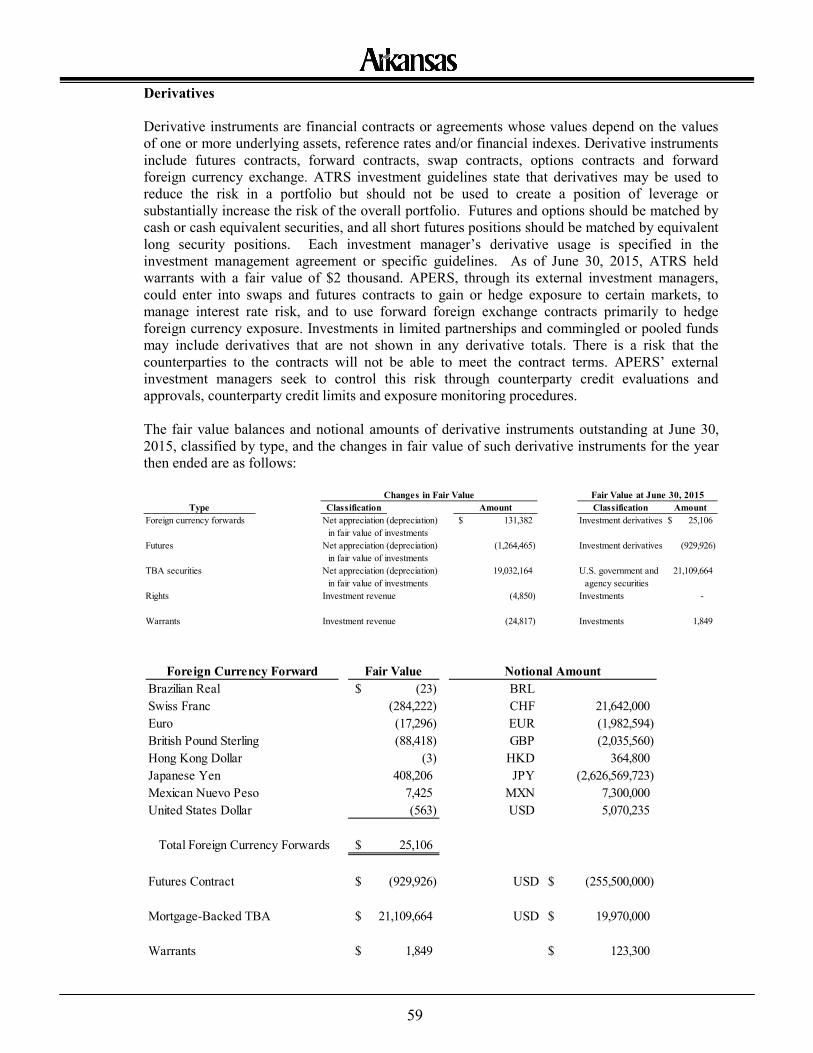
59
Derivatives Derivative instruments are financial contracts or agreements whose values depend on the values of one or more underlying assets, reference rates and/or financial indexes. Derivative instruments include futures contracts, forward contracts, swap contracts, options contracts and forward foreign currency exchange. ATRS investment guidelines state that derivatives may be used to reduce the risk in a portfolio but should not be used to create a position of leverage or substantially increase the risk of the overall portfolio. Futures and options should be matched by cash or cash equivalent securities, and all short futures positions should be matched by equivalent long security positions. Each investment manager’s derivative usage is specified in the investment management agreement or specific guidelines. As of June 30, 2015, ATRS held warrants with a fair value of $2 thousand. APERS, through its external investment managers, could enter into swaps and futures contracts to gain or hedge exposure to certain markets, to manage interest rate risk, and to use forward foreign exchange contracts primarily to hedge foreign currency exposure. Investments in limited partnerships and commingled or pooled funds may include derivatives that are not shown in any derivative totals. There is a risk that the counterparties to the contracts will not be able to meet the contract terms. APERS’ external investment managers seek to control this risk through counterparty credit evaluations and approvals, counterparty credit limits and exposure monitoring procedures. The fair value balances and notional amounts of derivative instruments outstanding at June 30, 2015, classified by type, and the changes in fair value of such derivative instruments for the year then ended are as follows:
Type Classification Amount Classification AmountForeign currency forwards Net appreciation (depreciation) 131,382$ Investment derivatives 25,106$
in fair value of investmentsFutures Net appreciation (depreciation) (1,264,465) Investment derivatives (929,926)
in fair value of investmentsTBA securities Net appreciation (depreciation) 19,032,164 U.S. government and 21,109,664
in fair value of investments agency securitiesRights Investment revenue (4,850) Investments -
Warrants Investment revenue (24,817) Investments 1,849
Changes in Fair Value Fair Value at June 30, 2015
Foreign Currency Forward Fair ValueBrazilian Real (23)$ BRLSwiss Franc (284,222) CHF 21,642,000 Euro (17,296) EUR (1,982,594) British Pound Sterling (88,418) GBP (2,035,560) Hong Kong Dollar (3) HKD 364,800 Japanese Yen 408,206 JPY (2,626,569,723) Mexican Nuevo Peso 7,425 MXN 7,300,000 United States Dollar (563) USD 5,070,235
Total Foreign Currency Forwards 25,106$
Futures Contract (929,926)$ USD (255,500,000)$
Mortgage-Backed TBA 21,109,664$ USD 19,970,000$
Warrants 1,849$ 123,300$
Notional Amount
60
4) Securities Lending Transactions
Arkansas Public Employees Retirement System (APERS) and Arkansas Teacher Retirement System (ATRS) participate in securities lending programs, as authorized by Arkansas Code Annotated § 24-3-412 and the Board of Trustees policies, whereby investment securities are transferred to an independent broker or dealer in exchange for collateral in the form of cash and cash equivalents, letters of credit, securities guaranteed by the U.S. Government or an agency thereof equal to at least 100% of the fair value of the securities loaned for ATRS and equal to at least 102% of domestic loans and 105% of international loans for APERS. At all times during the term of each loan, the total value of the collateral is not to be less than the fair value of all securities on loan. The programs are administered by custodial agent banks. The code does not specify the types of securities that may be loaned. The types of securities on loan at June 30, 2015, include U.S. Government securities, corporate securities and international securities. With the exception of cash collateral, the pensions do not have the ability to pledge or sell the collateral securities received unless there is borrower default. The pensions invest cash collateral received; accordingly, investments made with cash collateral received appear as assets on the statements of plan net position. As the pensions must return the cash collateral to the borrower upon expiration of the loan, a corresponding liability is recorded as obligations under securities lending. These securities have also been included in the preceding summary of deposits and investments (see Note 2). The weighted average maturity of collateral investments generally does not match the maturity of the loans. The custodial agents provide the pensions with an indemnification if insolvency causes the borrower to fail to return the securities lent or to fail to pay the income on the securities to the trust while lent. However, in the history of the pensions’ participation in such programs, no losses resulting from default have occurred. As of June 30, 2015, the carrying value and fair value of the underlying securities was $1.7 billion. At June 30, 2015, the pension systems had no credit risk exposure to borrowers because the amounts the pension systems owed the borrowers exceeded the amounts the borrowers owed the pension systems.
(5) Receivables
Receivables at June 30, 2015, consisted of the following (expressed in thousands): Primary Government
(1) Receivable balances of $88,507 are not expected to be collected within one year of the date of the financial statements. (2) See Note 11 - Leases. (3) $108 and $1 Interfund receivables due to the General Fund and the Workers' Compensation Commission, respectively,
from the Pension Trust fund were reclassified as accounts receivable on the Government-wide Statement of Net Position. (4) General fund has reclassified $38,025 from loans receivable and $11,975 from deposits with component units to loans
receivable - component unit for a total of $50,000 on the Government-wide Statement of Net Position.
Accounts Taxes (1)Employee/ Employer Medicaid
Capital Lease Receivable (2) Loans (4)
Investment- Related
Other Receivables
Allowance for Uncollectibles Total
General Fund $ 286,236 (3) $ 671,621 $ $ 234,712 $ 763 $ 375,607 $ 8,882 $ 32,111 $ (457,989) $ 1,151,943Higher Education Fund 674,521 62,653 172 12,801 (460,457) 289,690Workers' Compensation Commission 7,801 (3) 162 7,963Department of Workforce Services 177,579 (50,000) 127,579
Office of the Arkansas Lottery 12,275 12,275Non-major enterprise funds 4,969 397,945 710 (738) 402,886Pension trust 43,772 129,989 15,377 189,138Agency 7 1,406 (18) 1,395
Total $ 1,163,381 $ 671,621 $ 43,772 $ 234,712 $ 763 $ 836,205 $ 139,922 $ 61,695 $ (969,202) $ 2,182,869
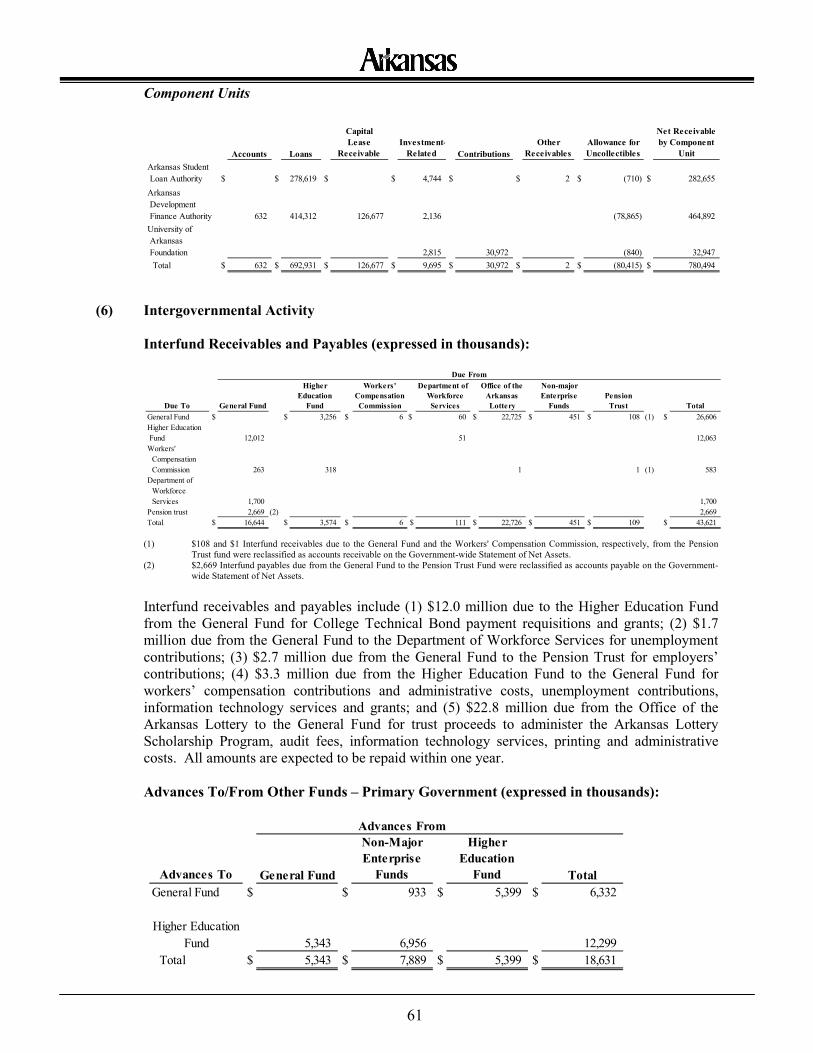
61
Component Units
(6) Intergovernmental Activity
Interfund Receivables and Payables (expressed in thousands):
(1) $108 and $1 Interfund receivables due to the General Fund and the Workers' Compensation Commission, respectively, from the Pension
Trust fund were reclassified as accounts receivable on the Government-wide Statement of Net Assets. (2) $2,669 Interfund payables due from the General Fund to the Pension Trust Fund were reclassified as accounts payable on the Government-
wide Statement of Net Assets.
Interfund receivables and payables include (1) $12.0 million due to the Higher Education Fund from the General Fund for College Technical Bond payment requisitions and grants; (2) $1.7 million due from the General Fund to the Department of Workforce Services for unemployment contributions; (3) $2.7 million due from the General Fund to the Pension Trust for employers’ contributions; (4) $3.3 million due from the Higher Education Fund to the General Fund for workers’ compensation contributions and administrative costs, unemployment contributions, information technology services and grants; and (5) $22.8 million due from the Office of the Arkansas Lottery to the General Fund for trust proceeds to administer the Arkansas Lottery Scholarship Program, audit fees, information technology services, printing and administrative costs. All amounts are expected to be repaid within one year. Advances To/From Other Funds – Primary Government (expressed in thousands):
Accounts Loans
Capital Lease
ReceivableInvestment-
Related ContributionsOther
ReceivablesAllowance for Uncollectibles
Net Receivable by Component
UnitArkansas Student Loan Authority $ $ 278,619 $ $ 4,744 $ $ 2 $ (710) $ 282,655Arkansas Development Finance Authority 632 414,312 126,677 2,136 (78,865) 464,892University of Arkansas Foundation 2,815 30,972 (840) 32,947
Total $ 632 $ 692,931 $ 126,677 $ 9,695 $ 30,972 $ 2 $ (80,415) $ 780,494
Due To General Fund
Higher Education
Fund
Workers' Compensation Commission
Department of □Workforce □Services
Office of the Arkansas Lottery
Non-major Enterprise
FundsPension
Trust Total General Fund $ $ 3,256 $ 6 $ 60 $ 22,725 $ 451 $ 108 (1) $ 26,606Higher Education Fund 12,012 51 12,063Workers' □Compensation □Commission 263 318 1 1 (1) 583Department of □Workforce □Services 1,700 1,700Pension trust 2,669 (2) 2,669Total $ 16,644 $ 3,574 $ 6 $ 111 $ 22,726 $ 451 $ 109 $ 43,621
Due From
Advances From
Advances To General Fund
Non-Major Enterprise
Funds
Higher Education
Fund TotalGeneral Fund $ $ 933 $ 5,399 $ 6,332
Higher Education Fund 5,343 6,956 12,299
Total $ 5,343 $ 7,889 $ 5,399 $ 18,631
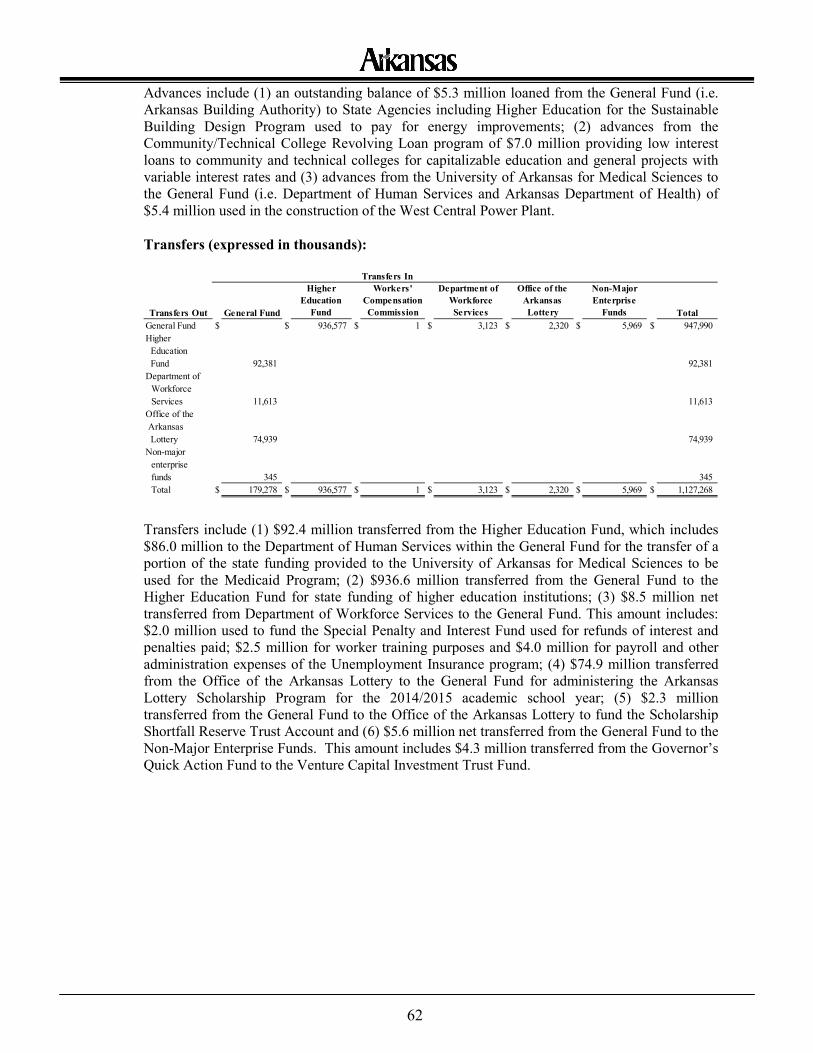
62
Advances include (1) an outstanding balance of $5.3 million loaned from the General Fund (i.e. Arkansas Building Authority) to State Agencies including Higher Education for the Sustainable Building Design Program used to pay for energy improvements; (2) advances from the Community/Technical College Revolving Loan program of $7.0 million providing low interest loans to community and technical colleges for capitalizable education and general projects with variable interest rates and (3) advances from the University of Arkansas for Medical Sciences to the General Fund (i.e. Department of Human Services and Arkansas Department of Health) of $5.4 million used in the construction of the West Central Power Plant. Transfers (expressed in thousands):
Transfers include (1) $92.4 million transferred from the Higher Education Fund, which includes $86.0 million to the Department of Human Services within the General Fund for the transfer of a portion of the state funding provided to the University of Arkansas for Medical Sciences to be used for the Medicaid Program; (2) $936.6 million transferred from the General Fund to the Higher Education Fund for state funding of higher education institutions; (3) $8.5 million net transferred from Department of Workforce Services to the General Fund. This amount includes: $2.0 million used to fund the Special Penalty and Interest Fund used for refunds of interest and penalties paid; $2.5 million for worker training purposes and $4.0 million for payroll and other administration expenses of the Unemployment Insurance program; (4) $74.9 million transferred from the Office of the Arkansas Lottery to the General Fund for administering the Arkansas Lottery Scholarship Program for the 2014/2015 academic school year; (5) $2.3 million transferred from the General Fund to the Office of the Arkansas Lottery to fund the Scholarship Shortfall Reserve Trust Account and (6) $5.6 million net transferred from the General Fund to the Non-Major Enterprise Funds. This amount includes $4.3 million transferred from the Governor’s Quick Action Fund to the Venture Capital Investment Trust Fund.
Transfers In
Transfers Out General Fund
Higher Education
Fund
Workers' Compensation Commission
Department of □Workforce □Services
Office of the Arkansas Lottery
Non-Major Enterprise
Funds TotalGeneral Fund $ $ 936,577 $ 1 $ 3,123 $ 2,320 $ 5,969 $ 947,990Higher Education Fund 92,381 92,381Department of □Workforce □Services 11,613 11,613Office of the Arkansas Lottery 74,939 74,939Non-major □enterprise □funds 345 345
Total $ 179,278 $ 936,577 $ 1 $ 3,123 $ 2,320 $ 5,969 $ 1,127,268
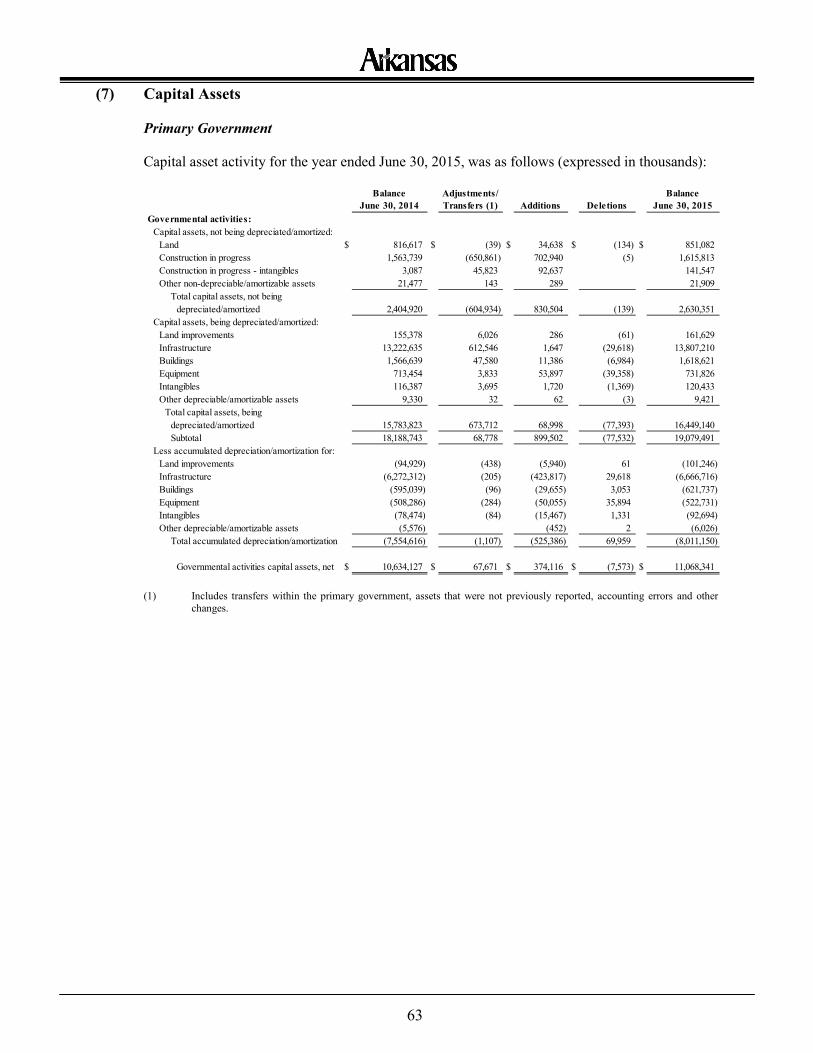
63
(7) Capital Assets
Primary Government
Capital asset activity for the year ended June 30, 2015, was as follows (expressed in thousands):
(1) Includes transfers within the primary government, assets that were not previously reported, accounting errors and other
changes.
Balance June 30, 2014
Adjustments/ Transfers (1) Additions Deletions
Balance June 30, 2015
Governmental activities:Capital assets, not being depreciated/amortized:
Land $ 816,617 $ (39) $ 34,638 $ (134) $ 851,082Construction in progress 1,563,739 (650,861) 702,940 (5) 1,615,813Construction in progress - intangibles 3,087 45,823 92,637 141,547Other non-depreciable/amortizable assets 21,477 143 289 21,909
Total capital assets, not being □depreciated/amortized 2,404,920 (604,934) 830,504 (139) 2,630,351
Capital assets, being depreciated/amortized:Land improvements 155,378 6,026 286 (61) 161,629Infrastructure 13,222,635 612,546 1,647 (29,618) 13,807,210Buildings 1,566,639 47,580 11,386 (6,984) 1,618,621Equipment 713,454 3,833 53,897 (39,358) 731,826Intangibles 116,387 3,695 1,720 (1,369) 120,433Other depreciable/amortizable assets 9,330 32 62 (3) 9,421
Total capital assets, being □depreciated/amortized 15,783,823 673,712 68,998 (77,393) 16,449,140
Subtotal 18,188,743 68,778 899,502 (77,532) 19,079,491Less accumulated depreciation/amortization for:
Land improvements (94,929) (438) (5,940) 61 (101,246)Infrastructure (6,272,312) (205) (423,817) 29,618 (6,666,716)Buildings (595,039) (96) (29,655) 3,053 (621,737)Equipment (508,286) (284) (50,055) 35,894 (522,731)Intangibles (78,474) (84) (15,467) 1,331 (92,694)Other depreciable/amortizable assets (5,576) (452) 2 (6,026)
Total accumulated depreciation/amortization (7,554,616) (1,107) (525,386) 69,959 (8,011,150)
Governmental activities capital assets, net $ 10,634,127 $ 67,671 $ 374,116 $ (7,573) $ 11,068,341
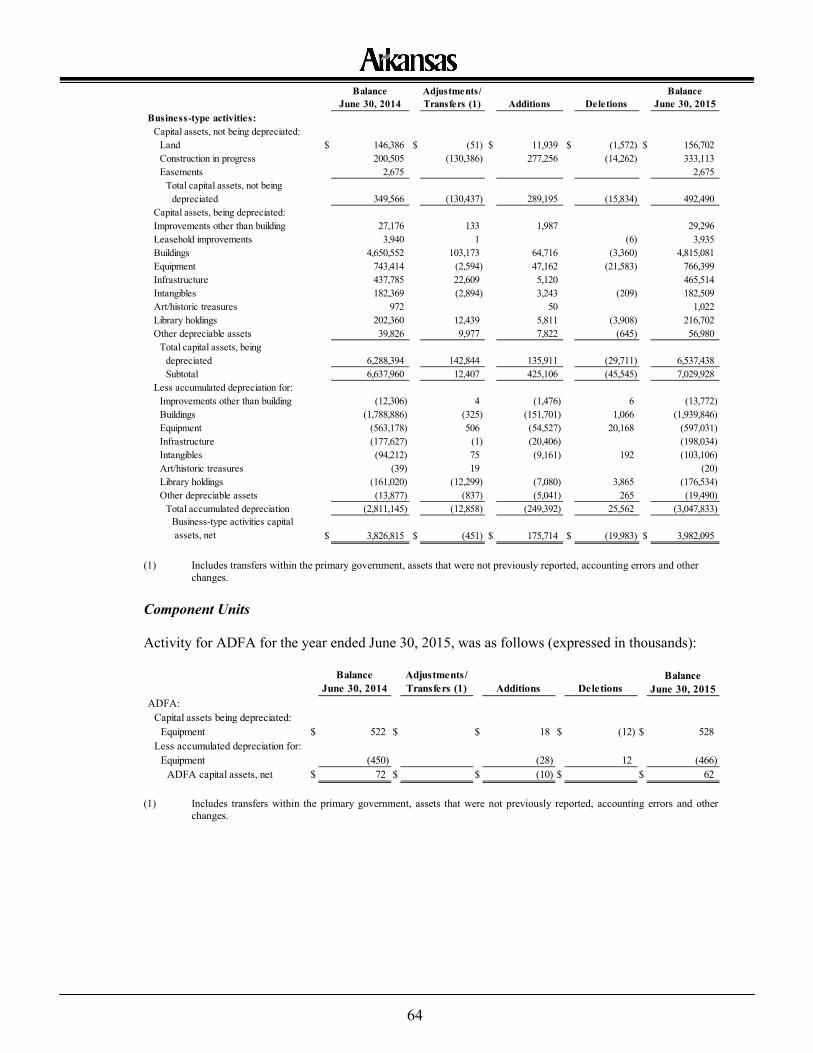
64
(1) Includes transfers within the primary government, assets that were not previously reported, accounting errors and other
changes. Component Units
Activity for ADFA for the year ended June 30, 2015, was as follows (expressed in thousands):
(1) Includes transfers within the primary government, assets that were not previously reported, accounting errors and other
changes.
Balance June 30, 2014
Adjustments/ Transfers (1) Additions Deletions
Balance June 30, 2015
Business-type activities:Capital assets, not being depreciated:
Land $ 146,386 $ (51) $ 11,939 $ (1,572) $ 156,702Construction in progress 200,505 (130,386) 277,256 (14,262) 333,113Easements 2,675 2,675
Total capital assets, not being □depreciated 349,566 (130,437) 289,195 (15,834) 492,490
Capital assets, being depreciated:Improvements other than building 27,176 133 1,987 29,296Leasehold improvements 3,940 1 (6) 3,935Buildings 4,650,552 103,173 64,716 (3,360) 4,815,081Equipment 743,414 (2,594) 47,162 (21,583) 766,399Infrastructure 437,785 22,609 5,120 465,514Intangibles 182,369 (2,894) 3,243 (209) 182,509Art/historic treasures 972 50 1,022Library holdings 202,360 12,439 5,811 (3,908) 216,702Other depreciable assets 39,826 9,977 7,822 (645) 56,980
Total capital assets, being □depreciated 6,288,394 142,844 135,911 (29,711) 6,537,438
Subtotal 6,637,960 12,407 425,106 (45,545) 7,029,928Less accumulated depreciation for:
Improvements other than building (12,306) 4 (1,476) 6 (13,772)Buildings (1,788,886) (325) (151,701) 1,066 (1,939,846)Equipment (563,178) 506 (54,527) 20,168 (597,031)Infrastructure (177,627) (1) (20,406) (198,034)Intangibles (94,212) 75 (9,161) 192 (103,106)Art/historic treasures (39) 19 (20)Library holdings (161,020) (12,299) (7,080) 3,865 (176,534)Other depreciable assets (13,877) (837) (5,041) 265 (19,490)
Total accumulated depreciation (2,811,145) (12,858) (249,392) 25,562 (3,047,833)Business-type activities capital assets, net $ 3,826,815 $ (451) $ 175,714 $ (19,983) $ 3,982,095
Balance June 30, 2014
Adjustments/ Transfers (1) Additions Deletions
Balance June 30, 2015
ADFA:Capital assets being depreciated:
Equipment $ 522 $ $ 18 $ (12) $ 528Less accumulated depreciation for:
Equipment (450) (28) 12 (466)ADFA capital assets, net $ 72 $ $ (10) $ $ 62
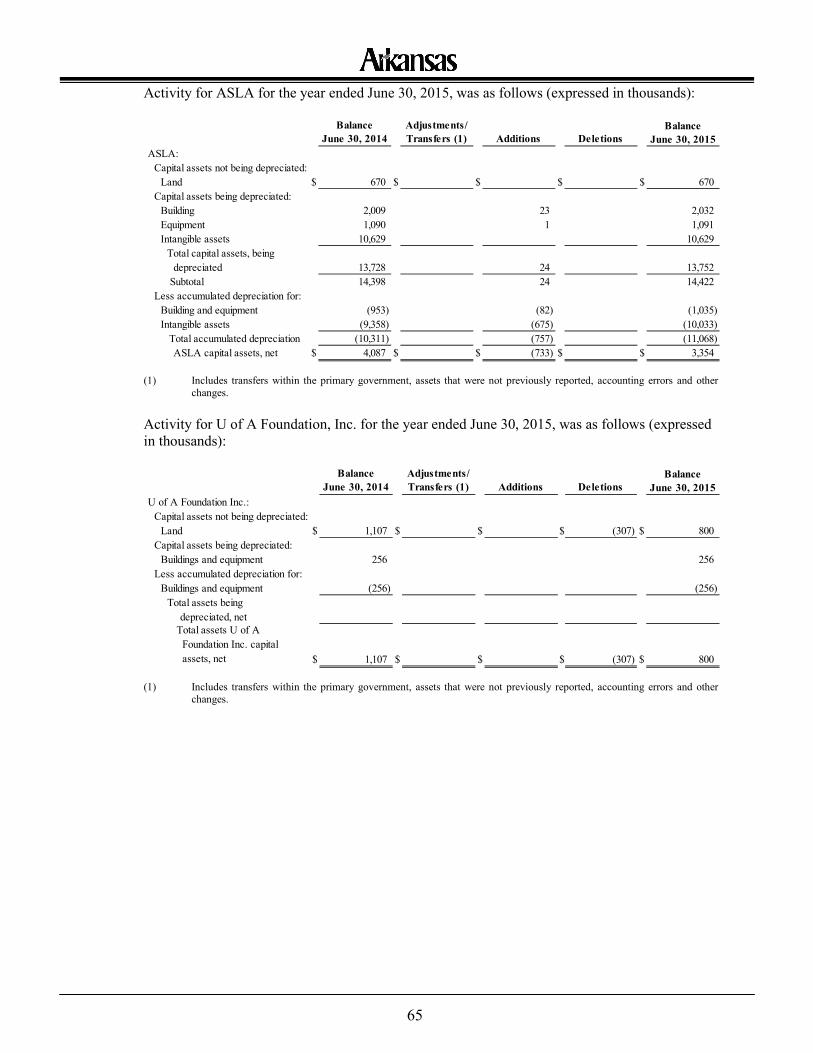
65
Activity for ASLA for the year ended June 30, 2015, was as follows (expressed in thousands):
(1) Includes transfers within the primary government, assets that were not previously reported, accounting errors and other
changes. Activity for U of A Foundation, Inc. for the year ended June 30, 2015, was as follows (expressed in thousands):
(1) Includes transfers within the primary government, assets that were not previously reported, accounting errors and other
changes.
Balance June 30, 2014
Adjustments/ Transfers (1) Additions Deletions
Balance June 30, 2015
ASLA:Capital assets not being depreciated:
Land $ 670 $ $ $ $ 670Capital assets being depreciated:
Building 2,009 23 2,032Equipment 1,090 1 1,091Intangible assets 10,629 10,629
Total capital assets, being □depreciated 13,728 24 13,752 Subtotal 14,398 24 14,422
Less accumulated depreciation for:Building and equipment (953) (82) (1,035)Intangible assets (9,358) (675) (10,033) Total accumulated depreciation (10,311) (757) (11,068)
ASLA capital assets, net $ 4,087 $ $ (733) $ $ 3,354
Balance June 30, 2014
Adjustments/ Transfers (1) Additions Deletions
Balance June 30, 2015
U of A Foundation Inc.:Capital assets not being depreciated:
Land $ 1,107 $ $ $ (307) $ 800Capital assets being depreciated:
Buildings and equipment 256 256Less accumulated depreciation for:
Buildings and equipment (256) (256)Total assets being □□depreciated, net
Total assets U of A Foundation Inc. capital assets, net $ 1,107 $ $ $ (307) $ 800
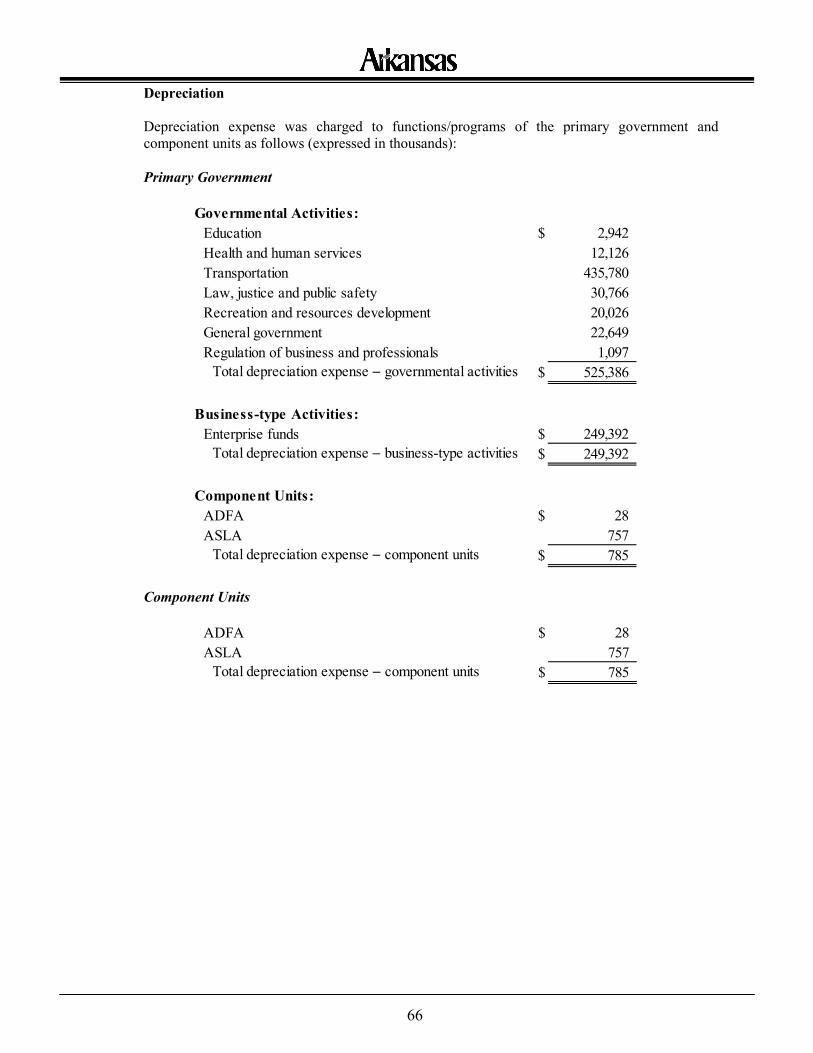
66
Depreciation Depreciation expense was charged to functions/programs of the primary government and component units as follows (expressed in thousands):
Primary Government
Component Units
Governmental Activities:Education $ 2,942Health and human services 12,126Transportation 435,780Law, justice and public safety 30,766Recreation and resources development 20,026General government 22,649Regulation of business and professionals 1,097
Total depreciation expense ─ governmental activities $ 525,386
Business-type Activities:Enterprise funds $ 249,392
Total depreciation expense ─ business-type activities $ 249,392
Component Units:ADFA $ 28ASLA 757
Total depreciation expense ─ component units $ 785
ADFA $ 28ASLA 757
Total depreciation expense ─ component units $ 785
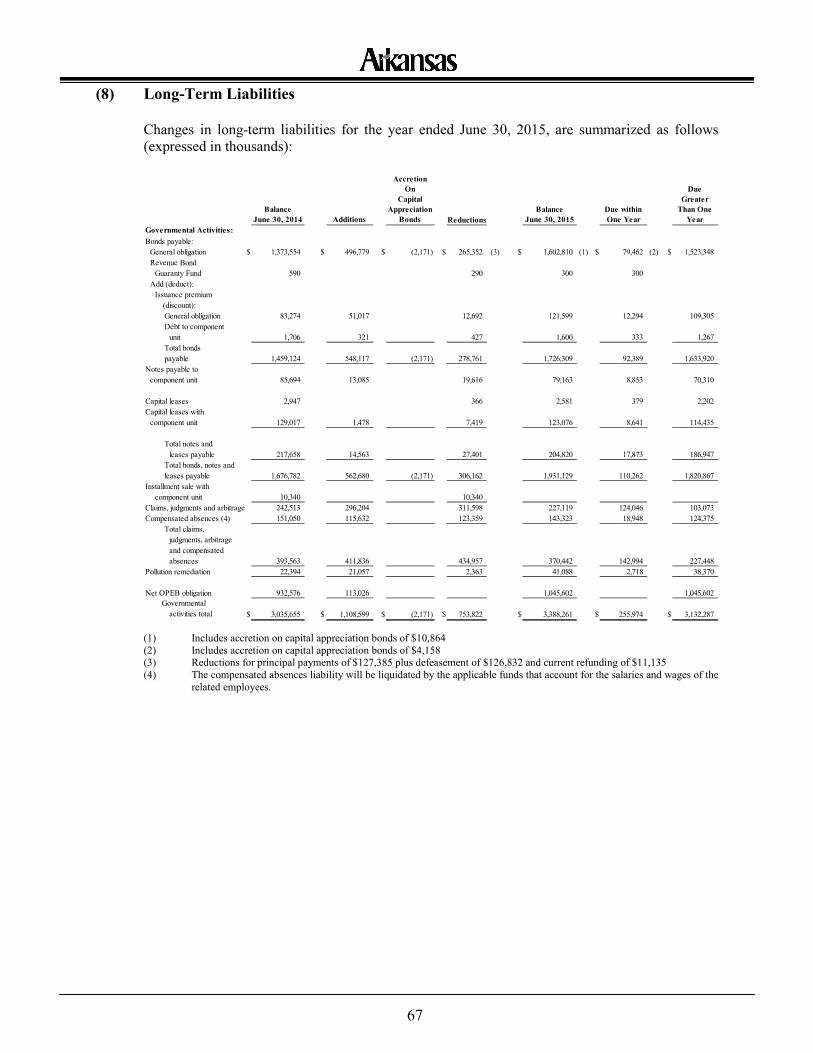
67
(8) Long-Term Liabilities
Changes in long-term liabilities for the year ended June 30, 2015, are summarized as follows (expressed in thousands):
(1) Includes accretion on capital appreciation bonds of $10,864 (2) Includes accretion on capital appreciation bonds of $4,158 (3) Reductions for principal payments of $127,385 plus defeasement of $126,832 and current refunding of $11,135 (4) The compensated absences liability will be liquidated by the applicable funds that account for the salaries and wages of the
related employees.
Balance June 30, 2014 Additions
Accretion On
Capital Appreciation
Bonds ReductionsBalance
June 30, 2015Due within One Year
Due Greater
Than One Year
Governmental Activities:Bonds payable:
General obligation $ 1,373,554 $ 496,779 $ (2,171) $ 265,352 (3) $ 1,602,810 (1) $ 79,462 (2) $ 1,523,348Revenue Bond □Guaranty Fund 590 290 300 300Add (deduct):
Issuance premium □ (discount):
General obligation 83,274 51,017 12,692 121,599 12,294 109,305Debt to component □unit 1,706 321 427 1,600 333 1,267Total bonds □ payable 1,459,124 548,117 (2,171) 278,761 1,726,309 92,389 1,633,920
Notes payable to □component unit 85,694 13,085 19,616 79,163 8,853 70,310
Capital leases 2,947 366 2,581 379 2,202Capital leases with □component unit 129,017 1,478 7,419 123,076 8,641 114,435
Total notes and □leases payable 217,658 14,563 27,401 204,820 17,873 186,947Total bonds, notes and leases payable 1,676,782 562,680 (2,171) 306,162 1,931,129 110,262 1,820,867
Installment sale with □□component unit 10,340 10,340Claims, judgments and arbitrage 242,513 296,204 311,598 227,119 124,046 103,073Compensated absences (4) 151,050 115,632 123,359 143,323 18,948 124,375
Total claims, □judgments, arbitrage □and compensated □absences 393,563 411,836 434,957 370,442 142,994 227,448
Pollution remediation 22,394 21,057 2,363 41,088 2,718 38,370
Net OPEB obligation 932,576 113,026 1,045,602 1,045,602 Governmental □□activities total $ 3,035,655 $ 1,108,599 $ (2,171) $ 753,822 $ 3,388,261 $ 255,974 $ 3,132,287
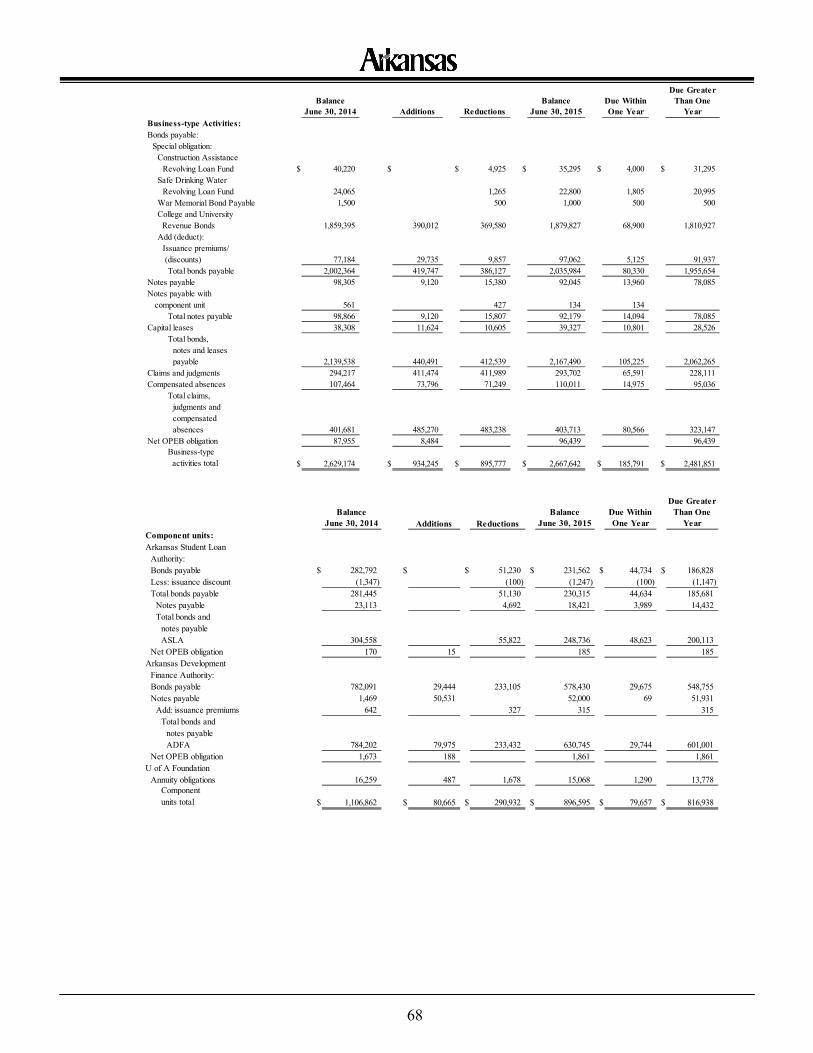
68
Balance June 30, 2014 Additions Reductions
Balance June 30, 2015
Due Within One Year
Due Greater Than One
YearBusiness-type Activities:Bonds payable:
Special obligation:Construction Assistance □Revolving Loan Fund $ 40,220 $ $ 4,925 $ 35,295 $ 4,000 $ 31,295Safe Drinking Water □Revolving Loan Fund 24,065 1,265 22,800 1,805 20,995War Memorial Bond Payable 1,500 500 1,000 500 500College and University Revenue Bonds 1,859,395 390,012 369,580 1,879,827 68,900 1,810,927Add (deduct):
Issuance premiums/ (discounts) 77,184 29,735 9,857 97,062 5,125 91,937
Total bonds payable 2,002,364 419,747 386,127 2,035,984 80,330 1,955,654Notes payable 98,305 9,120 15,380 92,045 13,960 78,085Notes payable with □component unit 561 427 134 134
Total notes payable 98,866 9,120 15,807 92,179 14,094 78,085Capital leases 38,308 11,624 10,605 39,327 10,801 28,526
Total bonds, □notes and leases □payable 2,139,538 440,491 412,539 2,167,490 105,225 2,062,265
Claims and judgments 294,217 411,474 411,989 293,702 65,591 228,111Compensated absences 107,464 73,796 71,249 110,011 14,975 95,036
Total claims, □judgments and □compensated □absences 401,681 485,270 483,238 403,713 80,566 323,147
Net OPEB obligation 87,955 8,484 96,439 96,439Business-type activities total $ 2,629,174 $ 934,245 $ 895,777 $ 2,667,642 $ 185,791 $ 2,481,851
Balance June 30, 2014 Additions Reductions
Balance June 30, 2015
Due Within One Year
Due Greater Than One
YearComponent units:Arkansas Student Loan □Authority:
Bonds payable $ 282,792 $ $ 51,230 $ 231,562 $ 44,734 $ 186,828Less: issuance discount (1,347) (100) (1,247) (100) (1,147)Total bonds payable 281,445 51,130 230,315 44,634 185,681
Notes payable 23,113 4,692 18,421 3,989 14,432Total bonds and □notes payable □ASLA 304,558 55,822 248,736 48,623 200,113
Net OPEB obligation 170 15 185 185Arkansas Development □Finance Authority:
Bonds payable 782,091 29,444 233,105 578,430 29,675 548,755Notes payable 1,469 50,531 52,000 69 51,931
Add: issuance premiums 642 327 315 315Total bonds and □notes payable □ADFA 784,202 79,975 233,432 630,745 29,744 601,001
Net OPEB obligation 1,673 188 1,861 1,861U of A Foundation
Annuity obligations 16,259 487 1,678 15,068 1,290 13,778Componentunits total $ 1,106,862 $ 80,665 $ 290,932 $ 896,595 $ 79,657 $ 816,938
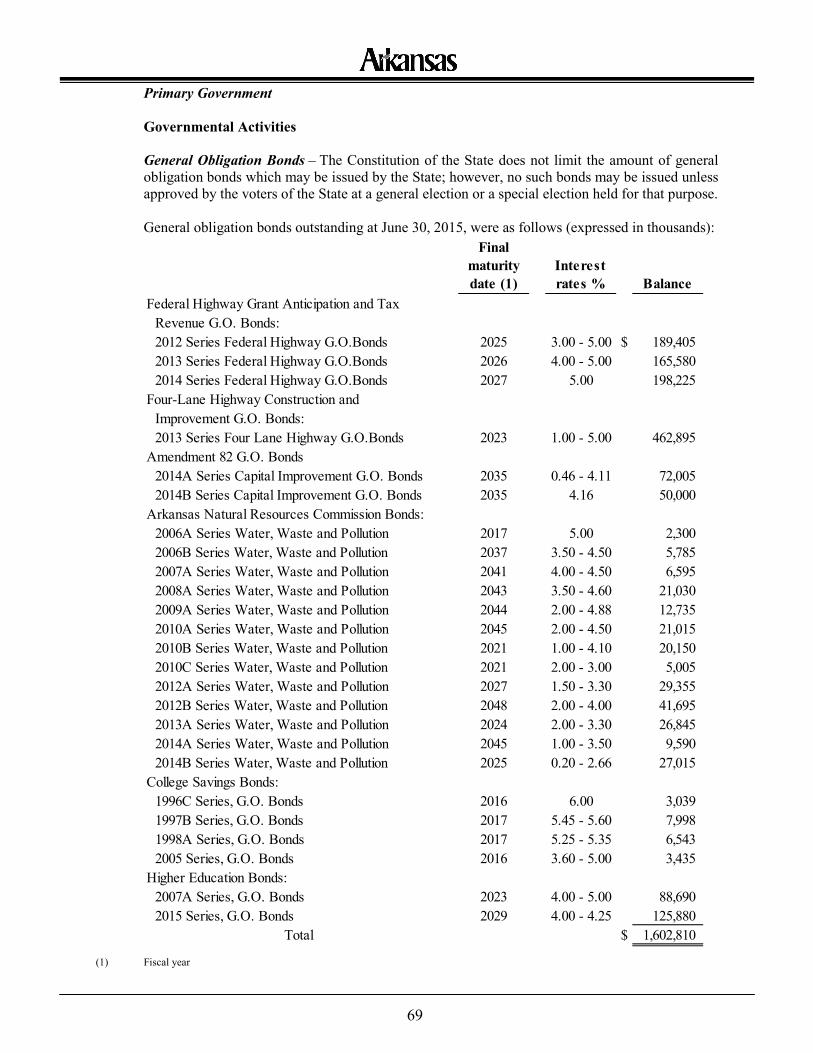
69
Primary Government Governmental Activities General Obligation Bonds – The Constitution of the State does not limit the amount of general obligation bonds which may be issued by the State; however, no such bonds may be issued unless approved by the voters of the State at a general election or a special election held for that purpose. General obligation bonds outstanding at June 30, 2015, were as follows (expressed in thousands):
(1) Fiscal year
Final maturity date (1)
Interest rates % Balance
Federal Highway Grant Anticipation and TaxRevenue G.O. Bonds:2012 Series Federal Highway G.O.Bonds 2025 3.00 - 5.00 $ 189,405 2013 Series Federal Highway G.O.Bonds 2026 4.00 - 5.00 165,580 2014 Series Federal Highway G.O.Bonds 2027 5.00 198,225
Four-Lane Highway Construction and Improvement G.O. Bonds:2013 Series Four Lane Highway G.O.Bonds 2023 1.00 - 5.00 462,895
Amendment 82 G.O. Bonds2014A Series Capital Improvement G.O. Bonds 2035 0.46 - 4.11 72,005 2014B Series Capital Improvement G.O. Bonds 2035 4.16 50,000
Arkansas Natural Resources Commission Bonds:2006A Series Water, Waste and Pollution 2017 5.00 2,300 2006B Series Water, Waste and Pollution 2037 3.50 - 4.50 5,785 2007A Series Water, Waste and Pollution 2041 4.00 - 4.50 6,595 2008A Series Water, Waste and Pollution 2043 3.50 - 4.60 21,030 2009A Series Water, Waste and Pollution 2044 2.00 - 4.88 12,735 2010A Series Water, Waste and Pollution 2045 2.00 - 4.50 21,015 2010B Series Water, Waste and Pollution 2021 1.00 - 4.10 20,150 2010C Series Water, Waste and Pollution 2021 2.00 - 3.00 5,005 2012A Series Water, Waste and Pollution 2027 1.50 - 3.30 29,355 2012B Series Water, Waste and Pollution 2048 2.00 - 4.00 41,695 2013A Series Water, Waste and Pollution 2024 2.00 - 3.30 26,845 2014A Series Water, Waste and Pollution 2045 1.00 - 3.50 9,590 2014B Series Water, Waste and Pollution 2025 0.20 - 2.66 27,015
College Savings Bonds:1996C Series, G.O. Bonds 2016 6.00 3,039 1997B Series, G.O. Bonds 2017 5.45 - 5.60 7,998 1998A Series, G.O. Bonds 2017 5.25 - 5.35 6,543 2005 Series, G.O. Bonds 2016 3.60 - 5.00 3,435
Higher Education Bonds:2007A Series, G.O. Bonds 2023 4.00 - 5.00 88,690 2015 Series, G.O. Bonds 2029 4.00 - 4.25 125,880
Total $ 1,602,810
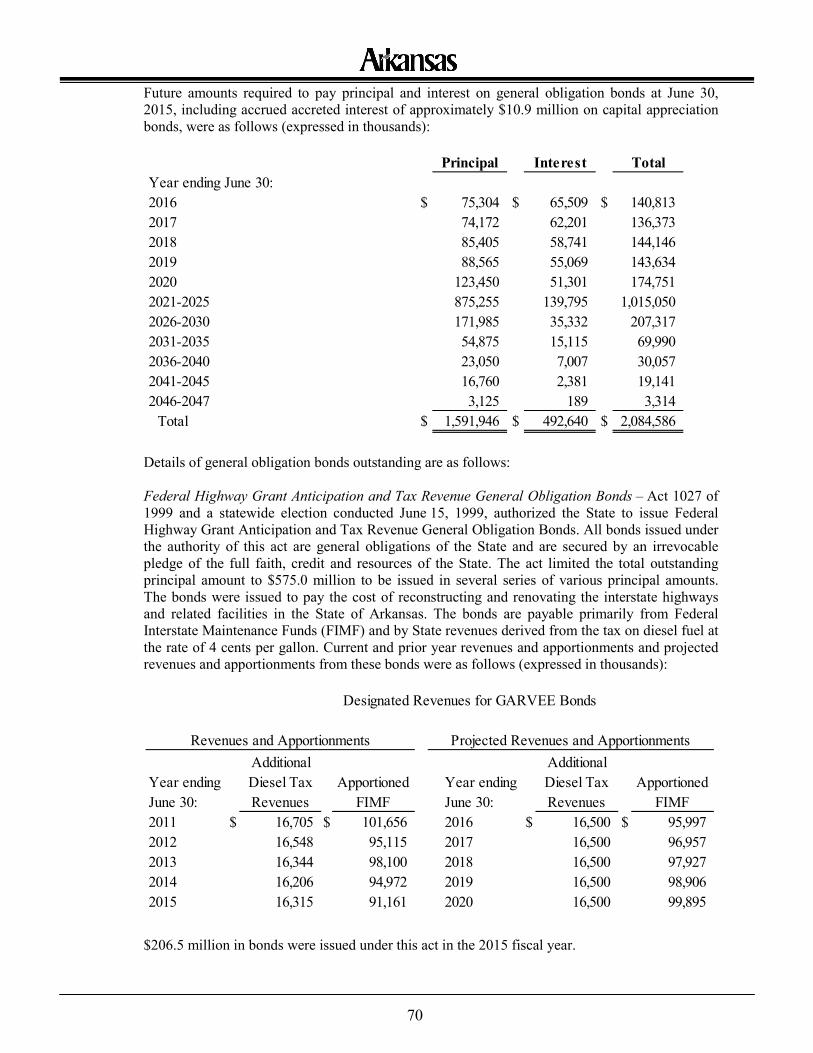
70
Future amounts required to pay principal and interest on general obligation bonds at June 30, 2015, including accrued accreted interest of approximately $10.9 million on capital appreciation bonds, were as follows (expressed in thousands):
Details of general obligation bonds outstanding are as follows: Federal Highway Grant Anticipation and Tax Revenue General Obligation Bonds – Act 1027 of 1999 and a statewide election conducted June 15, 1999, authorized the State to issue Federal Highway Grant Anticipation and Tax Revenue General Obligation Bonds. All bonds issued under the authority of this act are general obligations of the State and are secured by an irrevocable pledge of the full faith, credit and resources of the State. The act limited the total outstanding principal amount to $575.0 million to be issued in several series of various principal amounts. The bonds were issued to pay the cost of reconstructing and renovating the interstate highways and related facilities in the State of Arkansas. The bonds are payable primarily from Federal Interstate Maintenance Funds (FIMF) and by State revenues derived from the tax on diesel fuel at the rate of 4 cents per gallon. Current and prior year revenues and apportionments and projected revenues and apportionments from these bonds were as follows (expressed in thousands):
$206.5 million in bonds were issued under this act in the 2015 fiscal year.
Principal Interest TotalYear ending June 30:2016 $ 75,304 $ 65,509 $ 140,813 2017 74,172 62,201 136,373 2018 85,405 58,741 144,146 2019 88,565 55,069 143,634 2020 123,450 51,301 174,751 2021-2025 875,255 139,795 1,015,050 2026-2030 171,985 35,332 207,317 2031-2035 54,875 15,115 69,990 2036-2040 23,050 7,007 30,057 2041-2045 16,760 2,381 19,141 2046-2047 3,125 189 3,314
Total $ 1,591,946 $ 492,640 $ 2,084,586
Year ending June 30:
Additional Diesel Tax Revenues
Apportioned FIMF
Year ending June 30:
Additional Diesel Tax Revenues
Apportioned FIMF
2011 $ 16,705 $ 101,656 2016 $ 16,500 $ 95,9972012 16,548 95,115 2017 16,500 96,9572013 16,344 98,100 2018 16,500 97,9272014 16,206 94,972 2019 16,500 98,9062015 16,315 91,161 2020 16,500 99,895
Revenues and Apportionments
Designated Revenues for GARVEE Bonds
Projected Revenues and Apportionments
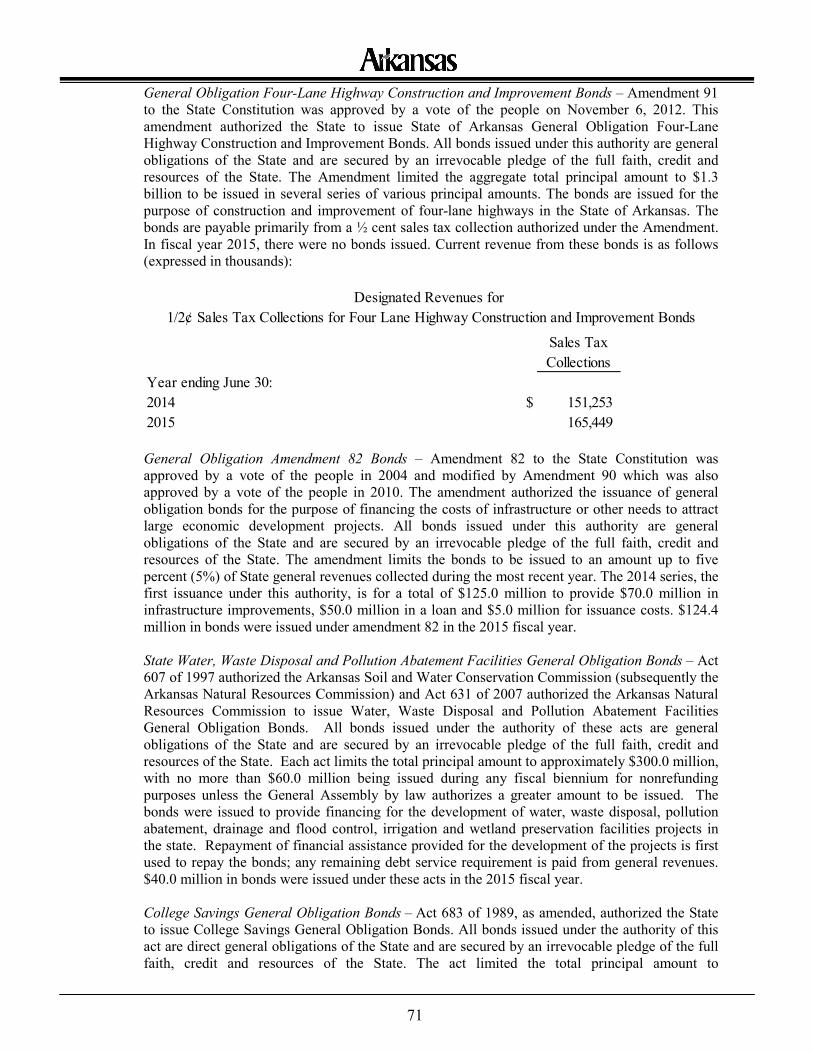
71
General Obligation Four-Lane Highway Construction and Improvement Bonds – Amendment 91 to the State Constitution was approved by a vote of the people on November 6, 2012. This amendment authorized the State to issue State of Arkansas General Obligation Four-Lane Highway Construction and Improvement Bonds. All bonds issued under this authority are general obligations of the State and are secured by an irrevocable pledge of the full faith, credit and resources of the State. The Amendment limited the aggregate total principal amount to $1.3 billion to be issued in several series of various principal amounts. The bonds are issued for the purpose of construction and improvement of four-lane highways in the State of Arkansas. The bonds are payable primarily from a ½ cent sales tax collection authorized under the Amendment. In fiscal year 2015, there were no bonds issued. Current revenue from these bonds is as follows (expressed in thousands):
General Obligation Amendment 82 Bonds – Amendment 82 to the State Constitution was approved by a vote of the people in 2004 and modified by Amendment 90 which was also approved by a vote of the people in 2010. The amendment authorized the issuance of general obligation bonds for the purpose of financing the costs of infrastructure or other needs to attract large economic development projects. All bonds issued under this authority are general obligations of the State and are secured by an irrevocable pledge of the full faith, credit and resources of the State. The amendment limits the bonds to be issued to an amount up to five percent (5%) of State general revenues collected during the most recent year. The 2014 series, the first issuance under this authority, is for a total of $125.0 million to provide $70.0 million in infrastructure improvements, $50.0 million in a loan and $5.0 million for issuance costs. $124.4 million in bonds were issued under amendment 82 in the 2015 fiscal year. State Water, Waste Disposal and Pollution Abatement Facilities General Obligation Bonds – Act 607 of 1997 authorized the Arkansas Soil and Water Conservation Commission (subsequently the Arkansas Natural Resources Commission) and Act 631 of 2007 authorized the Arkansas Natural Resources Commission to issue Water, Waste Disposal and Pollution Abatement Facilities General Obligation Bonds. All bonds issued under the authority of these acts are general obligations of the State and are secured by an irrevocable pledge of the full faith, credit and resources of the State. Each act limits the total principal amount to approximately $300.0 million, with no more than $60.0 million being issued during any fiscal biennium for nonrefunding purposes unless the General Assembly by law authorizes a greater amount to be issued. The bonds were issued to provide financing for the development of water, waste disposal, pollution abatement, drainage and flood control, irrigation and wetland preservation facilities projects in the state. Repayment of financial assistance provided for the development of the projects is first used to repay the bonds; any remaining debt service requirement is paid from general revenues. $40.0 million in bonds were issued under these acts in the 2015 fiscal year. College Savings General Obligation Bonds – Act 683 of 1989, as amended, authorized the State to issue College Savings General Obligation Bonds. All bonds issued under the authority of this act are direct general obligations of the State and are secured by an irrevocable pledge of the full faith, credit and resources of the State. The act limited the total principal amount to
Sales Tax Collections
Year ending June 30:2014 $ 151,253 2015 165,449
1/2¢ Sales Tax Collections for Four Lane Highway Construction and Improvement BondsDesignated Revenues for
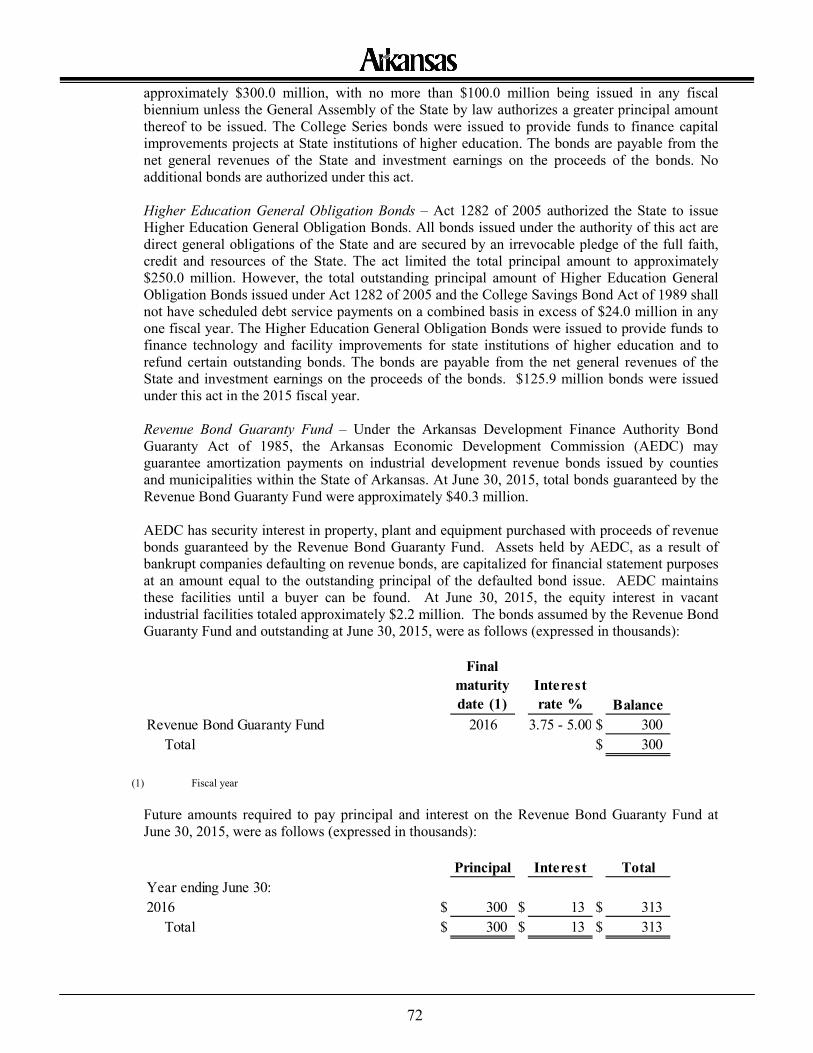
72
approximately $300.0 million, with no more than $100.0 million being issued in any fiscal biennium unless the General Assembly of the State by law authorizes a greater principal amount thereof to be issued. The College Series bonds were issued to provide funds to finance capital improvements projects at State institutions of higher education. The bonds are payable from the net general revenues of the State and investment earnings on the proceeds of the bonds. No additional bonds are authorized under this act.
Higher Education General Obligation Bonds – Act 1282 of 2005 authorized the State to issue Higher Education General Obligation Bonds. All bonds issued under the authority of this act are direct general obligations of the State and are secured by an irrevocable pledge of the full faith, credit and resources of the State. The act limited the total principal amount to approximately $250.0 million. However, the total outstanding principal amount of Higher Education General Obligation Bonds issued under Act 1282 of 2005 and the College Savings Bond Act of 1989 shall not have scheduled debt service payments on a combined basis in excess of $24.0 million in any one fiscal year. The Higher Education General Obligation Bonds were issued to provide funds to finance technology and facility improvements for state institutions of higher education and to refund certain outstanding bonds. The bonds are payable from the net general revenues of the State and investment earnings on the proceeds of the bonds. $125.9 million bonds were issued under this act in the 2015 fiscal year. Revenue Bond Guaranty Fund – Under the Arkansas Development Finance Authority Bond Guaranty Act of 1985, the Arkansas Economic Development Commission (AEDC) may guarantee amortization payments on industrial development revenue bonds issued by counties and municipalities within the State of Arkansas. At June 30, 2015, total bonds guaranteed by the Revenue Bond Guaranty Fund were approximately $40.3 million. AEDC has security interest in property, plant and equipment purchased with proceeds of revenue bonds guaranteed by the Revenue Bond Guaranty Fund. Assets held by AEDC, as a result of bankrupt companies defaulting on revenue bonds, are capitalized for financial statement purposes at an amount equal to the outstanding principal of the defaulted bond issue. AEDC maintains these facilities until a buyer can be found. At June 30, 2015, the equity interest in vacant industrial facilities totaled approximately $2.2 million. The bonds assumed by the Revenue Bond Guaranty Fund and outstanding at June 30, 2015, were as follows (expressed in thousands):
(1) Fiscal year
Future amounts required to pay principal and interest on the Revenue Bond Guaranty Fund at June 30, 2015, were as follows (expressed in thousands):
Final maturity date (1)
Interest rate % Balance
Revenue Bond Guaranty Fund 2016 3.75 - 5.00 $ 300 Total $ 300
Principal Interest TotalYear ending June 30:2016 $ 300 $ 13 $ 313
Total $ 300 $ 13 $ 313
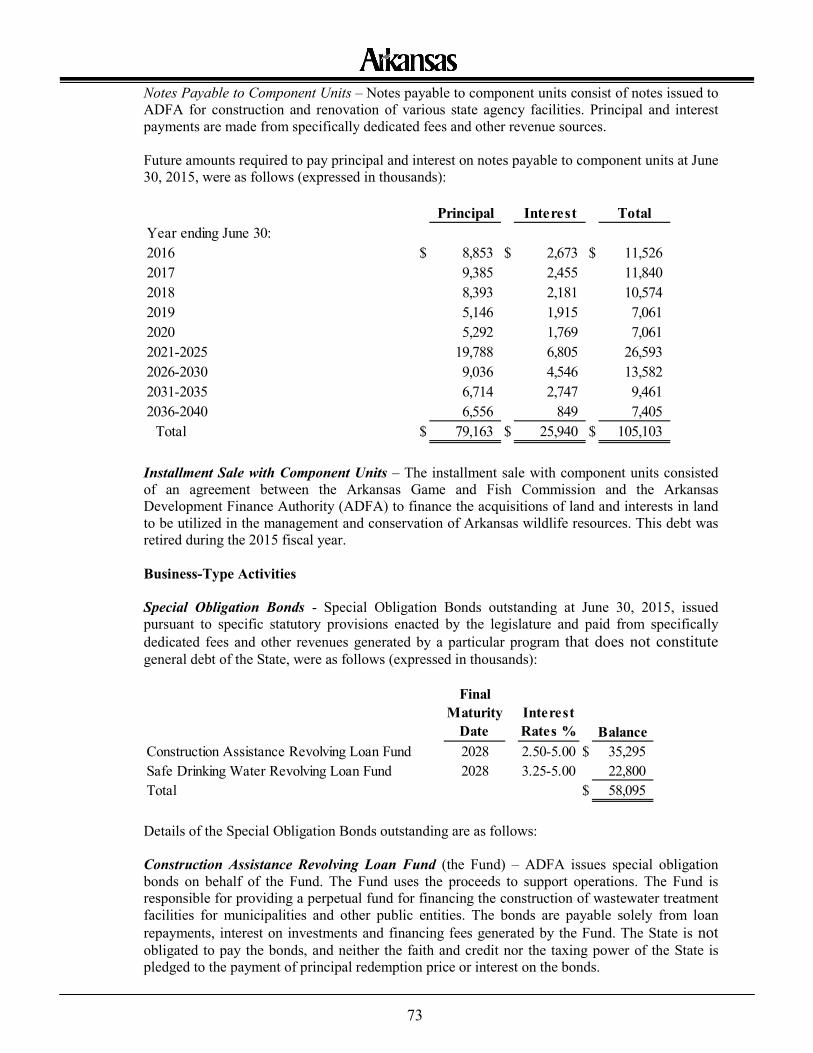
73
Notes Payable to Component Units – Notes payable to component units consist of notes issued to ADFA for construction and renovation of various state agency facilities. Principal and interest payments are made from specifically dedicated fees and other revenue sources. Future amounts required to pay principal and interest on notes payable to component units at June 30, 2015, were as follows (expressed in thousands):
Installment Sale with Component Units – The installment sale with component units consisted of an agreement between the Arkansas Game and Fish Commission and the Arkansas Development Finance Authority (ADFA) to finance the acquisitions of land and interests in land to be utilized in the management and conservation of Arkansas wildlife resources. This debt was retired during the 2015 fiscal year. Business-Type Activities Special Obligation Bonds - Special Obligation Bonds outstanding at June 30, 2015, issued pursuant to specific statutory provisions enacted by the legislature and paid from specifically dedicated fees and other revenues generated by a particular program that does not constitute general debt of the State, were as follows (expressed in thousands):
Details of the Special Obligation Bonds outstanding are as follows: Construction Assistance Revolving Loan Fund (the Fund) – ADFA issues special obligation bonds on behalf of the Fund. The Fund uses the proceeds to support operations. The Fund is responsible for providing a perpetual fund for financing the construction of wastewater treatment facilities for municipalities and other public entities. The bonds are payable solely from loan repayments, interest on investments and financing fees generated by the Fund. The State is not obligated to pay the bonds, and neither the faith and credit nor the taxing power of the State is pledged to the payment of principal redemption price or interest on the bonds.
Principal Interest TotalYear ending June 30:2016 $ 8,853 $ 2,673 $ 11,5262017 9,385 2,455 11,8402018 8,393 2,181 10,5742019 5,146 1,915 7,0612020 5,292 1,769 7,0612021-2025 19,788 6,805 26,5932026-2030 9,036 4,546 13,5822031-2035 6,714 2,747 9,4612036-2040 6,556 849 7,405
Total $ 79,163 $ 25,940 $ 105,103
Final Maturity
DateInterest Rates % Balance
Construction Assistance Revolving Loan Fund 2028 2.50-5.00 $ 35,295Safe Drinking Water Revolving Loan Fund 2028 3.25-5.00 22,800Total $ 58,095
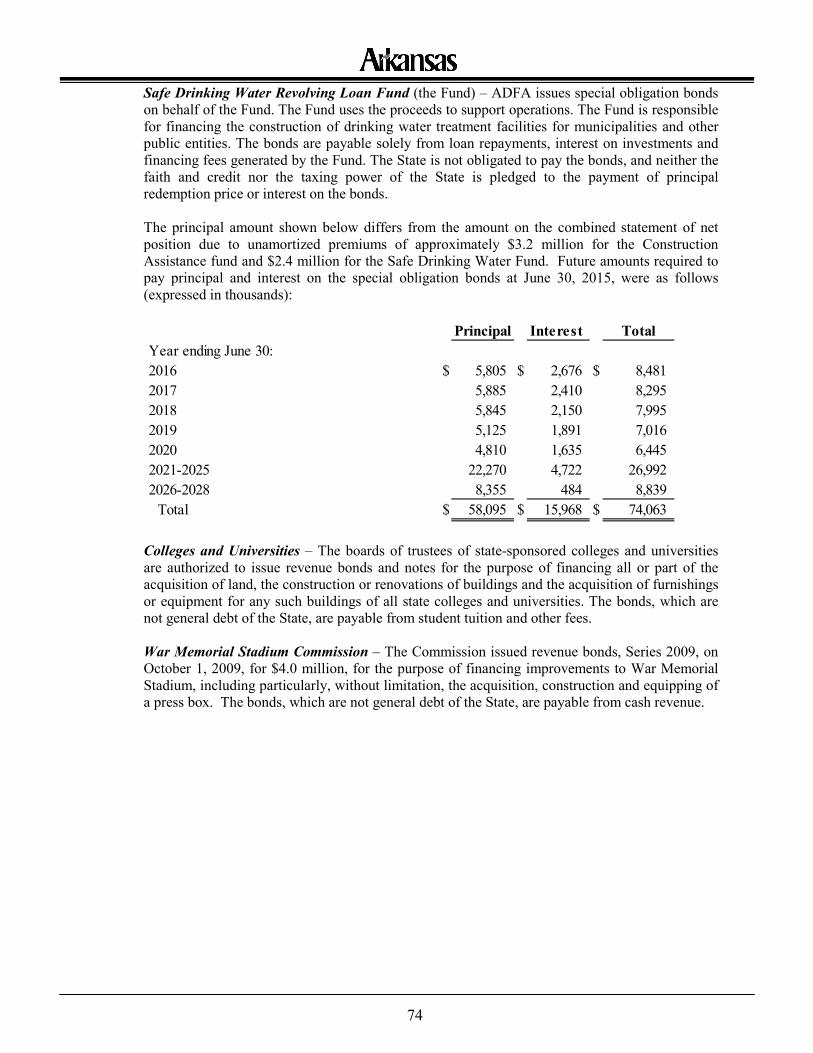
74
Safe Drinking Water Revolving Loan Fund (the Fund) – ADFA issues special obligation bonds on behalf of the Fund. The Fund uses the proceeds to support operations. The Fund is responsible for financing the construction of drinking water treatment facilities for municipalities and other public entities. The bonds are payable solely from loan repayments, interest on investments and financing fees generated by the Fund. The State is not obligated to pay the bonds, and neither the faith and credit nor the taxing power of the State is pledged to the payment of principal redemption price or interest on the bonds.
The principal amount shown below differs from the amount on the combined statement of net position due to unamortized premiums of approximately $3.2 million for the Construction Assistance fund and $2.4 million for the Safe Drinking Water Fund. Future amounts required to pay principal and interest on the special obligation bonds at June 30, 2015, were as follows (expressed in thousands):
Colleges and Universities – The boards of trustees of state-sponsored colleges and universities are authorized to issue revenue bonds and notes for the purpose of financing all or part of the acquisition of land, the construction or renovations of buildings and the acquisition of furnishings or equipment for any such buildings of all state colleges and universities. The bonds, which are not general debt of the State, are payable from student tuition and other fees.
War Memorial Stadium Commission – The Commission issued revenue bonds, Series 2009, on October 1, 2009, for $4.0 million, for the purpose of financing improvements to War Memorial Stadium, including particularly, without limitation, the acquisition, construction and equipping of a press box. The bonds, which are not general debt of the State, are payable from cash revenue.
Principal Interest TotalYear ending June 30:2016 $ 5,805 $ 2,676 $ 8,4812017 5,885 2,410 8,2952018 5,845 2,150 7,9952019 5,125 1,891 7,0162020 4,810 1,635 6,4452021-2025 22,270 4,722 26,9922026-2028 8,355 484 8,839
Total $ 58,095 $ 15,968 $ 74,063
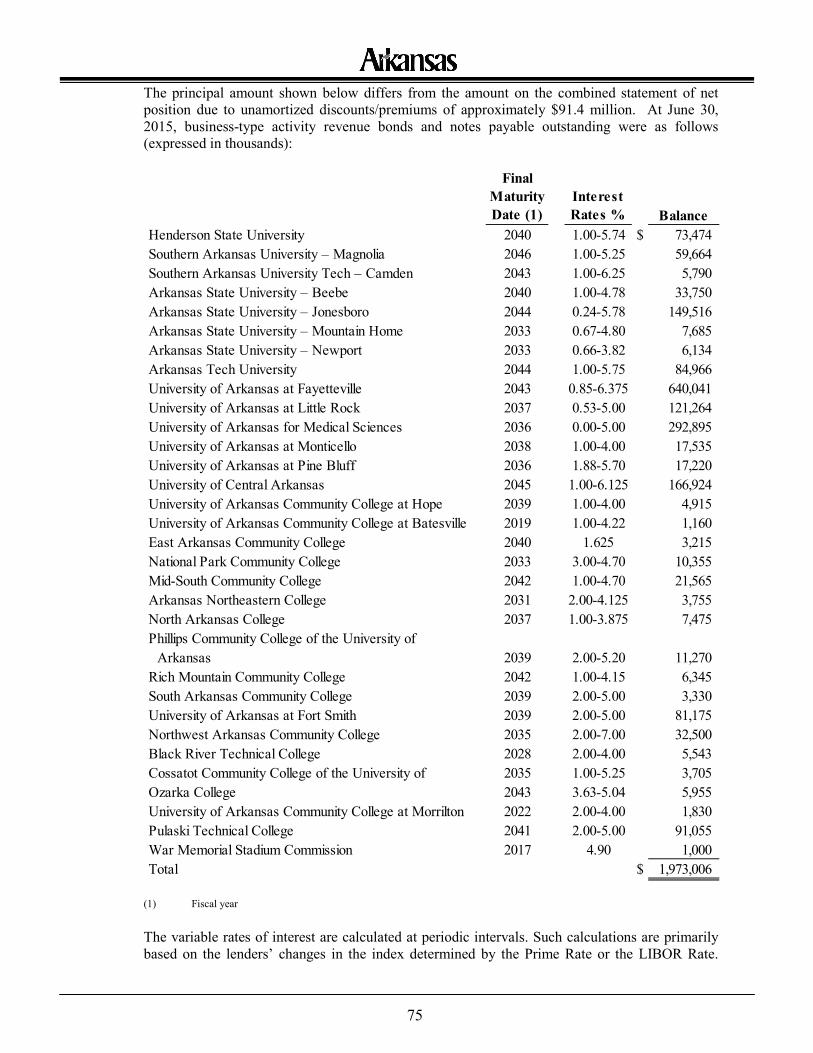
75
The principal amount shown below differs from the amount on the combined statement of net position due to unamortized discounts/premiums of approximately $91.4 million. At June 30, 2015, business-type activity revenue bonds and notes payable outstanding were as follows (expressed in thousands):
(1) Fiscal year
The variable rates of interest are calculated at periodic intervals. Such calculations are primarily based on the lenders’ changes in the index determined by the Prime Rate or the LIBOR Rate.
Final Maturity Date (1)
Interest Rates % Balance
Henderson State University 2040 1.00-5.74 $ 73,474Southern Arkansas University – Magnolia 2046 1.00-5.25 59,664Southern Arkansas University Tech – Camden 2043 1.00-6.25 5,790Arkansas State University – Beebe 2040 1.00-4.78 33,750Arkansas State University – Jonesboro 2044 0.24-5.78 149,516Arkansas State University – Mountain Home 2033 0.67-4.80 7,685Arkansas State University – Newport 2033 0.66-3.82 6,134Arkansas Tech University 2044 1.00-5.75 84,966University of Arkansas at Fayetteville 2043 0.85-6.375 640,041University of Arkansas at Little Rock 2037 0.53-5.00 121,264University of Arkansas for Medical Sciences 2036 0.00-5.00 292,895University of Arkansas at Monticello 2038 1.00-4.00 17,535University of Arkansas at Pine Bluff 2036 1.88-5.70 17,220University of Central Arkansas 2045 1.00-6.125 166,924University of Arkansas Community College at Hope 2039 1.00-4.00 4,915University of Arkansas Community College at Batesville 2019 1.00-4.22 1,160East Arkansas Community College 2040 1.625 3,215National Park Community College 2033 3.00-4.70 10,355Mid-South Community College 2042 1.00-4.70 21,565Arkansas Northeastern College 2031 2.00-4.125 3,755North Arkansas College 2037 1.00-3.875 7,475Phillips Community College of the University of □Arkansas 2039 2.00-5.20 11,270Rich Mountain Community College 2042 1.00-4.15 6,345South Arkansas Community College 2039 2.00-5.00 3,330University of Arkansas at Fort Smith 2039 2.00-5.00 81,175Northwest Arkansas Community College 2035 2.00-7.00 32,500Black River Technical College 2028 2.00-4.00 5,543Cossatot Community College of the University of 2035 1.00-5.25 3,705Ozarka College 2043 3.63-5.04 5,955University of Arkansas Community College at Morrilton 2022 2.00-4.00 1,830Pulaski Technical College 2041 2.00-5.00 91,055War Memorial Stadium Commission 2017 4.90 1,000Total $ 1,973,006
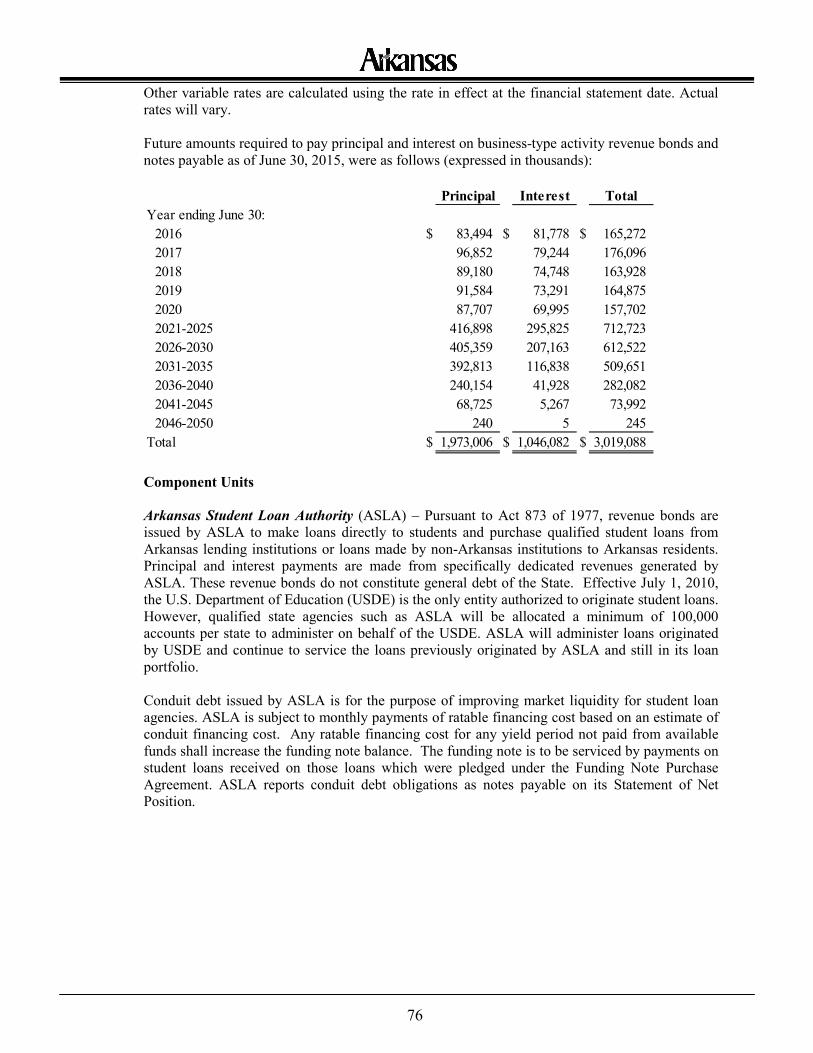
76
Other variable rates are calculated using the rate in effect at the financial statement date. Actual rates will vary. Future amounts required to pay principal and interest on business-type activity revenue bonds and notes payable as of June 30, 2015, were as follows (expressed in thousands):
Component Units Arkansas Student Loan Authority (ASLA) – Pursuant to Act 873 of 1977, revenue bonds are issued by ASLA to make loans directly to students and purchase qualified student loans from Arkansas lending institutions or loans made by non-Arkansas institutions to Arkansas residents. Principal and interest payments are made from specifically dedicated revenues generated by ASLA. These revenue bonds do not constitute general debt of the State. Effective July 1, 2010, the U.S. Department of Education (USDE) is the only entity authorized to originate student loans. However, qualified state agencies such as ASLA will be allocated a minimum of 100,000 accounts per state to administer on behalf of the USDE. ASLA will administer loans originated by USDE and continue to service the loans previously originated by ASLA and still in its loan portfolio. Conduit debt issued by ASLA is for the purpose of improving market liquidity for student loan agencies. ASLA is subject to monthly payments of ratable financing cost based on an estimate of conduit financing cost. Any ratable financing cost for any yield period not paid from available funds shall increase the funding note balance. The funding note is to be serviced by payments on student loans received on those loans which were pledged under the Funding Note Purchase Agreement. ASLA reports conduit debt obligations as notes payable on its Statement of Net Position.
Principal Interest TotalYear ending June 30:
2016 $ 83,494 $ 81,778 $ 165,2722017 96,852 79,244 176,0962018 89,180 74,748 163,9282019 91,584 73,291 164,8752020 87,707 69,995 157,7022021-2025 416,898 295,825 712,7232026-2030 405,359 207,163 612,5222031-2035 392,813 116,838 509,6512036-2040 240,154 41,928 282,0822041-2045 68,725 5,267 73,9922046-2050 240 5 245
Total $ 1,973,006 $ 1,046,082 $ 3,019,088
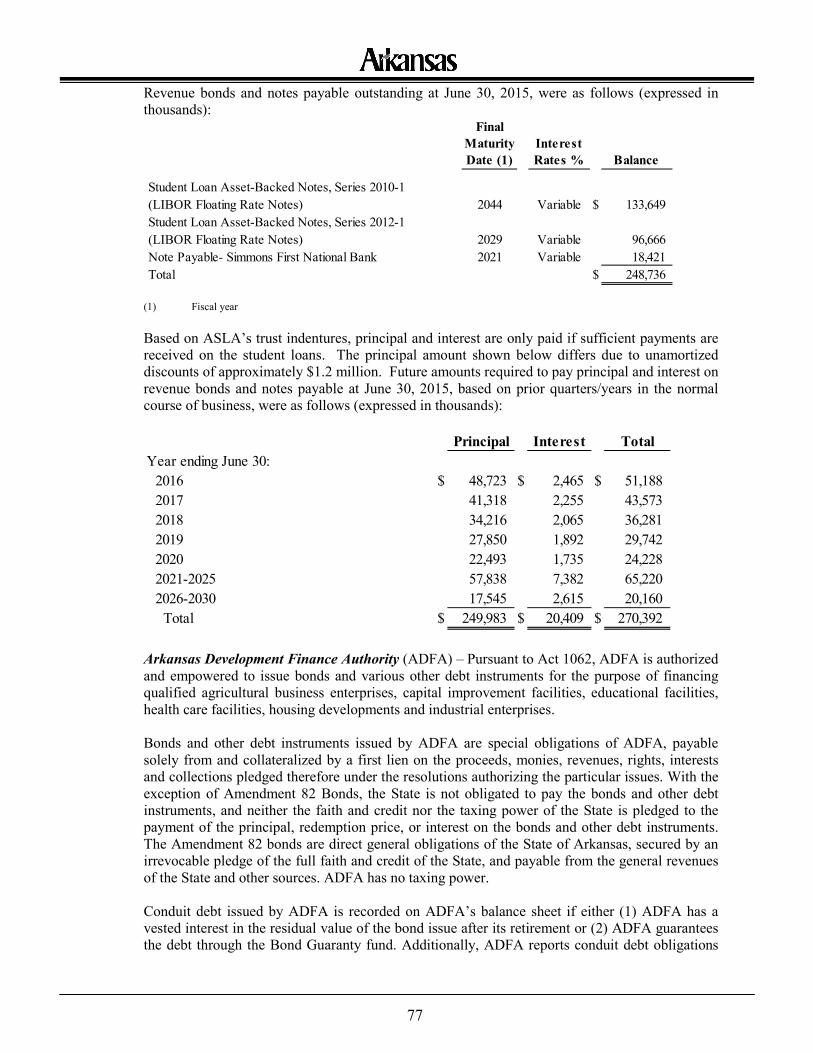
77
Revenue bonds and notes payable outstanding at June 30, 2015, were as follows (expressed in thousands):
(1) Fiscal year Based on ASLA’s trust indentures, principal and interest are only paid if sufficient payments are received on the student loans. The principal amount shown below differs due to unamortized discounts of approximately $1.2 million. Future amounts required to pay principal and interest on revenue bonds and notes payable at June 30, 2015, based on prior quarters/years in the normal course of business, were as follows (expressed in thousands):
Arkansas Development Finance Authority (ADFA) – Pursuant to Act 1062, ADFA is authorized and empowered to issue bonds and various other debt instruments for the purpose of financing qualified agricultural business enterprises, capital improvement facilities, educational facilities, health care facilities, housing developments and industrial enterprises. Bonds and other debt instruments issued by ADFA are special obligations of ADFA, payable solely from and collateralized by a first lien on the proceeds, monies, revenues, rights, interests and collections pledged therefore under the resolutions authorizing the particular issues. With the exception of Amendment 82 Bonds, the State is not obligated to pay the bonds and other debt instruments, and neither the faith and credit nor the taxing power of the State is pledged to the payment of the principal, redemption price, or interest on the bonds and other debt instruments. The Amendment 82 bonds are direct general obligations of the State of Arkansas, secured by an irrevocable pledge of the full faith and credit of the State, and payable from the general revenues of the State and other sources. ADFA has no taxing power. Conduit debt issued by ADFA is recorded on ADFA’s balance sheet if either (1) ADFA has a vested interest in the residual value of the bond issue after its retirement or (2) ADFA guarantees the debt through the Bond Guaranty fund. Additionally, ADFA reports conduit debt obligations
Final Maturity Date (1)
Interest Rates % Balance
Student Loan Asset-Backed Notes, Series 2010-1 (LIBOR Floating Rate Notes) 2044 Variable $ 133,649 Student Loan Asset-Backed Notes, Series 2012-1 (LIBOR Floating Rate Notes) 2029 Variable 96,666 Note Payable- Simmons First National Bank 2021 Variable 18,421 Total $ 248,736
Principal Interest TotalYear ending June 30:
2016 $ 48,723 $ 2,465 $ 51,188 2017 41,318 2,255 43,573 2018 34,216 2,065 36,281 2019 27,850 1,892 29,742 2020 22,493 1,735 24,228 2021-2025 57,838 7,382 65,220 2026-2030 17,545 2,615 20,160 Total $ 249,983 $ 20,409 $ 270,392
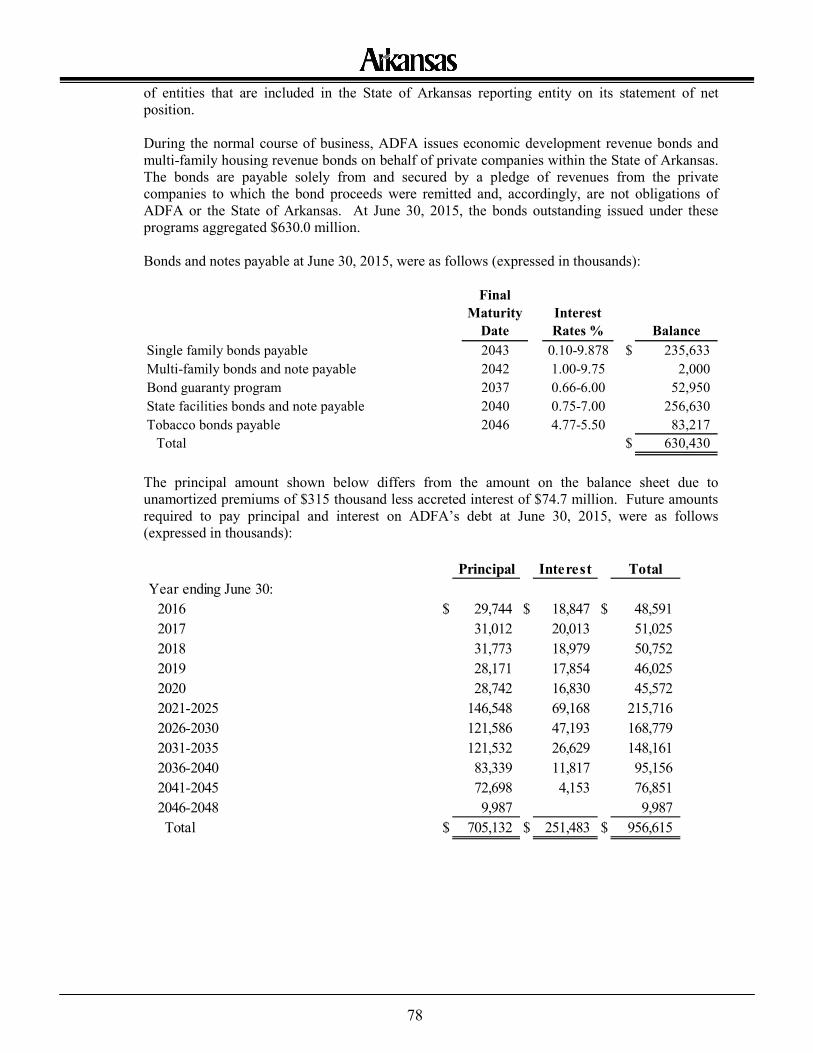
78
of entities that are included in the State of Arkansas reporting entity on its statement of net position. During the normal course of business, ADFA issues economic development revenue bonds and multi-family housing revenue bonds on behalf of private companies within the State of Arkansas. The bonds are payable solely from and secured by a pledge of revenues from the private companies to which the bond proceeds were remitted and, accordingly, are not obligations of ADFA or the State of Arkansas. At June 30, 2015, the bonds outstanding issued under these programs aggregated $630.0 million. Bonds and notes payable at June 30, 2015, were as follows (expressed in thousands):
The principal amount shown below differs from the amount on the balance sheet due to unamortized premiums of $315 thousand less accreted interest of $74.7 million. Future amounts required to pay principal and interest on ADFA’s debt at June 30, 2015, were as follows (expressed in thousands):
Final Maturity
DateInterest Rates % Balance
Single family bonds payable 2043 0.10-9.878 $ 235,633 Multi-family bonds and note payable 2042 1.00-9.75 2,000 Bond guaranty program 2037 0.66-6.00 52,950 State facilities bonds and note payable 2040 0.75-7.00 256,630 Tobacco bonds payable 2046 4.77-5.50 83,217
Total $ 630,430
Principal Interest TotalYear ending June 30:
2016 $ 29,744 $ 18,847 $ 48,5912017 31,012 20,013 51,0252018 31,773 18,979 50,7522019 28,171 17,854 46,0252020 28,742 16,830 45,5722021-2025 146,548 69,168 215,7162026-2030 121,586 47,193 168,7792031-2035 121,532 26,629 148,1612036-2040 83,339 11,817 95,1562041-2045 72,698 4,153 76,8512046-2048 9,987 9,987
Total $ 705,132 $ 251,483 $ 956,615
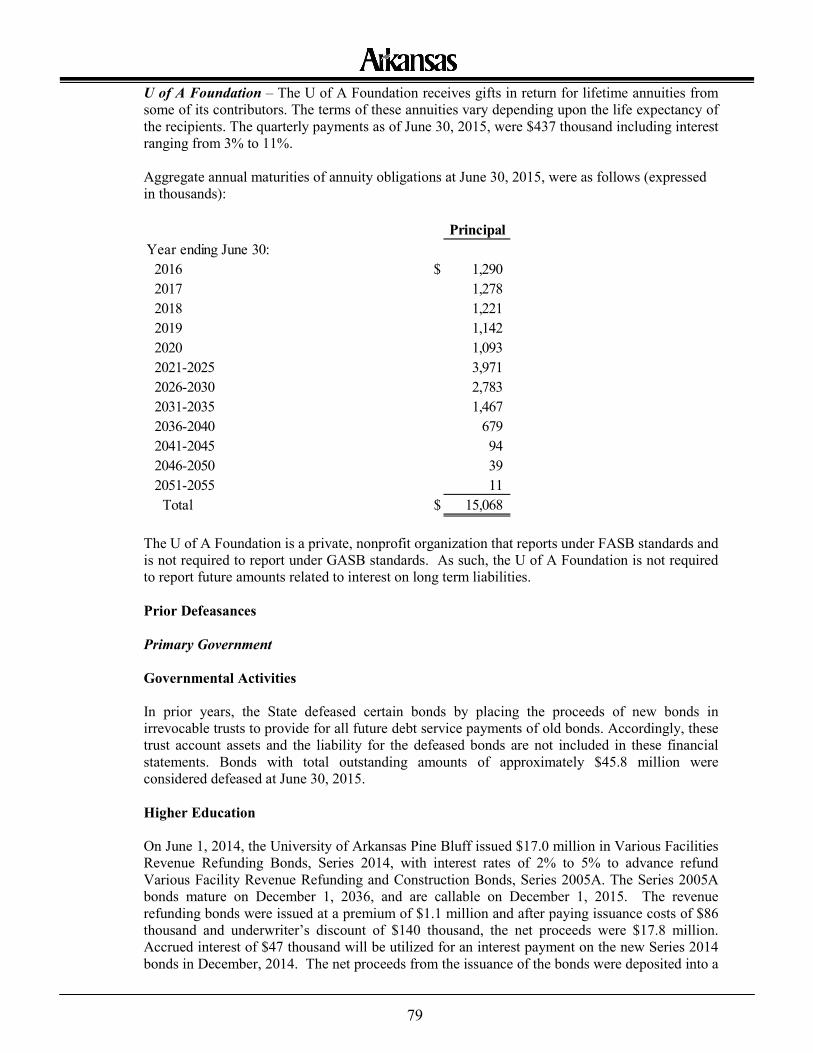
79
U of A Foundation – The U of A Foundation receives gifts in return for lifetime annuities from some of its contributors. The terms of these annuities vary depending upon the life expectancy of the recipients. The quarterly payments as of June 30, 2015, were $437 thousand including interest ranging from 3% to 11%. Aggregate annual maturities of annuity obligations at June 30, 2015, were as follows (expressed in thousands):
The U of A Foundation is a private, nonprofit organization that reports under FASB standards and is not required to report under GASB standards. As such, the U of A Foundation is not required to report future amounts related to interest on long term liabilities. Prior Defeasances
Primary Government Governmental Activities In prior years, the State defeased certain bonds by placing the proceeds of new bonds in irrevocable trusts to provide for all future debt service payments of old bonds. Accordingly, these trust account assets and the liability for the defeased bonds are not included in these financial statements. Bonds with total outstanding amounts of approximately $45.8 million were considered defeased at June 30, 2015. Higher Education On June 1, 2014, the University of Arkansas Pine Bluff issued $17.0 million in Various Facilities Revenue Refunding Bonds, Series 2014, with interest rates of 2% to 5% to advance refund Various Facility Revenue Refunding and Construction Bonds, Series 2005A. The Series 2005A bonds mature on December 1, 2036, and are callable on December 1, 2015. The revenue refunding bonds were issued at a premium of $1.1 million and after paying issuance costs of $86 thousand and underwriter’s discount of $140 thousand, the net proceeds were $17.8 million. Accrued interest of $47 thousand will be utilized for an interest payment on the new Series 2014 bonds in December, 2014. The net proceeds from the issuance of the bonds were deposited into a
PrincipalYear ending June 30: 2016 $ 1,290 2017 1,278 2018 1,221 2019 1,142 2020 1,093 2021-2025 3,971 2026-2030 2,783 2031-2035 1,467 2036-2040 679 2041-2045 94 2046-2050 39 2051-2055 11 Total $ 15,068
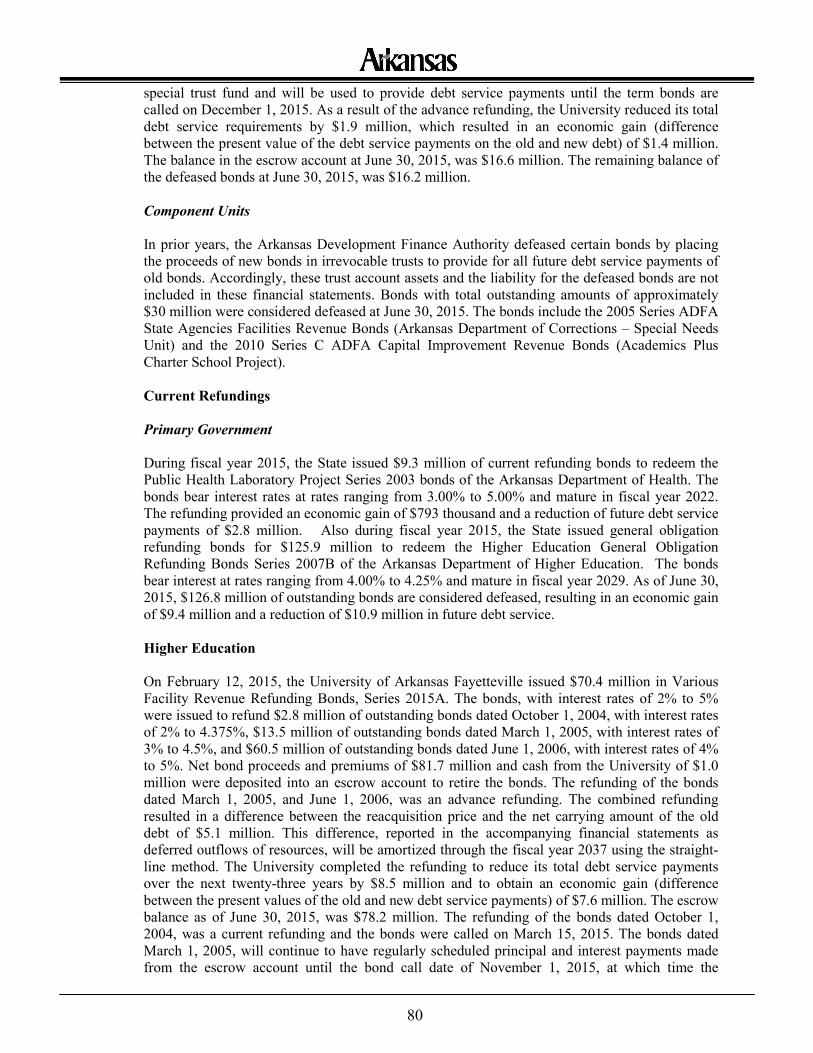
80
special trust fund and will be used to provide debt service payments until the term bonds are called on December 1, 2015. As a result of the advance refunding, the University reduced its total debt service requirements by $1.9 million, which resulted in an economic gain (difference between the present value of the debt service payments on the old and new debt) of $1.4 million. The balance in the escrow account at June 30, 2015, was $16.6 million. The remaining balance of the defeased bonds at June 30, 2015, was $16.2 million. Component Units In prior years, the Arkansas Development Finance Authority defeased certain bonds by placing the proceeds of new bonds in irrevocable trusts to provide for all future debt service payments of old bonds. Accordingly, these trust account assets and the liability for the defeased bonds are not included in these financial statements. Bonds with total outstanding amounts of approximately $30 million were considered defeased at June 30, 2015. The bonds include the 2005 Series ADFA State Agencies Facilities Revenue Bonds (Arkansas Department of Corrections – Special Needs Unit) and the 2010 Series C ADFA Capital Improvement Revenue Bonds (Academics Plus Charter School Project). Current Refundings Primary Government During fiscal year 2015, the State issued $9.3 million of current refunding bonds to redeem the Public Health Laboratory Project Series 2003 bonds of the Arkansas Department of Health. The bonds bear interest rates at rates ranging from 3.00% to 5.00% and mature in fiscal year 2022. The refunding provided an economic gain of $793 thousand and a reduction of future debt service payments of $2.8 million. Also during fiscal year 2015, the State issued general obligation refunding bonds for $125.9 million to redeem the Higher Education General Obligation Refunding Bonds Series 2007B of the Arkansas Department of Higher Education. The bonds bear interest at rates ranging from 4.00% to 4.25% and mature in fiscal year 2029. As of June 30, 2015, $126.8 million of outstanding bonds are considered defeased, resulting in an economic gain of $9.4 million and a reduction of $10.9 million in future debt service. Higher Education On February 12, 2015, the University of Arkansas Fayetteville issued $70.4 million in Various Facility Revenue Refunding Bonds, Series 2015A. The bonds, with interest rates of 2% to 5% were issued to refund $2.8 million of outstanding bonds dated October 1, 2004, with interest rates of 2% to 4.375%, $13.5 million of outstanding bonds dated March 1, 2005, with interest rates of 3% to 4.5%, and $60.5 million of outstanding bonds dated June 1, 2006, with interest rates of 4% to 5%. Net bond proceeds and premiums of $81.7 million and cash from the University of $1.0 million were deposited into an escrow account to retire the bonds. The refunding of the bonds dated March 1, 2005, and June 1, 2006, was an advance refunding. The combined refunding resulted in a difference between the reacquisition price and the net carrying amount of the old debt of $5.1 million. This difference, reported in the accompanying financial statements as deferred outflows of resources, will be amortized through the fiscal year 2037 using the straight-line method. The University completed the refunding to reduce its total debt service payments over the next twenty-three years by $8.5 million and to obtain an economic gain (difference between the present values of the old and new debt service payments) of $7.6 million. The escrow balance as of June 30, 2015, was $78.2 million. The refunding of the bonds dated October 1, 2004, was a current refunding and the bonds were called on March 15, 2015. The bonds dated March 1, 2005, will continue to have regularly scheduled principal and interest payments made from the escrow account until the bond call date of November 1, 2015, at which time the
81
remaining balance will be refunded. The bonds dated June 1, 2006, will continue to have regularly scheduled principal and interest payments made from the escrow account until the bond call date of November 1, 2016, at which time the remaining balance will be refunded. The remaining balance of the defeased bonds at June 30, 2015, was $74.0 million. On February 2, 2015, the University of Arkansas Fayetteville issued $14.2 million in Athletic Facilities Revenue Refunding Bonds, Series 2015. The bonds, with interest rates of 2% to 5% were issued to refund $4.8 million of outstanding bonds dated June 1, 2006, with interest rates of 4% to 4.375%, and $10.5 million of outstanding bonds dated June 29, 2011, with interest rates of 2% to 4.895%. Net bond proceeds and premiums of $16.2 million and cash from the University of $265.7 thousand were deposited into the advance refunding fund to retire the bonds. The combined refunding resulted in a difference between the reacquisition price and the net carrying amount of the old debt of $135 thousand. This difference, reported in the accompanying financial statements as deferred outflows of resources, will be amortized through the fiscal year 2023 using the straight-line method. The University completed the refunding to reduce its total debt service payments over the next eight years by $1.4 million and to obtain an economic gain of $1.1 million. The escrow balance as of June 30, 2015, was $16.2 million. The bonds dated June 1, 2006, will continue to have regularly scheduled principal and interest payments made from the escrow account until the bond call date of September 15, 2016. The bonds dated June 29, 2011, were not advance refunded in total. As of June 30, 2015, there was a balance of $5.5 million outstanding that was not refunded. These bonds will continue to be paid normally through September 15, 2016. The refunded bonds dated June 29, 2011, will continue to have regularly scheduled interest payments made from the escrow account until the bond call date of September 15, 2016, at which date the principal will be refunded. The remaining balance of the defeased bonds at June 30, 2015, was $15.2 million. On December 17, 2014, University of Arkansas for Medical Sciences (UAMS) issued Revenue Refunding Bonds, Series 2014, of $86.0 million (par value) with an interest rate of 2.52% to 3.17% to advance refund Various Facility Revenue Bond Series 2006 with remaining interest rates of 4.8% to 5% and a par value of $91.6 million. The 2006 bonds mature March 2036. The revenue refunding bonds were issued at a premium of $12.7 million and issuance costs were $211 thousand and underwriter’s discount was $499 thousand. The net proceeds were $98.1 million. The net proceeds from the issuance of the revenue refunding bonds were used to purchase U.S. government securities to provide debt service payments. The advance refunding met the requirements of an in-substance debt defeasance and the 2006 Series bonds were removed from UAMS financial statements. As a result of the advance refunding, UAMS reduced its total debt service requirements by $10.0 million which resulted in an economic gain (difference between the present value of the debt service payments on the old and new debt) of $9.3 million. Principal payments are made annually until 2036. Interest payments are made semi-annually. The advance refunding resulted in a difference between the reaquisition price and the net carrying amount of the old debt of $1.6 million. This difference is reported in the accompanying financial statements as deferred outflows of resources and will be amortized through 2036. The remaining balance of the defeased bonds at June 30, 2015, was $86.2 million. On April 22, 2015, Phillips Community College of the University of Arkansas issued Student Fee Refunding Revenue Bonds, Series 2015, in the amount of $11.3 million with interest rates of 2% to 4%. The purpose of this issue was to refund $10.8 million remaining from the Student Fee Revenue Bonds, Series 2009, which carried interest rates of 3% to 5.2%. Bond proceeds and premium of $11.4 million (after payment of debt issuance costs of $88 thousand and underwriter’s discount of $85 thousand), along with remaining debt service reserve funds of $396 thousand were deposited into the escrow fund to retire the Series 2009 bonds on December 1, 2016. The advance refunding resulted in a difference between the reacquisition price and the net carrying amount of the old debt of $1.0 million. This difference is reported in the accompanying
82
financial statements as deferred outflows of resources and will be amortized over the remaining life of the bonds through 2038 using the straight-line method. The University accomplished the refunding to reduce its total debt service payments by $2.2 million and to obtain an economic gain (difference between the present values of the old and new debt service payments) of $1.3 million. The bonds are callable on December 1, 2016. The balance in the escrow account at June 30, 2015, was $11.5 million and the remaining balance of the defeased bonds was $10.8 million. On April 1, 2015, Arkansas State University-Beebe issued $1.9 million in taxable refunding bonds for the Beebe campus with interest rates of 1% to 3% to refund $1.8 million of outstanding bonds dated September 15, 2005 with interest rates of 2.8% to 4.15%. Net proceeds of $1.9 million after payment of $43.9 thousand for bond issuance costs and a premium of $17 thousand were remitted to an escrow agent to provide for all future payments of the defeased bonds. Additionally, bond proceeds of $5 thousand were received. The bonds were called on April 21, 2015. The current refunding resulted in a difference between the reacquisition price and the net carrying amount of the old debt of $28 thousand. This difference, reported in the accompanying financial statements as a deferred outflow of resources, will be amortized through the year 2024 using the straight-line method. The University refunded the bonds to reduce its total debt service payments by $84 thousand over the next nine (9) years and to obtain an economic gain of $78 thousand. The University received accrued interest of $2 thousand from the bond issue to apply toward the debt payments of the new issue. On April 1, 2015, Arkansas State University-Beebe issued $8.0 million in tax exempt refunding bonds for the Beebe campus with interest rates of 1% to 3.625% to refund $7.8 million of outstanding bonds, with an unamortized discount of $96 thousand, dated April 1, 2010 with interest rates of 2% to 4.65%. Net proceeds of $7.8 million after payment of $128.7 thousand for bond issuance costs and a discount of $69 thousand were remitted to an escrow agent to provide for all future payments of the defeased bonds. Additionally, bond proceeds of $4 thousand were received. The bonds were called on April 21, 2015. The current refunding resulted in a difference between the reacquisition price and the net carrying amount of the old debt of $115 thousand. This difference, reported in the accompanying financial statements as a deferred outflow of resources, will be amortized through the year 2039 using the straight-line method. The University refunded the bonds to reduce its total debt service payments by $1.1 million over the next twenty-four (24) years and to obtain an economic gain of $761 thousand. The University received accrued interest of $14 thousand from the bond issue to apply toward the debt payments of the new issue. On May 1, 2015, Arkansas State University-Beebe issued $12.9 million in tax exempt refunding bonds for the Beebe campus with interest rates of 2% to 4% to advance refund $12.4 million of outstanding bonds dated December 1, 2005 with interest rates of 3.5% to 5%. Net proceeds of $13.0 million, after payment of $152 thousand for bond issuance costs and a premium of $244 thousand were remitted to an escrow agent to provide for all future payments of the defeased bonds. Cash held by the escrow agent in the amount of $13.0 million, is pledged for the retirement of these bonds. As a result of this refunding, the 2005 Series bonds are considered to be defeased and the liability for those bonds has been removed from the Statement of Net Position. The bonds will be called on December 1, 2015. The advance refunding resulted in a difference between the reacquisition price and the net carrying amount of the old debt of $589 thousand. This difference, reported in the accompanying financial statements as a deferred outflow of resources, will be amortized through the year 2036 using the straight-line method. The University advance refunded the bonds to reduce its total debt service payments by $1.9 million over the next twenty-one (21) years and to obtain an economic gain of $1.4 million. The University received accrued interest of $5.9 thousand and an additional $3 thousand from the bond issue to apply toward the debt payments of the new issue.
83
On June 1, 2015, Arkansas State University-Beebe issued $9.2 million in tax exempt refunding bonds for the Beebe campus with interest rates of 2% to 4% to refund $9.0 million of outstanding bonds dated March 1, 2006 with interest rates of 3.25% to 5%. Net proceeds of $9.2 million, after payment of $109 thousand for bond issuance costs and a premium of $143 thousand were remitted to an escrow agent to provide for all future payments of the defeased bonds. Cash held by the escrow agent in the amount of $9.2 million is pledged for the retirement of these bonds. As a result of this refunding, the 2006 Series bonds are considered to be defeased and the liability for those bonds has been removed from the Statement of Net Position. The bonds will be called on September 1, 2015. The current refunding resulted in a difference between the reacquisition price and the net carrying amount of the old debt of $210 thousand. This difference, reported in the accompanying financial statements as a deferred outflow of resources, will be amortized through the year 2036 using the straight-line method. The University refunded the bonds to reduce its total debt service payments by $1.2 million over the next twenty-one (21) years and to obtain an economic gain of $834 thousand. The University received accrued interest of $3 thousand and an additional $5 thousand from the bond issue to apply toward the debt payments of the new issue. On October 1, 2014, Arkansas Tech University issued Housing Refunding Bonds in the amount of $11.0 million with interest rates of 2% to 3.75% to refund $10.5 million of outstanding bonds dated May 1, 2006, and April 1, 2009, respectively, with interest rates of 2.5% to 5.38%. Net proceeds of $10.7 million were deposited with the trustee for the refunding. This was net of $146 thousand paid in bond issuance costs, a premium of $166 thousand, establishment of other trustee accounts of $386 thousand (including $22 thousand accrued interest), and transfers from prior debt service reserves of $71 thousand. The refunding resulted in a difference between the reacquisition price and the net carrying amount of the old debt of $215 thousand. The bonds were called on October 23, 2014. The University refunded the bonds to reduce its total gross debt service payments by $1.6 million over 25 years and obtain an economic gain of $1.4 million. The University received accrued interest of $22 thousand from the bond issue to apply toward the debt payments of the new issue. On October 1, 2014, Arkansas Tech University issued Student Fee Refunding Revenue Bonds in the amount of $16.3 million with interest rates of 2% to 3.75% to refund $15.9 million of outstanding bonds dated April 1, 2008, December 1, 2008, and September 1, 2009, respectively, with interest rates of 2.35% to 5.75%. Net proceeds of $16.1 million were deposited with the trustee for the refunding. This was net of $213 thousand paid in bond issuance costs, a discount of $53 thousand, establishment of other trustee accounts of $552 thousand (including $33 thousand accrued interest), and transfers from prior debt service reserves of $589 thousand. The refunding resulted in a difference between the reacquisition price and the net carrying amount of the old debt of $236 thousand. The bonds were called on October 23, 2014. The University refunded the bonds to reduce its total gross debt service payments by $3.8 million over 25 years and obtain an economic gain of $2.6 million. The University received accrued interest of $33 thousand from the bond issue to apply toward the debt payments of the new issue. On May 20, 2015, The University of Central Arkansas issued $18.2 million in Student Fee Revenue Refunding Bonds, Series 2015, with interest rates of 2% to 4%. The bond proceeds were used to refinance the Series 2006E and Series 2007B bonds, in order to recognize certain savings from more favorable interest rates and earlier maturity dates. The total present value cost savings to the University on the student fee revenue refunding issue is $686 thousand. Bond issuance costs of $197 thousand were expensed and shown as a component of non-operating interest expense in the current fiscal year. Bond insurance costs of $46 thousand were recorded as an asset and amortization for this fiscal year was $242 that was also included as a component of interest expense for the year ended June 30, 2015.
84
On May 28, 2015, The University of Central Arkansas issued $6.9 million in Auxiliary Revenue Refunding Bonds, Series 2015, with interest rates of 2.95%. The bond proceeds were used to refinance the Series 2006D and Series 2007A bonds, in order to recognize certain savings from more favorable interest rates and earlier maturity dates. The total present value cost savings to the University on the auxiliary refunding issue is $312 thousand. Bond issuance costs of $95 thousand were expensed and shown as a component of non-operating interest expense in the current fiscal year. Bond insurance costs of $15 thousand were recorded as an asset and amortization of $74 was also included as a component of interest expense for the year ended June 30, 2015. On June 1, 2015, Henderson State University issued Student Fee Refunding Revenue Bonds, Series 2015, in the amount of $3.8 million with interest rates of 1% to 3.2% to refund $4.4 million of outstanding bonds dated December 1, 2009 with interest rates of 2% to 4.3%. Net proceeds of $3.7 million after payment of $33 thousand for bond issuance costs and a premium of $17 thousand were remitted to an escrow agent to provide for all future payments of the defeased bonds. The bonds were called on June 24, 2015. The current refunding resulted in a difference between the reacquisition price and the net carrying amount of the old debt of $75 thousand. This difference, reported in the accompanying financial statements as a deferred outflow of resources, will be amortized through the year 2025 using the straight-line method. The University refunded the bonds to reduce its total debt service payments by $399 thousand over the next eleven years and to obtain an economic gain of $182 thousand. The University received accrued interest of $5 thousand from the bond issue to apply toward the debt payments of the new issue. On July 1, 2014, South Arkansas Community College issued General Obligation Refunding Bonds, Series 2014, in the amount of $3.3 million with interest rates of 2% to 4% to refund $3.2 million of outstanding Series 2009 Obligation Bonds dated October 1, 2009 with interest rates of 3.25% to 5%. Net proceeds of $3.3 million, after payment of $83 thousand for bond issuance costs and a discount of $12 thousand, were remitted to an escrow agent to provide for all future payments of the defeased bonds. The bonds were called on October 1, 2014. The University refunded the bonds to reduce its total debt service payments by $258 thousand over the next twenty five years and to obtain an economic gain of $240 thousand. On February 26, 2015, Northwest Arkansas Community College issued Capital Improvement Refunding Bonds, Series 2015, in the amount of $16.5 million with interest rates of 2% to 4% to refund $17.6 million of outstanding Series 2005 bonds dated May 15, 2005 with interest rates of 3% to 5%. Net bond proceeds and premium of $17.2 million plus deposits made to Series 2005 debt service account of $782 thousand were deposited into the advance refunding account, plus a minor amount of interest earnings from February 26, 2015 to May 15, 2015 to pay the Series 2005 Bonds of $17.6 million at May 15, 2015 and pay the accrued interest of $401 thousand. This left a balance of $2 thousand to be utilized in debt service for the 2015 bond issue. The College completed this refunding to reduce its total debt payments over the next fifteen years by $2.7 million and to obtain an economic gain (difference between present value between old and new debt service payments) of $2.3 million. On April 1, 2015, Southern Arkansas University-Magnolia issued Capital Improvement and Refunding Bonds, Series 2015, in the amount of $7.5 million with interest rates of 1% to 4.125% to refund $3.0 million of outstanding bonds dated March 1, 2005, July 1, 2009, respectively, with interest rates of 3.25% to 5.25% with the remaining balance to finance the acquisition, construction, and equipping of certain capital improvements, fund a debt service reserve and pay the cost of issuance of Bonds. Net proceeds of $3.0 million were deposited with the trustee for the refunding. This was net of $53 thousand paid in bond issuance costs, deposit with the trustee for the Project Construction Fund of $4.2 million, establishment of other trustee accounts of $233 thousand (including $5 thousand accrued interest) and transfers from prior debt service reserves
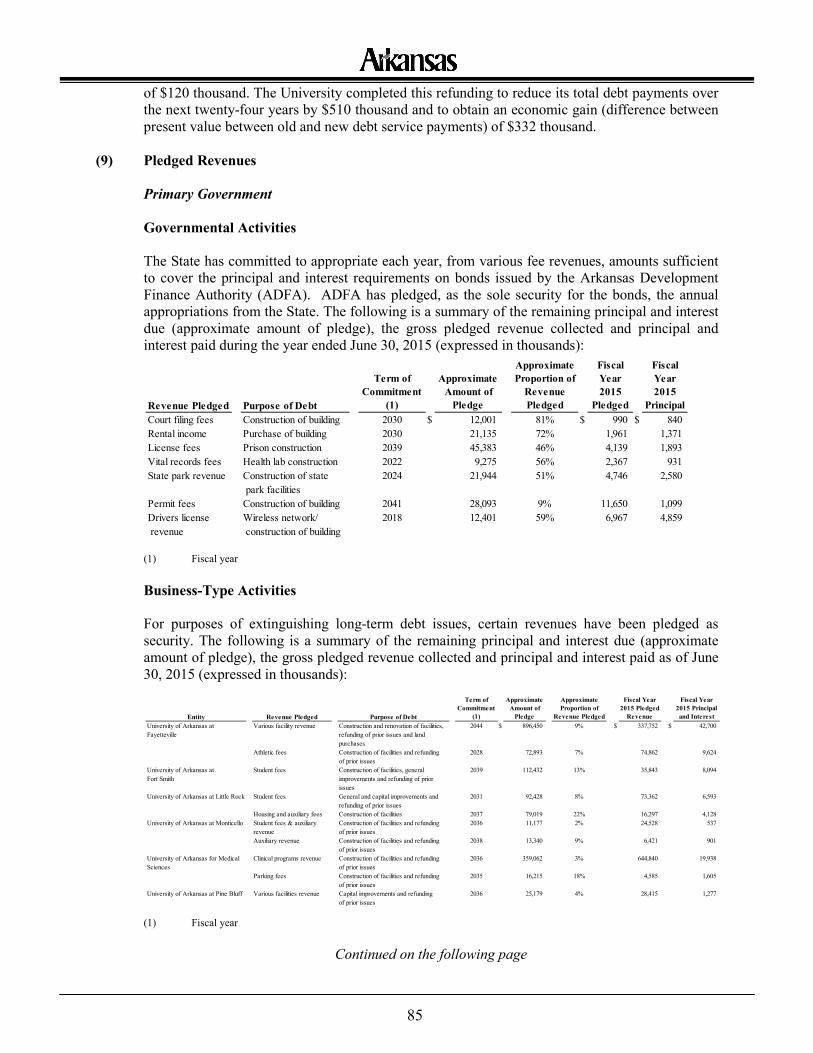
85
of $120 thousand. The University completed this refunding to reduce its total debt payments over the next twenty-four years by $510 thousand and to obtain an economic gain (difference between present value between old and new debt service payments) of $332 thousand.
(9) Pledged Revenues
Primary Government Governmental Activities
The State has committed to appropriate each year, from various fee revenues, amounts sufficient to cover the principal and interest requirements on bonds issued by the Arkansas Development Finance Authority (ADFA). ADFA has pledged, as the sole security for the bonds, the annual appropriations from the State. The following is a summary of the remaining principal and interest due (approximate amount of pledge), the gross pledged revenue collected and principal and interest paid during the year ended June 30, 2015 (expressed in thousands):
(1) Fiscal year Business-Type Activities
For purposes of extinguishing long-term debt issues, certain revenues have been pledged as security. The following is a summary of the remaining principal and interest due (approximate amount of pledge), the gross pledged revenue collected and principal and interest paid as of June 30, 2015 (expressed in thousands):
(1) Fiscal year
Continued on the following page
Revenue Pledged Purpose of Debt
Term of Commitment
(1)
Approximate Amount of
Pledge
Approximate Proportion of
Revenue Pledged
Fiscal Year 2015
Pledged
Fiscal Year 2015
Principal Court filing fees Construction of building 2030 $ 12,001 81% $ 990 $ 840 Rental income Purchase of building 2030 21,135 72% 1,961 1,371 License fees Prison construction 2039 45,383 46% 4,139 1,893 Vital records fees Health lab construction 2022 9,275 56% 2,367 931 State park revenue Construction of state
park facilities2024 21,944 51% 4,746 2,580
Permit fees Construction of building 2041 28,093 9% 11,650 1,099 Drivers license revenue
Wireless network/ construction of building
2018 12,401 59% 6,967 4,859
Entity Revenue Pledged Purpose of Debt
Term of Commitment
(1)
Approximate Amount of
Pledge
Approximate Proportion of
Revenue Pledged
Fiscal Year 2015 Pledged
Revenue
Fiscal Year 2015 Principal and Interest
University of Arkansas atFayetteville
Various facility revenue Construction and renovation of facilities, refunding of prior issues and landpurchases
2044 $ 896,450 9% $ 337,752 $ 42,700
Athletic fees Construction of facilities and refundingof prior issues
2028 72,893 7% 74,862 9,624
University of Arkansas at Fort Smith
Student fees Construction of facilities, general improvements and refunding of priorissues
2039 112,432 13% 35,843 8,094
University of Arkansas at Little Rock Student fees General and capital improvements and refunding of prior issues
2031 92,428 8% 73,362 6,593
Housing and auxiliary fees Construction of facilities 2037 79,019 22% 16,297 4,128 University of Arkansas at Monticello Student fees & auxiliary
revenueConstruction of facilities and refundingof prior issues
2036 11,177 2% 24,528 537
Auxiliary revenue Construction of facilities and refundingof prior issues
2038 13,340 9% 6,421 901
University of Arkansas for Medical Sciences
Clinical programs revenue Construction of facilities and refundingof prior issues
2036 359,062 3% 644,840 19,938
Parking fees Construction of facilities and refundingof prior issues
2035 16,215 18% 4,585 1,605
University of Arkansas at Pine Bluff Various facilities revenue Capital improvements and refundingof prior issues
2036 25,179 4% 28,415 1,277
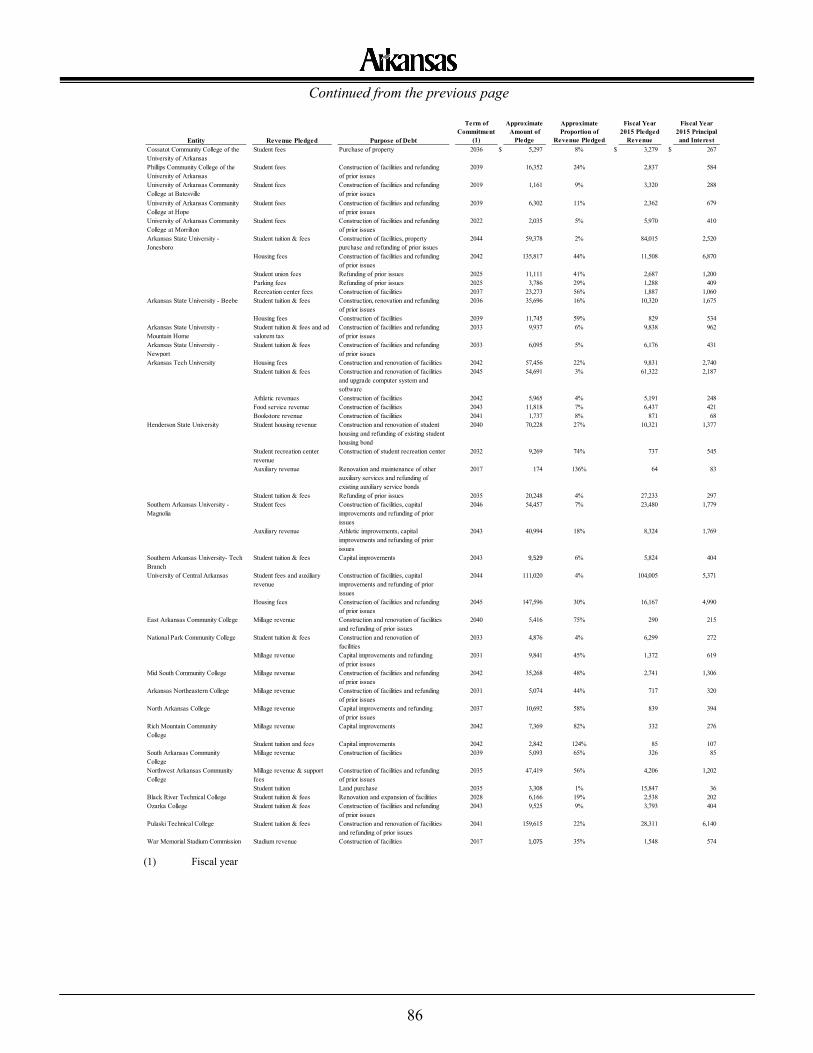
86
Continued from the previous page
(1) Fiscal year
Entity Revenue Pledged Purpose of Debt
Term of Commitment
(1)
Approximate Amount of
Pledge
Approximate Proportion of
Revenue Pledged
Fiscal Year 2015 Pledged
Revenue
Fiscal Year 2015 Principal and Interest
Cossatot Community College of the University of Arkansas
Student fees Purchase of property 2036 $ 5,297 8% $ 3,279 $ 267
Phillips Community College of the University of Arkansas
Student fees Construction of facilities and refundingof prior issues
2039 16,352 24% 2,837 584
University of Arkansas Community College at Batesville
Student fees Construction of facilities and refundingof prior issues
2019 1,161 9% 3,320 288
University of Arkansas Community College at Hope
Student fees Construction of facilities and refundingof prior issues
2039 6,302 11% 2,362 679
University of Arkansas Community College at Morrilton
Student fees Construction of facilities and refundingof prior issues
2022 2,035 5% 5,970 410
Arkansas State University - Jonesboro
Student tuition & fees Construction of facilities, property purchase and refunding of prior issues
2044 59,378 2% 84,015 2,520
Housing fees Construction of facilities and refundingof prior issues
2042 135,817 44% 11,508 6,870
Student union fees Refunding of prior issues 2025 11,111 41% 2,687 1,200 Parking fees Refunding of prior issues 2025 3,786 29% 1,288 409 Recreation center fees Construction of facilities 2037 23,273 56% 1,887 1,060
Arkansas State University - Beebe Student tuition & fees Construction, renovation and refundingof prior issues
2036 35,696 16% 10,320 1,675
Housing fees Construction of facilities 2039 11,745 59% 829 534 Arkansas State University - Mountain Home
Student tuition & fees and ad valorem tax
Construction of facilities and refundingof prior issues
2033 9,937 6% 9,838 962
Arkansas State University - Newport
Student tuition & fees Construction of facilities and refundingof prior issues
2033 6,095 5% 6,176 431
Arkansas Tech University Housing fees Construction and renovation of facilities 2042 57,456 22% 9,831 2,740 Student tuition & fees Construction and renovation of facilities
and upgrade computer system and software
2045 54,691 3% 61,322 2,187
Athletic revenues Construction of facilities 2042 5,965 4% 5,191 248 Food service revenue Construction of facilities 2043 11,818 7% 6,437 421 Bookstore revenue Construction of facilities 2041 1,737 8% 871 68
Henderson State University Student housing revenue Construction and renovation of student housing and refunding of existing student housing bond
2040 70,228 27% 10,321 1,377
Student recreation center revenue
Construction of student recreation center 2032 9,269 74% 737 545
Auxiliary revenue Renovation and maintenance of other auxiliary services and refunding of existing auxiliary service bonds
2017 174 136% 64 83
Student tuition & fees Refunding of prior issues 2035 20,248 4% 27,233 297 Southern Arkansas University - Magnolia
Student fees Construction of facilities, capital improvements and refunding of prior issues
2046 54,457 7% 23,480 1,779
Auxiliary revenue Athletic improvements, capital improvements and refunding of prior issues
2043 40,994 18% 8,324 1,769
Southern Arkansas University- Tech Branch
Student tuition & fees Capital improvements 2043 9,529 6% 5,824 404
University of Central Arkansas Student fees and auxiliary revenue
Construction of facilities, capital improvements and refunding of prior issues
2044 111,020 4% 104,005 5,371
Housing fees Construction of facilities and refundingof prior issues
2045 147,596 30% 16,167 4,990
East Arkansas Community College Millage revenue Construction and renovation of facilities and refunding of prior issues
2040 5,416 75% 290 215
National Park Community College Student tuition & fees Construction and renovation of facilities
2033 4,876 4% 6,299 272
Millage revenue Capital improvements and refundingof prior issues
2031 9,841 45% 1,372 619
Mid South Community College Millage revenue Construction of facilities and refundingof prior issues
2042 35,268 48% 2,741 1,306
Arkansas Northeastern College Millage revenue Construction of facilities and refundingof prior issues
2031 5,074 44% 717 320
North Arkansas College Millage revenue Capital improvements and refundingof prior issues
2037 10,692 58% 839 394
Rich Mountain CommunityCollege
Millage revenue Capital improvements 2042 7,369 82% 332 276
Student tuition and fees Capital improvements 2042 2,842 124% 85 107 South Arkansas CommunityCollege
Millage revenue Construction of facilities 2039 5,093 65% 326 85
Northwest Arkansas Community College
Millage revenue & support fees
Construction of facilities and refundingof prior issues
2035 47,419 56% 4,206 1,202
Student tuition Land purchase 2035 3,308 1% 15,847 36 Black River Technical College Student tuition & fees Renovation and expansion of facilities 2028 6,166 19% 2,538 202 Ozarka College Student tuition & fees Construction of facilities and refunding
of prior issues2043 9,525 9% 3,793 404
Pulaski Technical College Student tuition & fees Construction and renovation of facilities and refunding of prior issues
2041 159,615 22% 28,311 6,140
War Memorial Stadium Commission Stadium revenue Construction of facilities 2017 1,075 35% 1,548 574
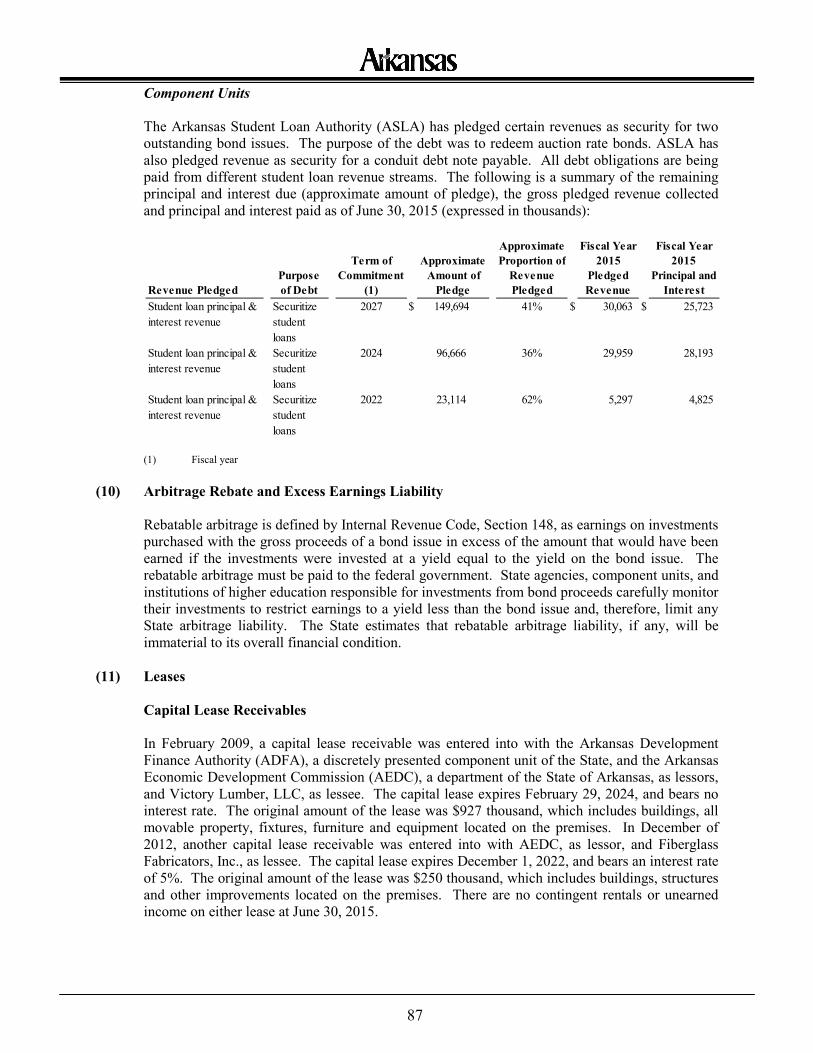
87
Component Units The Arkansas Student Loan Authority (ASLA) has pledged certain revenues as security for two outstanding bond issues. The purpose of the debt was to redeem auction rate bonds. ASLA has also pledged revenue as security for a conduit debt note payable. All debt obligations are being paid from different student loan revenue streams. The following is a summary of the remaining principal and interest due (approximate amount of pledge), the gross pledged revenue collected and principal and interest paid as of June 30, 2015 (expressed in thousands):
(1) Fiscal year
(10) Arbitrage Rebate and Excess Earnings Liability
Rebatable arbitrage is defined by Internal Revenue Code, Section 148, as earnings on investments purchased with the gross proceeds of a bond issue in excess of the amount that would have been earned if the investments were invested at a yield equal to the yield on the bond issue. The rebatable arbitrage must be paid to the federal government. State agencies, component units, and institutions of higher education responsible for investments from bond proceeds carefully monitor their investments to restrict earnings to a yield less than the bond issue and, therefore, limit any State arbitrage liability. The State estimates that rebatable arbitrage liability, if any, will be immaterial to its overall financial condition.
(11) Leases
Capital Lease Receivables
In February 2009, a capital lease receivable was entered into with the Arkansas Development Finance Authority (ADFA), a discretely presented component unit of the State, and the Arkansas Economic Development Commission (AEDC), a department of the State of Arkansas, as lessors, and Victory Lumber, LLC, as lessee. The capital lease expires February 29, 2024, and bears no interest rate. The original amount of the lease was $927 thousand, which includes buildings, all movable property, fixtures, furniture and equipment located on the premises. In December of 2012, another capital lease receivable was entered into with AEDC, as lessor, and Fiberglass Fabricators, Inc., as lessee. The capital lease expires December 1, 2022, and bears an interest rate of 5%. The original amount of the lease was $250 thousand, which includes buildings, structures and other improvements located on the premises. There are no contingent rentals or unearned income on either lease at June 30, 2015.
Revenue PledgedPurpose of Debt
Term of Commitment
(1)
Approximate Amount of
Pledge
Approximate Proportion of
Revenue Pledged
Fiscal Year 2015
Pledged Revenue
Fiscal Year 2015
Principal and Interest
Student loan principal & interest revenue
Securitize student loans
2027 $ 149,694 41% $ 30,063 $ 25,723
Student loan principal & interest revenue
Securitize student loans
2024 96,666 36% 29,959 28,193
Student loan principal & interest revenue
Securitize student loans
2022 23,114 62% 5,297 4,825
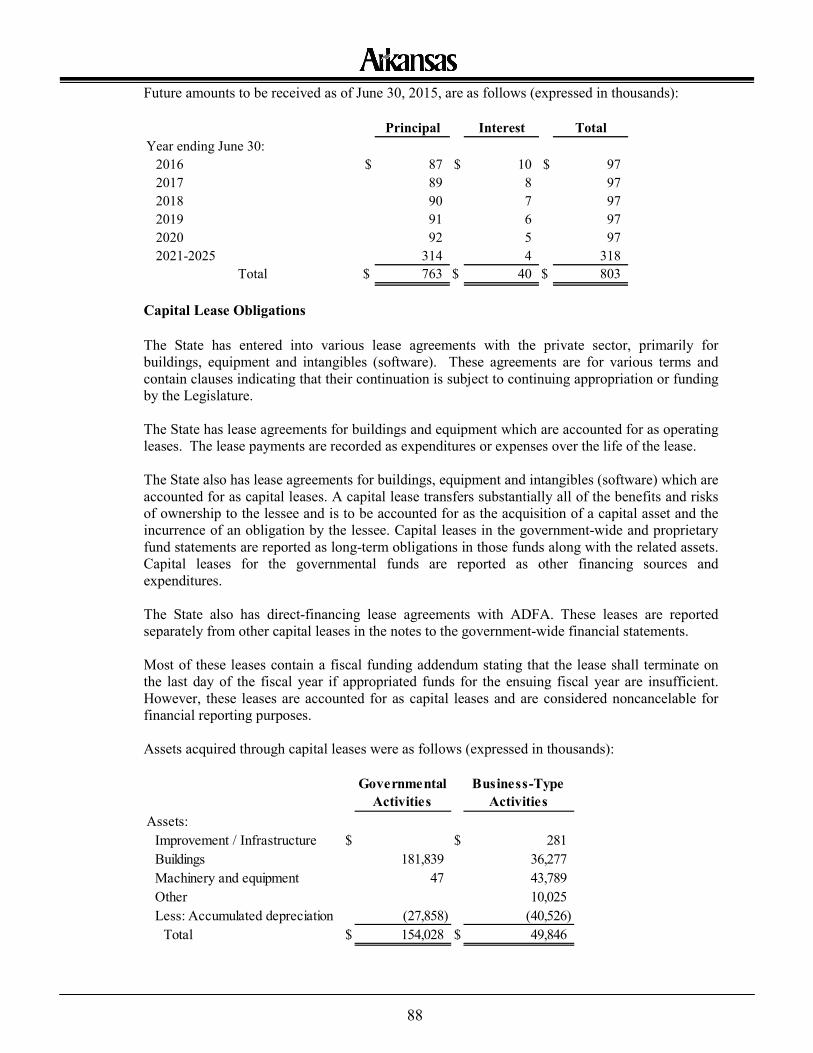
88
Future amounts to be received as of June 30, 2015, are as follows (expressed in thousands):
Capital Lease Obligations
The State has entered into various lease agreements with the private sector, primarily for buildings, equipment and intangibles (software). These agreements are for various terms and contain clauses indicating that their continuation is subject to continuing appropriation or funding by the Legislature. The State has lease agreements for buildings and equipment which are accounted for as operating leases. The lease payments are recorded as expenditures or expenses over the life of the lease. The State also has lease agreements for buildings, equipment and intangibles (software) which are accounted for as capital leases. A capital lease transfers substantially all of the benefits and risks of ownership to the lessee and is to be accounted for as the acquisition of a capital asset and the incurrence of an obligation by the lessee. Capital leases in the government-wide and proprietary fund statements are reported as long-term obligations in those funds along with the related assets. Capital leases for the governmental funds are reported as other financing sources and expenditures. The State also has direct-financing lease agreements with ADFA. These leases are reported separately from other capital leases in the notes to the government-wide financial statements. Most of these leases contain a fiscal funding addendum stating that the lease shall terminate on the last day of the fiscal year if appropriated funds for the ensuing fiscal year are insufficient. However, these leases are accounted for as capital leases and are considered noncancelable for financial reporting purposes. Assets acquired through capital leases were as follows (expressed in thousands):
Principal Interest TotalYear ending June 30:
2016 $ 87 $ 10 $ 972017 89 8 972018 90 7 972019 91 6 972020 92 5 972021-2025 314 4 318
Total $ 763 $ 40 $ 803
Governmental Activities
Business-Type Activities
Assets:Improvement / Infrastructure $ $ 281Buildings 181,839 36,277Machinery and equipment 47 43,789Other 10,025Less: Accumulated depreciation (27,858) (40,526)
Total $ 154,028 $ 49,846
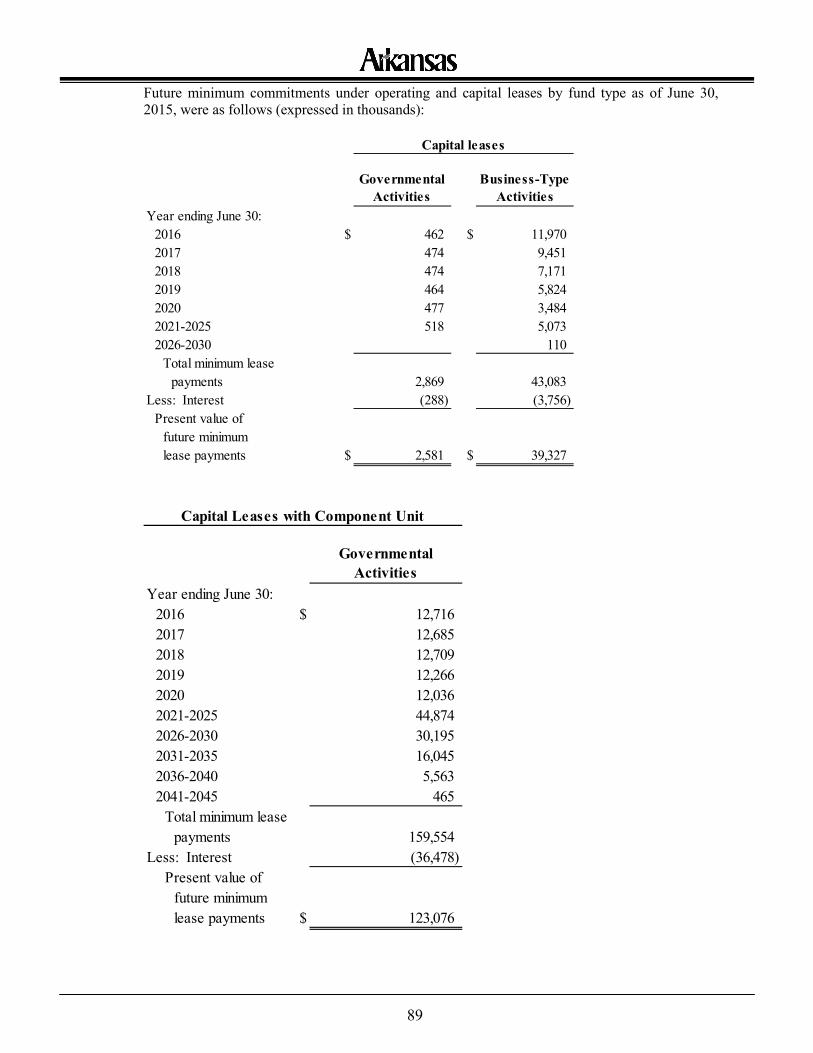
89
Future minimum commitments under operating and capital leases by fund type as of June 30, 2015, were as follows (expressed in thousands):
Governmental Activities
Business-Type Activities
Year ending June 30:2016 $ 462 $ 11,9702017 474 9,4512018 474 7,1712019 464 5,8242020 477 3,4842021-2025 518 5,0732026-2030 110
Total minimum leasepayments 2,869 43,083
Less: Interest (288) (3,756)Present value of
future minimumlease payments $ 2,581 $ 39,327
Capital leases
Governmental Activities
Year ending June 30:2016 $ 12,7162017 12,6852018 12,7092019 12,2662020 12,0362021-2025 44,8742026-2030 30,1952031-2035 16,0452036-2040 5,5632041-2045 465
Total minimum leasepayments 159,554
Less: Interest (36,478)Present value of
future minimumlease payments $ 123,076
Capital Leases with Component Unit
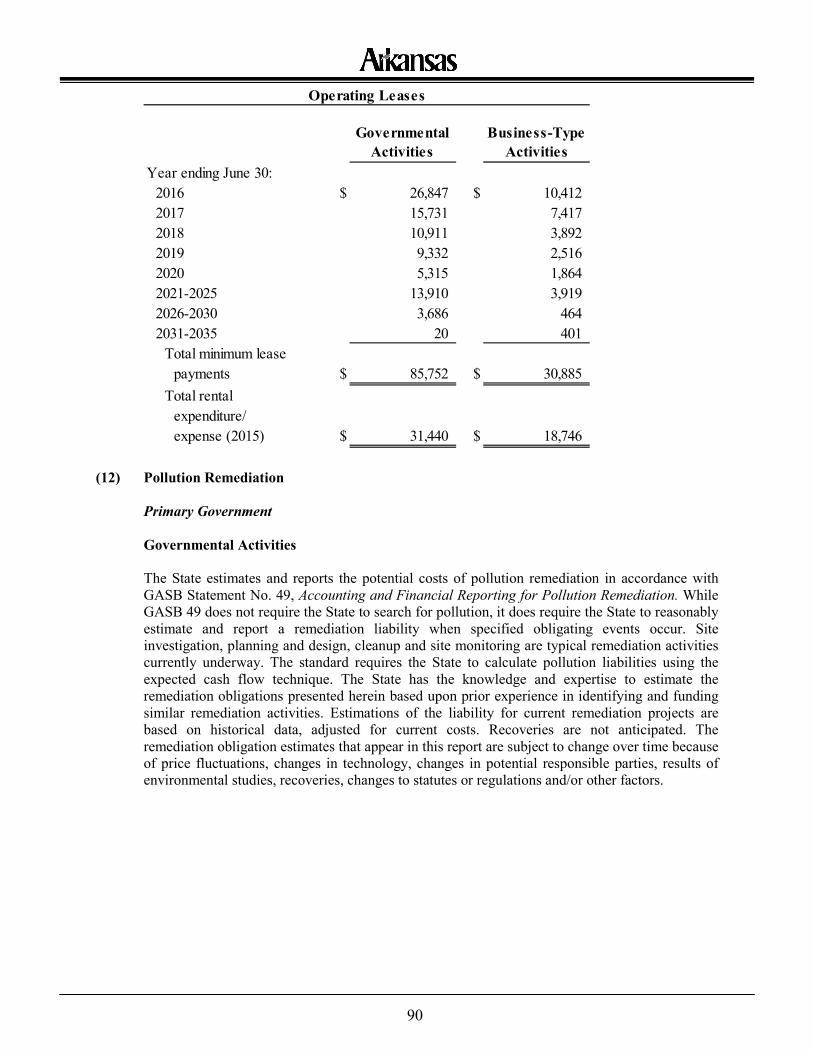
90
(12) Pollution Remediation
Primary Government Governmental Activities The State estimates and reports the potential costs of pollution remediation in accordance with GASB Statement No. 49, Accounting and Financial Reporting for Pollution Remediation. While GASB 49 does not require the State to search for pollution, it does require the State to reasonably estimate and report a remediation liability when specified obligating events occur. Site investigation, planning and design, cleanup and site monitoring are typical remediation activities currently underway. The standard requires the State to calculate pollution liabilities using the expected cash flow technique. The State has the knowledge and expertise to estimate the remediation obligations presented herein based upon prior experience in identifying and funding similar remediation activities. Estimations of the liability for current remediation projects are based on historical data, adjusted for current costs. Recoveries are not anticipated. The remediation obligation estimates that appear in this report are subject to change over time because of price fluctuations, changes in technology, changes in potential responsible parties, results of environmental studies, recoveries, changes to statutes or regulations and/or other factors.
Governmental Activities
Business-Type Activities
Year ending June 30:2016 $ 26,847 $ 10,4122017 15,731 7,4172018 10,911 3,8922019 9,332 2,5162020 5,315 1,8642021-2025 13,910 3,9192026-2030 3,686 4642031-2035 20 401
Total minimum leasepayments $ 85,752 $ 30,885
Total rental expenditure/expense (2015) $ 31,440 $ 18,746
Operating Leases
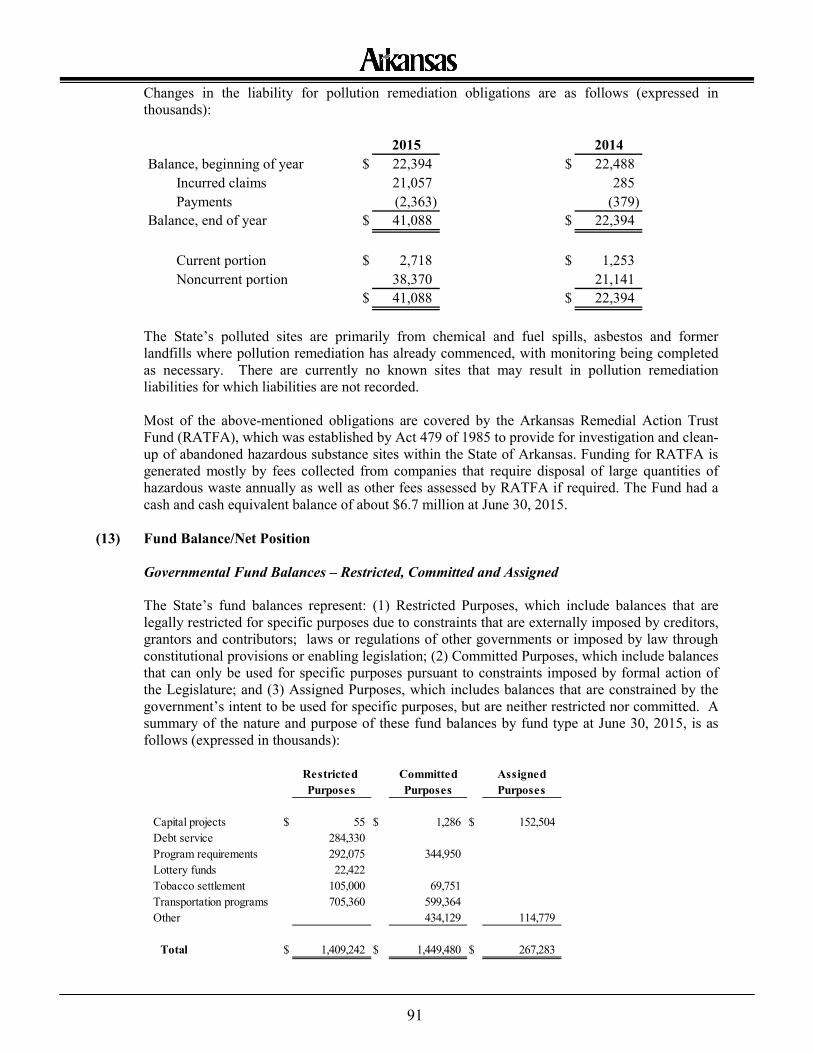
91
Changes in the liability for pollution remediation obligations are as follows (expressed in thousands):
The State’s polluted sites are primarily from chemical and fuel spills, asbestos and former landfills where pollution remediation has already commenced, with monitoring being completed as necessary. There are currently no known sites that may result in pollution remediation liabilities for which liabilities are not recorded. Most of the above-mentioned obligations are covered by the Arkansas Remedial Action Trust Fund (RATFA), which was established by Act 479 of 1985 to provide for investigation and clean-up of abandoned hazardous substance sites within the State of Arkansas. Funding for RATFA is generated mostly by fees collected from companies that require disposal of large quantities of hazardous waste annually as well as other fees assessed by RATFA if required. The Fund had a cash and cash equivalent balance of about $6.7 million at June 30, 2015.
(13) Fund Balance/Net Position
Governmental Fund Balances – Restricted, Committed and Assigned
The State’s fund balances represent: (1) Restricted Purposes, which include balances that are legally restricted for specific purposes due to constraints that are externally imposed by creditors, grantors and contributors; laws or regulations of other governments or imposed by law through constitutional provisions or enabling legislation; (2) Committed Purposes, which include balances that can only be used for specific purposes pursuant to constraints imposed by formal action of the Legislature; and (3) Assigned Purposes, which includes balances that are constrained by the government’s intent to be used for specific purposes, but are neither restricted nor committed. A summary of the nature and purpose of these fund balances by fund type at June 30, 2015, is as follows (expressed in thousands):
2015 2014Balance, beginning of year $ 22,394 $ 22,488
Incurred claims 21,057 285Payments (2,363) (379)
Balance, end of year $ 41,088 $ 22,394
Current portion $ 2,718 $ 1,253Noncurrent portion 38,370 21,141
$ 41,088 $ 22,394
Restricted Committed AssignedPurposes Purposes Purposes
Capital projects $ 55 $ 1,286 $ 152,504Debt service 284,330Program requirements 292,075 344,950Lottery funds 22,422Tobacco settlement 105,000 69,751Transportation programs 705,360 599,364Other 434,129 114,779
Total $ 1,409,242 $ 1,449,480 $ 267,283
92
The State’s fund balance includes: (1) $292.1 million in federal program revenue, private grants and revenue restricted by enabling legislation for specific programs, of which 34% is held by the health and human services function of the State, 26% is held by the general government function of the State to be used for administrative costs that are federally funded and 20% is held by the recreation function of the State to be used primarily for parks and tourism and wildlife management; (2) $705.4 million in general obligation four-lane highway construction and improvement bonds restricted by voter passage of constitutional amendment 97; (3) $345.0 million in revenue committed by the Arkansas General Assembly through legislation for state programs (i.e. health and human services, oil and gas commission, Arkansas natural and cultural resources, higher education, aeronautics and sustainable building design) as specified in the Arkansas Code; and (4) $599.4 million in revenue provided to the State Highway and Transportation Department committed for maintenance, operation and improvement of state highways as specified in the Arkansas Code.
Net Position Restricted by Enabling Legislation Enabling legislation is limited to legislation that the government itself approves. It establishes restriction if it includes a legally enforceable requirement that those resources be used only for the specific purposes stipulated in the legislation. Legally enforceable means that a government can be compelled by an external party, such as citizens, public interest groups or the judiciary, to use resources created by enabling legislation only for the purpose specified by the legislation. At June 30, 2015, the government-wide statement of net position reported $1.6 billion in restricted net position for governmental activities, of which $928.6 million was restricted by enabling legislation. Donor-Restricted Endowments
The State has donor-restricted endowments with net appreciation of $60.8 million on investments which are available for expenditure by the respective governing boards. Such amounts are included in Restricted Net Position in accordance with the restriction of the gift instrument. Three sections of the Arkansas Code outline the restrictions placed on the endowment fund and the net appreciation. First, Arkansas Code Annotated §28-69-603 restricts the expenditure of endowment funds that the governing body determines to be prudent under the standards established by Arkansas Code Annotated §28-69-607 for the uses and purposes for which an endowment fund is established. This section does not limit the authority of the governing board to expend funds as permitted under other law, the terms of the applicable gift instrument or the charter of the institution. Second, Arkansas Code Annotated §28-69-604 rule of construction states the restriction on the expenditures may not be implied for endowment funds. Third, Arkansas Code Annotated §28-69-607 standard of conduct states that members of a governing board shall exercise ordinary business care and prudence in decision-making and retaining investments and shall consider long and short-term needs of the institution’s financial requirements. Deficit Net Position
The Workers’ Compensation Commission (WCC) had a $119.9 million deficit in net position as of June 30, 2015. The deficit is due to a change in actuarial assumptions during the fiscal year ended June 30, 1997. During 1987, the structure of the law changed by tying workers’ compensation payments to the State’s average weekly wage, beginning on January 1, 1989. However, the threshold at which the agency’s Permanent and Total Disability Trust Fund takes over indemnity payments was not changed, and has remained static at $75 thousand from 1982 to 2008, although the state maximum total disability rate has increased over 300% since that time. This increased payout of claims, without a concomitant increase in the takeover threshold and
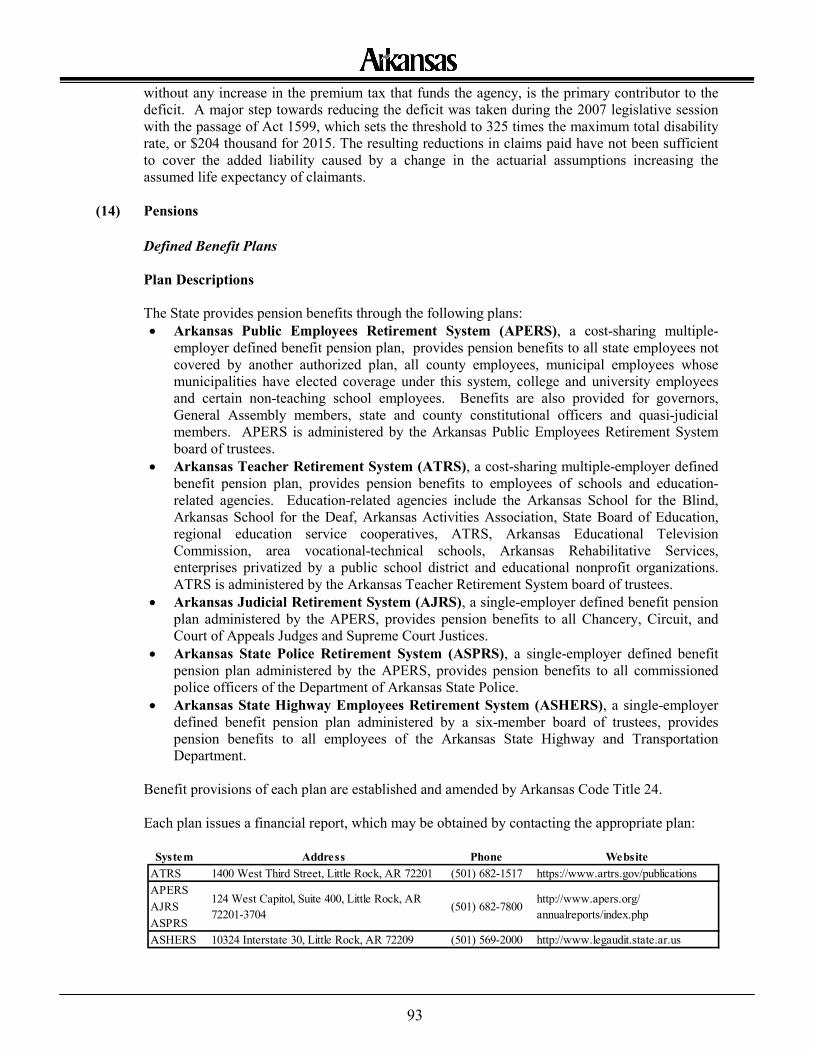
93
without any increase in the premium tax that funds the agency, is the primary contributor to the deficit. A major step towards reducing the deficit was taken during the 2007 legislative session with the passage of Act 1599, which sets the threshold to 325 times the maximum total disability rate, or $204 thousand for 2015. The resulting reductions in claims paid have not been sufficient to cover the added liability caused by a change in the actuarial assumptions increasing the assumed life expectancy of claimants.
(14) Pensions
Defined Benefit Plans
Plan Descriptions The State provides pension benefits through the following plans: • Arkansas Public Employees Retirement System (APERS), a cost-sharing multiple-
employer defined benefit pension plan, provides pension benefits to all state employees not covered by another authorized plan, all county employees, municipal employees whose municipalities have elected coverage under this system, college and university employees and certain non-teaching school employees. Benefits are also provided for governors, General Assembly members, state and county constitutional officers and quasi-judicial members. APERS is administered by the Arkansas Public Employees Retirement System board of trustees.
• Arkansas Teacher Retirement System (ATRS), a cost-sharing multiple-employer defined benefit pension plan, provides pension benefits to employees of schools and education-related agencies. Education-related agencies include the Arkansas School for the Blind, Arkansas School for the Deaf, Arkansas Activities Association, State Board of Education, regional education service cooperatives, ATRS, Arkansas Educational Television Commission, area vocational-technical schools, Arkansas Rehabilitative Services, enterprises privatized by a public school district and educational nonprofit organizations. ATRS is administered by the Arkansas Teacher Retirement System board of trustees.
• Arkansas Judicial Retirement System (AJRS), a single-employer defined benefit pension plan administered by the APERS, provides pension benefits to all Chancery, Circuit, and Court of Appeals Judges and Supreme Court Justices.
• Arkansas State Police Retirement System (ASPRS), a single-employer defined benefit pension plan administered by the APERS, provides pension benefits to all commissioned police officers of the Department of Arkansas State Police.
• Arkansas State Highway Employees Retirement System (ASHERS), a single-employer defined benefit pension plan administered by a six-member board of trustees, provides pension benefits to all employees of the Arkansas State Highway and Transportation Department.
Benefit provisions of each plan are established and amended by Arkansas Code Title 24. Each plan issues a financial report, which may be obtained by contacting the appropriate plan:
System Address Phone WebsiteATRS 1400 West Third Street, Little Rock, AR 72201 (501) 682-1517 https://www.artrs.gov/publicationsAPERSAJRSASPRSASHERS 10324 Interstate 30, Little Rock, AR 72209 (501) 569-2000 http://www.legaudit.state.ar.us
124 West Capitol, Suite 400, Little Rock, AR 72201-3704
http://www.apers.org/annualreports/index.php
(501) 682-7800
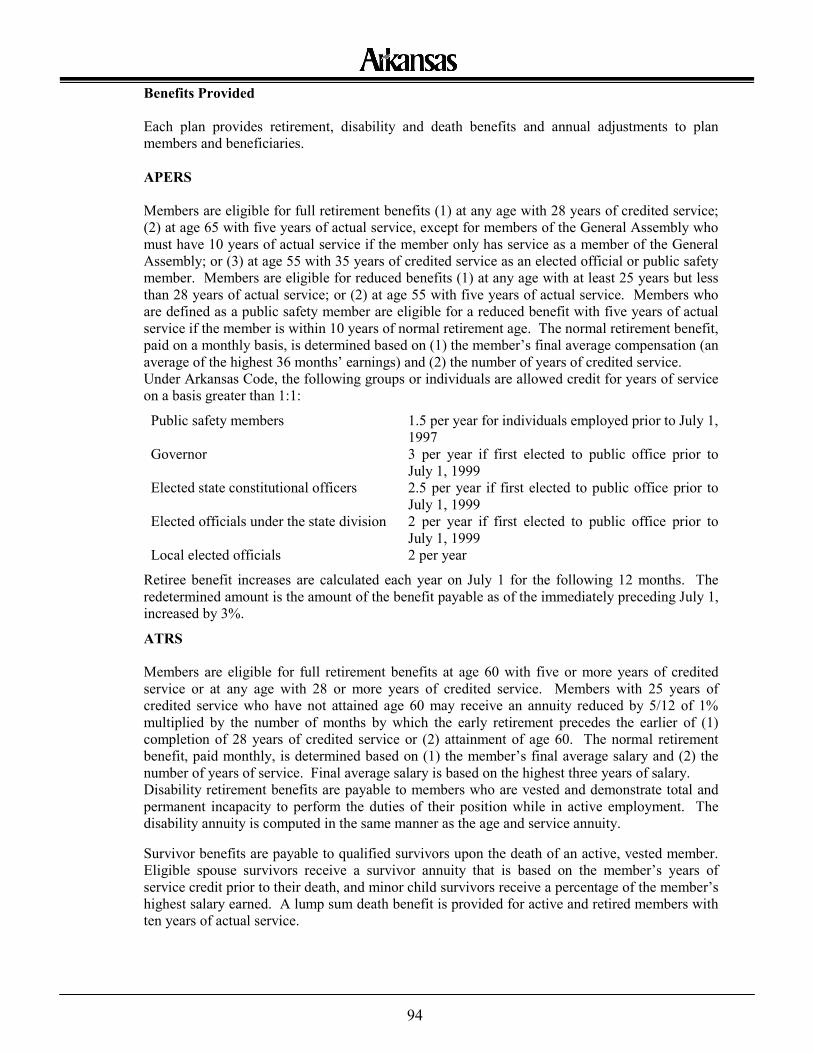
94
Benefits Provided Each plan provides retirement, disability and death benefits and annual adjustments to plan members and beneficiaries. APERS
Members are eligible for full retirement benefits (1) at any age with 28 years of credited service; (2) at age 65 with five years of actual service, except for members of the General Assembly who must have 10 years of actual service if the member only has service as a member of the General Assembly; or (3) at age 55 with 35 years of credited service as an elected official or public safety member. Members are eligible for reduced benefits (1) at any age with at least 25 years but less than 28 years of actual service; or (2) at age 55 with five years of actual service. Members who are defined as a public safety member are eligible for a reduced benefit with five years of actual service if the member is within 10 years of normal retirement age. The normal retirement benefit, paid on a monthly basis, is determined based on (1) the member’s final average compensation (an average of the highest 36 months’ earnings) and (2) the number of years of credited service. Under Arkansas Code, the following groups or individuals are allowed credit for years of service on a basis greater than 1:1:
Public safety members 1.5 per year for individuals employed prior to July 1, 1997
Governor 3 per year if first elected to public office prior to July 1, 1999
Elected state constitutional officers 2.5 per year if first elected to public office prior to July 1, 1999
Elected officials under the state division 2 per year if first elected to public office prior to July 1, 1999
Local elected officials 2 per year
Retiree benefit increases are calculated each year on July 1 for the following 12 months. The redetermined amount is the amount of the benefit payable as of the immediately preceding July 1, increased by 3%.
ATRS Members are eligible for full retirement benefits at age 60 with five or more years of credited service or at any age with 28 or more years of credited service. Members with 25 years of credited service who have not attained age 60 may receive an annuity reduced by 5/12 of 1% multiplied by the number of months by which the early retirement precedes the earlier of (1) completion of 28 years of credited service or (2) attainment of age 60. The normal retirement benefit, paid monthly, is determined based on (1) the member’s final average salary and (2) the number of years of service. Final average salary is based on the highest three years of salary. Disability retirement benefits are payable to members who are vested and demonstrate total and permanent incapacity to perform the duties of their position while in active employment. The disability annuity is computed in the same manner as the age and service annuity.
Survivor benefits are payable to qualified survivors upon the death of an active, vested member. Eligible spouse survivors receive a survivor annuity that is based on the member’s years of service credit prior to their death, and minor child survivors receive a percentage of the member’s highest salary earned. A lump sum death benefit is provided for active and retired members with ten years of actual service.
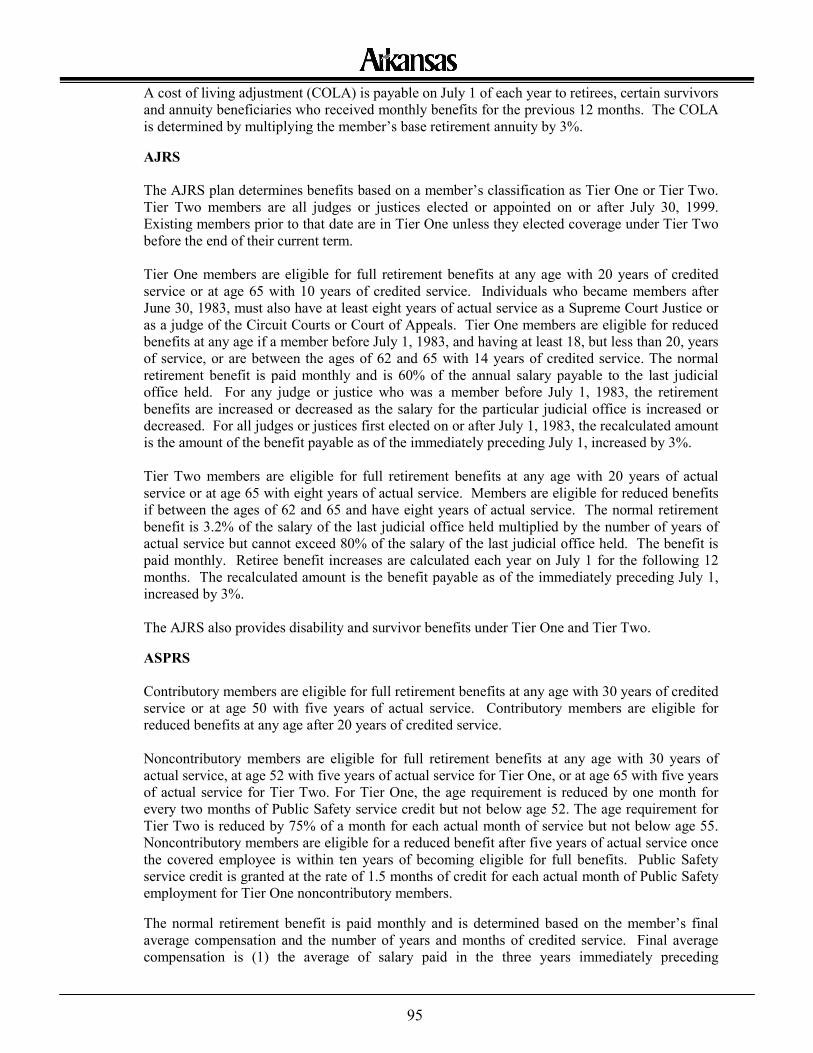
95
A cost of living adjustment (COLA) is payable on July 1 of each year to retirees, certain survivors and annuity beneficiaries who received monthly benefits for the previous 12 months. The COLA is determined by multiplying the member’s base retirement annuity by 3%.
AJRS The AJRS plan determines benefits based on a member’s classification as Tier One or Tier Two. Tier Two members are all judges or justices elected or appointed on or after July 30, 1999. Existing members prior to that date are in Tier One unless they elected coverage under Tier Two before the end of their current term. Tier One members are eligible for full retirement benefits at any age with 20 years of credited service or at age 65 with 10 years of credited service. Individuals who became members after June 30, 1983, must also have at least eight years of actual service as a Supreme Court Justice or as a judge of the Circuit Courts or Court of Appeals. Tier One members are eligible for reduced benefits at any age if a member before July 1, 1983, and having at least 18, but less than 20, years of service, or are between the ages of 62 and 65 with 14 years of credited service. The normal retirement benefit is paid monthly and is 60% of the annual salary payable to the last judicial office held. For any judge or justice who was a member before July 1, 1983, the retirement benefits are increased or decreased as the salary for the particular judicial office is increased or decreased. For all judges or justices first elected on or after July 1, 1983, the recalculated amount is the amount of the benefit payable as of the immediately preceding July 1, increased by 3%. Tier Two members are eligible for full retirement benefits at any age with 20 years of actual service or at age 65 with eight years of actual service. Members are eligible for reduced benefits if between the ages of 62 and 65 and have eight years of actual service. The normal retirement benefit is 3.2% of the salary of the last judicial office held multiplied by the number of years of actual service but cannot exceed 80% of the salary of the last judicial office held. The benefit is paid monthly. Retiree benefit increases are calculated each year on July 1 for the following 12 months. The recalculated amount is the benefit payable as of the immediately preceding July 1, increased by 3%. The AJRS also provides disability and survivor benefits under Tier One and Tier Two.
ASPRS Contributory members are eligible for full retirement benefits at any age with 30 years of credited service or at age 50 with five years of actual service. Contributory members are eligible for reduced benefits at any age after 20 years of credited service. Noncontributory members are eligible for full retirement benefits at any age with 30 years of actual service, at age 52 with five years of actual service for Tier One, or at age 65 with five years of actual service for Tier Two. For Tier One, the age requirement is reduced by one month for every two months of Public Safety service credit but not below age 52. The age requirement for Tier Two is reduced by 75% of a month for each actual month of service but not below age 55. Noncontributory members are eligible for a reduced benefit after five years of actual service once the covered employee is within ten years of becoming eligible for full benefits. Public Safety service credit is granted at the rate of 1.5 months of credit for each actual month of Public Safety employment for Tier One noncontributory members.
The normal retirement benefit is paid monthly and is determined based on the member’s final average compensation and the number of years and months of credited service. Final average compensation is (1) the average of salary paid in the three years immediately preceding
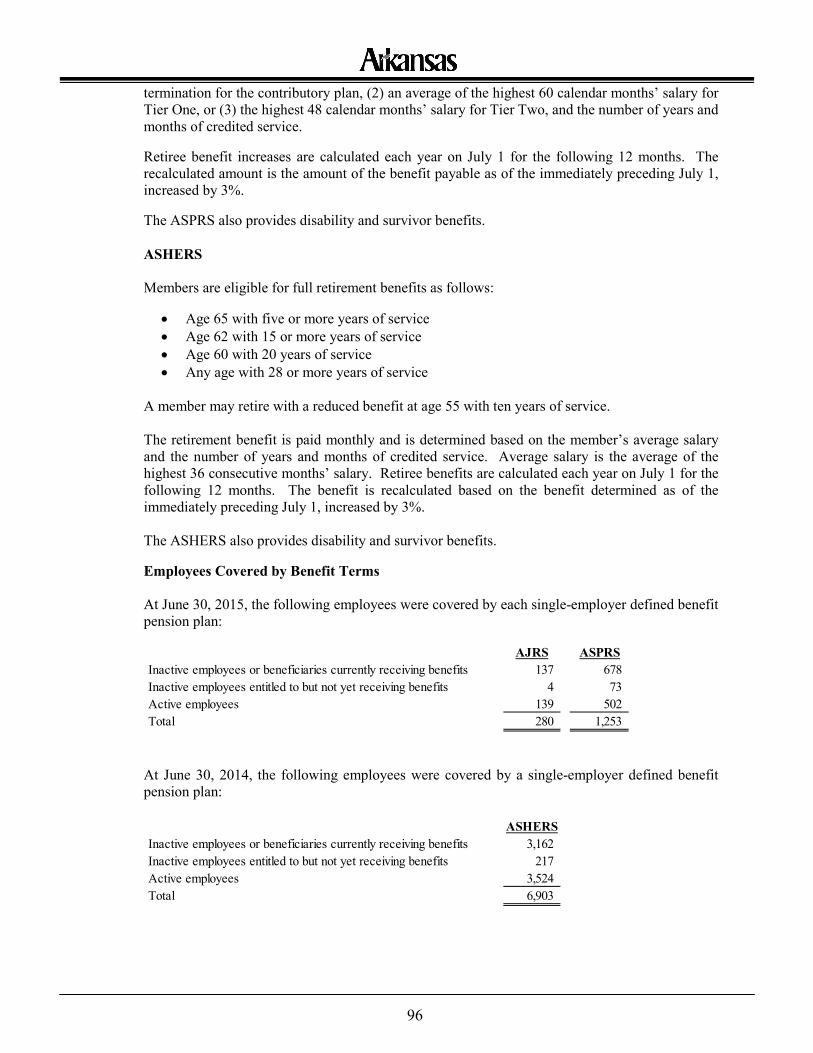
96
termination for the contributory plan, (2) an average of the highest 60 calendar months’ salary for Tier One, or (3) the highest 48 calendar months’ salary for Tier Two, and the number of years and months of credited service.
Retiree benefit increases are calculated each year on July 1 for the following 12 months. The recalculated amount is the amount of the benefit payable as of the immediately preceding July 1, increased by 3%.
The ASPRS also provides disability and survivor benefits. ASHERS Members are eligible for full retirement benefits as follows:
• Age 65 with five or more years of service • Age 62 with 15 or more years of service • Age 60 with 20 years of service • Any age with 28 or more years of service
A member may retire with a reduced benefit at age 55 with ten years of service. The retirement benefit is paid monthly and is determined based on the member’s average salary and the number of years and months of credited service. Average salary is the average of the highest 36 consecutive months’ salary. Retiree benefits are calculated each year on July 1 for the following 12 months. The benefit is recalculated based on the benefit determined as of the immediately preceding July 1, increased by 3%. The ASHERS also provides disability and survivor benefits.
Employees Covered by Benefit Terms At June 30, 2015, the following employees were covered by each single-employer defined benefit pension plan:
At June 30, 2014, the following employees were covered by a single-employer defined benefit pension plan:
AJRS ASPRSInactive employees or beneficiaries currently receiving benefits 137 678 Inactive employees entitled to but not yet receiving benefits 4 73 Active employees 139 502 Total 280 1,253
ASHERSInactive employees or beneficiaries currently receiving benefits 3,162 Inactive employees entitled to but not yet receiving benefits 217 Active employees 3,524 Total 6,903
97
Contributions
Arkansas Code Title 24 establishes the contribution requirements of active members and participating employers. Contribution rates for the various plans are as follows: APERS Contribution provisions applicable to the participating employers are established by the APERS’ Board of Trustees and should be based on an independent actuary’s determination of the rate required to fund the plan. The General Assembly and certain agencies employing individuals in public safety positions must also remit additional amounts. For the fiscal year ended June 30, 2014, the employer contribution rates, as a percentage of active member payroll, ranged from 4.00% to 26.88%. Contributions to APERS from the State were $174.8 million for the year ended June 30, 2015. During a member’s participation in the APERS deferred retirement option plan (DROP), the employer continues to make contributions and the employee ceases to make contributions. ATRS The funding policy of ATRS provides for periodic employer contributions at statutorily established rates based on annual actuarial valuations. For the fiscal year ended June 30, 2014, the employer contribution rate was 14% of covered employee payroll. Contributions to ATRS from the State were $17.1 million for the year ended June 30, 2015. ATRS has contributory and noncontributory plans. The contributory plan has been in effect since the establishment of ATRS. Contributory members of ATRS contribute 6% of their gross wages. The noncontributory plan began July 1, 1986. Effective July 1, 1999, all new members, including any former active members, were automatically enrolled as contributory members. Noncontributory members may make an irrevocable election to become contributory on July 1 of each fiscal year. During a member’s participation in the ATRS teacher deferred retirement option plan (T-DROP), the employer continues to make contributions on behalf of all members participating in T-DROP at rates established by the Board of Trustees. AJRS Employer contributions are 12% of active member payroll. In addition, the State makes an annual transfer to the plan based on the dollar amount of actuarially determined employer contribution determined in the most recent actuarial valuation less the employer statutory contribution amount, reduced by court cost revenue received. The State’s supplemental contribution for fiscal year 2015 was $2.6 million. Employee contribution rates are 6% of the annual salary for Tier One contributory members and 5% of the annual salary for Tier Two contributory members. A Tier One member no longer has to contribute when a judge is certified eligible for retirement. A Tier Two member no longer has to contribute when the member has sufficient service to receive the maximum benefit permitted by plan provisions.
98
ASPRS Employer contributions are 22% of active member payroll. In addition, the State makes an annual transfer to the plan based on the actuarially determined employer rate in the most recent annual actuarial valuation less the employer statutory contribution, reduced by driver’s license reinstatement fees received. The State’s supplemental contribution for fiscal year 2015 was $6.6 million. For any members still employed and covered by the Tier One contributory plan, the employee contribution rate is 9.25% of the member’s salary. During a member’s participation in the deferred retirement option plan (DROP), employer contributions continue. For Tier One members, employee contributions cease upon entrance into the DROP. ASHERS The funding policy for ASHERS provides for periodic employer contributions at statutorily established rates with a fundamental financial objective of having contribution rates that remain relatively level from generation to generation of Arkansas citizens. To test the adequacy of the statutory rates and assess the extent to which the fundamental financial objective is being achieved, ASHERS has actuarial valuations prepared annually. The statutory employer contribution rate is 12.9% of the pay of each covered employee not in the deferred retirement option program (DROP). Employer contributions are not made on the pay of employees in Tier I DROP. Employer contributions are 6.90% on the pay of employees in Tier II DROP. Covered employees not in Tier I DROP are required to contribute 6% of their compensation.
Net Pension Liability At June 30, 2015, the State reported the following liabilities and assets for the various plans (expressed in thousands):
The net pension liability was measured as of the date stated and the total pension liability used to calculate the net pension liability was determined by an actuarial valuation as of that date. For APERS and ATRS, the State’s proportion of the net pension liability was based on actual contributions in the 2014 fiscal year of all participating employers. At June 30, 2014, the State’s proportion was 67.64% for APERS and 4.29% for ATRS.
Measurement Date
Net Pension Liability (Asset)
APERS June 30, 2014 959,763$ ATRS June 30, 2014 112,517AJRS June 30, 2015 31,590ASPRS June 30, 2015 123,545Total 1,227,415$
ASHERS June 30, 2014 (7,296)$
99
Actuarial Assumptions The total pension liability in the actuarial valuation (as of the date noted below) was determined using the following actuarial assumptions, applied to all periods included in the measurement:
(1) Includes assumed inflation
APERS ATRS AJRS ASPRS ASHERS
Actuarial valuation date June 30, 2014 June 30, 2014 June 30, 2015 June 30, 2015 June 30, 2014
Inflation rate3.75% wages, 2.75% prices 3.25% 2.50% 2.50% 3.50%
Salary increases (1) 3.75% to 10.35% 3.25% to 9.10% 3.25% 3.25% to 10.25% 4.5% to 11.5%
Investment rate of return (1)
7.75% 8.00% 6.25% 7.50% 8.00%
Mortality rates RP-2000 Combined
Healthy Mortality Tables, projected
to 2020 using Projection Scale BB, set forward
two years for males and one
year for females
RP-2000 Mortality Table for Males and
Females projected 25
years with Scale AA (95% for
men and 87% for women)
RP-2000 Mortality Tables projected to 2020 using projection
scale BB
RP-2000 Combined
Healthy Mortality Table, projected
to 2020 using Projection Scale BB, set forward
two years for males and one
year for females, with an
approximate 14% margin for future
mortality improvement
1994 Uninsured Pensioner
Mortality Table
Actuarial experiencestudy dates
2007-2012 2005-2010 July 1, 2006 - June 30, 2011
July 1, 2006 - June 30, 2012
July 1, 2004 - June 30, 2008, updated for the 2013 valuation
100
The investment rate of return was developed for each plan as follows:
APERS The long-term expected rate of return on pension plan investments was determined using a building-block method in which best-estimate ranges of expected future real rates of return (expected returns, net of pension plan investment expense and inflation) are developed for each major asset class. These ranges are combined to produce the long-term expected rate of return by weighting the expected future real rates of return by the target asset allocation percentage and by adding expected inflation. Best estimates of arithmetic real rates of return for the 10-year period from 2014 to 2023 were provided by the plan’s investment consultants. For each major asset class that is included in the pension plan’s target asset allocation as of June 30, 2014, these best estimates are summarized in the following table:
ATRS The long-term expected rate of return on pension plan investments was determined using a building-block method in which best-estimate ranges of expected future real rates of return (expected returns, net of pension plan investment expense and inflation) are developed for each major asset class. These ranges are combined to produce the long-term expected rate of return by weighting the expected future real rates of return by the target asset allocation percentage and by adding expected inflation. Best estimates of geometric real rates of return were adopted by the plan’s trustees after considering input from the plan’s investment consultant and actuary. For each major asset class that is included in the pension plan’s target asset allocation as of June 30, 2014, these best estimates are summarized in the following table:
Asset ClassTarget
Allocation
Long-Term Expected Real Rate
of ReturnFixed income domestic 9.00% 0.50%Fixed income defensive 9.00% 0.80%Large cap domestic equity 20.00% 6.65%Small/mid-cap domestic equity 17.00% 7.90%International equity 12.00% 7.00%Emerging market equity 12.00% 9.20%Private equity 2.50% 11.30%Hedge funds 2.50% 3.19%Real estate 16.00% 5.10%Total 100.00%
Asset ClassTarget
AllocationLong-Term Expected Real Rate of Return
Domestic equity 20.00% 4.70%Global equity 30.00% 5.00%Fixed income 20.00% 2.00%Alternatives 5.00% 5.00%Real assets 15.00% 4.60%Private equity 10.00% 6.60%Cash equivalents 0.00% 1.20%Total 100.00%
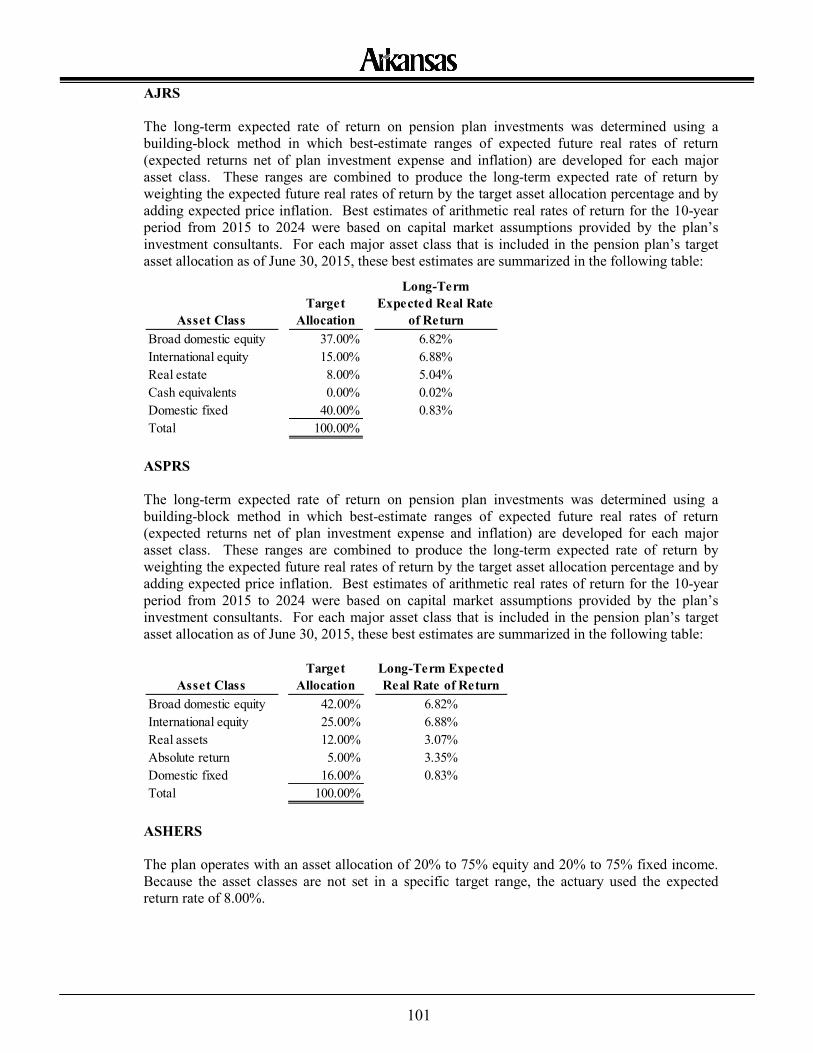
101
AJRS The long-term expected rate of return on pension plan investments was determined using a building-block method in which best-estimate ranges of expected future real rates of return (expected returns net of plan investment expense and inflation) are developed for each major asset class. These ranges are combined to produce the long-term expected rate of return by weighting the expected future real rates of return by the target asset allocation percentage and by adding expected price inflation. Best estimates of arithmetic real rates of return for the 10-year period from 2015 to 2024 were based on capital market assumptions provided by the plan’s investment consultants. For each major asset class that is included in the pension plan’s target asset allocation as of June 30, 2015, these best estimates are summarized in the following table:
ASPRS The long-term expected rate of return on pension plan investments was determined using a building-block method in which best-estimate ranges of expected future real rates of return (expected returns net of plan investment expense and inflation) are developed for each major asset class. These ranges are combined to produce the long-term expected rate of return by weighting the expected future real rates of return by the target asset allocation percentage and by adding expected price inflation. Best estimates of arithmetic real rates of return for the 10-year period from 2015 to 2024 were based on capital market assumptions provided by the plan’s investment consultants. For each major asset class that is included in the pension plan’s target asset allocation as of June 30, 2015, these best estimates are summarized in the following table:
ASHERS The plan operates with an asset allocation of 20% to 75% equity and 20% to 75% fixed income. Because the asset classes are not set in a specific target range, the actuary used the expected return rate of 8.00%.
Asset ClassTarget
Allocation
Long-Term Expected Real Rate
of ReturnBroad domestic equity 37.00% 6.82%International equity 15.00% 6.88%Real estate 8.00% 5.04%Cash equivalents 0.00% 0.02%Domestic fixed 40.00% 0.83%Total 100.00%
Asset ClassTarget
AllocationLong-Term Expected Real Rate of Return
Broad domestic equity 42.00% 6.82%International equity 25.00% 6.88%Real assets 12.00% 3.07%Absolute return 5.00% 3.35%Domestic fixed 16.00% 0.83%Total 100.00%
102
Discount Rate The discount rate for each plan was determined as follows: APERS A single discount rate of 7.75% was used to measure the total pension liabilities. This single discount rate was based on the expected rate of return on pension plan investments of 7.75%. The projection of cash flows used to determine this single discount rate assumed that plan member contributions will be made at the current contribution rate and that employer contributions will be made at rates equal to the difference between actuarially determined contribution rates and the member rate. Based on these assumptions, the APERS pension plan’s fiduciary net position was projected to be available to make all projected future benefit payments of current plan members. Therefore, the long-term expected rate of return on pension plan investments was applied to all periods of projected benefit payments to determine the total pension liability. ATRS A single discount rate of 8.00% was used to measure the total pension liability. This single discount rate was based on the expected rate of return on pension plan investments of 8.00%. The projection of cash flows used to determine this single discount rate assumed that plan member contributions will be made at the current contribution rate and that employer contributions will be 14% of payroll. Based on these assumptions, the pension plan’s fiduciary net position was projected to be available to make all projected future benefit payments of current plan members. Therefore, the long-term expected rate of return on pension plan investments was applied to all periods of projected benefit payments to determine the total pension liability. AJRS A single discount rate of 6.25% was used to measure the total pension liability. This single discount rate was based on the expected rate of return on pension plan investments of 6.25%. The projection of cash flows used to determine this single discount rate assumed that plan member contributions will be made at the current contribution rate and that employer contributions will be made at rates equal to the difference between actuarially determined contribution rates and the member rate. Based on these assumptions, the pension plan’s fiduciary net position was projected to be available to make all projected future benefit payments of current plan members. Therefore, the long-term expected rate of return on pension plan investments was applied to all periods of projected benefit payments to determine the total pension liability. ASPRS A single discount rate of 7.50% was used to measure the total pension liability. This single discount rate was based on the expected rate of return on pension plan investments of 7.50%. The projection of cash flows used to determine this single discount rate assumed that plan member contributions will be made at the current contribution rate and that employer contributions will be made at rates equal to the difference between actuarially determined contribution rates and the member rate. Based on these assumptions, the pension plan’s fiduciary net position was projected to be available to make all projected future benefit payments of current plan members. Therefore, the long-term expected rate of return on pension plan investments was applied to all periods of projected benefit payments to determine the total pension liability.
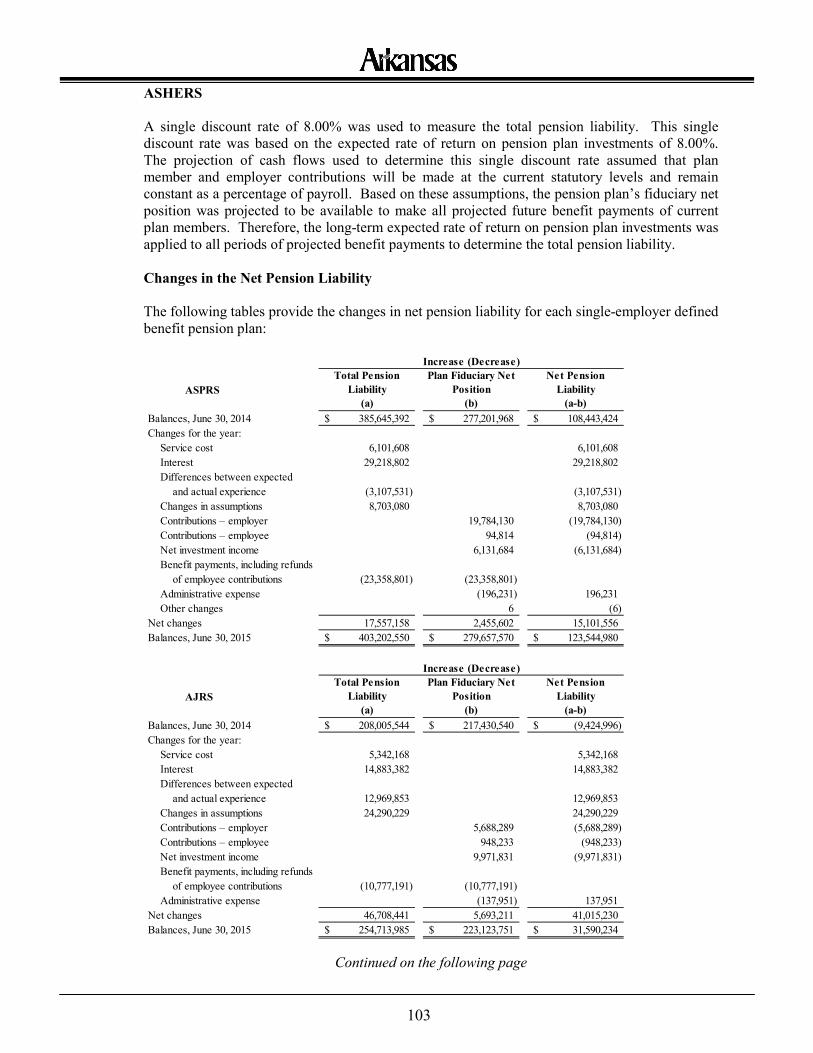
103
ASHERS A single discount rate of 8.00% was used to measure the total pension liability. This single discount rate was based on the expected rate of return on pension plan investments of 8.00%. The projection of cash flows used to determine this single discount rate assumed that plan member and employer contributions will be made at the current statutory levels and remain constant as a percentage of payroll. Based on these assumptions, the pension plan’s fiduciary net position was projected to be available to make all projected future benefit payments of current plan members. Therefore, the long-term expected rate of return on pension plan investments was applied to all periods of projected benefit payments to determine the total pension liability. Changes in the Net Pension Liability The following tables provide the changes in net pension liability for each single-employer defined benefit pension plan:
Continued on the following page
Increase (Decrease)
ASPRSTotal Pension
Liability (a)
Plan Fiduciary Net Position
(b)
Net Pension Liability
(a-b)Balances, June 30, 2014 385,645,392$ 277,201,968$ 108,443,424$ Changes for the year:
Service cost 6,101,608 6,101,608Interest 29,218,802 29,218,802Differences between expected
and actual experience (3,107,531) (3,107,531)Changes in assumptions 8,703,080 8,703,080Contributions – employer 19,784,130 (19,784,130)Contributions – employee 94,814 (94,814)Net investment income 6,131,684 (6,131,684)Benefit payments, including refunds
of employee contributions (23,358,801) (23,358,801)Administrative expense (196,231) 196,231Other changes 6 (6)
Net changes 17,557,158 2,455,602 15,101,556 Balances, June 30, 2015 403,202,550$ 279,657,570$ 123,544,980$
Increase (Decrease)
AJRSTotal Pension
Liability (a)
Plan Fiduciary Net Position
(b)
Net Pension Liability
(a-b)Balances, June 30, 2014 208,005,544$ 217,430,540$ (9,424,996)$ Changes for the year:
Service cost 5,342,168 5,342,168Interest 14,883,382 14,883,382Differences between expected
and actual experience 12,969,853 12,969,853Changes in assumptions 24,290,229 24,290,229Contributions – employer 5,688,289 (5,688,289)Contributions – employee 948,233 (948,233)Net investment income 9,971,831 (9,971,831)Benefit payments, including refunds
of employee contributions (10,777,191) (10,777,191)Administrative expense (137,951) 137,951
Net changes 46,708,441 5,693,211 41,015,230 Balances, June 30, 2015 254,713,985$ 223,123,751$ 31,590,234$
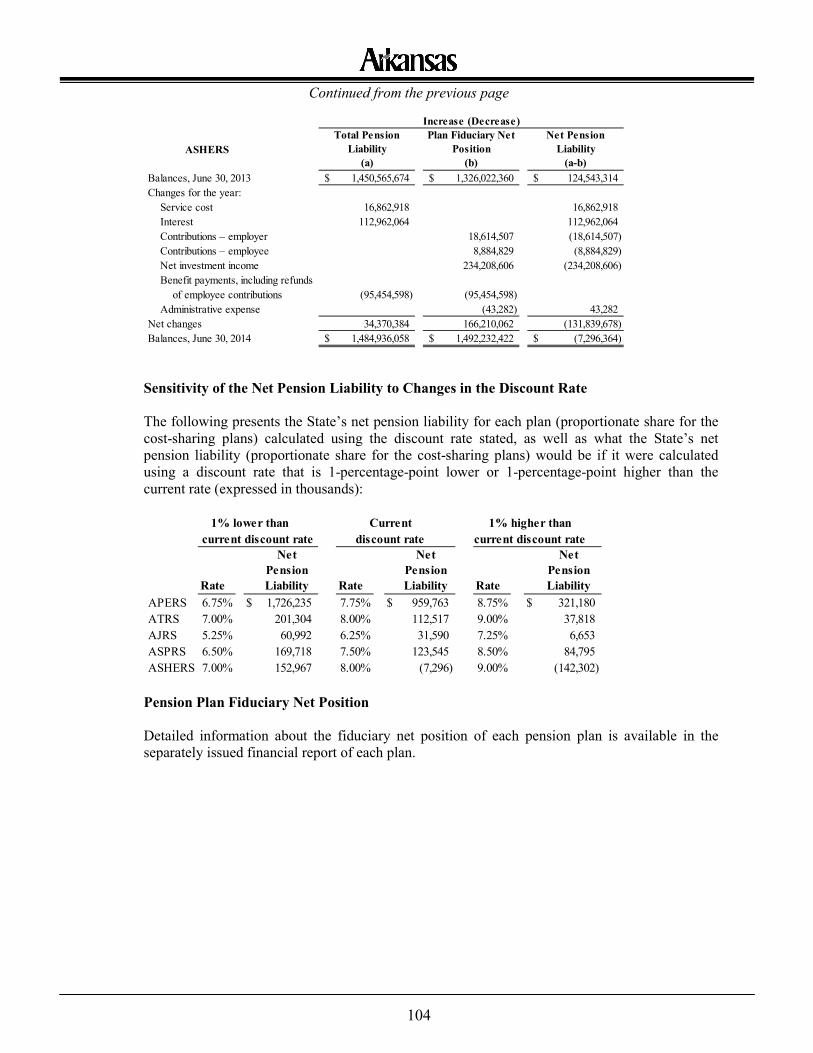
104
Continued from the previous page
Sensitivity of the Net Pension Liability to Changes in the Discount Rate The following presents the State’s net pension liability for each plan (proportionate share for the cost-sharing plans) calculated using the discount rate stated, as well as what the State’s net pension liability (proportionate share for the cost-sharing plans) would be if it were calculated using a discount rate that is 1-percentage-point lower or 1-percentage-point higher than the current rate (expressed in thousands):
Pension Plan Fiduciary Net Position Detailed information about the fiduciary net position of each pension plan is available in the separately issued financial report of each plan.
Increase (Decrease)
ASHERSTotal Pension
Liability (a)
Plan Fiduciary Net Position
(b)
Net Pension Liability
(a-b)Balances, June 30, 2013 1,450,565,674$ 1,326,022,360$ 124,543,314$ Changes for the year:
Service cost 16,862,918 16,862,918Interest 112,962,064 112,962,064Contributions – employer 18,614,507 (18,614,507)Contributions – employee 8,884,829 (8,884,829)Net investment income 234,208,606 (234,208,606)Benefit payments, including refunds
of employee contributions (95,454,598) (95,454,598)Administrative expense (43,282) 43,282
Net changes 34,370,384 166,210,062 (131,839,678) Balances, June 30, 2014 1,484,936,058$ 1,492,232,422$ (7,296,364)$
1% lower than Current 1% higher than current discount rate discount rate current discount rate
Rate
Net Pension Liability Rate
Net Pension Liability Rate
Net Pension Liability
APERS 6.75% $ 1,726,235 7.75% $ 959,763 8.75% $ 321,180ATRS 7.00% 201,304 8.00% 112,517 9.00% 37,818AJRS 5.25% 60,992 6.25% 31,590 7.25% 6,653ASPRS 6.50% 169,718 7.50% 123,545 8.50% 84,795ASHERS 7.00% 152,967 8.00% (7,296) 9.00% (142,302)
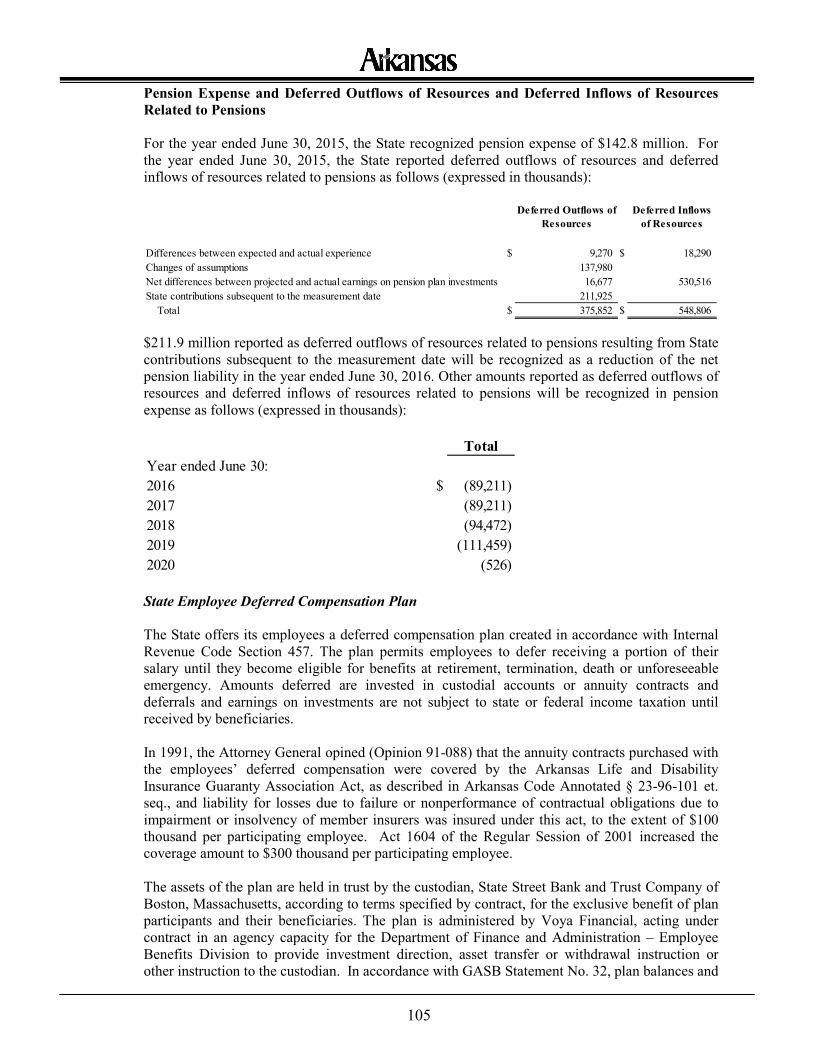
105
Pension Expense and Deferred Outflows of Resources and Deferred Inflows of Resources Related to Pensions For the year ended June 30, 2015, the State recognized pension expense of $142.8 million. For the year ended June 30, 2015, the State reported deferred outflows of resources and deferred inflows of resources related to pensions as follows (expressed in thousands):
$211.9 million reported as deferred outflows of resources related to pensions resulting from State contributions subsequent to the measurement date will be recognized as a reduction of the net pension liability in the year ended June 30, 2016. Other amounts reported as deferred outflows of resources and deferred inflows of resources related to pensions will be recognized in pension expense as follows (expressed in thousands):
State Employee Deferred Compensation Plan
The State offers its employees a deferred compensation plan created in accordance with Internal Revenue Code Section 457. The plan permits employees to defer receiving a portion of their salary until they become eligible for benefits at retirement, termination, death or unforeseeable emergency. Amounts deferred are invested in custodial accounts or annuity contracts and deferrals and earnings on investments are not subject to state or federal income taxation until received by beneficiaries. In 1991, the Attorney General opined (Opinion 91-088) that the annuity contracts purchased with the employees’ deferred compensation were covered by the Arkansas Life and Disability Insurance Guaranty Association Act, as described in Arkansas Code Annotated § 23-96-101 et. seq., and liability for losses due to failure or nonperformance of contractual obligations due to impairment or insolvency of member insurers was insured under this act, to the extent of $100 thousand per participating employee. Act 1604 of the Regular Session of 2001 increased the coverage amount to $300 thousand per participating employee. The assets of the plan are held in trust by the custodian, State Street Bank and Trust Company of Boston, Massachusetts, according to terms specified by contract, for the exclusive benefit of plan participants and their beneficiaries. The plan is administered by Voya Financial, acting under contract in an agency capacity for the Department of Finance and Administration – Employee Benefits Division to provide investment direction, asset transfer or withdrawal instruction or other instruction to the custodian. In accordance with GASB Statement No. 32, plan balances and
Deferred Outflows of Resources
Deferred Inflows of Resources
Differences between expected and actual experience $ 9,270 $ 18,290Changes of assumptions 137,980Net differences between projected and actual earnings on pension plan investments 16,677 530,516State contributions subsequent to the measurement date 211,925 Total $ 375,852 $ 548,806
TotalYear ended June 30:2016 $ (89,211) 2017 (89,211) 2018 (94,472) 2019 (111,459) 2020 (526)
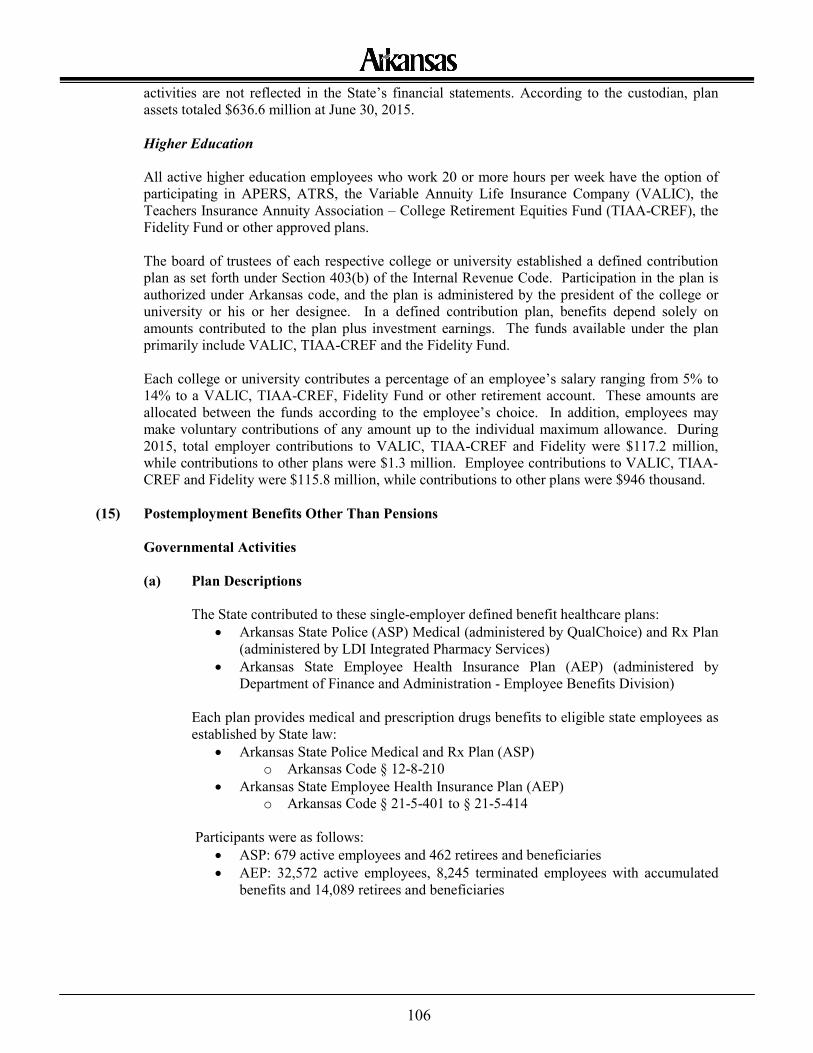
106
activities are not reflected in the State’s financial statements. According to the custodian, plan assets totaled $636.6 million at June 30, 2015. Higher Education
All active higher education employees who work 20 or more hours per week have the option of participating in APERS, ATRS, the Variable Annuity Life Insurance Company (VALIC), the Teachers Insurance Annuity Association – College Retirement Equities Fund (TIAA-CREF), the Fidelity Fund or other approved plans. The board of trustees of each respective college or university established a defined contribution plan as set forth under Section 403(b) of the Internal Revenue Code. Participation in the plan is authorized under Arkansas code, and the plan is administered by the president of the college or university or his or her designee. In a defined contribution plan, benefits depend solely on amounts contributed to the plan plus investment earnings. The funds available under the plan primarily include VALIC, TIAA-CREF and the Fidelity Fund. Each college or university contributes a percentage of an employee’s salary ranging from 5% to 14% to a VALIC, TIAA-CREF, Fidelity Fund or other retirement account. These amounts are allocated between the funds according to the employee’s choice. In addition, employees may make voluntary contributions of any amount up to the individual maximum allowance. During 2015, total employer contributions to VALIC, TIAA-CREF and Fidelity were $117.2 million, while contributions to other plans were $1.3 million. Employee contributions to VALIC, TIAA-CREF and Fidelity were $115.8 million, while contributions to other plans were $946 thousand.
(15) Postemployment Benefits Other Than Pensions Governmental Activities
(a) Plan Descriptions
The State contributed to these single-employer defined benefit healthcare plans: • Arkansas State Police (ASP) Medical (administered by QualChoice) and Rx Plan
(administered by LDI Integrated Pharmacy Services) • Arkansas State Employee Health Insurance Plan (AEP) (administered by
Department of Finance and Administration - Employee Benefits Division)
Each plan provides medical and prescription drugs benefits to eligible state employees as established by State law:
• Arkansas State Police Medical and Rx Plan (ASP) o Arkansas Code § 12-8-210
• Arkansas State Employee Health Insurance Plan (AEP) o Arkansas Code § 21-5-401 to § 21-5-414
Participants were as follows:
• ASP: 679 active employees and 462 retirees and beneficiaries • AEP: 32,572 active employees, 8,245 terminated employees with accumulated
benefits and 14,089 retirees and beneficiaries
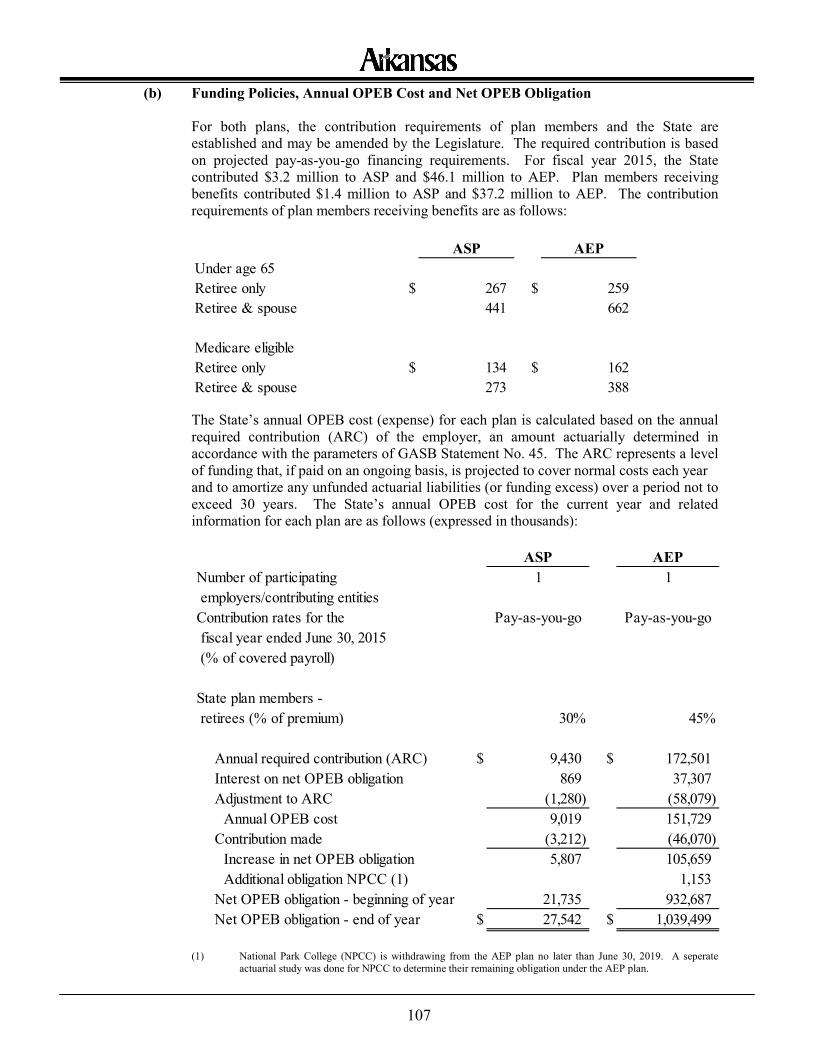
107
(b) Funding Policies, Annual OPEB Cost and Net OPEB Obligation
For both plans, the contribution requirements of plan members and the State are established and may be amended by the Legislature. The required contribution is based on projected pay-as-you-go financing requirements. For fiscal year 2015, the State contributed $3.2 million to ASP and $46.1 million to AEP. Plan members receiving benefits contributed $1.4 million to ASP and $37.2 million to AEP. The contribution requirements of plan members receiving benefits are as follows:
The State’s annual OPEB cost (expense) for each plan is calculated based on the annual required contribution (ARC) of the employer, an amount actuarially determined in accordance with the parameters of GASB Statement No. 45. The ARC represents a level of funding that, if paid on an ongoing basis, is projected to cover normal costs each year and to amortize any unfunded actuarial liabilities (or funding excess) over a period not to exceed 30 years. The State’s annual OPEB cost for the current year and related information for each plan are as follows (expressed in thousands):
(1) National Park College (NPCC) is withdrawing from the AEP plan no later than June 30, 2019. A seperate actuarial study was done for NPCC to determine their remaining obligation under the AEP plan.
ASP AEPUnder age 65Retiree only $ 267 $ 259Retiree & spouse 441 662
Medicare eligibleRetiree only $ 134 $ 162Retiree & spouse 273 388
ASP AEPNumber of participating employers/contributing entities
1 1
Contribution rates for the fiscal year ended June 30, 2015 (% of covered payroll)
Pay-as-you-go Pay-as-you-go
State plan members - retirees (% of premium) 30% 45%
Annual required contribution (ARC) $ 9,430 $ 172,501Interest on net OPEB obligation 869 37,307Adjustment to ARC (1,280) (58,079)
Annual OPEB cost 9,019 151,729Contribution made (3,212) (46,070)
Increase in net OPEB obligation 5,807 105,659Additional obligation NPCC (1) 1,153
Net OPEB obligation - beginning of year 21,735 932,687Net OPEB obligation - end of year $ 27,542 $ 1,039,499
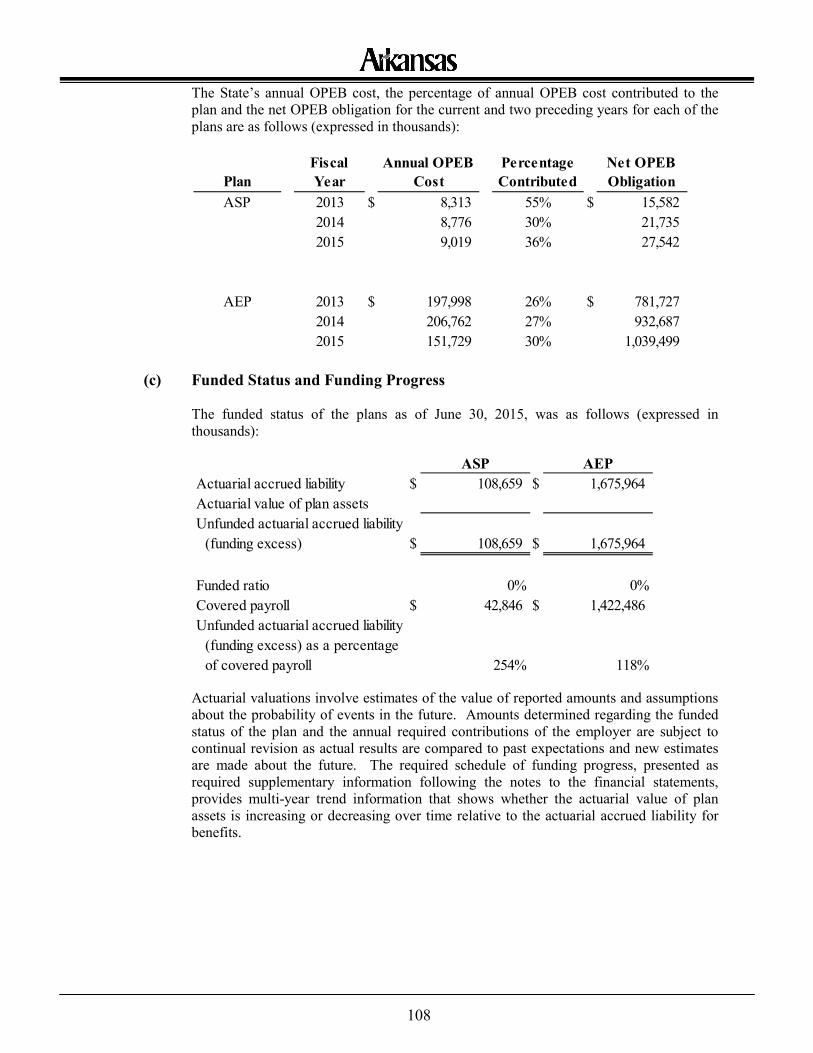
108
The State’s annual OPEB cost, the percentage of annual OPEB cost contributed to the plan and the net OPEB obligation for the current and two preceding years for each of the plans are as follows (expressed in thousands):
(c) Funded Status and Funding Progress The funded status of the plans as of June 30, 2015, was as follows (expressed in thousands):
Actuarial valuations involve estimates of the value of reported amounts and assumptions about the probability of events in the future. Amounts determined regarding the funded status of the plan and the annual required contributions of the employer are subject to continual revision as actual results are compared to past expectations and new estimates are made about the future. The required schedule of funding progress, presented as required supplementary information following the notes to the financial statements, provides multi-year trend information that shows whether the actuarial value of plan assets is increasing or decreasing over time relative to the actuarial accrued liability for benefits.
PlanFiscal Year
Annual OPEB Cost
Percentage Contributed
Net OPEB Obligation
ASP 2013 $ 8,313 55% $ 15,5822014 8,776 30% 21,7352015 9,019 36% 27,542
AEP 2013 $ 197,998 26% $ 781,7272014 206,762 27% 932,6872015 151,729 30% 1,039,499
ASP AEPActuarial accrued liability $ 108,659 $ 1,675,964Actuarial value of plan assetsUnfunded actuarial accrued liability
(funding excess) $ 108,659 $ 1,675,964
Funded ratio 0% 0%Covered payroll $ 42,846 $ 1,422,486Unfunded actuarial accrued liability
(funding excess) as a percentageof covered payroll 254% 118%
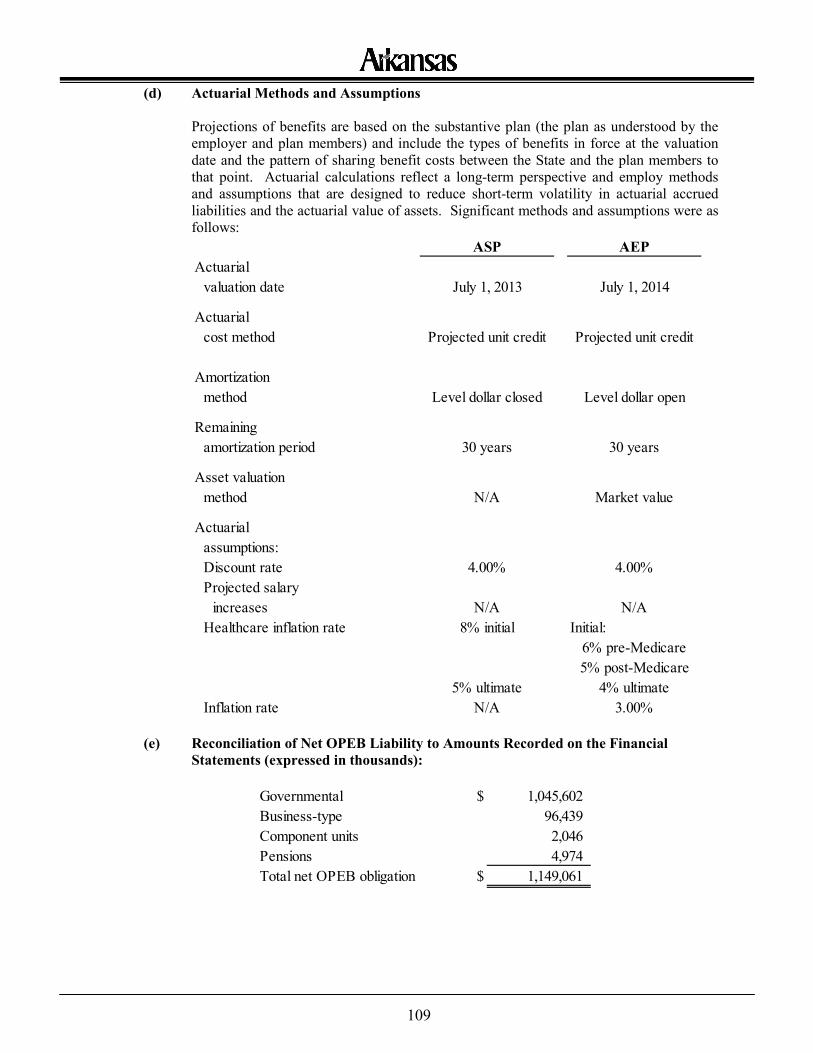
109
(d) Actuarial Methods and Assumptions Projections of benefits are based on the substantive plan (the plan as understood by the employer and plan members) and include the types of benefits in force at the valuation date and the pattern of sharing benefit costs between the State and the plan members to that point. Actuarial calculations reflect a long-term perspective and employ methods and assumptions that are designed to reduce short-term volatility in actuarial accrued liabilities and the actuarial value of assets. Significant methods and assumptions were as follows:
(e) Reconciliation of Net OPEB Liability to Amounts Recorded on the Financial Statements (expressed in thousands):
ASP AEPActuarial □valuation date July 1, 2013 July 1, 2014
Actuarial □cost method Projected unit credit Projected unit credit
Amortization □method Level dollar closed Level dollar open
Remaining □amortization period 30 years 30 years
Asset valuation □method N/A Market value
Actuarial □assumptions:
Discount rate 4.00% 4.00%Projected salary □increases N/A N/AHealthcare inflation rate 8% initial Initial:
6% pre-Medicare5% post-Medicare
5% ultimate 4% ultimateInflation rate N/A 3.00%
Governmental $ 1,045,602Business-type 96,439Component units 2,046Pensions 4,974Total net OPEB obligation $ 1,149,061
110
Business-Type Activities Higher Education
(a) Plan Descriptions
The State contributed to these single-employer defined benefit healthcare plans administered by the respective higher education institution except as noted:
• Arkansas State University Self Insured Retiree Medical Plan (ASU) • Arkansas Tech University Retiree Medical and Life Insurance Plan (ATU) • Henderson State University Post-Employment Benefit Plan (HSU) (administered
by Health Advantage and MetLife) • Northwest Arkansas Community College Healthcare Plan (NWACC)
(administered by Arkansas Blue Cross and Blue Shield) • Southern Arkansas University – Technical Campus Early Retirement Program
(SAUT) (administered by Health Advantage) • Southern Arkansas University Group Health Plan (SAU) (administered by Blue
Advantage) • University of Arkansas at Fort Smith Benefit Plan (UAFS) • University of Arkansas System Self-Funded Plan (UAS1) (administered by
UMR) • University of Central Arkansas Retiree Benefits Plan (UCA)
Participants in these plans included 24,659 active employees, 4 terminated employees with accumulated benefits and 2,409 retirees. The State contributed to the following defined post-employment benefit plans which are affiliated with and administered by the Arkansas Higher Education Consortium (AHEC), an agent multi-employer defined benefit healthcare plan:
• Arkansas Northeastern College Retirement Option (ANC) • Black River Technical College Health Insurance Plan (BRTC) • East Arkansas Community College Post-Employment Benefit Plan (EACC) • Mid-South Community College Plan (MSCC) • North Arkansas College Continued Health/Dental Insurance (NAC) • National Park Community College Other Post-Employment Benefits Policy
(NPCC) • Ozarka College Early Retirement Incentive Program (OC) • Pulaski Technical College Post-Employment Healthcare (PTC) • Rich Mountain Community College Retirement Program (RMCC) • South Arkansas Community College Post-Employment Benefits (SACC) • University of Arkansas Community College at Hope (UACCH)
Participants in these plans included 1,749 active employees, 5 terminated employees with accumulated benefits and 128 retirees. Each institute of higher education has the authority to affiliate with AHEC and establish by policy the defined benefits and amount contributed by the employer to AHEC. Benefits provided to retirees by the plans and eligibility requirements are established by policy by the Board of Trustees of each higher education institution. All plans include
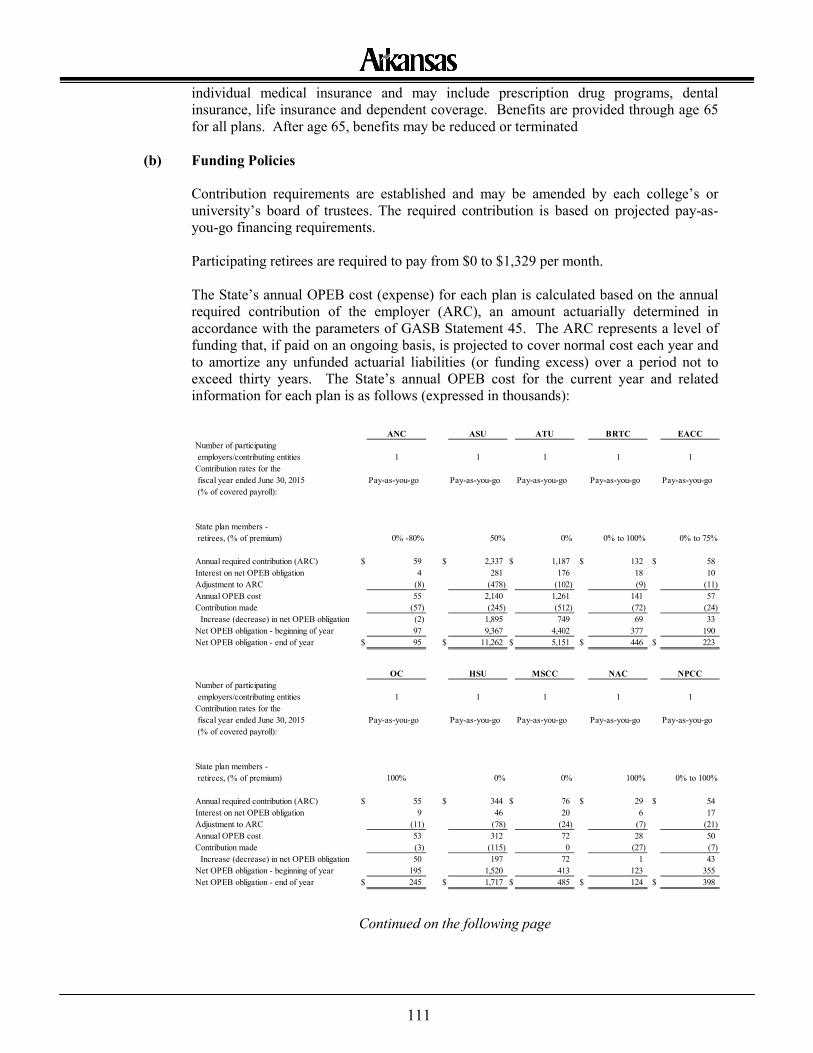
111
individual medical insurance and may include prescription drug programs, dental insurance, life insurance and dependent coverage. Benefits are provided through age 65 for all plans. After age 65, benefits may be reduced or terminated
(b) Funding Policies
Contribution requirements are established and may be amended by each college’s or university’s board of trustees. The required contribution is based on projected pay-as-you-go financing requirements. Participating retirees are required to pay from $0 to $1,329 per month. The State’s annual OPEB cost (expense) for each plan is calculated based on the annual required contribution of the employer (ARC), an amount actuarially determined in accordance with the parameters of GASB Statement 45. The ARC represents a level of funding that, if paid on an ongoing basis, is projected to cover normal cost each year and to amortize any unfunded actuarial liabilities (or funding excess) over a period not to exceed thirty years. The State’s annual OPEB cost for the current year and related information for each plan is as follows (expressed in thousands):
Continued on the following page
ANC ASU ATU BRTC EACCNumber of participating employers/contributing entities 1 1 1 1 1Contribution rates for the fiscal year ended June 30, 2015 (% of covered payroll):
Pay-as-you-go Pay-as-you-go Pay-as-you-go Pay-as-you-go Pay-as-you-go
State plan members - retirees, (% of premium) 0% -80% 50% 0% 0% to 100% 0% to 75%
Annual required contribution (ARC) $ 59 $ 2,337 $ 1,187 $ 132 $ 58Interest on net OPEB obligation 4 281 176 18 10Adjustment to ARC (8) (478) (102) (9) (11)Annual OPEB cost 55 2,140 1,261 141 57Contribution made (57) (245) (512) (72) (24)
Increase (decrease) in net OPEB obligation (2) 1,895 749 69 33Net OPEB obligation - beginning of year 97 9,367 4,402 377 190Net OPEB obligation - end of year $ 95 $ 11,262 $ 5,151 $ 446 $ 223
OC HSU MSCC NAC NPCCNumber of participating employers/contributing entities 1 1 1 1 1Contribution rates for the fiscal year ended June 30, 2015 (% of covered payroll):
Pay-as-you-go Pay-as-you-go Pay-as-you-go Pay-as-you-go Pay-as-you-go
State plan members - retirees, (% of premium) 100% 0% 0% 100% 0% to 100%
Annual required contribution (ARC) $ 55 $ 344 $ 76 $ 29 $ 54Interest on net OPEB obligation 9 46 20 6 17Adjustment to ARC (11) (78) (24) (7) (21)Annual OPEB cost 53 312 72 28 50Contribution made (3) (115) 0 (27) (7)
Increase (decrease) in net OPEB obligation 50 197 72 1 43Net OPEB obligation - beginning of year 195 1,520 413 123 355Net OPEB obligation - end of year $ 245 $ 1,717 $ 485 $ 124 $ 398
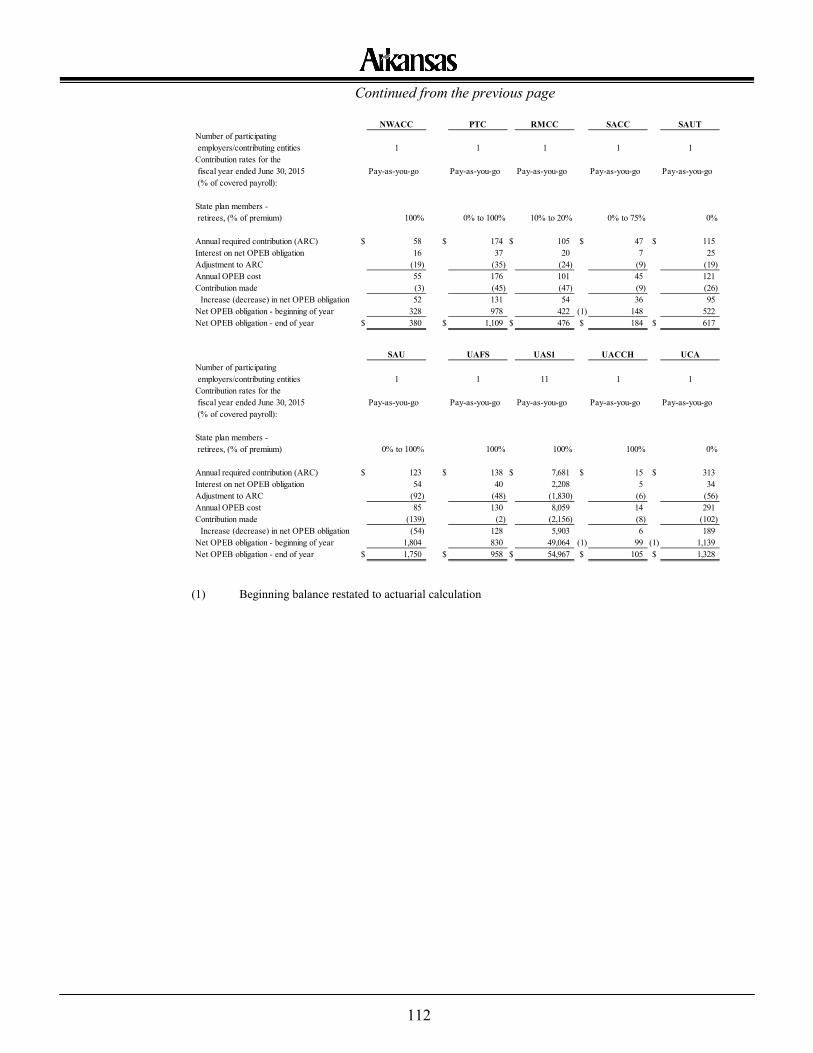
112
Continued from the previous page
(1) Beginning balance restated to actuarial calculation
NWACC PTC RMCC SACC SAUTNumber of participating employers/contributing entities 1 1 1 1 1Contribution rates for the fiscal year ended June 30, 2015 (% of covered payroll):
Pay-as-you-go Pay-as-you-go Pay-as-you-go Pay-as-you-go Pay-as-you-go
State plan members - retirees, (% of premium) 100% 0% to 100% 10% to 20% 0% to 75% 0%
Annual required contribution (ARC) $ 58 $ 174 $ 105 $ 47 $ 115Interest on net OPEB obligation 16 37 20 7 25Adjustment to ARC (19) (35) (24) (9) (19)Annual OPEB cost 55 176 101 45 121Contribution made (3) (45) (47) (9) (26)
Increase (decrease) in net OPEB obligation 52 131 54 36 95Net OPEB obligation - beginning of year 328 978 422 (1) 148 522Net OPEB obligation - end of year $ 380 $ 1,109 $ 476 $ 184 $ 617
SAU UAFS UAS1 UACCH UCANumber of participating employers/contributing entities 1 1 11 1 1Contribution rates for the fiscal year ended June 30, 2015 (% of covered payroll):
Pay-as-you-go Pay-as-you-go Pay-as-you-go Pay-as-you-go Pay-as-you-go
State plan members - retirees, (% of premium) 0% to 100% 100% 100% 100% 0%
Annual required contribution (ARC) $ 123 $ 138 $ 7,681 $ 15 $ 313Interest on net OPEB obligation 54 40 2,208 5 34Adjustment to ARC (92) (48) (1,830) (6) (56)Annual OPEB cost 85 130 8,059 14 291Contribution made (139) (2) (2,156) (8) (102)
Increase (decrease) in net OPEB obligation (54) 128 5,903 6 189Net OPEB obligation - beginning of year 1,804 830 49,064 (1) 99 (1) 1,139Net OPEB obligation - end of year $ 1,750 $ 958 $ 54,967 $ 105 $ 1,328
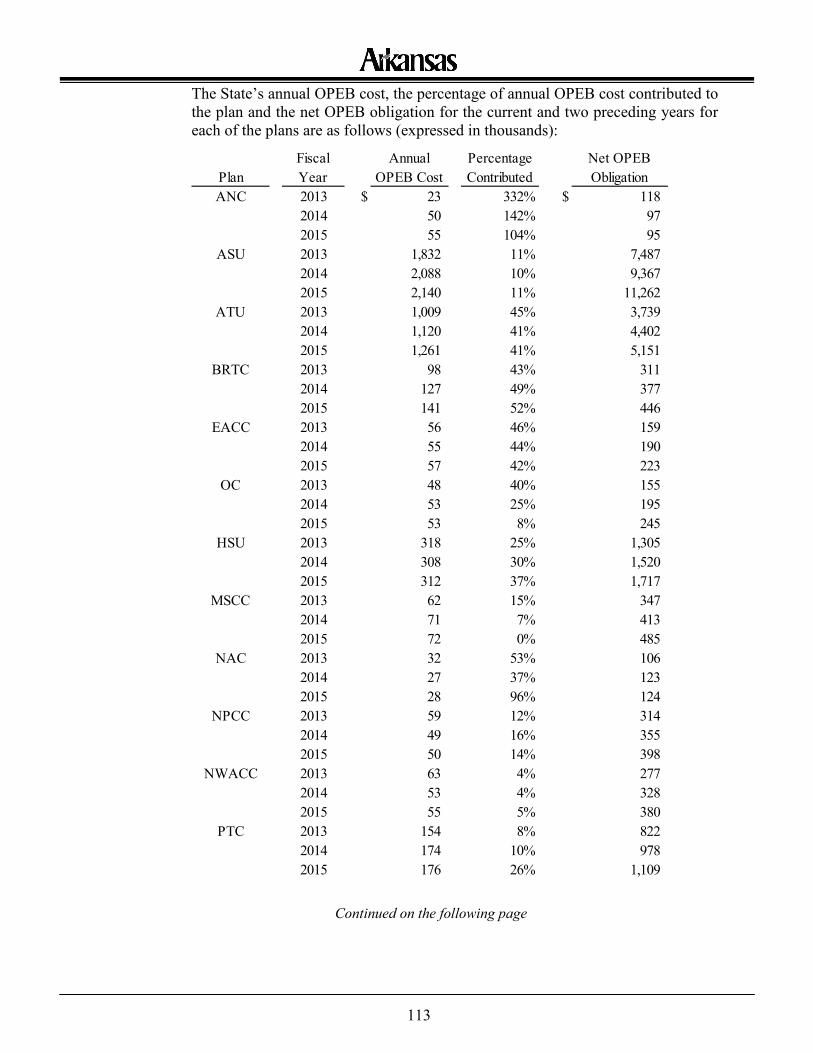
113
The State’s annual OPEB cost, the percentage of annual OPEB cost contributed to the plan and the net OPEB obligation for the current and two preceding years for each of the plans are as follows (expressed in thousands):
Continued on the following page
PlanFiscal Year
Annual OPEB Cost
Percentage Contributed
Net OPEB Obligation
ANC 2013 $ 23 332% $ 1182014 50 142% 972015 55 104% 95
ASU 2013 1,832 11% 7,4872014 2,088 10% 9,3672015 2,140 11% 11,262
ATU 2013 1,009 45% 3,7392014 1,120 41% 4,4022015 1,261 41% 5,151
BRTC 2013 98 43% 3112014 127 49% 3772015 141 52% 446
EACC 2013 56 46% 1592014 55 44% 1902015 57 42% 223
OC 2013 48 40% 1552014 53 25% 1952015 53 8% 245
HSU 2013 318 25% 1,3052014 308 30% 1,5202015 312 37% 1,717
MSCC 2013 62 15% 3472014 71 7% 4132015 72 0% 485
NAC 2013 32 53% 1062014 27 37% 1232015 28 96% 124
NPCC 2013 59 12% 3142014 49 16% 3552015 50 14% 398
NWACC 2013 63 4% 2772014 53 4% 3282015 55 5% 380
PTC 2013 154 8% 8222014 174 10% 9782015 176 26% 1,109
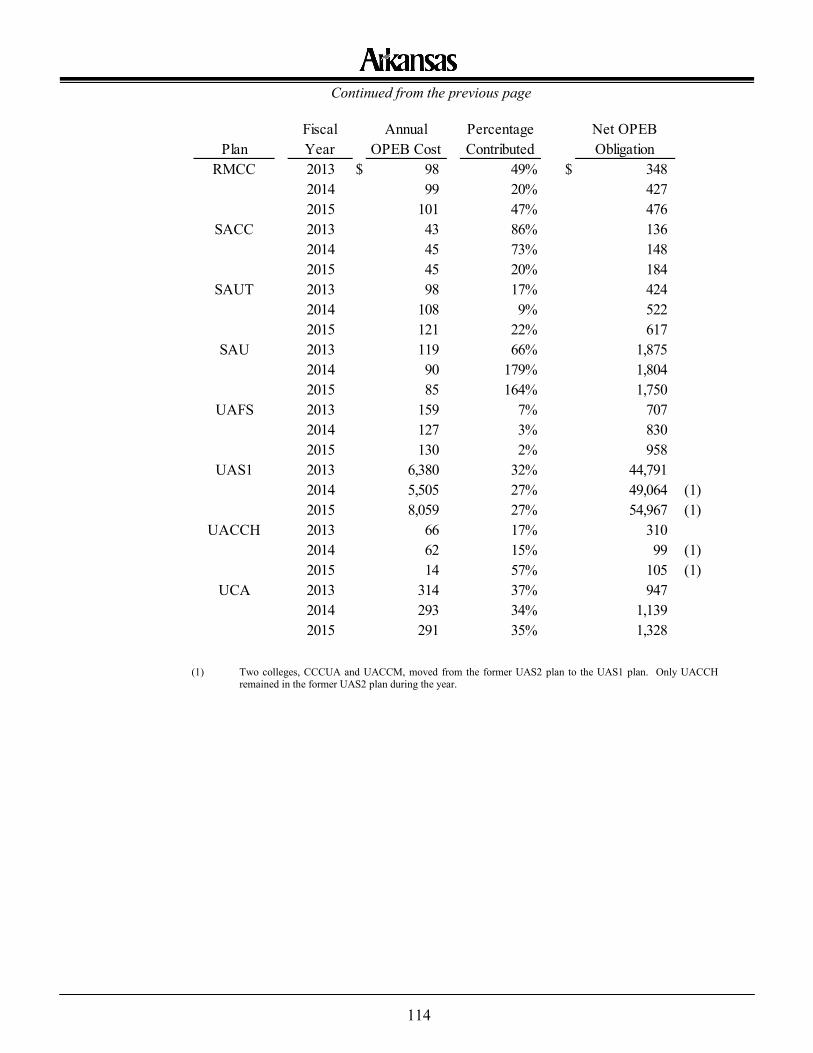
114
Continued from the previous page
(1) Two colleges, CCCUA and UACCM, moved from the former UAS2 plan to the UAS1 plan. Only UACCH remained in the former UAS2 plan during the year.
PlanFiscal Year
Annual OPEB Cost
Percentage Contributed
Net OPEB Obligation
RMCC 2013 $ 98 49% $ 3482014 99 20% 4272015 101 47% 476
SACC 2013 43 86% 1362014 45 73% 1482015 45 20% 184
SAUT 2013 98 17% 4242014 108 9% 5222015 121 22% 617
SAU 2013 119 66% 1,8752014 90 179% 1,8042015 85 164% 1,750
UAFS 2013 159 7% 7072014 127 3% 8302015 130 2% 958
UAS1 2013 6,380 32% 44,7912014 5,505 27% 49,064 (1) 2015 8,059 27% 54,967 (1)
UACCH 2013 66 17% 3102014 62 15% 99 (1) 2015 14 57% 105 (1)
UCA 2013 314 37% 9472014 293 34% 1,1392015 291 35% 1,328
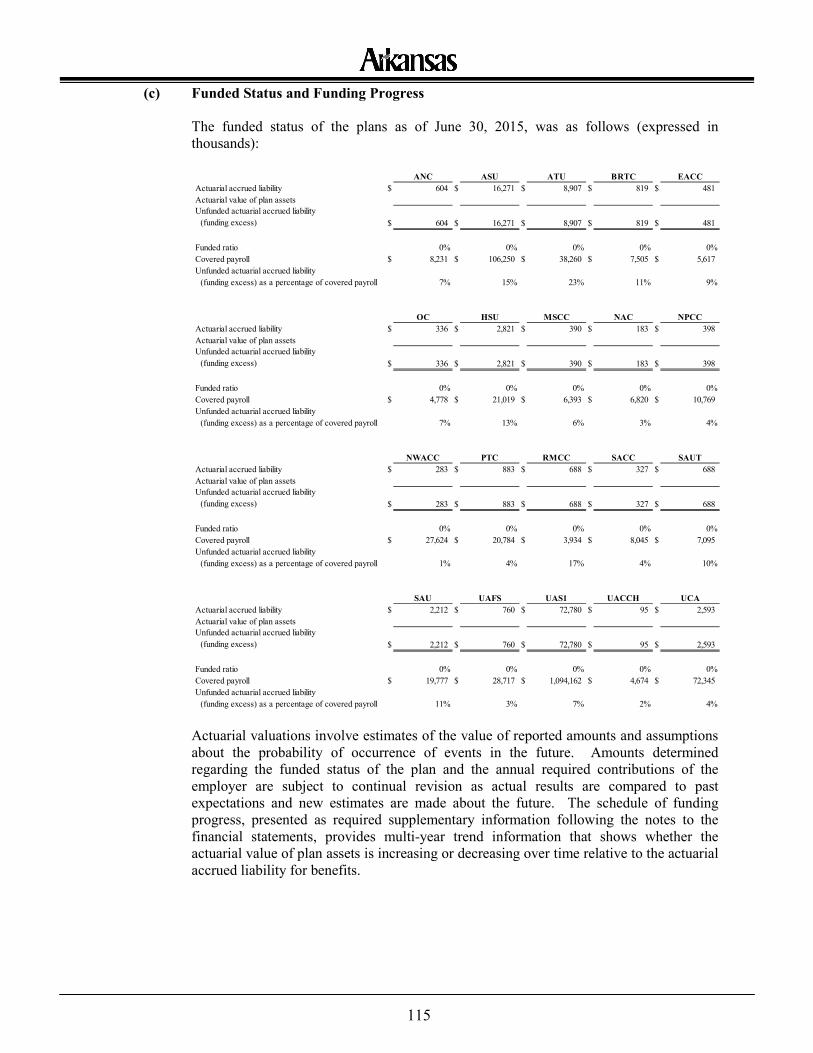
115
(c) Funded Status and Funding Progress
The funded status of the plans as of June 30, 2015, was as follows (expressed in thousands):
Actuarial valuations involve estimates of the value of reported amounts and assumptions about the probability of occurrence of events in the future. Amounts determined regarding the funded status of the plan and the annual required contributions of the employer are subject to continual revision as actual results are compared to past expectations and new estimates are made about the future. The schedule of funding progress, presented as required supplementary information following the notes to the financial statements, provides multi-year trend information that shows whether the actuarial value of plan assets is increasing or decreasing over time relative to the actuarial accrued liability for benefits.
ANC ASU ATU BRTC EACCActuarial accrued liability $ 604 $ 16,271 $ 8,907 $ 819 $ 481Actuarial value of plan assetsUnfunded actuarial accrued liability □(funding excess) $ 604 $ 16,271 $ 8,907 $ 819 $ 481
Funded ratio 0% 0% 0% 0% 0%Covered payroll $ 8,231 $ 106,250 $ 38,260 $ 7,505 $ 5,617Unfunded actuarial accrued liability □(funding excess) as a percentage of covered payroll 7% 15% 23% 11% 9%
OC HSU MSCC NAC NPCCActuarial accrued liability $ 336 $ 2,821 $ 390 $ 183 $ 398Actuarial value of plan assetsUnfunded actuarial accrued liability □(funding excess) $ 336 $ 2,821 $ 390 $ 183 $ 398
Funded ratio 0% 0% 0% 0% 0%Covered payroll $ 4,778 $ 21,019 $ 6,393 $ 6,820 $ 10,769Unfunded actuarial accrued liability □(funding excess) as a percentage of covered payroll 7% 13% 6% 3% 4%
NWACC PTC RMCC SACC SAUTActuarial accrued liability $ 283 $ 883 $ 688 $ 327 $ 688Actuarial value of plan assetsUnfunded actuarial accrued liability □(funding excess) $ 283 $ 883 $ 688 $ 327 $ 688
Funded ratio 0% 0% 0% 0% 0%Covered payroll $ 27,624 $ 20,784 $ 3,934 $ 8,045 $ 7,095Unfunded actuarial accrued liability □(funding excess) as a percentage of covered payroll 1% 4% 17% 4% 10%
SAU UAFS UAS1 UACCH UCAActuarial accrued liability $ 2,212 $ 760 $ 72,780 $ 95 $ 2,593Actuarial value of plan assetsUnfunded actuarial accrued liability □(funding excess) $ 2,212 $ 760 $ 72,780 $ 95 $ 2,593
Funded ratio 0% 0% 0% 0% 0%Covered payroll $ 19,777 $ 28,717 $ 1,094,162 $ 4,674 $ 72,345Unfunded actuarial accrued liability □(funding excess) as a percentage of covered payroll 11% 3% 7% 2% 4%
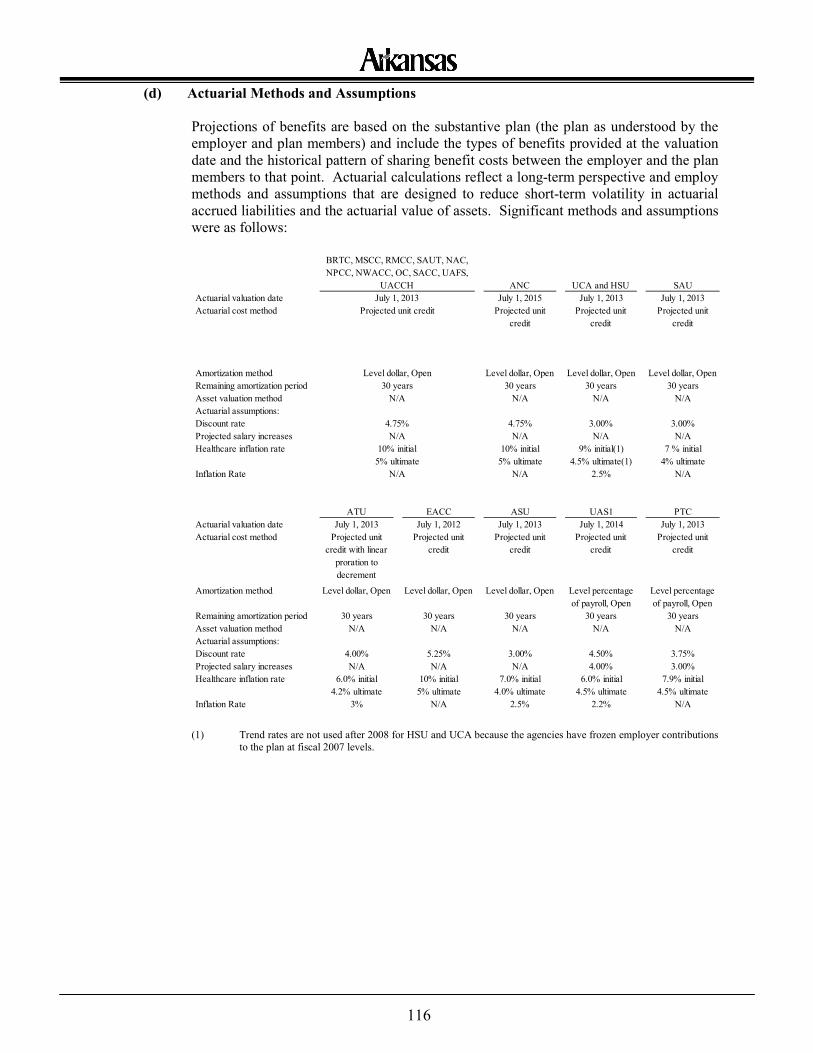
116
(d) Actuarial Methods and Assumptions Projections of benefits are based on the substantive plan (the plan as understood by the employer and plan members) and include the types of benefits provided at the valuation date and the historical pattern of sharing benefit costs between the employer and the plan members to that point. Actuarial calculations reflect a long-term perspective and employ methods and assumptions that are designed to reduce short-term volatility in actuarial accrued liabilities and the actuarial value of assets. Significant methods and assumptions were as follows:
(1) Trend rates are not used after 2008 for HSU and UCA because the agencies have frozen employer contributions
to the plan at fiscal 2007 levels.
ANC UCA and HSU SAUActuarial valuation date July 1, 2015 July 1, 2013 July 1, 2013Actuarial cost method Projected unit
creditProjected unit
creditProjected unit
credit
Amortization method Level dollar, Open Level dollar, Open Level dollar, OpenRemaining amortization period 30 years 30 years 30 yearsAsset valuation method N/A N/A N/AActuarial assumptions:Discount rate 4.75% 3.00% 3.00%Projected salary increases N/A N/A N/AHealthcare inflation rate 10% initial 9% initial(1) 7 % initial
5% ultimate 4.5% ultimate(1) 4% ultimateInflation Rate N/A 2.5% N/A
ATU EACC ASU UAS1 PTCActuarial valuation date July 1, 2013 July 1, 2012 July 1, 2013 July 1, 2014 July 1, 2013Actuarial cost method Projected unit
credit with linear proration to decrement
Projected unit credit
Projected unit credit
Projected unit credit
Projected unit credit
Amortization method Level dollar, Open Level dollar, Open Level dollar, Open Level percentage of payroll, Open
Level percentage of payroll, Open
Remaining amortization period 30 years 30 years 30 years 30 years 30 yearsAsset valuation method N/A N/A N/A N/A N/AActuarial assumptions:Discount rate 4.00% 5.25% 3.00% 4.50% 3.75%Projected salary increases N/A N/A N/A 4.00% 3.00%Healthcare inflation rate 6.0% initial 10% initial 7.0% initial 6.0% initial 7.9% initial
4.2% ultimate 5% ultimate 4.0% ultimate 4.5% ultimate 4.5% ultimateInflation Rate 3% N/A 2.5% 2.2% N/A
10% initial5% ultimate
N/A
BRTC, MSCC, RMCC, SAUT, NAC, NPCC, NWACC, OC, SACC, UAFS,
UACCHJuly 1, 2013
Projected unit credit
Level dollar, Open30 years
N/A
4.75%N/A
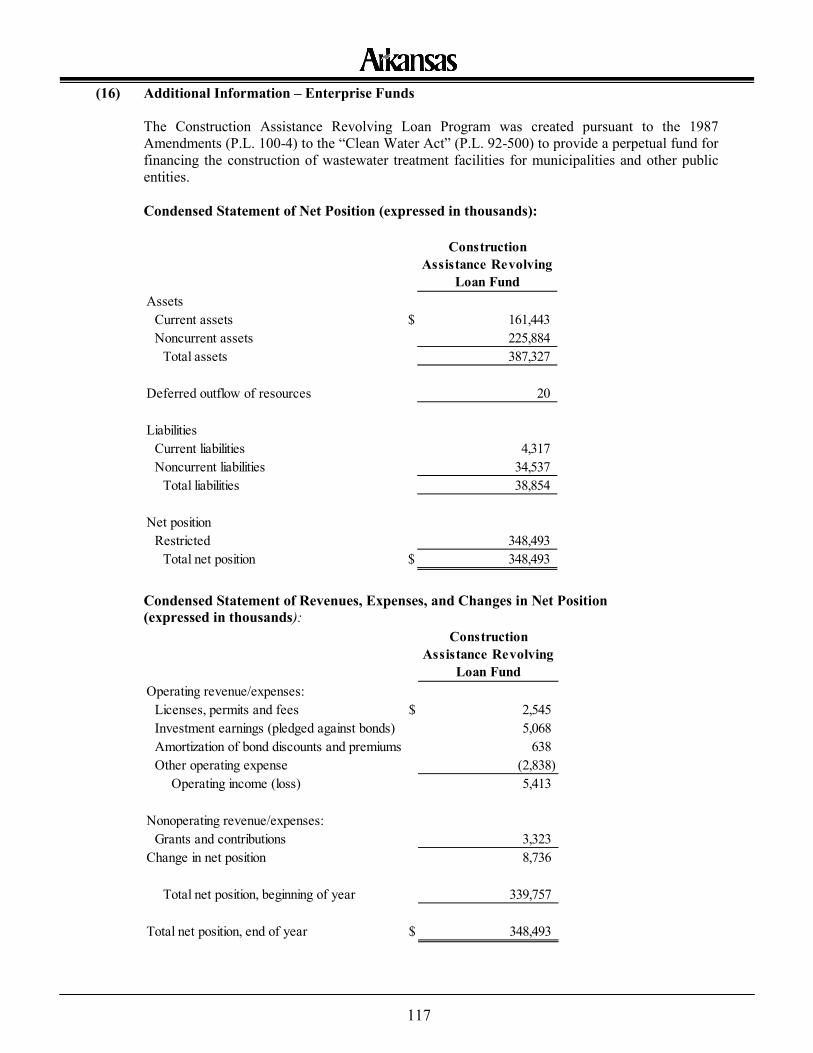
117
(16) Additional Information – Enterprise Funds The Construction Assistance Revolving Loan Program was created pursuant to the 1987 Amendments (P.L. 100-4) to the “Clean Water Act” (P.L. 92-500) to provide a perpetual fund for financing the construction of wastewater treatment facilities for municipalities and other public entities. Condensed Statement of Net Position (expressed in thousands):
Condensed Statement of Revenues, Expenses, and Changes in Net Position (expressed in thousands):
Construction Assistance Revolving
Loan FundAssets
Current assets $ 161,443Noncurrent assets 225,884
Total assets 387,327
Deferred outflow of resources 20
LiabilitiesCurrent liabilities 4,317Noncurrent liabilities 34,537
Total liabilities 38,854
Net positionRestricted 348,493
Total net position $ 348,493
Construction Assistance Revolving
Loan FundOperating revenue/expenses:
Licenses, permits and fees $ 2,545Investment earnings (pledged against bonds) 5,068Amortization of bond discounts and premiums 638Other operating expense (2,838)
Operating income (loss) 5,413
Nonoperating revenue/expenses:Grants and contributions 3,323
Change in net position 8,736
Total net position, beginning of year 339,757
Total net position, end of year $ 348,493
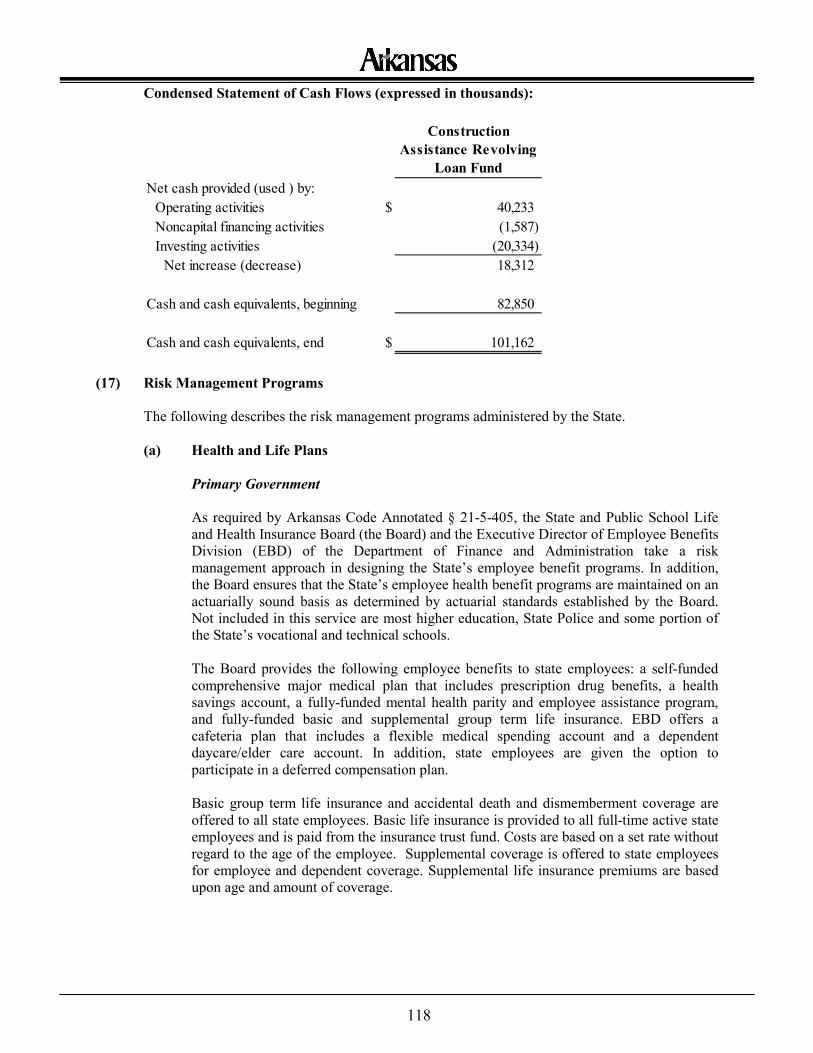
118
Condensed Statement of Cash Flows (expressed in thousands):
(17) Risk Management Programs
The following describes the risk management programs administered by the State.
(a) Health and Life Plans
Primary Government
As required by Arkansas Code Annotated § 21-5-405, the State and Public School Life and Health Insurance Board (the Board) and the Executive Director of Employee Benefits Division (EBD) of the Department of Finance and Administration take a risk management approach in designing the State’s employee benefit programs. In addition, the Board ensures that the State’s employee health benefit programs are maintained on an actuarially sound basis as determined by actuarial standards established by the Board. Not included in this service are most higher education, State Police and some portion of the State’s vocational and technical schools. The Board provides the following employee benefits to state employees: a self-funded comprehensive major medical plan that includes prescription drug benefits, a health savings account, a fully-funded mental health parity and employee assistance program, and fully-funded basic and supplemental group term life insurance. EBD offers a cafeteria plan that includes a flexible medical spending account and a dependent daycare/elder care account. In addition, state employees are given the option to participate in a deferred compensation plan. Basic group term life insurance and accidental death and dismemberment coverage are offered to all state employees. Basic life insurance is provided to all full-time active state employees and is paid from the insurance trust fund. Costs are based on a set rate without regard to the age of the employee. Supplemental coverage is offered to state employees for employee and dependent coverage. Supplemental life insurance premiums are based upon age and amount of coverage.
Construction Assistance Revolving
Loan FundNet cash provided (used ) by:
Operating activities $ 40,233Noncapital financing activities (1,587)Investing activities (20,334)
Net increase (decrease) 18,312
Cash and cash equivalents, beginning 82,850
Cash and cash equivalents, end $ 101,162
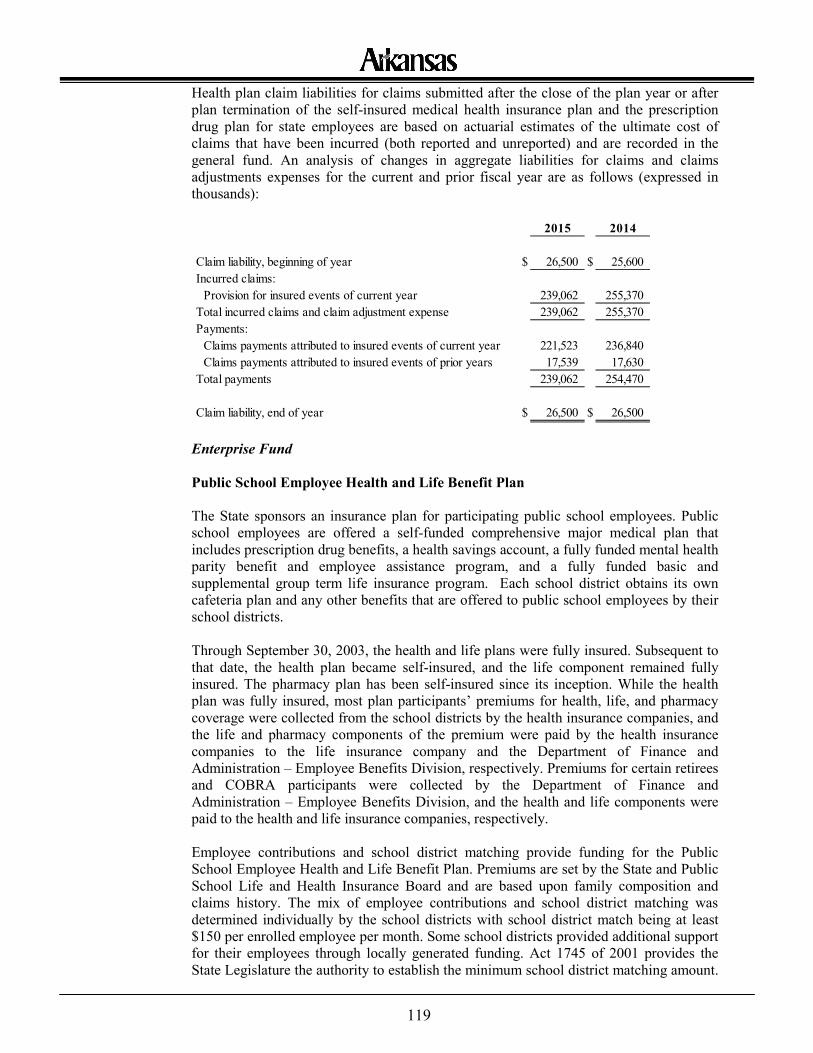
119
Health plan claim liabilities for claims submitted after the close of the plan year or after plan termination of the self-insured medical health insurance plan and the prescription drug plan for state employees are based on actuarial estimates of the ultimate cost of claims that have been incurred (both reported and unreported) and are recorded in the general fund. An analysis of changes in aggregate liabilities for claims and claims adjustments expenses for the current and prior fiscal year are as follows (expressed in thousands):
Enterprise Fund Public School Employee Health and Life Benefit Plan The State sponsors an insurance plan for participating public school employees. Public school employees are offered a self-funded comprehensive major medical plan that includes prescription drug benefits, a health savings account, a fully funded mental health parity benefit and employee assistance program, and a fully funded basic and supplemental group term life insurance program. Each school district obtains its own cafeteria plan and any other benefits that are offered to public school employees by their school districts. Through September 30, 2003, the health and life plans were fully insured. Subsequent to that date, the health plan became self-insured, and the life component remained fully insured. The pharmacy plan has been self-insured since its inception. While the health plan was fully insured, most plan participants’ premiums for health, life, and pharmacy coverage were collected from the school districts by the health insurance companies, and the life and pharmacy components of the premium were paid by the health insurance companies to the life insurance company and the Department of Finance and Administration – Employee Benefits Division, respectively. Premiums for certain retirees and COBRA participants were collected by the Department of Finance and Administration – Employee Benefits Division, and the health and life components were paid to the health and life insurance companies, respectively. Employee contributions and school district matching provide funding for the Public School Employee Health and Life Benefit Plan. Premiums are set by the State and Public School Life and Health Insurance Board and are based upon family composition and claims history. The mix of employee contributions and school district matching was determined individually by the school districts with school district match being at least $150 per enrolled employee per month. Some school districts provided additional support for their employees through locally generated funding. Act 1745 of 2001 provides the State Legislature the authority to establish the minimum school district matching amount.
2015 2014
Claim liability, beginning of year $ 26,500 $ 25,600Incurred claims:
Provision for insured events of current year 239,062 255,370Total incurred claims and claim adjustment expense 239,062 255,370Payments:
Claims payments attributed to insured events of current year 221,523 236,840Claims payments attributed to insured events of prior years 17,539 17,630
Total payments 239,062 254,470
Claim liability, end of year $ 26,500 $ 26,500
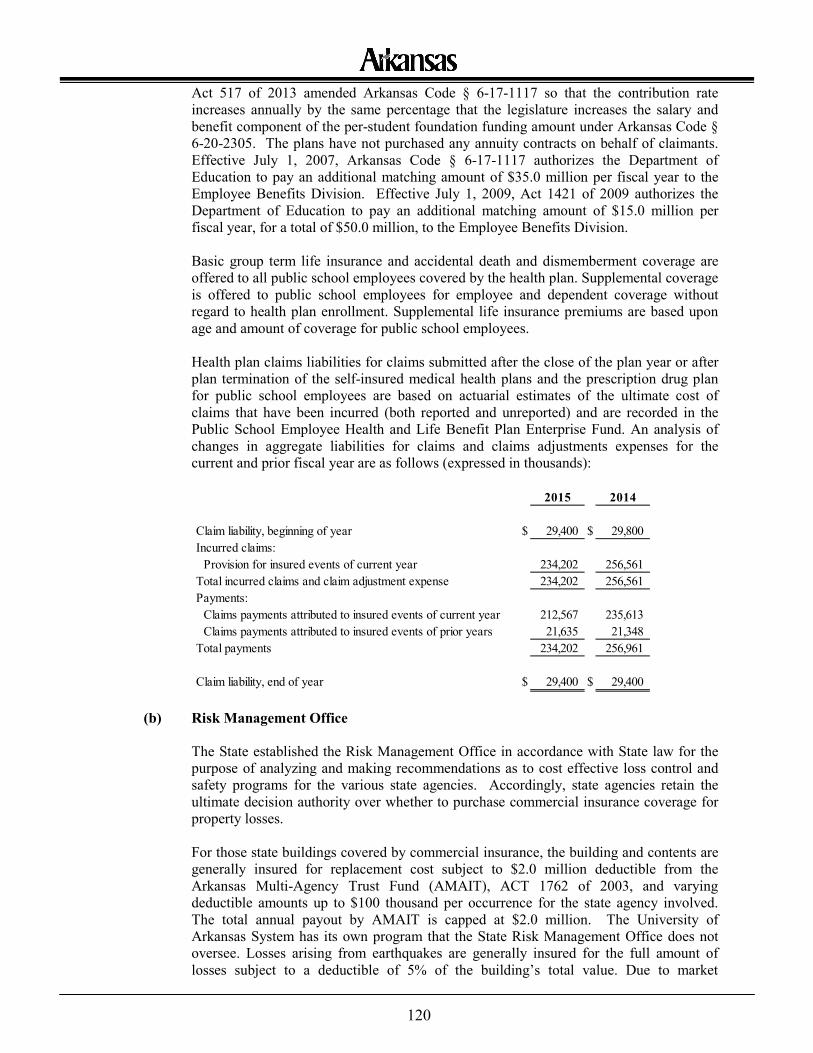
120
Act 517 of 2013 amended Arkansas Code § 6-17-1117 so that the contribution rate increases annually by the same percentage that the legislature increases the salary and benefit component of the per-student foundation funding amount under Arkansas Code § 6-20-2305. The plans have not purchased any annuity contracts on behalf of claimants. Effective July 1, 2007, Arkansas Code § 6-17-1117 authorizes the Department of Education to pay an additional matching amount of $35.0 million per fiscal year to the Employee Benefits Division. Effective July 1, 2009, Act 1421 of 2009 authorizes the Department of Education to pay an additional matching amount of $15.0 million per fiscal year, for a total of $50.0 million, to the Employee Benefits Division. Basic group term life insurance and accidental death and dismemberment coverage are offered to all public school employees covered by the health plan. Supplemental coverage is offered to public school employees for employee and dependent coverage without regard to health plan enrollment. Supplemental life insurance premiums are based upon age and amount of coverage for public school employees. Health plan claims liabilities for claims submitted after the close of the plan year or after plan termination of the self-insured medical health plans and the prescription drug plan for public school employees are based on actuarial estimates of the ultimate cost of claims that have been incurred (both reported and unreported) and are recorded in the Public School Employee Health and Life Benefit Plan Enterprise Fund. An analysis of changes in aggregate liabilities for claims and claims adjustments expenses for the current and prior fiscal year are as follows (expressed in thousands):
(b) Risk Management Office
The State established the Risk Management Office in accordance with State law for the purpose of analyzing and making recommendations as to cost effective loss control and safety programs for the various state agencies. Accordingly, state agencies retain the ultimate decision authority over whether to purchase commercial insurance coverage for property losses. For those state buildings covered by commercial insurance, the building and contents are generally insured for replacement cost subject to $2.0 million deductible from the Arkansas Multi-Agency Trust Fund (AMAIT), ACT 1762 of 2003, and varying deductible amounts up to $100 thousand per occurrence for the state agency involved. The total annual payout by AMAIT is capped at $2.0 million. The University of Arkansas System has its own program that the State Risk Management Office does not oversee. Losses arising from earthquakes are generally insured for the full amount of losses subject to a deductible of 5% of the building’s total value. Due to market
2015 2014
Claim liability, beginning of year $ 29,400 $ 29,800Incurred claims:
Provision for insured events of current year 234,202 256,561Total incurred claims and claim adjustment expense 234,202 256,561Payments:
Claims payments attributed to insured events of current year 212,567 235,613Claims payments attributed to insured events of prior years 21,635 21,348
Total payments 234,202 256,961
Claim liability, end of year $ 29,400 $ 29,400
121
conditions, limited availability and excessive cost, total earthquake coverage is limited to $100.0 million in earthquake zones 2 and 3 and $200.0 million for zones 4 and 5. The State has secured domestic and foreign terrorism insurance coverage. Certain state agencies have chosen not to purchase commercial insurance on certain buildings and, as such, losses for these buildings are recorded as expenditures in Governmental Activities when incurred. Flood coverage is provided with varying limits and deductibles according to the various flood zones. Limits vary from $30.0 million in high hazard Zone A ($1.0 million deductible) to $100.0 million in Zone X ($100 thousand deductible). Both earthquake and flood coverage limits are annual total maximum coverage for the State, not per occurrence and not per agency. The State does not purchase liability insurance coverage for claims arising from third-party losses on state property as the State relies on sovereign immunity against such claims. Claims against the State for such losses are heard before the State Claims Commission. For those state vehicles covered by commercial insurance, each participating agency determines which, if any, vehicles to insure for physical damage and are subject to a deductible of $500 or $1,000. Also, such commercial insurance generally provides coverage against liability losses up to $250 thousand per occurrence in state and $2.0 million per occurrence out of state. Seven higher education institutions and four state agencies have elected to purchase $1.0 million liability in state. Eleven state agencies purchase $500 thousand in state and $2.0 million out of state coverage. Two state agencies have elected not to purchase commercial vehicle insurance, and losses on such vehicles are recorded as expenditures in the General Fund as incurred. Liability losses arising from uninsured vehicles are heard and adjudicated by the State Claims Commission.
(c) State Claims Commission
The State Claims Commission (the Commission) was established by state law to hear and adjudicate all claims against the State and its agencies and component units, excluding those arising from workers’ compensation law, employment security law and the acts of the various retirement plans. The Commission may authorize awards up to $15 thousand without further approval (unless State-provided death and disability benefits for specified public employees are involved), while amounts exceeding $15 thousand must be approved by the State General Assembly. The claim liability is determined by review of pending claims and estimation of the ultimate cost to settle such claims and is recorded in the government-wide financial statements. The amount of claims awarded/allowed and awaiting review and approval to be paid by the General Assembly at June 30, 2015, is $581 thousand. This liability is included in Note 18 Governmental Activities (a) as part of litigation.
(d) Public Employee Claims Division of the Arkansas Insurance Department The State’s Workers’ Compensation Program (the Program) was created by state law to provide benefits to state employees injured on the job. All employees of the State and its component units are included in the Program. Prior to July 1, 1994, employees of State- sponsored school districts were also included in the plan, and the State continues to pay benefits to those employees injured prior to that date. Prior to July 1, 1986, employees of the counties and cities were included in the plan, and the State continues to pay benefits to those employees injured prior to that date. An injury is covered under workers’ compensation if it is caused by an accident that arose out of and in the course of
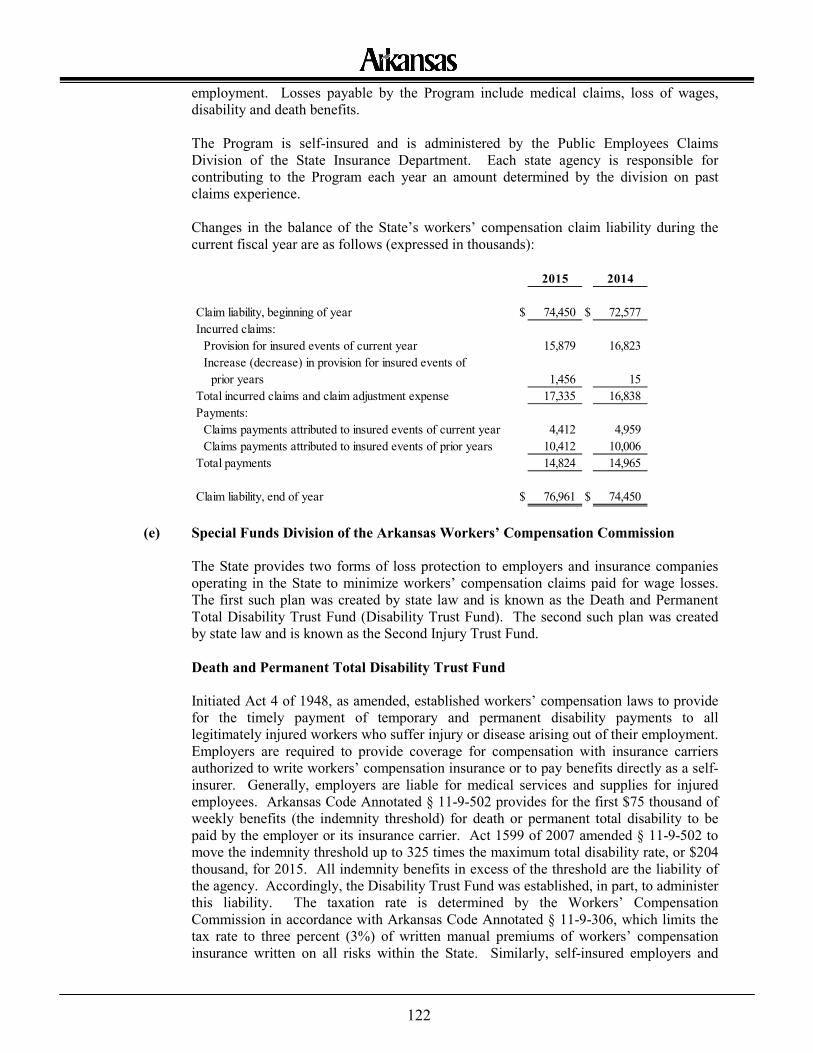
122
employment. Losses payable by the Program include medical claims, loss of wages, disability and death benefits. The Program is self-insured and is administered by the Public Employees Claims Division of the State Insurance Department. Each state agency is responsible for contributing to the Program each year an amount determined by the division on past claims experience. Changes in the balance of the State’s workers’ compensation claim liability during the current fiscal year are as follows (expressed in thousands):
(e) Special Funds Division of the Arkansas Workers’ Compensation Commission
The State provides two forms of loss protection to employers and insurance companies operating in the State to minimize workers’ compensation claims paid for wage losses. The first such plan was created by state law and is known as the Death and Permanent Total Disability Trust Fund (Disability Trust Fund). The second such plan was created by state law and is known as the Second Injury Trust Fund. Death and Permanent Total Disability Trust Fund Initiated Act 4 of 1948, as amended, established workers’ compensation laws to provide for the timely payment of temporary and permanent disability payments to all legitimately injured workers who suffer injury or disease arising out of their employment. Employers are required to provide coverage for compensation with insurance carriers authorized to write workers’ compensation insurance or to pay benefits directly as a self-insurer. Generally, employers are liable for medical services and supplies for injured employees. Arkansas Code Annotated § 11-9-502 provides for the first $75 thousand of weekly benefits (the indemnity threshold) for death or permanent total disability to be paid by the employer or its insurance carrier. Act 1599 of 2007 amended § 11-9-502 to move the indemnity threshold up to 325 times the maximum total disability rate, or $204 thousand, for 2015. All indemnity benefits in excess of the threshold are the liability of the agency. Accordingly, the Disability Trust Fund was established, in part, to administer this liability. The taxation rate is determined by the Workers’ Compensation Commission in accordance with Arkansas Code Annotated § 11-9-306, which limits the tax rate to three percent (3%) of written manual premiums of workers’ compensation insurance written on all risks within the State. Similarly, self-insured employers and
2015 2014
Claim liability, beginning of year $ 74,450 $ 72,577Incurred claims:
Provision for insured events of current year 15,879 16,823Increase (decrease) in provision for insured events of □prior years 1,456 15
Total incurred claims and claim adjustment expense 17,335 16,838Payments:
Claims payments attributed to insured events of current year 4,412 4,959Claims payments attributed to insured events of prior years 10,412 10,006
Total payments 14,824 14,965
Claim liability, end of year $ 76,961 $ 74,450
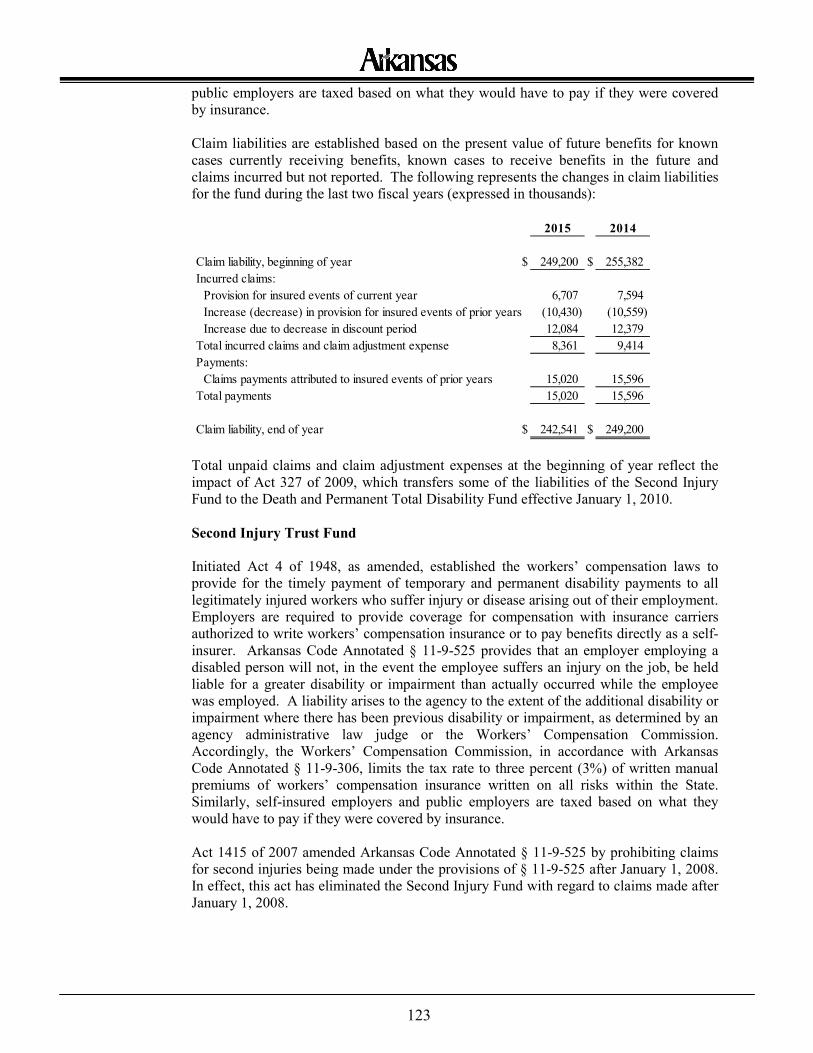
123
public employers are taxed based on what they would have to pay if they were covered by insurance. Claim liabilities are established based on the present value of future benefits for known cases currently receiving benefits, known cases to receive benefits in the future and claims incurred but not reported. The following represents the changes in claim liabilities for the fund during the last two fiscal years (expressed in thousands):
Total unpaid claims and claim adjustment expenses at the beginning of year reflect the impact of Act 327 of 2009, which transfers some of the liabilities of the Second Injury Fund to the Death and Permanent Total Disability Fund effective January 1, 2010. Second Injury Trust Fund Initiated Act 4 of 1948, as amended, established the workers’ compensation laws to provide for the timely payment of temporary and permanent disability payments to all legitimately injured workers who suffer injury or disease arising out of their employment. Employers are required to provide coverage for compensation with insurance carriers authorized to write workers’ compensation insurance or to pay benefits directly as a self-insurer. Arkansas Code Annotated § 11-9-525 provides that an employer employing a disabled person will not, in the event the employee suffers an injury on the job, be held liable for a greater disability or impairment than actually occurred while the employee was employed. A liability arises to the agency to the extent of the additional disability or impairment where there has been previous disability or impairment, as determined by an agency administrative law judge or the Workers’ Compensation Commission. Accordingly, the Workers’ Compensation Commission, in accordance with Arkansas Code Annotated § 11-9-306, limits the tax rate to three percent (3%) of written manual premiums of workers’ compensation insurance written on all risks within the State. Similarly, self-insured employers and public employers are taxed based on what they would have to pay if they were covered by insurance. Act 1415 of 2007 amended Arkansas Code Annotated § 11-9-525 by prohibiting claims for second injuries being made under the provisions of § 11-9-525 after January 1, 2008. In effect, this act has eliminated the Second Injury Fund with regard to claims made after January 1, 2008.
2015 2014
Claim liability, beginning of year $ 249,200 $ 255,382Incurred claims:
Provision for insured events of current year 6,707 7,594Increase (decrease) in provision for insured events of prior years (10,430) (10,559)Increase due to decrease in discount period 12,084 12,379
Total incurred claims and claim adjustment expense 8,361 9,414Payments:
Claims payments attributed to insured events of prior years 15,020 15,596Total payments 15,020 15,596
Claim liability, end of year $ 242,541 $ 249,200
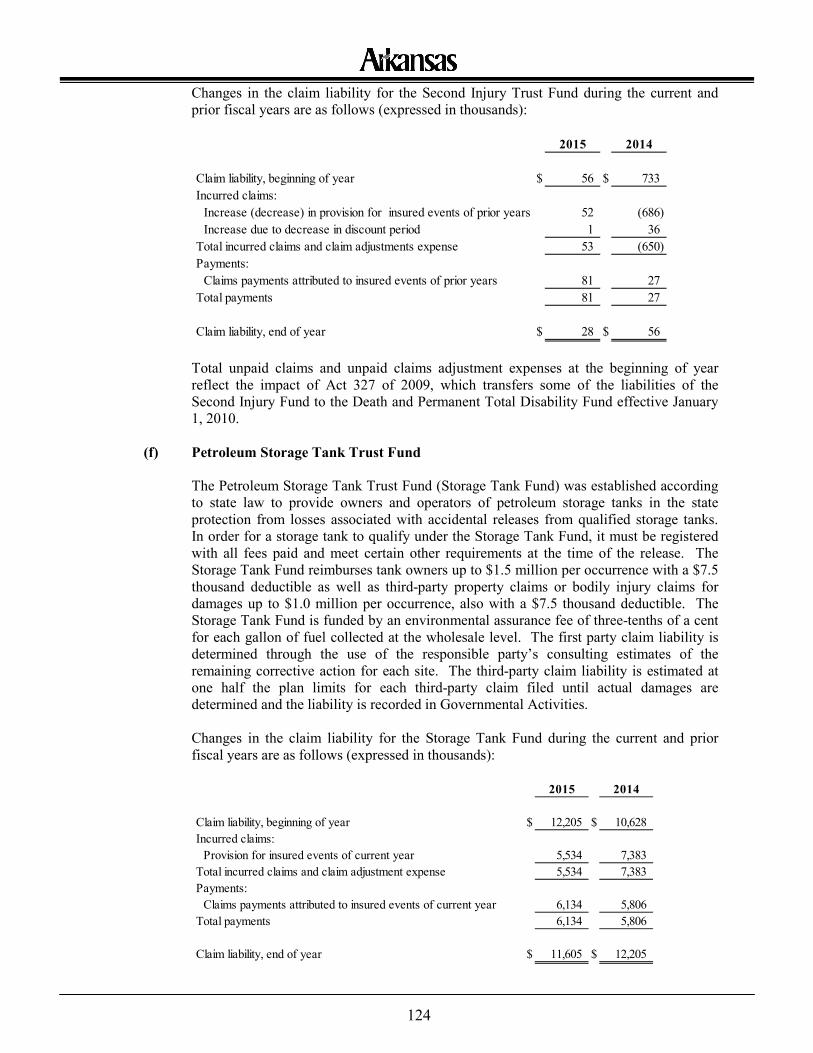
124
Changes in the claim liability for the Second Injury Trust Fund during the current and prior fiscal years are as follows (expressed in thousands):
Total unpaid claims and unpaid claims adjustment expenses at the beginning of year reflect the impact of Act 327 of 2009, which transfers some of the liabilities of the Second Injury Fund to the Death and Permanent Total Disability Fund effective January 1, 2010.
(f) Petroleum Storage Tank Trust Fund
The Petroleum Storage Tank Trust Fund (Storage Tank Fund) was established according to state law to provide owners and operators of petroleum storage tanks in the state protection from losses associated with accidental releases from qualified storage tanks. In order for a storage tank to qualify under the Storage Tank Fund, it must be registered with all fees paid and meet certain other requirements at the time of the release. The Storage Tank Fund reimburses tank owners up to $1.5 million per occurrence with a $7.5 thousand deductible as well as third-party property claims or bodily injury claims for damages up to $1.0 million per occurrence, also with a $7.5 thousand deductible. The Storage Tank Fund is funded by an environmental assurance fee of three-tenths of a cent for each gallon of fuel collected at the wholesale level. The first party claim liability is determined through the use of the responsible party’s consulting estimates of the remaining corrective action for each site. The third-party claim liability is estimated at one half the plan limits for each third-party claim filed until actual damages are determined and the liability is recorded in Governmental Activities. Changes in the claim liability for the Storage Tank Fund during the current and prior fiscal years are as follows (expressed in thousands):
2015 2014
Claim liability, beginning of year $ 56 $ 733Incurred claims:
Increase (decrease) in provision for insured events of prior years 52 (686)Increase due to decrease in discount period 1 36
Total incurred claims and claim adjustments expense 53 (650)Payments:
Claims payments attributed to insured events of prior years 81 27Total payments 81 27
Claim liability, end of year $ 28 $ 56
2015 2014
Claim liability, beginning of year $ 12,205 $ 10,628Incurred claims:
Provision for insured events of current year 5,534 7,383Total incurred claims and claim adjustment expense 5,534 7,383Payments:
Claims payments attributed to insured events of current year 6,134 5,806Total payments 6,134 5,806
Claim liability, end of year $ 11,605 $ 12,205
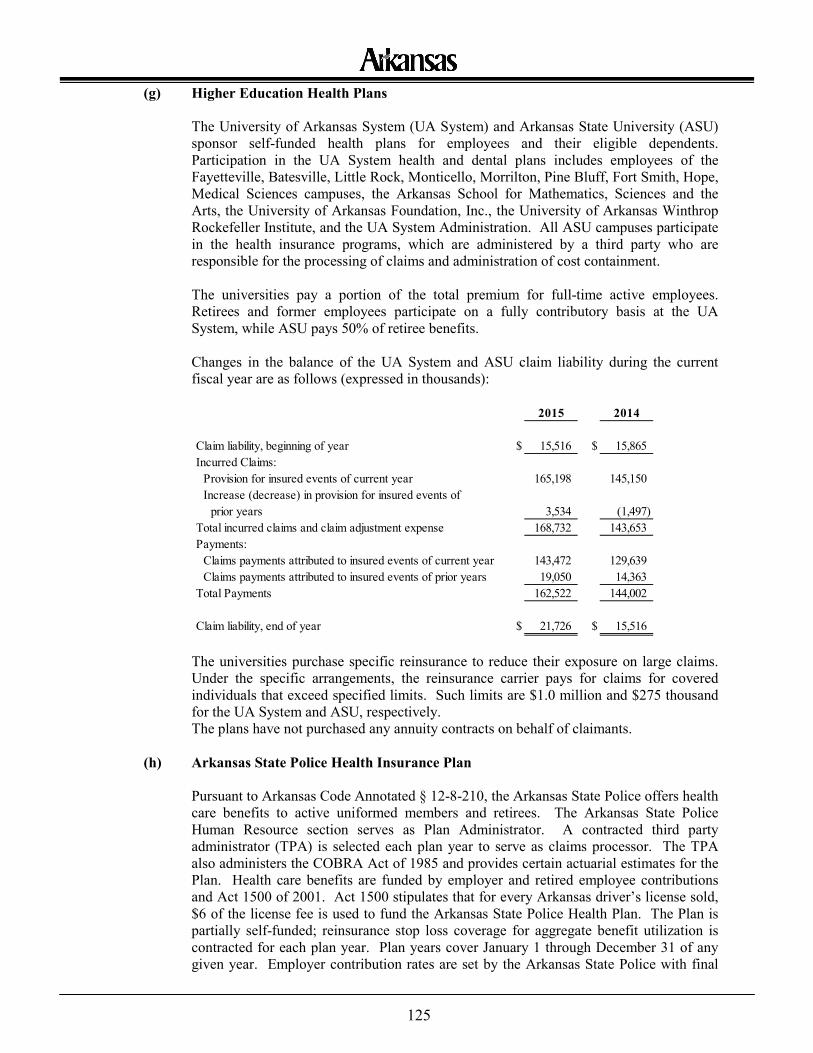
125
(g) Higher Education Health Plans
The University of Arkansas System (UA System) and Arkansas State University (ASU) sponsor self-funded health plans for employees and their eligible dependents. Participation in the UA System health and dental plans includes employees of the Fayetteville, Batesville, Little Rock, Monticello, Morrilton, Pine Bluff, Fort Smith, Hope, Medical Sciences campuses, the Arkansas School for Mathematics, Sciences and the Arts, the University of Arkansas Foundation, Inc., the University of Arkansas Winthrop Rockefeller Institute, and the UA System Administration. All ASU campuses participate in the health insurance programs, which are administered by a third party who are responsible for the processing of claims and administration of cost containment. The universities pay a portion of the total premium for full-time active employees. Retirees and former employees participate on a fully contributory basis at the UA System, while ASU pays 50% of retiree benefits. Changes in the balance of the UA System and ASU claim liability during the current fiscal year are as follows (expressed in thousands):
The universities purchase specific reinsurance to reduce their exposure on large claims. Under the specific arrangements, the reinsurance carrier pays for claims for covered individuals that exceed specified limits. Such limits are $1.0 million and $275 thousand for the UA System and ASU, respectively. The plans have not purchased any annuity contracts on behalf of claimants.
(h) Arkansas State Police Health Insurance Plan Pursuant to Arkansas Code Annotated § 12-8-210, the Arkansas State Police offers health care benefits to active uniformed members and retirees. The Arkansas State Police Human Resource section serves as Plan Administrator. A contracted third party administrator (TPA) is selected each plan year to serve as claims processor. The TPA also administers the COBRA Act of 1985 and provides certain actuarial estimates for the Plan. Health care benefits are funded by employer and retired employee contributions and Act 1500 of 2001. Act 1500 stipulates that for every Arkansas driver’s license sold, $6 of the license fee is used to fund the Arkansas State Police Health Plan. The Plan is partially self-funded; reinsurance stop loss coverage for aggregate benefit utilization is contracted for each plan year. Plan years cover January 1 through December 31 of any given year. Employer contribution rates are set by the Arkansas State Police with final
2015 2014
Claim liability, beginning of year $ 15,516 $ 15,865Incurred Claims:
Provision for insured events of current year 165,198 145,150Increase (decrease) in provision for insured events of □prior years 3,534 (1,497)
Total incurred claims and claim adjustment expense 168,732 143,653Payments:
Claims payments attributed to insured events of current year 143,472 129,639Claims payments attributed to insured events of prior years 19,050 14,363
Total Payments 162,522 144,002
Claim liability, end of year $ 21,726 $ 15,516
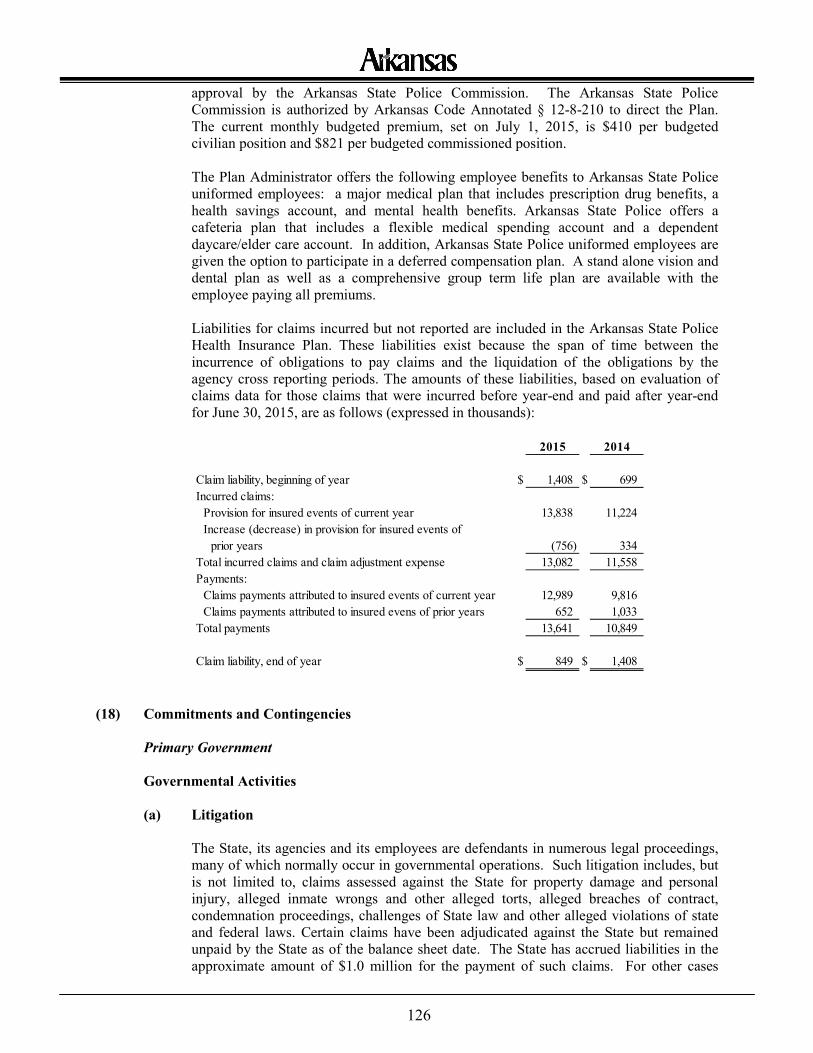
126
approval by the Arkansas State Police Commission. The Arkansas State Police Commission is authorized by Arkansas Code Annotated § 12-8-210 to direct the Plan. The current monthly budgeted premium, set on July 1, 2015, is $410 per budgeted civilian position and $821 per budgeted commissioned position. The Plan Administrator offers the following employee benefits to Arkansas State Police uniformed employees: a major medical plan that includes prescription drug benefits, a health savings account, and mental health benefits. Arkansas State Police offers a cafeteria plan that includes a flexible medical spending account and a dependent daycare/elder care account. In addition, Arkansas State Police uniformed employees are given the option to participate in a deferred compensation plan. A stand alone vision and dental plan as well as a comprehensive group term life plan are available with the employee paying all premiums. Liabilities for claims incurred but not reported are included in the Arkansas State Police Health Insurance Plan. These liabilities exist because the span of time between the incurrence of obligations to pay claims and the liquidation of the obligations by the agency cross reporting periods. The amounts of these liabilities, based on evaluation of claims data for those claims that were incurred before year-end and paid after year-end for June 30, 2015, are as follows (expressed in thousands):
(18) Commitments and Contingencies Primary Government Governmental Activities (a) Litigation
The State, its agencies and its employees are defendants in numerous legal proceedings, many of which normally occur in governmental operations. Such litigation includes, but is not limited to, claims assessed against the State for property damage and personal injury, alleged inmate wrongs and other alleged torts, alleged breaches of contract, condemnation proceedings, challenges of State law and other alleged violations of state and federal laws. Certain claims have been adjudicated against the State but remained unpaid by the State as of the balance sheet date. The State has accrued liabilities in the approximate amount of $1.0 million for the payment of such claims. For other cases
2015 2014
Claim liability, beginning of year $ 1,408 $ 699Incurred claims:
Provision for insured events of current year 13,838 11,224Increase (decrease) in provision for insured events of □prior years (756) 334
Total incurred claims and claim adjustment expense 13,082 11,558Payments:
Claims payments attributed to insured events of current year 12,989 9,816Claims payments attributed to insured evens of prior years 652 1,033
Total payments 13,641 10,849
Claim liability, end of year $ 849 $ 1,408
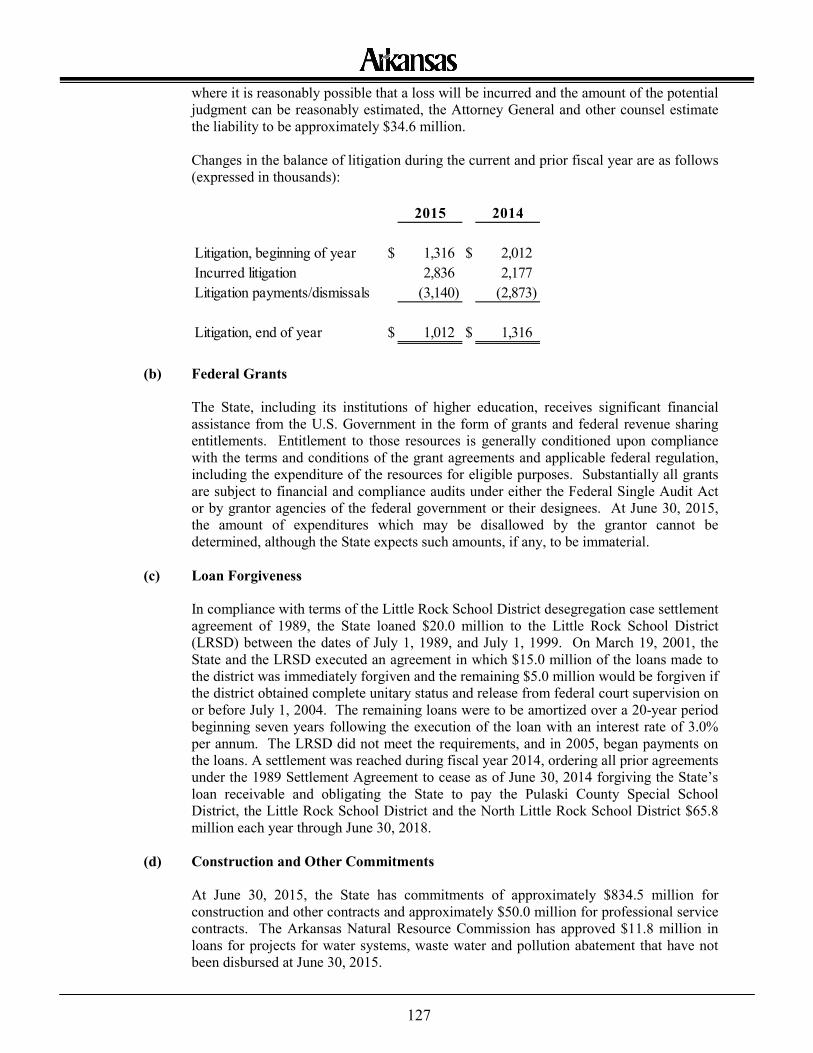
127
where it is reasonably possible that a loss will be incurred and the amount of the potential judgment can be reasonably estimated, the Attorney General and other counsel estimate the liability to be approximately $34.6 million. Changes in the balance of litigation during the current and prior fiscal year are as follows (expressed in thousands):
(b) Federal Grants
The State, including its institutions of higher education, receives significant financial assistance from the U.S. Government in the form of grants and federal revenue sharing entitlements. Entitlement to those resources is generally conditioned upon compliance with the terms and conditions of the grant agreements and applicable federal regulation, including the expenditure of the resources for eligible purposes. Substantially all grants are subject to financial and compliance audits under either the Federal Single Audit Act or by grantor agencies of the federal government or their designees. At June 30, 2015, the amount of expenditures which may be disallowed by the grantor cannot be determined, although the State expects such amounts, if any, to be immaterial.
(c) Loan Forgiveness
In compliance with terms of the Little Rock School District desegregation case settlement agreement of 1989, the State loaned $20.0 million to the Little Rock School District (LRSD) between the dates of July 1, 1989, and July 1, 1999. On March 19, 2001, the State and the LRSD executed an agreement in which $15.0 million of the loans made to the district was immediately forgiven and the remaining $5.0 million would be forgiven if the district obtained complete unitary status and release from federal court supervision on or before July 1, 2004. The remaining loans were to be amortized over a 20-year period beginning seven years following the execution of the loan with an interest rate of 3.0% per annum. The LRSD did not meet the requirements, and in 2005, began payments on the loans. A settlement was reached during fiscal year 2014, ordering all prior agreements under the 1989 Settlement Agreement to cease as of June 30, 2014 forgiving the State’s loan receivable and obligating the State to pay the Pulaski County Special School District, the Little Rock School District and the North Little Rock School District $65.8 million each year through June 30, 2018.
(d) Construction and Other Commitments
At June 30, 2015, the State has commitments of approximately $834.5 million for construction and other contracts and approximately $50.0 million for professional service contracts. The Arkansas Natural Resource Commission has approved $11.8 million in loans for projects for water systems, waste water and pollution abatement that have not been disbursed at June 30, 2015.
2015 2014
Litigation, beginning of year $ 1,316 $ 2,012Incurred litigation 2,836 2,177Litigation payments/dismissals (3,140) (2,873)
Litigation, end of year $ 1,012 $ 1,316
128
(e) Bond Guarantees
The Arkansas Economic Development Commission (AEDC) Bond Reserve Guarantee Fund is used to guarantee principal and interest on industrial development revenue bonds issued by counties and municipalities within the State of Arkansas. At June 30, 2015, total bonds guaranteed by the AEDC Bond Guarantee Reserve Fund were approximately $40.3 million. As of June 30, 2015, one (1) of these loans underlying these issues was in default with a total of $300 thousand for which AEDC is paying debt service on the related guaranteed bonds as the bonds become due.
(f) Tobacco Settlement
In November 1998, the Attorney General joined 46 other states and five territories in a settlement with the nation’s largest tobacco manufacturers. The settlement includes base payments to states totaling $206.0 billion over the next 25 years and continues in perpetuity. All disbursements from the Master Settlement Agreement were initially deposited to the Tobacco Settlement Cash Holding Account. In 2001, funds were distributed to various accounts within the General Fund, including the Arkansas Healthy Century Trust Account, in the amount needed to bring the principal balance to $100.0 million, and the remainder was distributed to the Tobacco Settlement Program Account. For 2002 and thereafter, the first $5.0 million must be distributed to the Tobacco Settlement Debt Service Account, and the amounts remaining are distributed to the Tobacco Settlement Program Account. The Arkansas Tobacco Settlement Commission, created by the Arkansas Tobacco Settlement Funds Act of 2000, is directed to monitor and evaluate programs established in the Tobacco Proceeds Act, to establish program goals for related programs and to develop performance indicators to monitor programmatic functions to ensure optimal impact on improving the health of Arkansans. The programs include prevention and cessation programs, targeted state needs programs, health issues with specific emphasis on smoking and the use of tobacco products, and the Medicaid Expansion program. In fiscal year 2006, the Arkansas Development Finance Authority (the Authority) issued $36.8 million in Tobacco Settlement Revenue Bonds. The Authority has made the proceeds of the bonds available to the University of Arkansas Board of Trustees (UA Board) to fund an expansion to the Arkansas Cancer Research Center (ACRC) on the campus of the University of Arkansas for Medical Sciences (UAMS). The bonds have an approximate yield to maturity of 4.77% to 5.10%, and principal and accumulated interest are payable beginning in 2021 through 2031 for $22.2 million of serial bonds and beginning in 2036 through 2046 for $14.6 million of term bonds. Funds received from the Arkansas Tobacco Settlement Funds Act of 2000 are pledged for debt service and are the primary source of payment for the bonds. In accordance with a Loan Agreement dated June 1, 2006, between the UA Board and the Authority, the UA Board will be required to make debt service payments on the Series 2006 bond issue in the event of a shortfall in tobacco settlement revenues. However, no such payments will be made unless the Debt Service Revenues are insufficient to make such payments. Management believes the Debt Service Revenues will be sufficient to service the entire principal and interest due. The latest Global Insights USA, Inc. report, prepared in August 2006 on the Forecast of U.S. Cigarette Consumption (2004-2046), indicates that tobacco consumption in 2046 is expected to decline by 54% from the 2003 level. For fiscal year 2003, Arkansas received $60.1 million from the Tobacco Settlement Fund. Using the 54% decline from above, Arkansas should receive approximately $27.6 million in 2046 with the first $5.0 million dedicated to pay the debt service on the above bond issue. If Debt
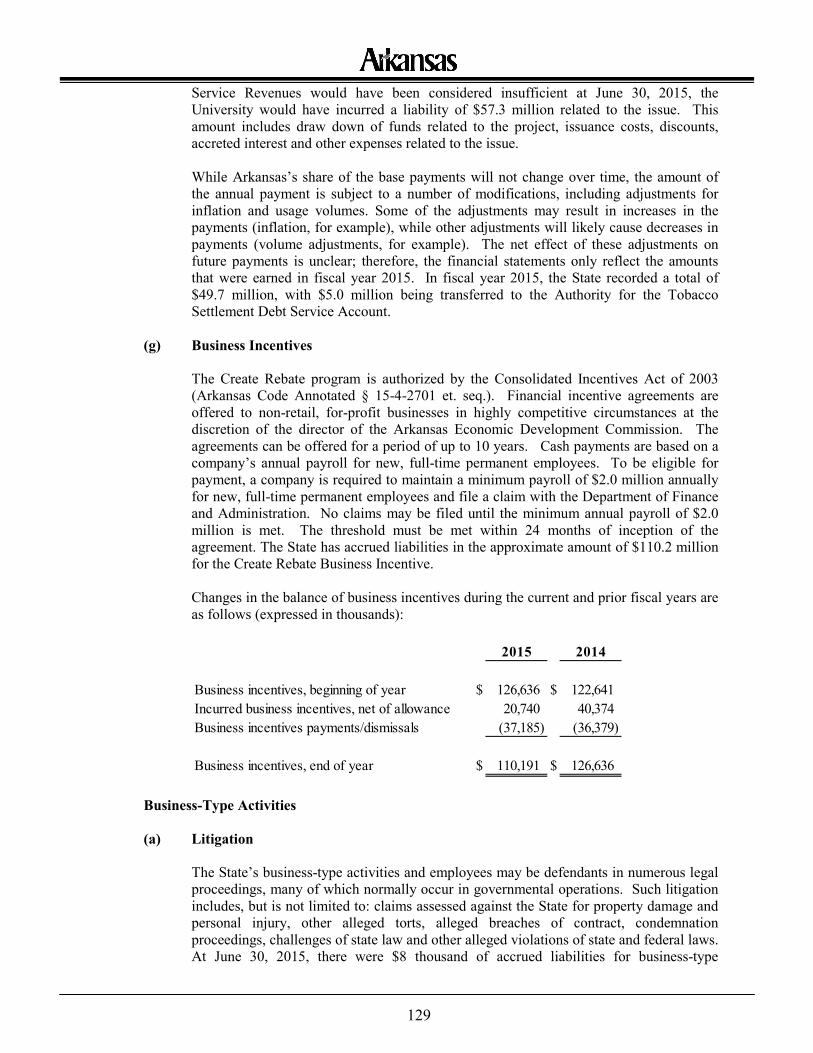
129
Service Revenues would have been considered insufficient at June 30, 2015, the University would have incurred a liability of $57.3 million related to the issue. This amount includes draw down of funds related to the project, issuance costs, discounts, accreted interest and other expenses related to the issue. While Arkansas’s share of the base payments will not change over time, the amount of the annual payment is subject to a number of modifications, including adjustments for inflation and usage volumes. Some of the adjustments may result in increases in the payments (inflation, for example), while other adjustments will likely cause decreases in payments (volume adjustments, for example). The net effect of these adjustments on future payments is unclear; therefore, the financial statements only reflect the amounts that were earned in fiscal year 2015. In fiscal year 2015, the State recorded a total of $49.7 million, with $5.0 million being transferred to the Authority for the Tobacco Settlement Debt Service Account.
(g) Business Incentives
The Create Rebate program is authorized by the Consolidated Incentives Act of 2003 (Arkansas Code Annotated § 15-4-2701 et. seq.). Financial incentive agreements are offered to non-retail, for-profit businesses in highly competitive circumstances at the discretion of the director of the Arkansas Economic Development Commission. The agreements can be offered for a period of up to 10 years. Cash payments are based on a company’s annual payroll for new, full-time permanent employees. To be eligible for payment, a company is required to maintain a minimum payroll of $2.0 million annually for new, full-time permanent employees and file a claim with the Department of Finance and Administration. No claims may be filed until the minimum annual payroll of $2.0 million is met. The threshold must be met within 24 months of inception of the agreement. The State has accrued liabilities in the approximate amount of $110.2 million for the Create Rebate Business Incentive. Changes in the balance of business incentives during the current and prior fiscal years are as follows (expressed in thousands):
Business-Type Activities
(a) Litigation
The State’s business-type activities and employees may be defendants in numerous legal proceedings, many of which normally occur in governmental operations. Such litigation includes, but is not limited to: claims assessed against the State for property damage and personal injury, other alleged torts, alleged breaches of contract, condemnation proceedings, challenges of state law and other alleged violations of state and federal laws. At June 30, 2015, there were $8 thousand of accrued liabilities for business-type
2015 2014
Business incentives, beginning of year $ 126,636 $ 122,641Incurred business incentives, net of allowance 20,740 40,374Business incentives payments/dismissals (37,185) (36,379)
Business incentives, end of year $ 110,191 $ 126,636
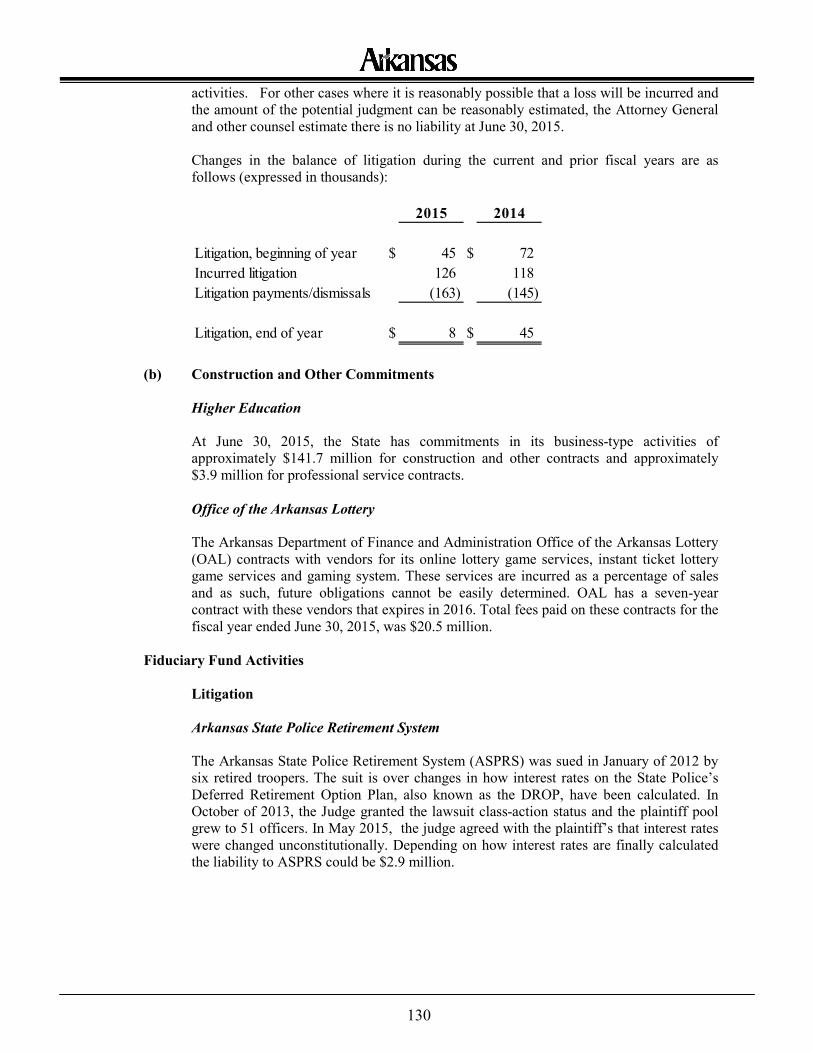
130
activities. For other cases where it is reasonably possible that a loss will be incurred and the amount of the potential judgment can be reasonably estimated, the Attorney General and other counsel estimate there is no liability at June 30, 2015. Changes in the balance of litigation during the current and prior fiscal years are as follows (expressed in thousands):
(b) Construction and Other Commitments
Higher Education
At June 30, 2015, the State has commitments in its business-type activities of approximately $141.7 million for construction and other contracts and approximately $3.9 million for professional service contracts. Office of the Arkansas Lottery The Arkansas Department of Finance and Administration Office of the Arkansas Lottery (OAL) contracts with vendors for its online lottery game services, instant ticket lottery game services and gaming system. These services are incurred as a percentage of sales and as such, future obligations cannot be easily determined. OAL has a seven-year contract with these vendors that expires in 2016. Total fees paid on these contracts for the fiscal year ended June 30, 2015, was $20.5 million.
Fiduciary Fund Activities
Litigation
Arkansas State Police Retirement System The Arkansas State Police Retirement System (ASPRS) was sued in January of 2012 by six retired troopers. The suit is over changes in how interest rates on the State Police’s Deferred Retirement Option Plan, also known as the DROP, have been calculated. In October of 2013, the Judge granted the lawsuit class-action status and the plaintiff pool grew to 51 officers. In May 2015, the judge agreed with the plaintiff’s that interest rates were changed unconstitutionally. Depending on how interest rates are finally calculated the liability to ASPRS could be $2.9 million.
2015 2014
Litigation, beginning of year $ 45 $ 72Incurred litigation 126 118Litigation payments/dismissals (163) (145)
Litigation, end of year $ 8 $ 45
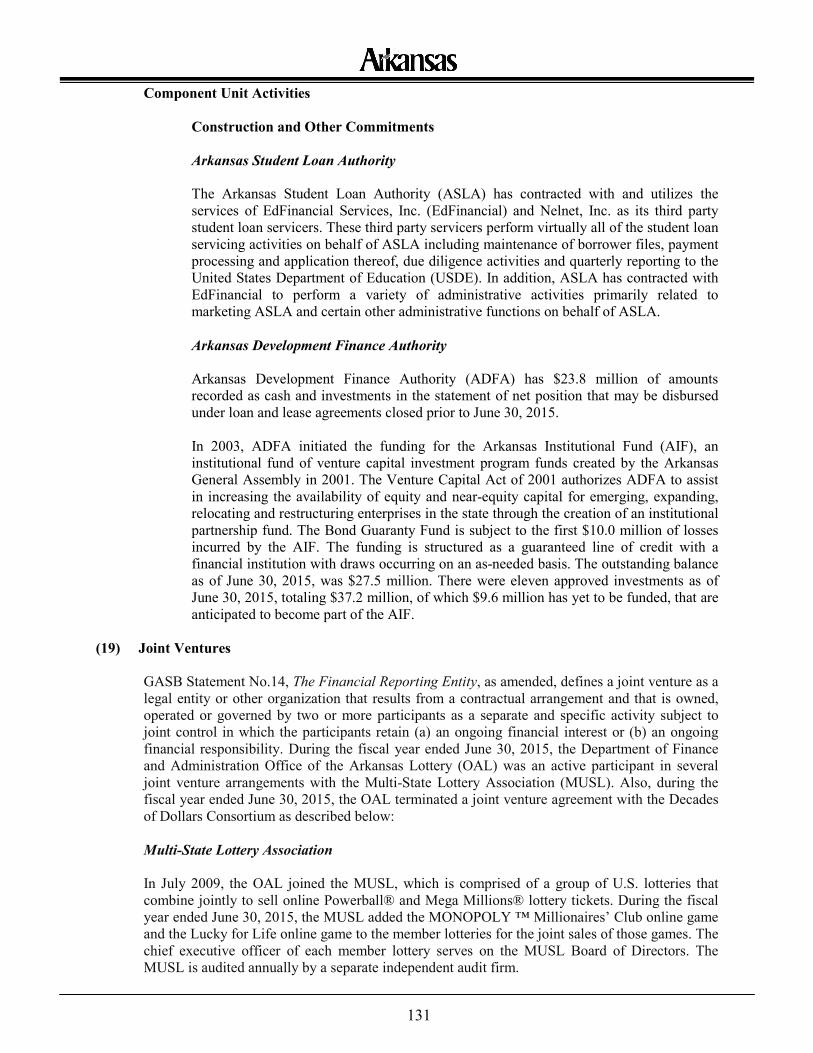
131
Component Unit Activities
Construction and Other Commitments Arkansas Student Loan Authority The Arkansas Student Loan Authority (ASLA) has contracted with and utilizes the services of EdFinancial Services, Inc. (EdFinancial) and Nelnet, Inc. as its third party student loan servicers. These third party servicers perform virtually all of the student loan servicing activities on behalf of ASLA including maintenance of borrower files, payment processing and application thereof, due diligence activities and quarterly reporting to the United States Department of Education (USDE). In addition, ASLA has contracted with EdFinancial to perform a variety of administrative activities primarily related to marketing ASLA and certain other administrative functions on behalf of ASLA. Arkansas Development Finance Authority Arkansas Development Finance Authority (ADFA) has $23.8 million of amounts recorded as cash and investments in the statement of net position that may be disbursed under loan and lease agreements closed prior to June 30, 2015. In 2003, ADFA initiated the funding for the Arkansas Institutional Fund (AIF), an institutional fund of venture capital investment program funds created by the Arkansas General Assembly in 2001. The Venture Capital Act of 2001 authorizes ADFA to assist in increasing the availability of equity and near-equity capital for emerging, expanding, relocating and restructuring enterprises in the state through the creation of an institutional partnership fund. The Bond Guaranty Fund is subject to the first $10.0 million of losses incurred by the AIF. The funding is structured as a guaranteed line of credit with a financial institution with draws occurring on an as-needed basis. The outstanding balance as of June 30, 2015, was $27.5 million. There were eleven approved investments as of June 30, 2015, totaling $37.2 million, of which $9.6 million has yet to be funded, that are anticipated to become part of the AIF.
(19) Joint Ventures
GASB Statement No.14, The Financial Reporting Entity, as amended, defines a joint venture as a legal entity or other organization that results from a contractual arrangement and that is owned, operated or governed by two or more participants as a separate and specific activity subject to joint control in which the participants retain (a) an ongoing financial interest or (b) an ongoing financial responsibility. During the fiscal year ended June 30, 2015, the Department of Finance and Administration Office of the Arkansas Lottery (OAL) was an active participant in several joint venture arrangements with the Multi-State Lottery Association (MUSL). Also, during the fiscal year ended June 30, 2015, the OAL terminated a joint venture agreement with the Decades of Dollars Consortium as described below: Multi-State Lottery Association In July 2009, the OAL joined the MUSL, which is comprised of a group of U.S. lotteries that combine jointly to sell online Powerball® and Mega Millions® lottery tickets. During the fiscal year ended June 30, 2015, the MUSL added the MONOPOLY ™ Millionaires’ Club online game and the Lucky for Life online game to the member lotteries for the joint sales of those games. The chief executive officer of each member lottery serves on the MUSL Board of Directors. The MUSL is audited annually by a separate independent audit firm.
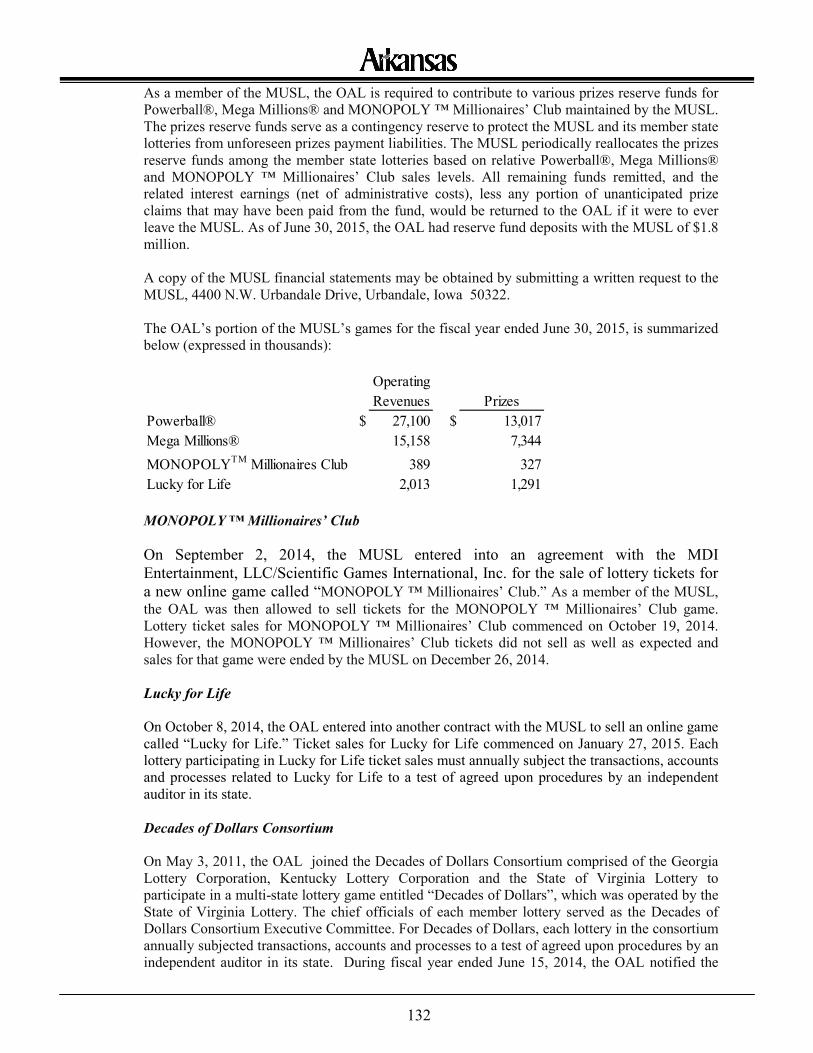
132
As a member of the MUSL, the OAL is required to contribute to various prizes reserve funds for Powerball®, Mega Millions® and MONOPOLY ™ Millionaires’ Club maintained by the MUSL. The prizes reserve funds serve as a contingency reserve to protect the MUSL and its member state lotteries from unforeseen prizes payment liabilities. The MUSL periodically reallocates the prizes reserve funds among the member state lotteries based on relative Powerball®, Mega Millions® and MONOPOLY ™ Millionaires’ Club sales levels. All remaining funds remitted, and the related interest earnings (net of administrative costs), less any portion of unanticipated prize claims that may have been paid from the fund, would be returned to the OAL if it were to ever leave the MUSL. As of June 30, 2015, the OAL had reserve fund deposits with the MUSL of $1.8 million. A copy of the MUSL financial statements may be obtained by submitting a written request to the MUSL, 4400 N.W. Urbandale Drive, Urbandale, Iowa 50322. The OAL’s portion of the MUSL’s games for the fiscal year ended June 30, 2015, is summarized below (expressed in thousands):
MONOPOLY ™ Millionaires’ Club
On September 2, 2014, the MUSL entered into an agreement with the MDI Entertainment, LLC/Scientific Games International, Inc. for the sale of lottery tickets for a new online game called “MONOPOLY ™ Millionaires’ Club.” As a member of the MUSL, the OAL was then allowed to sell tickets for the MONOPOLY ™ Millionaires’ Club game. Lottery ticket sales for MONOPOLY ™ Millionaires’ Club commenced on October 19, 2014. However, the MONOPOLY ™ Millionaires’ Club tickets did not sell as well as expected and sales for that game were ended by the MUSL on December 26, 2014. Lucky for Life On October 8, 2014, the OAL entered into another contract with the MUSL to sell an online game called “Lucky for Life.” Ticket sales for Lucky for Life commenced on January 27, 2015. Each lottery participating in Lucky for Life ticket sales must annually subject the transactions, accounts and processes related to Lucky for Life to a test of agreed upon procedures by an independent auditor in its state. Decades of Dollars Consortium On May 3, 2011, the OAL joined the Decades of Dollars Consortium comprised of the Georgia Lottery Corporation, Kentucky Lottery Corporation and the State of Virginia Lottery to participate in a multi-state lottery game entitled “Decades of Dollars”, which was operated by the State of Virginia Lottery. The chief officials of each member lottery served as the Decades of Dollars Consortium Executive Committee. For Decades of Dollars, each lottery in the consortium annually subjected transactions, accounts and processes to a test of agreed upon procedures by an independent auditor in its state. During fiscal year ended June 15, 2014, the OAL notified the
OperatingRevenues Prizes
Powerball® $ 27,100 $ 13,017Mega Millions® 15,158 7,344MONOPOLYTM Millionaires Club 389 327Lucky for Life 2,013 1,291
133
Decades of Dollars Consortium of its intent to withdraw from the consortium at a date subsequent to the end of fiscal year 2014. The member lotteries, other than the State of Virginia Lottery, also announced their intent to withdraw from the consortium. It was then agreed by the members of the consortium that ticket sales for the Decades of Dollars game would end after the drawing of October 16, 2015. The OAL’s portion of revenues for Decades of Dollars game for the fiscal year ended June 30, 2015, was $613 thousand. Due to the termination of ticket sales for the game, the subsequent amount of unclaimed prizes and the charge off of excess game reserves for Decades of Dollars resulted in a negative prizes expense of $(394) thousand for fiscal year 2015.
(20) Subsequent Events
Primary Government Governmental Activities Arkansas Building Authority Arkansas Building Authority became part of the Department of Finance & Administration (DFA) on July 1, 2015 and is now known as DFA – Division of Building Authority (DBA). On October 22, 2015, the Arkansas Development Finance Authority (ADFA) issued the $2.7 million State Agencies Facilities Refunding Bonds (Justice Building Project), Series 2015. The purpose of the bonds is to refund a portion of the Series 2005 bonds related to the Justice Building Project. At June 30, 2015, the Series 2005 bonds had a balance of $4.5 million. The bonds are secured by rental payments made to ADFA from DBA. Arkansas Natural Resources Commission In September 2015, the Arkansas Natural Resources Commission voted to convert the remaining Bayou Meto Water Management Project loan amount of $5.4 million to a grant. The project is a joint effort between state agencies, federal agencies and private entities. Its main objective is the development of an improvement plan that addresses flood control, groundwater conservation, water supply, waterfowl management and environmental enhancement in the Bayou Meto Wildlife Management Area.
Arkansas Department of Correction On October 22, 2015, AFDA issued the $7.3 million State Agencies Facilities Refunding Bonds (Arkansas Department of Correction Project), Series 2015. The purpose of the bonds is to refund the Series 2005-A bonds, which were issued to refund the Series 1999 bonds, which were originally issued for the purpose of financing the costs of acquiring, constructing and equipping of certain prison facilities. The bonds are secured by rental payments. Business-Type Activities Arkansas State University – Jonesboro Campus On August 27, 2015, the Board of Trustees approved the Wilson Hall renovation project and related financing. The renovation project includes the reconfiguration of the building infrastructure for new laboratories and learning environments, plus life and safety, technology and Americans with Disabilities Act improvements. The New York Institute of Technology
134
(NYIT) will lease Wilson Hall to provide appropriate space for the new Doctor of Osteopathy program. The cost of the project is expected to be $12.6 million. On November 5, 2015, the University borrowed $8.0 million at an interest rate of 2.97% for a term of 8 years for the project. The University has entered into $8.8 million in contracts after June 30, 2015, for these renovations. On August 27, 2015, the lease agreement with the Red Wolves Foundation was modified to secure an additional $4.0 million in financing for the Centennial Bank Stadium expansion project, bringing the total amount of the lease to $17.0 million. Arkansas Tech University On November 1, 2015, Student Fee Revenue Improvement Bonds were issued in the amount of $2.0 million to finance the replacement and upgrading of equipment in the University’s Computer Center. University of Arkansas On July 31, 2015, the University refinanced three existing installment contract agreements. All three financing arrangements facilitated the University’s energy savings projects. The first agreement, dated October 15, 2008, had an outstanding balance of $4.8 million on July 31, 2015. The second agreement, dated December 19, 2008, and the third agreement dated April 8, 2010, had outstanding balances of $16.6 million and $6.7 million, respectively, on July 31, 2015. The three new agreements are in the amounts of $4.9 million, $16.9 million and $6.8 million. The guaranteed energy savings over a 13-year period will cover the cost of building improvements.
On August 27, 2015, the University issued Board of Trustees of the University of Arkansas Various Facility Revenue Bonds (Fayetteville Campus), Series 2015B in the amount of $7.5 million and Board of Trustees of the University of Arkansas Various Facility Revenue Bonds (Fayetteville Campus), Refunding Series 2015C in the amount of $36.7 million. The Series 2015B bonds provide resources for three separate construction and renovation projects on the University campus. These projects include two residence facilities occupied by campus Greek organizations and construction of a high pressure pipeline to supply natural gas to the campus.
The proceeds from Series 2015C bonds along with a cash contribution from the University of $7.0 million were used to fund an escrow account set up to pay the principal, due November 1, 2015, of the Various Facility Revenue Bonds (Fayetteville Campus), Refunding Series 2005B, and to redeem the Series 2005B bonds maturing thereafter in whole on November 1, 2015. Pulaski Technical College On July 1, 2015, the College issued $25.9 million in Student Tuition and Fee Revenue Refunding Bonds, Series 2015. The refinancing of Series 2004 and Series 2006 Tuition and Fees Revenue Bonds in the amounts of $13.6 million and $13.0 million, respectively, was approved by the Board of Trustees at its June 17, 2015, meeting. The purpose of the refunding was to take advantage of savings on debt service over the life of the bonds to create more cash flow for the college. The original Series 2004 and Series 2006 funded the Campus Center, the Little Rock South and the Little Rock West locations.
135
Ozarka College On August 6, 2015, Ozarka College issued Student Tuition and Fee Revenue Refunding Bonds, Series 2015, for the amount of $3.2 million. The bonds were issued to refund the Series 2002 bonds. The 2002 bonds were issued to finance the construction of the facilities in Ash Flat and Mountain View and to make renovations to the main campus in Melbourne.
Office of the Arkansas Lottery At the request of the Arkansas Department of Higher Education (ADHE), on September 11, 2015, and September 30, 2015, payments of $33.0 million and $9.0 million, respectively, were made from the Education Trust Account to ADHE for payment of scholarships.


Required Supplementary Information

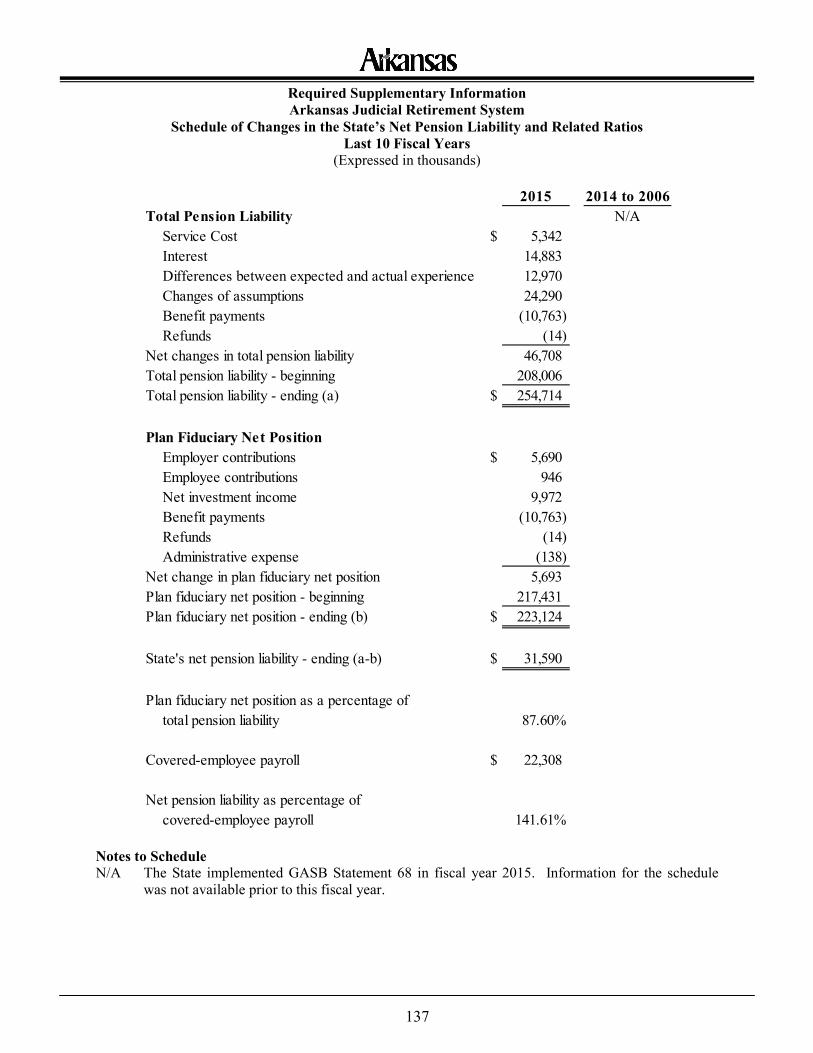
137
Required Supplementary Information Arkansas Judicial Retirement System
Schedule of Changes in the State’s Net Pension Liability and Related Ratios Last 10 Fiscal Years
(Expressed in thousands)
Notes to Schedule N/A The State implemented GASB Statement 68 in fiscal year 2015. Information for the schedule
was not available prior to this fiscal year.
2015 2014 to 2006Total Pension Liability N/A
Service Cost $ 5,342Interest 14,883Differences between expected and actual experience 12,970Changes of assumptions 24,290Benefit payments (10,763)Refunds (14)
Net changes in total pension liability 46,708Total pension liability - beginning 208,006Total pension liability - ending (a) $ 254,714
Plan Fiduciary Net PositionEmployer contributions $ 5,690Employee contributions 946Net investment income 9,972Benefit payments (10,763)Refunds (14)Administrative expense (138)
Net change in plan fiduciary net position 5,693Plan fiduciary net position - beginning 217,431Plan fiduciary net position - ending (b) $ 223,124
State's net pension liability - ending (a-b) $ 31,590
Plan fiduciary net position as a percentage oftotal pension liability 87.60%
Covered-employee payroll $ 22,308
Net pension liability as percentage ofcovered-employee payroll 141.61%
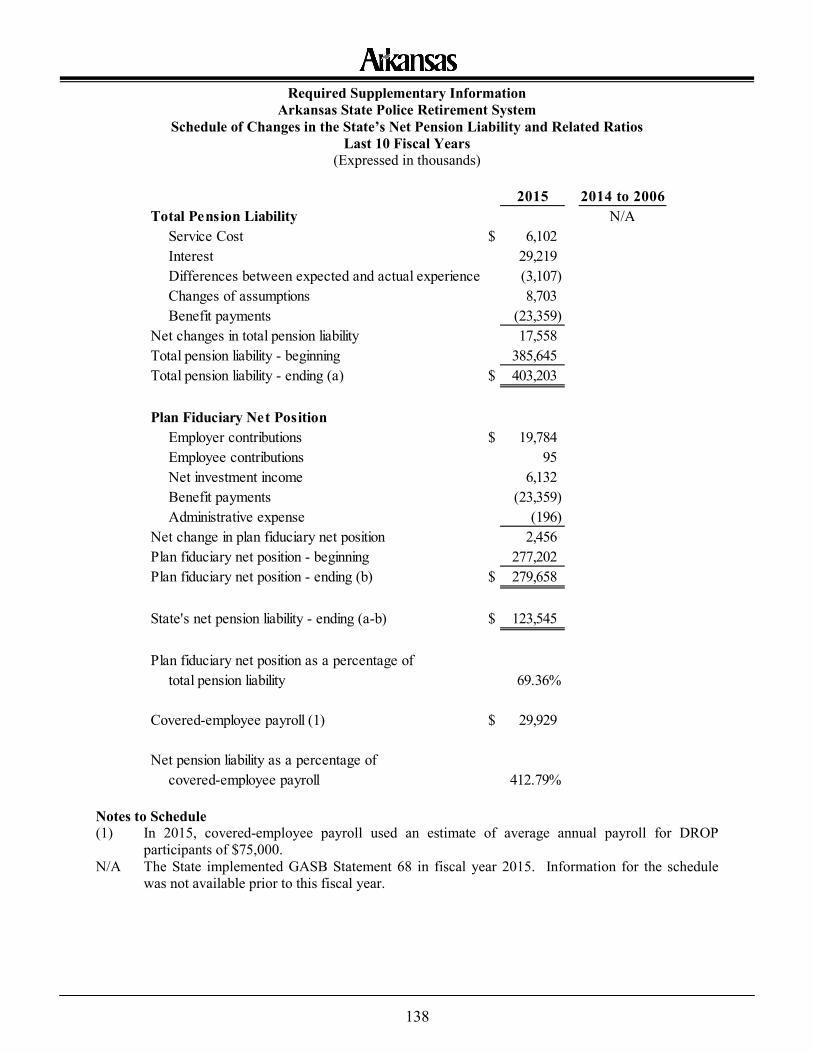
138
Required Supplementary Information Arkansas State Police Retirement System
Schedule of Changes in the State’s Net Pension Liability and Related Ratios Last 10 Fiscal Years
(Expressed in thousands)
Notes to Schedule (1) In 2015, covered-employee payroll used an estimate of average annual payroll for DROP
participants of $75,000. N/A The State implemented GASB Statement 68 in fiscal year 2015. Information for the schedule
was not available prior to this fiscal year.
2015 2014 to 2006Total Pension Liability N/A
Service Cost $ 6,102Interest 29,219Differences between expected and actual experience (3,107)Changes of assumptions 8,703Benefit payments (23,359)
Net changes in total pension liability 17,558Total pension liability - beginning 385,645Total pension liability - ending (a) $ 403,203
Plan Fiduciary Net PositionEmployer contributions $ 19,784Employee contributions 95Net investment income 6,132Benefit payments (23,359)Administrative expense (196)
Net change in plan fiduciary net position 2,456Plan fiduciary net position - beginning 277,202Plan fiduciary net position - ending (b) $ 279,658
State's net pension liability - ending (a-b) $ 123,545
Plan fiduciary net position as a percentage oftotal pension liability 69.36%
Covered-employee payroll (1) $ 29,929
Net pension liability as a percentage ofcovered-employee payroll 412.79%
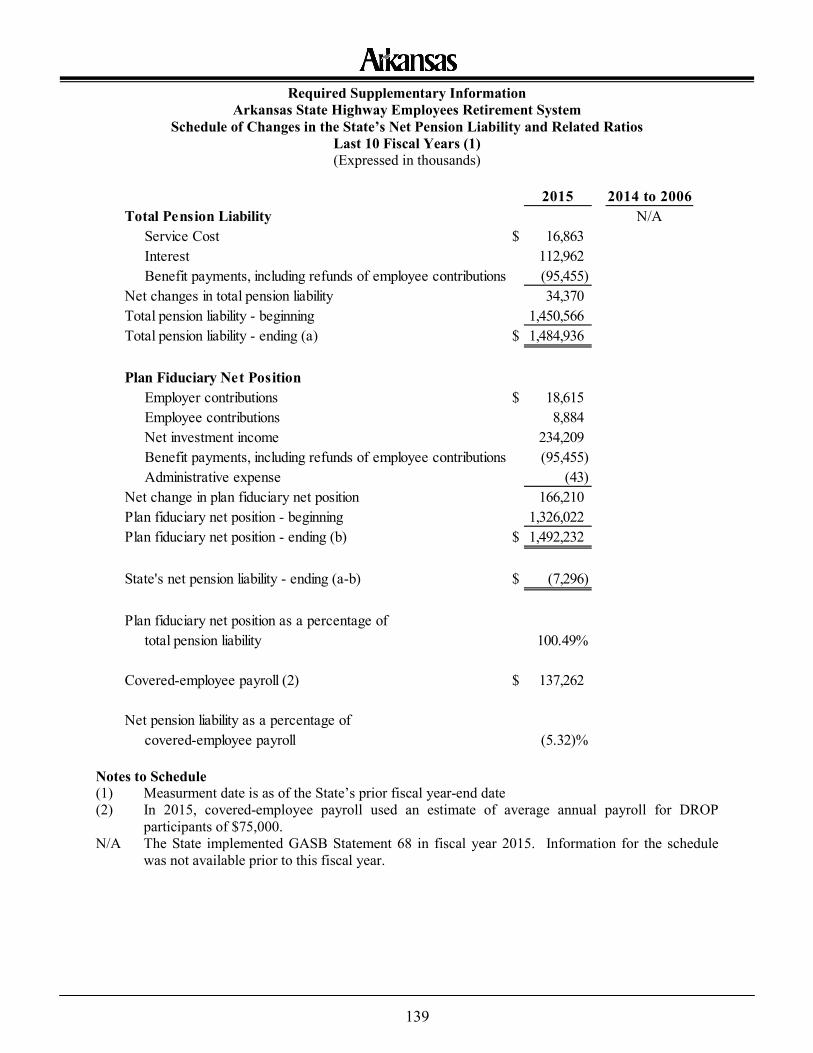
139
Required Supplementary Information Arkansas State Highway Employees Retirement System
Schedule of Changes in the State’s Net Pension Liability and Related Ratios Last 10 Fiscal Years (1) (Expressed in thousands)
Notes to Schedule (1) Measurment date is as of the State’s prior fiscal year-end date (2) In 2015, covered-employee payroll used an estimate of average annual payroll for DROP
participants of $75,000. N/A The State implemented GASB Statement 68 in fiscal year 2015. Information for the schedule
was not available prior to this fiscal year.
2015 2014 to 2006Total Pension Liability N/A
Service Cost $ 16,863Interest 112,962Benefit payments, including refunds of employee contributions (95,455)
Net changes in total pension liability 34,370Total pension liability - beginning 1,450,566Total pension liability - ending (a) $ 1,484,936
Plan Fiduciary Net PositionEmployer contributions $ 18,615Employee contributions 8,884Net investment income 234,209Benefit payments, including refunds of employee contributions (95,455)Administrative expense (43)
Net change in plan fiduciary net position 166,210Plan fiduciary net position - beginning 1,326,022Plan fiduciary net position - ending (b) $ 1,492,232
State's net pension liability - ending (a-b) $ (7,296)
Plan fiduciary net position as a percentage oftotal pension liability 100.49%
Covered-employee payroll (2) $ 137,262
Net pension liability as a percentage ofcovered-employee payroll (5.32)%
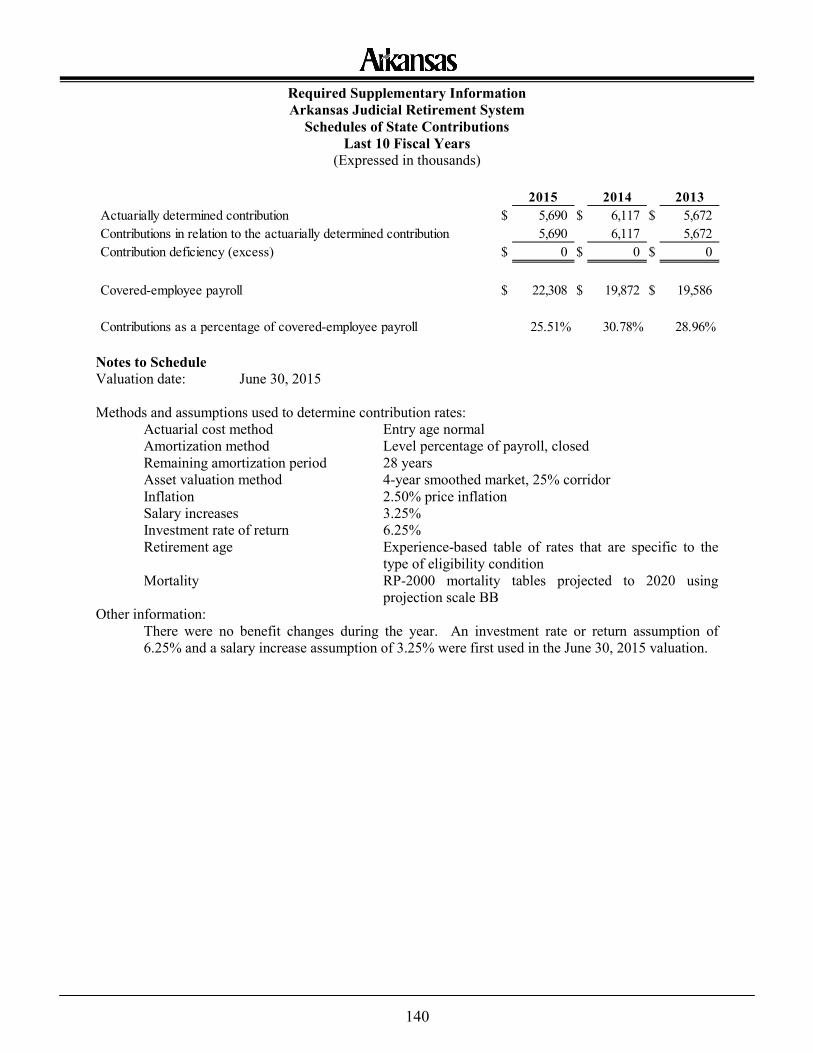
140
Required Supplementary Information Arkansas Judicial Retirement System
Schedules of State Contributions Last 10 Fiscal Years
(Expressed in thousands)
Notes to Schedule Valuation date: June 30, 2015 Methods and assumptions used to determine contribution rates: Actuarial cost method Entry age normal Amortization method Level percentage of payroll, closed Remaining amortization period 28 years
Asset valuation method 4-year smoothed market, 25% corridor Inflation 2.50% price inflation Salary increases 3.25% Investment rate of return 6.25% Retirement age Experience-based table of rates that are specific to the
type of eligibility condition Mortality RP-2000 mortality tables projected to 2020 using
projection scale BB Other information:
There were no benefit changes during the year. An investment rate or return assumption of 6.25% and a salary increase assumption of 3.25% were first used in the June 30, 2015 valuation.
2015 2014 2013Actuarially determined contribution $ 5,690 $ 6,117 $ 5,672Contributions in relation to the actuarially determined contribution 5,690 6,117 5,672Contribution deficiency (excess) $ 0 $ 0 $ 0
Covered-employee payroll $ 22,308 $ 19,872 $ 19,586
Contributions as a percentage of covered-employee payroll 25.51% 30.78% 28.96%
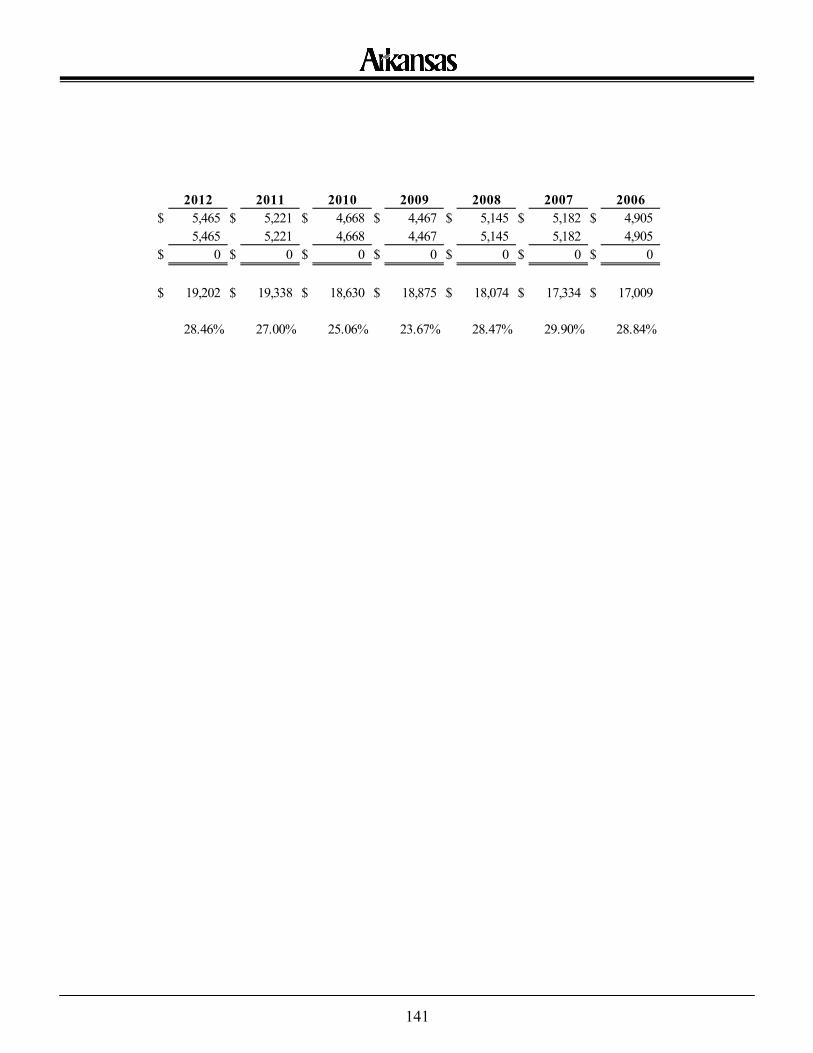
141
2012 2011 2010 2009 2008 2007 2006$ 5,465 $ 5,221 $ 4,668 $ 4,467 $ 5,145 $ 5,182 $ 4,905
5,465 5,221 4,668 4,467 5,145 5,182 4,905$ 0 $ 0 $ 0 $ 0 $ 0 $ 0 $ 0
$ 19,202 $ 19,338 $ 18,630 $ 18,875 $ 18,074 $ 17,334 $ 17,009
28.46% 27.00% 25.06% 23.67% 28.47% 29.90% 28.84%
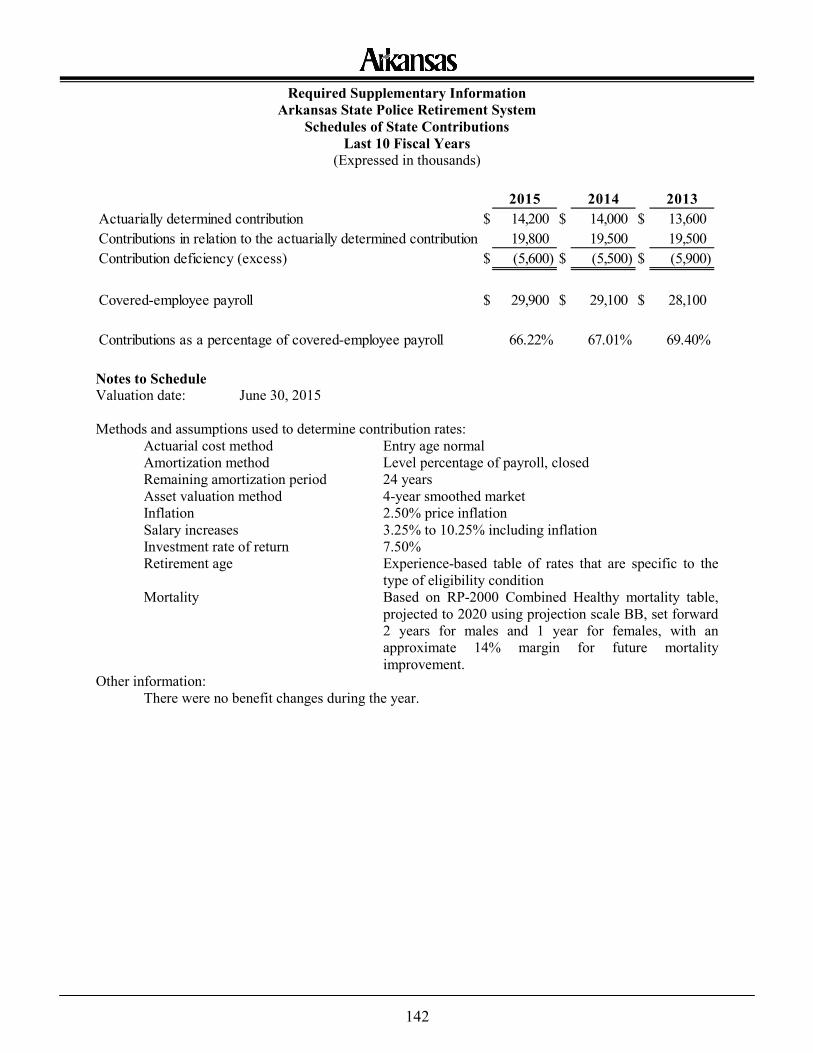
142
Required Supplementary Information Arkansas State Police Retirement System
Schedules of State Contributions Last 10 Fiscal Years
(Expressed in thousands)
Notes to Schedule Valuation date: June 30, 2015 Methods and assumptions used to determine contribution rates: Actuarial cost method Entry age normal Amortization method Level percentage of payroll, closed Remaining amortization period 24 years
Asset valuation method 4-year smoothed market Inflation 2.50% price inflation Salary increases 3.25% to 10.25% including inflation Investment rate of return 7.50% Retirement age Experience-based table of rates that are specific to the
type of eligibility condition Mortality Based on RP-2000 Combined Healthy mortality table,
projected to 2020 using projection scale BB, set forward 2 years for males and 1 year for females, with an approximate 14% margin for future mortality improvement.
Other information: There were no benefit changes during the year.
2015 2014 2013Actuarially determined contribution $ 14,200 $ 14,000 $ 13,600Contributions in relation to the actuarially determined contribution 19,800 19,500 19,500Contribution deficiency (excess) $ (5,600) $ (5,500) $ (5,900)
Covered-employee payroll $ 29,900 $ 29,100 $ 28,100
Contributions as a percentage of covered-employee payroll 66.22% 67.01% 69.40%
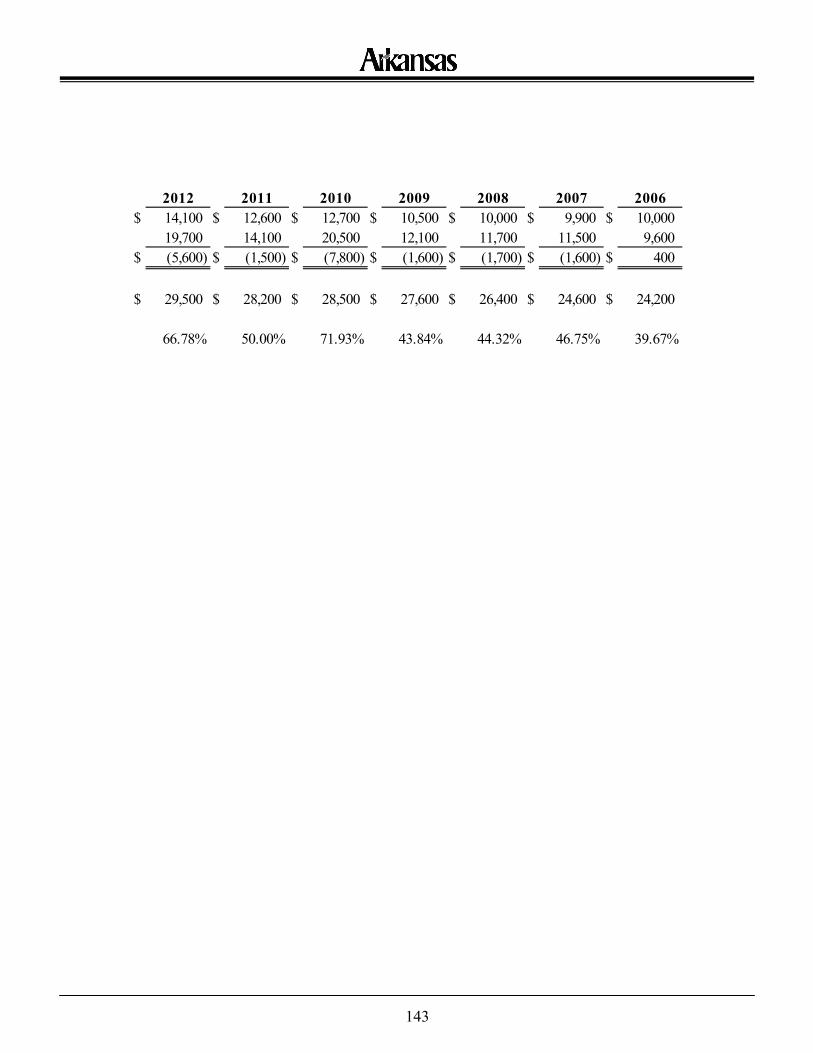
143
2012 2011 2010 2009 2008 2007 2006$ 14,100 $ 12,600 $ 12,700 $ 10,500 $ 10,000 $ 9,900 $ 10,000
19,700 14,100 20,500 12,100 11,700 11,500 9,600$ (5,600) $ (1,500) $ (7,800) $ (1,600) $ (1,700) $ (1,600) $ 400
$ 29,500 $ 28,200 $ 28,500 $ 27,600 $ 26,400 $ 24,600 $ 24,200
66.78% 50.00% 71.93% 43.84% 44.32% 46.75% 39.67%

144
Required Supplementary Information Arkansas State Highway Employees Retirement System
Schedule of State Contributions Last 10 Fiscal Years
(Expressed in thousands)
Notes to Schedule N/A The State implemented GASB Statement 68 in fiscal year 2015. Information for the schedule
was not available prior to this fiscal year.
2015 2014 2013 to 2006Statutorily determined contribution $ 19,059 $ 18,615 N/AContributions in relation to the statutorily determined contribution 19,059 18,615Contribution deficiency (excess) $ 0 $ 0
Covered-employee payroll $ 140,544 $ 137,262
Contributions as a percentage of covered-employee payroll 13.56% 13.56%
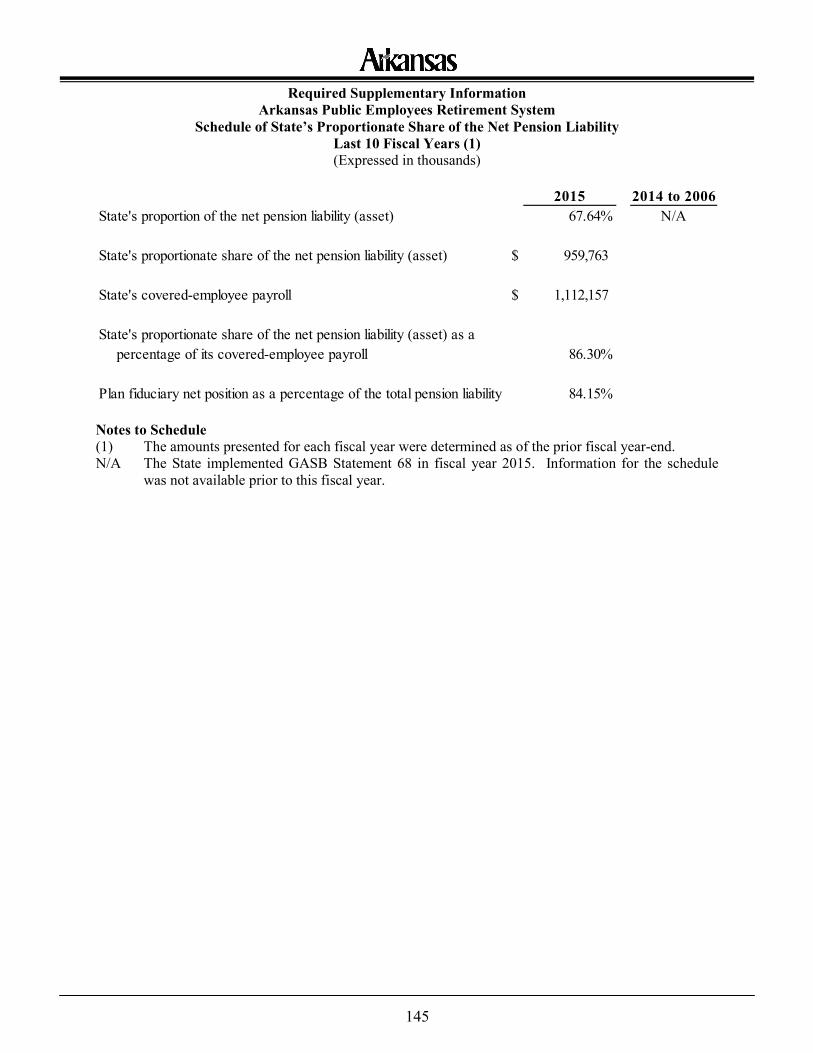
145
Required Supplementary Information Arkansas Public Employees Retirement System
Schedule of State’s Proportionate Share of the Net Pension Liability Last 10 Fiscal Years (1) (Expressed in thousands)
Notes to Schedule (1) The amounts presented for each fiscal year were determined as of the prior fiscal year-end. N/A The State implemented GASB Statement 68 in fiscal year 2015. Information for the schedule
was not available prior to this fiscal year.
2015 2014 to 2006State's proportion of the net pension liability (asset) 67.64% N/A
State's proportionate share of the net pension liability (asset) $ 959,763
State's covered-employee payroll $ 1,112,157
State's proportionate share of the net pension liability (asset) as apercentage of its covered-employee payroll 86.30%
Plan fiduciary net position as a percentage of the total pension liability 84.15%
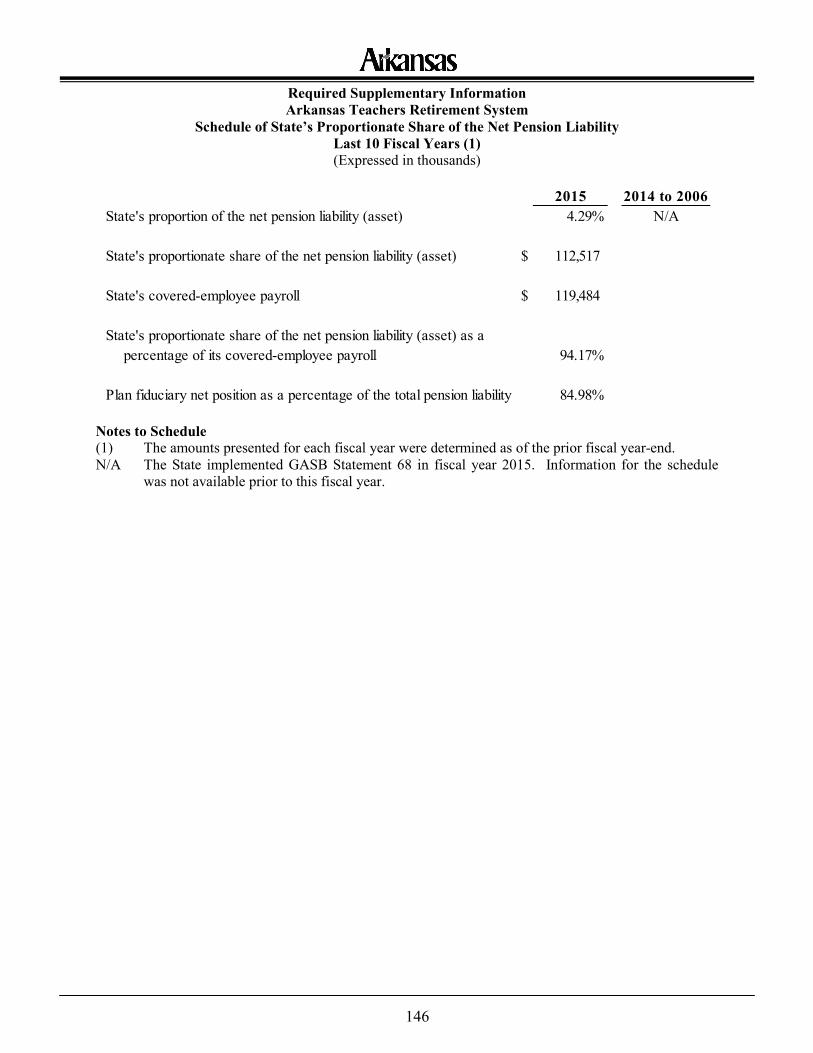
146
Required Supplementary Information Arkansas Teachers Retirement System
Schedule of State’s Proportionate Share of the Net Pension Liability Last 10 Fiscal Years (1) (Expressed in thousands)
Notes to Schedule (1) The amounts presented for each fiscal year were determined as of the prior fiscal year-end. N/A The State implemented GASB Statement 68 in fiscal year 2015. Information for the schedule
was not available prior to this fiscal year.
2015 2014 to 2006State's proportion of the net pension liability (asset) 4.29% N/A
State's proportionate share of the net pension liability (asset) $ 112,517
State's covered-employee payroll $ 119,484
State's proportionate share of the net pension liability (asset) as apercentage of its covered-employee payroll 94.17%
Plan fiduciary net position as a percentage of the total pension liability 84.98%
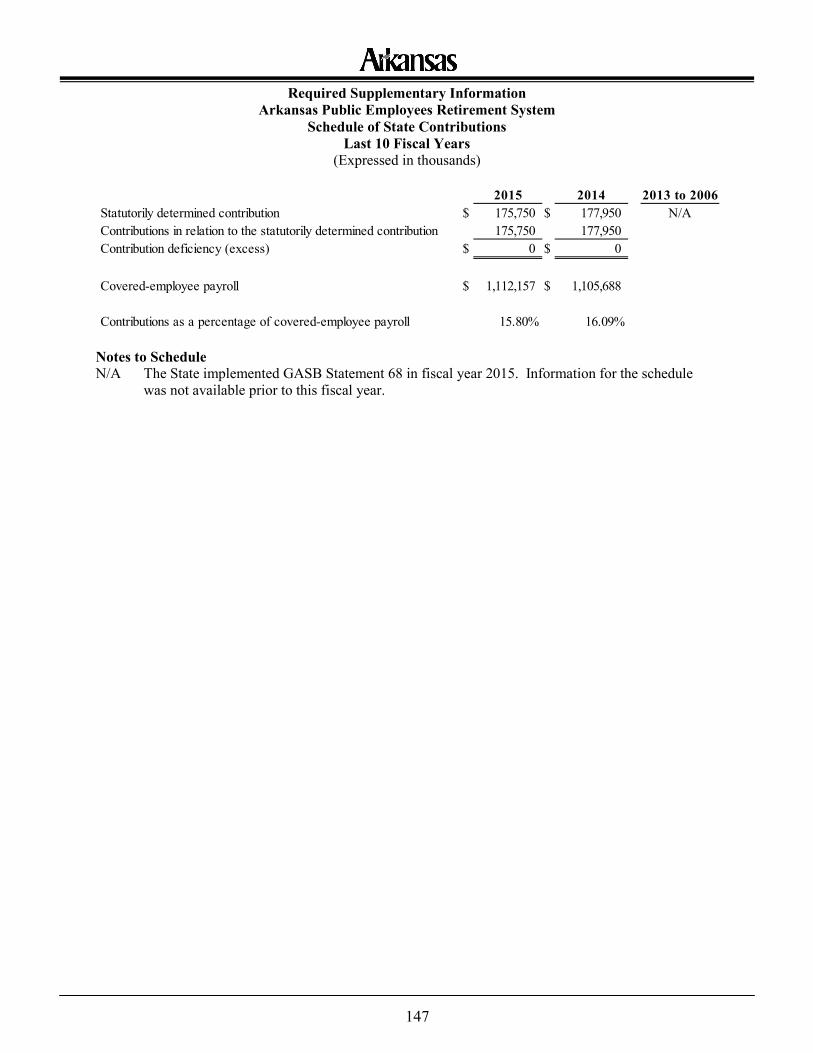
147
Required Supplementary Information Arkansas Public Employees Retirement System
Schedule of State Contributions Last 10 Fiscal Years
(Expressed in thousands)
Notes to Schedule N/A The State implemented GASB Statement 68 in fiscal year 2015. Information for the schedule
was not available prior to this fiscal year.
2015 2014 2013 to 2006Statutorily determined contribution $ 175,750 $ 177,950 N/AContributions in relation to the statutorily determined contribution 175,750 177,950Contribution deficiency (excess) $ 0 $ 0
Covered-employee payroll $ 1,112,157 $ 1,105,688
Contributions as a percentage of covered-employee payroll 15.80% 16.09%
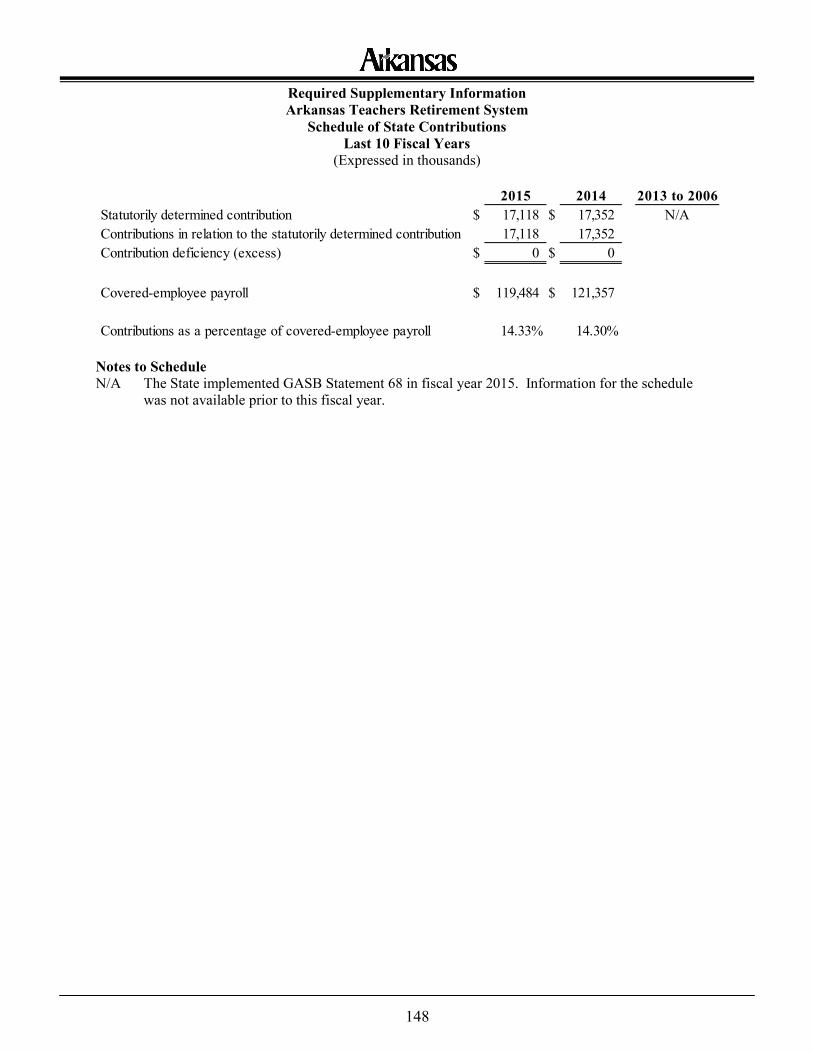
148
Required Supplementary Information Arkansas Teachers Retirement System
Schedule of State Contributions Last 10 Fiscal Years
(Expressed in thousands)
Notes to Schedule N/A The State implemented GASB Statement 68 in fiscal year 2015. Information for the schedule
was not available prior to this fiscal year.
2015 2014 2013 to 2006Statutorily determined contribution $ 17,118 $ 17,352 N/AContributions in relation to the statutorily determined contribution 17,118 17,352Contribution deficiency (excess) $ 0 $ 0
Covered-employee payroll $ 119,484 $ 121,357
Contributions as a percentage of covered-employee payroll 14.33% 14.30%
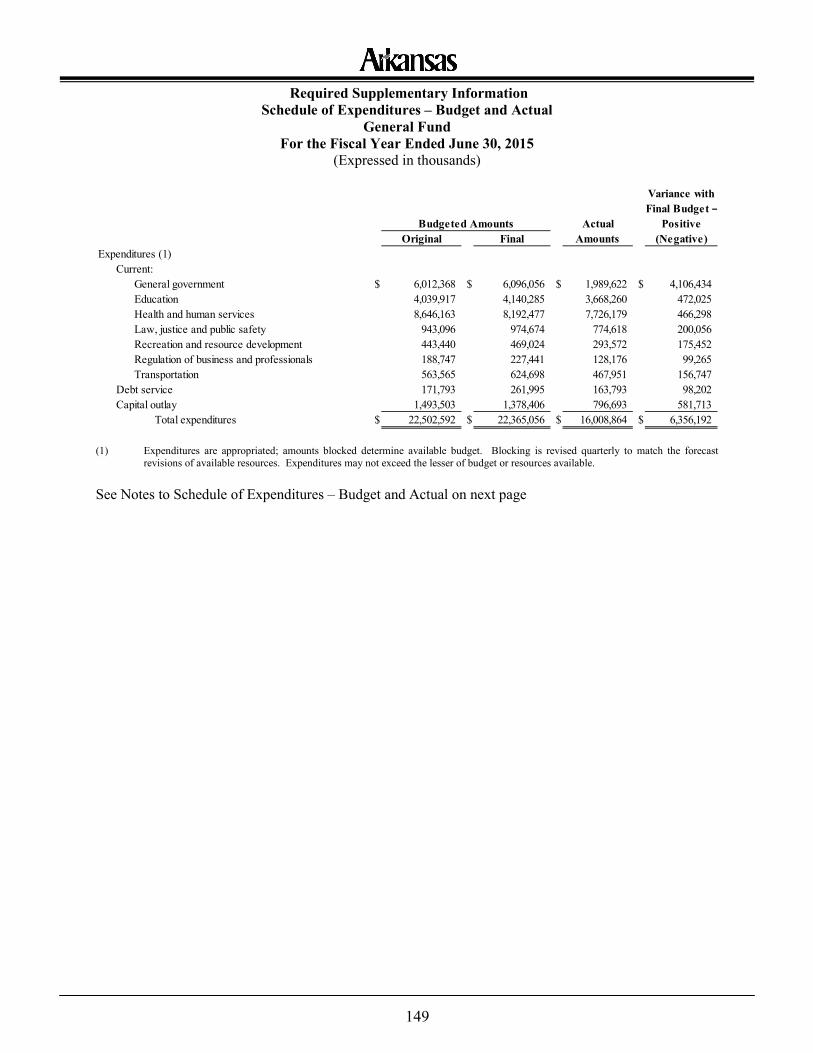
149
Required Supplementary Information Schedule of Expenditures – Budget and Actual
General Fund For the Fiscal Year Ended June 30, 2015
(Expressed in thousands)
(1) Expenditures are appropriated; amounts blocked determine available budget. Blocking is revised quarterly to match the forecast
revisions of available resources. Expenditures may not exceed the lesser of budget or resources available.
See Notes to Schedule of Expenditures – Budget and Actual on next page
Variance withFinal Budget –
Actual PositiveOriginal Final Amounts (Negative)
Expenditures (1)Current:
General government $ 6,012,368 $ 6,096,056 $ 1,989,622 $ 4,106,434Education 4,039,917 4,140,285 3,668,260 472,025Health and human services 8,646,163 8,192,477 7,726,179 466,298Law, justice and public safety 943,096 974,674 774,618 200,056Recreation and resource development 443,440 469,024 293,572 175,452Regulation of business and professionals 188,747 227,441 128,176 99,265Transportation 563,565 624,698 467,951 156,747
Debt service 171,793 261,995 163,793 98,202Capital outlay 1,493,503 1,378,406 796,693 581,713
Total expenditures $ 22,502,592 $ 22,365,056 $ 16,008,864 $ 6,356,192
Budgeted Amounts
150
Required Supplementary Information Notes to Schedule of Expenditures – Budget and Actual
General Fund For the Fiscal Year Ended June 30, 2015
(a) Budgetary Basis of Accounting
The State’s budget is adopted in accordance with a statutory cash basis of accounting, which is not in accordance with Generally Accepted Accounting Principles (GAAP). Revenues are recognized when cash is received and deposited in the State Treasury or reported to the Department of Finance and Administration (DFA). Expenditures are recorded when cash is disbursed. If goods or services are not received before year end, all encumbrances lapse, except those appropriations for multi-year projects.
(b) Budgetary Basis Reporting – Budgetary Process
State finance law requires that a balanced line item expenditure budget be approved by the Governor and the General Assembly. The Governor presents an annual budget to the General Assembly. The General Assembly, which has full authority to amend the budget, adopts a line item expenditure budget by appropriating monies in annual appropriation acts. Before signing the appropriation act, the Governor may veto any specific item, subject to legislative override. The original appropriation may be adjusted by several items subsequent to the appropriation act. The adjustment items may be supplemental appropriations or subsequent legislative acts, revisions to the forecast of available resources, restrictions on spending by Executive Order and carryforward provisions. The State does not adopt a revenue budget but does monitor the available resources and forecast of available resources and makes appropriate revisions to the line item expenditure budget based on such forecasts. These forecasts are adjusted quarterly to reflect actual receipts of resources. The General Assembly also must enact legislation pursuant to the Revenue Stabilization Law (the Stabilization Law) to provide an allotment process of funding line item expenditure appropriations in order to comply with the State law prohibiting deficit spending. The Governor may restrict spending to a level below appropriation amounts. The State uses specific funds (i.e., general and special revenue allotment accounts) for receipt and distribution of revenues. Pursuant to the Stabilization Law, all general revenue receipts are deposited in the General Revenue Allotment Account. From the General Revenue Allotment Account, 3% of all revenues are distributed to the Constitutional Officers Fund and the Central Services Fund to provide support for the State’s elected constitutional offices (legislators, executive department and judges), their staffs and the DFA. The balance, net of income tax refunds, court settlement arrangements, etc., is then distributed to separate funds proportionately as established by the Stabilization Law. Special revenues are deposited into the Special Revenue Allotment Account from which 3% of revenues collected by the DFA and 1½% of all special revenues collected by other agencies are first distributed to support the State’s elected officials, their staffs and the DFA. The balance is then distributed to the funds for which the special revenues were collected as provided by law. Special revenues, which are primarily user taxes, are generally earmarked for the program or agency providing the related service. General revenues are transferred into funds established and maintained by the Treasurer for major programs and agencies of the State in accordance with the General Revenue Allotment Account funding priorities established by the General Assembly.
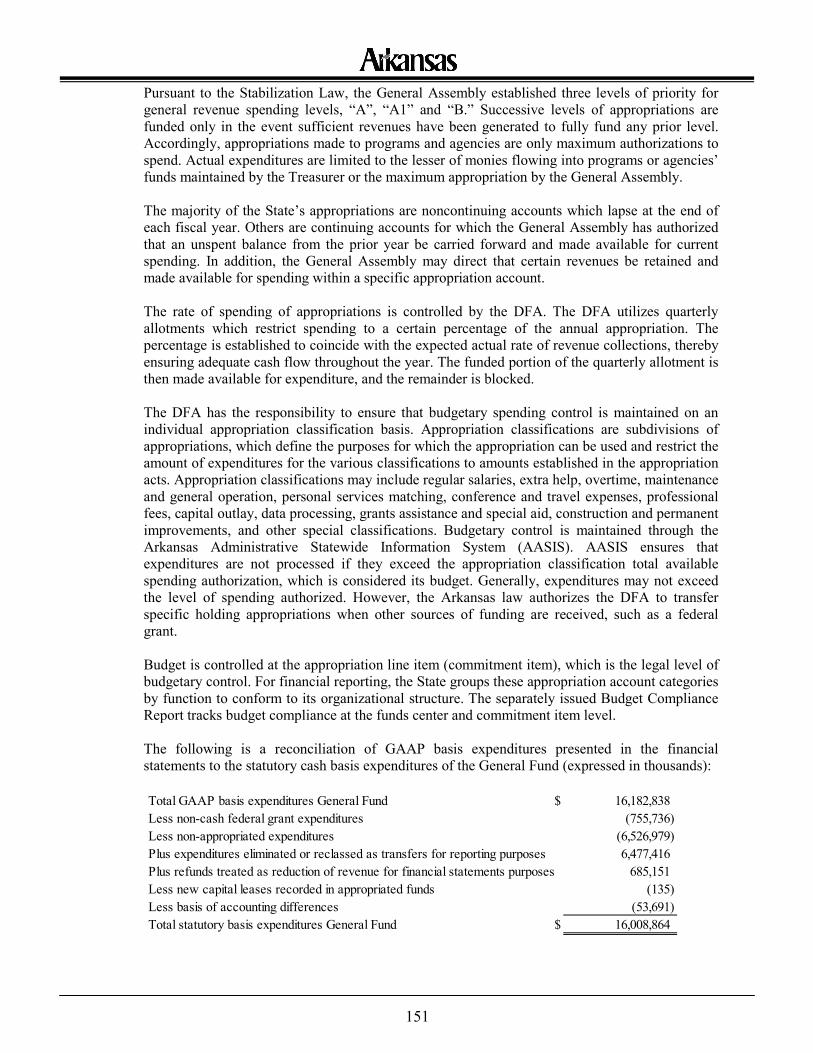
151
Pursuant to the Stabilization Law, the General Assembly established three levels of priority for general revenue spending levels, “A”, “A1” and “B.” Successive levels of appropriations are funded only in the event sufficient revenues have been generated to fully fund any prior level. Accordingly, appropriations made to programs and agencies are only maximum authorizations to spend. Actual expenditures are limited to the lesser of monies flowing into programs or agencies’ funds maintained by the Treasurer or the maximum appropriation by the General Assembly. The majority of the State’s appropriations are noncontinuing accounts which lapse at the end of each fiscal year. Others are continuing accounts for which the General Assembly has authorized that an unspent balance from the prior year be carried forward and made available for current spending. In addition, the General Assembly may direct that certain revenues be retained and made available for spending within a specific appropriation account. The rate of spending of appropriations is controlled by the DFA. The DFA utilizes quarterly allotments which restrict spending to a certain percentage of the annual appropriation. The percentage is established to coincide with the expected actual rate of revenue collections, thereby ensuring adequate cash flow throughout the year. The funded portion of the quarterly allotment is then made available for expenditure, and the remainder is blocked. The DFA has the responsibility to ensure that budgetary spending control is maintained on an individual appropriation classification basis. Appropriation classifications are subdivisions of appropriations, which define the purposes for which the appropriation can be used and restrict the amount of expenditures for the various classifications to amounts established in the appropriation acts. Appropriation classifications may include regular salaries, extra help, overtime, maintenance and general operation, personal services matching, conference and travel expenses, professional fees, capital outlay, data processing, grants assistance and special aid, construction and permanent improvements, and other special classifications. Budgetary control is maintained through the Arkansas Administrative Statewide Information System (AASIS). AASIS ensures that expenditures are not processed if they exceed the appropriation classification total available spending authorization, which is considered its budget. Generally, expenditures may not exceed the level of spending authorized. However, the Arkansas law authorizes the DFA to transfer specific holding appropriations when other sources of funding are received, such as a federal grant. Budget is controlled at the appropriation line item (commitment item), which is the legal level of budgetary control. For financial reporting, the State groups these appropriation account categories by function to conform to its organizational structure. The separately issued Budget Compliance Report tracks budget compliance at the funds center and commitment item level. The following is a reconciliation of GAAP basis expenditures presented in the financial statements to the statutory cash basis expenditures of the General Fund (expressed in thousands):
Total GAAP basis expenditures General Fund $ 16,182,838Less non-cash federal grant expenditures (755,736)Less non-appropriated expenditures (6,526,979)Plus expenditures eliminated or reclassed as transfers for reporting purposes 6,477,416Plus refunds treated as reduction of revenue for financial statements purposes 685,151Less new capital leases recorded in appropriated funds (135)Less basis of accounting differences (53,691)Total statutory basis expenditures General Fund $ 16,008,864
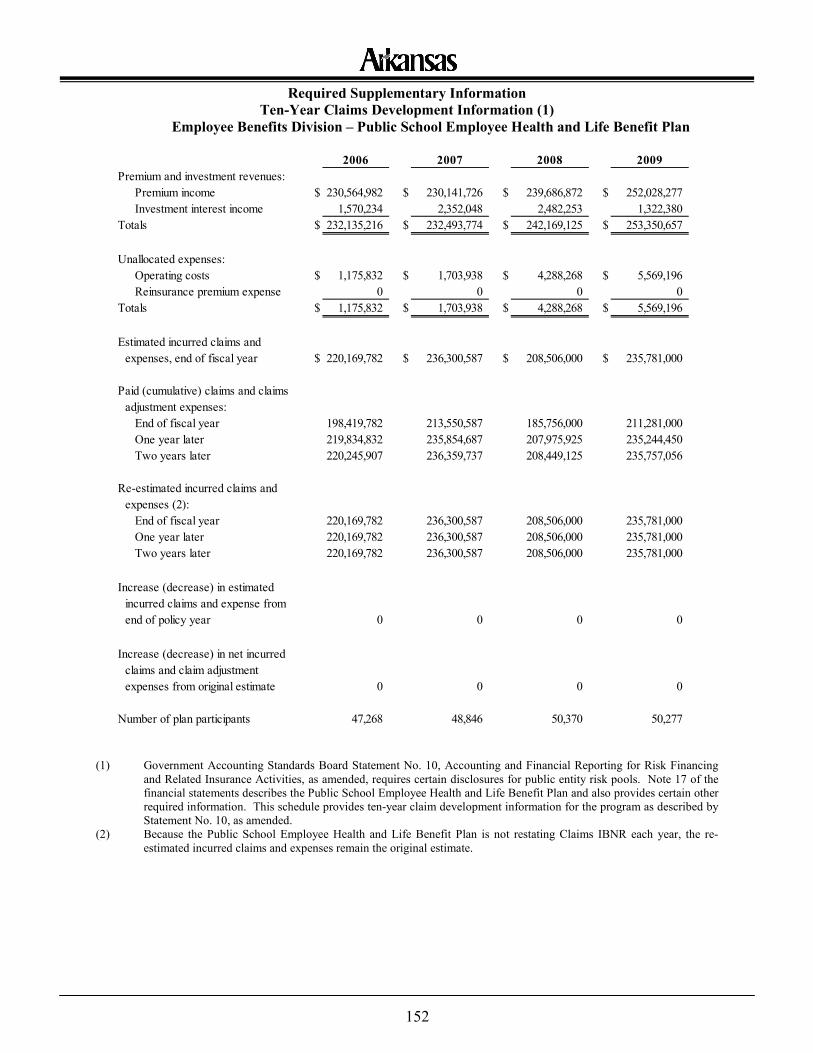
152
Required Supplementary Information Ten-Year Claims Development Information (1)
Employee Benefits Division – Public School Employee Health and Life Benefit Plan
(1) Government Accounting Standards Board Statement No. 10, Accounting and Financial Reporting for Risk Financing and Related Insurance Activities, as amended, requires certain disclosures for public entity risk pools. Note 17 of the financial statements describes the Public School Employee Health and Life Benefit Plan and also provides certain other required information. This schedule provides ten-year claim development information for the program as described by Statement No. 10, as amended.
(2) Because the Public School Employee Health and Life Benefit Plan is not restating Claims IBNR each year, the re-estimated incurred claims and expenses remain the original estimate.
2006 2007 2008 2009Premium and investment revenues:
Premium income $ 230,564,982 $ 230,141,726 $ 239,686,872 $ 252,028,277Investment interest income 1,570,234 2,352,048 2,482,253 1,322,380
Totals $ 232,135,216 $ 232,493,774 $ 242,169,125 $ 253,350,657
Unallocated expenses:Operating costs $ 1,175,832 $ 1,703,938 $ 4,288,268 $ 5,569,196Reinsurance premium expense 0 0 0 0
Totals $ 1,175,832 $ 1,703,938 $ 4,288,268 $ 5,569,196
$ 220,169,782 $ 236,300,587 $ 208,506,000 $ 235,781,000
End of fiscal year 198,419,782 213,550,587 185,756,000 211,281,000One year later 219,834,832 235,854,687 207,975,925 235,244,450Two years later 220,245,907 236,359,737 208,449,125 235,757,056
End of fiscal year 220,169,782 236,300,587 208,506,000 235,781,000One year later 220,169,782 236,300,587 208,506,000 235,781,000Two years later 220,169,782 236,300,587 208,506,000 235,781,000
0 0 0 0
0 0 0 0
Number of plan participants 47,268 48,846 50,370 50,277
Re-estimated incurred claims and □expenses (2):
Increase (decrease) in estimated □incurred claims and expense from □end of policy year
Increase (decrease) in net incurred □claims and claim adjustment □expenses from original estimate
Estimated incurred claims and □expenses, end of fiscal year
Paid (cumulative) claims and claims □adjustment expenses:
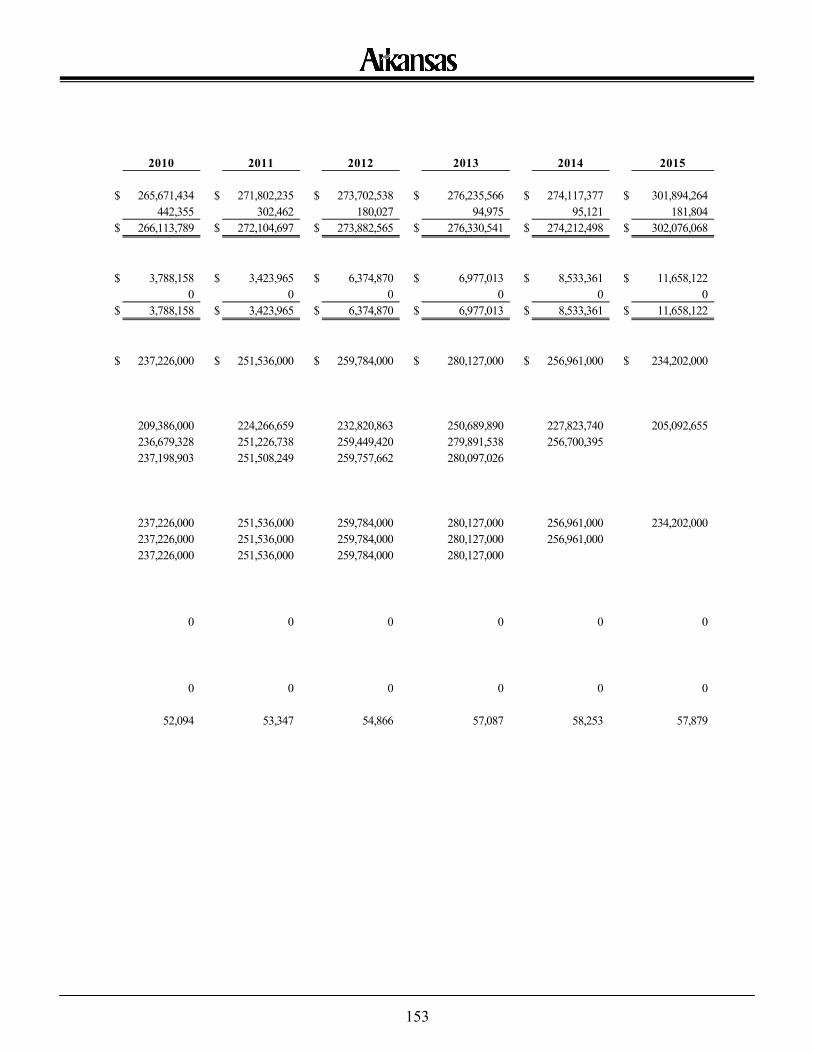
153
2010 2011 2012 2013 2014 2015
$ 265,671,434 $ 271,802,235 $ 273,702,538 $ 276,235,566 $ 274,117,377 $ 301,894,264442,355 302,462 180,027 94,975 95,121 181,804
$ 266,113,789 $ 272,104,697 $ 273,882,565 $ 276,330,541 $ 274,212,498 $ 302,076,068
$ 3,788,158 $ 3,423,965 $ 6,374,870 $ 6,977,013 $ 8,533,361 $ 11,658,1220 0 0 0 0 0
$ 3,788,158 $ 3,423,965 $ 6,374,870 $ 6,977,013 $ 8,533,361 $ 11,658,122
$ 237,226,000 $ 251,536,000 $ 259,784,000 $ 280,127,000 $ 256,961,000 $ 234,202,000
209,386,000 224,266,659 232,820,863 250,689,890 227,823,740 205,092,655236,679,328 251,226,738 259,449,420 279,891,538 256,700,395237,198,903 251,508,249 259,757,662 280,097,026
237,226,000 251,536,000 259,784,000 280,127,000 256,961,000 234,202,000237,226,000 251,536,000 259,784,000 280,127,000 256,961,000237,226,000 251,536,000 259,784,000 280,127,000
0 0 0 0 0 0
0 0 0 0 0 0
52,094 53,347 54,866 57,087 58,253 57,879
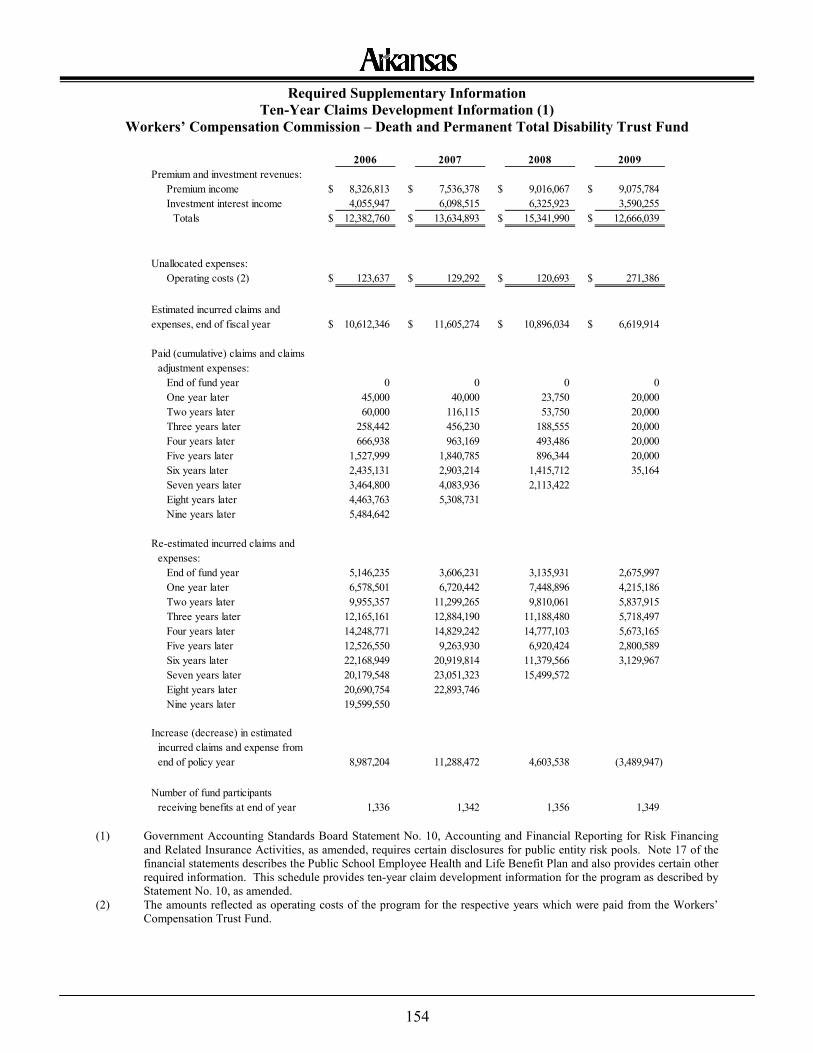
154
Required Supplementary Information Ten-Year Claims Development Information (1)
Workers’ Compensation Commission – Death and Permanent Total Disability Trust Fund
(1) Government Accounting Standards Board Statement No. 10, Accounting and Financial Reporting for Risk Financing
and Related Insurance Activities, as amended, requires certain disclosures for public entity risk pools. Note 17 of the financial statements describes the Public School Employee Health and Life Benefit Plan and also provides certain other required information. This schedule provides ten-year claim development information for the program as described by Statement No. 10, as amended.
(2) The amounts reflected as operating costs of the program for the respective years which were paid from the Workers’ Compensation Trust Fund.
2006 2007 2008 2009Premium and investment revenues:
Premium income $ 8,326,813 $ 7,536,378 $ 9,016,067 $ 9,075,784Investment interest income 4,055,947 6,098,515 6,325,923 3,590,255
Totals $ 12,382,760 $ 13,634,893 $ 15,341,990 $ 12,666,039
Unallocated expenses:Operating costs (2) $ 123,637 $ 129,292 $ 120,693 $ 271,386
$ 10,612,346 $ 11,605,274 $ 10,896,034 $ 6,619,914
End of fund year 0 0 0 0One year later 45,000 40,000 23,750 20,000Two years later 60,000 116,115 53,750 20,000Three years later 258,442 456,230 188,555 20,000Four years later 666,938 963,169 493,486 20,000Five years later 1,527,999 1,840,785 896,344 20,000Six years later 2,435,131 2,903,214 1,415,712 35,164Seven years later 3,464,800 4,083,936 2,113,422Eight years later 4,463,763 5,308,731Nine years later 5,484,642
End of fund year 5,146,235 3,606,231 3,135,931 2,675,997One year later 6,578,501 6,720,442 7,448,896 4,215,186Two years later 9,955,357 11,299,265 9,810,061 5,837,915Three years later 12,165,161 12,884,190 11,188,480 5,718,497Four years later 14,248,771 14,829,242 14,777,103 5,673,165Five years later 12,526,550 9,263,930 6,920,424 2,800,589Six years later 22,168,949 20,919,814 11,379,566 3,129,967Seven years later 20,179,548 23,051,323 15,499,572Eight years later 20,690,754 22,893,746Nine years later 19,599,550
8,987,204 11,288,472 4,603,538 (3,489,947)
1,336 1,342 1,356 1,349
Increase (decrease) in estimated □incurred claims and expense from □end of policy year
Number of fund participants □receiving benefits at end of year
Estimated incurred claims and expenses, end of fiscal year
Paid (cumulative) claims and claims □adjustment expenses:
Re-estimated incurred claims and □expenses:
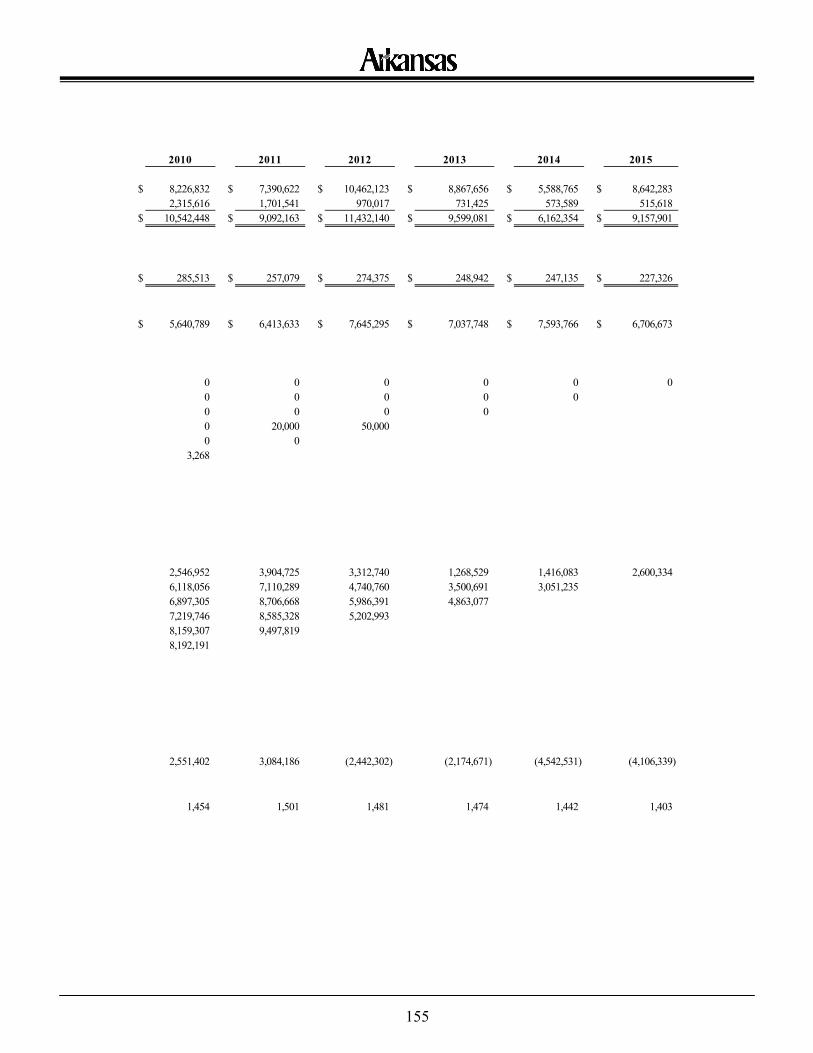
155
2010 2011 2012 2013 2014 2015
$ 8,226,832 $ 7,390,622 $ 10,462,123 $ 8,867,656 $ 5,588,765 $ 8,642,2832,315,616 1,701,541 970,017 731,425 573,589 515,618
$ 10,542,448 $ 9,092,163 $ 11,432,140 $ 9,599,081 $ 6,162,354 $ 9,157,901
$ 285,513 $ 257,079 $ 274,375 $ 248,942 $ 247,135 $ 227,326
$ 5,640,789 $ 6,413,633 $ 7,645,295 $ 7,037,748 $ 7,593,766 $ 6,706,673
0 0 0 0 0 00 0 0 0 00 0 0 00 20,000 50,0000 0
3,268
2,546,952 3,904,725 3,312,740 1,268,529 1,416,083 2,600,3346,118,056 7,110,289 4,740,760 3,500,691 3,051,2356,897,305 8,706,668 5,986,391 4,863,0777,219,746 8,585,328 5,202,9938,159,307 9,497,8198,192,191
2,551,402 3,084,186 (2,442,302) (2,174,671) (4,542,531) (4,106,339)
1,454 1,501 1,481 1,474 1,442 1,403
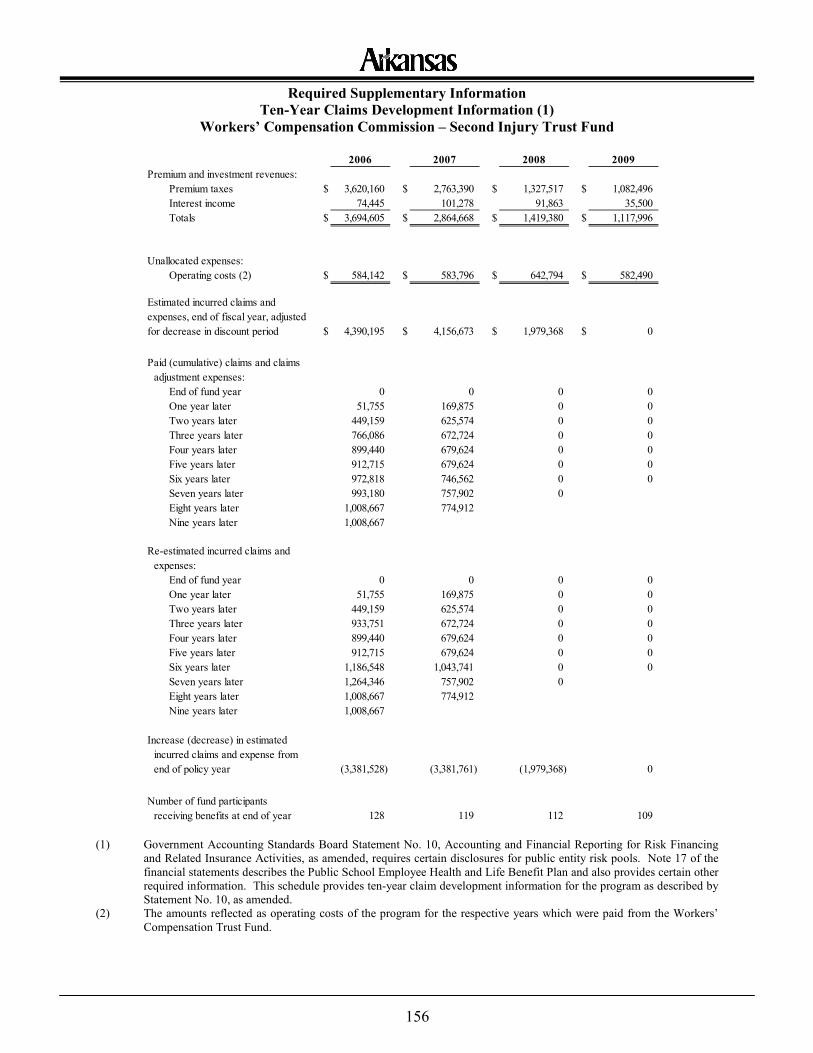
156
Required Supplementary Information Ten-Year Claims Development Information (1)
Workers’ Compensation Commission – Second Injury Trust Fund
(1) Government Accounting Standards Board Statement No. 10, Accounting and Financial Reporting for Risk Financing
and Related Insurance Activities, as amended, requires certain disclosures for public entity risk pools. Note 17 of the financial statements describes the Public School Employee Health and Life Benefit Plan and also provides certain other required information. This schedule provides ten-year claim development information for the program as described by Statement No. 10, as amended.
(2) The amounts reflected as operating costs of the program for the respective years which were paid from the Workers’ Compensation Trust Fund.
2006 2007 2008 2009Premium and investment revenues:
Premium taxes $ 3,620,160 $ 2,763,390 $ 1,327,517 $ 1,082,496Interest income 74,445 101,278 91,863 35,500Totals $ 3,694,605 $ 2,864,668 $ 1,419,380 $ 1,117,996
Unallocated expenses:Operating costs (2) $ 584,142 $ 583,796 $ 642,794 $ 582,490
$ 4,390,195 $ 4,156,673 $ 1,979,368 $ 0
End of fund year 0 0 0 0One year later 51,755 169,875 0 0Two years later 449,159 625,574 0 0Three years later 766,086 672,724 0 0Four years later 899,440 679,624 0 0Five years later 912,715 679,624 0 0Six years later 972,818 746,562 0 0Seven years later 993,180 757,902 0Eight years later 1,008,667 774,912Nine years later 1,008,667
End of fund year 0 0 0 0One year later 51,755 169,875 0 0Two years later 449,159 625,574 0 0Three years later 933,751 672,724 0 0Four years later 899,440 679,624 0 0Five years later 912,715 679,624 0 0Six years later 1,186,548 1,043,741 0 0Seven years later 1,264,346 757,902 0Eight years later 1,008,667 774,912Nine years later 1,008,667
(3,381,528) (3,381,761) (1,979,368) 0
128 119 112 109
Estimated incurred claims and expenses, end of fiscal year, adjusted for decrease in discount period
Paid (cumulative) claims and claims □adjustment expenses:
Re-estimated incurred claims and □expenses:
Increase (decrease) in estimated □incurred claims and expense from □end of policy year
Number of fund participants □receiving benefits at end of year
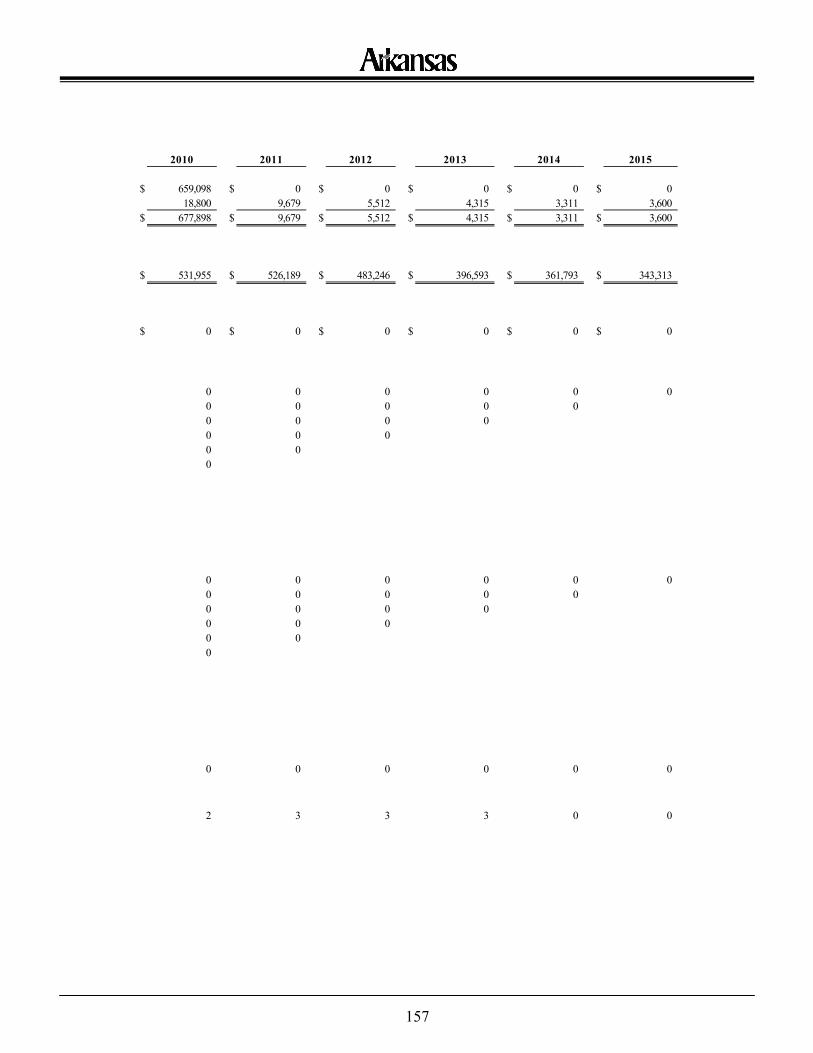
157
2010 2011 2012 2013 2014 2015
$ 659,098 $ 0 $ 0 $ 0 $ 0 $ 018,800 9,679 5,512 4,315 3,311 3,600
$ 677,898 $ 9,679 $ 5,512 $ 4,315 $ 3,311 $ 3,600
$ 531,955 $ 526,189 $ 483,246 $ 396,593 $ 361,793 $ 343,313
$ 0 $ 0 $ 0 $ 0 $ 0 $ 0
0 0 0 0 0 00 0 0 0 00 0 0 00 0 00 00
0 0 0 0 0 00 0 0 0 00 0 0 00 0 00 00
0 0 0 0 0 0
2 3 3 3 0 0
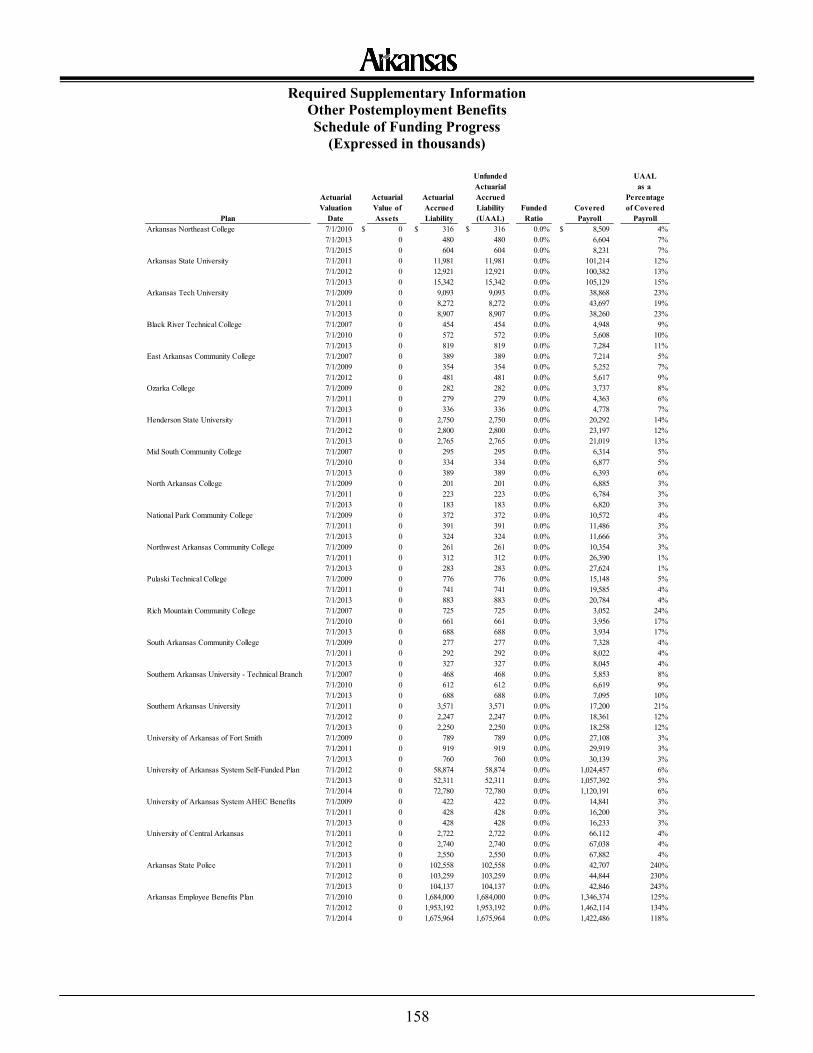
158
Required Supplementary Information Other Postemployment Benefits Schedule of Funding Progress
(Expressed in thousands)
Unfunded UAALActuarial as a
Actuarial Actuarial Actuarial Accrued PercentageValuation Value of Accrued Liability Funded Covered of Covered
Plan Date Assets Liability (UAAL) Ratio Payroll PayrollArkansas Northeast College 7/1/2010 $ 0 $ 316 $ 316 0.0% $ 8,509 4%
7/1/2013 0 480 480 0.0% 6,604 7%7/1/2015 0 604 604 0.0% 8,231 7%
Arkansas State University 7/1/2011 0 11,981 11,981 0.0% 101,214 12%7/1/2012 0 12,921 12,921 0.0% 100,382 13%7/1/2013 0 15,342 15,342 0.0% 105,129 15%
Arkansas Tech University 7/1/2009 0 9,093 9,093 0.0% 38,868 23%7/1/2011 0 8,272 8,272 0.0% 43,697 19%7/1/2013 0 8,907 8,907 0.0% 38,260 23%
Black River Technical College 7/1/2007 0 454 454 0.0% 4,948 9%7/1/2010 0 572 572 0.0% 5,608 10%7/1/2013 0 819 819 0.0% 7,284 11%
East Arkansas Community College 7/1/2007 0 389 389 0.0% 7,214 5%7/1/2009 0 354 354 0.0% 5,252 7%7/1/2012 0 481 481 0.0% 5,617 9%
Ozarka College 7/1/2009 0 282 282 0.0% 3,737 8%7/1/2011 0 279 279 0.0% 4,363 6%7/1/2013 0 336 336 0.0% 4,778 7%
Henderson State University 7/1/2011 0 2,750 2,750 0.0% 20,292 14%7/1/2012 0 2,800 2,800 0.0% 23,197 12%7/1/2013 0 2,765 2,765 0.0% 21,019 13%
Mid South Community College 7/1/2007 0 295 295 0.0% 6,314 5%7/1/2010 0 334 334 0.0% 6,877 5%7/1/2013 0 389 389 0.0% 6,393 6%
North Arkansas College 7/1/2009 0 201 201 0.0% 6,885 3%7/1/2011 0 223 223 0.0% 6,784 3%7/1/2013 0 183 183 0.0% 6,820 3%
National Park Community College 7/1/2009 0 372 372 0.0% 10,572 4%7/1/2011 0 391 391 0.0% 11,486 3%7/1/2013 0 324 324 0.0% 11,666 3%
Northwest Arkansas Community College 7/1/2009 0 261 261 0.0% 10,354 3%7/1/2011 0 312 312 0.0% 26,390 1%7/1/2013 0 283 283 0.0% 27,624 1%
Pulaski Technical College 7/1/2009 0 776 776 0.0% 15,148 5%7/1/2011 0 741 741 0.0% 19,585 4%7/1/2013 0 883 883 0.0% 20,784 4%
Rich Mountain Community College 7/1/2007 0 725 725 0.0% 3,052 24%7/1/2010 0 661 661 0.0% 3,956 17%7/1/2013 0 688 688 0.0% 3,934 17%
South Arkansas Community College 7/1/2009 0 277 277 0.0% 7,328 4%7/1/2011 0 292 292 0.0% 8,022 4%7/1/2013 0 327 327 0.0% 8,045 4%
Southern Arkansas University - Technical Branch 7/1/2007 0 468 468 0.0% 5,853 8%7/1/2010 0 612 612 0.0% 6,619 9%7/1/2013 0 688 688 0.0% 7,095 10%
Southern Arkansas University 7/1/2011 0 3,571 3,571 0.0% 17,200 21%7/1/2012 0 2,247 2,247 0.0% 18,361 12%7/1/2013 0 2,250 2,250 0.0% 18,258 12%
University of Arkansas of Fort Smith 7/1/2009 0 789 789 0.0% 27,108 3%7/1/2011 0 919 919 0.0% 29,919 3%7/1/2013 0 760 760 0.0% 30,139 3%
University of Arkansas System Self-Funded Plan 7/1/2012 0 58,874 58,874 0.0% 1,024,457 6%7/1/2013 0 52,311 52,311 0.0% 1,057,392 5%7/1/2014 0 72,780 72,780 0.0% 1,120,191 6%
University of Arkansas System AHEC Benefits 7/1/2009 0 422 422 0.0% 14,841 3%7/1/2011 0 428 428 0.0% 16,200 3%7/1/2013 0 428 428 0.0% 16,233 3%
University of Central Arkansas 7/1/2011 0 2,722 2,722 0.0% 66,112 4%7/1/2012 0 2,740 2,740 0.0% 67,038 4%7/1/2013 0 2,550 2,550 0.0% 67,882 4%
Arkansas State Police 7/1/2011 0 102,558 102,558 0.0% 42,707 240%7/1/2012 0 103,259 103,259 0.0% 44,844 230%7/1/2013 0 104,137 104,137 0.0% 42,846 243%
Arkansas Employee Benefits Plan 7/1/2010 0 1,684,000 1,684,000 0.0% 1,346,374 125%7/1/2012 0 1,953,192 1,953,192 0.0% 1,462,114 134%7/1/2014 0 1,675,964 1,675,964 0.0% 1,422,486 118%

Combining Financial Statements

159
NON-MAJOR ENTERPRISE FUNDS The enterprise funds are used to account for operations of those State agencies and/or programs providing goods or services to the general public on a user-charge basis or where the State has decided that periodic determination of revenues earned, expenses incurred and/or income is appropriate for capital maintenance, public policy, management control, accountability or other purposes. The non-major enterprise funds consist of the following:
War Memorial Stadium Commission – This agency has exclusive jurisdiction for the operation of the facility known as War Memorial Stadium, which is for the use of all the schools, colleges and universities of the State under the supervision of the agency.
Construction Assistance Revolving Loan Fund – This program is responsible for providing a perpetual fund for financing the construction of wastewater treatment facilities for municipalities and other public entities.
Public School Employee Health and Life Benefit Plan – This program is responsible for providing health and life insurance along with a prescription drug benefit to participating public school employees.
Other Revolving Loan Funds – These programs are responsible for providing a perpetual fund for financing the planning, design, acquisition, construction, expansion, equipping and/or rehabilitation for water systems; for the financing of capitalizable educational and general projects for community and technical colleges; financing of energy efficiency and conservation projects for residential homes; the establishment of a cooperative pilot program with the Clinton Climate Initiative to increase the energy efficiency of Arkansas companies and provide audit and retrofit opportunities for their employees; to incentivize development of affordable assisted living housing in Arkansas and to strengthen the financial feasibility of such developments; to finance energy efficiency retrofits and green energy implementation for industries; to hold equity investments made by the Risk Capital Matching Fund and to provide funding for communities to address affordable housing needs in metropolitan and rural areas in Arkansas.
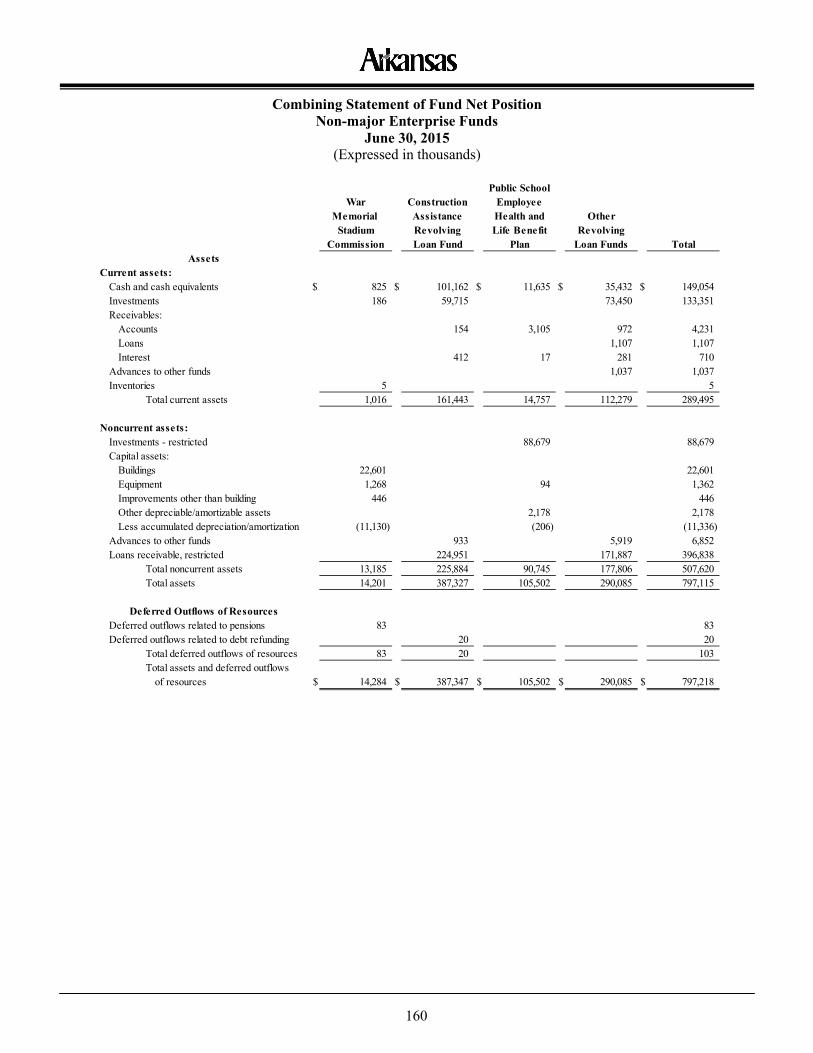
160
Combining Statement of Fund Net Position Non-major Enterprise Funds
June 30, 2015 (Expressed in thousands)
Public SchoolWar Construction Employee
Memorial Assistance Health and OtherStadium Revolving Life Benefit Revolving
Commission Loan Fund Plan Loan Funds Total
Cash and cash equivalents $ 825 $ 101,162 $ 11,635 $ 35,432 $ 149,054Investments 186 59,715 73,450 133,351Receivables:
Accounts 154 3,105 972 4,231Loans 1,107 1,107Interest 412 17 281 710
Advances to other funds 1,037 1,037Inventories 5 5
Total current assets 1,016 161,443 14,757 112,279 289,495
Investments - restricted 88,679 88,679Capital assets:
Buildings 22,601 22,601Equipment 1,268 94 1,362Improvements other than building 446 446Other depreciable/amortizable assets 2,178 2,178Less accumulated depreciation/amortization (11,130) (206) (11,336)
Advances to other funds 933 5,919 6,852Loans receivable, restricted 224,951 171,887 396,838
Total noncurrent assets 13,185 225,884 90,745 177,806 507,620Total assets 14,201 387,327 105,502 290,085 797,115
Deferred outflows related to pensions 83 83Deferred outflows related to debt refunding 20 20
Total deferred outflows of resources 83 20 103 Total assets and deferred outflows
of resources $ 14,284 $ 387,347 $ 105,502 $ 290,085 $ 797,218
AssetsCurrent assets:
Noncurrent assets:
Deferred Outflows of Resources
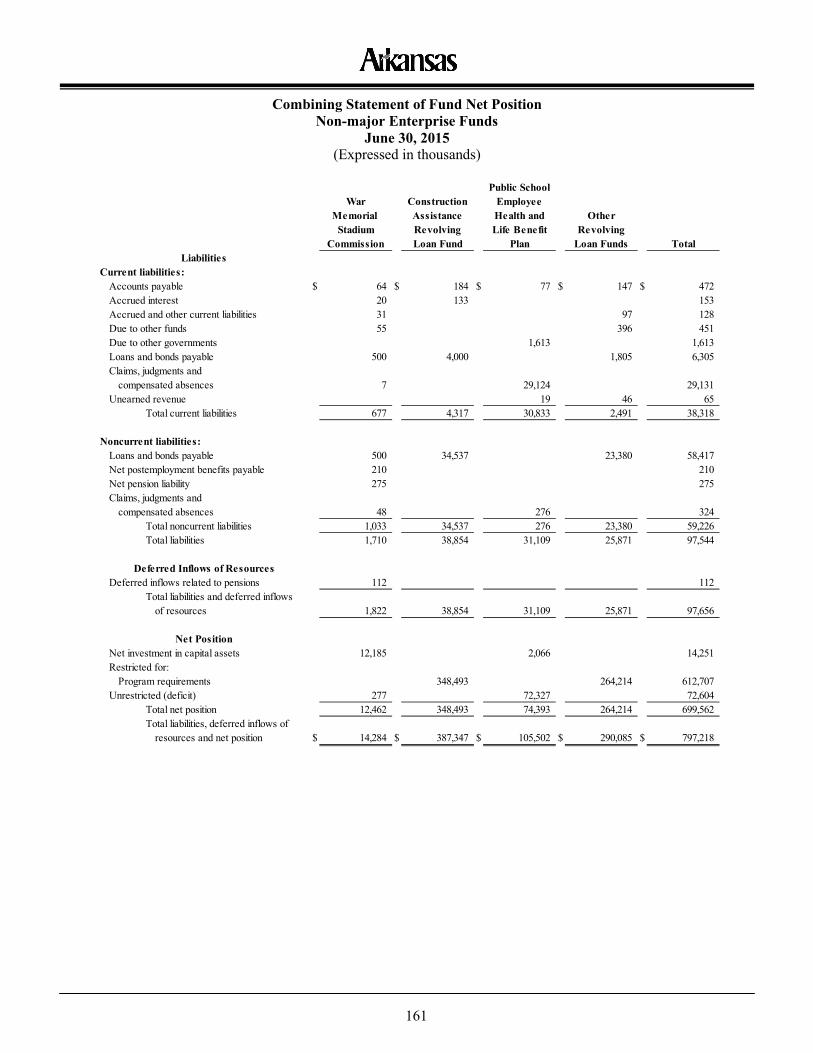
161
Combining Statement of Fund Net Position Non-major Enterprise Funds
June 30, 2015 (Expressed in thousands)
Public SchoolWar Construction Employee
Memorial Assistance Health and OtherStadium Revolving Life Benefit Revolving
Commission Loan Fund Plan Loan Funds Total
Accounts payable $ 64 $ 184 $ 77 $ 147 $ 472Accrued interest 20 133 153
Accrued and other current liabilities 31 97 128Due to other funds 55 396 451Due to other governments 1,613 1,613Loans and bonds payable 500 4,000 1,805 6,305Claims, judgments and
compensated absences 7 29,124 29,131Unearned revenue 19 46 65
Total current liabilities 677 4,317 30,833 2,491 38,318
Loans and bonds payable 500 34,537 23,380 58,417Net postemployment benefits payable 210 210Net pension liability 275 275Claims, judgments and
compensated absences 48 276 324Total noncurrent liabilities 1,033 34,537 276 23,380 59,226Total liabilities 1,710 38,854 31,109 25,871 97,544
Deferred inflows related to pensions 112 112Total liabilities and deferred inflows
of resources 1,822 38,854 31,109 25,871 97,656
Net investment in capital assets 12,185 2,066 14,251Restricted for:
Program requirements 348,493 264,214 612,707Unrestricted (deficit) 277 72,327 72,604
Total net position 12,462 348,493 74,393 264,214 699,562Total liabilities, deferred inflows of
resources and net position $ 14,284 $ 387,347 $ 105,502 $ 290,085 $ 797,218
Net Position
LiabilitiesCurrent liabilities:
Noncurrent liabilities:
Deferred Inflows of Resources
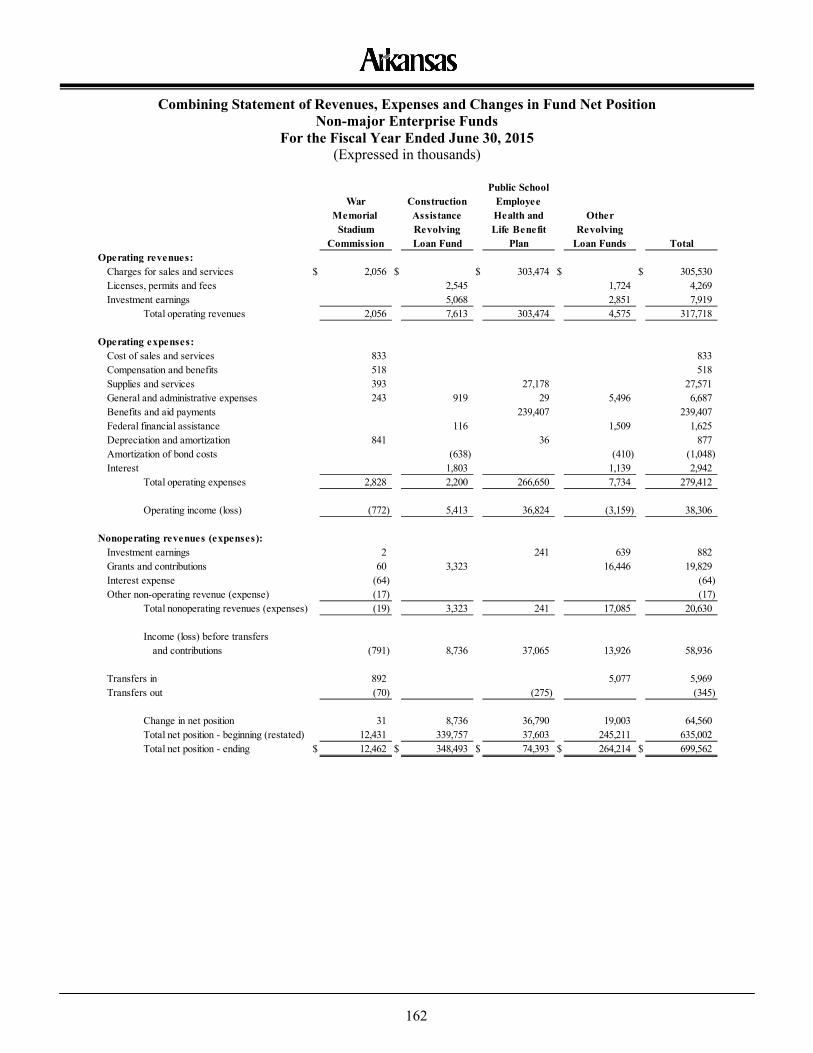
162
Combining Statement of Revenues, Expenses and Changes in Fund Net Position Non-major Enterprise Funds
For the Fiscal Year Ended June 30, 2015 (Expressed in thousands)
Public SchoolWar Construction Employee
Memorial Assistance Health and OtherStadium Revolving Life Benefit Revolving
Commission Loan Fund Plan Loan Funds Total
Charges for sales and services $ 2,056 $ $ 303,474 $ $ 305,530Licenses, permits and fees 2,545 1,724 4,269Investment earnings 5,068 2,851 7,919
Total operating revenues 2,056 7,613 303,474 4,575 317,718
Cost of sales and services 833 833Compensation and benefits 518 518Supplies and services 393 27,178 27,571General and administrative expenses 243 919 29 5,496 6,687Benefits and aid payments 239,407 239,407Federal financial assistance 116 1,509 1,625Depreciation and amortization 841 36 877Amortization of bond costs (638) (410) (1,048)Interest 1,803 1,139 2,942
Total operating expenses 2,828 2,200 266,650 7,734 279,412
Operating income (loss) (772) 5,413 36,824 (3,159) 38,306
Investment earnings 2 241 639 882Grants and contributions 60 3,323 16,446 19,829Interest expense (64) (64)Other non-operating revenue (expense) (17) (17)
Total nonoperating revenues (expenses) (19) 3,323 241 17,085 20,630
Income (loss) before transfersand contributions (791) 8,736 37,065 13,926 58,936
Transfers in 892 5,077 5,969Transfers out (70) (275) (345)
Change in net position 31 8,736 36,790 19,003 64,560Total net position - beginning (restated) 12,431 339,757 37,603 245,211 635,002Total net position - ending $ 12,462 $ 348,493 $ 74,393 $ 264,214 $ 699,562
Operating revenues:
Operating expenses:
Nonoperating revenues (expenses):
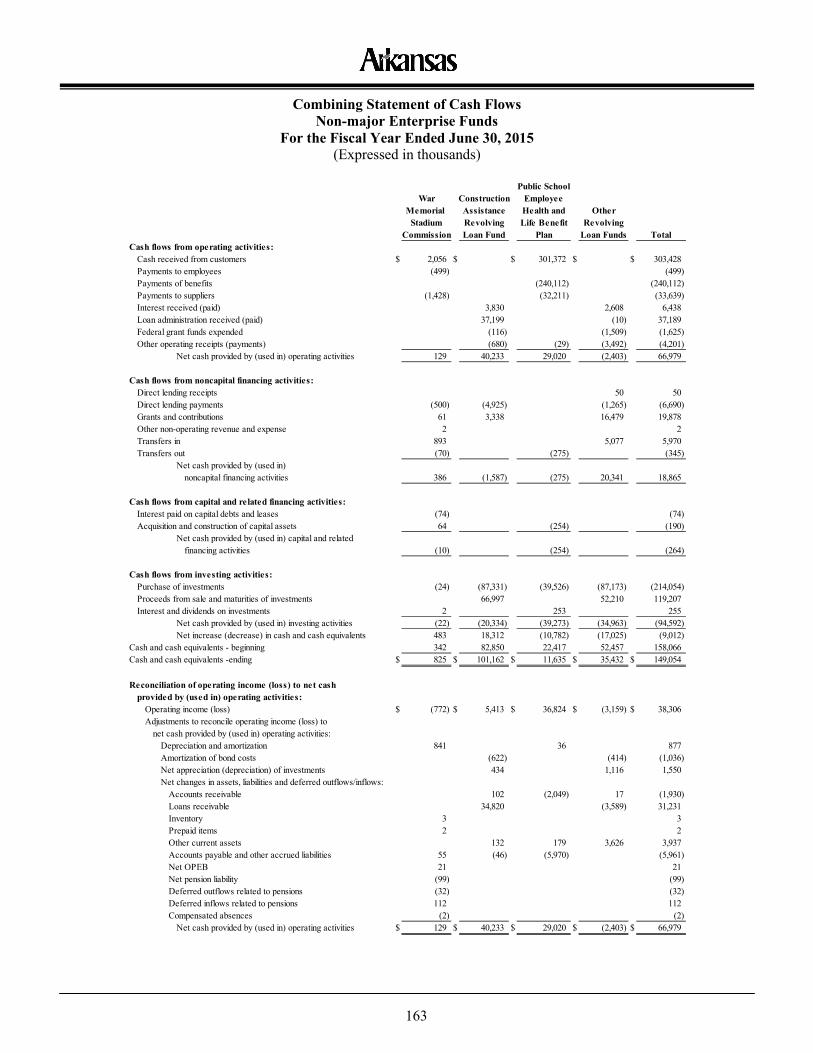
163
Combining Statement of Cash Flows Non-major Enterprise Funds
For the Fiscal Year Ended June 30, 2015 (Expressed in thousands)
Public SchoolWar Construction Employee
Memorial Assistance Health and OtherStadium Revolving Life Benefit Revolving
Commission Loan Fund Plan Loan Funds Total
Cash received from customers $ 2,056 $ $ 301,372 $ $ 303,428Payments to employees (499) (499)Payments of benefits (240,112) (240,112)Payments to suppliers (1,428) (32,211) (33,639)Interest received (paid) 3,830 2,608 6,438Loan administration received (paid) 37,199 (10) 37,189Federal grant funds expended (116) (1,509) (1,625)Other operating receipts (payments) (680) (29) (3,492) (4,201)
Net cash provided by (used in) operating activities 129 40,233 29,020 (2,403) 66,979
Direct lending receipts 50 50Direct lending payments (500) (4,925) (1,265) (6,690)Grants and contributions 61 3,338 16,479 19,878Other non-operating revenue and expense 2 2Transfers in 893 5,077 5,970Transfers out (70) (275) (345)
Net cash provided by (used in)noncapital financing activities 386 (1,587) (275) 20,341 18,865
Interest paid on capital debts and leases (74) (74)Acquisition and construction of capital assets 64 (254) (190)
Net cash provided by (used in) capital and related financing activities (10) (254) (264)
Purchase of investments (24) (87,331) (39,526) (87,173) (214,054)Proceeds from sale and maturities of investments 66,997 52,210 119,207Interest and dividends on investments 2 253 255
Net cash provided by (used in) investing activities (22) (20,334) (39,273) (34,963) (94,592)Net increase (decrease) in cash and cash equivalents 483 18,312 (10,782) (17,025) (9,012)
Cash and cash equivalents - beginning 342 82,850 22,417 52,457 158,066Cash and cash equivalents -ending $ 825 $ 101,162 $ 11,635 $ 35,432 $ 149,054
provided by (used in) operating activities:Operating income (loss) $ (772) $ 5,413 $ 36,824 $ (3,159) $ 38,306Adjustments to reconcile operating income (loss) to
net cash provided by (used in) operating activities: Depreciation and amortization 841 36 877Amortization of bond costs (622) (414) (1,036)Net appreciation (depreciation) of investments 434 1,116 1,550Net changes in assets, liabilities and deferred outflows/inflows:
Accounts receivable 102 (2,049) 17 (1,930)Loans receivable 34,820 (3,589) 31,231Inventory 3 3Prepaid items 2 2Other current assets 132 179 3,626 3,937Accounts payable and other accrued liabilities 55 (46) (5,970) (5,961)Net OPEB 21 21Net pension liability (99) (99)Deferred outflows related to pensions (32) (32)Deferred inflows related to pensions 112 112Compensated absences (2) (2)
Net cash provided by (used in) operating activities $ 129 $ 40,233 $ 29,020 $ (2,403) $ 66,979
Cash flows from noncapital financing activities:
Cash flows from capital and related financing activities:
Cash flows from investing activities:
Reconciliation of operating income (loss) to net cash
Cash flows from operating activities:
164
FIDUCIARY FUNDS Fiduciary funds are used to account for assets held by the State in a fiduciary capacity or as an agent for individuals, private organizations or other governments and/or funds. The trust and agency funds consist of the following:
Pension Trust Funds – These funds are accounted for in essentially the same manner as proprietary funds and include the Public Employees Retirement System (which also administers the District Judges Retirement System, the State Police Retirement System and the Judicial Retirement System), the Teacher Retirement System and the State Highway Employees Retirement System. Agency Funds – These funds are custodial in nature and do not involve measurement of operations. Included in these funds are assets held by the Insurance Department and various other state agencies.
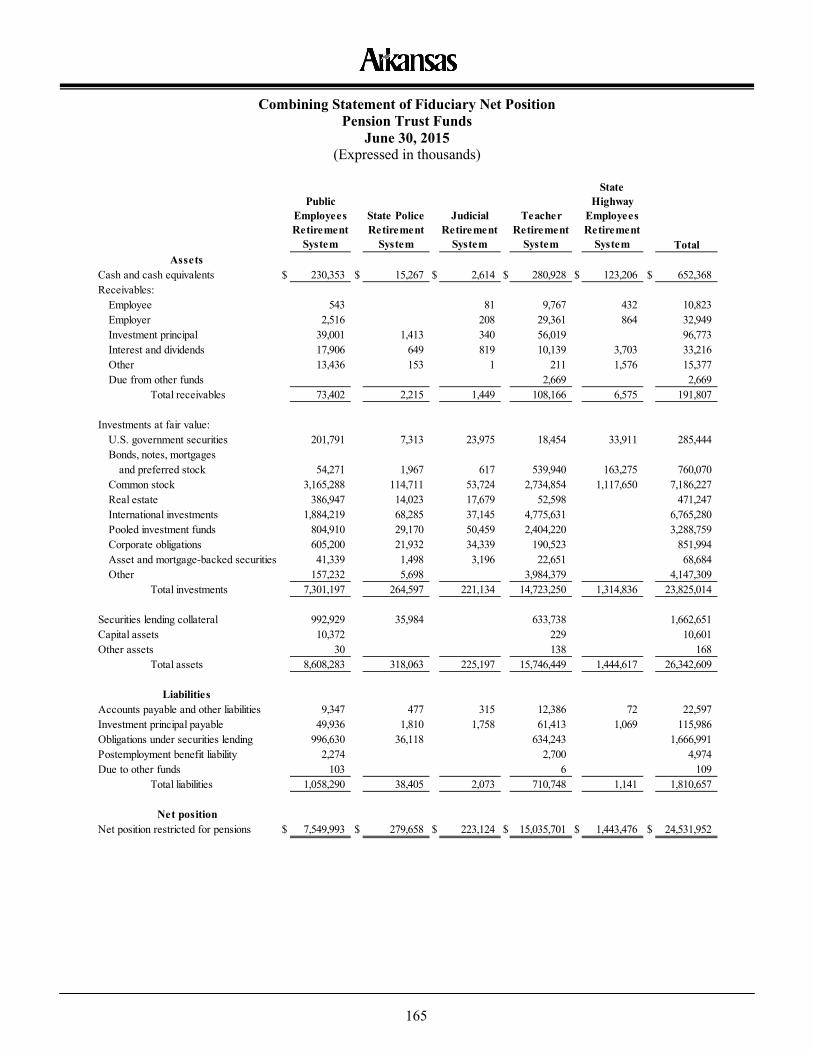
165
Combining Statement of Fiduciary Net Position Pension Trust Funds
June 30, 2015 (Expressed in thousands)
Public Employees Retirement
System
State Police Retirement
System
Judicial Retirement
System
Teacher Retirement
System
State Highway
Employees Retirement
System Total
Cash and cash equivalents $ 230,353 $ 15,267 $ 2,614 $ 280,928 $ 123,206 $ 652,368 Receivables:
Employee 543 81 9,767 432 10,823 Employer 2,516 208 29,361 864 32,949 Investment principal 39,001 1,413 340 56,019 96,773 Interest and dividends 17,906 649 819 10,139 3,703 33,216 Other 13,436 153 1 211 1,576 15,377 Due from other funds 2,669 2,669
Total receivables 73,402 2,215 1,449 108,166 6,575 191,807
Investments at fair value:U.S. government securities 201,791 7,313 23,975 18,454 33,911 285,444 Bonds, notes, mortgages
and preferred stock 54,271 1,967 617 539,940 163,275 760,070 Common stock 3,165,288 114,711 53,724 2,734,854 1,117,650 7,186,227 Real estate 386,947 14,023 17,679 52,598 471,247 International investments 1,884,219 68,285 37,145 4,775,631 6,765,280 Pooled investment funds 804,910 29,170 50,459 2,404,220 3,288,759 Corporate obligations 605,200 21,932 34,339 190,523 851,994 Asset and mortgage-backed securities 41,339 1,498 3,196 22,651 68,684 Other 157,232 5,698 3,984,379 4,147,309
Total investments 7,301,197 264,597 221,134 14,723,250 1,314,836 23,825,014
Securities lending collateral 992,929 35,984 633,738 1,662,651 Capital assets 10,372 229 10,601 Other assets 30 138 168
Total assets 8,608,283 318,063 225,197 15,746,449 1,444,617 26,342,609
Accounts payable and other liabilities 9,347 477 315 12,386 72 22,597 Investment principal payable 49,936 1,810 1,758 61,413 1,069 115,986 Obligations under securities lending 996,630 36,118 634,243 1,666,991 Postemployment benefit liability 2,274 2,700 4,974 Due to other funds 103 6 109
Total liabilities 1,058,290 38,405 2,073 710,748 1,141 1,810,657
Net position restricted for pensions $ 7,549,993 $ 279,658 $ 223,124 $ 15,035,701 $ 1,443,476 $ 24,531,952 Net position
Assets
Liabilities
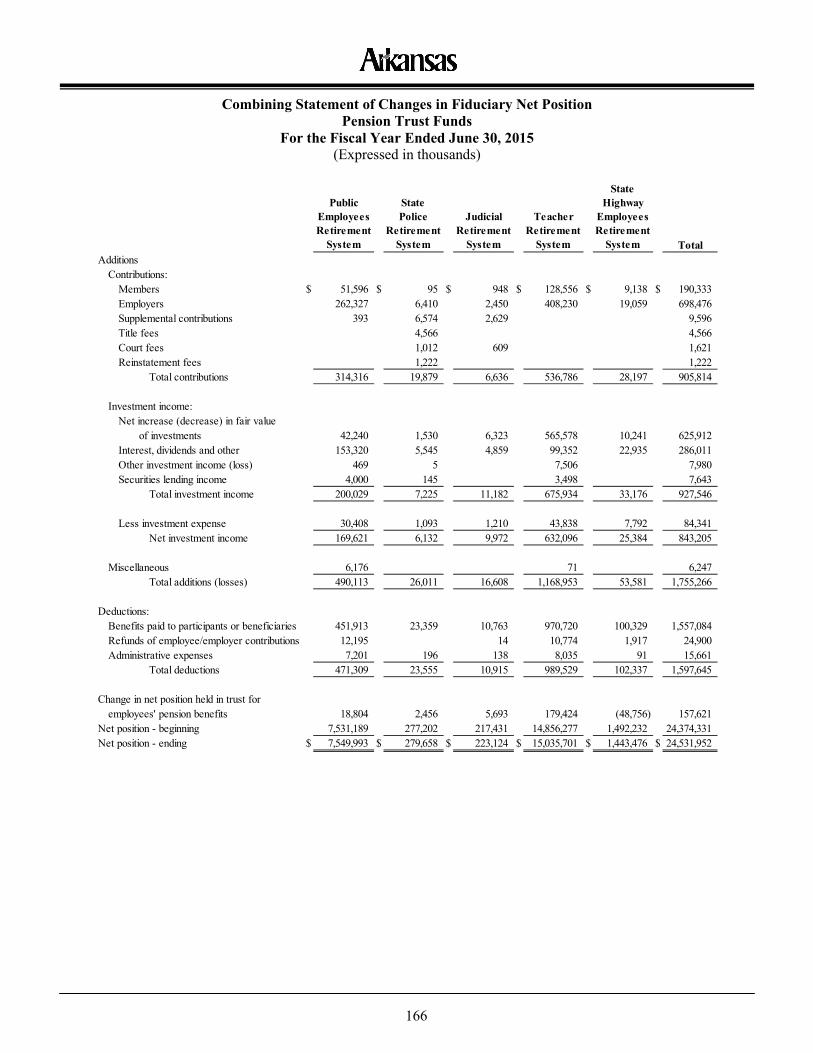
166
Combining Statement of Changes in Fiduciary Net Position Pension Trust Funds
For the Fiscal Year Ended June 30, 2015 (Expressed in thousands)
Public Employees Retirement
System
State Police
Retirement System
Judicial Retirement
System
Teacher Retirement
System
State Highway
Employees Retirement
System TotalAdditions
Contributions:Members $ 51,596 $ 95 $ 948 $ 128,556 $ 9,138 $ 190,333Employers 262,327 6,410 2,450 408,230 19,059 698,476Supplemental contributions 393 6,574 2,629 9,596Title fees 4,566 4,566Court fees 1,012 609 1,621Reinstatement fees 1,222 1,222
Total contributions 314,316 19,879 6,636 536,786 28,197 905,814
Investment income:Net increase (decrease) in fair value
of investments 42,240 1,530 6,323 565,578 10,241 625,912Interest, dividends and other 153,320 5,545 4,859 99,352 22,935 286,011Other investment income (loss) 469 5 7,506 7,980Securities lending income 4,000 145 3,498 7,643
Total investment income 200,029 7,225 11,182 675,934 33,176 927,546
Less investment expense 30,408 1,093 1,210 43,838 7,792 84,341Net investment income 169,621 6,132 9,972 632,096 25,384 843,205
Miscellaneous 6,176 71 6,247Total additions (losses) 490,113 26,011 16,608 1,168,953 53,581 1,755,266
Deductions:Benefits paid to participants or beneficiaries 451,913 23,359 10,763 970,720 100,329 1,557,084Refunds of employee/employer contributions 12,195 14 10,774 1,917 24,900Administrative expenses 7,201 196 138 8,035 91 15,661
Total deductions 471,309 23,555 10,915 989,529 102,337 1,597,645
Change in net position held in trust foremployees' pension benefits 18,804 2,456 5,693 179,424 (48,756) 157,621
Net position - beginning 7,531,189 277,202 217,431 14,856,277 1,492,232 24,374,331Net position - ending $ 7,549,993 $ 279,658 $ 223,124 $ 15,035,701 $ 1,443,476 $ 24,531,952
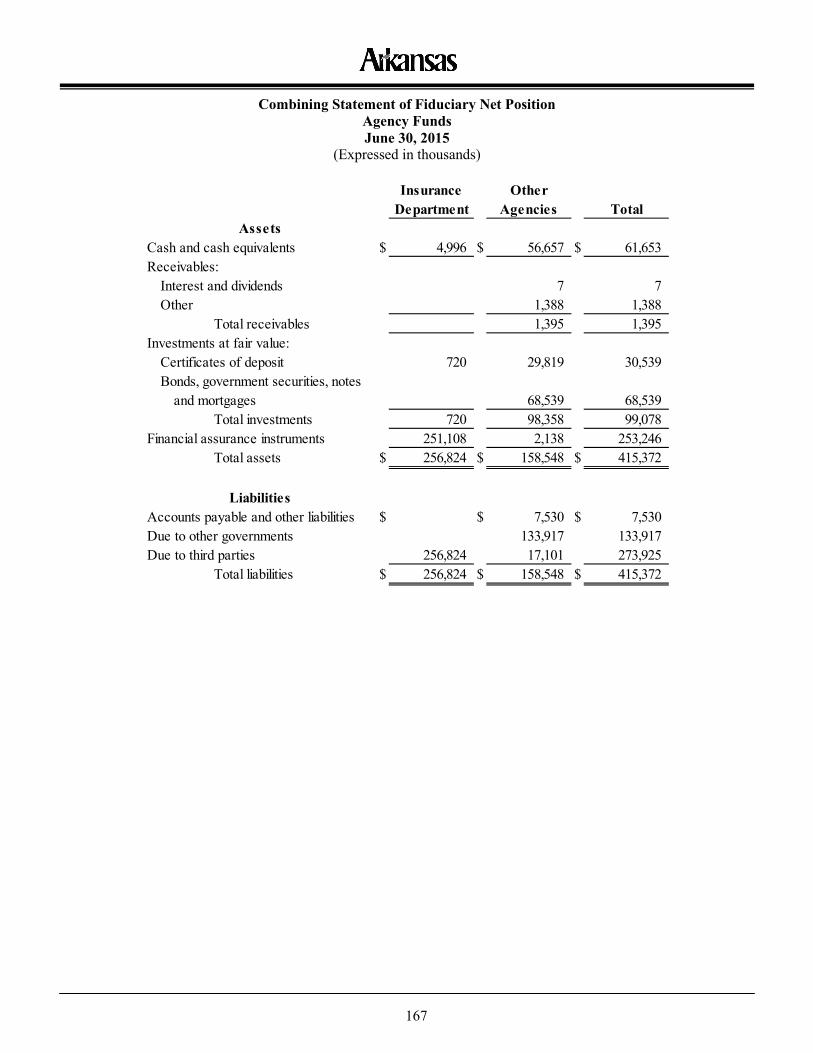
167
Combining Statement of Fiduciary Net Position Agency Funds June 30, 2015
(Expressed in thousands)
Insurance OtherDepartment Agencies Total
Cash and cash equivalents $ 4,996 $ 56,657 $ 61,653Receivables:
Interest and dividends 7 7Other 1,388 1,388
Total receivables 1,395 1,395Investments at fair value:
Certificates of deposit 720 29,819 30,539Bonds, government securities, notes
and mortgages 68,539 68,539Total investments 720 98,358 99,078
Financial assurance instruments 251,108 2,138 253,246Total assets $ 256,824 $ 158,548 $ 415,372
Accounts payable and other liabilities $ $ 7,530 $ 7,530Due to other governments 133,917 133,917Due to third parties 256,824 17,101 273,925
Total liabilities $ 256,824 $ 158,548 $ 415,372
Assets
Liabilities
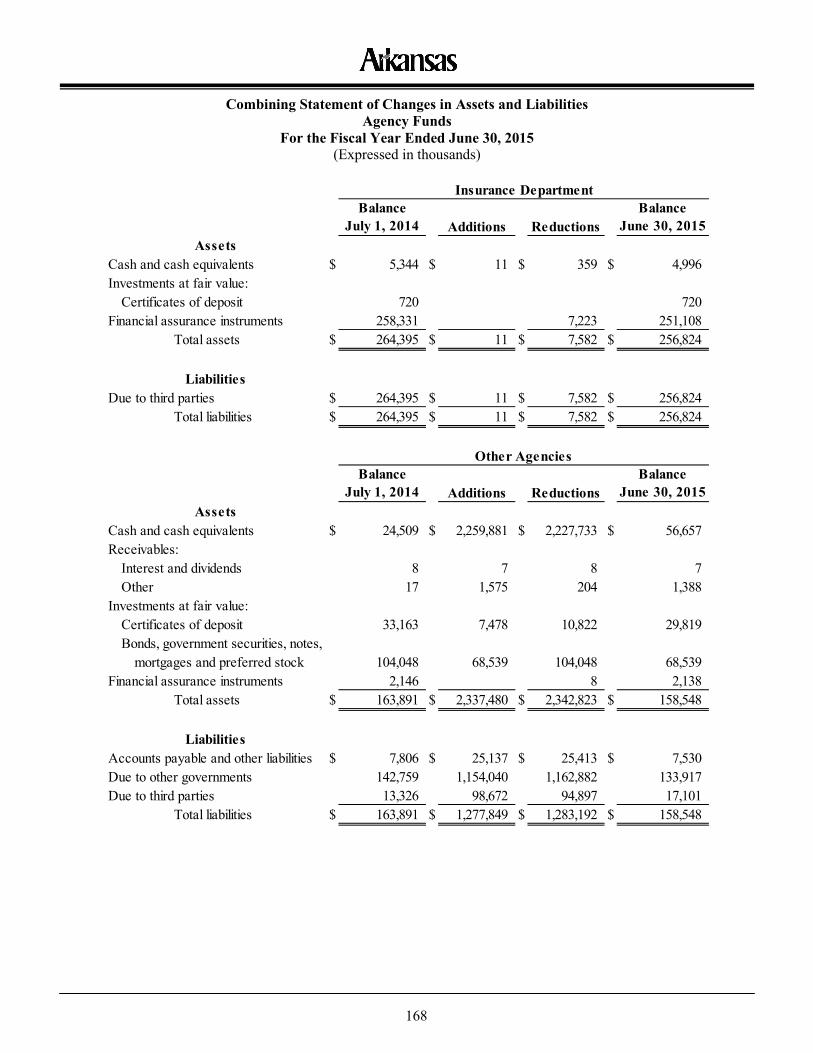
168
Combining Statement of Changes in Assets and Liabilities Agency Funds
For the Fiscal Year Ended June 30, 2015 (Expressed in thousands)
Balance July 1, 2014 Additions Reductions
Balance June 30, 2015
Cash and cash equivalents $ 5,344 $ 11 $ 359 $ 4,996Investments at fair value:
Certificates of deposit 720 720Financial assurance instruments 258,331 7,223 251,108
Total assets $ 264,395 $ 11 $ 7,582 $ 256,824
Due to third parties $ 264,395 $ 11 $ 7,582 $ 256,824Total liabilities $ 264,395 $ 11 $ 7,582 $ 256,824
Balance July 1, 2014 Additions Reductions
Balance June 30, 2015
Cash and cash equivalents $ 24,509 $ 2,259,881 $ 2,227,733 $ 56,657Receivables:
Interest and dividends 8 7 8 7Other 17 1,575 204 1,388
Investments at fair value:Certificates of deposit 33,163 7,478 10,822 29,819Bonds, government securities, notes,
mortgages and preferred stock 104,048 68,539 104,048 68,539Financial assurance instruments 2,146 8 2,138
Total assets $ 163,891 $ 2,337,480 $ 2,342,823 $ 158,548
Accounts payable and other liabilities $ 7,806 $ 25,137 $ 25,413 $ 7,530Due to other governments 142,759 1,154,040 1,162,882 133,917Due to third parties 13,326 98,672 94,897 17,101
Total liabilities $ 163,891 $ 1,277,849 $ 1,283,192 $ 158,548
Insurance Department
Assets
Liabilities
Assets
Other Agencies
Liabilities
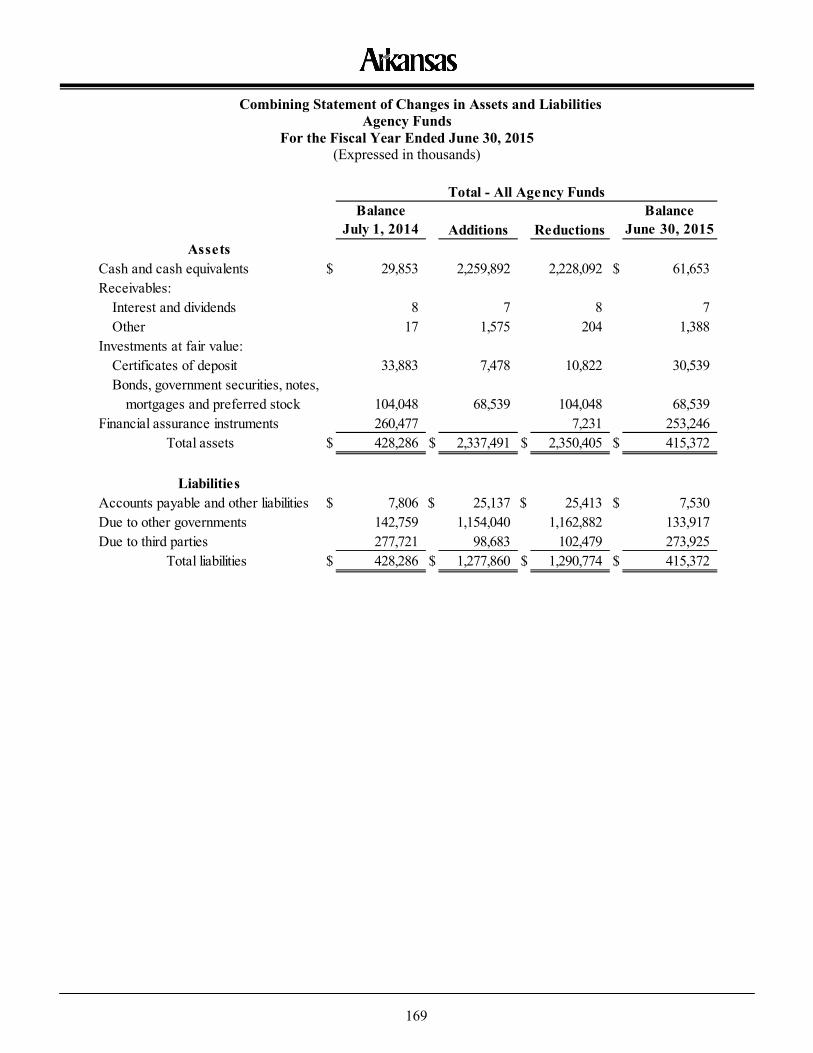
169
Combining Statement of Changes in Assets and Liabilities Agency Funds
For the Fiscal Year Ended June 30, 2015 (Expressed in thousands)
Balance July 1, 2014 Additions Reductions
Balance June 30, 2015
Cash and cash equivalents $ 29,853 2,259,892 2,228,092 $ 61,653Receivables:
Interest and dividends 8 7 8 7Other 17 1,575 204 1,388
Investments at fair value:Certificates of deposit 33,883 7,478 10,822 30,539Bonds, government securities, notes,
mortgages and preferred stock 104,048 68,539 104,048 68,539Financial assurance instruments 260,477 7,231 253,246
Total assets $ 428,286 $ 2,337,491 $ 2,350,405 $ 415,372
Accounts payable and other liabilities $ 7,806 $ 25,137 $ 25,413 $ 7,530Due to other governments 142,759 1,154,040 1,162,882 133,917Due to third parties 277,721 98,683 102,479 273,925
Total liabilities $ 428,286 $ 1,277,860 $ 1,290,774 $ 415,372
Liabilities
Assets
Total - All Agency Funds


Statistical Section

171
Statistical Section – Table of Contents This section contains statistical tables that reflect financial trend information, revenue capacity information, debt capacity information, demographic and economic information, operating information and other information. These tables differ from the financial statements because they usually cover more than two fiscal years and may present non-accounting data. The Statistical Section is divided into 6 sections as follows: Contents Page Financial Trends 172
These schedules contain trend information to help the reader understand how the State's financial performance and well-being have changed over time. Fund perspective schedules are presented for the last 10 years, except where noted.
Revenue Capacity Information 182
These schedules contain trend information to help the reader understand the State's capacity to raise revenues and the sources of those revenues.
Debt Capacity Information 185
These schedules contain trend information to help the reader understand the State's outstanding debt and the capacity to repay that debt.
Demographic and Economic Information 188
These schedules contain trend information to help the reader understand the environment in which the State's financial activities occur.
Operating Information 192
These schedules contain service and infrastructure data in relation to the services the State provides and the activities it performs.
Other Information 197
This schedule provides miscellaneous information about the State.

172
Schedule 1 Net Position by Component (Unaudited)
Last Ten Fiscal Years (Expressed in thousands)
(1) Fiscal year 2014 balances restated in fiscal year 2015.
2015 2014 (1) 2013 2012Primary Government
Governmental ActivitiesNet investment in capital assets $ 10,418,250 $ 9,441,544 $ 9,714,929 $ 9,632,774Restricted 1,627,433 2,098,642 1,319,560 1,256,134Unrestricted (1,312,316) (1,402,681) 449,360 589,166
Total governmental activities net position 10,733,367 10,137,505 11,483,849 11,478,074
Business-Type ActivitiesNet investment in capital assets 1,995,542 1,966,036 1,929,075 1,889,473Restricted 1,049,397 1,008,203 928,743 892,101Unrestricted 1,019,309 829,571 747,820 556,124
Total business-type activities net position 4,064,248 3,803,810 3,605,638 3,337,698
Total Primary GovernmentNet investment in capital assets 12,413,792 11,407,580 11,644,004 11,522,247Restricted 2,676,830 3,106,845 2,248,303 2,148,235Unrestricted (293,007) (573,110) 1,197,180 1,145,290
Total primary government activities net position $ 14,797,615 $ 13,941,315 $ 15,089,487 $ 14,815,772
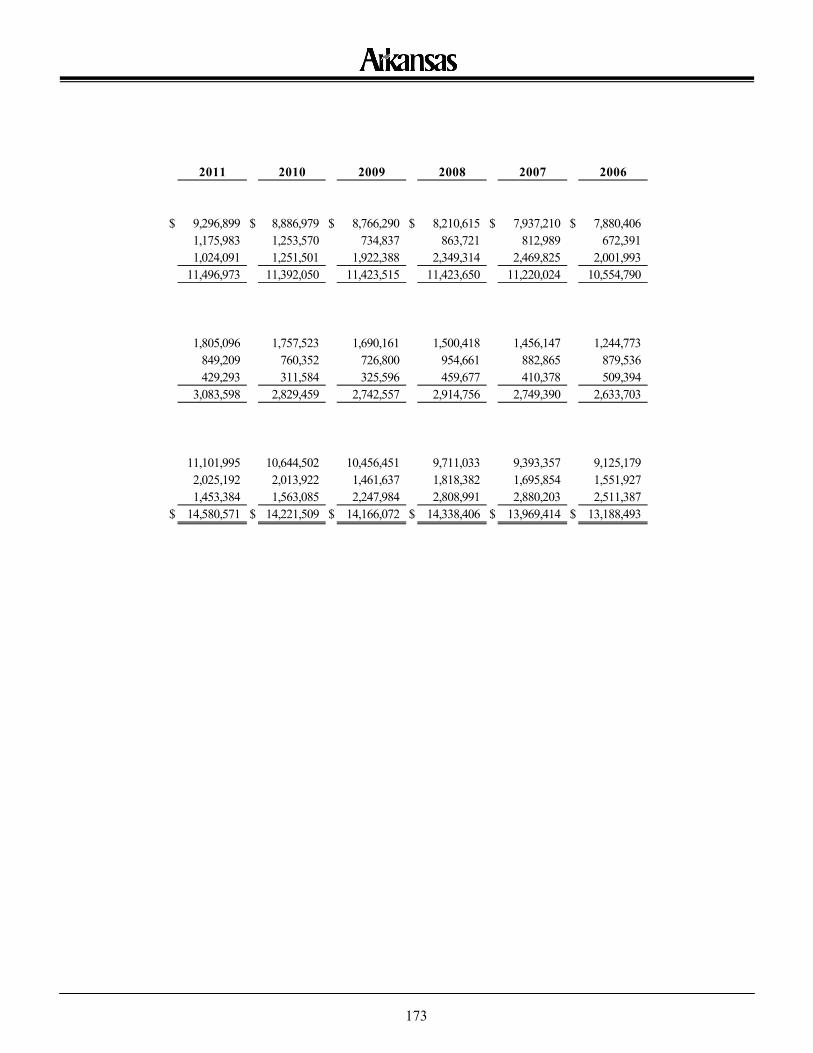
173
2011 2010 2009 2008 2007 2006
$ 9,296,899 $ 8,886,979 $ 8,766,290 $ 8,210,615 $ 7,937,210 $ 7,880,4061,175,983 1,253,570 734,837 863,721 812,989 672,3911,024,091 1,251,501 1,922,388 2,349,314 2,469,825 2,001,993
11,496,973 11,392,050 11,423,515 11,423,650 11,220,024 10,554,790
1,805,096 1,757,523 1,690,161 1,500,418 1,456,147 1,244,773849,209 760,352 726,800 954,661 882,865 879,536429,293 311,584 325,596 459,677 410,378 509,394
3,083,598 2,829,459 2,742,557 2,914,756 2,749,390 2,633,703
11,101,995 10,644,502 10,456,451 9,711,033 9,393,357 9,125,1792,025,192 2,013,922 1,461,637 1,818,382 1,695,854 1,551,9271,453,384 1,563,085 2,247,984 2,808,991 2,880,203 2,511,387
$ 14,580,571 $ 14,221,509 $ 14,166,072 $ 14,338,406 $ 13,969,414 $ 13,188,493
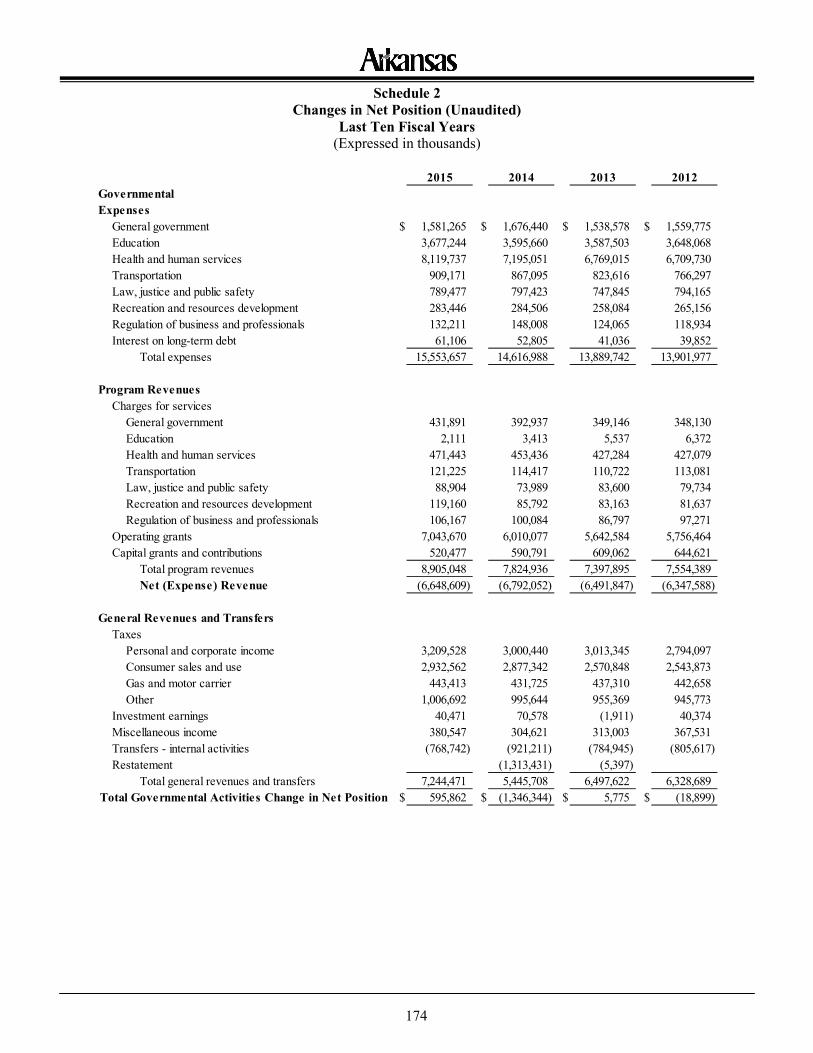
174
Schedule 2 Changes in Net Position (Unaudited)
Last Ten Fiscal Years (Expressed in thousands)
2015 2014 2013 2012
General government $ 1,581,265 $ 1,676,440 $ 1,538,578 $ 1,559,775Education 3,677,244 3,595,660 3,587,503 3,648,068Health and human services 8,119,737 7,195,051 6,769,015 6,709,730Transportation 909,171 867,095 823,616 766,297Law, justice and public safety 789,477 797,423 747,845 794,165Recreation and resources development 283,446 284,506 258,084 265,156Regulation of business and professionals 132,211 148,008 124,065 118,934Interest on long-term debt 61,106 52,805 41,036 39,852
Total expenses 15,553,657 14,616,988 13,889,742 13,901,977
Program RevenuesCharges for services
General government 431,891 392,937 349,146 348,130Education 2,111 3,413 5,537 6,372Health and human services 471,443 453,436 427,284 427,079Transportation 121,225 114,417 110,722 113,081Law, justice and public safety 88,904 73,989 83,600 79,734Recreation and resources development 119,160 85,792 83,163 81,637Regulation of business and professionals 106,167 100,084 86,797 97,271
Operating grants 7,043,670 6,010,077 5,642,584 5,756,464Capital grants and contributions 520,477 590,791 609,062 644,621
Total program revenues 8,905,048 7,824,936 7,397,895 7,554,389Net (Expense) Revenue (6,648,609) (6,792,052) (6,491,847) (6,347,588)
General Revenues and TransfersTaxes
Personal and corporate income 3,209,528 3,000,440 3,013,345 2,794,097Consumer sales and use 2,932,562 2,877,342 2,570,848 2,543,873Gas and motor carrier 443,413 431,725 437,310 442,658Other 1,006,692 995,644 955,369 945,773
Investment earnings 40,471 70,578 (1,911) 40,374Miscellaneous income 380,547 304,621 313,003 367,531Transfers - internal activities (768,742) (921,211) (784,945) (805,617)Restatement (1,313,431) (5,397)
Total general revenues and transfers 7,244,471 5,445,708 6,497,622 6,328,689$ 595,862 $ (1,346,344) $ 5,775 $ (18,899)Total Governmental Activities Change in Net Position
Governmental Expenses
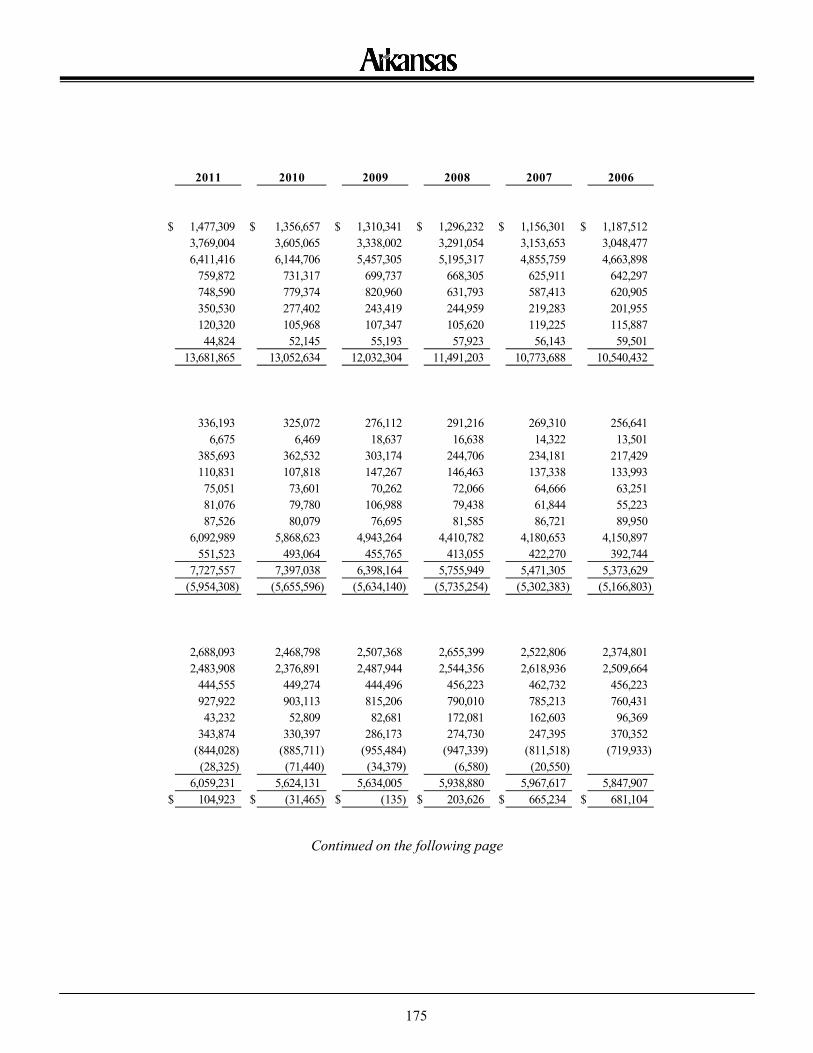
175
Continued on the following page
2011 2010 2009 2008 2007 2006
$ 1,477,309 $ 1,356,657 $ 1,310,341 $ 1,296,232 $ 1,156,301 $ 1,187,5123,769,004 3,605,065 3,338,002 3,291,054 3,153,653 3,048,4776,411,416 6,144,706 5,457,305 5,195,317 4,855,759 4,663,898
759,872 731,317 699,737 668,305 625,911 642,297748,590 779,374 820,960 631,793 587,413 620,905350,530 277,402 243,419 244,959 219,283 201,955120,320 105,968 107,347 105,620 119,225 115,88744,824 52,145 55,193 57,923 56,143 59,501
13,681,865 13,052,634 12,032,304 11,491,203 10,773,688 10,540,432
336,193 325,072 276,112 291,216 269,310 256,6416,675 6,469 18,637 16,638 14,322 13,501
385,693 362,532 303,174 244,706 234,181 217,429110,831 107,818 147,267 146,463 137,338 133,99375,051 73,601 70,262 72,066 64,666 63,25181,076 79,780 106,988 79,438 61,844 55,22387,526 80,079 76,695 81,585 86,721 89,950
6,092,989 5,868,623 4,943,264 4,410,782 4,180,653 4,150,897551,523 493,064 455,765 413,055 422,270 392,744
7,727,557 7,397,038 6,398,164 5,755,949 5,471,305 5,373,629(5,954,308) (5,655,596) (5,634,140) (5,735,254) (5,302,383) (5,166,803)
2,688,093 2,468,798 2,507,368 2,655,399 2,522,806 2,374,8012,483,908 2,376,891 2,487,944 2,544,356 2,618,936 2,509,664
444,555 449,274 444,496 456,223 462,732 456,223927,922 903,113 815,206 790,010 785,213 760,43143,232 52,809 82,681 172,081 162,603 96,369
343,874 330,397 286,173 274,730 247,395 370,352(844,028) (885,711) (955,484) (947,339) (811,518) (719,933)(28,325) (71,440) (34,379) (6,580) (20,550)
6,059,231 5,624,131 5,634,005 5,938,880 5,967,617 5,847,907$ 104,923 $ (31,465) $ (135) $ 203,626 $ 665,234 $ 681,104
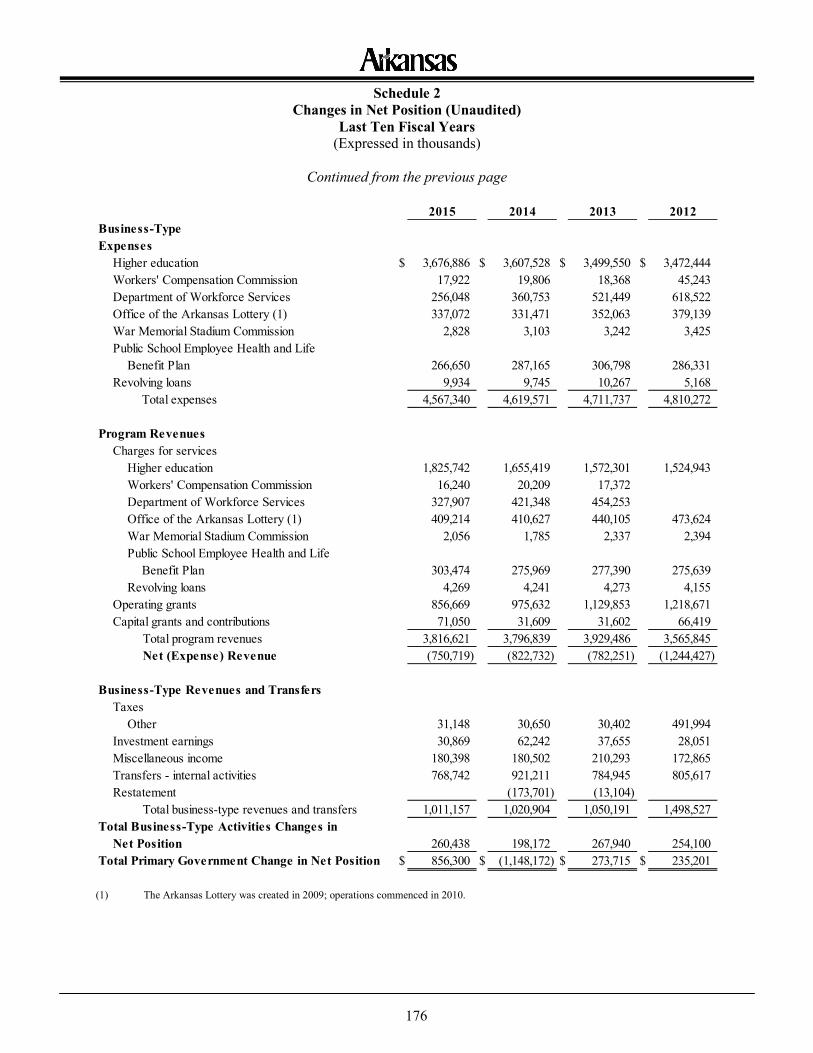
176
Schedule 2 Changes in Net Position (Unaudited)
Last Ten Fiscal Years (Expressed in thousands)
Continued from the previous page
(1) The Arkansas Lottery was created in 2009; operations commenced in 2010.
2015 2014 2013 2012Business-Type
Higher education $ 3,676,886 $ 3,607,528 $ 3,499,550 $ 3,472,444Workers' Compensation Commission 17,922 19,806 18,368 45,243Department of Workforce Services 256,048 360,753 521,449 618,522Office of the Arkansas Lottery (1) 337,072 331,471 352,063 379,139War Memorial Stadium Commission 2,828 3,103 3,242 3,425Public School Employee Health and Life
Benefit Plan 266,650 287,165 306,798 286,331Revolving loans 9,934 9,745 10,267 5,168
Total expenses 4,567,340 4,619,571 4,711,737 4,810,272
Program RevenuesCharges for services
Higher education 1,825,742 1,655,419 1,572,301 1,524,943Workers' Compensation Commission 16,240 20,209 17,372Department of Workforce Services 327,907 421,348 454,253Office of the Arkansas Lottery (1) 409,214 410,627 440,105 473,624War Memorial Stadium Commission 2,056 1,785 2,337 2,394Public School Employee Health and Life
Benefit Plan 303,474 275,969 277,390 275,639Revolving loans 4,269 4,241 4,273 4,155
Operating grants 856,669 975,632 1,129,853 1,218,671Capital grants and contributions 71,050 31,609 31,602 66,419
Total program revenues 3,816,621 3,796,839 3,929,486 3,565,845Net (Expense) Revenue (750,719) (822,732) (782,251) (1,244,427)
Business-Type Revenues and TransfersTaxes
Other 31,148 30,650 30,402 491,994Investment earnings 30,869 62,242 37,655 28,051Miscellaneous income 180,398 180,502 210,293 172,865Transfers - internal activities 768,742 921,211 784,945 805,617Restatement (173,701) (13,104)
Total business-type revenues and transfers 1,011,157 1,020,904 1,050,191 1,498,527Total Business-Type Activities Changes in
Net Position 260,438 198,172 267,940 254,100Total Primary Government Change in Net Position $ 856,300 $ (1,148,172) $ 273,715 $ 235,201
Expenses
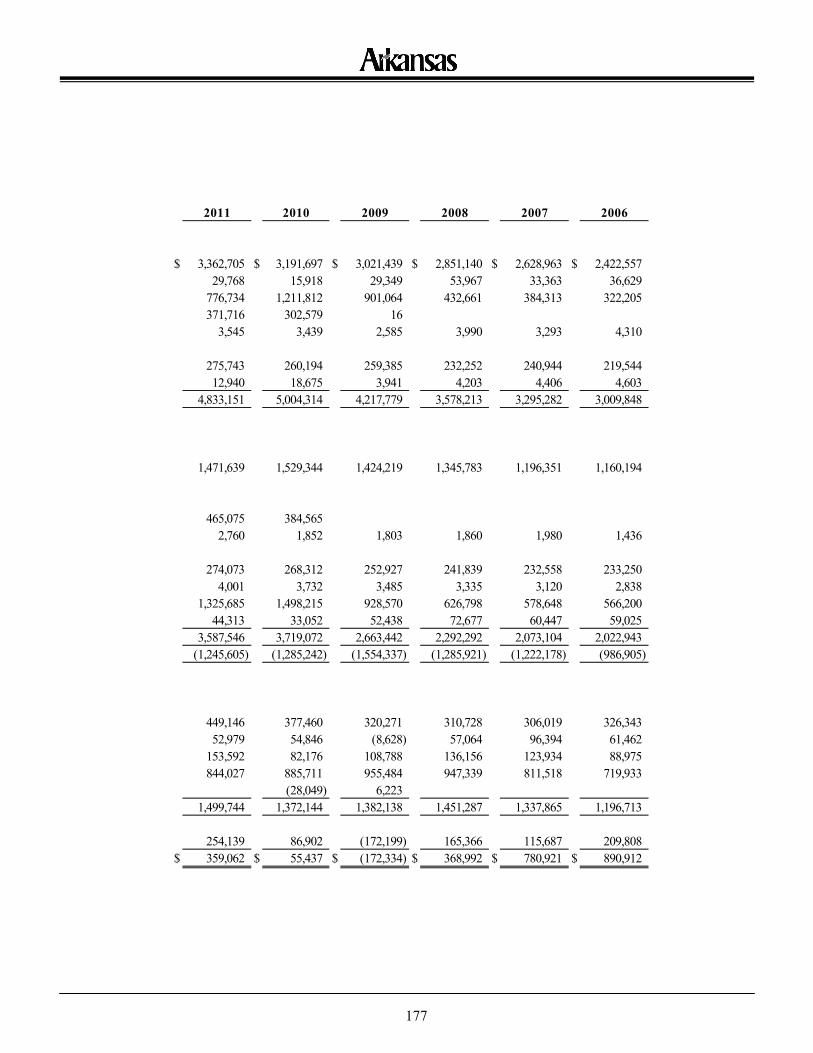
177
2011 2010 2009 2008 2007 2006
$ 3,362,705 $ 3,191,697 $ 3,021,439 $ 2,851,140 $ 2,628,963 $ 2,422,55729,768 15,918 29,349 53,967 33,363 36,629
776,734 1,211,812 901,064 432,661 384,313 322,205371,716 302,579 16
3,545 3,439 2,585 3,990 3,293 4,310
275,743 260,194 259,385 232,252 240,944 219,54412,940 18,675 3,941 4,203 4,406 4,603
4,833,151 5,004,314 4,217,779 3,578,213 3,295,282 3,009,848
1,471,639 1,529,344 1,424,219 1,345,783 1,196,351 1,160,194
465,075 384,5652,760 1,852 1,803 1,860 1,980 1,436
274,073 268,312 252,927 241,839 232,558 233,2504,001 3,732 3,485 3,335 3,120 2,838
1,325,685 1,498,215 928,570 626,798 578,648 566,20044,313 33,052 52,438 72,677 60,447 59,025
3,587,546 3,719,072 2,663,442 2,292,292 2,073,104 2,022,943(1,245,605) (1,285,242) (1,554,337) (1,285,921) (1,222,178) (986,905)
449,146 377,460 320,271 310,728 306,019 326,34352,979 54,846 (8,628) 57,064 96,394 61,462
153,592 82,176 108,788 136,156 123,934 88,975844,027 885,711 955,484 947,339 811,518 719,933
(28,049) 6,2231,499,744 1,372,144 1,382,138 1,451,287 1,337,865 1,196,713
254,139 86,902 (172,199) 165,366 115,687 209,808$ 359,062 $ 55,437 $ (172,334) $ 368,992 $ 780,921 $ 890,912
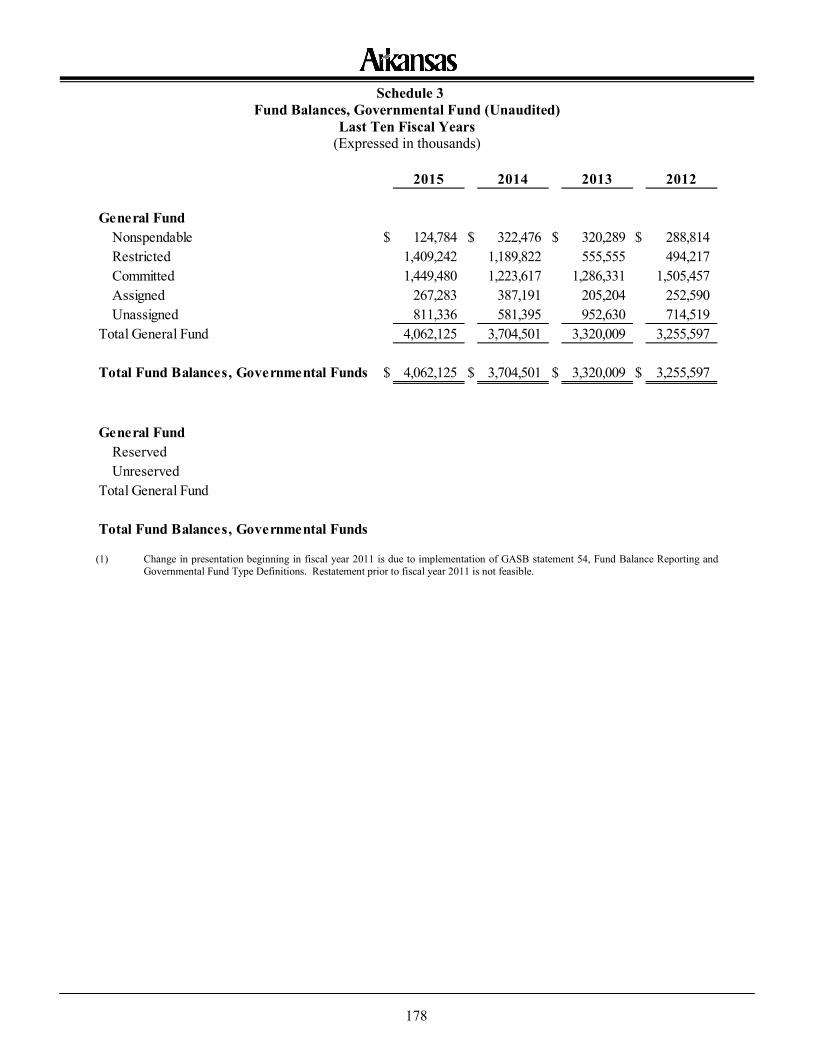
178
Schedule 3 Fund Balances, Governmental Fund (Unaudited)
Last Ten Fiscal Years (Expressed in thousands)
(1) Change in presentation beginning in fiscal year 2011 is due to implementation of GASB statement 54, Fund Balance Reporting and
Governmental Fund Type Definitions. Restatement prior to fiscal year 2011 is not feasible.
2015 2014 2013 2012
General FundNonspendable $ 124,784 $ 322,476 $ 320,289 $ 288,814Restricted 1,409,242 1,189,822 555,555 494,217Committed 1,449,480 1,223,617 1,286,331 1,505,457Assigned 267,283 387,191 205,204 252,590Unassigned 811,336 581,395 952,630 714,519
Total General Fund 4,062,125 3,704,501 3,320,009 3,255,597
Total Fund Balances, Governmental Funds $ 4,062,125 $ 3,704,501 $ 3,320,009 $ 3,255,597
General FundReservedUnreserved
Total General Fund
Total Fund Balances, Governmental Funds
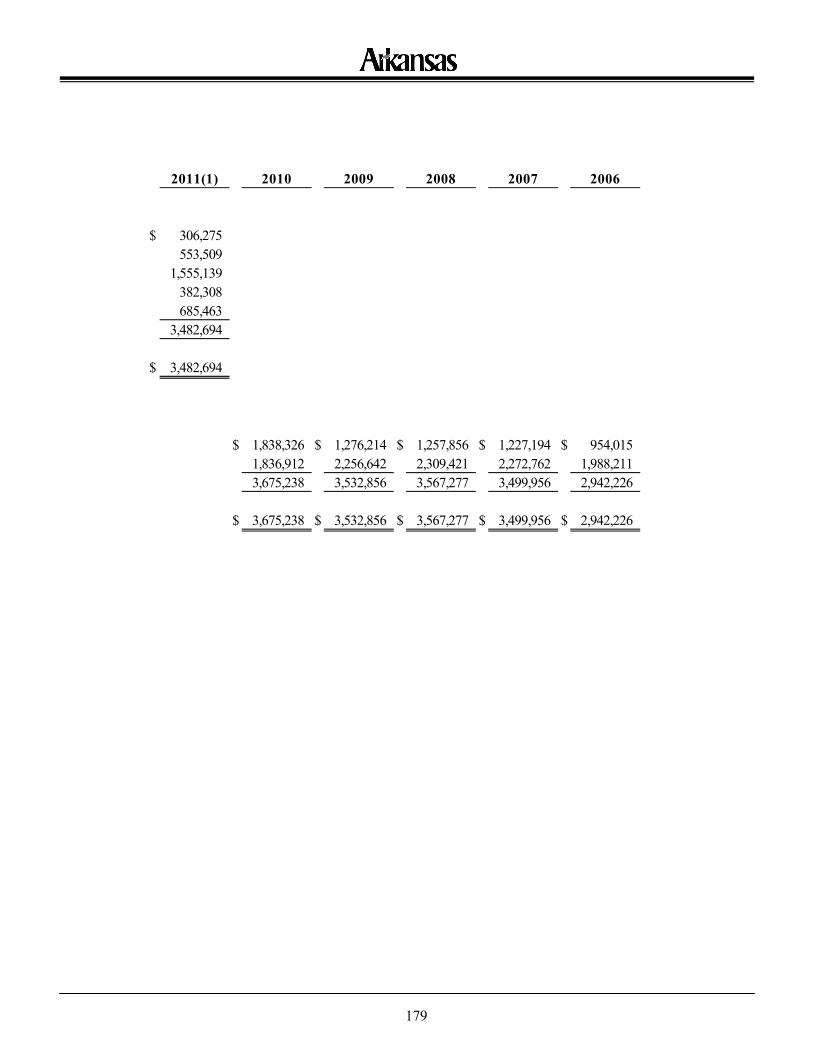
179
2011(1) 2010 2009 2008 2007 2006
$ 306,275553,509
1,555,139382,308685,463
3,482,694
$ 3,482,694
$ 1,838,326 $ 1,276,214 $ 1,257,856 $ 1,227,194 $ 954,0151,836,912 2,256,642 2,309,421 2,272,762 1,988,2113,675,238 3,532,856 3,567,277 3,499,956 2,942,226
$ 3,675,238 $ 3,532,856 $ 3,567,277 $ 3,499,956 $ 2,942,226
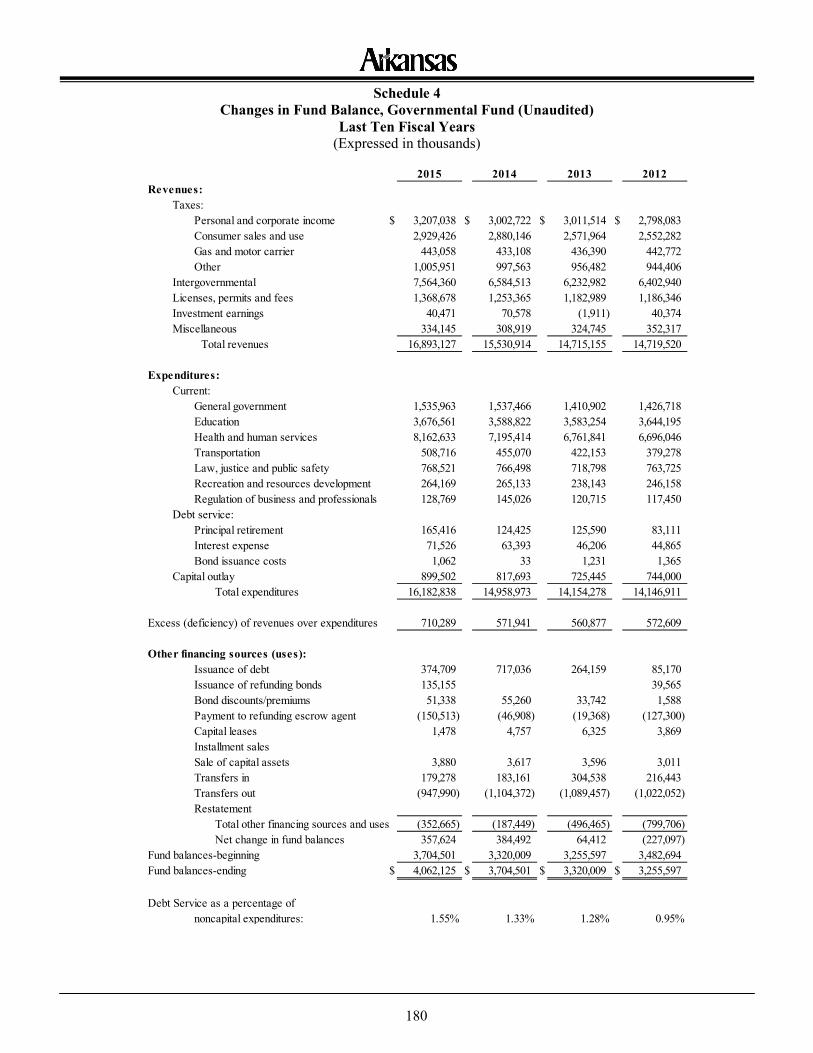
180
Schedule 4 Changes in Fund Balance, Governmental Fund (Unaudited)
Last Ten Fiscal Years (Expressed in thousands)
2015 2014 2013 2012Revenues:
Taxes:Personal and corporate income $ 3,207,038 $ 3,002,722 $ 3,011,514 $ 2,798,083Consumer sales and use 2,929,426 2,880,146 2,571,964 2,552,282Gas and motor carrier 443,058 433,108 436,390 442,772Other 1,005,951 997,563 956,482 944,406
Intergovernmental 7,564,360 6,584,513 6,232,982 6,402,940Licenses, permits and fees 1,368,678 1,253,365 1,182,989 1,186,346Investment earnings 40,471 70,578 (1,911) 40,374Miscellaneous 334,145 308,919 324,745 352,317
Total revenues 16,893,127 15,530,914 14,715,155 14,719,520
Expenditures:Current:
General government 1,535,963 1,537,466 1,410,902 1,426,718Education 3,676,561 3,588,822 3,583,254 3,644,195Health and human services 8,162,633 7,195,414 6,761,841 6,696,046Transportation 508,716 455,070 422,153 379,278Law, justice and public safety 768,521 766,498 718,798 763,725Recreation and resources development 264,169 265,133 238,143 246,158Regulation of business and professionals 128,769 145,026 120,715 117,450
Debt service:Principal retirement 165,416 124,425 125,590 83,111Interest expense 71,526 63,393 46,206 44,865Bond issuance costs 1,062 33 1,231 1,365
Capital outlay 899,502 817,693 725,445 744,000Total expenditures 16,182,838 14,958,973 14,154,278 14,146,911
Excess (deficiency) of revenues over expenditures 710,289 571,941 560,877 572,609
Other financing sources (uses):Issuance of debt 374,709 717,036 264,159 85,170Issuance of refunding bonds 135,155 39,565Bond discounts/premiums 51,338 55,260 33,742 1,588Payment to refunding escrow agent (150,513) (46,908) (19,368) (127,300)Capital leases 1,478 4,757 6,325 3,869Installment salesSale of capital assets 3,880 3,617 3,596 3,011Transfers in 179,278 183,161 304,538 216,443Transfers out (947,990) (1,104,372) (1,089,457) (1,022,052)Restatement
Total other financing sources and uses (352,665) (187,449) (496,465) (799,706)Net change in fund balances 357,624 384,492 64,412 (227,097)
Fund balances-beginning 3,704,501 3,320,009 3,255,597 3,482,694Fund balances-ending $ 4,062,125 $ 3,704,501 $ 3,320,009 $ 3,255,597
Debt Service as a percentage ofnoncapital expenditures: 1.55% 1.33% 1.28% 0.95%
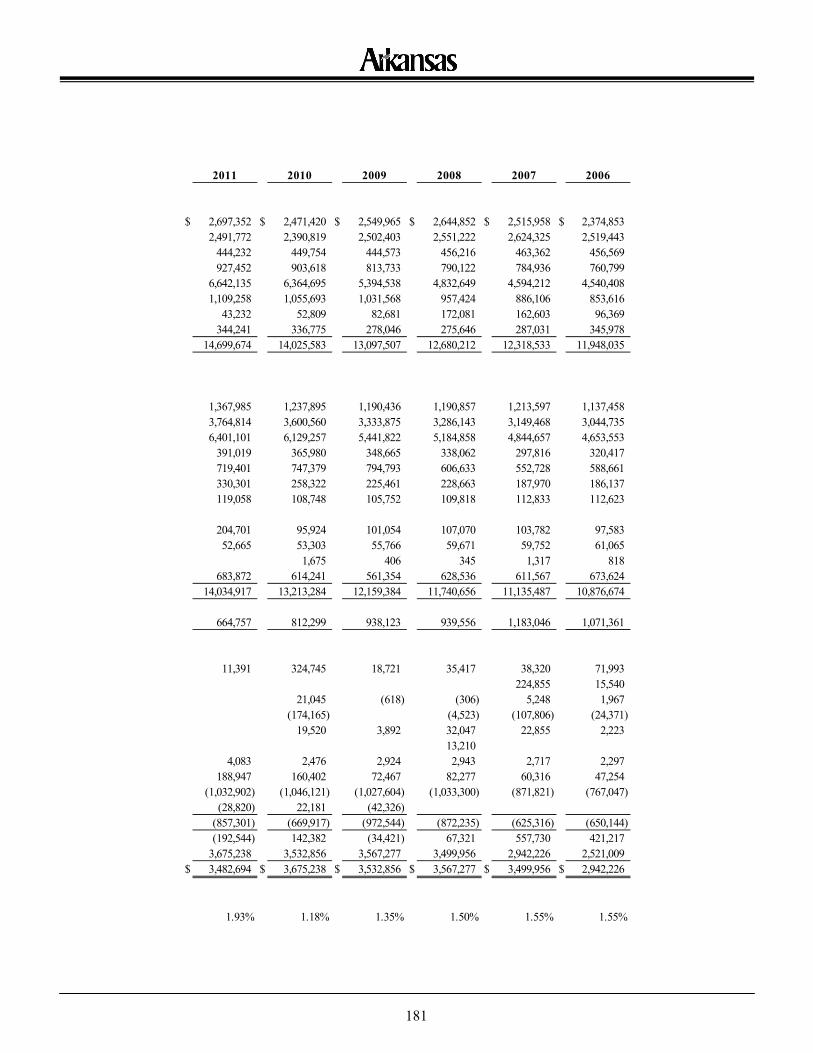
181
2011 2010 2009 2008 2007 2006
$ 2,697,352 $ 2,471,420 $ 2,549,965 $ 2,644,852 $ 2,515,958 $ 2,374,8532,491,772 2,390,819 2,502,403 2,551,222 2,624,325 2,519,443
444,232 449,754 444,573 456,216 463,362 456,569927,452 903,618 813,733 790,122 784,936 760,799
6,642,135 6,364,695 5,394,538 4,832,649 4,594,212 4,540,4081,109,258 1,055,693 1,031,568 957,424 886,106 853,616
43,232 52,809 82,681 172,081 162,603 96,369344,241 336,775 278,046 275,646 287,031 345,978
14,699,674 14,025,583 13,097,507 12,680,212 12,318,533 11,948,035
1,367,985 1,237,895 1,190,436 1,190,857 1,213,597 1,137,4583,764,814 3,600,560 3,333,875 3,286,143 3,149,468 3,044,7356,401,101 6,129,257 5,441,822 5,184,858 4,844,657 4,653,553
391,019 365,980 348,665 338,062 297,816 320,417719,401 747,379 794,793 606,633 552,728 588,661330,301 258,322 225,461 228,663 187,970 186,137119,058 108,748 105,752 109,818 112,833 112,623
204,701 95,924 101,054 107,070 103,782 97,58352,665 53,303 55,766 59,671 59,752 61,065
1,675 406 345 1,317 818683,872 614,241 561,354 628,536 611,567 673,624
14,034,917 13,213,284 12,159,384 11,740,656 11,135,487 10,876,674
664,757 812,299 938,123 939,556 1,183,046 1,071,361
11,391 324,745 18,721 35,417 38,320 71,993224,855 15,540
21,045 (618) (306) 5,248 1,967(174,165) (4,523) (107,806) (24,371)
19,520 3,892 32,047 22,855 2,22313,210
4,083 2,476 2,924 2,943 2,717 2,297188,947 160,402 72,467 82,277 60,316 47,254
(1,032,902) (1,046,121) (1,027,604) (1,033,300) (871,821) (767,047)(28,820) 22,181 (42,326)
(857,301) (669,917) (972,544) (872,235) (625,316) (650,144)(192,544) 142,382 (34,421) 67,321 557,730 421,217
3,675,238 3,532,856 3,567,277 3,499,956 2,942,226 2,521,009$ 3,482,694 $ 3,675,238 $ 3,532,856 $ 3,567,277 $ 3,499,956 $ 2,942,226
1.93% 1.18% 1.35% 1.50% 1.55% 1.55%
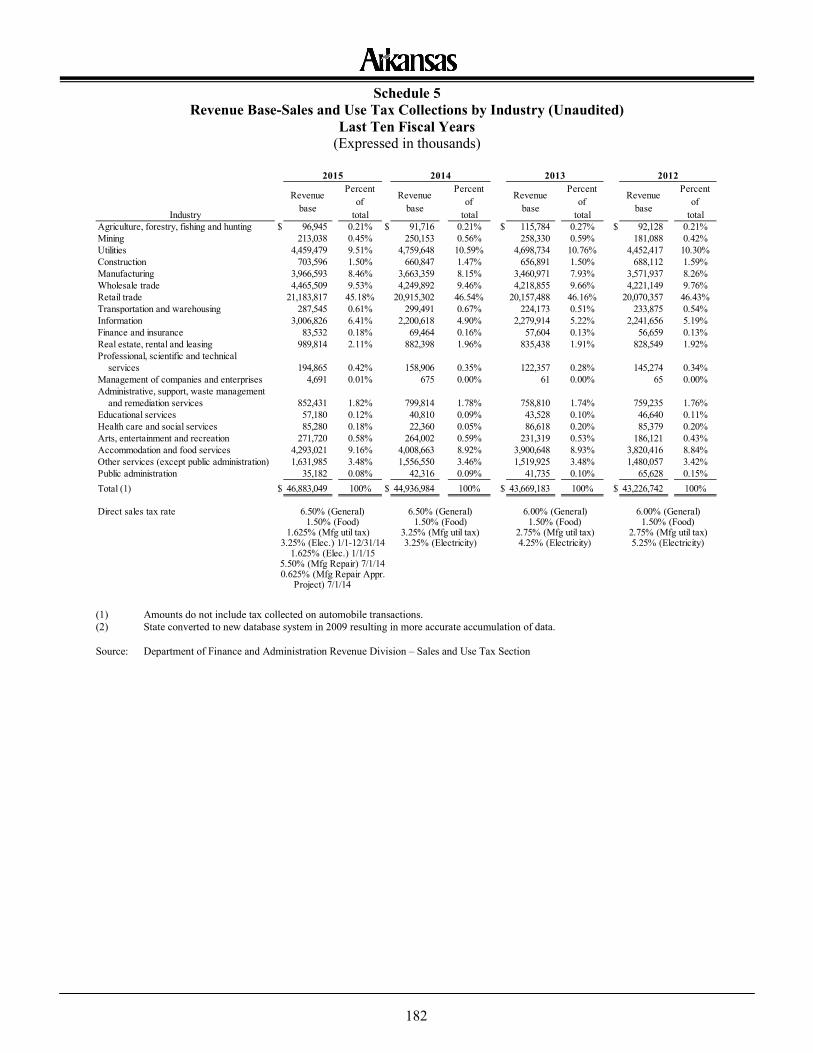
182
Schedule 5 Revenue Base-Sales and Use Tax Collections by Industry (Unaudited)
Last Ten Fiscal Years (Expressed in thousands)
(1) Amounts do not include tax collected on automobile transactions. (2) State converted to new database system in 2009 resulting in more accurate accumulation of data. Source: Department of Finance and Administration Revenue Division – Sales and Use Tax Section
Revenue base
Percent of
total
Revenue base
Percent of
total
Revenue base
Percent of
total
Revenue base
Percent of
total$ 96,945 0.21% $ 91,716 0.21% $ 115,784 0.27% $ 92,128 0.21%
213,038 0.45% 250,153 0.56% 258,330 0.59% 181,088 0.42%4,459,479 9.51% 4,759,648 10.59% 4,698,734 10.76% 4,452,417 10.30%
703,596 1.50% 660,847 1.47% 656,891 1.50% 688,112 1.59%3,966,593 8.46% 3,663,359 8.15% 3,460,971 7.93% 3,571,937 8.26%4,465,509 9.53% 4,249,892 9.46% 4,218,855 9.66% 4,221,149 9.76%
21,183,817 45.18% 20,915,302 46.54% 20,157,488 46.16% 20,070,357 46.43%287,545 0.61% 299,491 0.67% 224,173 0.51% 233,875 0.54%
3,006,826 6.41% 2,200,618 4.90% 2,279,914 5.22% 2,241,656 5.19%Finance and insurance 83,532 0.18% 69,464 0.16% 57,604 0.13% 56,659 0.13%Real estate, rental and leasing 989,814 2.11% 882,398 1.96% 835,438 1.91% 828,549 1.92%Professional, scientific and technical
194,865 0.42% 158,906 0.35% 122,357 0.28% 145,274 0.34%Management of companies and enterprises 4,691 0.01% 675 0.00% 61 0.00% 65 0.00%Administrative, support, waste management
852,431 1.82% 799,814 1.78% 758,810 1.74% 759,235 1.76%Educational services 57,180 0.12% 40,810 0.09% 43,528 0.10% 46,640 0.11%Health care and social services 85,280 0.18% 22,360 0.05% 86,618 0.20% 85,379 0.20%Arts, entertainment and recreation 271,720 0.58% 264,002 0.59% 231,319 0.53% 186,121 0.43%Accommodation and food services 4,293,021 9.16% 4,008,663 8.92% 3,900,648 8.93% 3,820,416 8.84%Other services (except public administration) 1,631,985 3.48% 1,556,550 3.46% 1,519,925 3.48% 1,480,057 3.42%Public administration 35,182 0.08% 42,316 0.09% 41,735 0.10% 65,628 0.15%Total (1) $ 46,883,049 100% $ 44,936,984 100% $ 43,669,183 100% $ 43,226,742 100%
Direct sales tax rate 6.50% (General)1.50% (Food)
1.625% (Mfg util tax)3.25% (Elec.) 1/1-12/31/14
1.625% (Elec.) 1/1/155.50% (Mfg Repair) 7/1/140.625% (Mfg Repair Appr.
Project) 7/1/14
Industry
Wholesale trade
Agriculture, forestry, fishing and huntingMiningUtilitiesConstructionManufacturing
Retail tradeTransportation and warehousingInformation
services
and remediation services
2015 2014 2013 2012
1.50% (Food) 1.50% (Food) 1.50% (Food)6.50% (General) 6.00% (General) 6.00% (General)
4.25% (Electricity)3.25% (Mfg util tax) 2.75% (Mfg util tax) 2.75% (Mfg util tax)3.25% (Electricity) 5.25% (Electricity)
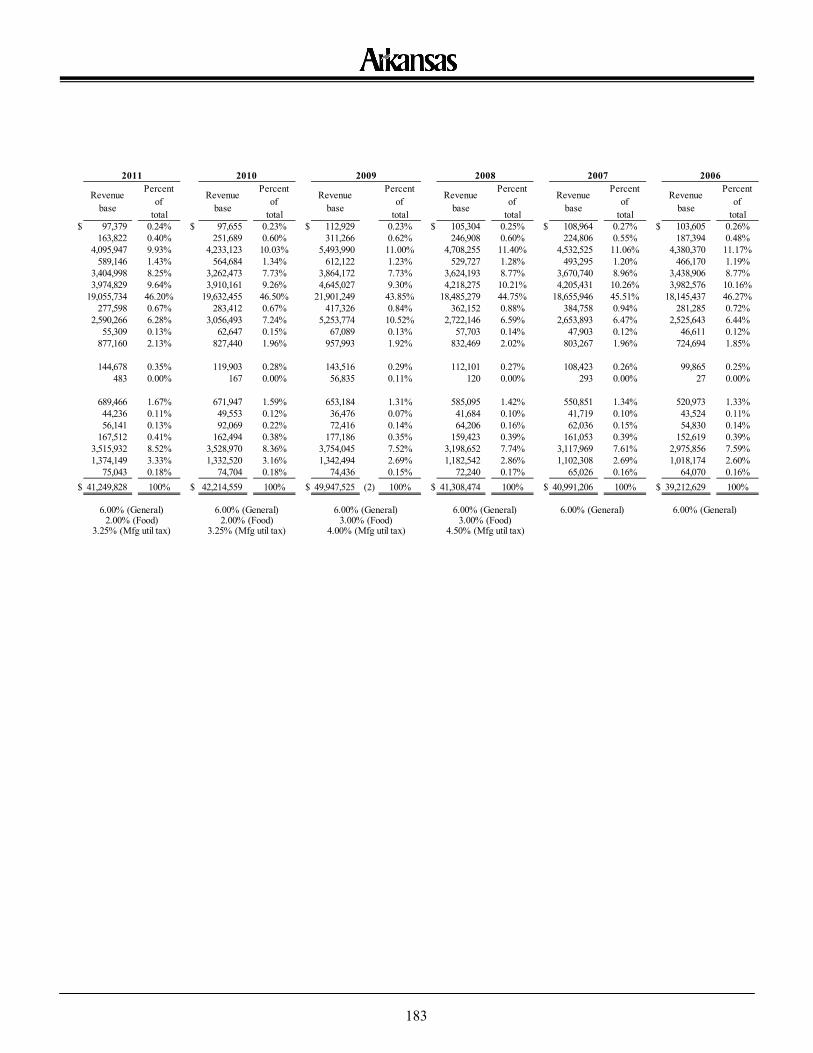
183
Revenue base
Percent of
total
Revenue base
Percent of
total
Revenue base
Percent of
total
Revenue base
Percent of
total
Revenue base
Percent of
total
Revenue base
Percent of
total$ 97,379 0.24% $ 97,655 0.23% $ 112,929 0.23% $ 105,304 0.25% $ 108,964 0.27% $ 103,605 0.26%
163,822 0.40% 251,689 0.60% 311,266 0.62% 246,908 0.60% 224,806 0.55% 187,394 0.48%4,095,947 9.93% 4,233,123 10.03% 5,493,990 11.00% 4,708,255 11.40% 4,532,525 11.06% 4,380,370 11.17%
589,146 1.43% 564,684 1.34% 612,122 1.23% 529,727 1.28% 493,295 1.20% 466,170 1.19%3,404,998 8.25% 3,262,473 7.73% 3,864,172 7.73% 3,624,193 8.77% 3,670,740 8.96% 3,438,906 8.77%3,974,829 9.64% 3,910,161 9.26% 4,645,027 9.30% 4,218,275 10.21% 4,205,431 10.26% 3,982,576 10.16%
19,055,734 46.20% 19,632,455 46.50% 21,901,249 43.85% 18,485,279 44.75% 18,655,946 45.51% 18,145,437 46.27%277,598 0.67% 283,412 0.67% 417,326 0.84% 362,152 0.88% 384,758 0.94% 281,285 0.72%
2,590,266 6.28% 3,056,493 7.24% 5,253,774 10.52% 2,722,146 6.59% 2,653,893 6.47% 2,525,643 6.44%55,309 0.13% 62,647 0.15% 67,089 0.13% 57,703 0.14% 47,903 0.12% 46,611 0.12%
877,160 2.13% 827,440 1.96% 957,993 1.92% 832,469 2.02% 803,267 1.96% 724,694 1.85%
144,678 0.35% 119,903 0.28% 143,516 0.29% 112,101 0.27% 108,423 0.26% 99,865 0.25%483 0.00% 167 0.00% 56,835 0.11% 120 0.00% 293 0.00% 27 0.00%
689,466 1.67% 671,947 1.59% 653,184 1.31% 585,095 1.42% 550,851 1.34% 520,973 1.33%44,236 0.11% 49,553 0.12% 36,476 0.07% 41,684 0.10% 41,719 0.10% 43,524 0.11%56,141 0.13% 92,069 0.22% 72,416 0.14% 64,206 0.16% 62,036 0.15% 54,830 0.14%
167,512 0.41% 162,494 0.38% 177,186 0.35% 159,423 0.39% 161,053 0.39% 152,619 0.39%3,515,932 8.52% 3,528,970 8.36% 3,754,045 7.52% 3,198,652 7.74% 3,117,969 7.61% 2,975,856 7.59%1,374,149 3.33% 1,332,520 3.16% 1,342,494 2.69% 1,182,542 2.86% 1,102,308 2.69% 1,018,174 2.60%
75,043 0.18% 74,704 0.18% 74,436 0.15% 72,240 0.17% 65,026 0.16% 64,070 0.16%$ 41,249,828 100% $ 42,214,559 100% $ 49,947,525 (2) 100% $ 41,308,474 100% $ 40,991,206 100% $ 39,212,629 100%
6.00% (General) 6.00% (General)
4.50% (Mfg util tax)3.00% (Food)
4.00% (Mfg util tax)3.25% (Mfg util tax)3.25% (Mfg util tax)
6.00% (General)2.00% (Food) 2.00% (Food)
6.00% (General) 6.00% (General) 6.00% (General)3.00% (Food)
2011 2010 2009 2008 2007 2006
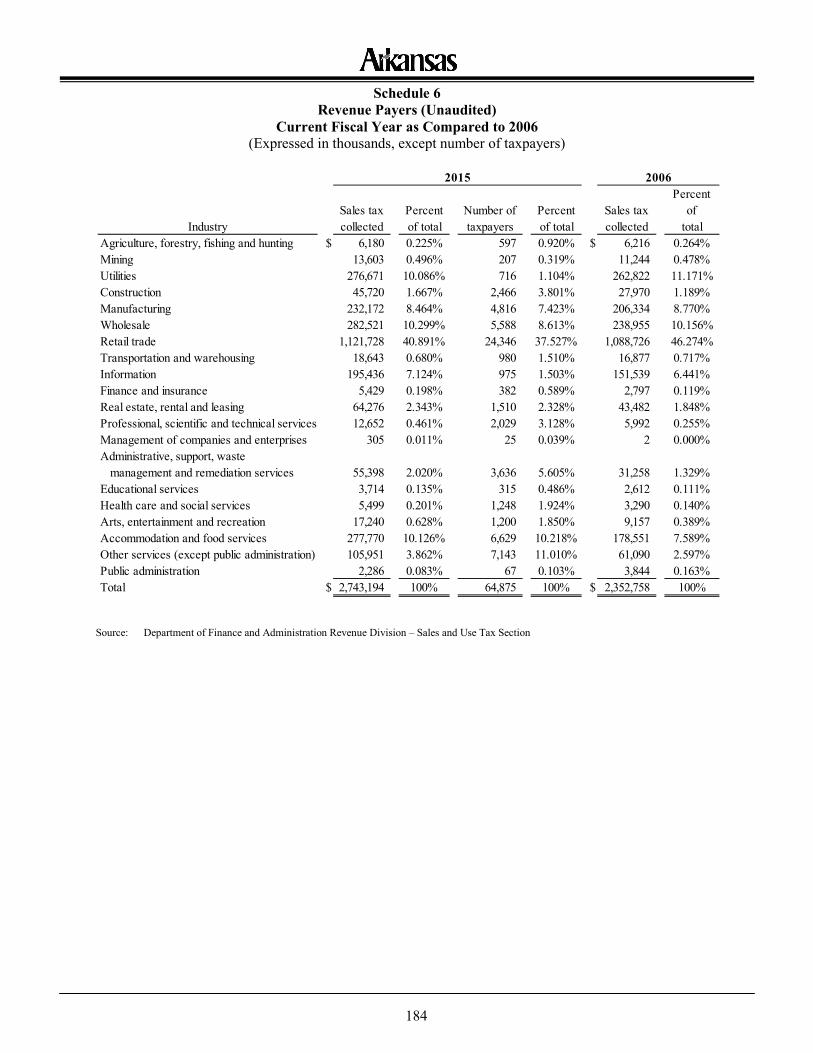
184
Schedule 6 Revenue Payers (Unaudited)
Current Fiscal Year as Compared to 2006 (Expressed in thousands, except number of taxpayers)
Source: Department of Finance and Administration Revenue Division – Sales and Use Tax Section
IndustrySales tax collected
Percent of total
Number of taxpayers
Percent of total
Sales tax collected
Percent of
totalAgriculture, forestry, fishing and hunting $ 6,180 0.225% 597 0.920% $ 6,216 0.264%Mining 13,603 0.496% 207 0.319% 11,244 0.478%Utilities 276,671 10.086% 716 1.104% 262,822 11.171%Construction 45,720 1.667% 2,466 3.801% 27,970 1.189%Manufacturing 232,172 8.464% 4,816 7.423% 206,334 8.770%Wholesale 282,521 10.299% 5,588 8.613% 238,955 10.156%Retail trade 1,121,728 40.891% 24,346 37.527% 1,088,726 46.274%Transportation and warehousing 18,643 0.680% 980 1.510% 16,877 0.717%Information 195,436 7.124% 975 1.503% 151,539 6.441%Finance and insurance 5,429 0.198% 382 0.589% 2,797 0.119%Real estate, rental and leasing 64,276 2.343% 1,510 2.328% 43,482 1.848%Professional, scientific and technical services 12,652 0.461% 2,029 3.128% 5,992 0.255%Management of companies and enterprises 305 0.011% 25 0.039% 2 0.000%Administrative, support, waste management and remediation services 55,398 2.020% 3,636 5.605% 31,258 1.329%Educational services 3,714 0.135% 315 0.486% 2,612 0.111%Health care and social services 5,499 0.201% 1,248 1.924% 3,290 0.140%Arts, entertainment and recreation 17,240 0.628% 1,200 1.850% 9,157 0.389%Accommodation and food services 277,770 10.126% 6,629 10.218% 178,551 7.589%Other services (except public administration) 105,951 3.862% 7,143 11.010% 61,090 2.597%Public administration 2,286 0.083% 67 0.103% 3,844 0.163%Total $ 2,743,194 100% 64,875 100% $ 2,352,758 100%
2015 2006
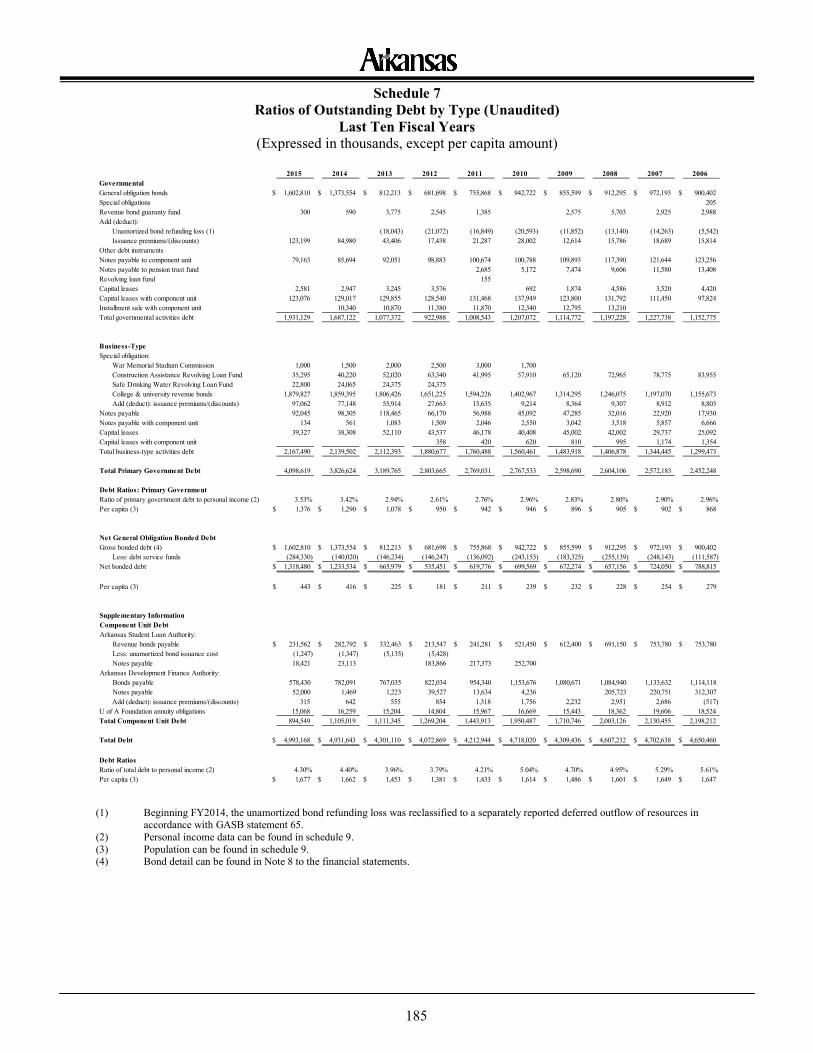
185
Schedule 7 Ratios of Outstanding Debt by Type (Unaudited)
Last Ten Fiscal Years (Expressed in thousands, except per capita amount)
(1) Beginning FY2014, the unamortized bond refunding loss was reclassified to a separately reported deferred outflow of resources in
accordance with GASB statement 65. (2) Personal income data can be found in schedule 9. (3) Population can be found in schedule 9. (4) Bond detail can be found in Note 8 to the financial statements.
2015 2014 2013 2012 2011 2010 2009 2008 2007 2006
General obligation bonds $ 1,602,810 $ 1,373,554 $ 812,213 $ 681,698 $ 755,868 $ 942,722 $ 855,599 $ 912,295 $ 972,193 $ 900,402Special obligations 205Revenue bond guaranty fund 300 590 3,775 2,545 1,385 2,575 5,703 2,925 2,988Add (deduct):
Unamortized bond refunding loss (1) (18,043) (21,072) (16,849) (20,593) (11,852) (13,140) (14,263) (5,542)Issuance premiums/(discounts) 123,199 84,980 43,406 17,438 21,287 28,002 12,614 15,786 18,689 15,814
Other debt instrumentsNotes payable to component unit 79,163 85,694 92,051 98,883 100,674 100,788 109,893 117,390 121,644 123,256Notes payable to pension trust fund 2,685 5,172 7,474 9,606 11,580 13,408Revolving loan fund 155Capital leases 2,581 2,947 3,245 3,576 692 1,874 4,586 3,520 4,420Capital leases with component unit 123,076 129,017 129,855 128,540 131,468 137,949 123,800 131,792 111,450 97,824Installment sale with component unit 10,340 10,870 11,380 11,870 12,340 12,795 13,210Total governmental activities debt 1,931,129 1,687,122 1,077,372 922,988 1,008,543 1,207,072 1,114,772 1,197,228 1,227,738 1,152,775
Business-Type Special obligation:
War Memorial Stadium Commission 1,000 1,500 2,000 2,500 3,000 1,700Construction Assistance Revolving Loan Fund 35,295 40,220 52,020 63,340 41,995 57,910 65,120 72,965 78,775 83,955Safe Drinking Water Revolving Loan Fund 22,800 24,065 24,375 24,375College & university revenue bonds 1,879,827 1,859,395 1,806,426 1,651,225 1,594,226 1,402,967 1,314,295 1,246,075 1,197,070 1,155,673Add (deduct): issuance premiums/(discounts) 97,062 77,148 55,914 27,663 15,635 9,214 8,364 9,307 8,912 8,803
Notes payable 92,045 98,305 118,465 66,170 56,988 45,092 47,285 32,016 22,920 17,930Notes payable with component unit 134 561 1,083 1,509 2,046 2,550 3,042 3,518 5,857 6,666Capital leases 39,327 38,308 52,110 43,537 46,178 40,408 45,002 42,002 29,737 25,092Capital leases with component unit 358 420 620 810 995 1,174 1,354Total business-type activities debt 2,167,490 2,139,502 2,112,393 1,880,677 1,760,488 1,560,461 1,483,918 1,406,878 1,344,445 1,299,473
Total Primary Government Debt 4,098,619 3,826,624 3,189,765 2,803,665 2,769,031 2,767,533 2,598,690 2,604,106 2,572,183 2,452,248
Debt Ratios: Primary GovernmentRatio of primary government debt to personal income (2) 3.53% 3.42% 2.94% 2.61% 2.76% 2.96% 2.83% 2.80% 2.90% 2.96%Per capita (3) $ 1,376 $ 1,290 $ 1,078 $ 950 $ 942 $ 946 $ 896 $ 905 $ 902 $ 868
Net General Obligation Bonded DebtGross bonded debt (4) $ 1,602,810 $ 1,373,554 $ 812,213 $ 681,698 $ 755,868 $ 942,722 $ 855,599 $ 912,295 $ 972,193 $ 900,402
Less: debt service funds (284,330) (140,020) (146,234) (146,247) (136,092) (243,153) (183,325) (255,139) (248,143) (111,587)Net bonded debt $ 1,318,480 $ 1,233,534 $ 665,979 $ 535,451 $ 619,776 $ 699,569 $ 672,274 $ 657,156 $ 724,050 $ 788,815
Per capita (3) $ 443 $ 416 $ 225 $ 181 $ 211 $ 239 $ 232 $ 228 $ 254 $ 279
Supplementary InformationComponent Unit DebtArkansas Student Loan Authority:
Revenue bonds payable $ 231,562 $ 282,792 $ 332,463 $ 213,547 $ 241,281 $ 521,450 $ 612,400 $ 691,150 $ 753,780 $ 753,780Less: unamortized bond issuance cost (1,247) (1,347) (5,135) (5,428)Notes payable 18,421 23,113 183,866 217,373 252,700
Arkansas Development Finance Authority:Bonds payable 578,430 782,091 767,035 822,034 954,340 1,153,676 1,080,671 1,084,940 1,133,632 1,114,118Notes payable 52,000 1,469 1,223 39,527 13,634 4,236 205,723 220,751 312,307Add (deduct): issuance premiums/(discounts) 315 642 555 854 1,318 1,756 2,232 2,951 2,686 (517)
U of A Foundation annuity obligations 15,068 16,259 15,204 14,804 15,967 16,669 15,443 18,362 19,606 18,524894,549 1,105,019 1,111,345 1,269,204 1,443,913 1,950,487 1,710,746 2,003,126 2,130,455 2,198,212
Total Debt $ 4,993,168 $ 4,931,643 $ 4,301,110 $ 4,072,869 $ 4,212,944 $ 4,718,020 $ 4,309,436 $ 4,607,232 $ 4,702,638 $ 4,650,460
Debt RatiosRatio of total debt to personal income (2) 4.30% 4.40% 3.96% 3.79% 4.21% 5.04% 4.70% 4.95% 5.29% 5.61%Per capita (3) $ 1,677 $ 1,662 $ 1,453 $ 1,381 $ 1,433 $ 1,614 $ 1,486 $ 1,601 $ 1,649 $ 1,647
Total Component Unit Debt
Governmental
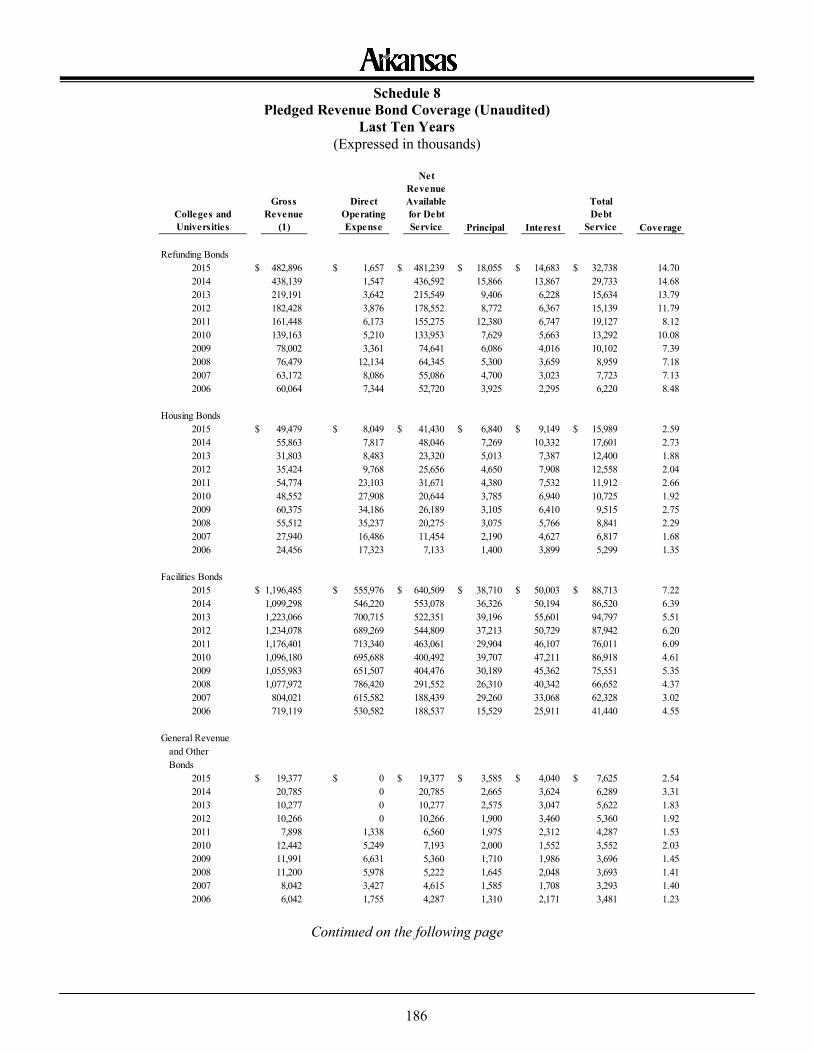
186
Schedule 8 Pledged Revenue Bond Coverage (Unaudited)
Last Ten Years (Expressed in thousands)
Continued on the following page
Colleges and Universities
Gross Revenue
(1)
Direct Operating Expense
Net Revenue Available for Debt Service Principal Interest
Total Debt
Service Coverage
Refunding Bonds2015 $ 482,896 $ 1,657 $ 481,239 $ 18,055 $ 14,683 $ 32,738 14.702014 438,139 1,547 436,592 15,866 13,867 29,733 14.682013 219,191 3,642 215,549 9,406 6,228 15,634 13.792012 182,428 3,876 178,552 8,772 6,367 15,139 11.792011 161,448 6,173 155,275 12,380 6,747 19,127 8.122010 139,163 5,210 133,953 7,629 5,663 13,292 10.082009 78,002 3,361 74,641 6,086 4,016 10,102 7.392008 76,479 12,134 64,345 5,300 3,659 8,959 7.182007 63,172 8,086 55,086 4,700 3,023 7,723 7.132006 60,064 7,344 52,720 3,925 2,295 6,220 8.48
Housing Bonds2015 $ 49,479 $ 8,049 $ 41,430 $ 6,840 $ 9,149 $ 15,989 2.592014 55,863 7,817 48,046 7,269 10,332 17,601 2.732013 31,803 8,483 23,320 5,013 7,387 12,400 1.882012 35,424 9,768 25,656 4,650 7,908 12,558 2.042011 54,774 23,103 31,671 4,380 7,532 11,912 2.662010 48,552 27,908 20,644 3,785 6,940 10,725 1.922009 60,375 34,186 26,189 3,105 6,410 9,515 2.752008 55,512 35,237 20,275 3,075 5,766 8,841 2.292007 27,940 16,486 11,454 2,190 4,627 6,817 1.682006 24,456 17,323 7,133 1,400 3,899 5,299 1.35
Facilities Bonds2015 $ 1,196,485 $ 555,976 $ 640,509 $ 38,710 $ 50,003 $ 88,713 7.222014 1,099,298 546,220 553,078 36,326 50,194 86,520 6.392013 1,223,066 700,715 522,351 39,196 55,601 94,797 5.512012 1,234,078 689,269 544,809 37,213 50,729 87,942 6.202011 1,176,401 713,340 463,061 29,904 46,107 76,011 6.092010 1,096,180 695,688 400,492 39,707 47,211 86,918 4.612009 1,055,983 651,507 404,476 30,189 45,362 75,551 5.352008 1,077,972 786,420 291,552 26,310 40,342 66,652 4.372007 804,021 615,582 188,439 29,260 33,068 62,328 3.022006 719,119 530,582 188,537 15,529 25,911 41,440 4.55
General Revenue and Other Bonds
2015 $ 19,377 $ 0 $ 19,377 $ 3,585 $ 4,040 $ 7,625 2.542014 20,785 0 20,785 2,665 3,624 6,289 3.312013 10,277 0 10,277 2,575 3,047 5,622 1.832012 10,266 0 10,266 1,900 3,460 5,360 1.922011 7,898 1,338 6,560 1,975 2,312 4,287 1.532010 12,442 5,249 7,193 2,000 1,552 3,552 2.032009 11,991 6,631 5,360 1,710 1,986 3,696 1.452008 11,200 5,978 5,222 1,645 2,048 3,693 1.412007 8,042 3,427 4,615 1,585 1,708 3,293 1.402006 6,042 1,755 4,287 1,310 2,171 3,481 1.23
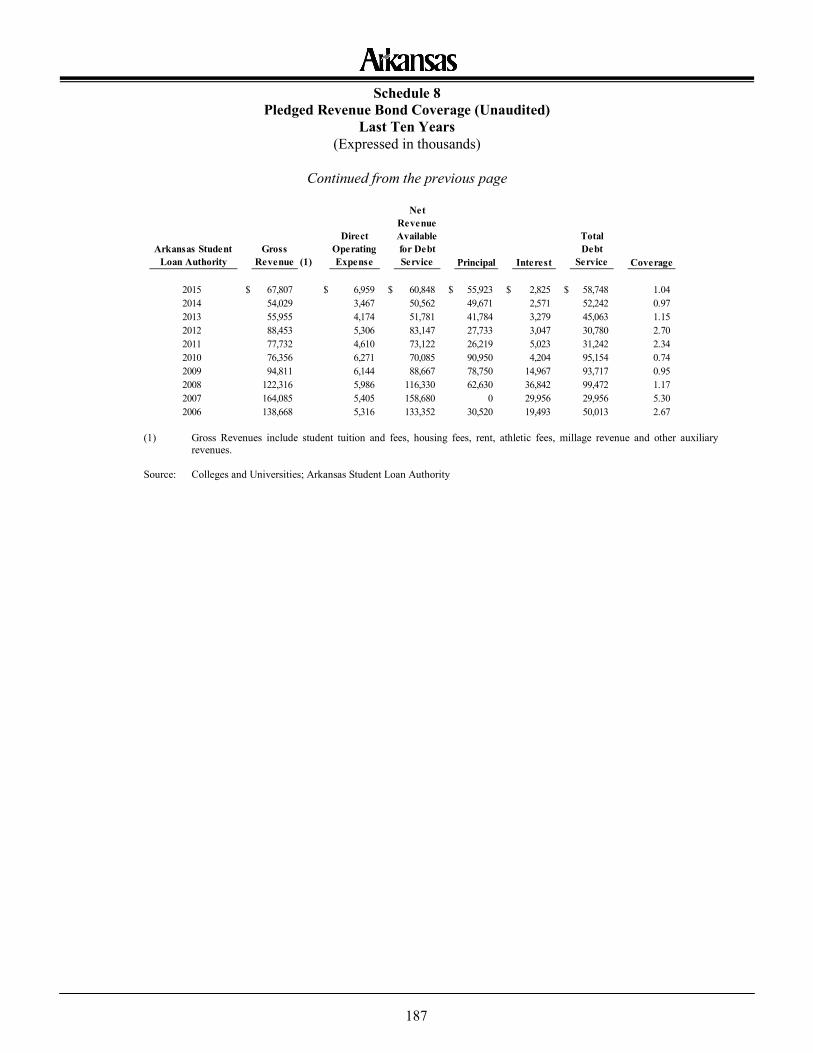
187
Schedule 8 Pledged Revenue Bond Coverage (Unaudited)
Last Ten Years (Expressed in thousands)
Continued from the previous page
(1) Gross Revenues include student tuition and fees, housing fees, rent, athletic fees, millage revenue and other auxiliary revenues.
Source: Colleges and Universities; Arkansas Student Loan Authority
Arkansas Student Loan Authority
Gross Revenue (1)
Direct Operating Expense
Net Revenue Available for Debt Service Principal Interest
Total Debt
Service Coverage
2015 $ 67,807 $ 6,959 $ 60,848 $ 55,923 $ 2,825 $ 58,748 1.042014 54,029 3,467 50,562 49,671 2,571 52,242 0.972013 55,955 4,174 51,781 41,784 3,279 45,063 1.152012 88,453 5,306 83,147 27,733 3,047 30,780 2.702011 77,732 4,610 73,122 26,219 5,023 31,242 2.342010 76,356 6,271 70,085 90,950 4,204 95,154 0.742009 94,811 6,144 88,667 78,750 14,967 93,717 0.952008 122,316 5,986 116,330 62,630 36,842 99,472 1.172007 164,085 5,405 158,680 0 29,956 29,956 5.302006 138,668 5,316 133,352 30,520 19,493 50,013 2.67
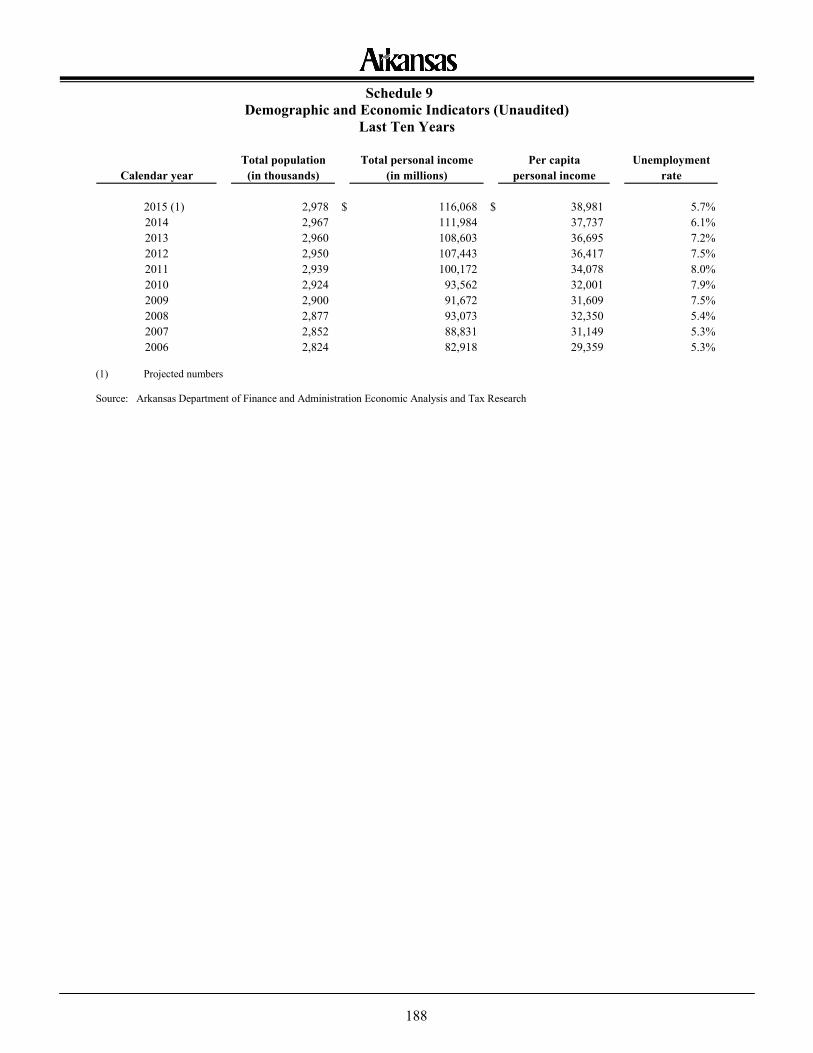
188
Schedule 9 Demographic and Economic Indicators (Unaudited)
Last Ten Years
(1) Projected numbers Source: Arkansas Department of Finance and Administration Economic Analysis and Tax Research
Total population Total personal income Per capita Unemployment(in thousands) (in millions) personal income rate
2,978 $ 116,068 $ 38,981 5.7%2,967 111,984 37,737 6.1%2,960 108,603 36,695 7.2%2,950 107,443 36,417 7.5%2,939 100,172 34,078 8.0%2,924 93,562 32,001 7.9%2,900 91,672 31,609 7.5%2,877 93,073 32,350 5.4%2,852 88,831 31,149 5.3%2,824 82,918 29,359 5.3%
2012
Calendar year
20132014
2015 (1)
201120102009200820072006
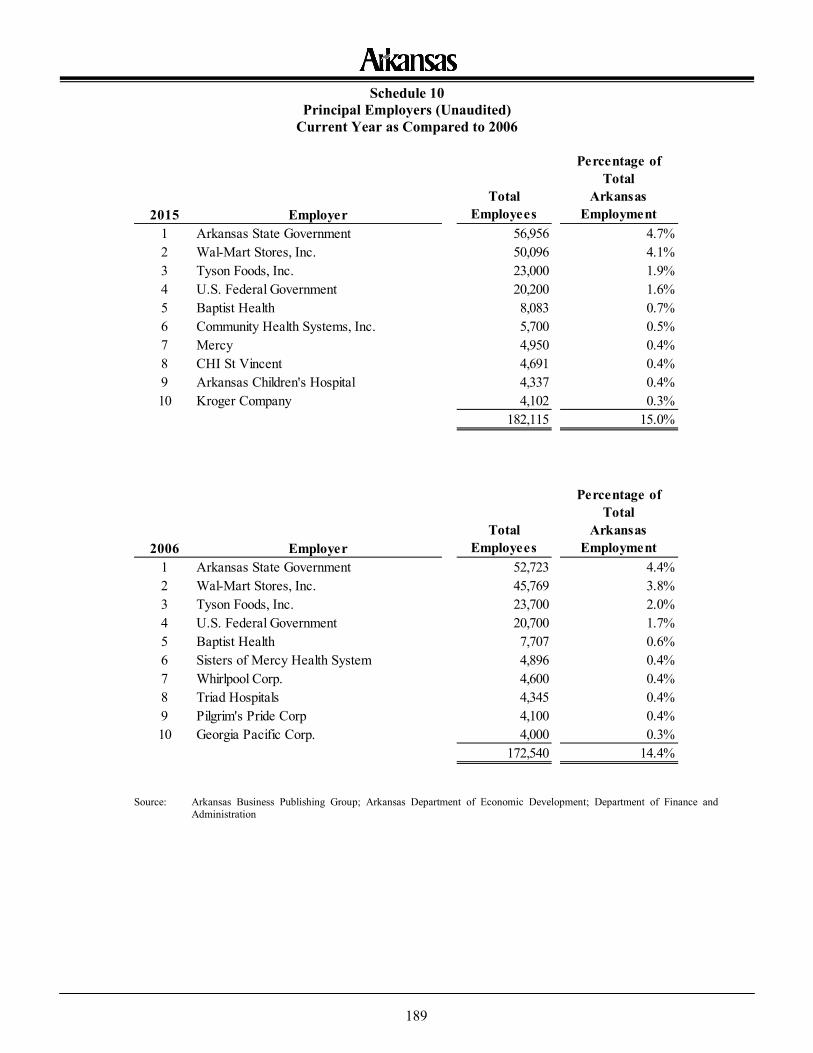
189
Schedule 10 Principal Employers (Unaudited)
Current Year as Compared to 2006
Source: Arkansas Business Publishing Group; Arkansas Department of Economic Development; Department of Finance and
Administration
2015 EmployerTotal
Employees
Percentage of Total
Arkansas Employment
1 Arkansas State Government 56,956 4.7%2 Wal-Mart Stores, Inc. 50,096 4.1%3 Tyson Foods, Inc. 23,000 1.9%4 U.S. Federal Government 20,200 1.6%5 Baptist Health 8,083 0.7%6 Community Health Systems, Inc. 5,700 0.5%7 Mercy 4,950 0.4%8 CHI St Vincent 4,691 0.4%9 Arkansas Children's Hospital 4,337 0.4%10 Kroger Company 4,102 0.3%
182,115 15.0%
2006 EmployerTotal
Employees
Percentage of Total
Arkansas Employment
1 Arkansas State Government 52,723 4.4%2 Wal-Mart Stores, Inc. 45,769 3.8%3 Tyson Foods, Inc. 23,700 2.0%4 U.S. Federal Government 20,700 1.7%5 Baptist Health 7,707 0.6%6 Sisters of Mercy Health System 4,896 0.4%7 Whirlpool Corp. 4,600 0.4%8 Triad Hospitals 4,345 0.4%9 Pilgrim's Pride Corp 4,100 0.4%10 Georgia Pacific Corp. 4,000 0.3%
172,540 14.4%
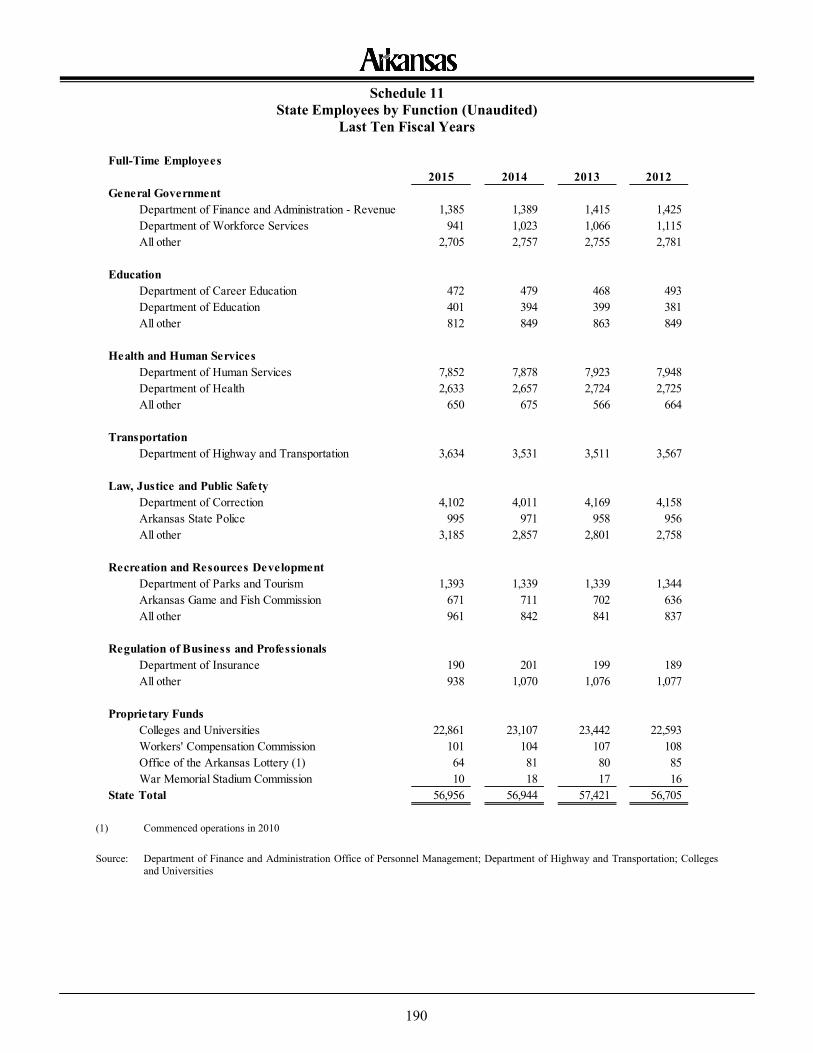
190
Schedule 11 State Employees by Function (Unaudited)
Last Ten Fiscal Years
(1) Commenced operations in 2010 Source: Department of Finance and Administration Office of Personnel Management; Department of Highway and Transportation; Colleges
and Universities
Full-Time Employees2015 2014 2013 2012
General GovernmentDepartment of Finance and Administration - Revenue 1,385 1,389 1,415 1,425Department of Workforce Services 941 1,023 1,066 1,115All other 2,705 2,757 2,755 2,781
EducationDepartment of Career Education 472 479 468 493Department of Education 401 394 399 381All other 812 849 863 849
Health and Human ServicesDepartment of Human Services 7,852 7,878 7,923 7,948Department of Health 2,633 2,657 2,724 2,725All other 650 675 566 664
TransportationDepartment of Highway and Transportation 3,634 3,531 3,511 3,567
Law, Justice and Public SafetyDepartment of Correction 4,102 4,011 4,169 4,158Arkansas State Police 995 971 958 956All other 3,185 2,857 2,801 2,758
Recreation and Resources DevelopmentDepartment of Parks and Tourism 1,393 1,339 1,339 1,344Arkansas Game and Fish Commission 671 711 702 636All other 961 842 841 837
Regulation of Business and ProfessionalsDepartment of Insurance 190 201 199 189All other 938 1,070 1,076 1,077
Proprietary FundsColleges and Universities 22,861 23,107 23,442 22,593Workers' Compensation Commission 101 104 107 108Office of the Arkansas Lottery (1) 64 81 80 85War Memorial Stadium Commission 10 18 17 16
State Total 56,956 56,944 57,421 56,705
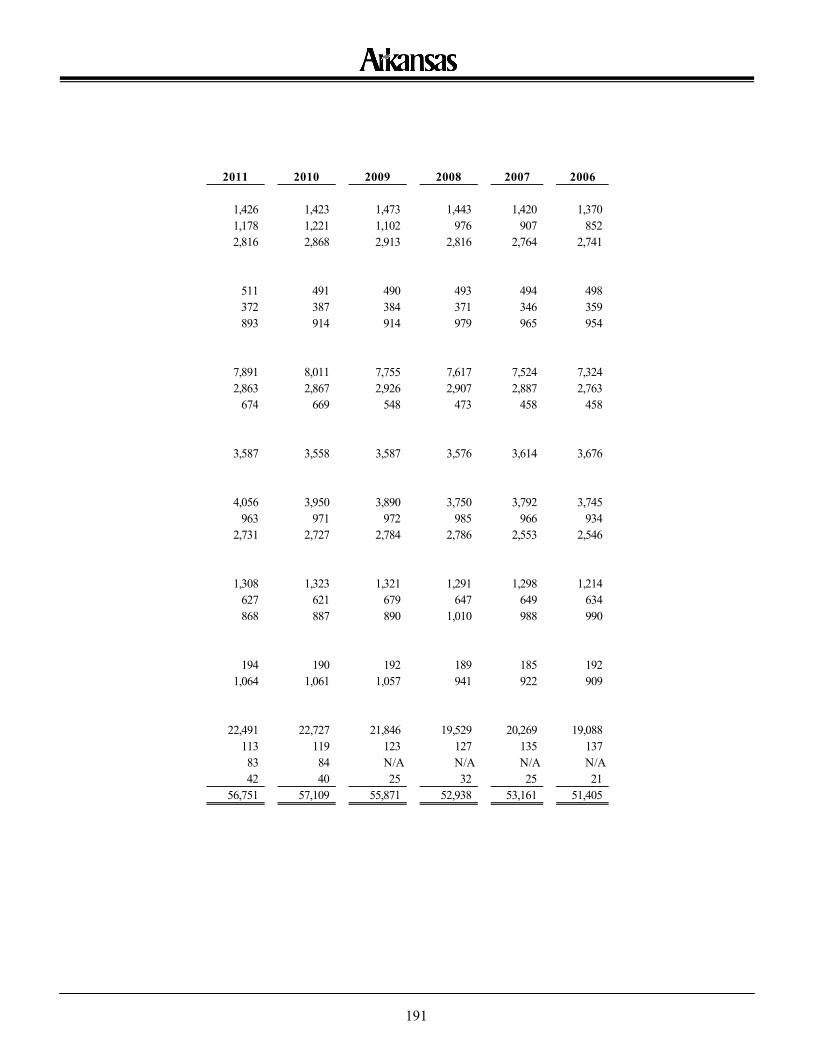
191
2011 2010 2009 2008 2007 2006
1,426 1,423 1,473 1,443 1,420 1,3701,178 1,221 1,102 976 907 8522,816 2,868 2,913 2,816 2,764 2,741
511 491 490 493 494 498372 387 384 371 346 359893 914 914 979 965 954
7,891 8,011 7,755 7,617 7,524 7,3242,863 2,867 2,926 2,907 2,887 2,763
674 669 548 473 458 458
3,587 3,558 3,587 3,576 3,614 3,676
4,056 3,950 3,890 3,750 3,792 3,745963 971 972 985 966 934
2,731 2,727 2,784 2,786 2,553 2,546
1,308 1,323 1,321 1,291 1,298 1,214627 621 679 647 649 634868 887 890 1,010 988 990
194 190 192 189 185 1921,064 1,061 1,057 941 922 909
22,491 22,727 21,846 19,529 20,269 19,088113 119 123 127 135 13783 84 N/A N/A N/A N/A42 40 25 32 25 21
56,751 57,109 55,871 52,938 53,161 51,405
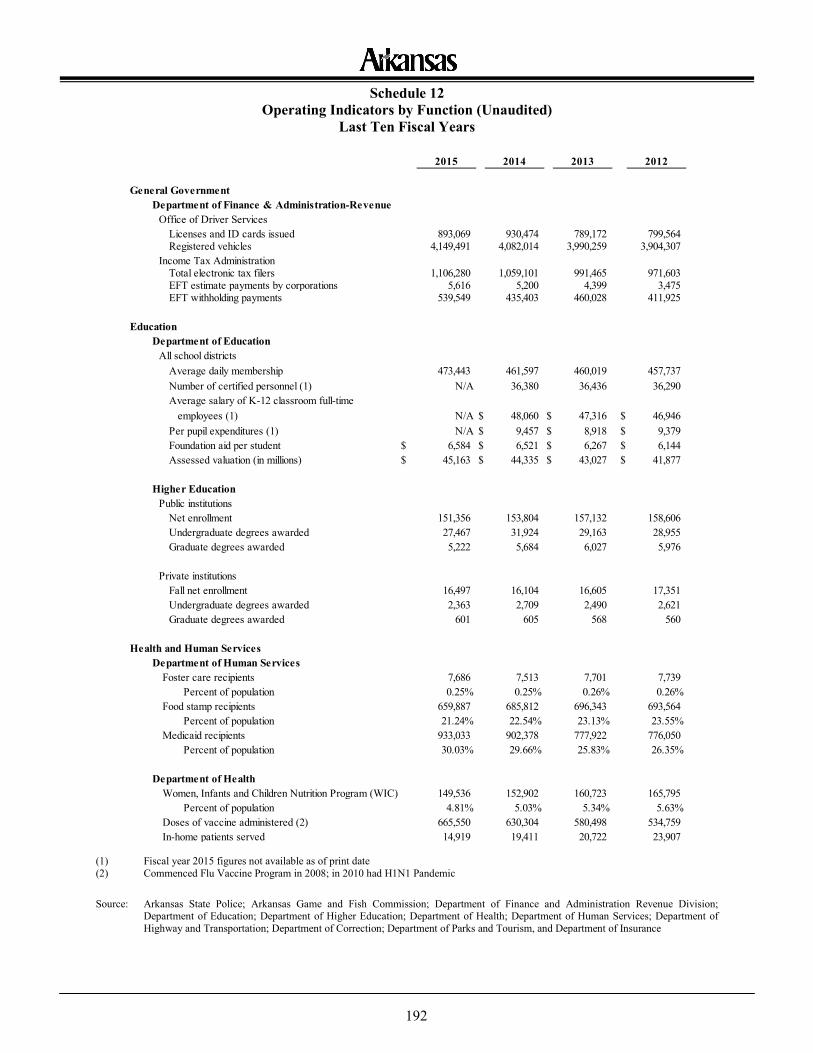
192
Schedule 12 Operating Indicators by Function (Unaudited)
Last Ten Fiscal Years
(1) Fiscal year 2015 figures not available as of print date (2) Commenced Flu Vaccine Program in 2008; in 2010 had H1N1 Pandemic Source: Arkansas State Police; Arkansas Game and Fish Commission; Department of Finance and Administration Revenue Division;
Department of Education; Department of Higher Education; Department of Health; Department of Human Services; Department of Highway and Transportation; Department of Correction; Department of Parks and Tourism, and Department of Insurance
2015 2014 2013 2012
General GovernmentDepartment of Finance & Administration-Revenue
Licenses and ID cards issued 893,069 930,474 789,172 799,564Registered vehicles 4,149,491 4,082,014 3,990,259 3,904,307
Income Tax AdministrationTotal electronic tax filers 1,106,280 1,059,101 991,465 971,603EFT estimate payments by corporations 5,616 5,200 4,399 3,475EFT withholding payments 539,549 435,403 460,028 411,925
EducationDepartment of Education
All school districtsAverage daily membership 473,443 461,597 460,019 457,737Number of certified personnel (1) N/A 36,380 36,436 36,290Average salary of K-12 classroom full-time employees (1) N/A $ 48,060 $ 47,316 $ 46,946Per pupil expenditures (1) N/A $ 9,457 $ 8,918 $ 9,379Foundation aid per student $ 6,584 $ 6,521 $ 6,267 $ 6,144Assessed valuation (in millions) $ 45,163 $ 44,335 $ 43,027 $ 41,877
Higher EducationPublic institutions
Net enrollment 151,356 153,804 157,132 158,606Undergraduate degrees awarded 27,467 31,924 29,163 28,955Graduate degrees awarded 5,222 5,684 6,027 5,976
Private institutionsFall net enrollment 16,497 16,104 16,605 17,351Undergraduate degrees awarded 2,363 2,709 2,490 2,621Graduate degrees awarded 601 605 568 560
Health and Human ServicesDepartment of Human Services
Foster care recipients 7,686 7,513 7,701 7,739Percent of population 0.25% 0.25% 0.26% 0.26%
Food stamp recipients 659,887 685,812 696,343 693,564Percent of population 21.24% 22.54% 23.13% 23.55%
Medicaid recipients 933,033 902,378 777,922 776,050Percent of population 30.03% 29.66% 25.83% 26.35%
Department of HealthWomen, Infants and Children Nutrition Program (WIC) 149,536 152,902 160,723 165,795
Percent of population 4.81% 5.03% 5.34% 5.63%Doses of vaccine administered (2) 665,550 630,304 580,498 534,759In-home patients served 14,919 19,411 20,722 23,907
Office of Driver Services
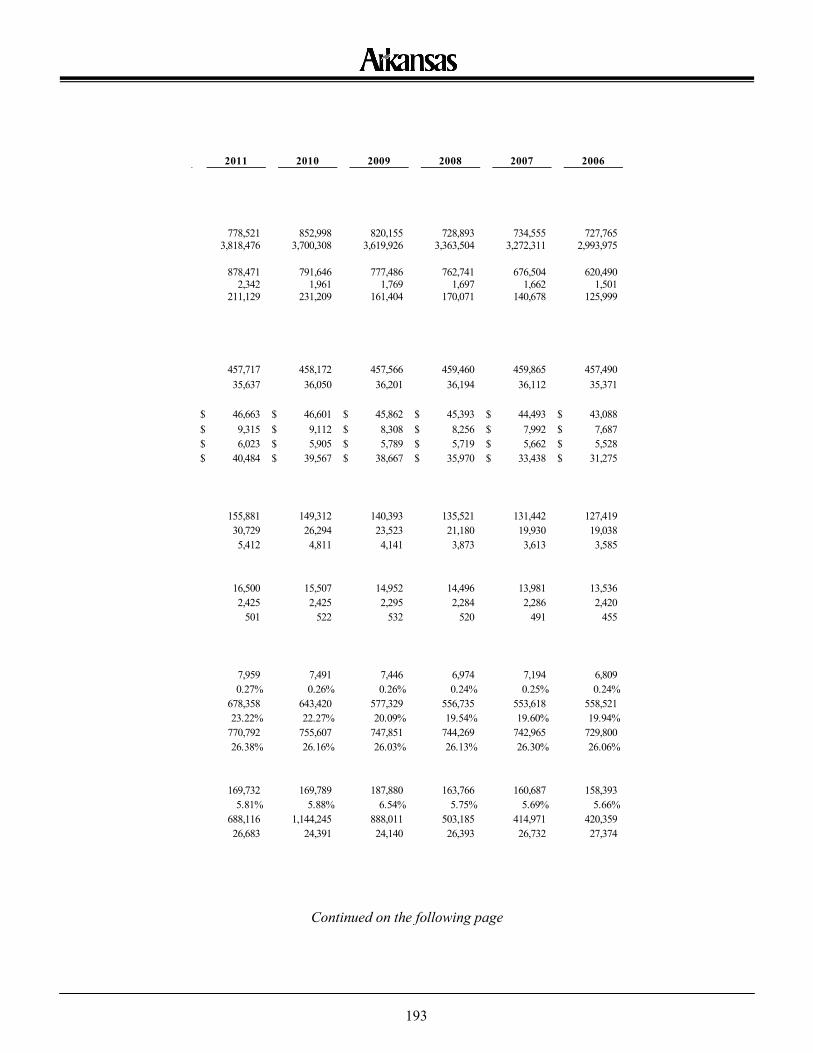
193
Continued on the following page
2011 2010 2009 2008 2007 2006
778,521 852,998 820,155 728,893 734,555 727,7653,818,476 3,700,308 3,619,926 3,363,504 3,272,311 2,993,975
878,471 791,646 777,486 762,741 676,504 620,4902,342 1,961 1,769 1,697 1,662 1,501
211,129 231,209 161,404 170,071 140,678 125,999
457,717 458,172 457,566 459,460 459,865 457,49035,637 36,050 36,201 36,194 36,112 35,371
$ 46,663 $ 46,601 $ 45,862 $ 45,393 $ 44,493 $ 43,088$ 9,315 $ 9,112 $ 8,308 $ 8,256 $ 7,992 $ 7,687$ 6,023 $ 5,905 $ 5,789 $ 5,719 $ 5,662 $ 5,528$ 40,484 $ 39,567 $ 38,667 $ 35,970 $ 33,438 $ 31,275
155,881 149,312 140,393 135,521 131,442 127,41930,729 26,294 23,523 21,180 19,930 19,0385,412 4,811 4,141 3,873 3,613 3,585
16,500 15,507 14,952 14,496 13,981 13,5362,425 2,425 2,295 2,284 2,286 2,420
501 522 532 520 491 455
7,959 7,491 7,446 6,974 7,194 6,8090.27% 0.26% 0.26% 0.24% 0.25% 0.24%
678,358 643,420 577,329 556,735 553,618 558,52123.22% 22.27% 20.09% 19.54% 19.60% 19.94%
770,792 755,607 747,851 744,269 742,965 729,80026.38% 26.16% 26.03% 26.13% 26.30% 26.06%
169,732 169,789 187,880 163,766 160,687 158,3935.81% 5.88% 6.54% 5.75% 5.69% 5.66%
688,116 1,144,245 888,011 503,185 414,971 420,35926,683 24,391 24,140 26,393 26,732 27,374
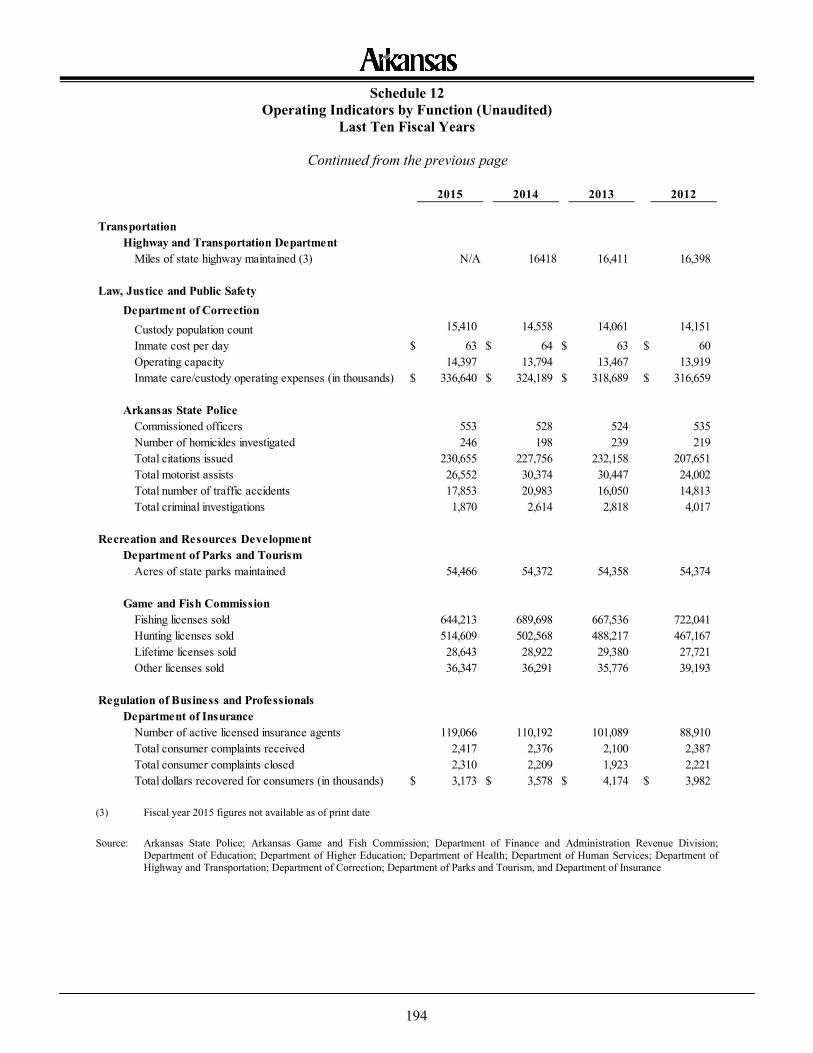
194
Schedule 12 Operating Indicators by Function (Unaudited)
Last Ten Fiscal Years
(3) Fiscal year 2015 figures not available as of print date Source: Arkansas State Police; Arkansas Game and Fish Commission; Department of Finance and Administration Revenue Division;
Department of Education; Department of Higher Education; Department of Health; Department of Human Services; Department of Highway and Transportation; Department of Correction; Department of Parks and Tourism, and Department of Insurance
2015 2014 2013 2012
TransportationHighway and Transportation Department
Miles of state highway maintained (3) N/A 16418 16,411 16,398
Law, Justice and Public SafetyDepartment of Correction
Custody population count 15,410 14,558 14,061 14,151Inmate cost per day $ 63 $ 64 $ 63 $ 60Operating capacity 14,397 13,794 13,467 13,919Inmate care/custody operating expenses (in thousands) $ 336,640 $ 324,189 $ 318,689 $ 316,659
Arkansas State PoliceCommissioned officers 553 528 524 535Number of homicides investigated 246 198 239 219Total citations issued 230,655 227,756 232,158 207,651Total motorist assists 26,552 30,374 30,447 24,002Total number of traffic accidents 17,853 20,983 16,050 14,813Total criminal investigations 1,870 2,614 2,818 4,017
Recreation and Resources DevelopmentDepartment of Parks and Tourism
Acres of state parks maintained 54,466 54,372 54,358 54,374
Game and Fish CommissionFishing licenses sold 644,213 689,698 667,536 722,041Hunting licenses sold 514,609 502,568 488,217 467,167Lifetime licenses sold 28,643 28,922 29,380 27,721Other licenses sold 36,347 36,291 35,776 39,193
Regulation of Business and ProfessionalsDepartment of Insurance
Number of active licensed insurance agents 119,066 110,192 101,089 88,910Total consumer complaints received 2,417 2,376 2,100 2,387Total consumer complaints closed 2,310 2,209 1,923 2,221Total dollars recovered for consumers (in thousands) $ 3,173 $ 3,578 $ 4,174 $ 3,982
Continued from the previous page
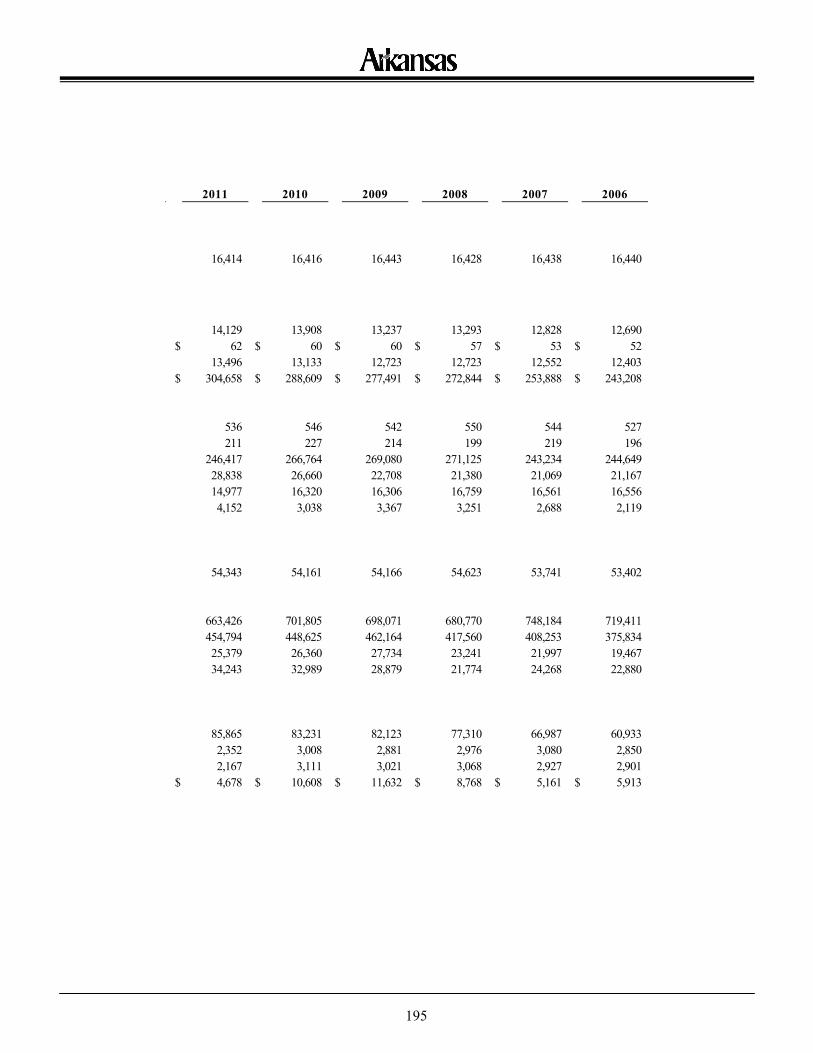
195
2011 2010 2009 2008 2007 2006
16,414 16,416 16,443 16,428 16,438 16,440
14,129 13,908 13,237 13,293 12,828 12,690$ 62 $ 60 $ 60 $ 57 $ 53 $ 52
13,496 13,133 12,723 12,723 12,552 12,403$ 304,658 $ 288,609 $ 277,491 $ 272,844 $ 253,888 $ 243,208
536 546 542 550 544 527211 227 214 199 219 196
246,417 266,764 269,080 271,125 243,234 244,64928,838 26,660 22,708 21,380 21,069 21,16714,977 16,320 16,306 16,759 16,561 16,5564,152 3,038 3,367 3,251 2,688 2,119
54,343 54,161 54,166 54,623 53,741 53,402
663,426 701,805 698,071 680,770 748,184 719,411454,794 448,625 462,164 417,560 408,253 375,83425,379 26,360 27,734 23,241 21,997 19,46734,243 32,989 28,879 21,774 24,268 22,880
85,865 83,231 82,123 77,310 66,987 60,9332,352 3,008 2,881 2,976 3,080 2,8502,167 3,111 3,021 3,068 2,927 2,901
$ 4,678 $ 10,608 $ 11,632 $ 8,768 $ 5,161 $ 5,913
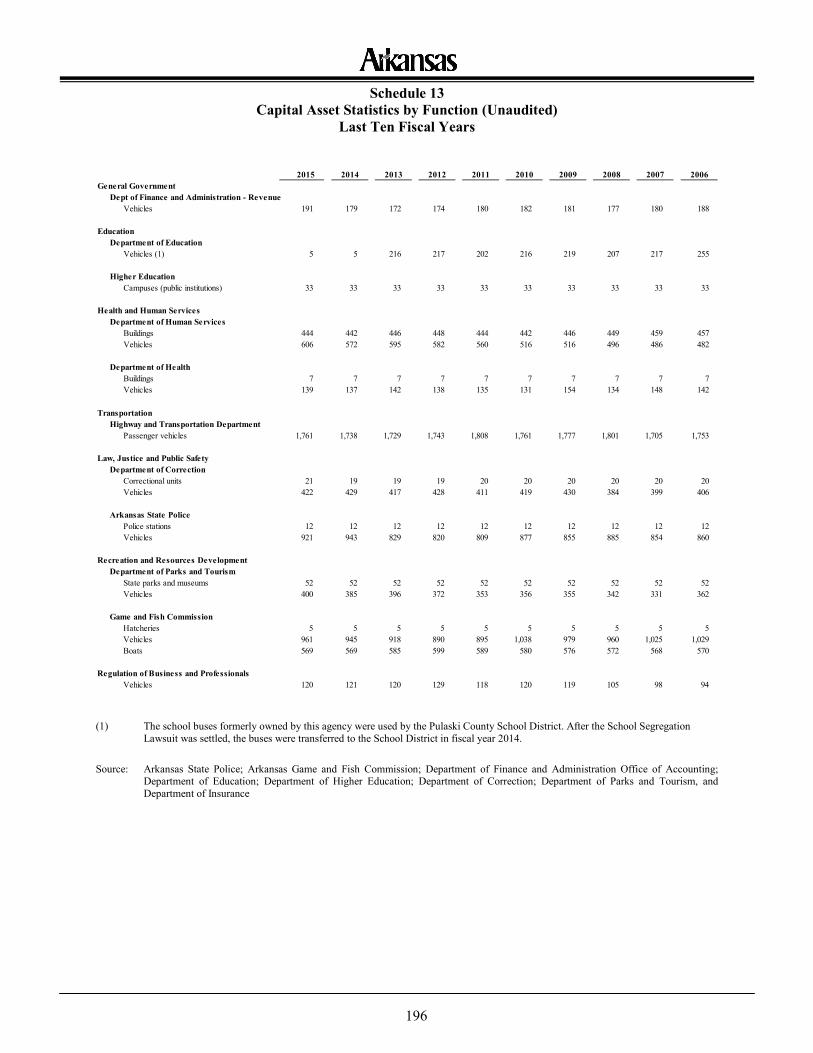
196
Schedule 13 Capital Asset Statistics by Function (Unaudited)
Last Ten Fiscal Years
(1) The school buses formerly owned by this agency were used by the Pulaski County School District. After the School Segregation
Lawsuit was settled, the buses were transferred to the School District in fiscal year 2014. Source: Arkansas State Police; Arkansas Game and Fish Commission; Department of Finance and Administration Office of Accounting;
Department of Education; Department of Higher Education; Department of Correction; Department of Parks and Tourism, and Department of Insurance
2015 2014 2013 2012 2011 2010 2009 2008 2007 2006General Government
Dept of Finance and Administration - RevenueVehicles 191 179 172 174 180 182 181 177 180 188
EducationDepartment of Education
Vehicles (1) 5 5 216 217 202 216 219 207 217 255
Higher EducationCampuses (public institutions) 33 33 33 33 33 33 33 33 33 33
Health and Human ServicesDepartment of Human Services
Buildings 444 442 446 448 444 442 446 449 459 457 Vehicles 606 572 595 582 560 516 516 496 486 482
Department of HealthBuildings 7 7 7 7 7 7 7 7 7 7 Vehicles 139 137 142 138 135 131 154 134 148 142
TransportationHighway and Transportation Department
Passenger vehicles 1,761 1,738 1,729 1,743 1,808 1,761 1,777 1,801 1,705 1,753
Law, Justice and Public SafetyDepartment of Correction
Correctional units 21 19 19 19 20 20 20 20 20 20 Vehicles 422 429 417 428 411 419 430 384 399 406
Arkansas State PolicePolice stations 12 12 12 12 12 12 12 12 12 12 Vehicles 921 943 829 820 809 877 855 885 854 860
Recreation and Resources DevelopmentDepartment of Parks and Tourism
State parks and museums 52 52 52 52 52 52 52 52 52 52 Vehicles 400 385 396 372 353 356 355 342 331 362
Game and Fish CommissionHatcheries 5 5 5 5 5 5 5 5 5 5 Vehicles 961 945 918 890 895 1,038 979 960 1,025 1,029 Boats 569 569 585 599 589 580 576 572 568 570
Regulation of Business and ProfessionalsVehicles 120 121 120 129 118 120 119 105 98 94
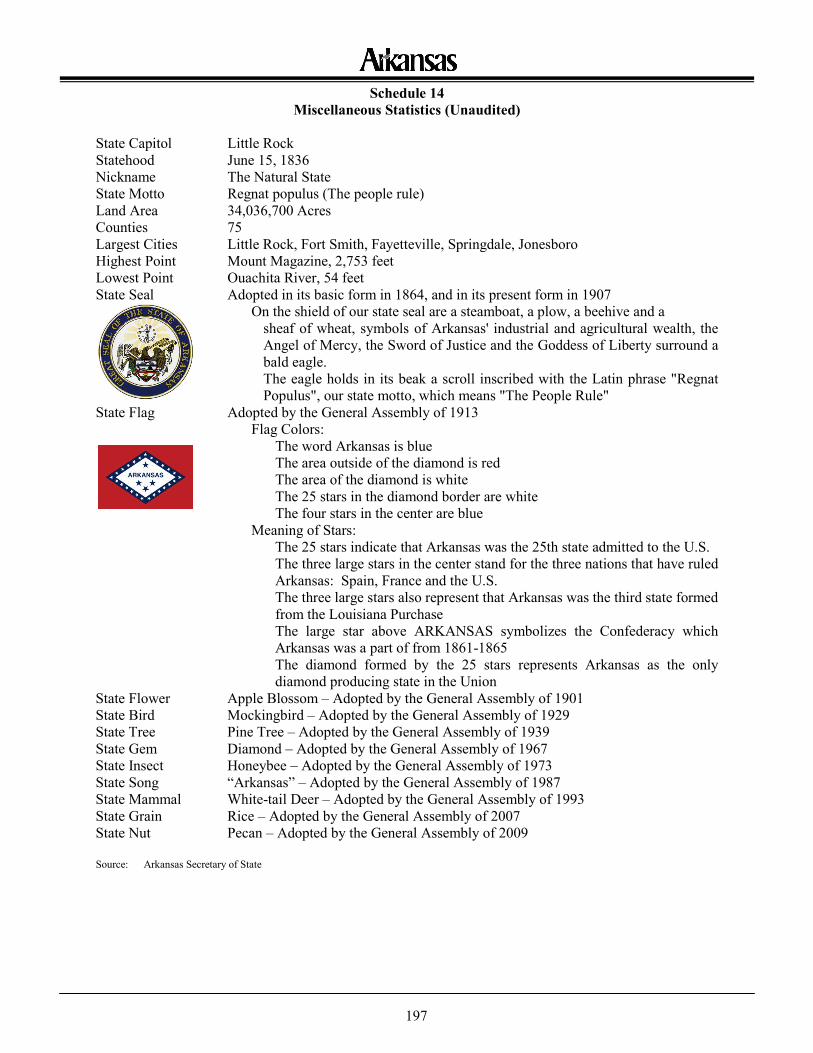
197
Schedule 14 Miscellaneous Statistics (Unaudited)
State Capitol Little Rock Statehood June 15, 1836 Nickname The Natural State State Motto Regnat populus (The people rule) Land Area 34,036,700 Acres Counties 75 Largest Cities Little Rock, Fort Smith, Fayetteville, Springdale, Jonesboro Highest Point Mount Magazine, 2,753 feet Lowest Point Ouachita River, 54 feet State Seal Adopted in its basic form in 1864, and in its present form in 1907 On the shield of our state seal are a steamboat, a plow, a beehive and a
sheaf of wheat, symbols of Arkansas' industrial and agricultural wealth, the Angel of Mercy, the Sword of Justice and the Goddess of Liberty surround a bald eagle. The eagle holds in its beak a scroll inscribed with the Latin phrase "Regnat Populus", our state motto, which means "The People Rule"
State Flag Adopted by the General Assembly of 1913 Flag Colors: The word Arkansas is blue The area outside of the diamond is red The area of the diamond is white The 25 stars in the diamond border are white The four stars in the center are blue Meaning of Stars: The 25 stars indicate that Arkansas was the 25th state admitted to the U.S.
The three large stars in the center stand for the three nations that have ruled Arkansas: Spain, France and the U.S. The three large stars also represent that Arkansas was the third state formed from the Louisiana Purchase The large star above ARKANSAS symbolizes the Confederacy which Arkansas was a part of from 1861-1865 The diamond formed by the 25 stars represents Arkansas as the only diamond producing state in the Union
State Flower Apple Blossom – Adopted by the General Assembly of 1901 State Bird Mockingbird – Adopted by the General Assembly of 1929 State Tree Pine Tree – Adopted by the General Assembly of 1939 State Gem Diamond – Adopted by the General Assembly of 1967 State Insect Honeybee – Adopted by the General Assembly of 1973 State Song “Arkansas” – Adopted by the General Assembly of 1987 State Mammal White-tail Deer – Adopted by the General Assembly of 1993 State Grain Rice – Adopted by the General Assembly of 2007 State Nut Pecan – Adopted by the General Assembly of 2009 Source: Arkansas Secretary of State