Embed Size (px)
Citation preview
COMPOSITION AND HEATING VALUE OF MUNICIPAL SOLID WASTE IN THE SPRING CREEK AREA
OF NEW YORK CITY
NORMAN CHIN PETER FRANCONERI The Port Authority of and Consulting Engineer
New York, New York New York and New Jersey
ABSTRACT
A comprehensive municipal solid waste (MSW) sampling program was conducted in the Spring Creek Area of New York City. MSW heating value, composition, and chemical analysis were determined from a total of 61 samples. Thirty-four samples were taken during autumn 1978, and nine samples were taken during each of the following three seasons (1978 - 1979) to determine seasonal effects. Flyash and residue were sampled in the winter. The sampling techniques, laboratory procedures, and program results are presented.
INTRODUCTION
To slow the decline of the region's economy and the exodus of indu&tries, The Port Authority of New York and New Jersey is developing industrial parks in the New York Metropolitan area. Conversion of the energy in New York City's MSW could generate sufficient energy to supply the energy needs of an industrial park. For example, an industrial park covering 240 acres (0.97 km2), with an energy demand of 54 MW and 100,000 1b/ hr (45,400 kg/h) of process steam, could be met by burning approximately 3500 tons/day (3175 tid) of MSW. Industrial park tenants would be supplied with energy at rates below what the utilities are charging. Low cost energy could be'come one of many incentives drawing tenants to
an industrial park in New York City. A resource recovery plant to process 3500
tons/day (3175 tid) of MSW would cost over two hundred million dollars to build. Such a large investment justifies careful feasibility study including an accurate determination of the heating value and composition of MSW in the area. The composition of MSW can vary from neighborhood to neighborhood, season to season, day to day, and truck load to truck load. It is important to determine the composition and heating value through sampling.
SOURCE OF MSW SAMPLED
MSW consists primarily of residential waste and commercial/industrial waste. In the City of New York, residential waste is collected by the Department of Sanitation, and commerical/industrial waste is collected by private cartmen.
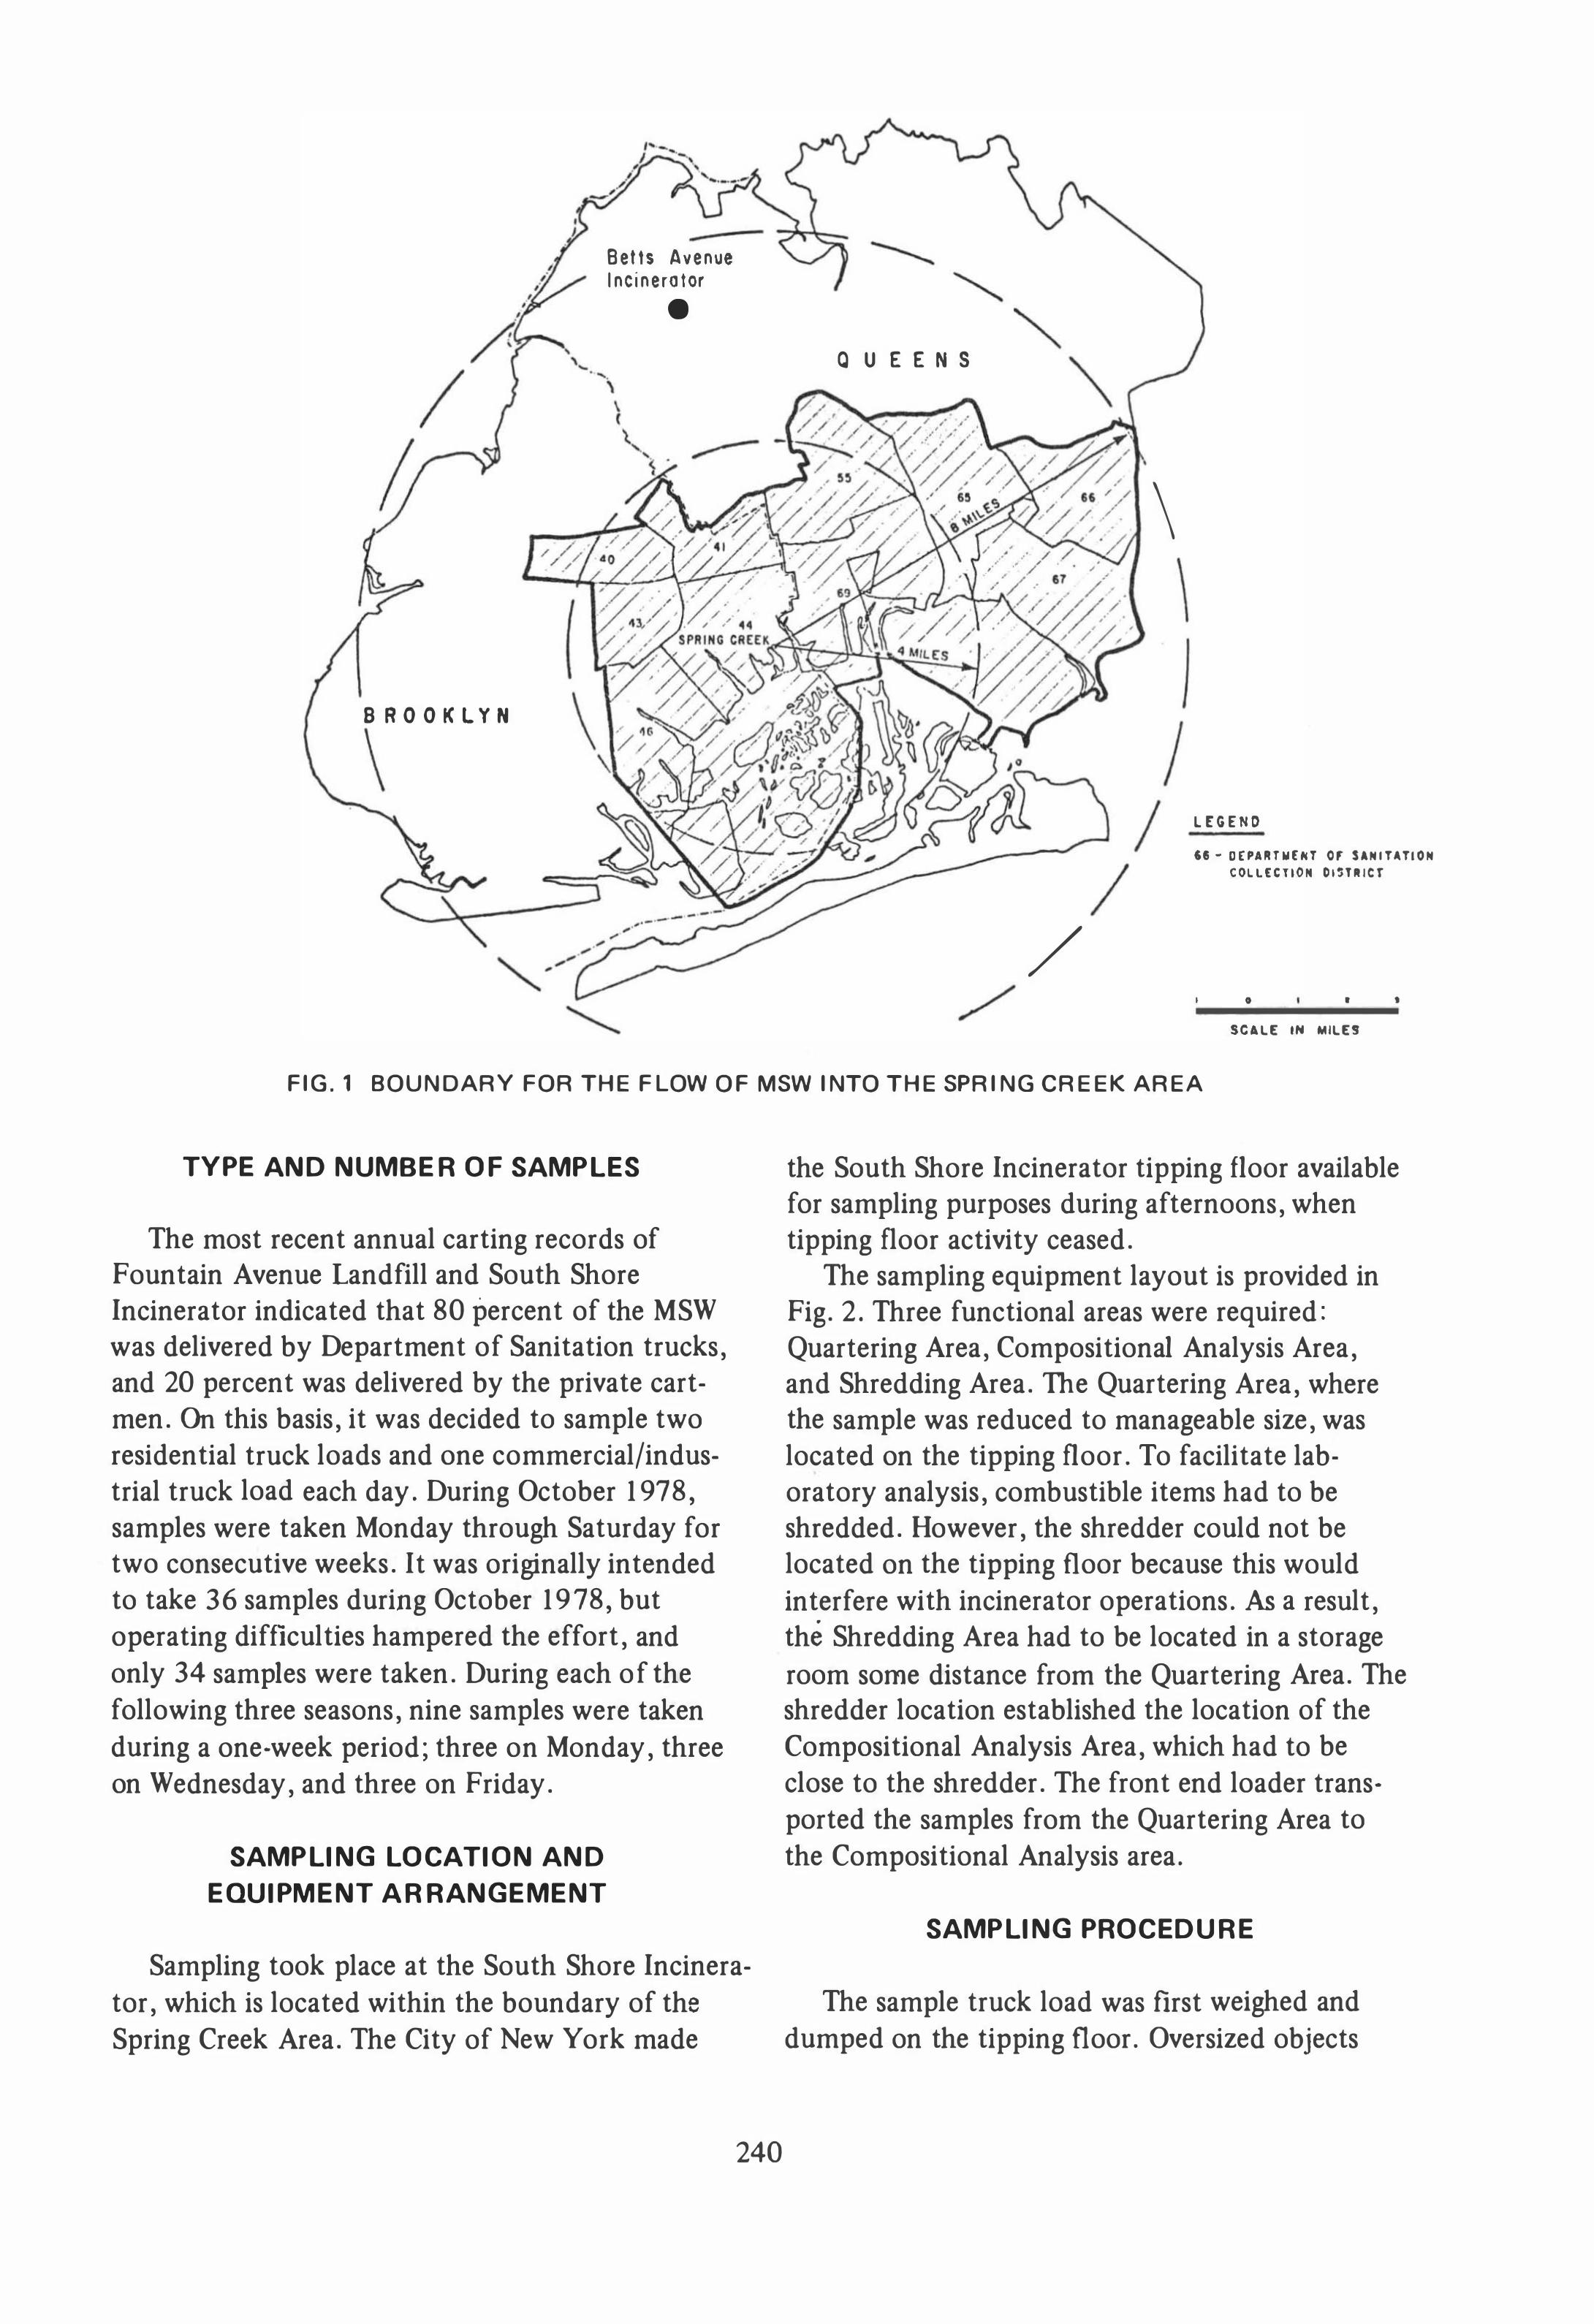
The proposed resource recovery facility/industrial park will be in the Spring Creek Area, shown in Fig. 1. MSW intended for use at the facility is presently delivered to the South Shore Incinerator and the Fountain Avenue Landfill. The boundary for the flow of MSW into the Spring Creek Area was established by including the Department of Sanitation Districts that deliver their wastes to the South Shore Incinerator or the Fountain Avenue Landfill. Samples were picked from private cartmen trucks and Department of Sanitation trucks that collect MSW within the boundary.
239
/
/
BROOKLYN
-
Betts Avenue Incinerator
• QUEENS
/ /'
\
LEGEND
,,- O£,Ul'liI£HT 0' SANITATION COL lEe no" OISTlller
I . • I •
SCALE IN MILES
FIG.1 BOUNDARY FOR THE FLOW OF MSW INTO THE SPRING CREEK AREA
TYPE AND NUMBER OF SAMPLES
The most recent annual carting records of Fountain Avenue Landfill and South Shore Incinerator indicated that 80 percent of the MSW was delivered by Department of Sanitation trucks, and 20 percent was delivered by the private cartmen. On this basis, it was decided to sample two residential truck loads and one commercial/industrial truck load each day. During October 1978, samples were taken Monday through Saturday for two consecutive weeks. It was originally intended to take 36 samples during October 1978, but operating difficulties hampered the effort, and only 34 samples were taken. During each of the following three seasons, nine samples were taken during a one-week period; three on Monday, three on Wednesday, and three on Friday.
SAMPLING LOCATION AND
EQUIPMENT ARRANGEMENT
Sampling took place at the South Shore Incinerator, which is located within the boundary of the Spring Creek Area. The City of New York made
240
the South Shore Incinerator tipping floor available for sampling purposes during afternoons, when tipping floor activity ceased.
The sampling equipment layout is provided in Fig. 2. Three functional areas were required: Quartering Area, Compositional Analysis Area, and Shredding Area. The Quartering Area, where the sample was reduced to manageable size, was located on the tipping floor. To facilitate laboratory analysis, combustible items had to be shredded. However, the shredder could not be located on the tipping floor because this would interfere with incinerator operations. As a result, the Shredding Area had to be located in a storage room some distance from the Quartering Area. The shredder location established the location of the Compositional Analysis Area, which had to be close to the shredder. The front end loader transported the samples from the Quartering Area to the Compositional Analysis area.
SAMPLING PROCEDURE
The sample truck load was first weighed and dumped on the tipping floor. Oversized objects

tv � -
----,
WALKWAY
,
" ! [I
" , ,
,
-'" ! -..
CD '" " v' I �I ",' '" v z o "
.)( '"
" " " '" ...
• I I I I I I I I I I I I I I I I I L_
. , o .,
... -0",
�g� ", -, .- "' U) Cl .-"'Z .0:
.. 0-... .-
2
ROADWAY
ROUTE OF LOADER
FROM TIPPING FLOOR TO COMPOSITIONAL AN ALYSIS AREA
/" ",
WALKWAY
,
• ,
• •
•
, . • , .
� .... :::::::::::::::::::::::::::::.. .. ::...::::::::::::� • • lo.... 1 r ..r- -
STORAG E
,.
..
""0· DIA. jiD '"
t"";:.'!-.'" , .' - •
:=I
" .o:";. . ... �u
,
3
7- I . I I
. I
I '\. ,�-,\./ //4 : PAINTED I
13'''0· DIA,-' \ LINES I I
STEEL PLATEI OVER ORA'N I
TIPPING FLOOR _ __ __ � _____ _ ____ _ J
P'T
------- ---- -, , i II QUARTERING ALTERNATE
OUMPING AREAS
I AREA (STEP NO.1) I I
r-----------/
•
.... :
.'
WALKWAY
..
\.1$ � r � J�, \ "L IUP . v � , . .
.... :1-'- I '. , ,... ' , -, , ' , I � .• _..: ,
I
STORAGE ROOM NO.6
n-'--- -------- - ---- , I
I I":� I I I I 000" I(ALfO
.±J
I L I I
2 3 , II DRUIIS I ...... I .. UP I . .. 4 i I I 6'DIA, I
ASH ORIVEWAYI I I
.
I I ... 4' DIA, I I I L 6' DIA, I �-----�------------��
, COMPOSITIONAL ANALYSIS AREA (STEP NO.2)
FIG.2 SA MPLING EQUIP MENT LAYOUT AT SOUTH SHORE INCINERATOR
i SHREDDING AREA (STEP NO.3)
r ---------,
I I I
SHREDDER
IARREL � UNDER SHREDDER
L--------·!·�·1
PLATFORM SCALE NO.2
D �
I I I I I I
J

such as rubber tires, iron pipes, wooden crates, heavy corrugated boxes etc. were hand picked, removed and weighed. The front end loader then deposited every sixth bucket load in the quartering area, and the other five bucket loads into the storage pit, until the whole truckload was depleted.
The sample deposited in the quartering area was then evenly spread over the 26 ft (7.9 m) diameter circle and separated into four quadrants. Two opposite quadrants were removed and discarded. The remainder was again spread evenly over the 19 ft (5.6 m) diameter circle, quartered and the MSW in the two opposite quadrants was discarded. The remainder was again spread evenly over the 13 ft (4 m) diameter circle. The quartering procedure continued until the sample was reduced to about 3/4 cu yds (0.6 m3).
The sample was then transferred to the 6 ft (1.8 m) diameter circle and further reduced to two 6 ft3(0.2 m3) samples, one for composition analysis and the other for moisture determination.
The moisture sample was further reduced to 1 fe (0.03 m3), placed into a double plastic bag, sealed, labeled and delivered to the laboratory for moisture determination.
The composition analysis sample was then spread over one of the circles and hand sorted into eleven classified containers and weighed. The eleven categories used were:
1. Paper 2. Wood 3. Plastic 4. Glass 5. Ferrous Metals 6. Aluminum 7. Other Nonferrous Metals 8. Sand 9. Organic
10. Rags 11. Miscellaneous
With the exception of plastic, the combustible components were shredded to a size suitable for further shredding in the laboratory. Plastic could not be shredded because it jammed the shredder. A l ft3 (0.03 m3) shredded sample was placed into a plastic bag, sealed, labeled, and delivered to the laboratory for heating value determination.
LABORATORY PROCEDURES
Standard procedures for laboratory analysis of MSW are being developed by ASTM E-38. At the
time of the sampling and analysis program, there were no standard procedures for laboratory analysis of MSW. However, standard procedures do exist in laboratory analysis of similar material. These standards include ASTM, ANSI, Standard Methods for Analysis of Water and Wastewater, and AOAC. The procedures used were based on modifications to ASTM, AOAC, or Standard Methods.
Heating value and composition were adjusted to reflect the oversized objects and plastic removed during the various steps of the assay. The heating value adjustment is shown in Table 1.
ASSAY RESULTS
The composition of residential waste samples is shown in Table 2, and commercial/industrial waste composition is shown in Table 3. The composition of the combined residential and commerical/industrial samples taken in autumn 1978 is provided in Table 4. There is a significant difference in paper and metal contents of MSW from the Spring Creek area, other regions in the City, and the nationwide average. These differences indicate that known MSW composition of one region should not be used for another.
Table 5 shows the wide variation in moisture content of MSW from truck load to truck load. Because of the wide variation, it is advisable to take as many samples as possible to reach a reliable average.
The average moisture content of residential waste in the Spring Creek area is almost exactly the same as that of commercial/industrial waste. Usually, commercial/industrial waste is drier than residen tial waste.
The proximate and ultimate analyses of the residential waste samples are shown in Table 6, and the commercial/industrial waste analyses are shown in Table 7. The high chloride values in the ash should have been even higher since plastics were purposely excluded from the laboratory sample because they proved difficult to shred.
The percentages of sulfur and oxygen in the residential and commercial/industrial waste samples are presented in Table 8. These percentages do not vary Significantly from truck load to truck load.
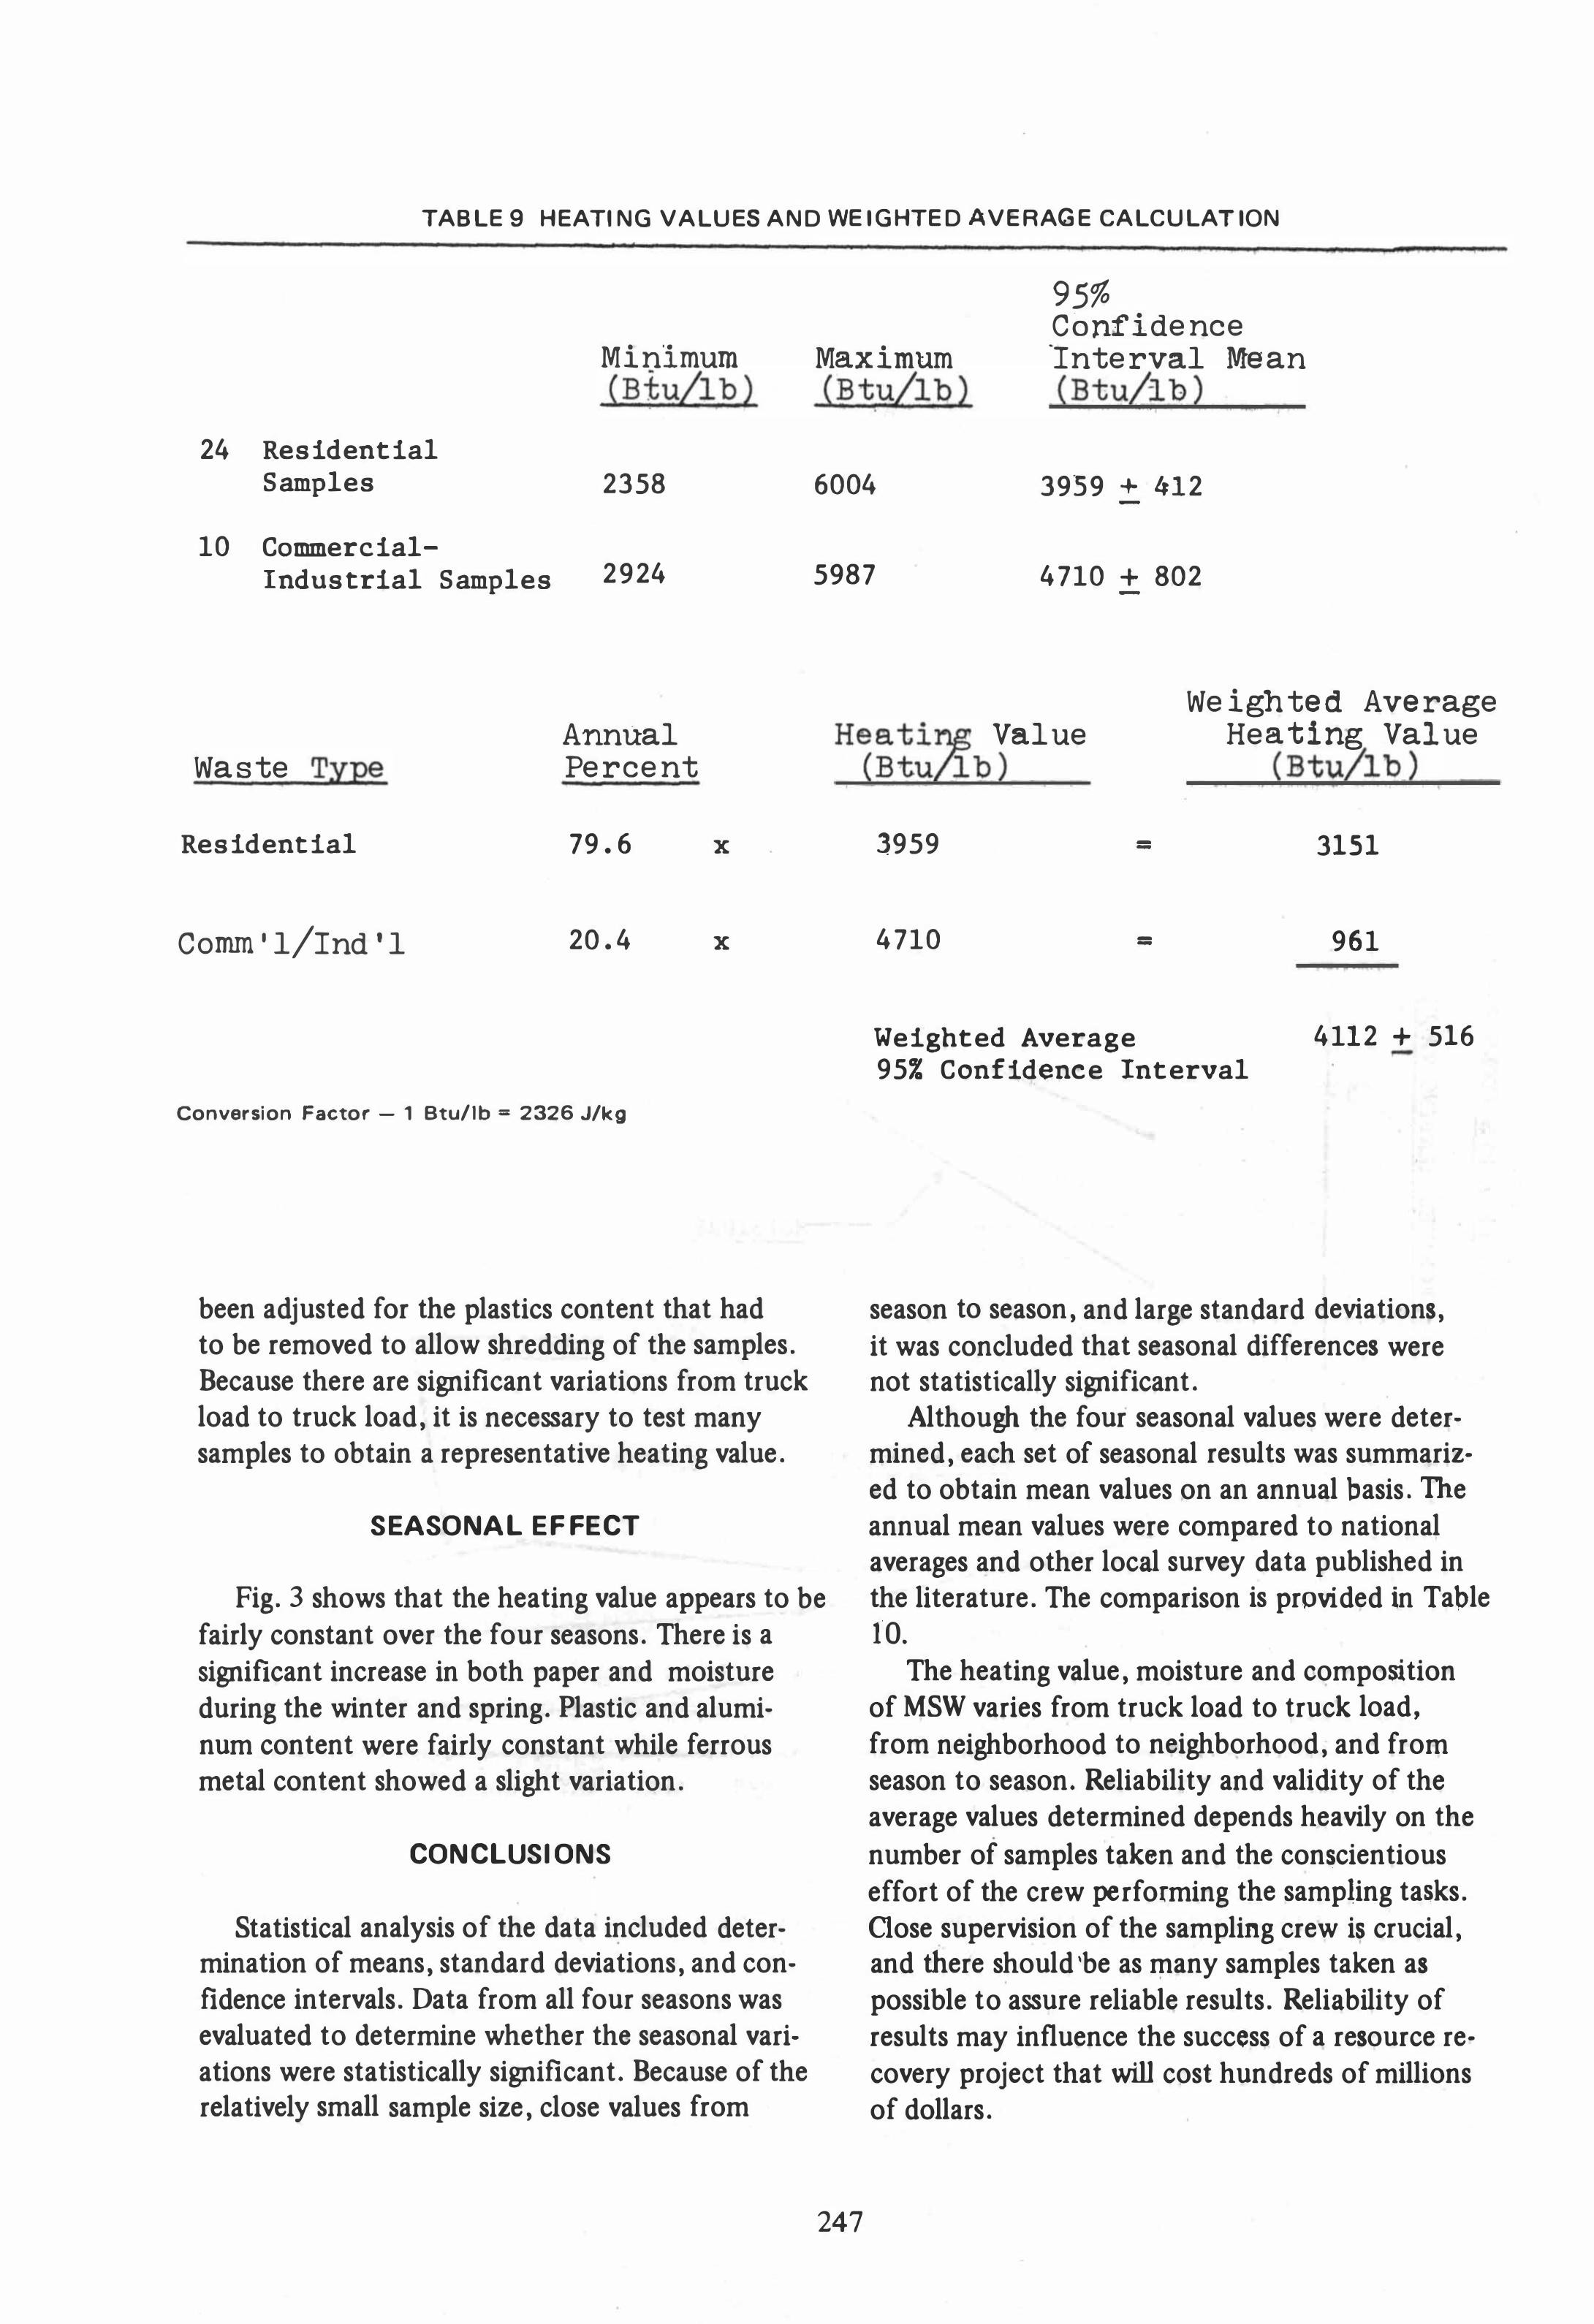
The heating values for residential and commercial/industrial waste samples are shown in Table 9. The as-received average heating value was 4100 Btu/lb (9.-5 MJ/kg). This heating value has
242
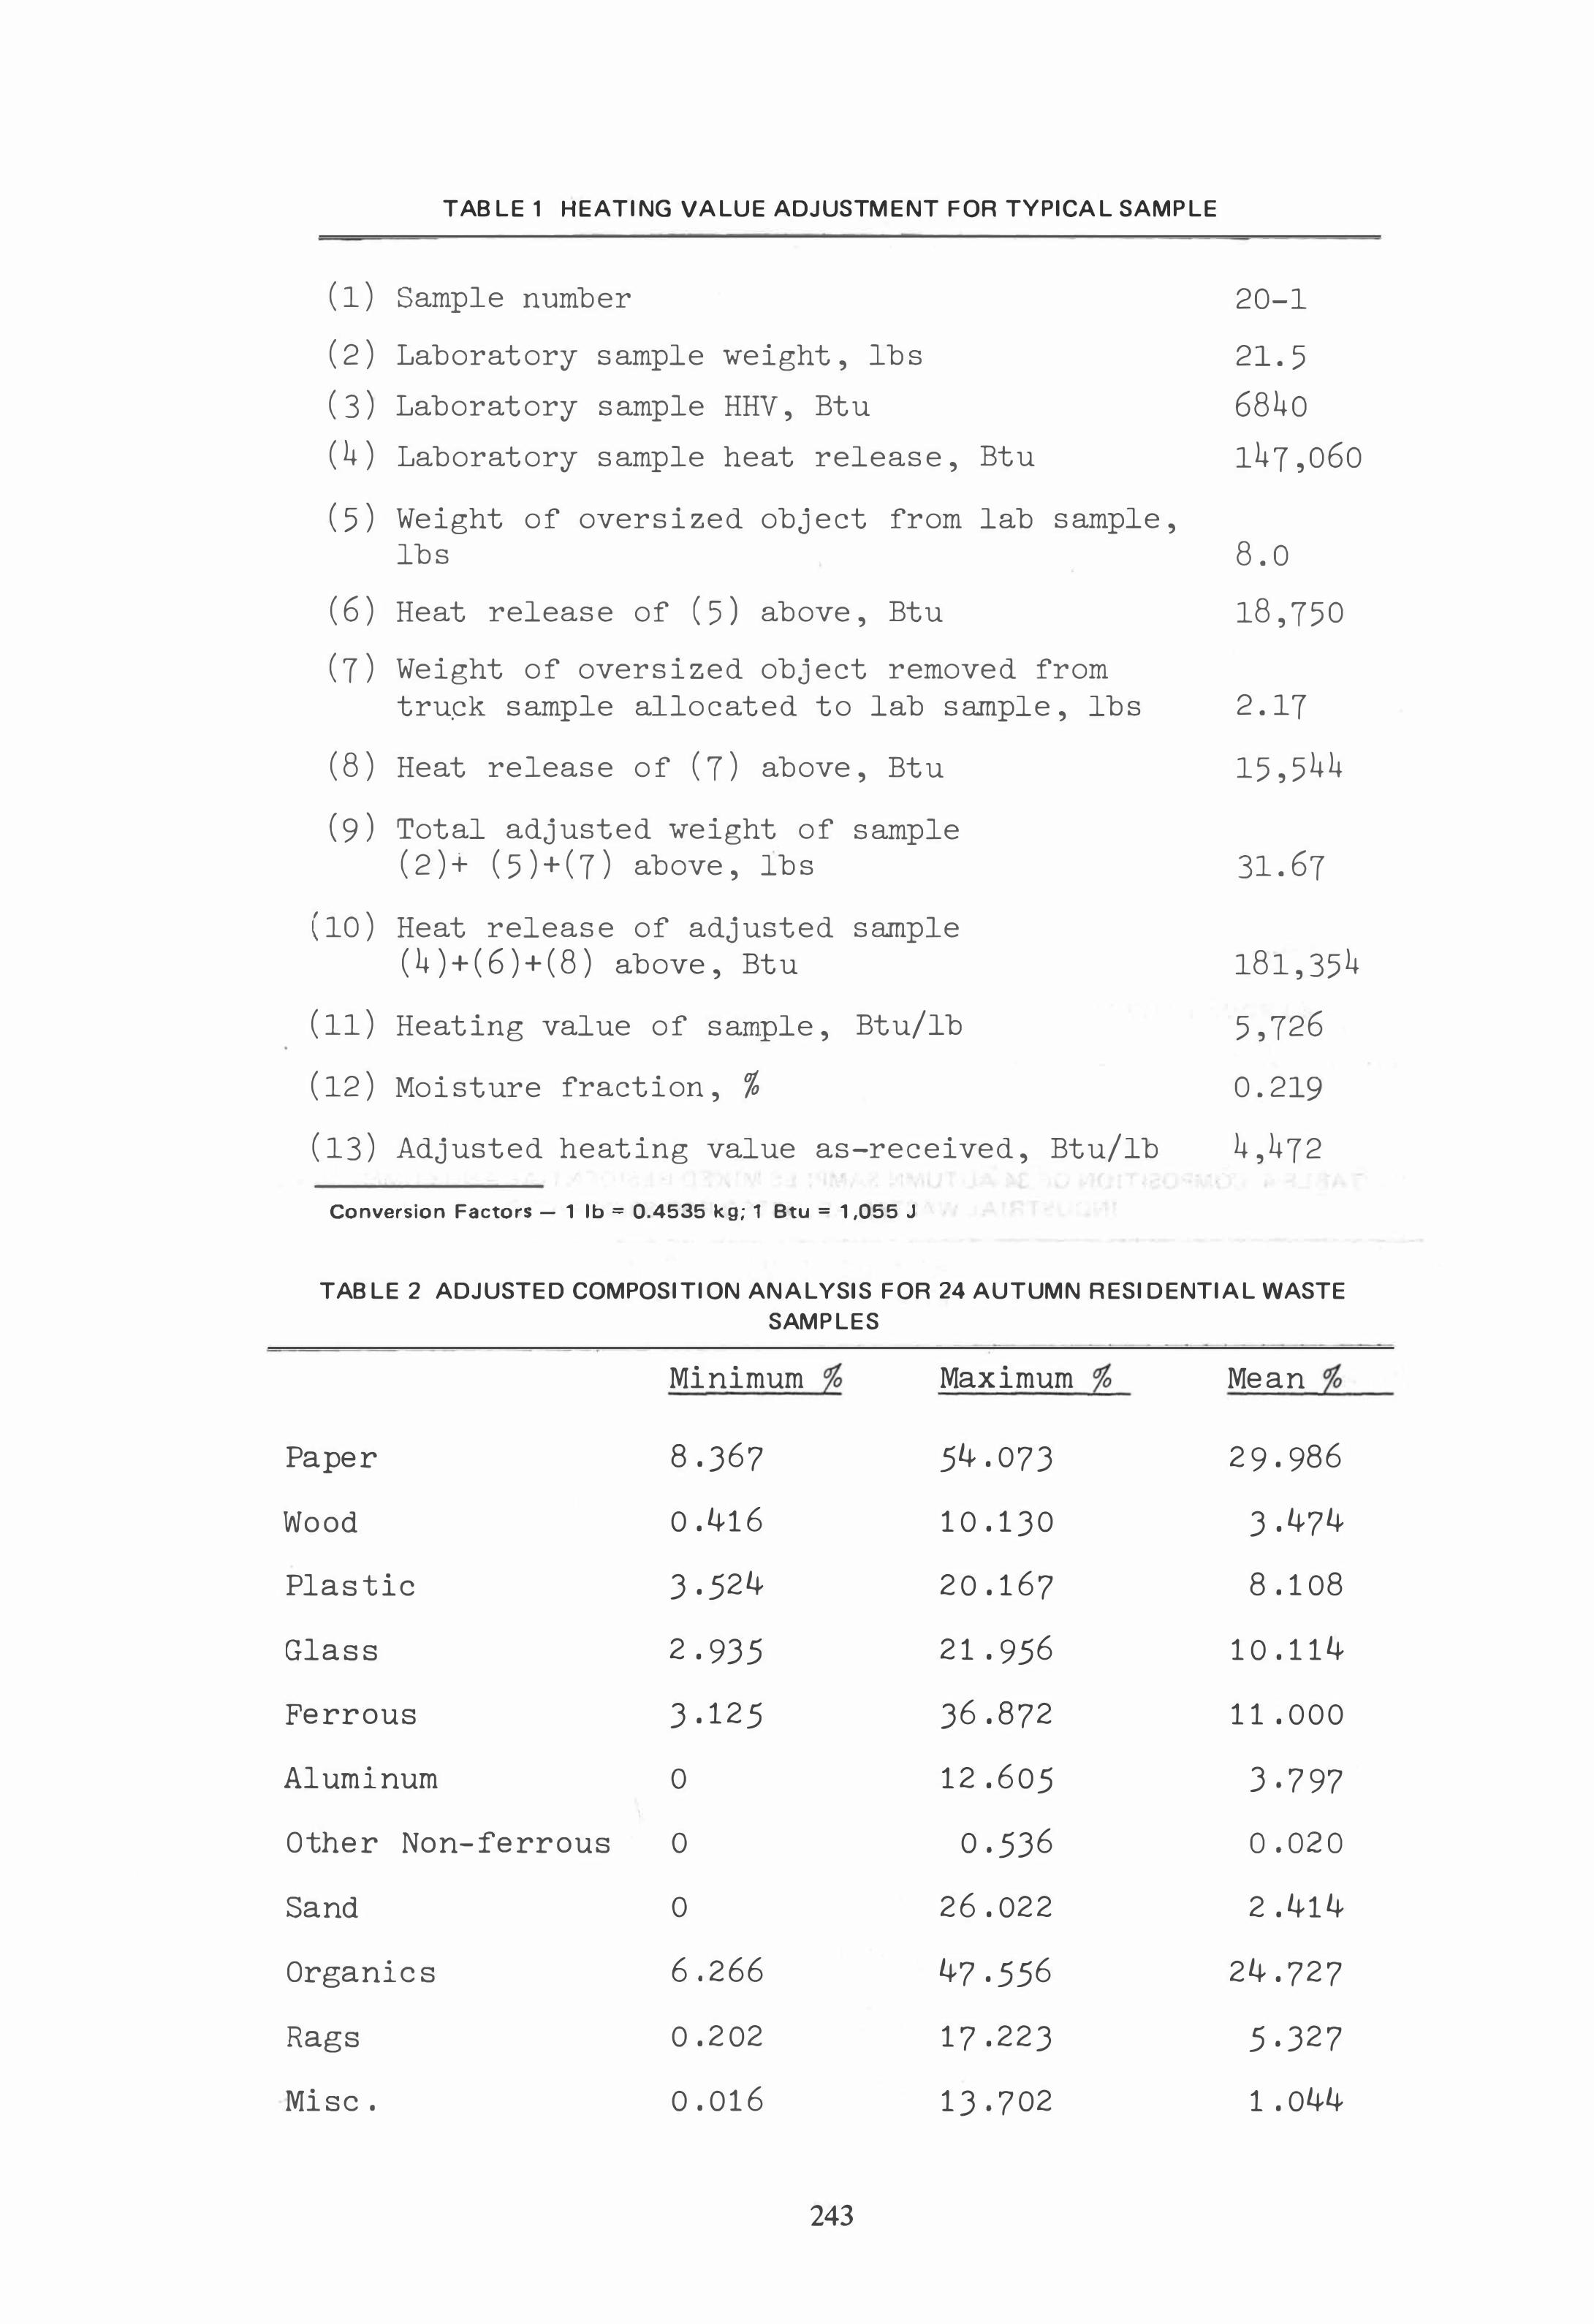
TABLE 1 HEATING VALUE ADJUSTMENT FOR TYPICAL SA MPLE
(1) Sample number
(2) Laboratory sample weight, lbs
(3) Laboratory sample HHV, Btu
(4) Laboratory sample heat release, Btu
(5) Weight of oversized object from lab sample,
20-1 21. 5 6840 147,060
lbs 8.0 (6) Heat release of (5) above, Btu 18,750 (7) Weight of oversized object removed from
tru,ck sample allocated to lab sample, lbs 2.17 (8) Heat release of (7) above, Btu
(9) Total adjusted weight of sample (2)+ (5)+(7) above, lbs
(10) Heat release of adjusted sample (4)+(6)+(8) above, Btu
(11) Heating value of sample, Btu/lb
(12) Moisture fraction, %
(13) Adjusted heating value as-received, Btu/lb
Conversion Factors - 1 Ib = 0,4535 kg; 1 Btu = 1,055 J
15,544
31.67
181,354 5,726 0.219 4,472
TABLE 2 ADJUSTED COMPOSITION ANALYSIS FOR 24 AUTUMN RESI DENTIAL WASTE
SAMPLES
Paper
Wood
Plastic
Glass
Ferrous
Aluminum
Other Non-ferrous
Sand
Organics
Rags
Misc.
Minimum % 8.367
0.416
3.524
2.935
3.125
o
o
o
6.266
0.202
0.016
243
Maximum % 54.073
10.130
20.167
21.956
36.872
12.605
0·536
26.022
47.556
17.223
13·702
Mean % 29.986
3.474
8.108
10.114
11 .000
3·797
0.020 2.414
24.727
5·327
1.044
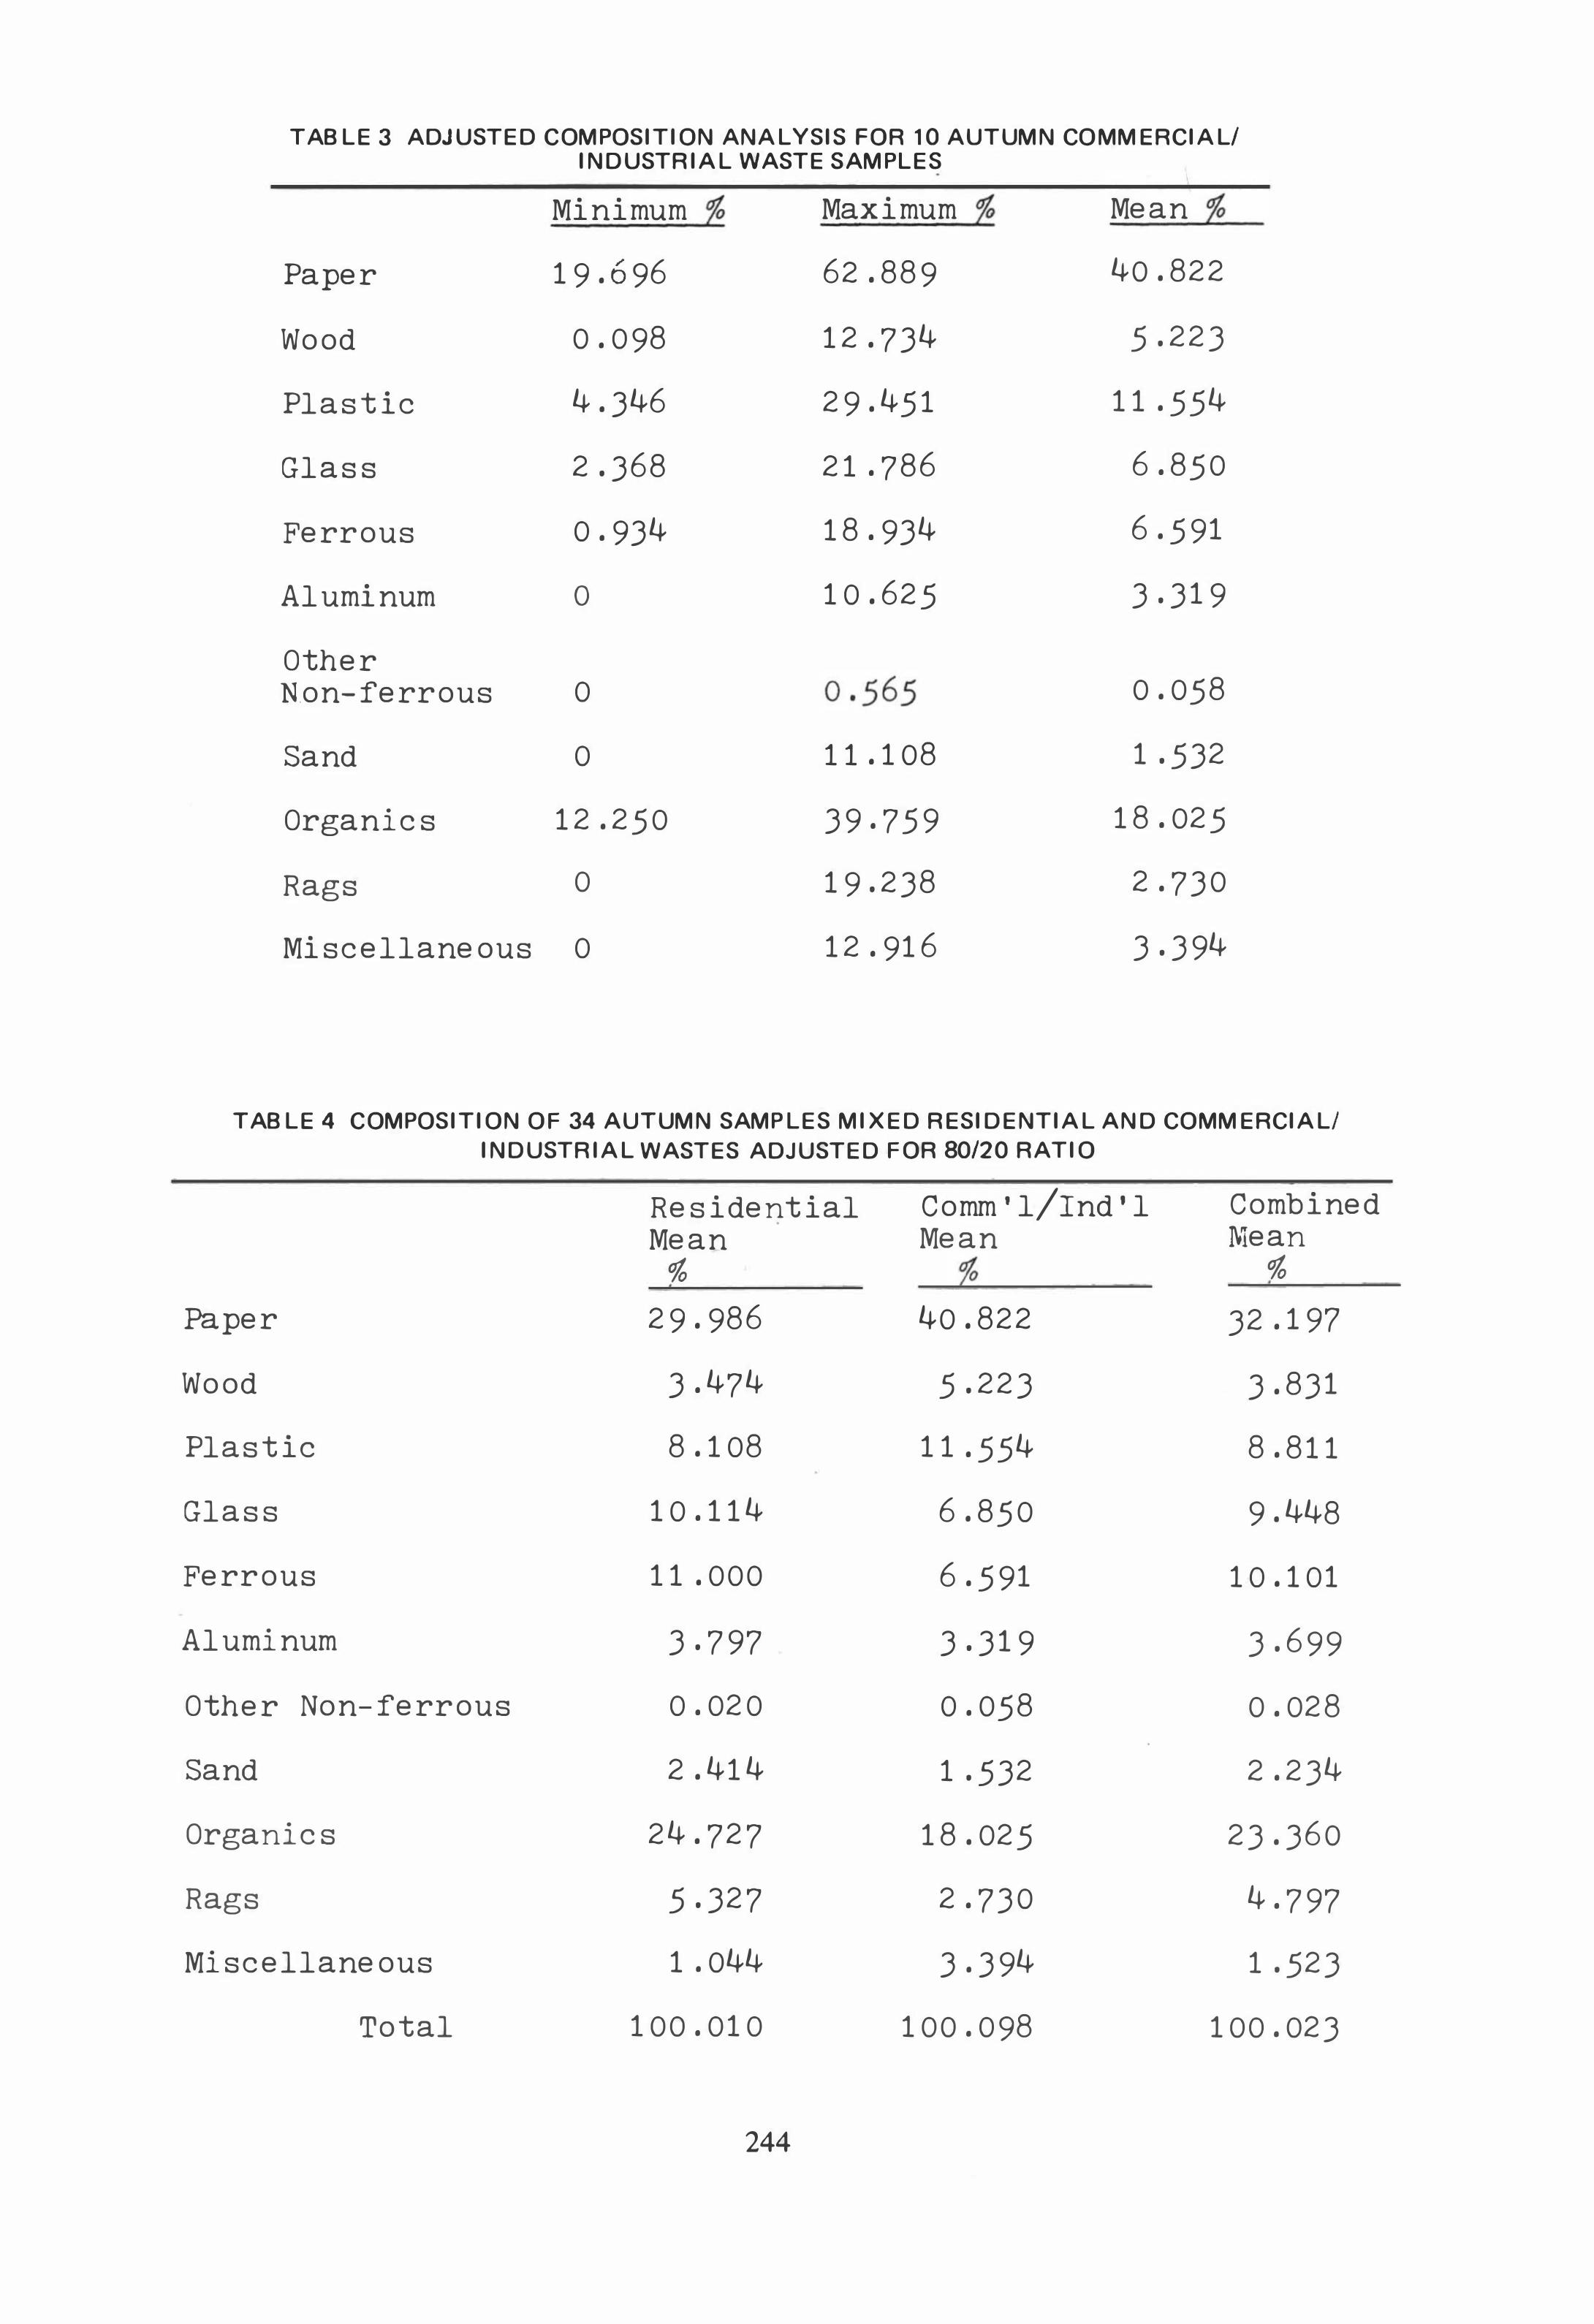
TABLE 3 ADJUSTED COMPOSITION ANALYSIS FOR 10 AUTUMN CO MMERCIAL! INDUSTRIAL WASTE SAMPLES
Paper
Wood
Plastic
Glass
Ferrous
Aluminum
Other
Minimum % 19.696
0.098
4.346
2·368
0.934
o
N.on-ferrous 0
Sand 0
Organics 12.250
Rags 0
Miscellaneous 0
Maximum % 62.889
12.734
29.451
21 .786
18.934
10.625
11 .108
39.759
19·238
12.916
Mean % 40.822
5·223
11.554
6.850
6.591
3·319
0.058
1·532
18.025
2.730
3·394
TABLE 4 COMPOSITION O F 34 AUTUMN SAMPLES MIXED RESIDENTIAL AND COMMERCIAL! INDUSTRIAL WASTES ADJUSTED FOR 80/20 RATIO
Paper
Wood
Plastic
Glass
Ferrous
Aluminum
Other Non-ferrous
Sand
Organics
Rags
Miscellaneous
Total
Residential Mean
% ,
29.986
3.474
8.108
10.114
11 .000
3·797
0.020
2.414
24.727
5·327
1.044
100.010
244
Comm'l/Ind'l Mean
% 40.822
5·223
11 .554
6.850
6.591
3·319
0.058
1·532
18.025
2.730
3.394
100.098
,
Combined Mean
% ,
32 .197
3.831
8.811
9.448
10.101
3·699
0.028
2.234
23.360
4.797
1·523
100.023
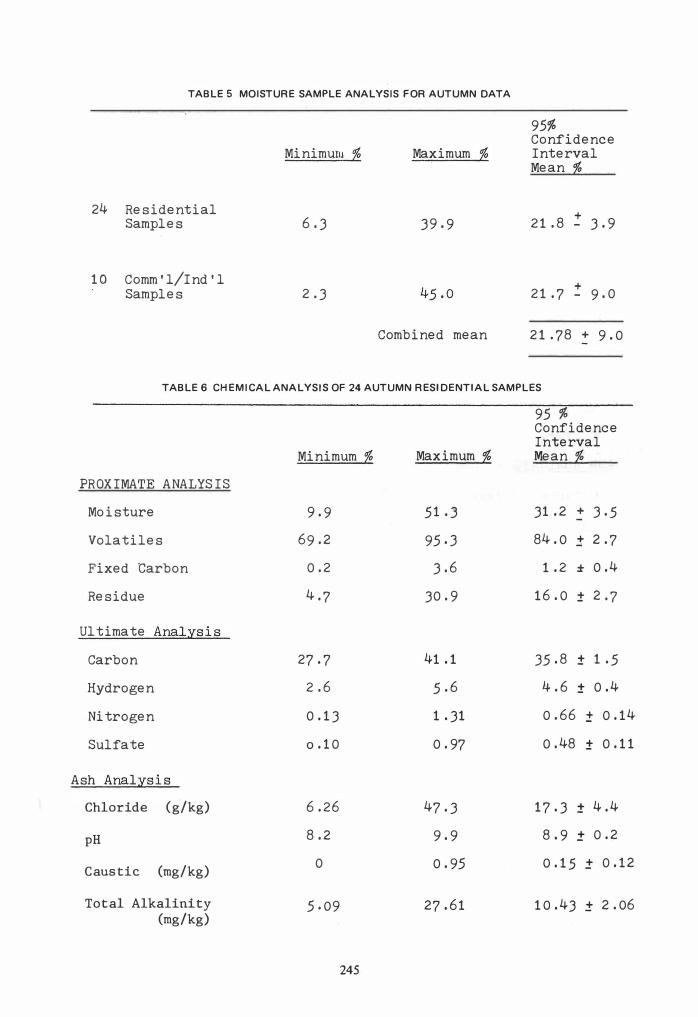
TABLE 5 MOISTURE SAMPLE ANALYSIS FOR AUTUMN DATA
24 Residential Samples
10 Comm'l/Ind'l Samples
MinimuDJ %
6.3
2·3
Maximum %
39.9
Combined mean
95% Confidence Interval Mean %
+ 21.8 - 3.9
+ 21.7 - 9.0
21·78 + 9.0
TABLE 6 CHEMICAL ANALYSIS OF 24 AUTUMN RESIDENTIAL SAMPLES
95 % Confidence Interval
Minimum % Maximum % Mean %
PROXIMATE ANALYSIS
Moisture 9.9 51.3 31.2 + 3.5
Volatiles 69.2 95·3 84.0 + 2.7
Fixed Carbon 0.2 3.6 1.2 ± 0.4
Residue 4.7 30.9 16.0 ± 2.7
Ul timate Anal;ysis
Carbon 27·7 41.1 35.8 ± 1.5
Hydrogen 2.6 5.6 4.6 ± 0.4
Nitrogen 0.13 1.31 0.66 t 0.14
Sulfate 0.10 0.97 0.48 ± 0.11
Ash Anal;ysis
Chloride (g/kg) 6.26 47·3 17.3 ± 4.4
pH 8.2 9.9 8.9 + 0.2
Caustic (mg/kg) 0 0.95 0.15 + 0.12
Total Alkalinity 5·09 27.61 10.43 + 2.06 (mg/kg)
245

TABLE 7 CHEMICAL ANALYSIS OF 10 AUTUMN COMMERCIAL/INDUSTRIAL SA MPLES
PROXIMATE ANALYSIS
Moisture
Volatiles
Fixed Carbon
Residue
ULTIMATE ANALYSIS
Carbon
Hydrogen
Nitrogen
Sulfate
ASH ANALYSIS
Chloride (g/kg)
pH
Caustic (mg/kg)
Total Alkalinity (mg/kg)
Minimum %
10.4
77.6
0·3
5·9
25·8
3·25
0.17
0.22
5·78
8.0
o
3·91
Maximum %
64.1
94.1
2.0
22·5
43·1
6.09
1.70
1.23
10.0
76.40
95 % Confidence Interval Mean %
31.4 :t 10.4
84.8 ± 3.8
0.8:t 0.4
15.3 ± 3·8
34.8 ± 3.8
4.76 ± 0.7
0.76 ± 0.36
0.61 ± 0.25
22.16 :t 15.4
9.0 ± 0.4
0.14 ± 0.17
15.21 ± 15.48
TABLE 8 CALCULATED OXYGEN AND SULFUR IN SAMPLES (Dry Basis)
24 Residential Waste Samples
% Sulfur * % Oxygen **
10 CommercialIndustrial samples
% Sulfur
% Oxygen ·Sulfur is calculated from sulfate value
Minimum
0.03
31.9
0.07
34·5
• ·Oxygen is calculated according to ASTM-O-3176-74
246
Maximum
0.32
58.8
0.41
64.1
95 % Confidence Interval Mean
0.16 ± 0.04
42.7 ± 2.7
0.20 :t 0.08
44.5 ± 5.9
,
TABLE 9 HEATING VALUES AND WEIGHTED AVERAGE CALCULATION ,
Minimum (Btu/lb)
Maximum (Btu/lb)
95% Confidence 'Interval Mean (Btu/l.b)
24 Residential Samples 2358 6004 3959 + 412 -
10 CommercialIndustrial Samples 2924 5987 4710 + 802
Waste Type
Residential
Comm'l/Ind'l
Annual Percent
79.6
20.4
Conversion Factor - 1 Btu/lb = 2326 J/kg
x
x
been adjusted for the plastics content that had to be removed to allow shredding of the samples. Because there are significant variations from truck load to truck load, it is necessary to test many samples to obtain a representative heating value.
SEASONAL EF FECT
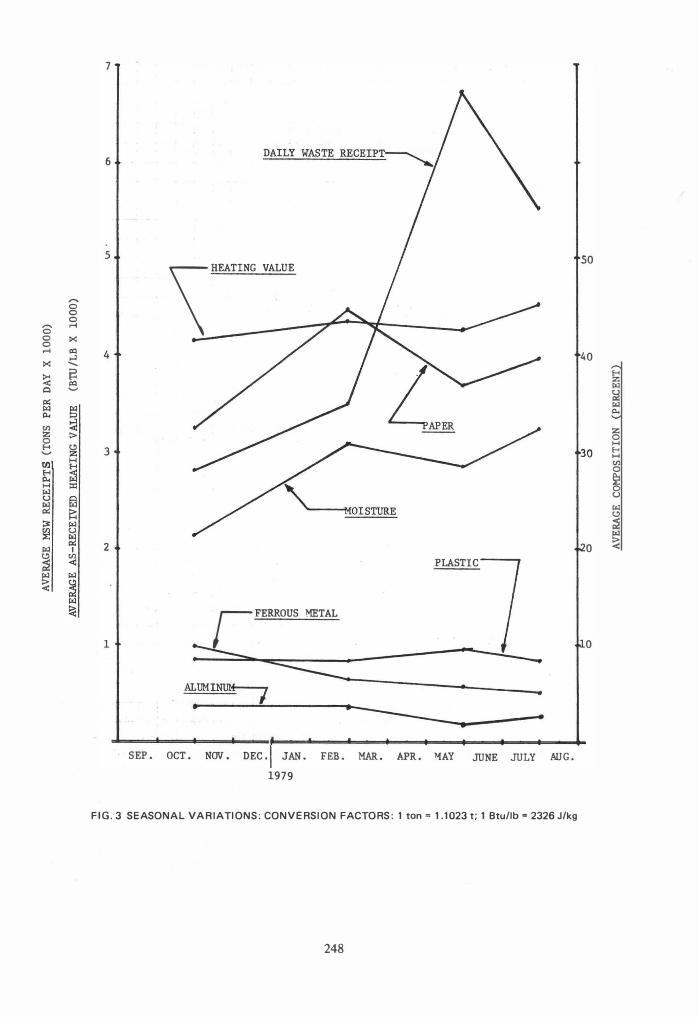
Fig. 3 shows that the heating value appears to be fairly constant over the four seasons. There is a Significant increase in both paper and moisture during the winter and spring. Plastic and aluminum content were fairly constant while ferrous metal content showed a slight variation.
CONCLUSIONS
Statistical analysis of the data included determination of means, standard deviations, and confidence intervals. Data from all four seasons was evaluated to determine whether the seasonal variations were statistically significant. Because of the relatively small sample size, close values from
He a.tiif Value (Btu lb)
3959
4710
-
=
=
Weighted Average
Weighted Average Heating Value
(BtuZlb)
3151
961 j :
4112 + 516 95% Confidence Interval
season to season, and large standard deviations, it was concluded that seasonal differences were not statistically Significant.
Although the four seasonal values were determined, each set of seasonal results was summarized to obtain mean values on an annual basis. The annual mean values were compared to national averages and other local survey data published in the literature. The comparison is provided in Taple 10.
The heating value, moisture and composition of MSW varies from truck load to truck load, from neighborhood to neighborhood, and from season to season. Reliability and validity of the average values determined depends heavily on the
number of samples taken and the con�cientious effort of the crew performing the sampling tasks. Gose supervision of the sampling crew i� crucial, and there should 'be as many samples taken as possible to assure reliable results. Reliability of results may influence the success of a resource recovery project that will cost hundreds of millions of dollars.
247
7
6
5 50
,-..
\" HEATING VALUE
0 0 0 ,-.. .-I 0
0 :< 0 .-I I:Q 4 40 ....1 :< ........ ,-..
� � E-< Z I:Q r.:I � '-' � � r.:I r.:I � Po. Po.
<J) :;J � � :> H E-< to? 3 30 E-< '-' Z H
til H <J)
� 0 E-< � Po. H ::<: r.:I u U
� gj r.:I
� to? � r.:I � � u
� gj r.:I 1 2 0 to? <J)
PLASTIC ;Z «
� r.:I
� r.:I �
I FERROUS METAL
1 0
� �
ALUMI�
. -------•
-..
SEP. OCT. NOV. DEC. JAN. FEB. MAR. APR. MAY JUNE JULY AUG.
1979
FIG.3 SEASONAL VARIATIONS: CONVERSION FACTORS: 1 ton = 1.1023 t; 1 Btu/lb = 2326 J/kg
248

TABLE 10 COMPARISON OF D ATA COMBINED RESID ENTIAL AND COMMERCIAL/IND USTRIAL
WASTES
US EPA National Average1 1978
(%) Paper )1.20
Glass & Ceramics 10.00
Metals 9·00
Ferrous 7.90
Aluminum 0.80
O.N.F. 0.)0
Textile 1.60
Rubber & Leather 2.80
Plastic ).80
Wood )·50 Organics )6.60
Miscellaneous (sand,rock & dirt) 1.50
Total 100.00
Moisture 26
Heating Value, As-Received, Btu/lb 4,600
Conversion Factor - 1 Btu/lb = 2326 J/kg
ACKNOWLEDGMENTS
The efforts of Mr. William Ingram and Dr. Herbert Fox in this work are greatly appreciated.
REFERENCES
[1] Estimates by Franklin Associates, Ltd., for the
Betts Avenu� Incinerator 1971
(%)
) )
51.25
6.69
16.8) ---
4.7)
5·0)
2.17
1).)0
1.61
101.61
15·71
4,867
South Shore Incineratpr 1 978
C%) )2.20
9.45
i) .8) 10.1 0
).70 0.0)
4.80
0.48
8.81
).8)
2).)6
).27
100.Q)
21.79
4,11 2
Resource Recovery D ivision, Office of Solid Waste, U.S.
Environmental Protection Agency, January 1978.
[2] Kaiser, E. R., Kassner, D ., and Zimmer, C.,
Incinerator Grate Deterioration - Causes, Cures, and Costs, Report to the City of New York Environmental
Protection Administration, D epartment of Sanitation,
August 1972.
Key Words
Analysis
Composition
Data
Energy
New York
Refuse
249