Embed Size (px)
Citation preview
Composites: Part A 101 (2017) 432–443
Contents lists available at ScienceDirect
Composites: Part A
journal homepage: www.elsevier .com/locate /composi tesa
Mechanisms and characterization of impact damage in 2D and 3D wovenfiber-reinforced composites
http://dx.doi.org/10.1016/j.compositesa.2017.07.0041359-835X/� 2017 Elsevier Ltd. All rights reserved.
⇑ Corresponding author at: Department of Aerospace Engineering, University ofIllinois at Urbana-Champaign, 104 S. Wright St., Urbana, IL 61801, USA.
E-mail address: [email protected] (S.R. White).URL: http://whitegroup.beckman.illinois.edu/ (S.R. White).
Kevin R. Hart a,b, Patrick X.L. Chia a, Lawrence E. Sheridan a, Eric D. Wetzel c, Nancy R. Sottos b,d,Scott R. White a,b,⇑aDepartment of Aerospace Engineering, University of Illinois at Urbana-Champaign, 104 S. Wright St., Urbana, IL 61801, USAbBeckman Institute for Advanced Science and Technology, University of Illinois at Urbana-Champaign, 405 N. Mathews Ave., Urbana, IL 61801, USAcWeapons and Materials Research Directorate, U.S. Army Research Laboratory, RDRL-WMM-A, Bldg. 4600, Aberdeen Proving Ground, MD 21005, USAdDepartment of Materials Science and Engineering, University of Illinois at Urbana-Champaign, 1304 W. Green St., Urbana, IL 61801, USA
a r t i c l e i n f o
Article history:Received 4 January 2017Received in revised form 30 June 2017Accepted 2 July 2017Available online 8 July 2017
Keywords:Impact behaviorDelamination3-Dimensional reinforcement
a b s t r a c t
Low velocity impact damage of 2D and 3D woven glass/epoxy composites with the same areal densityand material constituents were examined. Characterization of damage for both plate and beam samplegeometries was investigated through the collection of high-resolution cross-sectional images afterimpact. Load and displacement data collected during impact testing reveals that the threshold load tointroduce delamination damage is independent of the fabric architecture and is constant across a rangeof impact energies. Delamination length and opening of 3D woven composites was less than 2D compos-ites impacted at the same energy as a result of suppression of delamination propagation and openingoffered by the Z-tow reinforcement of the 3D fabric architecture. The formation of transverse shear crackswas independent of the fabric architecture.
� 2017 Elsevier Ltd. All rights reserved.
1. Introduction
Fiber reinforced composite materials are susceptible to low-velocity out-of-plane impact events that introduce internal struc-tural damage in the form of inter-ply delamination, transversematrix cracking, and tensile cracking [1]. This type of damage notonly weakens the structure, but is difficult to detect because itoccurs at relatively low impact energies and often leaves no visibleindication on the material surface (i.e. barely visible impact dam-age, BVID). If this damage goes undetected it can slowly growunder alternating or fluctuating stress, leading to a loss in mechan-ical performance and potential failure [2].
It is well known that fiber architecture plays a significant role indamage formation and post-impact mechanical performance ofimpacted composite plates and beams. For example, compositeswith stacking sequences in which the angle variation from ply toply is large show greater resistance to transverse and inter-plycrack propagation as a result of increased fiber bridging and crackdeflection [3–9]. Composites made with woven fabrics have also
shown increased residual compressive strength and smallerdelaminations than those made with unwoven unidirectional lay-ers, though the differences are typically small [10]. Through thick-ness stitching and Z-pinning has also been employed to improvethe critical energy release rates associated with fracture propaga-tion. Mode I [11–17], mode II [18–22], and mixed mode fracture[23–25] tests show that critical energy release rates increased withincreasing reinforcement until saturating above a critical density.In low-velocity impact studies, stitched and Z-pinned compositesgenerally show similar maximum impact load and energy absorp-tion when compared to similar unstitched composites. However,through thickness reinforcement (either via stitching orZ-pinning) reduces inter-ply delamination by providing additionalenergy dissipation mechanisms via crack deflection, fiber bridging,fiber pull out, and fiber rupture [1,26–28]. Despite the increasedfracture performance, stitched and Z-pinned composites typicallysuffer decreased performance (tension, compression, flexure) withincreasing stitch density due to fiber distortions which arise duringmanufacture of the preform [29].
More recently, three-dimensionally (3D) woven orthogonalnon-crimp fabric architectures have been investigated for use instructural composite applications. 3D orthogonal weaving intro-duces through-thickness fiber tows which are co-woven with thein-plane tows allowing insertion through the fabric thickness
K.R. Hart et al. / Composites: Part A 101 (2017) 432–443 433
without rupturing in-plane fibers [30]. With the rise of thismanufacturing innovation, there is significant debate regardingthe benefits of 3D woven composites when compared to similar2D woven structures. Despite multiple studies of the mechanicalbehavior of 3D woven composites in tension [31–35], compression[32], shear [32,36], and fatigue [37], there have been very fewinvestigations directly comparing 3D to 2D. In 2010, Mouritz andCox [29] consolidated current data on the in-plane mechanicalproperties of 3D woven, stitched, and pinned composites notingthat it was difficult to compare properties of 3D orthogonal wovencomposites to equivalent 2D woven composites because data wasscarce and many researchers failed to report areal densities andfiber volume fractions required for direct comparison. Data onthe comparative low-velocity impact response of 2D and 3D wovencomposites is even more limited. Baucom et al. [38–40] looked atenergy absorption and perforation in 2D and 3D woven compositesof similar areal density over multiple impact events. Authorsconcluded that while energy absorption of the first few impactevents were similar, 3D woven composites survived more strikesbefore perforation and absorbed more total energy because ofthe through thickness Z-tow binding. Unfortunately, damage sizeand characteristics were not recorded during this study.
In this paper, we compare impact response and damage forma-tion for 2D and 3D woven composite plates and beams subject toout-of-plane, low-velocity impact. Specimens are identically fabri-cated by vacuum assisted resin transfer molding of glass/epoxycomposites using woven preforms of the same areal density andmaterial construct. Load and displacement data gathered duringimpact testing is analyzed to identify the onset of various damagemodes. Post-impact fractography is employed to characterize theextent of damage including the length and separation of delamina-tions and the number of transverse shear cracks present. The effectof fiber architecture (2D vs. 3D) is revealed across a number of dif-ferent damage metrics.
We� Tow
Warp Tow
D2
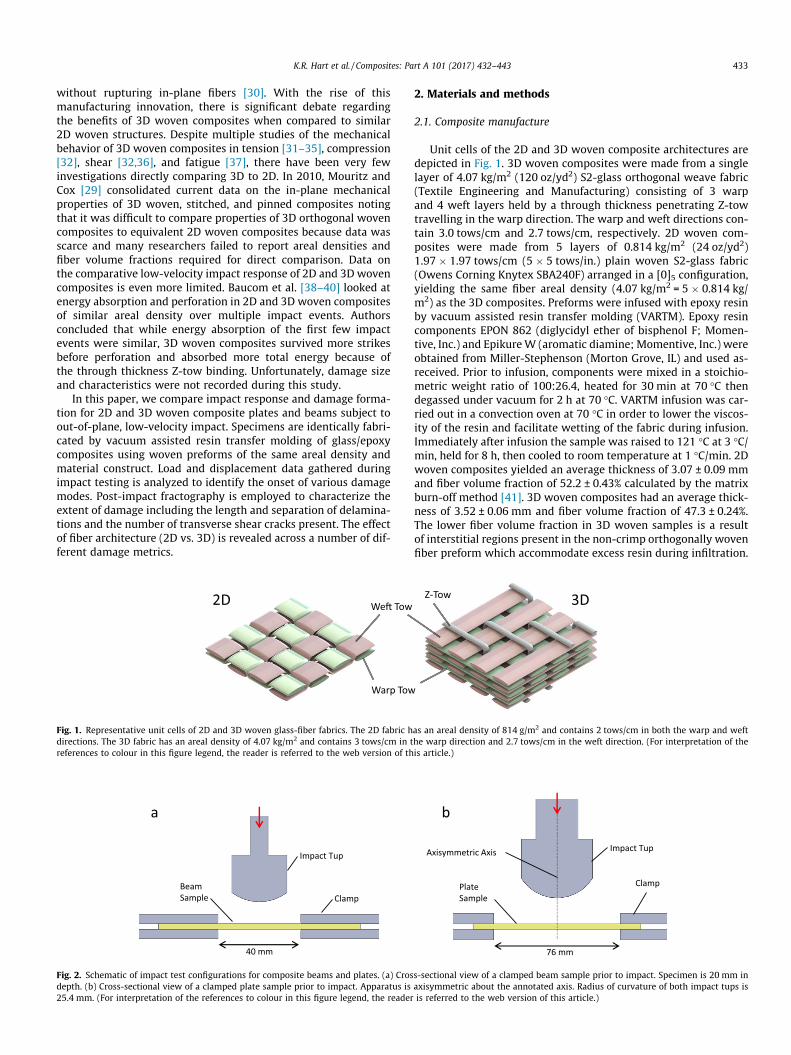
Fig. 1. Representative unit cells of 2D and 3D woven glass-fiber fabrics. The 2D fabric hdirections. The 3D fabric has an areal density of 4.07 kg/m2 and contains 3 tows/cm in treferences to colour in this figure legend, the reader is referred to the web version of th
Impact Tup
ClampBeamSample
40 mm
a
Fig. 2. Schematic of impact test configurations for composite beams and plates. (a) Crosdepth. (b) Cross-sectional view of a clamped plate sample prior to impact. Apparatus is25.4 mm. (For interpretation of the references to colour in this figure legend, the reader
2. Materials and methods
2.1. Composite manufacture
Unit cells of the 2D and 3D woven composite architectures aredepicted in Fig. 1. 3D woven composites were made from a singlelayer of 4.07 kg/m2 (120 oz/yd2) S2-glass orthogonal weave fabric(Textile Engineering and Manufacturing) consisting of 3 warpand 4 weft layers held by a through thickness penetrating Z-towtravelling in the warp direction. The warp and weft directions con-tain 3.0 tows/cm and 2.7 tows/cm, respectively. 2D woven com-posites were made from 5 layers of 0.814 kg/m2 (24 oz/yd2)1.97 � 1.97 tows/cm (5 � 5 tows/in.) plain woven S2-glass fabric(Owens Corning Knytex SBA240F) arranged in a [0]5 configuration,yielding the same fiber areal density (4.07 kg/m2 = 5 � 0.814 kg/m2) as the 3D composites. Preforms were infused with epoxy resinby vacuum assisted resin transfer molding (VARTM). Epoxy resincomponents EPON 862 (diglycidyl ether of bisphenol F; Momen-tive, Inc.) and EpikureW (aromatic diamine; Momentive, Inc.) wereobtained from Miller-Stephenson (Morton Grove, IL) and used as-received. Prior to infusion, components were mixed in a stoichio-metric weight ratio of 100:26.4, heated for 30 min at 70 �C thendegassed under vacuum for 2 h at 70 �C. VARTM infusion was car-ried out in a convection oven at 70 �C in order to lower the viscos-ity of the resin and facilitate wetting of the fabric during infusion.Immediately after infusion the sample was raised to 121 �C at 3 �C/min, held for 8 h, then cooled to room temperature at 1 �C/min. 2Dwoven composites yielded an average thickness of 3.07 ± 0.09 mmand fiber volume fraction of 52.2 ± 0.43% calculated by the matrixburn-off method [41]. 3D woven composites had an average thick-ness of 3.52 ± 0.06 mm and fiber volume fraction of 47.3 ± 0.24%.The lower fiber volume fraction in 3D woven samples is a resultof interstitial regions present in the non-crimp orthogonally wovenfiber preform which accommodate excess resin during infiltration.
Z-Tow D3
as an areal density of 814 g/m2 and contains 2 tows/cm in both the warp and wefthe warp direction and 2.7 tows/cm in the weft direction. (For interpretation of theis article.)
Axisymmetric Axis
PlateSample
76 mm
Impact Tup
Clamp
b
s-sectional view of a clamped beam sample prior to impact. Specimen is 20 mm inaxisymmetric about the annotated axis. Radius of curvature of both impact tups isis referred to the web version of this article.)
434 K.R. Hart et al. / Composites: Part A 101 (2017) 432–443
Plate samples were cut to 101 � 101 mm to conform with ASTMD7137, the standard test method for compressive residual strengthproperties of damaged polymer matrix composite plates. Beamspecimens were cut to 20 � 110 mm with the warp directionaligned to the longitudinal axis of the beam to conform with ASTMD790, the standard test methods for flexural properties of unrein-forced and reinforced plastics and electrical insulating materials.
2.2. Impact testing
2.2.1. Impact of beam specimensImpact testing of beam samples was conducted on a drop-
weight tower (Model 8250; Instron; Canton MA). Samples wereclamped in a fixed-fixed configuration with a free span of 40 mmand impacted in the center of the span across the entire width ofthe specimen with a cylindrical impact tup (25.4 mm radius of cur-vature, Fig. 2a). The tup configuration and the range of impactenergies used were selected to minimize fiber damage so thatthe effects of matrix damage and interface delamination alonecould be isolated and investigated. Samples were impacted witha range of impact energies up to 25 J (Table 1). Load data was
a
b
c
d
e
f
g
h
i
j
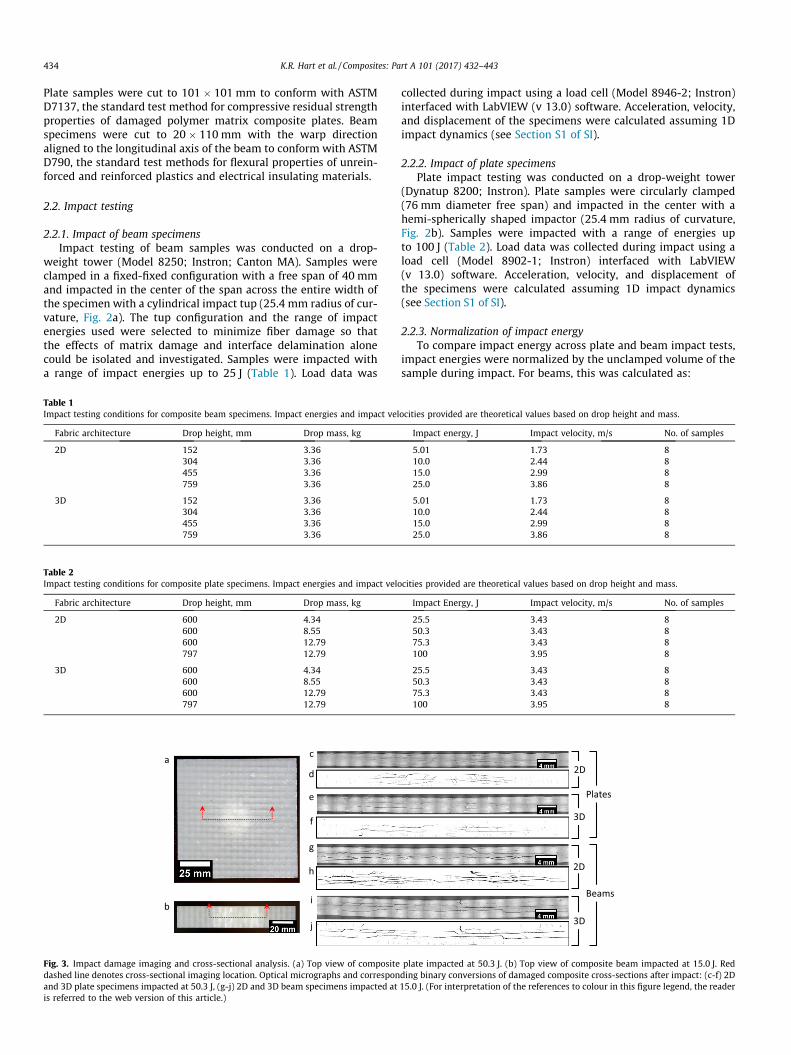
Fig. 3. Impact damage imaging and cross-sectional analysis. (a) Top view of compositedashed line denotes cross-sectional imaging location. Optical micrographs and corresponand 3D plate specimens impacted at 50.3 J, (g-j) 2D and 3D beam specimens impacted atis referred to the web version of this article.)
Table 2Impact testing conditions for composite plate specimens. Impact energies and impact velo
Fabric architecture Drop height, mm Drop mass, kg
2D 600 4.34600 8.55600 12.79797 12.79
3D 600 4.34600 8.55600 12.79797 12.79
Table 1Impact testing conditions for composite beam specimens. Impact energies and impact vel
Fabric architecture Drop height, mm Drop mass, kg
2D 152 3.36304 3.36455 3.36759 3.36
3D 152 3.36304 3.36455 3.36759 3.36
collected during impact using a load cell (Model 8946-2; Instron)interfaced with LabVIEW (v 13.0) software. Acceleration, velocity,and displacement of the specimens were calculated assuming 1Dimpact dynamics (see Section S1 of SI).
2.2.2. Impact of plate specimensPlate impact testing was conducted on a drop-weight tower
(Dynatup 8200; Instron). Plate samples were circularly clamped(76 mm diameter free span) and impacted in the center with ahemi-spherically shaped impactor (25.4 mm radius of curvature,Fig. 2b). Samples were impacted with a range of energies upto 100 J (Table 2). Load data was collected during impact using aload cell (Model 8902-1; Instron) interfaced with LabVIEW(v 13.0) software. Acceleration, velocity, and displacement ofthe specimens were calculated assuming 1D impact dynamics(see Section S1 of SI).
2.2.3. Normalization of impact energyTo compare impact energy across plate and beam impact tests,
impact energies were normalized by the unclamped volume of thesample during impact. For beams, this was calculated as:
cities provided are theoretical values based on drop height and mass.
Impact Energy, J Impact velocity, m/s No. of samples
25.5 3.43 850.3 3.43 875.3 3.43 8100 3.95 8
25.5 3.43 850.3 3.43 875.3 3.43 8100 3.95 8
ocities provided are theoretical values based on drop height and mass.
Impact energy, J Impact velocity, m/s No. of samples
5.01 1.73 810.0 2.44 815.0 2.99 825.0 3.86 8
5.01 1.73 810.0 2.44 815.0 2.99 825.0 3.86 8
2D
3D
2D
3D
Beams
Plates
plate impacted at 50.3 J. (b) Top view of composite beam impacted at 15.0 J. Redding binary conversions of damaged composite cross-sections after impact: (c-f) 2D15.0 J. (For interpretation of the references to colour in this figure legend, the reader
K.R. Hart et al. / Composites: Part A 101 (2017) 432–443 435
U ¼ U=Lwtbeam ð1Þand for plates was calculated as:
U ¼ 4U=pD2tplate ð2Þ
where U is the impact energy density, U is the impact energy, L isthe unclamped beam span, w is the beam width, tbeam is the beamthickness, tplate is the plate thickness, and D is the unclamped diam-eter of the plate.
2.3. Cross-sectional imaging and damage characterization
Plate specimens were sectioned in half along the warp directionfor standard analysis (Fig. 3a) or sectioned at angles of 30, 45, 60 or90�with respect to the warp direction for axial-symmetry analysis.Beam specimens were sectioned in half along the longitudinal(warp) axis (Fig. 3b). Samples were then polished with successivelyfiner grit paper and polishing compound until optically smooth(see detailed procedure in Section S2 of SI). Images of damagedsamples were gathered in bright-field reflection using an opticalmicroscope with a 2.5x objective (Axiovert 200M; Zeiss Corpora-tion; Oberkochen, Germany) yielding 8-bit greyscale images witha resolution of 2.39 mm/pixel. To view the entire cross-section,multiple images were stitched together using automatic imagegathering and tiling options within the microscope control soft-ware (Axiovision 4.7; Zeiss Corporation). Measurement error
Binary Conversion Area T
Original I
Full Converted Binary Image With Highlighte
a
b c
Large Region
Counted
e
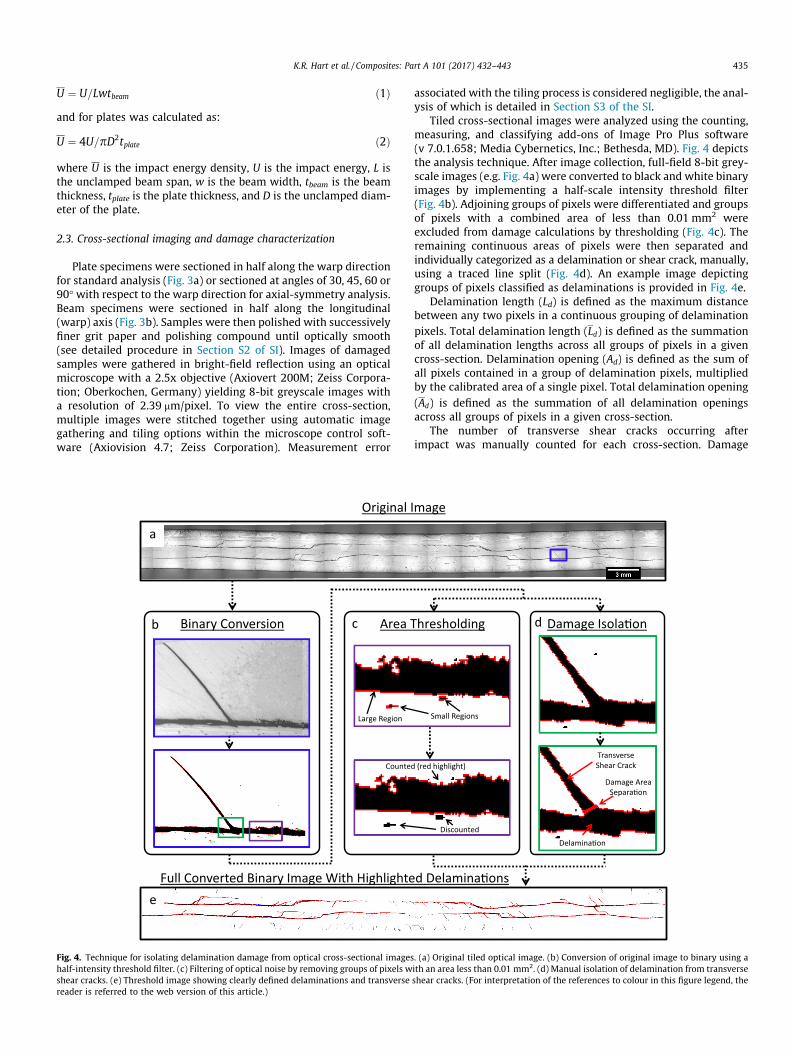
Fig. 4. Technique for isolating delamination damage from optical cross-sectional imageshalf-intensity threshold filter. (c) Filtering of optical noise by removing groups of pixels wshear cracks. (e) Threshold image showing clearly defined delaminations and transversereader is referred to the web version of this article.)
associated with the tiling process is considered negligible, the anal-ysis of which is detailed in Section S3 of the SI.
Tiled cross-sectional images were analyzed using the counting,measuring, and classifying add-ons of Image Pro Plus software(v 7.0.1.658; Media Cybernetics, Inc.; Bethesda, MD). Fig. 4 depictsthe analysis technique. After image collection, full-field 8-bit grey-scale images (e.g. Fig. 4a) were converted to black and white binaryimages by implementing a half-scale intensity threshold filter(Fig. 4b). Adjoining groups of pixels were differentiated and groupsof pixels with a combined area of less than 0.01 mm2 wereexcluded from damage calculations by thresholding (Fig. 4c). Theremaining continuous areas of pixels were then separated andindividually categorized as a delamination or shear crack, manually,using a traced line split (Fig. 4d). An example image depictinggroups of pixels classified as delaminations is provided in Fig. 4e.
Delamination length (Ld) is defined as the maximum distancebetween any two pixels in a continuous grouping of delaminationpixels. Total delamination length (Ld) is defined as the summationof all delamination lengths across all groups of pixels in a givencross-section. Delamination opening (Ad) is defined as the sum ofall pixels contained in a group of delamination pixels, multipliedby the calibrated area of a single pixel. Total delamination opening(Ad) is defined as the summation of all delamination openingsacross all groups of pixels in a given cross-section.
The number of transverse shear cracks occurring afterimpact was manually counted for each cross-section. Damage
hresholding Damage Isola�on
Transverse Shear Crack
Delamina�on
mage
d Delamina�ons
d
Small Regions
Damage Area Separa�on
(red highlight)
Discounted
. (a) Original tiled optical image. (b) Conversion of original image to binary using aith an area less than 0.01 mm2. (d) Manual isolation of delamination from transverseshear cracks. (For interpretation of the references to colour in this figure legend, the
5 J
10 JDelamina�on
a
b
Impact Site
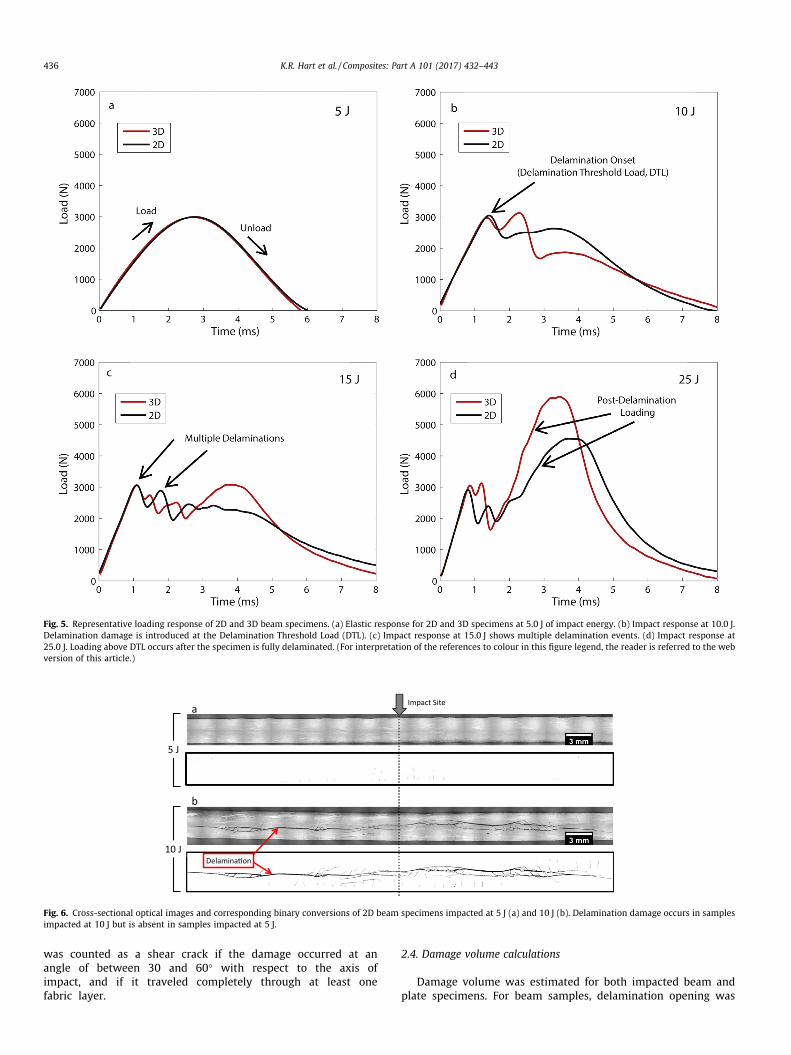
Fig. 6. Cross-sectional optical images and corresponding binary conversions of 2D beam specimens impacted at 5 J (a) and 10 J (b). Delamination damage occurs in samplesimpacted at 10 J but is absent in samples impacted at 5 J.
Fig. 5. Representative loading response of 2D and 3D beam specimens. (a) Elastic response for 2D and 3D specimens at 5.0 J of impact energy. (b) Impact response at 10.0 J.Delamination damage is introduced at the Delamination Threshold Load (DTL). (c) Impact response at 15.0 J shows multiple delamination events. (d) Impact response at25.0 J. Loading above DTL occurs after the specimen is fully delaminated. (For interpretation of the references to colour in this figure legend, the reader is referred to the webversion of this article.)
436 K.R. Hart et al. / Composites: Part A 101 (2017) 432–443
was counted as a shear crack if the damage occurred at anangle of between 30 and 60� with respect to the axis ofimpact, and if it traveled completely through at least onefabric layer.
2.4. Damage volume calculations
Damage volume was estimated for both impacted beam andplate specimens. For beam samples, delamination opening was
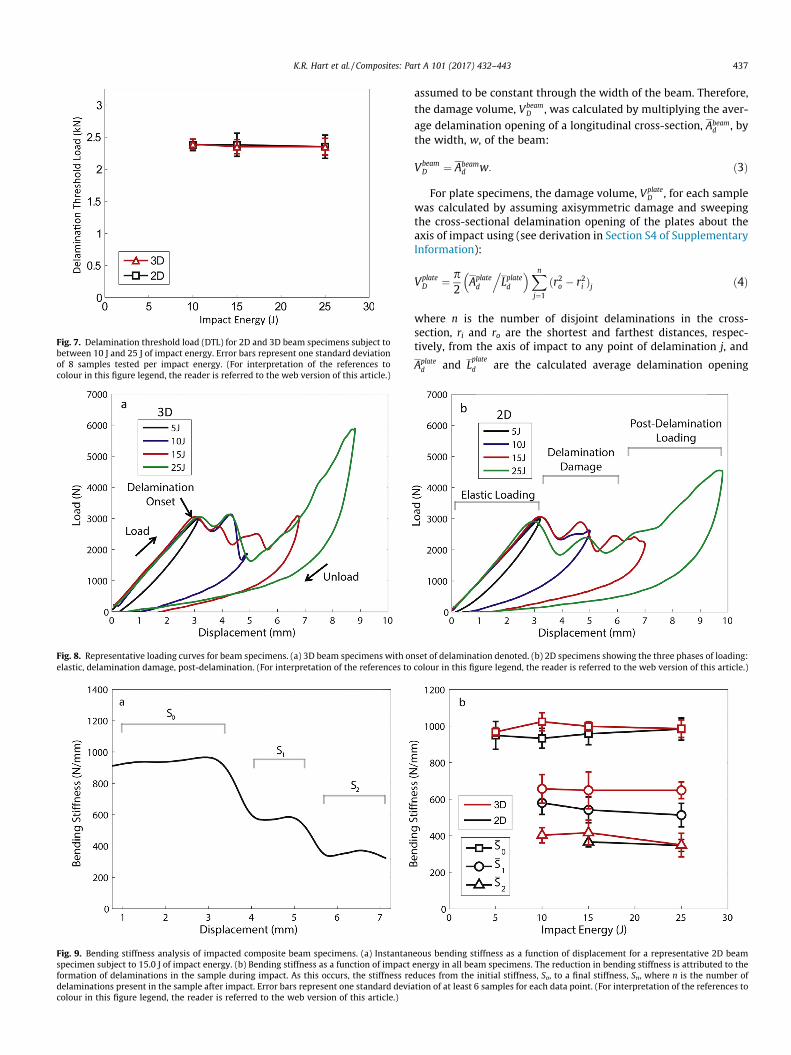
Fig. 9. Bending stiffness analysis of impacted composite beam specimens. (a) Instantanspecimen subject to 15.0 J of impact energy. (b) Bending stiffness as a function of impactformation of delaminations in the sample during impact. As this occurs, the stiffness redelaminations present in the sample after impact. Error bars represent one standard deviacolour in this figure legend, the reader is referred to the web version of this article.)
Fig. 8. Representative loading curves for beam specimens. (a) 3D beam specimens with onelastic, delamination damage, post-delamination. (For interpretation of the references to
Fig. 7. Delamination threshold load (DTL) for 2D and 3D beam specimens subject tobetween 10 J and 25 J of impact energy. Error bars represent one standard deviationof 8 samples tested per impact energy. (For interpretation of the references tocolour in this figure legend, the reader is referred to the web version of this article.)
K.R. Hart et al. / Composites: Part A 101 (2017) 432–443 437
assumed to be constant through the width of the beam. Therefore,
the damage volume, VbeamD , was calculated by multiplying the aver-
age delamination opening of a longitudinal cross-section, Abeamd , by
the width, w, of the beam:
VbeamD ¼ Abeam
d w: ð3Þ
For plate specimens, the damage volume, VplateD , for each sample
was calculated by assuming axisymmetric damage and sweepingthe cross-sectional delamination opening of the plates about theaxis of impact using (see derivation in Section S4 of SupplementaryInformation):
VplateD ¼ p
2Aplated Lplated
.� �Xnj¼1
ðr2o � r2i Þj ð4Þ
where n is the number of disjoint delaminations in the cross-section, ri and ro are the shortest and farthest distances, respec-tively, from the axis of impact to any point of delamination j, and
Aplated and L
plated are the calculated average delamination opening
eous bending stiffness as a function of displacement for a representative 2D beamenergy in all beam specimens. The reduction in bending stiffness is attributed to theduces from the initial stiffness, So, to a final stiffness, Sn, where n is the number otion of at least 6 samples for each data point. (For interpretation of the references to
set of delamination denoted. (b) 2D specimens showing the three phases of loadingcolour in this figure legend, the reader is referred to the web version of this article.
f
:)
438 K.R. Hart et al. / Composites: Part A 101 (2017) 432–443
and length of the cross-section, respectively. As will be shown later,the assumption of axisymmetric damage is largely satisfied (seeFig. 16). Variations in delamination length and opening about theimpact point were, on average, less than 5%, except for in the warpdirection of 3D woven composites, where increased delaminationlength was observed. These damage volume calculations are impor-tant for estimating the amount of healing agent required for self-healing [46] or determining the increase in water/solvent retentionand permeability after impact.
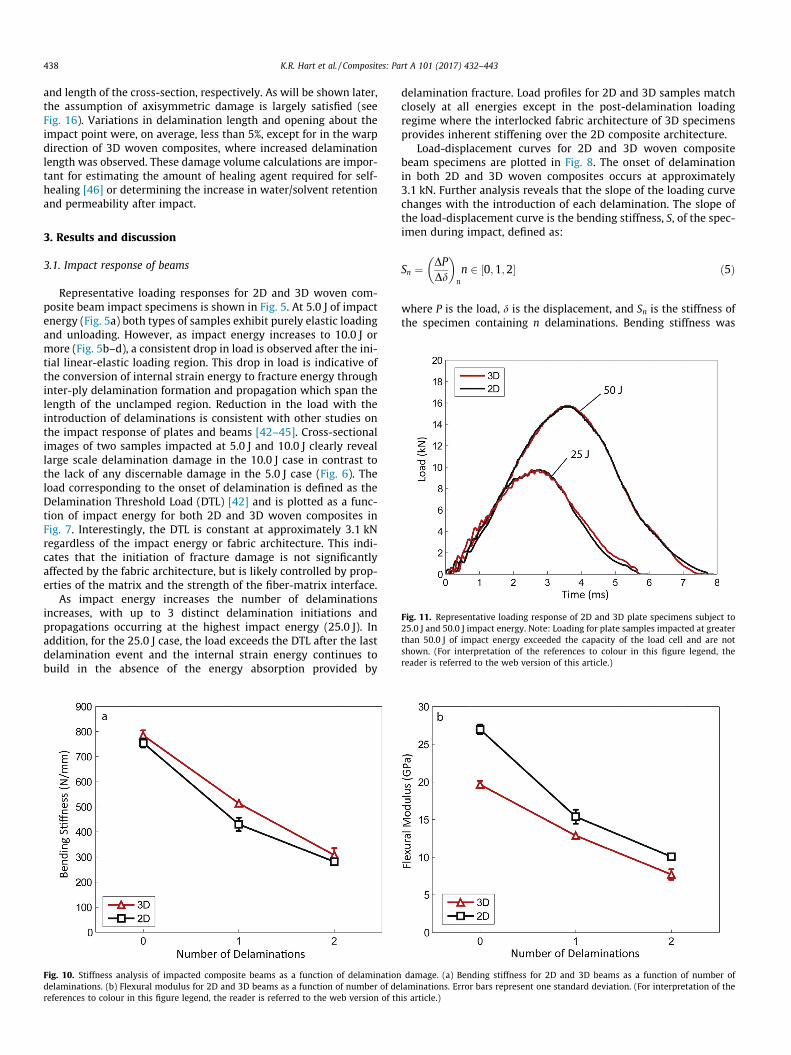
Fig. 11. Representative loading response of 2D and 3D plate specimens subject to25.0 J and 50.0 J impact energy. Note: Loading for plate samples impacted at greaterthan 50.0 J of impact energy exceeded the capacity of the load cell and are notshown. (For interpretation of the references to colour in this figure legend, thereader is referred to the web version of this article.)
3. Results and discussion
3.1. Impact response of beams
Representative loading responses for 2D and 3D woven com-posite beam impact specimens is shown in Fig. 5. At 5.0 J of impactenergy (Fig. 5a) both types of samples exhibit purely elastic loadingand unloading. However, as impact energy increases to 10.0 J ormore (Fig. 5b–d), a consistent drop in load is observed after the ini-tial linear-elastic loading region. This drop in load is indicative ofthe conversion of internal strain energy to fracture energy throughinter-ply delamination formation and propagation which span thelength of the unclamped region. Reduction in the load with theintroduction of delaminations is consistent with other studies onthe impact response of plates and beams [42–45]. Cross-sectionalimages of two samples impacted at 5.0 J and 10.0 J clearly reveallarge scale delamination damage in the 10.0 J case in contrast tothe lack of any discernable damage in the 5.0 J case (Fig. 6). Theload corresponding to the onset of delamination is defined as theDelamination Threshold Load (DTL) [42] and is plotted as a func-tion of impact energy for both 2D and 3D woven composites inFig. 7. Interestingly, the DTL is constant at approximately 3.1 kNregardless of the impact energy or fabric architecture. This indi-cates that the initiation of fracture damage is not significantlyaffected by the fabric architecture, but is likely controlled by prop-erties of the matrix and the strength of the fiber-matrix interface.
As impact energy increases the number of delaminationsincreases, with up to 3 distinct delamination initiations andpropagations occurring at the highest impact energy (25.0 J). Inaddition, for the 25.0 J case, the load exceeds the DTL after the lastdelamination event and the internal strain energy continues tobuild in the absence of the energy absorption provided by
Fig. 10. Stiffness analysis of impacted composite beams as a function of delaminationdelaminations. (b) Flexural modulus for 2D and 3D beams as a function of number of dereferences to colour in this figure legend, the reader is referred to the web version of th
delamination fracture. Load profiles for 2D and 3D samples matchclosely at all energies except in the post-delamination loadingregime where the interlocked fabric architecture of 3D specimensprovides inherent stiffening over the 2D composite architecture.
Load-displacement curves for 2D and 3D woven compositebeam specimens are plotted in Fig. 8. The onset of delaminationin both 2D and 3D woven composites occurs at approximately3.1 kN. Further analysis reveals that the slope of the loading curvechanges with the introduction of each delamination. The slope ofthe load-displacement curve is the bending stiffness, S, of the spec-imen during impact, defined as:
Sn ¼ DPDd
� �n
n 2 ½0;1;2� ð5Þ
where P is the load, d is the displacement, and Sn is the stiffness ofthe specimen containing n delaminations. Bending stiffness was
damage. (a) Bending stiffness for 2D and 3D beams as a function of number oflaminations. Error bars represent one standard deviation. (For interpretation of theis article.)
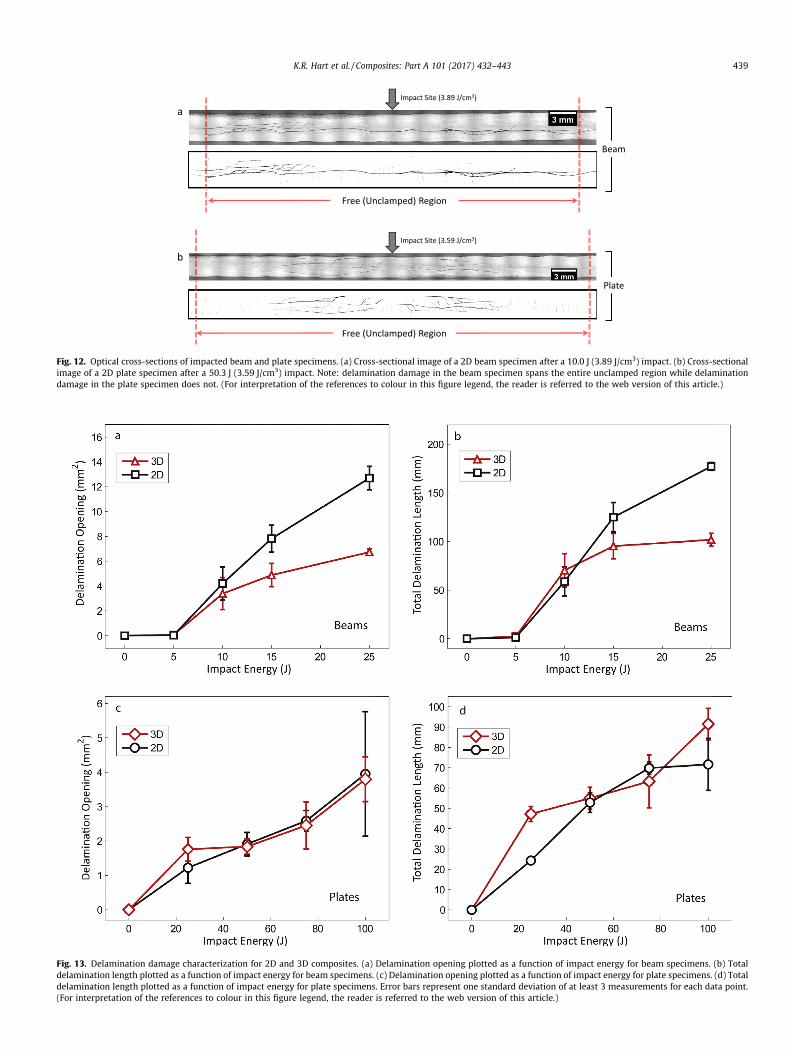
Fig. 13. Delamination damage characterization for 2D and 3D composites. (a) Delamination opening plotted as a function of impact energy for beam specimens. (b) Totaldelamination length plotted as a function of impact energy for beam specimens. (c) Delamination opening plotted as a function of impact energy for plate specimens. (d) Totaldelamination length plotted as a function of impact energy for plate specimens. Error bars represent one standard deviation of at least 3 measurements for each data point.(For interpretation of the references to colour in this figure legend, the reader is referred to the web version of this article.)
Free (Unclamped) Region
Free (Unclamped) Region
Impact Site (3.59 J/cm3)
b
a
Beam
Plate
Impact Site (3.89 J/cm3)
Fig. 12. Optical cross-sections of impacted beam and plate specimens. (a) Cross-sectional image of a 2D beam specimen after a 10.0 J (3.89 J/cm3) impact. (b) Cross-sectionalimage of a 2D plate specimen after a 50.3 J (3.59 J/cm3) impact. Note: delamination damage in the beam specimen spans the entire unclamped region while delaminationdamage in the plate specimen does not. (For interpretation of the references to colour in this figure legend, the reader is referred to the web version of this article.)
K.R. Hart et al. / Composites: Part A 101 (2017) 432–443 439
440 K.R. Hart et al. / Composites: Part A 101 (2017) 432–443
averaged over each delamination domain to get an average bendingstiffness for each delamination regime, Sn.
Fig. 9a depicts the bending stiffness (Sn) for a 3D beam specimensubject to 15.0 J of impact energy as a function of displacement.Three distinct regions (S0, S1, and S2) are indicated; each is demar-cated by the introduction of new delamination cracks. Fig. 9bshows the average value of the bending stiffness, Sn, as a functionof impact energy for both 2D and 3D composites subject to a rangeof impact energies. Notably, the average bending stiffness is con-stant for each class of composite and the reduction in stiffness witheach delamination is consistent across a range of impact energies.
Fig.10a presents the bending stiffness for both 2D and 3D spec-imens as a function of the number of delaminations, regardless ofthe level of initial impact energy. Remarkably, all the data collapsesto a single correlation relation in which the reduction in bendingstiffness scales with the number of delaminations. As delamina-tions are introduced, the original beam acts structurally like a com-bination of thinner beams with reduced cross-sectional momentsof inertia.
Using classical beam theory and the calculated bending stiffnessduring impact, an estimate of the flexural modulus during eachdamage regime is made using:
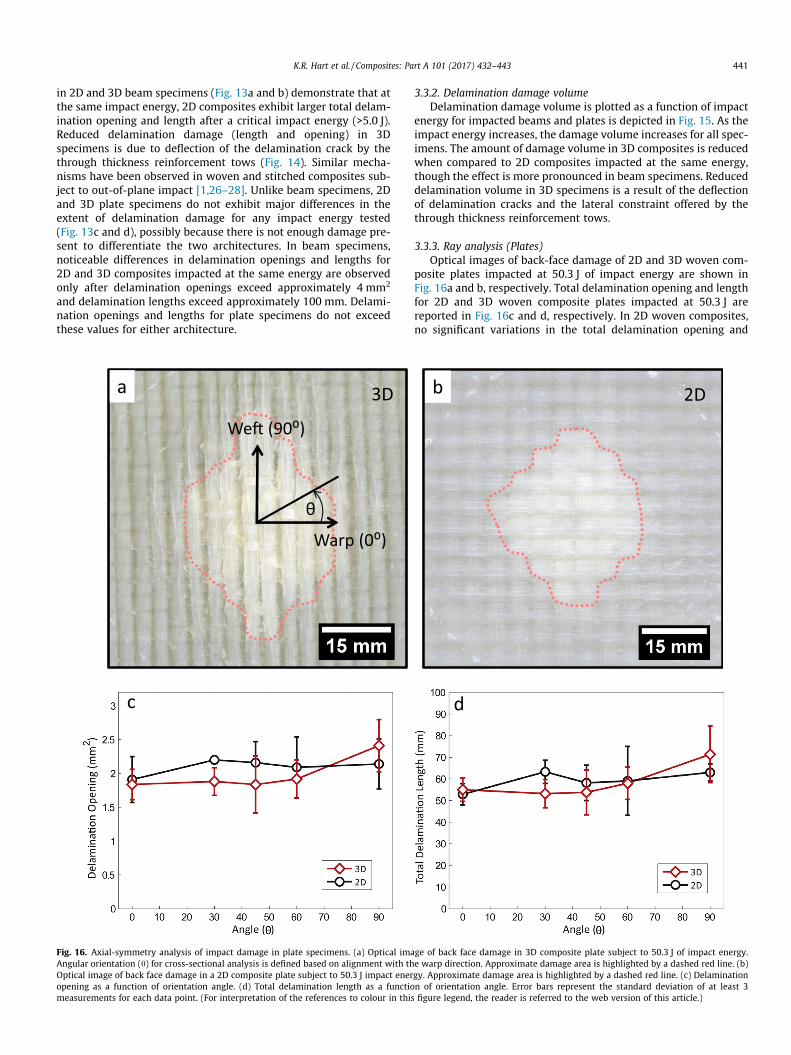
Fig. 15. Impact damage volume estimates for 2D and 3D composite beams and plates. (volume of plate specimens as a function of impact energy. Error bars represent one standthe references to colour in this figure legend, the reader is referred to the web version o
Delamina�on
Delamina�on Deflec�on
Z-tow
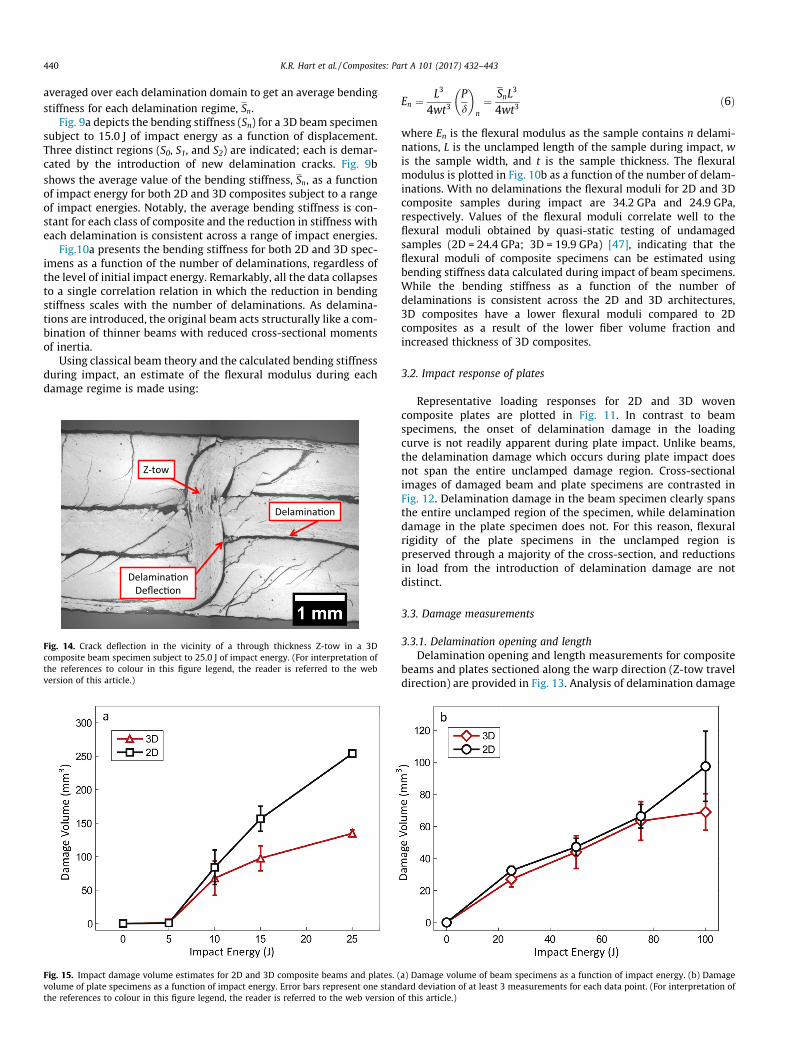
Fig. 14. Crack deflection in the vicinity of a through thickness Z-tow in a 3Dcomposite beam specimen subject to 25.0 J of impact energy. (For interpretation ofthe references to colour in this figure legend, the reader is referred to the webversion of this article.)
En ¼ L3
4wt3Pd
� �n
¼ SnL3
4wt3ð6Þ
where En is the flexural modulus as the sample contains n delami-nations, L is the unclamped length of the sample during impact, wis the sample width, and t is the sample thickness. The flexuralmodulus is plotted in Fig. 10b as a function of the number of delam-inations. With no delaminations the flexural moduli for 2D and 3Dcomposite samples during impact are 34.2 GPa and 24.9 GPa,respectively. Values of the flexural moduli correlate well to theflexural moduli obtained by quasi-static testing of undamagedsamples (2D = 24.4 GPa; 3D = 19.9 GPa) [47], indicating that theflexural moduli of composite specimens can be estimated usingbending stiffness data calculated during impact of beam specimens.While the bending stiffness as a function of the number ofdelaminations is consistent across the 2D and 3D architectures,3D composites have a lower flexural moduli compared to 2Dcomposites as a result of the lower fiber volume fraction andincreased thickness of 3D composites.
3.2. Impact response of plates
Representative loading responses for 2D and 3D wovencomposite plates are plotted in Fig. 11. In contrast to beamspecimens, the onset of delamination damage in the loadingcurve is not readily apparent during plate impact. Unlike beams,the delamination damage which occurs during plate impact doesnot span the entire unclamped damage region. Cross-sectionalimages of damaged beam and plate specimens are contrasted inFig. 12. Delamination damage in the beam specimen clearly spansthe entire unclamped region of the specimen, while delaminationdamage in the plate specimen does not. For this reason, flexuralrigidity of the plate specimens in the unclamped region ispreserved through a majority of the cross-section, and reductionsin load from the introduction of delamination damage are notdistinct.
3.3. Damage measurements
3.3.1. Delamination opening and lengthDelamination opening and length measurements for composite
beams and plates sectioned along the warp direction (Z-tow traveldirection) are provided in Fig. 13. Analysis of delamination damage
a) Damage volume of beam specimens as a function of impact energy. (b) Damageard deviation of at least 3 measurements for each data point. (For interpretation off this article.)
K.R. Hart et al. / Composites: Part A 101 (2017) 432–443 441
in 2D and 3D beam specimens (Fig. 13a and b) demonstrate that atthe same impact energy, 2D composites exhibit larger total delam-ination opening and length after a critical impact energy (>5.0 J).Reduced delamination damage (length and opening) in 3Dspecimens is due to deflection of the delamination crack by thethrough thickness reinforcement tows (Fig. 14). Similar mecha-nisms have been observed in woven and stitched composites sub-ject to out-of-plane impact [1,26–28]. Unlike beam specimens, 2Dand 3D plate specimens do not exhibit major differences in theextent of delamination damage for any impact energy tested(Fig. 13c and d), possibly because there is not enough damage pre-sent to differentiate the two architectures. In beam specimens,noticeable differences in delamination openings and lengths for2D and 3D composites impacted at the same energy are observedonly after delamination openings exceed approximately 4 mm2
and delamination lengths exceed approximately 100 mm. Delami-nation openings and lengths for plate specimens do not exceedthese values for either architecture.
3Da
c
Warp (0⁰)
θ
We� (90⁰)
Fig. 16. Axial-symmetry analysis of impact damage in plate specimens. (a) Optical imaAngular orientation (h) for cross-sectional analysis is defined based on alignment with thOptical image of back face damage in a 2D composite plate subject to 50.3 J impact eneropening as a function of orientation angle. (d) Total delamination length as a functiomeasurements for each data point. (For interpretation of the references to colour in this
3.3.2. Delamination damage volumeDelamination damage volume is plotted as a function of impact
energy for impacted beams and plates is depicted in Fig. 15. As theimpact energy increases, the damage volume increases for all spec-imens. The amount of damage volume in 3D composites is reducedwhen compared to 2D composites impacted at the same energy,though the effect is more pronounced in beam specimens. Reduceddelamination volume in 3D specimens is a result of the deflectionof delamination cracks and the lateral constraint offered by thethrough thickness reinforcement tows.
3.3.3. Ray analysis (Plates)Optical images of back-face damage of 2D and 3D woven com-
posite plates impacted at 50.3 J of impact energy are shown inFig. 16a and b, respectively. Total delamination opening and lengthfor 2D and 3D woven composite plates impacted at 50.3 J arereported in Fig. 16c and d, respectively. In 2D woven composites,no significant variations in the total delamination opening and
2Db
d
ge of back face damage in 3D composite plate subject to 50.3 J of impact energy.e warp direction. Approximate damage area is highlighted by a dashed red line. (b)gy. Approximate damage area is highlighted by a dashed red line. (c) Delaminationn of orientation angle. Error bars represent the standard deviation of at least 3figure legend, the reader is referred to the web version of this article.)
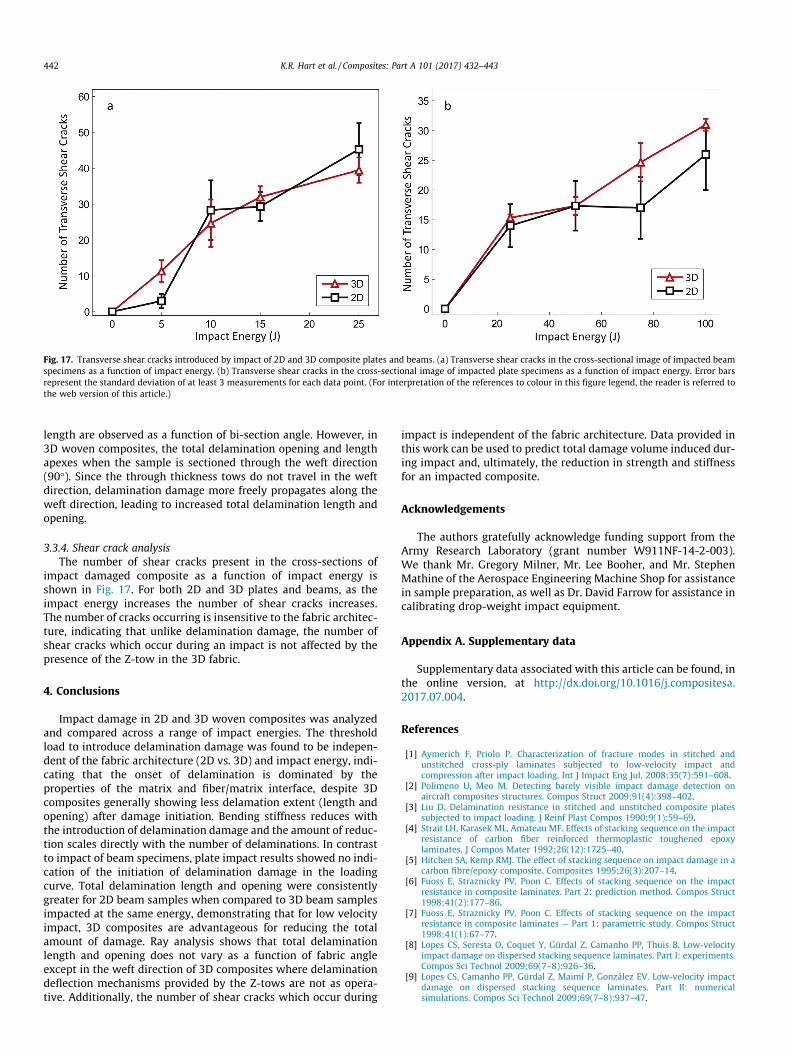
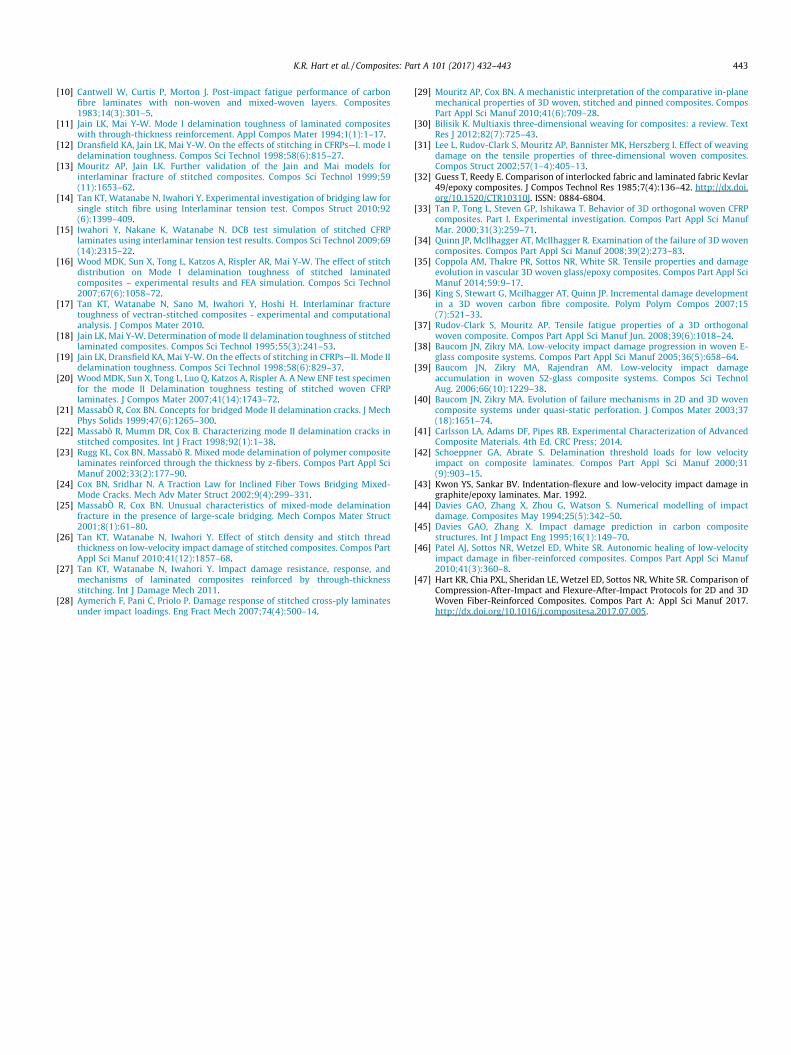
Fig. 17. Transverse shear cracks introduced by impact of 2D and 3D composite plates and beams. (a) Transverse shear cracks in the cross-sectional image of impacted beamspecimens as a function of impact energy. (b) Transverse shear cracks in the cross-sectional image of impacted plate specimens as a function of impact energy. Error barsrepresent the standard deviation of at least 3 measurements for each data point. (For interpretation of the references to colour in this figure legend, the reader is referred tothe web version of this article.)
442 K.R. Hart et al. / Composites: Part A 101 (2017) 432–443
length are observed as a function of bi-section angle. However, in3D woven composites, the total delamination opening and lengthapexes when the sample is sectioned through the weft direction(90�). Since the through thickness tows do not travel in the weftdirection, delamination damage more freely propagates along theweft direction, leading to increased total delamination length andopening.
3.3.4. Shear crack analysisThe number of shear cracks present in the cross-sections of
impact damaged composite as a function of impact energy isshown in Fig. 17. For both 2D and 3D plates and beams, as theimpact energy increases the number of shear cracks increases.The number of cracks occurring is insensitive to the fabric architec-ture, indicating that unlike delamination damage, the number ofshear cracks which occur during an impact is not affected by thepresence of the Z-tow in the 3D fabric.
4. Conclusions
Impact damage in 2D and 3D woven composites was analyzedand compared across a range of impact energies. The thresholdload to introduce delamination damage was found to be indepen-dent of the fabric architecture (2D vs. 3D) and impact energy, indi-cating that the onset of delamination is dominated by theproperties of the matrix and fiber/matrix interface, despite 3Dcomposites generally showing less delamation extent (length andopening) after damage initiation. Bending stiffness reduces withthe introduction of delamination damage and the amount of reduc-tion scales directly with the number of delaminations. In contrastto impact of beam specimens, plate impact results showed no indi-cation of the initiation of delamination damage in the loadingcurve. Total delamination length and opening were consistentlygreater for 2D beam samples when compared to 3D beam samplesimpacted at the same energy, demonstrating that for low velocityimpact, 3D composites are advantageous for reducing the totalamount of damage. Ray analysis shows that total delaminationlength and opening does not vary as a function of fabric angleexcept in the weft direction of 3D composites where delaminationdeflection mechanisms provided by the Z-tows are not as opera-tive. Additionally, the number of shear cracks which occur during
impact is independent of the fabric architecture. Data provided inthis work can be used to predict total damage volume induced dur-ing impact and, ultimately, the reduction in strength and stiffnessfor an impacted composite.
Acknowledgements
The authors gratefully acknowledge funding support from theArmy Research Laboratory (grant number W911NF-14-2-003).We thank Mr. Gregory Milner, Mr. Lee Booher, and Mr. StephenMathine of the Aerospace Engineering Machine Shop for assistancein sample preparation, as well as Dr. David Farrow for assistance incalibrating drop-weight impact equipment.
Appendix A. Supplementary data
Supplementary data associated with this article can be found, inthe online version, at http://dx.doi.org/10.1016/j.compositesa.2017.07.004.
References
[1] Aymerich F, Priolo P. Characterization of fracture modes in stitched andunstitched cross-ply laminates subjected to low-velocity impact andcompression after impact loading. Int J Impact Eng Jul. 2008;35(7):591–608.
[2] Polimeno U, Meo M. Detecting barely visible impact damage detection onaircraft composites structures. Compos Struct 2009;91(4):398–402.
[3] Liu D. Delamination resistance in stitched and unstitched composite platessubjected to impact loading. J Reinf Plast Compos 1990;9(1):59–69.
[4] Strait LH, Karasek ML, Amateau MF. Effects of stacking sequence on the impactresistance of carbon fiber reinforced thermoplastic toughened epoxylaminates. J Compos Mater 1992;26(12):1725–40.
[5] Hitchen SA, Kemp RMJ. The effect of stacking sequence on impact damage in acarbon fibre/epoxy composite. Composites 1995;26(3):207–14.
[6] Fuoss E, Straznicky PV, Poon C. Effects of stacking sequence on the impactresistance in composite laminates. Part 2: prediction method. Compos Struct1998;41(2):177–86.
[7] Fuoss E, Straznicky PV, Poon C. Effects of stacking sequence on the impactresistance in composite laminates — Part 1: parametric study. Compos Struct1998;41(1):67–77.
[8] Lopes CS, Seresta O, Coquet Y, Gürdal Z, Camanho PP, Thuis B. Low-velocityimpact damage on dispersed stacking sequence laminates. Part I: experiments.Compos Sci Technol 2009;69(7–8):926–36.
[9] Lopes CS, Camanho PP, Gürdal Z, Maimí P, González EV. Low-velocity impactdamage on dispersed stacking sequence laminates. Part II: numericalsimulations. Compos Sci Technol 2009;69(7–8):937–47.
K.R. Hart et al. / Composites: Part A 101 (2017) 432–443 443
[10] Cantwell W, Curtis P, Morton J. Post-impact fatigue performance of carbonfibre laminates with non-woven and mixed-woven layers. Composites1983;14(3):301–5.
[11] Jain LK, Mai Y-W. Mode I delamination toughness of laminated compositeswith through-thickness reinforcement. Appl Compos Mater 1994;1(1):1–17.
[12] Dransfield KA, Jain LK, Mai Y-W. On the effects of stitching in CFRPs—I. mode Idelamination toughness. Compos Sci Technol 1998;58(6):815–27.
[13] Mouritz AP, Jain LK. Further validation of the Jain and Mai models forinterlaminar fracture of stitched composites. Compos Sci Technol 1999;59(11):1653–62.
[14] Tan KT, Watanabe N, Iwahori Y. Experimental investigation of bridging law forsingle stitch fibre using Interlaminar tension test. Compos Struct 2010;92(6):1399–409.
[15] Iwahori Y, Nakane K, Watanabe N. DCB test simulation of stitched CFRPlaminates using interlaminar tension test results. Compos Sci Technol 2009;69(14):2315–22.
[16] Wood MDK, Sun X, Tong L, Katzos A, Rispler AR, Mai Y-W. The effect of stitchdistribution on Mode I delamination toughness of stitched laminatedcomposites – experimental results and FEA simulation. Compos Sci Technol2007;67(6):1058–72.
[17] Tan KT, Watanabe N, Sano M, Iwahori Y, Hoshi H. Interlaminar fracturetoughness of vectran-stitched composites - experimental and computationalanalysis. J Compos Mater 2010.
[18] Jain LK, Mai Y-W. Determination of mode II delamination toughness of stitchedlaminated composites. Compos Sci Technol 1995;55(3):241–53.
[19] Jain LK, Dransfield KA, Mai Y-W. On the effects of stitching in CFRPs—II. Mode IIdelamination toughness. Compos Sci Technol 1998;58(6):829–37.
[20] WoodMDK, Sun X, Tong L, Luo Q, Katzos A, Rispler A. A New ENF test specimenfor the mode II Delamination toughness testing of stitched woven CFRPlaminates. J Compos Mater 2007;41(14):1743–72.
[21] MassabÒ R, Cox BN. Concepts for bridged Mode II delamination cracks. J MechPhys Solids 1999;47(6):1265–300.
[22] Massabò R, Mumm DR, Cox B. Characterizing mode II delamination cracks institched composites. Int J Fract 1998;92(1):1–38.
[23] Rugg KL, Cox BN, Massabò R. Mixed mode delamination of polymer compositelaminates reinforced through the thickness by z-fibers. Compos Part Appl SciManuf 2002;33(2):177–90.
[24] Cox BN, Sridhar N. A Traction Law for Inclined Fiber Tows Bridging Mixed-Mode Cracks. Mech Adv Mater Struct 2002;9(4):299–331.
[25] MassabÒ R, Cox BN. Unusual characteristics of mixed-mode delaminationfracture in the presence of large-scale bridging. Mech Compos Mater Struct2001;8(1):61–80.
[26] Tan KT, Watanabe N, Iwahori Y. Effect of stitch density and stitch threadthickness on low-velocity impact damage of stitched composites. Compos PartAppl Sci Manuf 2010;41(12):1857–68.
[27] Tan KT, Watanabe N, Iwahori Y. Impact damage resistance, response, andmechanisms of laminated composites reinforced by through-thicknessstitching. Int J Damage Mech 2011.
[28] Aymerich F, Pani C, Priolo P. Damage response of stitched cross-ply laminatesunder impact loadings. Eng Fract Mech 2007;74(4):500–14.
[29] Mouritz AP, Cox BN. A mechanistic interpretation of the comparative in-planemechanical properties of 3D woven, stitched and pinned composites. ComposPart Appl Sci Manuf 2010;41(6):709–28.
[30] Bilisik K. Multiaxis three-dimensional weaving for composites: a review. TextRes J 2012;82(7):725–43.
[31] Lee L, Rudov-Clark S, Mouritz AP, Bannister MK, Herszberg I. Effect of weavingdamage on the tensile properties of three-dimensional woven composites.Compos Struct 2002;57(1–4):405–13.
[32] Guess T, Reedy E. Comparison of interlocked fabric and laminated fabric Kevlar49/epoxy composites. J Compos Technol Res 1985;7(4):136–42. http://dx.doi.org/10.1520/CTR10310J. ISSN: 0884-6804.
[33] Tan P, Tong L, Steven GP, Ishikawa T. Behavior of 3D orthogonal woven CFRPcomposites. Part I. Experimental investigation. Compos Part Appl Sci ManufMar. 2000;31(3):259–71.
[34] Quinn JP, McIlhagger AT, McIlhagger R. Examination of the failure of 3D wovencomposites. Compos Part Appl Sci Manuf 2008;39(2):273–83.
[35] Coppola AM, Thakre PR, Sottos NR, White SR. Tensile properties and damageevolution in vascular 3D woven glass/epoxy composites. Compos Part Appl SciManuf 2014;59:9–17.
[36] King S, Stewart G, Mcilhagger AT, Quinn JP. Incremental damage developmentin a 3D woven carbon fibre composite. Polym Polym Compos 2007;15(7):521–33.
[37] Rudov-Clark S, Mouritz AP. Tensile fatigue properties of a 3D orthogonalwoven composite. Compos Part Appl Sci Manuf Jun. 2008;39(6):1018–24.
[38] Baucom JN, Zikry MA. Low-velocity impact damage progression in woven E-glass composite systems. Compos Part Appl Sci Manuf 2005;36(5):658–64.
[39] Baucom JN, Zikry MA, Rajendran AM. Low-velocity impact damageaccumulation in woven S2-glass composite systems. Compos Sci TechnolAug. 2006;66(10):1229–38.
[40] Baucom JN, Zikry MA. Evolution of failure mechanisms in 2D and 3D wovencomposite systems under quasi-static perforation. J Compos Mater 2003;37(18):1651–74.
[41] Carlsson LA, Adams DF, Pipes RB. Experimental Characterization of AdvancedComposite Materials. 4th Ed. CRC Press; 2014.
[42] Schoeppner GA, Abrate S. Delamination threshold loads for low velocityimpact on composite laminates. Compos Part Appl Sci Manuf 2000;31(9):903–15.
[43] Kwon YS, Sankar BV. Indentation-flexure and low-velocity impact damage ingraphite/epoxy laminates. Mar. 1992.
[44] Davies GAO, Zhang X, Zhou G, Watson S. Numerical modelling of impactdamage. Composites May 1994;25(5):342–50.
[45] Davies GAO, Zhang X. Impact damage prediction in carbon compositestructures. Int J Impact Eng 1995;16(1):149–70.
[46] Patel AJ, Sottos NR, Wetzel ED, White SR. Autonomic healing of low-velocityimpact damage in fiber-reinforced composites. Compos Part Appl Sci Manuf2010;41(3):360–8.
[47] Hart KR, Chia PXL, Sheridan LE, Wetzel ED, Sottos NR, White SR. Comparison ofCompression-After-Impact and Flexure-After-Impact Protocols for 2D and 3DWoven Fiber-Reinforced Composites. Compos Part A: Appl Sci Manuf 2017.http://dx.doi.org/10.1016/j.compositesa.2017.07.005.