Embed Size (px)
Citation preview

Lehigh UniversityLehigh Preserve
Theses and Dissertations
2013
Fracture Behavior of Epoxy-Based HybridCompositesDaniel Wesley DaviesLehigh University
Follow this and additional works at: http://preserve.lehigh.edu/etd
Part of the Materials Science and Engineering Commons
This Thesis is brought to you for free and open access by Lehigh Preserve. It has been accepted for inclusion in Theses and Dissertations by anauthorized administrator of Lehigh Preserve. For more information, please contact [email protected].
Recommended CitationDavies, Daniel Wesley, "Fracture Behavior of Epoxy-Based Hybrid Composites" (2013). Theses and Dissertations. Paper 1468.

Fracture Behavior of Epoxy-Based Hybrid Composites
by
Daniel Davies
A Thesis
Presented to the Graduate and Research Committee
Of Lehigh University
In Candidacy for the Degree of
Master of Science
in
Materials Science and Engineering
Lehigh University
December 2013

ii
CERTIFICATE OF APPROVAL
This thesis is accepted and approved in partial fulfillment of the requirements for the
Master of Science in Materials Science and Engineering.
_________________________
Date
_________________________
Raymond A. Pearson
Thesis Advisor
_________________________
Helen M. Chan
Chairperson of Department

iii
ACKNOWLEDGEMENTS
This work has been funded with much appreciation by the Semiconductor
Research Corporation (SRC) GRC Task Number 2251.001.
I would like to extend my sincere gratitude to Dr. Raymond Pearson and all of the
students and staff in the Polymer Research group for their support and contributions
throughout the entirety of this research.
Training, technical support, and sample preparation from Mike Rex, John
Gregoris, and Bill Mushock has been greatly appreciated.
I would like to thank Dow Chemical, Kaneka Texas Corporation, and Cospheric
LLC for the provision of materials utilized in this research.
Lastly, I would like to thank my parents, Horace and Joyce, as well as my sister,
Cassandra, for continuous support and motivation throughout the years. It has meant
more than words can express, and I owe my success to you.

iv
TABLE OF CONTENTS
TITLE PAGE ....................................................................................................................... i
CERTIFICATE OF APPROVAL ....................................................................................... ii
ACKNOWLEDGEMENTS ............................................................................................... iii
TABLE OF CONTENTS ................................................................................................... iv
LIST OF TABLES ............................................................................................................ vii
LIST OF FIGURES ......................................................................................................... viii
ABSTRACT ........................................................................................................................ 1
1 INTRODUCTION ........................................................................................................... 3
1.1 Motivation .................................................................................................................. 3
1.2 Background ................................................................................................................ 6
1.2.1 Controlling Coefficient of Thermal Expansion ................................................. 6
1.2.2 Improving Fracture Toughness ........................................................................ 13
1.3 Objective .................................................................................................................. 21
2 MATERIALS AND METHODS ................................................................................... 22
2.1 Materials .................................................................................................................. 22
2.2 Formulations and Processing ................................................................................... 24
2.2.1 Neat Epoxy Resin ............................................................................................ 24
2.2.2 Epoxy Filled with Silica Particles .................................................................... 26
2.2.3 Epoxies Filled with Rubber Particles ............................................................... 27
2.2.4 Epoxies Filled with Both Types of Particles (Hybrids) ................................... 28
2.3 Characterization ....................................................................................................... 29

v
2.3.1 Calculating Filler Concentrations .................................................................... 29
2.3.2 Determining Weight Percent Silica Using TGA .............................................. 31
2.3.3 Determining Concentration of Particles Using Density................................... 32
2.3.4 Glass Transition Temperature by DSC ............................................................ 34
2.3.5 Coefficient of Thermal Expansion by TMA .................................................... 35
2.3.6 Compressive Yield Strength ............................................................................ 36
2.3.7 Fracture Toughness .......................................................................................... 37
2.3.8 Fractography .................................................................................................... 39
3 RESULTS AND DISCUSSION .................................................................................... 41
3.1 Description of Filler Concentrations ........................................................................ 41
3.2 Density ..................................................................................................................... 42
3.3 Glass Transition Temperature .................................................................................. 44
3.4 Coefficient of Thermal Expansion ........................................................................... 45
3.4.1 Modelling the Coefficient of Thermal Expansion ........................................... 47
3.5 Compressive Yield Strength .................................................................................... 48
3.5.1 Modelling Compressive Yield Strength........................................................... 51
3.6 Fracture Toughness .................................................................................................. 55
3.6.1 Modelling Fracture Toughness ........................................................................ 58
3.7 Fractography and Fracture Mechanisms .................................................................. 60
3.7.1 Scanning Electron Microscopy ........................................................................ 60
3.7.2 Transmission Electron Microscopy ................................................................. 66
4 SUMMARY AND CONCLUSIONS ............................................................................ 75
5 RECOMMENDATIONS FOR FUTURE WORK ........................................................ 76
5.1 Toughening Mechanism Contributions/KIC Modelling ........................................... 76
5.2 Increasing Plastic Zone Size .................................................................................... 77

vi
5.3 Silica Particle Size Effect ......................................................................................... 77
5.4 Particle-Matrix Adhesion ......................................................................................... 78
6 REFERENCES .............................................................................................................. 79
VITA ................................................................................................................................. 82

vii
LIST OF TABLES
Table 1: Dilatometer and TGA data for epoxy filled with mineral and fused silica at
45vol%. [16]. ................................................................................................................. 11
Table 2: Formulations for neat epoxy resin system. ...................................................... 25
Table 3: Mixing and curing schedule for all systems produced during this study. ....... 26
Table 4: Formulations for silica filled epoxy systems. .................................................. 26
Table 5: Formulations for core shell rubber modified epoxy systems........................... 27
Table 6: Formulations for hybrid systems produced, containing both core shell rubber
particles and silica microspheres. .................................................................................. 28
Table 7: Target, measured, and nominal additive concentrations for all systems. ........ 41
Table 8: Calculated and measured density values for all systems produced. ................ 43
Table 9: Glass transition temperature data for all systems. ........................................... 45
Table 10: Linear coefficient of thermal expansion data for all systems. ....................... 47
Table 11: Compressive yield strength data for all systems produced. .......................... 50
Table 12: Fracture toughness (KIC) data for all systems produced. ............................. 58

viii
LIST OF FIGURES
Figure 1: Schematic diagram of a typical flip chip interconnect device used in the
microelectrionics packaging industry. ............................................................................. 4
Figure 2: Comparison between the theoretical models and experimental CTE data of
epoxy filled with different silica nanoparticle sizes at below Tg and above Tg as a
function of filler content; A) 170 nm (below Tg), B) 74 nm (below Tg), C) 23 (below
Tg), and D) CTE of epoxy filled with 170 nm, 74 nm and 23 nm silica nanoparticles
(above Tg) [6]. ................................................................................................................. 9
Figure 3: CTE as a function of filler particle size (constant volume %) [4]. ................. 10
Figure 4: CTE as a function of filler loading (15 micron average particle size used for
each sample) [4]. ........................................................................................................... 13
Figure 5: Schematic showing toughening mechanisms observed in rubber toughened
epoxy systems. Left, rubber particle bridging mechanism. Right, cavitation and void
growth/shear banding mechansims within the corresponding plastic zone [12]. .......... 18
Figure 6: Chemical structures of epoxy, aniline, and mPDA from left to right,
respectively. ................................................................................................................... 22
Figure 7: Generic core-shell-rubber particle description, provided by Kaneka [42]. .... 23
Figure 8: Left, example TGA curve showing weight% lost after heating from 30-
700oC. Right, image of the TGA Q500 ........................................................................ 32
Figure 9: Equipment set-up for sample density measurements using Mettler Toledo
AG245 analytical balance. ............................................................................................ 34

ix
Figure 10: Left, the TA Instruments DSC Q2000. Right, a sample DSC curve with a
glass transition temperature near 117oC. ...................................................................... 35
Figure 11: Left, sample TMA curve showing CTE's in both the glassy and rubbery
state. Right, an image of the TMA 2940 ...................................................................... 36
Figure 12: Left, Instron 5567 with polished steel head and plate used for compression
testing. Right, example of compressive stress vs. strain curve with the maximum
representing the yield stress. ......................................................................................... 37
Figure 13: Fracture surface of a SEN3PB specimen, and corresponding crack length
measurement positions. ................................................................................................. 38
Figure 14: Specimen configurations for SEN3PB specimens [46]. ............................... 38
Figure 15: Sample load versus displacement curve for three point bending experiments.
....................................................................................................................................... 39
Figure 16: Glass transition temperature as a function of additive content, for Silica,
CSR, and Hybrid systems (Average Tg is marked with a horizontal line at 116.5oC). 45
Figure 17: Left, pre Tg CTE as a function of additive content. Right, post Tg CTE as a
function of additive content. Lines inserted to highlight trends. ................................... 46
Figure 18: CTE experimental data with predicted data using a rule of mixtures model.
Left column represents all pre Tg data, while the left hand column represents all post Tg
data. ............................................................................................................................... 48
Figure 19: Compressive yield strength as a function of additive content for silica, CSR,
and hybrid systems. ....................................................................................................... 50

x
Figure 20: Sudduth predictive model for compressive yield stress versus experimental
data obtained for silica composites. .............................................................................. 53
Figure 21: Sudduth predictive model for compressive yield stress versus experimental
data obtained for CSR composites. ............................................................................... 54
Figure 22: Sudduth predictive model for compressive yield stress versus experimental
data obtained for hybrid composites. ............................................................................ 55
Figure 23: Fracture toughness for each of the silica, CSR, and hybrid systems
produced. Dashed lines represent the KIC values for 5 and 8 volume percent CSR, in
order to compare the synergistic or additive benefits observed in the hybrid systems. 57
Figure 24: Hybrid fracture toughness as a function of additive concentration for
experimental and predicted data using the Kitagawa model ......................................... 60
Figure 25: Schematic of a sample fracture surface (face-on view), showing the pre-
notch (top white rectangle), stress whitened zone/slow fracture region, and fast fracture
region. ............................................................................................................................ 61
Figure 26: SEM micrographs for each silica system produced. For each concentration
prepared, left image represents stress whitened zones; right images represent fast
fracture regions. ............................................................................................................. 62
Figure 27: Micrographs of each CSR modified system. Left images represent stress
whitened zones; right images represent fast fracture regions. ...................................... 64
Figure 28: Micrographs of each hybrid epoxy system. Left images represent stress
whitened zones; right images represent fast fracture regions. ...................................... 65
Figure 29: Step by step process to preparing and examining TOM specimens. ........... 66

xi
Figure 30: Left, bright field transmission optical micrographs; left, dark field
transmission optical micrographs. ................................................................................. 68
Figure 31: TOM micrographs of each CSR modified system. Left images correspond
to bright-field conditions, right images correspond to dark-field conditions. ............... 70
Figure 32: TOM micrographs of each CSR modified system. Left images correspond
to bright-field conditions, right images correspond to dark-field conditions. ............... 72
Figure 33: Optical micrographs showing plastic zone size changes as a function of
added silica content. *Note, the 6vol% CSR system was taken as approximately 5vol%
for comparison. .............................................................................................................. 73
Figure 34: Experimentally measured plastic zone sizes versus predicted plastic zone
sizes based on Irwin's model. ........................................................................................ 74

ABSTRACT
Crosslinked epoxy resins have become popular materials in advanced
engineering applications such as the aerospace, packaging, coatings, electrical, and
adhesive industries. These resins offer a high strength to weight ratio, but have a
drawback of being inherently brittle and exhibit poor flaw tolerance. In
microelectronic packaging applications, the thermal expansion coefficients (CTEs) of
neat epoxy resins are too high. The addition of inorganic fillers is a traditional
solution for increasing fracture toughness and lowering CTE. Such a solution is
routinely utilized in epoxy-based underfills used in flip chip packaging.
Of particular interest in this study, is the incorporation of soft, compliant
rubbery particles and stiff, rigid silica particles into a model epoxy system. Rubber
particle addition has proven to be extremely effective at improving fracture toughness
of epoxy composite resins through rubber particle cavitation, matrix void growth, and
massive shear yielding mechanisms. The addition of silica particles can also provide
increases in fracture toughness, and do so without the compromises of decreased yield
strength or increased CTE. Hybrid composites comprised of both rubber and silica
particles have shown synergistic toughening benefits by some researchers.
In this particular study, an aromatic amine cured bisphenol-A based epoxy
resin is used as the model epoxy matrix. The fracture behavior of epoxies filled with
silica micro-spheres and/or rubber nano-particles at various concentrations in the
matrix have been studied. Micron-size silica particles successfully showed decreases
in the CTE of the epoxy matrix, but only provided minimal toughening benefits.
Nanometer-size core-shell-rubber particles provided exceptional toughening benefits,

2
but resulted in increased CTE of the epoxy matrix. Interestingly, some hybrid epoxy
composite formulations exhibited excellent fracture toughness and reasonable CTE
behavior.
It is the ultimate goal of this study to provide an understanding of the
toughening mechanisms produced for each additive and their interactive effects on
each other. It has been hypothesized that the use of rubber nanoparticles in a highly
silica filled epoxy may result in significant improvements in toughness since these
nanoparticle may be able to grow shear bands around the micron-size silica particles.
The results from this study support this hypothesis.

3
1 INTRODUCTION
1.1 Motivation
The microelectronics packaging industry has relied on polymer underfill resins
to improve the reliability of flip-chip packages for some time now. This packaging
technology was first introduced to the market by IBM in 1965, and possesses a higher
density of interconnects than that of traditional wire-bond packages [1, 2]. Flip-chip
technology (or “C4 technology” as described originally by IBM) uses a vertical stack
consisting of a silicon chip (or die) on top of a substrate (originally ceramic, but now
organic printed circuit boards are commonly used), connected directly together by
solder balls at interconnect sites. However, this vertical stack lacked rigidity and was
susceptible to failure at interconnect sites due to CTE mismatches between the silicon
die and substrate during thermal cycling. As a solution, a filled epoxy resin was
introduced into the device as a means of coupling CTE mismatches and providing
added rigidity and stability [3]. This “underfill resin” helped improve product
lifecycles by as much 20 fold [2]. A schematic of a typical flip chip interconnect
device with an underfill resin is shown in Figure 1. The most commercially available
underfill resins consist of thermosetting epoxy resins, and as such, are the focus of this
study.
Since their introduction, continued efforts have been made to further enhance
performance and reliability of the flip-chip packages by improving the properties of
underfill resins. Therefore, researchers have been investigating the possibility of
modifying the epoxy systems in an attempt to improve material properties.

4
Figure 1: Schematic diagram of a typical flip chip interconnect device used in the
microelectrionics packaging industry.
Underfill resins consist of epoxy matrices loaded with inorganic particles,
whose the primary purpose is to reduce the CTE. The CTE of the organic substrate is
much higher than that of the silicon chip (~15ppm/oC versus 2.5ppm/
oC, respectively),
and therefore solder joints are subjected to extremely large strains during operating
conditions and thermal cycling [4]. In order for the coupling to effectively improve
product performance, the CTE of the underfill resin must match that of the solder
interconnects. Typically, the material in the solder joints possess a CTE of
approximately 23ppm/oC, while the CTEs of unmodified epoxy resins are around
70ppm/oC. Therefore, the added inorganic filler must dramatically decrease the
inherent CTE of the epoxy, which can typically be done with about 65wt% filler [2].
Silica particles tend to be the most commonly used filler material due to their
abundance and ease of access as well as low CTE. As such, silica particles are one of
the additives evaluated in this study. The particle size of these filler particles can have
dramatic effects on the ability to manipulate the CTE of the epoxy. Specifics of this
approach will be discussed in the background section below.
With the underfill resin now being used to couple CTE mismatches between
different materials, it must also consequently be directly exposed to the stresses and

5
strains associated with those CTE mismatches. Indeed, the underfill experiences large
amounts of thermal stress, which can result in fracture of the underfill as a failure
mechanism, as opposed to only failure at solder joint interconnects. A downfall of the
epoxy materials used in these applications is their inherently brittle nature and inability
to resist crack propagation. Due to geometric factors and CTE mismatches in these
interconnect devices, the underfills encasing them experience large stress
concentrations at corners and interfaces that ultimately result in cracking during
thermal cycling. Therefore, it is desired that the toughness of the epoxy be improved
as much as possible under the given circumstances. It has been shown in many studies
that silica particles can effectively improve the fracture toughness behavior and
therefore increase crack propagation resistance of epoxy materials, in addition to
lowering the CTE of the epoxy resin [5, 6, 7]. Therefore, the silica in this study is also
evaluated as a toughening agent in the epoxy systems. Due to the high modulus of
silica, its incorporation into an epoxy matrix also increases the stiffness of the
composite. It is important to note that the benefits do come at a cost of decreased
elongation to failure [8, 9].
As a means to further improve fracture toughness while alleviating the
increased stiffness, rubber modifiers were evaluate as additives and proved useful.
They have been shown to increase toughness of epoxy resins while decreasing internal
stresses of incorporated epoxy resins [10]. In fact, the addition of rubber particles has
generally been found to be superior to the addition of inorganic fillers at improving
fracture toughness, but results in a decrease in stiffness and strength [11]. Due to the
promise they have shown as toughening agents, rubber particles are also a main focus

6
of this study and are evaluated as an epoxy modifier. Unfortunately, the rubber
addition to epoxy also comes at a cost of increased CTE behavior, as rubber typically
has a CTE much higher that of the epoxy resin. For those reasons mentioned above,
rubber modified systems alone have not been useful as underfill resins.
As a solution, it has been proposed that hybrid epoxy systems containing both
silica and rubber particles be employed in order to combine the benefits of both
improved fracture toughness and controlled CTE behavior. In addition, the
combination of both fillers has shown the ability to produce additive or synergistic
toughening effects, by combining toughening contributions from both additives [12,
11]. Particle size effects of both rubber and silica can significantly alter the results
obtained, and will be discussed in further detail in their respective sections below.
As can now be understood, both silica and rubber particles have proven
beneficial for different reasons as additives in epoxy systems. The ability of silica to
control the CTE behavior of the epoxy is its expected role, while providing limited
toughening effects to the epoxy systems. Rubber particles have shown superior
effectiveness in toughening epoxy systems, however at the expense of increased
thermal expansion and decreased yield stress. For these reasons, hybrid epoxy silica-
rubber composite systems are proposed as a method to provide large toughening
benefits while still maintaining or improving other important properties in epoxy
underfill resins.
1.2 Background
1.2.1 Controlling Coefficient of Thermal Expansion

7
As has already been elucidated to, the ability to control the CTE of an epoxy
resin is critical in the microelectronics industry. With that in mind, it is necessary to
understand the ability of different additives to modify this material property. As has
already been briefly mentioned, the use of rubber modifiers will have no beneficial
modifications on the CTE behavior of the epoxy, as the CTE of the rubber is typically
higher than that of the epoxy (200 ppm/C versus 70 ppm/C). By incorporating the
higher CTE phase into the epoxy, it is to be expected that the overall CTE of the
composite will increase. Although, some studies using certain types of rubbers have
been done, and appear to show that there is no or little degradation of thermal and
mechanical properties [13, 14]. Although the effects of rubber on CTE are important
to observe and predict, further elaboration will not be done due to the more important
focus of decreasing CTE.
Inorganic particles, silica in particular, are known to be low CTE materials (.5
ppm/C versus 70 ppm/C). With that simple concept known, it is an easy assumption
that their incorporation into a high CTE material such as epoxy can be beneficial. And
that assumption has proven monumental in the ability for researches to control the
CTE behavior of epoxy composites. Silica has recently been observed as one of the
most common fillers due to its ability to successfully control the CTE behavior of an
epoxy composite. Many variables come into play when determining the effectiveness
of a silica modifier in an epoxy system.
1.2.1.1 Filler Particle Surface Treatments
To begin with, a simple question when selecting silica fillers for formulating
underfill resins is whether to have the particle surfaces treated or not. Surface

8
treatments expectedly change the interaction between a particle surface and the epoxy
matrix. This will result in a change in the bond strength between the particle and the
matrix. Bond strength, or interaction between the particle and the matrix, can
influence the CTE behavior. Similar to modulus improvements due to surface
interactions, CTE improvements follow the same concepts. The CTE of the composite
is related to the thermal expansion of the constituents; however, polymer chain
mobility and expansion can be restricted by interactions with the filler surface.
Therefore, in order to ensure proper CTE benefits, particle surface treatments need to
be evaluated for particle matrix interaction, before carefully selecting a treatment or
not. A study of particle matrix adhesion with surface modifiers was done by Pearson
and Kawaguchi, showing the effects on cohesive strength and facture toughness [15].
Although not measured directly in this study, the effects of the surface treatment on
the CTE behavior can be anticipated due to the chain mobility argument stated above.
1.2.1.2 Filler Particle Size
In addition to surface treatments, particle size shows significant effects on the
CTE behavior of epoxy composites. Many studies have been performed in the past to
evaluate the size effect, and can be studied in more detail following references [6, 16,
4]. Particle size effects can be observed for both nanometer-size silica and micron-size
silica additives. In both cases, it is seen that as particle size increases, so does the
CTE. In other words, smaller particles are more effective at reducing CTE. This
condition applies to micron sized particles individually, and nano sized particles
individually. That is, it’s not to say that decreasing from micron sized particles to
nano sized particles improves the CTE. It only applies to size changes within a given
9
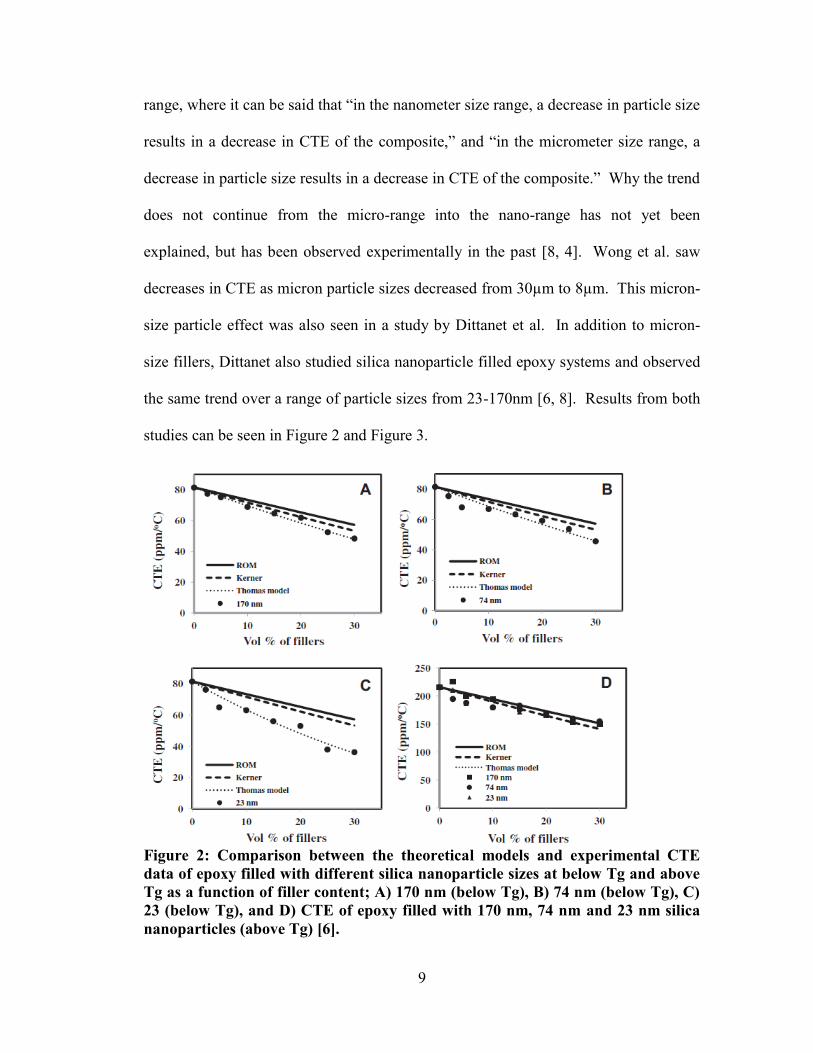
range, where it can be said that “in the nanometer size range, a decrease in particle size
results in a decrease in CTE of the composite,” and “in the micrometer size range, a
decrease in particle size results in a decrease in CTE of the composite.” Why the trend
does not continue from the micro-range into the nano-range has not yet been
explained, but has been observed experimentally in the past [8, 4]. Wong et al. saw
decreases in CTE as micron particle sizes decreased from 30µm to 8µm. This micron-
size particle effect was also seen in a study by Dittanet et al. In addition to micron-
size fillers, Dittanet also studied silica nanoparticle filled epoxy systems and observed
the same trend over a range of particle sizes from 23-170nm [6, 8]. Results from both
studies can be seen in Figure 2 and Figure 3.
Figure 2: Comparison between the theoretical models and experimental CTE
data of epoxy filled with different silica nanoparticle sizes at below Tg and above
Tg as a function of filler content; A) 170 nm (below Tg), B) 74 nm (below Tg), C)
23 (below Tg), and D) CTE of epoxy filled with 170 nm, 74 nm and 23 nm silica
nanoparticles (above Tg) [6].

10
Figure 3: CTE as a function of filler particle size (constant volume %) [4].
The argument for why this particle size effect takes place is based on surface
area. As particle size decreases, overall surface area increases which means an
increase in interfacial contact. Following the statements provided in the surface
treatment section above, increased interfacial contact with good adhesion results in a
decrease in observed CTE (for a given volume percent). The interface of the resin and
the rigid filler particles restricts the mobility of the matrix polymer chains, and
therefore reduces the expansion of the matrix. Decreased particle size and increased
surface area therefore results in greater interfacial contact and further decreases in
matrix expansion.
1.2.1.3 Filler Particle Shape
Particle shape is another common variable that can affect the CTE behavior of
a composite system. Although only spherical particles were used in this particular
study (therefore no shape effects are considered), shape contributions are still
important and should be understood. In some instances, oddly shaped filler such as
Boron Nitride platelets or silica minerals may be used as filler particles instead of
spherically shaped silica particles (typically for cost benefits). In these instances, the
filler effect in CTE will behave differently, and should be understood. As a note, all
11
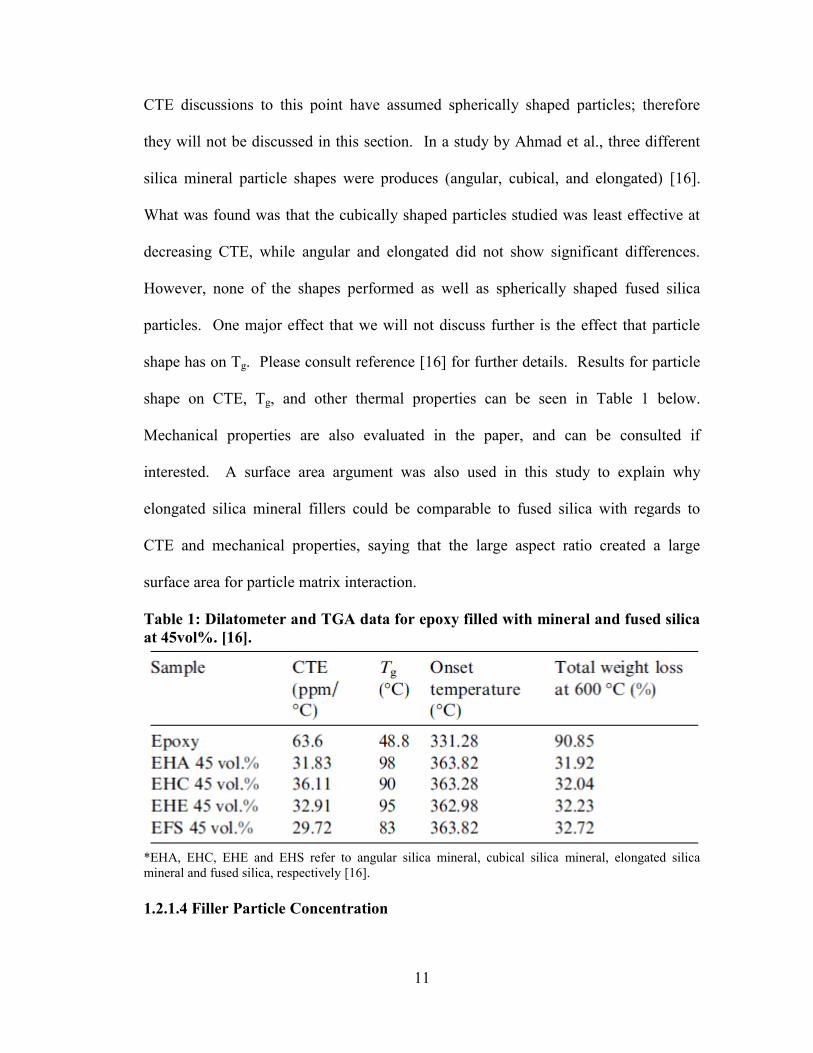
CTE discussions to this point have assumed spherically shaped particles; therefore
they will not be discussed in this section. In a study by Ahmad et al., three different
silica mineral particle shapes were produces (angular, cubical, and elongated) [16].
What was found was that the cubically shaped particles studied was least effective at
decreasing CTE, while angular and elongated did not show significant differences.
However, none of the shapes performed as well as spherically shaped fused silica
particles. One major effect that we will not discuss further is the effect that particle
shape has on Tg. Please consult reference [16] for further details. Results for particle
shape on CTE, Tg, and other thermal properties can be seen in Table 1 below.
Mechanical properties are also evaluated in the paper, and can be consulted if
interested. A surface area argument was also used in this study to explain why
elongated silica mineral fillers could be comparable to fused silica with regards to
CTE and mechanical properties, saying that the large aspect ratio created a large
surface area for particle matrix interaction.
Table 1: Dilatometer and TGA data for epoxy filled with mineral and fused silica
at 45vol%. [16].
*EHA, EHC, EHE and EHS refer to angular silica mineral, cubical silica mineral, elongated silica
mineral and fused silica, respectively [16].
1.2.1.4 Filler Particle Concentration

12
The most observed and predictable method for decreasing CTE is by simply
increasing the filler concentration. Following the surface area arguments discussed
previously, it can be anticipated that increasing the number of filler particles and
therefore increasing surface area, will decrease the CTE of the composite due to the
mobility restrictions on the polymer chains. Although this seems to be an elementary
prediction, it has been shown in numerous studies [2, 8, 6, 4]. In all instances, it
appears as though the particles ability to decrease the CTE of the composite is only
limited by the processability of the composite. At concentrations greater than around
35 volume %, the viscosity of the composite becomes too high to flow, and therefore
becomes out of the range of processing parameters for underfill resins. Until that
maximum concentration is reached though, CTE shows a continuously decreasing
trend. Figure 2 shows the results obtained by Dittanet et al., where this filler
concentration effect is observed. In addition, Wong’s study on micron-size fillers with
the same trend is shown below in Figure 4. Based on the number of studies showing
this similar result, it is anticipated that this particular study will reveal similar results
as a function of increasing filler content.

13
Figure 4: CTE as a function of filler loading (15 micron average particle size
used for each sample) [4].
1.2.2 Improving Fracture Toughness
The use of epoxy resins in high performance applications is becoming more
widespread. Unfortunately, their use in any application is hindered by their inherently
brittle nature. Therefore, researchers are continually searching for ways to improve
fracture toughness and resist crack propagation. In general, a consensus has been
reached that the crack propagation can be inhibited by the use of rigid inorganic fillers
[17, 18, 12] or thermoplastic particles to reinforce the epoxy matrix [19, 20, 21, 12], or
by the modification of the epoxy matrix using compliant rubbery particles [22, 12]. Of
most common interest is that of rigid silica particles, and compliant rubbery phases
(particles). The ability of either to toughen an epoxy system is based on the specific
toughening mechanisms they exhibit. Toughening mechanisms of silica and rubber
additives will be discussed below.
1.2.2.1 Addition of Silica Fillers

14
Inorganic particles have drawn attention for toughening epoxy resins because
of their ability to improve fracture toughness while still maintaining other thermal and
physical properties [6]. Most reports to date have dealt with use of micron sized
inorganic particles [23], but as has already been established, particle size can affect
many properties including fracture toughness. Therefore, the first takeaway is that
silica particles can toughen an otherwise brittle epoxy matrix by means of several
different toughening mechanisms. As a general observation, it has been found that
observed toughening mechanisms are dependent on particle size. For example, nano-
size particles generally exhibit a set of toughening mechanisms, while micro-size
particles exhibit a separate set.
The large amount of toughening mechanisms observed for silica filled systems
overlap between micro- and nano-size silica filled systems. Although some
mechanisms are more prevalent in one sized system over the other, assertions cannot
be made as the toughening mechanisms are ultimately based on the epoxy system
being used. In general, a compilation of the main toughening mechanisms observed in
silica filled epoxy systems based on experimental studies include that of
microcracking [24], crack tip pinning and crack surface bridging [12, 17, 18, 25],
microshear banding [26, 27], and particle matrix debonding followed by void growth
[28]. The microcracking concept is based on the absorption of strain energy by the
debonding of particles from the matrix, resulting in microcracks forming locally
through the well adhered matrix [29]. The pinning mechanism, originally proposed by
Lange et al., [30] is said to work by causing the crack tip to bow around the
impenetrable rigid filler particles, therefore absorbing energy [12, 31]. In addition, the

15
silica particles can bridge the two crack surfaces together, which provides resistance to
the crack propagation by a closing force at the crack tip [31, 12]. Based on this
literature review, microshear banding has almost exclusively been seen in epoxy silica
nanocomposites, and has not been present in many micron-size composites.
Microshear bands form in silica filled nanocomposites as a result of poor particle
matrix adhesion, resulting in plastic deformation between particles as stress continues
to be applied [8]. Particle matrix debonding and void growth has not been as common
as some of the other mechanisms, and has also mainly been found in nanocomposite
systems. This occurs when there is weak adhesion between the particle and the
matrix, resulting in the particle debonding or pulling out of the matrix. Due to the
triaxial stress state experienced by those particles near the crack tip, the void left by
the debonded particle can plastically grow hence the term plastic void growth. Zhang
et al. has proposed that silicafilled polymer nanocomposites provide superior
toughenability over micron sized composites because of the development of an
interphase polymer layer and decreased interparticle distance [32]. This is in contrast
to what has typically been viewed in prior micron-size glass sphere composite studies
[5].
In brief, this is a summary of the most common toughening mechanisms
observed in both nano and micro-size silica-filled composites, based on an array of
well-known silica composite toughening studies. Again, toughening mechanisms are
ultimately dependent on the epoxy material system being used, and therefore cannot be
precisely separated into nano versus micro.
1.2.2.2 Addition of Rubber Particles
16
There is some overlap of toughening mechanisms between the silica and rubber
systems; however the rubber toughening mechanisms have proven to be much more
consistent. Most studies have observed the same few toughening mechanisms, except
for a few differences that have been seen based on particle size.
It was once a common understanding that many rubber modified epoxy
composites dissipated energy through rubber particle cavitation or debonding,
followed by void growth [33]. Certainly, this is confirmed and agreed upon by a
number of authors who have observed the same common phenomena [34, 35, 13].
However, literature has recently shown that in the case of rubber toughened epoxies,
cavitation and void growth, as well as matrix shear banding are the most effective
rubber toughening mechanisms [31, 12, 7, 13]. Previous studies reported that
resistance to cavitation and therefore tendency to debond, increased as particle size
decreased [33]; however more recent studies have concentrated on solely the
contributions from cavitation followed by void growth/shear banding. However, in a
study by Azimi, Pearson, and Hertzberg, it was found that the tendency for rubber
particles to exhibit a bridging mechanism occurs when the plastic zone size is on the
order of the size of the rubber particles [31]. In other words, when the size of the
plastic zone produced during fracture is near the same size as the rubber particles used,
the particles do not experience enough of a triaxial stress state to cavitate, and instead
just bridge the gap between the two surfaces at the crack tip. As expected, this particle
bridging mechanism offered limited fracture toughness improvement.
Particle cavitation is essentially just a precursor to matrix void growth and
shear banding. The actual cavitation of the rubber particle has been shown to provide

17
little toughening benefits as discussed in a modelling study by Huang and Kinloch [36,
37], which also agrees with the results obtained by Azimi et al. that were previously
discussed; the toughening benefits achieved by particle matrix bridging provide
minimal contribution to the observed fracture toughness increases [11]. Essentially,
under the application of a triaxial stress state, the compliant rubbery particles are
forced to want to change volume. With an inherent poison’s ratio of 0.5, the volume
change is impossible and the rubber particles internally tear (cavitate) in order to
relieve the triaxial stress. That cavitation creates a void and initiates the plastic
deformation and shear yielding mechanisms that effectively dissipate the energy at the
crack tip. The mechanisms reduce the effective driving force at the crack tip by
forming a plastic zone which therefore shields the crack tip from the applied driving
force [12].
Again, Huang and Kinloch have proposed a model to evaluate the
contributions from each of the toughening mechanisms, and they have found that the
void growth and shear banding portions contribute more than 90% of the overall
contribution. This reiterates the fact that cavitation and rubber particle bridging
contribute very little to the overall toughness from rubber particle additions.
Theoretically, these major toughening mechanisms result in a composite whose
fracture toughness scales with the size of the plastic zone [38]. A schematic of the
described toughening mechanisms and corresponding plastic zone is shown below in
Figure 5.

18
Figure 5: Schematic showing toughening mechanisms observed in rubber
toughened epoxy systems. Left, rubber particle bridging mechanism. Right,
cavitation and void growth/shear banding mechansims within the corresponding
plastic zone [12].
1.2.2.3 Addition of Two Types of Particles (Hybrid Systems)
The ability to create synergistic toughening is of extreme interest because of
the possibility to promote simultaneous toughening mechanisms from both silica and
rubber particles. In general, studies on rubber-modified and glass-filled epoxies show
a maximum volume fraction of particles to which toughening benefits can be seen [17,
35]. The addition of particles beyond that value lacks significant improvement in
fracture toughness. Ideally, a hybrid composite can be created in which the
toughening mechanisms of the individual particles interact in a positive manner. To
fulfill the definition of the term synergistic, the interaction of these particles would
provide toughening benefits greater than the additive contributions of both modifiers.
Although synergistic toughening mechanisms have been predicted theoretically [39],
only a few experimental studies have been able to actually show synergistic
toughening in these silica-rubber hybrid epoxy composites [25, 40].
In a model proposed by Evans et al., he suggests that the interaction of
cavitation/shear yielding and void growth from rubber particles, and the bridging

19
mechanism from silica particles should result in synergistic toughening [39]. In a
study by Kinloch and co-workers [25], the synergistic toughening they observed was
indeed attributed to the interaction of cavitation/shear yielding mechanisms with crack
tip pinning. Although it does not follow the bridging mechanism proposed by Evans,
the pinning effect interacted enough with the rubber mechanisms to promote
synergism. The synergism observed by Smith et al. [40] was produced using rubber
particles and hollow glass spheres. In this study, the synergism was attributed to
cavitation/shear yielding along with microcracking due to the hollow glass spheres as
opposed to the pinning/bridging mechanisms previously reported.
More specific explanations to the causes of synergism were given by Azimi et
al., who observed synergistic toughening when blending 3µm rubber particles with
49µm diameter glass spheres. The synergism in this study was again attributed to
cavitation/shear yielding and crack-tip pinning mechanisms. More specifically, the
cavitation of the rubber particles releases the triaxial stress which suppresses the
debonding mechanism. The suppressed debonding magnifies the pinning mechanism,
therefore enhancing the fracture toughness [31].
All of the aforementioned synergistic toughening mechanisms were assuming
the use of micron sized silica particles which can effectively promote the
pinning/bridging/crack path deflection mechanisms. It has been said that nano-silica
cannot provide the same synergistic toughening due to the smaller particles not being
able to promote the same toughening mechanisms. In order to evaluate these claims, a
study by Liang and Pearson used silica nanoparticles of 20 and 80nm in a 2-3µm
CTBN modified epoxy system [11]. It was found that an additive toughening benefit

20
can be observed when adding nanosilica to the rubber modified system, to certain
point, after which diminishing fracture toughness is observed. The additive toughness
is attributed to the increased interparticle shear banding produced by the nanosilica,
therefore increasing the size of the voided rubber particles and consequently the plastic
damage zone. No synergistic toughening was seen.
Typically, these synergistic interactions are seen with when using high rubber
contents and only a few percent filler. It is often the case, however, that negative
interactions are seen when high filler contents are used. For example, Liang and
Pearson found that for a given rubber modifier content, increasing nanosilica only
provided additive toughening benefits until near 3vol%; after which the increases in
silica nanoparticle content actually resulted in negative interactions giving fracture
toughness values less than that of the rubber modified epoxy [11]. Such negative
interactions have also been observed DiBerardino and Pearson [41] while looking at
rubber-boron nitride (BN) hybrid epoxy composites. The authors noted that additive
or synergistic toughening contributions were dependent on the interaction of
toughening mechanisms, and the ability or inability of them to simultaneously
perform. It is said that rubber particles will cause a plastic zone to develop in front of
the crack tip. The plastic zone will continue to grow outwards until it encounters rigid
BN particles. The encounter shields the plastic zone from any further growth and thus
inhibits the toughening mechanisms of shear banding. In summary, the authors
attributed the negative interactions to be caused by decreased rigid particle spacing
resulting in termination of the shear yielding mechanisms before they have reached
their full toughening potential. The interparticle spacing is a function on particle

21
concentration, so therefore increased filler content can possibly result in negative
toughening interactions in hybrid composites.
1.3 Objective
Due to the interesting toughening abilities observed for silica-rubber hybrid
epoxy composites, they are the main focus of the current study. Following the
conclusions by the authors above, micron sized silica particles will be used in an
attempt to promote the pinning/bridging mechanisms common in synergistic
toughening. Unlike studies before, nano-sized core shell rubber particles will be used
to promote the cavitation/shear yielding and void growth mechanisms. With undefill
resins being the main motivation for this work, particle size needs to be strongly
considered. With underfill gaps currently reaching as small as 10’s of microns, large
micron sized particles can no longer be considered. For that reason, small 3.8µm silica
particles will comprise the large phase and small 50nm CSR particles will comprise
the small phase. If performance of this epoxy system can be optimized, the proposed
particle dimensions allow this composite to be considered as an “industrial type”
underfill resin.

22
2 MATERIALS AND METHODS
2.1 Materials
A model epoxy system was desired for this specific research to satisfy the
objective of mimicking epoxy systems used in the microelectronics industry. The
epoxy resin used consisted of a diglycidyl ether of bisphenol A (DGEBA) based
epoxy, sold under the trade name DER 331 by the Dow Chemical Company. Aniline
(99.5% extra pure) from Acros Organics was added to the system as a chain extender
in order to increase the molecular weight between crosslinks (decreasing the crosslink
density) which allows for increased toughenability from the modifiers and fillers used.
The curing agent used was solid m-phenylenediamine (mPDA) flakes (99% pure) and
was also purchased Acros Organics. The precursors were added in a mole ratio of
4:2:1 respectively, as listed above. This mole ratio ensures a stoichiometric cure to
produce the desired moderately crosslinked epoxy system. Chemical structures of
each are provided in Figure 6. This epoxy system is slightly different than the
piperidine cured epoxy system commonly studied in the past. The modifications were
in the interest of increasing Tg from the piperidine system, which had a relatively low
Tg of approximately 80oC [6]. This Tg is not necessarily useful in the microelectronics
packaging industry due to the high temperatures experienced. Therefore, the mPDA
cured system is being evaluated as providing a higher Tg while remaining toughenable.
Figure 6: Chemical structures of epoxy, aniline, and mPDA from left to right,
respectively.
23
With the objective of achieving low coefficients of thermal expansion,
inorganic fillers were used as an additive. The inorganic fillers used were solid glass
microspheres from Cospheric LLC sold under the trade name P2011SL, with an
average diameter of approximately 3.8µm. The spheres had no surface treatments
applied to them and were used as received.
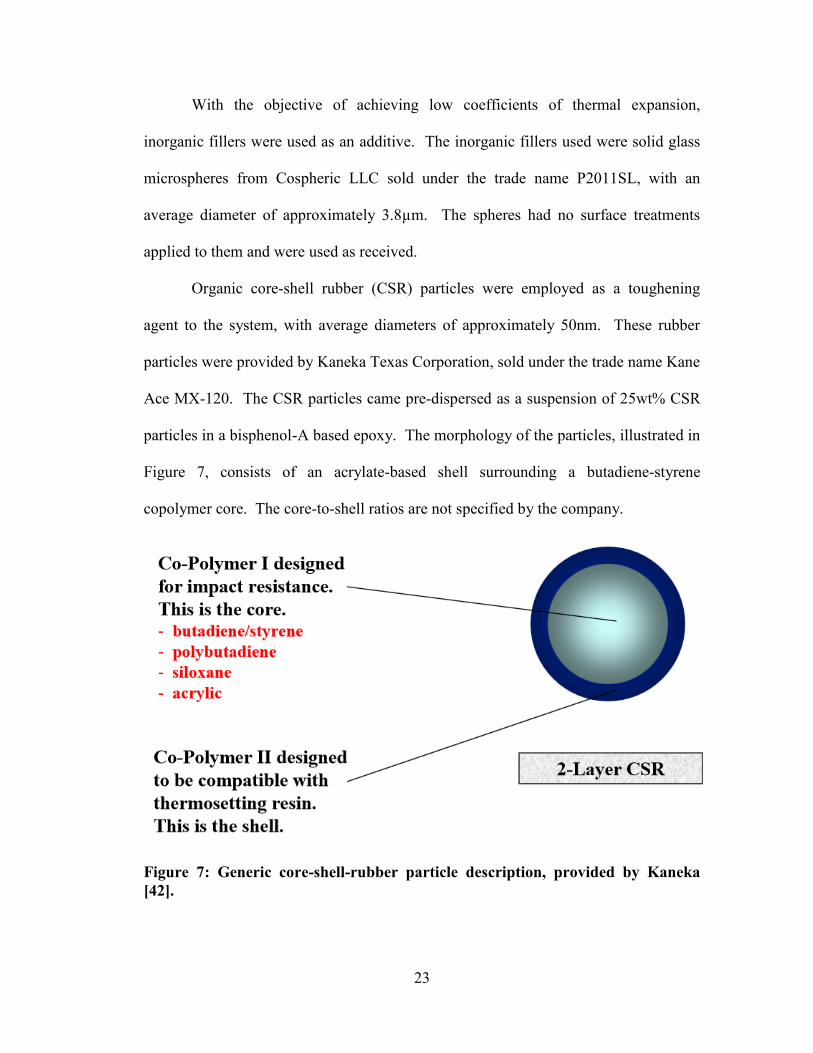
Organic core-shell rubber (CSR) particles were employed as a toughening
agent to the system, with average diameters of approximately 50nm. These rubber
particles were provided by Kaneka Texas Corporation, sold under the trade name Kane
Ace MX-120. The CSR particles came pre-dispersed as a suspension of 25wt% CSR
particles in a bisphenol-A based epoxy. The morphology of the particles, illustrated in
Figure 7, consists of an acrylate-based shell surrounding a butadiene-styrene
copolymer core. The core-to-shell ratios are not specified by the company.
Figure 7: Generic core-shell-rubber particle description, provided by Kaneka
[42].

24
2.2 Formulations and Processing
2.2.1 Neat Epoxy Resin
The standard neat resin used for this research was employed as a control in
order to be able compare the effect of additives. The neat resin is simply a cured
epoxy system using the epoxy, chain extender, and curing agent as described in the
materials section above. All batches were based on 300 grams of epoxy, therefore
chain extender and curing agent amounts are constant based on their required additive
mole ratios. To make the samples, 300 grams of the DER 331 epoxy was weighed
into a glass jar. A stirring rod attached to a mechanical mixer was then inserted into
the epoxy, and the epoxy was mixed for 30 minutes at room temperature. The jar was
then inserted into a thermally controlled heating mantle, and set to 80oC, and mixed
for 30 minutes at 80oC. The epoxy was then placed under vacuum and continued to
mix for an additional 30 minutes at 80oC. At that point, stoichiometric amounts of
aniline (37.71 grams) and mPDA (22.05 grams) were added to the epoxy, and further
mixed at 80oC for 5 minutes. Lastly, the mixture is again placed under vacuum and
mixed at 80oC for a final 3 minutes (or until degassing is completed). Care must be
taken not to mix the epoxy for too long after the addition of curing agent due its rapid
cure kinetics. Excessive mixing times can result in premature curing, encapsulating
the metal stirring rod, and damaging the mechanical mixer. After mixing was
completed, the liquid epoxy was poured into a Teflon coated aluminum mold that had
been preheated in an oven at 50oC. The mold was then placed back in the oven at
50oC, and held for 12 hours to cure. A three hour post cure at 130
oC was then used to
drive the polymerization process to completion and finalize all crosslinking. The mold
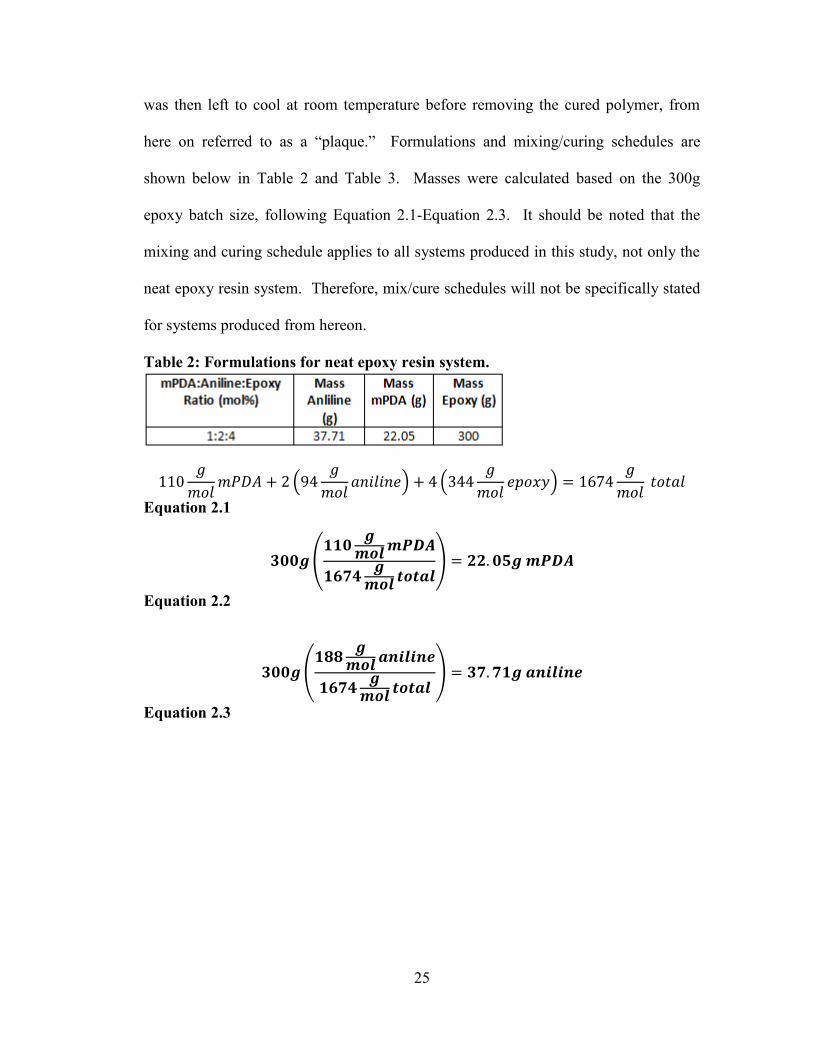
25
was then left to cool at room temperature before removing the cured polymer, from
here on referred to as a “plaque.” Formulations and mixing/curing schedules are
shown below in Table 2 and Table 3. Masses were calculated based on the 300g
epoxy batch size, following Equation 2.1-Equation 2.3. It should be noted that the
mixing and curing schedule applies to all systems produced in this study, not only the
neat epoxy resin system. Therefore, mix/cure schedules will not be specifically stated
for systems produced from hereon.
Table 2: Formulations for neat epoxy resin system.
(
) (
)
Equation 2.1
(
)
Equation 2.2
(
)
Equation 2.3

26
Table 3: Mixing and curing schedule for all systems produced during this study.
2.2.2 Epoxy Filled with Silica Particles
The optimal benefits seen in silica filled epoxy systems, with respect to CTE,
are obviously going to be seen at high silica loadings. However, silica also provides
benefits in regards to mechanical properties, and therefore needs to be added in varied
amounts in order to evaluate its effective amounts. The silica filler concentrations in
this study were varied from 10 to 30 volume percent. Formulations for all silica filled
systems are seen below in Table 4.
Table 4: Formulations for silica filled epoxy systems.
Volume percent calculations were based on the cured neat epoxy resin, and all of its
components. Calculations are shown in Equation 2.4 and Equation 2.5. The density
value of 1.19g/cm3 was determined using a type of Archimedes density principle,
described in Section 2.3.3.
27
Equation 2.4
(
)
Equation 2.5
With regards to mixing, after adding the 300g epoxy to the glass jar, the appropriate
silica amount was simply added on top. The subsequent mixing and curing steps all
follow the same as the neat resin, stated above.
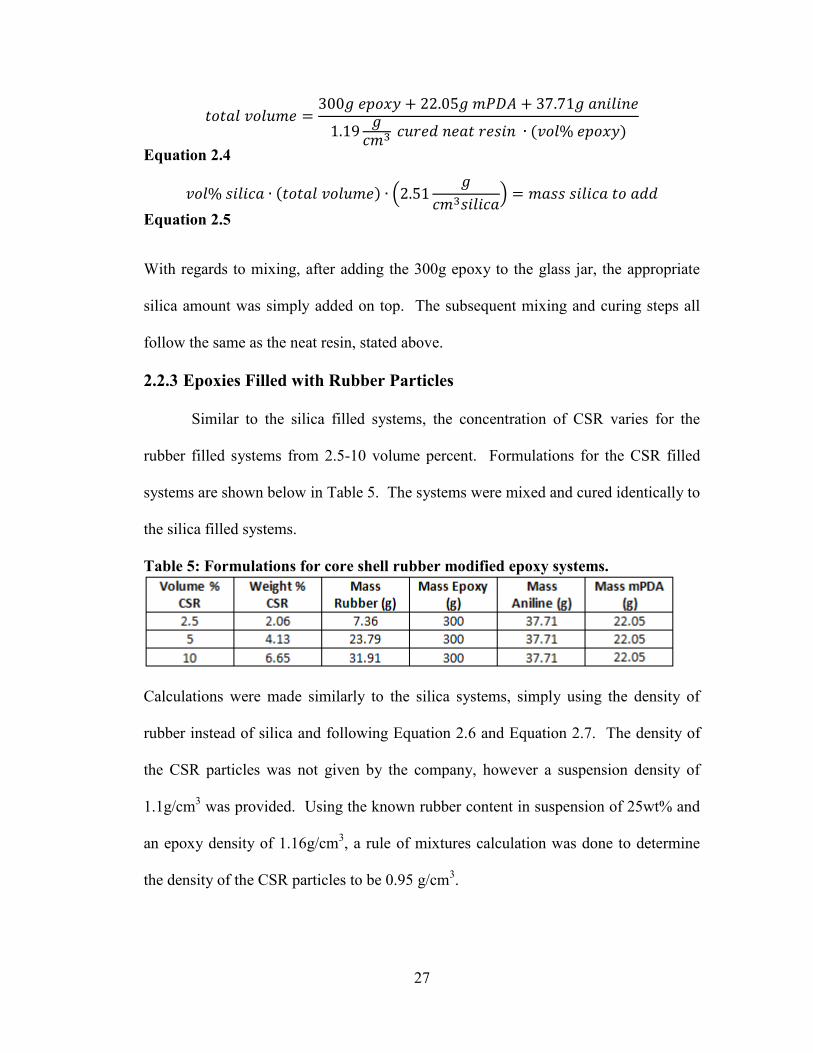
2.2.3 Epoxies Filled with Rubber Particles
Similar to the silica filled systems, the concentration of CSR varies for the
rubber filled systems from 2.5-10 volume percent. Formulations for the CSR filled
systems are shown below in Table 5. The systems were mixed and cured identically to
the silica filled systems.
Table 5: Formulations for core shell rubber modified epoxy systems.
Calculations were made similarly to the silica systems, simply using the density of
rubber instead of silica and following Equation 2.6 and Equation 2.7. The density of
the CSR particles was not given by the company, however a suspension density of
1.1g/cm3 was provided. Using the known rubber content in suspension of 25wt% and
an epoxy density of 1.16g/cm3, a rule of mixtures calculation was done to determine
the density of the CSR particles to be 0.95 g/cm3.

28
Equation 2.6
(
)
Equation 2.7
2.2.4 Epoxies Filled with Both Types of Particles (Hybrids)
In order to evaluate the effectiveness of incorporating both rubber and silica
into the epoxy matrix, hybrid systems were created using varied concentrations of
each. The hybrids were made identically to the other systems in regards to processing.
The systems produced and the formulations for those hybrid systems are shown below
in Table 6.
Table 6: Formulations for hybrid systems produced, containing both core shell
rubber particles and silica microspheres.
Calculations were completed identically to those used above for the silica and rubber
systems, using both densities in order to determine the amounts of rubber and silica to
add:
Equation 2.8
(
)
Equation 2.9

29
(
)
Equation 2.10
2.3 Characterization
2.3.1 Calculating Filler Concentrations
The volume percent of modifier/filler present in these model epoxy systems
was determined using a combination of density measurements and thermo-
gravimetric-analysis (TGA), both of which are described in depth below.
2.3.1.1 Amount of Silica Particles
For the pure silica filled systems, TGA was used to simply measure the weight
percent of a sample lost during a heating cycle. The weight percent lost represents the
mass of cured neat resin epoxy, and the remaining mass fraction therefore represents
pure silica. From these values, the volume percent of filler in the sample can be
calculated by using Equation 2.11 below. The variables ma, ρa, me, and ρe represent the
mass of additive (in this case, silica only), density of additive, mass of neat epoxy
resin, and density of cured neat epoxy resin. The density of the cured neat epoxy resin
was measured directly and described below in section 2.3.3. Assuming a 100g sample
size, output mass percentages can be taken as their respective absolute mass values,
since only those 2 components make up 100wt% of the sample. For example, if the
TGA determined that there was an 85wt% loss during a run, we automatically know
that the remaining 15wt% is silica. We can therefore assume a 100g sample size, and
say that the mass of silica (ma) is therefore 15g, and mass epoxy (me) is 85g. This
simplifies using Equation 2.11 by not needing to incorporate the mass of the original
sample.

30
∑ ⁄
∑ ⁄ ⁄
Equation 2.11
2.3.1.2 Amount of Rubber
For the purely rubber modified systems, a simple volumetric rule of mixtures
was used to calculate the volume percent rubber additive. After measuring the
composite sample’s density (following section 2.3.3), it can be plugged in directly to
Equation 2.12 to determine the volume percent rubber.
[ ]
Equation 2.12
where: ρsample=density of the rubber filled sample, x=volume % rubber, ρCSR=density
of the core shell rubber particles (previously mentioned to be ~0.95), and ρNR=density
of the cured neat epoxy resin.
2.3.1.3 Filler Content in Hybrids
For hybrid systems, the TGA method alone cannot work because of the fact
that the rubber will burn off along with the epoxy during the heating cycle. Therefore,
a combination of TGA and density measurements was employed. The same TGA
process as described above was used to determine the mass of silica in the hybrid
system. From there, it was assumed that the mass of added rubber modifier was
perfectly dispersed into the epoxy matrix, and was entirely contained in the mixture (in
other words, none lost to settling during mixing or sticking to the sides of the
jar/stirrer/etc). From that assumption, the mass fraction of rubber in the hybrid system

31
can be determined following Equation 2.13, which simply uses the mass of rubber
divided by the total mass of the hybrid.
Equation 2.13
With the mass fraction rubber now determined, we can resort back to Equation
2.11 for determining the volume percent additive in a system. However, now the mass
fraction of silica as well as rubber will need to be summed up in the “additive” portion
of the numerator and denominator. Remembering that the rubber and epoxy burned
off simultaneously during heating, the mass epoxy needs to be determined. This will
simply be based on the difference between 100 (assuming a 100g sample size still) and
the sum of the corresponding silica and rubber mass fractions (ms and mr,
respectively). This will now give us the mass fraction of actual epoxy that was burned
off during the run. This is shown fully in Equation 2.14.
⁄ ⁄
⁄ ⁄ [ ] ⁄
Equation 2.14
2.3.2 Determining Weight Percent Silica Using TGA
A TA Instruments Q500 TGA (shown in Figure 8 below) was used, heating
through a range of 30-700oC in air, at a heating rate of 10
oC/min. Sample sizes of
between 10-15mg were used, with a platinum sample pan used as the weighing
medium. An example of a weight loss TGA curve is shown in Figure 8 along with an
image of the instrument.

32
Figure 8: Left, example TGA curve showing weight% lost after heating from 30-
700oC. Right, image of the TGA Q500
2.3.3 Determining Concentration of Particles Using Density
Densities of all systems were a necessary measure in order to complete the
above volume percent filler calculations. The method used to determine density was a
form of the Archimedes Density Principle. Archimedes’ principle states that there is a
buoyancy force exerted on an object immersed in water, and that buoyancy force is
equal to the weight of the water displaced by its immersion. This buoyancy force is
equivalent to the difference between the dry sample and the submerged sample (refer
to Equation 2.16). Therefore, by being able to measure that buoyancy force (or the
mass of water displaced), the volume of that displaced water can be calculated. The
volume of displaced water is equal to the volume of the sample that was placed in the
water. Now that the volume of a specific sample with a known mass can be
determined, the density of that sample can be calculated following Equation 2.15
where the sample density, mass of dry sample, density of water, and mass of the
sample submerged in water are: ρsample, Mdry, ρwater, and Msubmerged, respectively.

33
Equation 2.15
derived from:
Equation 2.16
This method is a variation of ASTM D792-08, and according to that standard,
either deionized or distilled water may be used [43]. The standard also states that the
density of water is temperature dependent, and provides a conversion chart for the
density based on your specific water’s temperature. A relatively accurate
measurement can be made assuming a constant value of 1g/cm3, although the water
temp was considered for this study. The set-up for this measurement is a relatively
simple one, shown in Figure 9. A standard Mettler Toledo AG245 analytical balance
was used for all measurements. Most analytical balances contain a bottom weighing
hook, which is typically covered by a removable metal shield. This bottom weighing
hook is designed for submerged measurements exactly like the one described here.
Using a piece of wire, a make-shift basket was made and hung from the bottom
weighing hook. The basket end of the wire was submerged in the water, and the scale
as zeroed. Now, both dry and submerged masses can be measured and recorded. An
average of 5 measurements was taken for each formulation. *Note: care must be
taken when submerging the sample in water. Rapid immersion can result in
trapped air bubbles on the surface of the sample. This will result in an
inaccurate Msubmerged mass, and ultimately incorrect densities.

34
Figure 9: Equipment set-up for sample density measurements using Mettler
Toledo AG245 analytical balance.
2.3.4 Glass Transition Temperature by DSC
The glass transition temperatures of the cured model epoxy systems were
determined using differential scanning calorimetry (DSC). This technique measures
heat flow through a sample and compares it to heat flow through a reference sample,
then outputs data in the form of W/g versus Temperature. In this case, the sample
consists of a 5-10mg piece of the cured epoxy system of interest contained in a sealed
hermetic aluminum pan. The reference is simply an empty sealed hermetic aluminum
pan. The instrument used was a TA Instruments Q2000 DSC. The sample was heated
through a temperature range of 30-200oC at 10
oC/min in order to erase any thermal
history, then cooled back to 30oC and repeated. The second heating curve provides the
glass transition temperature, as measured by the “midpoint method” in the software
program, “TA Universal Analysis.” An image of the instrument and a sample DSC
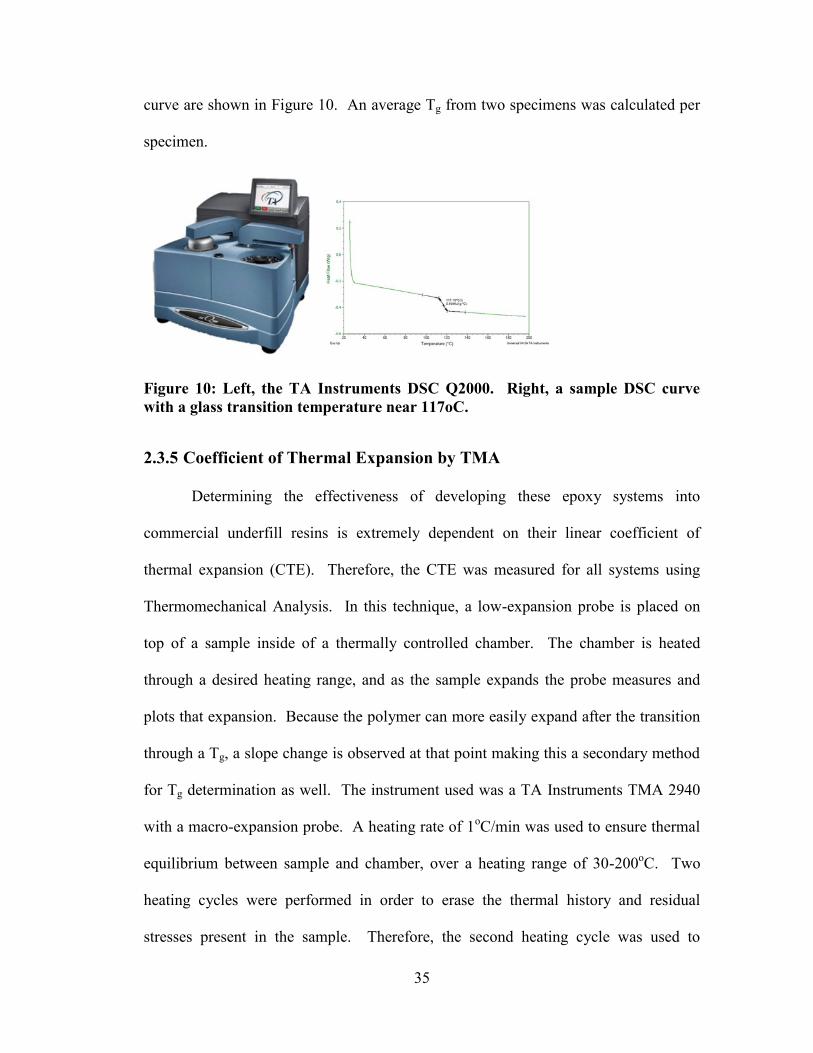
35
curve are shown in Figure 10. An average Tg from two specimens was calculated per
specimen.
Figure 10: Left, the TA Instruments DSC Q2000. Right, a sample DSC curve
with a glass transition temperature near 117oC.
2.3.5 Coefficient of Thermal Expansion by TMA
Determining the effectiveness of developing these epoxy systems into
commercial underfill resins is extremely dependent on their linear coefficient of
thermal expansion (CTE). Therefore, the CTE was measured for all systems using
Thermomechanical Analysis. In this technique, a low-expansion probe is placed on
top of a sample inside of a thermally controlled chamber. The chamber is heated
through a desired heating range, and as the sample expands the probe measures and
plots that expansion. Because the polymer can more easily expand after the transition
through a Tg, a slope change is observed at that point making this a secondary method
for Tg determination as well. The instrument used was a TA Instruments TMA 2940
with a macro-expansion probe. A heating rate of 1oC/min was used to ensure thermal
equilibrium between sample and chamber, over a heating range of 30-200oC. Two
heating cycles were performed in order to erase the thermal history and residual
stresses present in the sample. Therefore, the second heating cycle was used to

36
determine the true mechanical properties of the sample. Two samples per system were
tested and averaged. Samples were made following ASTM E831-12 specifications,
obtaining samples with 5mmx5mm lateral dimensions and 2.5mm in the thickness
direction [44]. All faces were measure and kept within ±25µm of the dimensions
stated above. The CTE in both the glassy and rubbery state were determined based on
the linear slope before and after the Tg. Figure 11 shows the instrument and an
example of a typical TMA curve.
Figure 11: Left, sample TMA curve showing CTE's in both the glassy and
rubbery state. Right, an image of the TMA 2940
2.3.6 Compressive Yield Strength
Yield strength was measured in compression following ASTM D695 [45].
Simplicity of machining and testing specimens is the main motivation for measuring in
compression versus in. The conversion between the two is easily determined using a
multiplicative conversion factor of 0.7 from compressive to tensile yield stress (0.7*σc
= σt), as stated in ASTM D5045-99 [46]. Samples were machined out of plaques into
rectangular geometries of 6x6x12 [mm]. Testing was performed using an Instron 5567

37
Universal Testing Frame, with a crosshead speed of 1.3mm/min [45] between two
parallel pieces of polished steel, as shown in Figure 12. The yield stress was taken as
the maximum of the stress vs. strain curve (example shown in Figure 12). Five
samples per formulation were tested and averaged.
Figure 12: Left, Instron 5567 with polished steel head and plate used for
compression testing. Right, example of compressive stress vs. strain curve with
the maximum representing the yield stress.
2.3.7 Fracture Toughness
Fracture toughness was the main property observed in this study, used to
evaluate the effectiveness of incorporating rigid inorganic micron sized fillers,
compliant rubbery nano-particles, and hybrid combinations of both. To this, ASTM
D-5045 was followed using a linear elastic fracture mechanics approach [46]. This
method uses single edge-notched, three-point-bend (SEN-3PB) specimens for testing.
These specimens were machined out of plaques into 12.7x6x76 [mm] rectangular
geometries. A single edge notch was then manually cut into the specimen at 50% of
the sample length using a jeweler’s saw. Razor blades that had been pre-soaked in
liquid nitrogen were then inserted into the pre-notch, and used to drive a pre-crack to
50% of the height of the specimen. The thermal shock of the frozen razor blade to the

38
glassy polymer creates a crack that is assumed to “atomically” sharp. The pre-cracked
specimens were then tested in three point bending on an Instron 5567 Universal
Testing Frame. After failure, the position of the pre-crack can visually be seen as
“smiley face” shaped region, as schematically shown in Figure 13. From this fracture
surface, calipers were used to take crack length measurements from the left, right, and
center of the specimen, and then averaged for a mean crack length (measurement
positions shown in Figure 13).
Figure 13: Fracture surface of a SEN3PB specimen, and corresponding crack
length measurement positions.
Samples are considered acceptable if they satisfy the following criterion, provided by
the ASTM standard:
where W=specimen width, and a is the average crack length measurement. General
specimen configurations are shown in Figure 14.
Figure 14: Specimen configurations for SEN3PB specimens [46].
The fracture toughness is then calculated using Equation 2.17 below:

39
(
)
Equation 2.17
[ ]
Equation 2.18
where: PQ = the maximum load (peak) on the load versus displacement curve in three
point bending (sample shown in Figure 15), and x=a/W. Further criteria that need to
be satisfied require that the sample be in a “plane strain” state, which ensures that (W-
a) be sufficient to avoid excessive plasticity [46]. These criteria are as follows, based
on the configurations shown in Figure 14:
⁄
where: KIC = plane strain fracture toughness, and σy = the tensile yield stress.
Figure 15: Sample load versus displacement curve for three point bending
experiments.
2.3.8 Fractography

40
2.3.8.1 Scanning Electron Microscopy
In order to understand the toughening mechanisms present in fractured three
point bend specimens, scanning electron microscopy (SEM) was employed. In this
analysis, the “stress whitened zone” (shown in Figure 13) of the fracture surface was
evaluated using a Hitachi 4300 low voltage SEM. A gun brightness of 1 and aperture
setting of three were used for every sample. Accelerating voltages varied depending
on the sample being looked at because of necessary resolution. For micron sized silica
particle with less resolution necessary, voltages of 3kV were used. On the contrary,
when examining the nano sized rubber particles, voltages of 15kV were used in order
to acquire the added resolution necessary to clearly see such small particles. Samples
being analyzed at 3kV were coated with 5nm of Irridium to prevent charging and
sample damage. The samples analyzed with 15kV were coated with 15nm Irridium in
order to prevent sample damage from the increased beam strength. Carbon tape was
used to adhere samples to a 12.5mm sample stub. Particle dispersion, size, and matrix
deformation were all evaluated to determine fracture mechanisms.
2.3.8.2 Transmission Optical Microscopy
Transmission optical microscopy (TOM) was performed using an Olympus
BH-2 light optical microscope. This microscopy method was used to look at
subsurface damage in the epoxy systems, which describes the sizes of both the damage
and plastic zones. Images were taken under both bright field and crossed polars in
order to image both of these zones. Under bright field conditions, any features that
scatter light appear dark from lack of light transmission, and therefore represents the
the above mentioned damage zone. Once placed under cross polars, birefringence is
41
able to show the areas that have been plastically deformed which represents the above
mentioned plastic zone. These zone sizes are used to help describe the energy
dissipated by a system. Fractured specimens were cut approximately 1cm below the
fracture surface, and mounted in a small epoxy mold such that the sample could be
ground and polished in the thickness dimension (6mm) using petrographic polishing
techniques to create thin sections of approximately 100µm.
3 RESULTS AND DISCUSSION
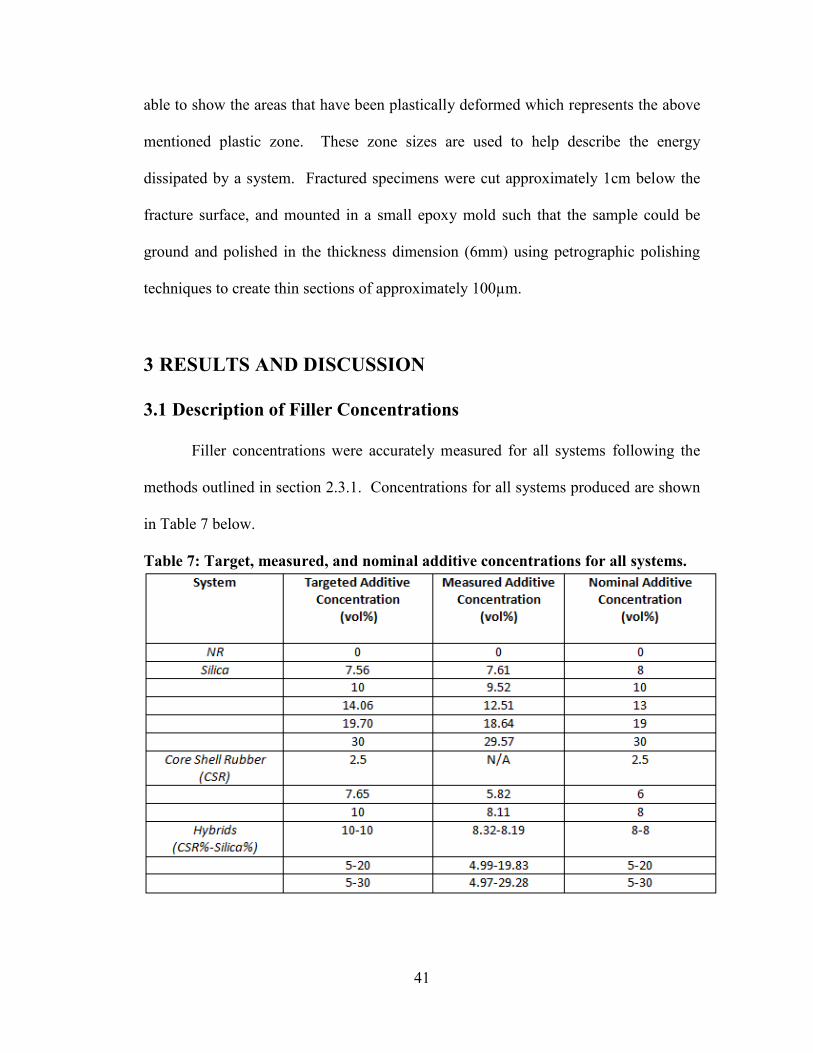
3.1 Description of Filler Concentrations
Filler concentrations were accurately measured for all systems following the
methods outlined in section 2.3.1. Concentrations for all systems produced are shown
in Table 7 below.
Table 7: Target, measured, and nominal additive concentrations for all systems.

42
This table shows both the target calculated values as well as the actual
measured values. The third column shows the nominal value which is based on the
measured value, rounded to the nearest percent. This nominal value will be referred to
here-after when identifying systems.
As can be seen in Table 7, certain target additive concentrations are not whole
numbers as they should be (i.e, 7.56vol% Silica). This mistake is present in the first
four systems produced (3 silica systems and 1 CSR system). This was due to a
calculation error at the beginning of the study, when parts-per-hundred-parts resin
(phr) calculations were being done instead of volume percent calculations. After
realizing the mistake, the calculations were re-done using the correct volume percent
method, and the resulting target additive concentrations are therefore reported with
slight deviations from round numbers.
The 2.5vol% rubber system reports a measured additive concentration of N/A
because of the amount of added rubber being so low. Some measurements even
resulted in negative values. Therefore, for that single system it was assumed that the
calculated additive concentration was correct. As seen in Table 8, the measured
density for the 2.5vol% rubber system was slightly higher than the desired calculated
density, suggesting that the correct amount of rubber was not actually contained in the
system. Again, with such low concentrations, this result is ignored. As seen in section
3.6, the fracture toughness data for this system is still significantly higher than the neat
resin, suggesting that rubber was certainly added to the system.
3.2 Density

43
Measured densities are shown below in Table 8. Calculated densities are also
reported in Table 8 as a way to identify any differences in theoretical and measured
densities. Calculated densities for the composites follow a simple rule of mixtures, as
mentioned by Dittanet et al. [8]. Silica and rubber particle densities are known (as
reported by supplier), and epoxy neat resin density was measured, therefore the
composite density could be calculated following Equation 3.1 below:
∑
∑
∑
(∑
)
Equation 3.1
where: mA is the mass of additive (either silica, rubber, or both in the case of hybrid
systems), ρA is the density of the additive, mE is the mass of epoxy, mCE is the mass of
chain extender (aniline), and mCA is the mass of the curing agent (mPDA), and ρNR is
the measured density of the cured neat resin.
Table 8: Calculated and measured density values for all systems produced.

44
Differences between calculated and measured density values follow the trends
observed in the “targeted” versus “nominal” additive concentrations. Densities are
reported to the third decimal place (four significant figures) based on the accuracy of
the analytical balance.
3.3 Glass Transition Temperature
It was observed that glass transition temperature was not greatly affected by
the addition of either silica or CSR particles. The average Tg measured for the systems
was 116.6oC, as seen in
Figure 16. Averages of 2 measurements were taken per sample. Tg values along with
standard deviations can be found in Table 9.
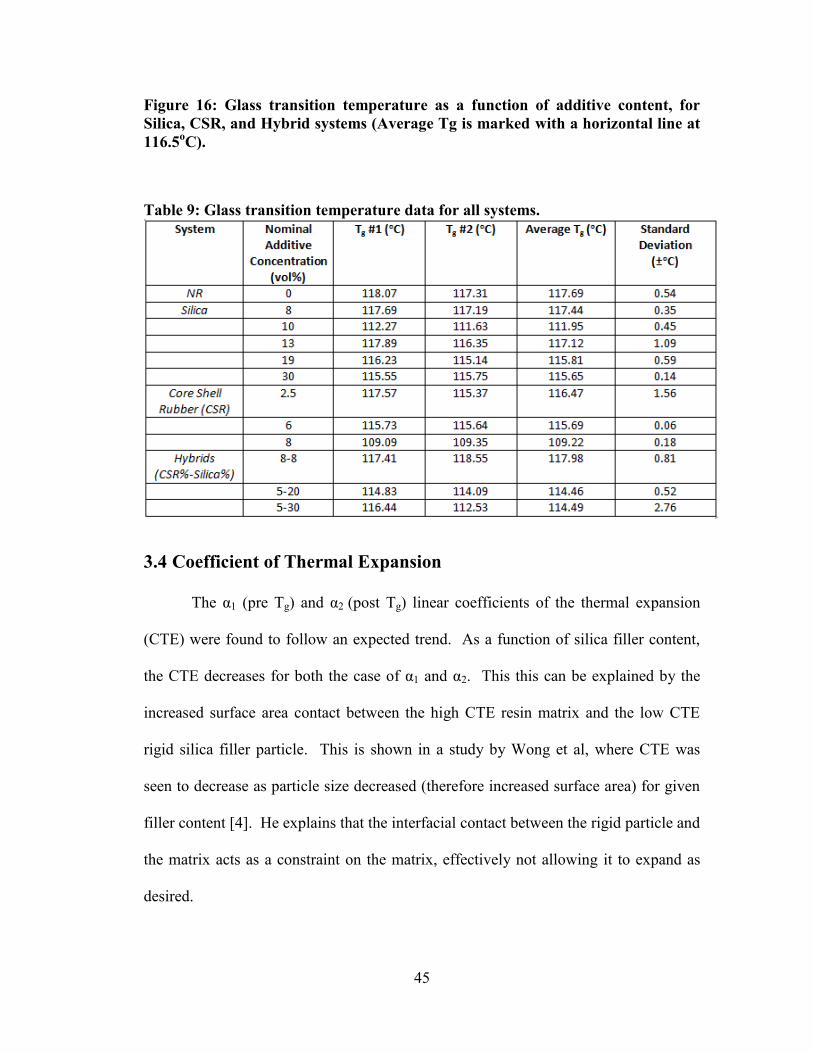
45
Figure 16: Glass transition temperature as a function of additive content, for
Silica, CSR, and Hybrid systems (Average Tg is marked with a horizontal line at
116.5oC).
Table 9: Glass transition temperature data for all systems.
3.4 Coefficient of Thermal Expansion
The α1 (pre Tg) and α2 (post Tg) linear coefficients of the thermal expansion
(CTE) were found to follow an expected trend. As a function of silica filler content,
the CTE decreases for both the case of α1 and α2. This this can be explained by the
increased surface area contact between the high CTE resin matrix and the low CTE
rigid silica filler particle. This is shown in a study by Wong et al, where CTE was
seen to decrease as particle size decreased (therefore increased surface area) for given
filler content [4]. He explains that the interfacial contact between the rigid particle and
the matrix acts as a constraint on the matrix, effectively not allowing it to expand as
desired.

46
On the contrary, CTE increases were seen for the case of α1 for CSR particles
due to the fact that the CSR particles have a higher CTE than the matrix, resulting in
an increased CTE. In the case of α2, both the matrix and the CSR particles are past Tg,
therefore both in the rubbery state, and CTE does not change as a function of CSR
content. As expected, hybrid systems show similar decreases in CTE as a function of
silica filler content, with a slight overall upward shift as a result of the CSR which is
also contained within. All of these results can be seen below in Figure 17. Numerical
values for CTE are shown in Table 10 for all systems. The CTE data reported for each
system in the chart is based on an average of 2 measurements.
Figure 17: Left, pre Tg CTE as a function of additive content. Right, post Tg CTE
as a function of additive content. Lines inserted to highlight trends.

47
Table 10: Linear coefficient of thermal expansion data for all systems.
3.4.1 Modelling the Coefficient of Thermal Expansion
Various models have been proposed to predict the CTE behavior of epoxy
composites [47], but the simplest among them is the rule of mixtures model. This
model assumes that each phase expands independently of one another, that no
mechanical interactions occur between the materials, and that all materials involved
are under an equal stress state (iso-stress). Because of its simplicity, this model was
applied before any others, and found to predict the data nearly flawlessly. The applied
model is shown in Equation 3.2: where α represents the thermal expansion coefficient
and V represents the volume fraction. The subscripts c, f, and m represent composite,
matrix, and filler, respectively. Results are plotted in Figure 18. It is noted that the
CTE of 2.5vol% CSR does not match the ROM data very well, however that data point

48
also exhibits a CTE lower than that of the neat resin, which most likely makes it an
outlier.
Equation 3.2
Figure 18: CTE experimental data with predicted data using a rule of mixtures
model. Left column represents all pre Tg data, while the left hand column
represents all post Tg data.
3.5 Compressive Yield Strength
Compressive yield strength measurements similarly show expected increases.
The addition of rigid silica particles results in significant increases in compressive

49
yield stress. Similar to the reasons behind CTE benefits, these increases in yield stress
can be attributed to the interfacial contact between the compliant epoxy matrix and the
stiff filler particle. This also hints towards good interfacial bond strength. If the
interfacial bond were weak, the particle would essentially act as a void and the matrix
deform around it. In this case, with yield stress increases being observed as seen in
Figure 19, we can therefore conclude that there is good interaction at the interface
between the particle and matrix. These results were expected, following the results
observed by Pearson and Kawaguchi with the addition of both large and small glass
spheres into an epoxy matrix [15].
As expected, addition of the softer compliant rubbery particles results in a
significant decrease in yield stress, shown in Figure 19. With the yield stress of the
rubber particles being less than that of the cured neat resin, it was predicted that the
yield stress would correspondingly decrease as a function of CSR content.
Again as expected, the hybrid systems showed an overall negative offset from
the pure silica filled systems, due to the CSR particles contained but. However,
similar to the pure silica filled systems, they showed an increase in yield stress as a
function of silica content with an identical slope to that of the pure silica systems
(figure 13). It was though that the hybrids might result in yield strengths based on
pure additive effects from the silica and rubber particles, but that was not observed.
The “x” symbols in Figure 19 represent the yield stress values following an additive
approach, and clearly don’t match the experimental data. A rule of mixtures model for
the yield stress will be evaluated in the corresponding modelling section. A complete
set of the yield stress data can be seen in Table 11.

50
Figure 19: Compressive yield strength as a function of additive content for silica,
CSR, and hybrid systems.
Table 11: Compressive yield strength data for all systems produced.

51
3.5.1 Modelling Compressive Yield Strength
As already discussed, the yield stress data for the hybrid composite systems
does not exhibit an additive effect between the silica and rubber systems. Therefore, a
model by Sudduth et al. was applied [48]. This model assumes spherical particles and
a simple parallel strain contribution of different tensile strength components within the
composite, and is similar to that previously proposed by Piggot et al. [49]. Essentially
this model is another variation of the rule of mixtures; however it also contains a
particle-matrix interaction parameter, fF, which is termed the transfer efficiency
parameter. This transfer efficiency parameter can be thought of as a fitting parameter,
and was not experimentally determined. The model is illustrated in Equation 3.3
where f, ϕ, and σ denote the transfer efficiency parameter, volume fraction, and yield
stress respectively; the subscripts M and F represent the matrix and the filler particles
respectively.
Equation 3.3
The transfer efficiency value for the silica and rubber particles were obtained
by fitting by finding the best fit with the experimental compressive strength data.
Although the model was developed as a means to evaluate tensile yield stress, it was
applied here to compressive yield stress in order to match experimental results. The
compressive yield stress value for the silica spheres was taken as 325MPa, obtained
from literature for Soda-Lime-Silica glass [50]. The exact composition of the CSR
particles is proprietary and not entirely known, so it was assumed that the

52
polybutadiene core was the most representative for the yield strength, resulting in a
literature value of 2.5MPa [51].
Using a transfer efficiency value of 0.61, Figure 20 shows that the Sudduth
model fits the experimental yield stress data for the silica composite systems well. A
transfer efficiency value of 1 means that there is exceptional particle matrix adhesion,
and would result in much larger values. An efficiency of 0 means no particle-matrix
interaction, and therefore the particles are essentially thought of as a void. Based on
the knowledge gained from fracture surfaces in this study, the particle matrix
debonding was said to have been characteristic of a fairly weak particle-matrix
interface which agrees well a transfer efficiency coefficient of 0.61.

53
Figure 20: Sudduth predictive model for compressive yield stress versus
experimental data obtained for silica composites.
In the case of the CSR particles, it was found that a transfer efficiency of -30
was needed in order to match the experimental data. Although efficiencies of between
0 and 1 are typically used to describe positive interactions between the particle and the
matrix, Sudduth states in his modelling study that negative values are possible if
detrimental negative interactions between the particle and the matrix occur [48]. At
the time of this publication, the author had not yet been able to provide an explanation
as to why this negative interaction occurs. Figure 21 shows the CSR data.

54
Figure 21: Sudduth predictive model for compressive yield stress versus
experimental data obtained for CSR composites.
With the transfer efficiency coefficients for the silica and CSR particles both
now known, the model was applied to the hybrid composites using and additive
approach to Sudduth’s model. As can be seen in Figure 22, the model predicts the
yield strength of the hybrids reasonably well, but tends to overestimate the
contribution of the silica phase. This may be due to the fact that Sudduth’s model is
developed based on the presence of voids, but voids were assumed to be absent for this
modelling study. If voids were in fact present in the hybrid composites, the model
would predict decreased values for all of the yield strength values, and may match the
experimental data more closely.

55
Figure 22: Sudduth predictive model for compressive yield stress versus
experimental data obtained for hybrid composites.
3.6 Fracture Toughness
Fracture toughness was the main focal point for this study, particularly the
ability of silica and rubber additives to improve this property. As such, the fracture
toughness from each of the produced specimens was measured and recorded to
produce the results shown in Figure 23. In short, silica additions can provide
toughening benefits, but not with any large significance (increases from ~0.68 to ~1.30
MPa-m0.5
). It is encouraging, however, that at the high silica loadings we are
interested in the fracture toughness is not yet decreasing. This is optimistic for the
ability of producing highly loaded silica composites (for CTE reasons) without
negatively affecting the fracture toughness of the system.

56
Rubber (CSR) particle additions provide immediate and rapid toughening
benefits, with as little as 2.5vol%, surpassing the toughening benefits of any of the
silica systems. A continuous increasing trend was observed for the three rubber
systems made. At a CSR loading of 8vol%, the KIC does not appear to have yet
plateaued, suggesting a maximum has most likely not yet been met. However, the
detrimental effects of rubber content on yield stress must be taken into consideration.
In other words, further increasing the CSR content of the system, although improving
fracture toughness, will not necessarily benefit the overall performance.
Hybrid systems were of most interest for this study. Knowing the background
and superior ability of rubber modifiers at improving fracture toughness makes them
of extreme interest for these epoxy systems. On the other hand, the stiffness and
thermal expansion of silica filled systems obviously attract equally important attention.
Therefore, the ability of hybrid systems to perform on both levels is extremely
appealing. As already mentioned, the hybrids showed promising results with respect
to CTE and yield stress, and the trend continues here with fracture toughness. The
fracture toughness of the first system produced, 8CSR-8Silica, shows values greater
than either of its individual components (8vol% CSR or 8vol%Silica). Nominally, the
KIC reached 2.65MPa-m0.5
, a reasonable improvement over the toughness of its
individual 8vol%CSR component of 2.31MPa-m0.5
(all fracture toughness data can be
seen in Table 12) . This means not only do we get CTE and stiffness benefits from
adding silica to a CSR system, but we actually have an additive effect to the fracture
toughness. This would have been even more intriguing if we could have attained

57
“synergistic” toughening. By definition, synergism is an effect that is greater than the
combination of the individual contributing effects.
Although synergism was not attained, the fact that an additive effect is
observed is exciting. In addition, the remaining 2 systems (5vol% rubber in both 20
and 30vol% silica) maintain all or most of the toughness of the near 5vol% rubber
system (6vol% nominally), rather than diminishing the toughness at high silica
loadings. This means that the addition of the silica does not inhibit the ability of the
system to produce a plastic damage zone at a crack tip (due to plasticity induced by the
CSR particles), and therefore does not inhibit the ability of the hybrid system to
dissipate energy.
Figure 23: Fracture toughness for each of the silica, CSR, and hybrid systems
produced. Dashed lines represent the KIC values for 5 and 8 volume percent
CSR, in order to compare the synergistic or additive benefits observed in the
hybrid systems.

58
Table 12: Fracture toughness (KIC) data for all systems produced.
3.6.1 Modelling Fracture Toughness
As mentioned previously, the model proposed by Huang and Kinloch [36, 37]
has been used my many researchers to predict the increases in fracture energy (GIC) for
particle modified epoxies. The model is shown in Equation 3.4, where the subscripts
ICu, s, c, and r represent the contributions of the unmodified epoxy resin, localized
shear banding mechanism, plastic void growth mechanism, and rubber-bridging
mechanism to the overall fracture energy. The GICu is determined experimentally from
the unmodified neat epoxy resin, but please consult references [36, 37] to learn more
about how to calculate the other individual toughening contributions. Unfortunately,
there was not enough time to fully evaluate this model during the current study,
therefore the details behind calculations will not be discussed in detail.
Equation 3.4

59
Essentially, the model can be used to calculate contributions from individual
toughening mechanisms to a composite’s overall fracture energy. The benefit of this
is being able to understand the primary and secondary contributions in toughening a
composite, which can be helpful in evaluating the effectiveness of incorporated
additives. If the model were to be applied in this study, the experimentally determined
fracture toughness (KIC) could be converted to a fracture energy values using Equation
3.5: where KIC is the experimentally determined fracture toughness of the composite,
E is the tensile Young’s Modulus, and ν is the Poison’s ratio of the epoxy neat resin.
KIC and E are both determined experimentally, while ν is taken from the literature to
be around 0.37 [37].
Equation 3.5
A model for predicting the fracture toughness of hybrid composites was
proposed by Kitagawa [52] et al., and is shown in Equation 3.6. Subscripts c, r, g, and
neat represent the hybrid composite, rubber modified composite, silica glass modified
composite, and unmodified neat resin respectively. This model is based on a simple
rule of mixtures, and is applied to the experimental data for this study, and shown in
Figure 24
Equation 3.6
The model predicts the data for the 8CSR-8Silica hybrid system with great
certainty, however it over-predicts at the higher silica concentrations. This is most
likely due to the fact that the model uses an additive approach and cannot account for
any particle interactions. As has been discussed already, high filler concentrations can

60
result in negative interactions by inhibiting the growth of the plastic zone growth from
shear yielding mechanisms. The observed shrinking plastic zone effect and its
contribution to fracture toughness will be discussed below in the Fractography and
Fracture Mechanisms section.
Figure 24: Hybrid fracture toughness as a function of additive concentration for
experimental and predicted data using the Kitagawa model
3.7 Fractography and Fracture Mechanisms
3.7.1 Scanning Electron Microscopy
Fracture toughening mechanisms are observed in an area termed the “stress
whitened zone,” which pertains to the area of energy dissipation. It is visually seen as
a white half-moon area on the fracture surface, which gets its color due to the
plastically deformed matrix scattering light. Figure 25 shows a schematic of the
stress-whitened zone on a fracture surface. The fast fracture region is below the stress

61
whitened zone, where the crack is growing unstably and at a very high rate. This
happens when the stress at the crack tip overcomes the ability of the matrix to dissipate
energy, and the crack therefore grows rapidly through the remainder of the sample.
Figure 25: Schematic of a sample fracture surface (face-on view), showing the
pre-notch (top white rectangle), stress whitened zone/slow fracture region, and
fast fracture region.
3.7.1.1 Silica Filled Systems
For all silica filled systems the fracture mechanisms remained constant,
regardless of filler concentration. The toughening mechanisms observed include
particle matrix debonding followed by matrix void growth. Comparison between the
fast fracture and stress whitened regions allow the toughening mechanisms to be
determined, as shown in Figure 26. The particle matrix debonding mechanisms are
quite obvious, seen as a visible silica particle or silica particle void, compared to the
fast fracture images where silica particles are all completely encompassed by the
epoxy matrix. The matrix void growth mechanism can be seen around the silica
particles, where the matrix plastically grows appearing as a black crater surrounding
the silica particles. In the case of 15 and 30 volume percent, the sample exhibited
“stable crack growth,” essentially meaning that a fast fracture region never formed,
and the crack continued to grow stably through the entire sample even after reaching a
maximum load.

62
Figure 26: SEM micrographs for each silica system produced. For each
concentration prepared, left image represents stress whitened zones; right images
represent fast fracture regions.
The particle matrix debonding and matrix void growth mechanisms are similar
to those seen by Azimi and Pearson in silica filled epoxy systems [7]. However, many

63
other studies most commonly describe crack tip pinning and crack surface bridging as
the major toughening mechanisms, neither of which are observed in any of these silica
systems [12, 30]. This is most likely due to epoxy matrix differences (crosslink
density, epoxy type, etc.) and the interactions at the particle matrix interface. Weak
particle-matrix adhesion has been related to particle matrix debonding near the
equatorial point on the particles, while good particle matrix adhesion would result in
stresses being directed to the poles and resulting in pinning/bridging mechanisms [25].
3.7.1.2 Core-Shell-Rubber Modified Systems
Evaluation of SEM micrographs of the fracture CSR modified systems showed
significant particle cavitation and void growth. Similar to the silica filled system, the
fracture mechanisms did not change regardless of rubber content. The tri-axial stress
state experienced by these particles during fracture forces them to have to change
volume. However, a Poison’s ratio of 0.5 for the rubber phase prevents such volume
change and causes internal particle cavitation. This particle cavitation is responsible
for little energy dissipation compared to the subsequent mechanisms of matrix void
growth and matrix shear banding. After the cavitation, the void shows continued
growth due to plastic deformation, which can be seen by comparison between void
sizes in the stress whitened versus fast fracture regions. As rubber content increases, it
can be seen that matrix tearing tends to become more prevalent (evident by presence of
jagged fingers of epoxy), most likely due to increased matrix plasticity.
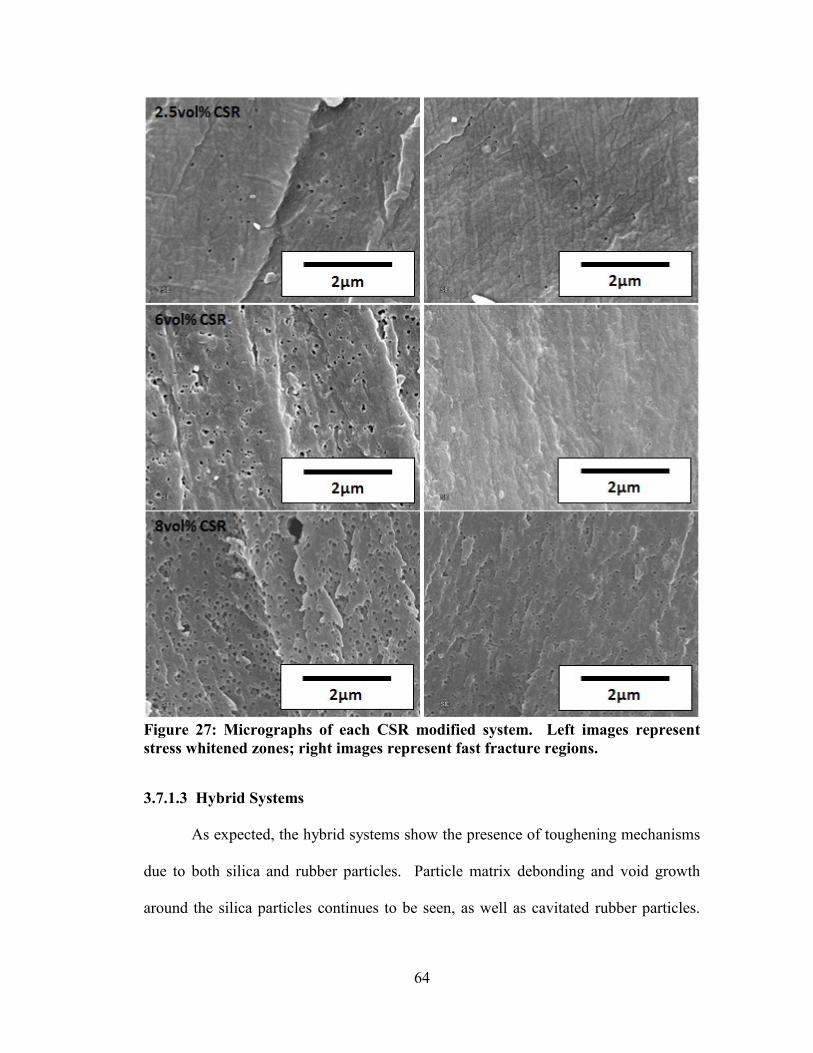
64
Figure 27: Micrographs of each CSR modified system. Left images represent
stress whitened zones; right images represent fast fracture regions.
3.7.1.3 Hybrid Systems
As expected, the hybrid systems show the presence of toughening mechanisms
due to both silica and rubber particles. Particle matrix debonding and void growth
around the silica particles continues to be seen, as well as cavitated rubber particles.

65
See Figure 28. Further, rubber cavitation seems to be enhanced in the presence of
silica when
Figure 28: Micrographs of each hybrid epoxy system. Left images represent
stress whitened zones; right images represent fast fracture regions.
compared to the pure rubber modified systems. This is similar to what has been seen
by Lee and Yee, explained by them as being due to an increase in the process zone
length [11] [26]. The presence of combined toughening mechanisms working together

66
is most likely the cause of additive fracture toughness in the 8CSR-8Silica system.
Similar to the silica filled systems, high silica loadings tend to result in stable crack
growth, which is observed here in the 5CSR-30Silica hybrid system. Therefore, no
fast fracture region is present in the micrographs.
3.7.2 Transmission Electron Microscopy
Transmission optical microscopy was extremely useful in this study to evaluate
subsurface damage, particularly damage and plastic zone sizes. It can be hard to
understand the TOM micrographs shown in the following sections; therefore a
schematic is shown in Figure 29 below to help understand what is being imaged
during the TOM technique. The red box in the end step represents the area imaged in
the TOM micrographs. It should be noted that the glass microscope slide mentioned in
the experimental approach is not shown in the schematic, but is assumed to be present.
Figure 29: Step by step process to preparing and examining TOM specimens.
3.7.2.1 Silica Filled Systems
Evaluation of TOM micrographs for all silica systems showed the absence of
any plastic damage zone. The images under bright-field conditions showed no light
scattering in the area of the crack tip. This is expected because there are no features

67
such as cavitated rubber to scatter the light. Dark areas are seen throughout the bulk of
the sample due to light scattering from the glass spheres. Under dark-field conditions,
only a very small area of birefringence is observed (nearly the size of a single silica
particle). This means the matrix underwent local plastic deformation for an
unidentified reason, but not contributing the toughening of the system. As silica
content increases, a birefringent layer appears at the surface, the depth of a single
particle. This corresponds to the matrix void growth observed on the SEM fracture
surfaces. It appears in the more highly loaded silica systems due to the increase
number of plastically deformed voids with increased silica particles. Bright field and
dark field images for all silica filled systems can be seen in Figure 30.

68
Figure 30: Left, bright field transmission optical micrographs; left, dark field
transmission optical micrographs.
3.7.2.2 Core-Shell-Rubber Modified Systems
The CSR modified systems showed significantly different TOM micrographs,
particularly in regards to the presence of a plastic zone. To begin with, the nanometer
sized rubber particles don’t scatter light throughout the bulk, so under bright-field

69
conditions only the cavitated rubber particles in the damage zone appear dark (top
images in Figure 31). In these bright-field conditions, it is apparent that the size of the
damage zone grows as a function of rubber content. Under dark-field conditions, we
can see that a plastic damage zone is also present (contrary to all silica systems), and is
essentially the same size as the damage zone. The presence of this plastic zone
clarifies that a cavitation and void growth/shear yielding mechanism is occurring, as
expected based on previous studies and the examination of fracture surfaces. The
increased shear banding and cavitation helps qualitatively explain the increases
observed in fracture toughness results.

70
Figure 31: TOM micrographs of each CSR modified system. Left images
correspond to bright-field conditions, right images correspond to dark-field
conditions.
3.7.2.3 Hybrid Systems
The hybrid systems show interesting results with regards to the optical
micrographs (shown in Figure 32). The 8CSR-8Silica images showed results as
expected, with a large damage zone, and correspondingly equal sized plastic zone (as
seen in the CSR modified systems). However, when increasing silica content in the

71
hybrid systems (5CSR-20Silica and 5CSR-30Silica) the damage and plastic zones both
shrink significantly in size. As anticipated, the zone sizes for each system did indeed
changed based on the addition of silica particles, which affects the shear yielding
mechanism. However it is peculiar that the depths of the plastic zones for a given
rubber content shrink with increasing silica content. This is likely due to the increase
in number of rigid filler particles limiting the amount of shear banding between
cavitated rubber particles. Essentially the rigid filler particles act as walls and block
the growth of the plastic zone when shear bands come in contact with them. This
follows a negative particle-particle interaction theory proposed by DiBerardino and
Pearson [41]. A comparison of decreasing plastic zone sizes with silica particle
additions is shown in Figure 33 (the depth differences are extremely apparent in the
transition from 5vol%CSR to 5CSR-30Silica due to the large amount of silica added;
results are less obvious when going from 8vol%CSR to 8CSR-8Silica due to the
smaller amount added silica).
Because of the shrinking plastic zone sizes, it is hard to explain how the
systems retain significantly large fracture toughness when the plastic zone size is
directly related to the amount of energy dissipated. A possible explanation is based on
observations of increasing plastic zone lengths. Less magnified images of these
samples show that the overall length of the damage and plastic zones increases in size
(horizontally in the x-direction), while the depth of the zones shrink (vertically in the
y-direction). Also, as discussed with the fracture surfaces, there does seem to be more
intense void growth around the silica particles when they are in the presence of rubber.
The plastic deformation associated with this extra voiding may make up for the

72
decrease in inter-particle shear banding to help maintain relatively high fracture
toughness values.
Figure 32: TOM micrographs of each CSR modified system. Left images
correspond to bright-field conditions, right images correspond to dark-field
conditions.

73
Figure 33: Optical micrographs showing plastic zone size changes as a function of
added silica content. *Note, the 6vol% CSR system was taken as approximately
5vol% for comparison.
3.7.2.4 Irwin Plastic Zone Model
The Irwin plastic zone model (illustrated in Equation 3.7) has been used in
previous studies as a way to correlate the size of the plastic damage zone with the
obtained yield stress and fracture values for a given sample [8] [6]. Unfortunately, the
model was not able to be successfully fitted to the results in this study (Note*: The
model was not applied to silica filled systems, due to the absence of a measurable

74
plastic zone). Figure 34 shows the experimentally measured plastic zone sizes versus
the predicted Irwin zone sizes for both CSR and hybrid systems.
(
)
Equation 3.7
Figure 34: Experimentally measured plastic zone sizes versus predicted plastic
zone sizes based on Irwin's model.
A possible reason for the lack of correlation may be due to the fact that the
Irwin model requires a tensile yield stress as opposed to the compressive yield stress
collected throughout this study. The compressive yield stress results were converted
to tensile yield stress values by using a multiplicative factor of 0.7 [46], but the
estimated conversion factor may not be precise enough to work for the model.
As discussed earlier, significant amounts void growth is observed in the CSR
modified systems based on fracture surface images. In other words, the toughening
mechanisms utilized in the CSR systems do not only include shear yielding. Because
of that, the fracture toughness values that are used to predict the plastic zone are
assumed to be entire due to shear yielding and will therefore over-predict the plastic
zone sizes. Therefore, it is most likely the case that Irwin’s model overestimates the
size of the plastic zones due to the toughening mechanisms that it does not account for.

75
Plastic zone sizes for the hybrid systems are greatly overestimated, further
solidifying the argument that the lack of accountability for non-shear yielding
mechanisms in the model is most likely the cause of overestimation. Based on the
conclusions from fracture surfaces, a large amount of debonding and void growth
around the silica particles and cavitation/void growth of the CSR particles contributes
to the fracture toughness. All of these mechanisms are ignore by Irwin’s model,
leading to a large over-prediction of plastic zone sizes.
4 SUMMARY AND CONCLUSIONS
It was found that both silica microspheres and nano-size, core-shell rubber
particles can effectively toughen a moderately crosslinked bisphenol-A based epoxy
resin. The silica particles used were able to provide slight improvements in fracture
toughness through particle matrix debonding and subsequent void growth
mechanisms. Toughness benefits were observed up to a plateau point near 15vol%
particles. In addition, the silica provides significant improvements to the yield
strength and thermal expansion behavior of the composites. The minimal
improvements in fracture toughness are most likely due a weak particle-matrix
interface, leading to the absence of typical crack pinning/bridging mechanisms
observed in other silica filled epoxy systems. The lack of surface treatments/adhesion
promoters on the particle surfaces may be responsible for the poor interfacial
interactions. Nanometer-size core-shell-rubber particles impart toughness to the resin
systems through typical particle cavitation/void growth and shear banding
mechanisms. Significant improvements in fracture toughness were observed up to

76
8vol% particles, but a plateau had not yet been observed, suggesting further
improvements would be expected with higher rubber concentration. These compliant
rubbery particles reduce the yield strength of the composite, and also cause an increase
in thermal expansion.
Hybrid systems containing various concentrations of both silica and rubber
particles were able to show additive toughening benefits, providing toughness greater
than either of the corresponding precursor contributions. Toughness in these systems
was attributed to the interaction of the toughening mechanisms from the corresponding
silica and rubber phases. Increased matrix plasticity due to the addition of rubber
particles appears to enhance the void growth mechanism around the silica particles,
possibly being responsible for the observed additive toughening. The hybrid
composites also allow for the detrimental effects of rubber on the yield strength and
thermal expansion to be offset by the beneficial contributions from the silica. The
inability to observe synergistic toughening is most like due to the weak particle-matrix
interfacial strength, resulting in less effective debonding mechanism as opposed to a
pinning/bridging mechanism.
5 RECOMMENDATIONS FOR FUTURE WORK
5.1 Toughening Mechanism Contributions/KIC Modelling
As discussed above, complete fracture toughness modelling was not able to be
completed during this study. As a result, the contributions of individual toughening
mechanisms to fracture toughness of the hybrid systems were never quantified. The
positive particle interactions observed in certain hybrid systems leads to the question

77
of what toughening contributions are responsible for the resulting fracture toughness.
In addition, the ability of the highly filled hybrid systems to retain high KIC values
with decreasing plastic zone sizes would be an interesting result to quantify. A
qualitative explanation to the toughening contributions has been proposed based on
SEM micrographs of fracture surfaces, but the ability to quantify those results are of
particular interest. A detailed study on the matrix dilation and its effect on fracture
toughness as a function of filler content is proposed as a method for evaluating
toughening contributions at high filler loadings.
5.2 Increasing Plastic Zone Size
It is still of interest to observe a true synergistic toughening effect in these
hybrid systems. A possible solution is to manipulate the effective plastic zone sizes by
varying rubber to silica ratio’s to determine an optimal concentration. As discussed
throughout this study, synergistic toughening effects have been observed, but typically
at low filler loadings and high rubber contents. It would be interesting to evaluate the
rubber to silica ratio as a means to determine the point where negative particle
interactions occur, represented by a shrinking plastic zone size and consequently
preventing synergistic toughening effects.
5.3 Silica Particle Size Effect
A particle size effect has regularly been observed in the literature. This size
effect has shown to be imperative in the toughening effects of additive particles in an
epoxy matrix. Namely, the observed toughening mechanisms in a system are largely
dependent of particle-matrix interactions, and consequently largely dependent on
particle size. It is of interest to determine if a particle size effect is observed in this

78
particular epoxy system. The rubber particles in this study have proven to be superior
toughening agents. The rigid silica particles showed minimal toughening
contributions, however. It is proposed that varied particle sizes or bimodal particle
distributions may alter the toughening mechanisms observed in the presence of the
silica particles, possibly leading to more effective pinning/bridging mechanisms. This
particle size effect is also of great interest for the hybrid epoxy systems, and its
possibility on improving additive or synergistic toughening characteristics.
5.4 Particle-Matrix Adhesion
Similar to the particle size effect, toughening mechanisms are also largely
dependent of particle-matrix interactions, namely adhesion. It has been found in the
literature that a weak particle-matrix interface tends to result in a relatively ineffective
particle matrix debonding and void growth mechanism, as was observed in this study.
Conversely, strong particle-matrix adhesion tends to lead towards much more effective
crack tip pinning and bridging mechanisms. Silica surface treatments are a common
way to enhance the particle-matrix adhesion of a system, and are therefore proposed as
a means to improve fracture toughness of these studied epoxy systems by invoking
crack pinning/bridging mechanisms.

79
6 REFERENCES
[1] "Flip Chip," Wikipedia.
[2] D. C. Chiang, Underfill Material Selection for Flip Chip Technology, Massachusetts Institute of
Technology, 1997.
[3] W. J. Roesch, "Cycling copper flip chip interconnects," Microelectronics Reliablity, vol. 44, pp.
1047-1054, 2004.
[4] J. Qu and C. Wong, "Effective Elastic Modulus of Underfill Material for Flip Chip
Applications," IEEE TRANSACTIONS ON COMPONENTS AND PACKAGING
TECHNOLOGIES, vol. 25, no. 1, pp. 53-55, 2002.
[5] R. Pearson and Y. Liang, "Tougheing Mechanisms in Epoxy-Silica Nanocomposites (ESNs),"
Polymer, vol. 50, pp. 4895-4905, 2009.
[6] P. Dittanet, "Effect of Silica Nanoparticle Size on Toughening Mechanisms of Filled Epoxy,"
Polymer, vol. 53, pp. 1890-1905, 2012.
[7] T. Kawaguchi and R. Pearson, "The effect of particle-matrix adhesion on the mechanical
behavior of glass filled epoxies. Part 2. A study on fracture toughness".
[8] P. Dittanet, "FRACTURE BEHAVIOR OF SILICA NANOPARTICLE FILLED EPOXY
RESIN," Lehigh University, Bethlehem, PA, 2011.
[9] A. Evans, S. Williams and P. Beaumont, "On the Toughness of Particulate Filled Polymers,"
Journal of Materials Science, vol. 20, pp. 3668-3674, 1985.
[10] K.-F. Lin and Y.-D. Shieh, "Core-Shell Particles Designed for Toughening the Epoxy Resins. II.
Core-Shell-Particle-Toughened Epoxy Resins," Journal of Applied Polymer Science, vol. 70, pp.
2313-2322, 1998.
[11] Y. Liang and R. Pearson, "The Toughening Mechanism in Hybrid Epoxy-Silica-Rubber
nanocomposites (HESRNs)," Polymer, vol. 51, pp. 4880-4890, 2010.
[12] H. Azimi, R. Pearson and R. Hertzberg, "Fatigue of Hybrid Composites: Epoxies Containing
Rubber and Hollow Glass Spheres," Polymer Engineering and Science, vol. 36, no. 18, pp. 2352-
2365, 1996.
[13] L. Manzione and J. Gillham, "Rubber Modified Epoxies. II. Morphology and Mechanical
Properties," Journal of Applied Polymer Science, vol. 26, no. 3, pp. 907-919, 2003.
[14] T.-H. Ho and C.-S. Wang, "Modification of Epoxy Resins with Polysiloxane Thermoplasyic
Polyurethane for Electronic Encapsulation: 1," Polymer, vol. 37, no. 13, pp. 2733-2742, 1996.
[15] T. Kawaguchi and R. Pearson, "The effect of particle-matrix adhesion on the mechanical
behavior of glass filled epoxies: Part 1. A study on yield behavior and cohesive strength,"
Polymer, vol. 44, pp. 4229-4238, 2003.
[16] F. N. Ahmad and M. Jaafar, "Effect of particle shape of silica mineral on the properties of epoxy
composites," Composutes Science and Technology, vol. 68, pp. 346-353, 2008.
[17] J. Spanoudakis and R. Young, "Crack propagation in a glass particle-filled epoxy resin," J.
Mater. Sci., vol. 19, p. 473, 1984.
[18] A. Moloney, H. Kausch, T. Kaiser and H. Beer, "Parameters determining the strength and

80
toughness of particulate filled epoxide resins," Journal of Materials Science, vol. 22, no. 2, pp.
381-393, 1987.
[19] C. Bucknall and A. Gilbert, Polym. Eng. Sci.,, vol. 26, p. 54, 1986.
[20] R. Pearson and A. Yee, Polymer, vol. 34, p. 3658, 1993.
[21] B. Caldwell and A. Yee, Am. Chem. Soc., Polym. Mater. Sci. Eng. Prep., vol. 70, p. 254, 1994.
[22] F. McGarry and A. Willner, Am. Chem. Soc., Org. Coat. Plast. Chem. Prept, vol. 28, p. 512,
1968.
[23] K. C. Jajam and H. V. Tippur, "Quasi-Static and Dynamic Fracture Behavior of Particulate
Polymer Composites: A study of nano- vs. micro-size filler and loading-rate effects,"
Composites: Part B, vol. 43, pp. 3467-3481, 2012.
[24] T. Kawaguchi and R. Pearson, "The moisture effect on the fatigue crack growth of glass particle
and fiber reinforced epoxies with strong and weak bonding conditions Part 2. A microscopic
study on toughening mechanism," Composites Science and Technology, vol. 64, pp. 1991-2007,
2004.
[25] A. Kinloch, "The Fracture of Hybrid-Particulate Composites.," Journal of Materials Science ,
vol. 20, pp. 4169-4184, 1985.
[26] J. Lee and A. Yee, Polymer Science and Engineering, vol. 40, no. 12, pp. 2457-2470, 2000.
[27] J. Lee and A. Yee, Polymer, vol. 42, p. 577, 2001.
[28] B. Johnsen, A. Kinloch, R. Mohammed, A. Taylor and S. SPrenger, Polymer, vol. 48, pp. 530-
541, 2007.
[29] L. Rose, "Int J Fract," vol. 31, pp. 233-242, 1986.
[30] F. Lange, Phil. Mag, vol. 22, p. 983, 1971.
[31] H. Azimi, R. Pearson and R. Hertzberg, "Role of Crack Tip Sheilding Mechanisms in Fatigue of
Hybrid Epoxy Composites Containing Rubber and Solid Glass Spheres," Journal of Applied
Polymer Science, vol. 58, pp. 449-463, 1995.
[32] H. Zhang, Z. Zhang, K. Friendrich and C. Eger, Acta Mater, vol. 54, pp. 1833-1842, 2006.
[33] R. S. Kody and A. J. Lesser, "Yield Behavior and Energy Absorbing Characteristics of Rubber-
Modified Epoxies Subjected to Biaxial Stress States," Polymer Composites, vol. 20, no. 2, pp.
250-259, 1999.
[34] S. Wu, J. Appl. Polym. Sci, vol. 35, p. 549, 1988.
[35] A. Yee and R. Pearson, J. Mater. Sci., vol. 21, p. 2462, 1986.
[36] Y. Huang and A. Kinloch, "Modelling of the toughening mechanisms in rubber-modified epoxy
polymers," Journal of Materials Science, vol. 27, pp. 2753-2762, 1992.
[37] Y. Huang and A. Kinloch, "Moedlling of the toughening mechanisms in rubber-modified epoxy
polymers. Part II A quantitative description of the microstructure-fracture property
relationships.," Journal of Materials Science, vol. 27, pp. 2763-2769, 1992.
[38] B. Budiansky, J. Amazigo and A. Evans, J. Mech. Phys. Solids, vol. 36, p. 167, 1988.
[39] A. Evans, Z. Ahmad, D. Gilbert and P. Beamount, Acta Metall, vol. 34, p. 79, 1986.
[40] R. Pearson, A. Smith and A. Yee, in 2nd Inter. Conf. on Defor. & Frac. of Comp, Manchester,
U.K., 1993.
[41] M. DiBerardino and R. Pearson, "The Effect of Particle Size on Synergistic Toughening of Boron

81
Nitride-Rubber Hybrid Epoxy Composites," in Toughening of Plastics, Washington, D.C.,
American Chemical Society, 200, pp. 213-229.
[42] D. J. Sober, "Thermoset Resin Formulators Association," 2007. [Online]. Available:
http://www.trfa.org/erc/docretrieval/uploadedfiles/Technical%20Papers/2007%20Meeting/Sober-
Kaneka_ppt-Toughening%20of%20Resins.pdf. [Accessed 1 November 2013].
[43] ASTM, D792-08: Standard Test Methods for Density and Specific Gravity (Relative Density) of
Plastics by displacement., West Conshohocken, PA: ASTM.
[44] ASTM, E831-12: Standard Test Method for Linear Thermal Expansion of Solid Materials by
Thermomechanical Analysis, West Conshohocken, PA: ASTM.
[45] ASTM, ASTM D695-10: Standard Test Methods for Compressive Properties of Rigid Plastics,
West Conshohocken, PA: ASTM.
[46] ASTM, ASTM D5045-99: Standard Test Methods for Plane Strain Fracture Toughness and
Strain Enery Release Rate of Plastic Materials, West Conshohocken, PA: ASTM.
[47] C. Hsieh and W. Tuan, Materials Science and Engineering A, pp. 453-458, 2007.
[48] R. Sudduth, "Analysis of the Maximum Tensile Strength of a Composite with Spherical
Particulates," Journal of Composites, vol. 40, pp. 301-331, 2006.
[49] M. Piggot, "Short-Fiber Polymer Composites - A Fracture-Based Theory of Fiber
Reinforcement," Journal of Composite Materials, vol. 28, no. 7, pp. 588-606, 1994.
[50] "Soda-Lime-Glass," MakeItFrom.com, 2009. [Online]. Available:
http://www.makeitfrom.com/material-data/?for=Soda-Lime-Glass. [Accessed 13 12 2013].
[51] "Polybutadiene - Properties, Applications, Processing, and Types of Polybutadiene," The A to Z
of Materials, [Online]. Available: http://www.azom.com/properties.aspx?ArticleID=1719.
[Accessed 13 12 2013].
[52] H. Kitagawa, R. Yuuki and T. Ohira, Eng. Fract. Mech., vol. 7, p. 515, 1975.
[53] Q. Yao and J. Qu, Electronic Packaging 124, 2002.
[54] R. Tummala, E. Rymanszewski and A. Klopfenstein, in Microelectronics Packaging Handbook,
Springer, 1997.

82
VITA
Daniel Wesley Davies was born in May of 1990 to Joyce and Horace Davies in
Scranton, PA. He attended Abington Heights High School, and graduated in 2008.
He then attended Alfred University, obtaining his B.S in Materials Science and
Engineering in May of 2012, graduating with High Honors in the Area of
Specialization. Daniel went on to attend Lehigh University in the fall of 2012, and
graduated in January 2013 with his M.S. in Materials Science and Engineering.