Embed Size (px)
Citation preview
Composites: Part A 66 (2014) 25–34
Contents lists available at ScienceDirect
Composites: Part A
journal homepage: www.elsevier .com/locate /composi tesa
Expanded graphite nanoplatelets as coupling agents in glass fiberreinforced polypropylene composites
http://dx.doi.org/10.1016/j.compositesa.2014.06.0161359-835X/� 2014 Elsevier Ltd. All rights reserved.
⇑ Corresponding author. Tel.: +39 0461 282452; fax: +39 0461 281977.E-mail address: [email protected] (A. Pegoretti).
Diego Pedrazzoli, Alessandro Pegoretti ⇑University of Trento, Department of Industrial Engineering and INSTM Research Unit, Via Mesiano 77, 38123 Trento, Italy
a r t i c l e i n f o a b s t r a c t
Article history:Received 16 December 2013Accepted 26 June 2014Available online 9 July 2014
Keywords:A. Polymer–matrix composites (PMCs)B. Interface/interphaseB. Fiber/matrix bondSingle-fiber fragmentation test (SFFT)
The interfacial adhesion between E-glass fibers and various types of nanomodified polypropylene (PP)matrices have been investigated on single-fiber model composites. In particular, an evaluation of thefiber–matrix interfacial shear strength was performed by the fragmentation tests on model compositesprepared by using PP matrices containing various amounts (up to 7 wt%) of expanded graphite nanoplat-elets (xGnP).
The presence of xGnP in the polymer matrix resulted in a remarkable increase of the interfacial shearstrength values (up to a factor of about 6 for a 7 wt% content of xGnP) if compared to neat PP. Moreover,wettability measurements in various liquids evidenced that the work of adhesion of the polymer matrixwith respect to glass fiber, was improved by the presence of xGnP.
� 2014 Elsevier Ltd. All rights reserved.
1. Introduction
It has been widely recognized that the fiber/matrix interfacialshear strength is one of the key factors determining the mechanicalproperties of fiber reinforced composite materials, in particular thefracture resistance parameters [1]. Concurrently, the interphaseregion often exhibits properties markedly deviating from those ofthe surrounding bulk matrix [1].
Polypropylene (PP) is one of the most widely used thermoplas-tic matrices for the production of glass fiber (GF) reinforced com-posites with excellent performance/cost ratio [2]. Due to thenon-polar nature of the matrix, interfacial adhesion is a criticalissue for PP/GF composites [3]. In fact, some of the available liter-ature data for uncoupled PP/GF composites, indicate that an inter-facial shear strength (ISS) values in the range 1–6 MPa can beconsidered [4–11]. In a recent study by Yang and Thomason [12],reporting a careful experimental research involving both fiberpull-out and microbond tests, a value in the range 3–4 MPa wasprovided.
According to the scientific literature, two main strategies havebeen adopted to improve the fiber/matrix adhesion in PP/glasscomposites: (i) the development of specific fiber sizings/coatings[4,5,7,8,10,11,13] and/or (ii) the incorporation of coupling agentsinto the PP matrix [7,8]. Both strategies showed a good capabilityto improve the fiber/matrix adhesion level.
For example, Thomason and Schoolenberg [10] observed thatthe use of silane coupling agents have only a slight effect on theimprovement of PP/GF interfacial shear strength. Moreover, theyexperimentally observed that full commercial coating formulationapplied to glass fibers is very important for the interface strength:variations of one order of magnitude in PP/GF adhesion wereobserved depending on the nature of the glass fiber coating.Etcheverry et al. [4,14] evidenced that a chemical anchoring ofthe PP matrix polymer on glass fibers by direct metallocenic poly-merization, may lead to an increase of the ISS with respect to theuntreated fibers by a factor of 2.1 [4]. On the other hand, Mäderand Freitag [7] proved that the bond strength in a PP/GF systemcan be significantly increased by modifications of the PP matrix,such as the addition of polypropylene grafted with acrylic acid orirradiation with electron beams.
Recent investigations demonstrated that nanoparticles homo-geneously dispersed in a polymer matrix [15–17] or localized atthe interfacial region [18–20] may also promote the fiber/matrixinterfacial adhesion in several types of fiber reinforced composites.
In a recent work of our group, it was shown how the addition ofboth non-functionalized and dimethyldichlorosilane-functional-ized silica nanoparticles led to a remarkable (up to a factor of about5) increase of the interfacial strength in the PP/GF system [21]. Theobserved effect was explained by considering that the presence ofsilica nanoparticles cause an increase of the work of adhesion ofpolypropylene with respect to glass, as proven by wettability testswith various liquids. Concurrently, with the incorporation ofnanoparticles an enhancement of the mechanical properties of
26 D. Pedrazzoli, A. Pegoretti / Composites: Part A 66 (2014) 25–34
the polymer matrix can be obtained [17] or specific functionalitiescan be attained [22].
There has been a recent increasing interest in thermoplasticmatrices modified with expanded graphite nanoplatelets (xGnP)[23,24]. Most of the research was focused on the preparationmethod and on the thermo-mechanical characterization, but noinvestigations can be found regarding the effect of the matrix mod-ification on the interfacial properties in fiber-reinforced structuralcomposites.
Therefore, the aim of this study is to investigate the possibilityto improve the adhesion between E-glass fibers and PP by dispers-ing xGnP in the polymer matrix.
2. Experimental section
2.1. Materials and samples preparation
The PP matrix used in this work was an isotactic homo-polypro-pylene matrix (code PPH-B-10-FB) produced by Polychim Industrie(Loon-Plage, France) and kindly provided by Lati Industria Termo-plastici (Varese, Italy). FUSABOND
�P M-613-05 maleic anhydride
modified polypropylene (PPgMA) was supplied by DuPont™ deNemours (Geneva, Switzerland).
Exfoliated graphite nanoplateletes xGnP�-M-5 have been sup-
plied by XG Sciences Inc. (East Lansing, USA). Details on the exfoli-ation process as well as on the morphology of xGnP can be foundelsewhere [25].
E-glass fibers (GFs), designed as RO99 P319, were supplied bySaint-GobainVetrotex (Vado Ligure, Italy) and used as-received.These GFs are indicated as treated with a proprietary silane basedcoupling agent specifically designed for polypropylene matrices.
Unfilled matrix was denoted as PP, while nanocomposites weredesignated indicating the matrix, the compatibilizer (if any) withits content, the filler and its amount. For instance, a sample filledwith 5 wt% of PPgMA and 5 wt% of xGnP was indicated as PP-PPgMA-5-xGnP-5.
Square sheets (thickness of around 0.7 mm) of PP-xGnP, PP-PPgMA and PP-PPgMA-xGnP were prepared by melt mixing in aThermo Haake internal mixer (temperature = 190 �C, rotorspeed = 50 rpm, time = 10 min) followed by compression mouldingin a Carver laboratory press (temperature = 190 �C, pressur-e = 0.76 MPa, time = 10 min). Thin (70–80 lm) matrix films usedfor the preparation of the microcomposites for the fragmentationtest were obtained by a further hot pressing stage (tempera-ture = 200 �C, pressure = 3.4 MPa, time = 10 min).
2.2. Testing methods
2.2.1. Filler characterizationDensity measurements were carried out by an helium pycnom-
eter (Micromeritics� Accupyc 1330, Norcross USA), at a tempera-ture of 23 �C, using a testing chamber of 3.5 cm3. Surface areaand porosity measurements were performed utilizing an ASAP
�
2010 Accelerated Surface Area and Porosimetry machine (Norcross,USA) referring to the nitrogen gas physisorption process, setting asaturation pressure of 738.57 mmHg and a bath temperature of77.35 K.
The morphology of expanded graphite platelets was observed atvarious magnifications by using a Zeiss Supra 40 (Berlin, Germany)field emission scanning electron microscope (FESEM), at an accel-eration voltage of 5 kV.
2.2.2. Single fiber fragmentation testsMicrocomposite samples were prepared by the following proce-
dure. About 10 fibers were aligned between two films of the
selected PP system, sandwiched between two Mylar�
sheets (thick-ness of 0.5 mm) and two aluminum plates. The mold was placed ina vacuum oven at a temperature of 165 �C and at a pressure ofabout 10 kPa for about 20 min and then it was let to cool in air.The specimens were obtained by cutting strips containing one sin-gle fiber longitudinally aligned in the centerline. The microcom-posites dimensions were roughly 0.18 mm in thickness, 5 mm inwidth and 25 mm in length. Single fiber fragmentation tests (SFFT)tests were performed at room temperature by using a custom-made apparatus represented by a small tensile tester (Minimat,by Polymer Laboratories) placed under a polarized optical stereo-microscope (Wild M3Z by Leica). Tests were performed at a strainrate of 0.05 mm�1. At least five specimens were tested for eachsample. All samples were loaded up to a strain of 10% in order toreach the saturation of the fragmentation process. The mean fiberlength at saturation, Ls, was measured by means of an image ana-lyzer system ImageJ v.1.46a on optical pictures taken under polar-ized light. According to Ohsawa et al. [26], the fiber critical length,Lc, was considered equal to 4/3 Ls.
2.2.3. Surfaces energetics and roughnessThe wettability of the matrix samples and the glass fiber was
measured by contact angle measurements with two differentliquids: water as a polar liquid (milli-Q grade, surface tensionc1 = 72.8 mN m�1, polar component of surface tension c1
p = 50.7 mNm�1, dispersive component of surface tension c1
d = 22.1 mN m�1,polarity X1
p = c1p/c1 = 0.7), and ethylene glycol as a non-polar
liquid (surface tension c2 = 48.0 mN m�1, polar component of sur-face tension c2
p = 19.0 mN m�1, dispersive component of surfacetension c2
d = 29.0 mN m�1, polarity X2p = c2
p/c2 = 0.4) [27].The total surface tension (ctot) can be factorized by considering
two additive terms: the dispersive surface tension (cd) and thepolar surface tension (cp):
ctot ¼ cd þ cp ð1Þ
The estimation of the surface tension components of matrices withvarious compositions was done through the geometric mean [27]on the basis of vibration induced equilibrium contact angles (VIECA)[28] measured in both test liquids by a modified Wilhelmy tech-nique. Surface tension components of glass fiber were estimatedreferring to the advancing contact angles measured by Wilhelmytechnique and applying the geometric mean. Knowing the surfacetension components of the adherends, the work of adhesion wasevaluated using the harmonic mean (Wa
h) equation, applicable topredict interactions between low-energy materials [27]:
Wha ¼ 4
cd1cd
2
cd1 þ cd
2
þ cp1c
p2
cp1 þ cp
2
� �ð2Þ
and the geometric mean (Wag) equation, more suitable to describe
interactions between low-energy and high-energy materials:
Wga ¼ 2
ffiffiffiffiffiffiffiffiffifficd
1cd2
qþ
ffiffiffiffiffiffiffiffiffifficp
1cp2
q� �ð3Þ
where the superscripts d and p refer to the dispersive and polarcomponents, respectively, while subscripts 1 and 2 refer to thetwo solids in contact (polymer and glass fiber), respectively.
The roughness of the samples was determined by a Wave Sys-tem rugosimeter (Hommelwerke Waveline GmbH, Villingen-Sch-wenningen, Germany) scanning a 15 mm line at a speed of0.50 mm min�1. At least three measurements were performedper each sample on the same specimens previously adopted forthe estimation of the contact angle. The ANOVA analysis was car-ried out on the means of Ra and Rmax at a significance level of 5%.
D. Pedrazzoli, A. Pegoretti / Composites: Part A 66 (2014) 25–34 27
2.2.4. Composite characterizationCryogenic fracture surfaces of unfilled PP and PP nanocompos-
ites were observed at various magnifications by using a Zeiss Supra40 (Berlin, Germany) field emission scanning electron microscope(FESEM), at acceleration voltages between 2.5 and 4 kV.
Transmission electron microscopy (TEM) technique wasadopted to analyze cryocut surfaces of PP nanocomposites. A Phi-lips
�EM 400 T (Amsterdam, Netherlands) transmission electron
microscope, was used at an acceleration voltage of 80 kV. Thin sec-tion of PP nanocomposites were ultramicrotomed at a temperatureof �100 �C by using a cryo-ultramicrotome.
X-ray diffraction (XRD) analysis was performed by a Rigaku 3DMax X-ray diffractometer operating at the Cu Ka wavelength(0.154056 nm), scanning the samples in a 2h range between 3�and 67� at a 2h step of 0.05�.
Solid-state 13C NMR experiments were carried out through aBruker 300 WB instrument (Bruker Biospin, Italy) operating at aproton frequency of 300.13 MHz. High resolution experiments,characterized by cross polarization with magic angle spinningand variable contact time technique (VCT-MAS), were performedoperating at a 13C resonance frequency of 75.48 MHz. The spectrawere acquired with a 5 s recycle delay, decoupling length 6.2 lsand 200 scans. The samples were packed in 4 mm zirconia rotors,which were spun at 6.5 kHz under air flow. Adamantane was usedas external secondary reference. The relaxation times TCH (cross-polarization rate constant) and TH
1q (13C spin–lattice relaxationtime) were determined indirectly by the profile decay of allresolved carbon nuclei with the increase of contact-time, whichwas established in a range varying from 200 to 9000 ls. In partic-ular, intensity signal profiles M(t) were fitted to a one-componentequation, assuming that all carbons were in similar motionaldomains, in according to Eq. (4).
MðtÞ ¼ M0 exp � t
TH1q
!exp 1� t
TCH
� �ð4Þ
where M0 is a normalization factor. The two relaxation timesobtained from NMR experiments can be directly related to themobility of the carbons being observed. Low mobility (higher heter-ogeneity) generally results in shorter TCH and longer TH
1q values,while a mobility increases (e.g. with increasing amorphous phaseor homogeneous character of the material) leads to larger TCH andsmaller TH
1q values. However, since the fitting was not satisfactoryin the case of some samples, the decay curve was fitted by a double-exponential function, in according to Eq. (5).
MðtÞ ¼ M0 exp � t
TH1q
!þ exp � t
TH2q
!" #1� exp 1� t
TCH
� �� �
ð5Þ
where TH1q and TH
2q represent the long and short spin–lattice relax-ation times, respectively [29]. The latter equation is generally usedto describe relaxation phenomena in materials showing highly het-erogeneous distribution of the filler within the matrix or phaseseparation.
Differential scanning calorimetry (DSC) tests were carried outby a Mettler DSC30 differential scanning calorimeter under a con-stant nitrogen flow of 100 ml min�1. The samples were first heatedto 200 �C at a rate of 10 �C min�1 and held for 5 min in order toerase any previous thermal history. Crystallization tests with cool-ing rates of 10 �C min�1 down to 0 �C were carried out. A subse-quent heating scan was performed at 10 �C�min�1. The meltingenthalpy of 100% crystalline isotactic PP has been considered asDH0 = 209 J g�1 [30]. Moreover, the crystallinity vc of nanocompos-ite samples was calculated by taking the weight fraction of PP andPPgMA in the composite into account. The melting temperatures
Tm1 and Tm2 were recorded during the first and second heatingscan, respectively. The crystallization enthalpy DHc was measuredby integrating the heat flow curve during cooling scan.
Thermogravimetric analysis (TGA) was carried out through aQ5000 IR thermogravimetric analyzer (TA Instruments-WatersLLC, New Castle, USA) imposing a temperature ramp between 40and 700 �C at a heating rate of 10 �C min�1 under a constant nitro-gen flow of 25 ml min�1. The onset of degradation temperature(Td,onset) was determined by the point of intersection of tangentsto two branches of the thermogravimetric curve, while the maxi-mum rate of degradation temperature (Td,max) was determinedfrom the peak maxima in the first derivative of weight loss curve.
Uniaxial tensile tests were performed with an Instron�
4502(Norwood, USA) tensile machine on samples of at least five ISO527 type 1BA specimens. The tests were carried out at a crossheadspeed of 0.25 mm min�1 up to a maximum axial deformation of 1%.The strain was recorded by using a resistance extensometerInstron
�model 2620-601 with a gage length of 12.5 mm. The elas-
tic modulus was measured as secant modulus between deforma-tion levels of 0.05% and 0.25% in according to ISO 527 standard.Uniaxial tensile properties, such as stress at yield (ry), stress atbreak (rb) and strain at break (eb) were determined at an highercrosshead speed (5 mm min�1) without extensometer.
Creep tests were performed utilizing a dynamic mechanicalanalyzer DMA Q800 (TA Instruments-Waters LLC, New Castle,USA) applying a constant stress (r0) of 3 MPa for 3600 s at 30 �C.Rectangular samples 25 mm long, 5 mm wide and 0.20 mm thickwere used, adopting a gage length of 11.5 mm. The creep compli-ance D(t), computed as the ratio between the strain and the creepstress, was plotted against the time for the different samples.Dynamic mechanical analyses (DMA) were carried out at a DMAQ800 testing machine over a temperature range between �20 �Cand 160 �C, imposing a heating rate of 3 �C/min and a frequencyof 1 Hz. A preload of 0.2 MPa and a maximum strain of 0.05%was imposed on rectangul samples 25 mm long, 5 mm wide and0.20 mm thick. The most important viscoelastic functions (E0, E0 0,tand) were recorded at different temperatures.
3. Results and discussion
3.1. Filler characterization
The filler density, obtained through helium pycnometry,resulted to be 1.851 ± 0.018 g cm�3. At least 300 measuring cycleswere needed in order to reach a constant density value, probablydue to packaging and agglomeration of the lamellae which highlyhinder the diffusion of helium molecules.
The BET (Brunauer–Emmett–Teller) [31] surface area, calcu-lated from the interpolation of the linear part of the adsorptioncurve in the plot reporting the adsorbed nitrogen volume versusthe relative pressure, corresponded to 32.3 ± 0.1 m2 g�1. The spe-cific surface area appears quite low when compared to that ofother graphite types [32], probably due to the difficult diffusionof nitrogen molecules through graphite packages andagglomerates.
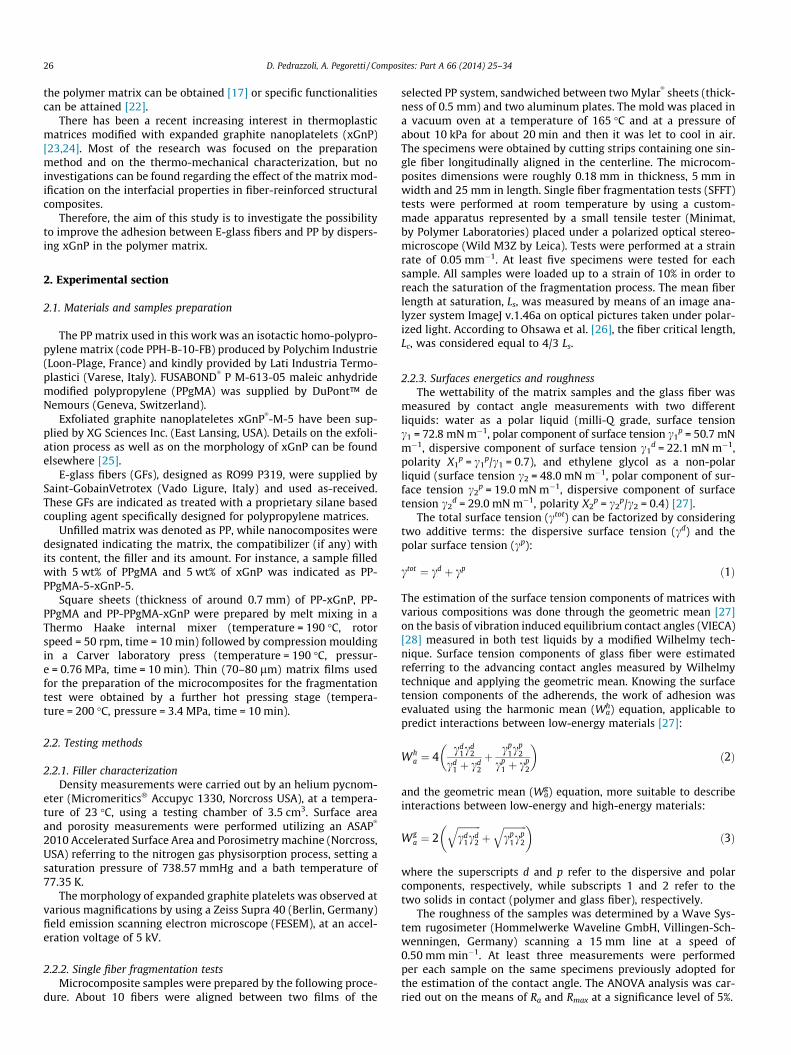
Fig. 1 shows the SEM micrographs of xGnP nanoplatelets, char-acterized by packages of several sheets with average diameteraround 5 lm. Each package is constituted by layers less than20 nm thick, with a spacing between layers less than 100 nm.
3.2. Interfacial shear strength evaluation
As reported in a previous work of this group [21], the Weibullstrength distribution of the E-glass fibers is characterized bya shape factor m = 5.7 and a scale factor r0 = 3609 MPa (at a
Fig. 1. ESEM images of expanded graphite nanoplatelets. (For interpretation of thereferences to color in this figure legend, the reader is referred to the web version ofthis article.)
28 D. Pedrazzoli, A. Pegoretti / Composites: Part A 66 (2014) 25–34
reference length of 15 mm), while the elastic modulus, estimatedin accordance with the standard ASTM C 1557-03, is equal to63 ± 5 GPa.
The average saturation length of the fiber fragments as mea-sured in the single fiber fragmentation tests is reported in Table 1,along with the ISS values estimated according to classical micro-mechanical models proposed the Kelly–Tyson (ISSK–T) [33] or theCox (ISSCOX) [34] models.
According to the Kelly–Tyson approach the average value of ISSis the result of the static equilibrium between the tensile force act-ing on a fiber and the shear force transferred through the fiber–matrix interface:
ISS ¼rfbðLcÞd
2Lcð6Þ
where d is the fiber diameter and rfb(Lc) is the tensile strength of afiber at the critical length Lc, which was computed on the basis ofthe Weibull distribution as:
rfbðLcÞ ¼ r0LL0
� ��1m
C 1þ 1m
� �ð7Þ
where C is the Gamma function, while r0 and m are the scale andshape parameters of the Weibull distribution, respectively.
On the other hand, the traditional shear-lag model is developedunder the following assumptions: (i) perfectly elastic and isotropicbehavior for matrix and fiber, (ii) proportionality between
Table 1ISS values in according to Kelly–Tyson (ISSK–T) and Cox (ISSCOX) models and mechanical p
Sample Ls (mm) ISSK–T (MPa) ISSCOX (M
PP 4.47 ± 0.31 2.7 ± 0.2 3.2 ± 0.6PP-PPgMA-5 1.20 ± 0.21 15.2 ± 2.7 8.9 ± 1.5PP-PPgMA-10 0.97 ± 0.36 20.2 ± 2.5 13.9 ± 1.1PP-xGnP-1 2.24 ± 0.29 6.7 ± 0.9 5.7 ± 1.2PP-xGnP-3 1.46 ± 0.23 11.8 ± 1.2 9.9 ± 1.5PP-xGnP-5 1.20 ± 0.11 15.3 ± 1.3 12.8 ± 1.7PP-xGnP-7 1.14 ± 0.20 16.4 ± 1.8 13.8 ± 2.1PP-PPgMA-5-xGnP-5 0.59 ± 0.09 39.0 ± 5.7 27.9 ± 2.1
Ls: Mean fragment length at saturation.ISSK–T: ISS values in according to Kelly–Tyson approach.ISSCOX: ISS values in according to Cox model.G/GPP: Shear modulus normalized with respect to that of PP.E: Tensile modulus.rbr: Tensile strength at break.ebr: Elongation at break.
interfacial shear force and the difference between the displace-ment in the matrix and the displacement that would exist if thefiber were absent, (iii) perfect bonding between matrix and fiber,(iv) same lateral stiffness of fiber and matrix, and (v) no residualstresses. Furthermore, the stress is taken as uniform through aradial section of fiber, and the stress is entirely transferred frommatrix to fiber by shear at the interface. The axial stress rf in thefiber can thus be written as:
rf ¼ Ef ef 1� cosh bzð ÞcoshðbtÞ
� �ð8Þ
where ef is the far-field applied strain, Ef is the elastic modulus ofthe fiber, z is the axial coordinate, t is the fiber half-length, whileb shear-lag parameter is defined as:
b ¼ffiffiffiffiffiffiffiffiffiffiffiffiffi
H
pR2f Ef
sð9Þ
With
H ¼ pEm
ð1þ tmÞ ln RmRf
� � ð10Þ
where Em and mm are the matrix elastic modulus and Poisson’s ratio,while Rm and Rf are the matrix and fiber radii, respectively. Theinterfacial shear stress profile s(z) can be calculated:
sðzÞ ¼ Ef ef Rf b2
sinhðbzÞsinhðbtÞ
� �ð11Þ
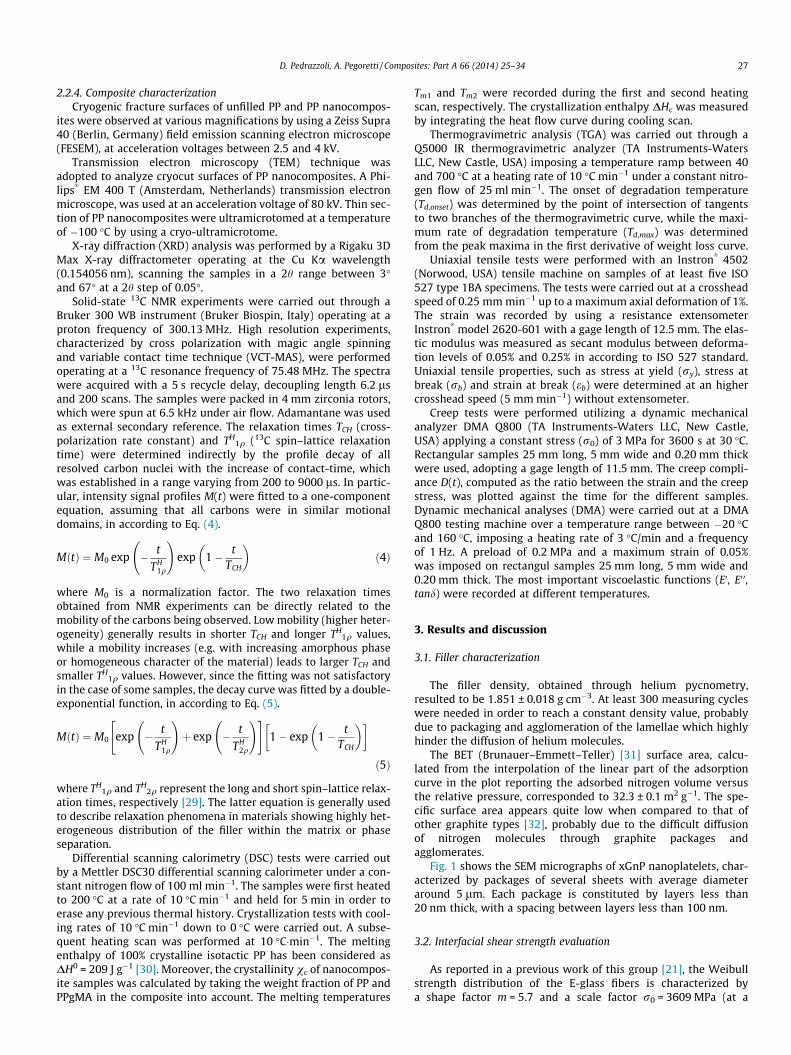
It is clear that the addition of PPgMA, xGnP or a combination of bothadditives produces a sharp decrease of the saturation length and,consequently, an enhancement of the ISS values computed accord-ing to both models. Specifically, ISSK–T values obtained by applyingthe Kelly–Tyson model are plotted in Fig. 2a as a function of the per-centage of PPgMA or xGnP for all the investigated samples. Asalready shown in a previous work of our group, when the PPgMAcompatibilizer is added, ISS values considerably increase withrespect to the case of neat PP/GF sample [21]. It is interesting tonote that comparable improvements can be reached by the additionof graphite nanoplatelets. However, when comparing systems withtotal weight composition of 10%, the ternary composite PP-PPgMA-5-xGnP-5 exhibits remarkably higher ISSK–T than PP-PPgMA-10,probably thanks to the better filler dispersion and synergistic effect.
The ISSCOX values have been also estimated in accordance to Coxmodel by assuming a concentric cylindrical geometry. The matrixPoisson’s ratio, necessary for the implementation of Cox model,was measured on unfilled PP (mm = 0.458) by using two extensom-eters (axial and transversal) mounted on ISO527 1B specimens
arameters (E, rbr and ebr) as measured from tensile tests.
Pa) G/GPP E (MPa) rbr (MPa) ebr (%)
1.00 1546 ± 24 35.0 ± 0.1 16.8 ± 0.31.12 1729 ± 31 34.5 ± 0.6 13.3 ± 0.71.07 1648 ± 12 33.6 ± 0.5 12.1 ± 0.61.15 1786 ± 34 33.3 ± 0.2 13.5 ± 0.41.22 1891 ± 64 31.5 ± 0.1 10.2 ± 0.51.31 2020 ± 77 31.5 ± 0.4 9.4 ± 0.31.44 2222 ± 404 31.3 ± 0.1 8.1 ± 0.31.98 3058 ± 114 33.5 ± 2.3 7.1 ± 1.0
Fig. 2. ISS values according to (a) Kelly–Tyson and (b) to the Cox’s models. (c) ISSfor GF/PP matrices in according to Kelly–Tyson model, as function of thethermodynamic work of adhesion Wa calculated using the harmonic (open point)and the geometric (full point) mean equation. (s,d) PP, (h,j) PP-PPgMA, (4,N) PP-xGnP, (},�) PP-PPgMA-5-xGnP-5. The trend lines describe the linear fittingoperated on each group.
D. Pedrazzoli, A. Pegoretti / Composites: Part A 66 (2014) 25–34 29
produced by injection moulding. Relative ISSCOX values, i.e. nor-malized over the value obtained for neat PP (ISSPP-COX), are plottedin Fig. 2b as a function of the relative shear modulus of the matrix.
It is interesting to observe that ISSCOX exhibits a significativeincrease with the matrix stiffness for all samples. Furthermore,PP-xGnP nanocomposites exhibits a slightly higher increase of ISSwhen compared to PP-PPgMA systems. However, the ternary com-posite PP-PPgMA-5-xGnP-5 displays relative ISS values remarkablyhigher than PP-PPgMA-10, probably because of the greatermechanical reinforcement (see Table 1).
Moreover, according to the Cox shear lag model, the observedincrease in the stress transfer ability of the interface could beexplained on the basis of the matrix stiffening effect caused bythe additives (both PPgMA and xGnP). Noteworthy, the samplesPP-PPgMA show values of relative ISS progressively increasingwith the PPgMA content even though the mechanical reinforce-ment of the samples with filler content higher than 5 wt% isdecreasing.
3.3. Surfaces energetics and roughness
Both the matrix and fiber surface tensions were calculated frommeasured equilibrium contact angles and from those values thethermodynamical work of adhesion (Wa) was computed and theobtained results are summarized in Table 2. The polar componentof the matrix surface tension (cp) increased considerably due to theaddition of PPgMA, probably due to the emersion of some hydro-philic maleic anhydride groups with high surface energy [35]. PP-xGnP systems show a similar increase in cp likely because of thesurface functionalization of the carbonaceous filler. The dispersivecomponent (cd) is slightly higher for all nanocomposites withrespect to unfilled PP and increases proportionally to the contentof PPgMA or xGnP.
As expected, values of work of adhesion (Wa) calculated usingthe geometric mean equation are higher then those calculatedfrom the harmonic mean equation [27]. The quantity Wa repre-sents the adhesion energy between solid phases, the higher thework of adhesion, the better the interfacial bonding between fiberand matrix. Wa values of PP-PPgMA blends and PP-xGnP nanocom-posites are much greater than that of unfilled PP (Table 2). How-ever, as already stated by Wojuzkij [36] a direct correlationbetween the work of adhesion and the mechanical adhesionparameters may not apply. In fact, micromechanical tests such asthe SFFT are characterized by non-equilibrium phenomena (suchas viscoelastic behavior and/or the fracture/yield phenomena ofthe polymer matrix). Nevertheless, in the present case a very goodcorrelation exists with the experimentally measured ISSK–T valuesand the work of adhesion (Fig. 2c). Also for ternary composites afurther increment in Wa values can be observed which correlateswell with the corresponding ISSK–T value.
Moreover, it is important to underline that the contribution ofsurface roughness to surface properties can be neglected and thedifferences measured through wettability tests can be mainlyattributed to surface chemistry. In fact, the roughness of the matrixfilms used in this work resulted in the range of Ra = 0.2 � 0.4 lm(Rmax = 2.5 � 3.6 lm) for all samples. The ANOVA analysis carriedout on the mean values of Ra and Rmax showed no statistically sig-nificative differences at a significance level of 5%.
3.4. Spectroscopic analyses
From the SEM micrographs of PP-xGnP-5 sample it can be seenthat aggregates of graphite nanopateletes appear quite well dis-tributed within the matrix (Fig. 3a), while most of the graphitepackages do not seem to be intercalated (Fig. 3c). The averagelength (L) and thickness (t) of aggregates is 9.5 ± 0.5 lm and0.5 ± 0.1 lm, respectively, with a correspondent aspect ratio (L/t)of 19.0 ± 3.9. The effect of the compatibilizer on the filler disper-sion can be noticed in the micrograph of PP-PPgMA-5-xGnP-5
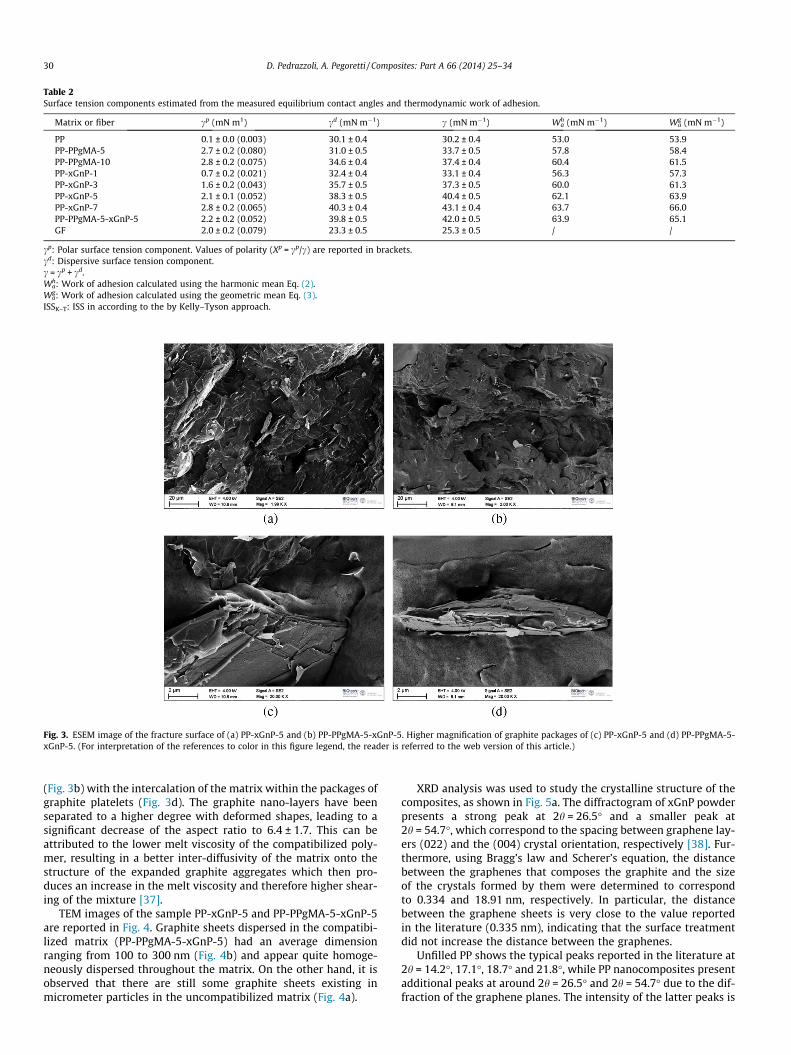
Table 2Surface tension components estimated from the measured equilibrium contact angles and thermodynamic work of adhesion.
Matrix or fiber cp (mN m1) cd (mN m�1) c (mN m�1) Wha (mN m�1) Wg
a (mN m�1)
PP 0.1 ± 0.0 (0.003) 30.1 ± 0.4 30.2 ± 0.4 53.0 53.9PP-PPgMA-5 2.7 ± 0.2 (0.080) 31.0 ± 0.5 33.7 ± 0.5 57.8 58.4PP-PPgMA-10 2.8 ± 0.2 (0.075) 34.6 ± 0.4 37.4 ± 0.4 60.4 61.5PP-xGnP-1 0.7 ± 0.2 (0.021) 32.4 ± 0.4 33.1 ± 0.4 56.3 57.3PP-xGnP-3 1.6 ± 0.2 (0.043) 35.7 ± 0.5 37.3 ± 0.5 60.0 61.3PP-xGnP-5 2.1 ± 0.1 (0.052) 38.3 ± 0.5 40.4 ± 0.5 62.1 63.9PP-xGnP-7 2.8 ± 0.2 (0.065) 40.3 ± 0.4 43.1 ± 0.4 63.7 66.0PP-PPgMA-5-xGnP-5 2.2 ± 0.2 (0.052) 39.8 ± 0.5 42.0 ± 0.5 63.9 65.1GF 2.0 ± 0.2 (0.079) 23.3 ± 0.5 25.3 ± 0.5 / /
cp: Polar surface tension component. Values of polarity (Xp = cp/c) are reported in brackets.cd: Dispersive surface tension component.c = cp + cd.Wh
a: Work of adhesion calculated using the harmonic mean Eq. (2).Wg
a: Work of adhesion calculated using the geometric mean Eq. (3).ISSK–T: ISS in according to the by Kelly–Tyson approach.
Fig. 3. ESEM image of the fracture surface of (a) PP-xGnP-5 and (b) PP-PPgMA-5-xGnP-5. Higher magnification of graphite packages of (c) PP-xGnP-5 and (d) PP-PPgMA-5-xGnP-5. (For interpretation of the references to color in this figure legend, the reader is referred to the web version of this article.)
30 D. Pedrazzoli, A. Pegoretti / Composites: Part A 66 (2014) 25–34
(Fig. 3b) with the intercalation of the matrix within the packages ofgraphite platelets (Fig. 3d). The graphite nano-layers have beenseparated to a higher degree with deformed shapes, leading to asignificant decrease of the aspect ratio to 6.4 ± 1.7. This can beattributed to the lower melt viscosity of the compatibilized poly-mer, resulting in a better inter-diffusivity of the matrix onto thestructure of the expanded graphite aggregates which then pro-duces an increase in the melt viscosity and therefore higher shear-ing of the mixture [37].
TEM images of the sample PP-xGnP-5 and PP-PPgMA-5-xGnP-5are reported in Fig. 4. Graphite sheets dispersed in the compatibi-lized matrix (PP-PPgMA-5-xGnP-5) had an average dimensionranging from 100 to 300 nm (Fig. 4b) and appear quite homoge-neously dispersed throughout the matrix. On the other hand, it isobserved that there are still some graphite sheets existing inmicrometer particles in the uncompatibilized matrix (Fig. 4a).
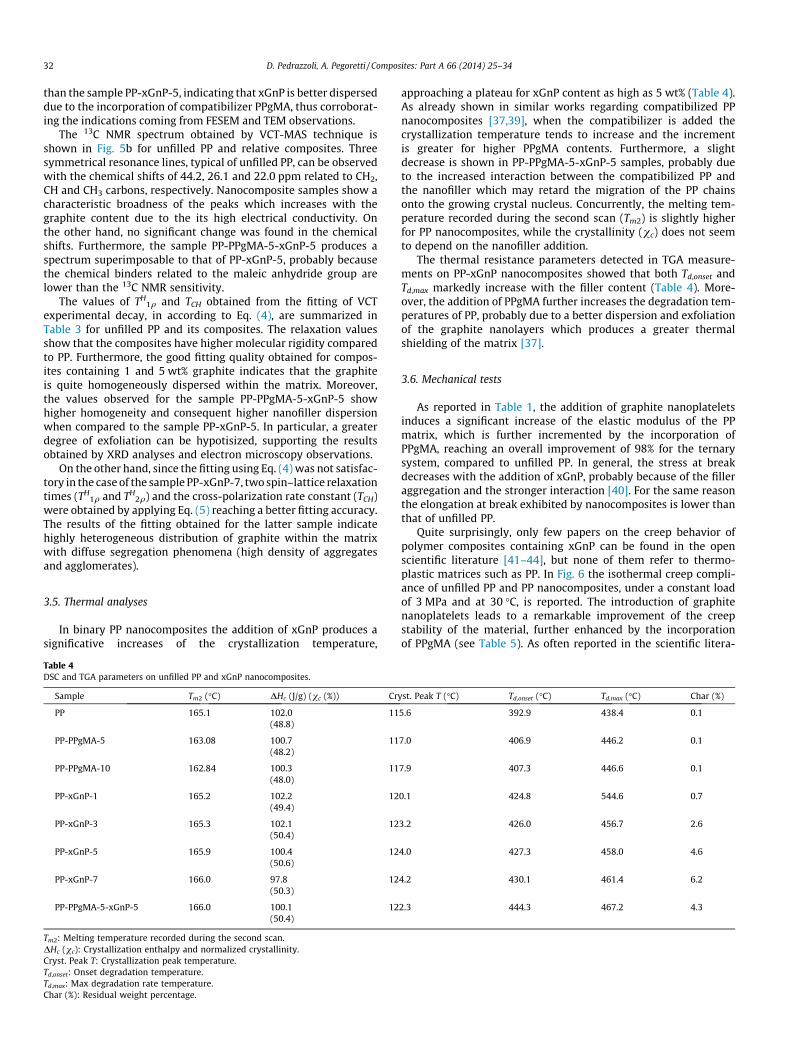
XRD analysis was used to study the crystalline structure of thecomposites, as shown in Fig. 5a. The diffractogram of xGnP powderpresents a strong peak at 2h = 26.5� and a smaller peak at2h = 54.7�, which correspond to the spacing between graphene lay-ers (022) and the (004) crystal orientation, respectively [38]. Fur-thermore, using Bragg’s law and Scherer’s equation, the distancebetween the graphenes that composes the graphite and the sizeof the crystals formed by them were determined to correspondto 0.334 and 18.91 nm, respectively. In particular, the distancebetween the graphene sheets is very close to the value reportedin the literature (0.335 nm), indicating that the surface treatmentdid not increase the distance between the graphenes.
Unfilled PP shows the typical peaks reported in the literature at2h = 14.2�, 17.1�, 18.7� and 21.8�, while PP nanocomposites presentadditional peaks at around 2h = 26.5� and 2h = 54.7� due to the dif-fraction of the graphene planes. The intensity of the latter peaks is
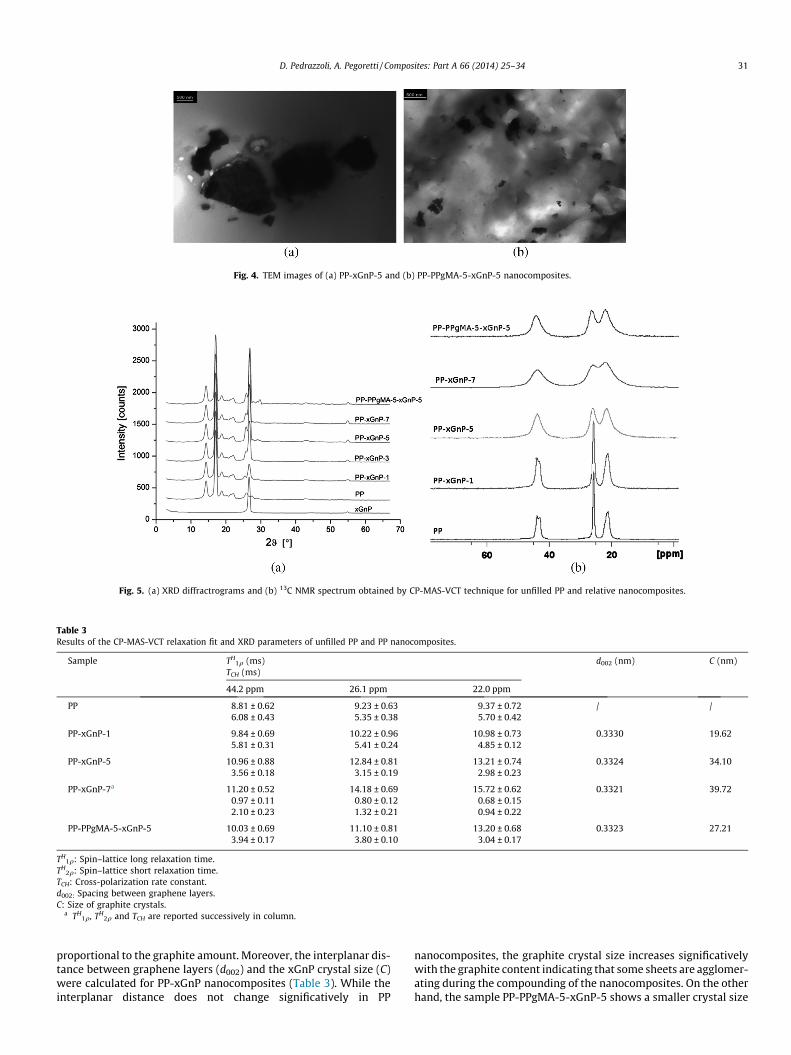
Fig. 4. TEM images of (a) PP-xGnP-5 and (b) PP-PPgMA-5-xGnP-5 nanocomposites.
Fig. 5. (a) XRD diffractrograms and (b) 13C NMR spectrum obtained by CP-MAS-VCT technique for unfilled PP and relative nanocomposites.
Table 3Results of the CP-MAS-VCT relaxation fit and XRD parameters of unfilled PP and PP nanocomposites.
Sample TH1q (ms) d002 (nm) C (nm)
TCH (ms)
44.2 ppm 26.1 ppm 22.0 ppm
PP 8.81 ± 0.62 9.23 ± 0.63 9.37 ± 0.72 / /6.08 ± 0.43 5.35 ± 0.38 5.70 ± 0.42
PP-xGnP-1 9.84 ± 0.69 10.22 ± 0.96 10.98 ± 0.73 0.3330 19.625.81 ± 0.31 5.41 ± 0.24 4.85 ± 0.12
PP-xGnP-5 10.96 ± 0.88 12.84 ± 0.81 13.21 ± 0.74 0.3324 34.103.56 ± 0.18 3.15 ± 0.19 2.98 ± 0.23
PP-xGnP-7a 11.20 ± 0.52 14.18 ± 0.69 15.72 ± 0.62 0.3321 39.720.97 ± 0.11 0.80 ± 0.12 0.68 ± 0.152.10 ± 0.23 1.32 ± 0.21 0.94 ± 0.22
PP-PPgMA-5-xGnP-5 10.03 ± 0.69 11.10 ± 0.81 13.20 ± 0.68 0.3323 27.213.94 ± 0.17 3.80 ± 0.10 3.04 ± 0.17
TH1q: Spin–lattice long relaxation time.
TH2q: Spin–lattice short relaxation time.
TCH: Cross-polarization rate constant.d002: Spacing between graphene layers.C: Size of graphite crystals.
a TH1q, TH
2q and TCH are reported successively in column.
D. Pedrazzoli, A. Pegoretti / Composites: Part A 66 (2014) 25–34 31
proportional to the graphite amount. Moreover, the interplanar dis-tance between graphene layers (d002) and the xGnP crystal size (C)were calculated for PP-xGnP nanocomposites (Table 3). While theinterplanar distance does not change significatively in PP
nanocomposites, the graphite crystal size increases significativelywith the graphite content indicating that some sheets are agglomer-ating during the compounding of the nanocomposites. On the otherhand, the sample PP-PPgMA-5-xGnP-5 shows a smaller crystal size
32 D. Pedrazzoli, A. Pegoretti / Composites: Part A 66 (2014) 25–34
than the sample PP-xGnP-5, indicating that xGnP is better disperseddue to the incorporation of compatibilizer PPgMA, thus corroborat-ing the indications coming from FESEM and TEM observations.
The 13C NMR spectrum obtained by VCT-MAS technique isshown in Fig. 5b for unfilled PP and relative composites. Threesymmetrical resonance lines, typical of unfilled PP, can be observedwith the chemical shifts of 44.2, 26.1 and 22.0 ppm related to CH2,CH and CH3 carbons, respectively. Nanocomposite samples show acharacteristic broadness of the peaks which increases with thegraphite content due to the its high electrical conductivity. Onthe other hand, no significant change was found in the chemicalshifts. Furthermore, the sample PP-PPgMA-5-xGnP-5 produces aspectrum superimposable to that of PP-xGnP-5, probably becausethe chemical binders related to the maleic anhydride group arelower than the 13C NMR sensitivity.
The values of TH1q and TCH obtained from the fitting of VCT
experimental decay, in according to Eq. (4), are summarized inTable 3 for unfilled PP and its composites. The relaxation valuesshow that the composites have higher molecular rigidity comparedto PP. Furthermore, the good fitting quality obtained for compos-ites containing 1 and 5 wt% graphite indicates that the graphiteis quite homogeneously dispersed within the matrix. Moreover,the values observed for the sample PP-PPgMA-5-xGnP-5 showhigher homogeneity and consequent higher nanofiller dispersionwhen compared to the sample PP-xGnP-5. In particular, a greaterdegree of exfoliation can be hypotisized, supporting the resultsobtained by XRD analyses and electron microscopy observations.
On the other hand, since the fitting using Eq. (4) was not satisfac-tory in the case of the sample PP-xGnP-7, two spin–lattice relaxationtimes (TH
1q and TH2q) and the cross-polarization rate constant (TCH)
were obtained by applying Eq. (5) reaching a better fitting accuracy.The results of the fitting obtained for the latter sample indicatehighly heterogeneous distribution of graphite within the matrixwith diffuse segregation phenomena (high density of aggregatesand agglomerates).
3.5. Thermal analyses
In binary PP nanocomposites the addition of xGnP produces asignificative increases of the crystallization temperature,
Table 4DSC and TGA parameters on unfilled PP and xGnP nanocomposites.
Sample Tm2 (�C) DHc (J/g) (vc (%)) Cry
PP 165.1 102.0 11(48.8)
PP-PPgMA-5 163.08 100.7 11(48.2)
PP-PPgMA-10 162.84 100.3 11(48.0)
PP-xGnP-1 165.2 102.2 12(49.4)
PP-xGnP-3 165.3 102.1 12(50.4)
PP-xGnP-5 165.9 100.4 12(50.6)
PP-xGnP-7 166.0 97.8 12(50.3)
PP-PPgMA-5-xGnP-5 166.0 100.1 12(50.4)
Tm2: Melting temperature recorded during the second scan.DHc (vc): Crystallization enthalpy and normalized crystallinity.Cryst. Peak T: Crystallization peak temperature.Td,onset: Onset degradation temperature.Td,max: Max degradation rate temperature.Char (%): Residual weight percentage.
approaching a plateau for xGnP content as high as 5 wt% (Table 4).As already shown in similar works regarding compatibilized PPnanocomposites [37,39], when the compatibilizer is added thecrystallization temperature tends to increase and the incrementis greater for higher PPgMA contents. Furthermore, a slightdecrease is shown in PP-PPgMA-5-xGnP-5 samples, probably dueto the increased interaction between the compatibilized PP andthe nanofiller which may retard the migration of the PP chainsonto the growing crystal nucleus. Concurrently, the melting tem-perature recorded during the second scan (Tm2) is slightly higherfor PP nanocomposites, while the crystallinity (vc) does not seemto depend on the nanofiller addition.
The thermal resistance parameters detected in TGA measure-ments on PP-xGnP nanocomposites showed that both Td,onset andTd,max markedly increase with the filler content (Table 4). More-over, the addition of PPgMA further increases the degradation tem-peratures of PP, probably due to a better dispersion and exfoliationof the graphite nanolayers which produces a greater thermalshielding of the matrix [37].
3.6. Mechanical tests
As reported in Table 1, the addition of graphite nanoplateletsinduces a significant increase of the elastic modulus of the PPmatrix, which is further incremented by the incorporation ofPPgMA, reaching an overall improvement of 98% for the ternarysystem, compared to unfilled PP. In general, the stress at breakdecreases with the addition of xGnP, probably because of the filleraggregation and the stronger interaction [40]. For the same reasonthe elongation at break exhibited by nanocomposites is lower thanthat of unfilled PP.
Quite surprisingly, only few papers on the creep behavior ofpolymer composites containing xGnP can be found in the openscientific literature [41–44], but none of them refer to thermo-plastic matrices such as PP. In Fig. 6 the isothermal creep compli-ance of unfilled PP and PP nanocomposites, under a constant loadof 3 MPa and at 30 �C, is reported. The introduction of graphitenanoplatelets leads to a remarkable improvement of the creepstability of the material, further enhanced by the incorporationof PPgMA (see Table 5). As often reported in the scientific litera-
st. Peak T (�C) Td,onset (�C) Td,max (�C) Char (%)
5.6 392.9 438.4 0.1
7.0 406.9 446.2 0.1
7.9 407.3 446.6 0.1
0.1 424.8 544.6 0.7
3.2 426.0 456.7 2.6
4.0 427.3 458.0 4.6
4.2 430.1 461.4 6.2
2.3 444.3 467.2 4.3
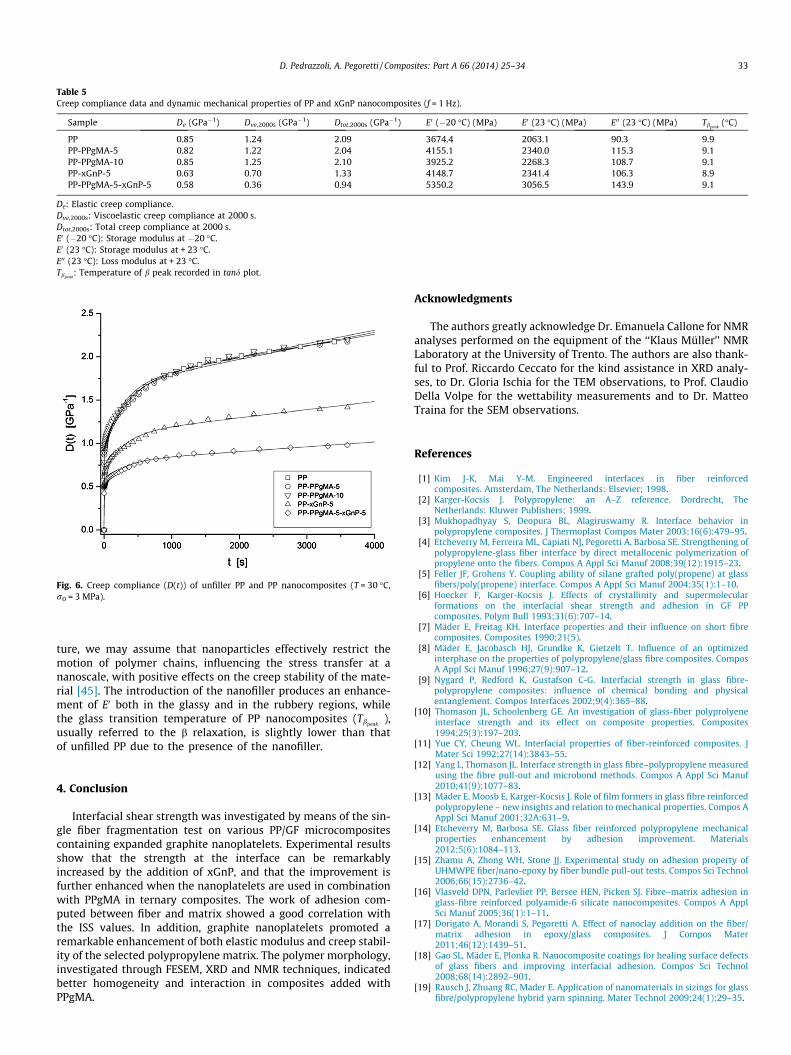
Fig. 6. Creep compliance (D(t)) of unfiller PP and PP nanocomposites (T = 30 �C,r0 = 3 MPa).
Table 5Creep compliance data and dynamic mechanical properties of PP and xGnP nanocomposites (f = 1 Hz).
Sample De (GPa�1) Dve,2000s (GPa�1) Dtot,2000s (GPa�1) E0 (�20 �C) (MPa) E0 (23 �C) (MPa) E00 (23 �C) (MPa) Tbpeak(�C)
PP 0.85 1.24 2.09 3674.4 2063.1 90.3 9.9PP-PPgMA-5 0.82 1.22 2.04 4155.1 2340.0 115.3 9.1PP-PPgMA-10 0.85 1.25 2.10 3925.2 2268.3 108.7 9.1PP-xGnP-5 0.63 0.70 1.33 4148.7 2341.4 106.3 8.9PP-PPgMA-5-xGnP-5 0.58 0.36 0.94 5350.2 3056.5 143.9 9.1
De: Elastic creep compliance.Dve,2000s: Viscoelastic creep compliance at 2000 s.Dtot,2000s: Total creep compliance at 2000 s.E0 (�20 �C): Storage modulus at �20 �C.E0 (23 �C): Storage modulus at + 23 �C.E00 (23 �C): Loss modulus at + 23 �C.Tbpeak
: Temperature of b peak recorded in tand plot.
D. Pedrazzoli, A. Pegoretti / Composites: Part A 66 (2014) 25–34 33
ture, we may assume that nanoparticles effectively restrict themotion of polymer chains, influencing the stress transfer at ananoscale, with positive effects on the creep stability of the mate-rial [45]. The introduction of the nanofiller produces an enhance-ment of E0 both in the glassy and in the rubbery regions, whilethe glass transition temperature of PP nanocomposites (Tbpeak
),usually referred to the b relaxation, is slightly lower than thatof unfilled PP due to the presence of the nanofiller.
4. Conclusion
Interfacial shear strength was investigated by means of the sin-gle fiber fragmentation test on various PP/GF microcompositescontaining expanded graphite nanoplatelets. Experimental resultsshow that the strength at the interface can be remarkablyincreased by the addition of xGnP, and that the improvement isfurther enhanced when the nanoplatelets are used in combinationwith PPgMA in ternary composites. The work of adhesion com-puted between fiber and matrix showed a good correlation withthe ISS values. In addition, graphite nanoplatelets promoted aremarkable enhancement of both elastic modulus and creep stabil-ity of the selected polypropylene matrix. The polymer morphology,investigated through FESEM, XRD and NMR techniques, indicatedbetter homogeneity and interaction in composites added withPPgMA.
Acknowledgments
The authors greatly acknowledge Dr. Emanuela Callone for NMRanalyses performed on the equipment of the ‘‘Klaus Müller’’ NMRLaboratory at the University of Trento. The authors are also thank-ful to Prof. Riccardo Ceccato for the kind assistance in XRD analy-ses, to Dr. Gloria Ischia for the TEM observations, to Prof. ClaudioDella Volpe for the wettability measurements and to Dr. MatteoTraina for the SEM observations.
References
[1] Kim J-K, Mai Y-M. Engineered interfaces in fiber reinforcedcomposites. Amsterdam, The Netherlands: Elsevier; 1998.
[2] Karger-Kocsis J. Polypropylene: an A–Z reference. Dordrecht, TheNetherlands: Kluwer Publishers; 1999.
[3] Mukhopadhyay S, Deopura BL, Alagiruswamy R. Interface behavior inpolypropylene composites. J Thermoplast Compos Mater 2003;16(6):479–95.
[4] Etcheverry M, Ferreira ML, Capiati NJ, Pegoretti A, Barbosa SE. Strengthening ofpolypropylene-glass fiber interface by direct metallocenic polymerization ofpropylene onto the fibers. Compos A Appl Sci Manuf 2008;39(12):1915–23.
[5] Feller JF, Grohens Y. Coupling ability of silane grafted poly(propene) at glassfibers/poly(propene) interface. Compos A Appl Sci Manuf 2004;35(1):1–10.
[6] Hoecker F, Karger-Kocsis J. Effects of crystallinity and supermolecularformations on the interfacial shear strength and adhesion in GF PPcomposites. Polym Bull 1993;31(6):707–14.
[7] Mäder E, Freitag KH. Interface properties and their influence on short fibrecomposites. Composites 1990;21(5).
[8] Mäder E, Jacobasch HJ, Grundke K, Gietzelt T. Influence of an optimizedinterphase on the properties of polypropylene/glass fibre composites. ComposA Appl Sci Manuf 1996;27(9):907–12.
[9] Nygard P, Redford K, Gustafson C-G. Interfacial strength in glass fibre-polypropylene composites: influence of chemical bonding and physicalentanglement. Compos Interfaces 2002;9(4):365–88.
[10] Thomason JL, Schoolenberg GE. An investigation of glass-fiber polyprolyeneinterface strength and its effect on composite properties. Composites1994;25(3):197–203.
[11] Yue CY, Cheung WL. Interfacial properties of fiber-reinforced composites. JMater Sci 1992;27(14):3843–55.
[12] Yang L, Thomason JL. Interface strength in glass fibre–polypropylene measuredusing the fibre pull-out and microbond methods. Compos A Appl Sci Manuf2010;41(9):1077–83.
[13] Mäder E, Moosb E, Karger-Kocsis J. Role of film formers in glass fibre reinforcedpolypropylene – new insights and relation to mechanical properties. Compos AAppl Sci Manuf 2001;32A:631–9.
[14] Etcheverry M, Barbosa SE. Glass fiber reinforced polypropylene mechanicalproperties enhancement by adhesion improvement. Materials2012;5(6):1084–113.
[15] Zhamu A, Zhong WH, Stone JJ. Experimental study on adhesion property ofUHMWPE fiber/nano-epoxy by fiber bundle pull-out tests. Compos Sci Technol2006;66(15):2736–42.
[16] Vlasveld DPN, Parlevliet PP, Bersee HEN, Picken SJ. Fibre–matrix adhesion inglass-fibre reinforced polyamide-6 silicate nanocomposites. Compos A ApplSci Manuf 2005;36(1):1–11.
[17] Dorigato A, Morandi S, Pegoretti A. Effect of nanoclay addition on the fiber/matrix adhesion in epoxy/glass composites. J Compos Mater2011;46(12):1439–51.
[18] Gao SL, Mäder E, Plonka R. Nanocomposite coatings for healing surface defectsof glass fibers and improving interfacial adhesion. Compos Sci Technol2008;68(14):2892–901.
[19] Rausch J, Zhuang RC, Mader E. Application of nanomaterials in sizings for glassfibre/polypropylene hybrid yarn spinning. Mater Technol 2009;24(1):29–35.
34 D. Pedrazzoli, A. Pegoretti / Composites: Part A 66 (2014) 25–34
[20] Gao X, Jensen RE, McKnight SH, Gillespie JW. Effect of colloidal silica on thestrength and energy absorption of glass fiber/epoxy interphases. Compos AAppl Sci Manuf 2011;42(11):1738–47.
[21] Pedrazzoli D, Pegoretti A. Silica nanoparticles as coupling agents forpolypropylene/glass composites. Compos Sci Technol 2013;76:77–83.
[22] Pedrazzoli D, Dorigato A, Pegoretti A. Monitoring the mechanical behaviourunder ramp and creep conditions of electrically conductive polymercomposites. Compos A Appl Sci Manuf 2012;43:1285–92.
[23] Kalaitzidou K, Fukushima H, Drzal LT. Multifunctional polypropylenecomposites produced by incorporation of exfoliated graphite nanoplatelets.Carbon 2007;45(7):1446–52.
[24] Kalaitzidou K, Fukushima H, Drzal LT. A new compounding method forexfoliated graphite–polypropylene nanocomposites with enhanced flexuralproperties and lower percolation threshold. Compos Sci Technol2007;67(10):2045–51.
[25] Fukushima H. Graphite nanoreinforcements in polymer nanocomposites, Ph.D.thesis. East Lansing, MI, USA: Michigan State University; 2003.
[26] Ohsawa T, Nakayama A, Miwa M, Hasegawa A. Temperature dependence ofcritical fiber length for glass fiber-reinforced thermosetting resins. J ApplPolym Sci 1978;22(11):3203–12.
[27] Wu S. Polymer interface and adhesion. New York: Marcel Dekker, Inc.; 1982.[28] Della Volpe C, Siboni S. A ‘conveyor belt’ model for the dynamic contact angle.
Eur J Phys 2011;32(4):1019–32.[29] Schroeder PA, Pruett RJ. Fe ordering in kaolinite: insights from 29Si and 27AI
MAS NMR spectroscopy. Am Mineral 1996;81:26–38.[30] James E. Polymer data handbook. New York: Oxford University Press; 1999.[31] Brunauer S, Emmett PH, Teller E. Adsorption of gases in multimolecular layers,
vol. 60. Bureau of Chemistry and Soils and George Washington University;1938. p. 309–19.
[32] Kim H, Abdala AA, Macosko CW. Graphene/polymer nanocomposites.Macromolecules 2010;43(16):6515–30.
[33] Tyson WR, Kelly A. Tensile properties of fibre-reinforced metals: copper/tungsten and copper/molybdenum. J Mech Phys Solids 1965;13(6):329–38.
[34] Cox H. The elasticity and strength of paper and other fibrous materials. Br JAppl Phys 1952;3:72–9.
[35] Garbassi F, Morra M, Occhiello E. Polymer surfaces: from physics totechnology. New York: John Wiley & Sons Ltd.; 1998.
[36] Wojuzkij SS. Uber das Fehlen einer Korrelation zwisehen der AdMision undBenetzung yon Substraten dureh das Polymere Adhaisiv. Polymere1966;214(2):97–100.
[37] Mirzazadeh H, Katbab AA, Hrymak AN. The role of interfacial compatibilizationupon the microstructure and electrical conductivity threshold inpolypropylene/expanded graphite nanocomposites. Polym Adv Technol2011;22(6):863–9.
[38] Shang S. A high-luminescence fringelike field emission from screen-printedcarbon nanotube and zinc oxide composite film. J Electromagn Anal Appl2010;02(12):649–53.
[39] Vladimirov V, Betchev C, Vassiliou A, Papageorgiou G, Bikiaris D. Dynamicmechanical and morphological studies of isotactic polypropylene/fumed silicananocomposites with enhanced gas barrier properties. Compos Sci Technol2006;66(15):2935–44.
[40] Bikiaris DN, Vassiliou A, Pavlidou E, Karayannidis GP. Compatibilisation effectof PP-g-MA copolymer on iPP/SiO2 nanocomposites prepared by melt mixing.Eur Polymer J 2005;41(9):1965–78.
[41] Pramanik B. Viscoelastic response of graphite platelet and CTBN reinforcedvinyl ester nanocomposites. Mater Sci Appl 2011;02(11):1667–74.
[42] Ahmad A, Gupta S, Mantena PR, Al-Ostaz A. Dynamic mechanical analysis ofgraphite platelet and nanocly reinforced vinyl ester and MWCNT reinforcednylon 6,6 nancomposites. Proceedings of 40th ISTC, Memphis, Tennessee;2008.
[43] King JA, Via MD, Morrison FA, Wiese KR, Beach EA, Cieslinski MJ, et al.Characterization of exfoliated graphite nanoplatelets/polycarbonatecomposites: electrical and thermal conductivity, and tensile, flexural, andrheological properties. J Compos Mater 2011;46(9):1029–39.
[44] Govindarajan S, NA L, GJ W. An experimental and theoretical study of creep ofa graphite/epoxy woven composite. Polym Compos 1996;17(3):353–61.
[45] Kolarik J, Pegoretti A. Non-linear tensile creep of polypropylene: time-strainsuperposition and creep prediction. Polymer 2006;47(1):346–56.


![Bond characteristics of steel fiber and deformed ...Open Engineering] Bond... · ded in steel fiber reinforced self-compacting concrete An overview of the practical applications](https://img.pdfslide.us/doc/110x75/5e7d0af137a05c25c847fa83/bond-characteristics-of-steel-iber-and-deformed-open-engineering-bond.jpg)