Embed Size (px)
Citation preview

CompNet firm-level based dataset: User guide for researchers 4th round of data collection
January 2016
Note: This User guide has been prepared by the CompNet team. Responsibility for any error is of the authors and not of the ECB or the EU system of Central Banks.
CompNet database User Guide, December 2015 1
Contents
1 Introduction to CompNet 4
2 Collection of data: micro-distributed approach 5
2.1 Data collection 5
2.2 Data sources 5
2.3 Confidentiality 6
2.4 Comparability 6
2.5 Deflators and PPPs 7
2.6 Treatment of outliers 7
3 Sample description and data preparation 9
3.1 Data span and dimension 9
3.2 Data coverage 11
3.3 Full and 20E samples 12
4 Caveats and limitations of the dataset 14
4.1 Construction limitation 14
4.2 Analysis of indicators over time 14
4.3 Comparison with National Accounts 15
4.4 Raw variable definition 15
4.5 Further data quality improvements 17
5 Variables available in the dataset 18
5.1 Productivity indicators 18
5.2 Financial indicators 26
5.3 Labour indicators 28
5.4 Markup indicators 30
5.5 Trade indicators 31
5.6 Joint distributions 33
6 How to use the database 35
CompNet database User Guide 2
General introduction to the datasets 35
6.1 The Descriptive section 37
6.2 The Productivity section 38
6.3 The Financial section 40
6.4 The Labour section 42
6.5 The Markup section 44
6.6 The Trade section 45
6.6.2 Additional trade statistics 47
6.6.3 Export performance 48
6.7 The joint distributions section 50
References 51
Annex 1. Country-specific breaks and biases 53
Annex 2. Sectors excluded 58
Annex 3. Raw variables 59
Annex 4. Deviation 60

CompNet database User Guide 3
CompNet database User Guide 4
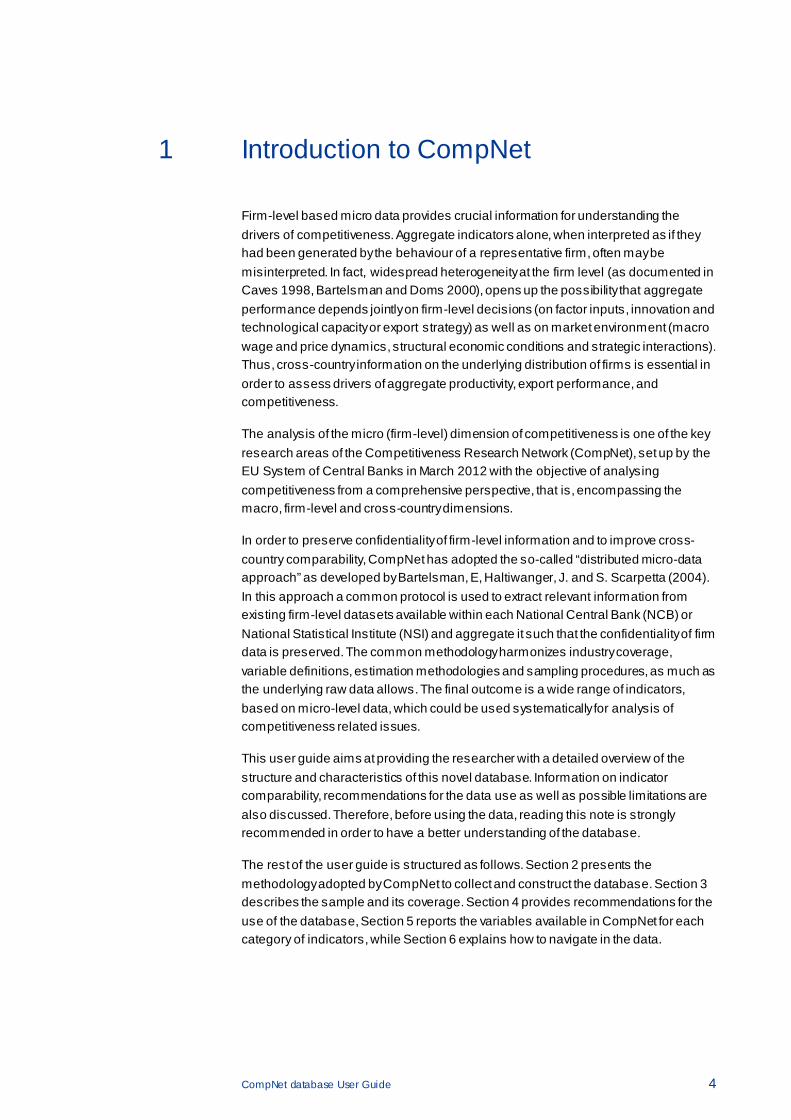
1 Introduction to CompNet
Firm-level based micro data provides crucial information for understanding the drivers of competitiveness. Aggregate indicators alone, when interpreted as if they had been generated by the behaviour of a representative firm, often may be misinterpreted. In fact, widespread heterogeneity at the firm level (as documented in Caves 1998, Bartelsman and Doms 2000), opens up the possibility that aggregate performance depends jointly on firm-level decisions (on factor inputs, innovation and technological capacity or export strategy) as well as on market environment (macro wage and price dynamics, structural economic conditions and strategic interactions). Thus, cross-country information on the underlying distribution of firms is essential in order to assess drivers of aggregate productivity, export performance, and competitiveness.
The analysis of the micro (firm-level) dimension of competitiveness is one of the key research areas of the Competitiveness Research Network (CompNet), set up by the EU System of Central Banks in March 2012 with the objective of analysing competitiveness from a comprehensive perspective, that is, encompassing the macro, firm-level and cross-country dimensions.
In order to preserve confidentiality of firm-level information and to improve cross-country comparability, CompNet has adopted the so-called “distributed micro-data approach” as developed by Bartelsman, E, Haltiwanger, J. and S. Scarpetta (2004). In this approach a common protocol is used to extract relevant information from existing firm-level datasets available within each National Central Bank (NCB) or National Statistical Institute (NSI) and aggregate it such that the confidentiality of firm data is preserved. The common methodology harmonizes industry coverage, variable definitions, estimation methodologies and sampling procedures, as much as the underlying raw data allows. The final outcome is a wide range of indicators, based on micro-level data, which could be used systematically for analysis of competitiveness related issues.
This user guide aims at providing the researcher with a detailed overview of the structure and characteristics of this novel database. Information on indicator comparability, recommendations for the data use as well as possible limitations are also discussed. Therefore, before using the data, reading this note is strongly recommended in order to have a better understanding of the database.
The rest of the user guide is structured as follows. Section 2 presents the methodology adopted by CompNet to collect and construct the database. Section 3 describes the sample and its coverage. Section 4 provides recommendations for the use of the database, Section 5 reports the variables available in CompNet for each category of indicators, while Section 6 explains how to navigate in the data.
CompNet database User Guide 5
2 Collection of data: micro-distributed approach
2.1 Data collection
Although the literature has long recognized that firm level data delivers crucial information about a wide range of phenomena, economic research based on these data has been so far hampered by issues of confidentiality and comparability. As a result, CompNet data collection process has been designed in such a way that both issues are resolved.
2.2 Data sources
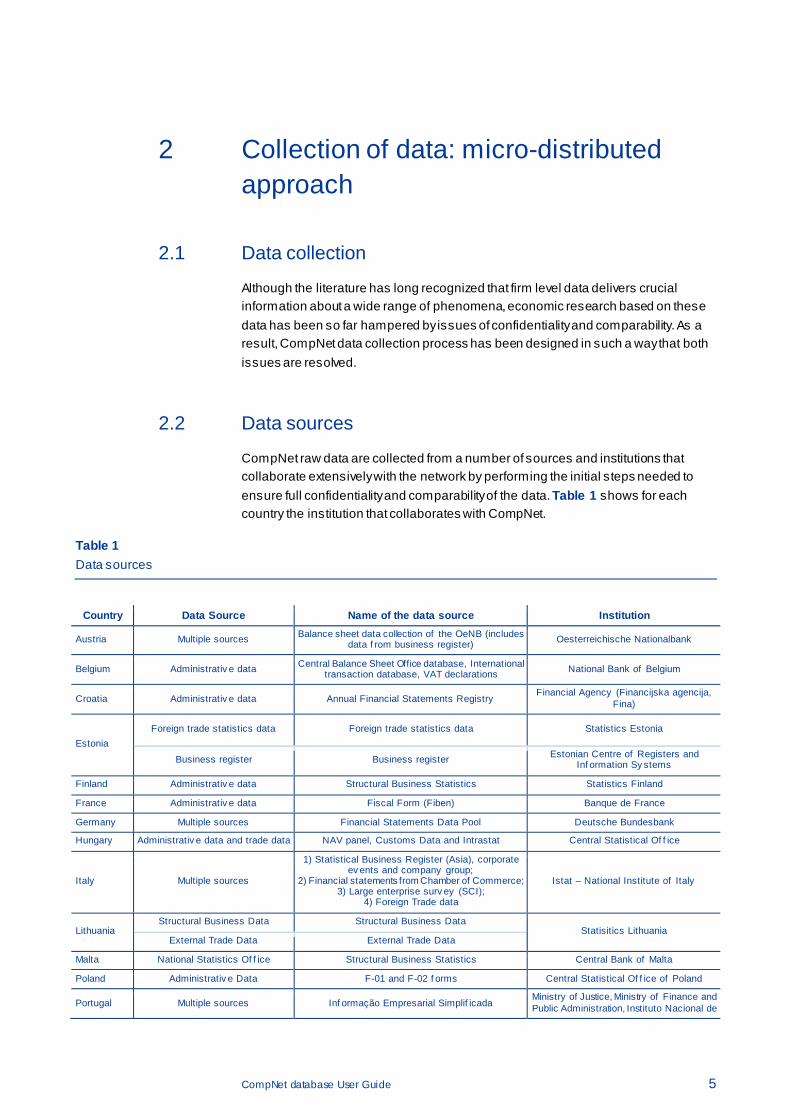
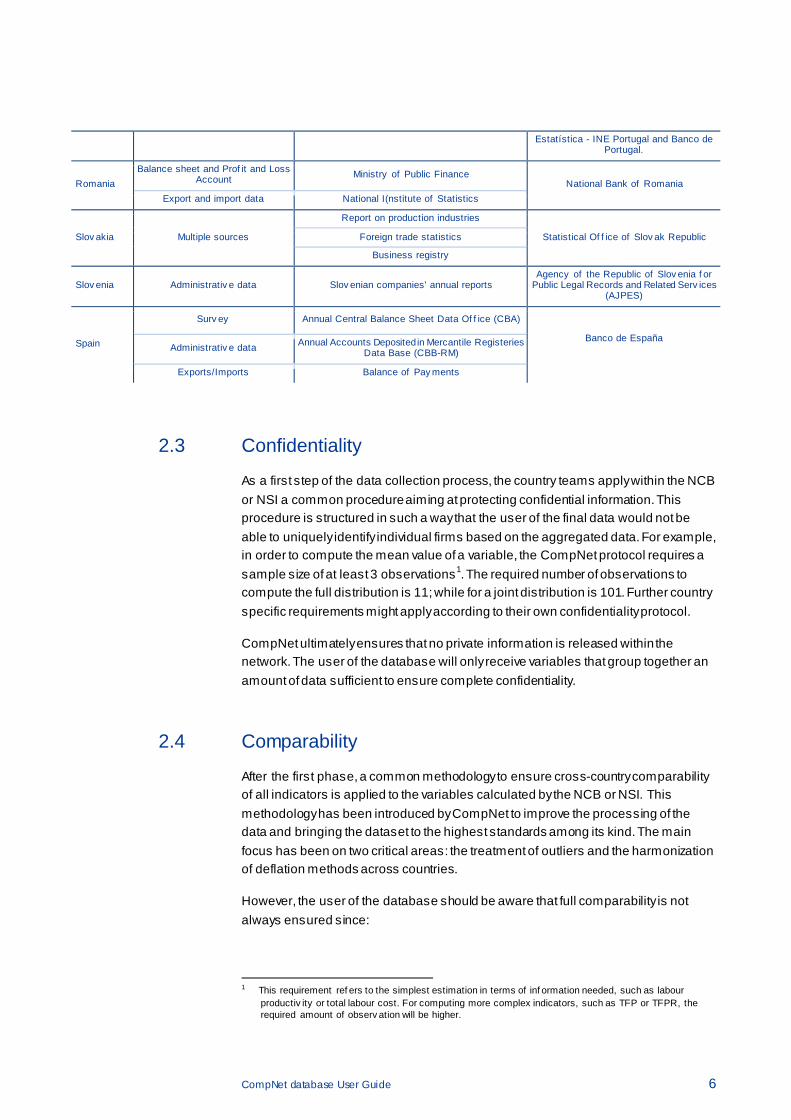
CompNet raw data are collected from a number of sources and institutions that collaborate extensively with the network by performing the initial steps needed to ensure full confidentiality and comparability of the data. Table 1 shows for each country the institution that collaborates with CompNet.
Table 1 Data sources
Country Data Source Name of the data source Institution
Austria Multiple sources Balance sheet data collection of the OeNB (includes data f rom business register) Oesterreichische Nationalbank
Belgium Administrativ e data Central Balance Sheet Office database, International transaction database, VAT declarations National Bank of Belgium
Croatia Administrativ e data Annual Financial Statements Registry Financial Agency (Financijska agencija,
Fina)
Estonia Foreign trade statistics data Foreign trade statistics data Statistics Estonia
Business register Business register Estonian Centre of Registers and Inf ormation Sy stems
Finland Administrativ e data Structural Business Statistics Statistics Finland
France Administrativ e data Fiscal Form (Fiben) Banque de France
Germany Multiple sources Financial Statements Data Pool Deutsche Bundesbank
Hungary Administrativ e data and trade data NAV panel, Customs Data and Intrastat Central Statistical Of f ice
Italy Multiple sources
1) Statistical Business Register (Asia), corporate ev ents and company group;
2) Financial statements from Chamber of Commerce; 3) Large enterprise surv ey (SCI);
4) Foreign Trade data
Istat – National Institute of Italy
Lithuania Structural Business Data Structural Business Data
Statisitics Lithuania External Trade Data External Trade Data
Malta National Statistics Of f ice Structural Business Statistics Central Bank of Malta
Poland Administrativ e Data F-01 and F-02 f orms Central Statistical Of f ice of Poland
Portugal Multiple sources Inf ormação Empresarial Simplif icada Ministry of Justice, Ministry of Finance and Public Administration, Instituto Nacional de
CompNet database User Guide 6
Estatística - INE Portugal and Banco de Portugal.
Romania Balance sheet and Prof it and Loss
Account Ministry of Public Finance National Bank of Romania
Export and import data National I(nstitute of Statistics
Slov akia Multiple sources
Report on production industries
Statistical Of f ice of Slov ak Republic Foreign trade statistics
Business registry
Slov enia Administrativ e data Slov enian companies' annual reports Agency of the Republic of Slov enia f or
Public Legal Records and Related Serv ices (AJPES)
Spain
Surv ey Annual Central Balance Sheet Data Of f ice (CBA)
Banco de España Administrativ e data Annual Accounts Deposited in Mercantile Registeries
Data Base (CBB-RM)
Exports/Imports Balance of Pay ments
2.3 Confidentiality
As a first step of the data collection process, the country teams apply within the NCB or NSI a common procedure aiming at protecting confidential information. This procedure is structured in such a way that the user of the final data would not be able to uniquely identify individual firms based on the aggregated data. For example, in order to compute the mean value of a variable, the CompNet protocol requires a sample size of at least 3 observations1. The required number of observations to compute the full distribution is 11; while for a joint distribution is 101. Further country specific requirements might apply according to their own confidentiality protocol.
CompNet ultimately ensures that no private information is released within the network. The user of the database will only receive variables that group together an amount of data sufficient to ensure complete confidentiality.
2.4 Comparability
After the first phase, a common methodology to ensure cross-country comparability of all indicators is applied to the variables calculated by the NCB or NSI. This methodology has been introduced by CompNet to improve the processing of the data and bringing the dataset to the highest standards among its kind. The main focus has been on two critical areas: the treatment of outliers and the harmonization of deflation methods across countries.
However, the user of the database should be aware that full comparability is not always ensured since:
1 This requirement ref ers to the simplest estimation in terms of inf ormation needed, such as labour
productiv ity or total labour cost. For computing more complex indicators, such as TFP or TFPR, the required amount of observ ation will be higher.
CompNet database User Guide 7
• Different institutions are in charge of gathering the data (National Central Banks, National Statistical Institutes, a third National Agency or under the joint responsibility of several institutions)2;
• There could be discrepancies in the definition of the target population (for instance Germany includes also some sole proprietorships);
• There could be different rules of exclusion to select the sample used to compute CompNet indicators3. For example, there could be differences in how countries define the size of firms like countries using the average number of employees over the year while some others using the number at the end of the year.
2.5 Deflators and PPPs
In order to produce real variables, the CompNet routine applies sector-specific deflators. Deflators are retrieved from NACE Rev.2, 2-digit level series on National Accounts by 64 branches from Eurostat, both in nominal and in real terms. Gross value added in millions of euros is expressed in current prices; real value added, measured in millions of euros and chain-linked with the base year 2005, is taken from the volume series. Since both series are already harmonized by Eurostat, the deflator values can be easily obtained by computing the ratio of both series. The same procedure is applied in order to obtain the country-level GDP deflators. The value added in each sector is then deflated with its corresponding sectorial deflator. Turnover, capital and intermediate inputs are deflated using the country-level GDP deflator.
Furthermore, in order to improve comparability across countries, the deflator series are adjusted by using country and sector specific value added PPPs. The latters are taken from the Groningen Growth and Development Centre productivity database for 19974.
2.6 Treatment of outliers
CompNet outlier cleaning is a multi-step procedure applied to ratios, as well as to the respective numerator and denominator. In detail, the cleaning algorithm works as follows:
1. First, if a given ratio is found to have an abnormal growth rate, it is replaced by a missing;
2. Subsequently, after identifying the reason for such an abnormal value, the corresponding numerator or the denominator is replaced with a missing.
2 Please ref er to Table 1 f or a detailed list of the institutions that are in charge of collecting the data used
within CompNet. 3 Please ref er to Section 3.2 f or a detailed analy sis of CompNet cov erage in comparison with Eurostat
and OECD database. 4 For f urther inf ormation see the GGDC database.
CompNet database User Guide 8
In a second step, any variable that has a ratio with capital or labour in the top or bottom 1% of observations in that sector and year is replaced with a missing.
The financial variables are also cleaned from outliers, following usual procedures in the financial literature5. Finally, several financial indicators are ratios that should theoretically lie within the interval between 0 and 1. They will be dropped if they do not satisfy this condition.
Further, the following cleaning rules are applied in all countries:
1. All observations with negative or zero labour costs, capital, value added, or turnover are replaced by missing values;
2. All firms with zero employees are dropped, considering therefore only the ones with at least one employee. This is done for two reasons. First, some countries report information on firms with at least one employee, whereas other countries have no reporting thresholds in place. Second, some countries replace missing information with a zero and there is no way to disentangle “true” zero-employee firms from missing data.
5 See Ferrando, et al. (2015).
CompNet database User Guide 9
3 Sample description and data preparation
3.1 Data span and dimension
Target populations are defined with few exceptions 6 in the same way across countries, aiming at nonfinancial corporations consistent with the definition of category S11 in the European System of Accounts (that is, excluding sole proprietors). However, as highlighted in Section 2.4, some minor discrepancies in the target population remain.
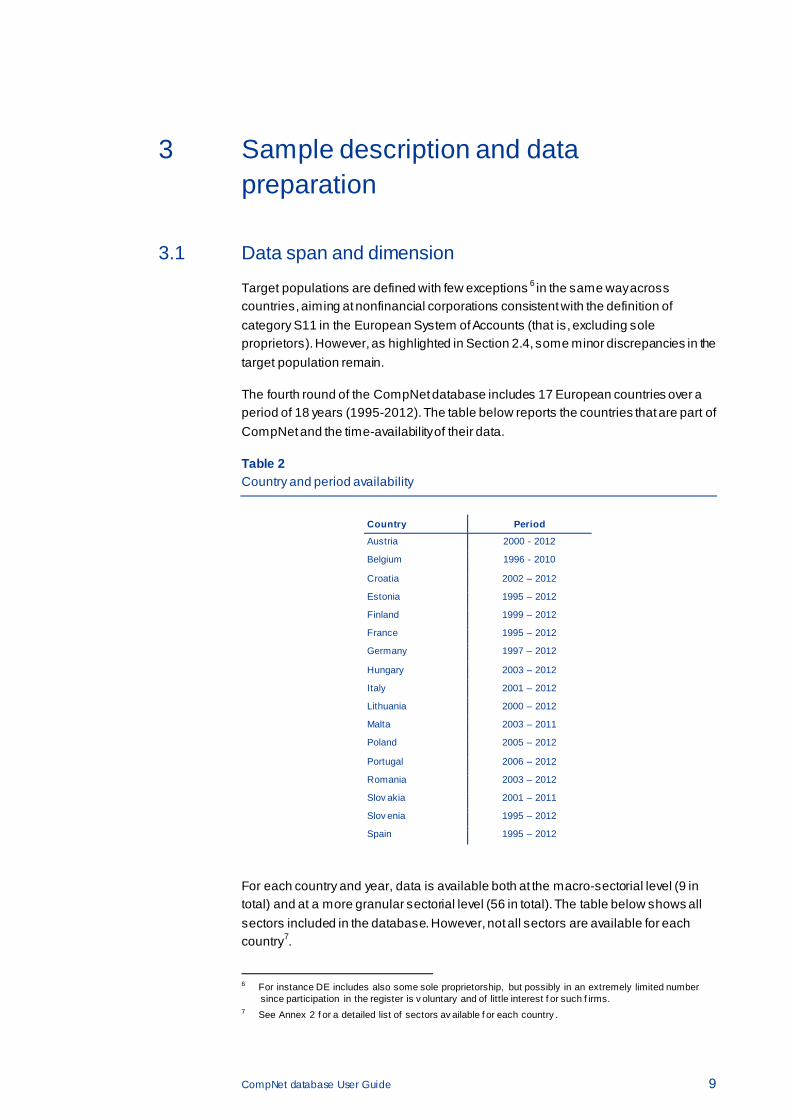
The fourth round of the CompNet database includes 17 European countries over a period of 18 years (1995-2012). The table below reports the countries that are part of CompNet and the time-availability of their data.
Table 2 Country and period availability
Country Period
Austria 2000 - 2012
Belgium 1996 - 2010
Croatia 2002 – 2012
Estonia 1995 – 2012
Finland 1999 – 2012
France 1995 – 2012
Germany 1997 – 2012
Hungary 2003 – 2012
Italy 2001 – 2012
Lithuania 2000 – 2012
Malta 2003 – 2011
Poland 2005 – 2012
Portugal 2006 – 2012
Romania 2003 – 2012
Slov akia 2001 – 2011
Slov enia 1995 – 2012
Spain 1995 – 2012
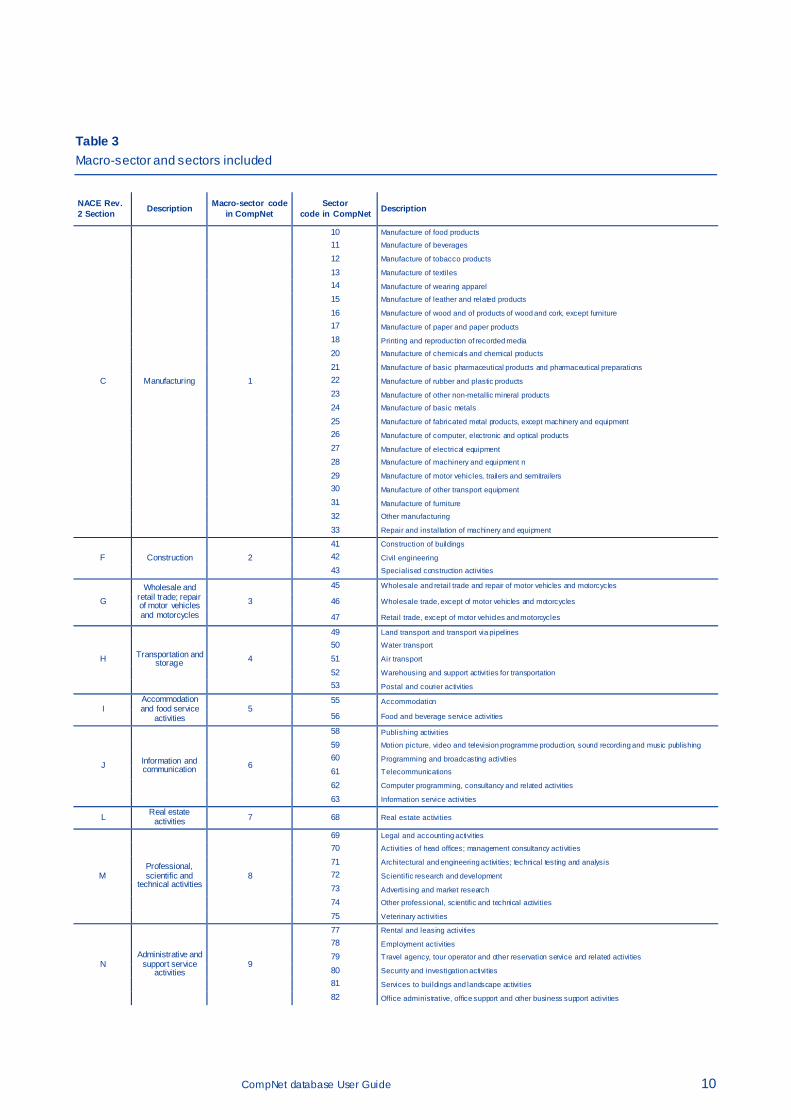
For each country and year, data is available both at the macro-sectorial level (9 in total) and at a more granular sectorial level (56 in total). The table below shows all sectors included in the database. However, not all sectors are available for each country7.
6 For instance DE includes also some sole proprietorship, but possibly in an extremely limited number
since participation in the register is v oluntary and of little interest f or such f irms. 7 See Annex 2 f or a detailed list of sectors av ailable f or each country .
CompNet database User Guide 10
Table 3 Macro-sector and sectors included
NACE Rev. 2 Section Description Macro-sector code
in CompNet Sector
code in CompNet Description
C Manufacturing 1
10 Manufacture of food products
11 Manufacture of beverages
12 Manufacture of tobacco products
13 Manufacture of textiles
14 Manufacture of wearing apparel
15 Manufacture of leather and related products
16 Manufacture of wood and of products of wood and cork, except furniture
17 Manufacture of paper and paper products
18 Printing and reproduction of recorded media
20 Manufacture of chemicals and chemical products
21 Manufacture of basic pharmaceutical products and pharmaceutical preparations
22 Manufacture of rubber and plastic products
23 Manufacture of other non-metallic mineral products
24 Manufacture of basic metals
25 Manufacture of fabricated metal products, except machinery and equipment
26 Manufacture of computer, electronic and optical products
27 Manufacture of electrical equipment
28 Manufacture of machinery and equipment n
29 Manufacture of motor vehicles, trailers and semitrailers
30 Manufacture of other transport equipment
31 Manufacture of furniture
32 Other manufacturing
33 Repair and installation of machinery and equipment
F Construction 2 41 Construction of buildings
42 Civil engineering
43 Specialised construction activities
G Wholesale and
retail trade; repair of motor vehicles and motorcycles
3
45 Wholesale and retail trade and repair of motor vehicles and motorcycles
46 Wholesale trade, except of motor vehicles and motorcycles
47 Retail trade, except of motor vehicles and motorcycles
H Transportation and storage 4
49 Land transport and transport via pipelines
50 Water transport
51 Air transport
52 Warehousing and support activities for transportation
53 Postal and courier activities
I Accommodation and food service
activities 5
55 Accommodation
56 Food and beverage service activities
J Information and communication 6
58 Publishing activities
59 Motion picture, video and television programme production, sound recording and music publishing
60 Programming and broadcasting activities
61 Telecommunications
62 Computer programming, consultancy and related activities
63 Information service activities
L Real estate activities 7 68 Real estate activities
M Professional, scientific and
technical activities 8
69 Legal and accounting activities
70 Activities of head offices; management consultancy activities
71 Architectural and engineering activities; technical testing and analysis
72 Scientific research and development
73 Advertising and market research
74 Other professional, scientific and technical activities
75 Veterinary activities
N Administrative and
support service activities
9
77 Rental and leasing activities
78 Employment activities
79 Travel agency, tour operator and other reservation service and related activities
80 Security and investigation activities
81 Services to buildings and landscape activities
82 Office administrative, office support and other business support activities
CompNet database User Guide 11
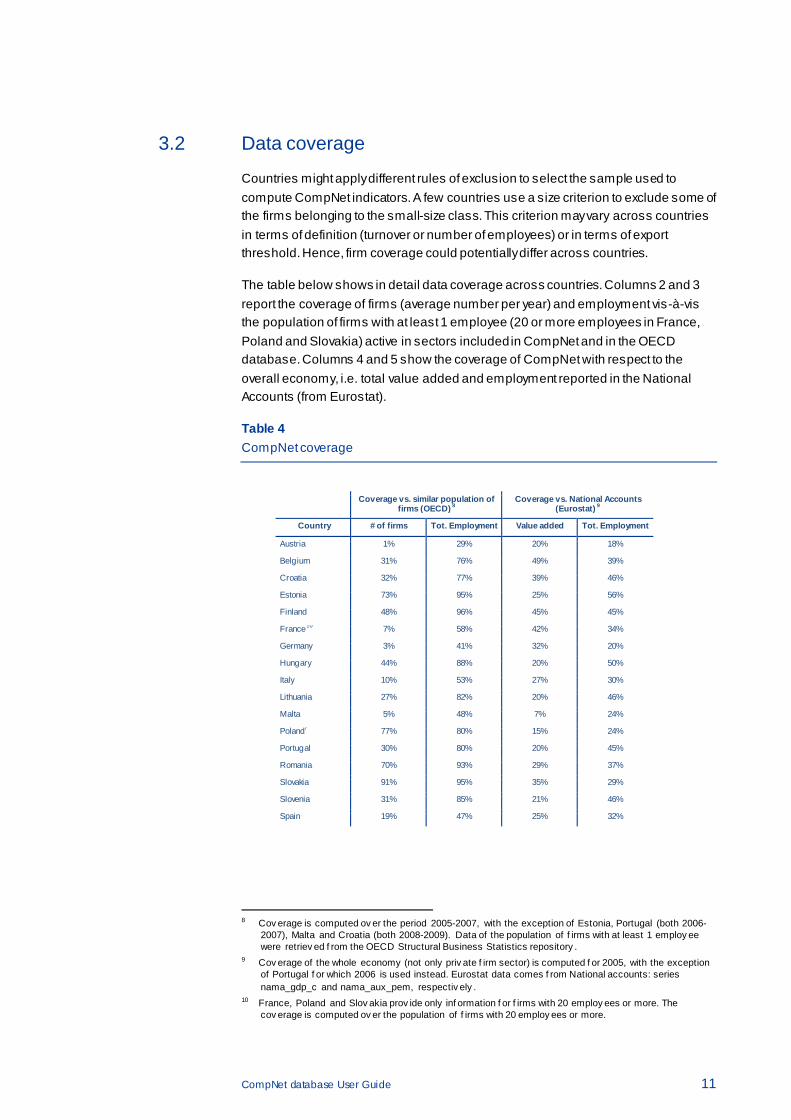
3.2 Data coverage
Countries might apply different rules of exclusion to select the sample used to compute CompNet indicators. A few countries use a size criterion to exclude some of the firms belonging to the small-size class. This criterion may vary across countries in terms of definition (turnover or number of employees) or in terms of export threshold. Hence, firm coverage could potentially differ across countries.
The table below shows in detail data coverage across countries. Columns 2 and 3 report the coverage of firms (average number per year) and employment vis-à-vis the population of firms with at least 1 employee (20 or more employees in France, Poland and Slovakia) active in sectors included in CompNet and in the OECD database. Columns 4 and 5 show the coverage of CompNet with respect to the overall economy, i.e. total value added and employment reported in the National Accounts (from Eurostat).
Table 4 CompNet coverage
8 Cov erage is computed ov er the period 2005-2007, with the exception of Estonia, Portugal (both 2006-
2007), Malta and Croatia (both 2008-2009). Data of the population of f irms with at least 1 employ ee were retriev ed f rom the OECD Structural Business Statistics repository .
9 Cov erage of the whole economy (not only priv ate f irm sector) is computed f or 2005, with the exception of Portugal f or which 2006 is used instead. Eurostat data comes f rom National accounts: series nama_gdp_c and nama_aux_pem, respectiv ely .
10 France, Poland and Slov akia prov ide only inf ormation f or f irms with 20 employ ees or more. The cov erage is computed ov er the population of f irms with 20 employ ees or more.
Coverage vs. similar population of firms (OECD) 8
Coverage vs. National Accounts (Eurostat) 9
Country # of firms Tot. Employment Value added Tot. Employment
Austria 1% 29% 20% 18%
Belgium 31% 76% 49% 39%
Croatia 32% 77% 39% 46%
Estonia 73% 95% 25% 56%
Finland 48% 96% 45% 45%
France10 7% 58% 42% 34%
Germany 3% 41% 32% 20%
Hungary 44% 88% 20% 50%
Italy 10% 53% 27% 30%
Lithuania 27% 82% 20% 46%
Malta 5% 48% 7% 24%
Poland7 77% 80% 15% 24%
Portugal 30% 80% 20% 45%
Romania 70% 93% 29% 37%
Slovakia 91% 95% 35% 29%
Slovenia 31% 85% 21% 46%
Spain 19% 47% 25% 32%
CompNet database User Guide 12
3.3 Full and 20E samples
CompNet variables and indicators are available for two samples: the full and the 20E. The full sample covers the period 1995-2012, its target population includes countries where firm-level data is available for all size classes listed below:
(1) firms with 1-9 employees; (2) firms with 10-19 employees; (3) firms with 20-49 employees; (4) firms with 50-250 employees; (5) firms with more than 250 employees.
Data prior to 2001 often lacks of representativeness due to country specific criteria in the methodology employed to collect the data. Furthermore, in some countries firms are legally obliged to report their balance sheet data only when certain thresholds are met (e.g. in Poland only firms with at least ten employees have to report their accounting information).
In order to provide a more homogeneous sample across countries, CompNet constructed a second sample which is the 20E sample.
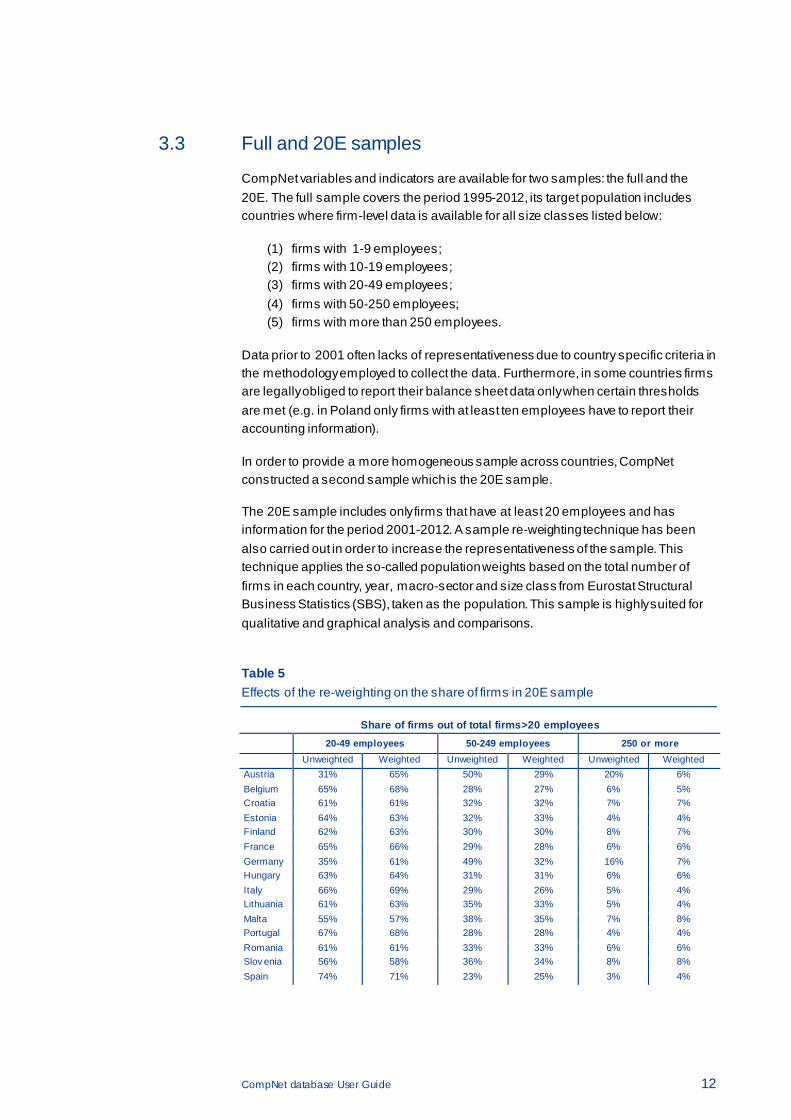
The 20E sample includes only firms that have at least 20 employees and has information for the period 2001-2012. A sample re-weighting technique has been also carried out in order to increase the representativeness of the sample. This technique applies the so-called population weights based on the total number of firms in each country, year, macro-sector and size class from Eurostat Structural Business Statistics (SBS), taken as the population. This sample is highly suited for qualitative and graphical analysis and comparisons.
Table 5 Effects of the re-weighting on the share of firms in 20E sample
Share of firms out of total firms>20 employees
20-49 employees 50-249 employees 250 or more
Unweighted Weighted Unweighted Weighted Unweighted Weighted Austria 31% 65% 50% 29% 20% 6% Belgium 65% 68% 28% 27% 6% 5% Croatia 61% 61% 32% 32% 7% 7% Estonia 64% 63% 32% 33% 4% 4% Finland 62% 63% 30% 30% 8% 7% France 65% 66% 29% 28% 6% 6% Germany 35% 61% 49% 32% 16% 7% Hungary 63% 64% 31% 31% 6% 6% Italy 66% 69% 29% 26% 5% 4% Lithuania 61% 63% 35% 33% 5% 4% Malta 55% 57% 38% 35% 7% 8% Portugal 67% 68% 28% 28% 4% 4% Romania 61% 61% 33% 33% 6% 6% Slov enia 56% 58% 36% 34% 8% 8% Spain 74% 71% 23% 25% 3% 4%
CompNet database User Guide 13
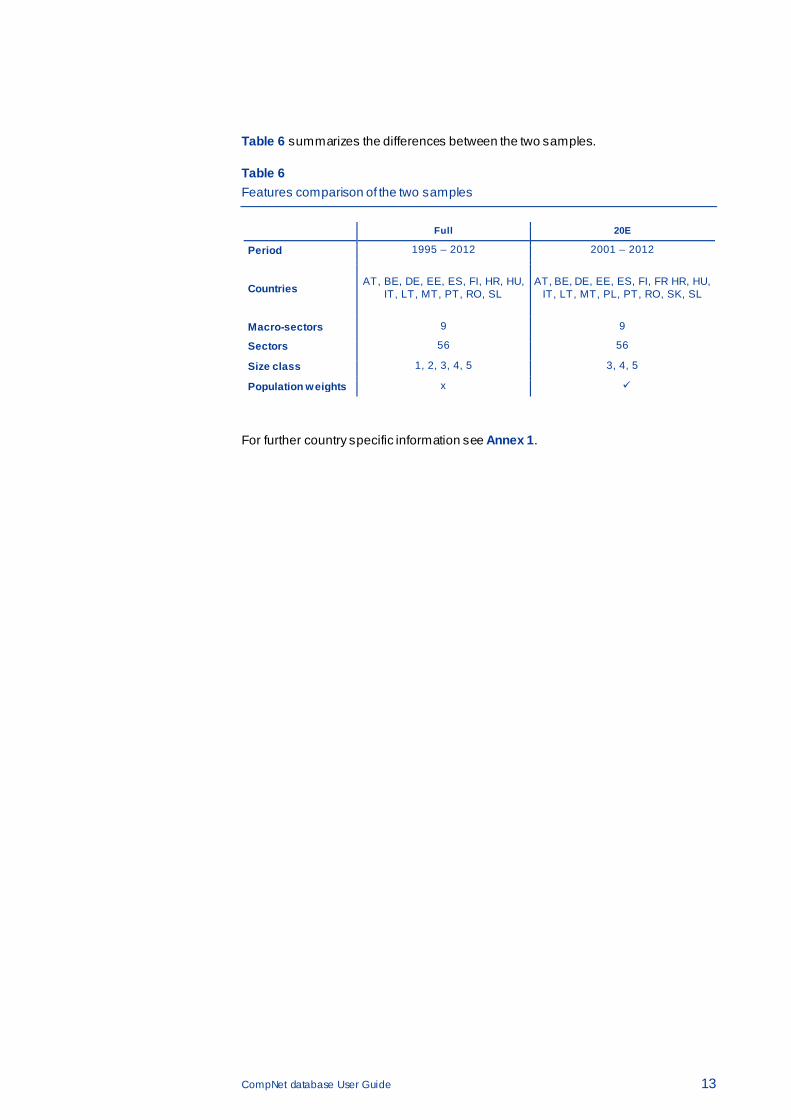
Table 6 summarizes the differences between the two samples.
Table 6 Features comparison of the two samples
For further country specific information see Annex 1.
Full 20E
Period 1995 – 2012 2001 – 2012
Countries
AT, BE, DE, EE, ES, FI, HR, HU,
IT, LT, MT, PT, RO, SL
AT, BE, DE, EE, ES, FI, FR HR, HU,
IT, LT, MT, PL, PT, RO, SK, SL
Macro-sectors 9 9
Sectors 56 56
Size class 1, 2, 3, 4, 5 3, 4, 5
Population weights x
CompNet database User Guide 14
4 Caveats and limitations of the dataset
4.1 Construction limitation
Data availability varies across indicators according to the procedure required to estimate them. For example, while labour productivity can be computed, on average, for 87% of all firms in the database, total factor productivity (TFP) is more data-intensive and can be estimated for 60% of the firms only. Moreover, the sample of firms for which each indicator can be computed might vary in terms of reporting standards. For this reason, basic indicators based on employment or sales figures are considered as being more comparable across countries than more complex indicators.
Moreover, in most countries sample composition does not account for market entry and exit of firms over time (see Annex 1 for details). Ultimately, changes in the sample composition could affect point estimates of the indicators, which are particularly relevant for dynamic indicators, such as the Foster productivity decomposition.
The year of creation of the firm is an item provided in the balance sheet of only 6 countries. Currently it is neither possible to compute entry and exit rates, nor to divide firms according to their age. These features will be added in the future.
Eventually, this could also lead to the presence of outliers in the aggregates, as it is pointed out by the ECB DG-Statistics Quality report.
4.2 Analysis of indicators over time
Two issues should be taken into consideration when assessing specific indicators over time. First, changes in the compilation methods (e.g. accounting standards) of raw variables used to produce indicators are a potential source of cross-country differences. Second, as already mentioned above, the country’s firm sample could feature changes in its composition or size over time.
In general, this implies that countries with a wider firm coverage (in particular Belgium, Estonia, Finland, Hungary, Poland, Portugal, Romania, Slovakia and Slovenia – see Annex 1) are able to provide figures that are less affected by changes in the composition of the sample population over time. For the remaining countries, yearly changes in the indicators over time could be the result of changes in the sample population, not related to firm dynamics but rather to statistical procedures. More recent data (i.e. from 2001 onwards) is considered to be more reliable than those from earlier years given that data compilation procedures in several countries have generally improved over time, mainly expressed in a substantial increase in the number of firms sampled.
CompNet database User Guide 15
4.3 Comparison with National Accounts
CompNet indicators aggregated from firm-level sources are fundamentally different from aggregate National Accounts statistics (NA) that consolidate and balance information from a variety of sources. Firm-level variables used by CompNet are collected based on national legislation on accounting rules (GAAP), while official aggregate statistics rely on National Accounts rules (ESA). Also, micro-based sources like CompNet rely on accounting figures that are mainly based on book value, although some assets are valued at market prices, following national accounting rules. National accounts, on the other hand, tend to use market values.
Although the trends detected within CompNet samples are correlated with those in National Accounts, the correlation could be weaker if the dynamics of the public sector or self-employed (not covered in the firm-level data) are substantially different from the non-financial corporate sector. Investigating case-by-case the sources of such discrepancies can be an important exercise to better assess the underlying dynamics of competitiveness of private businesses in each country.
4.4 Raw variable definition
CompNet collects information on a rather large number of raw variables. Table 24, in the Annex, provides the harmonized definition of each of those variables. Given the different underlying data sources and accounting rules across countries, some country-specific deviations still remain even after applying several steps to improve cross-country harmonization; they are presented in Table 25 of the Annex.
CompNet database User Guide 16
Box 1 Recommendations for the use of existing data
a. The data is useful and suitable for within-country firm performance comparisons (e.g. of low and high productive firms, or of firms with or without credit constraints), as well as to compare dynamics across sectors, or retrieve micro-based information to calibrate macroeconomic models.
b. When performing the above-mentioned analysis, a number of precautionary practices should nevertheless be followed. Since the coverage of the sample might vary across indicators, robustness checks with alternative indicators should be conducted (e.g. labour productivity vs. TFP); furthermore, as time series could change in certain countries/industries due to variability of the underlying sample, averages across years (e.g. before/after crisis) and cumulative growth rates should be preferred rather than specific yearly figures.
c. Since cross-country comparisons are crucial for policy analysis and research, the use of the 20E sample is strongly recommended, given its better quality in terms of distribution of firms across size classes and sectors. However, some within cell biases still persist. For this reason, we do not encourage the use of this dataset to perform direct cross-country comparisons of aggregate levels (e.g. simple averages of indicators at country level). In addition, restricting the analysis to the most comparable set of countries 11 is recommended. It is also recommended not to compare the absolute magnitude of micro-based variables to macro aggregates retrieved from NA statistics, preferring when possible some sort of normalization.
d. Due to the lack of full comparability, the CompNet database should be used with great caution for cross-country comparisons of descriptive, unconditional cross-country statistics. This is especially true for productivity measures. Indeed, as reported in section 5.1.4, in order to perform cross-country analysis the TFP distribution should be rescaled with the TFPR. However, if the data is used within a regression analysis, the researcher can control for country and sector differences via a rich set of dummies.
e. Despite the fact that Germany and Austria provide information on firms with more than 1 employee, for these two countries the use of the full (unweighted) sample is not encouraged. According to Table 4, the samples in both countries include only 1-3% of firms in the population but covers 30-40% of the total employment, thus indicating a clear bias towards large firms in both countries. The 20E sample (which is population weighted) is more comparable, and therefore recommended for cross-country analysis.
11 For example, if the research question requires the use of the f ull sample of f irms, authors should restrict
the analy sis to countries with good cov erage of small f irms. For detailed inf ormation on sample cov erage, ref er to the ECB DG-Statistics Quality report.
CompNet database User Guide 17
4.5 Further data quality improvements
CompNet, following the recommendations provided by DG Statistics in November 201412, is working to improve the database along the following lines:
i. Comparability of samples and concepts ii. Representativeness of the sample iii. Missing data iv. Outliers
In the future data will be improved by both modifying the relevant programmes of data gathering at the centre of the project; and refining the methodology behind data collection and sampling.
12 See ECB DG-Statistics Quality report.
CompNet database User Guide 18
5 Variables available in the database
The CompNet firm-level-based database offers a wide range of indicators constructed on firm-level information. For each indicator, CompNet collects the complete set of statistical moments of the distribution.
In this section, a detailed list of available statistics and their level of aggregation is presented for all indicators computed by CompNet. Furthermore, the label used in the Stata datasets and the general definitions are provided. In order to make the user guide more accessible, the variables are organised by topic of interest, i.e. productivity, financial, trade, markup, labour and joint distributions.
For more specific details on the CompNet overall dataset and its four modules see the following papers:
• CompNet overall methodological paper: Lopez-Garcia, di Mauro and the CompNet Task Force (2015) - ECB WP 1764
• Financial module: Ferrando, et al. (2015) - ECB WP 1836 • Trade module: Berthou, et al. (2015) - ECB WP 1788 • Labour module: Fernández, et al. (forthcoming) • Markup module: Amador, et al. (forthcoming)
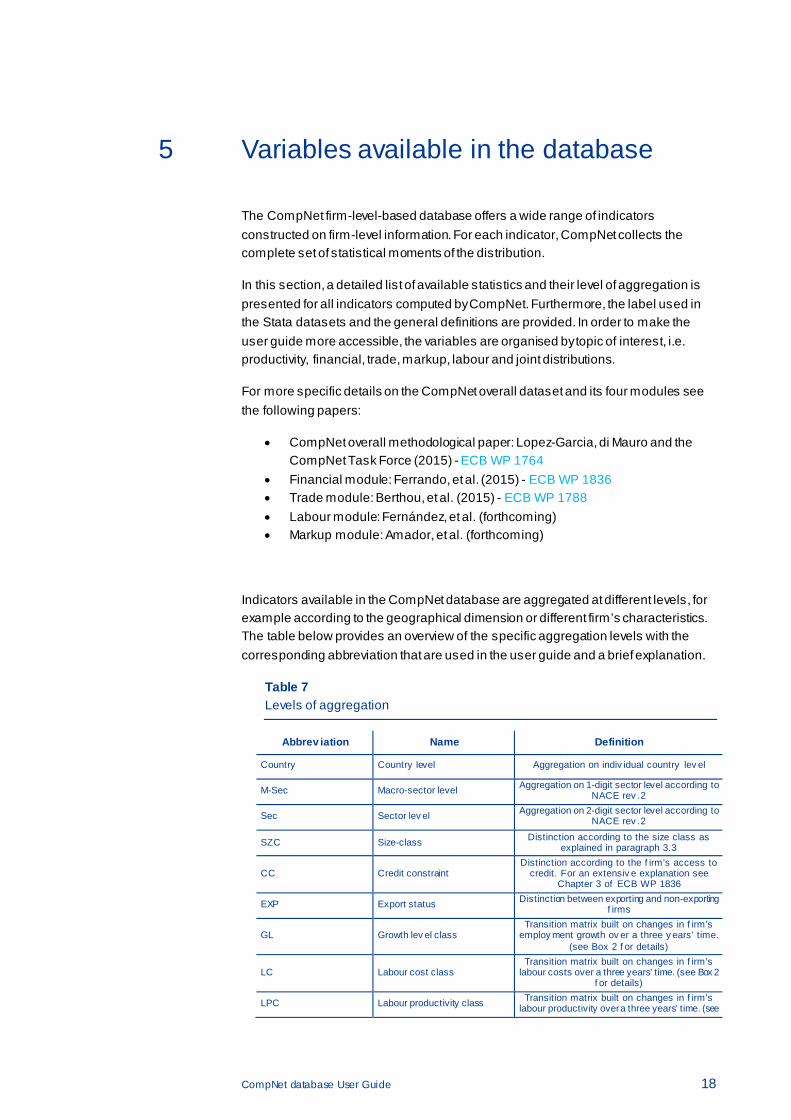
Indicators available in the CompNet database are aggregated at different levels, for example according to the geographical dimension or different firm’s characteristics. The table below provides an overview of the specific aggregation levels with the corresponding abbreviation that are used in the user guide and a brief explanation.
Table 7 Levels of aggregation
Abbrev iation Name Definition
Country Country level Aggregation on indiv idual country lev el
M-Sec Macro-sector level Aggregation on 1-digit sector level according to NACE rev .2
Sec Sector lev el Aggregation on 2-digit sector level according to NACE rev .2
SZC Size-class Distinction according to the size class as explained in paragraph 3.3
CC Credit constraint Distinction according to the f irm’s access to
credit. For an extensiv e explanation see Chapter 3 of ECB WP 1836
EXP Export status Distinction between exporting and non-exporting f irms
GL Growth lev el class Transition matrix built on changes in f irm’s
employ ment growth ov er a three y ears’ time. (see Box 2 f or details)
LC Labour cost class Transition matrix built on changes in f irm’s
labour costs over a three years’ time. (see Box 2 f or details)
LPC Labour productivity class Transition matrix built on changes in f irm’s labour productivity over a three years’ time. (see
CompNet database User Guide 19
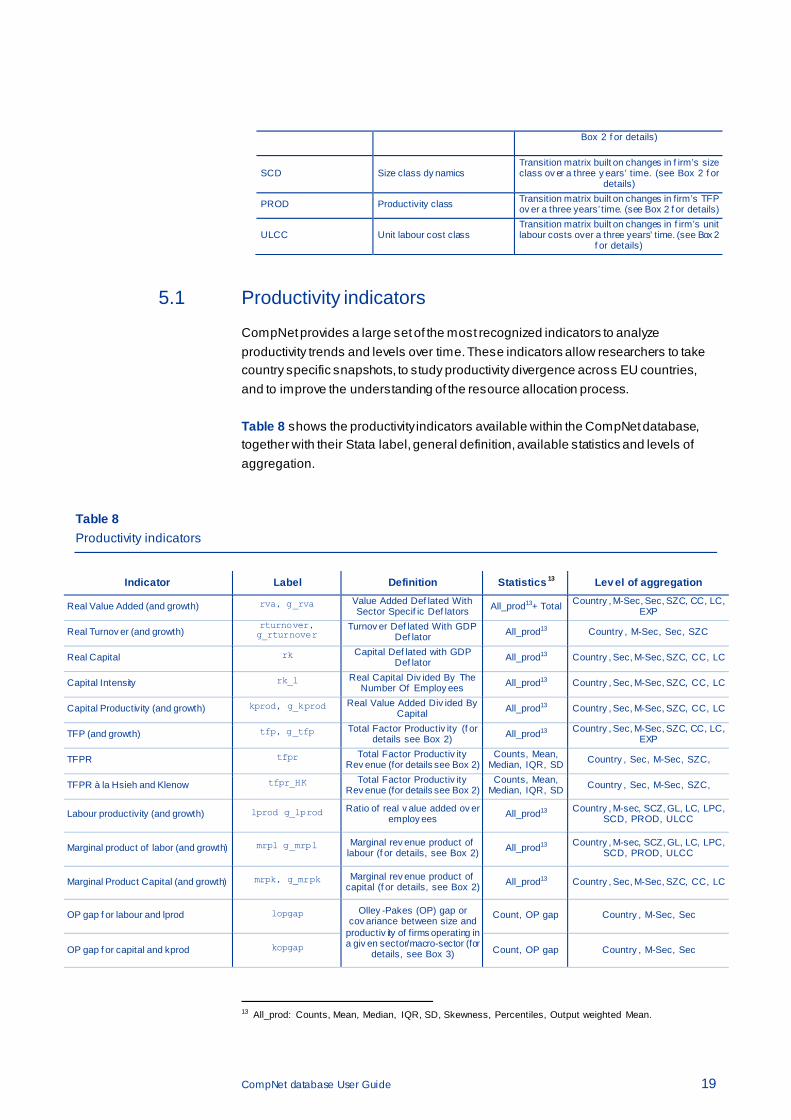
5.1 Productivity indicators
CompNet provides a large set of the most recognized indicators to analyze productivity trends and levels over time. These indicators allow researchers to take country specific snapshots, to study productivity divergence across EU countries, and to improve the understanding of the resource allocation process.
Table 8 shows the productivity indicators available within the CompNet database, together with their Stata label, general definition, available statistics and levels of aggregation.
Table 8 Productivity indicators
Indicator Label Definition Statistics 13 Lev el of aggregation
Real Value Added (and growth) rva, g_rva Value Added Def lated With Sector Specif ic Def lators All_prod13+ Total Country , M-Sec, Sec, SZC, CC, LC,
EXP
Real Turnov er (and growth) rturnover, g_rturnover
Turnov er Def lated With GDP Def lator All_prod13 Country , M-Sec, Sec, SZC
Real Capital rk Capital Def lated with GDP Def lator All_prod13 Country , Sec, M-Sec, SZC, CC, LC
Capital Intensity rk_l Real Capital Div ided By The Number Of Employ ees All_prod13 Country , Sec, M-Sec, SZC, CC, LC
Capital Productivity (and growth) kprod, g_kprod Real Value Added Div ided By Capital All_prod13 Country , Sec, M-Sec, SZC, CC, LC
TFP (and growth) tfp, g_tfp Total Factor Productiv ity (f or details see Box 2) All_prod13 Country , Sec, M-Sec, SZC, CC, LC,
EXP
TFPR tfpr Total Factor Productiv ity Rev enue (for details see Box 2)
Counts, Mean, Median, IQR, SD Country , Sec, M-Sec, SZC,
TFPR à la Hsieh and Klenow tfpr_HK Total Factor Productiv ity Rev enue (for details see Box 2)
Counts, Mean, Median, IQR, SD Country , Sec, M-Sec, SZC,
Labour productivity (and growth) lprod g_lprod Ratio of real v alue added ov er employ ees All_prod13 Country , M-sec, SCZ, GL, LC, LPC,
SCD, PROD, ULCC
Marginal product of labor (and growth) mrpl g_mrpl Marginal rev enue product of labour (f or details, see Box 2) All_prod13 Country , M-sec, SCZ, GL, LC, LPC,
SCD, PROD, ULCC
Marginal Product Capital (and growth) mrpk, g_mrpk Marginal rev enue product of capital (f or details, see Box 2) All_prod13 Country , Sec, M-Sec, SZC, CC, LC
OP gap f or labour and lprod lopgap Olley -Pakes (OP) gap or cov ariance between size and
productiv ity of firms operating in a giv en sector/macro-sector (for
details, see Box 3)
Count, OP gap Country , M-Sec, Sec
OP gap f or capital and kprod kopgap Count, OP gap Country , M-Sec, Sec
13 All_prod: Counts, Mean, Median, IQR, SD, Skewness, Percentiles, Output weighted Mean.
Box 2 f or details)
SCD Size class dy namics Transition matrix built on changes in f irm’s size class ov er a three y ears’ time. (see Box 2 f or
details)
PROD Productivity class Transition matrix built on changes in firm’s TFP ov er a three years’ time. (see Box 2 f or details)
ULCC Unit labour cost class Transition matrix built on changes in f irm’s unit labour costs over a three years’ time. (see Box 2
f or details)
CompNet database User Guide 20
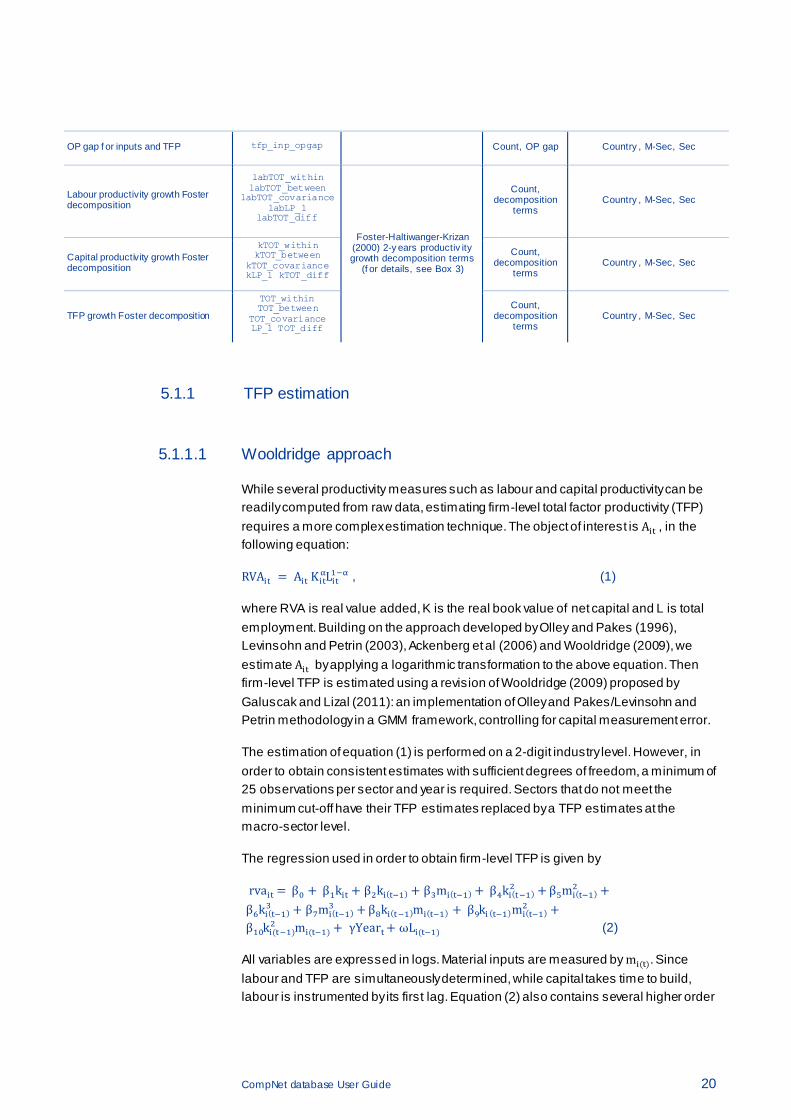
OP gap f or inputs and TFP tfp_inp_opgap Count, OP gap Country , M-Sec, Sec
Labour productivity growth Foster decomposition
labTOT_within labTOT_between
labTOT_covariance labLP_l
labTOT_diff
Foster-Haltiwanger-Krizan (2000) 2-y ears productiv ity growth decomposition terms
(f or details, see Box 3)
Count, decomposition
terms Country , M-Sec, Sec
Capital productivity growth Foster decomposition
kTOT_within kTOT_between
kTOT_covariance kLP_l kTOT_diff
Count, decomposition
terms Country , M-Sec, Sec
TFP growth Foster decomposition
TOT_within TOT_between
TOT_covariance LP_l TOT_diff
Count, decomposition
terms Country , M-Sec, Sec
5.1.1 TFP estimation
5.1.1.1 Wooldridge approach
While several productivity measures such as labour and capital productivity can be readily computed from raw data, estimating firm-level total factor productivity (TFP) requires a more complex estimation technique. The object of interest is Ait , in the following equation:
RVAit = Ait KitαLit1−α , (1)
where RVA is real value added, K is the real book value of net capital and L is total employment. Building on the approach developed by Olley and Pakes (1996), Levinsohn and Petrin (2003), Ackenberg et al (2006) and Wooldridge (2009), we estimate Ait by applying a logarithmic transformation to the above equation. Then firm-level TFP is estimated using a revision of Wooldridge (2009) proposed by Galuscak and Lizal (2011): an implementation of Olley and Pakes/Levinsohn and Petrin methodology in a GMM framework, controlling for capital measurement error.
The estimation of equation (1) is performed on a 2-digit industry level. However, in order to obtain consistent estimates with sufficient degrees of freedom, a minimum of 25 observations per sector and year is required. Sectors that do not meet the minimum cut-off have their TFP estimates replaced by a TFP estimates at the macro-sector level.
The regression used in order to obtain firm-level TFP is given by
rvait = β0 + β1kit + β2ki(t−1) + β3mi(t−1) + β4ki(t−1)2 + β5mi(t−1)
2 +β6ki(t−1)
3 + β7mi(t−1)3 + β8ki(t−1)mi(t−1) + β9ki (t−1)mi(t−1)
2 +β10ki(t−1)
2 mi(t−1) + γYeart+ ωLi(t−1) (2)
All variables are expressed in logs. Material inputs are measured by mi(t). Since labour and TFP are simultaneously determined, while capital takes time to build, labour is instrumented by its first lag. Equation (2) also contains several higher order
CompNet database User Guide 21
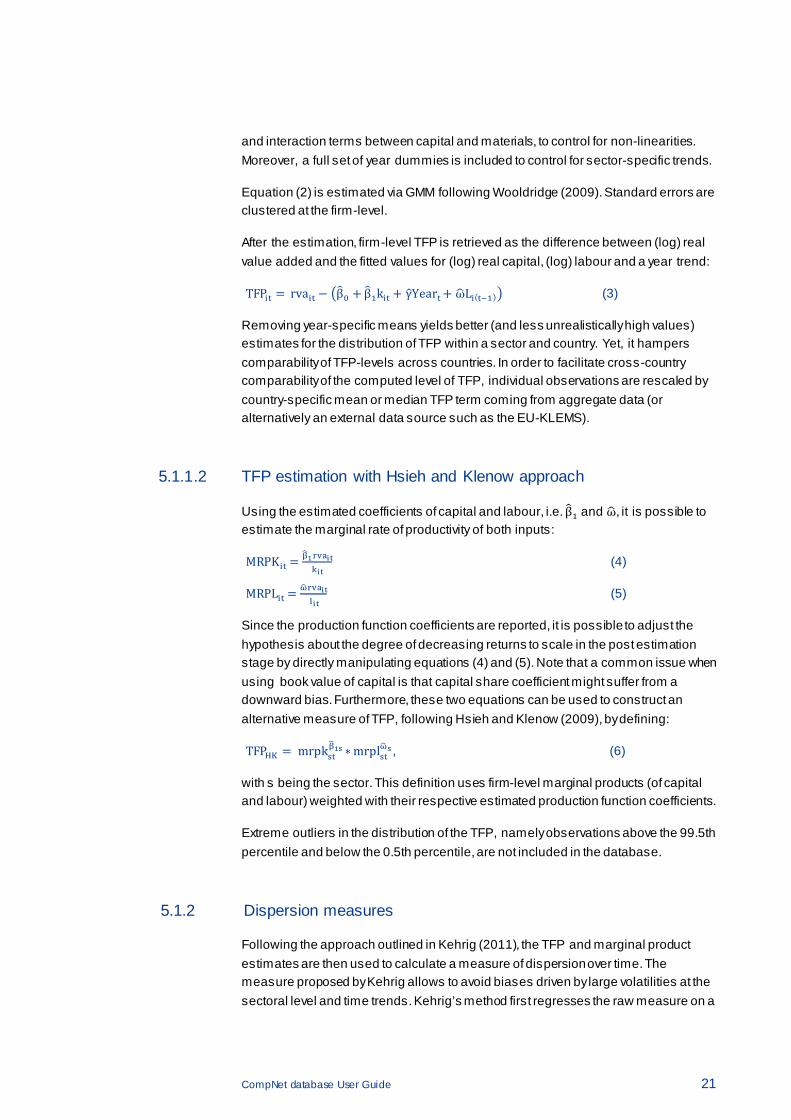
and interaction terms between capital and materials, to control for non-linearities. Moreover, a full set of year dummies is included to control for sector-specific trends.
Equation (2) is estimated via GMM following Wooldridge (2009). Standard errors are clustered at the firm-level.
After the estimation, firm-level TFP is retrieved as the difference between (log) real value added and the fitted values for (log) real capital, (log) labour and a year trend:
TFPit = rvait − �β�0 + β�1kit + γ�Yeart+ ω�Li(t−1)� (3)
Removing year-specific means yields better (and less unrealistically high values) estimates for the distribution of TFP within a sector and country. Yet, it hampers comparability of TFP-levels across countries. In order to facilitate cross-country comparability of the computed level of TFP, individual observations are rescaled by country-specific mean or median TFP term coming from aggregate data (or alternatively an external data source such as the EU-KLEMS).
5.1.1.2 TFP estimation with Hsieh and Klenow approach
Using the estimated coefficients of capital and labour, i.e. β�1 and ω� , it is possible to estimate the marginal rate of productivity of both inputs:
MRPKit = β�1rvaitkit
(4)
MRPLit = ω� rvaitlit
(5)
Since the production function coefficients are reported, it is possible to adjust the hypothesis about the degree of decreasing returns to scale in the post estimation stage by directly manipulating equations (4) and (5). Note that a common issue when using book value of capital is that capital share coefficient might suffer from a downward bias. Furthermore, these two equations can be used to construct an alternative measure of TFP, following Hsieh and Klenow (2009), by defining:
TFPHK = mrpkstβ�1s ∗mrplst
ω� s , (6)
with s being the sector. This definition uses firm-level marginal products (of capital and labour) weighted with their respective estimated production function coefficients.
Extreme outliers in the distribution of the TFP, namely observations above the 99.5th percentile and below the 0.5th percentile, are not included in the database.
5.1.2 Dispersion measures
Following the approach outlined in Kehrig (2011), the TFP and marginal product estimates are then used to calculate a measure of dispersion over time. The measure proposed by Kehrig allows to avoid biases driven by large volatilities at the sectoral level and time trends. Kehrig’s method first regresses the raw measure on a
CompNet database User Guide 22
time trend and the residuals. It retrieves the residuals of this regression. Next, the residuals are divided by the sector-specific standard deviation. The dispersion measure at the industry level is then defined as the median standard deviation of the resulting series.
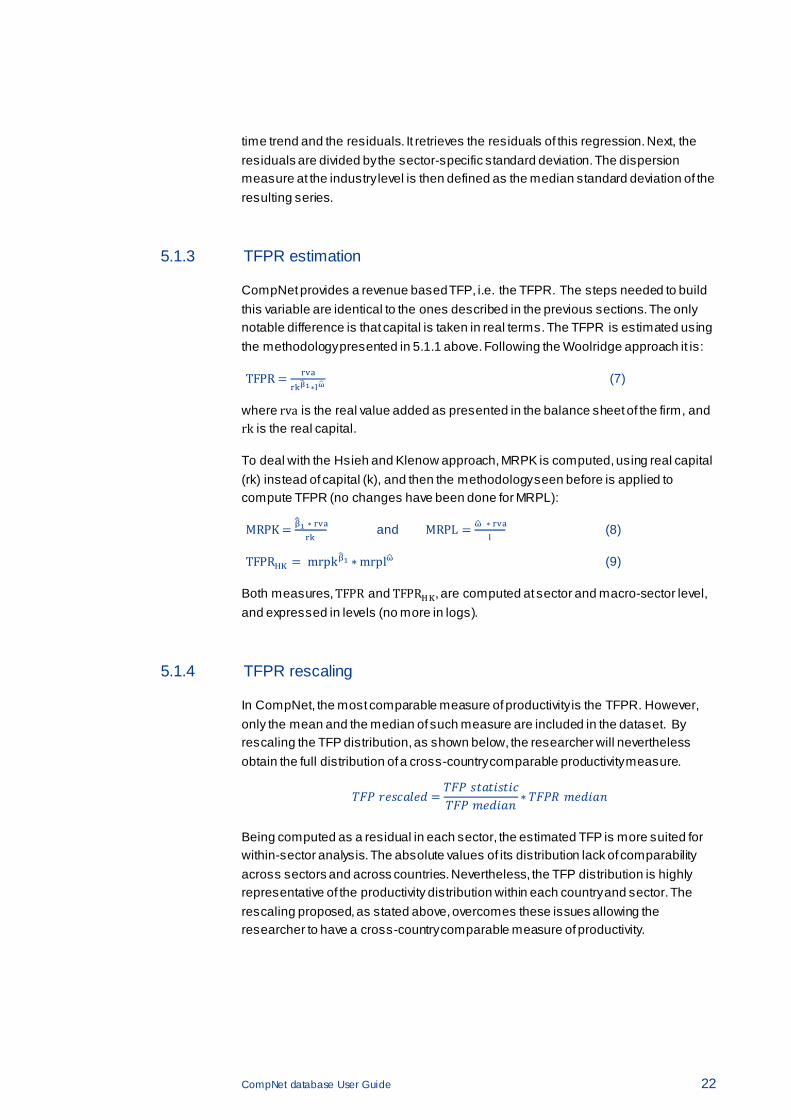
5.1.3 TFPR estimation
CompNet provides a revenue based TFP, i.e. the TFPR. The steps needed to build this variable are identical to the ones described in the previous sections. The only notable difference is that capital is taken in real terms. The TFPR is estimated using the methodology presented in 5.1.1 above. Following the Woolridge approach it is:
TFPR = rva
rkβ�1∗lω� (7)
where rva is the real value added as presented in the balance sheet of the firm, and rk is the real capital.
To deal with the Hsieh and Klenow approach, MRPK is computed, using real capital (rk) instead of capital (k), and then the methodology seen before is applied to compute TFPR (no changes have been done for MRPL):
MRPK = β��1 ∗ rvark
and MRPL = ω� ∗ rval
(8)
TFPRHK = mrpk β�1 ∗mrpl
ω� (9)
Both measures, TFPR and TFPRHK, are computed at sector and macro-sector level, and expressed in levels (no more in logs).
5.1.4 TFPR rescaling
In CompNet, the most comparable measure of productivity is the TFPR. However, only the mean and the median of such measure are included in the dataset. By rescaling the TFP distribution, as shown below, the researcher will nevertheless obtain the full distribution of a cross-country comparable productivity measure.
𝑇𝑇𝑇 𝑟𝑟𝑟𝑟𝑟𝑟𝑟𝑟 =𝑇𝑇𝑇 𝑟𝑠𝑟𝑠𝑠𝑟𝑠𝑠𝑟𝑇𝑇𝑇 𝑚𝑟𝑟𝑠𝑟𝑚
∗ 𝑇𝑇𝑇𝑇 𝑚𝑟𝑟𝑠𝑟𝑚
Being computed as a residual in each sector, the estimated TFP is more suited for within-sector analysis. The absolute values of its distribution lack of comparability across sectors and across countries. Nevertheless, the TFP distribution is highly representative of the productivity distribution within each country and sector. The rescaling proposed, as stated above, overcomes these issues allowing the researcher to have a cross-country comparable measure of productivity.
CompNet database User Guide 23
5.1.5 Allocative efficiency measures
CompNet database provides estimates of different allocative efficiency indicators developed and widely used in the literature.
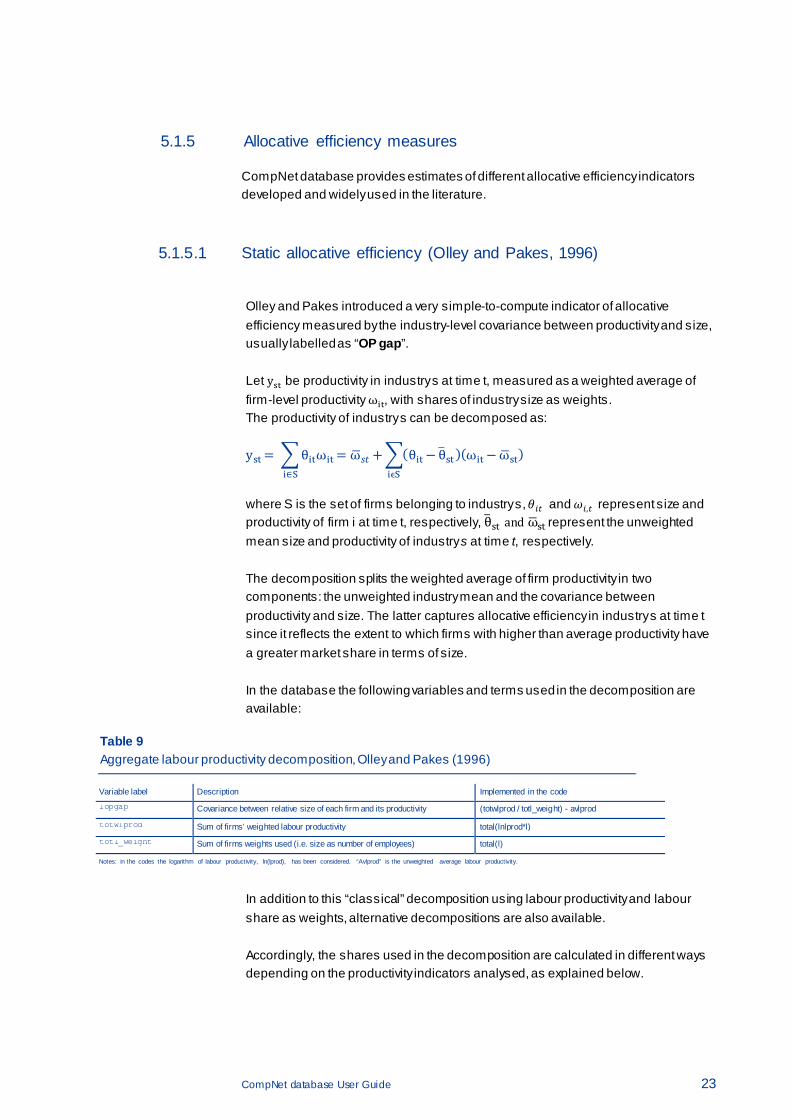
5.1.5.1 Static allocative efficiency (Olley and Pakes, 1996)
Olley and Pakes introduced a very simple-to-compute indicator of allocative efficiency measured by the industry-level covariance between productivity and size, usually labelled as “OP gap”.
Let yst be productivity in industry s at time t, measured as a weighted average of firm-level productivity ωit, with shares of industry size as weights. The productivity of industry s can be decomposed as:
yst = �θitωit = ω�𝑠𝑠 +�(θit − θ�st)(ωit −ω�st)iϵSi∈S
where S is the set of firms belonging to industry s, 𝜃𝑖𝑠 and 𝜔𝑖,𝑠 represent size and productivity of firm i at time t, respectively, θ�st and ω�st represent the unweighted mean size and productivity of industry s at time t, respectively.
The decomposition splits the weighted average of firm productivity in two components: the unweighted industry mean and the covariance between productivity and size. The latter captures allocative efficiency in industry s at time t since it reflects the extent to which firms with higher than average productivity have a greater market share in terms of size.
In the database the following variables and terms used in the decomposition are available:
Table 9 Aggregate labour productivity decomposition, Olley and Pakes (1996)
Variable label Description Implemented in the code
lopgap Covariance between relative size of each firm and its productivity (totwlprod / totl_weight) - avlprod
totwlprod Sum of firms’ weighted labour productivity total(lnlprod*l)
totl_weight Sum of firms weights used (i.e. size as number of employees) total(l)
Notes: in the codes the logarithm of labour productivity, ln(lprod), has been considered. “Avlprod” is the unweighted average labour productivity.
In addition to this “classical” decomposition using labour productivity and labour share as weights, alternative decompositions are also available. Accordingly, the shares used in the decomposition are calculated in different ways depending on the productivity indicators analysed, as explained below.
CompNet database User Guide 24
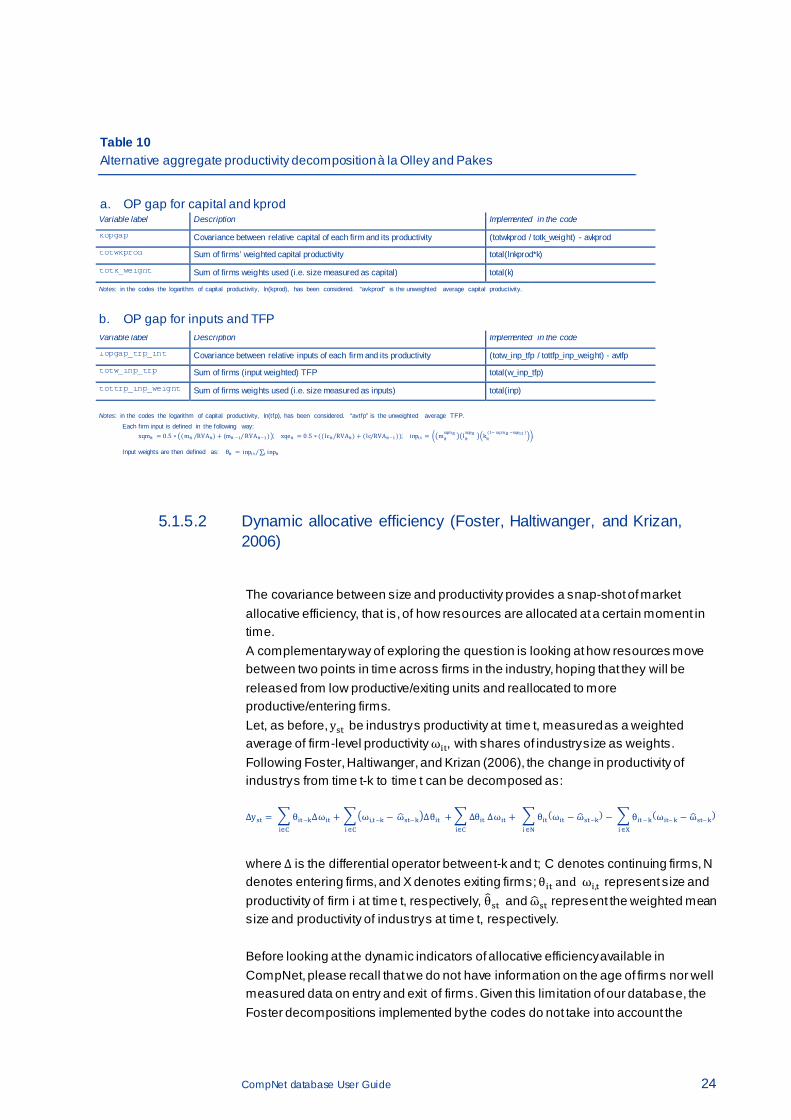
Table 10
Alternative aggregate productivity decomposition à la Olley and Pakes
a. OP gap for capital and kprod Variable label Description Implemented in the code
kopgap Covariance between relative capital of each firm and its productivity (totwkprod / totk_weight) - avkprod
totwkprod Sum of firms’ weighted capital productivity total(lnkprod*k)
totk_weight Sum of firms weights used (i.e. size measured as capital) total(k)
Notes: in the codes the logarithm of capital productivity, ln(kprod), has been considered. “avkprod” is the unweighted average capital productivity.
b. OP gap for inputs and TFP
Variable label Description Implemented in the code
lopgap_tfp_int Covariance between relative inputs of each firm and its productivity (totw_inp_tfp / tottfp_inp_weight) - avtfp
totw_inp_tfp Sum of firms (input weighted) TFP total(w_inp_tfp)
tottfp_inp_weight Sum of firms weights used (i.e. size measured as inputs) total(inp)
Notes: in the codes the logarithm of capital productivity, ln(tfp), has been considered. “avtfp” is the unweighted average TFP.
Each firm input is defined in the following way: xqmit = 0 .5 ∗ �(mit RVAit⁄ ) + (mit −1 RVAit−1⁄ )�; xqeit = 0 .5 ∗ ((lcit RVAit⁄ ) + (lc RVAit−1⁄ )); inpi t = ��mit
xqmit ��litxqeit ��kit
(1− xqmit −xqei t )��.
Input weights are then defined as: θit = inpi t ∑ inpiti⁄
5.1.5.2 Dynamic allocative efficiency (Foster, Haltiwanger, and Krizan, 2006)
The covariance between size and productivity provides a snap-shot of market allocative efficiency, that is, of how resources are allocated at a certain moment in time. A complementary way of exploring the question is looking at how resources move between two points in time across firms in the industry, hoping that they will be released from low productive/exiting units and reallocated to more productive/entering firms. Let, as before, yst be industry s productivity at time t, measured as a weighted average of firm-level productivity ωit, with shares of industry size as weights. Following Foster, Haltiwanger, and Krizan (2006), the change in productivity of industry s from time t-k to time t can be decomposed as:
∆yst = �θit−k∆ωit +
i∈C
��ωi,t−k − ω�st−k�∆θit + �∆θit ∆ωit + �θit(ωit − ω�st−k)i ∈Ni∈Ci ∈C
− �θit−k(ωit−k − ω�st−k)i ∈X
where ∆ is the differential operator between t-k and t; C denotes continuing firms, N denotes entering firms, and X denotes exiting firms; θit and ωi,t represent size and productivity of firm i at time t, respectively, θ�st and ω�st represent the weighted mean size and productivity of industry s at time t, respectively. Before looking at the dynamic indicators of allocative efficiency available in CompNet, please recall that we do not have information on the age of firms nor well measured data on entry and exit of firms. Given this limitation of our database, the Foster decompositions implemented by the codes do not take into account the
CompNet database User Guide 25
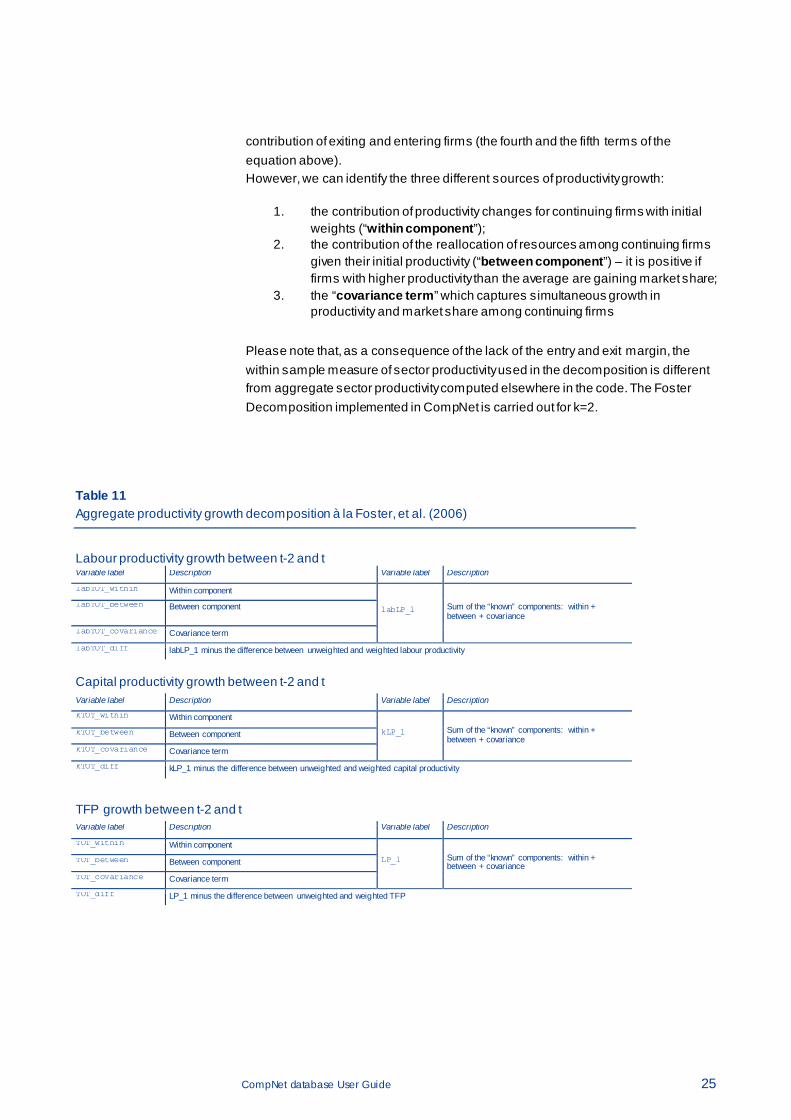
contribution of exiting and entering firms (the fourth and the fifth terms of the equation above). However, we can identify the three different sources of productivity growth:
1. the contribution of productivity changes for continuing firms with initial
weights (“within component”); 2. the contribution of the reallocation of resources among continuing firms
given their initial productivity (“between component”) – it is positive if firms with higher productivity than the average are gaining market share;
3. the “covariance term” which captures simultaneous growth in productivity and market share among continuing firms
Please note that, as a consequence of the lack of the entry and exit margin, the within sample measure of sector productivity used in the decomposition is different from aggregate sector productivity computed elsewhere in the code. The Foster Decomposition implemented in CompNet is carried out for k=2.
Table 11 Aggregate productivity growth decomposition à la Foster, et al. (2006)
Labour productivity growth between t-2 and t Variable label Description Variable label Description
labTOT_within Within component
labLP_l labTOT_between Between component Sum of the “known” components: within +
between + covariance
labTOT_covariance Covariance term
labTOT_diff labLP_1 minus the difference between unweighted and weighted labour productivity
Capital productivity growth between t-2 and t
Variable label Description Variable label Description
kTOT_within Within component
kLP_l Sum of the “known” components: within + between + covariance
kTOT_between Between component
kTOT_covariance Covariance term
kTOT_diff kLP_1 minus the difference between unweighted and weighted capital productivity
TFP growth between t-2 and t
Variable label Description Variable label Description
TOT_within Within component
LP_l Sum of the “known” components: within + between + covariance
TOT_between Between component
TOT_covariance Covariance term
TOT_diff LP_1 minus the difference between unweighted and weighted TFP
CompNet database User Guide 26
5.2 Financial indicators
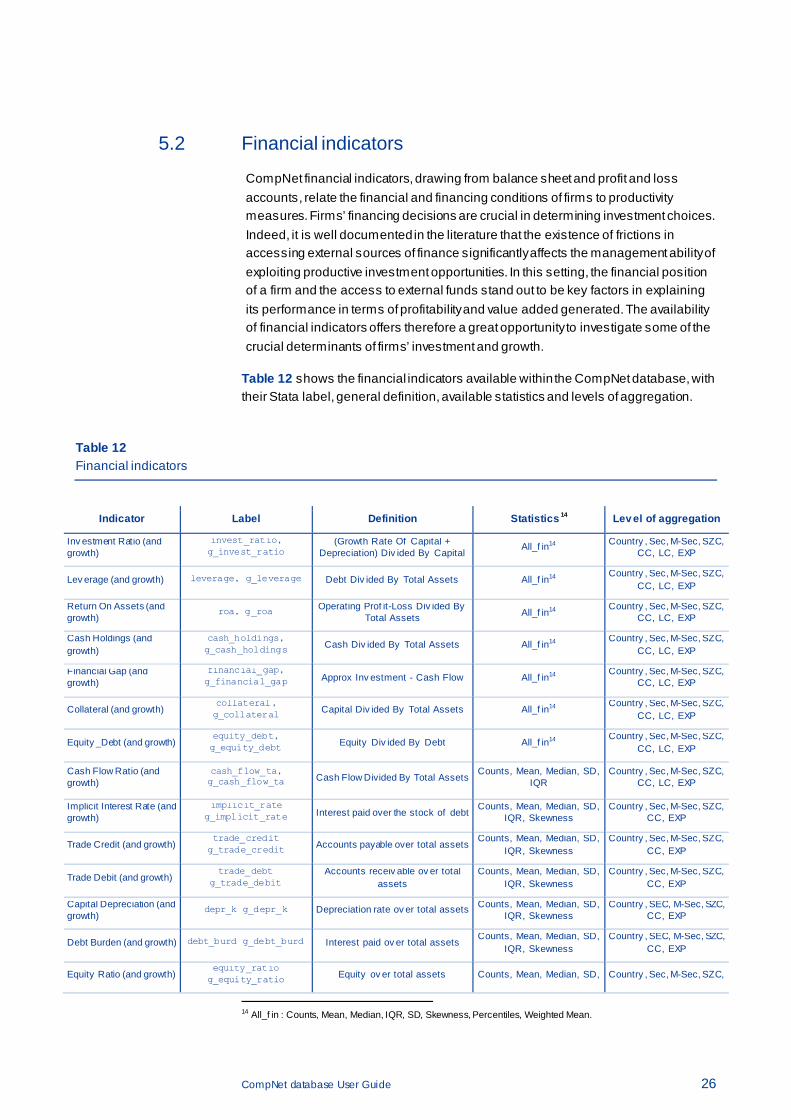
CompNet financial indicators, drawing from balance sheet and profit and loss accounts, relate the financial and financing conditions of firms to productivity measures. Firms’ financing decisions are crucial in determining investment choices. Indeed, it is well documented in the literature that the existence of frictions in accessing external sources of finance significantly affects the management ability of exploiting productive investment opportunities. In this setting, the financial position of a firm and the access to external funds stand out to be key factors in explaining its performance in terms of profitability and value added generated. The availability of financial indicators offers therefore a great opportunity to investigate some of the crucial determinants of firms’ investment and growth.
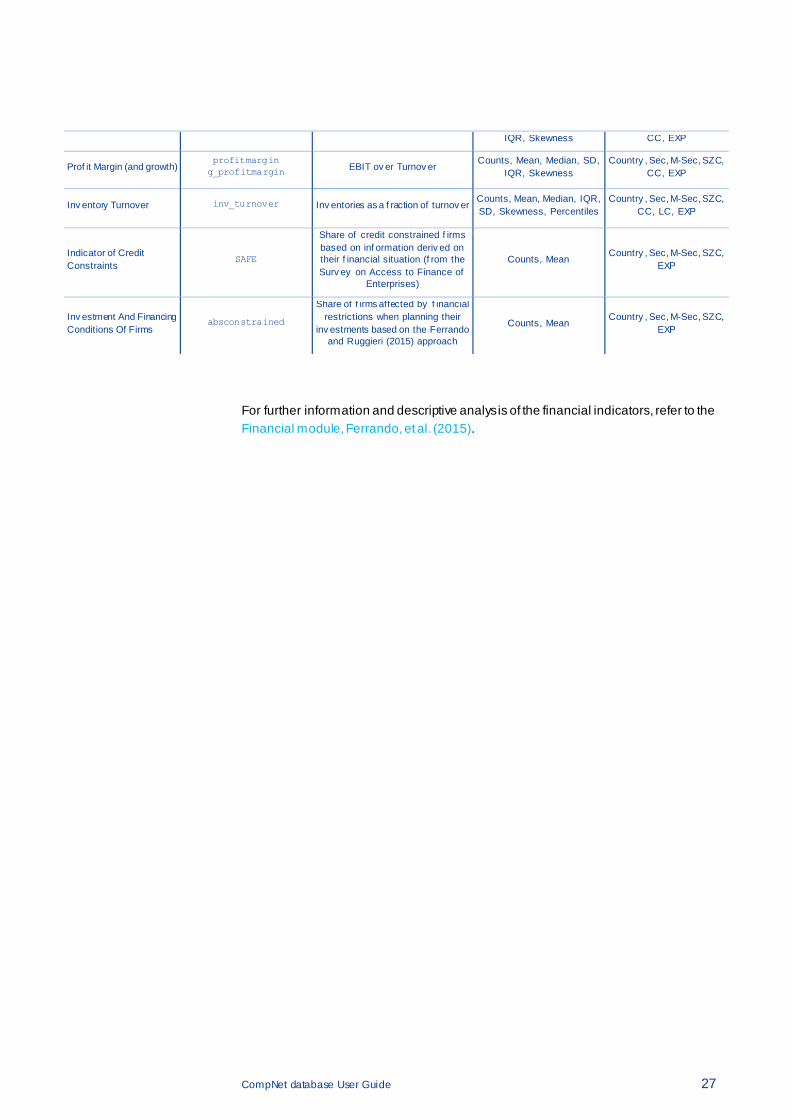
Table 12 shows the financial indicators available within the CompNet database, with their Stata label, general definition, available statistics and levels of aggregation.
Table 12 Financial indicators
Indicator Label Definition Statistics 14 Lev el of aggregation
Inv estment Ratio (and growth)
invest_ratio, g_invest_ratio
(Growth Rate Of Capital + Depreciation) Div ided By Capital
All_f in14 Country , Sec, M-Sec, SZC, CC, LC, EXP
Lev erage (and growth) leverage, g_leverage Debt Div ided By Total Assets All_f in14 Country , Sec, M-Sec, SZC,
CC, LC, EXP
Return On Assets (and growth)
roa, g_roa Operating Prof it-Loss Div ided By Total Assets All_f in14
Country , Sec, M-Sec, SZC, CC, LC, EXP
Cash Holdings (and growth)
cash_holdings, g_cash_holdings Cash Div ided By Total Assets All_f in14
Country , Sec, M-Sec, SZC, CC, LC, EXP
Financial Gap (and growth)
financial_gap, g_financial_gap Approx Inv estment - Cash Flow All_f in14
Country , Sec, M-Sec, SZC, CC, LC, EXP
Collateral (and growth) collateral, g_collateral Capital Div ided By Total Assets All_f in14
Country , Sec, M-Sec, SZC, CC, LC, EXP
Equity _Debt (and growth) equity_debt, g_equity_debt Equity Div ided By Debt All_f in14
Country , Sec, M-Sec, SZC, CC, LC, EXP
Cash Flow Ratio (and growth)
cash_flow_ta, g_cash_flow_ta Cash Flow Divided By Total Assets
Counts, Mean, Median, SD, IQR
Country , Sec, M-Sec, SZC, CC, LC, EXP
Implicit Interest Rate (and growth)
implicit_rate g_implicit_rate Interest paid over the stock of debt
Counts, Mean, Median, SD, IQR, Skewness
Country , Sec, M-Sec, SZC, CC, EXP
Trade Credit (and growth) trade_credit g_trade_credit Accounts payable over total assets
Counts, Mean, Median, SD, IQR, Skewness
Country , Sec, M-Sec, SZC, CC, EXP
Trade Debit (and growth) trade_debt
g_trade_debit Accounts receiv able ov er total
assets Counts, Mean, Median, SD,
IQR, Skewness Country , Sec, M-Sec, SZC,
CC, EXP
Capital Depreciation (and growth)
depr_k g_depr_k Depreciation rate ov er total assets Counts, Mean, Median, SD, IQR, Skewness
Country , SEC, M-Sec, SZC, CC, EXP
Debt Burden (and growth) debt_burd g_debt_burd Interest paid ov er total assets Counts, Mean, Median, SD,
IQR, Skewness Country , SEC, M-Sec, SZC,
CC, EXP
Equity Ratio (and growth) equity_ratio g_equity_ratio Equity ov er total assets Counts, Mean, Median, SD, Country , Sec, M-Sec, SZC,
14 All_f in : Counts, Mean, Median, IQR, SD, Skewness, Percentiles, Weighted Mean.
CompNet database User Guide 27
IQR, Skewness CC, EXP
Prof it Margin (and growth) profitmargin g_profitmargin EBIT ov er Turnov er
Counts, Mean, Median, SD, IQR, Skewness
Country , Sec, M-Sec, SZC, CC, EXP
Inv entory Turnover inv_turnover Inv entories as a f raction of turnov er Counts, Mean, Median, IQR, SD, Skewness, Percentiles
Country , Sec, M-Sec, SZC, CC, LC, EXP
Indicator of Credit Constraints
SAFE
Share of credit constrained f irms based on inf ormation deriv ed on their f inancial situation (f rom the Surv ey on Access to Finance of
Enterprises)
Counts, Mean Country , Sec, M-Sec, SZC,
EXP
Inv estment And Financing Conditions Of Firms
absconstrained
Share of f irms affected by f inancial restrictions when planning their
inv estments based on the Ferrando and Ruggieri (2015) approach
Counts, Mean Country , Sec, M-Sec, SZC,
EXP
For further information and descriptive analysis of the financial indicators, refer to the Financial module, Ferrando, et al. (2015).
CompNet database User Guide 28
5.3 Labour indicators
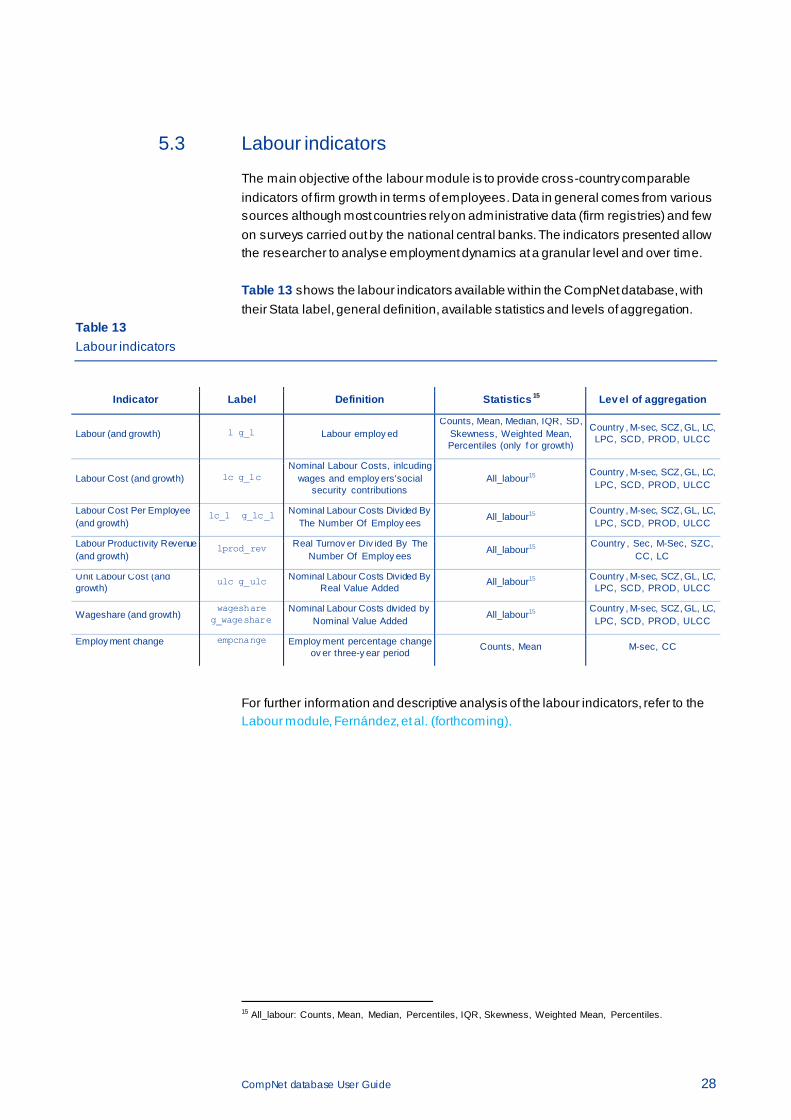
The main objective of the labour module is to provide cross-country comparable indicators of firm growth in terms of employees. Data in general comes from various sources although most countries rely on administrative data (firm registries) and few on surveys carried out by the national central banks. The indicators presented allow the researcher to analyse employment dynamics at a granular level and over time. Table 13 shows the labour indicators available within the CompNet database, with their Stata label, general definition, available statistics and levels of aggregation.
Table 13 Labour indicators
Indicator Label Definition Statistics 15 Lev el of aggregation
Labour (and growth) l g_l Labour employ ed Counts, Mean, Median, IQR, SD,
Skewness, Weighted Mean, Percentiles (only f or growth)
Country , M-sec, SCZ, GL, LC, LPC, SCD, PROD, ULCC
Labour Cost (and growth) lc g_lc Nominal Labour Costs, inlcuding
wages and employ ers'social security contributions
All_labour15 Country , M-sec, SCZ, GL, LC, LPC, SCD, PROD, ULCC
Labour Cost Per Employee (and growth)
lc_l g_lc_l Nominal Labour Costs Divided By The Number Of Employ ees
All_labour15 Country , M-sec, SCZ, GL, LC, LPC, SCD, PROD, ULCC
Labour Productivity Revenue (and growth)
lprod_rev Real Turnov er Div ided By The Number Of Employ ees
All_labour15 Country , Sec, M-Sec, SZC,
CC, LC
Unit Labour Cost (and growth)
ulc g_ulc Nominal Labour Costs Divided By Real Value Added
All_labour15 Country , M-sec, SCZ, GL, LC, LPC, SCD, PROD, ULCC
Wageshare (and growth) wageshare
g_wageshare Nominal Labour Costs divided by
Nominal Value Added All_labour15
Country , M-sec, SCZ, GL, LC, LPC, SCD, PROD, ULCC
Employ ment change
empchange
Employ ment percentage change ov er three-y ear period
Counts, Mean M-sec, CC
For further information and descriptive analysis of the labour indicators, refer to the Labour module, Fernández, et al. (forthcoming).
15 All_labour: Counts, Mean, Median, Percentiles, IQR, Skewness, Weighted Mean, Percentiles.
CompNet database User Guide 29
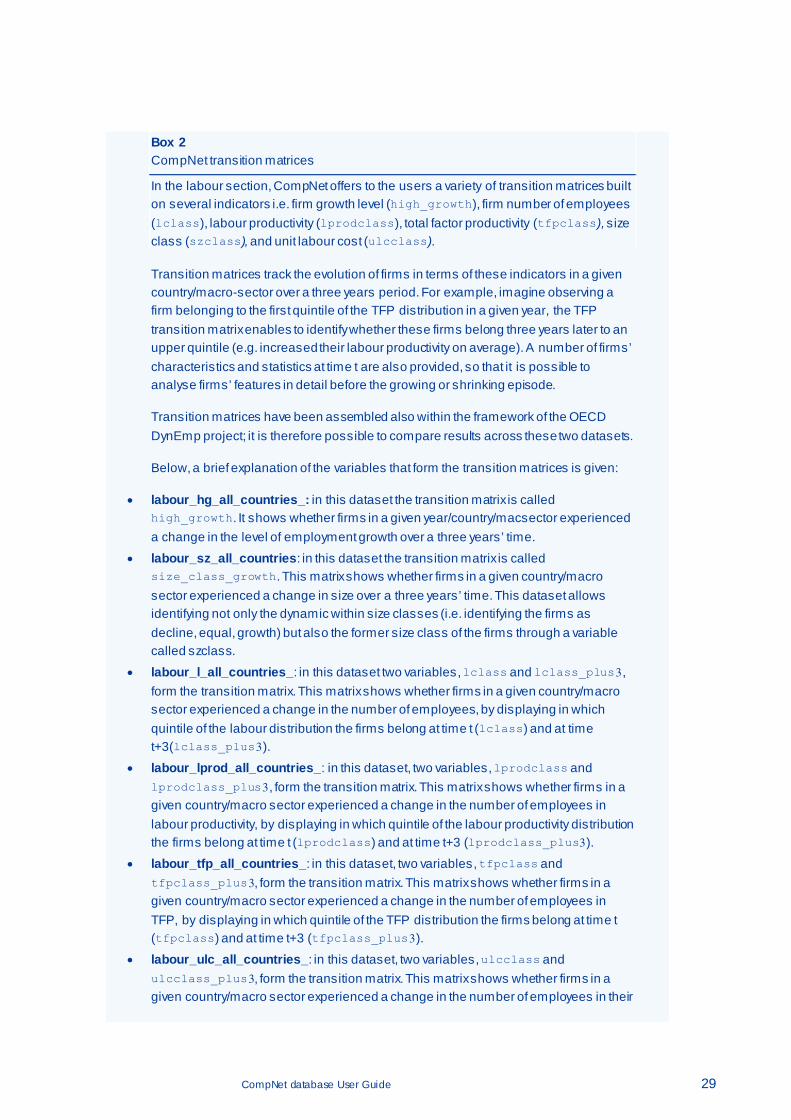
Box 2 CompNet transition matrices
In the labour section, CompNet offers to the users a variety of transition matrices built on several indicators i.e. firm growth level (high_growth), firm number of employees (lclass), labour productivity (lprodclass), total factor productivity (tfpclass), size class (szclass), and unit labour cost (ulcclass).
Transition matrices track the evolution of firms in terms of these indicators in a given country/macro-sector over a three years period. For example, imagine observing a firm belonging to the first quintile of the TFP distribution in a given year, the TFP transition matrix enables to identify whether these firms belong three years later to an upper quintile (e.g. increased their labour productivity on average). A number of firms’ characteristics and statistics at time t are also provided, so that it is possible to analyse firms’ features in detail before the growing or shrinking episode.
Transition matrices have been assembled also within the framework of the OECD DynEmp project; it is therefore possible to compare results across these two datasets.
Below, a brief explanation of the variables that form the transition matrices is given:
• labour_hg_all_countries_: in this dataset the transition matrix is called high_growth. It shows whether firms in a given year/country/macsector experienced a change in the level of employment growth over a three years’ time.
• labour_sz_all_countries: in this dataset the transition matrix is called size_class_growth. This matrix shows whether firms in a given country/macro sector experienced a change in size over a three years’ time. This dataset allows identifying not only the dynamic within size classes (i.e. identifying the firms as decline, equal, growth) but also the former size class of the firms through a variable called szclass.
• labour_l_all_countries_: in this dataset two variables, lclass and lclass_plus3, form the transition matrix. This matrix shows whether firms in a given country/macro sector experienced a change in the number of employees, by displaying in which quintile of the labour distribution the firms belong at time t (lclass) and at time t+3(lclass_plus3).
• labour_lprod_all_countries_: in this dataset, two variables, lprodclass and lprodclass_plus3, form the transition matrix. This matrix shows whether firms in a given country/macro sector experienced a change in the number of employees in labour productivity, by displaying in which quintile of the labour productivity distribution the firms belong at time t (lprodclass) and at time t+3 (lprodclass_plus3).
• labour_tfp_all_countries_: in this dataset, two variables, tfpclass and tfpclass_plus3, form the transition matrix. This matrix shows whether firms in a given country/macro sector experienced a change in the number of employees in TFP, by displaying in which quintile of the TFP distribution the firms belong at time t (tfpclass) and at time t+3 (tfpclass_plus3).
• labour_ulc_all_countries_: in this dataset, two variables, ulcclass and ulcclass_plus3, form the transition matrix. This matrix shows whether firms in a given country/macro sector experienced a change in the number of employees in their
CompNet database User Guide 30
unit labour cost, by displaying in which quintile of the unit labour cost distribution the firms belong at time t (ulcclass) and at time t+3 (ulcclass_plus3).
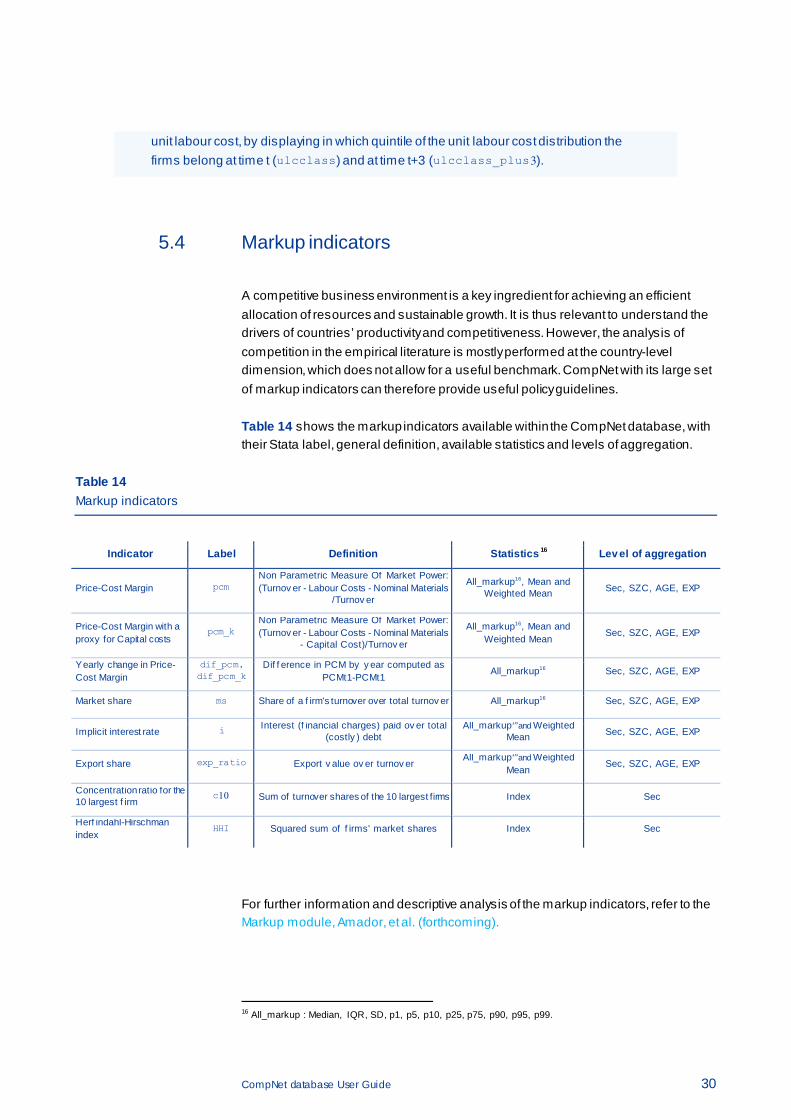
5.4 Markup indicators
A competitive business environment is a key ingredient for achieving an efficient allocation of resources and sustainable growth. It is thus relevant to understand the drivers of countries’ productivity and competitiveness. However, the analysis of competition in the empirical literature is mostly performed at the country-level dimension, which does not allow for a useful benchmark. CompNet with its large set of markup indicators can therefore provide useful policy guidelines. Table 14 shows the markup indicators available within the CompNet database, with their Stata label, general definition, available statistics and levels of aggregation.
Table 14 Markup indicators
Indicator Label Definition Statistics 16 Lev el of aggregation
Price-Cost Margin pcm Non Parametric Measure Of Market Power: (Turnov er - Labour Costs - Nominal Materials
/Turnov er
All_markup16, Mean and Weighted Mean Sec, SZC, AGE, EXP
Price-Cost Margin with a proxy for Capital costs
pcm_k Non Parametric Measure Of Market Power: (Turnov er - Labour Costs - Nominal Materials
- Capital Cost)/Turnov er
All_markup16, Mean and Weighted Mean
Sec, SZC, AGE, EXP
Yearly change in Price-Cost Margin
dif_pcm, dif_pcm_k
Dif f erence in PCM by y ear computed as PCMt1-PCMt1
All_markup16 Sec, SZC, AGE, EXP
Market share ms Share of a f irm's turnover over total turnov er All_markup16 Sec, SZC, AGE, EXP
Implicit interest rate i Interest (f inancial charges) paid ov er total (costly ) debt
All_markup16and Weighted Mean Sec, SZC, AGE, EXP
Export share exp_ratio Export v alue ov er turnov er All_markup16and Weighted
Mean Sec, SZC, AGE, EXP
Concentration ratio for the 10 largest f irm
c10 Sum of turnover shares of the 10 largest firms Index Sec
Herf indahl-Hirschman index
HHI Squared sum of f irms' market shares Index Sec
For further information and descriptive analysis of the markup indicators, refer to the Markup module, Amador, et al. (forthcoming).
16 All_markup : Median, IQR, SD, p1, p5, p10, p25, p75, p90, p95, p99.
CompNet database User Guide 31
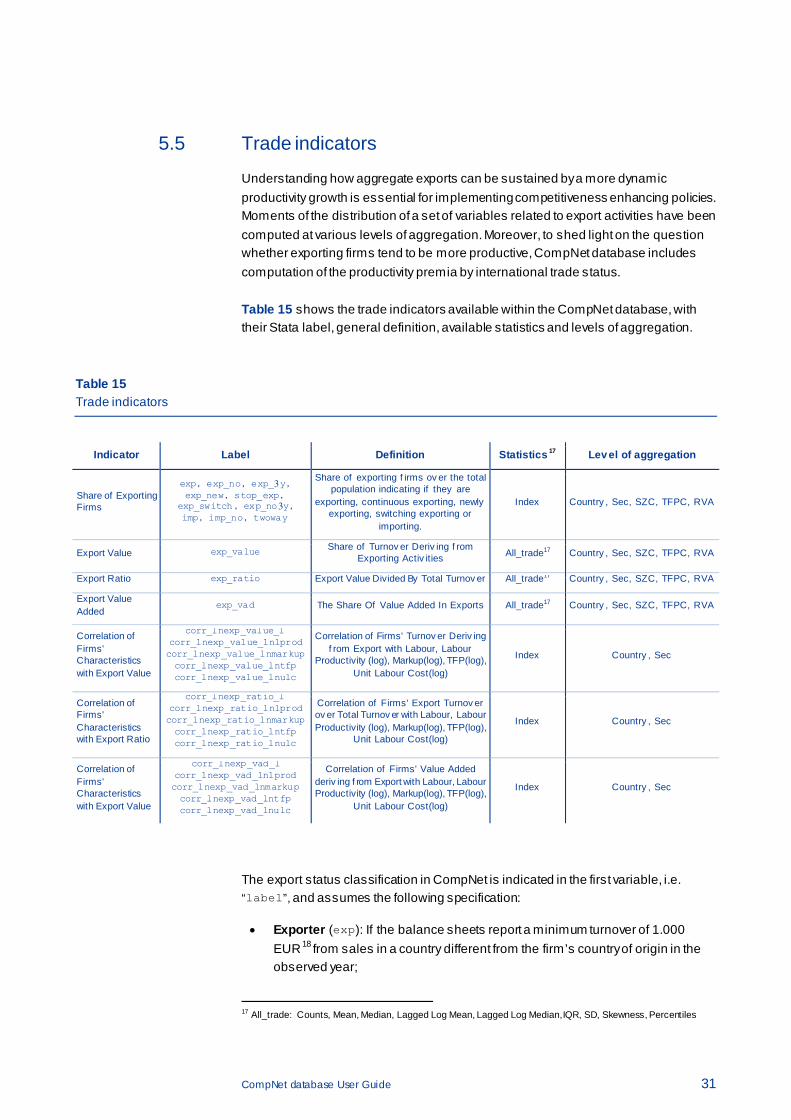
5.5 Trade indicators
Understanding how aggregate exports can be sustained by a more dynamic productivity growth is essential for implementing competitiveness enhancing policies. Moments of the distribution of a set of variables related to export activities have been computed at various levels of aggregation. Moreover, to shed light on the question whether exporting firms tend to be more productive, CompNet database includes computation of the productivity premia by international trade status. Table 15 shows the trade indicators available within the CompNet database, with their Stata label, general definition, available statistics and levels of aggregation.
Table 15 Trade indicators
Indicator Label Definition Statistics 17 Lev el of aggregation
Share of Exporting Firms
exp, exp_no, exp_3y, exp_new, stop_exp,
exp_switch, exp_no3y, imp, imp_no, twoway
Share of exporting f irms ov er the total population indicating if they are
exporting, continuous exporting, newly exporting, switching exporting or
importing.
Index Country , Sec, SZC, TFPC, RVA
Export Value exp_value Share of Turnov er Deriv ing f rom Exporting Activ ities All_trade17 Country , Sec, SZC, TFPC, RVA
Export Ratio exp_ratio Export Value Divided By Total Turnov er All_trade17 Country , Sec, SZC, TFPC, RVA
Export Value Added
exp_vad The Share Of Value Added In Exports All_trade17 Country , Sec, SZC, TFPC, RVA
Correlation of Firms' Characteristics with Export Value
corr_lnexp_value_l corr_lnexp_value_lnlprod corr_lnexp_value_lnmarkup corr_lnexp_value_lntfp corr_lnexp_value_lnulc
Correlation of Firms' Turnov er Deriv ing f rom Export with Labour, Labour
Productivity (log), Markup(log), TFP(log), Unit Labour Cost(log)
Index Country , Sec
Correlation of Firms' Characteristics with Export Ratio
corr_lnexp_ratio_l corr_lnexp_ratio_lnlprod corr_lnexp_ratio_lnmarkup corr_lnexp_ratio_lntfp corr_lnexp_ratio_lnulc
Correlation of Firms' Export Turnov er ov er Total Turnov er with Labour, Labour Productivity (log), Markup(log), TFP(log),
Unit Labour Cost(log)
Index Country , Sec
Correlation of Firms' Characteristics with Export Value
corr_lnexp_vad_l corr_lnexp_vad_lnlprod corr_lnexp_vad_lnmarkup corr_lnexp_vad_lntfp corr_lnexp_vad_lnulc
Correlation of Firms' Value Added deriv ing f rom Export with Labour, Labour Productivity (log), Markup(log), TFP(log),
Unit Labour Cost(log)
Index Country , Sec
The export status classification in CompNet is indicated in the first variable, i.e. “label”, and assumes the following specification:
• Exporter (exp): If the balance sheets report a minimum turnover of 1.000 EUR18 from sales in a country different from the firm’s country of origin in the observed year;
17 All_trade: Counts, Mean, Median, Lagged Log Mean, Lagged Log Median,IQR, SD, Skewness, Percentiles
CompNet database User Guide 32
• Permanent exporter (exp_3y): If the balance sheets report minimum turnover of 1.000 EUR from sales in a country different from the firm’s country of origin in the observed year as well as the previous and the next ones;
• New exporter (exp_new): If the balance sheets report minimum turnover of 1.000 EUR from sales in a country different from the firm’s country of origin in the observed year as well as the next one;
• Non exporter (exp_no): If the balance sheets do not report any turnover from sales in a country different from the firm’s country of origin in the observed year;
• Permanent non exporter (exp_no3y): If the balance sheets report turnover from sales in a country different from the firm’s country of origin neither in the observed year nor the previous nor the next ones;
• Temporary exporter (exp_switch): If the balance sheets report minimum turnover of 1.000 EUR from sales in a country different from the firm’s country of origin in the observed year but not in the previous and next year;
• Exiter (stop_exp): If the balance sheets report minimum turnover of 1.000 EUR from sales in a country different from the firm’s country of origin in the observed year as well as in the previous one but not in the next year;
• Importer (imp): If the balance sheets report costs sustained by the firm against firms in a country different from the firm’s country of origin in the observed year;
• Non importer (imp_no): If the balance sheets do not report costs sustained by the firm against firms in a country different from the firm’s country of origin in the observed year;
An additional classification is provided to extend the analysis of firms’ international activities, namely:
• Two-way trader (twoway): If the firm is considered both an exporter and an importer in the observed year;
• Firms where the export is not relevant (catx_1): When the export accounts for 1% or less of total turnover;
• Firms where the export is hardly relevant (catx_1to5): When the export accounts for 1% to 5% of total turnover;
• Firms where the export is slightly relevant (catx_5to10): When the export accounts for 5% to 10% of total turnover;
• Firms where the export is relevant (catx_10to50): When the export accounts for 10% to 50% of total turnover;
• Firms where the export is largely relevant (catx_50): When the export accounts for more than 50% of total turnover;
• Top 5 exporters in a given level of aggregation by turnover deriving by exporting activities (top5_x) or employment (top5_l);
• Top 10 exporters in a given level of aggregation by turnover deriving by exporting activities (top10_x) or employment (top10_l);
18 Note that f or countries that use custom or intra-Stat / extra-Stat declarations to observ e exports at the
f irm lev el, the minimum amount of exports may be much larger (f or instance, in Belgium f or the 2006-2010 period, intra EU trade is observ ed f or f irms exporting to the EU 27 at least 600,000 EUR in a giv en y ear).
CompNet database User Guide 33
• Exporters that account for 60% of the total value of export by turnover in a given level of aggregation (top60pct_x).
For further information and descriptive analysis of the trade indicators, refer to the Trade module paper, Berthou, et al. (2015).
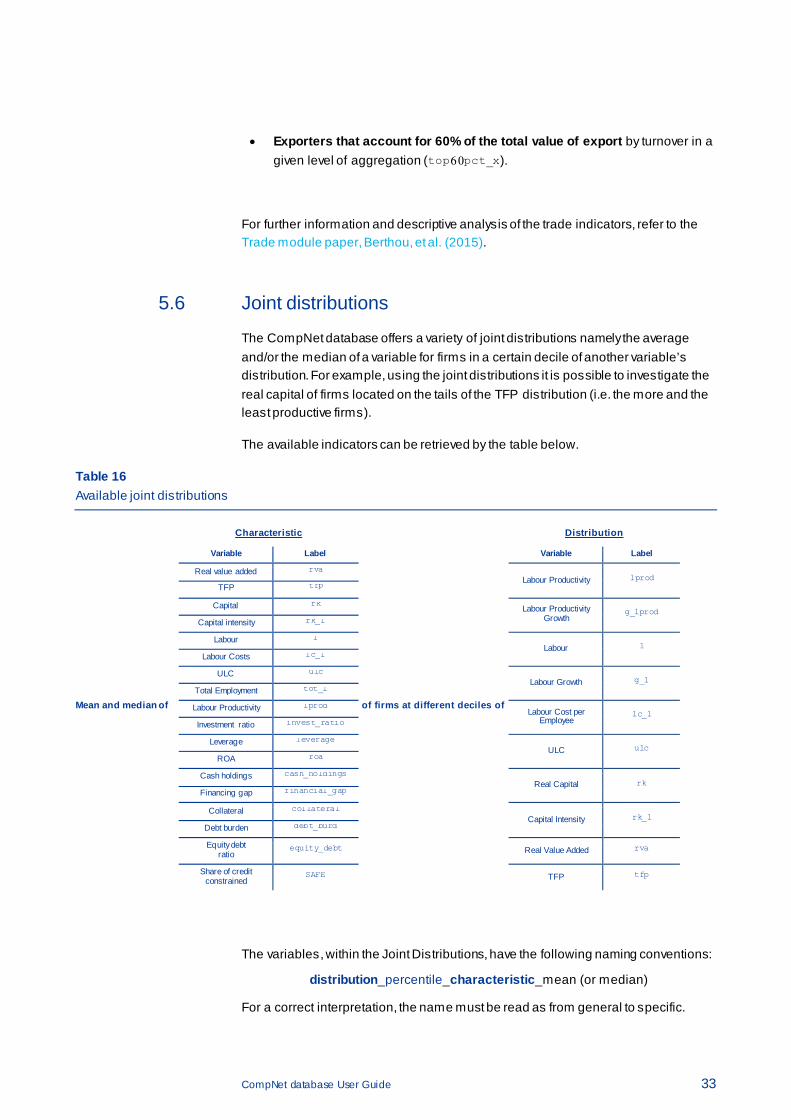
5.6 Joint distributions
The CompNet database offers a variety of joint distributions namely the average and/or the median of a variable for firms in a certain decile of another variable’s distribution. For example, using the joint distributions it is possible to investigate the real capital of firms located on the tails of the TFP distribution (i.e. the more and the least productive firms).
The available indicators can be retrieved by the table below.
Table 16 Available joint distributions
Mean and median of
Characteristic
of firms at different deciles of
Distribution
Variable Label Variable Label
Real value added rva Labour Productivity lprod
TFP tfp
Capital rk Labour Productivity Growth
g_lprod Capital intensity rk_l
Labour l Labour l
Labour Costs lc_l
ULC ulc Labour Growth g_l
Total Employment tot_l
Labour Productivity lprod Labour Cost per
Employee lc_l
Investment ratio invest_ratio
Leverage leverage ULC ulc
ROA roa
Cash holdings cash_holdings Real Capital rk
Financing gap financial_gap
Collateral collateral Capital Intensity rk_l
Debt burden debt_burd
Equity debt ratio
equity_debt Real Value Added rva
Share of credit constrained
SAFE TFP tfp
The variables, within the Joint Distributions, have the following naming conventions:
distribution_percentile_characteristic_mean (or median)
For a correct interpretation, the name must be read as from general to specific.

CompNet database User Guide 34
Precisely the first word is the variable relevant in terms of distribution, the second part is the percentile of interest, the third part displays the characteristic investigated, while the last part tell the user whether the statistic reported is the median or the average of the characteristic investigated. Some examples are: - g_lprod_p30_tfp_median indicates the median of TFP for the 3rd decile of the
growth rate of labour productivity. - rva_p90_SAFE_mean indicates the average share of credit constrained firms in
the 90th percentile of real value added.
CompNet database User Guide 35
6 How to use the database
This chapter provides a detailed description of the datasets available within CompNet. Datasets are grouped by content i.e. descriptive, productivity, financial, labour, markup, trade and joint distributions.
Each section provides the following information: names of the datasets (presented in a table), list of all the indicators included and their availability.
General introduction to the datasets
Before moving to a detailed description of each dataset, some general rules according to which the user can easily navigate in the database are provided below.
Each dataset name is structured as follows:
Content_dimension_sample.dta
The three different labels represent different information regarding the data:
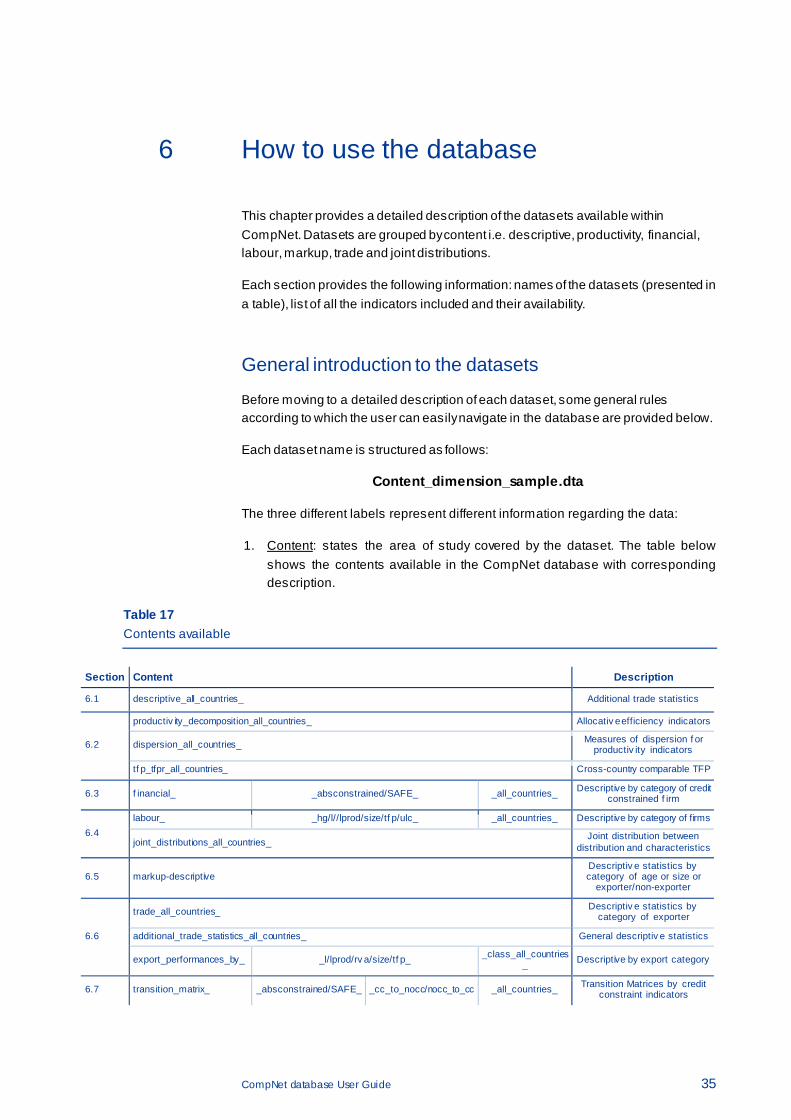
1. Content: states the area of study covered by the dataset. The table below shows the contents available in the CompNet database with corresponding description.
Table 17 Contents available
Section Content Description
6.1 descriptive_all_countries_ Additional trade statistics
6.2
productiv ity_decomposition_all_countries_ Allocativ e efficiency indicators
dispersion_all_countries_ Measures of dispersion f or productiv ity indicators
tf p_tfpr_all_countries_ Cross-country comparable TFP
6.3 f inancial_ _absconstrained/SAFE_ _all_countries_ Descriptive by category of credit constrained f irm
6.4 labour_ _hg/l//lprod/size/tf p/ulc_ _all_countries_ Descriptive by category of firms
joint_distributions_all_countries_ Joint distribution between
distribution and characteristics
6.5 markup-descriptive Descriptiv e statistics by category of age or size or
exporter/non-exporter
6.6
trade_all_countries_ Descriptiv e statistics by category of exporter
additional_trade_statistics_all_countries_ General descriptiv e statistics
export_performances_by_ _l/lprod/rv a/size/tf p_ _class_all_countries_ Descriptive by export category
6.7 transition_matrix_ _absconstrained/SAFE_ _cc_to_nocc/nocc_to_cc _all_countries_ Transition Matrices by credit constraint indicators
CompNet database User Guide 36
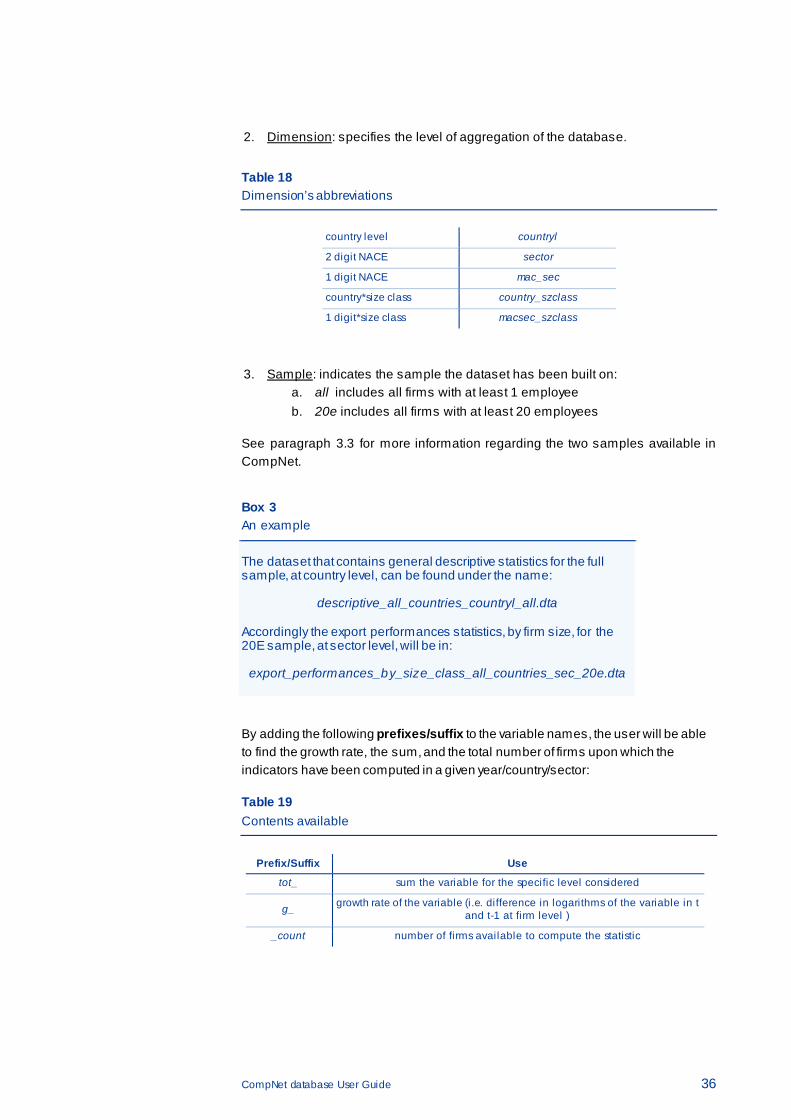
2. Dimension: specifies the level of aggregation of the database.
Table 18 Dimension’s abbreviations
country level countryl
2 digit NACE sector
1 digit NACE mac_sec
country*size class country_szclass
1 digit*size class macsec_szclass
3. Sample: indicates the sample the dataset has been built on: a. all includes all firms with at least 1 employee b. 20e includes all firms with at least 20 employees
See paragraph 3.3 for more information regarding the two samples available in CompNet.
Box 3 An example
The dataset that contains general descriptive statistics for the full sample, at country level, can be found under the name:
descriptive_all_countries_countryl_all.dta
Accordingly the export performances statistics, by firm size, for the 20E sample, at sector level, will be in:
export_performances_by_size_class_all_countries_sec_20e.dta
By adding the following prefixes/suffix to the variable names, the user will be able to find the growth rate, the sum, and the total number of firms upon which the indicators have been computed in a given year/country/sector:
Table 19 Contents available
Prefix/Suffix Use
tot_ sum the variable for the specific level considered
g_ growth rate of the variable (i.e. difference in logarithms of the variable in t and t-1 at firm level )
_count number of firms available to compute the statistic
CompNet database User Guide 37
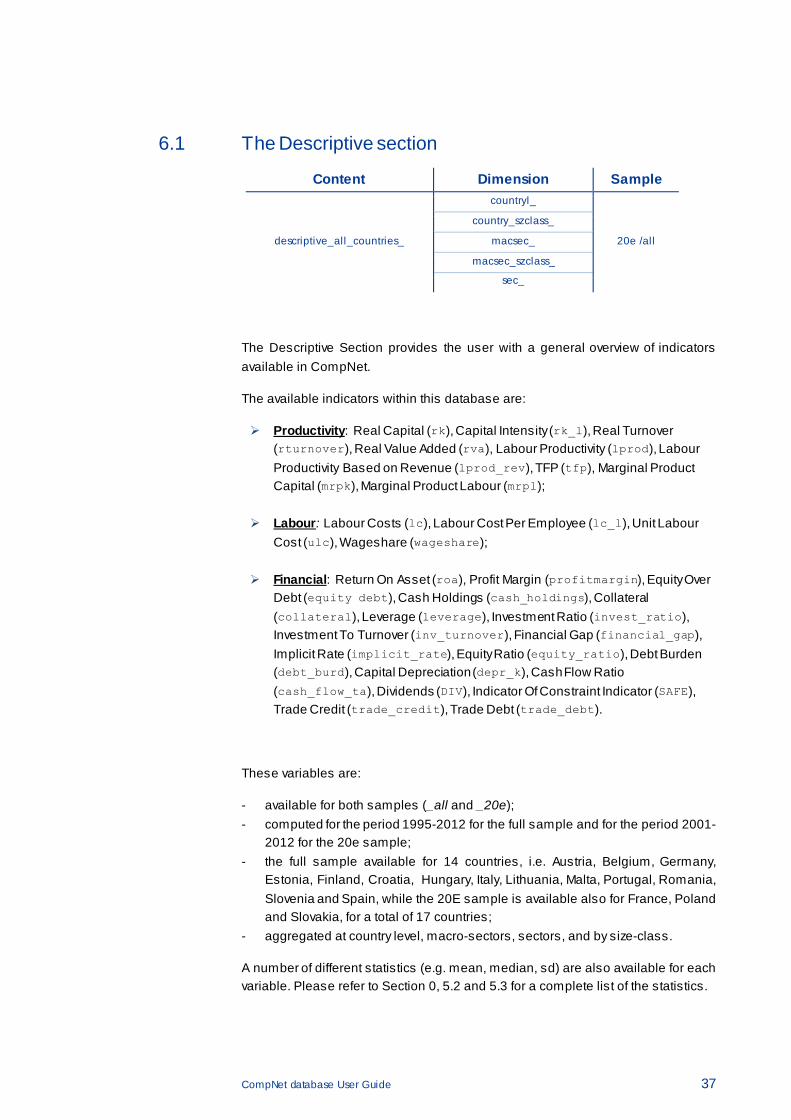
6.1 The Descriptive section
Content Dimension Sample
descriptive_all_countries_
countryl_
20e /all
country_szclass_
macsec_
macsec_szclass_
sec_
The Descriptive Section provides the user with a general overview of indicators available in CompNet.
The available indicators within this database are:
Productivity: Real Capital (rk), Capital Intensity (rk_l), Real Turnover (rturnover), Real Value Added (rva), Labour Productivity (lprod), Labour Productivity Based on Revenue (lprod_rev), TFP (tfp), Marginal Product Capital (mrpk), Marginal Product Labour (mrpl);
Labour: Labour Costs (lc), Labour Cost Per Employee (lc_l), Unit Labour Cost (ulc), Wageshare (wageshare);
Financial: Return On Asset (roa), Profit Margin (profitmargin), Equity Over Debt (equity debt), Cash Holdings (cash_holdings), Collateral (collateral), Leverage (leverage), Investment Ratio (invest_ratio), Investment To Turnover (inv_turnover), Financial Gap (financial_gap), Implicit Rate (implicit_rate), Equity Ratio (equity_ratio), Debt Burden (debt_burd), Capital Depreciation (depr_k), Cash Flow Ratio (cash_flow_ta), Dividends (DIV), Indicator Of Constraint Indicator (SAFE), Trade Credit (trade_credit), Trade Debt (trade_debt).
These variables are:
- available for both samples (_all and _20e); - computed for the period 1995-2012 for the full sample and for the period 2001-
2012 for the 20e sample; - the full sample available for 14 countries, i.e. Austria, Belgium, Germany,
Estonia, Finland, Croatia, Hungary, Italy, Lithuania, Malta, Portugal, Romania, Slovenia and Spain, while the 20E sample is available also for France, Poland and Slovakia, for a total of 17 countries;
- aggregated at country level, macro-sectors, sectors, and by size-class.
A number of different statistics (e.g. mean, median, sd) are also available for each variable. Please refer to Section 0, 5.2 and 5.3 for a complete list of the statistics.
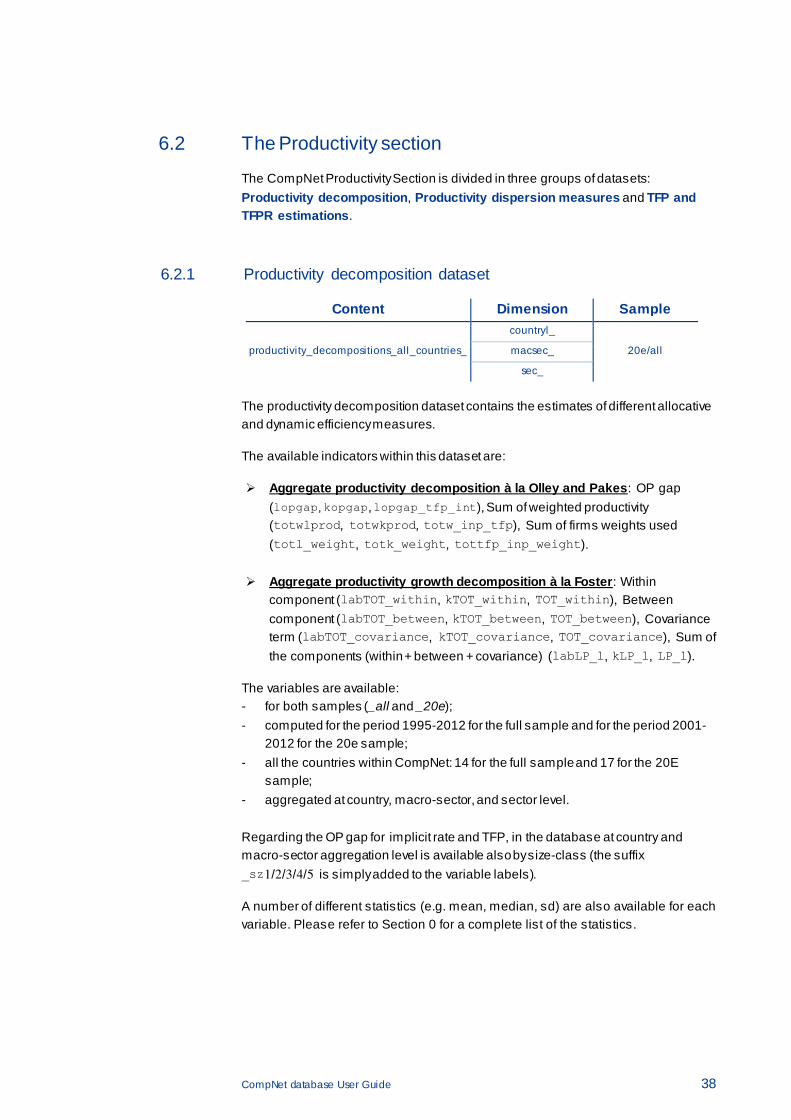
CompNet database User Guide 38
6.2 The Productivity section
The CompNet Productivity Section is divided in three groups of datasets: Productivity decomposition, Productivity dispersion measures and TFP and TFPR estimations.
6.2.1 Productivity decomposition dataset
Content Dimension Sample
productivity_decompositions_all_countries_
countryl_
20e/all macsec_
sec_
The productivity decomposition dataset contains the estimates of different allocative and dynamic efficiency measures.
The available indicators within this dataset are:
Aggregate productivity decomposition à la Olley and Pakes: OP gap (lopgap, kopgap, lopgap_tfp_int), Sum of weighted productivity (totwlprod, totwkprod, totw_inp_tfp), Sum of firms weights used (totl_weight, totk_weight, tottfp_inp_weight).
Aggregate productivity growth decomposition à la Foster: Within component (labTOT_within, kTOT_within, TOT_within), Between component (labTOT_between, kTOT_between, TOT_between), Covariance term (labTOT_covariance, kTOT_covariance, TOT_covariance), Sum of the components (within + between + covariance) (labLP_l, kLP_l, LP_l).
The variables are available: - for both samples (_all and _20e); - computed for the period 1995-2012 for the full sample and for the period 2001-
2012 for the 20e sample; - all the countries within CompNet: 14 for the full sample and 17 for the 20E
sample; - aggregated at country, macro-sector, and sector level.
Regarding the OP gap for implicit rate and TFP, in the database at country and macro-sector aggregation level is available also by size-class (the suffix _sz1/2/3/4/5 is simply added to the variable labels).
A number of different statistics (e.g. mean, median, sd) are also available for each variable. Please refer to Section 0 for a complete list of the statistics.
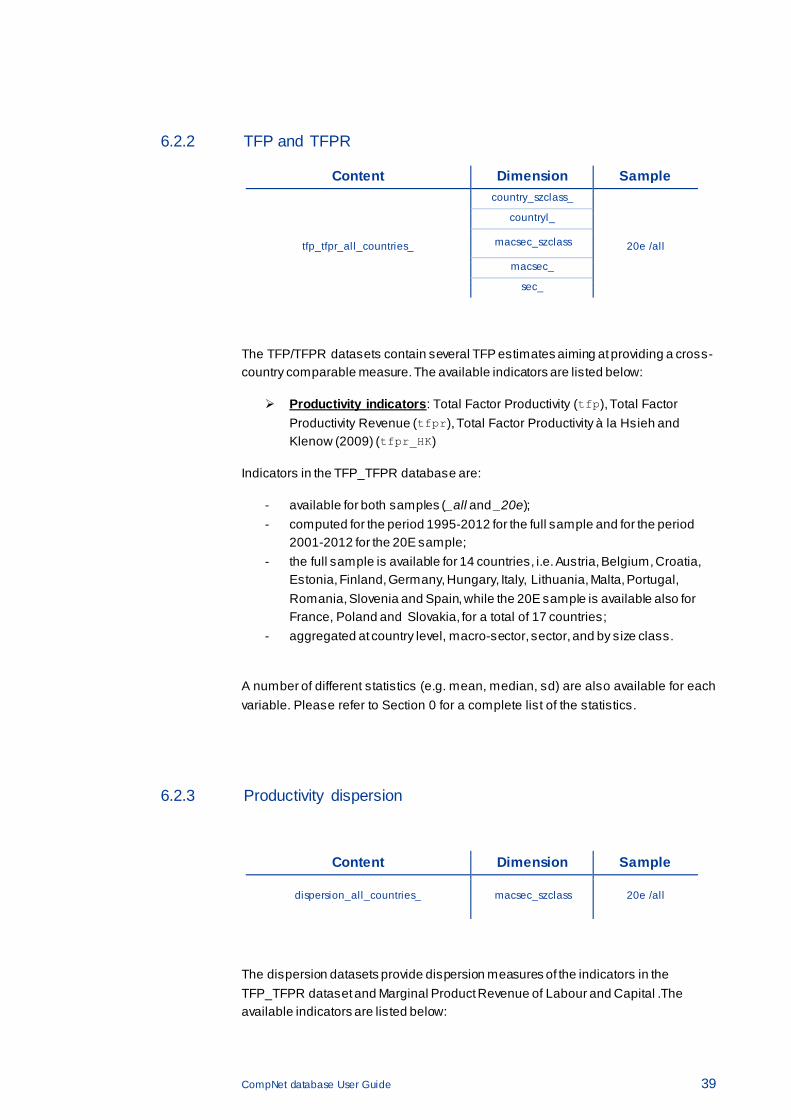
CompNet database User Guide 39
6.2.2 TFP and TFPR
Content Dimension Sample
tfp_tfpr_all_countries_
country_szclass_
20e /all
countryl_
macsec_szclass
macsec_
sec_
The TFP/TFPR datasets contain several TFP estimates aiming at providing a cross-country comparable measure. The available indicators are listed below:
Productivity indicators: Total Factor Productivity (tfp), Total Factor Productivity Revenue (tfpr), Total Factor Productivity à la Hsieh and Klenow (2009) (tfpr_HK)
Indicators in the TFP_TFPR database are:
- available for both samples (_all and _20e); - computed for the period 1995-2012 for the full sample and for the period
2001-2012 for the 20E sample; - the full sample is available for 14 countries, i.e. Austria, Belgium, Croatia,
Estonia, Finland, Germany, Hungary, Italy, Lithuania, Malta, Portugal, Romania, Slovenia and Spain, while the 20E sample is available also for France, Poland and Slovakia, for a total of 17 countries;
- aggregated at country level, macro-sector, sector, and by size class.
A number of different statistics (e.g. mean, median, sd) are also available for each variable. Please refer to Section 0 for a complete list of the statistics.
6.2.3 Productivity dispersion
Content Dimension Sample
dispersion_all_countries_
macsec_szclass 20e /all
The dispersion datasets provide dispersion measures of the indicators in the TFP_TFPR dataset and Marginal Product Revenue of Labour and Capital .The available indicators are listed below:
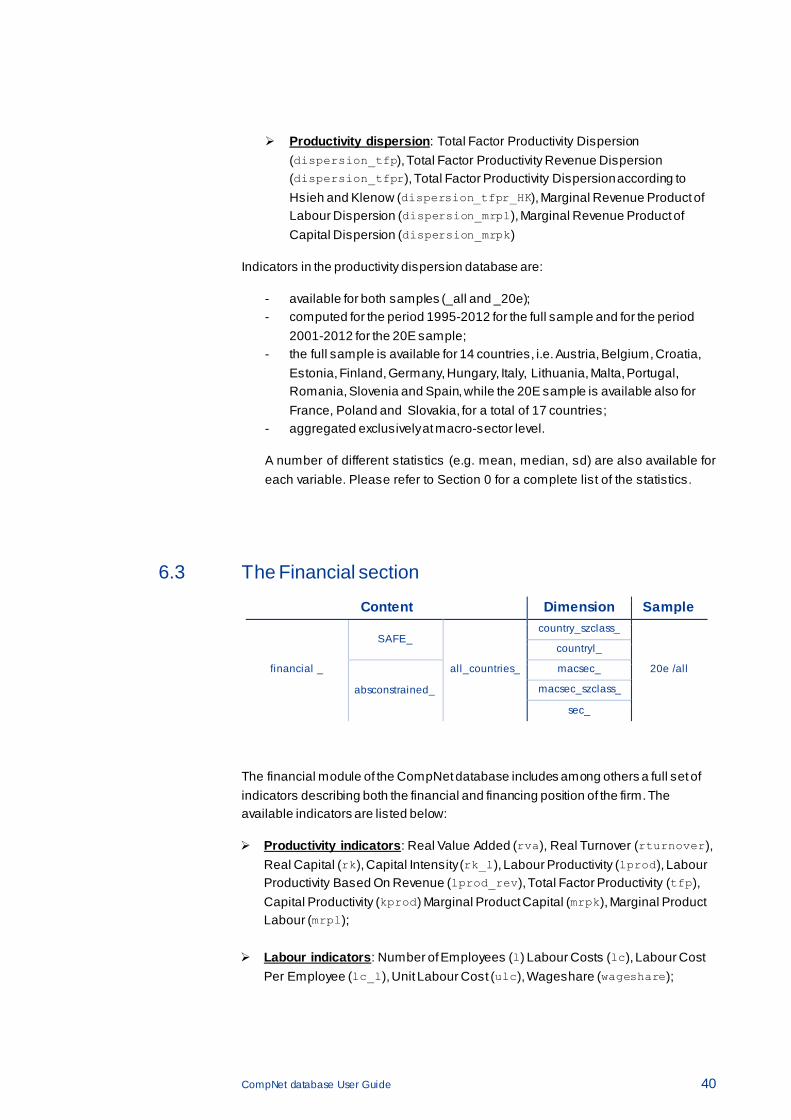
CompNet database User Guide 40
Productivity dispersion: Total Factor Productivity Dispersion (dispersion_tfp), Total Factor Productivity Revenue Dispersion (dispersion_tfpr), Total Factor Productivity Dispersion according to Hsieh and Klenow (dispersion_tfpr_HK), Marginal Revenue Product of Labour Dispersion (dispersion_mrpl), Marginal Revenue Product of Capital Dispersion (dispersion_mrpk)
Indicators in the productivity dispersion database are:
- available for both samples (_all and _20e); - computed for the period 1995-2012 for the full sample and for the period
2001-2012 for the 20E sample; - the full sample is available for 14 countries, i.e. Austria, Belgium, Croatia,
Estonia, Finland, Germany, Hungary, Italy, Lithuania, Malta, Portugal, Romania, Slovenia and Spain, while the 20E sample is available also for France, Poland and Slovakia, for a total of 17 countries;
- aggregated exclusively at macro-sector level.
A number of different statistics (e.g. mean, median, sd) are also available for each variable. Please refer to Section 0 for a complete list of the statistics.
6.3 The Financial section
Content Dimension Sample
financial _
SAFE_
all_countries_
country_szclass_
20e /all
countryl_
absconstrained_
macsec_
macsec_szclass_
sec_
The financial module of the CompNet database includes among others a full set of indicators describing both the financial and financing position of the firm. The available indicators are listed below:
Productivity indicators: Real Value Added (rva), Real Turnover (rturnover), Real Capital (rk), Capital Intensity (rk_l), Labour Productivity (lprod), Labour Productivity Based On Revenue (lprod_rev), Total Factor Productivity (tfp), Capital Productivity (kprod) Marginal Product Capital (mrpk), Marginal Product Labour (mrpl);
Labour indicators: Number of Employees (l) Labour Costs (lc), Labour Cost Per Employee (lc_l), Unit Labour Cost (ulc), Wageshare (wageshare);
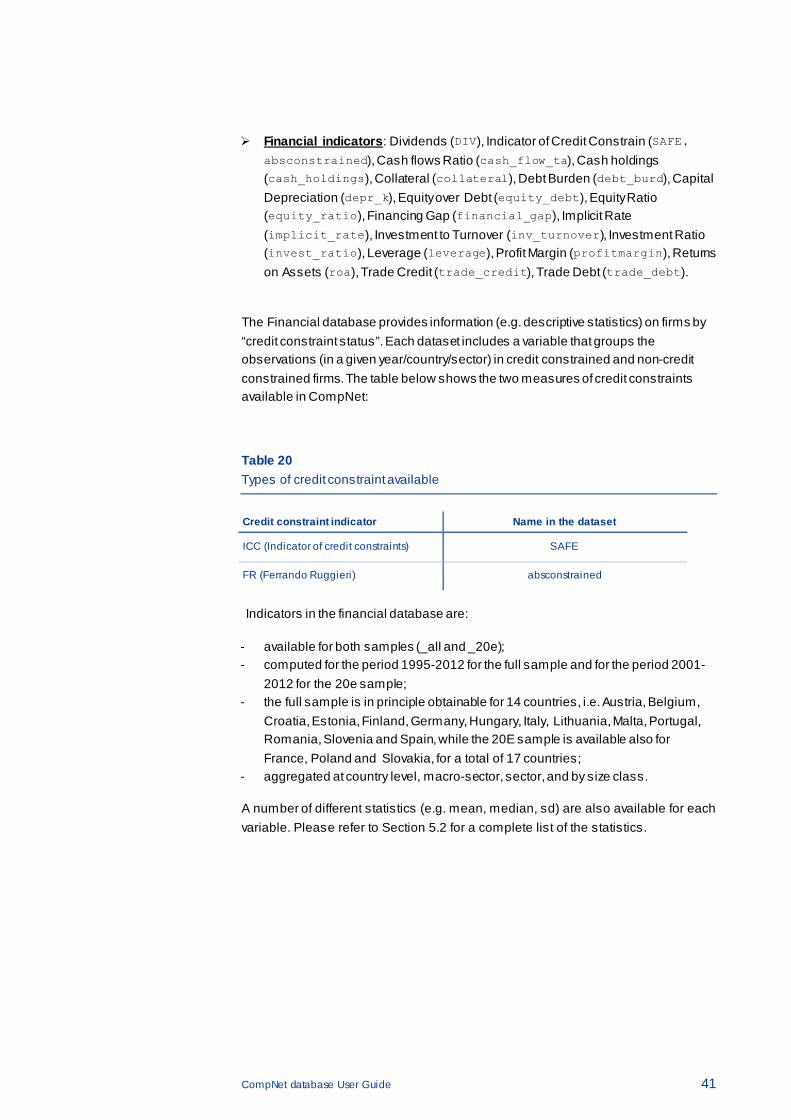
CompNet database User Guide 41
Financial indicators: Dividends (DIV), Indicator of Credit Constrain (SAFE, absconstrained), Cash flows Ratio (cash_flow_ta), Cash holdings (cash_holdings), Collateral (collateral), Debt Burden (debt_burd), Capital Depreciation (depr_k), Equity over Debt (equity_debt), Equity Ratio (equity_ratio), Financing Gap (financial_gap), Implicit Rate (implicit_rate), Investment to Turnover (inv_turnover), Investment Ratio (invest_ratio), Leverage (leverage), Profit Margin (profitmargin), Returns on Assets (roa), Trade Credit (trade_credit), Trade Debt (trade_debt).
The Financial database provides information (e.g. descriptive statistics) on firms by “credit constraint status”. Each dataset includes a variable that groups the observations (in a given year/country/sector) in credit constrained and non-credit constrained firms. The table below shows the two measures of credit constraints available in CompNet:
Table 20 Types of credit constraint available
Credit constraint indicator Name in the dataset
ICC (Indicator of credit constraints) SAFE
FR (Ferrando Ruggieri) absconstrained
Indicators in the financial database are:
- available for both samples (_all and _20e); - computed for the period 1995-2012 for the full sample and for the period 2001-
2012 for the 20e sample; - the full sample is in principle obtainable for 14 countries, i.e. Austria, Belgium,
Croatia, Estonia, Finland, Germany, Hungary, Italy, Lithuania, Malta, Portugal, Romania, Slovenia and Spain, while the 20E sample is available also for France, Poland and Slovakia, for a total of 17 countries;
- aggregated at country level, macro-sector, sector, and by size class.
A number of different statistics (e.g. mean, median, sd) are also available for each variable. Please refer to Section 5.2 for a complete list of the statistics.
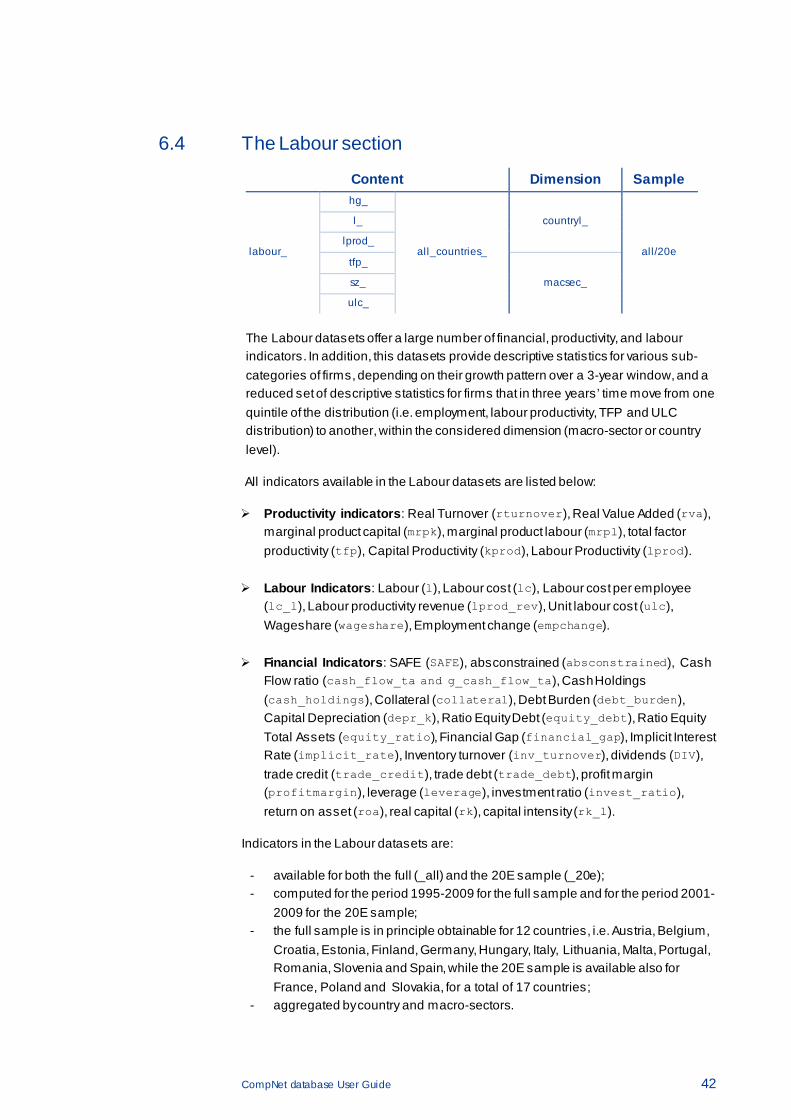
CompNet database User Guide 42
6.4 The Labour section
The Labour datasets offer a large number of financial, productivity, and labour indicators. In addition, this datasets provide descriptive statistics for various sub-categories of firms, depending on their growth pattern over a 3-year window, and a reduced set of descriptive statistics for firms that in three years’ time move from one quintile of the distribution (i.e. employment, labour productivity, TFP and ULC distribution) to another, within the considered dimension (macro-sector or country level).
All indicators available in the Labour datasets are listed below:
Productivity indicators: Real Turnover (rturnover), Real Value Added (rva), marginal product capital (mrpk), marginal product labour (mrpl), total factor productivity (tfp), Capital Productivity (kprod), Labour Productivity (lprod).
Labour Indicators: Labour (l), Labour cost (lc), Labour cost per employee (lc_l), Labour productivity revenue (lprod_rev), Unit labour cost (ulc), Wageshare (wageshare), Employment change (empchange).
Financial Indicators: SAFE (SAFE), absconstrained (absconstrained), Cash Flow ratio (cash_flow_ta and g_cash_flow_ta), Cash Holdings (cash_holdings), Collateral (collateral), Debt Burden (debt_burden), Capital Depreciation (depr_k), Ratio Equity Debt (equity_debt), Ratio Equity Total Assets (equity_ratio), Financial Gap (financial_gap), Implicit Interest Rate (implicit_rate), Inventory turnover (inv_turnover), dividends (DIV), trade credit (trade_credit), trade debt (trade_debt), profit margin (profitmargin), leverage (leverage), investment ratio (invest_ratio), return on asset (roa), real capital (rk), capital intensity (rk_l).
Indicators in the Labour datasets are:
- available for both the full (_all) and the 20E sample (_20e); - computed for the period 1995-2009 for the full sample and for the period 2001-
2009 for the 20E sample; - the full sample is in principle obtainable for 12 countries, i.e. Austria, Belgium,
Croatia, Estonia, Finland, Germany, Hungary, Italy, Lithuania, Malta, Portugal, Romania, Slovenia and Spain, while the 20E sample is available also for France, Poland and Slovakia, for a total of 17 countries;
- aggregated by country and macro-sectors.
Content Dimension Sample
labour_
hg_
all_countries_
countryl_
all/20e
l_
lprod_
tfp_
macsec_ sz_
ulc_
CompNet database User Guide 43
The distinguishing factor, which characterizes the four datasets, is the presence of transition matrices related to a number of sub-dimensions (i.e. level of growth, labour class, labour productivity, size, total factor productivity and unit labour cost). These sub-dimensions are:
• Level of employment growth (Labour_hg_all_countries): In this dataset, all variables listed above can be found. Within this dataset, there is a variable that categorizes the different firms observed (in year/country/macro-sector) depending on their cumulative percentage growth in employment over a 3-years period, named high_growth. Accordingly, five classes of firms arise: (1) decline (negative growth larger than -3.03% over 3 years); (2) remain equal (growth between -3.03% and +3.03%); (3) small growth (between 3.03% and 33.1%); (4) high growth (between 33.1% and 72.8%) and (5) very high-growth firms (over 72.8%).
• Number of Employees (Labour_l_all_countries ), all variables listed above can be found. In this dataset, there is a variable called lclass that assumes values from 1 to 5 indicating the quintiles of the distribution of the number of employees. The result is that the overall number of observations is distributed into 5 different size classes according to the amount of workers employed within the firm.
• Labour Productivity (Labour_lprod_all_countries), all variables listed above can be found. In this dataset, there is a variable called lprodclass that assumes values from 1 to 5 indicating the quintiles of the labour productivity distribution. Accordingly, observations are divided by the ten deciles of the labour productivity distribution in the relevant level of aggregation (country/sector);
• Total Factor Productivity (Labour_tfp_all_countries): In this dataset, there is a variable called tfpclass that assumes values from 1 to 5 indicating the quintiles of the total factor productivity distribution. Accordingly, observations are divided by the five quintiles of the total factor productivity distribution in the relevant level of aggregation (country/sector);
• Size Class (Labour_sz_all_countries): In this dataset, there is a variable called szclass that assumes values from 1 to 5 (3 to 5 in the 20E sample) and indicates the size class of the firms considered in that specific cell. Accordingly, observations are divided by the 5 size class used within CompNet (1-9, 10-19, 20-49, 50-249, 250+ employees) in the relevant level of aggregation;
• Unit Labour Cost (Labour_ulc_all_countries): In this dataset, there is a variable called ulclass that assumes values from 1 to 5 indicating the quintiles of the unit labour cost distribution. Accordingly, observations are divided by the five quintiles of the unit labour cost distribution in the relevant level of aggregation (country/sector).
A number of different statistics (e.g. mean, median, sd) are also available for each variable. Please refer to Section 5.3 for a complete list of the statistics.
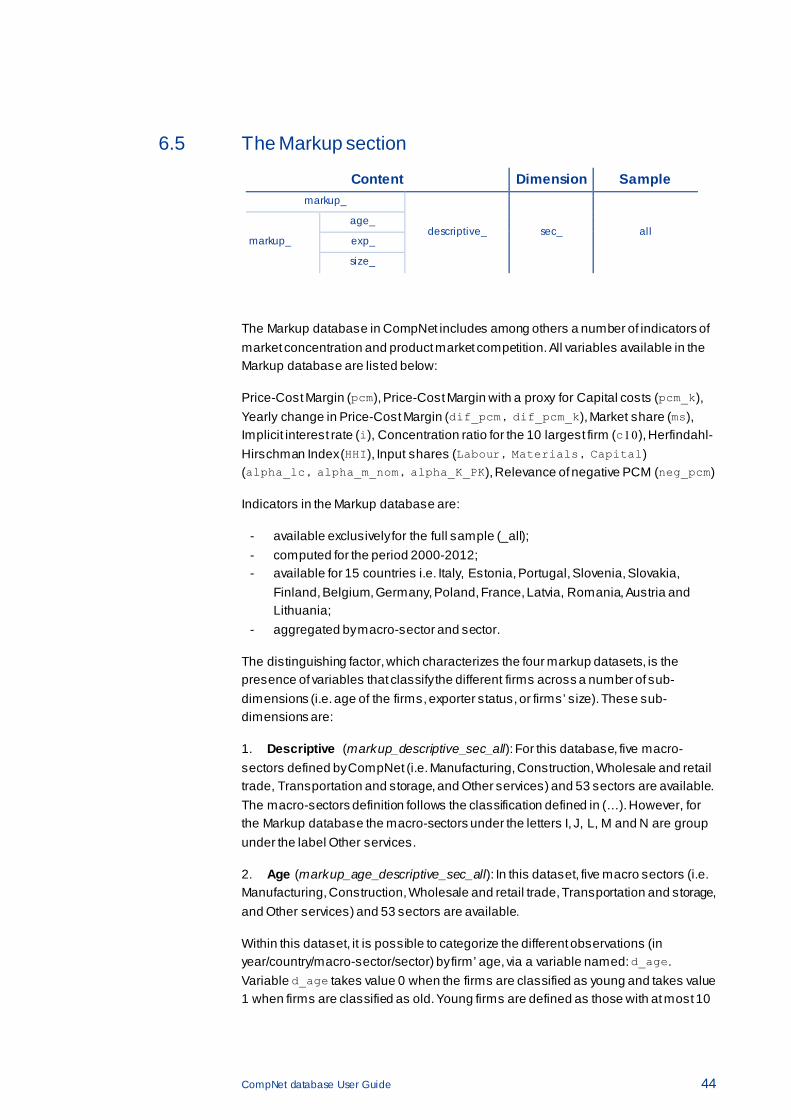
CompNet database User Guide 44
6.5 The Markup section
Content Dimension Sample markup_
descriptive_ sec_ all markup_
age_
exp_
size_
The Markup database in CompNet includes among others a number of indicators of market concentration and product market competition. All variables available in the Markup database are listed below:
Price-Cost Margin (pcm), Price-Cost Margin with a proxy for Capital costs (pcm_k), Yearly change in Price-Cost Margin (dif_pcm, dif_pcm_k), Market share (ms), Implicit interest rate (i), Concentration ratio for the 10 largest firm (c10), Herfindahl-Hirschman Index (HHI), Input shares (Labour, Materials, Capital) (alpha_lc, alpha_m_nom, alpha_K_PK), Relevance of negative PCM (neg_pcm)
Indicators in the Markup database are:
- available exclusively for the full sample (_all); - computed for the period 2000-2012; - available for 15 countries i.e. Italy, Estonia, Portugal, Slovenia, Slovakia,
Finland, Belgium, Germany, Poland, France, Latvia, Romania, Austria and Lithuania;
- aggregated by macro-sector and sector.
The distinguishing factor, which characterizes the four markup datasets, is the presence of variables that classify the different firms across a number of sub-dimensions (i.e. age of the firms, exporter status, or firms’ size). These sub-dimensions are:
1. Descriptive (markup_descriptive_sec_all): For this database, five macro-sectors defined by CompNet (i.e. Manufacturing, Construction, Wholesale and retail trade, Transportation and storage, and Other services) and 53 sectors are available. The macro-sectors definition follows the classification defined in (…). However, for the Markup database the macro-sectors under the letters I, J, L, M and N are group under the label Other services.
2. Age (markup_age_descriptive_sec_all): In this dataset, five macro sectors (i.e. Manufacturing, Construction, Wholesale and retail trade, Transportation and storage, and Other services) and 53 sectors are available.
Within this dataset, it is possible to categorize the different observations (in year/country/macro-sector/sector) by firm’ age, via a variable named: d_age. Variable d_age takes value 0 when the firms are classified as young and takes value 1 when firms are classified as old. Young firms are defined as those with at most 10
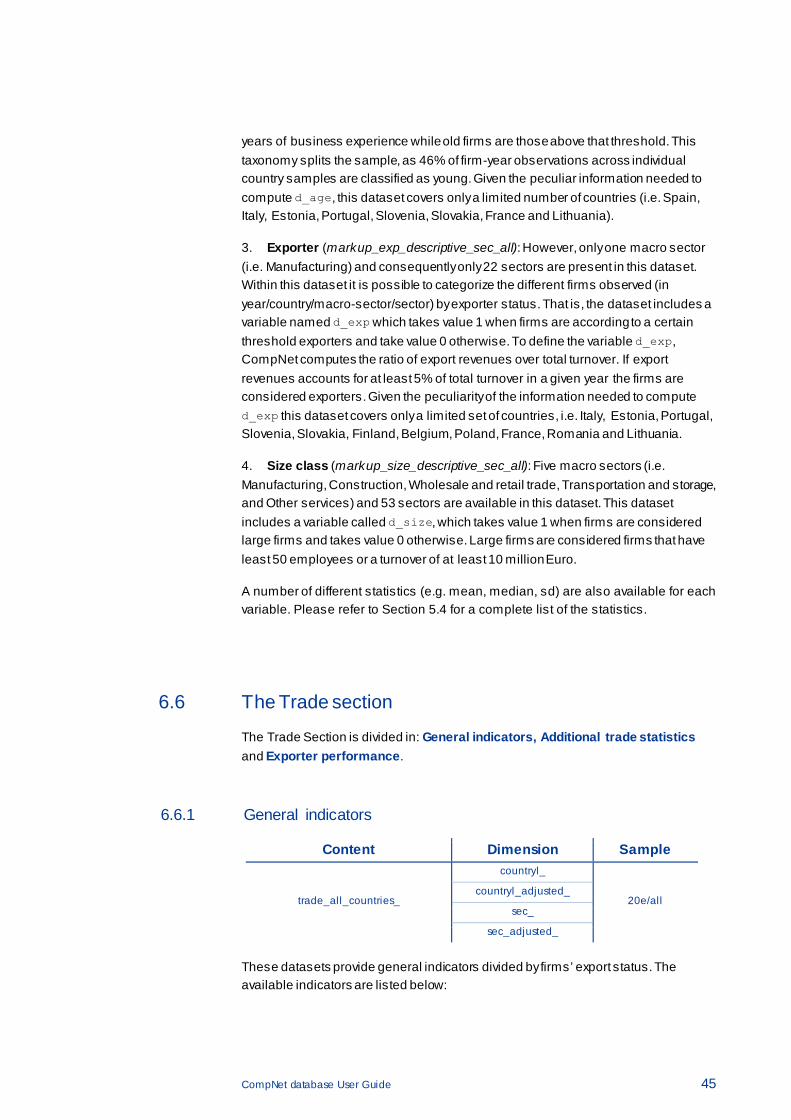
CompNet database User Guide 45
years of business experience while old firms are those above that threshold. This taxonomy splits the sample, as 46% of firm-year observations across individual country samples are classified as young. Given the peculiar information needed to compute d_age, this dataset covers only a limited number of countries (i.e. Spain, Italy, Estonia, Portugal, Slovenia, Slovakia, France and Lithuania).
3. Exporter (markup_exp_descriptive_sec_all): However, only one macro sector (i.e. Manufacturing) and consequently only 22 sectors are present in this dataset. Within this dataset it is possible to categorize the different firms observed (in year/country/macro-sector/sector) by exporter status. That is, the dataset includes a variable named d_exp which takes value 1 when firms are according to a certain threshold exporters and take value 0 otherwise. To define the variable d_exp, CompNet computes the ratio of export revenues over total turnover. If export revenues accounts for at least 5% of total turnover in a given year the firms are considered exporters. Given the peculiarity of the information needed to compute d_exp this dataset covers only a limited set of countries, i.e. Italy, Estonia, Portugal, Slovenia, Slovakia, Finland, Belgium, Poland, France, Romania and Lithuania.
4. Size class (markup_size_descriptive_sec_all): Five macro sectors (i.e. Manufacturing, Construction, Wholesale and retail trade, Transportation and storage, and Other services) and 53 sectors are available in this dataset. This dataset includes a variable called d_size, which takes value 1 when firms are considered large firms and takes value 0 otherwise. Large firms are considered firms that have least 50 employees or a turnover of at least 10 million Euro.
A number of different statistics (e.g. mean, median, sd) are also available for each variable. Please refer to Section 5.4 for a complete list of the statistics.
6.6 The Trade section
The Trade Section is divided in: General indicators, Additional trade statistics and Exporter performance.
6.6.1 General indicators
Content Dimension Sample
trade_all_countries_
countryl_
20e/all countryl_adjusted_
sec_
sec_adjusted_
These datasets provide general indicators divided by firms’ export status. The available indicators are listed below:
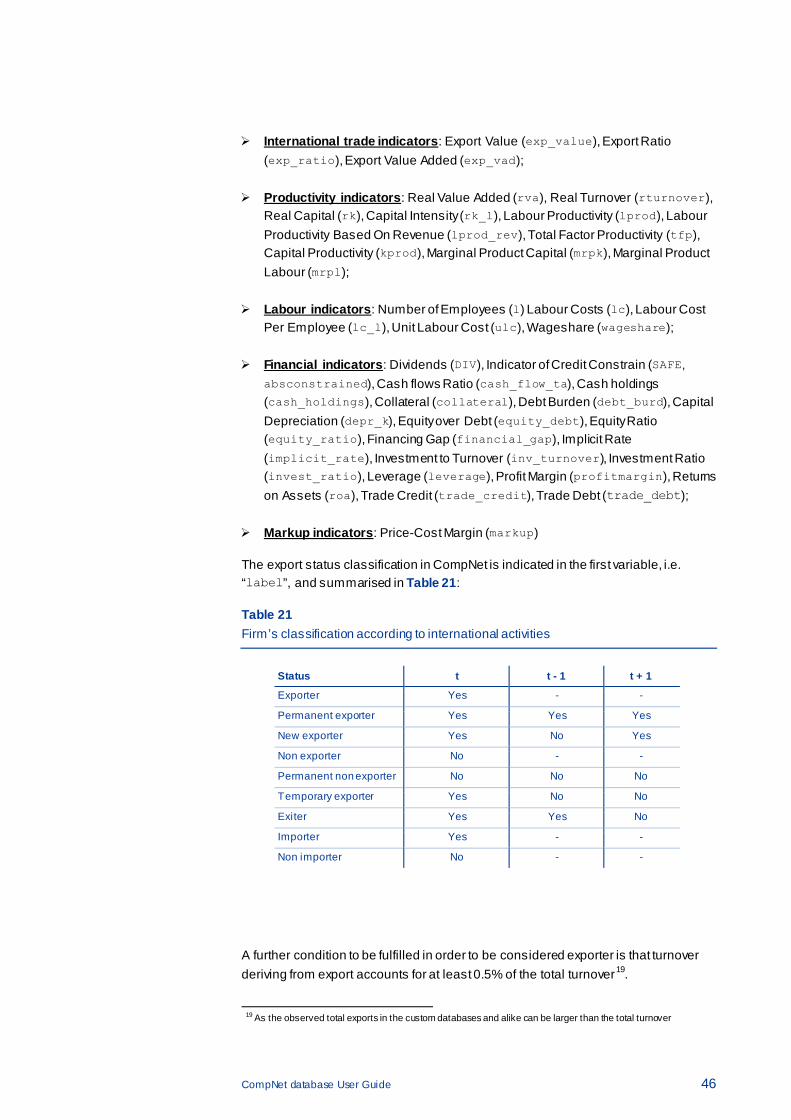
CompNet database User Guide 46
International trade indicators: Export Value (exp_value), Export Ratio (exp_ratio), Export Value Added (exp_vad);
Productivity indicators: Real Value Added (rva), Real Turnover (rturnover), Real Capital (rk), Capital Intensity (rk_l), Labour Productivity (lprod), Labour Productivity Based On Revenue (lprod_rev), Total Factor Productivity (tfp), Capital Productivity (kprod), Marginal Product Capital (mrpk), Marginal Product Labour (mrpl);
Labour indicators: Number of Employees (l) Labour Costs (lc), Labour Cost Per Employee (lc_l), Unit Labour Cost (ulc), Wageshare (wageshare);
Financial indicators: Dividends (DIV), Indicator of Credit Constrain (SAFE, absconstrained), Cash flows Ratio (cash_flow_ta), Cash holdings (cash_holdings), Collateral (collateral), Debt Burden (debt_burd), Capital Depreciation (depr_k), Equity over Debt (equity_debt), Equity Ratio (equity_ratio), Financing Gap (financial_gap), Implicit Rate (implicit_rate), Investment to Turnover (inv_turnover), Investment Ratio (invest_ratio), Leverage (leverage), Profit Margin (profitmargin), Returns on Assets (roa), Trade Credit (trade_credit), Trade Debt (trade_debt);
Markup indicators: Price-Cost Margin (markup)
The export status classification in CompNet is indicated in the first variable, i.e. “label”, and summarised in Table 21:
Table 21 Firm’s classification according to international activities
Status t t - 1 t + 1
Exporter Yes - -
Permanent exporter Yes Yes Yes
New exporter Yes No Yes
Non exporter No - -
Permanent non exporter No No No
Temporary exporter Yes No No
Exiter Yes Yes No
Importer Yes - -
Non importer No - -
A further condition to be fulfilled in order to be considered exporter is that turnover deriving from export accounts for at least 0.5% of the total turnover19.
19 As the observed total exports in the custom databases and alike can be larger than the total turnover
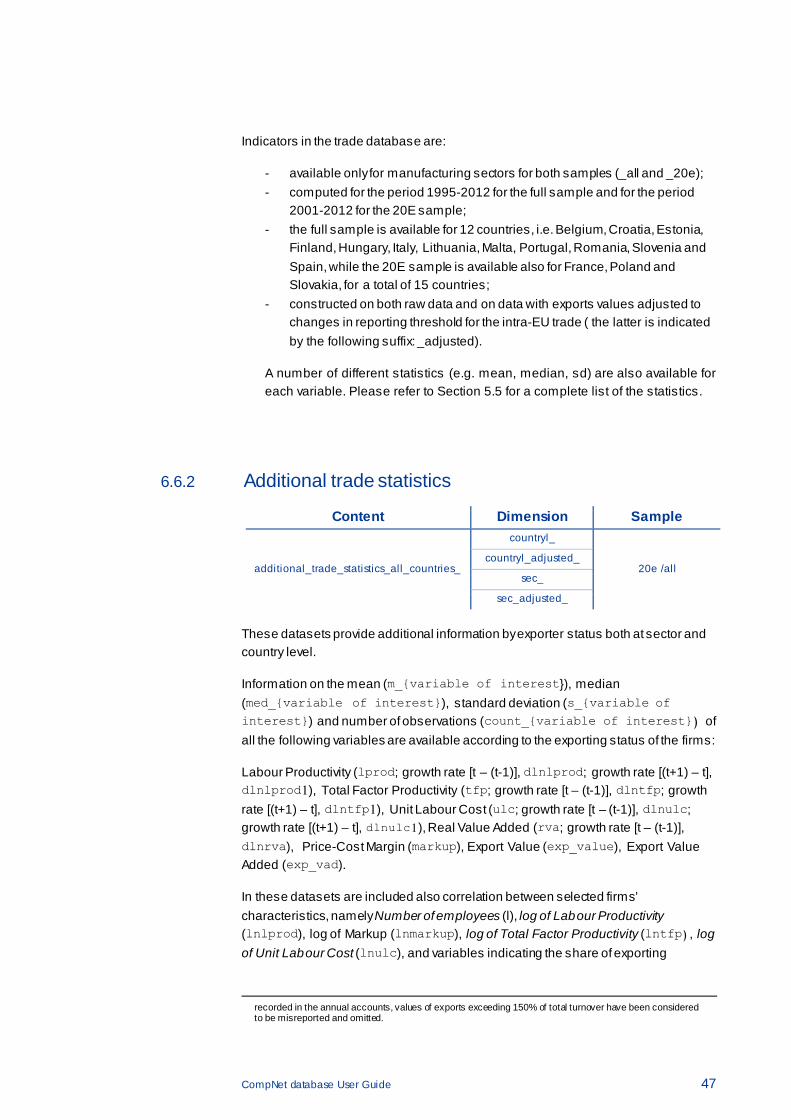
CompNet database User Guide 47
Indicators in the trade database are:
- available only for manufacturing sectors for both samples (_all and _20e); - computed for the period 1995-2012 for the full sample and for the period
2001-2012 for the 20E sample; - the full sample is available for 12 countries, i.e. Belgium, Croatia, Estonia,
Finland, Hungary, Italy, Lithuania, Malta, Portugal, Romania, Slovenia and Spain, while the 20E sample is available also for France, Poland and Slovakia, for a total of 15 countries;
- constructed on both raw data and on data with exports values adjusted to changes in reporting threshold for the intra-EU trade ( the latter is indicated by the following suffix: _adjusted).
A number of different statistics (e.g. mean, median, sd) are also available for each variable. Please refer to Section 5.5 for a complete list of the statistics.
6.6.2 Additional trade statistics
Content Dimension Sample
additional_trade_statistics_all_countries_
countryl_
20e /all countryl_adjusted_
sec_
sec_adjusted_
These datasets provide additional information by exporter status both at sector and country level.
Information on the mean (m_{variable of interest}), median (med_{variable of interest}), standard deviation (s_{variable of interest}) and number of observations (count_{variable of interest}) of all the following variables are available according to the exporting status of the firms:
Labour Productivity (lprod; growth rate [t – (t-1)], dlnlprod; growth rate [(t+1) – t], dlnlprod1), Total Factor Productivity (tfp; growth rate [t – (t-1)], dlntfp; growth rate [(t+1) – t], dlntfp1), Unit Labour Cost (ulc; growth rate [t – (t-1)], dlnulc; growth rate [(t+1) – t], dlnulc1), Real Value Added (rva; growth rate [t – (t-1)], dlnrva), Price-Cost Margin (markup), Export Value (exp_value), Export Value Added (exp_vad).
In these datasets are included also correlation between selected firms’ characteristics, namely Number of employees (l), log of Labour Productivity (lnlprod), log of Markup (lnmarkup), log of Total Factor Productivity (lntfp), log of Unit Labour Cost (lnulc), and variables indicating the share of exporting
recorded in the annual accounts, values of exports exceeding 150% of total turnover have been considered to be misreported and omitted.
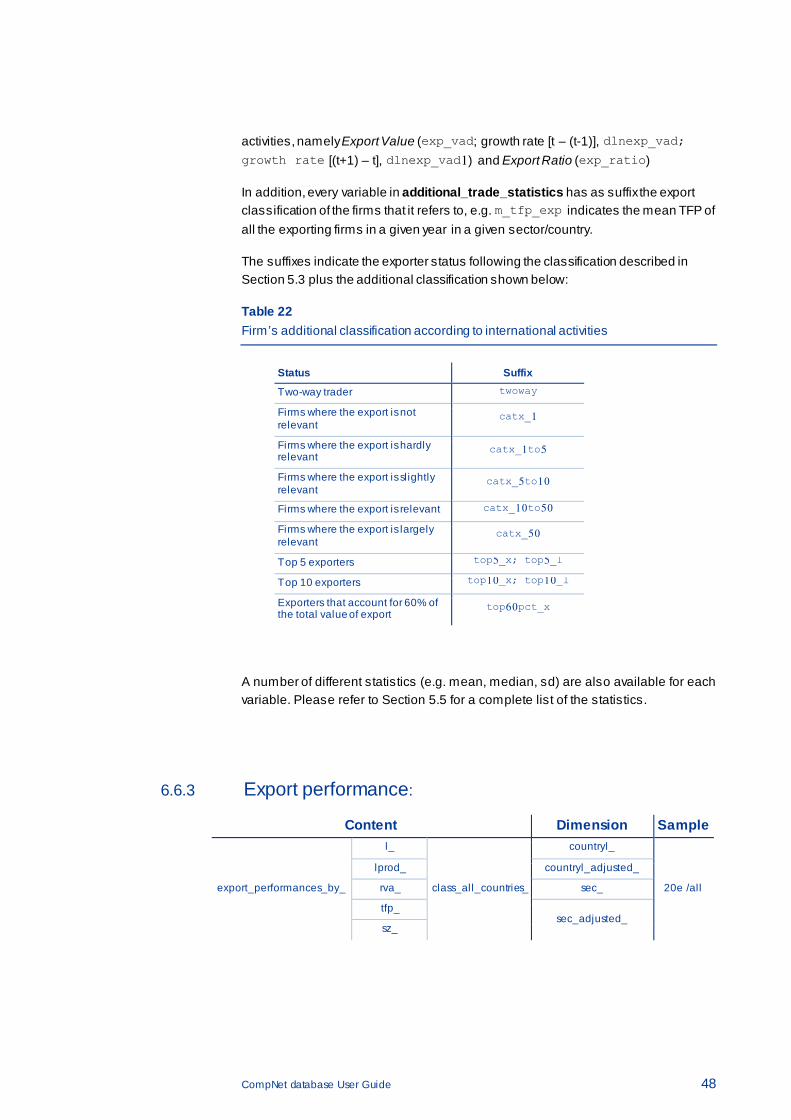
CompNet database User Guide 48
activities, namely Export Value (exp_vad; growth rate [t – (t-1)], dlnexp_vad; growth rate [(t+1) – t], dlnexp_vad1) and Export Ratio (exp_ratio)
In addition, every variable in additional_trade_statistics has as suffix the export classification of the firms that it refers to, e.g. m_tfp_exp indicates the mean TFP of all the exporting firms in a given year in a given sector/country.
The suffixes indicate the exporter status following the classification described in Section 5.3 plus the additional classification shown below:
Table 22 Firm’s additional classification according to international activities
Status Suffix
Two-way trader twoway
Firms where the export is not relevant
catx_1
Firms where the export is hardly relevant
catx_1to5
Firms where the export is slightly relevant
catx_5to10
Firms where the export is relevant catx_10to50
Firms where the export is largely relevant
catx_50
Top 5 exporters top5_x; top5_l
Top 10 exporters top10_x; top10_l
Exporters that account for 60% of the total value of export
top60pct_x
A number of different statistics (e.g. mean, median, sd) are also available for each variable. Please refer to Section 5.5 for a complete list of the statistics.
6.6.3 Export performance:
Content Dimension Sample
export_performances_by_
l_
class_all_countries_
countryl_
20e /all
lprod_ countryl_adjusted_
rva_ sec_
tfp_ sec_adjusted_
sz_
CompNet database User Guide 49
The distinguishing factor between the five datasets is that firms, within a given year/country/sector, are categorized according to several sub-dimensions (e.g. number of employees, labour productivity). These sub-dimensions are:
• Number of Employees (export_performances_by_lclass): In this dataset, there is a variable called lclass that assumes values from 1 to 10 indicating the deciles of the distribution of the number of employees. Accordingly, observations are divided by the ten deciles of the distribution of the number of employees in the relevant level of aggregation (country/sector);
• Labour Productivity (export_performances_by_lprodclass): In this dataset, there is a variable called lprodclass that assumes values from 1 to 10 indicating the deciles of the labour productivity distribution. Accordingly, observations are divided by the ten deciles of the labour productivity distribution in the relevant level of aggregation (country/sector);
• Real Value Added (export_performances_by_rvaclass): In this dataset, there is a variable called rvaclass that assumes values from 1 to 10 indicating the deciles of the real value added distribution. Accordingly, observations are divided by the ten deciles of the real value added distribution in the relevant level of aggregation (country/sector);
• Total Factor Productivity (export_performances_by_tfpclass): In this dataset, there is a variable called tfpclass that assumes values from 1 to 10 indicating the deciles of the total factor productivity distribution. Accordingly, observations are divided by the ten deciles of the total factor productivity distribution in the relevant level of aggregation (country/sector);
• Size Class (export_performances_by_szclass): In this dataset, there is a variable called szclass that assumes values from 1 to 5 (3 to 5 in the 20E sample) and indicates the size class of the firms considered in that specific cell. Accordingly, observations are divided by the 5 size class used within CompNet (1-9, 10-19, 20-49, 50-249, 250+ employees) in the relevant level of aggregation.
Information on the mean ({variable of interest}), median (variable of interest}_p50) and number of observations ({variable of interest}_count) of all the following variables are available according to the exporting status of the firms:
Labour Productivity (lprod; growth rate t – (t-1), dlnlprod; growth rate (t+1) – t, dlnlprod1), Total Factor Productivity (tfp; growth rate t – (t-1), dlntfp; growth rate [(t+1) – t], dlntfp1), Export Value (exp_value; growth rate [t – (t-1)], dlnexp_value; growth rate [(t+1) – t], dlnexp_value1), and Export Ratio (exp_ratio; growth rate [t – (t-1)], dlnexp_ratio; growth rate [(t+1) – t], dlnexp_ratio1)
Furthermore, the following variables are also available in this datasets: exp, exp_no, exp_3y, exp_new, stop_exp, exp_switch, exp_no3y, imp,
imp_no, and twoway. These variables indicate the share of firms related to a certain export status, as reported in Section 5.3, compared to the total population.
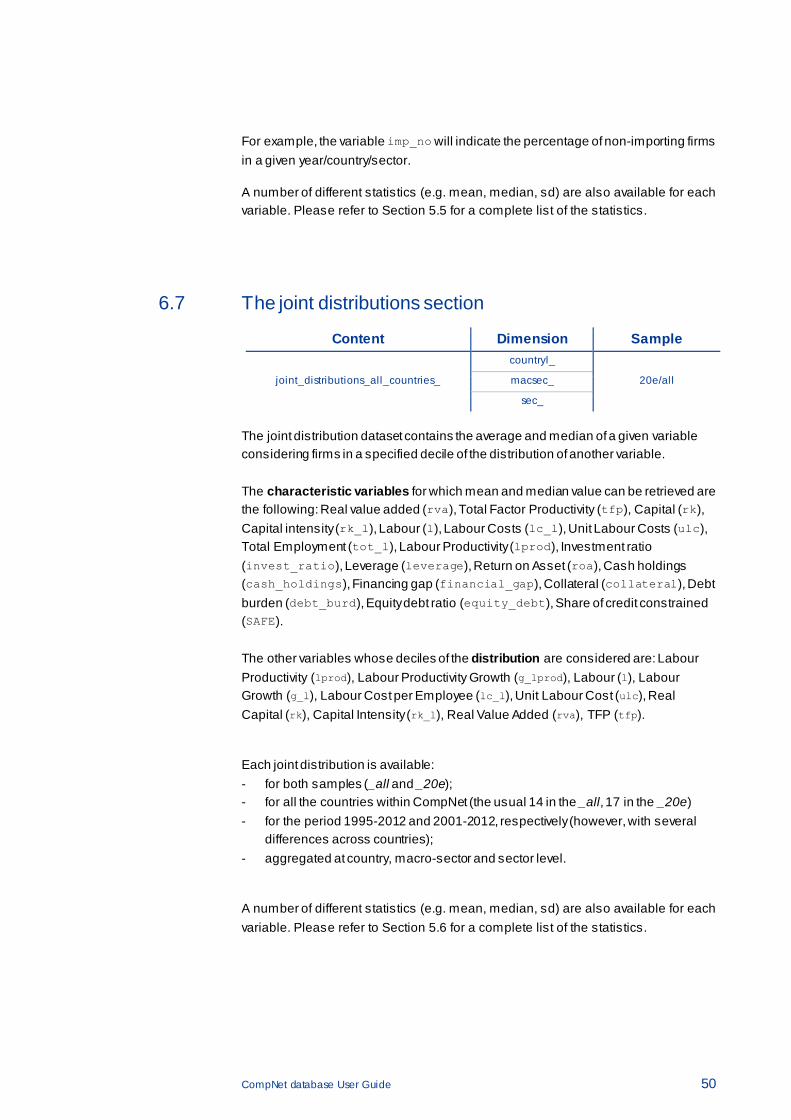
CompNet database User Guide 50
For example, the variable imp_no will indicate the percentage of non-importing firms in a given year/country/sector.
A number of different statistics (e.g. mean, median, sd) are also available for each variable. Please refer to Section 5.5 for a complete list of the statistics.
6.7 The joint distributions section
Content Dimension Sample
joint_distributions_all_countries_
countryl_
20e/all macsec_
sec_
The joint distribution dataset contains the average and median of a given variable considering firms in a specified decile of the distribution of another variable. The characteristic variables for which mean and median value can be retrieved are the following: Real value added (rva), Total Factor Productivity (tfp), Capital (rk), Capital intensity (rk_l), Labour (l), Labour Costs (lc_l), Unit Labour Costs (ulc), Total Employment (tot_l), Labour Productivity (lprod), Investment ratio (invest_ratio), Leverage (leverage), Return on Asset (roa), Cash holdings (cash_holdings), Financing gap (financial_gap), Collateral (collateral), Debt burden (debt_burd), Equity debt ratio (equity_debt), Share of credit constrained (SAFE). The other variables whose deciles of the distribution are considered are: Labour Productivity (lprod), Labour Productivity Growth (g_lprod), Labour (l), Labour Growth (g_l), Labour Cost per Employee (lc_l), Unit Labour Cost (ulc), Real Capital (rk), Capital Intensity (rk_l), Real Value Added (rva), TFP (tfp).
Each joint distribution is available: - for both samples (_all and _20e); - for all the countries within CompNet (the usual 14 in the _all, 17 in the _20e) - for the period 1995-2012 and 2001-2012, respectively (however, with several
differences across countries); - aggregated at country, macro-sector and sector level.
A number of different statistics (e.g. mean, median, sd) are also available for each variable. Please refer to Section 5.6 for a complete list of the statistics.
CompNet database User Guide 51
References
Ackerberg, D., Caves, K. and F. Garth (2006): "Structural identification of production functions," MPRA Paper 38349, University Library of Munich, Germany.
Bartelsman, E. and M. Doms (2000), “Understanding productivity: Lessons from longitudinal microdata,” Journal of Economic Literature (38): 569-594.
Bartelsman, E, Haltiwanger, J. and S. Scarpetta (2004), "Microeconomic evidence of creative destruction in industrial and developing countries", The World Bank, Policy Research Working Paper No. 3464.
Berthou A., E. Dhyne, M. Bugamelli, A. Cazacu, C. Demian, P. Harasztosi, T. Lalinsky, J. Meriküll, F. Oropallo and A. C. Soares (2015), “Assessing European firms’ exports and productivity distributions: the CompNet trade module”, ECB Working Paper Series No. 1788.
Caves, R. (1998), “Industrial Organization and New Findings on the Turnover and Mobility of Firms,” Journal of Economic Literature (36): 1947-1982.
Ferrando, A., Iudice, M., Altomonte, C., Blank, S., Felt, M.H., Meinen, P., Neugebauer, K.M. and I. Siedschlag (2015), “Assessing the financial and financing conditions of firms in Europe: The financial module in CompNet”, ECB Working Paper Series No. 1836.
Foster, L., Haltiwanger, J and C. J. Krizan, (2006): "Market Selection, Reallocation, and Restructuring in the U.S. Retail Trade Sector in the 1990s," The Review of Economics and Statistics 88(4): 748-758.
Galuscak, K. and L. Lizal (2011): "The Impact of Capital Measurement Error Correction on Firm-Level Production Function Estimation," Working Papers 2011/09, Czech National Bank, Research Department.
Hsieh and Klenow (2009): “Misallocation and manufacturing TFP in China and India”, Quarterly Journal of Economics, Volume 124 Issue 4. MIT Press.
Kehrig, M. (2011): “The cyclicality of productivity dispersion”, Meeting papers 484, Society for Economic Dynamics.
Levinsohn, J. and a. Petrin (2003): "Estimating Production Functions Using Inputs to Control for Unobservables," Review of Economic Studies Vol. 70 (2): 317-342.
Lopez Garcia, P., Di Mauro, F., and the CompNet Task Force (2015), “Assessing European Competitiveness: The new CompNet micro-based database”, ECB Working Paper Series No. 1764.
Olley, G.S. and A. Pakes (1996): “The dynamics of productivity in the telecommunications equipment industry,” Econometrica 64(6): 1263-1297.

CompNet database User Guide 52
Wooldridge, J.M (2009): "On estimating firm-level production functions using proxy variables to control for unobservables," Economics Letters, 104(3):112-114.
CompNet database User Guide 53
Annex 1. Country-specific breaks and biases
Austria
• The Austrian dataset is very biased towards large firms: it covers about 3% of the population of
firms and one-third of total employment.
This is the result of the groups of firms reporting data to the Bank of Austria:
1. Firms receiving passive direct investment from abroad are legally obliged to report their
balance sheet data to the OeNB. These firms constitute the most important group in the
data;
2. All firms from the commercial register for which balance sheet data are available (i. e.
corporations);
3. Firms receiving a loan from the ERP (European Recovery Programme);
4. Austrian “Top-500” firms;
5. Firms receiving larger loans (above EUR 5 million)
• No information on financial statements or exporting activities of the firms.
Belgium • Change in reporting thresholds for EU intra trade: Reporting of intra-EU and extra-EU trade
activities of Belgian firms are conditional on reporting thresholds. Exports to non-EU countries of
at least 1,000 EUR per year have to be reported. Concerning intra-EU trade flows, firms only
have to report their intra-EU exports if the total of their exports to EU countries over the last 12
months are above the intra-EU threshold. This threshold is varying over time and has been set
to fulfi l l Eurostat requirements in terms of the coverage of total export activities. That intra-EU
threshold was 104.115 EUR from 1995 to 1997, 250.000 EUR from 1998 to 2005 and 1.000.000
EUR from 2006 onwards.
• The Belgian dataset covers the universe of firms that have to provide complete or abbreviate
standardized annual accounts.
Croatia
• Relevant methodological changes were adopted in 2008 and 2010: these changes affected the
construction of the intermediate input variable which is not directly comparable between
methodologies. There is some uncertainty about tracking energy costs in different profit and loss
statement items because there is no explicit item for energy costs in the 2007-2008 and 2010-
2012 methodologies. Specifically, before 2008 energy costs are reported separately, and
afterwards it is assumed that they are included in costs of raw materials or costs of sold goods.
• From 2002 onwards (the Croatian dataset goes from 2002 to 2012), non-reporting to the firm
registries is subject to penalties for all legal firms.
• Although this database is widely used for statistical purposes, there are sti l l some issues
regarding non-reporting of firms which suggest taking results with some caution. More
concretely, some firms drop from the database and then reappear but it is not known this
caused by statistical or economic reasons.
CompNet database User Guide 54
Estonia
• With the accession to the EU in 2004 there was a change in the methodology for foreign trade
statistics. More concretely:
o 1995-2003
- Special trade system, i.e. commodities to free circulation or goods where some value
is added after importing and before exporting;
- Full population of exporters/importers is covered, based on declarations to tax and
customs board;
o 2004-onwards
- Extra EU, same as before, i.e. special trade system and whole population is covered
(Extrastat);
- Intra EU, important change (Intrastat): Includes commodities re-exported through
customs warehouses without free circulation; includes import/export only above a
certain threshold. The threshold is time-varying , 100 000 EUR for yearly export and
140 000 EUR for yearly import in 2012;
• Switch from print-out paper reports to the electronic reports in 2009. This change concerned
mostly one item - employment. It was not compulsory to report employment before the switch,
although the majority of firms did report it; since 2009 it has become compulsory. As a result the
smallest firms started reporting employment and the median size of a firm decreased from 3 to 2
and the average from 11 to 8 between 2009 and 2010.
Finland
• There was a change in taxation records data in 2005-2006: The financial statements statistics
data had to be constructed from a new database and detailed information on all items was no
longer available. The perspective changed from accounting to taxation. Although these changes
do not seem to result in any break of the series, they should be kept in mind when using the
data.
• The Finnish data covers the full universe of firms during the entire time period covered in
CompNet.
France
• Only firms with more than 750.000 euros of turnover report data to the Bank of France.
Germany
• There is a severe bias towards large firms. For this reason the use of the 20E sample is strongly
recommended.
• There is a bias towards manufacturing firms. Some service sectors feature a rather poor
coverage.
• Selection bias is present for multiple reasons (firms report to get a rating, for example).
Hungary
• Data starts in 2004 because the accession to the EU resulted in a break in trade data.
• Change in NACE from rev.2.1 to rev.2.2 in 2008.
CompNet database User Guide 55
• Otherwise, no reported breaks or biases.
• The Hungarian dataset covers the universe of firms subject to corporate income tax.
Italy
• New NACE classification was adopted in 2008 (from NACE rev. 1 to NACE rev.2).
• The Italian dataset all Limited Liability Companies with employees, that is, excluding (differently
from the figures provided from the Italian Business Register), all self-employed, sole
proprietorships and partnerships (not Limited Liabil ity Companies).
• Introduction of a new depreciation reform (Finance Law for 2008 n. 244 of 24th of Dec. 2007 -
Chap. V - abolition of accelerated depreciation) produced a large increase in investment ratios
in 2008, especially in some service sectors (in particular small-medium sized computer
companies).
Lithuania • In 2004 the new national business accounting standards were implemented (new financial asset
value assessment and some new accounting rules were introduced).
• Until 1 May 2004 the main source of information for external trade data was customs
declarations. As of 1 May 2004 foreign trade data is based on the data from two statistical
surveys – Intrastat and Extrastat.
• The dataset covers all the surveyed firms excluding a few (just a few) very large companies
dropped for confidentiality causes.
Malta • Only firms with more than 5 employees.
Poland • New NACE classification was adopted in 2008 (although firm-level statistics had double NACE
codes from 2005).
• The Polish dataset covers the universe of firms with more than 10 employees, although
CompNet indicators are only computed for firms with at least 20 employees (in the 20E sample).
Portugal
• New accounting standards were introduced in 2010: This introduction led to a break in the
Survey, which can have implications on some variables, namely financial variables related to
debt and interest expenses.
Romania • There were changes in accounting standards (2005) related to a better harmonization of the
national framework with the European standards although it did not result in any structural break
in the number of companies or the values of the indicators used in the CompNet.
• Changes in national classification in 2008 (from NACE rev 1 to NACE rev 2) but again, with no
reported breaks in the series.
CompNet database User Guide 56
• The Romanian dataset covers the universe of mercantile societies.
Slov akia • Euro adoption in 2009.
• Total imports are retrieved from customs data (change in reporting threshold for EU intra trade),
but total exports’ source is balance sheet data (no reporting threshold).
• Slovak dataset covers the universe of firms with more than 20 employees.
Slov enia
• There is no trade (custom-based) data prior 2000.
• There is no separate data on "financial expenses attributable to operating liabilities" prior 2006.
• Prior 2006, there are breaks and biases present in many sub-items of the financial statements
due to changes in accounting regulations.
• The Slovenian dataset covers the universe (more than 90%) of registered firms.
Spain
• It has to be taken into account that there is a positive trend in the number of firms until around
2002/03 due to improvements in data compilation capacity, not to genuine firm dynamics. The
Spanish sample is thus less representative of the firm population in the period 1995-2002.
• We have identified problems when computing aggregates for productivity, labour share, profit
share and unit labour costs from 2007 on. The previous problems are partially related to a
change in general accounting rules that took place in 2007 (effective in 2008), which somehow
produced a break in the series of some of the variables used to compute productivity, profits
and labour costs. This change might affect both the level and the trend of these variables, but
heterogeneity of those variables between sectors appears to be more resil ient to the change.
• The abovementioned change in accounting rules was accompanied by a somewhat more
detailed information on liabilities, allowing the incorporation of the leverage ratio (and the
subsequent indicators based on this ratio) to the list of financial indicators that can be provided
for Spain (before 2007, data on costly debt is not available).
• The change in accounting rules affected the way machinery acquired through leasing was
recorded (formerly as an intangible asset and currently as a tangible asset). This issue only
affects firms from the CBB sample (i.e. the one coming from Mercantile Registries). As a
solution, the Spanish measure of the stock of capital is the sum of both tangible and intangible
assets. This should be taken into account when computing variables in levels that use the stock
of capital.
• Finally, concerning trade data, the Balance of payments Statistics (BoP) is used to identify
whether a Spanish firm has exported goods between 1995 and 2011. There is a simplification
reporting threshold, below which any exporting firms do not have to report about the nature of
the external transaction. This reporting threshold has change over time: 3.000 € from 1995 to
2000; 12.500 € from 2001 to 2007; and, finally, 50.000 € from 2008 onwards. Any increase in
the threshold automatically reduces the sample of exporting firms and introduces a break in the
time series. In Spain, this break was relevant in 2008, when there was a significant decrease in
the number of goods exporting firms that had the obligation to report to the Banco de España to
compile the BoP. Despite this reduction in the sample of exporting firms, the exported value

CompNet database User Guide 57
reported by these firms sti l l accounted for around 95% of total Spanish exports of goods
according to the official figures since 2008 (around 20% in terms of total goods exporting firms,
55% before 2008). Nevertheless, this percentage decreases when the BoP data are combined
with other statistics to obtain firm level information, such as, the number of employees or the
labour cost, that it required to compute ULCs or productivity at firm level.
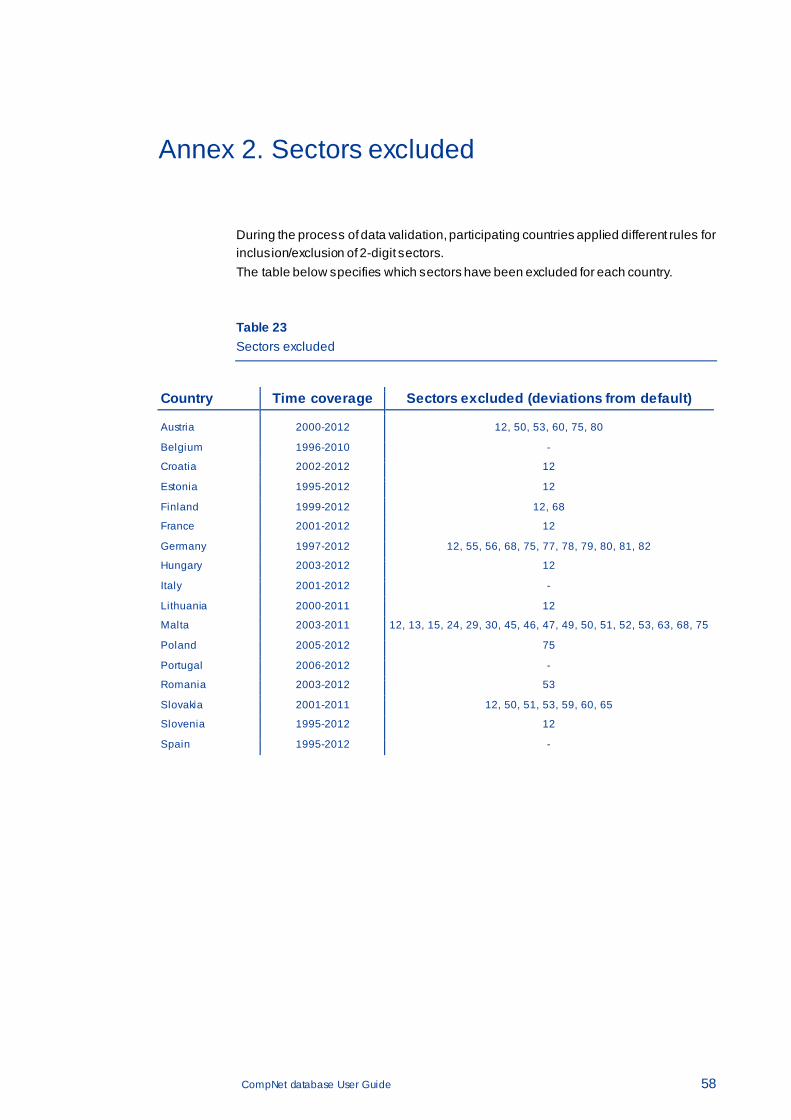
CompNet database User Guide 58
Annex 2. Sectors excluded
During the process of data validation, participating countries applied different rules for inclusion/exclusion of 2-digit sectors. The table below specifies which sectors have been excluded for each country. Table 23 Sectors excluded
Country Time coverage Sectors excluded (deviations from default)
Austria 2000-2012 12, 50, 53, 60, 75, 80
Belgium 1996-2010 -
Croatia 2002-2012 12
Estonia 1995-2012 12
Finland 1999-2012 12, 68
France 2001-2012 12
Germany 1997-2012 12, 55, 56, 68, 75, 77, 78, 79, 80, 81, 82
Hungary 2003-2012 12
Italy 2001-2012 -
Lithuania 2000-2011 12
Malta 2003-2011 12, 13, 15, 24, 29, 30, 45, 46, 47, 49, 50, 51, 52, 53, 63, 68, 75
Poland 2005-2012 75
Portugal 2006-2012 -
Romania 2003-2012 53
Slovakia 2001-2011 12, 50, 51, 53, 59, 60, 65
Slovenia 1995-2012 12
Spain 1995-2012 -
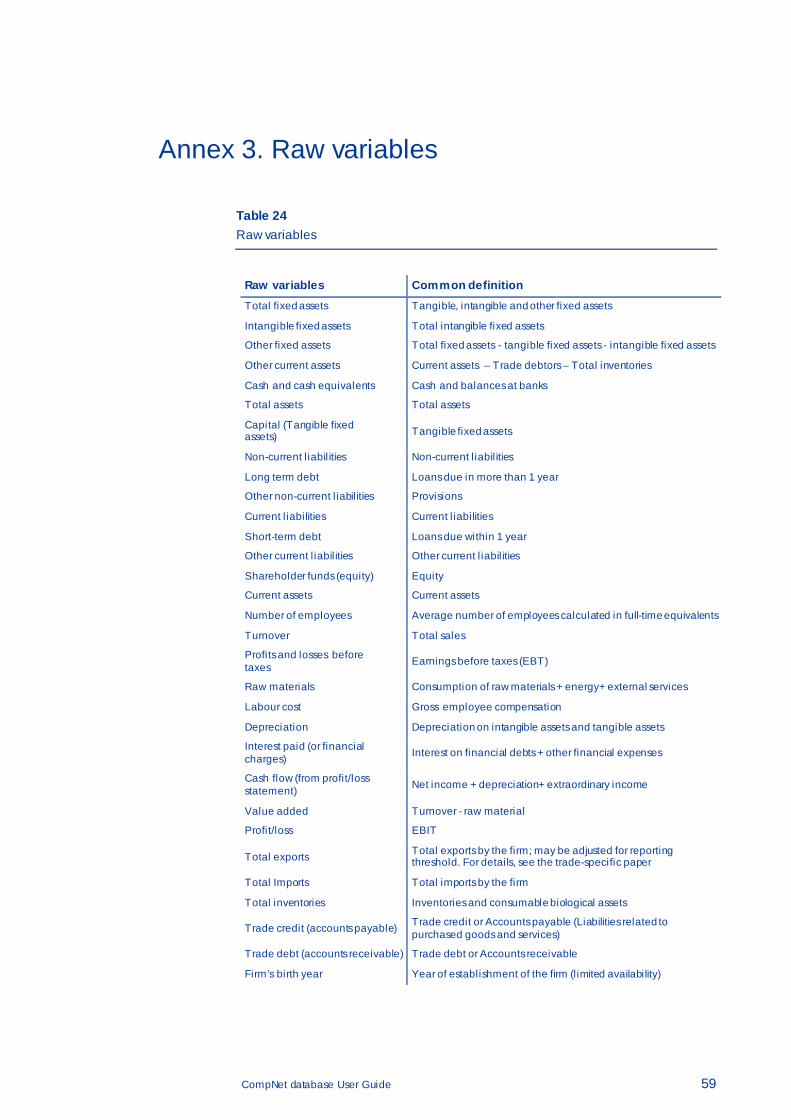
CompNet database User Guide 59
Annex 3. Raw variables
Table 24 Raw variables
Raw variables Common definition Total fixed assets Tangible, intangible and other fixed assets
Intangible fixed assets Total intangible fixed assets
Other fixed assets Total fixed assets - tangible fixed assets - intangible fixed assets
Other current assets Current assets – Trade debtors – Total inventories
Cash and cash equivalents Cash and balances at banks
Total assets Total assets
Capital (Tangible fixed assets) Tangible fixed assets
Non-current l iabil ities Non-current l iabil ities
Long term debt Loans due in more than 1 year
Other non-current l iabil ities Provisions
Current l iabilities Current l iabilities
Short-term debt Loans due within 1 year
Other current l iabil ities Other current l iabil ities
Shareholder funds (equity) Equity
Current assets Current assets
Number of employees Average number of employees calculated in full-time equivalents
Turnover Total sales
Profits and losses before taxes Earnings before taxes (EBT)
Raw materials Consumption of raw materials + energy+ external services
Labour cost Gross employee compensation
Depreciation Depreciation on intangible assets and tangible assets
Interest paid (or financial charges) Interest on financial debts + other financial expenses
Cash flow (from profit/loss statement) Net income + depreciation+ extraordinary income
Value added Turnover - raw material
Profit/loss EBIT
Total exports Total exports by the firm; may be adjusted for reporting threshold. For details, see the trade-specific paper
Total Imports Total imports by the firm
Total inventories Inventories and consumable biological assets
Trade credit (accounts payable) Trade credit or Accounts payable (Liabilities related to purchased goods and services)
Trade debt (accounts receivable) Trade debt or Accounts receivable
Firm’s birth year Year of establishment of the firm (limited availability)
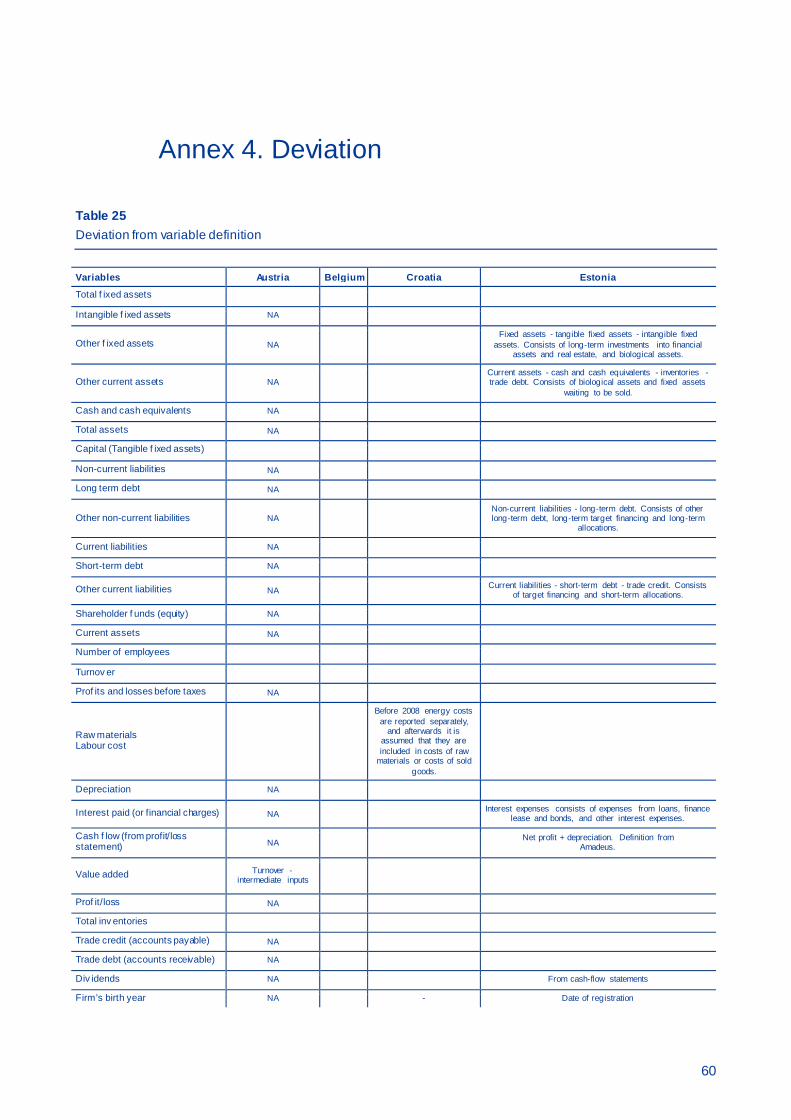
60
Annex 4. Deviation
Table 25 Deviation from variable definition
Variables Austria Belgium Croatia Estonia
Total f ixed assets
Intangible f ixed assets NA
Other f ixed assets NA Fixed assets - tangible fixed assets - intangible fixed
assets. Consists of long-term investments into financial assets and real estate, and biological assets.
Other current assets NA Current assets - cash and cash equivalents - inventories - trade debt. Consists of biological assets and fixed assets
waiting to be sold.
Cash and cash equivalents NA
Total assets NA
Capital (Tangible f ixed assets)
Non-current liabilities NA
Long term debt NA
Other non-current liabilities NA Non-current liabilities - long-term debt. Consists of other long-term debt, long-term target financing and long-term
allocations.
Current liabilities NA
Short-term debt NA
Other current liabilities NA Current liabilities - short-term debt - trade credit. Consists of target financing and short-term allocations.
Shareholder f unds (equity) NA
Current assets NA
Number of employees
Turnov er
Prof its and losses before taxes NA
Raw materials Labour cost
Before 2008 energy costs are reported separately,
and afterwards it is assumed that they are included in costs of raw
materials or costs of sold goods.
Depreciation NA
Interest paid (or financial charges) NA Interest expenses consists of expenses from loans, finance lease and bonds, and other interest expenses.
Cash f low (from profit/loss statement) NA Net profit + depreciation. Definition from
Amadeus.
Value added Turnover - intermediate inputs
Prof it/loss NA
Total inv entories
Trade credit (accounts payable) NA
Trade debt (accounts receivable) NA
Div idends NA From cash-flow statements
Firm’s birth year NA - Date of registration
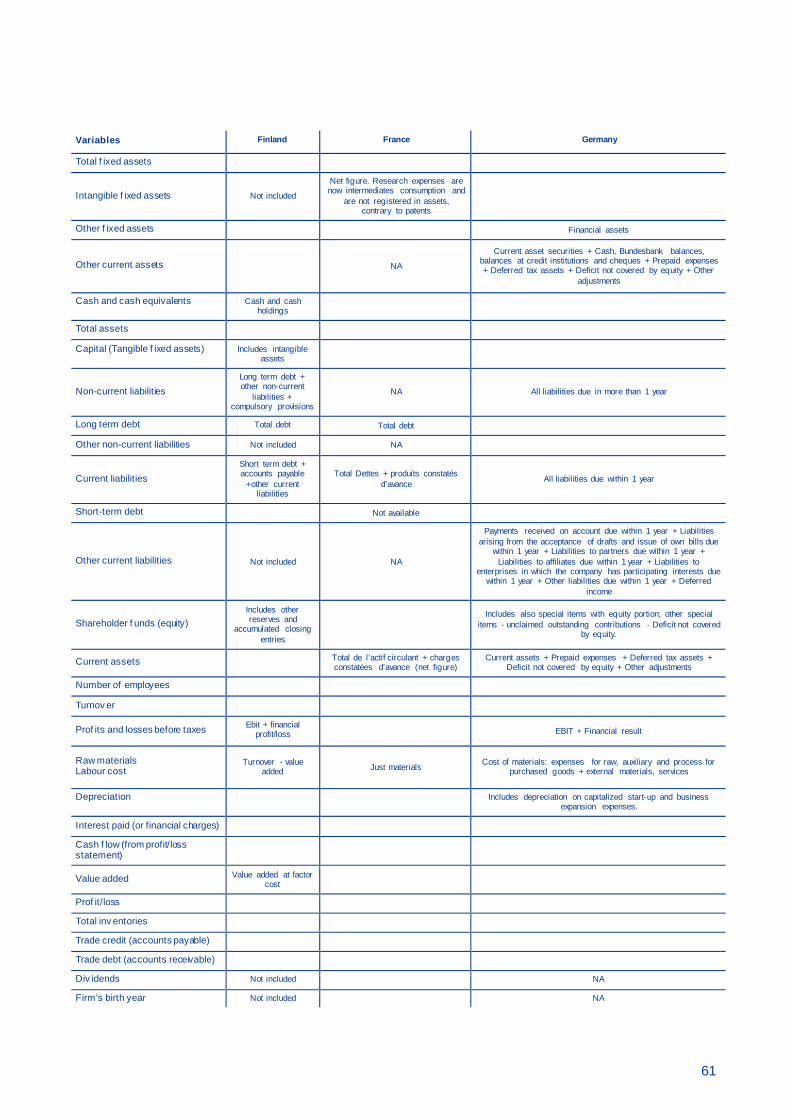
61
Variables Finland France Germany
Total f ixed assets
Intangible f ixed assets Not included
Net figure. Research expenses are now intermediates consumption and
are not registered in assets, contrary to patents
Other f ixed assets Financial assets
Other current assets
NA
Current asset securities + Cash, Bundesbank balances, balances at credit institutions and cheques + Prepaid expenses + Deferred tax assets + Deficit not covered by equity + Other
adjustments
Cash and cash equivalents Cash and cash holdings
Total assets
Capital (Tangible f ixed assets) Includes intangible assets
Non-current liabilities Long term debt + other non-current
liabilities + compulsory provisions
NA All liabilities due in more than 1 year
Long term debt Total debt Total debt
Other non-current liabilities Not included NA
Current liabilities Short term debt + accounts payable
+other current liabilities
Total Dettes + produits constatés d’avance All liabilities due within 1 year
Short-term debt Not available
Other current liabilities Not included NA
Payments received on account due within 1 year + Liabilities arising from the acceptance of drafts and issue of own bills due
within 1 year + Liabilities to partners due within 1 year + Liabilities to affiliates due within 1 year + Liabilities to
enterprises in which the company has participating interests due within 1 year + Other liabilities due within 1 year + Deferred
income
Shareholder f unds (equity) Includes other reserves and
accumulated closing entries
Includes also special items with equity portion; other special
items - unclaimed outstanding contributions - Deficit not covered by equity.
Current assets Total de l’actif circulant + charges constatées d’avance (net figure)
Current assets + Prepaid expenses + Deferred tax assets + Deficit not covered by equity + Other adjustments
Number of employees
Turnov er
Prof its and losses before taxes Ebit + financial profit/loss EBIT + Financial result
Raw materials Labour cost
Turnover - value added Just materials Cost of materials: expenses for raw, auxiliary and process for
purchased goods + external materials, services
Depreciation Includes depreciation on capitalized start-up and business expansion expenses.
Interest paid (or financial charges)
Cash f low (from profit/loss statement)
Value added Value added at factor cost
Prof it/loss
Total inv entories
Trade credit (accounts payable)
Trade debt (accounts receivable)
Div idends Not included NA
Firm’s birth year Not included NA
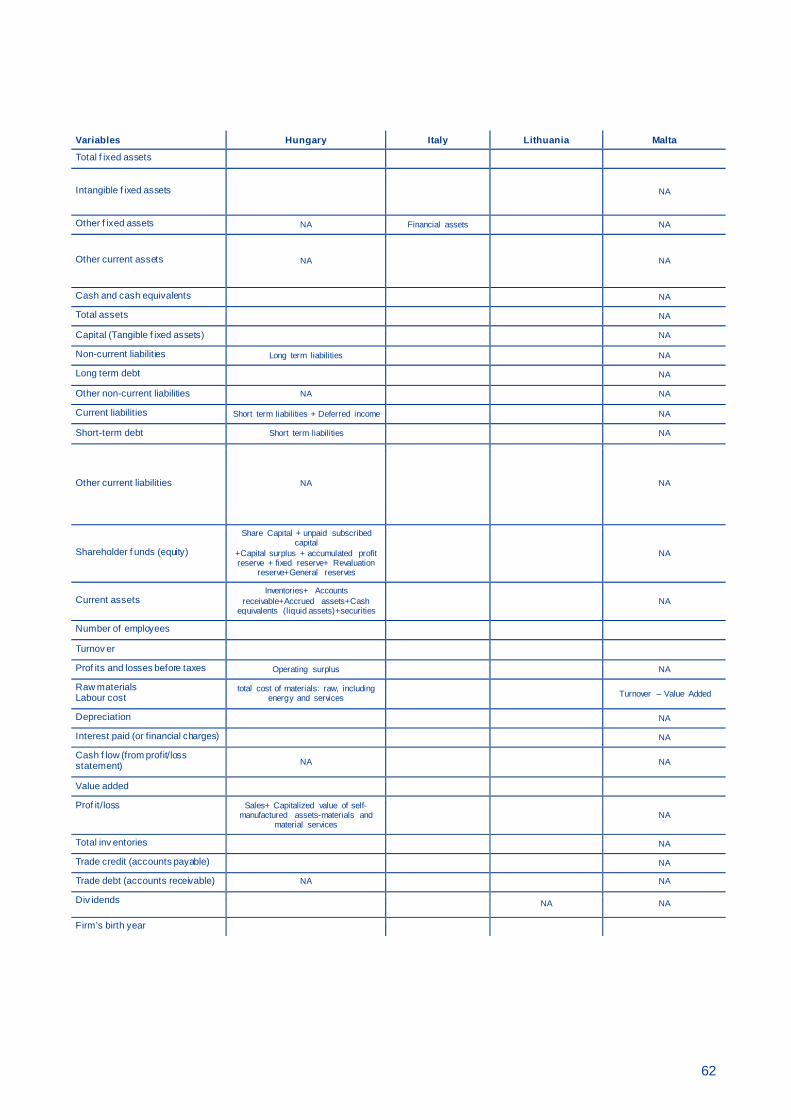
62
Variables Hungary Italy Lithuania Malta
Total f ixed assets
Intangible f ixed assets NA
Other f ixed assets NA Financial assets NA
Other current assets NA NA
Cash and cash equivalents NA
Total assets NA
Capital (Tangible f ixed assets) NA
Non-current liabilities Long term liabilities NA
Long term debt NA
Other non-current liabilities NA NA
Current liabilities Short term liabilities + Deferred income NA
Short-term debt Short term liabilities NA
Other current liabilities NA NA
Shareholder f unds (equity)
Share Capital + unpaid subscribed capital
+Capital surplus + accumulated profit reserve + fixed reserve+ Revaluation
reserve+General reserves
NA
Current assets Inventories+ Accounts
receivable+Accrued assets+Cash equivalents (liquid assets)+securities
NA
Number of employees
Turnov er
Prof its and losses before taxes Operating surplus NA
Raw materials Labour cost
total cost of materials: raw, including energy and services Turnover – Value Added
Depreciation NA
Interest paid (or financial charges) NA
Cash f low (from profit/loss statement) NA NA
Value added
Prof it/loss Sales+ Capitalized value of self-manufactured assets-materials and
material services NA
Total inv entories NA
Trade credit (accounts payable) NA
Trade debt (accounts receivable) NA NA
Div idends NA NA
Firm’s birth year
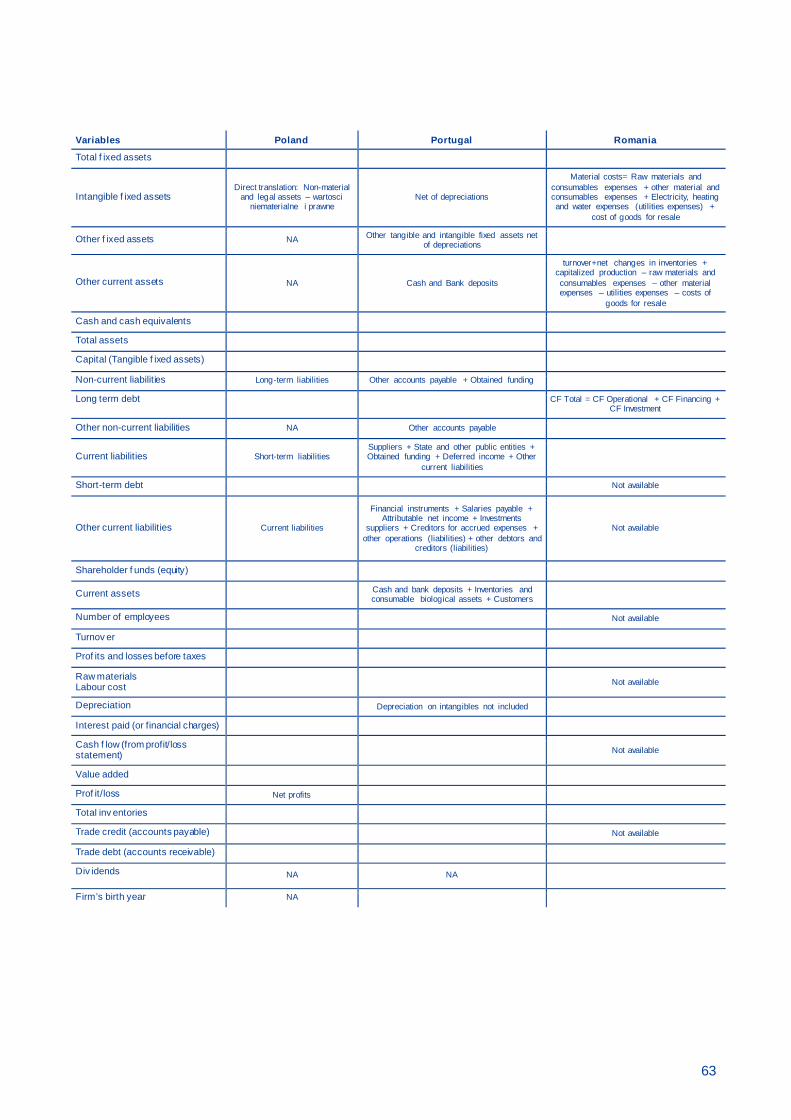
63
Variables Poland Portugal Romania
Total f ixed assets
Intangible f ixed assets Direct translation: Non-material
and legal assets – wartosci niematerialne i prawne
Net of depreciations
Material costs= Raw materials and consumables expenses + other material and consumables expenses + Electricity, heating and water expenses (utilities expenses) +
cost of goods for resale
Other f ixed assets NA Other tangible and intangible fixed assets net of depreciations
Other current assets NA Cash and Bank deposits
turnover+net changes in inventories + capitalized production – raw materials and consumables expenses – other material expenses – utilities expenses – costs of
goods for resale
Cash and cash equivalents
Total assets
Capital (Tangible f ixed assets)
Non-current liabilities Long-term liabilities Other accounts payable + Obtained funding
Long term debt CF Total = CF Operational + CF Financing + CF Investment
Other non-current liabilities NA Other accounts payable
Current liabilities Short-term liabilities Suppliers + State and other public entities + Obtained funding + Deferred income + Other
current liabilities
Short-term debt Not available
Other current liabilities Current liabilities
Financial instruments + Salaries payable + Attributable net income + Investments
suppliers + Creditors for accrued expenses + other operations (liabilities) + other debtors and
creditors (liabilities)
Not available
Shareholder f unds (equity)
Current assets Cash and bank deposits + Inventories and consumable biological assets + Customers
Number of employees Not available
Turnov er
Prof its and losses before taxes
Raw materials Labour cost Not available
Depreciation Depreciation on intangibles not included
Interest paid (or financial charges)
Cash f low (from profit/loss statement) Not available
Value added
Prof it/loss Net profits
Total inv entories
Trade credit (accounts payable) Not available
Trade debt (accounts receivable)
Div idends NA NA
Firm’s birth year NA
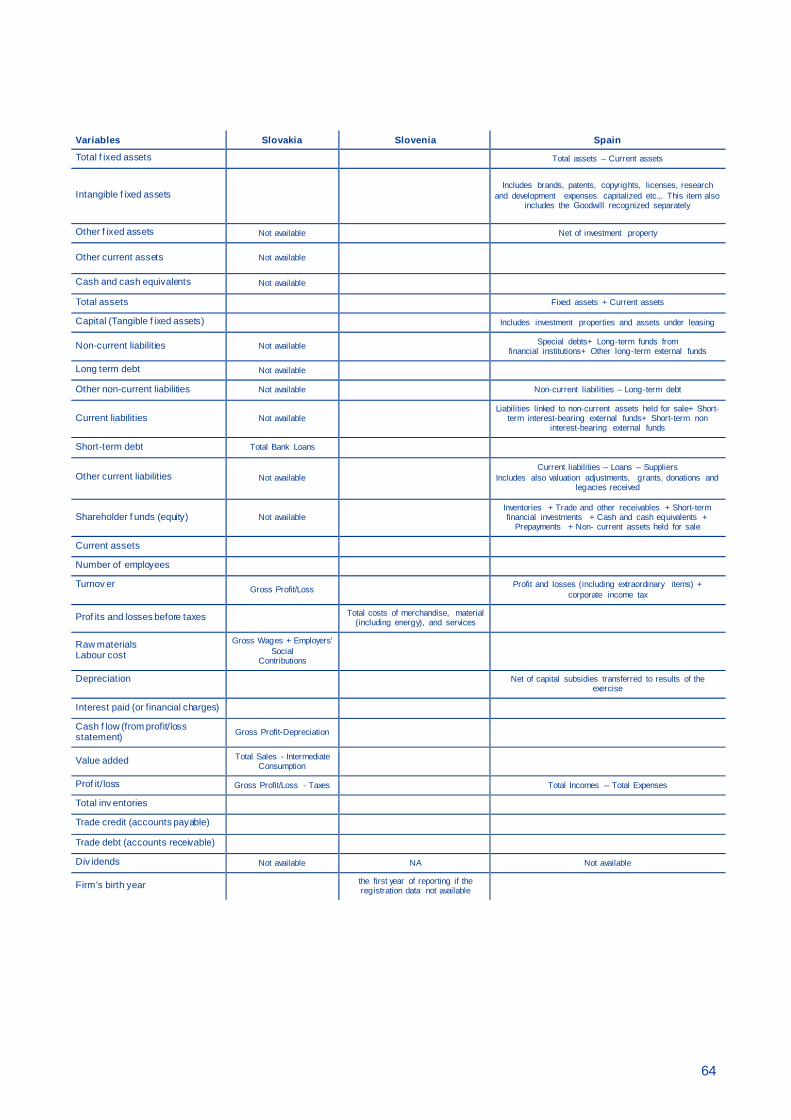
64
Variables Slovakia Slovenia Spain
Total f ixed assets Total assets – Current assets
Intangible f ixed assets Includes brands, patents, copyrights, licenses, research
and development expenses capitalized etc.,. This item also includes the Goodwill recognized separately
Other f ixed assets Not available Net of investment property
Other current assets Not available
Cash and cash equivalents Not available
Total assets Fixed assets + Current assets
Capital (Tangible f ixed assets) Includes investment properties and assets under leasing
Non-current liabilities Not available Special debts+ Long-term funds from financial institutions+ Other long-term external funds
Long term debt Not available
Other non-current liabilities Not available Non-current liabilities – Long-term debt
Current liabilities Not available Liabilities linked to non-current assets held for sale+ Short-
term interest-bearing external funds+ Short-term non interest-bearing external funds
Short-term debt Total Bank Loans
Other current liabilities Not available Current liabilities – Loans – Suppliers
Includes also valuation adjustments, grants, donations and legacies received
Shareholder f unds (equity) Not available Inventories + Trade and other receivables + Short-term financial investments + Cash and cash equivalents +
Prepayments + Non- current assets held for sale
Current assets
Number of employees
Turnov er Gross Profit/Loss Profit and losses (including extraordinary items) + corporate income tax
Prof its and losses before taxes Total costs of merchandise, material (including energy), and services
Raw materials Labour cost
Gross Wages + Employers' Social
Contributions
Depreciation Net of capital subsidies transferred to results of the exercise
Interest paid (or financial charges)
Cash f low (from profit/loss statement) Gross Profit-Depreciation
Value added Total Sales - Intermediate Consumption
Prof it/loss Gross Profit/Loss - Taxes Total Incomes – Total Expenses
Total inv entories
Trade credit (accounts payable)
Trade debt (accounts receivable)
Div idends Not available NA Not available
Firm’s birth year the first year of reporting if the registration data not available

65
Competitiv eness Research Network Description of the database Acknowledgements
Paloma Lopez-Garcia European Central Bank; e-mail: [email protected] Elena Ashtari Tafti European Central Bank; e-mail: [email protected]
Filippo Biondi European Central Bank; e-mail: [email protected]
Sante De Pinto European Central Bank; e-mail: [email protected]
Paolo Mengano European Central Bank; e-mail: [email protected]
Daniel Stöhlker European Central Bank; e-mail: [email protected]