Embed Size (px)
Citation preview
Complying with the European Union car CO2 emission regulation
1
Group 1
Elias ABOU KHALIL Alexandre DUBOIS-NAKHLÉ
Ravi GAUTAMOjas KARANDIKARLaure LACHEVRE
Danielle XU

Executive summary : Helping car manufacturers to Comply with the tight EU CO2 regulation
PR
OB
LEM
CO
NTE
XT
OB
JEC
TIV
ES&
RES
ULT
S• The European Union has implemented a strict legislation to reduce car Co2 emissions in Europe.
• In 2015, car manufacturers fleet need to emit in average <130g of Co2/km• In 2020, the cap will be reduced at 95g of Co2/km+ The EU is likely to implement a new CO2 emission calculation method that will harden the blow• Comment
• The EU regulation authorizes the creation of pools to help manufacturers reach their Co2 target. -> The fleet Co2 would then be calculated at the pool level and not at manufacturer level.
2009 avgemissions:
145g CO2/km
2015 Target: 130g/km
2020 Target: 95g
/km
“We are not talking about (…)millions of euros. We aretalking about billions”BMW CEO, July 2014
“New European CO2 rules threaten car makers’ profits” – Forbes, 27 Feb 2014
Manufacturers face ambitious CO2 targets and non compliance is not an option given the level of the fine.
Help the different manufacturers to minimize the fines paid to the EUComment • To achieve this goal we have:
1. Cleaned and transformed European datasets gathering car sales, emissions and detailed characteristics2. Forecasted the average CO2 emissions for each manufacturer for 2015 and 20203. Computed the optimal pooling strategy for each manufacturer
• By applying more optimal pooling strategies, manufacturers will be able to decrease the level of the fines paid to the EU.

The EU CO2 regulation is a real challenge for car manufacturers
World’s most constraining targets:. 130g CO2/km by 2015. 95g CO2/km by 2020
Progressive specific CO2 emission targets for each year. Constraining targets set for 2012-14 and 2017-2020. Calculated on the basis of the average mass of registered cars
Tougher CO2 measurements likely to be implemented in 2017:. On road / laboratory conditions (WPT Method). Potential increase of CO2 recorded: 20 to 30%
High Penalties in case of non compliance:. 5€ for the 1st g in excess, 15€ for the 2nd, 25€ for the 3rd. 95€ per g of CO2 over the limit, beginning at the 4th one
POSSIBILITY TO CREATE POOLS. Avg CO2 emissions will be calculated for the pool fleet and not at the manucfacturer level
HARDTARGETS
SOFTTARGETS
POSSIBLECHANGE
FINES
POOLING
• « (CO2 regulations) couldprevent approximatively210k premature mortalitiesin urban areas in 2030 »ICCT, October 2013
• “The German Association of the Automotive Industry warned that the deal would require "enormous efforts" on the part of car makers to reach the "most severe targets in the world.“WSJ, February 2014
• « This is an herculean taskcalling the best efforts of all our 40k developpers. Wecan do it »Volkswagen Chairman, Avril 2014
The EU sets mandatory CO2
standards of 130g of CO2/km in 2015
Eur. Parliamentand EU Council
agree to set 2020 target at
95g
Manufacturersare to comply
with the targetof 130g CO2/km
From NEDC to WLTP: change
in CO2 emissioncalculation
2009 2013 2015 2017
Manufacturersto comply
with target of 95g CO2/km
Talks to set a new CO2
emission targetfor 2025 and
2030
2014 2020
Chronology: EU CO2 regulation
Market Reactions

Our 3 Steps Approach to help the car manufacturers diminish their potential fines
DATA
• Identification of the Data needed:. ≠ models of car sold in EU (2000-2013); number of models sold per year ; main characteristics of the model sold
• Data Research:. Datasets from the EU and its member states, Car Manufacturer Annual Reports, Research Papers
• Data Cleaning :. Data formatting and outlier detection
• Data Transformation:. Pro Forma combination of the different datasets
FORECASTING
• Modelisation of Car Registrations and CO2 Emissions:. Identification of the variables that explain the most CO2 emissions evolution and creation of clusters of cars
• Projection of CO2 Emissions and Number of Models sold:. Forecasting of registrations and weighted average CO2 emissions using time serie analysis
• Calculation of potential Fines: . Creation of an algorithm to compute the potential fines applied to non complying manufacturers
OPTIMIZING
• Compute optimal pooling strategies:. Identification of three groups of manufacturers: highly probable non compliers that need to pool, higly probable
compliers that can pool without too much risks, manufacturers revolving around the target. Identification of pooling* and depooling** possible strategies. Computation of financial gains from the new pooling/depooling strategies
• Recommandations:. Example of possible pooling and depooling strategy for the manufacturers that have the more to gain
6W
ee
ks2
We
eks
1 W
ee
k
*Pooling: Action of merging one or more manufacturers or pool / **Depooling: action of breaking a pool into one or more pools or manufacturers

• For 2010-2013: Sales and weighted average CO2 emissions, fuel type mass and engine capacity per model, brand & 2013 pool
• For 2000-2013: Sales and weighted average CO2 emissions, fuel type & mass distribution per year, brand & 2013 poolSales and weighted average CO2 emissions, fuel type & engine capacity distribution per year, brand & 2013 pool
• 2010-2013: Variables and rework:. ≠ Pools, ≠ Brands, ≠ Unique Models, ≠ Countries-> Cleaning + Pro Forma 2013. CO2 Emissions/Model, Mass/Model, Engine
Capacity/Model, Engine Power/Model, Fuel Type/Model-> Outlier Detection, Cleaning
• 2000-2009: Variables and rework:. ≠ Brands, ≠ Countries-> Pro Forma 2013, Pool 2013 Assignation. Mass Distribution per Brand, Fuel Type and Country
Engine Capacity Distribution per Brand, Fuel Type and Country
-> Outlier Detection, Cleaning
• Annual Reports of Car Maufacturers:. Sales and sales prediction per Brand-> Used to clean the main base and check the forecasts. Qualitative Datas-> Better understanding of the impact of the regulation on
each manufacturer
• Research Papers:. Historic + Forecast Sales and Specific Emissions-> Used to clean the main base and check the forecasts
Identifying, Collecting, Cleaning and Transforming the Data
Output
MAIN BASEEuropean Environment Agency, Member States Datasets
SANITY CHECK BASESManufacturer Annual Reports, Research Papers

Forecasting Sales, Emissions & Fines per Brand for 2015 and 2020: The Steps
1/ Running a PCA to find the variables that explain better the CO2 emissions of a car
• Outcome:-> Fuel Type & Engine Capacity are the best variables at our disposal to forecast emissions per manufacturer car
2/ Clustering of Sales and Weighted Average Emissions
• Outcome:-> Creation of 6 clusters/brand as a combination of the two main fuel types (diesel & petrol) and three levels of engine capacity (high, medium and low)(The data were not sufficient to create useful hybrid & electric clusters for the forecasting - <5% of the sales on the period)
4/ Computing Potential Fines for each Brand/Pool for 2015 and 2020
• Outcome-> Creation of an algorithm that uses EU calculation method on the values forecasted by the model
• Method Selection◦ Initial graphical observations of data favored using Additive models with no seasonality ( Holt’s exponential
modeling with zero Gamma in our case)• Accuracy of the forecast
◦ Autocorrelogram: No significant autocorrelations were found between the residual lags.◦ Ljung box test: Sufficiently high p-value to not reject null hypothesis of no autocorrelation between the residuals.◦ Scatter plot of residuals: Consistent variance and near zero mean◦ Histogram of residuals: Near normal with mean zero
• Conclusion: The accuracy of forecast would not improve significantly just by using another forecasting method. Therefore, we stick by this method.
3/ Forecasting Sales and Weighted Average Emissions per Cluster per Brand using Time Series

• In 2015, 15% of the manufacturers will be above the target paying a €148.5m fine
• In 2020, 3 groups can be identified: 1 below the target, 1 far above and one revolving around it.The fines paid could amount to €4737m
• The optimal strategy for the car manufacturers would be to constitute one unique pool.
• Smaller agreements are more plausible and could lead to a largely smaller level of fines.
• By taking out of their pools their most polluting brands, existing pools can also reduce their fines.
• On average cars sold in 2015 will emit 117g of CO2, 13g below the authorized emissions
• In 2020, according to our forecast the average will be at 98.(However, since we didn’t take electric and hybrid cars into account due to a lack of historical datas, the real number should be lower)
If on average car manufacturers will comply with the 2015 and 2020, there’s important discrepancies between them
14
8
14
6
14
2
12
9
12
2
12
2
11
5
11
0
10
5
10
0
94
89
84
78
15
9
15
3
14
5
14
0
13
5
13
2
12
6
12
2
11
7
11
3
10
9
10
5
10
1
98
22
2
21
6
20
0
19
6
18
9
18
3
17
9
17
3
16
6
16
1
15
4
14
8
14
1
13
5
0
50
100
150
200
250
2007 2008 2009 2010 2011 2012 2013 2014 2015 2016 2017 2018 2019 2020
MIN AVERAGE MAX
Average, Minimum and Maximum Fleet CO2 Emissions
EU DATAS FORECASTS
CO
2 e
mis
sio
ns
g/km
2015 cap:130g/km
2015 cap:95g/km
On Average Target will be met But Discrepancies are important So an optimal Pooling strategy exists

Result: Sales and CO2 Emissions Forecasts 2010-2020:1/3rd of the manufacturers are likely to miss 2020 targetsCO2 emissions
in g/km
Bubble Size : number of registrations * Only the 11 first pools are displayed for clarity reasons
2015 Target
2020 Target

Singularization of High, Medium and Low Risk Players
9
. CO2 2015: 166
. Fine 2015: 41m
. CO2 2020: 135
. Fine 2020: 281m
Pool Main Brands Metrics
. CO2 2015: 123
. Fine 2015: 0
. CO2 2020: 113
. Fine 2020: 855m
Pool Main Brands Metrics
. CO2 2015: 125
. Fine 2015: 0
. CO2 2020: 108
. Fine 2020: 67m
Pool Main Brands Metrics
. CO2 2015: 119
. Fine 2015: 0
. CO2 2020: 106
. Fine 2020: 285m
Pool Main Brands Metrics
. CO2 2015: 123
. Fine 2015: 0
. CO2 2020: 104
. Fine 2020: 297m
Pool Main Brands Metrics
. CO2 2015: 122
. Fine 2015: 0
. CO2 2020: 100
. Fine 2020: 1.6bn
Pool Main Brands Metrics
. CO2 2015: 115
. Fine 2015: 0
. CO2 2020: 97
. Fine 2020: 555m
Pool Main Brands Metrics
. CO2 2015: 116
. Fine 2015: 0
. CO2 2020: 96
. Fine 2020: 111m
Pool Main Brands Metrics
. CO2 2015: 110
. Fine 2015: 0
. CO2 2020: 94
. Fine 2020: 0
Pool Main Brands Metrics
. CO2 2015: 122
. Fine 2015: 0
. CO2 2020: 91
. Fine 2020: 0
Pool Main Brands Metrics
. CO2 2015: 110
. Fine 2015: 0
. CO2 2020: 90
. Fine 2020: 0
Pool Main Brands Metrics
. CO2 2015: 106
. Fine 2015: 0
. CO2 2020: 85
. Fine 2020: 0
Pool Main Brands Metrics
. CO2 2015: 111
. Fine 2015: 0
. CO2 2020: 80
. Fine 2020: 0
Pool Main Brands Metrics
. CO2 2015: 105
. Fine 2015: 0
. CO2 2020: 78
. Fine 2020: 0
Pool Main Brands Metrics
. CO2 2015: 105
. Fine 2015: 0
. CO2 2020: 85
. Fine 2020: 0
Pool Main Brands Metrics
. CO2 2015: 116
. Fine 2015: 0
. CO2 2020: 93
. Fine 2020: 0
Pool Main Brands Metrics
Low Risk of Fine
Medium Risk of Fine
High Risk of Fine • Low Risk of Fine: <40% of chance to pay a fine in 2020-> Total forecasted 2020 fine: €0
• Medium Risk of Fine: ~ 50% of chance to pay a fine in 2020-> Total forecasted 2020 fine: €666m
• High Risk of Fine: >60% of chance to pay a fine in 2020-> Total forecasted 2020 fines: €3,385m

5 on the7 pools above 2020 targets can meet them with simple pooling strategies
• Two or more constructorscan decide to form a pool when their aggregatedweighted average fleetCO2 emission is below the EU 2020 target.
(Here two pools canmerge when the intersection between themis green)
• Nissan, Volvo, Tata, Renault and Suzuki canpool with at least 1 single pool to pass the 2020 targets.
• BMW & Hyunday can onlypool in this set of possibility with the combination of Citroen & Peugeot
• VW would need either to form a larger alliance, by grouping 2 other pools or more or to try a mix pooling depooling solution
Takeway

Other can use depooling strategies: Volkswagen example
New Pool 1 Main Brands Metrics
• New CO2: 101,9g/km• Current Fine: €1.276bn
Current Pool Main Brands Current Metrics
• Current CO2 emissions: 100,1g/km• Current Fine: €1.575bn
Current Pool Main Brands Current Metrics
• Current CO2: 94,8g/km• Current Fine: €0bn
• By Creating two separatepools Audi can manage to save almost €300m
• BMW and Renault coulduse the same types of strategies
Takeway

Limits:
12
Limits Description Solution
. Only 14 years of historical data for the time seriesanalysis. CO2 emission is difficult to predict due to low dataquality for 2000 / 2009
Lack of historical dataBenchmark expert views toreach a consensus on what is themost likely to happen
. Impossible to forecast the sales of electric vehicles given the few numbers and irregularities of past observations
Few or no historical datas for electric and hybrid vehicles
Use of the sole petrole and dieselvehicles for the forecasting.Upward bias on the CO2 emissiontrends
. Fines have been calculated on clusters rather than on each car model which makes the estimates ballpark
Necessitity of large clustering due to the low quality of the 2000-09 data
Using databases on drivingbehaviour will give us a betteridea of effective fines to be paid
. The crisis had an impact on the buying behavior of the consumers, pushing them towards cheaper, lighter and less powerful cars. The EU regulation had an impact on the manufacturers, pushing them toward taking rapidly the quick wins in term of CO2 efficiency
Historical Bias in the data
Downward bias on the CO2emission trends

Wrap Up
13
Based on European Data and Reports
We have discovered that:
• The most part of the manufacturers will respect the 2015 target…• … but will have difficulties to meet the 2020 one (projected fines paid for non compliant
manufacturers amount to €4.7 bn in 2020)• The EU will harden the regulation in 2017 (new CO2 emission calculation will be based on real
driving conditions)
We have found insights by:
• Forecasting the Co2 emission thanks to fuel type and displacement based on historical data• Using Time Series analysis to project Co2 emission and sales.
We have proposed:
• A model to estimate the most at-risk manufacturers in 2020 for not respecting the regulation (and the fines paid if so).
• Two strategies for reducing the risk to pay fines (pooling optimization & de-pooling)• WV could be able to reduce the cost by
Additional recommendation: Invest the saving costs to push electric cars and alternative fuel through the market

Annexes
14

A focus on the EU CO2 emission regulation (EC 443/2009)
Emission targets
Passenger cars have to comply with the following CO2 targets:- 130g of CO2/ km in 2015, measured with the NEDC method- 95g of CO2/ km in 2020, currently measured with NEDC method,
but the WLTP will probably be introduced in 2017
Specific emissiontargets
Each manufacturer has a specific emission target per year. The average of the pool or of the manufacturer’s fleet is taken intoaccount.- Calculated on the basis of the average mass of registered cars.
- The reference mass and coefficient a are calculated so that the global EU target is 130g/km. It is reviewed every 2 years.
Specific emissions of CO2 = 130 + a * (M - M0)M: average mass of the manufacturer's fleet in kgM0: reference mass (1372 kg)a: 0.0457
Phasing out
The regulation is progressive:- In 2012, 65% of the best performing cars are taken into account- In 2013, 75%- In 2014, 80% and in 2015, 100% of cars concerned 15

A focus on the EU CO2 emission regulation (EC 443/2009)
PoolingA flexibility is given to car manufacturers, who are allowed toregroup themselves in a pool. In that case, the pool average CO2emission is taken into account for the calculation of CO2 emissions.
Fines
The excess emissions premium for failing to meet the specific CO2 emission target is based on the following criteria:- the distance to the emission target in a given year (in g CO2/
km) - the number of vehicles registered by the manufacturer during
that year- the premium level as described in the table
Excessemission
Fine Nb ofvehicles
Formula5 15 25 95
0 - 1 (EE) - - - NV (EE * 5) * NV1 - 2 1 (EE - 1) - - NV (1 * 5 + (EE - 1) * 15) * NV2 - 3 1 1 (EE - 2) - NV (1 * 5 + 1 * 15 + (EE - 2) * 25) * NV
>3 1 1 1 (EE - 3) NV(1 * 5 + 1 * 15 + 1 * 25 + (EE - 3) * 95)
* NV 16

Our car CO2 emissions are confirmed by the ICCT
In January 2014, the ICCT published areport estimating the passenger car CO2emissions for a selected number ofmanufacturers in 2015 and 2020.
According to ICCT, most manufacturers willreach the 2015 target. Germanmanufacturers are lagging a bit behindRenault-Nissan, PSA, Ford and Fiat who arevery likely to reach the 2015 and 2020targets.
The values presented in this table arecalculated according to the currentEuropean CO2 emissions calculation(NEDC). The new calculation method willaim at reducing the CO2 emission gapbetween laboratory and on-roadconditions.
Note: the ICCT (International Council on Clean Transportation) is a non profit organization that focuses on research and technical & scientificanalysis of environmental regulations.Source: EU CO2 emission standards for passenger cars and light-commercial vehicleshttp://www.theicct.org/sites/default/files/publications/ICCTupdate_EU-95gram_jan2014.pdf
17

The McKinsey penalty estimation is close from ours
In a study published in February2012, McKinsey shows that thepotential fines in 2020 and 2525 arequite important, due to theambitious target set by the EU. Thelevel of the target acts as a realdeterrent for car manufacturers.
According to McKinsey, the level ofthe fine could even increase in thenext decade in order to force all carmanufacturers to comply with theEU regulation.
It is worth noting that this graphdoes not take into account the newCO2 calculation method (WLPT).This will increase the difficulty toreach the 2020 target and thereforewill probably increase the potentialpenalties.
Source: Lightweight, heavy impact - McKinsey, February 2012 18
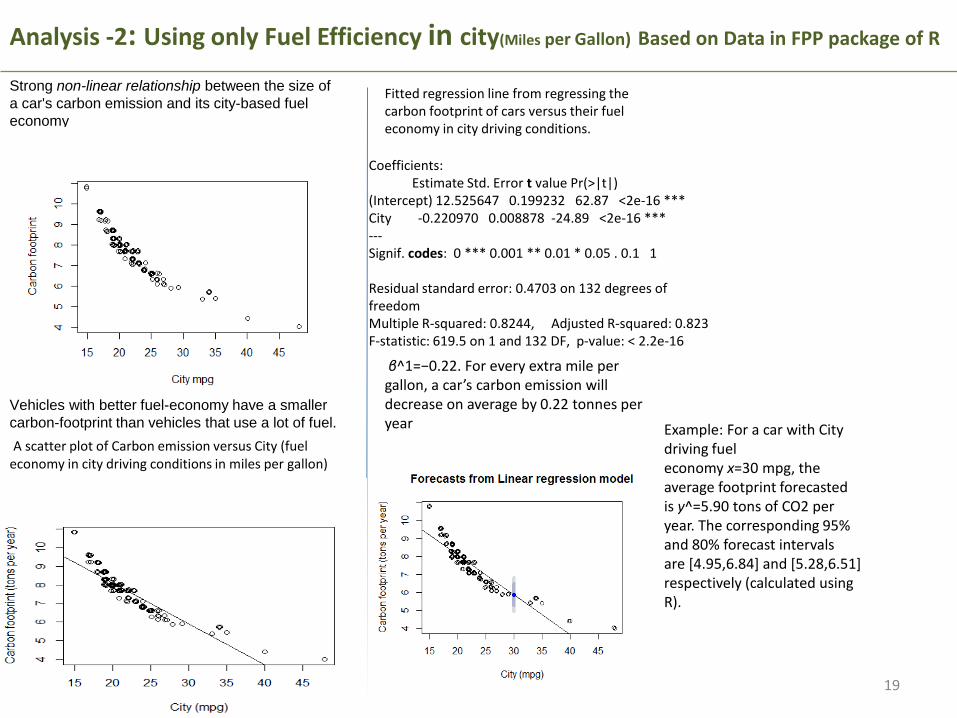
Analysis -2: Using only Fuel Efficiency in city(Miles per Gallon) Based on Data in FPP package of R
19
Strong non-linear relationship between the size of
a car's carbon emission and its city-based fuel
economy
Vehicles with better fuel-economy have a smaller
carbon-footprint than vehicles that use a lot of fuel.
A scatter plot of Carbon emission versus City (fuel economy in city driving conditions in miles per gallon)
Fitted regression line from regressing the carbon footprint of cars versus their fuel economy in city driving conditions.
Coefficients:Estimate Std. Error t value Pr(>|t|)
(Intercept) 12.525647 0.199232 62.87 <2e-16 ***City -0.220970 0.008878 -24.89 <2e-16 ***---Signif. codes: 0 *** 0.001 ** 0.01 * 0.05 . 0.1 1
Residual standard error: 0.4703 on 132 degrees of freedomMultiple R-squared: 0.8244, Adjusted R-squared: 0.823F-statistic: 619.5 on 1 and 132 DF, p-value: < 2.2e-16
β^1=−0.22. For every extra mile per gallon, a car’s carbon emission will decrease on average by 0.22 tonnes per year Example: For a car with City
driving fuel economy x=30 mpg, the average footprint forecasted is y^=5.90 tons of CO2 per year. The corresponding 95% and 80% forecast intervals are [4.95,6.84] and [5.28,6.51]respectively (calculated using R).

20
Non-Linear Regression
Piecewise linear trend to fuel economy data.Plot suggests that a change in slope occurs at about 25mpg.
The resulting fitted values are shown
as the red line belowAn example of a cubic regression spline fitted to the fuel economy data is shown along side with a single knot at c1=25
2.5 % 97.5 %(Intercept) 12.1315464 12.9197478City -0.2385315 -0.2034092
Confidence Interval
The interval [−0.239,−0.203] contains the slope parameter, β1, with probability 95%
The slope of the fitted regression line using a log-log functional form is non-constant.
Plots show the estimated relationship both in the original and the logarithmic scales.