Embed Size (px)
Citation preview
_____________________________________________________________________________________________________ *Corresponding author: E-mail: [email protected];
British Journal of Applied Science & Technology 8(5): 427-436, 2015, Article no.BJAST.2015.222
ISSN: 2231-0843
SCIENCEDOMAIN international
www.sciencedomain.org
Complex Extraction of Phenol, o-Cresol and p-Cresol from Model Coal Tar Using Methanol and
Acetone Solutions
Dewi Selvia Fardhyanti1*, Wahyudi Budi Sediawan2 and Panut Mulyono2
1Department of Chemical Engineering, Faculty of Engineering, Semarang State University, Semarang, Indonesia.
2Department of Chemical Engineering, Faculty of Engineering, Gadjah Mada University, Yogyakarta,
Indonesia.
Authors’ contributions
This work was carried out in collaboration between all authors. Author DSF designed the study, performed the statistical analysis, wrote the protocol, and wrote the first draft of the manuscript.
Author WBS managed the analyses of the study. Author PM managed the literature searches. All authors read and approved the final manuscript.
Article Information
DOI: 10.9734/BJAST/2015/16693
Editor(s): (1) Verlicchi Paola, Department of Engineering, University of Ferrara, Via Saragat 1, Ferrara, Italy.
Reviewers: (1) P.K. Kuipa, Chinhoyi University of Technology, Zimbabwe.
(2) Anonymous, Malaysia. (3) Anonymous, Mongolia.
Complete Peer review History: http://www.sciencedomain.org/review-history.php?iid=1073&id=5&aid=8967
Received 11th February 2015 Accepted 14
th April 2015
Published 27th
April 2015
ABSTRACT
Aims: The extractive performance of two solution solvents were studied for the complex extraction of phenols from model coal tar at varying conditions and variables. Study Design: Ordinary solvent extraction can preferentially extract phenolic compounds from the other compositions in coal tar. In order to separate the phenolic compounds from coal tar, it is essential to choose an extractant that has a specific interaction with phenols but insoluble in coal tar. Toward this aim, methanol solution and acetone solution may be candidate for their following characteristic. Place and Duration of Study: Department of Chemical Engineering, Semarang State University and Department of Chemical Engineering, Gadjah Mada University. Methodology: For this research, the influence of temperature, mass ratio of solvent to feed, mole
Original Research Article
Fardhyanti et al.; BJAST, 8(5): 427-436, 2015; Article no.BJAST.2015.222
428
fraction of water in solvent and composition of solvent in the extractbillity of phenols were studied for methanol solution and acetone solution using model coal tar. Model coal tar is used in which the solute is a phenol, o-cresol, and p-cresol; diluent is kerosene, and solvent are water and methanol or acetone. Methanol and acetone need to be mixed with water because their polarities are not strong enough to form immiscible mixture with kerosene. The extract phase of the each extraction processes are analyzed by GC to obtain the concentration of each component in the extract phase and the concentration of each component in raffinate phase. Results: Maximum of solute mole fraction (0.055 phenol; 0,037 o-cresol, and 0.061 p-cresol), maximum of the distribution coefficient (2.80 phenol; 3.66 o-cresol; and 4.55 p-cresol), and maximum of the yield (0.66 phenol; 0.64 o-cresol; and 0.76 p-cresol) obtained in the mass ratio of solvent-feed is 1, temperature is 308 K, and mole fraction of water in solvent is 0.2 by using an aqueous methanol solvent. Conclusion: Even though the mole fractions of the solutes in the extract are relatively low, but since the boiling points of the solvents and the solutes are differ significantly, the solutes can be easily separated by evaporating the solvents. Phenolic compounds in low temperature coal tar may be extracted efficiently by methanol and acetone solutions at ambient temperature.
Keywords: Phenol; o-cresol; p-cresol; methanol; acetone; extraction; coal tar.
1. INTRODUCTION Coal tar which is obtained by pyrolysis process at low temperature is more complicated and contained main components such as aromatic, hydrocarbon and phenolic compounds about 10%, 60% and 30%, respectively. Coal tar is an important source of chemicals oil and fuel oil [1]. Therefore, a detailed analytical study on the composition and chemical structure of coal tar will be advantageous to its processing and utilization. When being processed, the very complicated compounds of the coal tar will be splitted to a simple products with higher economic value. It is important to obtain the phenols for the following reasons. First, phenolic compounds are of high value chemicals, and their reclamation favors the process economics of the coal processing industry. Second, phenolic compounds are important raw materials for production of bisphenol A, phenolic resin, engineering plastics, synthetic fiber, etc. And third, removal of phenolic compounds in advance can decrease the consumption of H2 in the hydrogen treating process of coal tar for the production of fuel oils [1]. Although lots of studies related to coal utilization have been conducted, studies concerning coal tar are relatively rare. Some researchers have coal tar component separation [2-7]. Extraction is an important process in separating coal tar compounds, but they have not analyze the Indonesian coal tar.
Many methods to separate th useful compounds from coal tar have been tried. Various method have been used to obtain individual phenolic compounds contained in coal tar: Ordinary solvent extraction, supercritical extraction, distillation, extractive distillation, azeotropic distillation, crystallization, liquid membrane separation, adsorption, etc. Although the reactive extraction achieves good separation of coal tar fraction, it requires relatively high energy costs, since the solvent used in the reactive extraction is corrosive to the extractor and is difficult to recover and reuse [2]. Ordinary solvent extraction can preferentially extract phenolic compounds from the other compositions in coal tar. In order to separate the phenolic compounds from coal tar, it is essential to choose an extractant that has a spesific interaction with phenols but insoluble in coal tar. Toward this aim, methanol solution and acetone solution may be candidate for their following characteristic. Model coal tar in this research is similary with the real coal tar which is obtained by coal pyrolysis (at low temperature, 450-600°C) to find out the components contained in the coal tar so that the model coal tar that will be used in the study has a composition which is similar to the real coal tar. Coal tar produced has the following physical characteristics: dark black coloured, viscosity = 2.82 cp, density = 2.05 g/cm
3 and the caloric
value = 10,425.63 cal/g. Using a method of GC-MS, this work presents a composition of the coal tar generated in the experiment. The analysis shows that coal tar contains more than 53 components. The total phenolic compounds
Fardhyanti et al.; BJAST, 8(5): 427-436, 2015; Article no.BJAST.2015.222
429
contained in coal tar is 39.44% (v/v). Of those, the largest are phenol (8.06% v/v), o-cresol (3.45% v/v) and p-cresol (11.06% v/v) [8]. In this research, the extractive performance of two solution solvents were studied for the complex extraction of phenols from model coal tar at varying conditions and variables. Extraction is often operated at ambient temperature, higher temperature is however favorable for the efficient mass transfer especially for the viscous liquids like coal tar due to the drastically lowering viscosity and the decreasing interfacial tension. For this purpose, the influence of temperature and composition of solvent in the extractbility of phenols were studied for methanol solution and acetone solution at 298, 308 and 318 K using model coal tar.
2. MATERIALS AND METHODOLOGY
2.1 Material and Experimental
2.1.1 Material
1. Aquadest 2. Solvents: methanol and acetone (products
of e-MERCK). 3. Model coal tar: kerosene, phenol, p-cresol,
and o-cresol (products of e-MERCK).
2.1.2 Experimental
Instruments used in this study:
1. Shaker bath, product by Memmert WB14, SV1422, Scwabach, Germany.
2. Gas Chromatography (GC), product by GC 6820 Agilent Technologies, column: Rastek RXi-5MS002E.
The variables studied in this research are:
1. Composition of solvent (mole fraction of water and solvent) : 0.2, 0.5, 0,8.
2. The type of solvent : acetone solution and methanol solution.
3. Mass ratio of solvent to feed (Eo/Ro) : 1, 2 and 3.
4. Temperature of the process : 298, 308, 318 K.
This research uses artificial coal tar solution feed with the composition:
1. 77.5% v/v kerosene (as diluent) 2. 8% v/v phenol
3. 3.5% v/v o-cresol 4. 11% v/v p-cresol
Each solution is extracted with the solvents of aqueous acetone and aqueous methanol to obtain the equilibrium data of each component.
2.2 Methodology 10 mL of the feed (model coal tar), Ro and the solvent, Eo, were brought into contact in an erlenmeyer flask with a screw cap. The erlenmeyer was shaken in a water bath shaker with amplitudo of shaking is 35 rpm. After equilibrium attained (5 hours), the mixtures were poured into a separating funnel, settled for an hour and separated into two phases. Then the two phases were weighed. The extract phases were analyzed by Gas-Chromatograph (GC). The principal conditions of this analysis are shown in Table 1.
Table 1. Conditions of analysis using GC
GC: GC 6820 agilent technologies Column: Rastek RXi-5MS Column:
Inner diameter [m] 3.2 x 10⁻⁴ Length [m] 30 Carrier gas He Split ratio [-] 153 Flow rate [cm/sec] 26.6 Sample volume m3 1.10-9 Injection temp. [K] 553 Column temp. [K] 313 – 573 Pressure column kPa 10.0 Column flow mL/min 0.54 Detector (FID) temperature
[K] 573
For the liquid extraction processes of the major components of coal tar, model coal tar is used in which the solute is a phenol, o-cresol, and p-cresol; diluent is kerosene and solvent is water and methanol or acetone. Kerosene is used as diluent because it is almost similary with the real coal tar. It contains such as Carbon, Hydrogen and Oxygen. Phenol, o-Cresol and p-Cresol are completely miscible with kerosene [3]. Methanol and acetone need to be mixed with water because their polarities are not strong enough to form immiscible mixture with kerosene [4]. The extract phase and the raffinate phase of each extraction processes are analyzed by GC to obtain the concentration of each component.
Fardhyanti et al.; BJAST, 8(5): 427-436, 2015; Article no.BJAST.2015.222
430
The distribution coefficient for each component i, Ki, is calculated by using Equation (1) as follows [4]:
phase raffinatein solute offraction mole
phaseextract in solute offraction moleiK
(1)
The yield (Ye,i) of each component in extract phase during the extraction process are calculated with Equation (2) as follows [4]:
feed)in solute offraction mole feed of (mass
phase)extract in solute
offraction mole extract of (mass
,
ieY (2)
Equation (2) is formulated based on the assumption that there is a little material loss during extraction. This assumption was laboratory checked by measuring the amount of extract and raffinate and the results were compared to the amount of initial feed and solvent. It turned out that the assumption is correct. The assumption that after 5 hours theequilibrium has been attained was checked by analyzing the compositions of the extract and raffinate at various time. The compositions after 4 hours are almost constant. So the assumption of 5 hours for equilibrium time is justified.
3. RESULTS AND DISCUSSION 3.1 The Effect of Mole Fraction Ratio of
Solvent to Feed on Phenolic Compounds Extraction
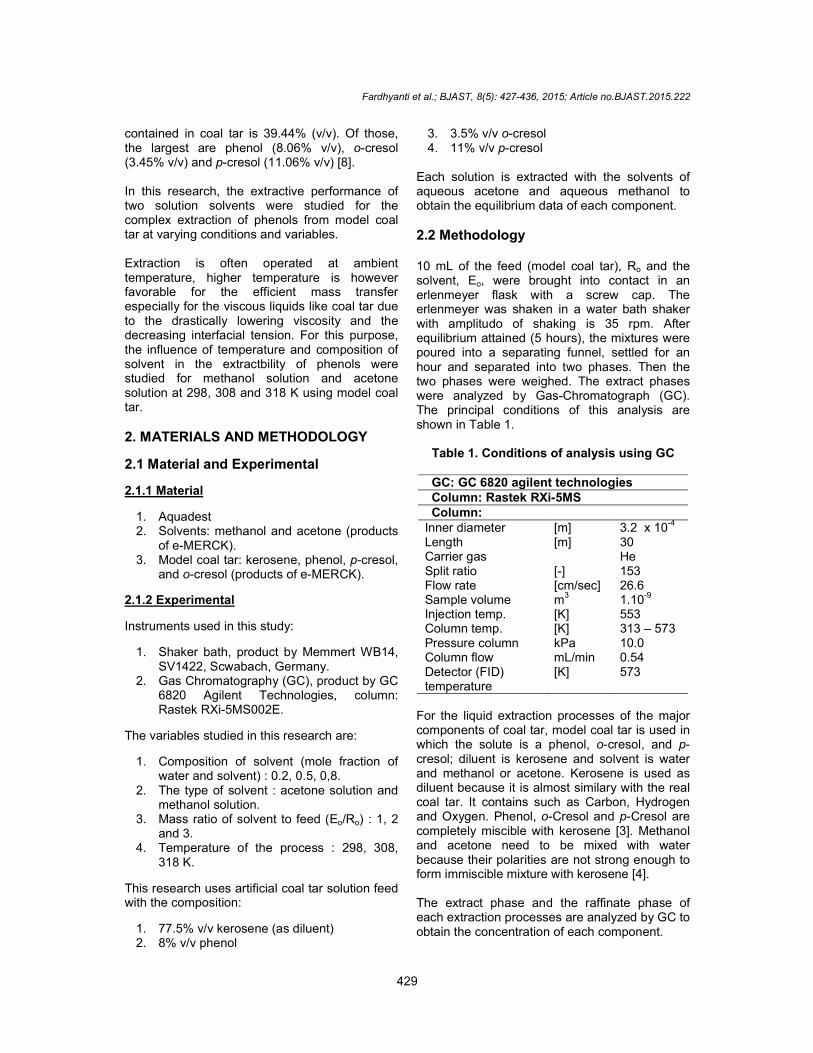
Fig. 1 (a) and (b) shows the effect of mole fraction ratio of solvent to feed (Eo/Ro) for mole fraction of phenol, o-cresol, and p-cresol in the extract phase and the raffinate phase at 308 K and Yw=0.2. Increasing the ratio of Eo/Ro
decreases mole fraction of phenol, o-cresol, and p-cresol in the extract phase and in the raffinate phase. Maximum value of mole fraction of phenol, o-cresol and p-cresol in extracts phase which are obtained by using methanol solution is 0.055; 0,037; and 0.061, respectivelly. Because methanol has a greater polarity than acetone that able to form a liquid-liquid heterogeneous system with kerosene at various temperatures.
3.2 The Effect of Temperatureon Phenolic Compounds Extraction
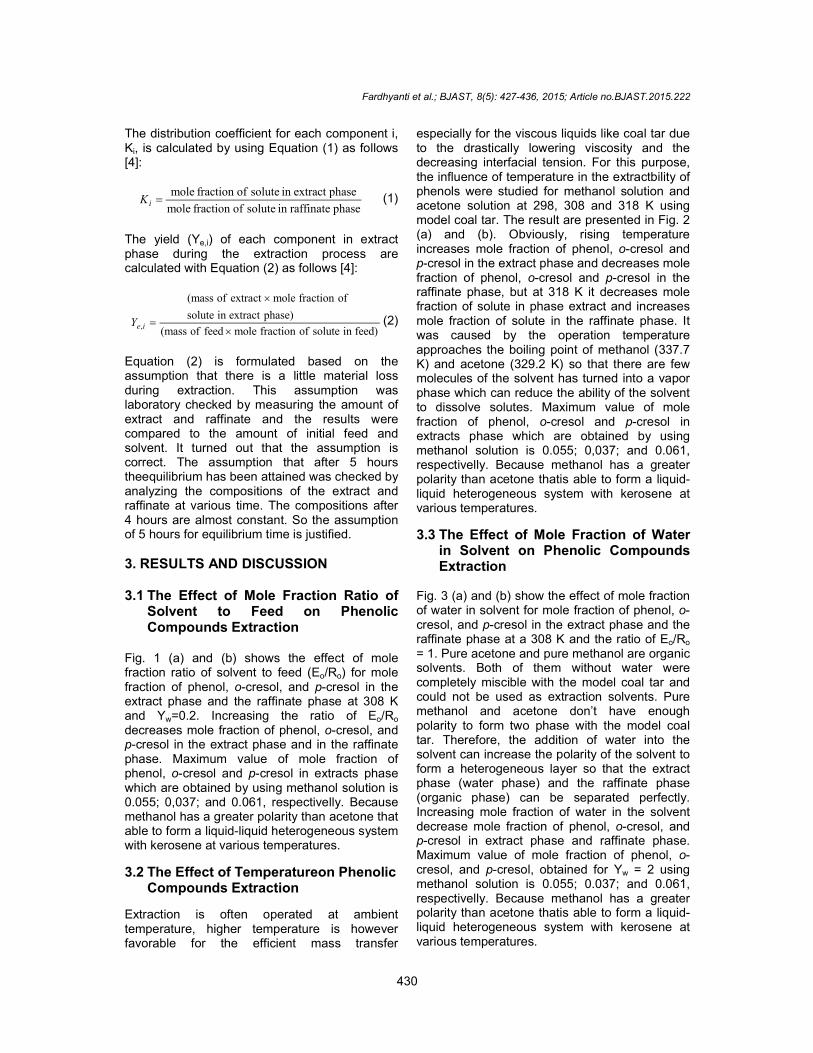
Extraction is often operated at ambient temperature, higher temperature is however favorable for the efficient mass transfer
especially for the viscous liquids like coal tar due to the drastically lowering viscosity and the decreasing interfacial tension. For this purpose, the influence of temperature in the extractbility of phenols were studied for methanol solution and acetone solution at 298, 308 and 318 K using model coal tar. The result are presented in Fig. 2 (a) and (b). Obviously, rising temperature increases mole fraction of phenol, o-cresol and p-cresol in the extract phase and decreases mole fraction of phenol, o-cresol and p-cresol in the raffinate phase, but at 318 K it decreases mole fraction of solute in phase extract and increases mole fraction of solute in the raffinate phase. It was caused by the operation temperature approaches the boiling point of methanol (337.7 K) and acetone (329.2 K) so that there are few molecules of the solvent has turned into a vapor phase which can reduce the ability of the solvent to dissolve solutes. Maximum value of mole fraction of phenol, o-cresol and p-cresol in extracts phase which are obtained by using methanol solution is 0.055; 0,037; and 0.061, respectivelly. Because methanol has a greater polarity than acetone thatis able to form a liquid-liquid heterogeneous system with kerosene at various temperatures.
3.3 The Effect of Mole Fraction of Water in Solvent on Phenolic Compounds Extraction
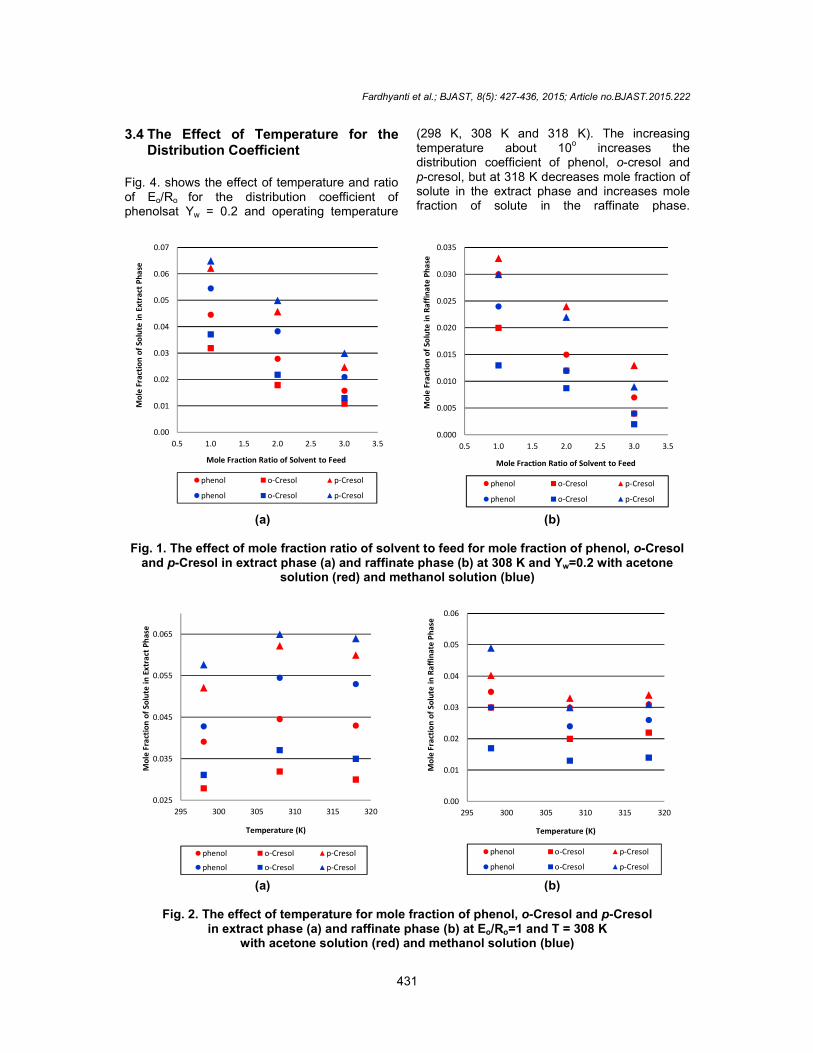
Fig. 3 (a) and (b) show the effect of mole fraction of water in solvent for mole fraction of phenol, o-cresol, and p-cresol in the extract phase and the raffinate phase at a 308 K and the ratio of Eo/Ro = 1. Pure acetone and pure methanol are organic solvents. Both of them without water were completely miscible with the model coal tar and could not be used as extraction solvents. Pure methanol and acetone don’t have enough polarity to form two phase with the model coal tar. Therefore, the addition of water into the solvent can increase the polarity of the solvent to form a heterogeneous layer so that the extract phase (water phase) and the raffinate phase (organic phase) can be separated perfectly. Increasing mole fraction of water in the solvent decrease mole fraction of phenol, o-cresol, and p-cresol in extract phase and raffinate phase. Maximum value of mole fraction of phenol, o-cresol, and p-cresol, obtained for Yw = 2 using methanol solution is 0.055; 0.037; and 0.061, respectivelly. Because methanol has a greater polarity than acetone thatis able to form a liquid-liquid heterogeneous system with kerosene at various temperatures.
Fardhyanti et al.; BJAST, 8(5): 427-436, 2015; Article no.BJAST.2015.222
431
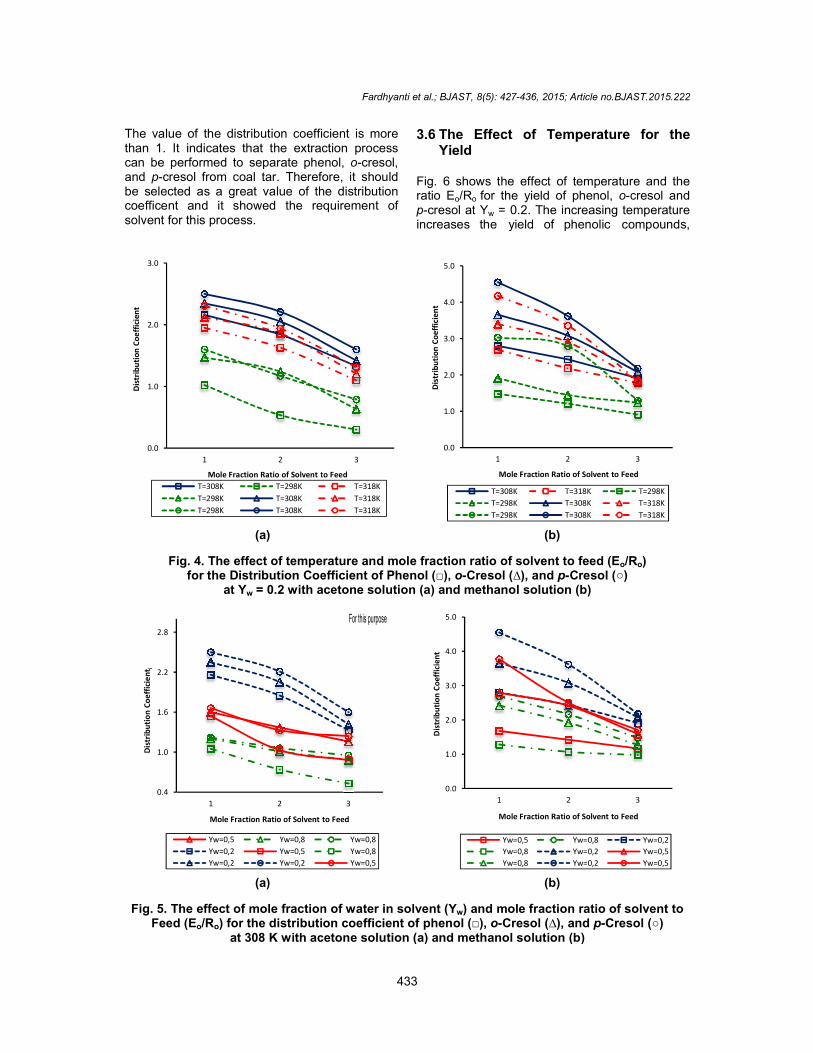
3.4 The Effect of Temperature for the Distribution Coefficient
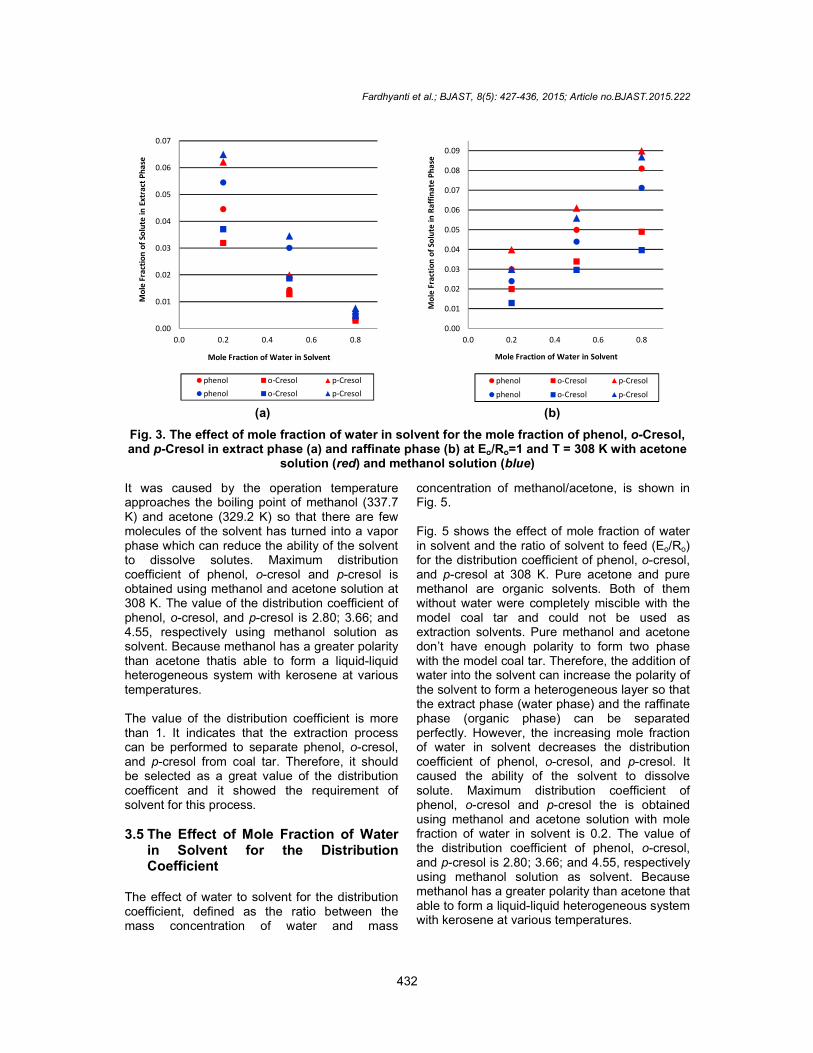
Fig. 4. shows the effect of temperature and ratio of Eo/Ro for the distribution coefficient of phenolsat Yw = 0.2 and operating temperature
(298 K, 308 K and 318 K). The increasing temperature about 10
o increases the
distribution coefficient of phenol, o-cresol and p-cresol, but at 318 K decreases mole fraction of solute in the extract phase and increases mole fraction of solute in the raffinate phase.
(a) (b)
Fig. 1. The effect of mole fraction ratio of solvent to feed for mole fraction of phenol, o-Cresol
and p-Cresol in extract phase (a) and raffinate phase (b) at 308 K and Yw=0.2 with acetone solution (red) and methanol solution (blue)
(a) (b)
Fig. 2. The effect of temperature for mole fraction of phenol, o-Cresol and p-Cresol
in extract phase (a) and raffinate phase (b) at Eo/Ro=1 and T = 308 K with acetone solution (red) and methanol solution (blue)
0.00
0.01
0.02
0.03
0.04
0.05
0.06
0.07
0.5 1.0 1.5 2.0 2.5 3.0 3.5
Mo
le F
ract
ion
of
Solu
te i
n E
xtra
ct P
ha
se
Mole Fraction Ratio of Solvent to Feed
phenol o-Cresol p-Cresol
phenol o-Cresol p-Cresol
0.000
0.005
0.010
0.015
0.020
0.025
0.030
0.035
0.5 1.0 1.5 2.0 2.5 3.0 3.5
Mo
le F
ract
ion
of
Solu
te i
n R
affi
na
te P
ha
se
Mole Fraction Ratio of Solvent to Feed
phenol o-Cresol p-Cresol
phenol o-Cresol p-Cresol
0.025
0.035
0.045
0.055
0.065
295 300 305 310 315 320
Mo
le F
ract
ion
of
Solu
te i
n E
xtra
ct P
has
e
Temperature (K)
phenol o-Cresol p-Cresol
phenol o-Cresol p-Cresol
0.00
0.01
0.02
0.03
0.04
0.05
0.06
295 300 305 310 315 320
Mo
le F
ract
ion
of
Solu
te i
n R
aff
inat
e P
has
e
Temperature (K)
phenol o-Cresol p-Cresol
phenol o-Cresol p-Cresol
Fardhyanti et al.; BJAST, 8(5): 427-436, 2015; Article no.BJAST.2015.222
432
(a) (b)
Fig. 3. The effect of mole fraction of water in solvent for the mole fraction of phenol, o-Cresol, and p-Cresol in extract phase (a) and raffinate phase (b) at Eo/Ro=1 and T = 308 K with acetone
solution (red) and methanol solution (blue)
It was caused by the operation temperature approaches the boiling point of methanol (337.7 K) and acetone (329.2 K) so that there are few molecules of the solvent has turned into a vapor phase which can reduce the ability of the solvent to dissolve solutes. Maximum distribution coefficient of phenol, o-cresol and p-cresol is obtained using methanol and acetone solution at 308 K. The value of the distribution coefficient of phenol, o-cresol, and p-cresol is 2.80; 3.66; and 4.55, respectively using methanol solution as solvent. Because methanol has a greater polarity than acetone thatis able to form a liquid-liquid heterogeneous system with kerosene at various temperatures. The value of the distribution coefficient is more than 1. It indicates that the extraction process can be performed to separate phenol, o-cresol, and p-cresol from coal tar. Therefore, it should be selected as a great value of the distribution coefficent and it showed the requirement of solvent for this process. 3.5 The Effect of Mole Fraction of Water
in Solvent for the Distribution Coefficient
The effect of water to solvent for the distribution coefficient, defined as the ratio between the mass concentration of water and mass
concentration of methanol/acetone, is shown in Fig. 5. Fig. 5 shows the effect of mole fraction of water in solvent and the ratio of solvent to feed (Eo/Ro) for the distribution coefficient of phenol, o-cresol, and p-cresol at 308 K. Pure acetone and pure methanol are organic solvents. Both of them without water were completely miscible with the model coal tar and could not be used as extraction solvents. Pure methanol and acetone don’t have enough polarity to form two phase with the model coal tar. Therefore, the addition of water into the solvent can increase the polarity of the solvent to form a heterogeneous layer so that the extract phase (water phase) and the raffinate phase (organic phase) can be separated perfectly. However, the increasing mole fraction of water in solvent decreases the distribution coefficient of phenol, o-cresol, and p-cresol. It caused the ability of the solvent to dissolve solute. Maximum distribution coefficient of phenol, o-cresol and p-cresol the is obtained using methanol and acetone solution with mole fraction of water in solvent is 0.2. The value of the distribution coefficient of phenol, o-cresol, and p-cresol is 2.80; 3.66; and 4.55, respectively using methanol solution as solvent. Because methanol has a greater polarity than acetone that able to form a liquid-liquid heterogeneous system with kerosene at various temperatures.
0.00
0.01
0.02
0.03
0.04
0.05
0.06
0.07
0.0 0.2 0.4 0.6 0.8
Mo
le F
ract
ion
of
Solu
te i
n E
xtra
ct P
ha
se
Mole Fraction of Water in Solvent
phenol o-Cresol p-Cresol
phenol o-Cresol p-Cresol
0.00
0.01
0.02
0.03
0.04
0.05
0.06
0.07
0.08
0.09
0.0 0.2 0.4 0.6 0.8
Mo
le F
ract
ion
of
Solu
te i
n R
affi
na
te P
ha
se
Mole Fraction of Water in Solvent
phenol o-Cresol p-Cresol
phenol o-Cresol p-Cresol
The value of the distribution coefficient is more than 1. It indicates that the extraction process can be performed to separate phenol, and p-cresol from coal tar. Therefobe selected as a great value of the distribution coefficent and it showed the requirement of solvent for this process.
(a)
Fig. 4. The effect of temperature and mole fraction ratio of solvent to feed for the Distribution Coefficient of Phenol (
at Yw = 0.2 with acetone solution
(a)
Fig. 5. The effect of mole fraction of water in solvent Feed (Eo/Ro) for the distribution coefficient of phenol
at 308 K with acetone solution
0.0
1.0
2.0
3.0
1 2
Dis
trib
uti
on
Co
eff
icie
nt
Mole Fraction Ratio of Solvent to Feed
T=308K T=298K
T=298K T=308K
T=298K T=308K
0.4
1.0
1.6
2.2
2.8
1 2
Dis
trib
uti
on
Co
eff
icie
nt i
Mole Fraction Ratio of Solvent to Feed
Yw=0,5 Yw=0,8
Yw=0,2 Yw=0,5
Yw=0,2 Yw=0,2
Fardhyanti et al.; BJAST, 8(5): 427-436, 2015; Article no.
433
The value of the distribution coefficient is more than 1. It indicates that the extraction process can be performed to separate phenol, o-cresol,
cresol from coal tar. Therefore, it should be selected as a great value of the distribution coefficent and it showed the requirement of
3.6 The Effect of Temperature for the Yield
Fig. 6 shows the effect of temperature and the ratio Eo/Ro for the yield of phenol, p-cresol at Yw = 0.2. The increasing temperatureincreases the yield of phenolic
(b)
temperature and mole fraction ratio of solvent to feed (Efor the Distribution Coefficient of Phenol (□), o-Cresol (∆), and p-Cresol (
acetone solution (a) and methanol solution (b)
(b)
effect of mole fraction of water in solvent (Yw) and mole fraction ratio of solvent distribution coefficient of phenol (□), o-Cresol (∆), and p-Cresol (
acetone solution (a) and methanol solution (b)
3
Mole Fraction Ratio of Solvent to Feed
T=318K
T=318K
T=318K
0.0
1.0
2.0
3.0
4.0
5.0
1 2
Dis
trib
uti
on
Co
effi
cien
t
Mole Fraction Ratio of Solvent to Feed
T=308K T=318K
T=298K T=308K
T=298K T=308K
3
Mole Fraction Ratio of Solvent to Feed
Yw=0,8
Yw=0,8
Yw=0,5
For this purpose
0.0
1.0
2.0
3.0
4.0
5.0
1 2
Dis
trib
uti
on
Co
effi
cien
t
Mole Fraction Ratio of Solvent to Feed
Yw=0,5 Yw=0,8
Yw=0,8 Yw=0,2
Yw=0,8 Yw=0,2
; Article no.BJAST.2015.222
Effect of Temperature for the
6 shows the effect of temperature and the for the yield of phenol, o-cresol and
= 0.2. The increasing temperature yield of phenolic compounds,
(Eo/Ro) Cresol (○)
mole fraction ratio of solvent to Cresol (○)
3
Mole Fraction Ratio of Solvent to Feed
T=298K
T=318K
T=318K
3
Mole Fraction Ratio of Solvent to Feed
Yw=0,2
Yw=0,5
Yw=0,5
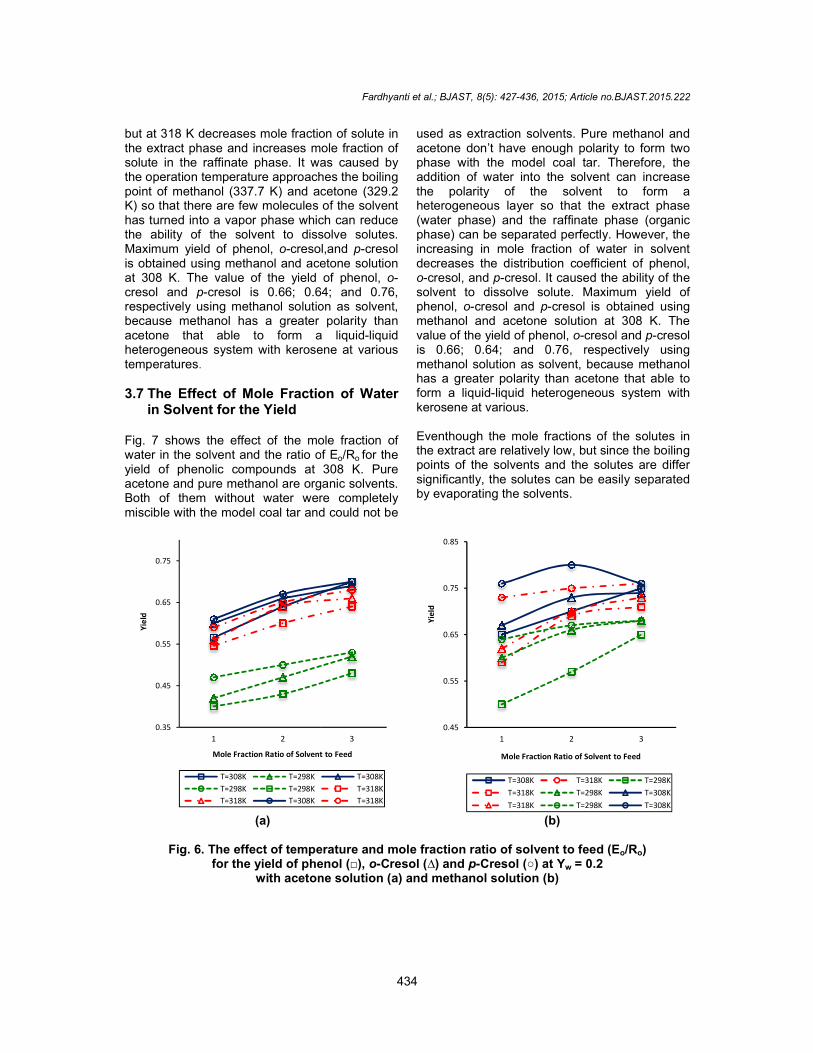
but at 318 K decreases mole fraction of solute inthe extract phase and increases mole fraction of solute in the raffinate phase. It was caused by the operation temperature approaches the boiling point of methanol (337.7 K) and acetone (329.2 K) so that there are few molecules of the solvent has turned into a vapor phase which can reduce the ability of the solvent to dissolve solutes.Maximum yield of phenol, o-cresol,and is obtained using methanol and acetone solution at 308 K. The value of the yield of phenol, cresol and p-cresol is 0.66; 0.6respectively using methanol solution as solvent,because methanol has a greater polarity than acetone that able to form a liquidheterogeneous system with kerosene at various temperatures.
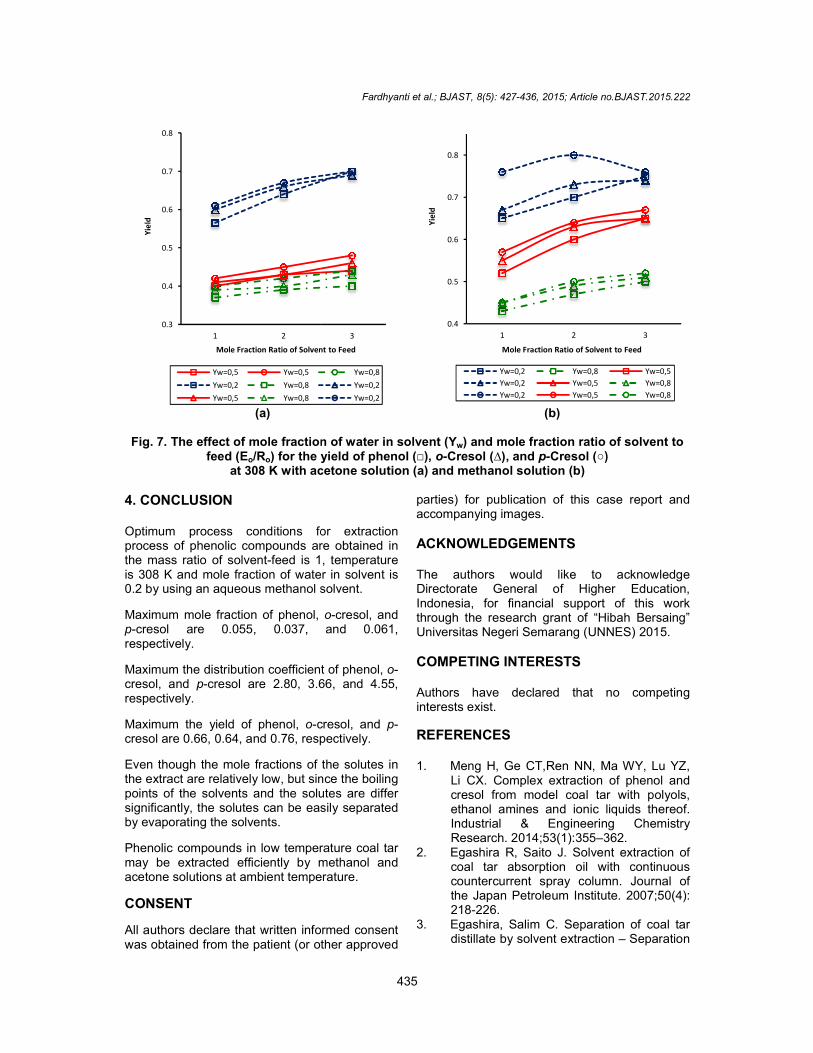
3.7 The Effect of Mole Fraction of Water in Solvent for the Yield
Fig. 7 shows the effect of the mole fraction of water in the solvent and the ratio of Eyield of phenolic compounds at 308 K. Pure acetone and pure methanol are organic solvents. Both of them without water were completely miscible with the model coal tar and could not be
(a)
Fig. 6. The effect of temperature and mole fraction ratio of solvent to feed for the yield of phenol
with acetone solution
0.35
0.45
0.55
0.65
0.75
1 2
Yie
ld
Mole Fraction Ratio of Solvent to Feed
T=308K T=298K
T=298K T=298K
T=318K T=308K
Fardhyanti et al.; BJAST, 8(5): 427-436, 2015; Article no.
434
but at 318 K decreases mole fraction of solute in the extract phase and increases mole fraction of solute in the raffinate phase. It was caused by the operation temperature approaches the boiling point of methanol (337.7 K) and acetone (329.2 K) so that there are few molecules of the solvent
nto a vapor phase which can reduce the ability of the solvent to dissolve solutes.
cresol,and p-cresol is obtained using methanol and acetone solution at 308 K. The value of the yield of phenol, o-
cresol is 0.66; 0.64; and 0.76, respectively using methanol solution as solvent, ecause methanol has a greater polarity than
acetone that able to form a liquid-liquid heterogeneous system with kerosene at various
Effect of Mole Fraction of Water
7 shows the effect of the mole fraction of water in the solvent and the ratio of Eo/Ro for the yield of phenolic compounds at 308 K. Pure acetone and pure methanol are organic solvents.
f them without water were completely miscible with the model coal tar and could not be
used as extraction solvents. Pure methanol and acetone don’t have enough polarity to form two phase with the model coal tar. addition of water into the solvent can increase the polarity of the solvent to form a heterogeneous layer so that the extract phase (water phase) and the raffinate phase (organic phase) can be separated perfectly. However, the increasing in mole fraction of water in solvent decreases the distribution coefficient of phenol, o-cresol, and p-cresol. It caused the ability of the solvent to dissolve solute. Maximum yield of phenol, o-cresol and p-cresol is obtained using methanol and acetone solution at 308 K. The value of the yield of phenol, o-cresolis 0.66; 0.64; and 0.76, respectively using methanol solution as solvent, because methanol has a greater polarity than acetone that abform a liquid-liquid heterogeneous system with kerosene at various. Eventhough the mole fractions of the solutes in the extract are relatively low, but since the boiling points of the solvents and the solutes are differ significantly, the solutes can be easily separated by evaporating the solvents.
(b)
effect of temperature and mole fraction ratio of solvent to feed (Eyield of phenol (□), o-Cresol (∆) and p-Cresol (○) at Yw = 0.2
acetone solution (a) and methanol solution (b)
3
Mole Fraction Ratio of Solvent to Feed
T=308K
T=318K
T=318K
0.45
0.55
0.65
0.75
0.85
1 2
Yie
ld
Mole Fraction Ratio of Solvent to Feed
T=308K T=318K
T=318K T=298K
T=318K T=298K
; Article no.BJAST.2015.222
used as extraction solvents. Pure methanol and acetone don’t have enough polarity to form two phase with the model coal tar. Therefore, the
lvent can increase the polarity of the solvent to form a heterogeneous layer so that the extract phase (water phase) and the raffinate phase (organic phase) can be separated perfectly. However, the increasing in mole fraction of water in solvent
the distribution coefficient of phenol, cresol. It caused the ability of the
Maximum yield of cresol is obtained using
methanol and acetone solution at 308 K. The cresol and p-cresol
is 0.66; 0.64; and 0.76, respectively using ecause methanol
has a greater polarity than acetone that able to liquid heterogeneous system with
Eventhough the mole fractions of the solutes in the extract are relatively low, but since the boiling points of the solvents and the solutes are differ
n be easily separated
(Eo/Ro)
3
Mole Fraction Ratio of Solvent to Feed
T=298K
T=308K
T=308K
(a)
Fig. 7. The effect of mole fraction of water in solvent feed (Eo/Ro) for the yield of phenol
at 308 K with acetone solution 4. CONCLUSION Optimum process conditions for extraction process of phenolic compounds are obtained in the mass ratio of solvent-feed is 1, temperature is 308 K and mole fraction of water in solvent is 0.2 by using an aqueous methanol solvent.
Maximum mole fraction of phenol, p-cresol are 0.055, 0.037, and 0.061, respectively.
Maximum the distribution coefficient of phenol, cresol, and p-cresol are 2.80, 3.66, and 4.55, respectively.
Maximum the yield of phenol, o-cresol, and cresol are 0.66, 0.64, and 0.76, respectively.
Even though the mole fractions of the solutes in the extract are relatively low, but since the boiling points of the solvents and the solutes are differ significantly, the solutes can be easily separated by evaporating the solvents.
Phenolic compounds in low temperature coal tar may be extracted efficiently by methanol and acetone solutions at ambient temperature.
CONSENT
All authors declare that written informed consent was obtained from the patient (or other approved
0.3
0.4
0.5
0.6
0.7
0.8
1 2
Yie
ld
Mole Fraction Ratio of Solvent to Feed
Yw=0,5 Yw=0,5
Yw=0,2 Yw=0,8
Yw=0,5 Yw=0,8
Fardhyanti et al.; BJAST, 8(5): 427-436, 2015; Article no.
435
(b)
effect of mole fraction of water in solvent (Yw) and mole fraction ratio of solvent
yield of phenol (□), o-Cresol (∆), and p-Cresol (○) acetone solution (a) and methanol solution (b)
Optimum process conditions for extraction process of phenolic compounds are obtained in
feed is 1, temperature and mole fraction of water in solvent is
0.2 by using an aqueous methanol solvent.
Maximum mole fraction of phenol, o-cresol, and cresol are 0.055, 0.037, and 0.061,
Maximum the distribution coefficient of phenol, o-are 2.80, 3.66, and 4.55,
cresol, and p-cresol are 0.66, 0.64, and 0.76, respectively.
though the mole fractions of the solutes in the extract are relatively low, but since the boiling
solvents and the solutes are differ significantly, the solutes can be easily separated
Phenolic compounds in low temperature coal tar may be extracted efficiently by methanol and acetone solutions at ambient temperature.
written informed consent was obtained from the patient (or other approved
parties) for publication of this case report and accompanying images.
ACKNOWLEDGEMENTS The authors would like to acknowledge Directorate General of Higher Education, Indonesia, for financial support of this work through the research grant of “Hibah Bersaing” Universitas Negeri Semarang (UNNES)
COMPETING INTERESTS Authors have declared that no competing interests exist.
REFERENCES 1. Meng H, Ge CT,Ren NN, Ma WY, Lu YZ,
Li CX. Complex extraction of phenol and cresol from model coal tar with polyols, ethanol amines and ionic liquids thIndustrial & Engineering Chemistry Research. 2014;53(1):355–362
2. Egashira R, Saito J. Solvent coal tar absorption oil with continuous countercurrent spray columnthe Japan Petroleum Institute218-226.
3. Egashira, Salim C. Separation of distillate by solvent extraction
3
Mole Fraction Ratio of Solvent to Feed
Yw=0,8
Yw=0,2
Yw=0,2
0.4
0.5
0.6
0.7
0.8
1 2
Yie
ld
Mole Fraction Ratio of Solvent to Feed
Yw=0,2 Yw=0,8
Yw=0,2 Yw=0,5
Yw=0,2 Yw=0,5
; Article no.BJAST.2015.222
mole fraction ratio of solvent to ○)
parties) for publication of this case report and
The authors would like to acknowledge Directorate General of Higher Education, Indonesia, for financial support of this work through the research grant of “Hibah Bersaing” Universitas Negeri Semarang (UNNES) 2015.
d that no competing
Ren NN, Ma WY, Lu YZ, extraction of phenol and
cresol from model coal tar with polyols, ethanol amines and ionic liquids thereof. Industrial & Engineering Chemistry
362. Solvent extraction of
coal tar absorption oil with continuous umn. Journal of
the Japan Petroleum Institute. 2007;50(4):
Separation of coal tar ction – Separation
3
Mole Fraction Ratio of Solvent to Feed
Yw=0,5
Yw=0,8
Yw=0,8
Fardhyanti et al.; BJAST, 8(5): 427-436, 2015; Article no.BJAST.2015.222
436
of extract phase using distillation. Journal of the Japan Petroleum Institute. 2006; 49(6):326-334.
4. Egashira R, Salim C, Saito J. Separation of coal tar fractions by solvent extraction–Extraction/solvent separation by secondary extraction. Journal of the Japan Petroleum Institute. 2005;48(1):60-66.
5. Jiang J, Wang Q, Wang Y, Tong W, Xiao B. GC/MS analysis of coal tar composition produced from coal pyrolysis. Bull. Chem. Soc. Ethiop. 2007;21(2):229-240.
6. Ebbe RS, Dennis CE, Franklin GR, and Robert JW. Coal-Tar chemicals and syncrude oil production from low-rank
coals using mild-temperature pyrolysis. AIChE Spring National Meeting, Houston, Texas. 2007;22-26.
7. Casal MD, Diez MA, Alvarez R, Barriocanal C. Primary tar of different cooking coal ranks. International Journal of Coal Geology. 2008;76:237-242.
8. Fardhyanti DS. Model Matematis Termodinamika dalam Rangka Pemungutan Komponen-komponen Utama dalam Tir Batubara dengan Proses Ekstraksi Cair-cair. Doctoral Diss. Gadjah Mada University. Yogyakarta. Indonesia; 2014.
_________________________________________________________________________________ © 2015 Fardhyanti et al.; This is an Open Access article distributed under the terms of the Creative Commons Attribution License (http://creativecommons.org/licenses/by/4.0), which permits unrestricted use, distribution, and reproduction in any medium, provided the original work is properly cited.
Peer-review history: The peer review history for this paper can be accessed here:
http://www.sciencedomain.org/review-history.php?iid=1073&id=5&aid=8967
![Thermal Applications of p-Cresol-Oxamide-Formaldehyde … · 2020. 7. 10. · Various modified phenol-formaldehyde resins have large number of practical applications [1, 2 , 3] viz](https://img.pdfslide.us/doc/110x75/60b072c8f3736a002545324a/thermal-applications-of-p-cresol-oxamide-formaldehyde-2020-7-10-various-modified.jpg)


![Lenzinger Berichte - TU Wien...LENZINGER BERICHTE 94 (2018) 15 – 26 organic acids, phenol and cresol as well as esters, ketones and amines can be applied [1]. Many process variants](https://img.pdfslide.us/doc/110x75/61244b1a37a0c255c42a0281/lenzinger-berichte-tu-wien-lenzinger-berichte-94-2018-15-a-26-organic.jpg)