Embed Size (px)
Citation preview
February 2018
This Word module should be used for all taxonomic proposals. Please complete Part 1 and:
either Part 3 for proposals to create new taxa or change existing taxa or Part 2 for proposals of a general nature.
Submit the completed Word module, together with the accompanying Excel module named in Part 3, to the appropriate ICTV Subcommittee Chair.
For guidance, see the notes written in blue, below, and the help notes in file Taxonomic_Proposals_Help_2018.
Part 1: TITLE, AUTHORS, etc
Code assigned: 2018.001S (to be completed by ICTV officers)
Short title: (e.g. “6 new species in the genus Zetavirus”)
1 new picornavirus genus (Ailurivirus) with 1 species (Ailurivirus A)
Author(s):Roland Zell, Alexander E. Gorbalenya, Tapani Hovi, Andrew M.Q. King, Nick J. Knowles, A. Michael Lindberg, M. Steven Oberste, Ann C. Palmenberg, Gabor Reuter, Peter Simmonds, Tim Skern, Caroline Tapparel, Katja C. Wolthers, Patrick C.Y. Woo
Corresponding author with e-mail address:Roland Zell ([email protected])
List the ICTV study group(s) that have seen this proposal:A list of study groups and contacts is provided at http://www.ictvonline.org/subcommittees.asp . If in doubt, contact the appropriate subcommittee chair (there are six virus subcommittees: animal DNA and retroviruses, animal ssRNA-, animal ssRNA+, fungal and protist, plant, bacterial and archaeal)
Picornaviridae Study Group
ICTV Study Group comments (if any) and response of the proposer:
Date first submitted to ICTV: 15/06/2018Date of this revision (if different to above):
ICTV-EC comments and response of the proposer:
Page 1 of 19
February 2018
Part 2: NON-STANDARDTemplate for any proposal regarding ICTV procedures, rules or policy, not involving the creation of new taxonomy.
Text of proposal:
Part 3: PROPOSED TAXONOMY
Name of accompanying Excel module: 2018.001S.N.v1.Ailurivirus
The taxonomic changes you are proposing should be presented on an accompanying Excel module, 2017_TP_Template_Excel_module. Please enter the file name of the completed module in this box.
Supporting material:additional material in support of this proposal
Please explain the reasons for the taxonomic changes you are proposing and provide evidence to support them. The following information should be provided, where relevant: Species demarcation criteria: Explain how new species differ from others in the genus and
demonstrate that these differences meet the criteria previously established for demarcating between species. If no criteria have previously been established, and if there will now be more than one species in the genus, please state the demarcation criteria you are proposing.
Higher taxa:o There is no formal requirement to state demarcation criteria when proposing new genera
or other higher taxa. However, a similar concept should apply in pursuit of a rational and consistent virus taxonomy.
o Please indicate the origin of names assigned to new taxa at genus level and above.o For each new genus a type species must be designated to represent it. Please explain
your choice. Supporting evidence: The use of Figures and Tables is strongly recommended (note that
copying from publications will require permission from the copyright holder). For phylogenetic analysis, try to provide a tree where branch length is related to genetic distance.
Create 1 new species (Ailurivirus A) in a new genus (Ailurivirus)
Page 2 of 19
February 2018
Novel picornaviruses—named aimelvirus 1 to 6—have been detected in faecal specimens of giant pandas (Ailuropoda melanoleuca). No virus was isolated yet. Ailuriviruses were detected in wild (1 sick, 1 healthy) and captive (healthy) giant pandas.
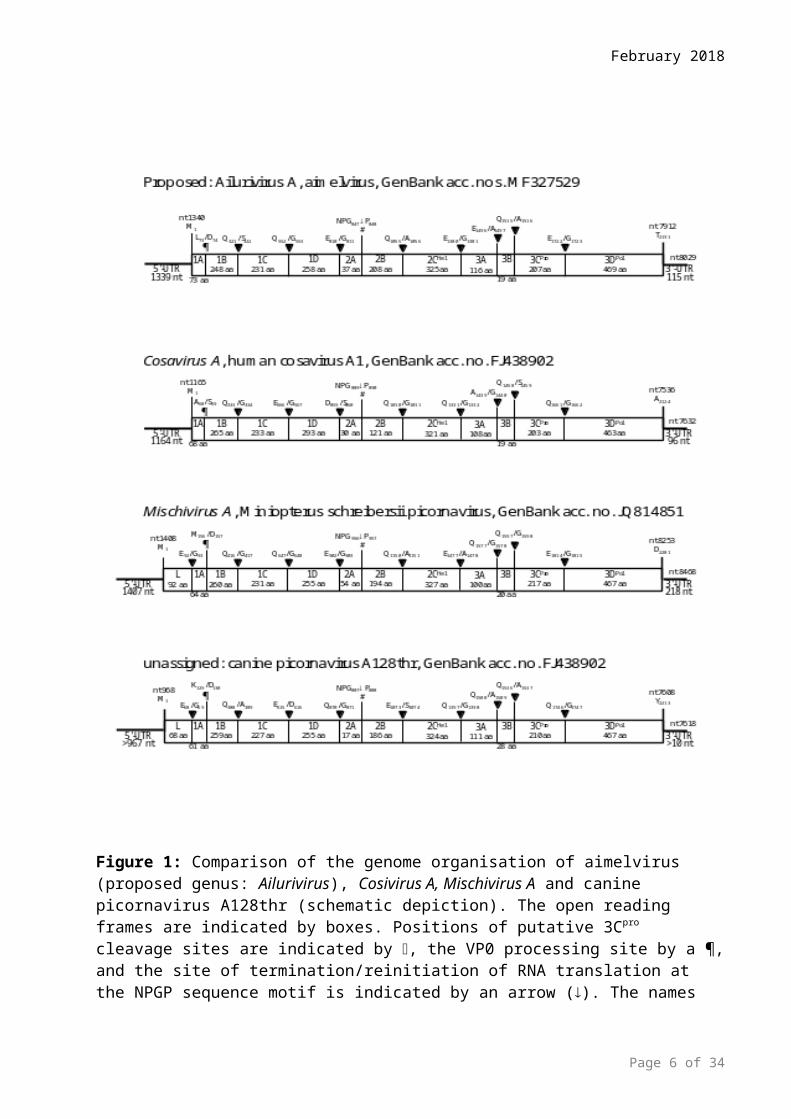
Relation to other picornaviruses:- Ailuriviruses have a typical picornavirus genome layout:
5'-UTR[1A-1B-1C-1D-2Anpgp/2B-2Chel/3A-3BVPg-3Cpro-3Dpol]3'UTR(compare Fig. 1 of supporting material)
- Ailuriviruses possess typical hallmarks of picornaviruses: capsid protein 1B, 1C, 1D: rhv domain with drug-binding site, 2A: NPGP sequence motif,2Chel: GxxGxGKS motif of helicases,3BVPg: Y-3 residue,3Cpro: CxCGx14GxH motif,3Dpol: KDE, PSG, YGDD, FLKR motifs
- Phylogenetic analyses indicate a distinct clade that clusters either with cosaviruses (P1 tree) or with mischiviruses/canine picornavirus A128thr (2Chel, 3Cpro, 3Dpol trees; compare Figs. 2-5 of supporting material).
- Ailuriviruses have no L protein (in common with cosaviruses). - The P1 region shares closest sequence similarity to the cosavirus P1.- The 2B-2Chel and 3BVPg-3Cpro-3Dpol proteins of ailuriviruses have similarity to the respective
proteins of mischiviruses and the canine picornavirus A128thr.
Distinguishing features of ailuriviruses compared to cosa- and mischiviruses: 1. Ailuriviruses have a unique 3A protein;2. Sequence divergence (uncorrected p-distances) of all relevant genome regions is high in
pairwise comparisons:- VP1: nt divergence >0.55, aa divergence >0.65;- P1: nt divergence >0.5, aa divergence >0.6;- 2Chel: nt divergence >0.43, aa divergence >0.5;- 3Cpro: nt divergence >0.4, aa divergence >0.5;- 3Dpol: nt divergence >0.39, aa divergence >0.43
(compare tables 1-10 of supporting material);3. Available sequence data indicate that within-species nt divergences range from 0.1% to 29.7%
in VP1 gene region (aa divergence <24.4%) and 0.4-25.4% in the P1 region (aa divergence <17.3%).
4. (Geno-)Types have not been defined yet.5. No species demarcation criteria have been defined.
Type species of genus: Ailurivirus A, aimelvirus 1 [gpai001], GenBank acc. no. MF327529
Species demarcation criteria:not applicable
Origin of name:
Page 3 of 19
February 2018
ailuri refers to the host Ailuropoda melanoleuca,aimel refers to the host Ailuropoda melanoleuca.
References:
Zhang W, Yang S, Shan T, Hou R, Liu Z, Li W, Guo L, Wang Y, Chen P, Wang X, Feng F, Wang H, Chen C, Shen Q, Zhou C, Hua X, Cui L, Deng X, Zhang Z, Qi D, Delwart E. 2017. Virome comparisons in wild-diseased and healthy captive giant pandas. Microbiome 5:90.
Page 4 of 19
February 2018
Figure 1: Comparison of the genome organisation of aimelvirus (proposed genus: Ailurivirus), Cosivirus A, Mischivirus A and canine picornavirus A128thr (schematic depiction). The open reading frames are indicated by boxes. Positions of putative 3Cpro cleavage sites are indicated by , the VP0 processing site by a ¶, and the site of termination/reinitiation of RNA translation at the NPGP sequence motif is indicated by an arrow (). The names and lengths of the deduced proteins are presented. The 5'-UTR and the 3'UTR of the canine picornavirus may be incomplete.
Page 5 of 19
February 2018
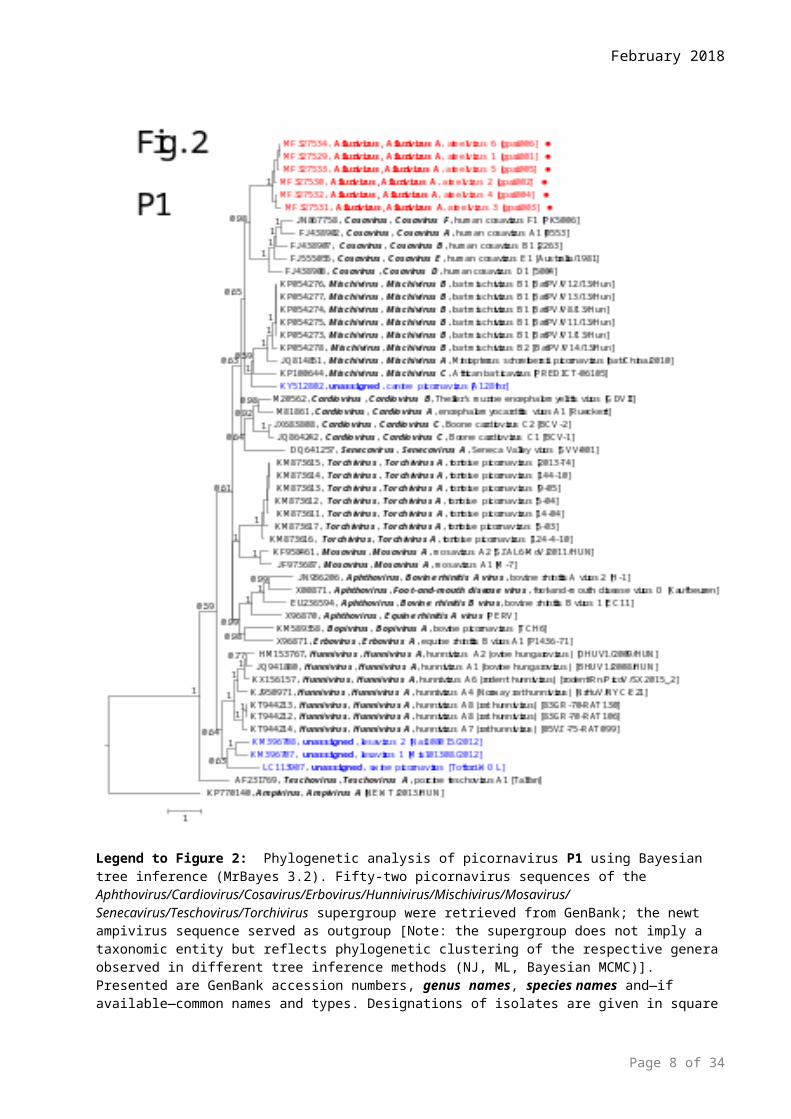
Legend to Figure 2: Phylogenetic analysis of picornavirus P1 using Bayesian tree inference (MrBayes 3.2). Fifty-two picornavirus sequences of the Aphthovirus/Cardiovirus/Cosavirus/Erbovirus/Hunnivirus/Mischivirus/Mosavirus/ Senecavirus/Teschovirus/Torchivirus supergroup were retrieved from GenBank; the newt ampivirus sequence served as outgroup [Note: the supergroup does not imply a taxonomic entity but reflects phylogenetic clustering of the respective genera observed in different tree inference methods (NJ, ML, Bayesian MCMC)]. Presented are GenBank accession numbers, genus names, species names and—if available—common names and types. Designations of isolates are given in square brackets. Yet unassigned viruses are printed in blue. Proposed names are printed in red and indicated by a dot (). Numbers at nodes indicate posterior probabilities obtained after 4,000,000 generations. The optimal substitution model (GTR+G+I) was determined with MEGA 5. The scale indicates substitutions/site.
Page 6 of 19
February 2018
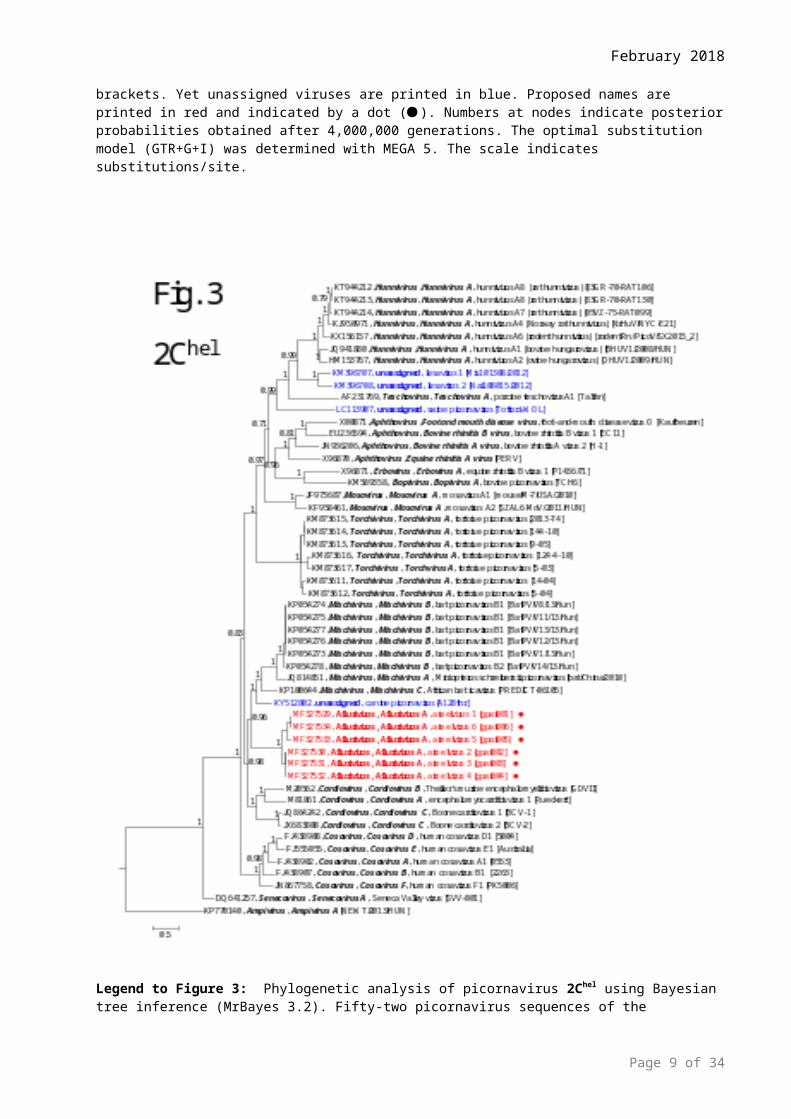
Legend to Figure 3: Phylogenetic analysis of picornavirus 2Chel using Bayesian tree inference (MrBayes 3.2). Fifty-two picornavirus sequences of the Aphthovirus/Cardiovirus/Cosavirus/Erbovirus/Hunnivirus/Mischivirus/ Mosavirus/Senecavirus/Teschovirus/Torchivirus supergroup were retrieved from GenBank; the newt ampivirus sequence served as outgroup [Note: the supergroup does not imply a taxonomic entity but reflects phylogenetic clustering of the respective genera observed in different tree inference methods (NJ, ML, Bayesian MCMC)]. Presented are GenBank accession numbers, genus names, species names and—if available—common names and types. Designations of isolates are given in square brackets. Yet unassigned viruses are printed in blue. Proposed names are printed in red and indicated by a dot (). Numbers at nodes indicate posterior probabilities obtained after 2,000,000 generations. The optimal substitution model (GTR+G+I) was determined with MEGA 5. The scale indicates substitutions/site.
Page 7 of 19
February 2018
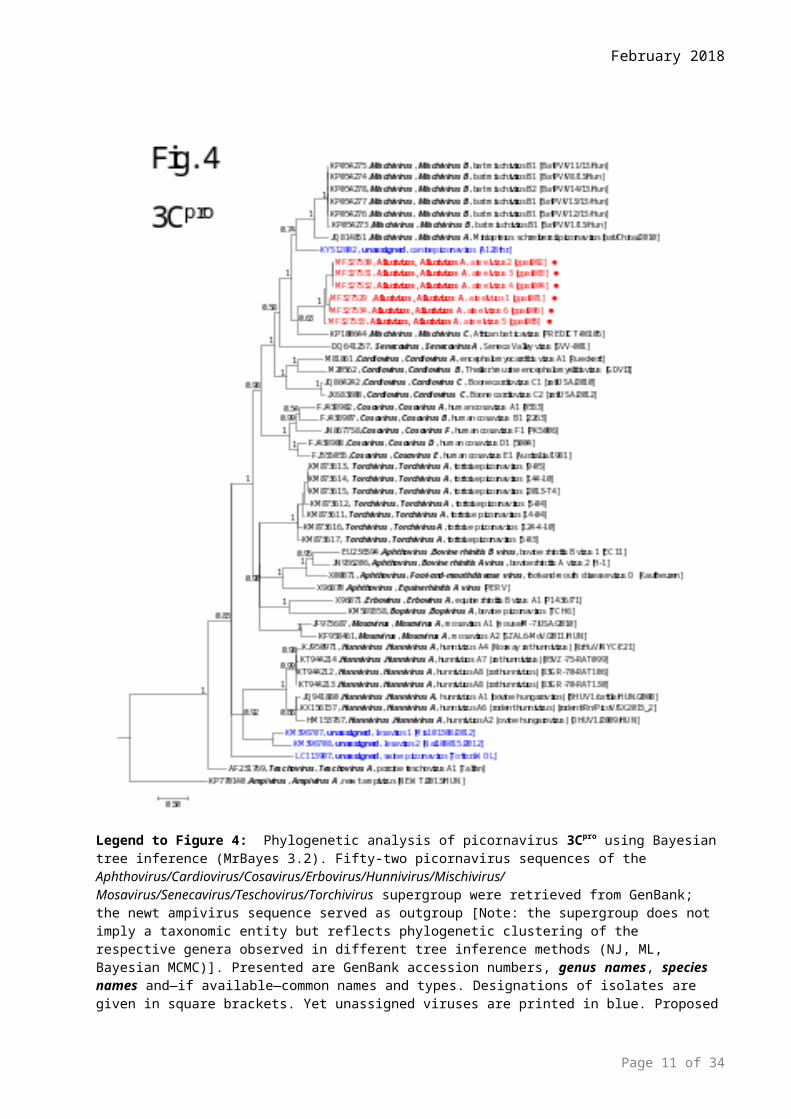
Legend to Figure 4: Phylogenetic analysis of picornavirus 3Cpro using Bayesian tree inference (MrBayes 3.2). Fifty-two picornavirus sequences of the Aphthovirus/Cardiovirus/Cosavirus/Erbovirus/Hunnivirus/Mischivirus/ Mosavirus/Senecavirus/Teschovirus/Torchivirus supergroup were retrieved from GenBank; the newt ampivirus sequence served as outgroup [Note: the supergroup does not imply a taxonomic entity but reflects phylogenetic clustering of the respective genera observed in different tree inference methods (NJ, ML, Bayesian MCMC)]. Presented are GenBank accession numbers, genus names, species names and—if available—common names and types. Designations of isolates are given in square brackets. Yet unassigned viruses are printed in blue. Proposed names are printed in red and indicated by a dot (). Numbers at nodes indicate posterior probabilities obtained after 4,000,000 generations. The optimal substitution model (GTR+G+I) was determined with MEGA 5. The scale indicates substitutions/site.
Page 8 of 19
February 2018
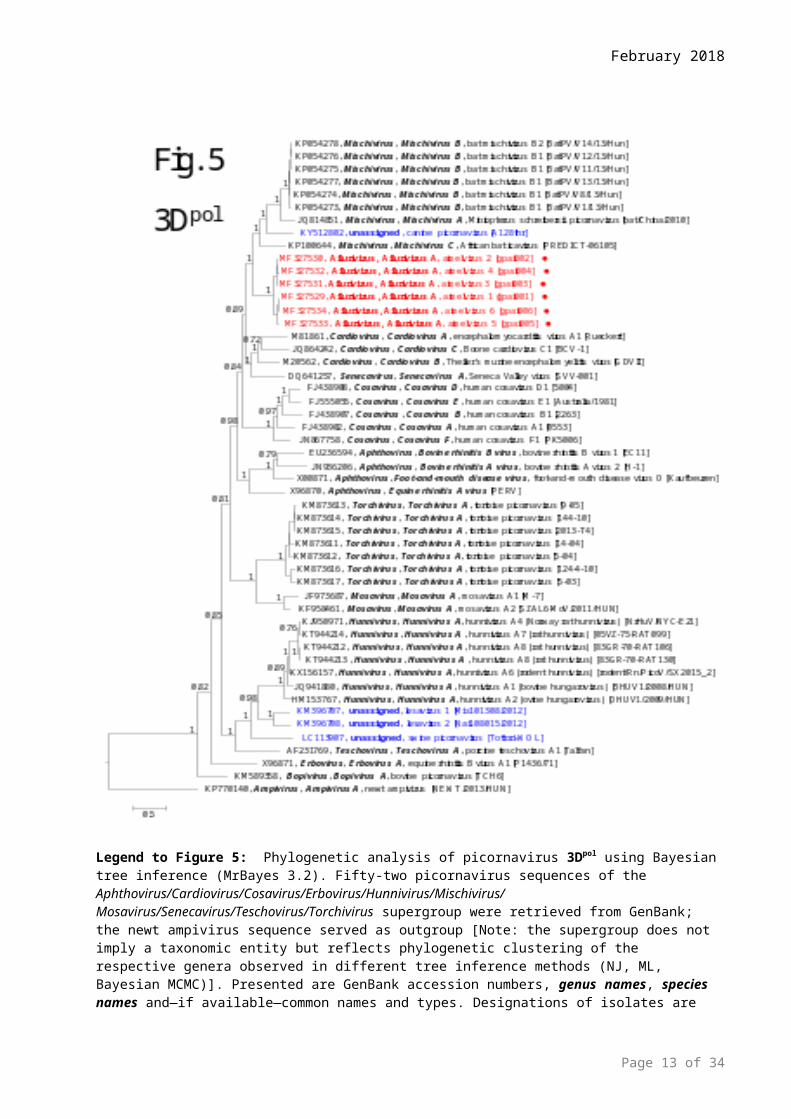
Legend to Figure 5: Phylogenetic analysis of picornavirus 3Dpol using Bayesian tree inference (MrBayes 3.2). Fifty-two picornavirus sequences of the Aphthovirus/Cardiovirus/Cosavirus/Erbovirus/Hunnivirus/Mischivirus/ Mosavirus/Senecavirus/Teschovirus/Torchivirus supergroup were retrieved from GenBank; the newt ampivirus sequence served as outgroup [Note: the supergroup does not imply a taxonomic entity but reflects phylogenetic clustering of the respective genera observed in different tree inference methods (NJ, ML, Bayesian MCMC)]. Presented are GenBank accession numbers, genus names, species names and—if available—common names and types. Designations of isolates are given in square brackets. Yet unassigned viruses are printed in blue. Proposed names are printed in red and indicated by a dot (). Numbers at nodes indicate posterior probabilities obtained after 2,000,000 generations. The optimal substitution model (GTR+G+I) was determined with MEGA 5. The scale indicates substitutions/site.
Page 9 of 19
February 2018
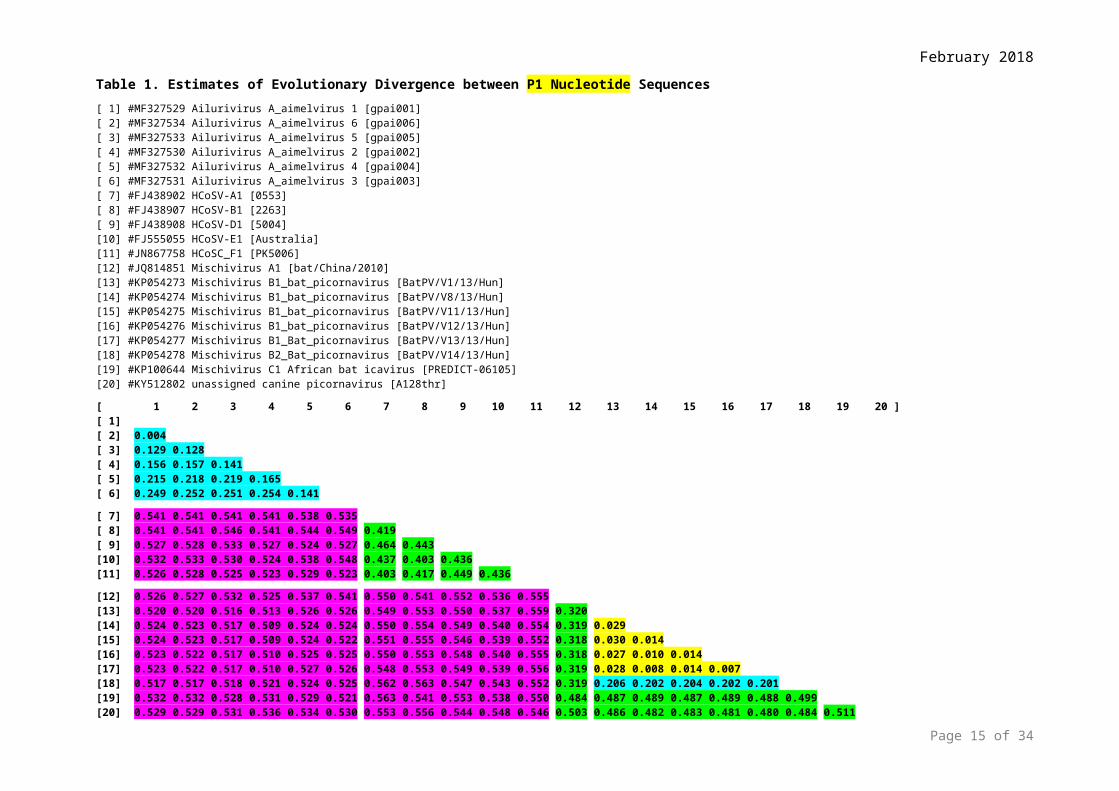
Table 1. Estimates of Evolutionary Divergence between P1 Nucleotide Sequences[ 1] #MF327529 Ailurivirus A_aimelvirus 1 [gpai001][ 2] #MF327534 Ailurivirus A_aimelvirus 6 [gpai006][ 3] #MF327533 Ailurivirus A_aimelvirus 5 [gpai005][ 4] #MF327530 Ailurivirus A_aimelvirus 2 [gpai002][ 5] #MF327532 Ailurivirus A_aimelvirus 4 [gpai004][ 6] #MF327531 Ailurivirus A_aimelvirus 3 [gpai003][ 7] #FJ438902 HCoSV-A1 [0553][ 8] #FJ438907 HCoSV-B1 [2263][ 9] #FJ438908 HCoSV-D1 [5004][10] #FJ555055 HCoSV-E1 [Australia][11] #JN867758 HCoSC_F1 [PK5006][12] #JQ814851 Mischivirus A1 [bat/China/2010][13] #KP054273 Mischivirus B1_bat_picornavirus [BatPV/V1/13/Hun][14] #KP054274 Mischivirus B1_bat_picornavirus [BatPV/V8/13/Hun][15] #KP054275 Mischivirus B1_bat_picornavirus [BatPV/V11/13/Hun][16] #KP054276 Mischivirus B1_bat_picornavirus [BatPV/V12/13/Hun][17] #KP054277 Mischivirus B1_Bat_picornavirus [BatPV/V13/13/Hun][18] #KP054278 Mischivirus B2_Bat_picornavirus [BatPV/V14/13/Hun][19] #KP100644 Mischivirus C1 African bat icavirus [PREDICT-06105][20] #KY512802 unassigned canine picornavirus [A128thr]
[ 1 2 3 4 5 6 7 8 9 10 11 12 13 14 15 16 17 18 19 20 ][ 1][ 2] 0.004[ 3] 0.129 0.128[ 4] 0.156 0.157 0.141[ 5] 0.215 0.218 0.219 0.165[ 6] 0.249 0.252 0.251 0.254 0.141
[ 7] 0.541 0.541 0.541 0.541 0.538 0.535[ 8] 0.541 0.541 0.546 0.541 0.544 0.549 0.419[ 9] 0.527 0.528 0.533 0.527 0.524 0.527 0.464 0.443[10] 0.532 0.533 0.530 0.524 0.538 0.548 0.437 0.403 0.436[11] 0.526 0.528 0.525 0.523 0.529 0.523 0.403 0.417 0.449 0.436
[12] 0.526 0.527 0.532 0.525 0.537 0.541 0.550 0.541 0.552 0.536 0.555[13] 0.520 0.520 0.516 0.513 0.526 0.526 0.549 0.553 0.550 0.537 0.559 0.320[14] 0.524 0.523 0.517 0.509 0.524 0.524 0.550 0.554 0.549 0.540 0.554 0.319 0.029[15] 0.524 0.523 0.517 0.509 0.524 0.522 0.551 0.555 0.546 0.539 0.552 0.318 0.030 0.014[16] 0.523 0.522 0.517 0.510 0.525 0.525 0.550 0.553 0.548 0.540 0.555 0.318 0.027 0.010 0.014[17] 0.523 0.522 0.517 0.510 0.527 0.526 0.548 0.553 0.549 0.539 0.556 0.319 0.028 0.008 0.014 0.007[18] 0.517 0.517 0.518 0.521 0.524 0.525 0.562 0.563 0.547 0.543 0.552 0.319 0.206 0.202 0.204 0.202 0.201[19] 0.532 0.532 0.528 0.531 0.529 0.521 0.563 0.541 0.553 0.538 0.550 0.484 0.487 0.489 0.487 0.489 0.488 0.499[20] 0.529 0.529 0.531 0.536 0.534 0.530 0.553 0.556 0.544 0.548 0.546 0.503 0.486 0.482 0.483 0.481 0.480 0.484 0.511
The number of base differences per site from between sequences are shown. The analysis involved 20 nucleotide sequences. Codon positions included were 1st+2nd+3rd+Noncoding. All ambiguous positions were removed for each sequence pair. There were a total of 2733 positions in the final dataset. Evolutionary analyses were conducted in MEGA5 [1].The number of base differences per site from between sequences are shown. The analysis involved 20 nucleotide sequences. Codon positions included were 1st+2nd+3rd+Noncoding. All ambiguous positions were removed for each sequence pair. There were a total of 2733 positions in the final dataset. Evolutionary analyses were conducted in MEGA5 [1].___ within type comparison, ___ between types/within species comparison,
___ between species/within genus comparison, ___ between genera comparison
Page 10 of 19
February 2018
Table 2. Estimates of Evolutionary Divergence between P1 Amino Acid Sequences[ 1] #MF327529 Ailurivirus A_aimelvirus 1 [gpai001][ 2] #MF327534 Ailurivirus A_aimelvirus 6 [gpai006][ 3] #MF327533 Ailurivirus A_aimelvirus 5 [gpai005][ 4] #MF327530 Ailurivirus A_aimelvirus 2 [gpai002][ 5] #MF327532 Ailurivirus A_aimelvirus 4 [gpai004][ 6] #MF327531 Ailurivirus A_aimelvirus 3 [gpai003][ 7] #FJ438902 HCoSV-A1 [0553][ 8] #FJ438907 HCoSV-B1 [2263][ 9] #FJ438908 HCoSV-D1 [5004][10] #FJ555055 HCoSV-E1 [Australia][11] #JN867758 HCoSC_F1 [PK5006][12] #JQ814851 Mischivirus A1 [bat/China/2010][13] #KP054273 Mischivirus B1_bat_picornavirus [BatPV/V1/13/Hun][14] #KP054274 Mischivirus B1_bat_picornavirus [BatPV/V8/13/Hun][15] #KP054275 Mischivirus B1_bat_picornavirus [BatPV/V11/13/Hun][16] #KP054276 Mischivirus B1_bat_picornavirus [BatPV/V12/13/Hun][17] #KP054277 Mischivirus B1_Bat_picornavirus [BatPV/V13/13/Hun][18] #KP054278 Mischivirus B2_Bat_picornavirus [BatPV/V14/13/Hun][19] #KP100644 Mischivirus C1 African bat icavirus [PREDICT-06105][20] #KY512802 unassigned canine picornavirus [A128thr]
[ 1 2 3 4 5 6 7 8 9 10 11 12 13 14 15 16 17 18 19 20 ][ 1][ 2] 0.004[ 3] 0.067 0.068[ 4] 0.043 0.044 0.064[ 5] 0.127 0.130 0.152 0.119[ 6] 0.157 0.158 0.173 0.169 0.119
[ 7] 0.662 0.659 0.658 0.661 0.673 0.655[ 8] 0.645 0.643 0.646 0.640 0.664 0.658 0.448[ 9] 0.649 0.648 0.650 0.645 0.659 0.643 0.526 0.506[10] 0.645 0.643 0.647 0.640 0.668 0.652 0.465 0.430 0.489[11] 0.628 0.626 0.633 0.627 0.647 0.631 0.393 0.417 0.505 0.478
[12] 0.617 0.616 0.621 0.612 0.627 0.614 0.648 0.645 0.668 0.641 0.657[13] 0.609 0.608 0.608 0.600 0.616 0.608 0.651 0.655 0.662 0.645 0.656 0.267[14] 0.609 0.608 0.608 0.600 0.616 0.608 0.651 0.655 0.662 0.645 0.656 0.267 0.001[15] 0.609 0.608 0.608 0.600 0.616 0.608 0.651 0.655 0.662 0.645 0.656 0.267 0.001 0.000[16] 0.608 0.607 0.607 0.598 0.617 0.609 0.651 0.655 0.662 0.645 0.656 0.265 0.002 0.001 0.001[17] 0.607 0.605 0.605 0.600 0.616 0.605 0.649 0.655 0.665 0.645 0.656 0.268 0.004 0.002 0.002 0.004[18] 0.612 0.611 0.613 0.605 0.624 0.615 0.657 0.657 0.655 0.649 0.656 0.277 0.148 0.148 0.148 0.149 0.148[19] 0.629 0.627 0.627 0.627 0.632 0.620 0.668 0.655 0.678 0.656 0.666 0.554 0.547 0.545 0.545 0.545 0.545 0.558[20] 0.642 0.640 0.648 0.639 0.661 0.643 0.669 0.670 0.667 0.655 0.660 0.564 0.551 0.551 0.551 0.552 0.550 0.543 0.586
The number of amino acid differences per site from between sequences are shown. The analysis involved 20 amino acid sequences. The coding data was translated assuming a Standard genetic code table. All ambiguous positions were removed for each sequence pair. There were a total of 911 positions in the final dataset. Evolutionary analyses were conducted in MEGA5 [1].___ within type comparison, ___ between types/within species comparison,
___ between species/within genus comparison, ___ between genera comparison
Page 11 of 19
February 2018
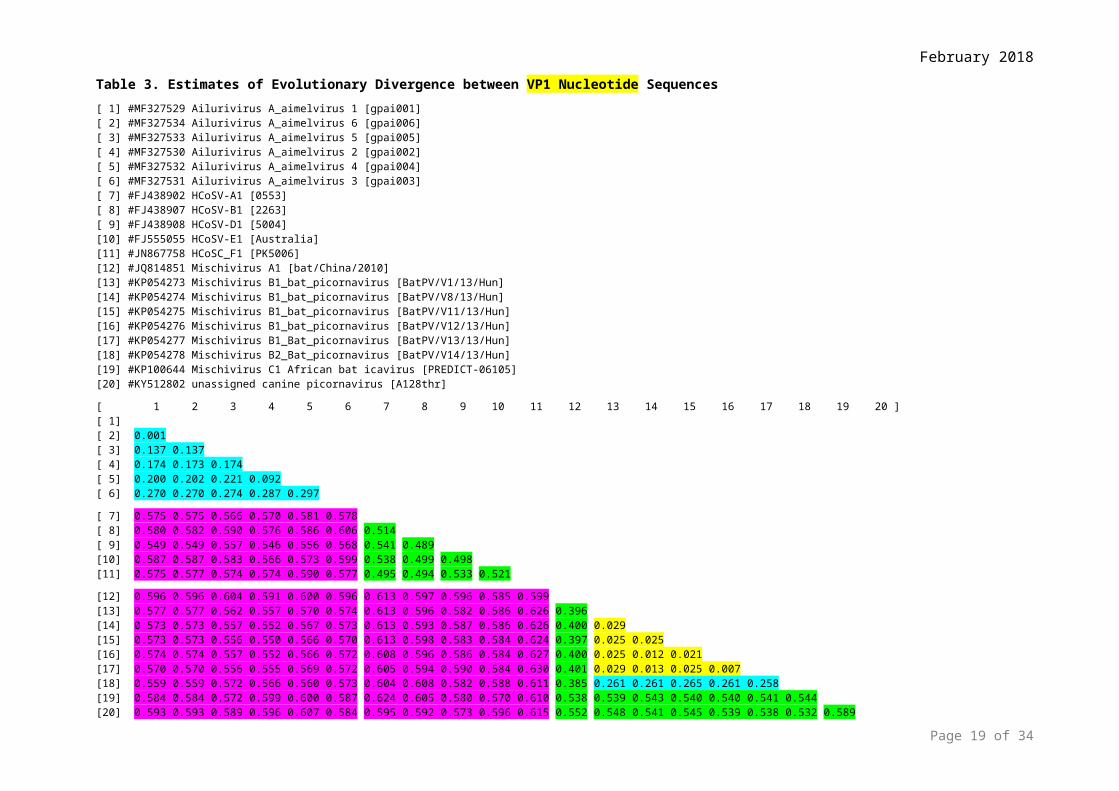
Table 3. Estimates of Evolutionary Divergence between VP1 Nucleotide Sequences[ 1] #MF327529 Ailurivirus A_aimelvirus 1 [gpai001][ 2] #MF327534 Ailurivirus A_aimelvirus 6 [gpai006][ 3] #MF327533 Ailurivirus A_aimelvirus 5 [gpai005][ 4] #MF327530 Ailurivirus A_aimelvirus 2 [gpai002][ 5] #MF327532 Ailurivirus A_aimelvirus 4 [gpai004][ 6] #MF327531 Ailurivirus A_aimelvirus 3 [gpai003][ 7] #FJ438902 HCoSV-A1 [0553][ 8] #FJ438907 HCoSV-B1 [2263][ 9] #FJ438908 HCoSV-D1 [5004][10] #FJ555055 HCoSV-E1 [Australia][11] #JN867758 HCoSC_F1 [PK5006][12] #JQ814851 Mischivirus A1 [bat/China/2010][13] #KP054273 Mischivirus B1_bat_picornavirus [BatPV/V1/13/Hun][14] #KP054274 Mischivirus B1_bat_picornavirus [BatPV/V8/13/Hun][15] #KP054275 Mischivirus B1_bat_picornavirus [BatPV/V11/13/Hun][16] #KP054276 Mischivirus B1_bat_picornavirus [BatPV/V12/13/Hun][17] #KP054277 Mischivirus B1_Bat_picornavirus [BatPV/V13/13/Hun][18] #KP054278 Mischivirus B2_Bat_picornavirus [BatPV/V14/13/Hun][19] #KP100644 Mischivirus C1 African bat icavirus [PREDICT-06105][20] #KY512802 unassigned canine picornavirus [A128thr]
[ 1 2 3 4 5 6 7 8 9 10 11 12 13 14 15 16 17 18 19 20 ][ 1][ 2] 0.001[ 3] 0.137 0.137[ 4] 0.174 0.173 0.174[ 5] 0.200 0.202 0.221 0.092[ 6] 0.270 0.270 0.274 0.287 0.297
[ 7] 0.575 0.575 0.566 0.570 0.581 0.578[ 8] 0.580 0.582 0.590 0.576 0.586 0.606 0.514[ 9] 0.549 0.549 0.557 0.546 0.556 0.568 0.541 0.489[10] 0.587 0.587 0.583 0.566 0.573 0.599 0.538 0.499 0.498[11] 0.575 0.577 0.574 0.574 0.590 0.577 0.495 0.494 0.533 0.521
[12] 0.596 0.596 0.604 0.591 0.600 0.596 0.613 0.597 0.596 0.585 0.599[13] 0.577 0.577 0.562 0.557 0.570 0.574 0.613 0.596 0.582 0.586 0.626 0.396[14] 0.573 0.573 0.557 0.552 0.567 0.573 0.613 0.593 0.587 0.586 0.626 0.400 0.029[15] 0.573 0.573 0.556 0.550 0.566 0.570 0.613 0.598 0.583 0.584 0.624 0.397 0.025 0.025[16] 0.574 0.574 0.557 0.552 0.566 0.572 0.608 0.596 0.586 0.584 0.627 0.400 0.025 0.012 0.021[17] 0.570 0.570 0.556 0.555 0.569 0.572 0.605 0.594 0.590 0.584 0.630 0.401 0.029 0.013 0.025 0.007[18] 0.559 0.559 0.572 0.566 0.560 0.573 0.604 0.608 0.582 0.588 0.611 0.385 0.261 0.261 0.265 0.261 0.258[19] 0.584 0.584 0.572 0.599 0.600 0.587 0.624 0.605 0.580 0.570 0.610 0.538 0.539 0.543 0.540 0.540 0.541 0.544[20] 0.593 0.593 0.589 0.596 0.607 0.584 0.595 0.592 0.573 0.596 0.615 0.552 0.548 0.541 0.545 0.539 0.538 0.532 0.589
The number of base differences per site from between sequences are shown. The analysis involved 20 nucleotide sequences. Codon positions included were 1st+2nd+3rd+Noncoding. All ambiguous positions were removed for each sequence pair. There were a total of 963 positions in the final dataset. Evolutionary analyses were conducted in MEGA5 [1].___ within type comparison, ___ between types/within species comparison,
___ between species/within genus comparison, ___ between genera comparison
Page 12 of 19
February 2018
Table 4. Estimates of Evolutionary Divergence between VP1 Amino acid Sequences[ 1] #MF327529 Ailurivirus A_aimelvirus 1 [gpai001][ 2] #MF327534 Ailurivirus A_aimelvirus 6 [gpai006][ 3] #MF327533 Ailurivirus A_aimelvirus 5 [gpai005][ 4] #MF327530 Ailurivirus A_aimelvirus 2 [gpai002][ 5] #MF327532 Ailurivirus A_aimelvirus 4 [gpai004][ 6] #MF327531 Ailurivirus A_aimelvirus 3 [gpai003][ 7] #FJ438902 HCoSV-A1 [0553][ 8] #FJ438907 HCoSV-B1 [2263][ 9] #FJ438908 HCoSV-D1 [5004][10] #FJ555055 HCoSV-E1 [Australia][11] #JN867758 HCoSC_F1 [PK5006][12] #JQ814851 Mischivirus A1 [bat/China/2010][13] #KP054273 Mischivirus B1_bat_picornavirus [BatPV/V1/13/Hun][14] #KP054274 Mischivirus B1_bat_picornavirus [BatPV/V8/13/Hun][15] #KP054275 Mischivirus B1_bat_picornavirus [BatPV/V11/13/Hun][16] #KP054276 Mischivirus B1_bat_picornavirus [BatPV/V12/13/Hun][17] #KP054277 Mischivirus B1_Bat_picornavirus [BatPV/V13/13/Hun][18] #KP054278 Mischivirus B2_Bat_picornavirus [BatPV/V14/13/Hun][19] #KP100644 Mischivirus C1 African bat icavirus [PREDICT-06105][20] #KY512802 unassigned canine picornavirus [A128thr]
[ 1 2 3 4 5 6 7 8 9 10 11 12 13 14 15 16 17 18 19 20 ][ 1][ 2] 0.000[ 3] 0.085 0.085[ 4] 0.047 0.047 0.085[ 5] 0.124 0.124 0.167 0.093[ 6] 0.171 0.171 0.198 0.186 0.244
[ 7] 0.722 0.722 0.718 0.730 0.766 0.722[ 8] 0.709 0.709 0.713 0.709 0.733 0.717 0.582[ 9] 0.687 0.687 0.687 0.679 0.711 0.687 0.651 0.576[10] 0.714 0.714 0.710 0.714 0.750 0.702 0.594 0.548 0.601[11] 0.679 0.679 0.690 0.687 0.726 0.690 0.540 0.493 0.608 0.577
[12] 0.709 0.709 0.726 0.700 0.730 0.700 0.751 0.724 0.738 0.721 0.741[13] 0.672 0.672 0.672 0.655 0.689 0.677 0.745 0.730 0.715 0.718 0.735 0.371[14] 0.672 0.672 0.672 0.655 0.689 0.677 0.745 0.730 0.715 0.718 0.735 0.371 0.000[15] 0.672 0.672 0.672 0.655 0.689 0.677 0.745 0.730 0.715 0.718 0.735 0.371 0.000 0.000[16] 0.672 0.672 0.672 0.655 0.689 0.677 0.745 0.730 0.715 0.718 0.735 0.371 0.000 0.000 0.000[17] 0.664 0.664 0.664 0.655 0.689 0.668 0.737 0.730 0.724 0.718 0.735 0.375 0.008 0.008 0.008 0.008[18] 0.698 0.698 0.694 0.689 0.719 0.706 0.753 0.725 0.720 0.726 0.739 0.388 0.221 0.221 0.221 0.221 0.221[19] 0.706 0.706 0.706 0.711 0.740 0.719 0.743 0.731 0.739 0.726 0.738 0.669 0.632 0.632 0.632 0.632 0.632 0.649[20] 0.736 0.736 0.732 0.728 0.762 0.728 0.744 0.718 0.714 0.729 0.746 0.668 0.648 0.648 0.648 0.648 0.643 0.648 0.711
The number of amino acid differences per site from between sequences are shown. The analysis involved 20 amino acid sequences. The coding data was translated assuming a Standard genetic code table. All ambiguous positions were removed for each sequence pair. There were a total of 321 positions in the final dataset. Evolutionary analyses were conducted in MEGA5 [1].___ within type comparison, ___ between types/within species comparison,
___ between species/within genus comparison, ___ between genera comparison
Page 13 of 19
February 2018
Table 5. Estimates of Evolutionary Divergence between 2Chel Nucleotide Sequences[ 1] #MF327529 Ailurivirus A_aimelvirus 1 [gpai001][ 2] #MF327534 Ailurivirus A_aimelvirus 6 [gpai006][ 3] #MF327533 Ailurivirus A_aimelvirus 5 [gpai005][ 4] #MF327530 Ailurivirus A_aimelvirus 2 [gpai002][ 5] #MF327532 Ailurivirus A_aimelvirus 4 [gpai004][ 6] #MF327531 Ailurivirus A_aimelvirus 3 [gpai003][ 7] #FJ438902 HCoSV-A1 [0553][ 8] #FJ438907 HCoSV-B1 [2263][ 9] #FJ438908 HCoSV-D1 [5004][10] #FJ555055 HCoSV-E1 [Australia][11] #JN867758 HCoSC_F1 [PK5006][12] #JQ814851 Mischivirus A1 [bat/China/2010][13] #KP054273 Mischivirus B1_bat_picornavirus [BatPV/V1/13/Hun][14] #KP054274 Mischivirus B1_bat_picornavirus [BatPV/V8/13/Hun][15] #KP054275 Mischivirus B1_bat_picornavirus [BatPV/V11/13/Hun][16] #KP054276 Mischivirus B1_bat_picornavirus [BatPV/V12/13/Hun][17] #KP054277 Mischivirus B1_Bat_picornavirus [BatPV/V13/13/Hun][18] #KP054278 Mischivirus B2_Bat_picornavirus [BatPV/V14/13/Hun][19] #KP100644 Mischivirus C1 African bat icavirus [PREDICT-06105][20] #KY512802 unassigned canine picornavirus [A128thr]
[ 1 2 3 4 5 6 7 8 9 10 11 12 13 14 15 16 17 18 19 20 ][ 1][ 2] 0.001[ 3] 0.150 0.150[ 4] 0.212 0.212 0.207[ 5] 0.214 0.214 0.202 0.041[ 6] 0.218 0.218 0.209 0.035 0.035
[ 7] 0.520 0.520 0.533 0.486 0.490 0.494[ 8] 0.511 0.511 0.526 0.498 0.508 0.498 0.304[ 9] 0.503 0.503 0.511 0.485 0.485 0.480 0.290 0.334[10] 0.520 0.520 0.537 0.501 0.499 0.506 0.317 0.349 0.234[11] 0.509 0.508 0.509 0.493 0.497 0.499 0.353 0.350 0.367 0.361
[12] 0.474 0.474 0.505 0.480 0.477 0.481 0.504 0.493 0.496 0.501 0.498[13] 0.484 0.484 0.507 0.486 0.486 0.492 0.479 0.486 0.478 0.478 0.489 0.249[14] 0.488 0.488 0.508 0.486 0.484 0.488 0.482 0.486 0.478 0.480 0.487 0.256 0.024[15] 0.487 0.487 0.510 0.486 0.484 0.490 0.482 0.484 0.479 0.481 0.488 0.255 0.024 0.004[16] 0.482 0.482 0.505 0.485 0.483 0.487 0.480 0.484 0.479 0.481 0.493 0.249 0.026 0.018 0.020[17] 0.486 0.486 0.508 0.488 0.486 0.492 0.481 0.482 0.478 0.481 0.490 0.256 0.023 0.005 0.005 0.019[18] 0.485 0.485 0.501 0.487 0.482 0.490 0.481 0.478 0.479 0.474 0.483 0.247 0.042 0.041 0.043 0.042 0.042[19] 0.478 0.479 0.496 0.465 0.471 0.470 0.484 0.487 0.490 0.491 0.482 0.408 0.407 0.408 0.406 0.408 0.406 0.398[20] 0.441 0.441 0.474 0.448 0.448 0.447 0.467 0.468 0.461 0.468 0.471 0.415 0.406 0.406 0.407 0.406 0.407 0.417 0.369
The number of base differences per site from between sequences are shown. The analysis involved 20 nucleotide sequences. Codon positions included were 1st+2nd+3rd+Noncoding. All ambiguous positions were removed for each sequence pair. There were a total of 996 positions in the final dataset. Evolutionary analyses were conducted in MEGA5 [1].___ within type comparison, ___ between types/within species comparison,
___ between species/within genus comparison, ___ between genera comparison
Page 14 of 19
February 2018
Table 6. Estimates of Evolutionary Divergence between 2Chel Amino Acid Sequences[ 1] #MF327529 Ailurivirus A_aimelvirus 1 [gpai001][ 2] #MF327534 Ailurivirus A_aimelvirus 6 [gpai006][ 3] #MF327533 Ailurivirus A_aimelvirus 5 [gpai005][ 4] #MF327530 Ailurivirus A_aimelvirus 2 [gpai002][ 5] #MF327532 Ailurivirus A_aimelvirus 4 [gpai004][ 6] #MF327531 Ailurivirus A_aimelvirus 3 [gpai003][ 7] #FJ438902 HCoSV-A1 [0553][ 8] #FJ438907 HCoSV-B1 [2263][ 9] #FJ438908 HCoSV-D1 [5004][10] #FJ555055 HCoSV-E1 [Australia][11] #JN867758 HCoSC_F1 [PK5006][12] #JQ814851 Mischivirus A1 [bat/China/2010][13] #KP054273 Mischivirus B1_bat_picornavirus [BatPV/V1/13/Hun][14] #KP054274 Mischivirus B1_bat_picornavirus [BatPV/V8/13/Hun][15] #KP054275 Mischivirus B1_bat_picornavirus [BatPV/V11/13/Hun][16] #KP054276 Mischivirus B1_bat_picornavirus [BatPV/V12/13/Hun][17] #KP054277 Mischivirus B1_Bat_picornavirus [BatPV/V13/13/Hun][18] #KP054278 Mischivirus B2_Bat_picornavirus [BatPV/V14/13/Hun][19] #KP100644 Mischivirus C1 African bat icavirus [PREDICT-06105][20] #KY512802 unassigned canine picornavirus [A128thr]
[ 1 2 3 4 5 6 7 8 9 10 11 12 13 14 15 16 17 18 19 20 ][ 1][ 2] 0.000[ 3] 0.092 0.092[ 4] 0.058 0.058 0.110[ 5] 0.058 0.058 0.110 0.009[ 6] 0.055 0.055 0.107 0.006 0.003
[ 7] 0.580 0.580 0.599 0.564 0.564 0.564[ 8] 0.571 0.571 0.599 0.586 0.586 0.586 0.230[ 9] 0.577 0.577 0.602 0.571 0.571 0.571 0.267 0.329[10] 0.586 0.586 0.614 0.577 0.577 0.577 0.245 0.304 0.118[11] 0.592 0.592 0.614 0.589 0.589 0.589 0.273 0.280 0.348 0.320
[12] 0.557 0.557 0.585 0.545 0.545 0.545 0.575 0.540 0.568 0.568 0.559[13] 0.585 0.585 0.604 0.570 0.570 0.570 0.565 0.537 0.578 0.562 0.547 0.195[14] 0.585 0.585 0.604 0.570 0.570 0.570 0.565 0.537 0.578 0.562 0.547 0.195 0.000[15] 0.585 0.585 0.604 0.570 0.570 0.570 0.565 0.537 0.578 0.562 0.547 0.195 0.000 0.000[16] 0.585 0.585 0.604 0.570 0.570 0.570 0.565 0.537 0.578 0.562 0.547 0.195 0.000 0.000 0.000[17] 0.585 0.585 0.604 0.570 0.570 0.570 0.565 0.537 0.578 0.562 0.547 0.195 0.000 0.000 0.000 0.000[18] 0.588 0.588 0.607 0.573 0.573 0.573 0.568 0.540 0.578 0.562 0.547 0.201 0.012 0.012 0.012 0.012 0.012[19] 0.553 0.553 0.585 0.557 0.560 0.557 0.587 0.562 0.562 0.552 0.568 0.409 0.418 0.418 0.418 0.418 0.418 0.418[20] 0.558 0.558 0.596 0.555 0.555 0.555 0.545 0.533 0.533 0.526 0.561 0.423 0.429 0.429 0.429 0.429 0.429 0.435 0.442
The number of amino acid differences per site from between sequences are shown. The analysis involved 20 amino acid sequences. The coding data was translated assuming a Standard genetic code table. All ambiguous positions were removed for each sequence pair. There were a total of 332 positions in the final dataset. Evolutionary analyses were conducted in MEGA5 [1].___ within type comparison, ___ between types/within species comparison,
___ between species/within genus comparison, ___ between genera comparison
Page 15 of 19
February 2018
Table 7. Estimates of Evolutionary Divergence between 3Cpro Nucleotide Sequences[ 1] #MF327529 Ailurivirus A_aimelvirus 1 [gpai001][ 2] #MF327534 Ailurivirus A_aimelvirus 6 [gpai006][ 3] #MF327533 Ailurivirus A_aimelvirus 5 [gpai005][ 4] #MF327530 Ailurivirus A_aimelvirus 2 [gpai002][ 5] #MF327532 Ailurivirus A_aimelvirus 4 [gpai004][ 6] #MF327531 Ailurivirus A_aimelvirus 3 [gpai003][ 7] #FJ438902 HCoSV-A1 [0553][ 8] #FJ438907 HCoSV-B1 [2263][ 9] #FJ438908 HCoSV-D1 [5004][10] #FJ555055 HCoSV-E1 [Australia][11] #JN867758 HCoSC_F1 [PK5006][12] #JQ814851 Mischivirus A1 [bat/China/2010][13] #KP054273 Mischivirus B1_bat_picornavirus [BatPV/V1/13/Hun][14] #KP054274 Mischivirus B1_bat_picornavirus [BatPV/V8/13/Hun][15] #KP054275 Mischivirus B1_bat_picornavirus [BatPV/V11/13/Hun][16] #KP054276 Mischivirus B1_bat_picornavirus [BatPV/V12/13/Hun][17] #KP054277 Mischivirus B1_Bat_picornavirus [BatPV/V13/13/Hun][18] #KP054278 Mischivirus B2_Bat_picornavirus [BatPV/V14/13/Hun][19] #KP100644 Mischivirus C1 African bat icavirus [PREDICT-06105][20] #KY512802 unassigned canine picornavirus [A128thr]
[ 1 2 3 4 5 6 7 8 9 10 11 12 13 14 15 16 17 18 19 20 ][ 1][ 2] 0.005[ 3] 0.095 0.097[ 4] 0.145 0.148 0.148[ 5] 0.150 0.153 0.156 0.021[ 6] 0.156 0.159 0.161 0.018 0.032
[ 7] 0.580 0.579 0.580 0.566 0.561 0.564[ 8] 0.583 0.583 0.595 0.570 0.568 0.570 0.370[ 9] 0.567 0.566 0.566 0.556 0.556 0.554 0.386 0.391[10] 0.579 0.577 0.589 0.580 0.580 0.584 0.401 0.411 0.259[11] 0.572 0.572 0.559 0.567 0.574 0.574 0.411 0.434 0.424 0.415
[12] 0.501 0.501 0.499 0.507 0.502 0.506 0.626 0.630 0.611 0.603 0.614[13] 0.459 0.456 0.473 0.473 0.472 0.477 0.599 0.612 0.604 0.609 0.589 0.330[14] 0.456 0.452 0.459 0.470 0.469 0.472 0.599 0.612 0.589 0.601 0.588 0.333 0.045[15] 0.456 0.452 0.459 0.470 0.469 0.472 0.601 0.610 0.591 0.603 0.589 0.333 0.048 0.003[16] 0.462 0.459 0.462 0.475 0.473 0.477 0.599 0.605 0.599 0.609 0.588 0.330 0.045 0.012 0.012[17] 0.459 0.456 0.462 0.477 0.475 0.478 0.596 0.604 0.596 0.609 0.591 0.327 0.045 0.012 0.012 0.009[18] 0.467 0.464 0.470 0.473 0.472 0.475 0.603 0.613 0.599 0.609 0.588 0.333 0.049 0.020 0.020 0.017 0.020[19] 0.486 0.485 0.481 0.506 0.507 0.512 0.577 0.585 0.559 0.554 0.589 0.482 0.491 0.504 0.502 0.502 0.499 0.502[20] 0.477 0.478 0.480 0.464 0.473 0.467 0.577 0.596 0.554 0.562 0.590 0.454 0.449 0.438 0.439 0.441 0.441 0.446 0.481
The number of base differences per site from between sequences are shown. The analysis involved 20 nucleotide sequences. Codon positions included were 1st+2nd+3rd+Noncoding. All ambiguous positions were removed for each sequence pair. There were a total of 657 positions in the final dataset. Evolutionary analyses were conducted in MEGA5 [1].___ within type comparison, ___ between types/within species comparison,
___ between species/within genus comparison, ___ between genera comparison
Page 16 of 19

February 2018
Table 8. Estimates of Evolutionary Divergence between 3Cpro Amino Acid Sequences[ 1] #MF327529 Ailurivirus A_aimelvirus 1 [gpai001][ 2] #MF327534 Ailurivirus A_aimelvirus 6 [gpai006][ 3] #MF327533 Ailurivirus A_aimelvirus 5 [gpai005][ 4] #MF327530 Ailurivirus A_aimelvirus 2 [gpai002][ 5] #MF327532 Ailurivirus A_aimelvirus 4 [gpai004][ 6] #MF327531 Ailurivirus A_aimelvirus 3 [gpai003][ 7] #FJ438902 HCoSV-A1 [0553][ 8] #FJ438907 HCoSV-B1 [2263][ 9] #FJ438908 HCoSV-D1 [5004][10] #FJ555055 HCoSV-E1 [Australia][11] #JN867758 HCoSC_F1 [PK5006][12] #JQ814851 Mischivirus A1 [bat/China/2010][13] #KP054273 Mischivirus B1_bat_picornavirus [BatPV/V1/13/Hun][14] #KP054274 Mischivirus B1_bat_picornavirus [BatPV/V8/13/Hun][15] #KP054275 Mischivirus B1_bat_picornavirus [BatPV/V11/13/Hun][16] #KP054276 Mischivirus B1_bat_picornavirus [BatPV/V12/13/Hun][17] #KP054277 Mischivirus B1_Bat_picornavirus [BatPV/V13/13/Hun][18] #KP054278 Mischivirus B2_Bat_picornavirus [BatPV/V14/13/Hun][19] #KP100644 Mischivirus C1 African bat icavirus [PREDICT-06105][20] #KY512802 unassigned canine picornavirus [A128thr]
[ 1 2 3 4 5 6 7 8 9 10 11 12 13 14 15 16 17 18 19 20 ][ 1][ 2] 0.005[ 3] 0.034 0.039[ 4] 0.068 0.072 0.072[ 5] 0.072 0.077 0.077 0.005[ 6] 0.068 0.072 0.072 0.000 0.005
[ 7] 0.697 0.697 0.697 0.687 0.687 0.687[ 8] 0.695 0.695 0.680 0.675 0.675 0.675 0.356[ 9] 0.706 0.701 0.701 0.701 0.701 0.701 0.414 0.356[10] 0.697 0.692 0.687 0.697 0.697 0.697 0.424 0.411 0.222[11] 0.711 0.711 0.711 0.706 0.711 0.706 0.429 0.436 0.453 0.443
[12] 0.599 0.604 0.604 0.609 0.609 0.609 0.749 0.757 0.729 0.744 0.754[13] 0.556 0.551 0.560 0.541 0.546 0.541 0.739 0.767 0.719 0.739 0.749 0.295[14] 0.556 0.551 0.560 0.541 0.546 0.541 0.739 0.767 0.719 0.739 0.749 0.290 0.009[15] 0.556 0.551 0.560 0.541 0.546 0.541 0.739 0.767 0.719 0.739 0.749 0.290 0.009 0.000[16] 0.556 0.551 0.560 0.541 0.546 0.541 0.739 0.767 0.719 0.739 0.749 0.290 0.009 0.000 0.000[17] 0.556 0.551 0.560 0.541 0.546 0.541 0.739 0.767 0.719 0.739 0.749 0.290 0.009 0.000 0.000 0.000[18] 0.556 0.551 0.560 0.541 0.546 0.541 0.739 0.767 0.719 0.739 0.749 0.290 0.009 0.000 0.000 0.000 0.000[19] 0.585 0.589 0.575 0.585 0.585 0.585 0.721 0.715 0.697 0.706 0.736 0.569 0.612 0.612 0.612 0.612 0.612 0.612[20] 0.546 0.551 0.560 0.546 0.546 0.546 0.721 0.720 0.692 0.706 0.716 0.476 0.510 0.510 0.510 0.510 0.510 0.510 0.541
The number of amino acid differences per site from between sequences are shown. The analysis involved 20 amino acid sequences. The coding data was translated assuming a Standard genetic code table. All ambiguous positions were removed for each sequence pair. There were a total of 219 positions in the final dataset. Evolutionary analyses were conducted in MEGA5 [1].___ within type comparison, ___ between types/within species comparison,
___ between species/within genus comparison, ___ between genera comparison
Page 17 of 19
February 2018
Table 9. Estimates of Evolutionary Divergence between 3Dpol Nucleotide Sequences[ 1] #MF327529 Ailurivirus A_aimelvirus 1 [gpai001][ 2] #MF327534 Ailurivirus A_aimelvirus 6 [gpai006][ 3] #MF327533 Ailurivirus A_aimelvirus 5 [gpai005][ 4] #MF327530 Ailurivirus A_aimelvirus 2 [gpai002][ 5] #MF327532 Ailurivirus A_aimelvirus 4 [gpai004][ 6] #MF327531 Ailurivirus A_aimelvirus 3 [gpai003][ 7] #FJ438902 HCoSV-A1 [0553][ 8] #FJ438907 HCoSV-B1 [2263][ 9] #FJ438908 HCoSV-D1 [5004][10] #FJ555055 HCoSV-E1 [Australia][11] #JN867758 HCoSC_F1 [PK5006][12] #JQ814851 Mischivirus A1 [bat/China/2010][13] #KP054273 Mischivirus B1_bat_picornavirus [BatPV/V1/13/Hun][14] #KP054274 Mischivirus B1_bat_picornavirus [BatPV/V8/13/Hun][15] #KP054275 Mischivirus B1_bat_picornavirus [BatPV/V11/13/Hun][16] #KP054276 Mischivirus B1_bat_picornavirus [BatPV/V12/13/Hun][17] #KP054277 Mischivirus B1_Bat_picornavirus [BatPV/V13/13/Hun][18] #KP054278 Mischivirus B2_Bat_picornavirus [BatPV/V14/13/Hun][19] #KP100644 Mischivirus C1 African bat icavirus [PREDICT-06105][20] #KY512802 unassigned canine picornavirus [A128thr]
[ 1 2 3 4 5 6 7 8 9 10 11 12 13 14 15 16 17 18 19 20 ][ 1][ 2] 0.005[ 3] 0.038 0.041[ 4] 0.121 0.123 0.123[ 5] 0.134 0.134 0.138 0.043[ 6] 0.118 0.120 0.122 0.029 0.053
[ 7] 0.459 0.460 0.463 0.451 0.460 0.446[ 8] 0.482 0.485 0.482 0.484 0.491 0.481 0.352[ 9] 0.455 0.456 0.462 0.458 0.467 0.458 0.328 0.326[10] 0.475 0.474 0.473 0.473 0.480 0.473 0.327 0.337 0.261[11] 0.475 0.475 0.475 0.479 0.487 0.473 0.331 0.346 0.342 0.341
[12] 0.416 0.416 0.408 0.424 0.439 0.421 0.487 0.478 0.481 0.492 0.497[13] 0.410 0.409 0.412 0.413 0.429 0.409 0.482 0.484 0.471 0.501 0.473 0.256[14] 0.414 0.413 0.414 0.413 0.432 0.411 0.484 0.479 0.469 0.500 0.475 0.251 0.023[15] 0.410 0.408 0.413 0.410 0.429 0.408 0.487 0.486 0.468 0.502 0.477 0.254 0.033 0.024[16] 0.412 0.412 0.409 0.415 0.430 0.409 0.483 0.481 0.474 0.504 0.477 0.254 0.028 0.020 0.024[17] 0.416 0.414 0.414 0.413 0.430 0.413 0.487 0.484 0.471 0.500 0.476 0.254 0.028 0.014 0.024 0.021[18] 0.415 0.415 0.412 0.414 0.432 0.413 0.489 0.483 0.473 0.505 0.481 0.254 0.031 0.024 0.026 0.019 0.024[19] 0.398 0.397 0.398 0.397 0.407 0.393 0.488 0.505 0.508 0.510 0.507 0.422 0.403 0.400 0.401 0.397 0.403 0.401[20] 0.425 0.425 0.431 0.423 0.434 0.418 0.488 0.490 0.492 0.502 0.498 0.385 0.387 0.385 0.394 0.389 0.385 0.390 0.413
The number of base differences per site from between sequences are shown. The analysis involved 20 nucleotide sequences. Codon positions included were 1st+2nd+3rd+Noncoding. All ambiguous positions were removed for each sequence pair. There were a total of 1428 positions in the final dataset. Evolutionary analyses were conducted in MEGA5 [1].___ within type comparison, ___ between types/within species comparison,
___ between species/within genus comparison, ___ between genera comparison
Page 18 of 19
February 2018
Table 10. Estimates of Evolutionary Divergence between 3Dpol Amino Acid Sequences[ 1] #MF327529 Ailurivirus A_aimelvirus 1 [gpai001][ 2] #MF327534 Ailurivirus A_aimelvirus 6 [gpai006][ 3] #MF327533 Ailurivirus A_aimelvirus 5 [gpai005][ 4] #MF327530 Ailurivirus A_aimelvirus 2 [gpai002][ 5] #MF327532 Ailurivirus A_aimelvirus 4 [gpai004][ 6] #MF327531 Ailurivirus A_aimelvirus 3 [gpai003][ 7] #FJ438902 HCoSV-A1 [0553][ 8] #FJ438907 HCoSV-B1 [2263][ 9] #FJ438908 HCoSV-D1 [5004][10] #FJ555055 HCoSV-E1 [Australia][11] #JN867758 HCoSC_F1 [PK5006][12] #JQ814851 Mischivirus A1 [bat/China/2010][13] #KP054273 Mischivirus B1_bat_picornavirus [BatPV/V1/13/Hun][14] #KP054274 Mischivirus B1_bat_picornavirus [BatPV/V8/13/Hun][15] #KP054275 Mischivirus B1_bat_picornavirus [BatPV/V11/13/Hun][16] #KP054276 Mischivirus B1_bat_picornavirus [BatPV/V12/13/Hun][17] #KP054277 Mischivirus B1_Bat_picornavirus [BatPV/V13/13/Hun][18] #KP054278 Mischivirus B2_Bat_picornavirus [BatPV/V14/13/Hun][19] #KP100644 Mischivirus C1 African bat icavirus [PREDICT-06105][20] #KY512802 unassigned canine picornavirus [A128thr]
[ 1 2 3 4 5 6 7 8 9 10 11 12 13 14 15 16 17 18 19 20 ][ 1][ 2] 0.004[ 3] 0.019 0.024[ 4] 0.051 0.056 0.066[ 5] 0.077 0.082 0.086 0.047[ 6] 0.056 0.060 0.071 0.017 0.052
[ 7] 0.499 0.499 0.510 0.501 0.520 0.501[ 8] 0.545 0.545 0.554 0.545 0.561 0.547 0.280[ 9] 0.530 0.530 0.538 0.534 0.555 0.532 0.302 0.295[10] 0.549 0.549 0.560 0.558 0.577 0.556 0.308 0.299 0.223[11] 0.520 0.520 0.528 0.517 0.534 0.513 0.286 0.330 0.321 0.338
[12] 0.430 0.430 0.434 0.426 0.453 0.430 0.531 0.544 0.539 0.559 0.538[13] 0.445 0.445 0.452 0.447 0.474 0.445 0.533 0.559 0.546 0.561 0.540 0.163[14] 0.443 0.443 0.449 0.445 0.472 0.443 0.533 0.559 0.546 0.561 0.540 0.161 0.004[15] 0.439 0.439 0.445 0.441 0.468 0.439 0.535 0.559 0.546 0.563 0.542 0.161 0.009 0.004[16] 0.443 0.443 0.449 0.445 0.472 0.443 0.533 0.559 0.546 0.561 0.540 0.161 0.004 0.002 0.006[17] 0.443 0.443 0.449 0.445 0.472 0.443 0.533 0.559 0.546 0.561 0.540 0.161 0.004 0.000 0.004 0.002[18] 0.443 0.443 0.449 0.445 0.472 0.443 0.533 0.559 0.546 0.561 0.540 0.161 0.004 0.000 0.004 0.002 0.000[19] 0.429 0.429 0.431 0.435 0.454 0.433 0.563 0.581 0.568 0.590 0.575 0.395 0.384 0.382 0.382 0.382 0.382 0.382[20] 0.445 0.445 0.452 0.439 0.461 0.443 0.537 0.570 0.555 0.572 0.542 0.347 0.360 0.358 0.358 0.358 0.358 0.358 0.399
The number of amino acid differences per site from between sequences are shown. The analysis involved 20 amino acid sequences. The coding data was translated assuming a Standard genetic code table. All ambiguous positions were removed for each sequence pair. There were a total of 473 positions in the final dataset. Evolutionary analyses were conducted in MEGA5 [1].___ within type comparison, ___ between types/within species comparison,
___ between species/within genus comparison, ___ between genera comparison
Page 19 of 19