Embed Size (px)
Citation preview
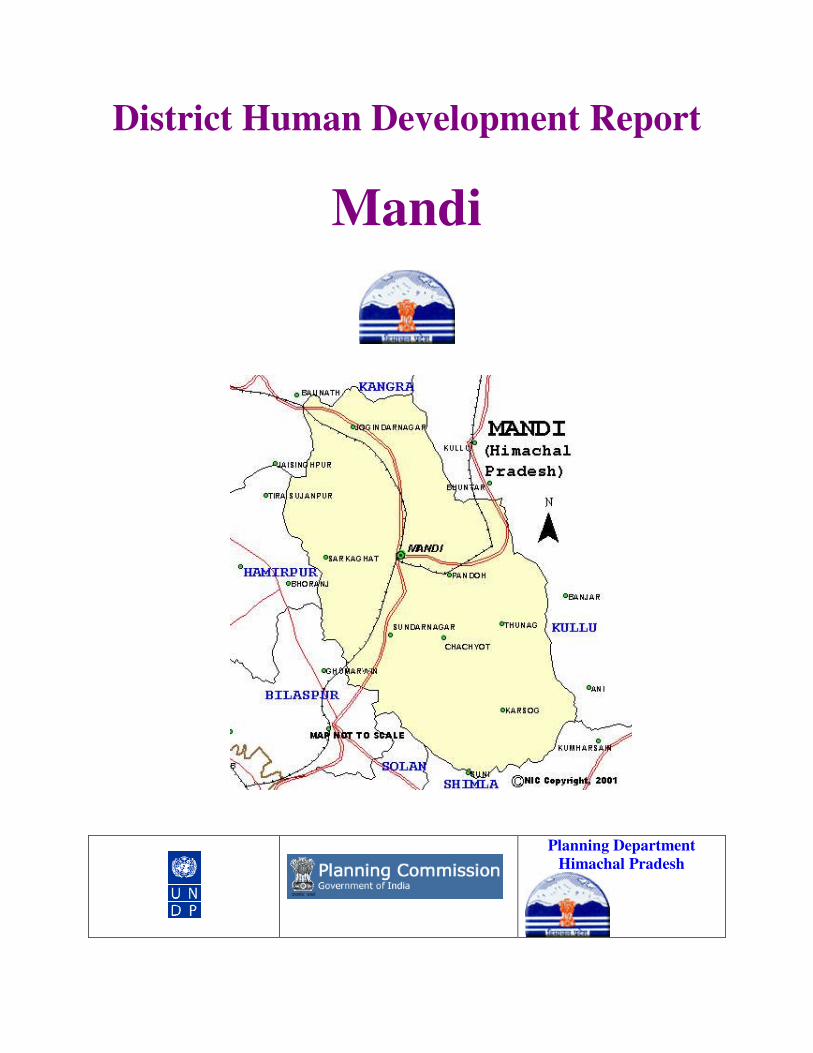
District Human Development Report
Mandi
Planning Department
Himachal Pradesh
Foreword
The first Human Development Report of Mandi district of Himachal Pradesh is
the second in the series of district level Human Development Reports brought out by the
Planning Department with the assistance from the Planning Commission and the United
Nations Development Programme under the project – ‘Strengthening State Plans for
Human Development’. The findings of the report will not only serve as the baseline
information but also as a guide in mapping the development strategy for Mandi district
with an objective to achieve the goal of ‘inclusive growth’. The document will prove to be
an important tool for planners and social scientists engaged in planning and policy
analysis at the grass root level.
I express my gratitude to the Planning Commission, Government of India and the
United Nations Development Programme for providing all important support to the State
Government in furthering the cause of human development in the State. I also
appreciate the efforts made by the Planning Department and the Department of Social
Sciences, Dr. Y.S. Parmar University of Agriculture and Forestry, Solan in finalizing the
report.
Ajay Tyagi Principal Secretary (Planning)
To the Government of Himachal Pradesh
Preface
Last three decades of development have witnessed an increasing emphasis on
the human development both at national and international levels. The development
debate assumed the human development as the central point in the development
strategies forwarded by contributions made by Mahbub ul-Haq and Amratya Sen, both
from the South Asian region. Late Mahbub ul-Haq advocated that development is about
‘human well being’ and not just about incomes and went a step further cautioning
against the ‘jobless, rootless and ruthless’ income oriented growth.
Himachal Pradesh has prepared with the first ever Human Development Report
in the year 2003 with the assistance from the Planning Commission and the United
Nations development Programme. As a follow up to the recommendations made in
various Human Development Reports brought out at the national and sub national
levels, the Planning Commission, government of India and the United Nations
Development Programme decided to support the efforts of the partner States to prepare
the Human Development Reports for the selected districts across the country on pilot
basis. Mandi district was one of the three districts of Himachal Pradesh selected for the
purpose. The Department of Social Sciences, Dr. Y.S. Parmar University of Horticulture
and Forestry, Solan was assigned the task to prepare the first Human Development
report of Mandi district. A mechanism was evolved for preparing the report with
involvement of local administration and elected representatives through periodic
interaction at the local level and at the State level. The Planning Department provided
technical and other inputs to coordinate the efforts made by the agencies involved in
bringing out the document.
The report analyzes the information pertaining to demographic and other socio-
economic indicators for each of the development blocks of Mandi district based on the
analysis. The study could not work out Human Development Indices at the block level
due to non-availability of consistent and reliable data. The inter Development Block
comparisons based on available data on various socio-economic indicators has been
attempted in the report. Qualitative analysis has also been made in the areas where it is
not possible to quantify the information pertaining to development indicators. The draft
report was presented and discussed in the District Level Planning, Development and
Twenty Point Programme Review Committee which has representation from the district
administration, elected representatives and the civil society. The report has been
finalized after incorporating the comments and suggestions that came up during
discussions with the public representatives from different sections of the society.
I put on record my appreciation for the hard work done by the officers and the
officials of the Planning Department in bringing out this report. This report will surely be
a guiding tool in determining the development strategy for Mandi district in future.
Dr. S. K. Shad Adviser (Planning)
Planning Department Himachal Pradesh
The Team
Dr. YS Parmar UniversitDr. YS Parmar UniversitDr. YS Parmar UniversitDr. YS Parmar University of Horticulture and Forestry, Solany of Horticulture and Forestry, Solany of Horticulture and Forestry, Solany of Horticulture and Forestry, Solan Principal Investigator
M. K. Vaidya
Co- Principal Investigators
L. R. Sharma Y. S. Negi
Planning Department, Himachal PradeshPlanning Department, Himachal PradeshPlanning Department, Himachal PradeshPlanning Department, Himachal Pradesh Basu Sood, Deputy Director T. S. Thakur, DPO, Kangra Sanjeev Sood, ARO
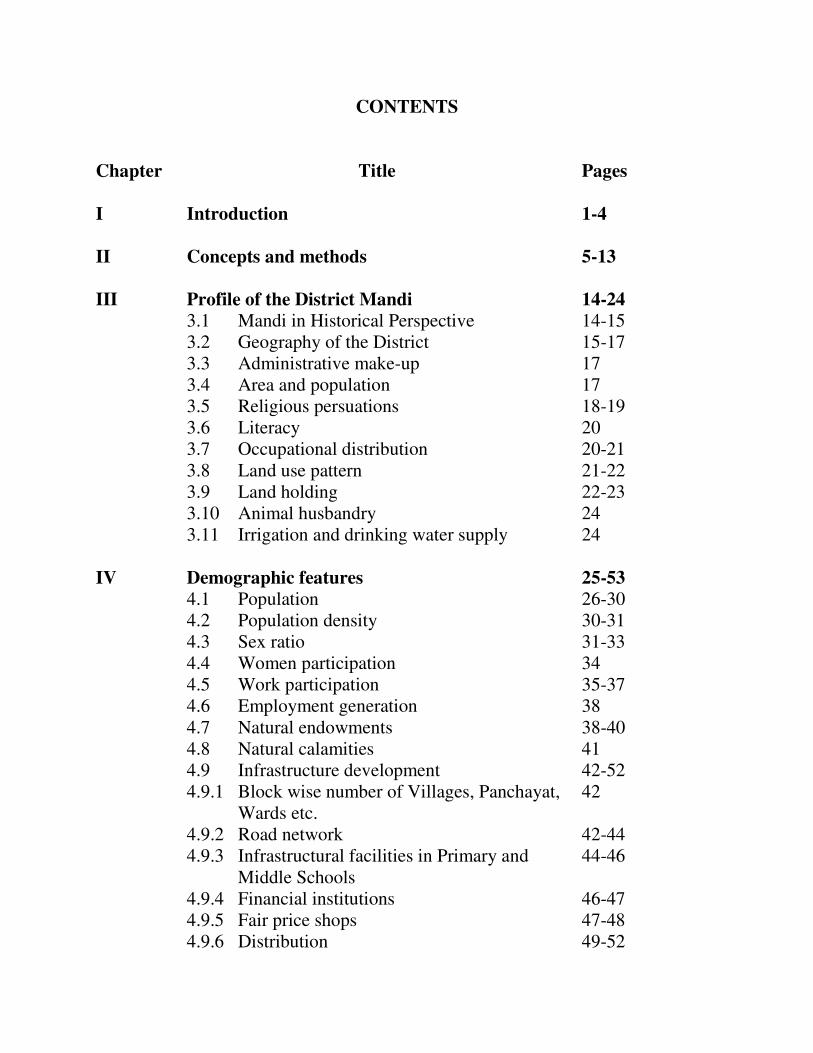
CONTENTS
Chapter Title Pages
I Introduction 1-4
II Concepts and methods 5-13
III Profile of the District Mandi 14-24
3.1 Mandi in Historical Perspective 14-15 3.2 Geography of the District 15-17 3.3 Administrative make-up 17 3.4 Area and population 17 3.5 Religious persuations 18-19 3.6 Literacy 20 3.7 Occupational distribution 20-21 3.8 Land use pattern 21-22 3.9 Land holding 22-23 3.10 Animal husbandry 24 3.11 Irrigation and drinking water supply 24
IV Demographic features 25-53
4.1 Population 26-30 4.2 Population density 30-31 4.3 Sex ratio 31-33 4.4 Women participation 34 4.5 Work participation 35-37 4.6 Employment generation 38 4.7 Natural endowments 38-40 4.8 Natural calamities 41 4.9 Infrastructure development 42-52 4.9.1 Block wise number of Villages, Panchayat,
Wards etc. 42
4.9.2 Road network 42-44 4.9.3 Infrastructural facilities in Primary and
Middle Schools 44-46
4.9.4 Financial institutions 46-47 4.9.5 Fair price shops 47-48 4.9.6 Distribution 49-52
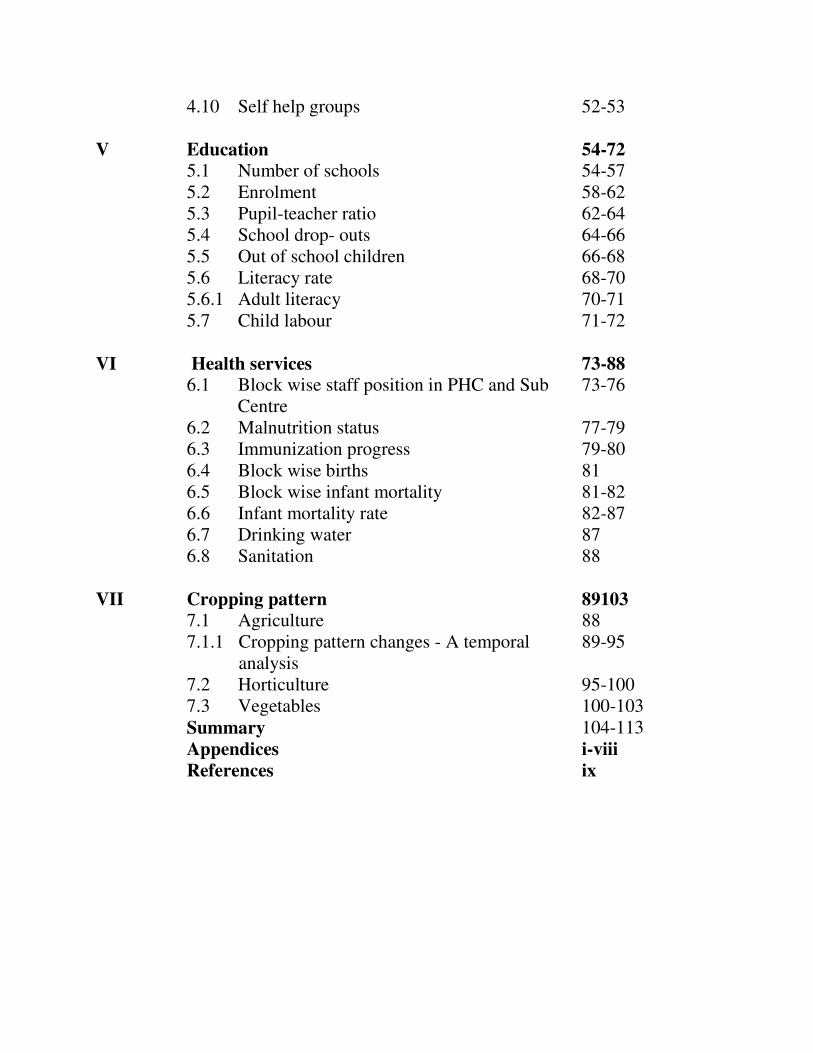
4.10 Self help groups 52-53
V Education 54-72
5.1 Number of schools 54-57 5.2 Enrolment 58-62 5.3 Pupil-teacher ratio 62-64 5.4 School drop- outs 64-66 5.5 Out of school children 66-68 5.6 Literacy rate 68-70 5.6.1 Adult literacy 70-71 5.7 Child labour 71-72
VI Health services 73-88
6.1 Block wise staff position in PHC and Sub Centre
73-76
6.2 Malnutrition status 77-79 6.3 Immunization progress 79-80 6.4 Block wise births 81 6.5 Block wise infant mortality 81-82 6.6 Infant mortality rate 82-87 6.7 Drinking water 87 6.8 Sanitation 88
VII Cropping pattern 89103
7.1 Agriculture 88 7.1.1 Cropping pattern changes - A temporal
analysis 89-95
7.2 Horticulture 95-100 7.3 Vegetables 100-103 Summary 104-113 Appendices i-viii
References ix
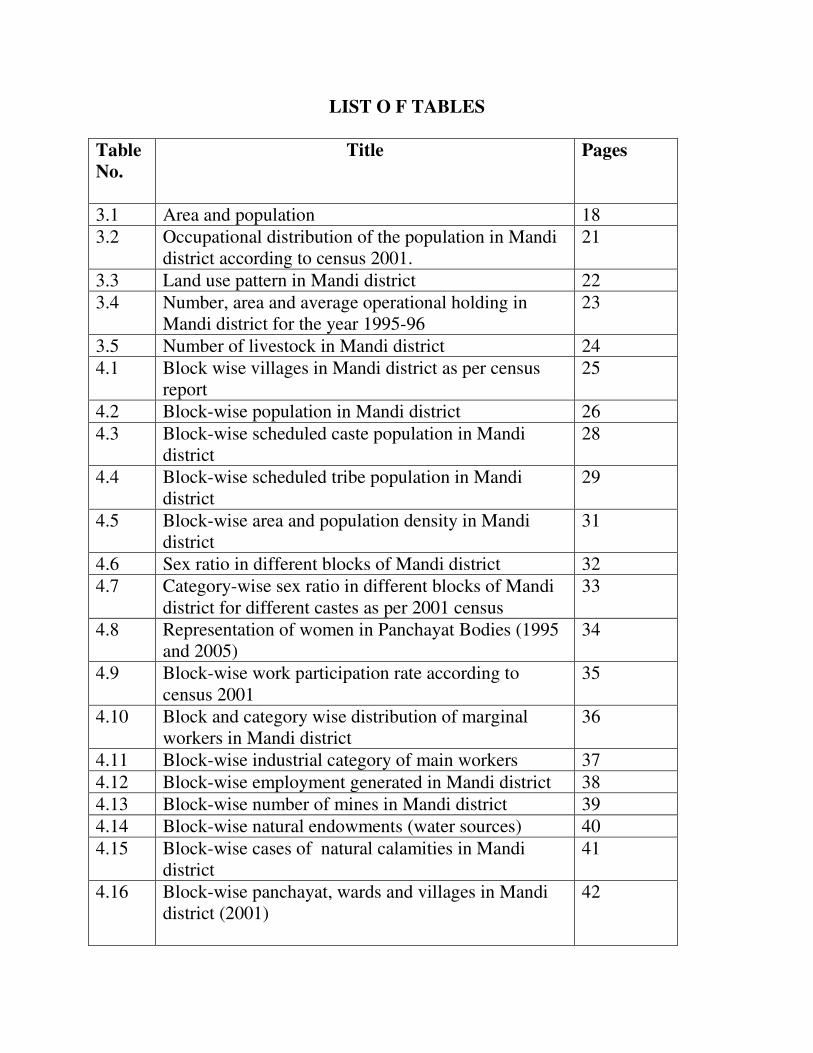
LIST O F TABLES
Table
No.
Title Pages
3.1 Area and population 18 3.2 Occupational distribution of the population in Mandi
district according to census 2001. 21
3.3 Land use pattern in Mandi district 22 3.4 Number, area and average operational holding in
Mandi district for the year 1995-96 23
3.5 Number of livestock in Mandi district 24 4.1 Block wise villages in Mandi district as per census
report 25
4.2 Block-wise population in Mandi district 26
4.3 Block-wise scheduled caste population in Mandi district
28
4.4 Block-wise scheduled tribe population in Mandi district
29
4.5 Block-wise area and population density in Mandi district
31
4.6 Sex ratio in different blocks of Mandi district 32 4.7 Category-wise sex ratio in different blocks of Mandi
district for different castes as per 2001 census 33
4.8 Representation of women in Panchayat Bodies (1995 and 2005)
34
4.9 Block-wise work participation rate according to census 2001
35
4.10 Block and category wise distribution of marginal workers in Mandi district
36
4.11 Block-wise industrial category of main workers 37
4.12 Block-wise employment generated in Mandi district 38 4.13 Block-wise number of mines in Mandi district 39 4.14 Block-wise natural endowments (water sources) 40
4.15 Block-wise cases of natural calamities in Mandi district
41
4.16 Block-wise panchayat, wards and villages in Mandi district (2001)
42
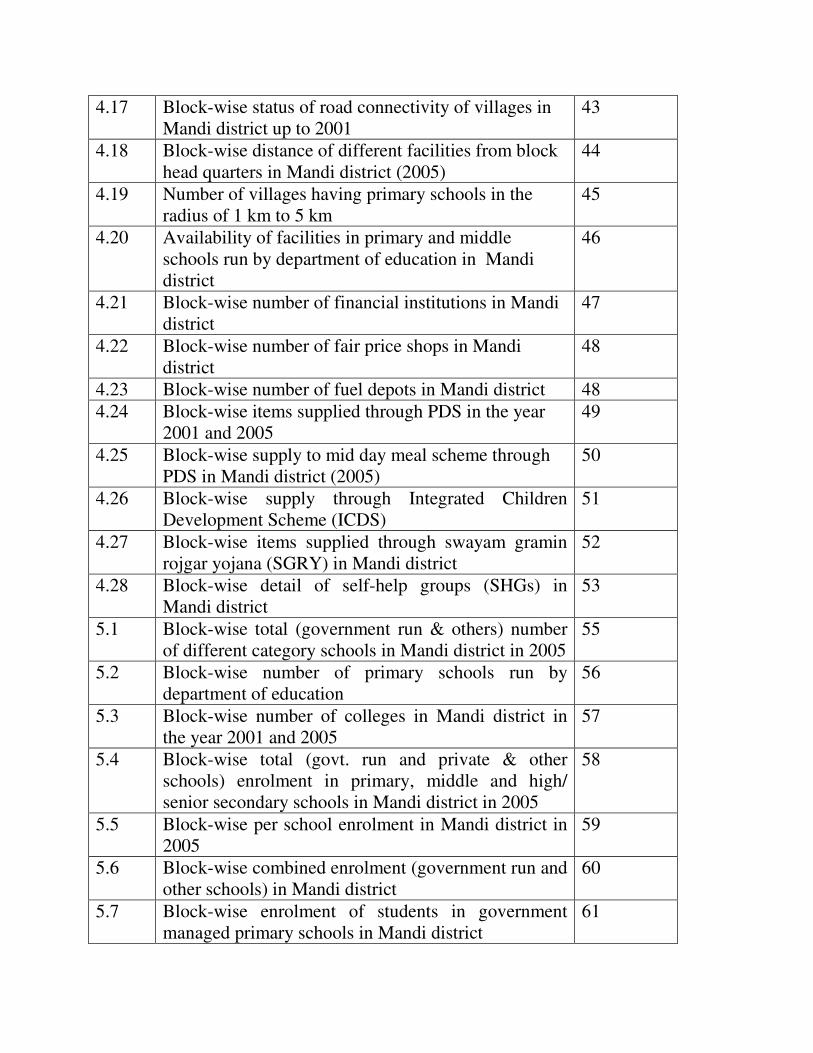
4.17 Block-wise status of road connectivity of villages in Mandi district up to 2001
43
4.18 Block-wise distance of different facilities from block head quarters in Mandi district (2005)
44
4.19 Number of villages having primary schools in the radius of 1 km to 5 km
45
4.20 Availability of facilities in primary and middle schools run by department of education in Mandi district
46
4.21 Block-wise number of financial institutions in Mandi district
47
4.22 Block-wise number of fair price shops in Mandi district
48
4.23 Block-wise number of fuel depots in Mandi district 48 4.24 Block-wise items supplied through PDS in the year
2001 and 2005 49
4.25 Block-wise supply to mid day meal scheme through PDS in Mandi district (2005)
50
4.26 Block-wise supply through Integrated Children Development Scheme (ICDS)
51
4.27 Block-wise items supplied through swayam gramin rojgar yojana (SGRY) in Mandi district
52
4.28 Block-wise detail of self-help groups (SHGs) in Mandi district
53
5.1 Block-wise total (government run & others) number of different category schools in Mandi district in 2005
55
5.2 Block-wise number of primary schools run by department of education
56
5.3 Block-wise number of colleges in Mandi district in the year 2001 and 2005
57
5.4 Block-wise total (govt. run and private & other schools) enrolment in primary, middle and high/ senior secondary schools in Mandi district in 2005
58
5.5 Block-wise per school enrolment in Mandi district in 2005
59
5.6 Block-wise combined enrolment (government run and other schools) in Mandi district
60
5.7 Block-wise enrolment of students in government managed primary schools in Mandi district
61
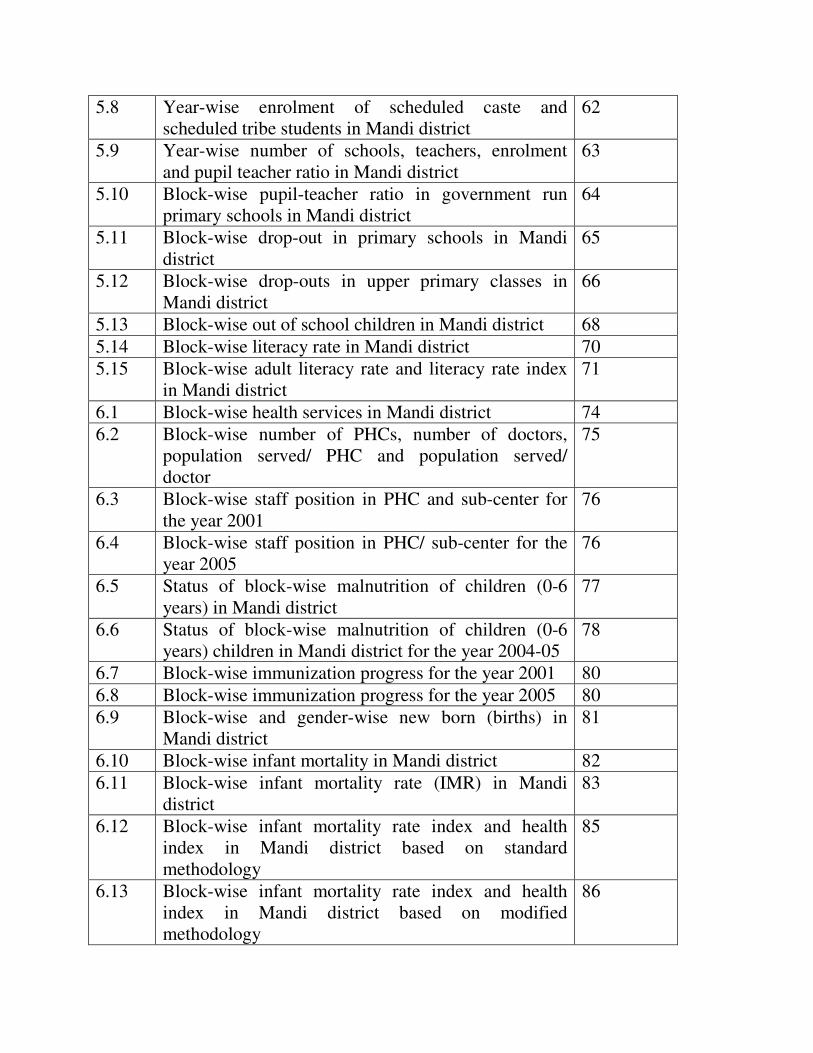
5.8 Year-wise enrolment of scheduled caste and scheduled tribe students in Mandi district
62
5.9 Year-wise number of schools, teachers, enrolment and pupil teacher ratio in Mandi district
63
5.10 Block-wise pupil-teacher ratio in government run primary schools in Mandi district
64
5.11 Block-wise drop-out in primary schools in Mandi district
65
5.12 Block-wise drop-outs in upper primary classes in Mandi district
66
5.13 Block-wise out of school children in Mandi district 68
5.14 Block-wise literacy rate in Mandi district 70 5.15 Block-wise adult literacy rate and literacy rate index
in Mandi district 71
6.1 Block-wise health services in Mandi district 74 6.2 Block-wise number of PHCs, number of doctors,
population served/ PHC and population served/ doctor
75
6.3 Block-wise staff position in PHC and sub-center for the year 2001
76
6.4 Block-wise staff position in PHC/ sub-center for the year 2005
76
6.5 Status of block-wise malnutrition of children (0-6 years) in Mandi district
77
6.6 Status of block-wise malnutrition of children (0-6 years) children in Mandi district for the year 2004-05
78
6.7 Block-wise immunization progress for the year 2001 80
6.8 Block-wise immunization progress for the year 2005 80 6.9 Block-wise and gender-wise new born (births) in
Mandi district 81
6.10 Block-wise infant mortality in Mandi district 82
6.11 Block-wise infant mortality rate (IMR) in Mandi district
83
6.12 Block-wise infant mortality rate index and health index in Mandi district based on standard methodology
85
6.13 Block-wise infant mortality rate index and health index in Mandi district based on modified methodology
86
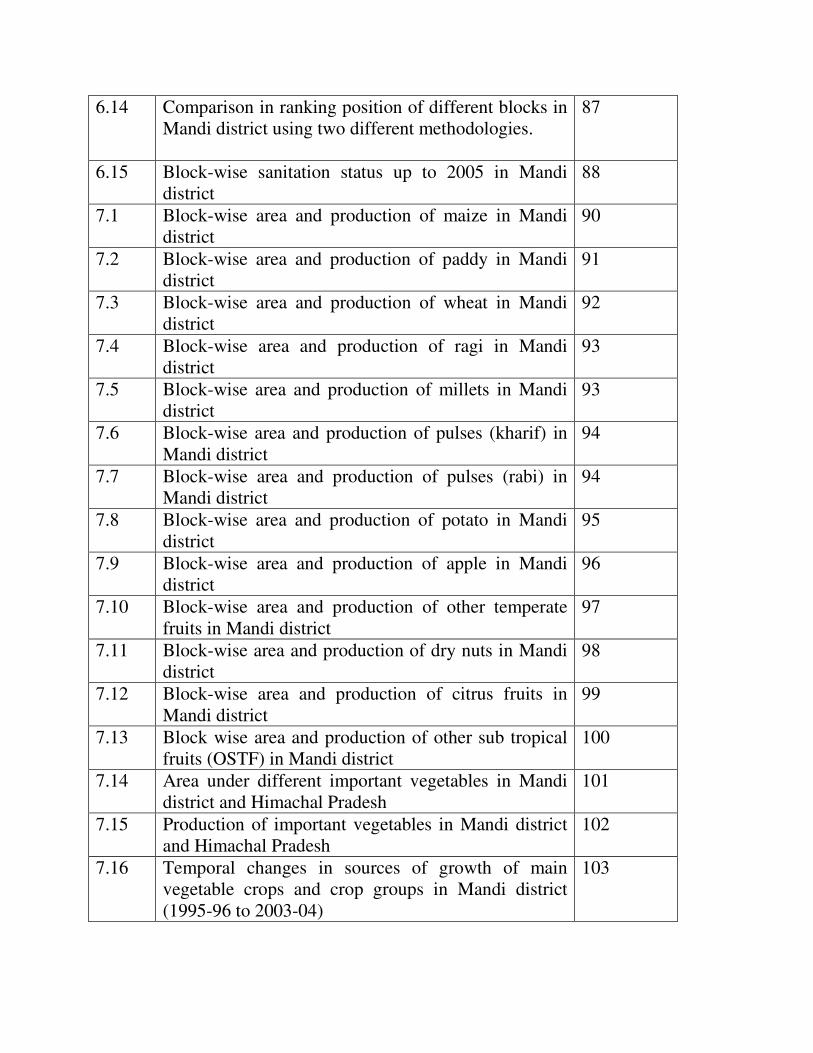
6.14 Comparison in ranking position of different blocks in Mandi district using two different methodologies.
87
6.15 Block-wise sanitation status up to 2005 in Mandi district
88
7.1 Block-wise area and production of maize in Mandi district
90
7.2 Block-wise area and production of paddy in Mandi district
91
7.3 Block-wise area and production of wheat in Mandi district
92
7.4 Block-wise area and production of ragi in Mandi district
93
7.5 Block-wise area and production of millets in Mandi district
93
7.6 Block-wise area and production of pulses (kharif) in Mandi district
94
7.7 Block-wise area and production of pulses (rabi) in Mandi district
94
7.8 Block-wise area and production of potato in Mandi district
95
7.9 Block-wise area and production of apple in Mandi district
96
7.10 Block-wise area and production of other temperate fruits in Mandi district
97
7.11 Block-wise area and production of dry nuts in Mandi district
98
7.12 Block-wise area and production of citrus fruits in Mandi district
99
7.13 Block wise area and production of other sub tropical fruits (OSTF) in Mandi district
100
7.14 Area under different important vegetables in Mandi district and Himachal Pradesh
101
7.15 Production of important vegetables in Mandi district and Himachal Pradesh
102
7.16 Temporal changes in sources of growth of main vegetable crops and crop groups in Mandi district (1995-96 to 2003-04)
103
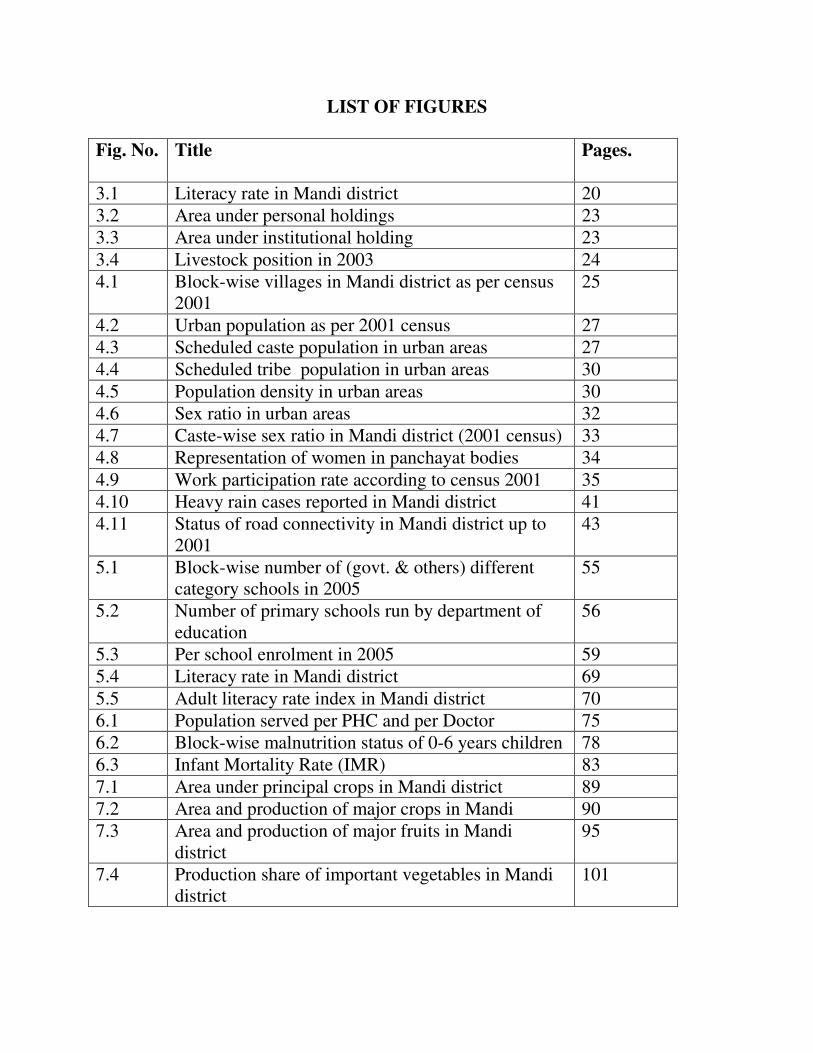
LIST OF FIGURES
Fig. No.
Title Pages.
3.1 Literacy rate in Mandi district 20 3.2 Area under personal holdings 23 3.3 Area under institutional holding 23
3.4 Livestock position in 2003 24 4.1 Block-wise villages in Mandi district as per census
2001 25
4.2 Urban population as per 2001 census 27 4.3 Scheduled caste population in urban areas 27 4.4 Scheduled tribe population in urban areas 30
4.5 Population density in urban areas 30 4.6 Sex ratio in urban areas 32 4.7 Caste-wise sex ratio in Mandi district (2001 census) 33 4.8 Representation of women in panchayat bodies 34
4.9 Work participation rate according to census 2001 35 4.10 Heavy rain cases reported in Mandi district 41 4.11 Status of road connectivity in Mandi district up to
2001 43
5.1 Block-wise number of (govt. & others) different category schools in 2005
55
5.2 Number of primary schools run by department of education
56
5.3 Per school enrolment in 2005 59 5.4 Literacy rate in Mandi district 69
5.5 Adult literacy rate index in Mandi district 70 6.1 Population served per PHC and per Doctor 75 6.2 Block-wise malnutrition status of 0-6 years children 78 6.3 Infant Mortality Rate (IMR) 83
7.1 Area under principal crops in Mandi district 89 7.2 Area and production of major crops in Mandi 90 7.3 Area and production of major fruits in Mandi
district 95
7.4 Production share of important vegetables in Mandi district
101
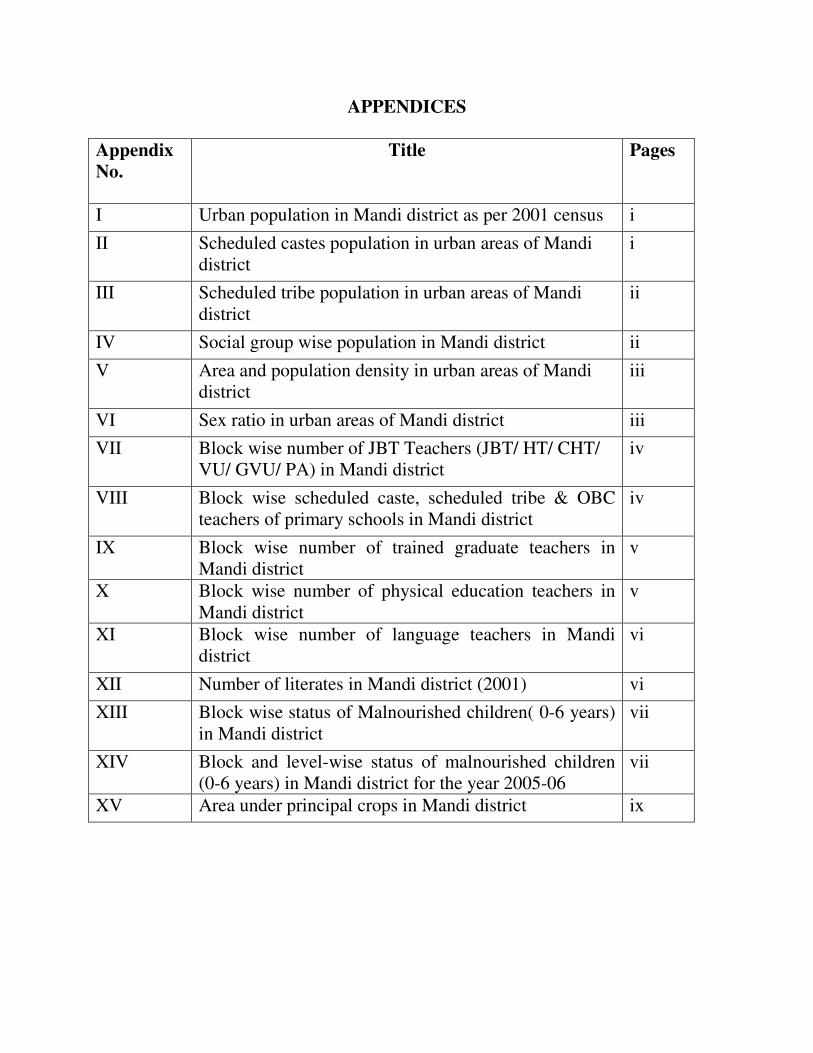
APPENDICES
Appendix
No.
Title Pages
I Urban population in Mandi district as per 2001 census i
II Scheduled castes population in urban areas of Mandi district
i
III Scheduled tribe population in urban areas of Mandi district
ii
IV Social group wise population in Mandi district ii
V Area and population density in urban areas of Mandi district
iii
VI Sex ratio in urban areas of Mandi district iii
VII Block wise number of JBT Teachers (JBT/ HT/ CHT/ VU/ GVU/ PA) in Mandi district
iv
VIII Block wise scheduled caste, scheduled tribe & OBC teachers of primary schools in Mandi district
iv
IX Block wise number of trained graduate teachers in Mandi district
v
X Block wise number of physical education teachers in Mandi district
v
XI Block wise number of language teachers in Mandi district
vi
XII Number of literates in Mandi district (2001) vi
XIII Block wise status of Malnourished children( 0-6 years) in Mandi district
vii
XIV Block and level-wise status of malnourished children (0-6 years) in Mandi district for the year 2005-06
vii
XV Area under principal crops in Mandi district ix
1
CHAPTER-I
Introduction
The issues of balanced regional growth and development have attracted
considerable attention both researchers and policy makers. Since independence, the central and
the state governments have been concerned about how to promote and strengthen economic
growth with regional equity. Balanced growth of all the regions of the country is essential for
political stability and economic viability of the nation. Naturally, the issue of regional balance
has thus been given the focus in the Plans and various programmes with the primary objectives
of allround development to be achieved through attainment of better standards of living, greater
equity, social justice and respect for human rights. Accordingly, huge investments have been
made in various sectors of the economy for the overall socio-economic development. It is in this
context that the evaluation of the developmental goals, particularly progress towards human
development become more important. Measuring social progress is inherently a difficult task
and the researchers and development planners have put forth numerous approaches and measures
of socio-economic development. Human development approach is considered universally
acceptable and logically efficient as it focuses on people and keeps them at the centre of all
aspects of the development process.
In the 70s and 80s, economists believed economic growth and its trickle down
effect would reduce poverty. However, poverty reduction is still a challenge despite years of
development, market oriented policy measures and high growth rates achieved in recent years in
many developing countries including India. In the 1990s, Professor Mahbub ul-Haq and
Amartya Sen, both from the South Asian region, greatly influenced the development debate.
Late Prof Mahbub ul-Haq emphasized that development is about “human well being” and not
just about incomes and rightly cautioned against growth which is “jobless, rootless and ruthless”.
The concept of human development has gradually evolved to encompass all areas
of societal development. It is inclusive of income and livelihoods, provision of social
2
infrastructure and services on an equal basis to all citizens, gender concerns, provision of equal
opportunity for political participation, respect for human rights and the concerns for
sustainability of environmental and natural resources. The concept distinguishes between two
sides of human development, one is the formation of human capabilities such as improved health
or knowledge and the other is the use that people make of their acquired capabilities for work.
The main values included in this concept and in human development policy are:-
i) Ensuring security of life and secure livelihoods for all
ii) Equity in opportunities and capabilities
iii) Equality between men and women
iv) Distribution, justice and sharing of national wealth by all regions/ ethnic groups
v) Democratic governance and participatory development
vi) Pursuit of sustainable development and conservation of nature
vii) Human rights protection
viii) Upholding human dignity and self respect
ix) Acceptance and accommodation of divergent cultures, ethnic minorities and
x) Peace and non-violence
The focus on human development analysis at more desegregated level becomes
all the more important in the states characterized by persistent economic disparities. Often the
income growth achieved as a consequence of dramatic advances in technology, trade and
investment is not converted into human development at the rate required to bring the
developmental goals within the reach. Thus, a large section of the society is left behind,
widening the human development gaps between the rich and the poor. This is true even for the
countries which are widely cited as examples of globalization success stories, where converting
rising prosperity into human development is still an issue. Difficulties are encountered in ending
the sufferings, debilitating diseases and deaths from preventable illness that blight the lives of a
large section of the people world over. For the human development analysis, a composite
indicator termed as the human development index (HDI) is used as a comprehensive measure of
social welfare. The HDI is a sort of barometer used for capturing the changes, over time
and space, in human well-being. This index focuses mainly on three indicators of longevity,
literacy and per capita income to arrive at the composite human development index. The
3
“human development” approach was articulated through UNDP’s Human Development Reports
(HDRs) under the leadership of Mahbub-Ul-Haq, and the first in an annual series of HDRs
appeared in 1990. These reports defined human development as a process of enlarging people’s
choices, using the language of human capabilities.
The HDI is now a favourite planning tool with the policy maker and its use is
being emphasized at the all levels of planning. Thus different state government have prepared
or are in the process of preparing State Human Development Reports (SHDRs); after taking up
this exercise at district levels. The district human development reports serve as the precursor of
SHDR. This recognizes that the district is the administrative level at which the success or failure
of development initiatives is often determined. The SHDRs generally make use of HDI index in
highlighting the human development issues covering human development indicators in inter and
intra-district evaluations of impacts of programmes and policies for possible resource allocation
to different social sectors. The human development studies are considered as an important “tools
for action” as they throw ample light on human development issues and influencing interactions.
They serve as platforms for public accountability and action. These reports bring and ensure the
human development agenda to the forefront of the state’s developmental priorities and its vision
for the future. They draw attention to development indicators at desegregated levels in areas
such as education, health attainments that are critical for capacity building of the community.
Thus such studies, help the Governments, NGOs, and donor agencies to streamline their
development priority. The recommendations emerging from these reports are meant to cover
public policy and resources in a focused manner on sustainable human development. Many of
the state governments have used SHDRs as a framework for making contextually relevant social
sector interventions.
In Himachal Pradesh the first ever Human Development Report was brought out
in the year 2003, with the signing of a tripartite MOU with the UNDP and the Planning
Commission, Govt. of India to implement the UNDP assisted project on “Strengthening of State
Plans for Human Development”. Later, a Human Development Research and Coordination Unit
(HDRCU) was established in the Planning Department of Govt. of Himachal Pradesh to ensure
smooth implementation of the project. The HDRCU was registered as a society and came to be
4
known as Himachal Pradesh Human Development Research and Coordination Society (HP
HDRCS). One of the activities envisaged under the project was to prepare District Human
Development Reports. In the first instance at least three districts viz; Kangra, Mandi and Shimla
have been taken on pilot basis. These districts have been identified keeping in view their large
size, different demographic factors, socio-economic diversity and diversity in climatic and
livelihood patterns.
The task of preparation of District Human Development Report for Mandi district
was assigned to the Department of Social Sciences, Dr YS Parmar University of Horticulture and
Forestry, Nauni, Solan (HP). In the present report emphasis was laid on block-wise comparison
of the attainment of welfare indicators expressed in terms of human development index in the
district. Apart from quantitative analysis, in terms of income health and education indices, an
attempt has also been made to analyze qualitatively the evolution of decentralized planning and
its effectiveness in each block; with special reference to the extent of people’s participation,
enabling environment and institutional set up.
5
CHAPTER-II
Concepts and Methods
The concepts and the definitions of the terms adopted for preparation of this
District Human development Report are as per the concepts and definitions used in the Census of
India 2001 report. This would facilitate the meaningful comparisons of the similar data
generated and used by various other agencies at different levels and in different areas or regions.
The data for the report were collected from different developmental departments of Mandi
District on defined indicators on pre-designed schedules through personal visits. The concepts
and definitions used are as given below:
Rural-Urban Areas An urban area is defined as follows:
a) All places with a municipality, corporation, cantonment board or notified town
area/ committee, etc.
b) A place satisfying the following three criteria simultaneously:
i) a minimum population of 5,000;
ii) at least 75 per cent of male working population engaged in non-agricultural
pursuits; and
iii) a density of population of at least 400 per sq. km. (1,000 per sq. mile).
Household
A 'household' is usually a group of persons who normally live together and take
their meals from a common kitchen unless the exigencies of work prevent any of them from
doing so. Persons in a household may be related or unrelated or a mix of both. However, if a
group of unrelated persons live in a census house but do not take their meals from the common
kitchen, then they are not constituent of a common household. Each such person was to be
6
treated as a separate household. The important link in finding out whether it was a household or
not was a common kitchen. There may be one member households, two member households or
multi-member households.
Institutional Household
A group of unrelated persons who live in an institution and take their meals from
a common kitchen is called an Institutional Household. Examples of Institutional Households are
boarding houses, messes, hostels, hotels, rescue homes, jails, ashrams, orphanages, etc. To make
the definition more clearly perceptible to the enumerators at the Census 2001, it was specifically
mentioned that this category of households would cover only those households where a group of
unrelated persons live in an institution and share a common kitchen.
Houseless Households
Households who do not live in buildings or census houses but live in the open on
roadside, pavements, in hume pipes, under fly-overs and staircases, or in the open in places of
worship, mandaps, railway platforms, etc. are treated as Houseless households.
Head of the Household
The head of household for census purposes is a person who is recognised as such
by the household. She or he is generally the person who bears the chief responsibility for
managing the affairs of the household and takes decision on behalf of the household. The head of
household need not necessarily be the oldest male member or an earning member, but may be a
female or a younger member of either sex. In case of an absentee de jure 'Head' who is not
eligible to be enumerated in the household, the person on whom the responsibility of managing
the affairs of household rests was to be regarded as the head irrespective whether the person is
male or female.
7
Scheduled Castes & Scheduled Tribes
Article 341 of the Constitution provides that the President may, with respect to
any State or Union territory, specify the castes, races or tribes or parts of or groups within castes,
races or tribes which shall for the purposes of the Constitution be deemed to be Scheduled Castes
in relation to that State or Union territory. Similarly, Article 342 provides for specification of
tribes or tribal communities or parts of or groups within tribes or tribal communities which are
deemed to be for the purposes of the Constitution the Scheduled Tribes in relation to that State or
Union territory. In pursuance of these provisions, the list of Scheduled Castes and / or Scheduled
Tribes are notified for each State and Union territory and are valid only within the jurisdiction of
that State or Union territory and not outside.
Literates
A person aged 7 years and above who can both read and write with understanding
in any language has been taken as literate. It is not necessary for a person to have received any
formal education or passed any minimum educational standard for being treated as literate.
People who were blind and could read in Braille are treated to be literates.
A person, who can only read but cannot write, is treated as illiterate. All children
of age 6 years or less, even if going to school and have picked up reading and writing, are treated
as illiterate.
Work
Work is defined as participation in any economically productive activity with or
without compensation, wages or profit. Such participation may be physical and/or mental in
nature. Work involves not only actual work but also includes effective supervision and direction
of work. It even includes part time help or unpaid work on farm, family enterprise or in any other
economic activity. All persons engaged in 'work' as defined above are workers. Persons who are
engaged in cultivation or milk production even solely for domestic consumption are also treated
as workers.
8
- Reference period for determining a person as worker and non-worker is one year preceding
the date of enumeration.
Main Workers
Those workers who had worked for the major part of the reference period (i.e. 6
months or more) are termed as Main Workers.
Marginal Workers
Those workers who had not worked for the major part of the reference period (i.e.
less than 6 months) are termed as Marginal Workers.
Cultivator
For purposes of the census a person is classified as cultivator if he or she is
engaged in cultivation of land owned or held from Government or held from private persons or
institutions for payment in money, kind or share. Cultivation includes effective supervision or
direction in cultivation.
A person who has given out her/his land to another person or persons or
institution(s) for cultivation for money, kind or share of crop and who does not even supervise or
direct cultivation in exchange of land, is not treated as cultivator. Similarly, a person working on
another person's land for wages in cash or kind or a combination of both (agricultural labourer)
are not treated as cultivator.
Agricultural Labourers
A person who works on another person's land for wages in money or kind or share
is regarded as an agricultural labourer. He/she has no risk in the cultivation, but merely works on
another person's land for wages. An agricultural labourer has no right of lease or contract on land
on which he/she works.
9
Household Industry Workers
Household Industry is defined as an industry run by one or more members of the
household at home or within the village in rural areas and only within the precincts of the house
where the household lives in urban areas. The larger proportion of workers in the household
industry consists of members of the household. The industry is not run on the scale of a
registered factory which would qualify or has to be registered under the Indian Factories Act.
The main criterion of a Household industry even in urban areas is the
participation of one or more members of a household. Even if the industry is not actually located
at home in rural areas there is a greater possibility of the members of the household participating
even if it is located anywhere within the village limits. In the urban areas where organized
industry takes greater prominence, the Household Industry is confined to the precincts of the
house where the participants live. In urban areas, even if the members of the household run an
industry by themselves but at a place away from the precincts of their home, it is not considered
as a Household Industry. It should be located within the precincts of the house where the
members live in the case of urban areas.
Household Industry relates to production, processing, servicing, repairing or
making and selling (but not merely selling) of goods. It does not include professions such as a
Pleader, Doctor, Musician, Dancer, Waterman, Astrologer, Dhobi, Barber, etc., or merely trade
or business, even if such professions, trade or services are run at home by members of the
household.
Other Workers
All workers, i.e., those who have been engaged in some economic activity during
the last one year, but are not cultivators or agricultural labourers or in Household Industry, are
'Other Workers'. The type of workers that come under this category of 'Other Worker' include all
government servants, municipal employees, teachers, factory workers, plantation workers, those
engaged in trade, commerce, business, transport, banking, mining, construction, political or
10
social work, priests, entertainment artists, etc. In effect, all those workers other than cultivators
or agricultural labourers or household industry workers are 'Other Workers'.
Sex Ratio
Sex ratio has been defined as the number of females per 1000 males in the population. It
is expressed as 'number of females per 1000 males'.
Number of females Sex-ratio = ----------------------------- x 1000 Number of males
Sex Ratio (0-6 years)
Sex-ratio (0-6 years) has been defined as the number of females in age-group 0-6 years
per 1000 males in the same age-group in the population. It is expressed as 'number of females
per 1000 males'.
Number of females (0-6) Sex-ratio (0-6 years) = ----------------------------------- x 1000 Number of males (0-6) Literacy Rate
Literacy rate of population is defined as the percentage of literates to the total population
aged 7 years and above.
Number of Literates Literacy rate = ------------------------------- x 100 Population aged 7+ Work Participation Rate
Work participation rate is defined as the percentage of total workers (main and marginal)
to total population.
11
Total Workers (Main+Marginal) Work participation rate = --------------------------------------------- x 100 Total Population
Human Development Index (HDI)
The methodology for calculating HDI as adopted by the UNDP covers three
indicators viz; (i) longevity index measured by the Life Expectancy at birth, (ii) educational
attainment index measured as the combination of adult literacy rate and combined enrolment
ratio (primary and secondary) and (iii) the standard of living index measured by the real GDP per
capita expressed in Purchasing Power Parity dollars (US) i.e. PPP$. The methodology for
obtaining indicators (ii) and (iii) has been identical with that used by the UNDP in various
Global and regional Human Development Reports. There is a deviation from the standard
methodology in calculating health index. Infant Mortality Rate in place of Life Expectancy at
Birth has been used to arrive at health index as data on life expectancy at birth by districts is not
available. Construction of life tables was also not possible as the Census data on district wise
population by single year of age has not been made available by the Registrar General of India.
Health/ Life Index
Infant Mortality Index has been computed by using actual, maximum and
minimum values of Infant Mortality Rate which then, has been connected into life index by
taking former’s distance from unity.
Steps for calculating Health/ Life index
: X1 - Xmin Infant Mortality Rate Index = ------------- Xmax - Xmin Where X1 = Infant Mortality rate Xmax = Maximum value Xmin = Minimum value
Health Index or life index = 1 – Infant Mortality Rate Index
Maximum and minimum values for Infant Mortality Rate have been taken as 166 (Damoh,
Madhya Pradesh) and 22 (Hyderabad, Andhra Pradesh) respectively.
12
Educational Attainment Index
Educational attainment index has been worked out by combining adult literacy
ratio and combined enrolment ratio for primary and secondary levels of education (Standards I to
X). Enrolment ratios for tertiary level of education could not be incorporated because of non
availability of the same. Enrolment ratios for primary and secondary enrolment ratios have been
worked out by the Planning Department, Himachal Pradesh based on the enrolment figures
provided by the Directorate of Primary and Secondary Education, Government of Himachal
Pradesh. Actual enrolments have been divided by the population in that particular age group to
arrive at enrolment ratios.
Steps for calculating educational attainment index:
X1 - Xmin i) Adult literacy Rate Index = ------------------ Xmax - Xmin
Where X1 = Adult literacy rate Xmin = Minimum Value Xmax = Maximum value X1 - Xmin ii) Combined enrolment ratio index = ------------------ Xmax - Xmin Where X1 = Combined enrolment ratio (I to X) Xmin = Minimum Value Xmax = Maximum value iii) Educational Attainment index = 2/3 x (Adult literacy rate index) + 1/3 x (Combined enrolment ratio index) Maximum and minimum values for both adult literacy rate and combined enrolment ratio
have been taken as 100 and 0 respectively.
13
Constraints:
� The combined Enrollment Rate Index can not be computed in the absence of population
data in that age group; hence the Educational Attainment Index can also not be computed.
� Data regarding the Economic parameters i.e. block-wise per capita income, GDP and
data related to Below Poverty Line families were not made available.
� In the absence of these data Income Index and ultimately Human Development Index for
the different blocks of Mandi district can not be worked out. Therefore, inter block
comparisons were made with the help of data available from various sources in the
current study.
� Non availability of time series data on most of the indicators.
14
CHAPTER-III
Profile of the District
3.1 Mandi in Historical Perspective
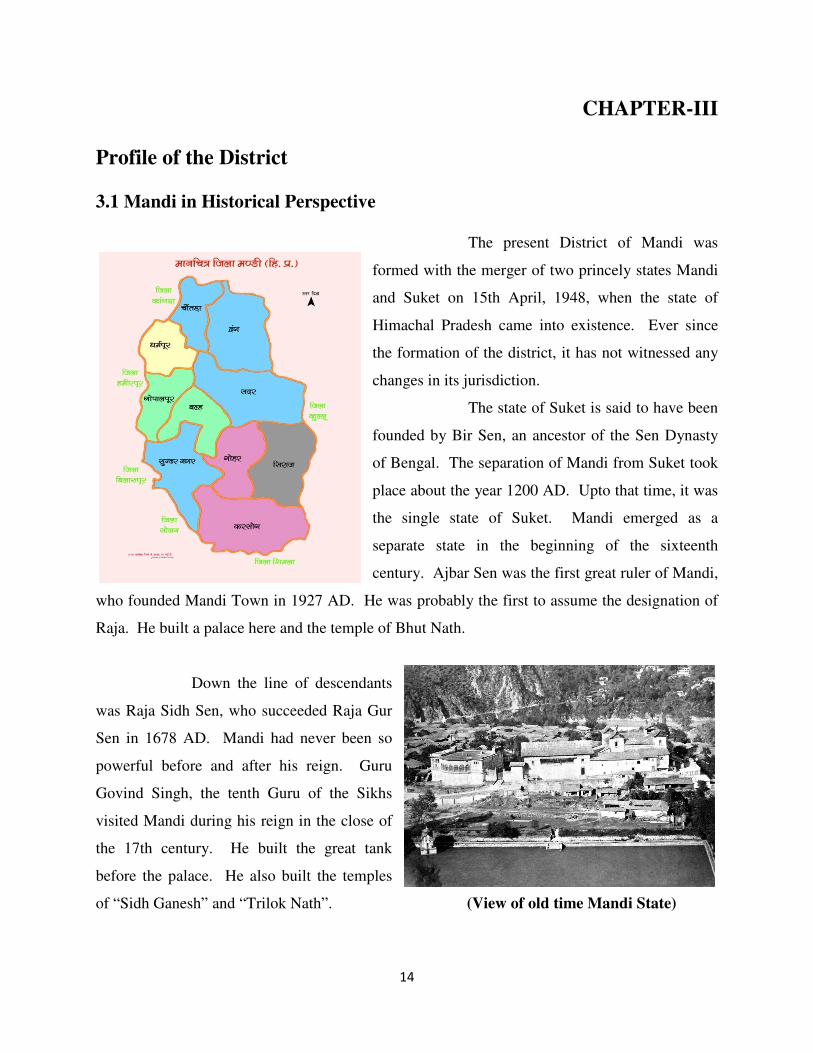
The present District of Mandi was
formed with the merger of two princely states Mandi
and Suket on 15th April, 1948, when the state of
Himachal Pradesh came into existence. Ever since
the formation of the district, it has not witnessed any
changes in its jurisdiction.
The state of Suket is said to have been
founded by Bir Sen, an ancestor of the Sen Dynasty
of Bengal. The separation of Mandi from Suket took
place about the year 1200 AD. Upto that time, it was
the single state of Suket. Mandi emerged as a
separate state in the beginning of the sixteenth
century. Ajbar Sen was the first great ruler of Mandi,
who founded Mandi Town in 1927 AD. He was probably the first to assume the designation of
Raja. He built a palace here and the temple of Bhut Nath.
Down the line of descendants
was Raja Sidh Sen, who succeeded Raja Gur
Sen in 1678 AD. Mandi had never been so
powerful before and after his reign. Guru
Govind Singh, the tenth Guru of the Sikhs
visited Mandi during his reign in the close of
the 17th century. He built the great tank
before the palace. He also built the temples
of “Sidh Ganesh” and “Trilok Nath”. (View of old time Mandi State)
15
The history of both the state of Mandi and Suket is full with wars among
themselves and other adjoining states. These two states had always been rivals and generally
enemies, but there was no great result of their warfare.
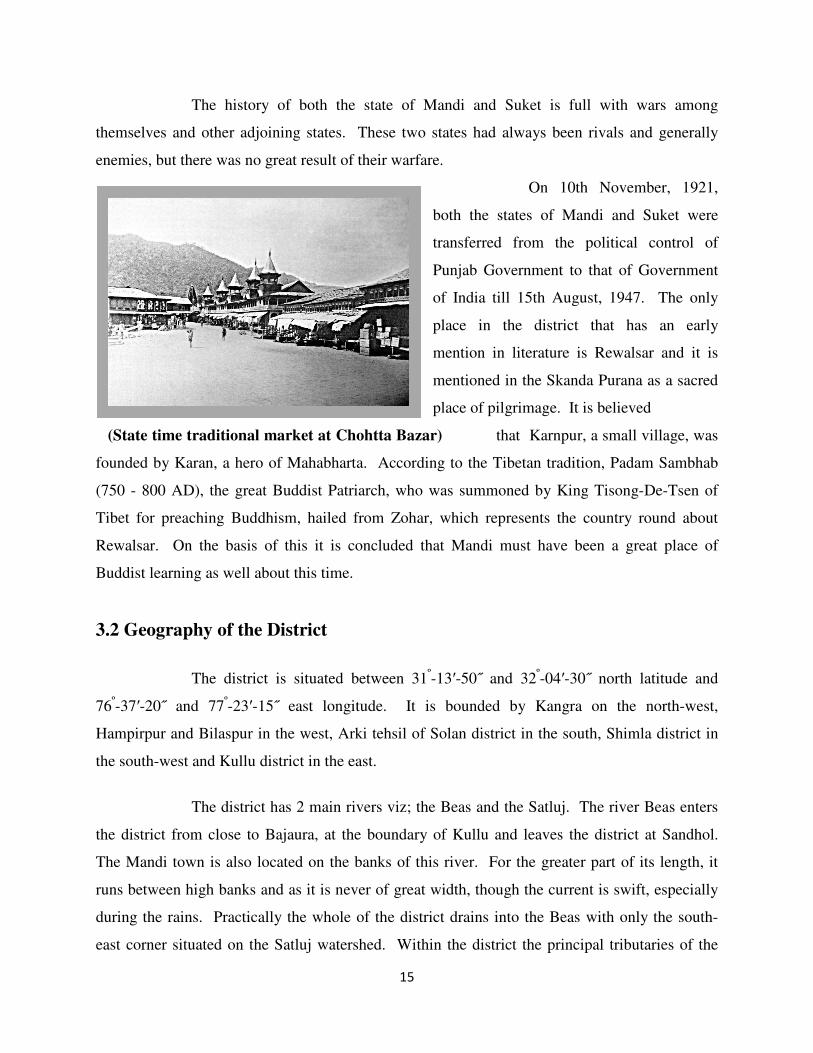
On 10th November, 1921,
both the states of Mandi and Suket were
transferred from the political control of
Punjab Government to that of Government
of India till 15th August, 1947. The only
place in the district that has an early
mention in literature is Rewalsar and it is
mentioned in the Skanda Purana as a sacred
place of pilgrimage. It is believed
(State time traditional market at Chohtta Bazar) that Karnpur, a small village, was
founded by Karan, a hero of Mahabharta. According to the Tibetan tradition, Padam Sambhab
(750 - 800 AD), the great Buddist Patriarch, who was summoned by King Tisong-De-Tsen of
Tibet for preaching Buddhism, hailed from Zohar, which represents the country round about
Rewalsar. On the basis of this it is concluded that Mandi must have been a great place of
Buddist learning as well about this time.
3.2 Geography of the District
The district is situated between 31º-13′-50˝ and 32º-04′-30˝ north latitude and
76º-37′-20˝ and 77º-23′-15˝ east longitude. It is bounded by Kangra on the north-west,
Hampirpur and Bilaspur in the west, Arki tehsil of Solan district in the south, Shimla district in
the south-west and Kullu district in the east.
The district has 2 main rivers viz; the Beas and the Satluj. The river Beas enters
the district from close to Bajaura, at the boundary of Kullu and leaves the district at Sandhol.
The Mandi town is also located on the banks of this river. For the greater part of its length, it
runs between high banks and as it is never of great width, though the current is swift, especially
during the rains. Practically the whole of the district drains into the Beas with only the south-
east corner situated on the Satluj watershed. Within the district the principal tributaries of the
16
Beas on the north bank are Uhl, Luni, Rana and Binu and on the south bank are the Hanse,
Tirthan, Bakhli, Jiuni, Suketi, Ranodi, Son and Bakar.
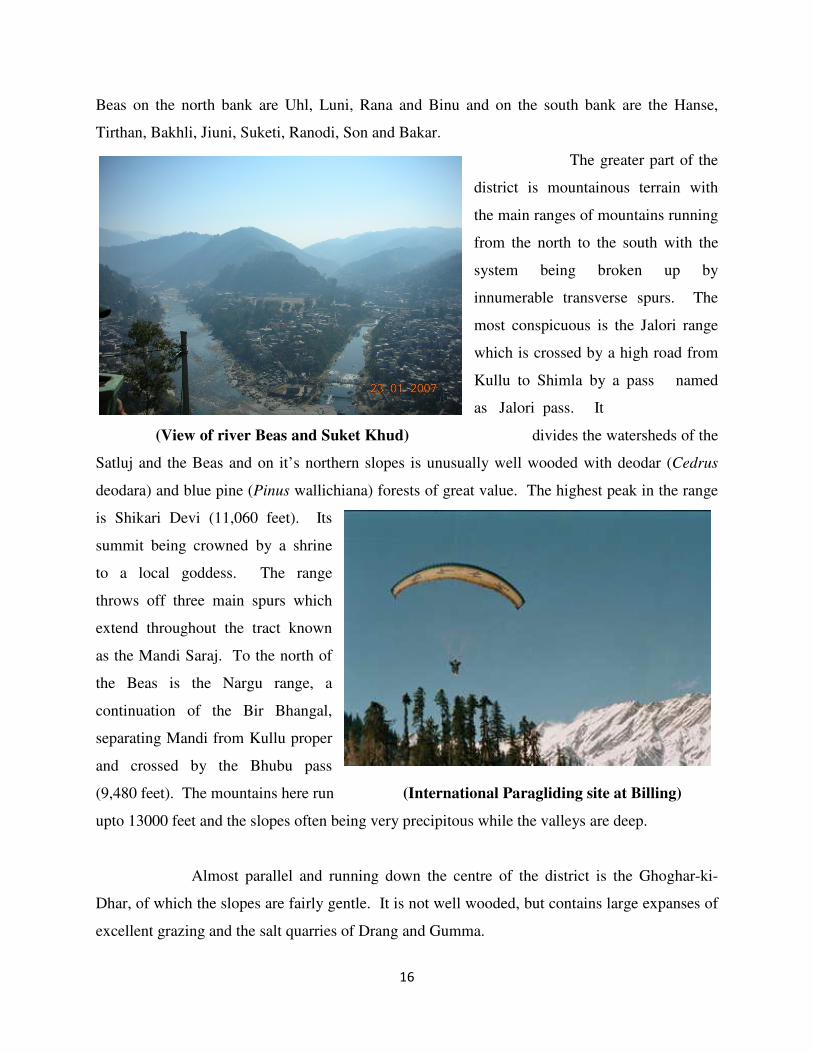
The greater part of the
district is mountainous terrain with
the main ranges of mountains running
from the north to the south with the
system being broken up by
innumerable transverse spurs. The
most conspicuous is the Jalori range
which is crossed by a high road from
Kullu to Shimla by a pass named
as Jalori pass. It
(View of river Beas and Suket Khud) divides the watersheds of the
Satluj and the Beas and on it’s northern slopes is unusually well wooded with deodar (Cedrus
deodara) and blue pine (Pinus wallichiana) forests of great value. The highest peak in the range
is Shikari Devi (11,060 feet). Its
summit being crowned by a shrine
to a local goddess. The range
throws off three main spurs which
extend throughout the tract known
as the Mandi Saraj. To the north of
the Beas is the Nargu range, a
continuation of the Bir Bhangal,
separating Mandi from Kullu proper
and crossed by the Bhubu pass
(9,480 feet). The mountains here run (International Paragliding site at Billing)
upto 13000 feet and the slopes often being very precipitous while the valleys are deep.
Almost parallel and running down the centre of the district is the Ghoghar-ki-
Dhar, of which the slopes are fairly gentle. It is not well wooded, but contains large expanses of
excellent grazing and the salt quarries of Drang and Gumma.
17
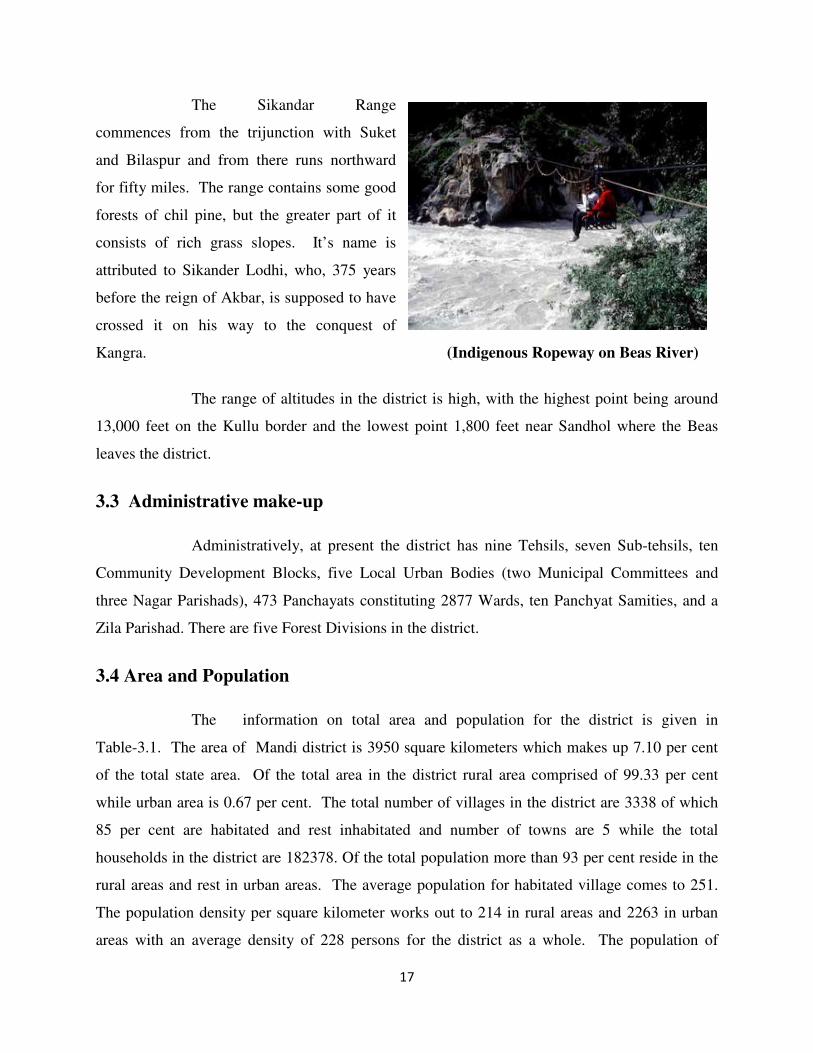
The Sikandar Range
commences from the trijunction with Suket
and Bilaspur and from there runs northward
for fifty miles. The range contains some good
forests of chil pine, but the greater part of it
consists of rich grass slopes. It’s name is
attributed to Sikander Lodhi, who, 375 years
before the reign of Akbar, is supposed to have
crossed it on his way to the conquest of
Kangra. (Indigenous Ropeway on Beas River)
The range of altitudes in the district is high, with the highest point being around
13,000 feet on the Kullu border and the lowest point 1,800 feet near Sandhol where the Beas
leaves the district.
3.3 Administrative make-up
Administratively, at present the district has nine Tehsils, seven Sub-tehsils, ten
Community Development Blocks, five Local Urban Bodies (two Municipal Committees and
three Nagar Parishads), 473 Panchayats constituting 2877 Wards, ten Panchyat Samities, and a
Zila Parishad. There are five Forest Divisions in the district.
3.4 Area and Population
The information on total area and population for the district is given in
Table-3.1. The area of Mandi district is 3950 square kilometers which makes up 7.10 per cent
of the total state area. Of the total area in the district rural area comprised of 99.33 per cent
while urban area is 0.67 per cent. The total number of villages in the district are 3338 of which
85 per cent are habitated and rest inhabitated and number of towns are 5 while the total
households in the district are 182378. Of the total population more than 93 per cent reside in the
rural areas and rest in urban areas. The average population for habitated village comes to 251.
The population density per square kilometer works out to 214 in rural areas and 2263 in urban
areas with an average density of 228 persons for the district as a whole. The population of
18
scheduled caste and scheduled tribe population to total population is 28.98 and 1.17 per cent
respectively, for the whole district. The number of females per thousand of males is estimated at
1013 for rural areas and 894 for urban areas, with a figure of 1012 for the district as a whole.
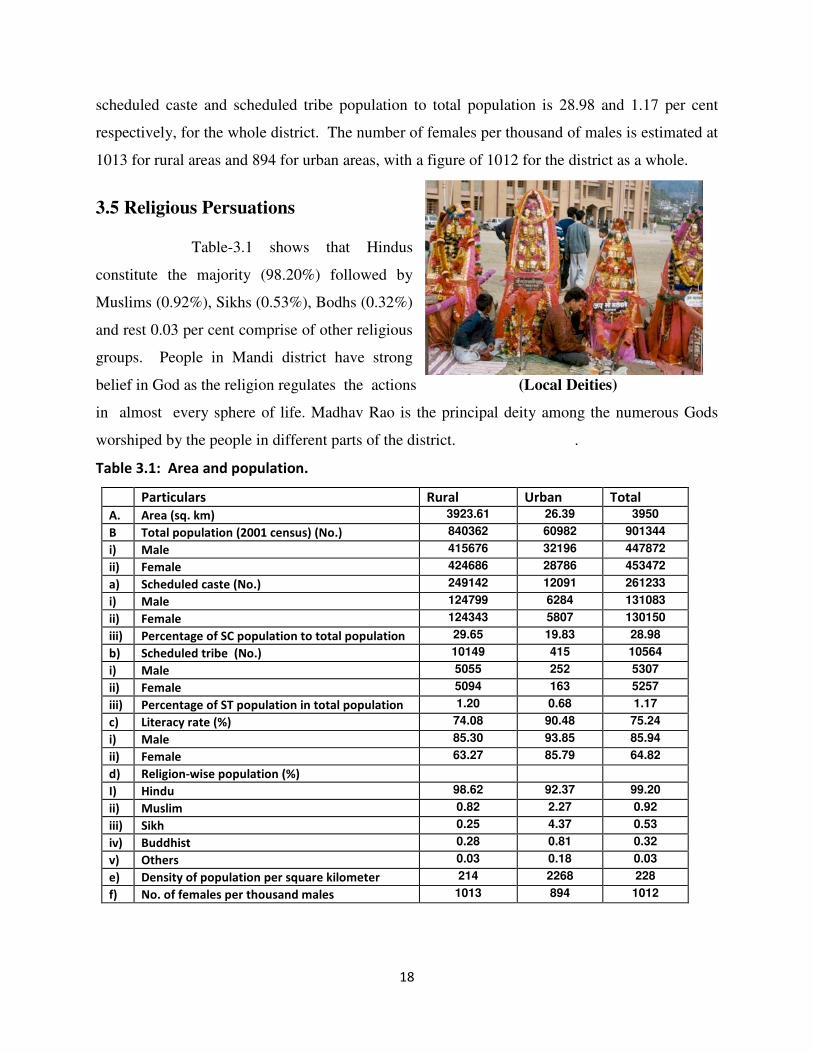
3.5 Religious Persuations
Table-3.1 shows that Hindus
constitute the majority (98.20%) followed by
Muslims (0.92%), Sikhs (0.53%), Bodhs (0.32%)
and rest 0.03 per cent comprise of other religious
groups. People in Mandi district have strong
belief in God as the religion regulates the actions (Local Deities)
in almost every sphere of life. Madhav Rao is the principal deity among the numerous Gods
worshiped by the people in different parts of the district. .
Table 3.1: Area and population.
Particulars Rural Urban Total
A. Area (sq. km) 3923.61 26.39 3950
B Total population (2001 census) (No.) 840362 60982 901344
i) Male 415676 32196 447872
ii) Female 424686 28786 453472
a) Scheduled caste (No.) 249142 12091 261233
i) Male 124799 6284 131083
ii) Female 124343 5807 130150
iii) Percentage of SC population to total population 29.65 19.83 28.98
b) Scheduled tribe (No.) 10149 415 10564
i) Male 5055 252 5307
ii) Female 5094 163 5257
iii) Percentage of ST population in total population 1.20 0.68 1.17
c) Literacy rate (%) 74.08 90.48 75.24
i) Male 85.30 93.85 85.94
ii) Female 63.27 85.79 64.82
d) Religion-wise population (%)
I) Hindu 98.62 92.37 99.20
ii) Muslim 0.82 2.27 0.92
iii) Sikh 0.25 4.37 0.53
iv) Buddhist 0.28 0.81 0.32
v) Others 0.03 0.18 0.03
e) Density of population per square kilometer 214 2268 228
f) No. of females per thousand males 1013 894 1012
19
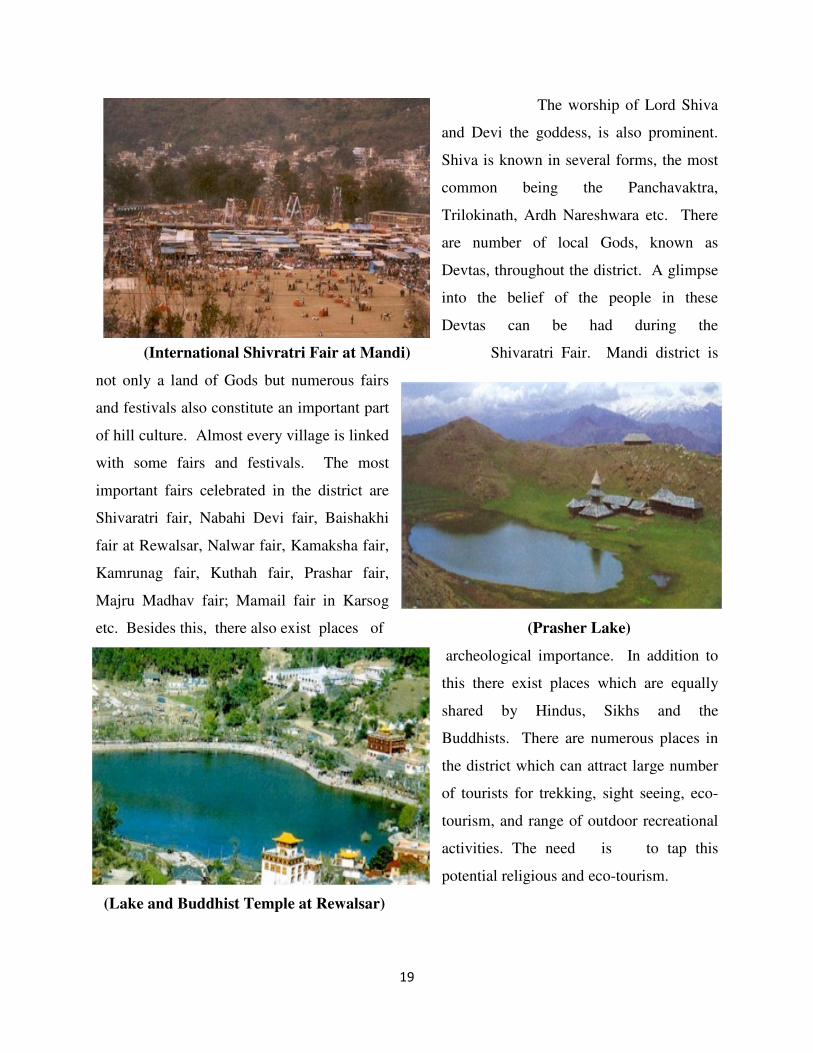
The worship of Lord Shiva
and Devi the goddess, is also prominent.
Shiva is known in several forms, the most
common being the Panchavaktra,
Trilokinath, Ardh Nareshwara etc. There
are number of local Gods, known as
Devtas, throughout the district. A glimpse
into the belief of the people in these
Devtas can be had during the
(International Shivratri Fair at Mandi) Shivaratri Fair. Mandi district is
not only a land of Gods but numerous fairs
and festivals also constitute an important part
of hill culture. Almost every village is linked
with some fairs and festivals. The most
important fairs celebrated in the district are
Shivaratri fair, Nabahi Devi fair, Baishakhi
fair at Rewalsar, Nalwar fair, Kamaksha fair,
Kamrunag fair, Kuthah fair, Prashar fair,
Majru Madhav fair; Mamail fair in Karsog
etc. Besides this, there also exist places of (Prasher Lake)
archeological importance. In addition to
this there exist places which are equally
shared by Hindus, Sikhs and the
Buddhists. There are numerous places in
the district which can attract large number
of tourists for trekking, sight seeing, eco-
tourism, and range of outdoor recreational
activities. The need is to tap this
potential religious and eco-tourism.
(Lake and Buddhist Temple at Rewalsar)
20
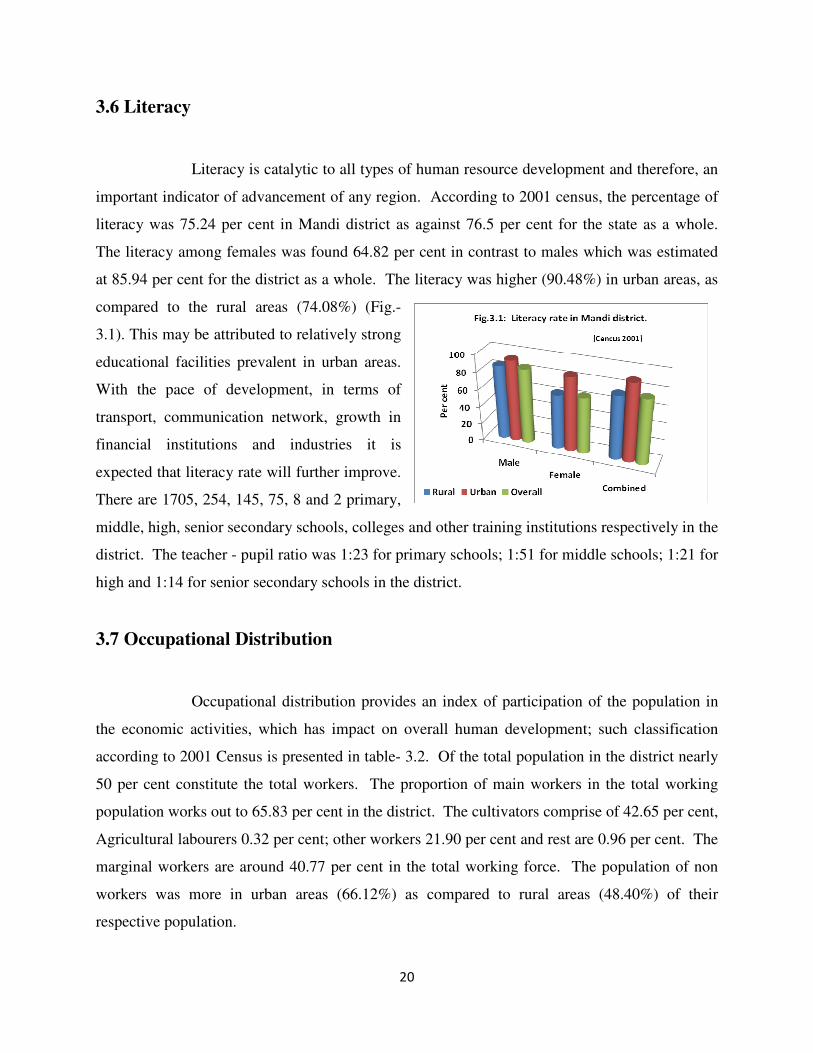
3.6 Literacy
Literacy is catalytic to all types of human resource development and therefore, an
important indicator of advancement of any region. According to 2001 census, the percentage of
literacy was 75.24 per cent in Mandi district as against 76.5 per cent for the state as a whole.
The literacy among females was found 64.82 per cent in contrast to males which was estimated
at 85.94 per cent for the district as a whole. The literacy was higher (90.48%) in urban areas, as
compared to the rural areas (74.08%) (Fig.-
3.1). This may be attributed to relatively strong
educational facilities prevalent in urban areas.
With the pace of development, in terms of
transport, communication network, growth in
financial institutions and industries it is
expected that literacy rate will further improve.
There are 1705, 254, 145, 75, 8 and 2 primary,
middle, high, senior secondary schools, colleges and other training institutions respectively in the
district. The teacher - pupil ratio was 1:23 for primary schools; 1:51 for middle schools; 1:21 for
high and 1:14 for senior secondary schools in the district.
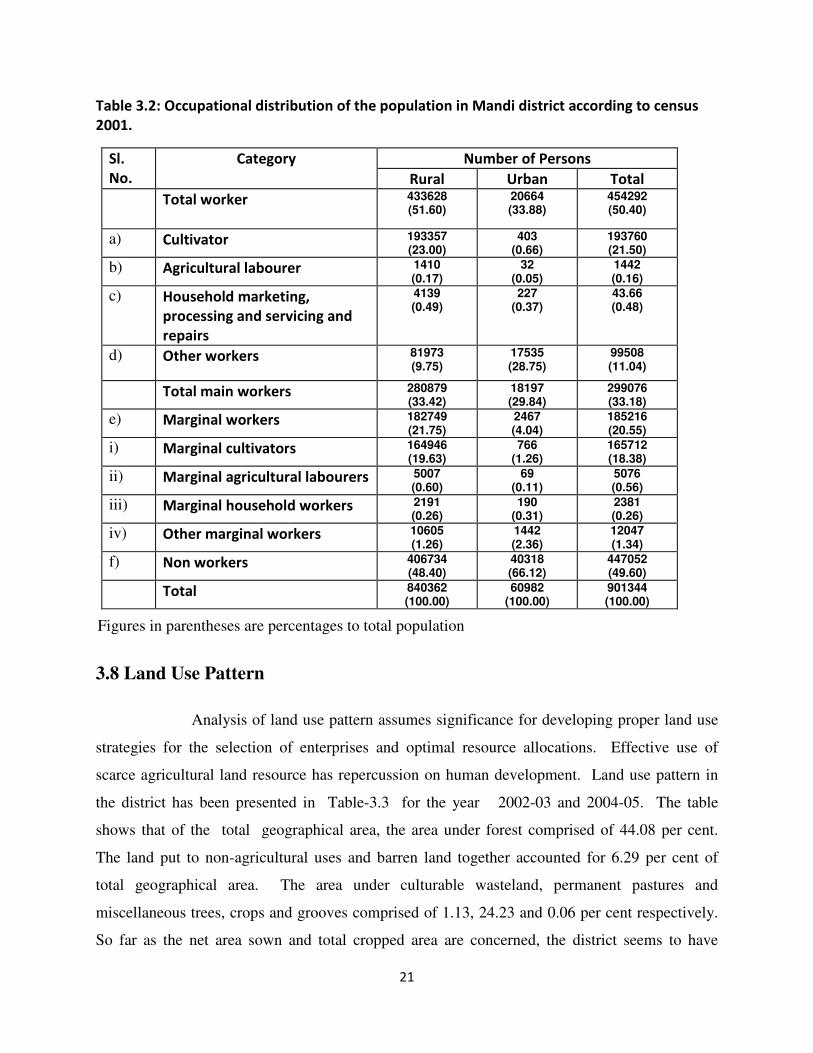
3.7 Occupational Distribution
Occupational distribution provides an index of participation of the population in
the economic activities, which has impact on overall human development; such classification
according to 2001 Census is presented in table- 3.2. Of the total population in the district nearly
50 per cent constitute the total workers. The proportion of main workers in the total working
population works out to 65.83 per cent in the district. The cultivators comprise of 42.65 per cent,
Agricultural labourers 0.32 per cent; other workers 21.90 per cent and rest are 0.96 per cent. The
marginal workers are around 40.77 per cent in the total working force. The population of non
workers was more in urban areas (66.12%) as compared to rural areas (48.40%) of their
respective population.
21
Table 3.2: Occupational distribution of the population in Mandi district according to census
2001.
Number of Persons Sl.
No.
Category
Rural Urban Total
Total worker
433628 (51.60)
20664 (33.88)
454292 (50.40)
a) Cultivator 193357 (23.00)
403 (0.66)
193760 (21.50)
b) Agricultural labourer 1410 (0.17)
32 (0.05)
1442 (0.16)
c) Household marketing,
processing and servicing and
repairs
4139 (0.49)
227 (0.37)
43.66 (0.48)
d) Other workers 81973 (9.75)
17535 (28.75)
99508 (11.04)
Total main workers 280879 (33.42)
18197 (29.84)
299076 (33.18)
e) Marginal workers 182749 (21.75)
2467 (4.04)
185216 (20.55)
i) Marginal cultivators 164946 (19.63)
766 (1.26)
165712 (18.38)
ii) Marginal agricultural labourers 5007 (0.60)
69 (0.11)
5076 (0.56)
iii) Marginal household workers 2191 (0.26)
190 (0.31)
2381 (0.26)
iv) Other marginal workers 10605 (1.26)
1442 (2.36)
12047 (1.34)
f) Non workers 406734 (48.40)
40318 (66.12)
447052 (49.60)
Total 840362 (100.00)
60982 (100.00)
901344 (100.00)
Figures in parentheses are percentages to total population
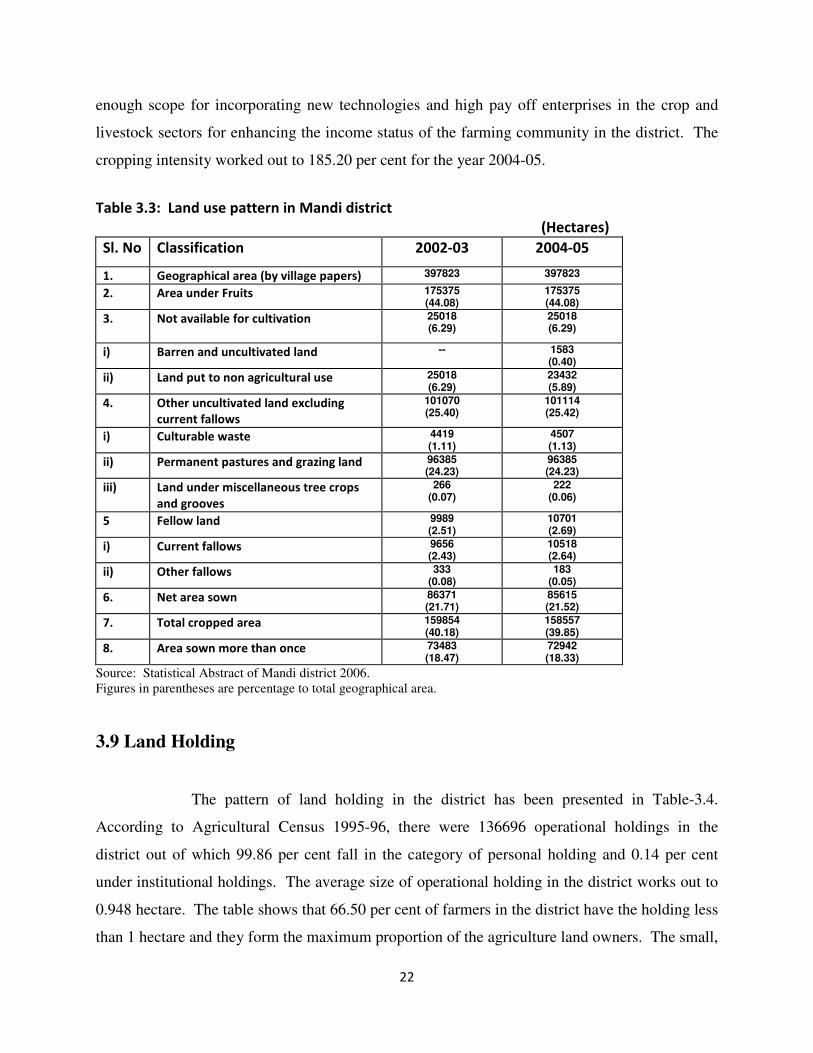
3.8 Land Use Pattern
Analysis of land use pattern assumes significance for developing proper land use
strategies for the selection of enterprises and optimal resource allocations. Effective use of
scarce agricultural land resource has repercussion on human development. Land use pattern in
the district has been presented in Table-3.3 for the year 2002-03 and 2004-05. The table
shows that of the total geographical area, the area under forest comprised of 44.08 per cent.
The land put to non-agricultural uses and barren land together accounted for 6.29 per cent of
total geographical area. The area under culturable wasteland, permanent pastures and
miscellaneous trees, crops and grooves comprised of 1.13, 24.23 and 0.06 per cent respectively.
So far as the net area sown and total cropped area are concerned, the district seems to have
22
enough scope for incorporating new technologies and high pay off enterprises in the crop and
livestock sectors for enhancing the income status of the farming community in the district. The
cropping intensity worked out to 185.20 per cent for the year 2004-05.
Table 3.3: Land use pattern in Mandi district
(Hectares)
Sl. No Classification 2002-03 2004-05
1. Geographical area (by village papers) 397823 397823
2. Area under Fruits 175375 (44.08)
175375 (44.08)
3. Not available for cultivation
25018 (6.29)
25018 (6.29)
i) Barren and uncultivated land -- 1583 (0.40)
ii) Land put to non agricultural use 25018 (6.29)
23432 (5.89)
4. Other uncultivated land excluding
current fallows
101070 (25.40)
101114 (25.42)
i) Culturable waste 4419 (1.11)
4507 (1.13)
ii) Permanent pastures and grazing land 96385 (24.23)
96385 (24.23)
iii) Land under miscellaneous tree crops
and grooves
266 (0.07)
222 (0.06)
5 Fellow land 9989 (2.51)
10701 (2.69)
i) Current fallows 9656 (2.43)
10518 (2.64)
ii) Other fallows 333 (0.08)
183 (0.05)
6. Net area sown 86371 (21.71)
85615 (21.52)
7. Total cropped area 159854 (40.18)
158557 (39.85)
8. Area sown more than once 73483 (18.47)
72942 (18.33)
Source: Statistical Abstract of Mandi district 2006. Figures in parentheses are percentage to total geographical area.
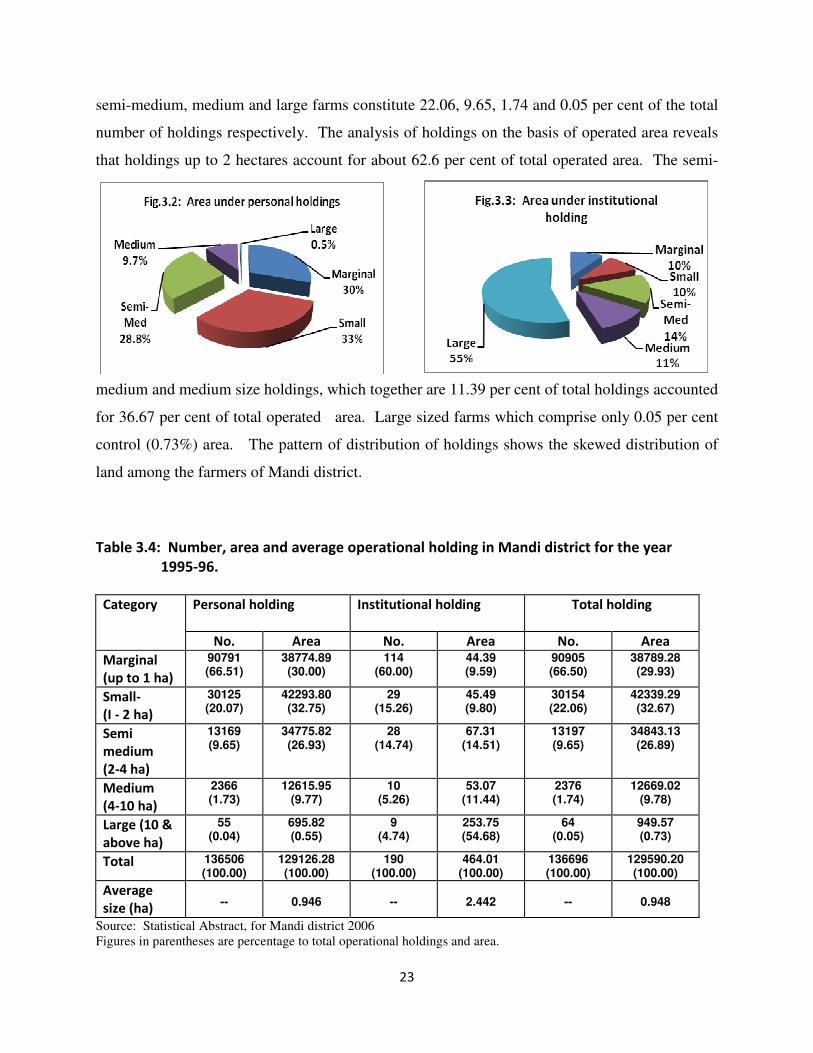
3.9 Land Holding
The pattern of land holding in the district has been presented in Table-3.4.
According to Agricultural Census 1995-96, there were 136696 operational holdings in the
district out of which 99.86 per cent fall in the category of personal holding and 0.14 per cent
under institutional holdings. The average size of operational holding in the district works out to
0.948 hectare. The table shows that 66.50 per cent of farmers in the district have the holding less
than 1 hectare and they form the maximum proportion of the agriculture land owners. The small,
23
semi-medium, medium and large farms constitute 22.06, 9.65, 1.74 and 0.05 per cent of the total
number of holdings respectively. The analysis of holdings on the basis of operated area reveals
that holdings up to 2 hectares account for about 62.6 per cent of total operated area. The semi-
medium and medium size holdings, which together are 11.39 per cent of total holdings accounted
for 36.67 per cent of total operated area. Large sized farms which comprise only 0.05 per cent
control (0.73%) area. The pattern of distribution of holdings shows the skewed distribution of
land among the farmers of Mandi district.
Table 3.4: Number, area and average operational holding in Mandi district for the year
1995-96.
Personal holding
Institutional holding
Total holding
Category
No. Area No. Area No. Area
Marginal
(up to 1 ha)
90791 (66.51)
38774.89 (30.00)
114 (60.00)
44.39 (9.59)
90905 (66.50)
38789.28 (29.93)
Small-
(I - 2 ha)
30125 (20.07)
42293.80 (32.75)
29 (15.26)
45.49 (9.80)
30154 (22.06)
42339.29 (32.67)
Semi
medium
(2-4 ha)
13169 (9.65)
34775.82 (26.93)
28 (14.74)
67.31 (14.51)
13197 (9.65)
34843.13 (26.89)
Medium
(4-10 ha)
2366 (1.73)
12615.95 (9.77)
10 (5.26)
53.07 (11.44)
2376 (1.74)
12669.02 (9.78)
Large (10 &
above ha)
55 (0.04)
695.82 (0.55)
9 (4.74)
253.75 (54.68)
64 (0.05)
949.57 (0.73)
Total 136506 (100.00)
129126.28 (100.00)
190 (100.00)
464.01 (100.00)
136696 (100.00)
129590.20 (100.00)
Average
size (ha)
--
0.946
--
2.442
--
0.948
Source: Statistical Abstract, for Mandi district 2006 Figures in parentheses are percentage to total operational holdings and area.
24
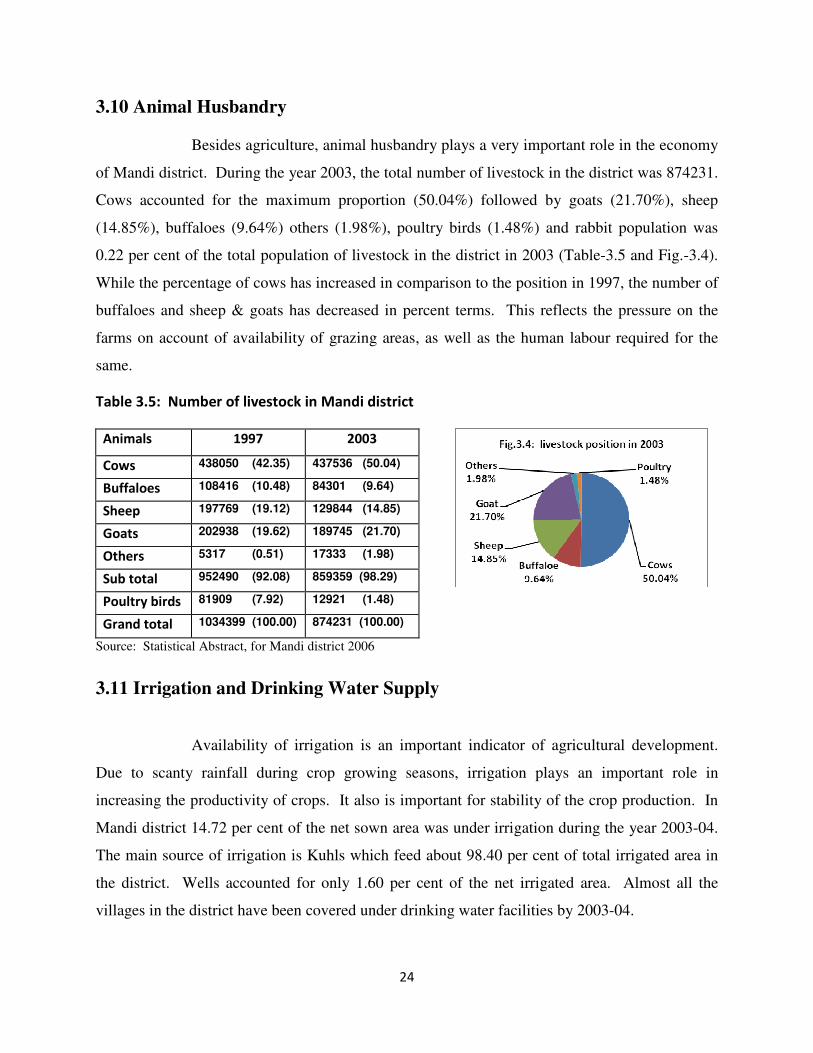
3.10 Animal Husbandry
Besides agriculture, animal husbandry plays a very important role in the economy
of Mandi district. During the year 2003, the total number of livestock in the district was 874231.
Cows accounted for the maximum proportion (50.04%) followed by goats (21.70%), sheep
(14.85%), buffaloes (9.64%) others (1.98%), poultry birds (1.48%) and rabbit population was
0.22 per cent of the total population of livestock in the district in 2003 (Table-3.5 and Fig.-3.4).
While the percentage of cows has increased in comparison to the position in 1997, the number of
buffaloes and sheep & goats has decreased in percent terms. This reflects the pressure on the
farms on account of availability of grazing areas, as well as the human labour required for the
same.
Table 3.5: Number of livestock in Mandi district
Animals 1997 2003
Cows 438050 (42.35) 437536 (50.04)
Buffaloes 108416 (10.48) 84301 (9.64)
Sheep 197769 (19.12) 129844 (14.85)
Goats 202938 (19.62) 189745 (21.70)
Others 5317 (0.51) 17333 (1.98)
Sub total 952490 (92.08) 859359 (98.29)
Poultry birds 81909 (7.92) 12921 (1.48)
Grand total 1034399 (100.00) 874231 (100.00)
Source: Statistical Abstract, for Mandi district 2006
3.11 Irrigation and Drinking Water Supply
Availability of irrigation is an important indicator of agricultural development.
Due to scanty rainfall during crop growing seasons, irrigation plays an important role in
increasing the productivity of crops. It also is important for stability of the crop production. In
Mandi district 14.72 per cent of the net sown area was under irrigation during the year 2003-04.
The main source of irrigation is Kuhls which feed about 98.40 per cent of total irrigated area in
the district. Wells accounted for only 1.60 per cent of the net irrigated area. Almost all the
villages in the district have been covered under drinking water facilities by 2003-04.
25
CHAPTER-IV
Demographic Features
A deeper analysis and understanding of the total population of an area and its
composition is important for planning and execution of development strategies for that area. It
is in this regard that the analysis of demographic profile of the area becomes important. District
Mandi is an important district and has been an educational and cultural centre of the state.
People of the district are known to be
religious, hardworking and
educationally active. This is amply
reflected in the number of temples and
the number of educated persons in
Mandi. In fact, the Mandi town is also
commonly known “Chhoti Kashi” of
the state.
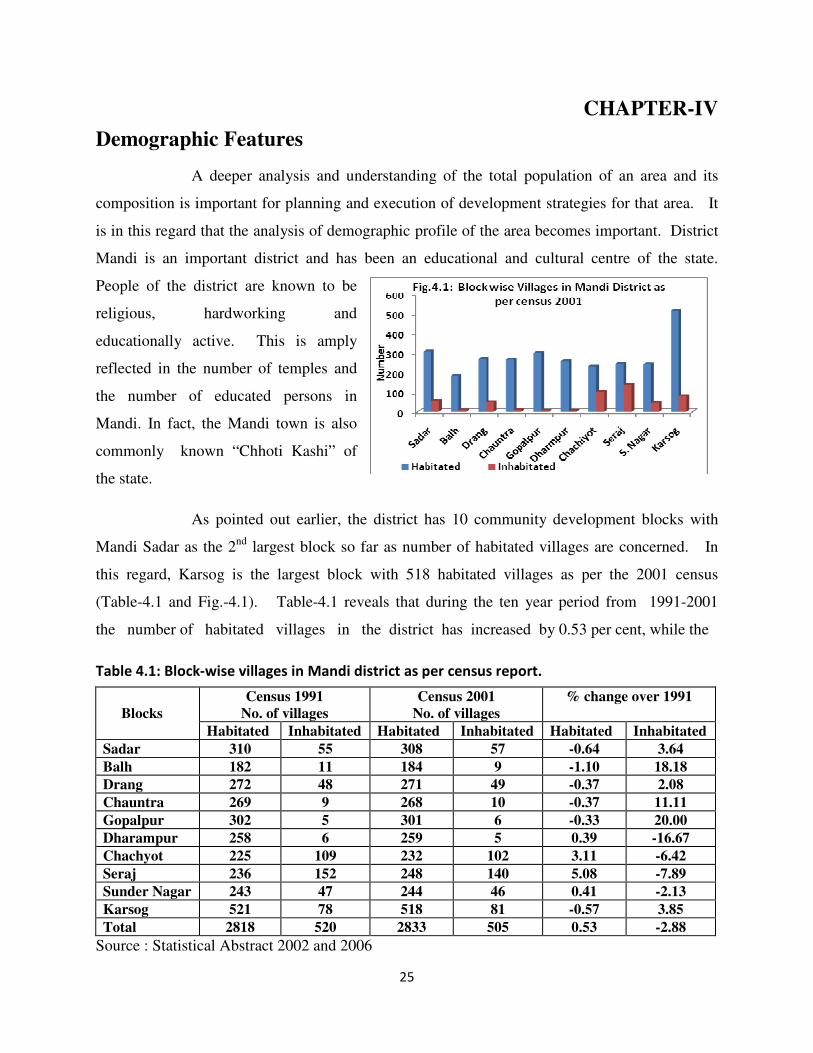
As pointed out earlier, the district has 10 community development blocks with
Mandi Sadar as the 2nd largest block so far as number of habitated villages are concerned. In
this regard, Karsog is the largest block with 518 habitated villages as per the 2001 census
(Table-4.1 and Fig.-4.1). Table-4.1 reveals that during the ten year period from 1991-2001
the number of habitated villages in the district has increased by 0.53 per cent, while the
Table 4.1: Block-wise villages in Mandi district as per census report.
Census 1991
No. of villages
Census 2001
No. of villages
% change over 1991
Blocks
Habitated Inhabitated Habitated Inhabitated Habitated Inhabitated
Sadar 310 55 308 57 -0.64 3.64
Balh 182 11 184 9 -1.10 18.18
Drang 272 48 271 49 -0.37 2.08
Chauntra 269 9 268 10 -0.37 11.11
Gopalpur 302 5 301 6 -0.33 20.00
Dharampur 258 6 259 5 0.39 -16.67
Chachyot 225 109 232 102 3.11 -6.42
Seraj 236 152 248 140 5.08 -7.89
Sunder Nagar 243 47 244 46 0.41 -2.13
Karsog 521 78 518 81 -0.57 3.85
Total 2818 520 2833 505 0.53 -2.88
Source : Statistical Abstract 2002 and 2006
26
number of inhabitated villages has shown a decline of 2.88 per cent. Across the blocks, the block
showing increase in habitated villages has also shown decrease in inhabitated villages and vice
versa. Wherever, there have been decrease in habitated villages, the relative increase in in
inhabitated villages is much higher. In Dharampur, Chachyot, Seraj and Sunder Nagar the
habitated villages have shown an increase. Here also, the decline in inhabitated villages is
relatively higher. This may be attributed to the growth in exodus of rural population to urban
areas, reallocation of block area in the district, re-settlement of people near roads and
improvement in other infrastructural facilities.
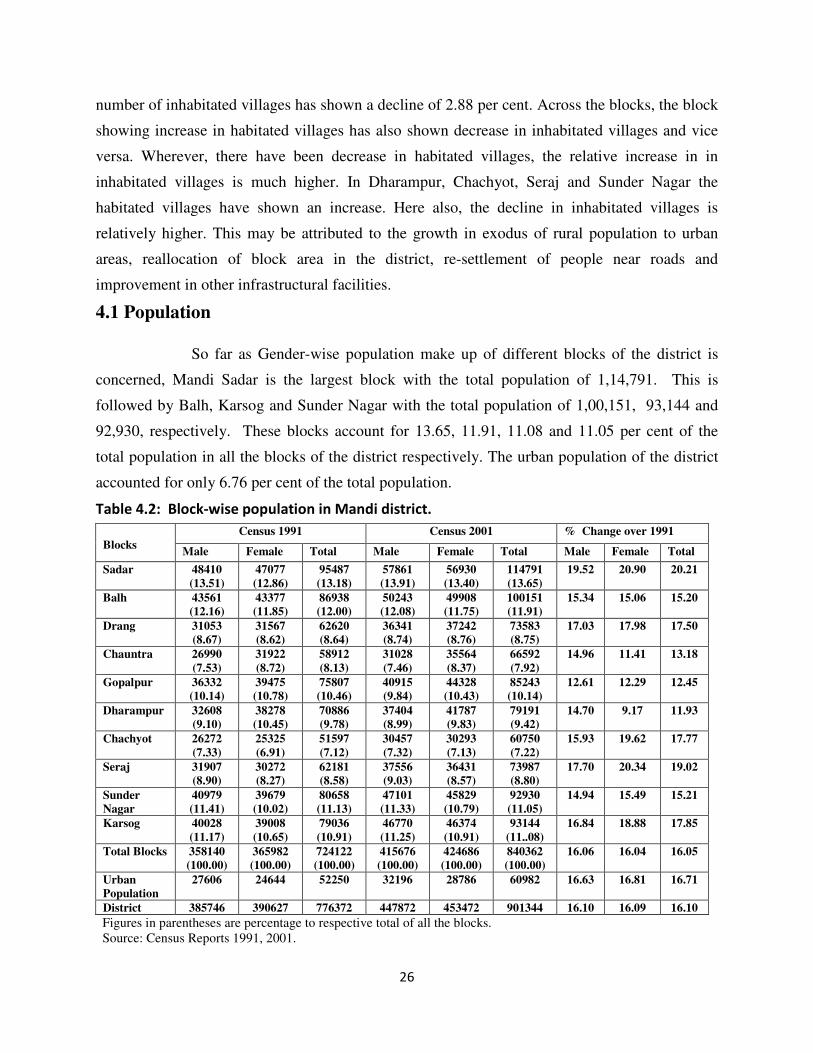
4.1 Population
So far as Gender-wise population make up of different blocks of the district is
concerned, Mandi Sadar is the largest block with the total population of 1,14,791. This is
followed by Balh, Karsog and Sunder Nagar with the total population of 1,00,151, 93,144 and
92,930, respectively. These blocks account for 13.65, 11.91, 11.08 and 11.05 per cent of the
total population in all the blocks of the district respectively. The urban population of the district
accounted for only 6.76 per cent of the total population.
Table 4.2: Block-wise population in Mandi district.
Census 1991 Census 2001 % Change over 1991
Blocks Male Female Total Male Female Total Male Female Total
Sadar 48410
(13.51)
47077
(12.86)
95487
(13.18)
57861
(13.91)
56930
(13.40)
114791
(13.65)
19.52 20.90 20.21
Balh 43561
(12.16)
43377
(11.85)
86938
(12.00)
50243
(12.08)
49908
(11.75)
100151
(11.91)
15.34 15.06 15.20
Drang 31053
(8.67)
31567
(8.62)
62620
(8.64)
36341
(8.74)
37242
(8.76)
73583
(8.75)
17.03 17.98 17.50
Chauntra 26990
(7.53)
31922
(8.72)
58912
(8.13)
31028
(7.46)
35564
(8.37)
66592
(7.92)
14.96 11.41 13.18
Gopalpur 36332
(10.14)
39475
(10.78)
75807
(10.46)
40915
(9.84)
44328
(10.43)
85243
(10.14)
12.61 12.29 12.45
Dharampur 32608
(9.10)
38278
(10.45)
70886
(9.78)
37404
(8.99)
41787
(9.83)
79191
(9.42)
14.70 9.17 11.93
Chachyot 26272
(7.33)
25325
(6.91)
51597
(7.12)
30457
(7.32)
30293
(7.13)
60750
(7.22)
15.93 19.62 17.77
Seraj 31907
(8.90)
30272
(8.27)
62181
(8.58)
37556
(9.03)
36431
(8.57)
73987
(8.80)
17.70 20.34 19.02
Sunder
Nagar
40979
(11.41)
39679
(10.02)
80658
(11.13)
47101
(11.33)
45829
(10.79)
92930
(11.05)
14.94 15.49 15.21
Karsog 40028
(11.17)
39008
(10.65)
79036
(10.91)
46770
(11.25)
46374
(10.91)
93144
(11..08)
16.84 18.88 17.85
Total Blocks 358140
(100.00)
365982
(100.00)
724122
(100.00)
415676
(100.00)
424686
(100.00)
840362
(100.00)
16.06 16.04 16.05
Urban
Population
27606 24644 52250 32196 28786 60982 16.63 16.81 16.71
District 385746 390627 776372 447872 453472 901344 16.10 16.09 16.10
Figures in parentheses are percentage to respective total of all the blocks. Source: Census Reports 1991, 2001.
27
Gender-wise make up of the population for the census of 1991 and 2001 is
presented in Table- 4.2. It is evident from the table that female population is marginally higher
than the male in this district. Female
population forms 50.31 per cent of the
total population of the total district.
Similarly, rural female population
accounted for 50.54 per cent of total
rural population. Block-wise changes in
male and female population in 2001,
over the census of 1991, shows that the female population increased by about 20.90 per cent in
Mandi Sadar followed by 20.34% in Seraj block. These two blocks were followed by Chachyot
(19.62%), Karsog (18.88%) and Darang (17.98%). As in case of female population, the increase
in male population was also highest in Mandi Sadar. This increase is shown to be 19.52 per cent
in 2001 over the census of 1991. Other prominent blocks with regard to increase in male
population are Darang (17.03%), Seraj
(17.70), Karsog (16.84%) and Chachyot
(15.93%). In case of urban population the
increase over 1991 census recorded was
16.81 per cent in case of female and 16.63
per cent in case of male population (Fig.-
4.2 and Appendix-I).
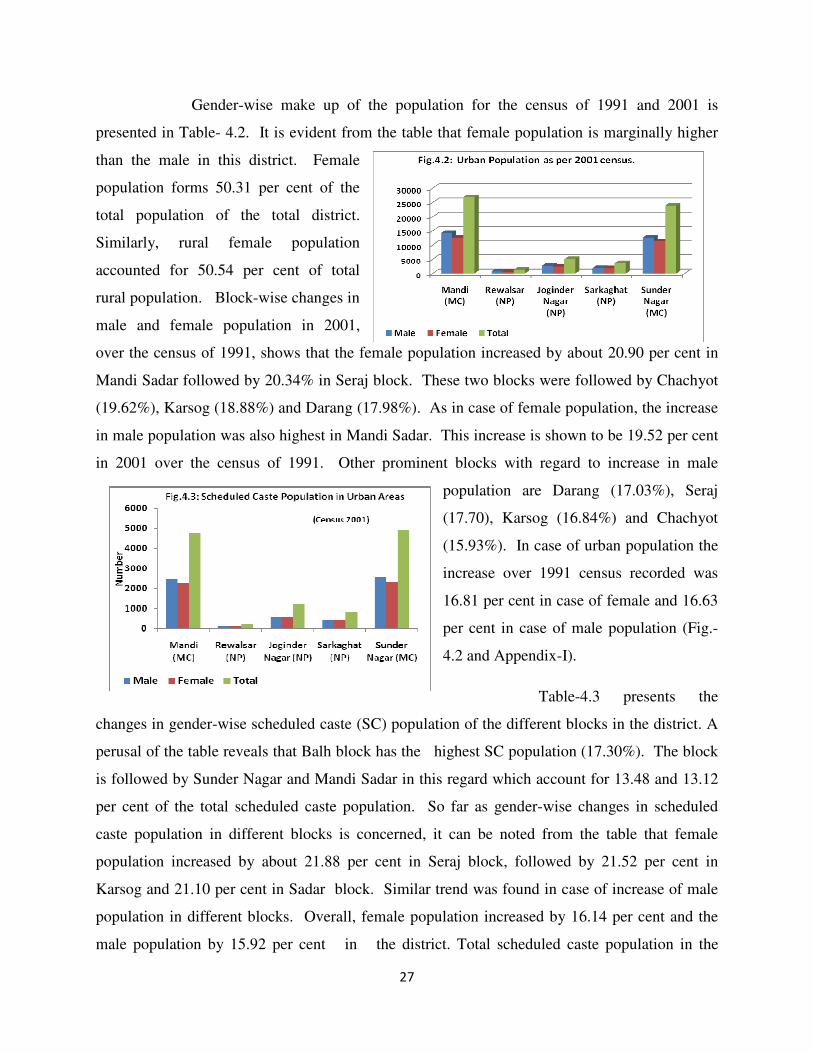
Table-4.3 presents the
changes in gender-wise scheduled caste (SC) population of the different blocks in the district. A
perusal of the table reveals that Balh block has the highest SC population (17.30%). The block
is followed by Sunder Nagar and Mandi Sadar in this regard which account for 13.48 and 13.12
per cent of the total scheduled caste population. So far as gender-wise changes in scheduled
caste population in different blocks is concerned, it can be noted from the table that female
population increased by about 21.88 per cent in Seraj block, followed by 21.52 per cent in
Karsog and 21.10 per cent in Sadar block. Similar trend was found in case of increase of male
population in different blocks. Overall, female population increased by 16.14 per cent and the
male population by 15.92 per cent in the district. Total scheduled caste population in the
28
district is noted to have increased by 16.04 per cent in 2001, over the figures of 1991 census. In
case of scheduled caste population in the urban area of the district, Sundar Nagar Municipal area
has the largest population with 40.83 per cent, followed by Mandi with 39.86 per cent of total
urban scheduled caste population (Fig.-4.3 and Appendix-II). The decadal growth of SC
population in urban areas was recorded 9.27 per cent. However, for the Mandi district as a
whole, the scheduled caste population increased by 15.71 per cent during 1991 to 2001.
Table 4.3: Block-wise scheduled caste population in Mandi district.
Census 1991 Census 2001 % Change over 1991
Blocks
M F T M F T M F T
Sadar 13957
(12.96)
13488
(12.59)
27445
(12.78)
16500
(8.41)
16200
(13.03)
32720
(13.12)
18.22 20.10 19.16
Balh 19012
(17.66)
18661
(17.37)
37673
(17.54)
21794
(17.6)
21307
(17.13)
43101
(17.30)
14.63 14.17 14.40
Drang 6321
(5.27)
6286
(5.87)
12607
(5.87)
7173
(5.74)
7184
(5.77)
14347
(5.75)
13.48 14.28 13.80
Chauntra 6753
(6.27)
7479
(6.89)
14232
(6.62)
7818
(6.26)
8643
(6.95)
16461
(6.60)
15.77 15.56 15.66
Gopalpur 9709
(9.01)
10068
(9.40)
19777
(9.21)
10860
(8.70)
11149
(8.96)
22009 11.85 10.73 11.28
Dharampur 7375
(6.85)
7736
(7.22)
15111
(7.03)
8090
(6.48)
8312
(6.68)
16402
(6.58)
9.69 7.44 8.54
Chachyot 9096
(8.44)
8895
(8.30)
17991
(8.37)
10565
(8.46)
10538
(8.47)
21103
(8.47)
16.15 18.47 17.29
Seraj 8553
(7.94)
8186
(7.64)
16739
(7.79)
10339
(8.29)
9977
(8.02)
20316
(8.15)
20.88 21.88 21.36
Sunder Nagar 14682
(13.63)
14408
(13.45)
29090
(13.54)
16976
(13.60)
16622
(13.37)
33598
(13.48)
15.62 15.36 15.49
Karsog 22197
(11.32)
11842
(11.06)
24039
(11.19)
14684
(11.19)
14391
(11.76)
29075
(11.67)
20.39 21.52 20.94
Total Blocks 107655
(100.00)
107049
(100.00)
214704
(100.00)
124799
(100.00)
124323
(100.00)
249132
(100.00)
15.92 16.14 16.04
Urban Area 5775 5290 11065 6284 5808 12091 8.81 9.79 9.27
District 113430 112339 225769 131083 130151 261233 15.56 15.85 15.71
Figures in parentheses are percentage to respective total. Source: Census Reports 1991, 2001
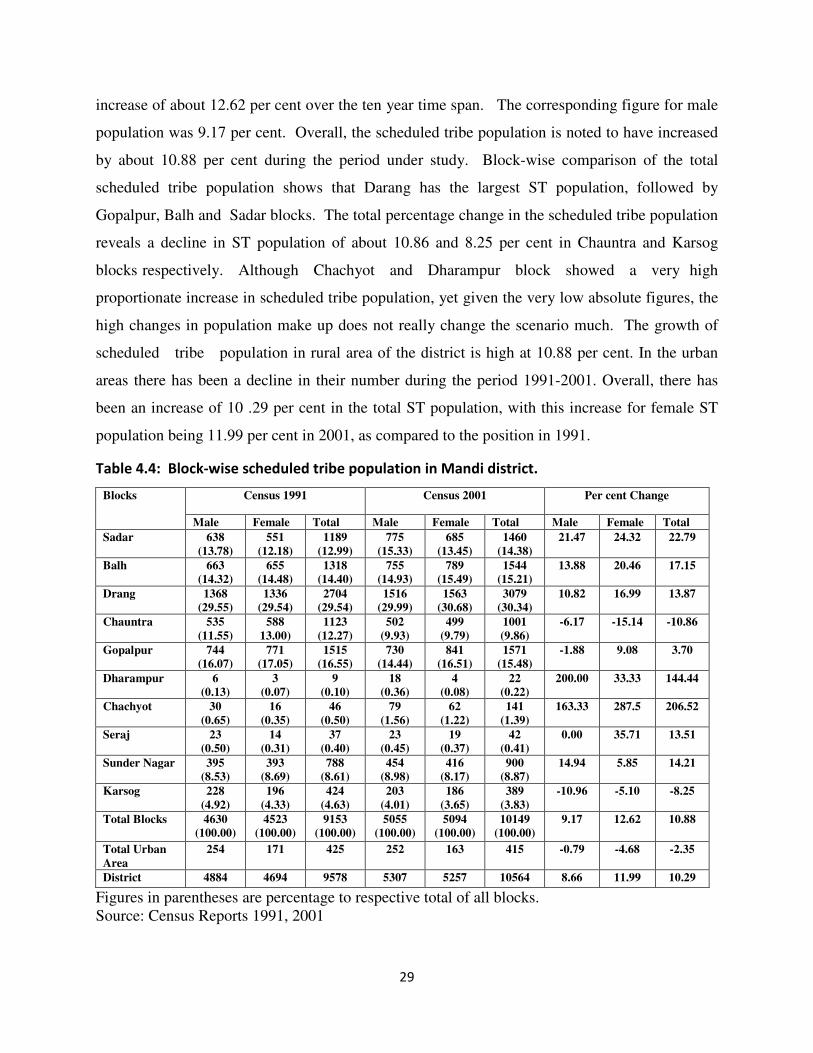
Similar information with regard to the scheduled tribe (ST) population in
different blocks of the district is presented in Table- 4.4. A cursory glance at the table reveals
that like the SC population, the scheduled tribe female population in the district also showed an
29
increase of about 12.62 per cent over the ten year time span. The corresponding figure for male
population was 9.17 per cent. Overall, the scheduled tribe population is noted to have increased
by about 10.88 per cent during the period under study. Block-wise comparison of the total
scheduled tribe population shows that Darang has the largest ST population, followed by
Gopalpur, Balh and Sadar blocks. The total percentage change in the scheduled tribe population
reveals a decline in ST population of about 10.86 and 8.25 per cent in Chauntra and Karsog
blocks respectively. Although Chachyot and Dharampur block showed a very high
proportionate increase in scheduled tribe population, yet given the very low absolute figures, the
high changes in population make up does not really change the scenario much. The growth of
scheduled tribe population in rural area of the district is high at 10.88 per cent. In the urban
areas there has been a decline in their number during the period 1991-2001. Overall, there has
been an increase of 10 .29 per cent in the total ST population, with this increase for female ST
population being 11.99 per cent in 2001, as compared to the position in 1991.
Table 4.4: Block-wise scheduled tribe population in Mandi district.
Census 1991 Census 2001 Per cent Change Blocks
Male Female Total Male Female Total Male Female Total
Sadar 638
(13.78)
551
(12.18)
1189
(12.99)
775
(15.33)
685
(13.45)
1460
(14.38)
21.47 24.32 22.79
Balh 663
(14.32)
655
(14.48)
1318
(14.40)
755
(14.93)
789
(15.49)
1544
(15.21)
13.88 20.46 17.15
Drang 1368
(29.55)
1336
(29.54)
2704
(29.54)
1516
(29.99)
1563
(30.68)
3079
(30.34)
10.82 16.99 13.87
Chauntra 535
(11.55)
588
13.00)
1123
(12.27)
502
(9.93)
499
(9.79)
1001
(9.86)
-6.17 -15.14 -10.86
Gopalpur 744
(16.07)
771
(17.05)
1515
(16.55)
730
(14.44)
841
(16.51)
1571
(15.48)
-1.88 9.08 3.70
Dharampur 6
(0.13)
3
(0.07)
9
(0.10)
18
(0.36)
4
(0.08)
22
(0.22)
200.00 33.33 144.44
Chachyot 30
(0.65)
16
(0.35)
46
(0.50)
79
(1.56)
62
(1.22)
141
(1.39)
163.33 287.5 206.52
Seraj 23
(0.50)
14
(0.31)
37
(0.40)
23
(0.45)
19
(0.37)
42
(0.41)
0.00 35.71 13.51
Sunder Nagar 395
(8.53)
393
(8.69)
788
(8.61)
454
(8.98)
416
(8.17)
900
(8.87)
14.94 5.85 14.21
Karsog 228
(4.92)
196
(4.33)
424
(4.63)
203
(4.01)
186
(3.65)
389
(3.83)
-10.96 -5.10 -8.25
Total Blocks 4630
(100.00)
4523
(100.00)
9153
(100.00)
5055
(100.00)
5094
(100.00)
10149
(100.00)
9.17 12.62 10.88
Total Urban
Area
254 171 425 252 163 415 -0.79 -4.68 -2.35
District 4884 4694 9578 5307 5257 10564 8.66 11.99 10.29
Figures in parentheses are percentage to respective total of all blocks. Source: Census Reports 1991, 2001
30
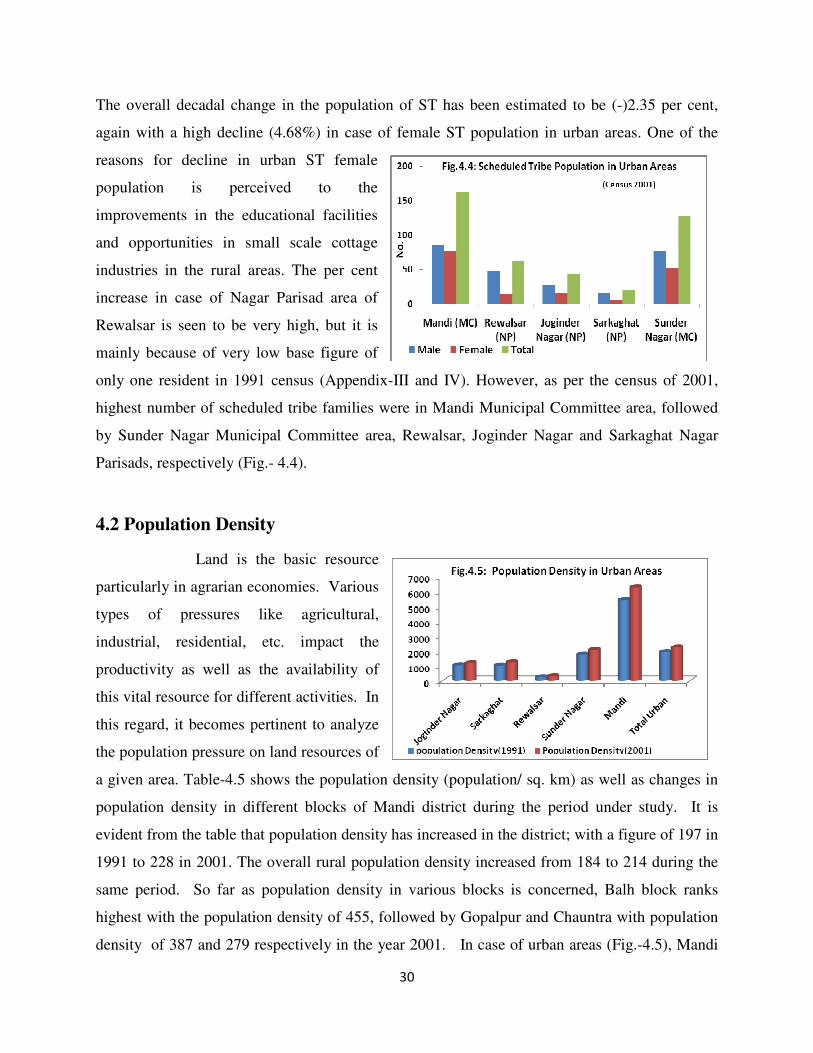
The overall decadal change in the population of ST has been estimated to be (-)2.35 per cent,
again with a high decline (4.68%) in case of female ST population in urban areas. One of the
reasons for decline in urban ST female
population is perceived to the
improvements in the educational facilities
and opportunities in small scale cottage
industries in the rural areas. The per cent
increase in case of Nagar Parisad area of
Rewalsar is seen to be very high, but it is
mainly because of very low base figure of
only one resident in 1991 census (Appendix-III and IV). However, as per the census of 2001,
highest number of scheduled tribe families were in Mandi Municipal Committee area, followed
by Sunder Nagar Municipal Committee area, Rewalsar, Joginder Nagar and Sarkaghat Nagar
Parisads, respectively (Fig.- 4.4).
4.2 Population Density
Land is the basic resource
particularly in agrarian economies. Various
types of pressures like agricultural,
industrial, residential, etc. impact the
productivity as well as the availability of
this vital resource for different activities. In
this regard, it becomes pertinent to analyze
the population pressure on land resources of
a given area. Table-4.5 shows the population density (population/ sq. km) as well as changes in
population density in different blocks of Mandi district during the period under study. It is
evident from the table that population density has increased in the district; with a figure of 197 in
1991 to 228 in 2001. The overall rural population density increased from 184 to 214 during the
same period. So far as population density in various blocks is concerned, Balh block ranks
highest with the population density of 455, followed by Gopalpur and Chauntra with population
density of 387 and 279 respectively in the year 2001. In case of urban areas (Fig.-4.5), Mandi
31
Municipal Committee area has the highest population density of 6308 persons per sq. km,
followed by Sunder Nagar with a density of 2093 and Sarkaghat with 1256 persons/ sq. km
(Appendix-V). The overall urban area population density works out to be 2263 persons/ sq. km
in the year 2001 against 1943 persons/ sq. km in 1991 (Table-4.5).
Table 4.5: Block-wise area and population density in Mandi district
1991 2001
Blocks Geographical Area km² Popn Density/ Km
2 Geographical Area km² Pop
n Density/ Km
2
Sadar 600.81 159 600.81 191
Balh 220.18 395 220.18 455
Drang 523.76 119 523.76 140
Chauntra 238.47 247 238.47 279
Gopalpur 221.12 343 221.12 387
Dharampur 226.96 312 226.96 297
Chachyot 358.15 144 358.15 170
Seraj 496.95 125 496.95 149
S.Nagar 412.64 195 412.64 225
Karsog 585.65 135 585.65 159
Total Blocks 3923.69 184 3923.69 214
Urban Area 26.89 1943 26.89 2263
District 3950.58 197 3950.58 228
Source: CensusReports 1991, 2001.
4.3 Sex Ratio One indicator used to assess society’s treatment for women is the population sex
ratio. The sex ratio in India has seen a downward trend throughout the 20th century; reaching 927
in the year 1997 as against 972 in the year 1901. In 2001,
however, the sex ratio improved marginally to reach 933
(by 6%). In Himachal Pradesh, the sex ratio also
decreased from 976 in 1991 to 968 in 2001. In district
Mandi the sex ratio decreased by one from 1013 in 1991
to 1012 in 2001, indicating a decrease of 0.09 per cent.
The sex ratio remained practically unchanged for the rural
areas of the district during the decade under reference
(Table-4.6). During 2001 the number of females per
thousand of males varied from lowest of 933 (Balh block)
to highest of 1146 (Chauntra block). With regard to the
sex ratio, Chauntra block ranks first and it is followed by
Dharampur, Gopalpur and Darang with the figure of 1117, 1083 and 1025, respectively. The
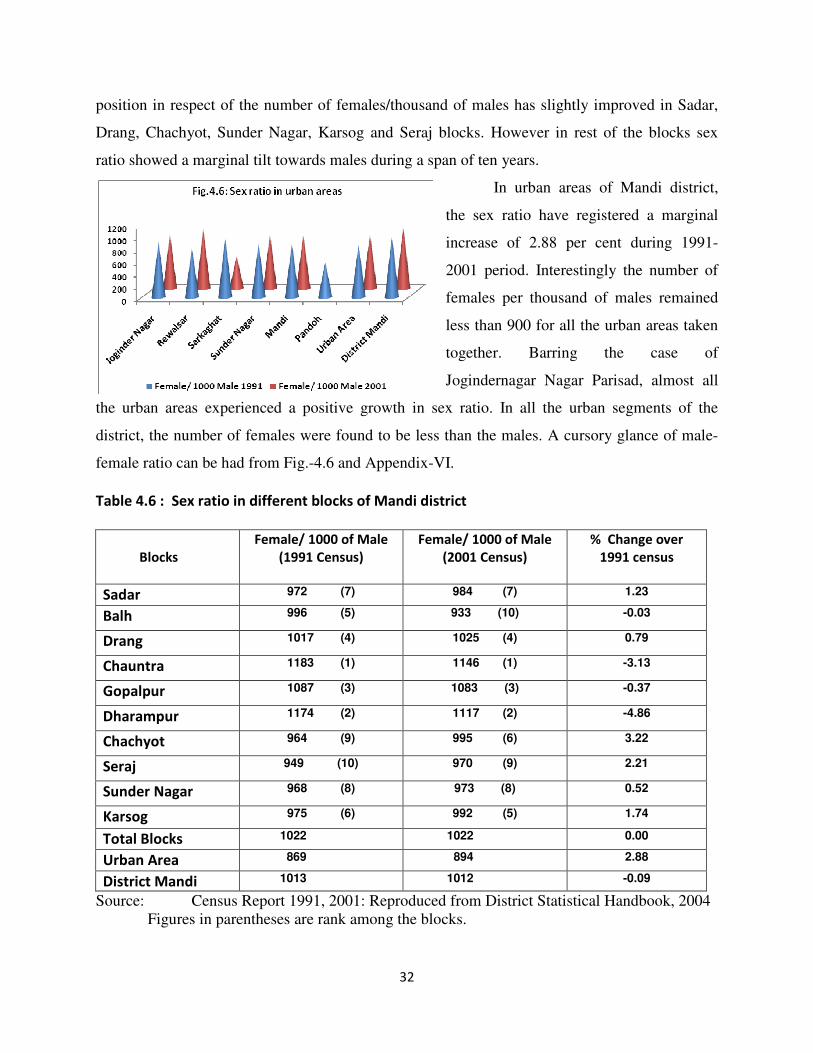
32
position in respect of the number of females/thousand of males has slightly improved in Sadar,
Drang, Chachyot, Sunder Nagar, Karsog and Seraj blocks. However in rest of the blocks sex
ratio showed a marginal tilt towards males during a span of ten years.
In urban areas of Mandi district,
the sex ratio have registered a marginal
increase of 2.88 per cent during 1991-
2001 period. Interestingly the number of
females per thousand of males remained
less than 900 for all the urban areas taken
together. Barring the case of
Jogindernagar Nagar Parisad, almost all
the urban areas experienced a positive growth in sex ratio. In all the urban segments of the
district, the number of females were found to be less than the males. A cursory glance of male-
female ratio can be had from Fig.-4.6 and Appendix-VI.
Table 4.6 : Sex ratio in different blocks of Mandi district
Blocks
Female/ 1000 of Male
(1991 Census)
Female/ 1000 of Male
(2001 Census)
% Change over
1991 census
Sadar 972 (7) 984 (7) 1.23
Balh 996 (5) 933 (10) -0.03
Drang 1017 (4) 1025 (4) 0.79
Chauntra 1183 (1) 1146 (1) -3.13
Gopalpur 1087 (3) 1083 (3) -0.37
Dharampur 1174 (2) 1117 (2) -4.86
Chachyot 964 (9) 995 (6) 3.22
Seraj 949 (10) 970 (9) 2.21
Sunder Nagar 968 (8) 973 (8) 0.52
Karsog 975 (6) 992 (5) 1.74
Total Blocks 1022 1022 0.00
Urban Area 869 894 2.88
District Mandi 1013 1012 -0.09
Source: Census Report 1991, 2001: Reproduced from District Statistical Handbook, 2004 Figures in parentheses are rank among the blocks.
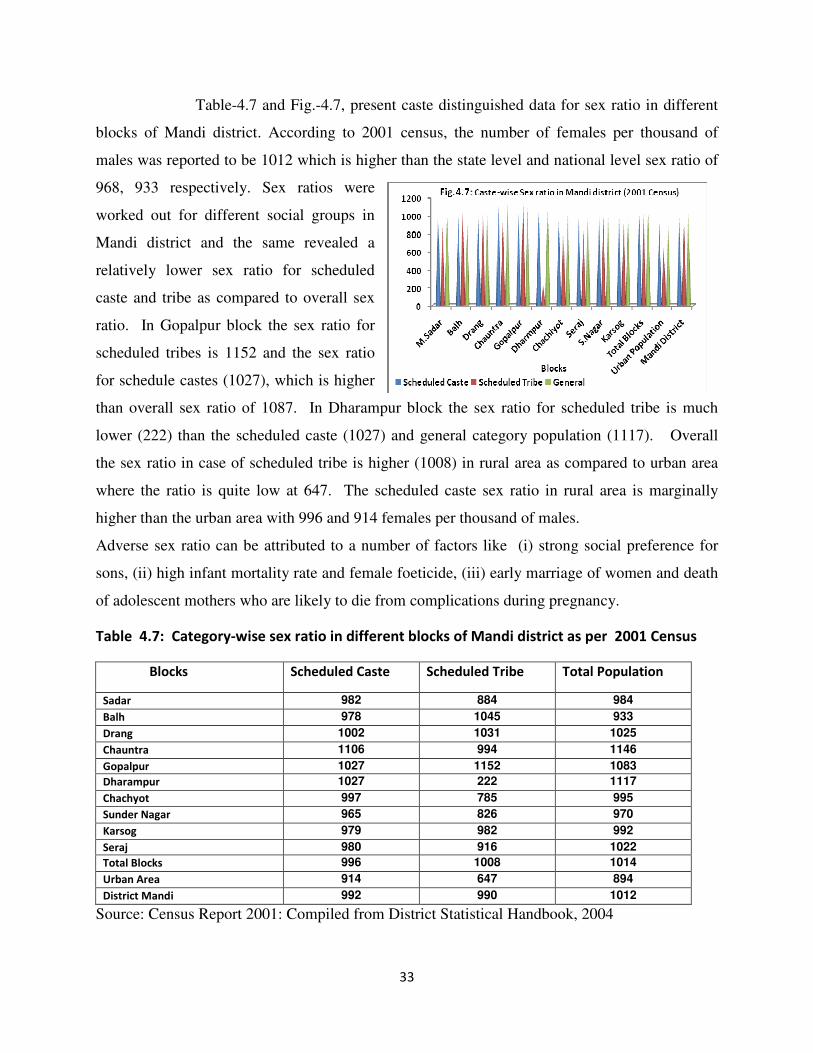
33
Table-4.7 and Fig.-4.7, present caste distinguished data for sex ratio in different
blocks of Mandi district. According to 2001 census, the number of females per thousand of
males was reported to be 1012 which is higher than the state level and national level sex ratio of
968, 933 respectively. Sex ratios were
worked out for different social groups in
Mandi district and the same revealed a
relatively lower sex ratio for scheduled
caste and tribe as compared to overall sex
ratio. In Gopalpur block the sex ratio for
scheduled tribes is 1152 and the sex ratio
for schedule castes (1027), which is higher
than overall sex ratio of 1087. In Dharampur block the sex ratio for scheduled tribe is much
lower (222) than the scheduled caste (1027) and general category population (1117). Overall
the sex ratio in case of scheduled tribe is higher (1008) in rural area as compared to urban area
where the ratio is quite low at 647. The scheduled caste sex ratio in rural area is marginally
higher than the urban area with 996 and 914 females per thousand of males.
Adverse sex ratio can be attributed to a number of factors like (i) strong social preference for
sons, (ii) high infant mortality rate and female foeticide, (iii) early marriage of women and death
of adolescent mothers who are likely to die from complications during pregnancy.
Table 4.7: Category-wise sex ratio in different blocks of Mandi district as per 2001 Census
Blocks Scheduled Caste Scheduled Tribe Total Population
Sadar 982 884 984
Balh 978 1045 933
Drang 1002 1031 1025
Chauntra 1106 994 1146
Gopalpur 1027 1152 1083
Dharampur 1027 222 1117
Chachyot 997 785 995
Sunder Nagar 965 826 970
Karsog 979 982 992
Seraj 980 916 1022
Total Blocks 996 1008 1014
Urban Area 914 647 894
District Mandi 992 990 1012
Source: Census Report 2001: Compiled from District Statistical Handbook, 2004
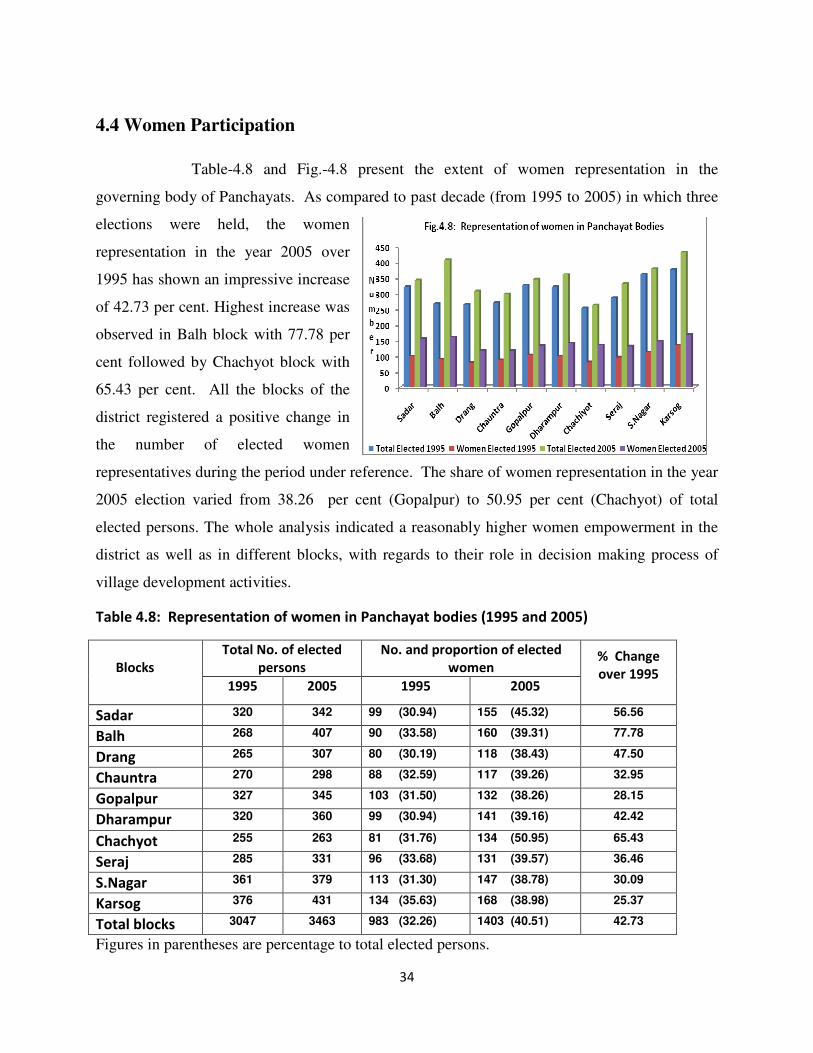
34
4.4 Women Participation
Table-4.8 and Fig.-4.8 present the extent of women representation in the
governing body of Panchayats. As compared to past decade (from 1995 to 2005) in which three
elections were held, the women
representation in the year 2005 over
1995 has shown an impressive increase
of 42.73 per cent. Highest increase was
observed in Balh block with 77.78 per
cent followed by Chachyot block with
65.43 per cent. All the blocks of the
district registered a positive change in
the number of elected women
representatives during the period under reference. The share of women representation in the year
2005 election varied from 38.26 per cent (Gopalpur) to 50.95 per cent (Chachyot) of total
elected persons. The whole analysis indicated a reasonably higher women empowerment in the
district as well as in different blocks, with regards to their role in decision making process of
village development activities.
Table 4.8: Representation of women in Panchayat bodies (1995 and 2005)
Total No. of elected
persons
No. and proportion of elected
women
Blocks
1995 2005 1995 2005
% Change
over 1995
Sadar 320 342 99 (30.94) 155 (45.32) 56.56
Balh 268 407 90 (33.58) 160 (39.31) 77.78
Drang 265 307 80 (30.19) 118 (38.43) 47.50
Chauntra 270 298 88 (32.59) 117 (39.26) 32.95
Gopalpur 327 345 103 (31.50) 132 (38.26) 28.15
Dharampur 320 360 99 (30.94) 141 (39.16) 42.42
Chachyot 255 263 81 (31.76) 134 (50.95) 65.43
Seraj 285 331 96 (33.68) 131 (39.57) 36.46
S.Nagar 361 379 113 (31.30) 147 (38.78) 30.09
Karsog 376 431 134 (35.63) 168 (38.98) 25.37
Total blocks 3047 3463 983 (32.26) 1403 (40.51) 42.73
Figures in parentheses are percentage to total elected persons.
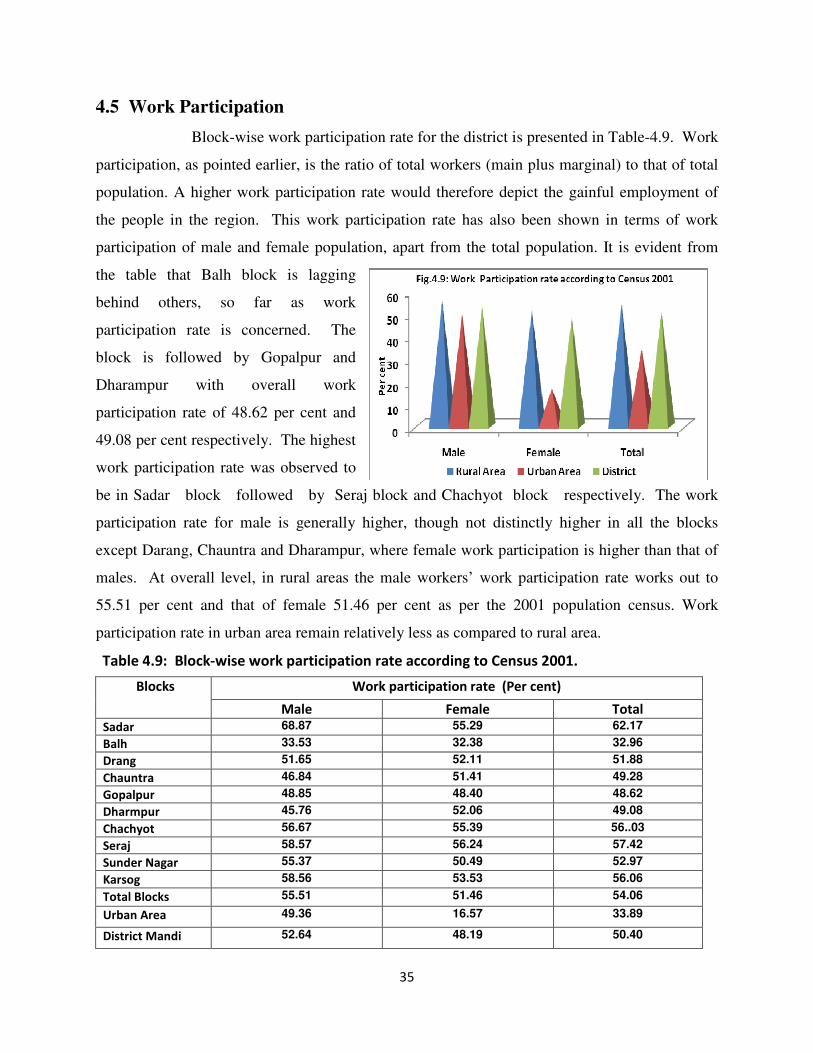
35
4.5 Work Participation
Block-wise work participation rate for the district is presented in Table-4.9. Work
participation, as pointed earlier, is the ratio of total workers (main plus marginal) to that of total
population. A higher work participation rate would therefore depict the gainful employment of
the people in the region. This work participation rate has also been shown in terms of work
participation of male and female population, apart from the total population. It is evident from
the table that Balh block is lagging
behind others, so far as work
participation rate is concerned. The
block is followed by Gopalpur and
Dharampur with overall work
participation rate of 48.62 per cent and
49.08 per cent respectively. The highest
work participation rate was observed to
be in Sadar block followed by Seraj block and Chachyot block respectively. The work
participation rate for male is generally higher, though not distinctly higher in all the blocks
except Darang, Chauntra and Dharampur, where female work participation is higher than that of
males. At overall level, in rural areas the male workers’ work participation rate works out to
55.51 per cent and that of female 51.46 per cent as per the 2001 population census. Work
participation rate in urban area remain relatively less as compared to rural area.
Table 4.9: Block-wise work participation rate according to Census 2001.
Work participation rate (Per cent) Blocks
Male Female Total
Sadar 68.87 55.29 62.17
Balh 33.53 32.38 32.96
Drang 51.65 52.11 51.88
Chauntra 46.84 51.41 49.28
Gopalpur 48.85 48.40 48.62
Dharmpur 45.76 52.06 49.08
Chachyot 56.67 55.39 56..03
Seraj 58.57 56.24 57.42
Sunder Nagar 55.37 50.49 52.97
Karsog 58.56 53.53 56.06
Total Blocks 55.51 51.46 54.06
Urban Area 49.36 16.57 33.89
District Mandi 52.64 48.19 50.40
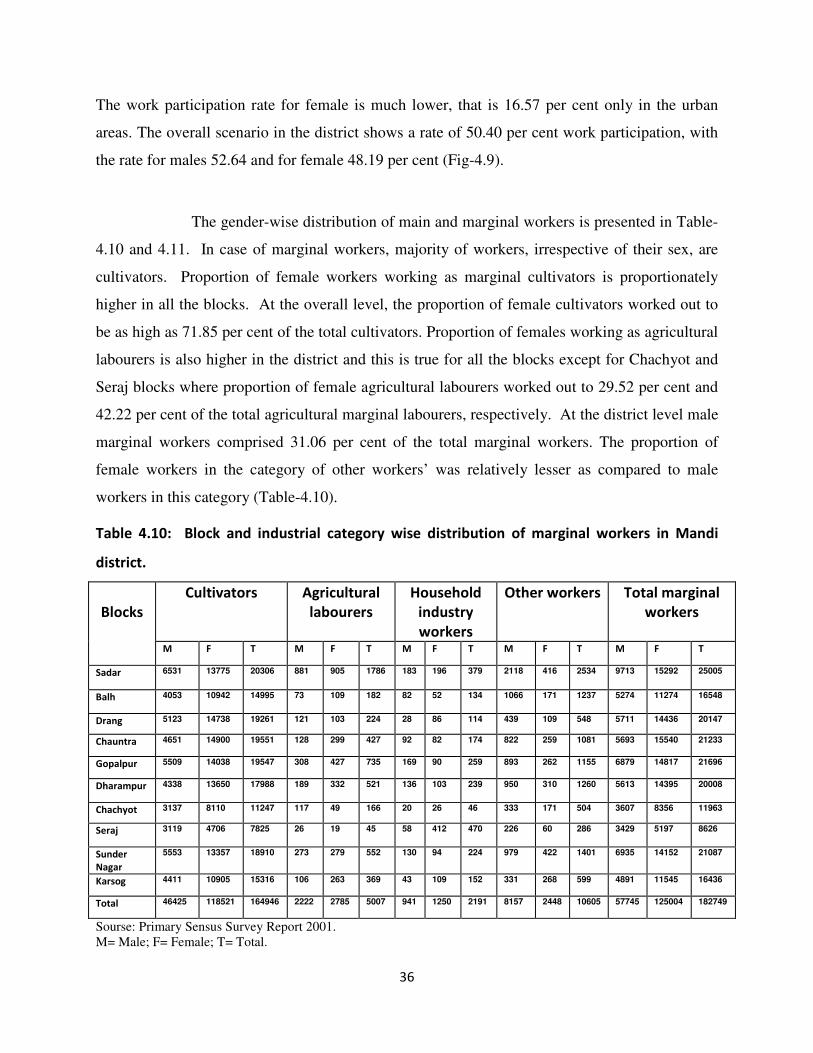
36
The work participation rate for female is much lower, that is 16.57 per cent only in the urban
areas. The overall scenario in the district shows a rate of 50.40 per cent work participation, with
the rate for males 52.64 and for female 48.19 per cent (Fig-4.9).
The gender-wise distribution of main and marginal workers is presented in Table-
4.10 and 4.11. In case of marginal workers, majority of workers, irrespective of their sex, are
cultivators. Proportion of female workers working as marginal cultivators is proportionately
higher in all the blocks. At the overall level, the proportion of female cultivators worked out to
be as high as 71.85 per cent of the total cultivators. Proportion of females working as agricultural
labourers is also higher in the district and this is true for all the blocks except for Chachyot and
Seraj blocks where proportion of female agricultural labourers worked out to 29.52 per cent and
42.22 per cent of the total agricultural marginal labourers, respectively. At the district level male
marginal workers comprised 31.06 per cent of the total marginal workers. The proportion of
female workers in the category of other workers’ was relatively lesser as compared to male
workers in this category (Table-4.10).
Table 4.10: Block and industrial category wise distribution of marginal workers in Mandi
district.
Cultivators Agricultural
labourers
Household
industry
workers
Other workers Total marginal
workers
Blocks
M F T M F T M F T M F T M F T
Sadar 6531 13775 20306 881 905 1786 183 196 379 2118 416 2534 9713 15292 25005
Balh 4053 10942 14995 73 109 182 82 52 134 1066 171 1237 5274 11274 16548
Drang 5123 14738 19261 121 103 224 28 86 114 439 109 548 5711 14436 20147
Chauntra 4651 14900 19551 128 299 427 92 82 174 822 259 1081 5693 15540 21233
Gopalpur 5509 14038 19547 308 427 735 169 90 259 893 262 1155 6879 14817 21696
Dharampur 4338 13650 17988 189 332 521 136 103 239 950 310 1260 5613 14395 20008
Chachyot 3137 8110 11247 117 49 166 20 26 46 333 171 504 3607 8356 11963
Seraj 3119 4706 7825 26 19 45 58 412 470 226 60 286 3429 5197 8626
Sunder
Nagar
5553 13357 18910 273 279 552 130 94 224 979 422 1401 6935 14152 21087
Karsog 4411 10905 15316 106 263 369 43 109 152 331 268 599 4891 11545 16436
Total 46425 118521 164946 2222 2785 5007 941 1250 2191 8157 2448 10605 57745 125004 182749
Sourse: Primary Sensus Survey Report 2001. M= Male; F= Female; T= Total.
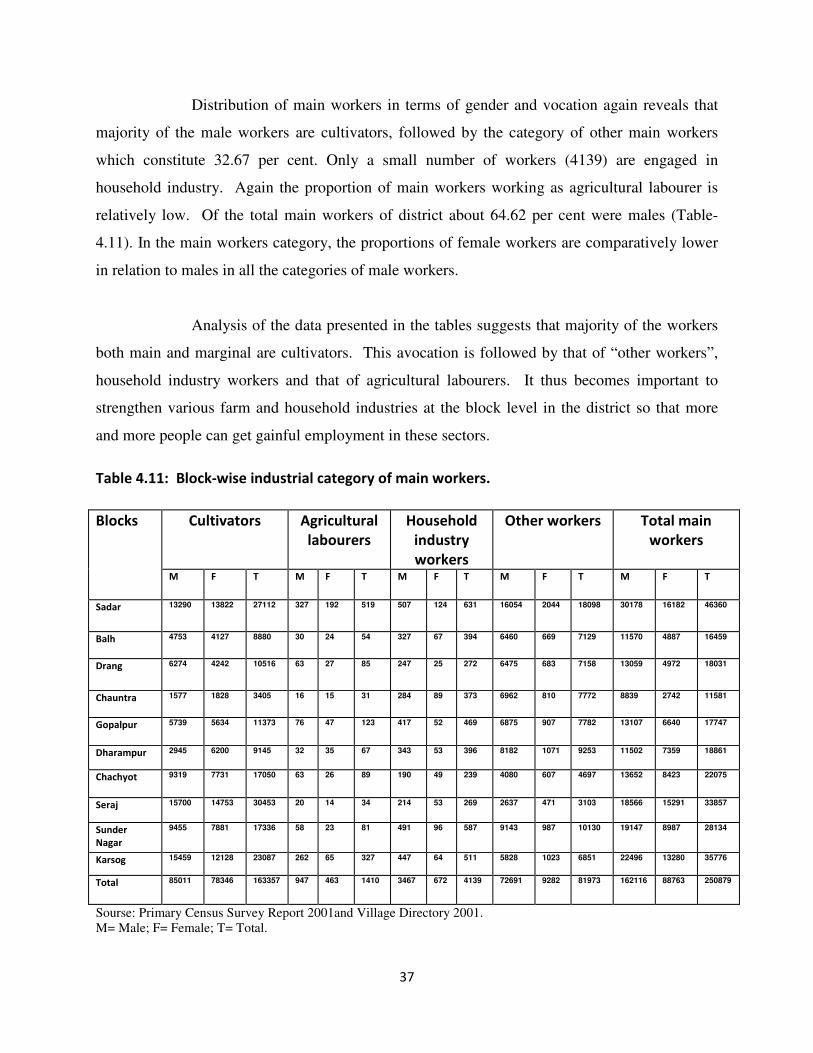
37
Distribution of main workers in terms of gender and vocation again reveals that
majority of the male workers are cultivators, followed by the category of other main workers
which constitute 32.67 per cent. Only a small number of workers (4139) are engaged in
household industry. Again the proportion of main workers working as agricultural labourer is
relatively low. Of the total main workers of district about 64.62 per cent were males (Table-
4.11). In the main workers category, the proportions of female workers are comparatively lower
in relation to males in all the categories of male workers.
Analysis of the data presented in the tables suggests that majority of the workers
both main and marginal are cultivators. This avocation is followed by that of “other workers”,
household industry workers and that of agricultural labourers. It thus becomes important to
strengthen various farm and household industries at the block level in the district so that more
and more people can get gainful employment in these sectors.
Table 4.11: Block-wise industrial category of main workers.
Cultivators Agricultural
labourers
Household
industry
workers
Other workers Total main
workers
Blocks
M F T M F T M F T M F T M F T
Sadar 13290 13822 27112 327 192 519 507 124 631 16054 2044 18098 30178 16182 46360
Balh 4753 4127 8880 30 24 54 327 67 394 6460 669 7129 11570 4887 16459
Drang 6274 4242 10516 63 27 85 247 25 272 6475 683 7158 13059 4972 18031
Chauntra 1577 1828 3405 16 15 31 284 89 373 6962 810 7772 8839 2742 11581
Gopalpur 5739 5634 11373 76 47 123 417 52 469 6875 907 7782 13107 6640 17747
Dharampur 2945 6200 9145 32 35 67 343 53 396 8182 1071 9253 11502 7359 18861
Chachyot 9319 7731 17050 63 26 89 190 49 239 4080 607 4697 13652 8423 22075
Seraj 15700 14753 30453 20 14 34 214 53 269 2637 471 3103 18566 15291 33857
Sunder
Nagar
9455 7881 17336 58 23 81 491 96 587 9143 987 10130 19147 8987 28134
Karsog 15459 12128 23087 262 65 327 447 64 511 5828 1023 6851 22496 13280 35776
Total 85011 78346 163357 947 463 1410 3467 672 4139 72691 9282 81973 162116 88763 250879
Sourse: Primary Census Survey Report 2001and Village Directory 2001. M= Male; F= Female; T= Total.
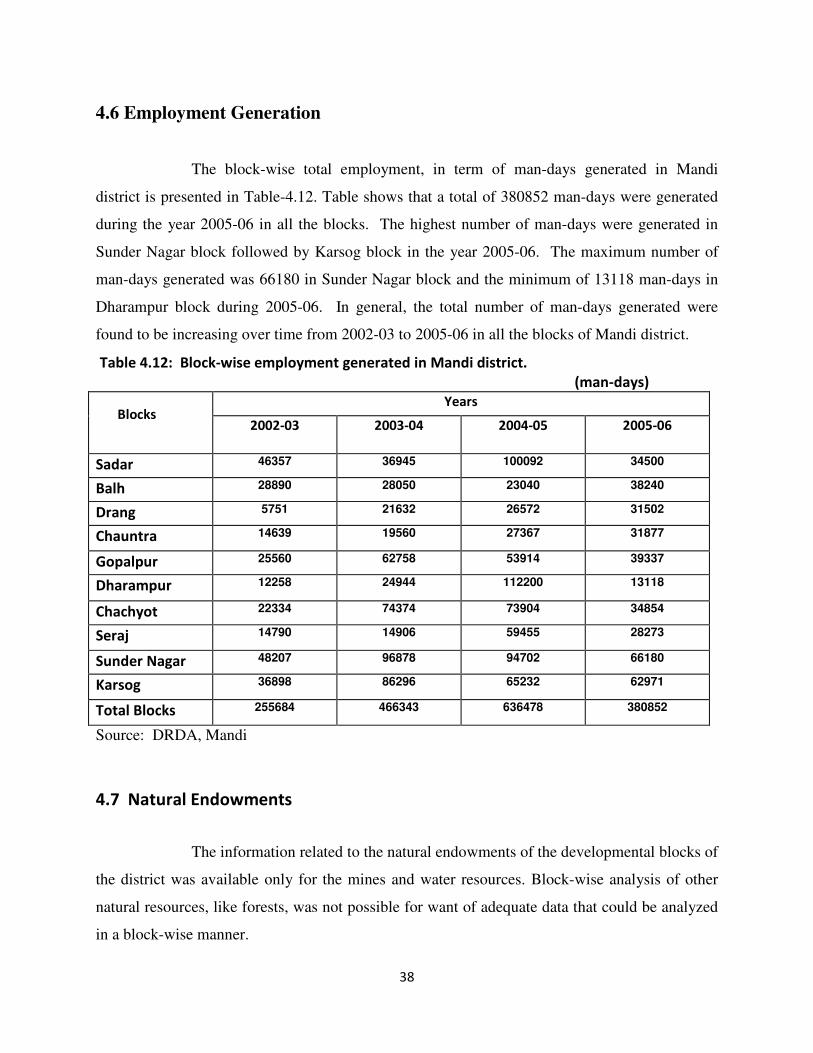
38
4.6 Employment Generation The block-wise total employment, in term of man-days generated in Mandi
district is presented in Table-4.12. Table shows that a total of 380852 man-days were generated
during the year 2005-06 in all the blocks. The highest number of man-days were generated in
Sunder Nagar block followed by Karsog block in the year 2005-06. The maximum number of
man-days generated was 66180 in Sunder Nagar block and the minimum of 13118 man-days in
Dharampur block during 2005-06. In general, the total number of man-days generated were
found to be increasing over time from 2002-03 to 2005-06 in all the blocks of Mandi district.
Table 4.12: Block-wise employment generated in Mandi district.
(man-days)
Years
Blocks 2002-03 2003-04 2004-05 2005-06
Sadar 46357 36945 100092 34500
Balh 28890 28050 23040 38240
Drang 5751 21632 26572 31502
Chauntra 14639 19560 27367 31877
Gopalpur 25560 62758 53914 39337
Dharampur 12258 24944 112200 13118
Chachyot 22334 74374 73904 34854
Seraj 14790 14906 59455 28273
Sunder Nagar 48207 96878 94702 66180
Karsog 36898 86296 65232 62971
Total Blocks 255684 466343 636478 380852
Source: DRDA, Mandi
4.7 Natural Endowments
The information related to the natural endowments of the developmental blocks of
the district was available only for the mines and water resources. Block-wise analysis of other
natural resources, like forests, was not possible for want of adequate data that could be analyzed
in a block-wise manner.
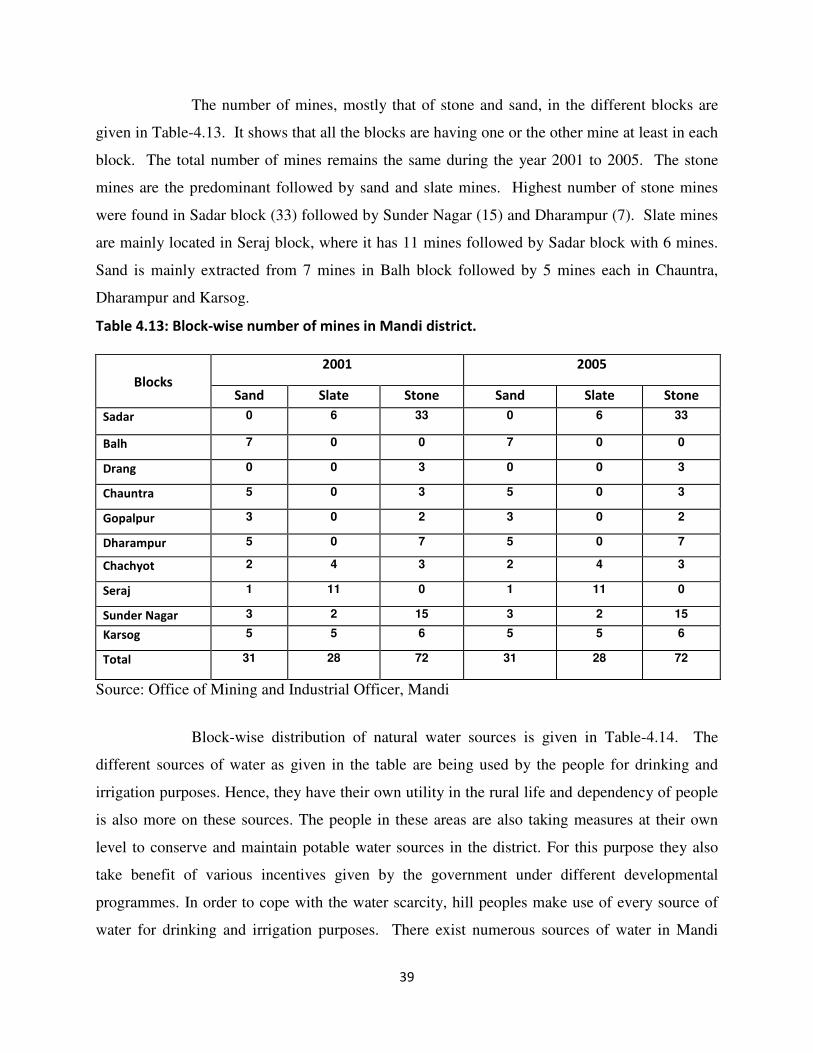
39
The number of mines, mostly that of stone and sand, in the different blocks are
given in Table-4.13. It shows that all the blocks are having one or the other mine at least in each
block. The total number of mines remains the same during the year 2001 to 2005. The stone
mines are the predominant followed by sand and slate mines. Highest number of stone mines
were found in Sadar block (33) followed by Sunder Nagar (15) and Dharampur (7). Slate mines
are mainly located in Seraj block, where it has 11 mines followed by Sadar block with 6 mines.
Sand is mainly extracted from 7 mines in Balh block followed by 5 mines each in Chauntra,
Dharampur and Karsog.
Table 4.13: Block-wise number of mines in Mandi district.
2001 2005
Blocks Sand Slate Stone Sand Slate Stone
Sadar 0 6 33 0 6 33
Balh 7 0 0 7 0 0
Drang 0 0 3 0 0 3
Chauntra 5 0 3 5 0 3
Gopalpur 3 0 2 3 0 2
Dharampur 5 0 7 5 0 7
Chachyot 2 4 3 2 4 3
Seraj 1 11 0 1 11 0
Sunder Nagar 3 2 15 3 2 15
Karsog 5 5 6 5 5 6
Total 31 28 72 31 28 72
Source: Office of Mining and Industrial Officer, Mandi
Block-wise distribution of natural water sources is given in Table-4.14. The
different sources of water as given in the table are being used by the people for drinking and
irrigation purposes. Hence, they have their own utility in the rural life and dependency of people
is also more on these sources. The people in these areas are also taking measures at their own
level to conserve and maintain potable water sources in the district. For this purpose they also
take benefit of various incentives given by the government under different developmental
programmes. In order to cope with the water scarcity, hill peoples make use of every source of
water for drinking and irrigation purposes. There exist numerous sources of water in Mandi
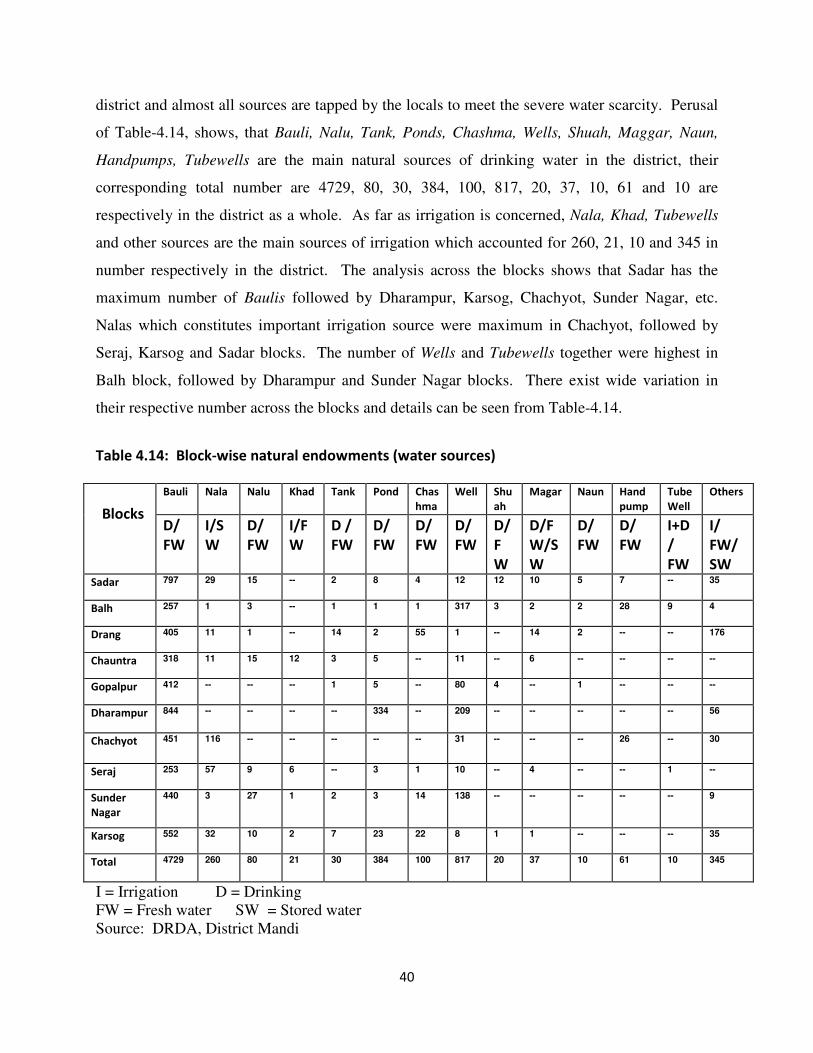
40
district and almost all sources are tapped by the locals to meet the severe water scarcity. Perusal
of Table-4.14, shows, that Bauli, Nalu, Tank, Ponds, Chashma, Wells, Shuah, Maggar, Naun,
Handpumps, Tubewells are the main natural sources of drinking water in the district, their
corresponding total number are 4729, 80, 30, 384, 100, 817, 20, 37, 10, 61 and 10 are
respectively in the district as a whole. As far as irrigation is concerned, Nala, Khad, Tubewells
and other sources are the main sources of irrigation which accounted for 260, 21, 10 and 345 in
number respectively in the district. The analysis across the blocks shows that Sadar has the
maximum number of Baulis followed by Dharampur, Karsog, Chachyot, Sunder Nagar, etc.
Nalas which constitutes important irrigation source were maximum in Chachyot, followed by
Seraj, Karsog and Sadar blocks. The number of Wells and Tubewells together were highest in
Balh block, followed by Dharampur and Sunder Nagar blocks. There exist wide variation in
their respective number across the blocks and details can be seen from Table-4.14.
Table 4.14: Block-wise natural endowments (water sources)
Bauli Nala Nalu Khad Tank Pond Chas
hma
Well Shu
ah
Magar Naun Hand
pump
Tube
Well
Others
Blocks D/
FW
I/S
W
D/
FW
I/F
W
D /
FW
D/
FW
D/
FW
D/
FW
D/
F
W
D/F
W/S
W
D/
FW
D/
FW
I+D
/
FW
I/
FW/
SW Sadar 797 29 15 -- 2 8 4 12 12 10 5 7 -- 35
Balh 257 1 3 -- 1 1 1 317 3 2 2 28 9 4
Drang 405 11 1 -- 14 2 55 1 -- 14 2 -- -- 176
Chauntra 318 11 15 12 3 5 -- 11 -- 6 -- -- -- --
Gopalpur 412 -- -- -- 1 5 -- 80 4 -- 1 -- -- --
Dharampur 844 -- -- -- -- 334 -- 209 -- -- -- -- -- 56
Chachyot 451 116 -- -- -- -- -- 31 -- -- -- 26 -- 30
Seraj 253 57 9 6 -- 3 1 10 -- 4 -- -- 1 --
Sunder
Nagar
440 3 27 1 2 3 14 138 -- -- -- -- -- 9
Karsog 552 32 10 2 7 23 22 8 1 1 -- -- -- 35
Total 4729 260 80 21 30 384 100 817 20 37 10 61 10 345
I = Irrigation D = Drinking FW = Fresh water SW = Stored water Source: DRDA, District Mandi
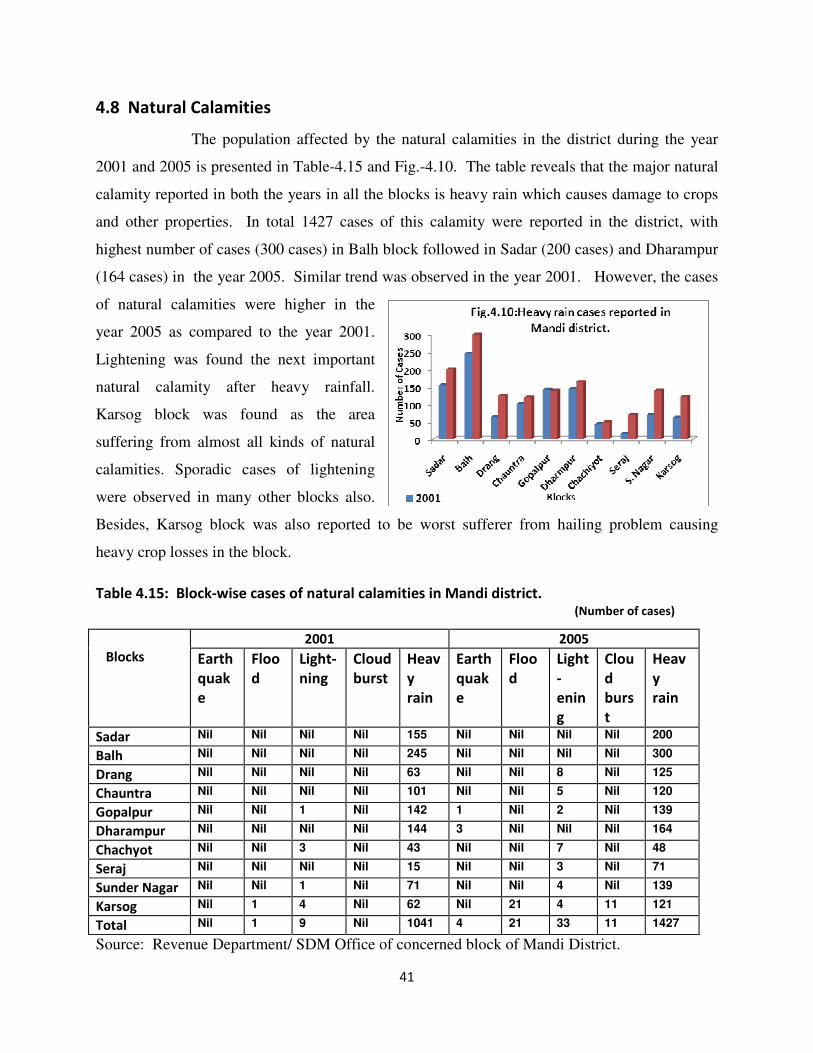
41
4.8 Natural Calamities
The population affected by the natural calamities in the district during the year
2001 and 2005 is presented in Table-4.15 and Fig.-4.10. The table reveals that the major natural
calamity reported in both the years in all the blocks is heavy rain which causes damage to crops
and other properties. In total 1427 cases of this calamity were reported in the district, with
highest number of cases (300 cases) in Balh block followed in Sadar (200 cases) and Dharampur
(164 cases) in the year 2005. Similar trend was observed in the year 2001. However, the cases
of natural calamities were higher in the
year 2005 as compared to the year 2001.
Lightening was found the next important
natural calamity after heavy rainfall.
Karsog block was found as the area
suffering from almost all kinds of natural
calamities. Sporadic cases of lightening
were observed in many other blocks also.
Besides, Karsog block was also reported to be worst sufferer from hailing problem causing
heavy crop losses in the block.
Table 4.15: Block-wise cases of natural calamities in Mandi district.
(Number of cases)
Source: Revenue Department/ SDM Office of concerned block of Mandi District.
2001 2005
Blocks
Earth
quak
e
Floo
d
Light-
ning
Cloud
burst
Heav
y
rain
Earth
quak
e
Floo
d
Light
-
enin
g
Clou
d
burs
t
Heav
y
rain
Sadar Nil Nil Nil Nil 155 Nil Nil Nil Nil 200
Balh Nil Nil Nil Nil 245 Nil Nil Nil Nil 300
Drang Nil Nil Nil Nil 63 Nil Nil 8 Nil 125
Chauntra Nil Nil Nil Nil 101 Nil Nil 5 Nil 120
Gopalpur Nil Nil 1 Nil 142 1 Nil 2 Nil 139
Dharampur Nil Nil Nil Nil 144 3 Nil Nil Nil 164
Chachyot Nil Nil 3 Nil 43 Nil Nil 7 Nil 48
Seraj Nil Nil Nil Nil 15 Nil Nil 3 Nil 71
Sunder Nagar Nil Nil 1 Nil 71 Nil Nil 4 Nil 139
Karsog Nil 1 4 Nil 62 Nil 21 4 11 121
Total Nil 1 9 Nil 1041 4 21 33 11 1427
42
4.9 Infrastructure Development
Infrastructure development is considered the basis for all the development
activities that lead to the better living, higher growth both economic as well as social.
4.9.1 Block-wise number of villages, panchayat, wards etc.
As per 2001 population census, there are 3338 villages in 10 blocks of the district.
Karsog block has highest number of villages (599) followed by Seraj (388), Sadar (365),
Chachyot (334) and Darang (320). The details related to the number of Panchayats and Wards
existing in the district are presented in Table 4.16. There are 473 panchayats and 2877 wards in
the district, with a total population of 8,40,362. The Sadar block has the highest number of
panchayats (61), followed by Karsog block (60), Balh (51), Sunder Nagar and Dharampur (49
each).
Table 4.16: Block-wise panchayat, wards and villages in Mandi district (2001).
4.9.2 Road network
Road network is a crucial ingredient of any developmental strategy. This is
particularly so for the hilly areas which are geographically difficult and connectivity of
population is difficult without road and communication network. The importance of road
network in the development of hilly regions is well reflected in the often quoted statement of Dr
YS Parmar, the first Chief Minister of Himachal Pradesh who termed roads as the lifeline of hill
economy. The importance of roads and related transport and communication network is amply
reflected in the pace of development of the state today.
Blocks
No. of
panchayat
No. of wards No. of villages
Sadar 61 379 365
Balh 51 327 193
Drang 40 246 320
Chauntra 40 238 278
Gopalpur 41 279 307
Dharampur 49 287 264
Chachyot 37 209 334
Seraj 45 265 388
Sunder Nagar 49 303 290
Karsog 60 344 599
Total Blocks 473 2877 3338
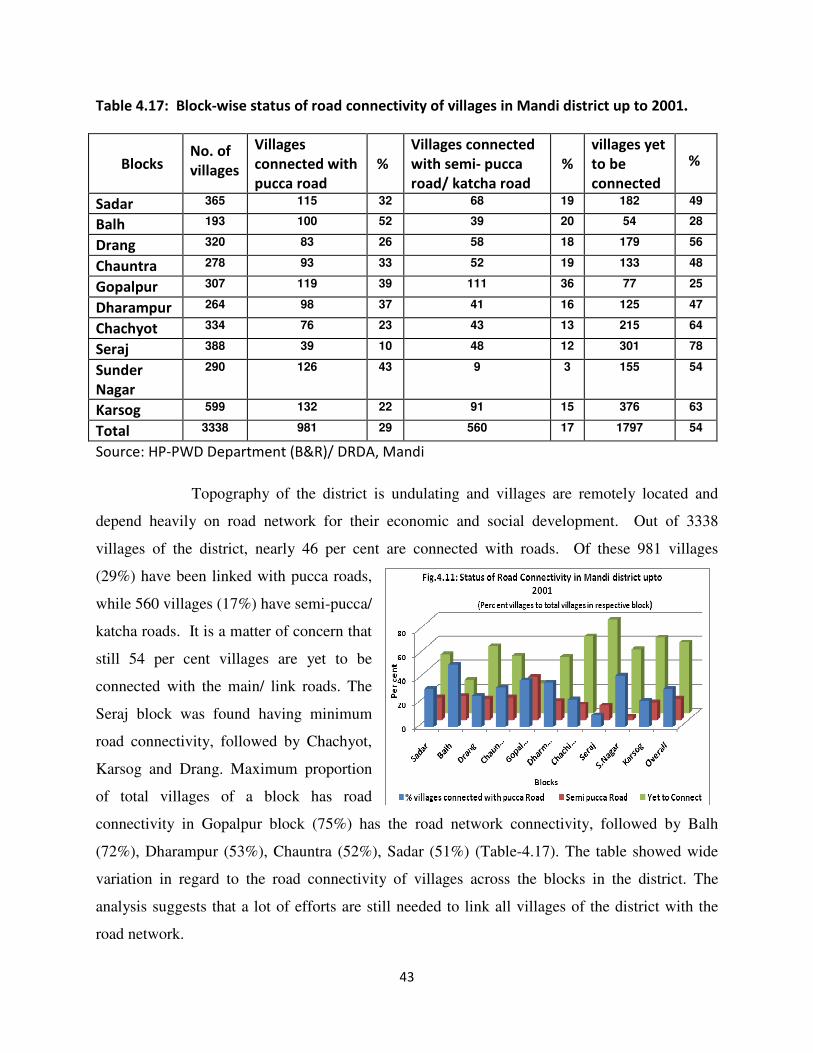
43
Table 4.17: Block-wise status of road connectivity of villages in Mandi district up to 2001.
Blocks
No. of
villages
Villages
connected with
pucca road
%
Villages connected
with semi- pucca
road/ katcha road
%
villages yet
to be
connected
%
Sadar 365 115 32 68 19 182 49
Balh 193 100 52 39 20 54 28
Drang 320 83 26 58 18 179 56
Chauntra 278 93 33 52 19 133 48
Gopalpur 307 119 39 111 36 77 25
Dharampur 264 98 37 41 16 125 47
Chachyot 334 76 23 43 13 215 64
Seraj 388 39 10 48 12 301 78
Sunder
Nagar
290 126 43 9 3 155 54
Karsog 599 132 22 91 15 376 63
Total 3338 981 29 560 17 1797 54
Source: HP-PWD Department (B&R)/ DRDA, Mandi
Topography of the district is undulating and villages are remotely located and
depend heavily on road network for their economic and social development. Out of 3338
villages of the district, nearly 46 per cent are connected with roads. Of these 981 villages
(29%) have been linked with pucca roads,
while 560 villages (17%) have semi-pucca/
katcha roads. It is a matter of concern that
still 54 per cent villages are yet to be
connected with the main/ link roads. The
Seraj block was found having minimum
road connectivity, followed by Chachyot,
Karsog and Drang. Maximum proportion
of total villages of a block has road
connectivity in Gopalpur block (75%) has the road network connectivity, followed by Balh
(72%), Dharampur (53%), Chauntra (52%), Sadar (51%) (Table-4.17). The table showed wide
variation in regard to the road connectivity of villages across the blocks in the district. The
analysis suggests that a lot of efforts are still needed to link all villages of the district with the
road network.
44
Table 4.18: Block-wise distance of different facilities from block headquarters in Mandi
District (2005).
Nearest Facility
Blocks
Nearest
town
Railway
station
Bus
stand
Police
station
Nearest Agril.
marketing centre
(kms)
Sadar 1 51 1 1 1
Balh 15 71 1 0.5 8
Drang 28 28 0 27 50
Chauntra 10 0 1 10 90
Gopalpur -- 63 0 0 55
Dharampur 22 42 0 23 66
Chachyot 35 95 1 0 30
Seraj 85 137 1 1 65
Sunder Nagar 0 73 1 1 2
Karsog* 108 108 2 1 108
* Nearest town Shimla. Source: Concerned B.D.O. Offices in the district.
Table-4.18 presents the distance of important facilities from the block
headquarter. The physical distance, coupled with the lack of road and communication net-work
influences the pace of development. While the shorter distances and hence the frequent visits to
the facilities, are expected to promote initiatives, both from the side of local people and
development agencies, the longer distances are expected to hinder this process. Shortening of the
physical distances is possible through opening up of new facilities or through the net-work of
link roads etc. In general, this does not seem have happened in the district, in respect of the
facilities considered, particularly that of Agricultural marketing centre and the railway station.
4.9.3 Infrastructural facilities in primary and middle Schools
Infrastructure is an important indicator of level of development and the potential
for future growth in a particular area. The quality of schools largely depends upon the type of
infrastructure available. The information with regard to distance between villages and primary
schools, the number of primary and middle schools having common toilets, girls toilet,
electricity, boundary walls, book bank, playgrounds, drinking water, medical check up facilities,
computers, black boards in the schools for the year 2005, has been presented in Table-4.19 and
Table-4.20.
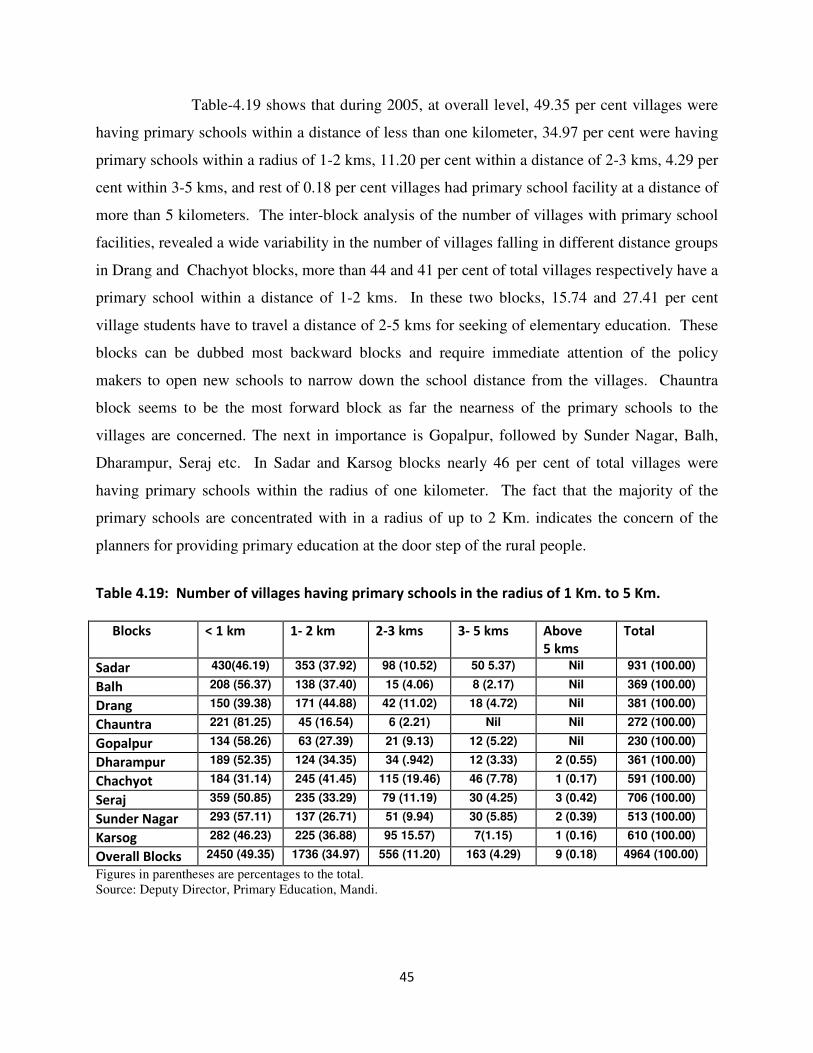
45
Table-4.19 shows that during 2005, at overall level, 49.35 per cent villages were
having primary schools within a distance of less than one kilometer, 34.97 per cent were having
primary schools within a radius of 1-2 kms, 11.20 per cent within a distance of 2-3 kms, 4.29 per
cent within 3-5 kms, and rest of 0.18 per cent villages had primary school facility at a distance of
more than 5 kilometers. The inter-block analysis of the number of villages with primary school
facilities, revealed a wide variability in the number of villages falling in different distance groups
in Drang and Chachyot blocks, more than 44 and 41 per cent of total villages respectively have a
primary school within a distance of 1-2 kms. In these two blocks, 15.74 and 27.41 per cent
village students have to travel a distance of 2-5 kms for seeking of elementary education. These
blocks can be dubbed most backward blocks and require immediate attention of the policy
makers to open new schools to narrow down the school distance from the villages. Chauntra
block seems to be the most forward block as far the nearness of the primary schools to the
villages are concerned. The next in importance is Gopalpur, followed by Sunder Nagar, Balh,
Dharampur, Seraj etc. In Sadar and Karsog blocks nearly 46 per cent of total villages were
having primary schools within the radius of one kilometer. The fact that the majority of the
primary schools are concentrated with in a radius of up to 2 Km. indicates the concern of the
planners for providing primary education at the door step of the rural people.
Table 4.19: Number of villages having primary schools in the radius of 1 Km. to 5 Km.
Blocks
< 1 km 1- 2 km 2-3 kms 3- 5 kms Above
5 kms
Total
Sadar 430(46.19) 353 (37.92) 98 (10.52) 50 5.37) Nil 931 (100.00)
Balh 208 (56.37) 138 (37.40) 15 (4.06) 8 (2.17) Nil 369 (100.00)
Drang 150 (39.38) 171 (44.88) 42 (11.02) 18 (4.72) Nil 381 (100.00)
Chauntra 221 (81.25) 45 (16.54) 6 (2.21) Nil Nil 272 (100.00)
Gopalpur 134 (58.26) 63 (27.39) 21 (9.13) 12 (5.22) Nil 230 (100.00)
Dharampur 189 (52.35) 124 (34.35) 34 (.942) 12 (3.33) 2 (0.55) 361 (100.00)
Chachyot 184 (31.14) 245 (41.45) 115 (19.46) 46 (7.78) 1 (0.17) 591 (100.00)
Seraj 359 (50.85) 235 (33.29) 79 (11.19) 30 (4.25) 3 (0.42) 706 (100.00)
Sunder Nagar 293 (57.11) 137 (26.71) 51 (9.94) 30 (5.85) 2 (0.39) 513 (100.00)
Karsog 282 (46.23) 225 (36.88) 95 15.57) 7(1.15) 1 (0.16) 610 (100.00)
Overall Blocks 2450 (49.35) 1736 (34.97) 556 (11.20) 163 (4.29) 9 (0.18) 4964 (100.00)
Figures in parentheses are percentages to the total. Source: Deputy Director, Primary Education, Mandi.
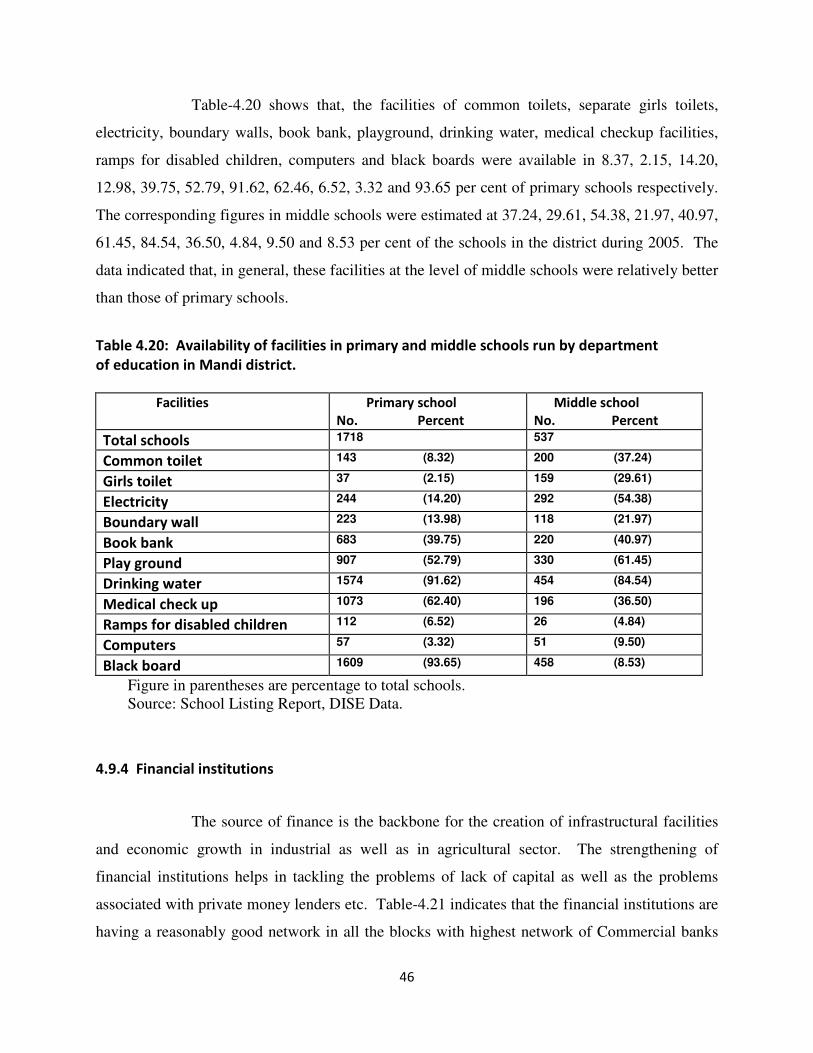
46
Table-4.20 shows that, the facilities of common toilets, separate girls toilets,
electricity, boundary walls, book bank, playground, drinking water, medical checkup facilities,
ramps for disabled children, computers and black boards were available in 8.37, 2.15, 14.20,
12.98, 39.75, 52.79, 91.62, 62.46, 6.52, 3.32 and 93.65 per cent of primary schools respectively.
The corresponding figures in middle schools were estimated at 37.24, 29.61, 54.38, 21.97, 40.97,
61.45, 84.54, 36.50, 4.84, 9.50 and 8.53 per cent of the schools in the district during 2005. The
data indicated that, in general, these facilities at the level of middle schools were relatively better
than those of primary schools.
Table 4.20: Availability of facilities in primary and middle schools run by department
of education in Mandi district.
Facilities Primary school
No. Percent
Middle school
No. Percent
Total schools 1718 537
Common toilet 143 (8.32) 200 (37.24)
Girls toilet 37 (2.15) 159 (29.61)
Electricity 244 (14.20) 292 (54.38)
Boundary wall 223 (13.98) 118 (21.97)
Book bank 683 (39.75) 220 (40.97)
Play ground 907 (52.79) 330 (61.45)
Drinking water 1574 (91.62) 454 (84.54)
Medical check up 1073 (62.40) 196 (36.50)
Ramps for disabled children 112 (6.52) 26 (4.84)
Computers 57 (3.32) 51 (9.50)
Black board 1609 (93.65) 458 (8.53)
Figure in parentheses are percentage to total schools. Source: School Listing Report, DISE Data.
4.9.4 Financial institutions
The source of finance is the backbone for the creation of infrastructural facilities
and economic growth in industrial as well as in agricultural sector. The strengthening of
financial institutions helps in tackling the problems of lack of capital as well as the problems
associated with private money lenders etc. Table-4.21 indicates that the financial institutions are
having a reasonably good network in all the blocks with highest network of Commercial banks
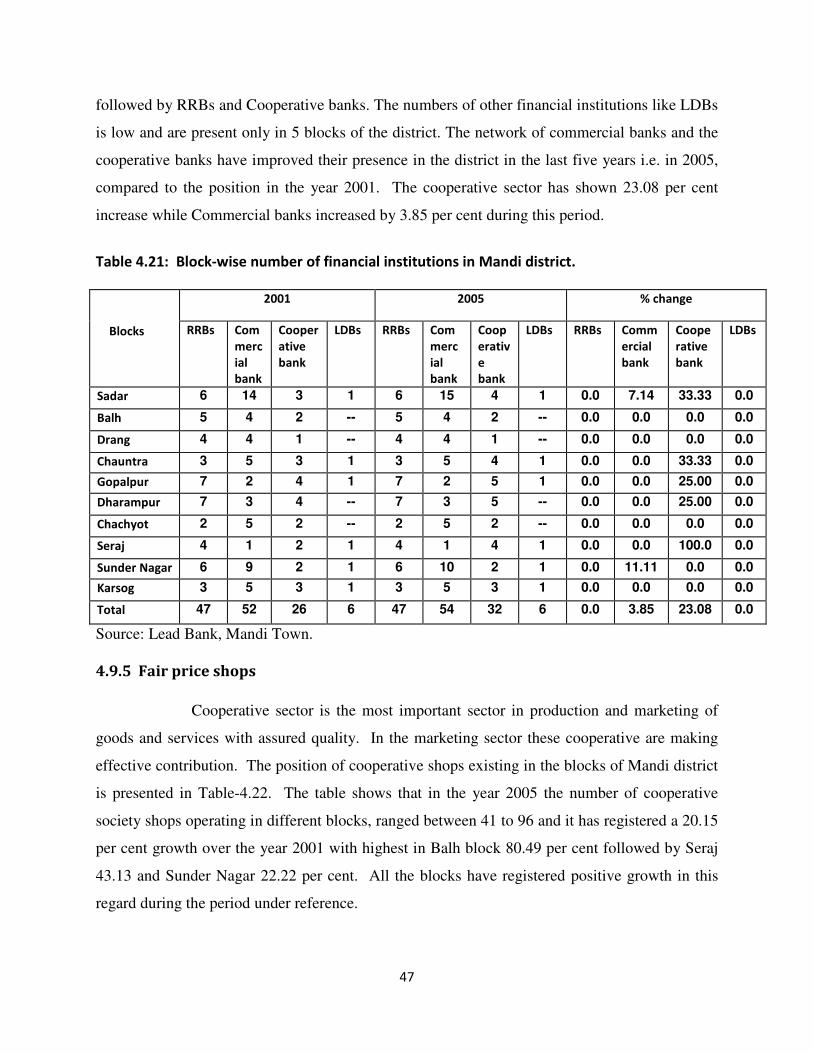
47
followed by RRBs and Cooperative banks. The numbers of other financial institutions like LDBs
is low and are present only in 5 blocks of the district. The network of commercial banks and the
cooperative banks have improved their presence in the district in the last five years i.e. in 2005,
compared to the position in the year 2001. The cooperative sector has shown 23.08 per cent
increase while Commercial banks increased by 3.85 per cent during this period.
Table 4.21: Block-wise number of financial institutions in Mandi district.
2001 2005 % change
Blocks
RRBs Com
merc
ial
bank
Cooper
ative
bank
LDBs RRBs Com
merc
ial
bank
Coop
erativ
e
bank
LDBs RRBs Comm
ercial
bank
Coope
rative
bank
LDBs
Sadar 6 14 3 1 6 15 4 1 0.0 7.14 33.33 0.0
Balh 5 4 2 -- 5 4 2 -- 0.0 0.0 0.0 0.0
Drang 4 4 1 -- 4 4 1 -- 0.0 0.0 0.0 0.0
Chauntra 3 5 3 1 3 5 4 1 0.0 0.0 33.33 0.0
Gopalpur 7 2 4 1 7 2 5 1 0.0 0.0 25.00 0.0
Dharampur 7 3 4 -- 7 3 5 -- 0.0 0.0 25.00 0.0
Chachyot 2 5 2 -- 2 5 2 -- 0.0 0.0 0.0 0.0
Seraj 4 1 2 1 4 1 4 1 0.0 0.0 100.0 0.0
Sunder Nagar 6 9 2 1 6 10 2 1 0.0 11.11 0.0 0.0
Karsog 3 5 3 1 3 5 3 1 0.0 0.0 0.0 0.0
Total 47 52 26 6 47 54 32 6 0.0 3.85 23.08 0.0
Source: Lead Bank, Mandi Town.
4.9.5 Fair price shops
Cooperative sector is the most important sector in production and marketing of
goods and services with assured quality. In the marketing sector these cooperative are making
effective contribution. The position of cooperative shops existing in the blocks of Mandi district
is presented in Table-4.22. The table shows that in the year 2005 the number of cooperative
society shops operating in different blocks, ranged between 41 to 96 and it has registered a 20.15
per cent growth over the year 2001 with highest in Balh block 80.49 per cent followed by Seraj
43.13 and Sunder Nagar 22.22 per cent. All the blocks have registered positive growth in this
regard during the period under reference.
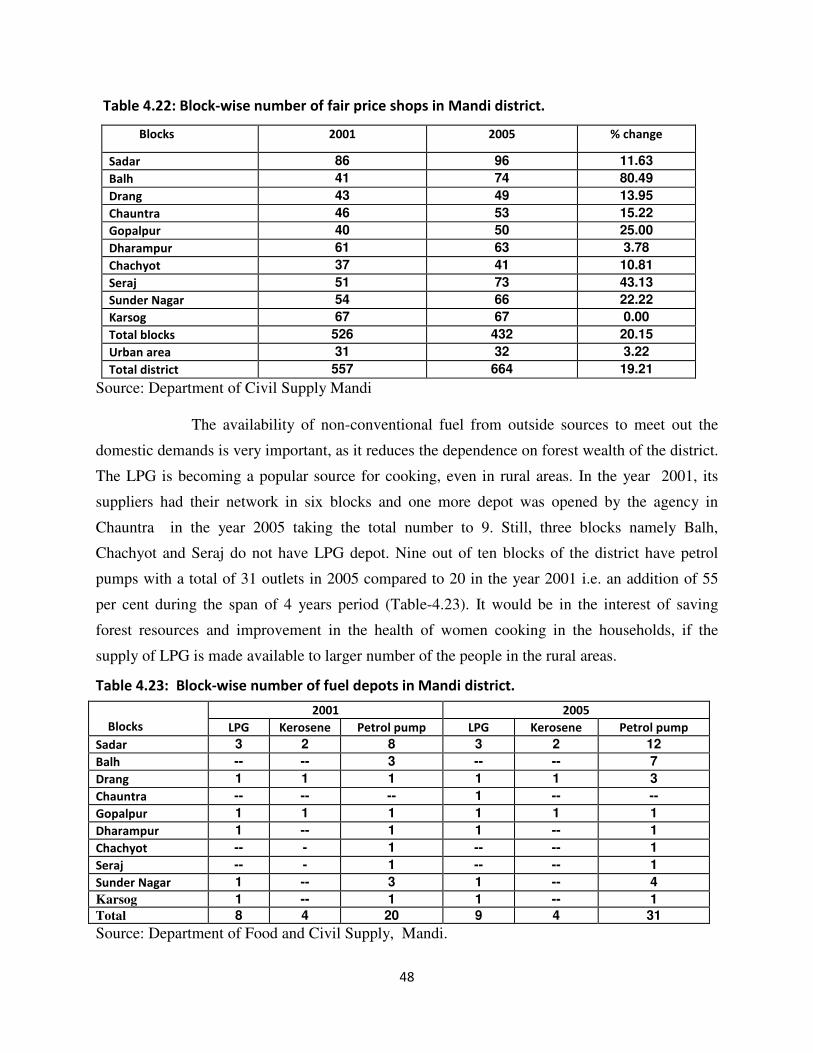
48
Table 4.22: Block-wise number of fair price shops in Mandi district.
Blocks 2001 2005 % change
Sadar 86 96 11.63
Balh 41 74 80.49
Drang 43 49 13.95
Chauntra 46 53 15.22
Gopalpur 40 50 25.00
Dharampur 61 63 3.78
Chachyot 37 41 10.81
Seraj 51 73 43.13
Sunder Nagar 54 66 22.22
Karsog 67 67 0.00
Total blocks 526 432 20.15
Urban area 31 32 3.22
Total district 557 664 19.21
Source: Department of Civil Supply Mandi The availability of non-conventional fuel from outside sources to meet out the
domestic demands is very important, as it reduces the dependence on forest wealth of the district.
The LPG is becoming a popular source for cooking, even in rural areas. In the year 2001, its
suppliers had their network in six blocks and one more depot was opened by the agency in
Chauntra in the year 2005 taking the total number to 9. Still, three blocks namely Balh,
Chachyot and Seraj do not have LPG depot. Nine out of ten blocks of the district have petrol
pumps with a total of 31 outlets in 2005 compared to 20 in the year 2001 i.e. an addition of 55
per cent during the span of 4 years period (Table-4.23). It would be in the interest of saving
forest resources and improvement in the health of women cooking in the households, if the
supply of LPG is made available to larger number of the people in the rural areas.
Table 4.23: Block-wise number of fuel depots in Mandi district.
2001 2005
Blocks LPG Kerosene Petrol pump LPG Kerosene Petrol pump
Sadar 3 2 8 3 2 12
Balh -- -- 3 -- -- 7
Drang 1 1 1 1 1 3
Chauntra -- -- -- 1 -- --
Gopalpur 1 1 1 1 1 1
Dharampur 1 -- 1 1 -- 1
Chachyot -- - 1 -- -- 1
Seraj -- - 1 -- -- 1
Sunder Nagar 1 -- 3 1 -- 4
Karsog 1 -- 1 1 -- 1
Total 8 4 20 9 4 31
Source: Department of Food and Civil Supply, Mandi.
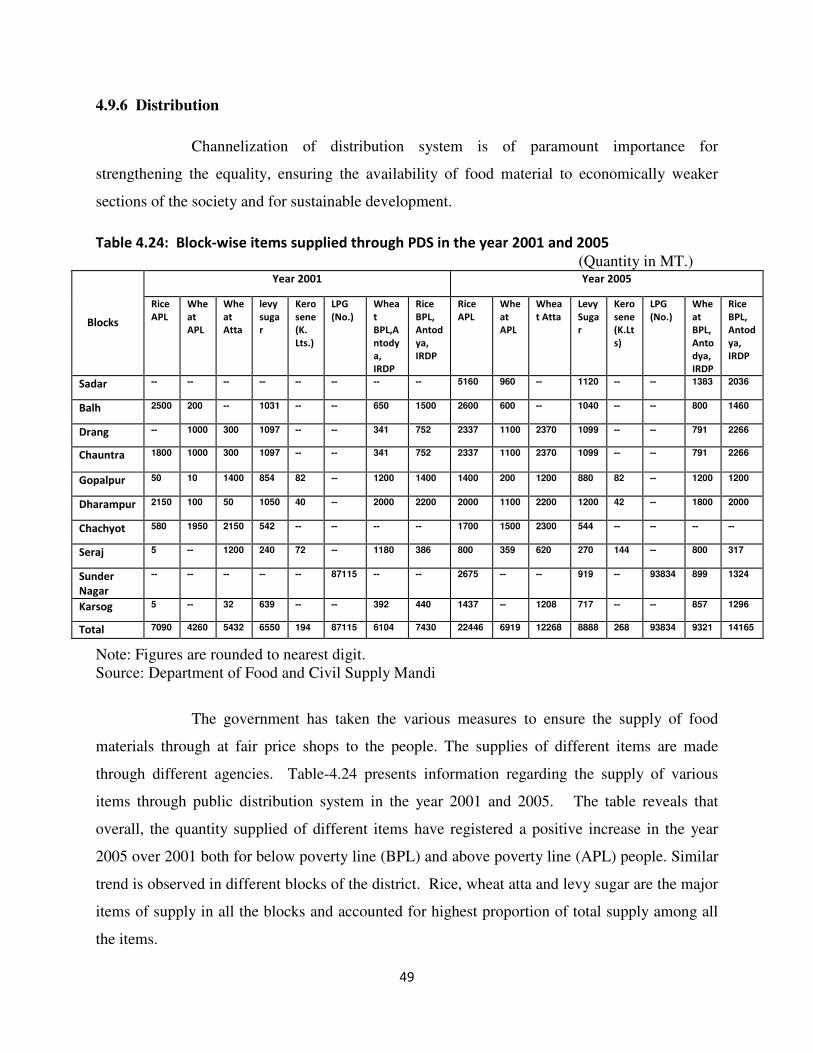
49
4.9.6 Distribution
Channelization of distribution system is of paramount importance for
strengthening the equality, ensuring the availability of food material to economically weaker
sections of the society and for sustainable development.
Table 4.24: Block-wise items supplied through PDS in the year 2001 and 2005
(Quantity in MT.) Year 2001 Year 2005
Blocks
Rice
APL
Whe
at
APL
Whe
at
Atta
levy
suga
r
Kero
sene
(K.
Lts.)
LPG
(No.)
Whea
t
BPL,A
ntody
a,
IRDP
Rice
BPL,
Antod
ya,
IRDP
Rice
APL
Whe
at
APL
Whea
t Atta
Levy
Suga
r
Kero
sene
(K.Lt
s)
LPG
(No.)
Whe
at
BPL,
Anto
dya,
IRDP
Rice
BPL,
Antod
ya,
IRDP
Sadar -- -- -- -- -- -- -- -- 5160 960 -- 1120 -- -- 1383 2036
Balh 2500 200 -- 1031 -- -- 650 1500 2600 600 -- 1040 -- -- 800 1460
Drang -- 1000 300 1097 -- -- 341 752 2337 1100 2370 1099 -- -- 791 2266
Chauntra 1800 1000 300 1097 -- -- 341 752 2337 1100 2370 1099 -- -- 791 2266
Gopalpur 50 10 1400 854 82 -- 1200 1400 1400 200 1200 880 82 -- 1200 1200
Dharampur 2150 100 50 1050 40 -- 2000 2200 2000 1100 2200 1200 42 -- 1800 2000
Chachyot 580 1950 2150 542 -- -- -- -- 1700 1500 2300 544 -- -- -- --
Seraj 5 -- 1200 240 72 -- 1180 386 800 359 620 270 144 -- 800 317
Sunder
Nagar
-- -- -- -- -- 87115 -- -- 2675 -- -- 919 -- 93834 899 1324
Karsog 5 -- 32 639 -- -- 392 440 1437 -- 1208 717 -- -- 857 1296
Total 7090 4260 5432 6550 194 87115 6104 7430 22446 6919 12268 8888 268 93834 9321 14165
Note: Figures are rounded to nearest digit. Source: Department of Food and Civil Supply Mandi
The government has taken the various measures to ensure the supply of food
materials through at fair price shops to the people. The supplies of different items are made
through different agencies. Table-4.24 presents information regarding the supply of various
items through public distribution system in the year 2001 and 2005. The table reveals that
overall, the quantity supplied of different items have registered a positive increase in the year
2005 over 2001 both for below poverty line (BPL) and above poverty line (APL) people. Similar
trend is observed in different blocks of the district. Rice, wheat atta and levy sugar are the major
items of supply in all the blocks and accounted for highest proportion of total supply among all
the items.
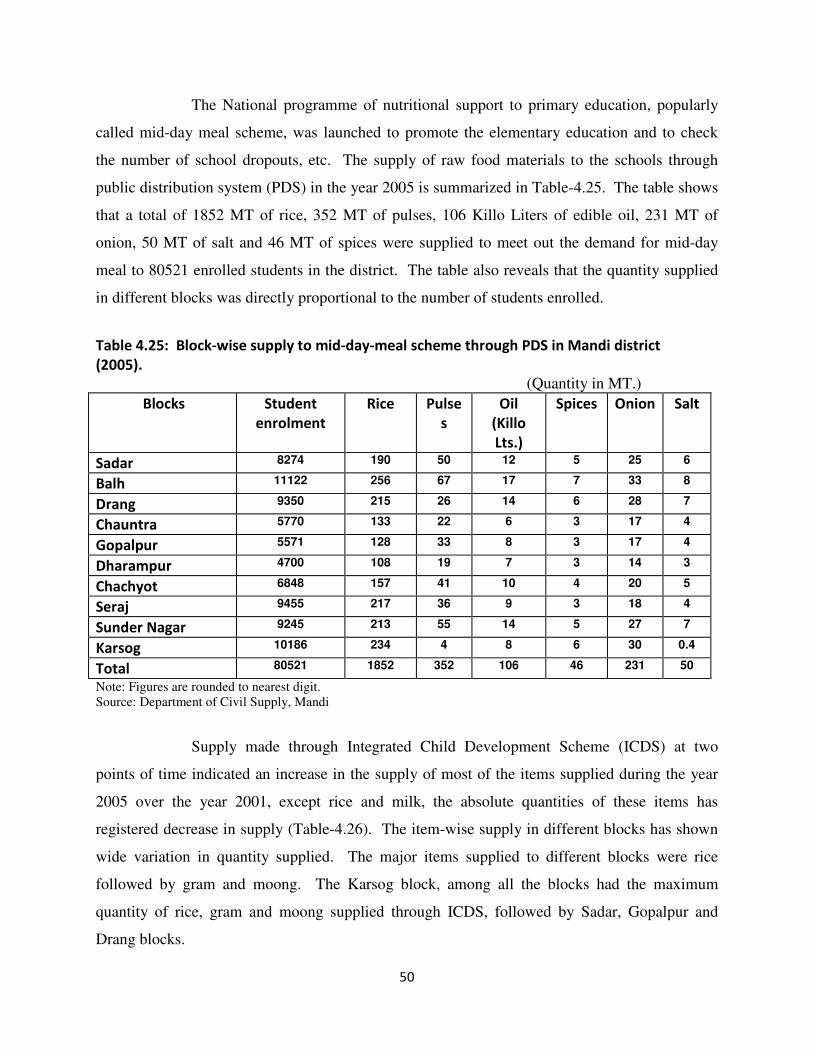
50
The National programme of nutritional support to primary education, popularly
called mid-day meal scheme, was launched to promote the elementary education and to check
the number of school dropouts, etc. The supply of raw food materials to the schools through
public distribution system (PDS) in the year 2005 is summarized in Table-4.25. The table shows
that a total of 1852 MT of rice, 352 MT of pulses, 106 Killo Liters of edible oil, 231 MT of
onion, 50 MT of salt and 46 MT of spices were supplied to meet out the demand for mid-day
meal to 80521 enrolled students in the district. The table also reveals that the quantity supplied
in different blocks was directly proportional to the number of students enrolled.
Table 4.25: Block-wise supply to mid-day-meal scheme through PDS in Mandi district
(2005).
(Quantity in MT.)
Blocks
Student
enrolment
Rice Pulse
s
Oil
(Killo
Lts.)
Spices Onion Salt
Sadar 8274 190 50 12 5 25 6
Balh 11122 256 67 17 7 33 8
Drang 9350 215 26 14 6 28 7
Chauntra 5770 133 22 6 3 17 4
Gopalpur 5571 128 33 8 3 17 4
Dharampur 4700 108 19 7 3 14 3
Chachyot 6848 157 41 10 4 20 5
Seraj 9455 217 36 9 3 18 4
Sunder Nagar 9245 213 55 14 5 27 7
Karsog 10186 234 4 8 6 30 0.4
Total 80521 1852 352 106 46 231 50
Note: Figures are rounded to nearest digit. Source: Department of Civil Supply, Mandi
Supply made through Integrated Child Development Scheme (ICDS) at two
points of time indicated an increase in the supply of most of the items supplied during the year
2005 over the year 2001, except rice and milk, the absolute quantities of these items has
registered decrease in supply (Table-4.26). The item-wise supply in different blocks has shown
wide variation in quantity supplied. The major items supplied to different blocks were rice
followed by gram and moong. The Karsog block, among all the blocks had the maximum
quantity of rice, gram and moong supplied through ICDS, followed by Sadar, Gopalpur and
Drang blocks.
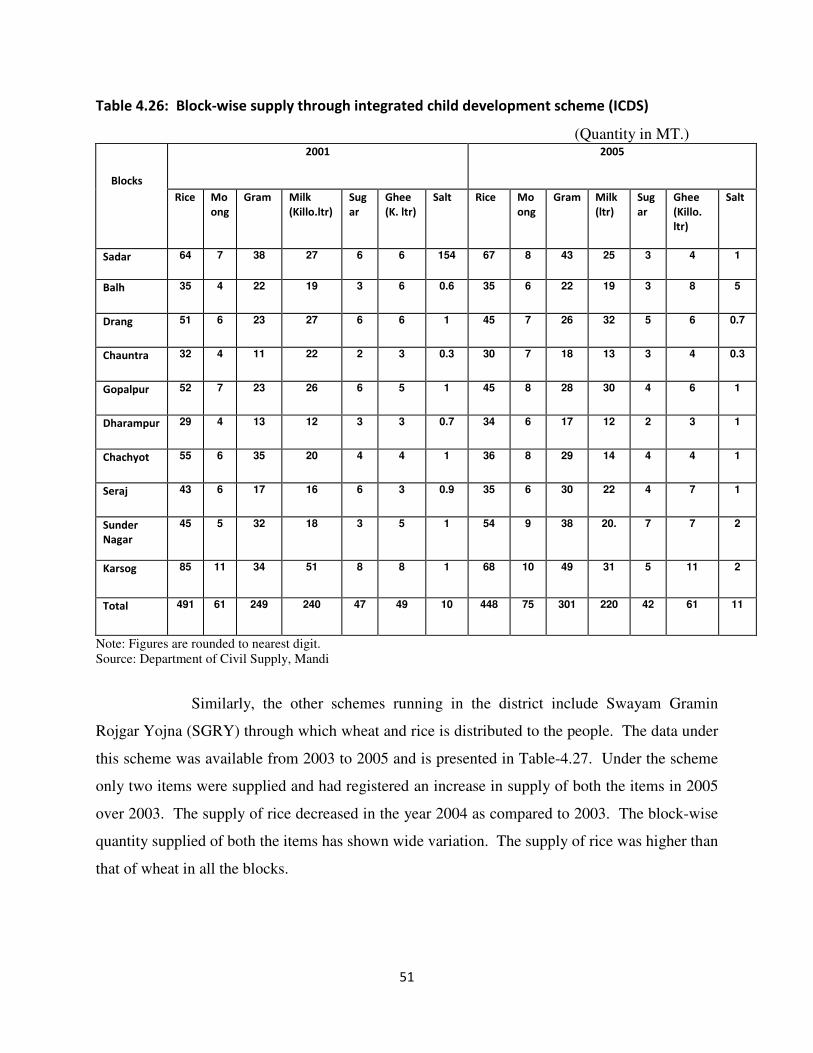
51
Table 4.26: Block-wise supply through integrated child development scheme (ICDS)
(Quantity in MT.) 2001 2005
Blocks
Rice Mo
ong
Gram
Milk
(Killo.ltr)
Sug
ar
Ghee
(K. ltr)
Salt Rice Mo
ong
Gram
Milk
(ltr)
Sug
ar
Ghee
(Killo.
ltr)
Salt
Sadar 64 7 38 27 6 6 154 67 8 43 25 3 4 1
Balh 35 4 22 19 3 6 0.6 35 6 22 19 3 8 5
Drang 51 6 23 27 6 6 1 45 7 26 32 5 6 0.7
Chauntra 32 4 11 22 2 3 0.3 30 7 18 13 3 4 0.3
Gopalpur 52 7 23 26 6 5 1 45 8 28 30 4 6 1
Dharampur 29 4 13 12 3 3 0.7 34 6 17 12 2 3 1
Chachyot 55 6 35 20 4 4 1 36 8 29 14 4 4 1
Seraj 43 6 17 16 6 3 0.9 35 6 30 22 4 7 1
Sunder
Nagar
45 5 32 18 3 5 1 54 9 38 20. 7 7 2
Karsog 85 11 34 51 8 8 1 68 10 49 31 5 11 2
Total 491 61 249 240 47 49 10 448 75 301 220 42 61 11
Note: Figures are rounded to nearest digit. Source: Department of Civil Supply, Mandi
Similarly, the other schemes running in the district include Swayam Gramin
Rojgar Yojna (SGRY) through which wheat and rice is distributed to the people. The data under
this scheme was available from 2003 to 2005 and is presented in Table-4.27. Under the scheme
only two items were supplied and had registered an increase in supply of both the items in 2005
over 2003. The supply of rice decreased in the year 2004 as compared to 2003. The block-wise
quantity supplied of both the items has shown wide variation. The supply of rice was higher than
that of wheat in all the blocks.
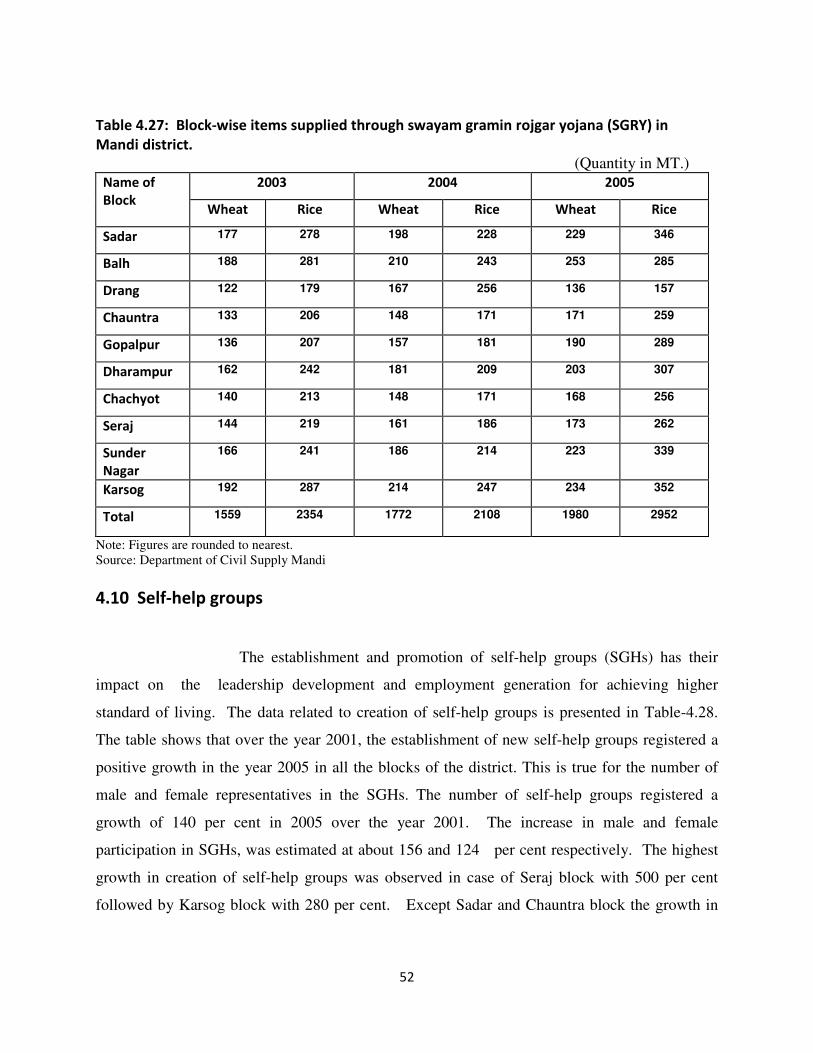
52
Table 4.27: Block-wise items supplied through swayam gramin rojgar yojana (SGRY) in
Mandi district.
(Quantity in MT.) 2003 2004 2005 Name of
Block Wheat Rice Wheat Rice Wheat Rice
Sadar 177 278 198 228 229 346
Balh 188 281 210 243 253 285
Drang 122 179 167 256 136 157
Chauntra 133 206 148 171 171 259
Gopalpur 136 207 157 181 190 289
Dharampur 162 242 181 209 203 307
Chachyot 140 213 148 171 168 256
Seraj 144 219 161 186 173 262
Sunder
Nagar
166 241 186 214 223 339
Karsog 192 287 214 247 234 352
Total 1559 2354 1772 2108 1980 2952
Note: Figures are rounded to nearest. Source: Department of Civil Supply Mandi
4.10 Self-help groups
The establishment and promotion of self-help groups (SGHs) has their
impact on the leadership development and employment generation for achieving higher
standard of living. The data related to creation of self-help groups is presented in Table-4.28.
The table shows that over the year 2001, the establishment of new self-help groups registered a
positive growth in the year 2005 in all the blocks of the district. This is true for the number of
male and female representatives in the SGHs. The number of self-help groups registered a
growth of 140 per cent in 2005 over the year 2001. The increase in male and female
participation in SGHs, was estimated at about 156 and 124 per cent respectively. The highest
growth in creation of self-help groups was observed in case of Seraj block with 500 per cent
followed by Karsog block with 280 per cent. Except Sadar and Chauntra block the growth in
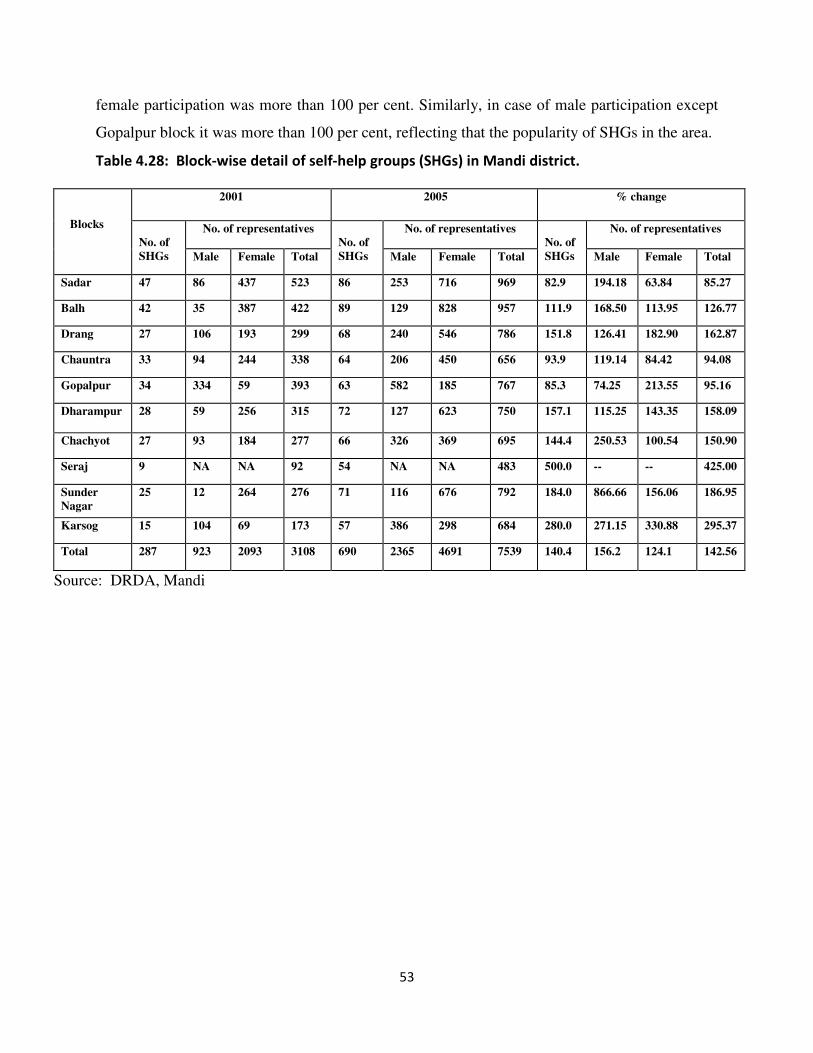
53
female participation was more than 100 per cent. Similarly, in case of male participation except
Gopalpur block it was more than 100 per cent, reflecting that the popularity of SHGs in the area.
Table 4.28: Block-wise detail of self-help groups (SHGs) in Mandi district.
2001 2005 % change
No. of representatives No. of representatives No. of representatives
Blocks
No. of
SHGs Male Female Total
No. of
SHGs Male Female Total
No. of
SHGs Male Female Total
Sadar 47 86 437 523 86 253 716 969 82.9 194.18 63.84 85.27
Balh 42 35 387 422 89 129 828 957 111.9 168.50 113.95 126.77
Drang 27 106 193 299 68 240 546 786 151.8 126.41 182.90 162.87
Chauntra 33 94 244 338 64 206 450 656 93.9 119.14 84.42 94.08
Gopalpur 34 334 59 393 63 582 185 767 85.3 74.25 213.55 95.16
Dharampur 28 59 256 315 72 127 623 750 157.1 115.25 143.35 158.09
Chachyot 27 93 184 277 66 326 369 695 144.4 250.53 100.54 150.90
Seraj 9 NA NA 92 54 NA NA 483 500.0 -- -- 425.00
Sunder
Nagar
25 12 264 276 71 116 676 792 184.0 866.66 156.06 186.95
Karsog 15 104 69 173 57 386 298 684 280.0 271.15 330.88 295.37
Total 287 923 2093 3108 690 2365 4691 7539 140.4 156.2 124.1 142.56
Source: DRDA, Mandi
54
CHAPTER-V
Education
The importance of education can hardly be overstressed as the freedom from
ignorance is as important as freedom from diseases and fear. Education, health care, clean water
availability, sanitation and environment, collectively termed as social infrastructure, and are
considered important for the development. Education increases people’s awareness of
opportunities for advancement and imparts the ability to seize them; literacy is the first step for
empowerment. The benefits of investing in basic education for enhancing human capabilities,
social development, economic growth, greater efficiency and better functioning of democratic
institutions are well established. In order to achieve these objectives, state intervention becomes
all the more important to reform and restructure the education system. It is in this regard that the
analysis of educational facilities and student enrolment in the schools, particularly in rural areas,
becomes important. This chapter presents the block-wise status of the district in respect of
educational development scenario of the district.
5.1 Number of Schools
Our development experience very clearly suggests the importance of and the role
played by education in socio-economic upliftment of the people. Historically, Mandi district of
the state, fortunately, has been an educational centre of the state. However, in the changing
times, the emphasis on the type and pattern of education has changed a lot. As a result different
new fields have emerged in this sphere.
There has been a spectacular increase in elementary education in the post-
independence period in Mandi district of the State. The brief account of block-wise total number
of schools (government, non-government, government aided, & others private) is given in Table-
5.1and Fig.-5.1 for the year 2005.
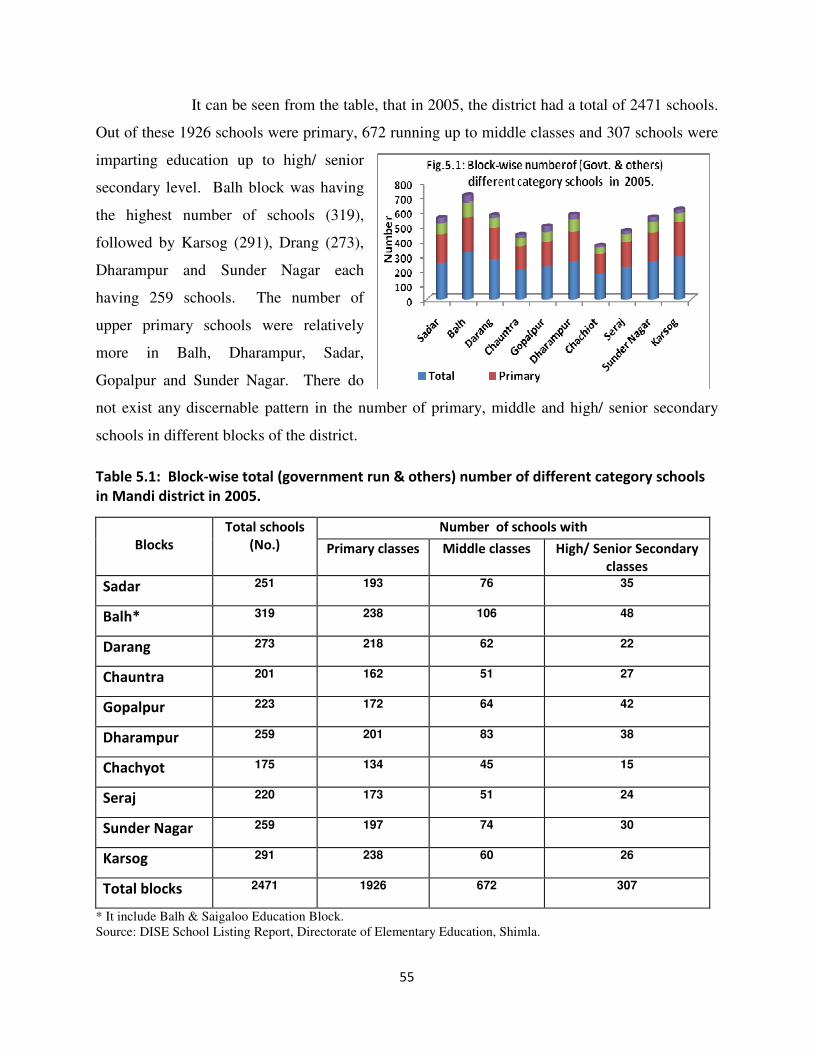
55
It can be seen from the table, that in 2005, the district had a total of 2471 schools.
Out of these 1926 schools were primary, 672 running up to middle classes and 307 schools were
imparting education up to high/ senior
secondary level. Balh block was having
the highest number of schools (319),
followed by Karsog (291), Drang (273),
Dharampur and Sunder Nagar each
having 259 schools. The number of
upper primary schools were relatively
more in Balh, Dharampur, Sadar,
Gopalpur and Sunder Nagar. There do
not exist any discernable pattern in the number of primary, middle and high/ senior secondary
schools in different blocks of the district.
Table 5.1: Block-wise total (government run & others) number of different category schools
in Mandi district in 2005.
Number of schools with
Blocks
Total schools
(No.) Primary classes Middle classes High/ Senior Secondary
classes
Sadar 251 193 76 35
Balh* 319 238 106 48
Darang 273 218 62 22
Chauntra 201 162 51 27
Gopalpur 223 172 64 42
Dharampur 259 201 83 38
Chachyot 175 134 45 15
Seraj 220 173 51 24
Sunder Nagar 259 197 74 30
Karsog 291 238 60 26
Total blocks 2471 1926 672 307
* It include Balh & Saigaloo Education Block. Source: DISE School Listing Report, Directorate of Elementary Education, Shimla.
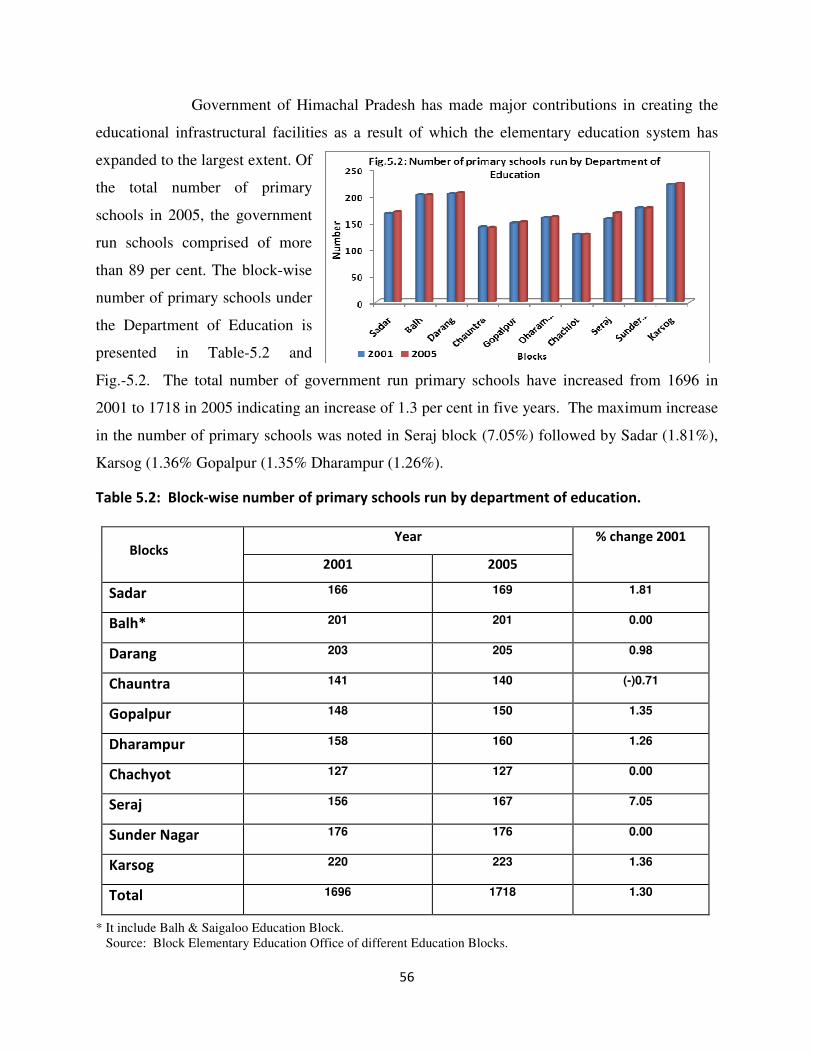
56
Government of Himachal Pradesh has made major contributions in creating the
educational infrastructural facilities as a result of which the elementary education system has
expanded to the largest extent. Of
the total number of primary
schools in 2005, the government
run schools comprised of more
than 89 per cent. The block-wise
number of primary schools under
the Department of Education is
presented in Table-5.2 and
Fig.-5.2. The total number of government run primary schools have increased from 1696 in
2001 to 1718 in 2005 indicating an increase of 1.3 per cent in five years. The maximum increase
in the number of primary schools was noted in Seraj block (7.05%) followed by Sadar (1.81%),
Karsog (1.36% Gopalpur (1.35% Dharampur (1.26%).
Table 5.2: Block-wise number of primary schools run by department of education.
Year
Blocks 2001 2005
% change 2001
Sadar 166 169 1.81
Balh* 201 201 0.00
Darang 203 205 0.98
Chauntra 141 140 (-)0.71
Gopalpur 148 150 1.35
Dharampur 158 160 1.26
Chachyot 127 127 0.00
Seraj 156 167 7.05
Sunder Nagar 176 176 0.00
Karsog 220 223 1.36
Total 1696 1718 1.30
* It include Balh & Saigaloo Education Block. Source: Block Elementary Education Office of different Education Blocks.
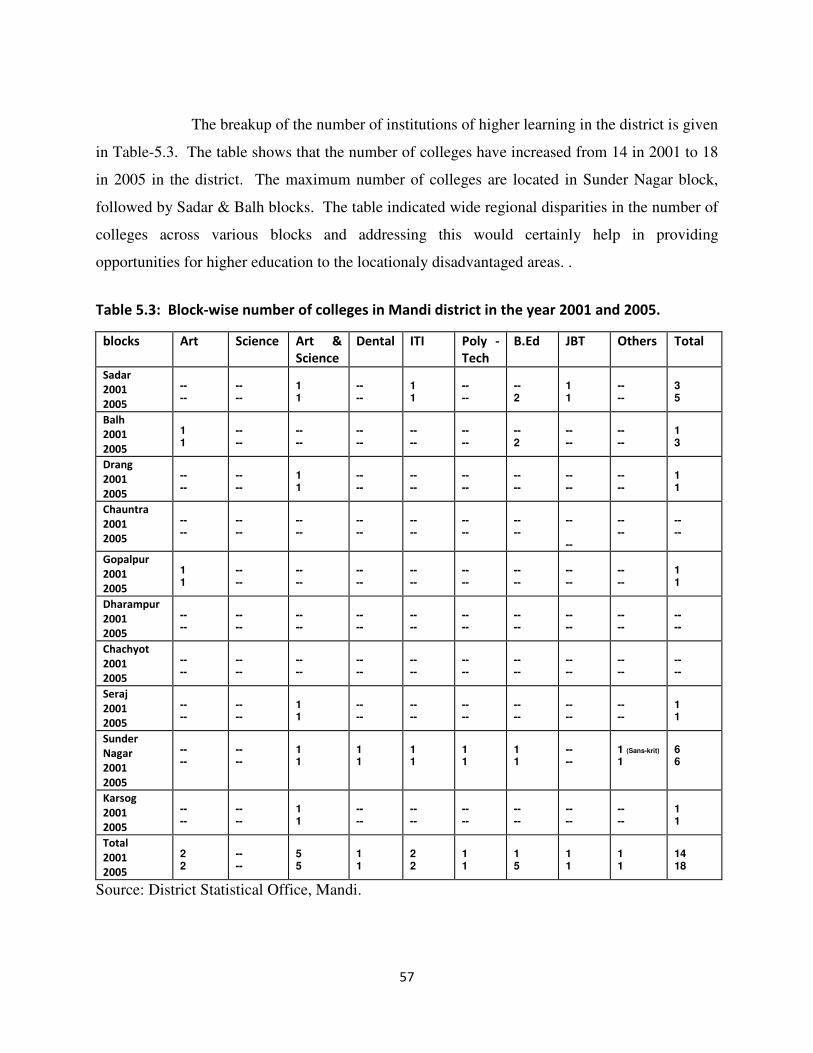
57
The breakup of the number of institutions of higher learning in the district is given
in Table-5.3. The table shows that the number of colleges have increased from 14 in 2001 to 18
in 2005 in the district. The maximum number of colleges are located in Sunder Nagar block,
followed by Sadar & Balh blocks. The table indicated wide regional disparities in the number of
colleges across various blocks and addressing this would certainly help in providing
opportunities for higher education to the locationaly disadvantaged areas. .
Table 5.3: Block-wise number of colleges in Mandi district in the year 2001 and 2005.
blocks Art Science Art &
Science
Dental ITI Poly -
Tech
B.Ed JBT Others Total
Sadar
2001
2005
-- --
-- --
1 1
-- --
1 1
-- --
-- 2
1 1
-- --
3 5
Balh
2001
2005
1 1
-- --
-- --
-- --
-- --
-- --
-- 2
-- --
-- --
1 3
Drang
2001
2005
-- --
-- --
1 1
-- --
-- --
-- --
-- --
-- --
-- --
1 1
Chauntra
2001
2005
-- --
-- --
-- --
-- --
-- --
-- --
-- --
-- --
-- --
-- --
Gopalpur
2001
2005
1 1
-- --
-- --
-- --
-- --
-- --
-- --
-- --
-- --
1 1
Dharampur
2001
2005
-- --
-- --
-- --
-- --
-- --
-- --
-- --
-- --
-- --
-- --
Chachyot
2001
2005
-- --
-- --
-- --
-- --
-- --
-- --
-- --
-- --
-- --
-- --
Seraj
2001
2005
-- --
-- --
1 1
-- --
-- --
-- --
-- --
-- --
-- --
1 1
Sunder
Nagar
2001
2005
-- --
-- --
1 1
1 1
1 1
1 1
1 1
-- --
1 (Sans-krit)
1
6 6
Karsog
2001
2005
-- --
-- --
1 1
-- --
-- --
-- --
-- --
-- --
-- --
1 1
Total
2001
2005
2 2
-- --
5 5
1 1
2 2
1 1
1 5
1 1
1 1
14 18
Source: District Statistical Office, Mandi.
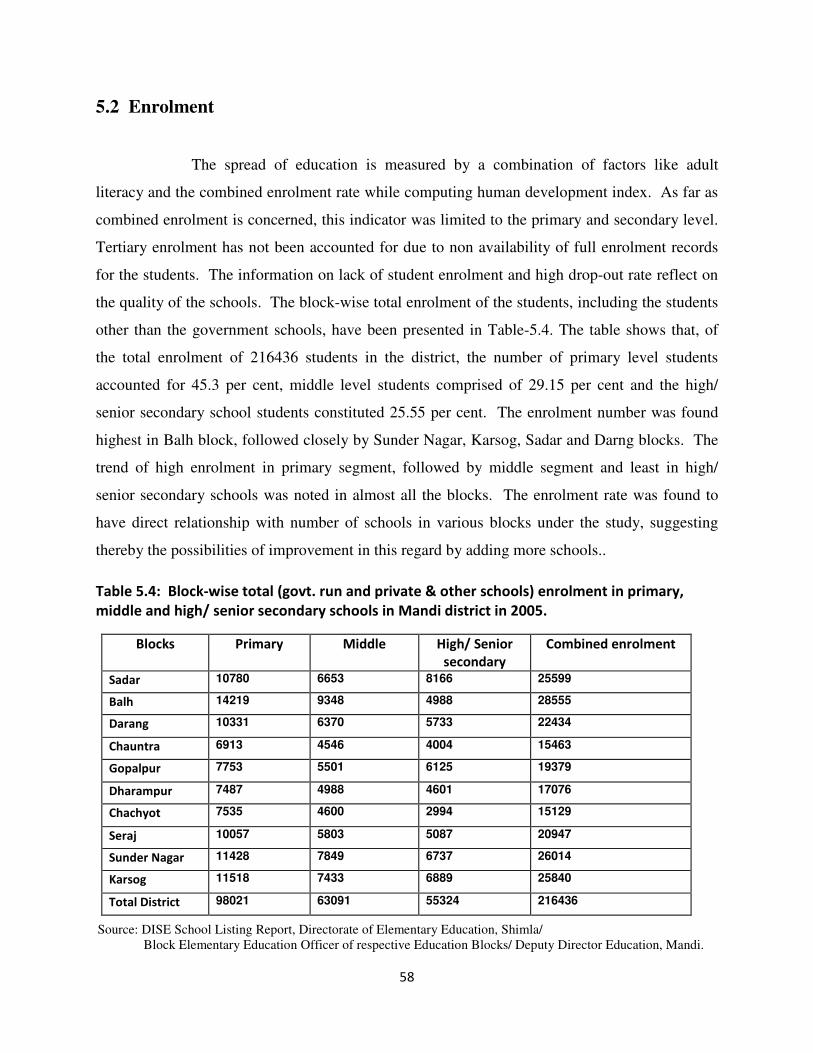
58
5.2 Enrolment
The spread of education is measured by a combination of factors like adult
literacy and the combined enrolment rate while computing human development index. As far as
combined enrolment is concerned, this indicator was limited to the primary and secondary level.
Tertiary enrolment has not been accounted for due to non availability of full enrolment records
for the students. The information on lack of student enrolment and high drop-out rate reflect on
the quality of the schools. The block-wise total enrolment of the students, including the students
other than the government schools, have been presented in Table-5.4. The table shows that, of
the total enrolment of 216436 students in the district, the number of primary level students
accounted for 45.3 per cent, middle level students comprised of 29.15 per cent and the high/
senior secondary school students constituted 25.55 per cent. The enrolment number was found
highest in Balh block, followed closely by Sunder Nagar, Karsog, Sadar and Darng blocks. The
trend of high enrolment in primary segment, followed by middle segment and least in high/
senior secondary schools was noted in almost all the blocks. The enrolment rate was found to
have direct relationship with number of schools in various blocks under the study, suggesting
thereby the possibilities of improvement in this regard by adding more schools..
Table 5.4: Block-wise total (govt. run and private & other schools) enrolment in primary,
middle and high/ senior secondary schools in Mandi district in 2005.
Blocks Primary Middle High/ Senior
secondary
Combined enrolment
Sadar 10780 6653 8166 25599
Balh 14219 9348 4988 28555
Darang 10331 6370 5733 22434
Chauntra 6913 4546 4004 15463
Gopalpur 7753 5501 6125 19379
Dharampur 7487 4988 4601 17076
Chachyot 7535 4600 2994 15129
Seraj 10057 5803 5087 20947
Sunder Nagar 11428 7849 6737 26014
Karsog 11518 7433 6889 25840
Total District 98021 63091 55324 216436
Source: DISE School Listing Report, Directorate of Elementary Education, Shimla/ Block Elementary Education Officer of respective Education Blocks/ Deputy Director Education, Mandi.
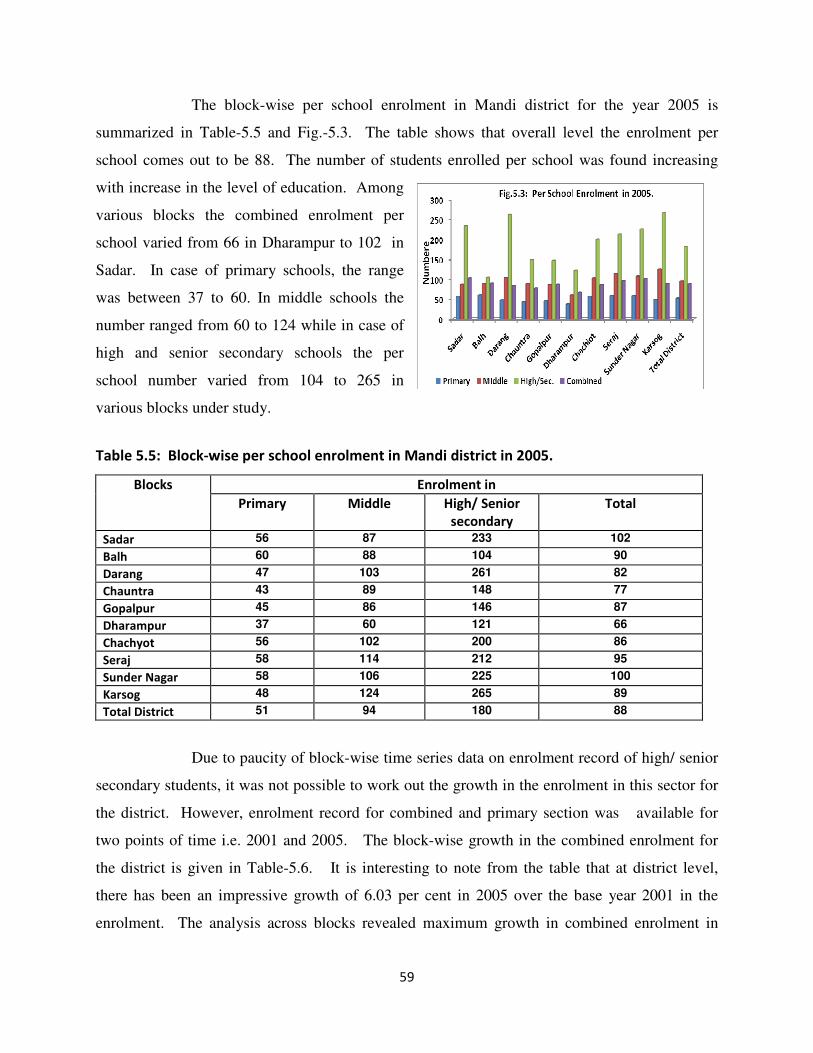
59
The block-wise per school enrolment in Mandi district for the year 2005 is
summarized in Table-5.5 and Fig.-5.3. The table shows that overall level the enrolment per
school comes out to be 88. The number of students enrolled per school was found increasing
with increase in the level of education. Among
various blocks the combined enrolment per
school varied from 66 in Dharampur to 102 in
Sadar. In case of primary schools, the range
was between 37 to 60. In middle schools the
number ranged from 60 to 124 while in case of
high and senior secondary schools the per
school number varied from 104 to 265 in
various blocks under study.
Table 5.5: Block-wise per school enrolment in Mandi district in 2005.
Enrolment in Blocks
Primary Middle High/ Senior
secondary
Total
Sadar 56 87 233 102
Balh 60 88 104 90
Darang 47 103 261 82
Chauntra 43 89 148 77
Gopalpur 45 86 146 87
Dharampur 37 60 121 66
Chachyot 56 102 200 86
Seraj 58 114 212 95
Sunder Nagar 58 106 225 100
Karsog 48 124 265 89
Total District 51 94 180 88
Due to paucity of block-wise time series data on enrolment record of high/ senior
secondary students, it was not possible to work out the growth in the enrolment in this sector for
the district. However, enrolment record for combined and primary section was available for
two points of time i.e. 2001 and 2005. The block-wise growth in the combined enrolment for
the district is given in Table-5.6. It is interesting to note from the table that at district level,
there has been an impressive growth of 6.03 per cent in 2005 over the base year 2001 in the
enrolment. The analysis across blocks revealed maximum growth in combined enrolment in
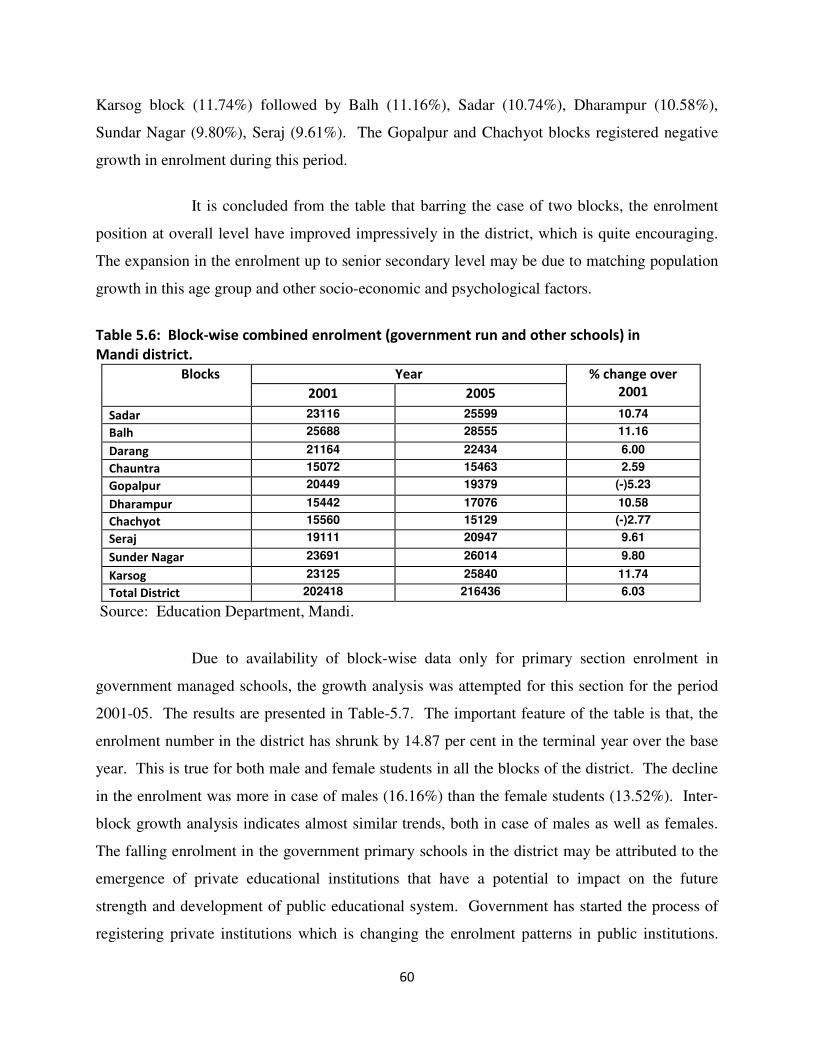
60
Karsog block (11.74%) followed by Balh (11.16%), Sadar (10.74%), Dharampur (10.58%),
Sundar Nagar (9.80%), Seraj (9.61%). The Gopalpur and Chachyot blocks registered negative
growth in enrolment during this period.
It is concluded from the table that barring the case of two blocks, the enrolment
position at overall level have improved impressively in the district, which is quite encouraging.
The expansion in the enrolment up to senior secondary level may be due to matching population
growth in this age group and other socio-economic and psychological factors.
Table 5.6: Block-wise combined enrolment (government run and other schools) in
Mandi district.
Year Blocks
2001 2005
% change over
2001
Sadar 23116 25599 10.74
Balh 25688 28555 11.16
Darang 21164 22434 6.00
Chauntra 15072 15463 2.59
Gopalpur 20449 19379 (-)5.23
Dharampur 15442 17076 10.58
Chachyot 15560 15129 (-)2.77
Seraj 19111 20947 9.61
Sunder Nagar 23691 26014 9.80
Karsog 23125 25840 11.74
Total District 202418 216436 6.03
Source: Education Department, Mandi.
Due to availability of block-wise data only for primary section enrolment in
government managed schools, the growth analysis was attempted for this section for the period
2001-05. The results are presented in Table-5.7. The important feature of the table is that, the
enrolment number in the district has shrunk by 14.87 per cent in the terminal year over the base
year. This is true for both male and female students in all the blocks of the district. The decline
in the enrolment was more in case of males (16.16%) than the female students (13.52%). Inter-
block growth analysis indicates almost similar trends, both in case of males as well as females.
The falling enrolment in the government primary schools in the district may be attributed to the
emergence of private educational institutions that have a potential to impact on the future
strength and development of public educational system. Government has started the process of
registering private institutions which is changing the enrolment patterns in public institutions.
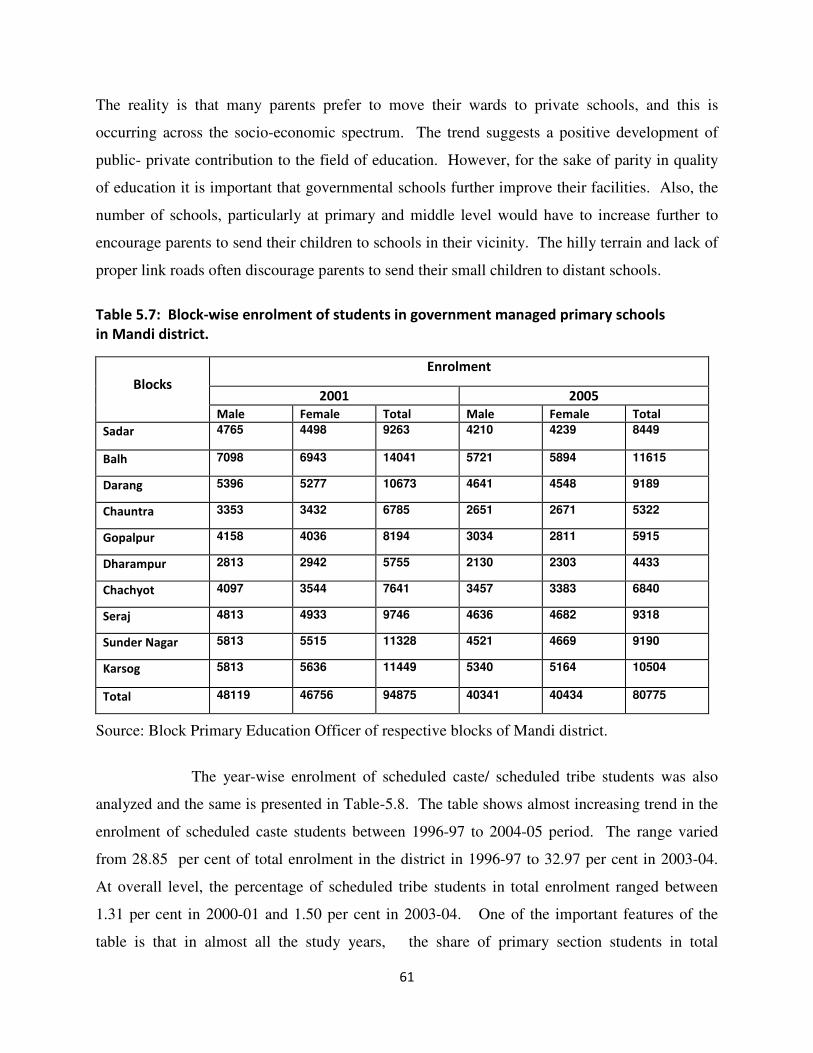
61
The reality is that many parents prefer to move their wards to private schools, and this is
occurring across the socio-economic spectrum. The trend suggests a positive development of
public- private contribution to the field of education. However, for the sake of parity in quality
of education it is important that governmental schools further improve their facilities. Also, the
number of schools, particularly at primary and middle level would have to increase further to
encourage parents to send their children to schools in their vicinity. The hilly terrain and lack of
proper link roads often discourage parents to send their small children to distant schools.
Table 5.7: Block-wise enrolment of students in government managed primary schools
in Mandi district.
Enrolment
2001 2005
Blocks
Male Female Total Male Female Total
Sadar 4765 4498 9263 4210 4239 8449
Balh 7098 6943 14041 5721 5894 11615
Darang 5396 5277 10673 4641 4548 9189
Chauntra 3353 3432 6785 2651 2671 5322
Gopalpur 4158 4036 8194 3034 2811 5915
Dharampur 2813 2942 5755 2130 2303 4433
Chachyot 4097 3544 7641 3457 3383 6840
Seraj 4813 4933 9746 4636 4682 9318
Sunder Nagar 5813 5515 11328 4521 4669 9190
Karsog 5813 5636 11449 5340 5164 10504
Total 48119 46756 94875 40341 40434 80775
Source: Block Primary Education Officer of respective blocks of Mandi district.
The year-wise enrolment of scheduled caste/ scheduled tribe students was also
analyzed and the same is presented in Table-5.8. The table shows almost increasing trend in the
enrolment of scheduled caste students between 1996-97 to 2004-05 period. The range varied
from 28.85 per cent of total enrolment in the district in 1996-97 to 32.97 per cent in 2003-04.
At overall level, the percentage of scheduled tribe students in total enrolment ranged between
1.31 per cent in 2000-01 and 1.50 per cent in 2003-04. One of the important features of the
table is that in almost all the study years, the share of primary section students in total
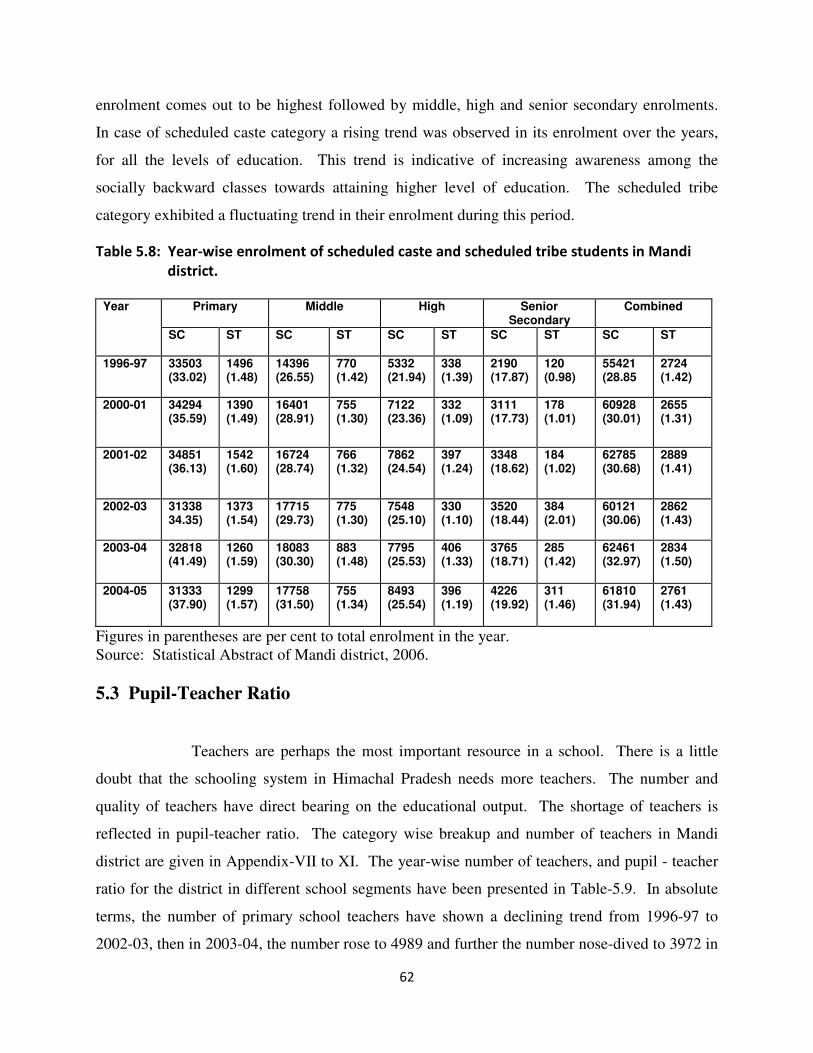
62
enrolment comes out to be highest followed by middle, high and senior secondary enrolments.
In case of scheduled caste category a rising trend was observed in its enrolment over the years,
for all the levels of education. This trend is indicative of increasing awareness among the
socially backward classes towards attaining higher level of education. The scheduled tribe
category exhibited a fluctuating trend in their enrolment during this period.
Table 5.8: Year-wise enrolment of scheduled caste and scheduled tribe students in Mandi
district.
Primary Middle High Senior
Secondary Combined Year
SC
ST SC ST SC ST SC ST SC ST
1996-97 33503 (33.02)
1496 (1.48)
14396 (26.55)
770 (1.42)
5332 (21.94)
338 (1.39)
2190 (17.87)
120 (0.98)
55421 (28.85
2724 (1.42)
2000-01 34294 (35.59)
1390 (1.49)
16401 (28.91)
755 (1.30)
7122 (23.36)
332 (1.09)
3111 (17.73)
178 (1.01)
60928 (30.01)
2655 (1.31)
2001-02 34851 (36.13)
1542 (1.60)
16724 (28.74)
766 (1.32)
7862 (24.54)
397 (1.24)
3348 (18.62)
184 (1.02)
62785 (30.68)
2889 (1.41)
2002-03 31338 34.35)
1373 (1.54)
17715 (29.73)
775 (1.30)
7548 (25.10)
330 (1.10)
3520 (18.44)
384 (2.01)
60121 (30.06)
2862 (1.43)
2003-04 32818 (41.49)
1260 (1.59)
18083 (30.30)
883 (1.48)
7795 (25.53)
406 (1.33)
3765 (18.71)
285 (1.42)
62461 (32.97)
2834 (1.50)
2004-05 31333 (37.90)
1299 (1.57)
17758 (31.50)
755 (1.34)
8493 (25.54)
396 (1.19)
4226 (19.92)
311 (1.46)
61810 (31.94)
2761 (1.43)
Figures in parentheses are per cent to total enrolment in the year. Source: Statistical Abstract of Mandi district, 2006.
5.3 Pupil-Teacher Ratio
Teachers are perhaps the most important resource in a school. There is a little
doubt that the schooling system in Himachal Pradesh needs more teachers. The number and
quality of teachers have direct bearing on the educational output. The shortage of teachers is
reflected in pupil-teacher ratio. The category wise breakup and number of teachers in Mandi
district are given in Appendix-VII to XI. The year-wise number of teachers, and pupil - teacher
ratio for the district in different school segments have been presented in Table-5.9. In absolute
terms, the number of primary school teachers have shown a declining trend from 1996-97 to
2002-03, then in 2003-04, the number rose to 4989 and further the number nose-dived to 3972 in
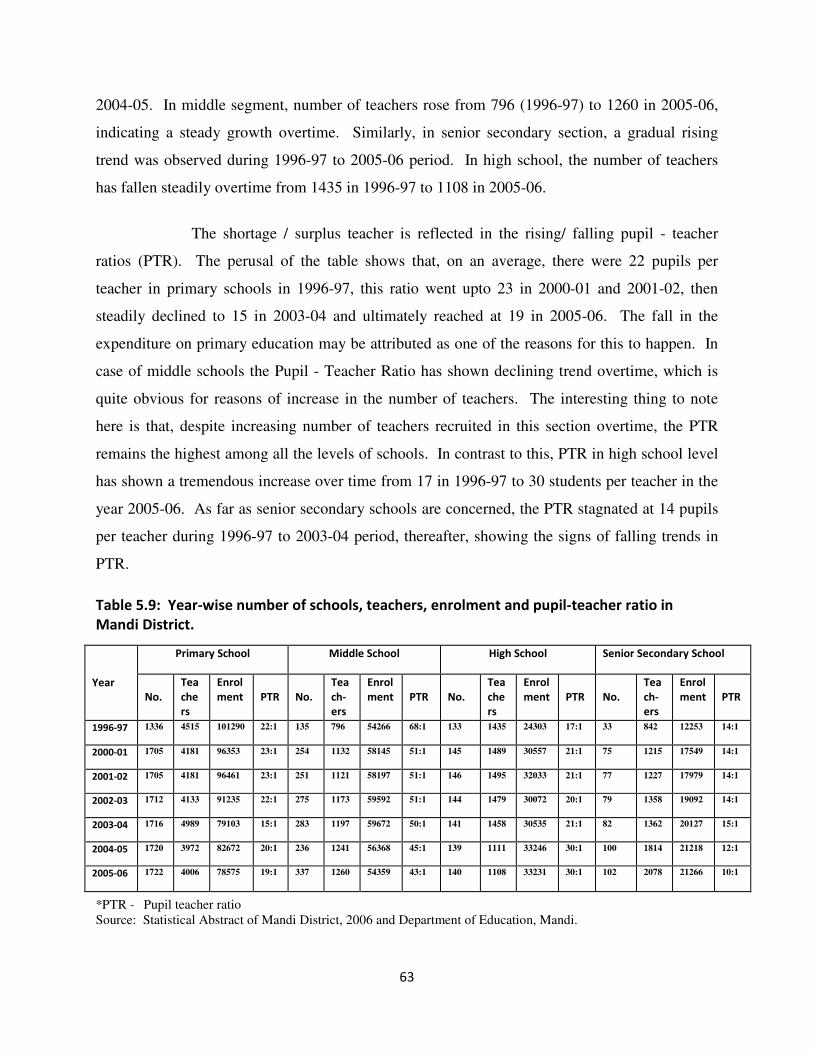
63
2004-05. In middle segment, number of teachers rose from 796 (1996-97) to 1260 in 2005-06,
indicating a steady growth overtime. Similarly, in senior secondary section, a gradual rising
trend was observed during 1996-97 to 2005-06 period. In high school, the number of teachers
has fallen steadily overtime from 1435 in 1996-97 to 1108 in 2005-06.
The shortage / surplus teacher is reflected in the rising/ falling pupil - teacher
ratios (PTR). The perusal of the table shows that, on an average, there were 22 pupils per
teacher in primary schools in 1996-97, this ratio went upto 23 in 2000-01 and 2001-02, then
steadily declined to 15 in 2003-04 and ultimately reached at 19 in 2005-06. The fall in the
expenditure on primary education may be attributed as one of the reasons for this to happen. In
case of middle schools the Pupil - Teacher Ratio has shown declining trend overtime, which is
quite obvious for reasons of increase in the number of teachers. The interesting thing to note
here is that, despite increasing number of teachers recruited in this section overtime, the PTR
remains the highest among all the levels of schools. In contrast to this, PTR in high school level
has shown a tremendous increase over time from 17 in 1996-97 to 30 students per teacher in the
year 2005-06. As far as senior secondary schools are concerned, the PTR stagnated at 14 pupils
per teacher during 1996-97 to 2003-04 period, thereafter, showing the signs of falling trends in
PTR.
Table 5.9: Year-wise number of schools, teachers, enrolment and pupil-teacher ratio in
Mandi District.
*PTR - Pupil teacher ratio Source: Statistical Abstract of Mandi District, 2006 and Department of Education, Mandi.
Primary School Middle School High School Senior Secondary School
Year
No.
Tea
che
rs
Enrol
ment
PTR
No.
Tea
ch-
ers
Enrol
ment
PTR
No.
Tea
che
rs
Enrol
ment
PTR
No.
Tea
ch-
ers
Enrol
ment
PTR
1996-97 1336 4515 101290 22:1 135 796 54266 68:1 133 1435 24303 17:1 33 842 12253 14:1
2000-01 1705 4181 96353 23:1 254 1132 58145 51:1 145 1489 30557 21:1 75 1215 17549 14:1
2001-02 1705 4181 96461 23:1 251 1121 58197 51:1 146 1495 32033 21:1 77 1227 17979 14:1
2002-03 1712 4133 91235 22:1 275 1173 59592 51:1 144 1479 30072 20:1 79 1358 19092 14:1
2003-04 1716 4989 79103 15:1 283 1197 59672 50:1 141 1458 30535 21:1 82 1362 20127 15:1
2004-05 1720 3972 82672 20:1 236 1241 56368 45:1 139 1111 33246 30:1 100 1814 21218 12:1
2005-06 1722 4006 78575 19:1 337 1260 54359 43:1 140 1108 33231 30:1 102 2078 21266 10:1
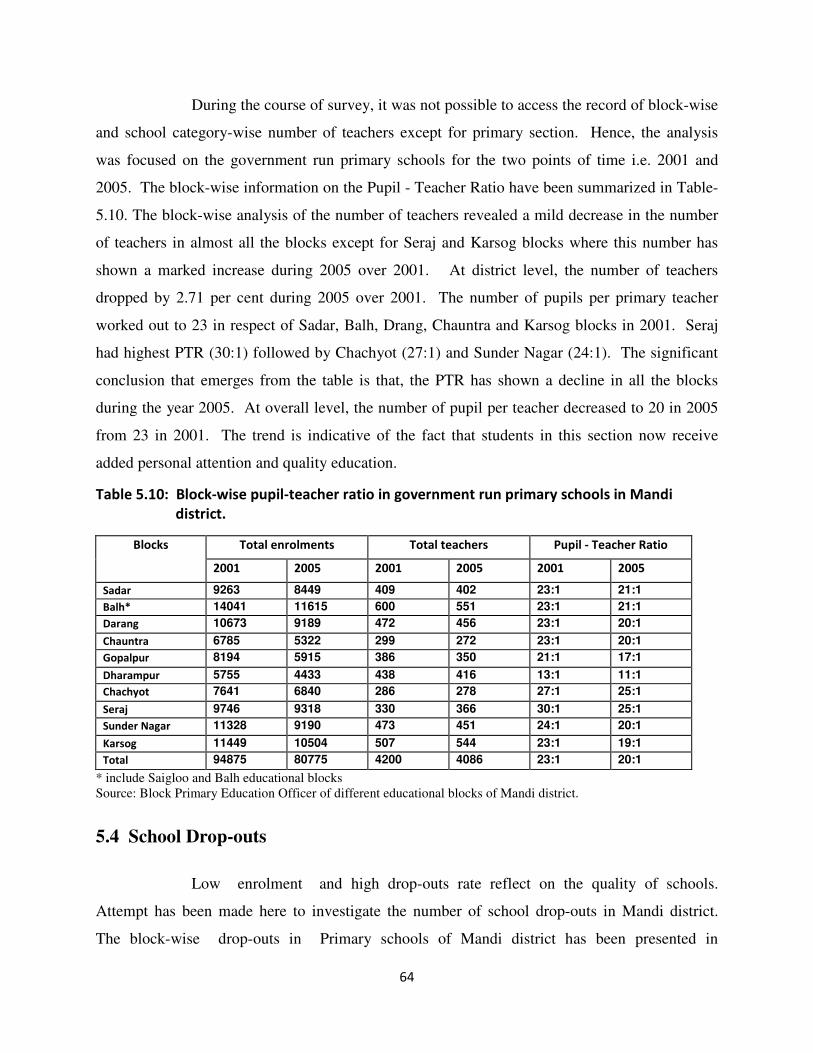
64
During the course of survey, it was not possible to access the record of block-wise
and school category-wise number of teachers except for primary section. Hence, the analysis
was focused on the government run primary schools for the two points of time i.e. 2001 and
2005. The block-wise information on the Pupil - Teacher Ratio have been summarized in Table-
5.10. The block-wise analysis of the number of teachers revealed a mild decrease in the number
of teachers in almost all the blocks except for Seraj and Karsog blocks where this number has
shown a marked increase during 2005 over 2001. At district level, the number of teachers
dropped by 2.71 per cent during 2005 over 2001. The number of pupils per primary teacher
worked out to 23 in respect of Sadar, Balh, Drang, Chauntra and Karsog blocks in 2001. Seraj
had highest PTR (30:1) followed by Chachyot (27:1) and Sunder Nagar (24:1). The significant
conclusion that emerges from the table is that, the PTR has shown a decline in all the blocks
during the year 2005. At overall level, the number of pupil per teacher decreased to 20 in 2005
from 23 in 2001. The trend is indicative of the fact that students in this section now receive
added personal attention and quality education.
Table 5.10: Block-wise pupil-teacher ratio in government run primary schools in Mandi
district.
Total enrolments Total teachers Pupil - Teacher Ratio Blocks
2001 2005 2001 2005 2001 2005
Sadar 9263 8449 409 402 23:1 21:1
Balh* 14041 11615 600 551 23:1 21:1
Darang 10673 9189 472 456 23:1 20:1
Chauntra 6785 5322 299 272 23:1 20:1
Gopalpur 8194 5915 386 350 21:1 17:1
Dharampur 5755 4433 438 416 13:1 11:1
Chachyot 7641 6840 286 278 27:1 25:1
Seraj 9746 9318 330 366 30:1 25:1
Sunder Nagar 11328 9190 473 451 24:1 20:1
Karsog 11449 10504 507 544 23:1 19:1
Total 94875 80775 4200 4086 23:1 20:1
* include Saigloo and Balh educational blocks Source: Block Primary Education Officer of different educational blocks of Mandi district.
5.4 School Drop-outs
Low enrolment and high drop-outs rate reflect on the quality of schools.
Attempt has been made here to investigate the number of school drop-outs in Mandi district.
The block-wise drop-outs in Primary schools of Mandi district has been presented in
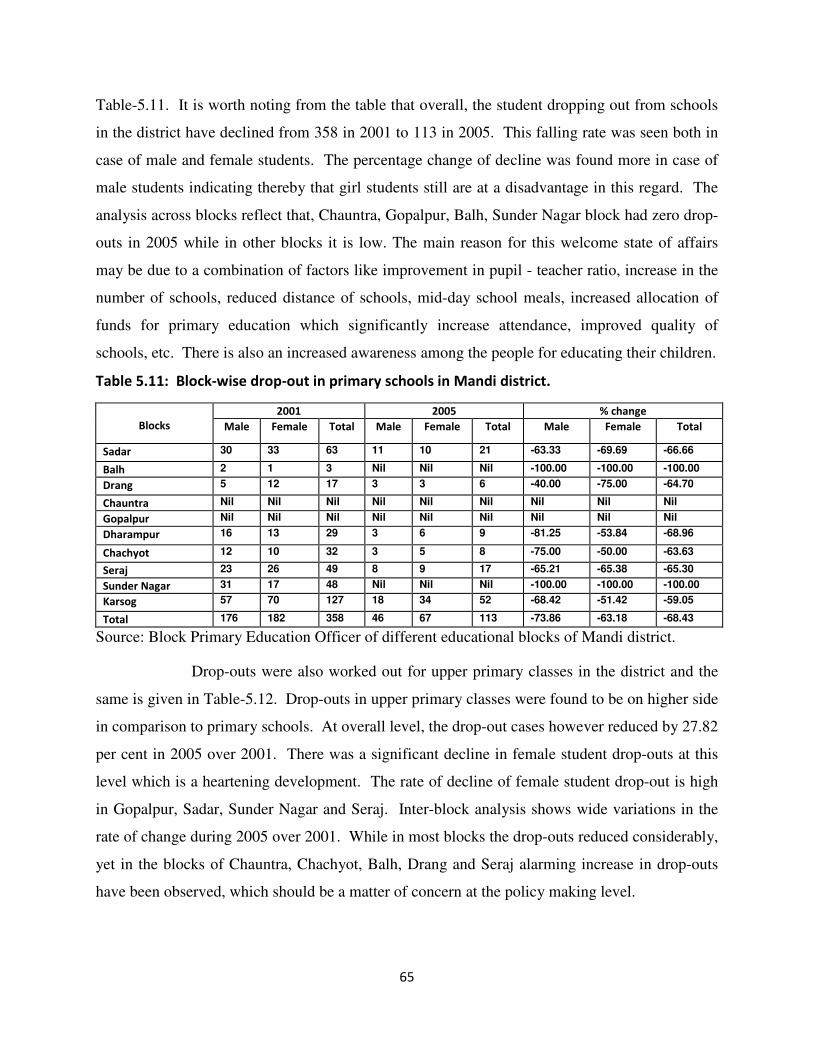
65
Table-5.11. It is worth noting from the table that overall, the student dropping out from schools
in the district have declined from 358 in 2001 to 113 in 2005. This falling rate was seen both in
case of male and female students. The percentage change of decline was found more in case of
male students indicating thereby that girl students still are at a disadvantage in this regard. The
analysis across blocks reflect that, Chauntra, Gopalpur, Balh, Sunder Nagar block had zero drop-
outs in 2005 while in other blocks it is low. The main reason for this welcome state of affairs
may be due to a combination of factors like improvement in pupil - teacher ratio, increase in the
number of schools, reduced distance of schools, mid-day school meals, increased allocation of
funds for primary education which significantly increase attendance, improved quality of
schools, etc. There is also an increased awareness among the people for educating their children.
Table 5.11: Block-wise drop-out in primary schools in Mandi district.
2001 2005 % change
Blocks Male Female Total Male Female Total Male Female Total
Sadar 30 33 63 11 10 21 -63.33 -69.69 -66.66
Balh 2 1 3 Nil Nil Nil -100.00 -100.00 -100.00
Drang 5 12 17 3 3 6 -40.00 -75.00 -64.70
Chauntra Nil Nil Nil Nil Nil Nil Nil Nil Nil
Gopalpur Nil Nil Nil Nil Nil Nil Nil Nil Nil
Dharampur 16 13 29 3 6 9 -81.25 -53.84 -68.96
Chachyot 12 10 32 3 5 8 -75.00 -50.00 -63.63
Seraj 23 26 49 8 9 17 -65.21 -65.38 -65.30
Sunder Nagar 31 17 48 Nil Nil Nil -100.00 -100.00 -100.00
Karsog 57 70 127 18 34 52 -68.42 -51.42 -59.05
Total 176 182 358 46 67 113 -73.86 -63.18 -68.43
Source: Block Primary Education Officer of different educational blocks of Mandi district.
Drop-outs were also worked out for upper primary classes in the district and the
same is given in Table-5.12. Drop-outs in upper primary classes were found to be on higher side
in comparison to primary schools. At overall level, the drop-out cases however reduced by 27.82
per cent in 2005 over 2001. There was a significant decline in female student drop-outs at this
level which is a heartening development. The rate of decline of female student drop-out is high
in Gopalpur, Sadar, Sunder Nagar and Seraj. Inter-block analysis shows wide variations in the
rate of change during 2005 over 2001. While in most blocks the drop-outs reduced considerably,
yet in the blocks of Chauntra, Chachyot, Balh, Drang and Seraj alarming increase in drop-outs
have been observed, which should be a matter of concern at the policy making level.
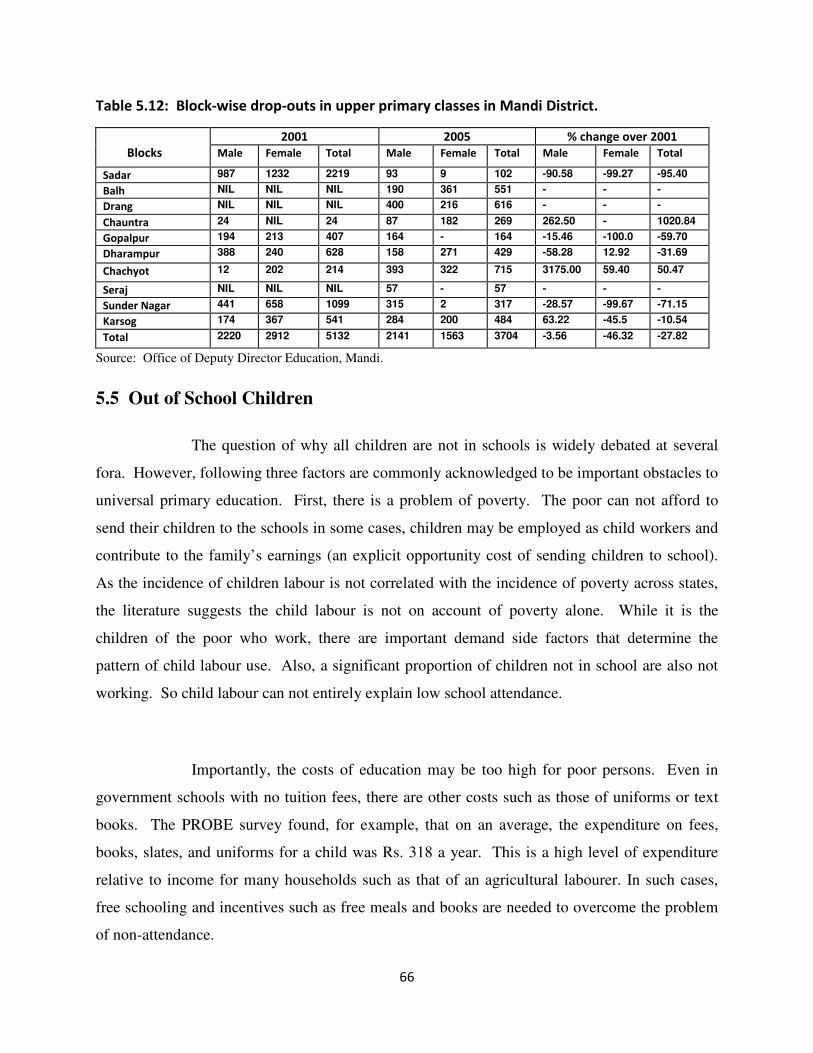
66
Table 5.12: Block-wise drop-outs in upper primary classes in Mandi District.
2001 2005 % change over 2001
Blocks Male Female Total Male Female Total Male Female Total
Sadar 987 1232 2219 93 9 102 -90.58 -99.27 -95.40
Balh NIL NIL NIL 190 361 551 - - -
Drang NIL NIL NIL 400 216 616 - - -
Chauntra 24 NIL 24 87 182 269 262.50 - 1020.84
Gopalpur 194 213 407 164 - 164 -15.46 -100.0 -59.70
Dharampur 388 240 628 158 271 429 -58.28 12.92 -31.69
Chachyot 12 202 214 393 322 715 3175.00 59.40 50.47
Seraj NIL NIL NIL 57 - 57 - - -
Sunder Nagar 441 658 1099 315 2 317 -28.57 -99.67 -71.15
Karsog 174 367 541 284 200 484 63.22 -45.5 -10.54
Total 2220 2912 5132 2141 1563 3704 -3.56 -46.32 -27.82
Source: Office of Deputy Director Education, Mandi.
5.5 Out of School Children
The question of why all children are not in schools is widely debated at several
fora. However, following three factors are commonly acknowledged to be important obstacles to
universal primary education. First, there is a problem of poverty. The poor can not afford to
send their children to the schools in some cases, children may be employed as child workers and
contribute to the family’s earnings (an explicit opportunity cost of sending children to school).
As the incidence of children labour is not correlated with the incidence of poverty across states,
the literature suggests the child labour is not on account of poverty alone. While it is the
children of the poor who work, there are important demand side factors that determine the
pattern of child labour use. Also, a significant proportion of children not in school are also not
working. So child labour can not entirely explain low school attendance.
Importantly, the costs of education may be too high for poor persons. Even in
government schools with no tuition fees, there are other costs such as those of uniforms or text
books. The PROBE survey found, for example, that on an average, the expenditure on fees,
books, slates, and uniforms for a child was Rs. 318 a year. This is a high level of expenditure
relative to income for many households such as that of an agricultural labourer. In such cases,
free schooling and incentives such as free meals and books are needed to overcome the problem
of non-attendance.
67
A second reason pertains to the quality of schooling and school infrastructure is
woefully inadequate. For many children, the absence of a functioning school in the
neighbourhood is the main determinant of non attendance. The problems of physical distance
from a school are exacerbated by problems of social distance for children from underprivileged
households (PROBE Team, 1999). Given that the average quality of schooling is very low, a
frequently cited argument is that education of such poor quality is of little use. The low quality
of education is blamed for low school enrolment and the high dropout rate. While these
statements are valid, it is wrong to argue, as is often done, that without an improvement in
quality, nothing much can be gained from universalizing primary education. The struggle for
more schools and for universal education must be made together with the struggle for better
quality.
Lastly, it is argued that there are problems of motivation, both among parents and
children. These may be due to a range of factors including long years of deprivation, an
environment in which there is no tradition of literacy, inadequate information about the returns to
schooling, nutritional deprivation of children, low quality of school education, and so on.
Empirical studies, however, indicate a high level of motivation among poor parents is needed.
The recent experience of the MV Foundation in Andhra Pradesh shows that even poor parents
are willing to send their children to school (Sinha, 1996). Parents are willing to take on extra
work to see that their children go to school. In other words, there is demand for schooling even
among poor parents and poor children.
The block-wise position of out of school children in Mandi district is presented in
Table-5.13. The contents of the table indicate that the problem of out of school children is
coming down. On overall basis, the number of out of school children during 2003-05 period
decreased by 19.83 per cent. However, the decrease was found only in case of males, where the
number of out of school children decreased by 49.19 per cent. In case of females, this number in
fact increased by 13.89 per cent. The overall decrease may have resulted due to increase or
upgrading the number of schools as well as higher literacy achievement among the parents and
outcome of mid-day meal incentive. As is evidenced from the table, in the year 2003, all the
blocks have reported out of school children with highest number of 44 in Sadar block followed
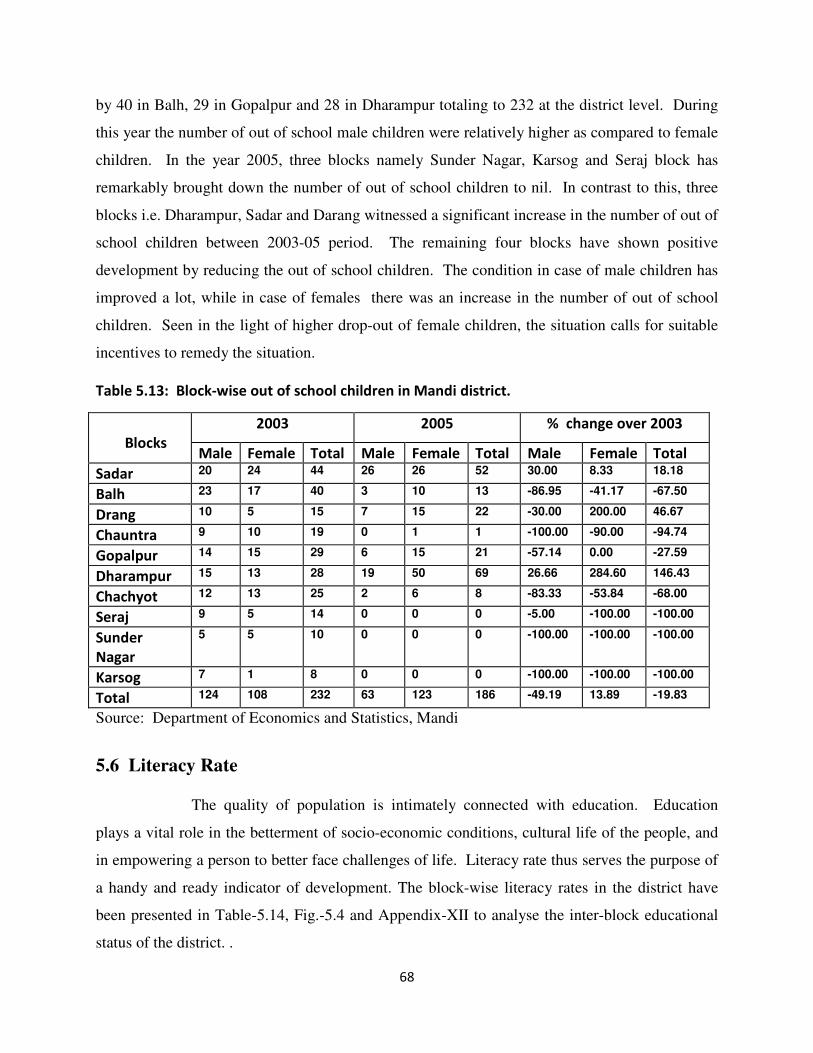
68
by 40 in Balh, 29 in Gopalpur and 28 in Dharampur totaling to 232 at the district level. During
this year the number of out of school male children were relatively higher as compared to female
children. In the year 2005, three blocks namely Sunder Nagar, Karsog and Seraj block has
remarkably brought down the number of out of school children to nil. In contrast to this, three
blocks i.e. Dharampur, Sadar and Darang witnessed a significant increase in the number of out of
school children between 2003-05 period. The remaining four blocks have shown positive
development by reducing the out of school children. The condition in case of male children has
improved a lot, while in case of females there was an increase in the number of out of school
children. Seen in the light of higher drop-out of female children, the situation calls for suitable
incentives to remedy the situation.
Table 5.13: Block-wise out of school children in Mandi district.
2003 2005 % change over 2003
Blocks Male Female Total Male Female Total Male Female Total
Sadar 20 24 44 26 26 52 30.00 8.33 18.18
Balh 23 17 40 3 10 13 -86.95 -41.17 -67.50
Drang 10 5 15 7 15 22 -30.00 200.00 46.67
Chauntra 9 10 19 0 1 1 -100.00 -90.00 -94.74
Gopalpur 14 15 29 6 15 21 -57.14 0.00 -27.59
Dharampur 15 13 28 19 50 69 26.66 284.60 146.43
Chachyot 12 13 25 2 6 8 -83.33 -53.84 -68.00
Seraj 9 5 14 0 0 0 -5.00 -100.00 -100.00
Sunder
Nagar
5 5 10 0 0 0 -100.00 -100.00 -100.00
Karsog 7 1 8 0 0 0 -100.00 -100.00 -100.00
Total 124 108 232 63 123 186 -49.19 13.89 -19.83
Source: Department of Economics and Statistics, Mandi
5.6 Literacy Rate
The quality of population is intimately connected with education. Education
plays a vital role in the betterment of socio-economic conditions, cultural life of the people, and
in empowering a person to better face challenges of life. Literacy rate thus serves the purpose of
a handy and ready indicator of development. The block-wise literacy rates in the district have
been presented in Table-5.14, Fig.-5.4 and Appendix-XII to analyse the inter-block educational
status of the district. .
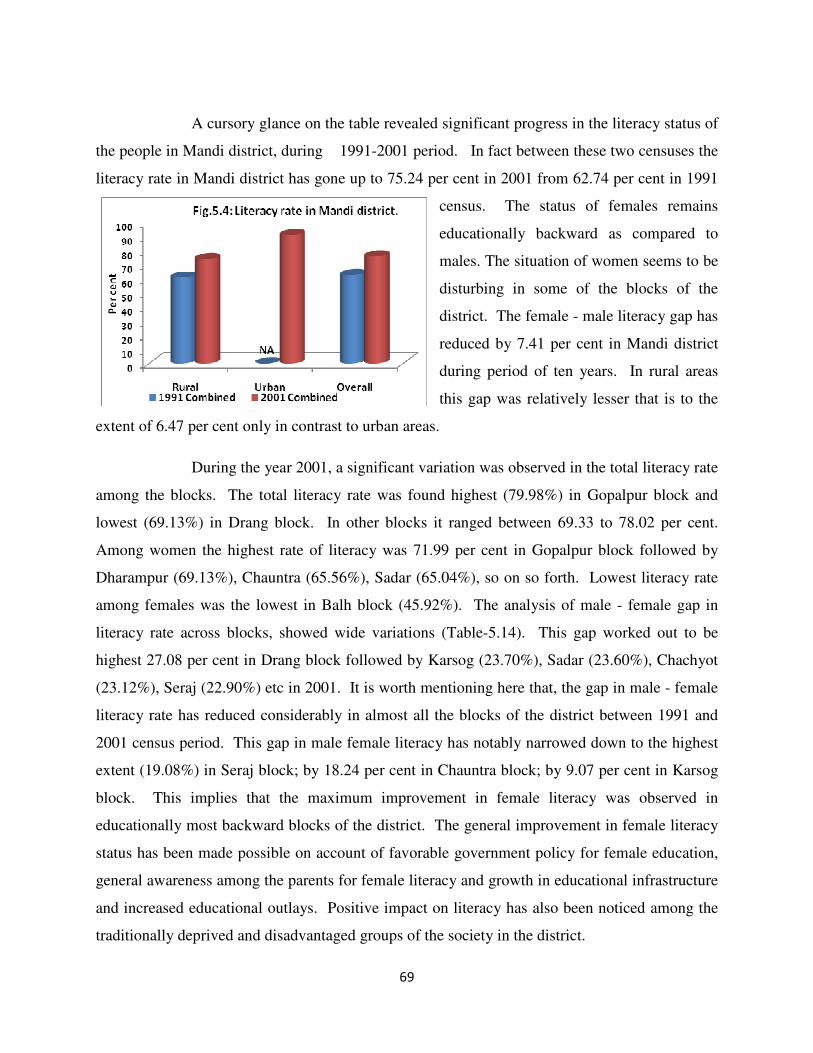
69
A cursory glance on the table revealed significant progress in the literacy status of
the people in Mandi district, during 1991-2001 period. In fact between these two censuses the
literacy rate in Mandi district has gone up to 75.24 per cent in 2001 from 62.74 per cent in 1991
census. The status of females remains
educationally backward as compared to
males. The situation of women seems to be
disturbing in some of the blocks of the
district. The female - male literacy gap has
reduced by 7.41 per cent in Mandi district
during period of ten years. In rural areas
this gap was relatively lesser that is to the
extent of 6.47 per cent only in contrast to urban areas.
During the year 2001, a significant variation was observed in the total literacy rate
among the blocks. The total literacy rate was found highest (79.98%) in Gopalpur block and
lowest (69.13%) in Drang block. In other blocks it ranged between 69.33 to 78.02 per cent.
Among women the highest rate of literacy was 71.99 per cent in Gopalpur block followed by
Dharampur (69.13%), Chauntra (65.56%), Sadar (65.04%), so on so forth. Lowest literacy rate
among females was the lowest in Balh block (45.92%). The analysis of male - female gap in
literacy rate across blocks, showed wide variations (Table-5.14). This gap worked out to be
highest 27.08 per cent in Drang block followed by Karsog (23.70%), Sadar (23.60%), Chachyot
(23.12%), Seraj (22.90%) etc in 2001. It is worth mentioning here that, the gap in male - female
literacy rate has reduced considerably in almost all the blocks of the district between 1991 and
2001 census period. This gap in male female literacy has notably narrowed down to the highest
extent (19.08%) in Seraj block; by 18.24 per cent in Chauntra block; by 9.07 per cent in Karsog
block. This implies that the maximum improvement in female literacy was observed in
educationally most backward blocks of the district. The general improvement in female literacy
status has been made possible on account of favorable government policy for female education,
general awareness among the parents for female literacy and growth in educational infrastructure
and increased educational outlays. Positive impact on literacy has also been noticed among the
traditionally deprived and disadvantaged groups of the society in the district.
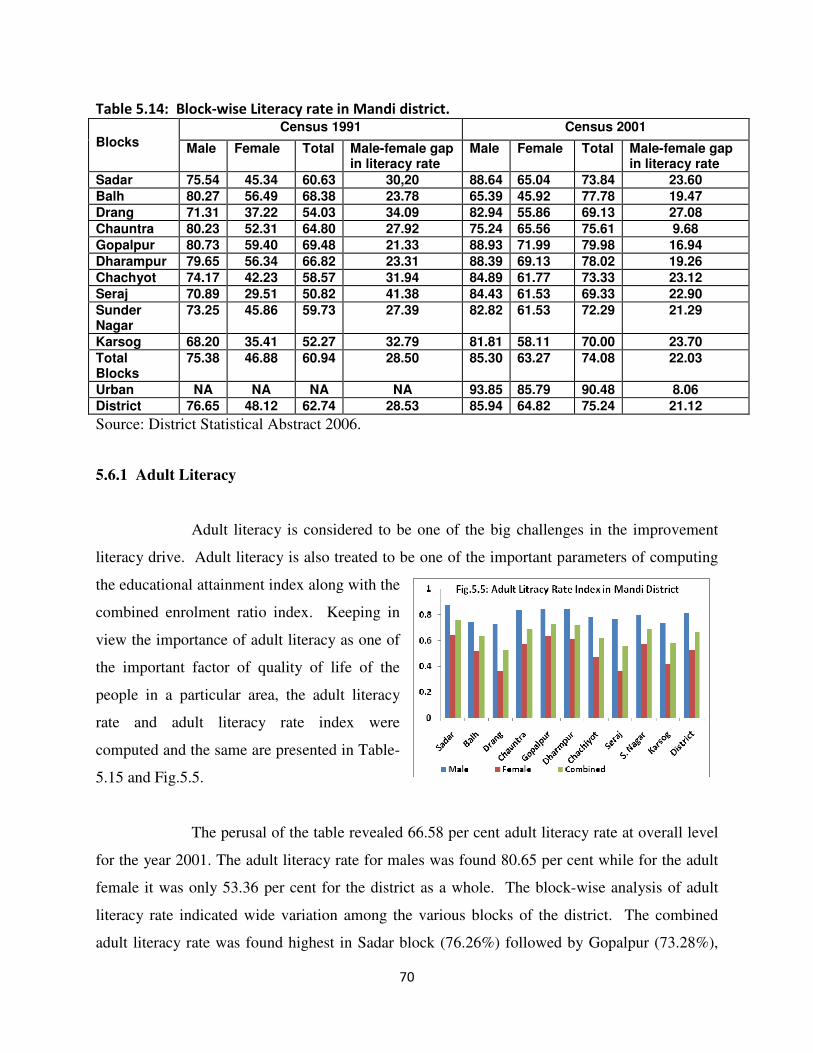
70
Table 5.14: Block-wise Literacy rate in Mandi district. Census 1991 Census 2001
Blocks
Male Female Total Male-female gap in literacy rate
Male Female Total Male-female gap in literacy rate
Sadar 75.54 45.34 60.63 30,20 88.64 65.04 73.84 23.60
Balh 80.27 56.49 68.38 23.78 65.39 45.92 77.78 19.47
Drang 71.31 37.22 54.03 34.09 82.94 55.86 69.13 27.08
Chauntra 80.23 52.31 64.80 27.92 75.24 65.56 75.61 9.68
Gopalpur 80.73 59.40 69.48 21.33 88.93 71.99 79.98 16.94
Dharampur 79.65 56.34 66.82 23.31 88.39 69.13 78.02 19.26
Chachyot 74.17 42.23 58.57 31.94 84.89 61.77 73.33 23.12
Seraj 70.89 29.51 50.82 41.38 84.43 61.53 69.33 22.90
Sunder Nagar
73.25 45.86 59.73 27.39 82.82 61.53 72.29 21.29
Karsog 68.20 35.41 52.27 32.79 81.81 58.11 70.00 23.70
Total Blocks
75.38 46.88 60.94 28.50 85.30 63.27 74.08 22.03
Urban NA NA NA NA 93.85 85.79 90.48 8.06
District 76.65 48.12 62.74 28.53 85.94 64.82 75.24 21.12
Source: District Statistical Abstract 2006.
5.6.1 Adult Literacy
Adult literacy is considered to be one of the big challenges in the improvement
literacy drive. Adult literacy is also treated to be one of the important parameters of computing
the educational attainment index along with the
combined enrolment ratio index. Keeping in
view the importance of adult literacy as one of
the important factor of quality of life of the
people in a particular area, the adult literacy
rate and adult literacy rate index were
computed and the same are presented in Table-
5.15 and Fig.5.5.
The perusal of the table revealed 66.58 per cent adult literacy rate at overall level
for the year 2001. The adult literacy rate for males was found 80.65 per cent while for the adult
female it was only 53.36 per cent for the district as a whole. The block-wise analysis of adult
literacy rate indicated wide variation among the various blocks of the district. The combined
adult literacy rate was found highest in Sadar block (76.26%) followed by Gopalpur (73.28%),
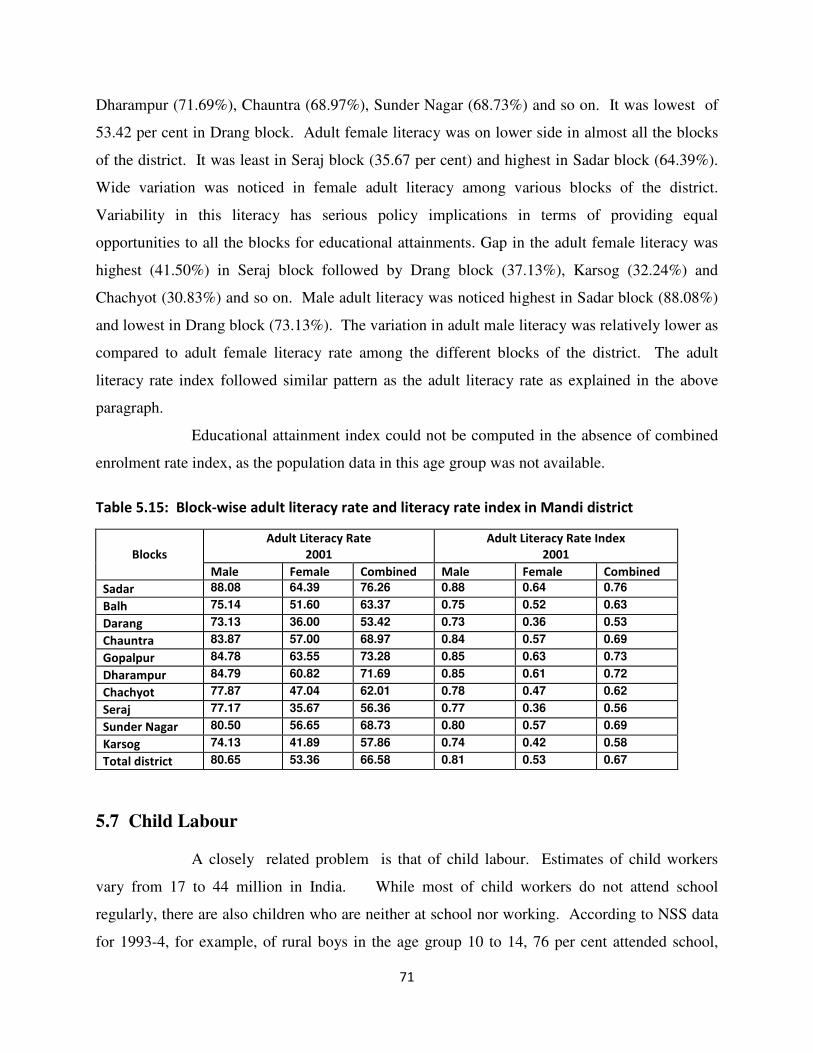
71
Dharampur (71.69%), Chauntra (68.97%), Sunder Nagar (68.73%) and so on. It was lowest of
53.42 per cent in Drang block. Adult female literacy was on lower side in almost all the blocks
of the district. It was least in Seraj block (35.67 per cent) and highest in Sadar block (64.39%).
Wide variation was noticed in female adult literacy among various blocks of the district.
Variability in this literacy has serious policy implications in terms of providing equal
opportunities to all the blocks for educational attainments. Gap in the adult female literacy was
highest (41.50%) in Seraj block followed by Drang block (37.13%), Karsog (32.24%) and
Chachyot (30.83%) and so on. Male adult literacy was noticed highest in Sadar block (88.08%)
and lowest in Drang block (73.13%). The variation in adult male literacy was relatively lower as
compared to adult female literacy rate among the different blocks of the district. The adult
literacy rate index followed similar pattern as the adult literacy rate as explained in the above
paragraph.
Educational attainment index could not be computed in the absence of combined
enrolment rate index, as the population data in this age group was not available.
Table 5.15: Block-wise adult literacy rate and literacy rate index in Mandi district
Adult Literacy Rate
2001
Adult Literacy Rate Index
2001
Blocks
Male Female Combined Male Female Combined
Sadar 88.08 64.39 76.26 0.88 0.64 0.76
Balh 75.14 51.60 63.37 0.75 0.52 0.63
Darang 73.13 36.00 53.42 0.73 0.36 0.53
Chauntra 83.87 57.00 68.97 0.84 0.57 0.69
Gopalpur 84.78 63.55 73.28 0.85 0.63 0.73
Dharampur 84.79 60.82 71.69 0.85 0.61 0.72
Chachyot 77.87 47.04 62.01 0.78 0.47 0.62
Seraj 77.17 35.67 56.36 0.77 0.36 0.56
Sunder Nagar 80.50 56.65 68.73 0.80 0.57 0.69
Karsog 74.13 41.89 57.86 0.74 0.42 0.58
Total district 80.65 53.36 66.58 0.81 0.53 0.67
5.7 Child Labour
A closely related problem is that of child labour. Estimates of child workers
vary from 17 to 44 million in India. While most of child workers do not attend school
regularly, there are also children who are neither at school nor working. According to NSS data
for 1993-4, for example, of rural boys in the age group 10 to 14, 76 per cent attended school,
72
11.7 per cent were workers, and 10.6 per cent were neither at school nor at work. So a
substantial number of children were not attending school but this was not on account of
participation in work. There are two points to note about these observations. First, it is possible
that children’s work is undercounted. Like women, work undertaken by children is also hidden
work and not enumerated. Second, it indicated that there are children who are not attending
school not because they have to work but for other reasons. It is pertinent to point out to the
view that the elimination of child labour is closely tied to the spread of school education
(Weiner, 1991). It is also easier to implement a policy of universal schooling than to enforce
laws regulating the use of child labour. Appropriate data and child labour for the district was not
available and hence a deeper analysis was not possible.
73
CHAPTER-VI
Health services
Health is important for human welfare. As a Gujarati proverb says “the first
happiness is health, the second is a full stomach”. One can’t enjoy food if one is not healthy (of
course, one can not be healthy if one doesn’t have enough food). To lead a productive life, one
needs good health. As Viner (1953) observed “the first requirement of high labour productivity
under modern conditions are that the masses of the population should be literate, healthy and
sufficiently well-fed to be strong and energetic. Health, like education, is desirable in itself.
Sickness or ill-health imposes a burden on other members of the family and also on society.
Absenteeism from work, on account of ill-health, can result in a loss of production and
productivity. Thus, to emerge as a wealthy nation, a healthy society is desirable. Health,
however, can not be ensured simply by individual efforts. Social action is needed for sanitation,
water supply, clean air, waste disposal and an environment which does not breed diseases or
result in epidemics. Public policy and action is critical in ensuring adequate infrastructure and
follow-up for a healthy society.
6.1 Block-wise staff position in PHC and Sub Centre
Physical health of the population is one of the important indicators of
development. The health of the population, however, is determined by the level of medical
infrastructure as well as the number of doctors, health workers per unit of population; of course,
apart from the nutritional standards of food intake, type of environment, etc. In this regard,
analysis of health services related infrastructure becomes important from the planning point of
view.
Government Primary Health Centers (PHCs), Sub-Centers and Hospitals are the
important health services providing medical facilities in the rural areas. Although many private
practitioners have also started operating in rural areas, yet their number is relatively small and
they are located mainly in the main business centers. Block-wise positions with regard to the
number of PHCs, sub centers and hospitals in 2001 and 2005 are presented in Table-6.1 to 6.4. It
is evident from the Table-6.1 that there has been marginal increase in the number of PHCs
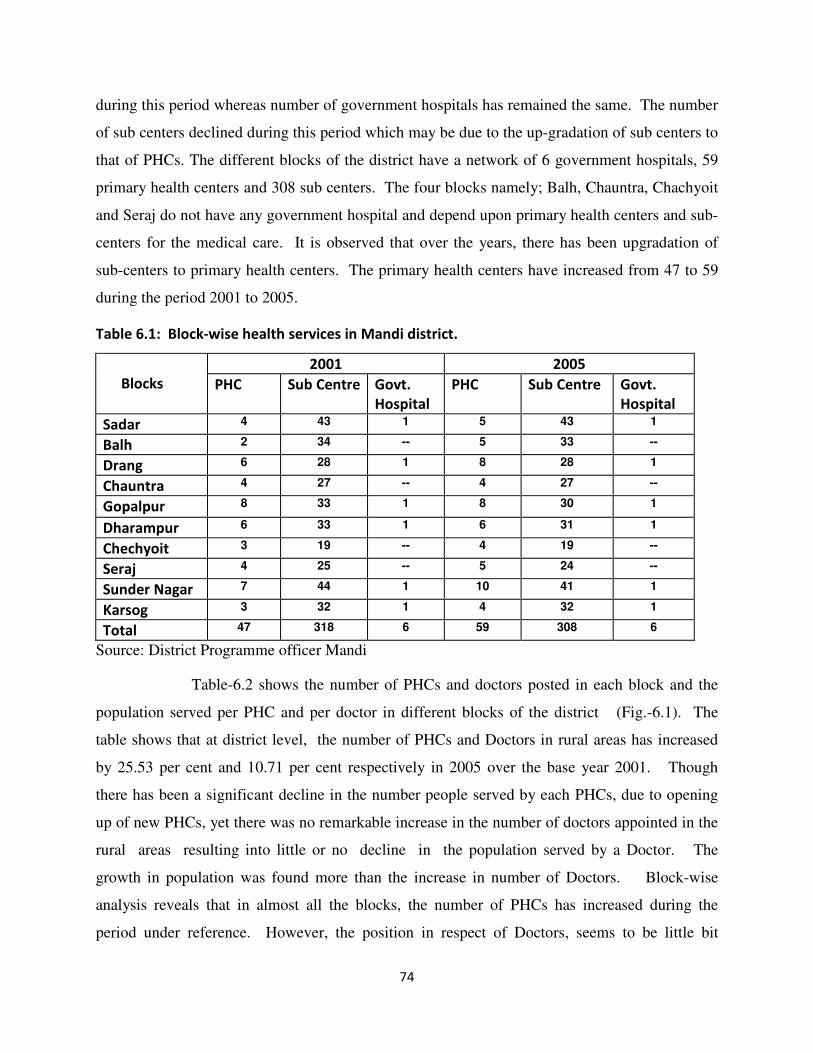
74
during this period whereas number of government hospitals has remained the same. The number
of sub centers declined during this period which may be due to the up-gradation of sub centers to
that of PHCs. The different blocks of the district have a network of 6 government hospitals, 59
primary health centers and 308 sub centers. The four blocks namely; Balh, Chauntra, Chachyoit
and Seraj do not have any government hospital and depend upon primary health centers and sub-
centers for the medical care. It is observed that over the years, there has been upgradation of
sub-centers to primary health centers. The primary health centers have increased from 47 to 59
during the period 2001 to 2005.
Table 6.1: Block-wise health services in Mandi district.
2001 2005
Blocks PHC Sub Centre Govt.
Hospital
PHC Sub Centre Govt.
Hospital
Sadar 4 43 1 5 43 1
Balh 2 34 -- 5 33 --
Drang 6 28 1 8 28 1
Chauntra 4 27 -- 4 27 --
Gopalpur 8 33 1 8 30 1
Dharampur 6 33 1 6 31 1
Chechyoit 3 19 -- 4 19 --
Seraj 4 25 -- 5 24 --
Sunder Nagar 7 44 1 10 41 1
Karsog 3 32 1 4 32 1
Total 47 318 6 59 308 6
Source: District Programme officer Mandi
Table-6.2 shows the number of PHCs and doctors posted in each block and the
population served per PHC and per doctor in different blocks of the district (Fig.-6.1). The
table shows that at district level, the number of PHCs and Doctors in rural areas has increased
by 25.53 per cent and 10.71 per cent respectively in 2005 over the base year 2001. Though
there has been a significant decline in the number people served by each PHCs, due to opening
up of new PHCs, yet there was no remarkable increase in the number of doctors appointed in the
rural areas resulting into little or no decline in the population served by a Doctor. The
growth in population was found more than the increase in number of Doctors. Block-wise
analysis reveals that in almost all the blocks, the number of PHCs has increased during the
period under reference. However, the position in respect of Doctors, seems to be little bit
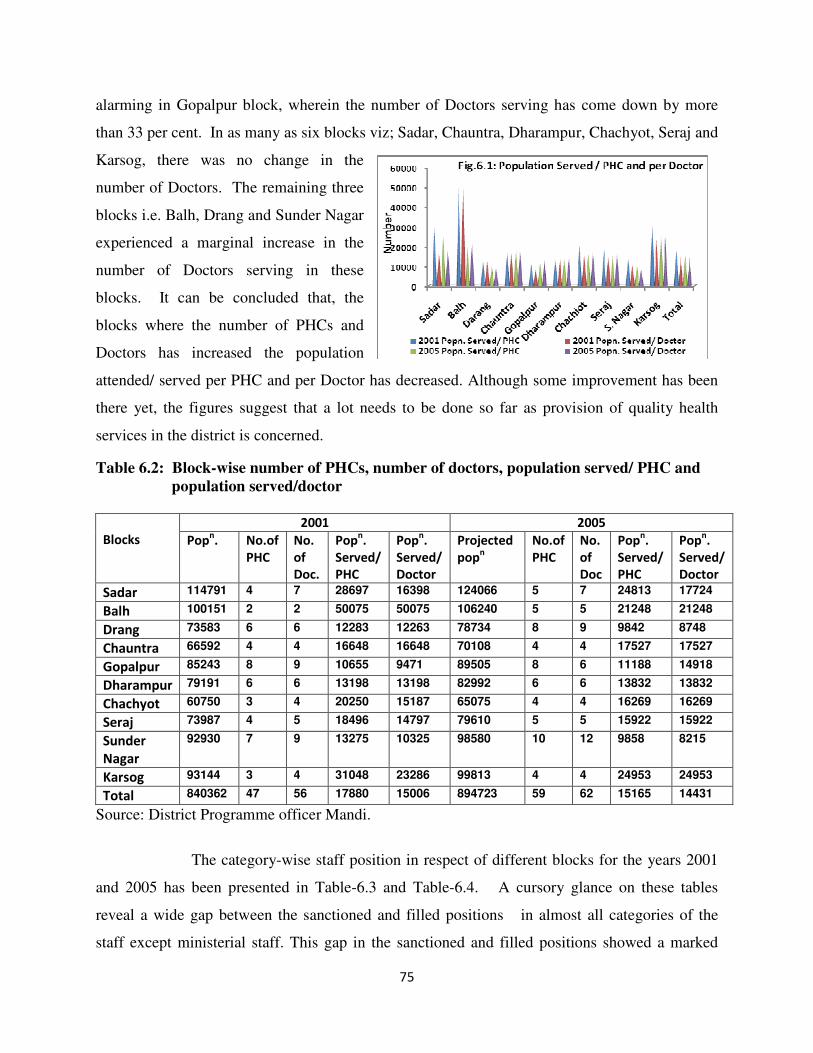
75
alarming in Gopalpur block, wherein the number of Doctors serving has come down by more
than 33 per cent. In as many as six blocks viz; Sadar, Chauntra, Dharampur, Chachyot, Seraj and
Karsog, there was no change in the
number of Doctors. The remaining three
blocks i.e. Balh, Drang and Sunder Nagar
experienced a marginal increase in the
number of Doctors serving in these
blocks. It can be concluded that, the
blocks where the number of PHCs and
Doctors has increased the population
attended/ served per PHC and per Doctor has decreased. Although some improvement has been
there yet, the figures suggest that a lot needs to be done so far as provision of quality health
services in the district is concerned.
Table 6.2: Block-wise number of PHCs, number of doctors, population served/ PHC and
population served/doctor
2001 2005
Blocks Popn. No.of
PHC
No.
of
Doc.
Popn.
Served/
PHC
Popn.
Served/
Doctor
Projected
popn
No.of
PHC
No.
of
Doc
Popn.
Served/
PHC
Popn.
Served/
Doctor
Sadar 114791 4 7 28697 16398 124066 5 7 24813 17724
Balh 100151 2 2 50075 50075 106240 5 5 21248 21248
Drang 73583 6 6 12283 12263 78734 8 9 9842 8748
Chauntra 66592 4 4 16648 16648 70108 4 4 17527 17527
Gopalpur 85243 8 9 10655 9471 89505 8 6 11188 14918
Dharampur 79191 6 6 13198 13198 82992 6 6 13832 13832
Chachyot 60750 3 4 20250 15187 65075 4 4 16269 16269
Seraj 73987 4 5 18496 14797 79610 5 5 15922 15922
Sunder
Nagar
92930 7 9 13275 10325 98580 10 12 9858 8215
Karsog 93144 3 4 31048 23286 99813 4 4 24953 24953
Total 840362 47 56 17880 15006 894723 59 62 15165 14431
Source: District Programme officer Mandi.
The category-wise staff position in respect of different blocks for the years 2001
and 2005 has been presented in Table-6.3 and Table-6.4. A cursory glance on these tables
reveal a wide gap between the sanctioned and filled positions in almost all categories of the
staff except ministerial staff. This gap in the sanctioned and filled positions showed a marked
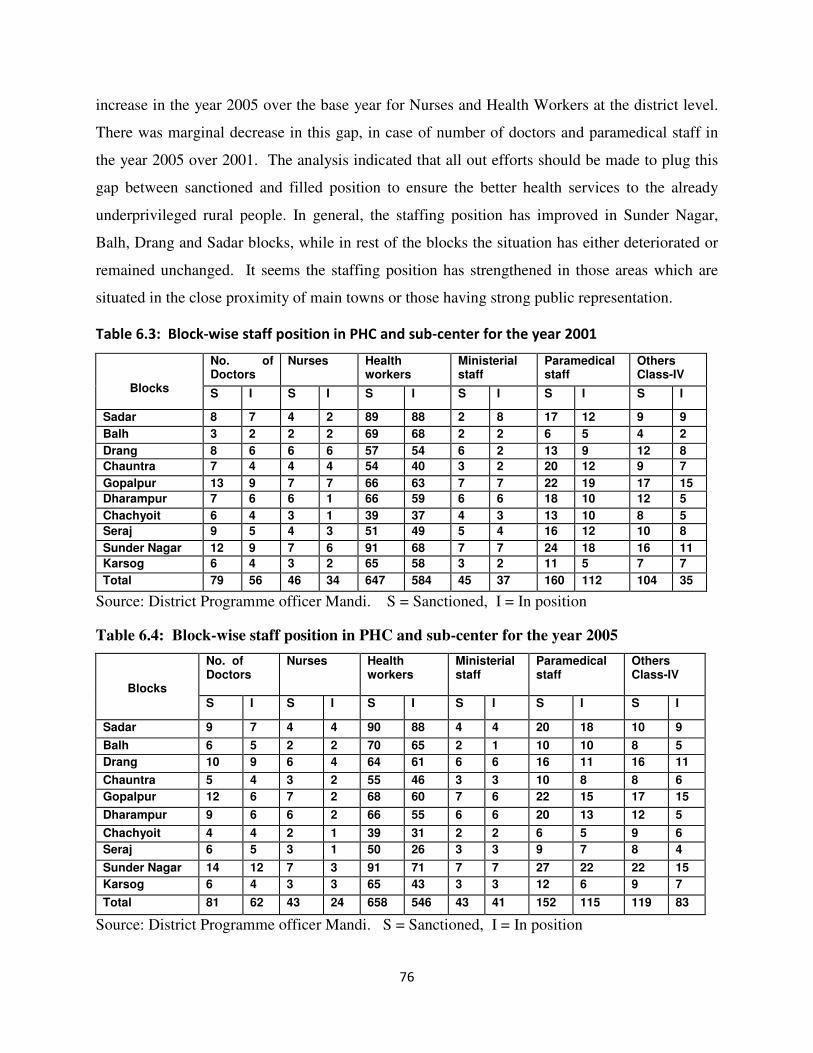
76
increase in the year 2005 over the base year for Nurses and Health Workers at the district level.
There was marginal decrease in this gap, in case of number of doctors and paramedical staff in
the year 2005 over 2001. The analysis indicated that all out efforts should be made to plug this
gap between sanctioned and filled position to ensure the better health services to the already
underprivileged rural people. In general, the staffing position has improved in Sunder Nagar,
Balh, Drang and Sadar blocks, while in rest of the blocks the situation has either deteriorated or
remained unchanged. It seems the staffing position has strengthened in those areas which are
situated in the close proximity of main towns or those having strong public representation.
Table 6.3: Block-wise staff position in PHC and sub-center for the year 2001
No. of Doctors
Nurses Health workers
Ministerial staff
Paramedical staff
Others Class-IV
Blocks S I S I S I S I S I S I
Sadar 8 7 4 2 89 88 2 8 17 12 9 9
Balh 3 2 2 2 69 68 2 2 6 5 4 2
Drang 8 6 6 6 57 54 6 2 13 9 12 8
Chauntra 7 4 4 4 54 40 3 2 20 12 9 7
Gopalpur 13 9 7 7 66 63 7 7 22 19 17 15
Dharampur 7 6 6 1 66 59 6 6 18 10 12 5
Chachyoit 6 4 3 1 39 37 4 3 13 10 8 5
Seraj 9 5 4 3 51 49 5 4 16 12 10 8
Sunder Nagar 12 9 7 6 91 68 7 7 24 18 16 11
Karsog 6 4 3 2 65 58 3 2 11 5 7 7
Total 79 56 46 34 647 584 45 37 160 112 104 35
Source: District Programme officer Mandi. S = Sanctioned, I = In position
Table 6.4: Block-wise staff position in PHC and sub-center for the year 2005
No. of Doctors
Nurses Health workers
Ministerial staff
Paramedical staff
Others Class-IV
Blocks
S I S I S I S I S I S I
Sadar 9 7 4 4 90 88 4 4 20 18 10 9
Balh 6 5 2 2 70 65 2 1 10 10 8 5
Drang 10 9 6 4 64 61 6 6 16 11 16 11
Chauntra 5 4 3 2 55 46 3 3 10 8 8 6
Gopalpur 12 6 7 2 68 60 7 6 22 15 17 15
Dharampur 9 6 6 2 66 55 6 6 20 13 12 5
Chachyoit 4 4 2 1 39 31 2 2 6 5 9 6
Seraj 6 5 3 1 50 26 3 3 9 7 8 4
Sunder Nagar 14 12 7 3 91 71 7 7 27 22 22 15
Karsog 6 4 3 3 65 43 3 3 12 6 9 7
Total 81 62 43 24 658 546 43 41 152 115 119 83
Source: District Programme officer Mandi. S = Sanctioned, I = In position
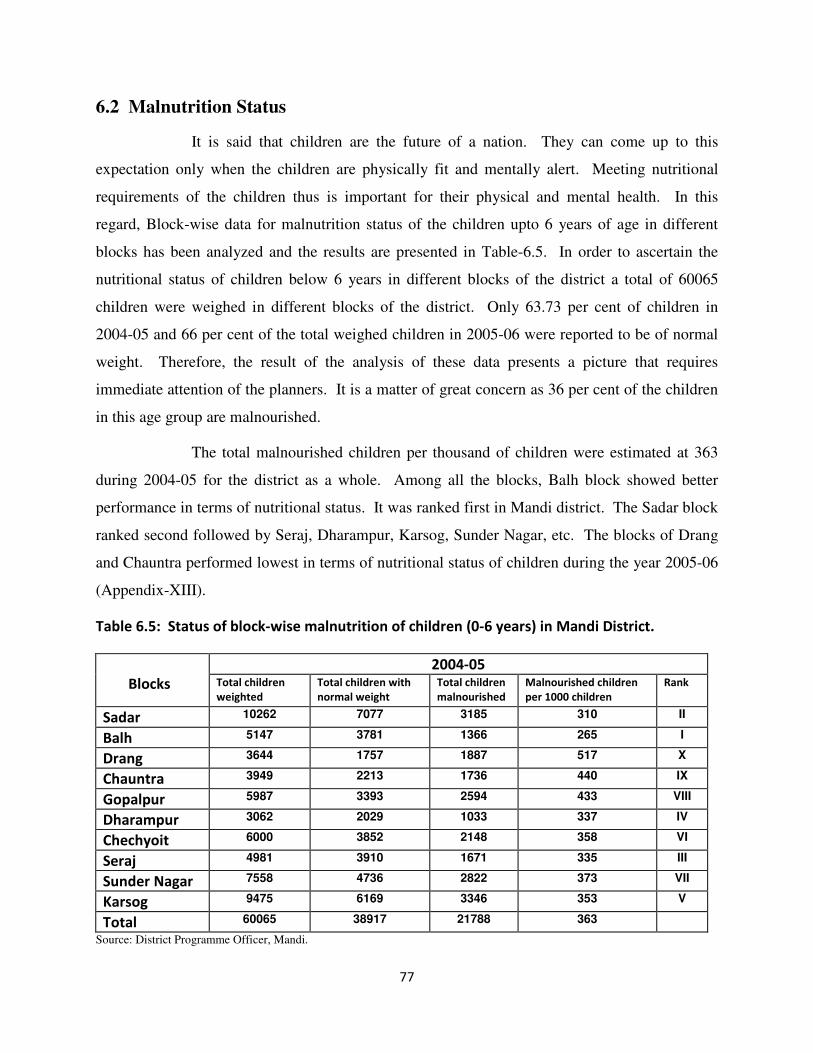
77
6.2 Malnutrition Status
It is said that children are the future of a nation. They can come up to this
expectation only when the children are physically fit and mentally alert. Meeting nutritional
requirements of the children thus is important for their physical and mental health. In this
regard, Block-wise data for malnutrition status of the children upto 6 years of age in different
blocks has been analyzed and the results are presented in Table-6.5. In order to ascertain the
nutritional status of children below 6 years in different blocks of the district a total of 60065
children were weighed in different blocks of the district. Only 63.73 per cent of children in
2004-05 and 66 per cent of the total weighed children in 2005-06 were reported to be of normal
weight. Therefore, the result of the analysis of these data presents a picture that requires
immediate attention of the planners. It is a matter of great concern as 36 per cent of the children
in this age group are malnourished.
The total malnourished children per thousand of children were estimated at 363
during 2004-05 for the district as a whole. Among all the blocks, Balh block showed better
performance in terms of nutritional status. It was ranked first in Mandi district. The Sadar block
ranked second followed by Seraj, Dharampur, Karsog, Sunder Nagar, etc. The blocks of Drang
and Chauntra performed lowest in terms of nutritional status of children during the year 2005-06
(Appendix-XIII).
Table 6.5: Status of block-wise malnutrition of children (0-6 years) in Mandi District.
2004-05
Blocks Total children
weighted
Total children with
normal weight
Total children
malnourished
Malnourished children
per 1000 children
Rank
Sadar 10262 7077 3185 310 II
Balh 5147 3781 1366 265 I
Drang 3644 1757 1887 517 X
Chauntra 3949 2213 1736 440 IX
Gopalpur 5987 3393 2594 433 VIII
Dharampur 3062 2029 1033 337 IV
Chechyoit 6000 3852 2148 358 VI
Seraj 4981 3910 1671 335 III
Sunder Nagar 7558 4736 2822 373 VII
Karsog 9475 6169 3346 353 V
Total 60065 38917 21788 363
Source: District Programme Officer, Mandi.
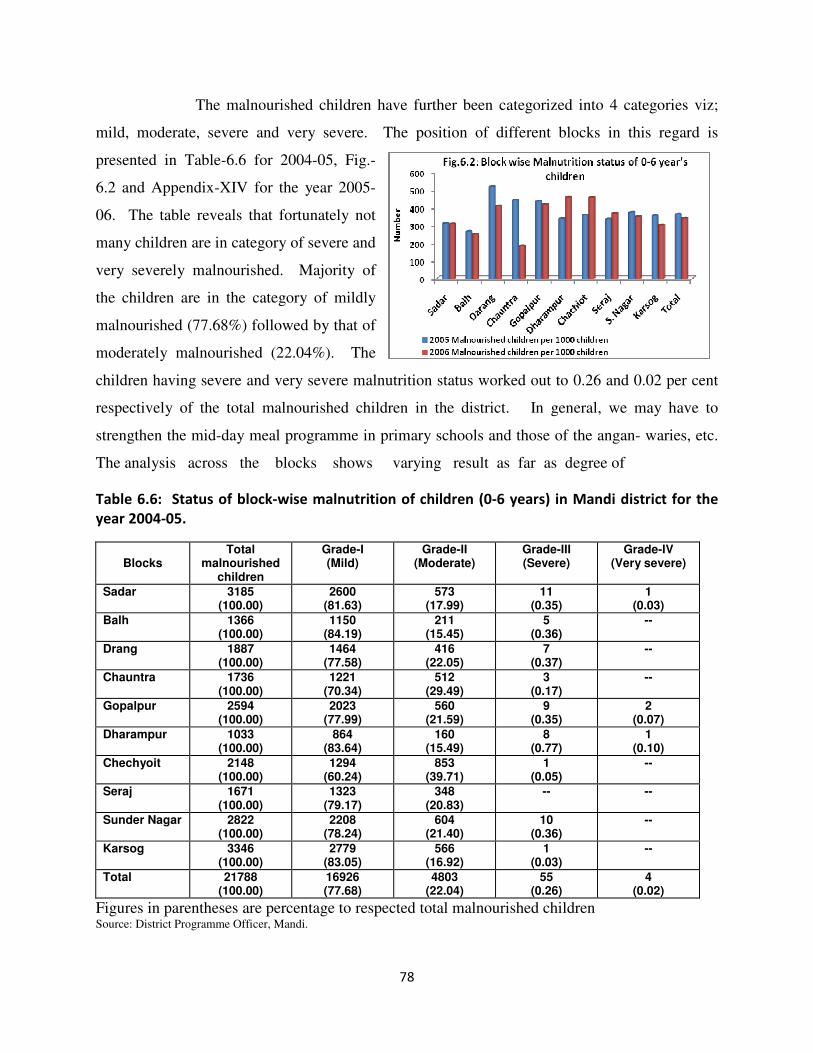
78
The malnourished children have further been categorized into 4 categories viz;
mild, moderate, severe and very severe. The position of different blocks in this regard is
presented in Table-6.6 for 2004-05, Fig.-
6.2 and Appendix-XIV for the year 2005-
06. The table reveals that fortunately not
many children are in category of severe and
very severely malnourished. Majority of
the children are in the category of mildly
malnourished (77.68%) followed by that of
moderately malnourished (22.04%). The
children having severe and very severe malnutrition status worked out to 0.26 and 0.02 per cent
respectively of the total malnourished children in the district. In general, we may have to
strengthen the mid-day meal programme in primary schools and those of the angan- waries, etc.
The analysis across the blocks shows varying result as far as degree of
Table 6.6: Status of block-wise malnutrition of children (0-6 years) in Mandi district for the
year 2004-05.
Blocks
Total malnourished
children
Grade-I (Mild)
Grade-II (Moderate)
Grade-III (Severe)
Grade-IV (Very severe)
Sadar 3185 (100.00)
2600 (81.63)
573 (17.99)
11 (0.35)
1 (0.03)
Balh 1366 (100.00)
1150 (84.19)
211 (15.45)
5 (0.36)
--
Drang 1887 (100.00)
1464 (77.58)
416 (22.05)
7 (0.37)
--
Chauntra 1736 (100.00)
1221 (70.34)
512 (29.49)
3 (0.17)
--
Gopalpur 2594 (100.00)
2023 (77.99)
560 (21.59)
9 (0.35)
2 (0.07)
Dharampur 1033 (100.00)
864 (83.64)
160 (15.49)
8 (0.77)
1 (0.10)
Chechyoit 2148 (100.00)
1294 (60.24)
853 (39.71)
1 (0.05)
--
Seraj 1671 (100.00)
1323 (79.17)
348 (20.83)
-- --
Sunder Nagar 2822 (100.00)
2208 (78.24)
604 (21.40)
10 (0.36)
--
Karsog 3346 (100.00)
2779 (83.05)
566 (16.92)
1 (0.03)
--
Total 21788 (100.00)
16926 (77.68)
4803 (22.04)
55 (0.26)
4 (0.02)
Figures in parentheses are percentage to respected total malnourished children Source: District Programme Officer, Mandi.
79
malnourishment is concerned. Among all the blocks Chachiyoit block had maximum of 40 per
cent of total malnourished, as moderately malnourished. Chauntra block had 29.49 per cent
followed by Drang (22.05%), Gopalpur (21.59%), Sunder Nagar (21.40%) and Seraj 20.83 per
cent as moderately malnourished children. These blocks in particular require greater attention
and better health care services aimed at improving the nutritional status of the children.
6.3 Immunization Progress
Immunization against various diseases during childhood is very important for
long term success of health programmes. Immunization of children at early age against diseases
like diptheria, polio and measles, etc. is done regularly by the parents, particularly in urban areas/
centers. In rural areas, as well, awareness in this regard is quite high and the people are taking
due care in this regard. Mandi district is covered under strong network of immunizing
programmes. These immunization programmes are regularly excluded in all the blocks of the
district and are run through a network of primary health centers, sub-centers and hospitals
spreaded in different blocks of the district. It can be seen from the table that more than 98 per
cent of the eligible children have been immunized during the year 2005. The immunization was
successfully and regularly done in all the blocks of the Mandi. The block-wise progress of
immunization of eligible children for the year 2001 and 2005 have been presented in Table-6.7
and 6.8.
At overall level, about 83.17 per cent of the eligible children were immunized
during 2001, while this figure rose to 98.29 per cent of the eligible children in 2005. The block-
wise position of the progress in this regard is also satisfactory, with the percentage of immunized
children ranging between 94.16 per cent in Seraj and 99.86 per cent in Dharampur block in 2005.
In case of Karsog block, immunization progress was very low during 2001. Here the percentage
of immunized children was just 47.32 per cent of the eligible children in 2001. However, the
position of this block improved significantly in 2005. It is evident from the table that the
proportion of immunized children is relatively high in all the blocks, implying thereby that the
people of the district are well aware of the utility of immunization programme and are actively
participating in this programme.
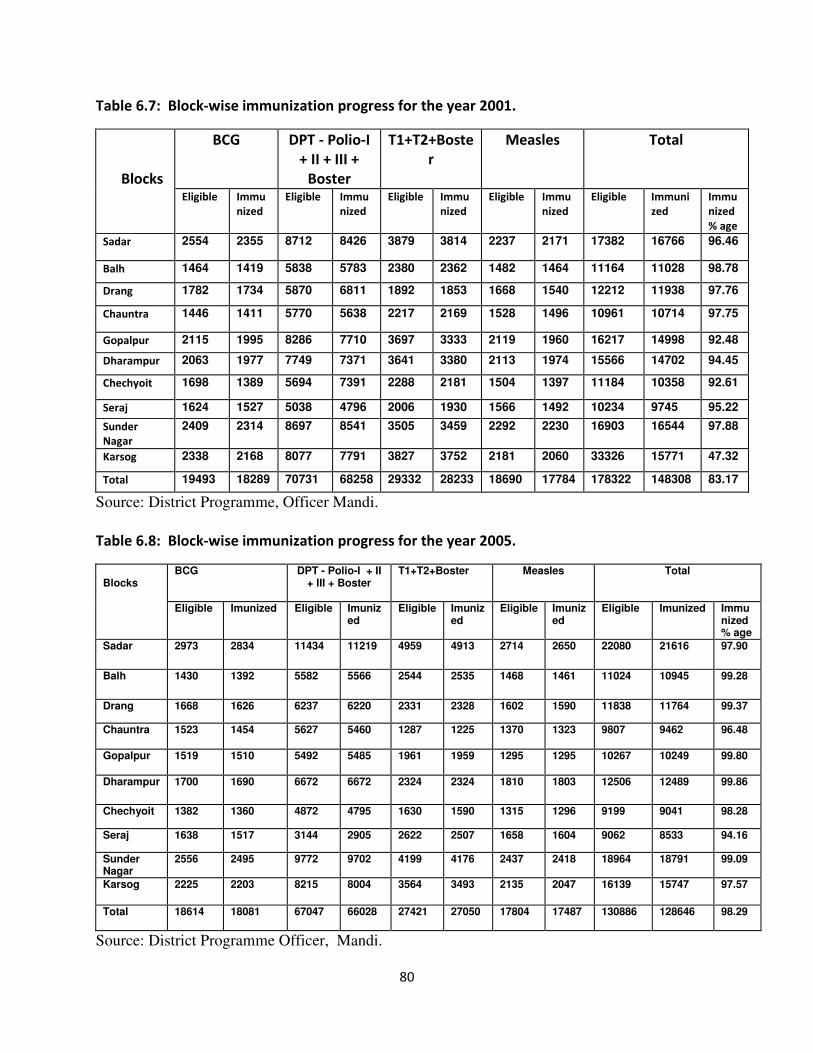
80
Table 6.7: Block-wise immunization progress for the year 2001.
BCG DPT - Polio-I
+ II + III +
Boster
T1+T2+Boste
r
Measles
Total
Blocks Eligible Immu
nized
Eligible Immu
nized
Eligible Immu
nized
Eligible Immu
nized
Eligible Immuni
zed
Immu
nized
% age
Sadar 2554 2355 8712 8426 3879 3814 2237 2171 17382 16766 96.46
Balh 1464 1419 5838 5783 2380 2362 1482 1464 11164 11028 98.78
Drang 1782 1734 5870 6811 1892 1853 1668 1540 12212 11938 97.76
Chauntra 1446 1411 5770 5638 2217 2169 1528 1496 10961 10714 97.75
Gopalpur 2115 1995 8286 7710 3697 3333 2119 1960 16217 14998 92.48
Dharampur 2063 1977 7749 7371 3641 3380 2113 1974 15566 14702 94.45
Chechyoit 1698 1389 5694 7391 2288 2181 1504 1397 11184 10358 92.61
Seraj 1624 1527 5038 4796 2006 1930 1566 1492 10234 9745 95.22
Sunder
Nagar
2409 2314 8697 8541 3505 3459 2292 2230 16903 16544 97.88
Karsog 2338 2168 8077 7791 3827 3752 2181 2060 33326 15771 47.32
Total 19493 18289 70731 68258 29332 28233 18690 17784 178322 148308 83.17
Source: District Programme, Officer Mandi.
Table 6.8: Block-wise immunization progress for the year 2005.
BCG DPT - Polio-I + II + III + Boster
T1+T2+Boster Measles
Total Blocks
Eligible Imunized Eligible Imunized
Eligible Imunized
Eligible Imunized
Eligible Imunized Immunized % age
Sadar 2973 2834 11434 11219 4959 4913 2714 2650 22080 21616 97.90
Balh 1430 1392 5582 5566 2544 2535 1468 1461 11024 10945 99.28
Drang 1668 1626 6237 6220 2331 2328 1602 1590 11838 11764 99.37
Chauntra 1523 1454 5627 5460 1287 1225 1370 1323 9807 9462 96.48
Gopalpur 1519 1510 5492 5485 1961 1959 1295 1295 10267 10249 99.80
Dharampur 1700 1690 6672 6672 2324 2324 1810 1803 12506 12489 99.86
Chechyoit 1382 1360 4872 4795 1630 1590 1315 1296 9199 9041 98.28
Seraj 1638 1517 3144 2905 2622 2507 1658 1604 9062 8533 94.16
Sunder Nagar
2556 2495 9772 9702 4199 4176 2437 2418 18964 18791 99.09
Karsog 2225 2203 8215 8004 3564 3493 2135 2047 16139 15747 97.57
Total 18614 18081 67047 66028 27421 27050 17804 17487 130886 128646 98.29
Source: District Programme Officer, Mandi.
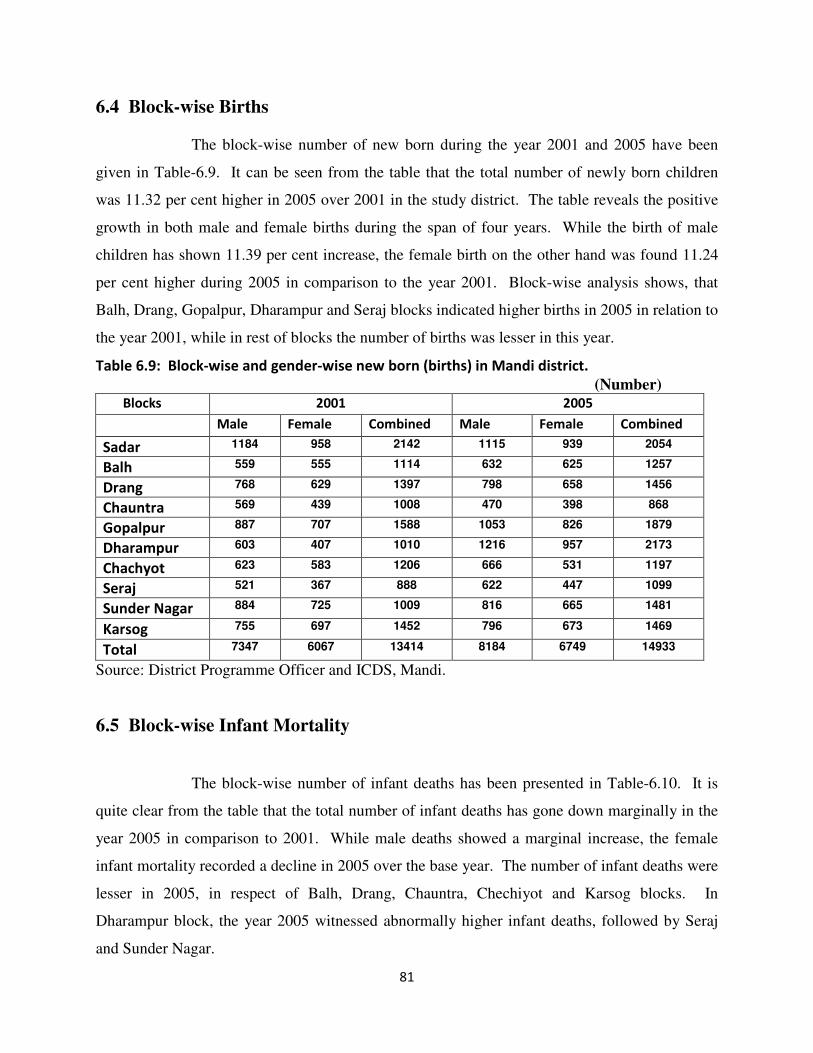
81
6.4 Block-wise Births
The block-wise number of new born during the year 2001 and 2005 have been
given in Table-6.9. It can be seen from the table that the total number of newly born children
was 11.32 per cent higher in 2005 over 2001 in the study district. The table reveals the positive
growth in both male and female births during the span of four years. While the birth of male
children has shown 11.39 per cent increase, the female birth on the other hand was found 11.24
per cent higher during 2005 in comparison to the year 2001. Block-wise analysis shows, that
Balh, Drang, Gopalpur, Dharampur and Seraj blocks indicated higher births in 2005 in relation to
the year 2001, while in rest of blocks the number of births was lesser in this year.
Table 6.9: Block-wise and gender-wise new born (births) in Mandi district.
(Number)
Blocks 2001 2005
Male Female Combined Male Female Combined
Sadar 1184 958 2142 1115 939 2054
Balh 559 555 1114 632 625 1257
Drang 768 629 1397 798 658 1456
Chauntra 569 439 1008 470 398 868
Gopalpur 887 707 1588 1053 826 1879
Dharampur 603 407 1010 1216 957 2173
Chachyot 623 583 1206 666 531 1197
Seraj 521 367 888 622 447 1099
Sunder Nagar 884 725 1009 816 665 1481
Karsog 755 697 1452 796 673 1469
Total 7347 6067 13414 8184 6749 14933
Source: District Programme Officer and ICDS, Mandi.
6.5 Block-wise Infant Mortality
The block-wise number of infant deaths has been presented in Table-6.10. It is
quite clear from the table that the total number of infant deaths has gone down marginally in the
year 2005 in comparison to 2001. While male deaths showed a marginal increase, the female
infant mortality recorded a decline in 2005 over the base year. The number of infant deaths were
lesser in 2005, in respect of Balh, Drang, Chauntra, Chechiyot and Karsog blocks. In
Dharampur block, the year 2005 witnessed abnormally higher infant deaths, followed by Seraj
and Sunder Nagar.
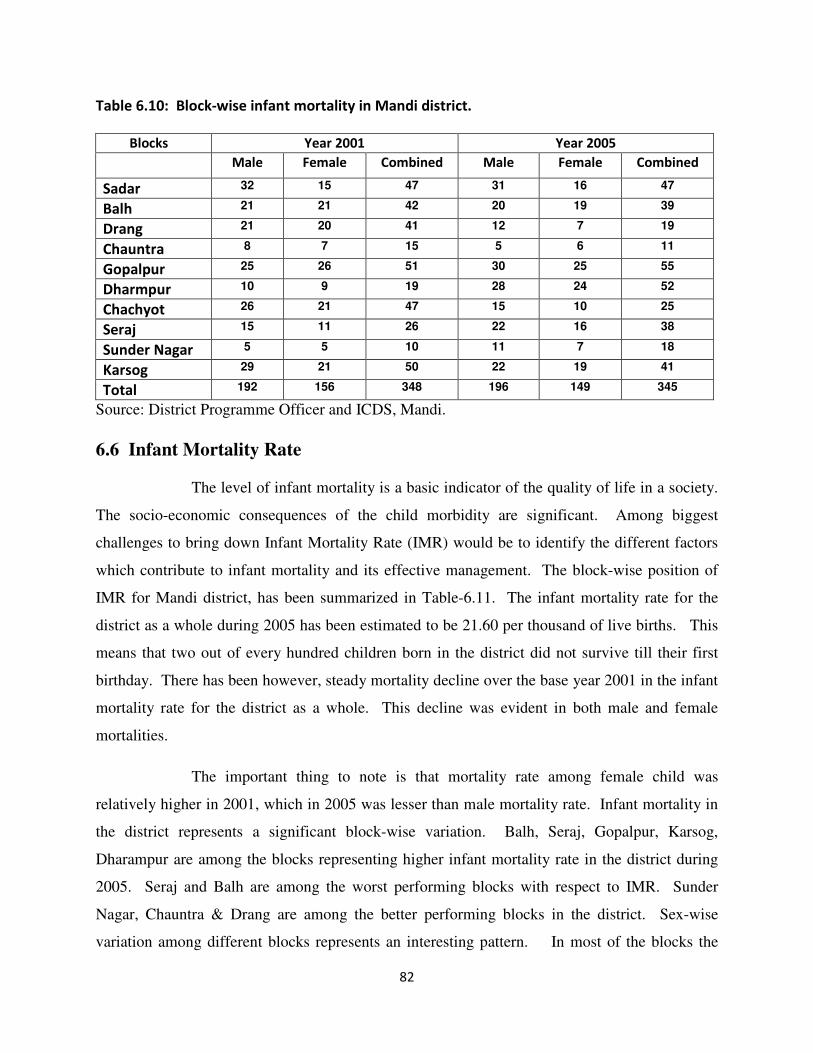
82
Table 6.10: Block-wise infant mortality in Mandi district.
Blocks Year 2001 Year 2005
Male Female Combined Male Female Combined
Sadar 32 15 47 31 16 47
Balh 21 21 42 20 19 39
Drang 21 20 41 12 7 19
Chauntra 8 7 15 5 6 11
Gopalpur 25 26 51 30 25 55
Dharmpur 10 9 19 28 24 52
Chachyot 26 21 47 15 10 25
Seraj 15 11 26 22 16 38
Sunder Nagar 5 5 10 11 7 18
Karsog 29 21 50 22 19 41
Total 192 156 348 196 149 345
Source: District Programme Officer and ICDS, Mandi.
6.6 Infant Mortality Rate
The level of infant mortality is a basic indicator of the quality of life in a society.
The socio-economic consequences of the child morbidity are significant. Among biggest
challenges to bring down Infant Mortality Rate (IMR) would be to identify the different factors
which contribute to infant mortality and its effective management. The block-wise position of
IMR for Mandi district, has been summarized in Table-6.11. The infant mortality rate for the
district as a whole during 2005 has been estimated to be 21.60 per thousand of live births. This
means that two out of every hundred children born in the district did not survive till their first
birthday. There has been however, steady mortality decline over the base year 2001 in the infant
mortality rate for the district as a whole. This decline was evident in both male and female
mortalities.
The important thing to note is that mortality rate among female child was
relatively higher in 2001, which in 2005 was lesser than male mortality rate. Infant mortality in
the district represents a significant block-wise variation. Balh, Seraj, Gopalpur, Karsog,
Dharampur are among the blocks representing higher infant mortality rate in the district during
2005. Seraj and Balh are among the worst performing blocks with respect to IMR. Sunder
Nagar, Chauntra & Drang are among the better performing blocks in the district. Sex-wise
variation among different blocks represents an interesting pattern. In most of the blocks the
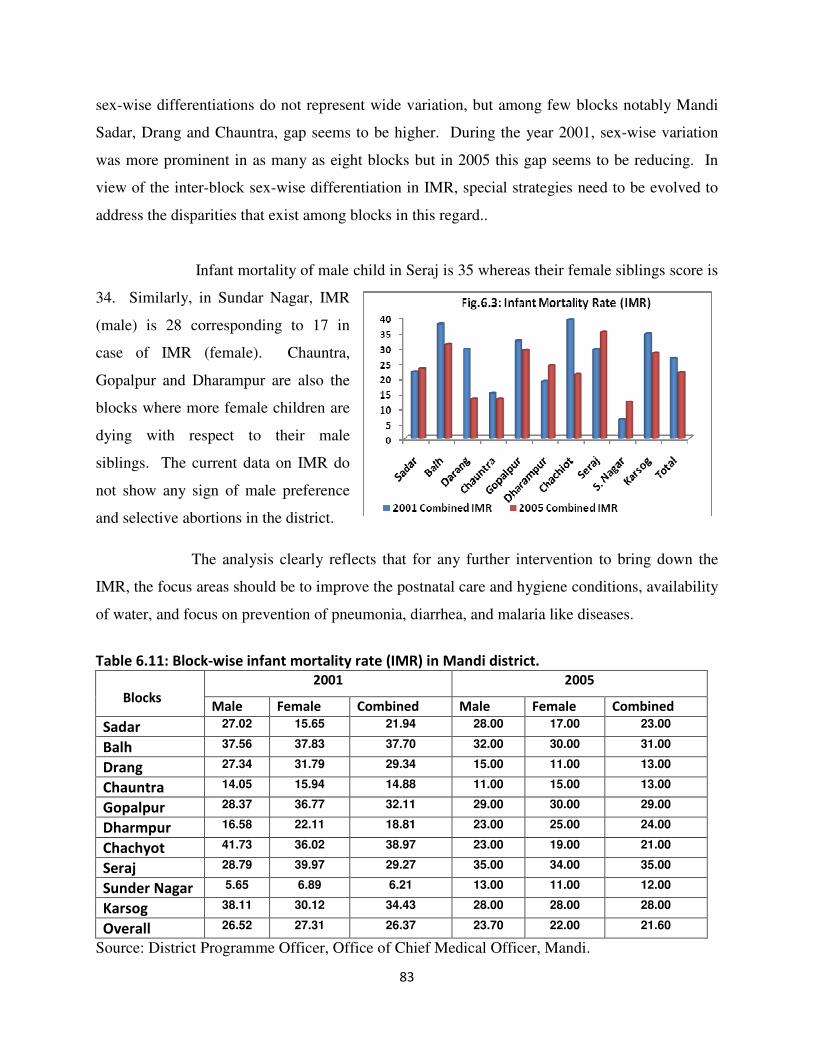
83
sex-wise differentiations do not represent wide variation, but among few blocks notably Mandi
Sadar, Drang and Chauntra, gap seems to be higher. During the year 2001, sex-wise variation
was more prominent in as many as eight blocks but in 2005 this gap seems to be reducing. In
view of the inter-block sex-wise differentiation in IMR, special strategies need to be evolved to
address the disparities that exist among blocks in this regard..
Infant mortality of male child in Seraj is 35 whereas their female siblings score is
34. Similarly, in Sundar Nagar, IMR
(male) is 28 corresponding to 17 in
case of IMR (female). Chauntra,
Gopalpur and Dharampur are also the
blocks where more female children are
dying with respect to their male
siblings. The current data on IMR do
not show any sign of male preference
and selective abortions in the district.
The analysis clearly reflects that for any further intervention to bring down the
IMR, the focus areas should be to improve the postnatal care and hygiene conditions, availability
of water, and focus on prevention of pneumonia, diarrhea, and malaria like diseases.
Table 6.11: Block-wise infant mortality rate (IMR) in Mandi district.
2001 2005
Blocks Male Female Combined Male Female Combined
Sadar 27.02 15.65 21.94 28.00 17.00 23.00
Balh 37.56 37.83 37.70 32.00 30.00 31.00
Drang 27.34 31.79 29.34 15.00 11.00 13.00
Chauntra 14.05 15.94 14.88 11.00 15.00 13.00
Gopalpur 28.37 36.77 32.11 29.00 30.00 29.00
Dharmpur 16.58 22.11 18.81 23.00 25.00 24.00
Chachyot 41.73 36.02 38.97 23.00 19.00 21.00
Seraj 28.79 39.97 29.27 35.00 34.00 35.00
Sunder Nagar 5.65 6.89 6.21 13.00 11.00 12.00
Karsog 38.11 30.12 34.43 28.00 28.00 28.00
Overall 26.52 27.31 26.37 23.70 22.00 21.60
Source: District Programme Officer, Office of Chief Medical Officer, Mandi.
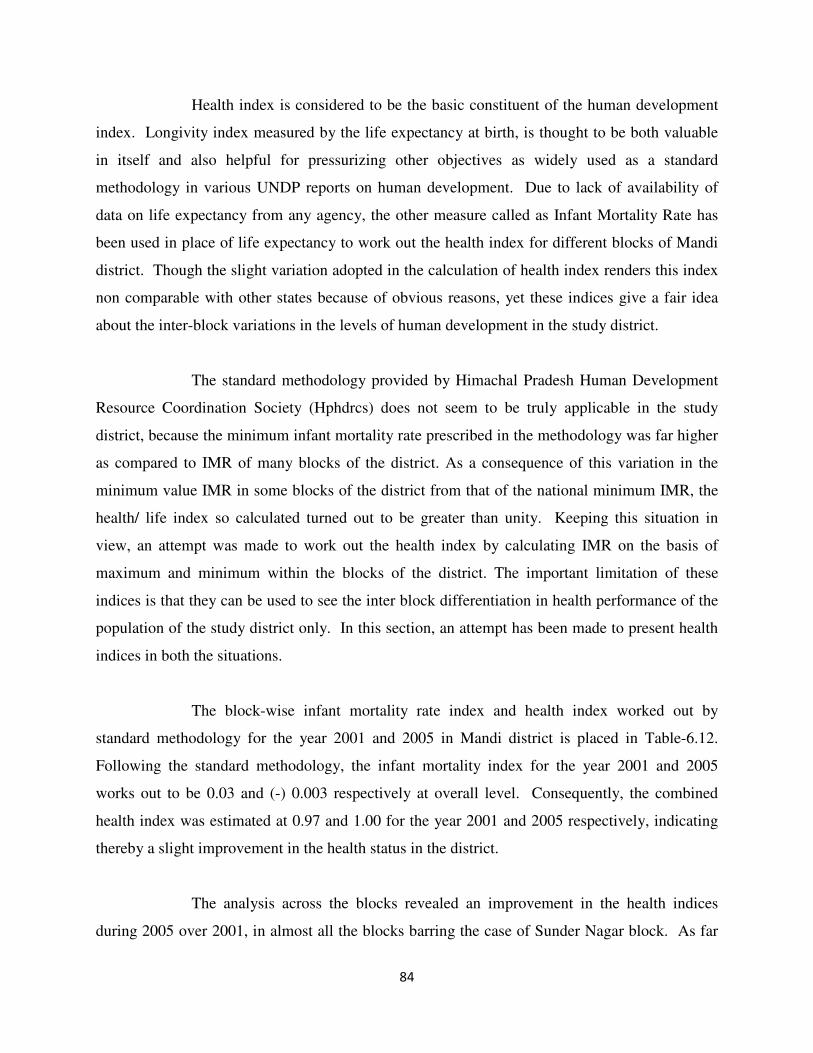
84
Health index is considered to be the basic constituent of the human development
index. Longivity index measured by the life expectancy at birth, is thought to be both valuable
in itself and also helpful for pressurizing other objectives as widely used as a standard
methodology in various UNDP reports on human development. Due to lack of availability of
data on life expectancy from any agency, the other measure called as Infant Mortality Rate has
been used in place of life expectancy to work out the health index for different blocks of Mandi
district. Though the slight variation adopted in the calculation of health index renders this index
non comparable with other states because of obvious reasons, yet these indices give a fair idea
about the inter-block variations in the levels of human development in the study district.
The standard methodology provided by Himachal Pradesh Human Development
Resource Coordination Society (Hphdrcs) does not seem to be truly applicable in the study
district, because the minimum infant mortality rate prescribed in the methodology was far higher
as compared to IMR of many blocks of the district. As a consequence of this variation in the
minimum value IMR in some blocks of the district from that of the national minimum IMR, the
health/ life index so calculated turned out to be greater than unity. Keeping this situation in
view, an attempt was made to work out the health index by calculating IMR on the basis of
maximum and minimum within the blocks of the district. The important limitation of these
indices is that they can be used to see the inter block differentiation in health performance of the
population of the study district only. In this section, an attempt has been made to present health
indices in both the situations.
The block-wise infant mortality rate index and health index worked out by
standard methodology for the year 2001 and 2005 in Mandi district is placed in Table-6.12.
Following the standard methodology, the infant mortality index for the year 2001 and 2005
works out to be 0.03 and (-) 0.003 respectively at overall level. Consequently, the combined
health index was estimated at 0.97 and 1.00 for the year 2001 and 2005 respectively, indicating
thereby a slight improvement in the health status in the district.
The analysis across the blocks revealed an improvement in the health indices
during 2005 over 2001, in almost all the blocks barring the case of Sunder Nagar block. As far
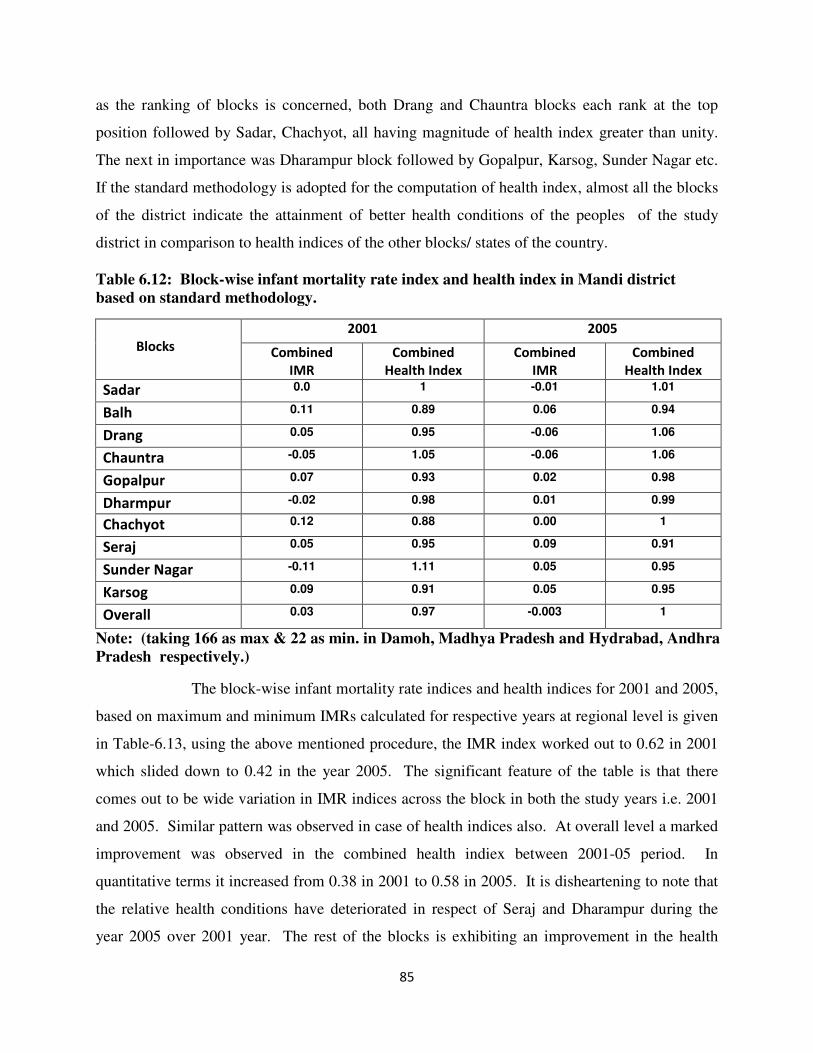
85
as the ranking of blocks is concerned, both Drang and Chauntra blocks each rank at the top
position followed by Sadar, Chachyot, all having magnitude of health index greater than unity.
The next in importance was Dharampur block followed by Gopalpur, Karsog, Sunder Nagar etc.
If the standard methodology is adopted for the computation of health index, almost all the blocks
of the district indicate the attainment of better health conditions of the peoples of the study
district in comparison to health indices of the other blocks/ states of the country.
Table 6.12: Block-wise infant mortality rate index and health index in Mandi district
based on standard methodology.
2001 2005
Blocks Combined
IMR
Combined
Health Index
Combined
IMR
Combined
Health Index
Sadar 0.0 1 -0.01 1.01
Balh 0.11 0.89 0.06 0.94
Drang 0.05 0.95 -0.06 1.06
Chauntra -0.05 1.05 -0.06 1.06
Gopalpur 0.07 0.93 0.02 0.98
Dharmpur -0.02 0.98 0.01 0.99
Chachyot 0.12 0.88 0.00 1
Seraj 0.05 0.95 0.09 0.91
Sunder Nagar -0.11 1.11 0.05 0.95
Karsog 0.09 0.91 0.05 0.95
Overall 0.03 0.97 -0.003 1
Note: (taking 166 as max & 22 as min. in Damoh, Madhya Pradesh and Hydrabad, Andhra
Pradesh respectively.)
The block-wise infant mortality rate indices and health indices for 2001 and 2005,
based on maximum and minimum IMRs calculated for respective years at regional level is given
in Table-6.13, using the above mentioned procedure, the IMR index worked out to 0.62 in 2001
which slided down to 0.42 in the year 2005. The significant feature of the table is that there
comes out to be wide variation in IMR indices across the block in both the study years i.e. 2001
and 2005. Similar pattern was observed in case of health indices also. At overall level a marked
improvement was observed in the combined health indiex between 2001-05 period. In
quantitative terms it increased from 0.38 in 2001 to 0.58 in 2005. It is disheartening to note that
the relative health conditions have deteriorated in respect of Seraj and Dharampur during the
year 2005 over 2001 year. The rest of the blocks is exhibiting an improvement in the health
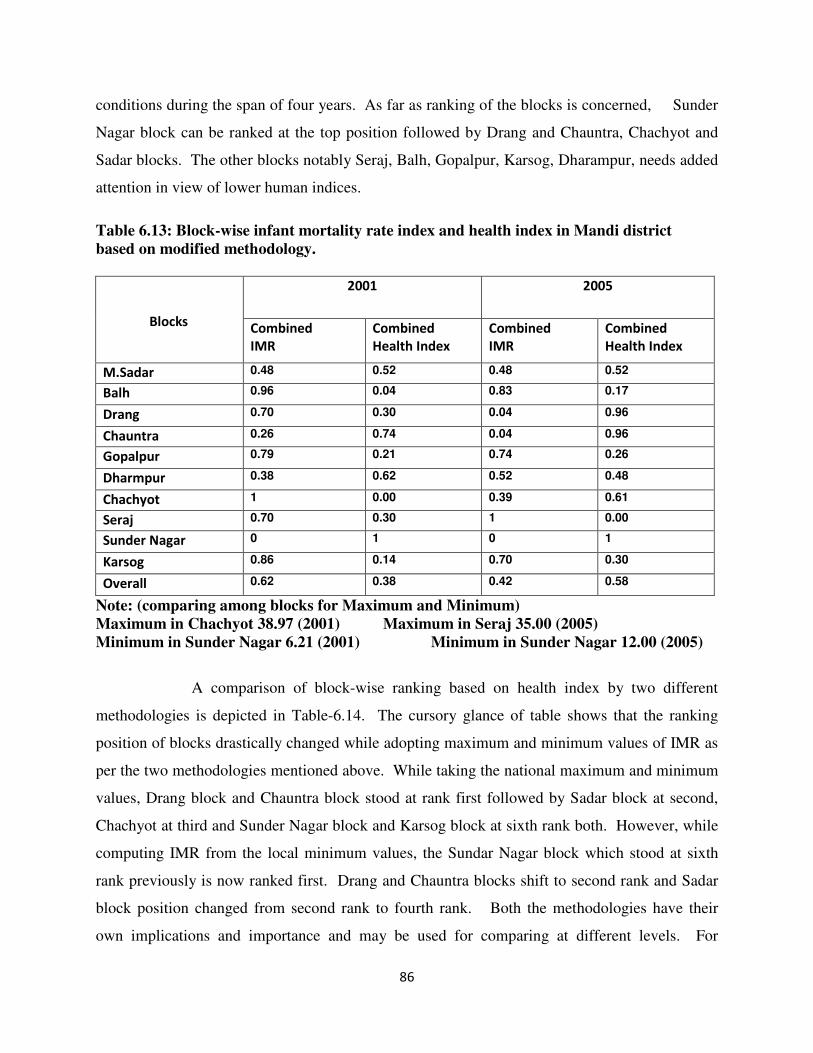
86
conditions during the span of four years. As far as ranking of the blocks is concerned, Sunder
Nagar block can be ranked at the top position followed by Drang and Chauntra, Chachyot and
Sadar blocks. The other blocks notably Seraj, Balh, Gopalpur, Karsog, Dharampur, needs added
attention in view of lower human indices.
Table 6.13: Block-wise infant mortality rate index and health index in Mandi district
based on modified methodology.
2001
2005
Blocks Combined
IMR
Combined
Health Index
Combined
IMR
Combined
Health Index
M.Sadar 0.48 0.52 0.48 0.52
Balh 0.96 0.04 0.83 0.17
Drang 0.70 0.30 0.04 0.96
Chauntra 0.26 0.74 0.04 0.96
Gopalpur 0.79 0.21 0.74 0.26
Dharmpur 0.38 0.62 0.52 0.48
Chachyot 1 0.00 0.39 0.61
Seraj 0.70 0.30 1 0.00
Sunder Nagar 0 1 0 1
Karsog 0.86 0.14 0.70 0.30
Overall 0.62 0.38 0.42 0.58
Note: (comparing among blocks for Maximum and Minimum)
Maximum in Chachyot 38.97 (2001) Maximum in Seraj 35.00 (2005)
Minimum in Sunder Nagar 6.21 (2001) Minimum in Sunder Nagar 12.00 (2005)
A comparison of block-wise ranking based on health index by two different
methodologies is depicted in Table-6.14. The cursory glance of table shows that the ranking
position of blocks drastically changed while adopting maximum and minimum values of IMR as
per the two methodologies mentioned above. While taking the national maximum and minimum
values, Drang block and Chauntra block stood at rank first followed by Sadar block at second,
Chachyot at third and Sunder Nagar block and Karsog block at sixth rank both. However, while
computing IMR from the local minimum values, the Sundar Nagar block which stood at sixth
rank previously is now ranked first. Drang and Chauntra blocks shift to second rank and Sadar
block position changed from second rank to fourth rank. Both the methodologies have their
own implications and importance and may be used for comparing at different levels. For
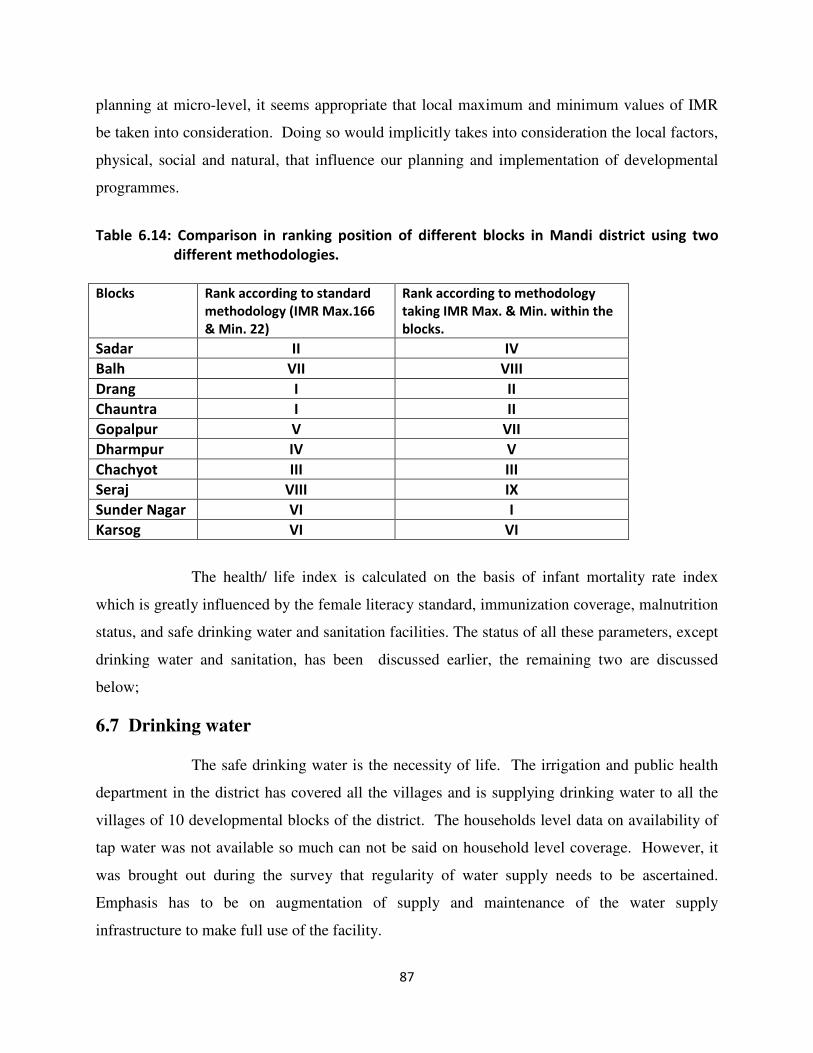
87
planning at micro-level, it seems appropriate that local maximum and minimum values of IMR
be taken into consideration. Doing so would implicitly takes into consideration the local factors,
physical, social and natural, that influence our planning and implementation of developmental
programmes.
Table 6.14: Comparison in ranking position of different blocks in Mandi district using two
different methodologies.
Blocks Rank according to standard
methodology (IMR Max.166
& Min. 22)
Rank according to methodology
taking IMR Max. & Min. within the
blocks.
Sadar II IV
Balh VII VIII
Drang I II
Chauntra I II
Gopalpur V VII
Dharmpur IV V
Chachyot III III
Seraj VIII IX
Sunder Nagar VI I
Karsog VI VI
The health/ life index is calculated on the basis of infant mortality rate index
which is greatly influenced by the female literacy standard, immunization coverage, malnutrition
status, and safe drinking water and sanitation facilities. The status of all these parameters, except
drinking water and sanitation, has been discussed earlier, the remaining two are discussed
below;
6.7 Drinking water
The safe drinking water is the necessity of life. The irrigation and public health
department in the district has covered all the villages and is supplying drinking water to all the
villages of 10 developmental blocks of the district. The households level data on availability of
tap water was not available so much can not be said on household level coverage. However, it
was brought out during the survey that regularity of water supply needs to be ascertained.
Emphasis has to be on augmentation of supply and maintenance of the water supply
infrastructure to make full use of the facility.
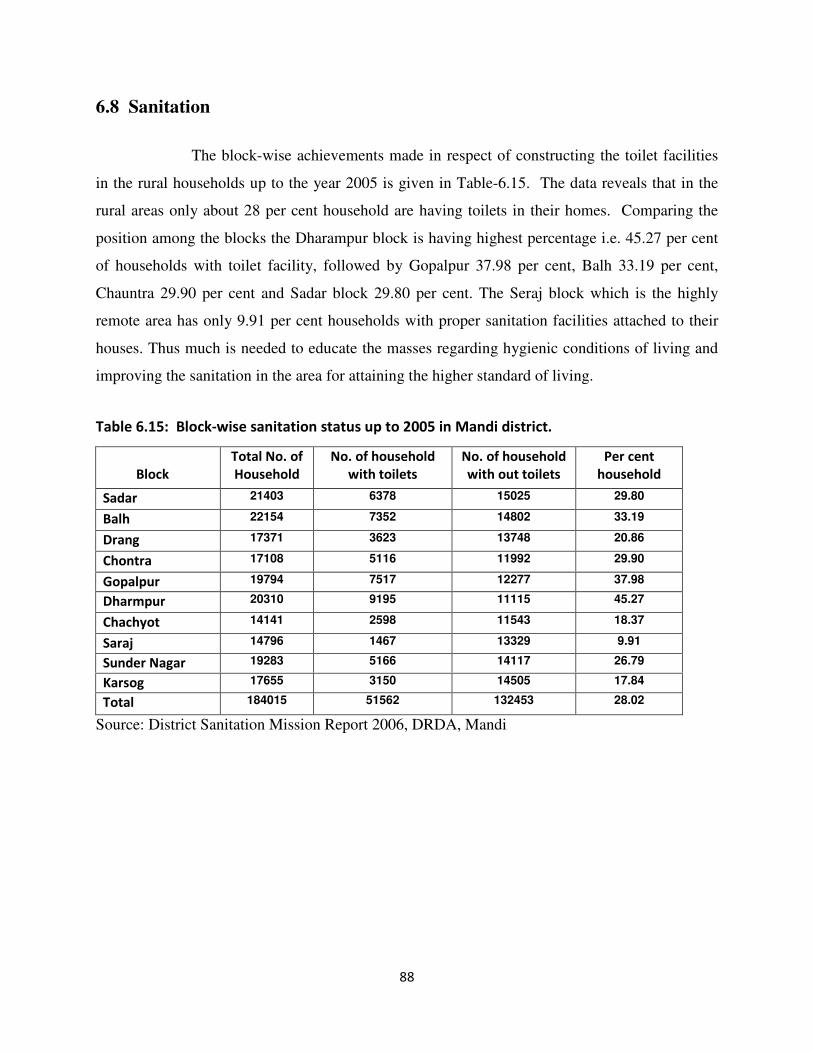
88
6.8 Sanitation
The block-wise achievements made in respect of constructing the toilet facilities
in the rural households up to the year 2005 is given in Table-6.15. The data reveals that in the
rural areas only about 28 per cent household are having toilets in their homes. Comparing the
position among the blocks the Dharampur block is having highest percentage i.e. 45.27 per cent
of households with toilet facility, followed by Gopalpur 37.98 per cent, Balh 33.19 per cent,
Chauntra 29.90 per cent and Sadar block 29.80 per cent. The Seraj block which is the highly
remote area has only 9.91 per cent households with proper sanitation facilities attached to their
houses. Thus much is needed to educate the masses regarding hygienic conditions of living and
improving the sanitation in the area for attaining the higher standard of living.
Table 6.15: Block-wise sanitation status up to 2005 in Mandi district.
Source: District Sanitation Mission Report 2006, DRDA, Mandi
Block
Total No. of
Household
No. of household
with toilets
No. of household
with out toilets
Per cent
household
Sadar 21403 6378 15025 29.80
Balh 22154 7352 14802 33.19
Drang 17371 3623 13748 20.86
Chontra 17108 5116 11992 29.90
Gopalpur 19794 7517 12277 37.98
Dharmpur 20310 9195 11115 45.27
Chachyot 14141 2598 11543 18.37
Saraj 14796 1467 13329 9.91
Sunder Nagar 19283 5166 14117 26.79
Karsog 17655 3150 14505 17.84
Total 184015 51562 132453 28.02
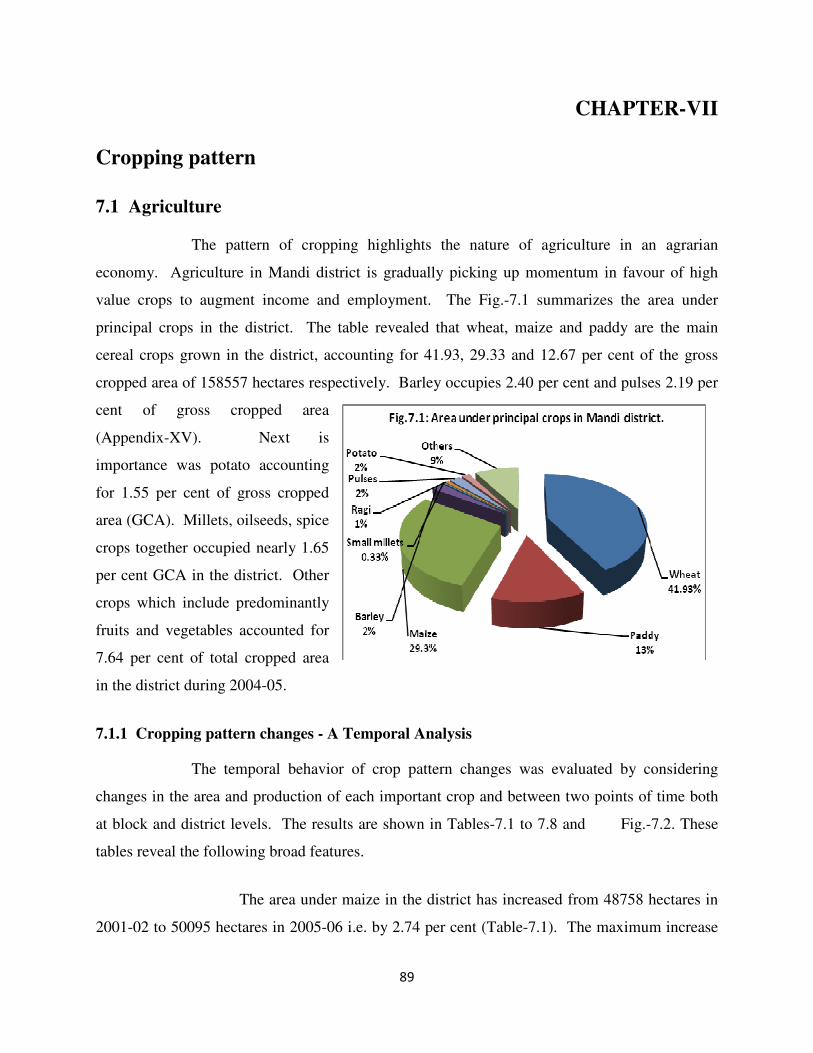
89
CHAPTER-VII
Cropping pattern
7.1 Agriculture
The pattern of cropping highlights the nature of agriculture in an agrarian
economy. Agriculture in Mandi district is gradually picking up momentum in favour of high
value crops to augment income and employment. The Fig.-7.1 summarizes the area under
principal crops in the district. The table revealed that wheat, maize and paddy are the main
cereal crops grown in the district, accounting for 41.93, 29.33 and 12.67 per cent of the gross
cropped area of 158557 hectares respectively. Barley occupies 2.40 per cent and pulses 2.19 per
cent of gross cropped area
(Appendix-XV). Next is
importance was potato accounting
for 1.55 per cent of gross cropped
area (GCA). Millets, oilseeds, spice
crops together occupied nearly 1.65
per cent GCA in the district. Other
crops which include predominantly
fruits and vegetables accounted for
7.64 per cent of total cropped area
in the district during 2004-05.
7.1.1 Cropping pattern changes - A Temporal Analysis
The temporal behavior of crop pattern changes was evaluated by considering
changes in the area and production of each important crop and between two points of time both
at block and district levels. The results are shown in Tables-7.1 to 7.8 and Fig.-7.2. These
tables reveal the following broad features.
The area under maize in the district has increased from 48758 hectares in
2001-02 to 50095 hectares in 2005-06 i.e. by 2.74 per cent (Table-7.1). The maximum increase
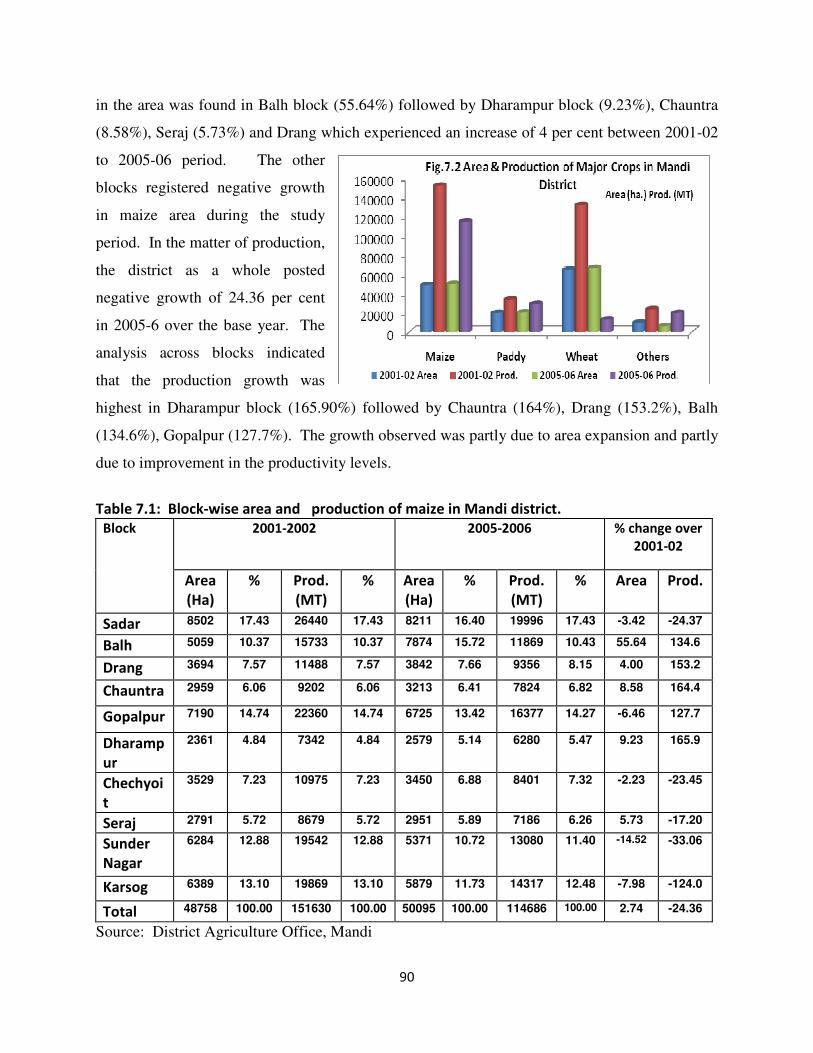
90
in the area was found in Balh block (55.64%) followed by Dharampur block (9.23%), Chauntra
(8.58%), Seraj (5.73%) and Drang which experienced an increase of 4 per cent between 2001-02
to 2005-06 period. The other
blocks registered negative growth
in maize area during the study
period. In the matter of production,
the district as a whole posted
negative growth of 24.36 per cent
in 2005-6 over the base year. The
analysis across blocks indicated
that the production growth was
highest in Dharampur block (165.90%) followed by Chauntra (164%), Drang (153.2%), Balh
(134.6%), Gopalpur (127.7%). The growth observed was partly due to area expansion and partly
due to improvement in the productivity levels.
Table 7.1: Block-wise area and production of maize in Mandi district.
2001-2002 2005-2006 % change over
2001-02
Block
Area
(Ha)
% Prod.
(MT)
%
Area
(Ha)
% Prod.
(MT)
%
Area Prod.
Sadar 8502 17.43 26440 17.43 8211 16.40 19996 17.43 -3.42 -24.37
Balh 5059 10.37 15733 10.37 7874 15.72 11869 10.43 55.64 134.6
Drang 3694 7.57 11488 7.57 3842 7.66 9356 8.15 4.00 153.2
Chauntra 2959 6.06 9202 6.06 3213 6.41 7824 6.82 8.58 164.4
Gopalpur 7190 14.74 22360 14.74 6725 13.42 16377 14.27 -6.46 127.7
Dharamp
ur
2361 4.84 7342 4.84 2579 5.14 6280 5.47 9.23 165.9
Chechyoi
t
3529 7.23 10975 7.23 3450 6.88 8401 7.32 -2.23 -23.45
Seraj 2791 5.72 8679 5.72 2951 5.89 7186 6.26 5.73 -17.20
Sunder
Nagar
6284 12.88 19542 12.88
5371 10.72 13080 11.40
-14.52 -33.06
Karsog 6389 13.10 19869 13.10 5879 11.73 14317 12.48 -7.98 -124.0
Total 48758 100.00 151630 100.00 50095 100.00 114686 100.00 2.74 -24.36
Source: District Agriculture Office, Mandi
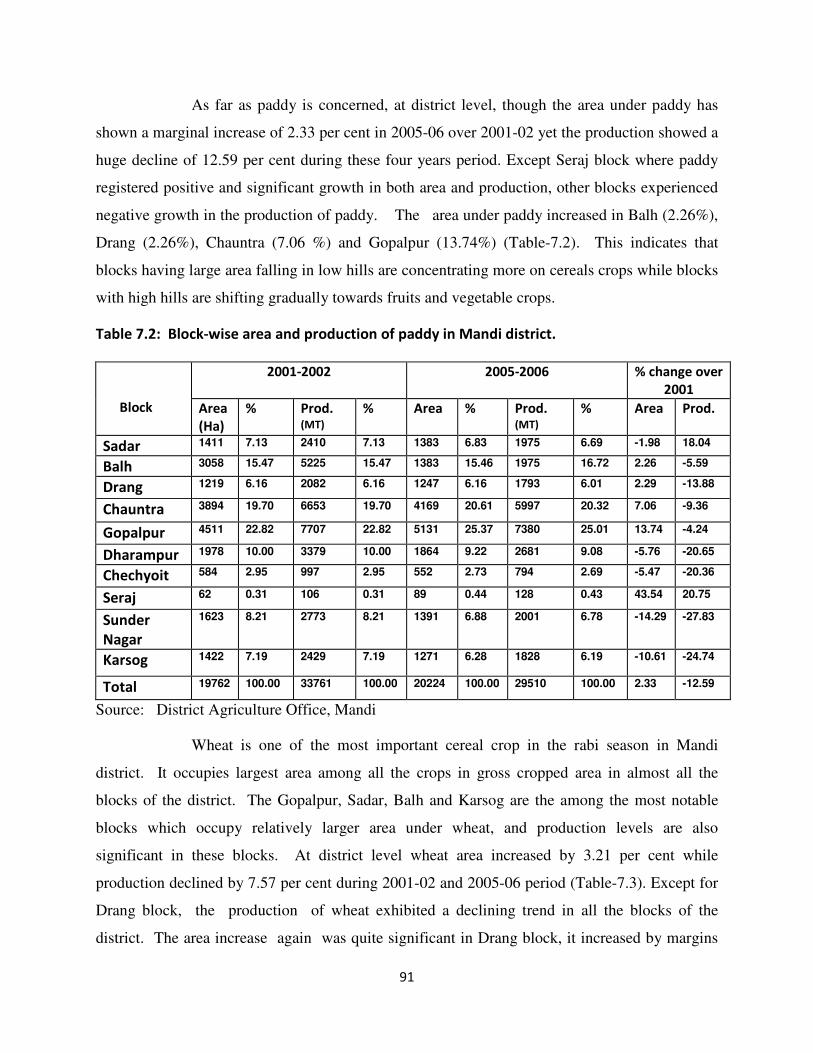
91
As far as paddy is concerned, at district level, though the area under paddy has
shown a marginal increase of 2.33 per cent in 2005-06 over 2001-02 yet the production showed a
huge decline of 12.59 per cent during these four years period. Except Seraj block where paddy
registered positive and significant growth in both area and production, other blocks experienced
negative growth in the production of paddy. The area under paddy increased in Balh (2.26%),
Drang (2.26%), Chauntra (7.06 %) and Gopalpur (13.74%) (Table-7.2). This indicates that
blocks having large area falling in low hills are concentrating more on cereals crops while blocks
with high hills are shifting gradually towards fruits and vegetable crops.
Table 7.2: Block-wise area and production of paddy in Mandi district.
2001-2002 2005-2006 % change over
2001
Block Area
(Ha)
% Prod. (MT)
%
Area % Prod. (MT)
%
Area Prod.
Sadar 1411 7.13 2410 7.13 1383 6.83 1975 6.69 -1.98 18.04
Balh 3058 15.47 5225 15.47 1383 15.46 1975 16.72 2.26 -5.59
Drang 1219 6.16 2082 6.16 1247 6.16 1793 6.01 2.29 -13.88
Chauntra 3894 19.70 6653 19.70 4169 20.61 5997 20.32 7.06 -9.36
Gopalpur 4511 22.82 7707 22.82 5131 25.37 7380 25.01 13.74 -4.24
Dharampur 1978 10.00 3379 10.00 1864 9.22 2681 9.08 -5.76 -20.65
Chechyoit 584 2.95 997 2.95 552 2.73 794 2.69 -5.47 -20.36
Seraj 62 0.31 106 0.31 89 0.44 128 0.43 43.54 20.75
Sunder
Nagar
1623 8.21 2773 8.21 1391 6.88 2001 6.78 -14.29 -27.83
Karsog 1422 7.19 2429 7.19
1271 6.28 1828 6.19
-10.61 -24.74
Total 19762 100.00 33761 100.00 20224 100.00 29510 100.00 2.33 -12.59
Source: District Agriculture Office, Mandi
Wheat is one of the most important cereal crop in the rabi season in Mandi
district. It occupies largest area among all the crops in gross cropped area in almost all the
blocks of the district. The Gopalpur, Sadar, Balh and Karsog are the among the most notable
blocks which occupy relatively larger area under wheat, and production levels are also
significant in these blocks. At district level wheat area increased by 3.21 per cent while
production declined by 7.57 per cent during 2001-02 and 2005-06 period (Table-7.3). Except for
Drang block, the production of wheat exhibited a declining trend in all the blocks of the
district. The area increase again was quite significant in Drang block, it increased by margins
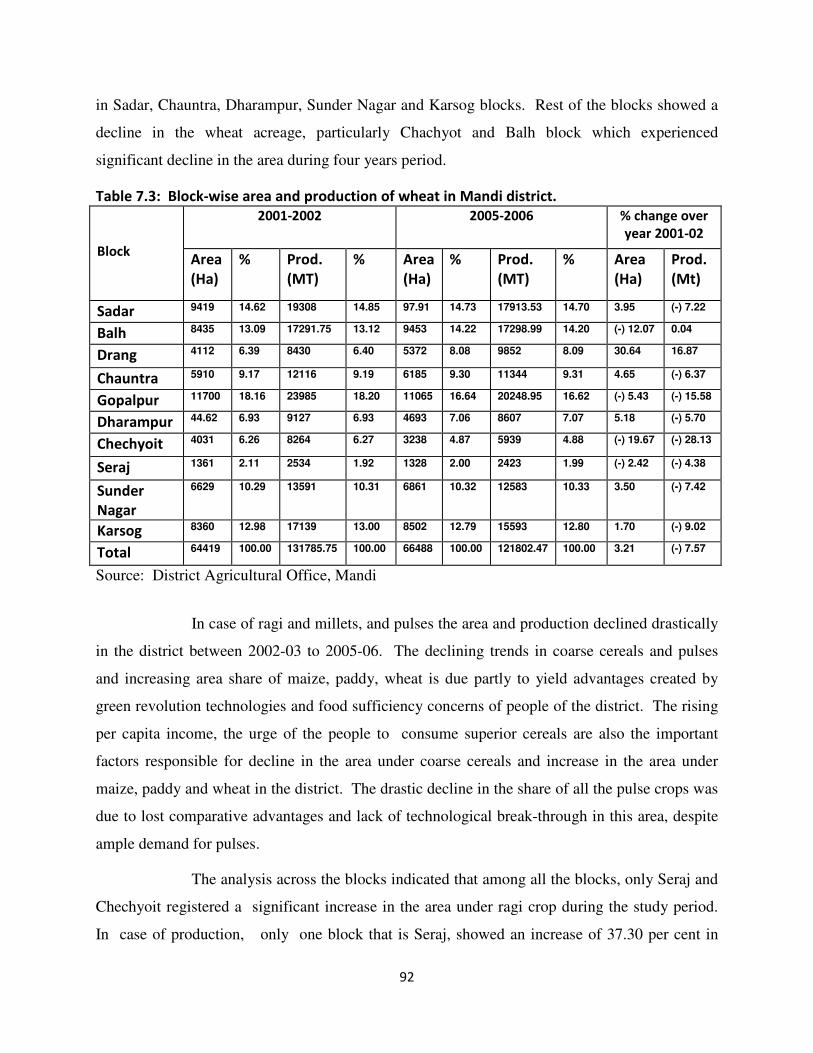
92
in Sadar, Chauntra, Dharampur, Sunder Nagar and Karsog blocks. Rest of the blocks showed a
decline in the wheat acreage, particularly Chachyot and Balh block which experienced
significant decline in the area during four years period.
Table 7.3: Block-wise area and production of wheat in Mandi district.
2001-2002 2005-2006 % change over
year 2001-02
Block Area
(Ha)
% Prod.
(MT)
% Area
(Ha)
% Prod.
(MT)
% Area
(Ha)
Prod.
(Mt)
Sadar 9419 14.62 19308 14.85 97.91 14.73 17913.53 14.70 3.95 (-) 7.22
Balh 8435 13.09 17291.75 13.12 9453 14.22 17298.99 14.20 (-) 12.07 0.04
Drang 4112 6.39 8430 6.40 5372 8.08 9852 8.09 30.64 16.87
Chauntra 5910 9.17 12116 9.19 6185 9.30 11344 9.31 4.65 (-) 6.37
Gopalpur 11700 18.16 23985 18.20 11065 16.64 20248.95 16.62 (-) 5.43 (-) 15.58
Dharampur 44.62 6.93 9127 6.93 4693 7.06 8607 7.07 5.18 (-) 5.70
Chechyoit 4031 6.26 8264 6.27 3238 4.87 5939 4.88 (-) 19.67 (-) 28.13
Seraj 1361 2.11 2534 1.92 1328 2.00 2423 1.99 (-) 2.42 (-) 4.38
Sunder
Nagar
6629 10.29 13591 10.31 6861 10.32 12583 10.33 3.50 (-) 7.42
Karsog 8360 12.98 17139 13.00 8502 12.79 15593 12.80 1.70 (-) 9.02
Total 64419 100.00 131785.75 100.00 66488 100.00 121802.47 100.00 3.21 (-) 7.57
Source: District Agricultural Office, Mandi
In case of ragi and millets, and pulses the area and production declined drastically
in the district between 2002-03 to 2005-06. The declining trends in coarse cereals and pulses
and increasing area share of maize, paddy, wheat is due partly to yield advantages created by
green revolution technologies and food sufficiency concerns of people of the district. The rising
per capita income, the urge of the people to consume superior cereals are also the important
factors responsible for decline in the area under coarse cereals and increase in the area under
maize, paddy and wheat in the district. The drastic decline in the share of all the pulse crops was
due to lost comparative advantages and lack of technological break-through in this area, despite
ample demand for pulses.
The analysis across the blocks indicated that among all the blocks, only Seraj and
Chechyoit registered a significant increase in the area under ragi crop during the study period.
In case of production, only one block that is Seraj, showed an increase of 37.30 per cent in
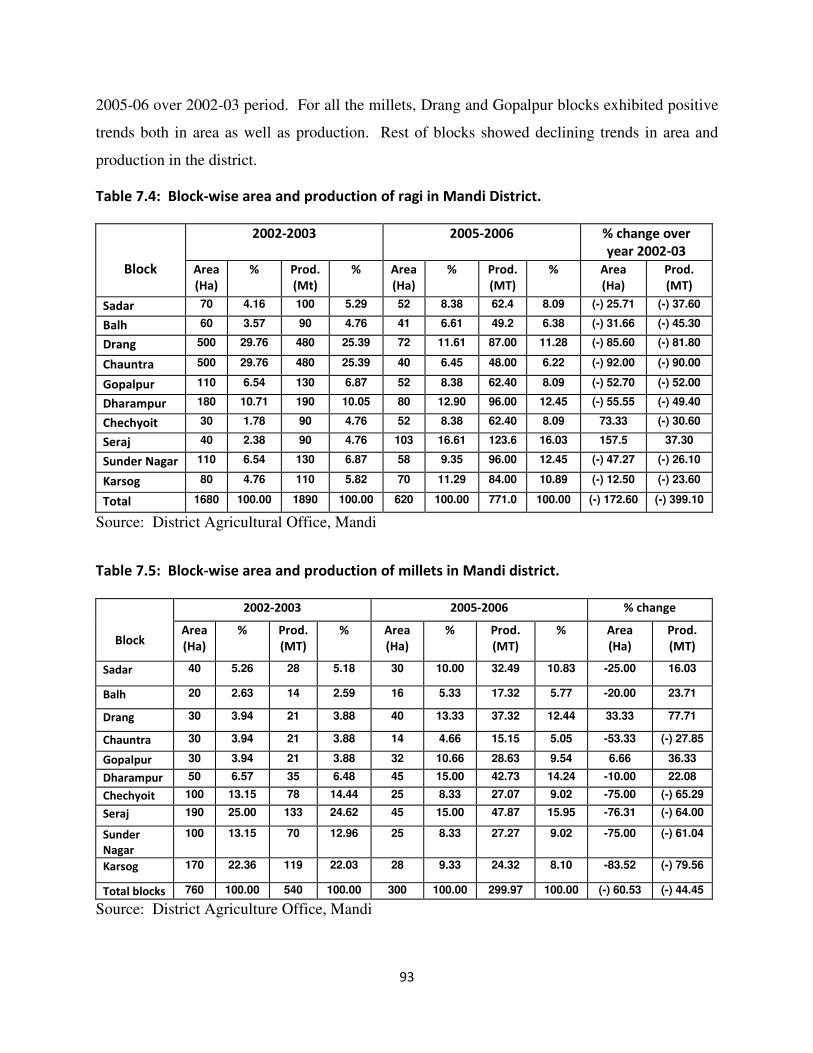
93
2005-06 over 2002-03 period. For all the millets, Drang and Gopalpur blocks exhibited positive
trends both in area as well as production. Rest of blocks showed declining trends in area and
production in the district.
Table 7.4: Block-wise area and production of ragi in Mandi District.
2002-2003 2005-2006 % change over
year 2002-03
Block Area
(Ha)
% Prod.
(Mt)
% Area
(Ha)
% Prod.
(MT)
%
Area
(Ha)
Prod.
(MT)
Sadar 70 4.16 100 5.29 52 8.38 62.4 8.09 (-) 25.71 (-) 37.60
Balh 60 3.57 90 4.76 41 6.61 49.2 6.38 (-) 31.66 (-) 45.30
Drang 500 29.76 480 25.39 72 11.61 87.00 11.28 (-) 85.60 (-) 81.80
Chauntra 500 29.76 480 25.39 40 6.45 48.00 6.22 (-) 92.00 (-) 90.00
Gopalpur 110 6.54 130 6.87 52 8.38 62.40 8.09 (-) 52.70 (-) 52.00
Dharampur 180 10.71 190 10.05 80 12.90 96.00 12.45 (-) 55.55 (-) 49.40
Chechyoit 30 1.78 90 4.76 52 8.38 62.40 8.09 73.33 (-) 30.60
Seraj 40 2.38 90 4.76 103 16.61 123.6 16.03 157.5 37.30
Sunder Nagar 110 6.54 130 6.87 58 9.35 96.00 12.45 (-) 47.27 (-) 26.10
Karsog 80 4.76 110 5.82 70 11.29 84.00 10.89 (-) 12.50 (-) 23.60
Total 1680 100.00 1890 100.00 620 100.00 771.0 100.00 (-) 172.60 (-) 399.10
Source: District Agricultural Office, Mandi
Table 7.5: Block-wise area and production of millets in Mandi district.
2002-2003 2005-2006 % change
Block Area
(Ha)
% Prod.
(MT)
% Area
(Ha)
% Prod.
(MT)
% Area
(Ha)
Prod.
(MT)
Sadar 40 5.26 28 5.18 30 10.00 32.49 10.83 -25.00 16.03
Balh 20 2.63 14 2.59 16 5.33 17.32 5.77 -20.00 23.71
Drang 30 3.94 21 3.88 40 13.33 37.32 12.44 33.33 77.71
Chauntra 30 3.94 21 3.88 14 4.66 15.15 5.05 -53.33 (-) 27.85
Gopalpur 30 3.94 21 3.88 32 10.66 28.63 9.54 6.66 36.33
Dharampur 50 6.57 35 6.48 45 15.00 42.73 14.24 -10.00 22.08
Chechyoit 100 13.15 78 14.44 25 8.33 27.07 9.02 -75.00 (-) 65.29
Seraj 190 25.00 133 24.62 45 15.00 47.87 15.95 -76.31 (-) 64.00
Sunder
Nagar
100 13.15 70 12.96
25 8.33 27.27 9.02
-75.00 (-) 61.04
Karsog 170 22.36 119 22.03 28 9.33 24.32 8.10 -83.52 (-) 79.56
Total blocks 760 100.00 540 100.00 300 100.00 299.97 100.00 (-) 60.53 (-) 44.45
Source: District Agriculture Office, Mandi
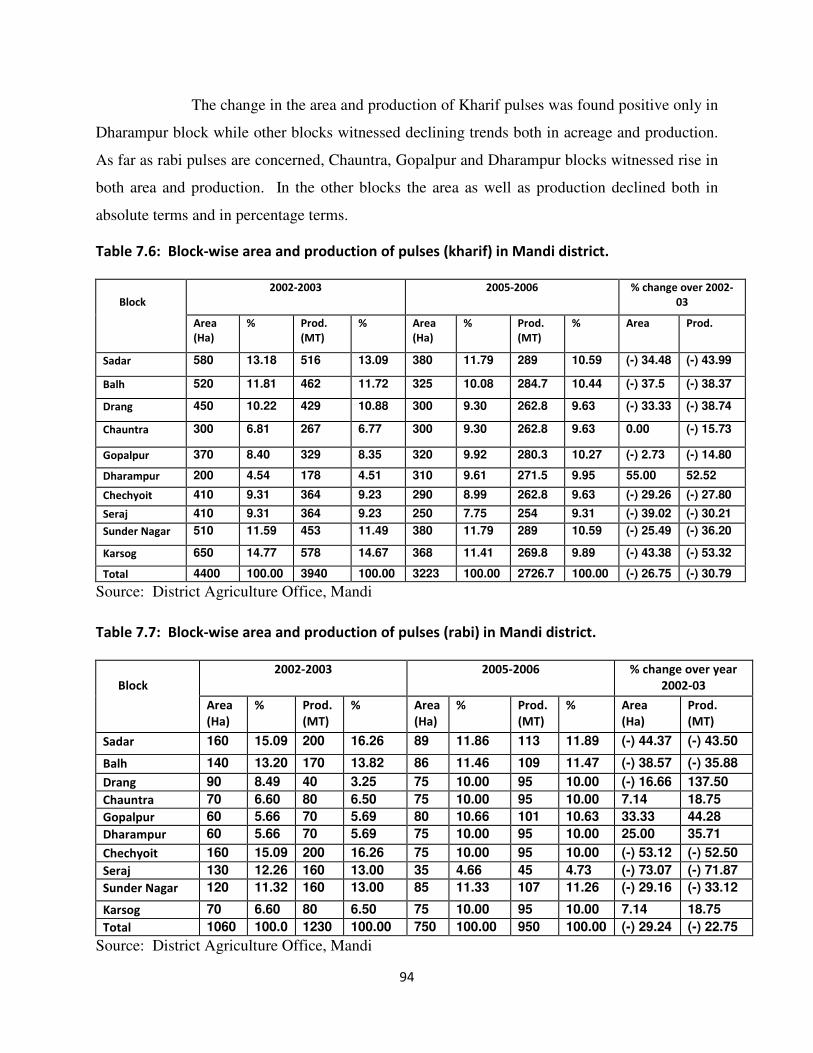
94
The change in the area and production of Kharif pulses was found positive only in
Dharampur block while other blocks witnessed declining trends both in acreage and production.
As far as rabi pulses are concerned, Chauntra, Gopalpur and Dharampur blocks witnessed rise in
both area and production. In the other blocks the area as well as production declined both in
absolute terms and in percentage terms.
Table 7.6: Block-wise area and production of pulses (kharif) in Mandi district.
2002-2003 2005-2006 % change over 2002-
03
Block
Area
(Ha)
% Prod.
(MT)
%
Area
(Ha)
% Prod.
(MT)
%
Area
Prod.
Sadar 580 13.18 516 13.09 380 11.79 289 10.59 (-) 34.48 (-) 43.99
Balh 520 11.81 462 11.72 325 10.08 284.7 10.44 (-) 37.5 (-) 38.37
Drang 450 10.22 429 10.88 300 9.30 262.8 9.63 (-) 33.33 (-) 38.74
Chauntra 300 6.81 267 6.77 300 9.30 262.8 9.63 0.00 (-) 15.73
Gopalpur 370 8.40 329 8.35 320 9.92 280.3 10.27 (-) 2.73 (-) 14.80
Dharampur 200 4.54 178 4.51 310 9.61 271.5 9.95 55.00 52.52
Chechyoit 410 9.31 364 9.23 290 8.99 262.8 9.63 (-) 29.26 (-) 27.80
Seraj 410 9.31 364 9.23 250 7.75 254 9.31 (-) 39.02 (-) 30.21
Sunder Nagar 510 11.59 453 11.49 380 11.79 289 10.59 (-) 25.49 (-) 36.20
Karsog 650 14.77 578 14.67 368 11.41 269.8 9.89 (-) 43.38 (-) 53.32
Total 4400 100.00 3940 100.00 3223 100.00 2726.7 100.00 (-) 26.75 (-) 30.79
Source: District Agriculture Office, Mandi
Table 7.7: Block-wise area and production of pulses (rabi) in Mandi district.
2002-2003 2005-2006 % change over year
2002-03
Block
Area
(Ha)
% Prod.
(MT)
%
Area
(Ha)
% Prod.
(MT)
%
Area
(Ha)
Prod.
(MT)
Sadar 160 15.09 200 16.26 89 11.86 113 11.89 (-) 44.37 (-) 43.50
Balh 140 13.20 170 13.82 86 11.46 109 11.47 (-) 38.57 (-) 35.88
Drang 90 8.49 40 3.25 75 10.00 95 10.00 (-) 16.66 137.50
Chauntra 70 6.60 80 6.50 75 10.00 95 10.00 7.14 18.75
Gopalpur 60 5.66 70 5.69 80 10.66 101 10.63 33.33 44.28
Dharampur 60 5.66 70 5.69 75 10.00 95 10.00 25.00 35.71
Chechyoit 160 15.09 200 16.26 75 10.00 95 10.00 (-) 53.12 (-) 52.50
Seraj 130 12.26 160 13.00 35 4.66 45 4.73 (-) 73.07 (-) 71.87
Sunder Nagar 120 11.32 160 13.00 85 11.33 107 11.26 (-) 29.16 (-) 33.12
Karsog 70 6.60 80 6.50 75 10.00 95 10.00 7.14 18.75
Total 1060 100.0 1230 100.00 750 100.00 950 100.00 (-) 29.24 (-) 22.75
Source: District Agriculture Office, Mandi
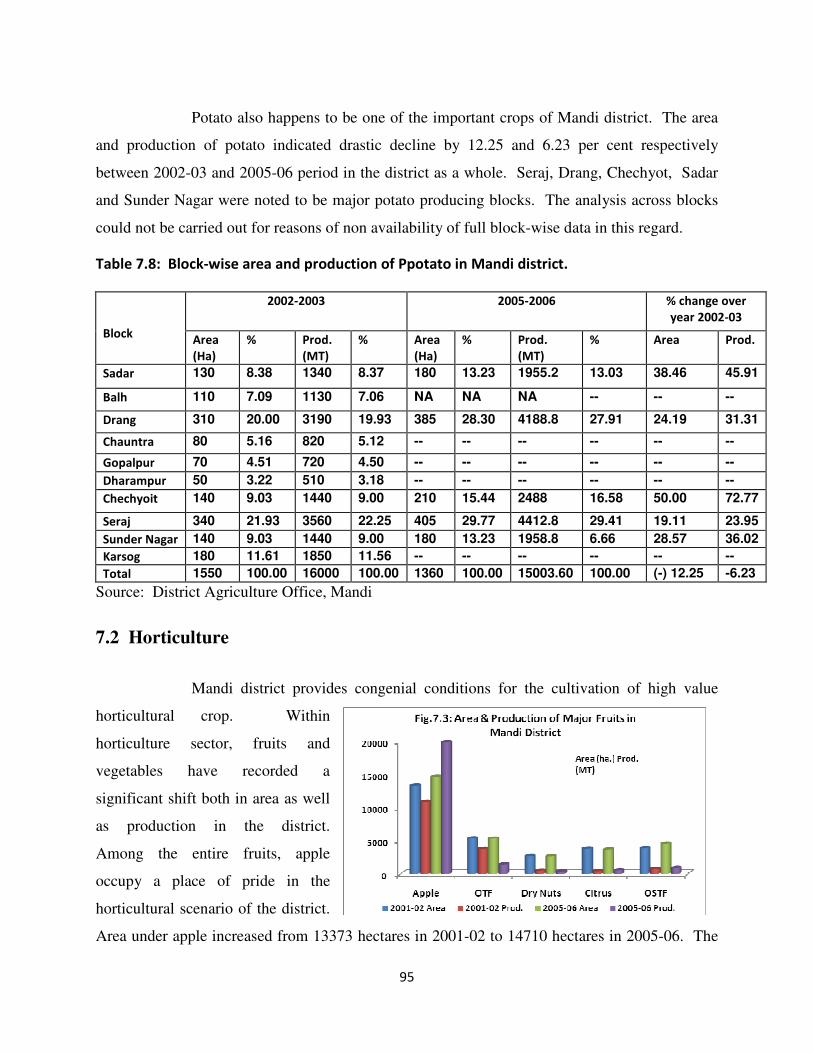
95
Potato also happens to be one of the important crops of Mandi district. The area
and production of potato indicated drastic decline by 12.25 and 6.23 per cent respectively
between 2002-03 and 2005-06 period in the district as a whole. Seraj, Drang, Chechyot, Sadar
and Sunder Nagar were noted to be major potato producing blocks. The analysis across blocks
could not be carried out for reasons of non availability of full block-wise data in this regard.
Table 7.8: Block-wise area and production of Ppotato in Mandi district.
2002-2003 2005-2006 % change over
year 2002-03
Block Area
(Ha)
% Prod.
(MT)
%
Area
(Ha)
% Prod.
(MT)
%
Area
Prod.
Sadar 130 8.38 1340 8.37 180 13.23 1955.2 13.03 38.46 45.91
Balh 110 7.09 1130 7.06 NA NA NA -- -- --
Drang 310 20.00 3190 19.93 385 28.30 4188.8 27.91 24.19 31.31
Chauntra 80 5.16 820 5.12 -- -- -- -- -- --
Gopalpur 70 4.51 720 4.50 -- -- -- -- -- --
Dharampur 50 3.22 510 3.18 -- -- -- -- -- --
Chechyoit 140 9.03 1440 9.00 210 15.44 2488 16.58 50.00 72.77
Seraj 340 21.93 3560 22.25 405 29.77 4412.8 29.41 19.11 23.95
Sunder Nagar 140 9.03 1440 9.00 180 13.23 1958.8 6.66 28.57 36.02
Karsog 180 11.61 1850 11.56 -- -- -- -- -- --
Total 1550 100.00 16000 100.00 1360 100.00 15003.60 100.00 (-) 12.25 -6.23
Source: District Agriculture Office, Mandi
7.2 Horticulture
Mandi district provides congenial conditions for the cultivation of high value
horticultural crop. Within
horticulture sector, fruits and
vegetables have recorded a
significant shift both in area as well
as production in the district.
Among the entire fruits, apple
occupy a place of pride in the
horticultural scenario of the district.
Area under apple increased from 13373 hectares in 2001-02 to 14710 hectares in 2005-06. The
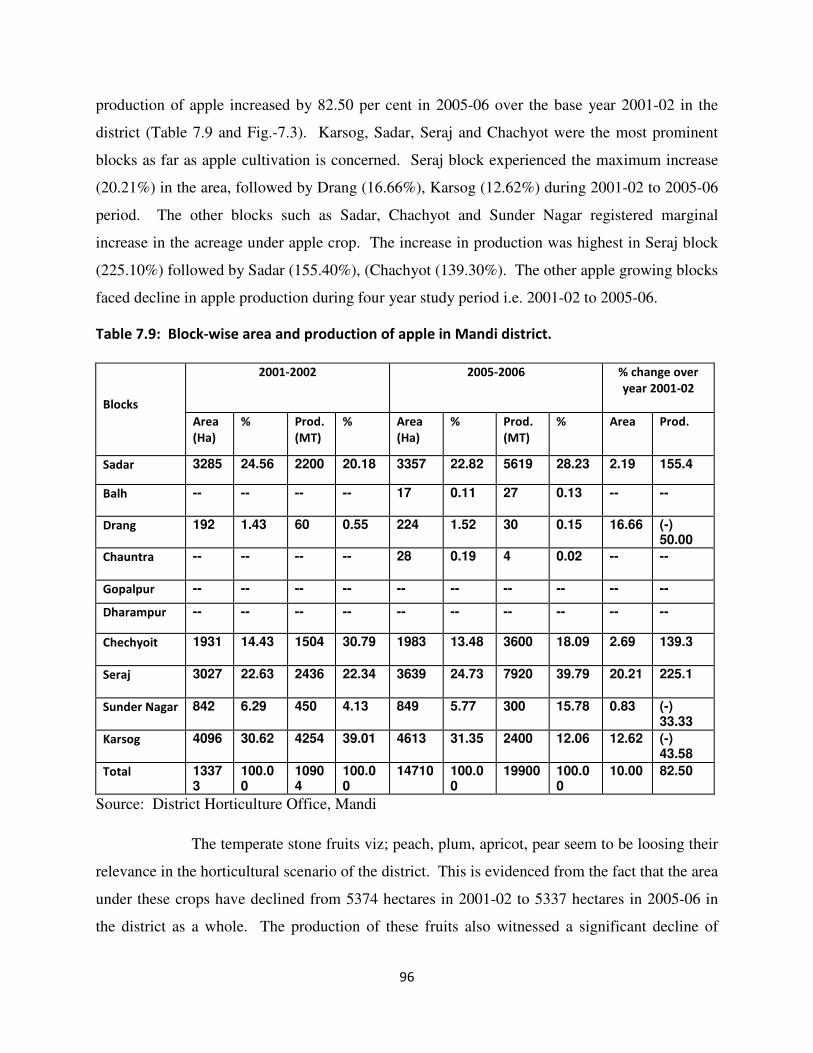
96
production of apple increased by 82.50 per cent in 2005-06 over the base year 2001-02 in the
district (Table 7.9 and Fig.-7.3). Karsog, Sadar, Seraj and Chachyot were the most prominent
blocks as far as apple cultivation is concerned. Seraj block experienced the maximum increase
(20.21%) in the area, followed by Drang (16.66%), Karsog (12.62%) during 2001-02 to 2005-06
period. The other blocks such as Sadar, Chachyot and Sunder Nagar registered marginal
increase in the acreage under apple crop. The increase in production was highest in Seraj block
(225.10%) followed by Sadar (155.40%), (Chachyot (139.30%). The other apple growing blocks
faced decline in apple production during four year study period i.e. 2001-02 to 2005-06.
Table 7.9: Block-wise area and production of apple in Mandi district.
2001-2002 2005-2006 % change over
year 2001-02
Blocks
Area
(Ha)
% Prod.
(MT)
% Area
(Ha)
% Prod.
(MT)
% Area Prod.
Sadar 3285 24.56 2200 20.18 3357 22.82 5619 28.23 2.19 155.4
Balh -- -- -- -- 17 0.11 27 0.13 -- --
Drang 192 1.43 60 0.55 224 1.52 30 0.15 16.66 (-) 50.00
Chauntra -- -- -- -- 28 0.19 4 0.02 -- --
Gopalpur -- -- -- -- -- -- -- -- -- --
Dharampur -- -- -- -- -- -- -- -- -- --
Chechyoit 1931 14.43 1504 30.79 1983 13.48 3600 18.09 2.69 139.3
Seraj 3027 22.63 2436 22.34 3639 24.73 7920 39.79 20.21 225.1
Sunder Nagar 842 6.29 450 4.13 849 5.77 300 15.78 0.83 (-) 33.33
Karsog 4096 30.62 4254 39.01 4613 31.35 2400 12.06 12.62 (-) 43.58
Total 13373
100.00
10904
100.00
14710 100.00
19900 100.00
10.00 82.50
Source: District Horticulture Office, Mandi
The temperate stone fruits viz; peach, plum, apricot, pear seem to be loosing their
relevance in the horticultural scenario of the district. This is evidenced from the fact that the area
under these crops have declined from 5374 hectares in 2001-02 to 5337 hectares in 2005-06 in
the district as a whole. The production of these fruits also witnessed a significant decline of
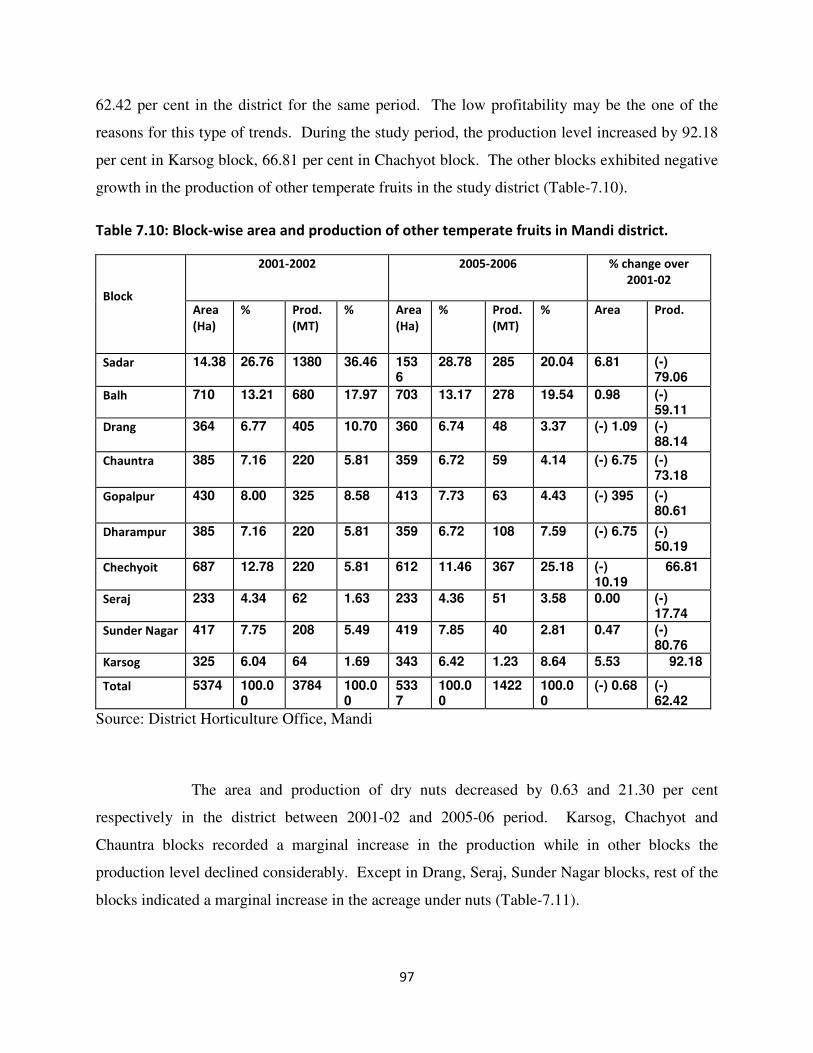
97
62.42 per cent in the district for the same period. The low profitability may be the one of the
reasons for this type of trends. During the study period, the production level increased by 92.18
per cent in Karsog block, 66.81 per cent in Chachyot block. The other blocks exhibited negative
growth in the production of other temperate fruits in the study district (Table-7.10).
Table 7.10: Block-wise area and production of other temperate fruits in Mandi district.
2001-2002 2005-2006 % change over
2001-02
Block Area
(Ha)
% Prod.
(MT)
%
Area
(Ha)
% Prod.
(MT)
%
Area
Prod.
Sadar 14.38 26.76 1380 36.46 1536
28.78 285 20.04 6.81 (-) 79.06
Balh 710 13.21 680 17.97 703 13.17 278 19.54 0.98 (-) 59.11
Drang 364 6.77 405 10.70 360 6.74 48 3.37 (-) 1.09 (-) 88.14
Chauntra 385 7.16 220 5.81 359 6.72 59 4.14 (-) 6.75 (-) 73.18
Gopalpur 430 8.00 325 8.58 413 7.73 63 4.43 (-) 395 (-) 80.61
Dharampur 385 7.16 220 5.81 359 6.72 108 7.59 (-) 6.75 (-) 50.19
Chechyoit 687 12.78 220 5.81 612 11.46 367 25.18 (-) 10.19
66.81
Seraj 233 4.34 62 1.63 233 4.36 51 3.58 0.00 (-) 17.74
Sunder Nagar 417 7.75 208 5.49 419 7.85 40 2.81 0.47 (-) 80.76
Karsog 325 6.04 64 1.69 343 6.42 1.23 8.64 5.53 92.18
Total 5374 100.00
3784 100.00
5337
100.00
1422 100.00
(-) 0.68 (-) 62.42
Source: District Horticulture Office, Mandi
The area and production of dry nuts decreased by 0.63 and 21.30 per cent
respectively in the district between 2001-02 and 2005-06 period. Karsog, Chachyot and
Chauntra blocks recorded a marginal increase in the production while in other blocks the
production level declined considerably. Except in Drang, Seraj, Sunder Nagar blocks, rest of the
blocks indicated a marginal increase in the acreage under nuts (Table-7.11).
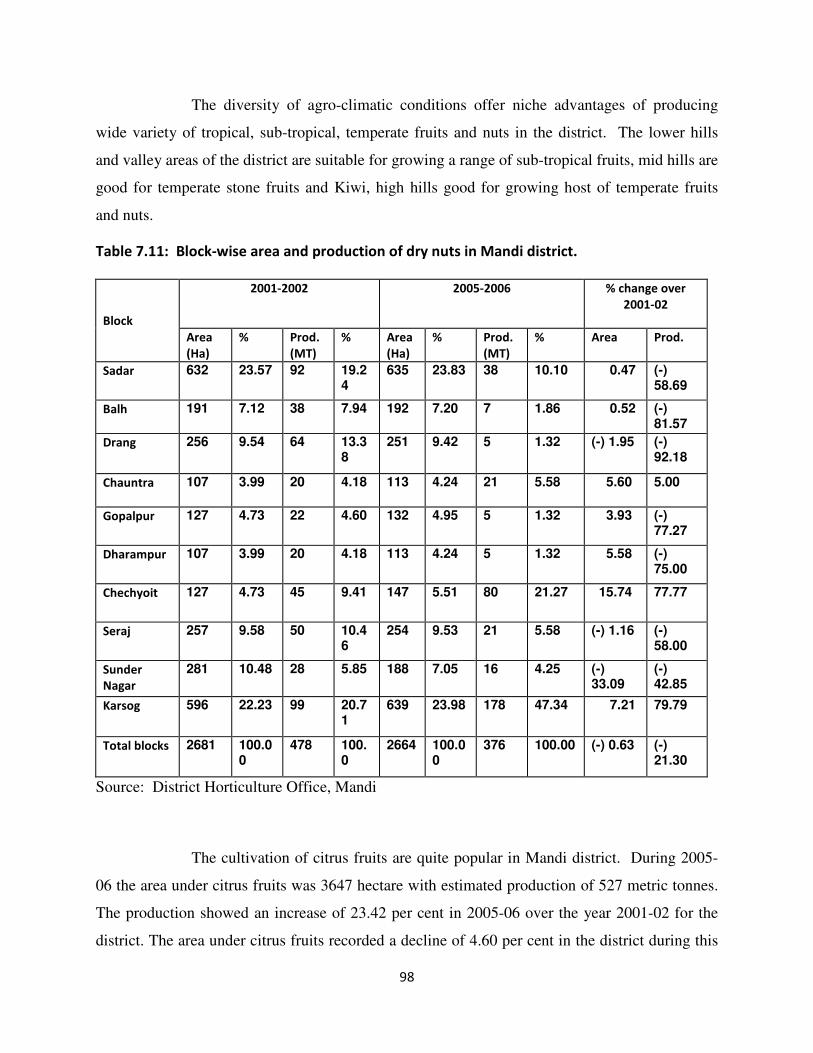
98
The diversity of agro-climatic conditions offer niche advantages of producing
wide variety of tropical, sub-tropical, temperate fruits and nuts in the district. The lower hills
and valley areas of the district are suitable for growing a range of sub-tropical fruits, mid hills are
good for temperate stone fruits and Kiwi, high hills good for growing host of temperate fruits
and nuts.
Table 7.11: Block-wise area and production of dry nuts in Mandi district.
2001-2002 2005-2006 % change over
2001-02
Block
Area
(Ha)
% Prod.
(MT)
%
Area
(Ha)
% Prod.
(MT)
%
Area
Prod.
Sadar 632 23.57 92 19.24
635 23.83 38 10.10 0.47 (-) 58.69
Balh 191 7.12 38 7.94 192 7.20 7 1.86 0.52 (-) 81.57
Drang 256 9.54 64 13.38
251 9.42 5 1.32 (-) 1.95 (-) 92.18
Chauntra 107 3.99 20 4.18 113 4.24 21 5.58 5.60 5.00
Gopalpur 127 4.73 22 4.60 132 4.95 5 1.32 3.93 (-) 77.27
Dharampur 107 3.99 20 4.18 113 4.24 5 1.32 5.58 (-) 75.00
Chechyoit 127 4.73 45 9.41 147 5.51 80 21.27 15.74 77.77
Seraj 257 9.58 50 10.46
254 9.53 21 5.58 (-) 1.16 (-) 58.00
Sunder
Nagar
281 10.48 28 5.85 188 7.05 16 4.25 (-) 33.09
(-) 42.85
Karsog 596 22.23 99 20.71
639 23.98 178 47.34 7.21 79.79
Total blocks 2681 100.00
478 100.0
2664 100.00
376 100.00 (-) 0.63 (-) 21.30
Source: District Horticulture Office, Mandi
The cultivation of citrus fruits are quite popular in Mandi district. During 2005-
06 the area under citrus fruits was 3647 hectare with estimated production of 527 metric tonnes.
The production showed an increase of 23.42 per cent in 2005-06 over the year 2001-02 for the
district. The area under citrus fruits recorded a decline of 4.60 per cent in the district during this
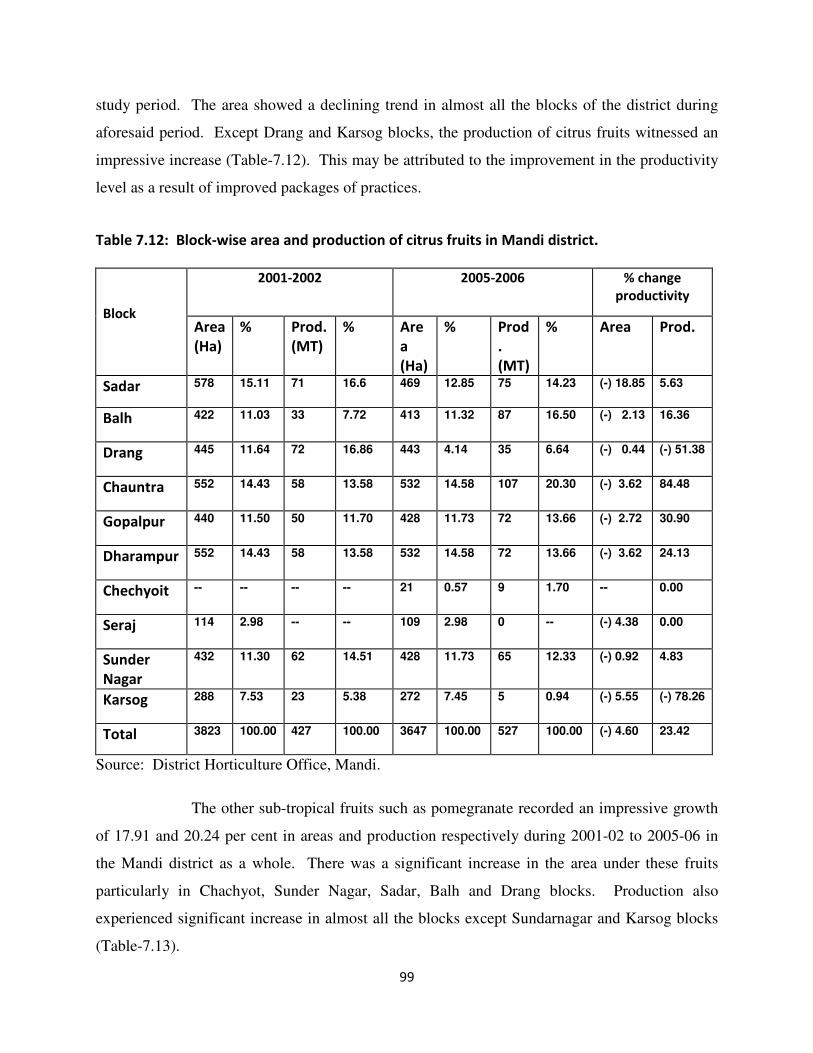
99
study period. The area showed a declining trend in almost all the blocks of the district during
aforesaid period. Except Drang and Karsog blocks, the production of citrus fruits witnessed an
impressive increase (Table-7.12). This may be attributed to the improvement in the productivity
level as a result of improved packages of practices.
Table 7.12: Block-wise area and production of citrus fruits in Mandi district.
2001-2002 2005-2006 % change
productivity
Block Area
(Ha)
% Prod.
(MT)
%
Are
a
(Ha)
% Prod
.
(MT)
%
Area
Prod.
Sadar 578 15.11 71 16.6 469 12.85 75 14.23 (-) 18.85 5.63
Balh 422 11.03 33 7.72 413 11.32 87 16.50 (-) 2.13 16.36
Drang 445 11.64 72 16.86 443 4.14 35 6.64 (-) 0.44 (-) 51.38
Chauntra 552 14.43 58 13.58 532 14.58 107 20.30 (-) 3.62 84.48
Gopalpur 440 11.50 50 11.70 428 11.73 72 13.66 (-) 2.72 30.90
Dharampur 552 14.43 58 13.58 532 14.58 72 13.66 (-) 3.62 24.13
Chechyoit -- -- -- -- 21 0.57 9 1.70 -- 0.00
Seraj 114 2.98 -- -- 109 2.98 0 -- (-) 4.38 0.00
Sunder
Nagar
432 11.30 62 14.51 428 11.73 65 12.33 (-) 0.92 4.83
Karsog 288 7.53 23 5.38 272 7.45 5 0.94 (-) 5.55 (-) 78.26
Total 3823 100.00 427 100.00 3647 100.00 527 100.00 (-) 4.60 23.42
Source: District Horticulture Office, Mandi.
The other sub-tropical fruits such as pomegranate recorded an impressive growth
of 17.91 and 20.24 per cent in areas and production respectively during 2001-02 to 2005-06 in
the Mandi district as a whole. There was a significant increase in the area under these fruits
particularly in Chachyot, Sunder Nagar, Sadar, Balh and Drang blocks. Production also
experienced significant increase in almost all the blocks except Sundarnagar and Karsog blocks
(Table-7.13).
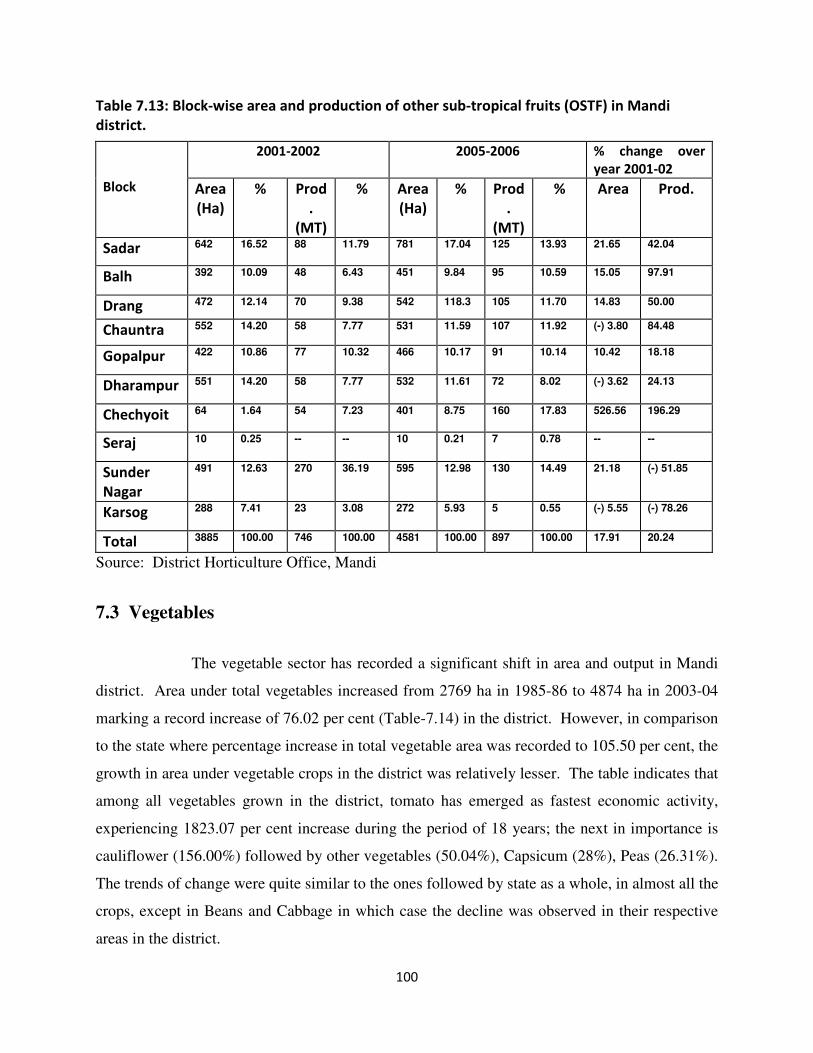
100
Table 7.13: Block-wise area and production of other sub-tropical fruits (OSTF) in Mandi
district.
2001-2002 2005-2006 % change over
year 2001-02
Block Area
(Ha)
% Prod
.
(MT)
%
Area
(Ha)
% Prod
.
(MT)
%
Area
Prod.
Sadar 642 16.52 88 11.79 781 17.04 125 13.93 21.65 42.04
Balh 392 10.09 48 6.43 451 9.84 95 10.59 15.05 97.91
Drang 472 12.14 70 9.38 542 118.3 105 11.70 14.83 50.00
Chauntra 552 14.20 58 7.77 531 11.59 107 11.92 (-) 3.80 84.48
Gopalpur 422 10.86 77 10.32 466 10.17 91 10.14 10.42 18.18
Dharampur 551 14.20 58 7.77 532 11.61 72 8.02 (-) 3.62 24.13
Chechyoit 64 1.64 54 7.23 401 8.75 160 17.83 526.56 196.29
Seraj 10 0.25 -- -- 10 0.21 7 0.78 -- --
Sunder
Nagar
491 12.63 270 36.19 595 12.98 130 14.49 21.18 (-) 51.85
Karsog 288 7.41 23 3.08 272 5.93 5 0.55 (-) 5.55 (-) 78.26
Total 3885 100.00 746 100.00 4581 100.00 897 100.00 17.91 20.24
Source: District Horticulture Office, Mandi
7.3 Vegetables
The vegetable sector has recorded a significant shift in area and output in Mandi
district. Area under total vegetables increased from 2769 ha in 1985-86 to 4874 ha in 2003-04
marking a record increase of 76.02 per cent (Table-7.14) in the district. However, in comparison
to the state where percentage increase in total vegetable area was recorded to 105.50 per cent, the
growth in area under vegetable crops in the district was relatively lesser. The table indicates that
among all vegetables grown in the district, tomato has emerged as fastest economic activity,
experiencing 1823.07 per cent increase during the period of 18 years; the next in importance is
cauliflower (156.00%) followed by other vegetables (50.04%), Capsicum (28%), Peas (26.31%).
The trends of change were quite similar to the ones followed by state as a whole, in almost all the
crops, except in Beans and Cabbage in which case the decline was observed in their respective
areas in the district.
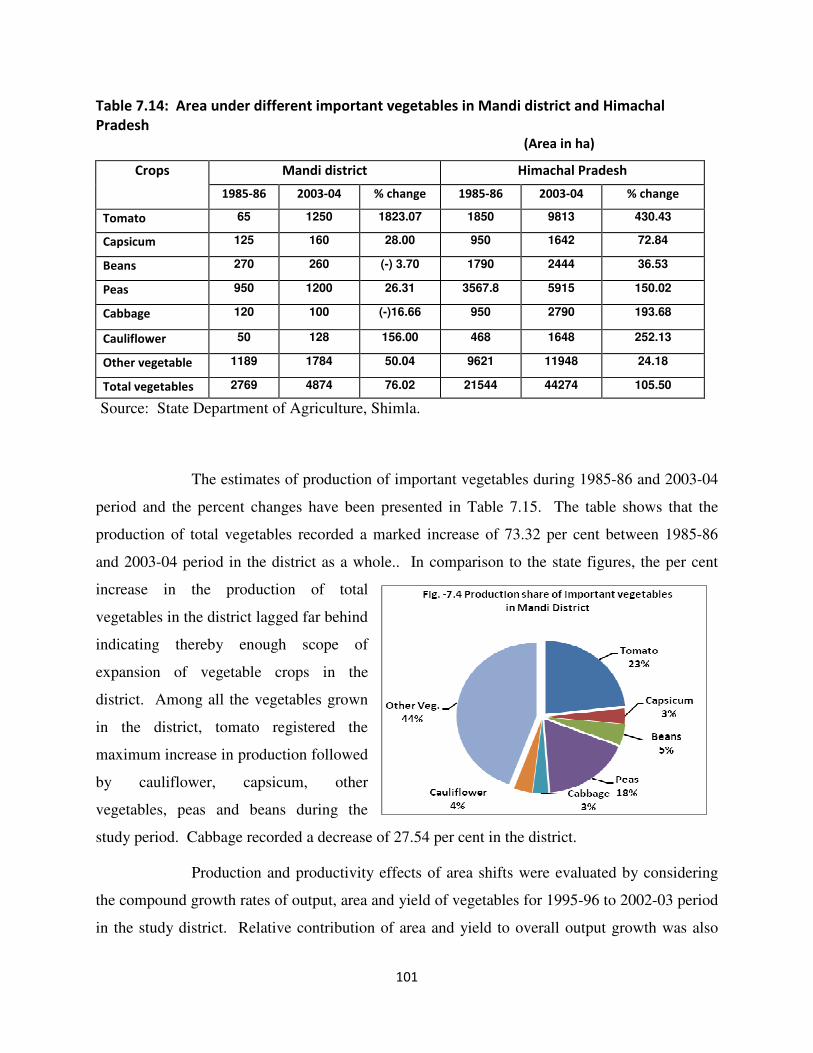
101
Table 7.14: Area under different important vegetables in Mandi district and Himachal
Pradesh (Area in ha)
Mandi district Himachal Pradesh Crops
1985-86 2003-04 % change 1985-86 2003-04 % change
Tomato 65 1250 1823.07 1850 9813 430.43
Capsicum 125 160 28.00 950 1642 72.84
Beans 270 260 (-) 3.70 1790 2444 36.53
Peas 950 1200 26.31 3567.8 5915 150.02
Cabbage 120 100 (-)16.66 950 2790 193.68
Cauliflower 50 128 156.00 468 1648 252.13
Other vegetable 1189 1784 50.04 9621 11948 24.18
Total vegetables 2769 4874 76.02 21544 44274 105.50
Source: State Department of Agriculture, Shimla.
The estimates of production of important vegetables during 1985-86 and 2003-04
period and the percent changes have been presented in Table 7.15. The table shows that the
production of total vegetables recorded a marked increase of 73.32 per cent between 1985-86
and 2003-04 period in the district as a whole.. In comparison to the state figures, the per cent
increase in the production of total
vegetables in the district lagged far behind
indicating thereby enough scope of
expansion of vegetable crops in the
district. Among all the vegetables grown
in the district, tomato registered the
maximum increase in production followed
by cauliflower, capsicum, other
vegetables, peas and beans during the
study period. Cabbage recorded a decrease of 27.54 per cent in the district.
Production and productivity effects of area shifts were evaluated by considering
the compound growth rates of output, area and yield of vegetables for 1995-96 to 2002-03 period
in the study district. Relative contribution of area and yield to overall output growth was also
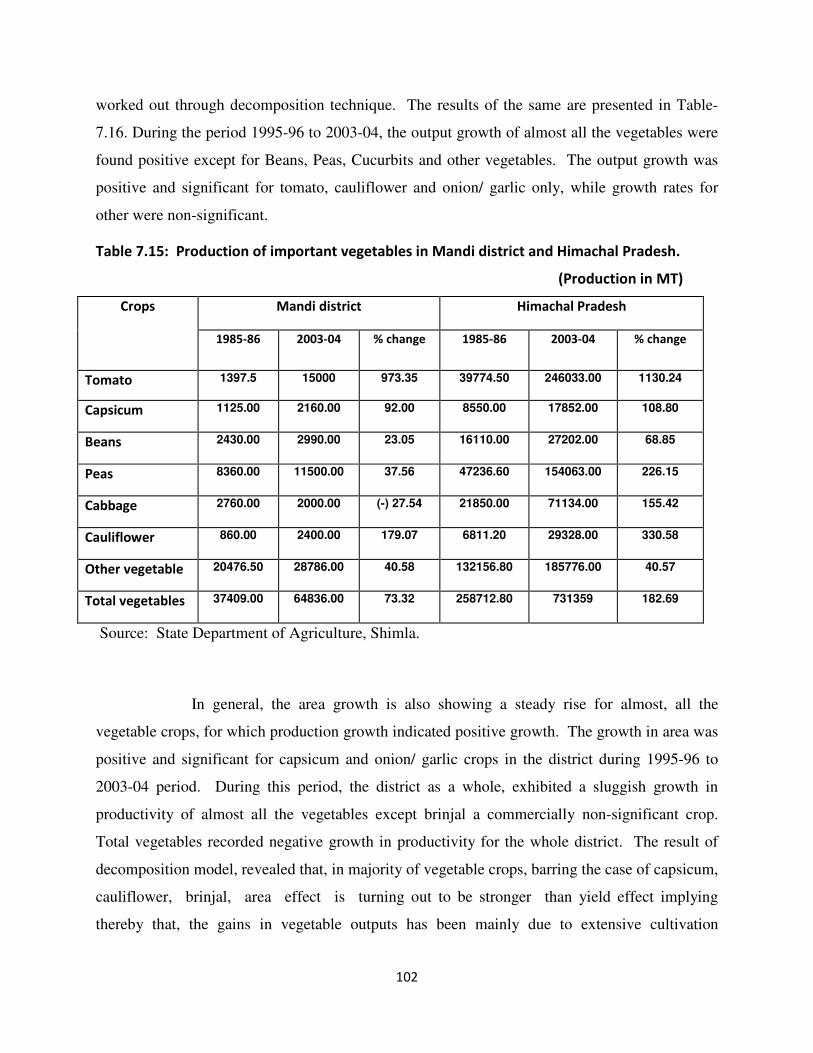
102
worked out through decomposition technique. The results of the same are presented in Table-
7.16. During the period 1995-96 to 2003-04, the output growth of almost all the vegetables were
found positive except for Beans, Peas, Cucurbits and other vegetables. The output growth was
positive and significant for tomato, cauliflower and onion/ garlic only, while growth rates for
other were non-significant.
Table 7.15: Production of important vegetables in Mandi district and Himachal Pradesh.
(Production in MT)
Mandi district Himachal Pradesh Crops
1985-86 2003-04 % change 1985-86 2003-04 % change
Tomato 1397.5 15000 973.35 39774.50 246033.00 1130.24
Capsicum 1125.00 2160.00 92.00 8550.00 17852.00 108.80
Beans 2430.00 2990.00 23.05 16110.00 27202.00 68.85
Peas 8360.00 11500.00 37.56 47236.60 154063.00 226.15
Cabbage 2760.00 2000.00 (-) 27.54 21850.00 71134.00 155.42
Cauliflower 860.00 2400.00 179.07 6811.20 29328.00 330.58
Other vegetable 20476.50 28786.00 40.58 132156.80 185776.00 40.57
Total vegetables 37409.00 64836.00 73.32 258712.80 731359 182.69
Source: State Department of Agriculture, Shimla.
In general, the area growth is also showing a steady rise for almost, all the
vegetable crops, for which production growth indicated positive growth. The growth in area was
positive and significant for capsicum and onion/ garlic crops in the district during 1995-96 to
2003-04 period. During this period, the district as a whole, exhibited a sluggish growth in
productivity of almost all the vegetables except brinjal a commercially non-significant crop.
Total vegetables recorded negative growth in productivity for the whole district. The result of
decomposition model, revealed that, in majority of vegetable crops, barring the case of capsicum,
cauliflower, brinjal, area effect is turning out to be stronger than yield effect implying
thereby that, the gains in vegetable outputs has been mainly due to extensive cultivation
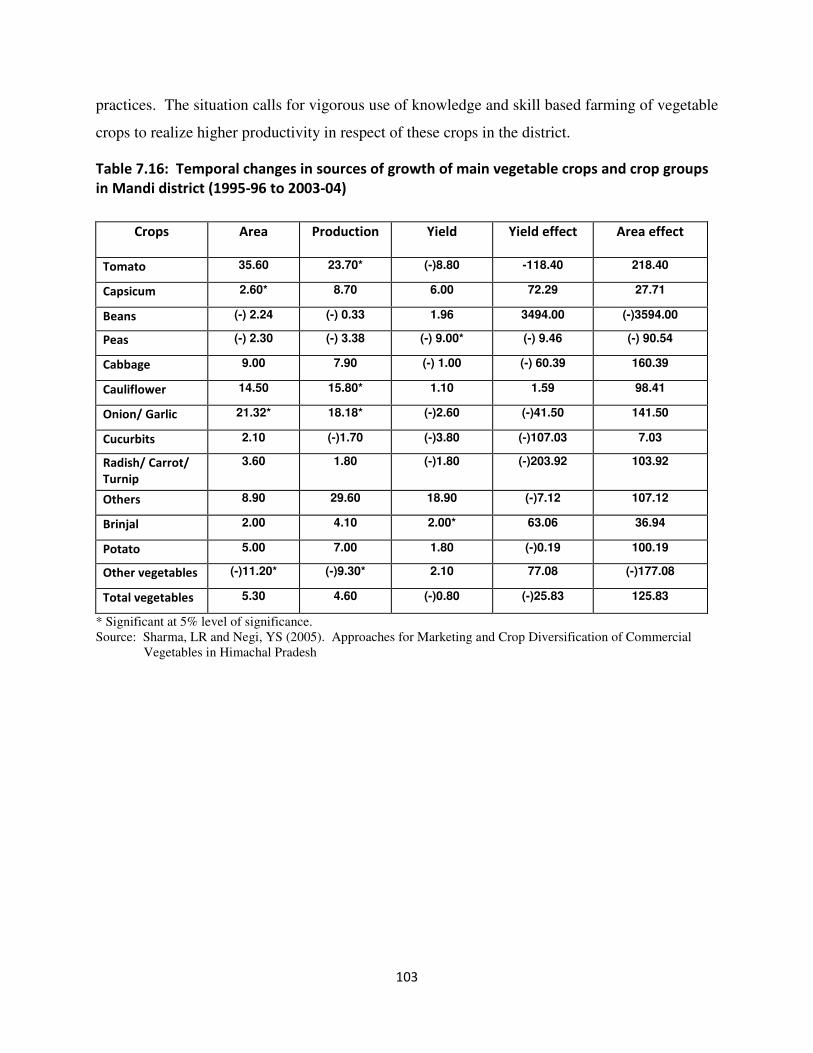
103
practices. The situation calls for vigorous use of knowledge and skill based farming of vegetable
crops to realize higher productivity in respect of these crops in the district.
Table 7.16: Temporal changes in sources of growth of main vegetable crops and crop groups
in Mandi district (1995-96 to 2003-04)
* Significant at 5% level of significance. Source: Sharma, LR and Negi, YS (2005). Approaches for Marketing and Crop Diversification of Commercial Vegetables in Himachal Pradesh
Crops Area Production Yield Yield effect Area effect
Tomato 35.60 23.70* (-)8.80 -118.40 218.40
Capsicum 2.60* 8.70 6.00 72.29 27.71
Beans (-) 2.24 (-) 0.33 1.96 3494.00 (-)3594.00
Peas (-) 2.30 (-) 3.38 (-) 9.00* (-) 9.46 (-) 90.54
Cabbage 9.00 7.90 (-) 1.00 (-) 60.39 160.39
Cauliflower 14.50 15.80* 1.10 1.59 98.41
Onion/ Garlic 21.32* 18.18* (-)2.60 (-)41.50 141.50
Cucurbits 2.10 (-)1.70 (-)3.80 (-)107.03 7.03
Radish/ Carrot/
Turnip
3.60 1.80 (-)1.80 (-)203.92 103.92
Others 8.90 29.60 18.90 (-)7.12 107.12
Brinjal 2.00 4.10 2.00* 63.06 36.94
Potato 5.00 7.00 1.80 (-)0.19 100.19
Other vegetables (-)11.20* (-)9.30* 2.10 77.08 (-)177.08
Total vegetables 5.30 4.60 (-)0.80 (-)25.83 125.83
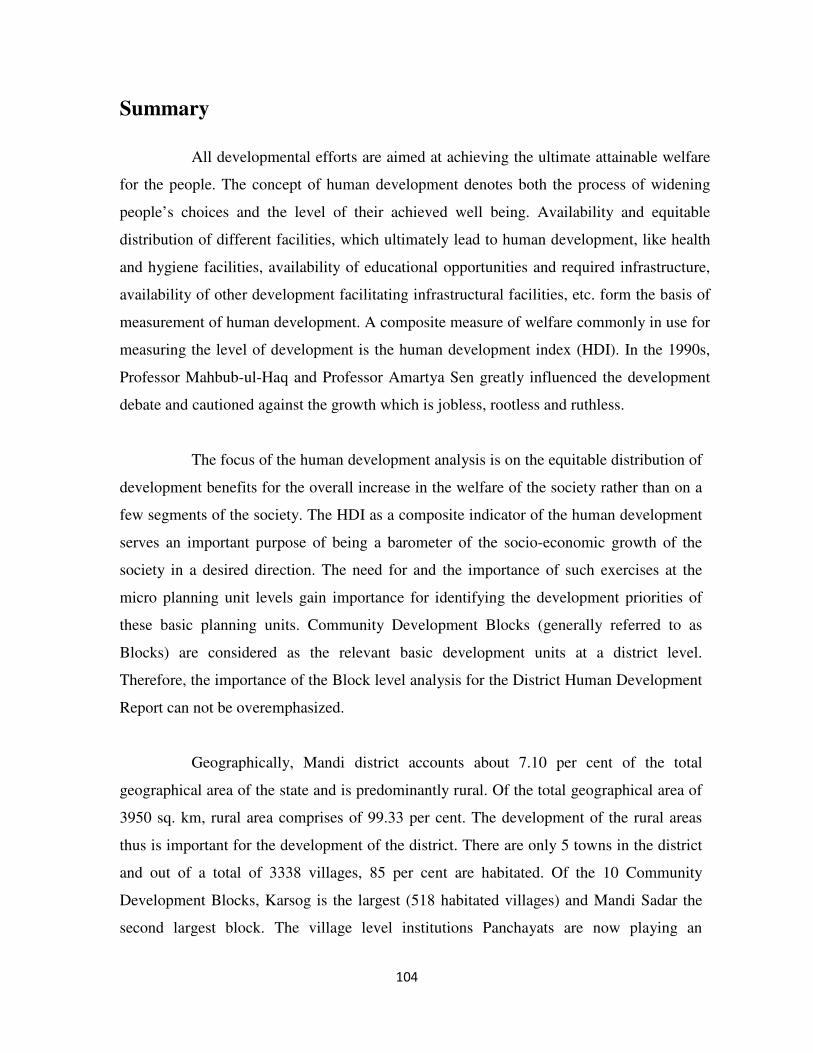
104
Summary
All developmental efforts are aimed at achieving the ultimate attainable welfare
for the people. The concept of human development denotes both the process of widening
people’s choices and the level of their achieved well being. Availability and equitable
distribution of different facilities, which ultimately lead to human development, like health
and hygiene facilities, availability of educational opportunities and required infrastructure,
availability of other development facilitating infrastructural facilities, etc. form the basis of
measurement of human development. A composite measure of welfare commonly in use for
measuring the level of development is the human development index (HDI). In the 1990s,
Professor Mahbub-ul-Haq and Professor Amartya Sen greatly influenced the development
debate and cautioned against the growth which is jobless, rootless and ruthless.
The focus of the human development analysis is on the equitable distribution of
development benefits for the overall increase in the welfare of the society rather than on a
few segments of the society. The HDI as a composite indicator of the human development
serves an important purpose of being a barometer of the socio-economic growth of the
society in a desired direction. The need for and the importance of such exercises at the
micro planning unit levels gain importance for identifying the development priorities of
these basic planning units. Community Development Blocks (generally referred to as
Blocks) are considered as the relevant basic development units at a district level.
Therefore, the importance of the Block level analysis for the District Human Development
Report can not be overemphasized.
Geographically, Mandi district accounts about 7.10 per cent of the total
geographical area of the state and is predominantly rural. Of the total geographical area of
3950 sq. km, rural area comprises of 99.33 per cent. The development of the rural areas
thus is important for the development of the district. There are only 5 towns in the district
and out of a total of 3338 villages, 85 per cent are habitated. Of the 10 Community
Development Blocks, Karsog is the largest (518 habitated villages) and Mandi Sadar the
second largest block. The village level institutions Panchayats are now playing an
105
important role in rural development. There are 473 panchayats and 2877 wards in the
district, with a total population of 8,40,362. The Sadar block has the highest number of 61
panchayats, followed by Karsog (60), Balh (51), Sunder Nagar and Dharampur (49) block.
Majority of the population of the district are Hindus (98.20%), followed by
Muslims (0.92%), Sikhs (0.53%) and Bodhs (0.32%). Of the total population of the
district, more than 93 per cent reside in the rural areas, with an average population 251 per
habitated village. This distribution of the population has repercussions for the development
planning and implementation in the district. The population density works out to be 214
for the rural and 2263 persons per square kilometer for urban areas, with the average
population density 228 for the district as a whole. Block wise analysis in this regard
reveals that Balh block ranks the highest with the population density of 455, followed by
Gopalpur and Chauntra with the corresponding figure of 387 and 279 respectively.
The population make-up of the district during the last ten year period (1991-2001),
showed that the female population increased by about 21 per cent in Mandi Sadar block
followed by Seraj (20.34%), Chachyot (19.62%) and Karsog (18.88%). The scheduled caste
and scheduled tribe population in the district comprised of 28.98 and 1.17 per cent
respectively. Balh block had the largest scheduled caste population (17.30%) among all the
blocks in thr district. The scheduled tribe population has shown a positive growth in all the
blocks, except Chauntra and Karsog where this population declined by 10.86 and 8.25 per
cent, respectively during this period. Women form almost half of population and contribute
equally, if not more, towards the economic growth. For long, women remained
marginalized in our society and thus it is heartening to note that the recent efforts at the
planning level and the improving economic status of the people are changing this picture for
good. One of the indicators used to assess society’s treatment of women is the population
sex ratio. Sex ratio in the district decreased from 1013 in 1991 to 1012 in 2001, indicating
thereby a marginal decrease of 0.09 percent. During 2001, the number of females per
thousand of males varied from lowest of 933 in Balh to highest of 1146 in Chauntra block,
and the sex ratio improved slightly in Sadar, Drang, Chachyot, Sunder Nagar, Karsog and
Seraj blocks. Interestingly, the number of females per thousand of males remained less than
900 for all the urban areas taken together. This is assuring that barring the case of
106
Jogindernagar (Nagar Parishad), almost all the urban areas experienced a slight increase in
number of females over the males.
Education is an all empowering resource. It creates opportunities for the income
and employment generation. An educated person can better comprehend the intricacies of
real life and chart a suitable path for her/himself. In this regard, literacy is an important
indicator of advancement of human resource. In terms of literacy, Mandi district is
reasonably well placed with the literacy percentage 75.24 per cent as against 76.50 per cent
for the state as a whole. The female literacy rate for the district is 64.82 per cent in contrast
to 85.94 per cent for the males. Because of the relatively better educational facilities in
urban areas, the literacy among the urban people is high at 90.48 per cent, compared to the
rural literacy of 74.08 per cent; implying thereby the need for extending educational
facilities, like well equipped schools and provision of adequate number of teachers in the
schools. A significant variation was observed in the total literacy among the blocks and it
was found highest (79.98%) in Gopalpur block and the lowest (69.13%) in Drang block.
Among women, the highest literacy was again found in Gopalpur block (71.99%) and the
lowest in Balh block (45.92%). Adult literacy is one of the important parameters of
computing the educational attainment index, along with the combined enrolment ratio
index. The adult literacy rate for males was found to be 80.65 per cent and for adult females
only 53.36 per cent for the district as a whole. The block-wise analysis of adult literacy rate
indicated a wide variation among the blocks.
The district, as on 2005, had 2471 schools; of which 1926 were Primary, 672
Middle and 307 were imparting education upto High/ Senior Secondary level. Balh block
with 319 schools, followed by Karsog (291), Drang (273), Dharampur and Sunder Nagar
(each with 259 schools) are ahead of other blocks in this regard. During the period of 2001-
05, there has been an increase of 1.3 per cent in the number of government run primary
schools. The maximum increase was noted in Seraj block followed by Sadar, Karsog,
Gopalpur and Dharampur. Similarly, the number of colleges in the district increased from
14 in 2001 to 18 in 2005, although there seems to be the need for more colleges to address
the issue of regional disparities in this regard across blocks.
107
Along with the number of schools, the total number of enrolment of eligible
students serves as an indicator of progress in educational sector. For the present analysis,
this indicator was limited to the primary and secondary level for want of detailed data.
There were total of 216436 students on the rolls during 2005 in the district, the number of
primary level students accounted for 45.3 per cent, middle level 29.15 per cent and the high/
senior secondary school students constituted 25.55 per cent. The enrolment was found to be
highest in Balh block, followed by Sunder Nagar, Karsog, and Sadar. The enrolment rate
was highest in primary segment, followed by middle segment and least in high/ senior
secondary schools, in almost all the blocks. The low enrolment at the level of high/higher
secondary level could also be on account of students shifting to places out of the district or
because of opting for private schools for reasons of their better reputation.
Teachers are perhaps the most important resource in a school. The number and
quality of teachers have direct bearing on the educational output. The shortage of teachers is
reflected in pupil-teacher ratio (PTR). It was observed that, on an average there were 22
students per teacher in primary schools in 1996-97. This ratio went up to 23 in 2000-01 and
2001-02, then steadily declined to 15 in 2003-04 and ultimately reached at 19 in 2005-06.
The fall in the expenditure on primary education may be attributed as one of the reason for
this to happen. In case of middle schools the pupil-teacher ratio has shown declining trend
overtime, which is quite obvious for reasons of rising trend in the number of teachers in this
segment.
The primary school dropouts in the district show that the number of dropout
students declined from 358 in 2001 to 113 in 2005. The fall in dropout rate was observed
both in case of male and female students, with a higher decline in dropout rate for the male
students. The analysis across blocks reflects that Chauntra, Gopalpur, Balh, and Sunder
Nagar blocks had zero dropouts in 2005, while the dropouts also decreased in other blocks
as well. Some of the reasons for this welcome state of affairs could be the improvement in
PTR, increase in number of schools, decrease in distance of schools, provision of mid-day
meals and improvement in quality of schools.
108
On overall basis, the number of out-of-school children during 2003-05 period
decreased by 19.83 per cent. However, gender-wise look on the picture revealed that the
number of out-of-school girls in fact, increased by 13.89 per cent. While the general
decrease in the number of out-of-school children may have been the result of factors like the
increase in or upgrading of the schools, higher literacy and awareness among the parents
and the outcome of incentives like mid-day meal, etc., the increase in the number of out-of-
school girls seems to be result of gender bias among parents.
The importance of human health in achieving developmental goals is
undisputed. While on the one hand, a healthy human resource is the pre-condition of human
development, on the other it is also one of the goals of development planning (Fang Jing,
2006). Therefore, the importance of adequate health facilities in this regard can hardly be
overemphasized. In Mandi district, there has been marginal increase in the number of
primary health centers (PHCs) in the recent past, whereas the number of government
hospitals remained the same. The number of sub-centers declined, which may be due to the
up-gradation of sub centers to that of PHCs. The different blocks of the district had a
network of 6 government hospitals, 59 PHCs, and 308 sub-centers during the year 2005.
The four blocks namely Balh, Chauntra, Chachyoit and Seraj do not have any government
hospital and depend upon primary health centers and sub-centers for the medical care. The
primary health centers have increased from 47 to 59 during the years 2001 to 2005.
Although the number of PHCs increased by 25.53 per cent and the number of doctors by
10.71 per cent in during the period 2001-2005, yet there was no remarkable decline in the
population served by per doctor. It was also observed that there was wide gap between the
sanctioned and filled positions in almost all categories of the health staff, except the
ministerial staff.
Among other health indicators, extent of malnourished children, immunization
of the children, infant mortality, etc. are important. During 2004-05, the malnourished
children, per thousand of total children, were estimated at 363 for the district as a whole.
Among all the blocks, Balh block showed better performance in terms of nutritional status
and ranked first in the district, followed by Sadar, Seraj, Dharampur, Karsog, and Sunder
109
Nagar block. Majority of the children were in the category of mildly malnourished
(77.68%), followed by that of moderately malnourished (22.04%). The cases of severe and
very severely malnutrition children were low at 0.26 and 0.02 per cent of the total
malnourished children respectively. So far as immunization of the children is concerned, at
overall level, about 83.17 per cent of the eligible children were immunized during 2001,
while this figure rose to 98.29 per cent in 2005. The infant mortality rate for the district for
2005 is estimated to be 21.60 per thousand of live births. There is a wide variation in the
Infant mortality rate among different blocks of the district and there is a need to focus on
pre and post-natal care, hygiene, availability of potable water, and prevention of diseases
like pneumonia, and diarrhea, etc. It was observed that only about 28 per cent rural
households were having toilets in their homes.
Following the standard methodology, the infant mortality index for the year 2001
and 2005 worked out to be 0.03 and (-)0.003 respectively at overall level. Consequently, the
combined health index was estimated at 0.97 and 1.00 for the year 2001 and 2005
respectively, indicating thereby a slight improvement in the health status in the district. The
analysis across the blocks revealed an improvement in the health indices, over the position
in 2001, in almost all the blocks barring the case of Sunder Nagar block. Both Drang and
Chauntra blocks occupy the top position, followed by Sadar, and Chachyot in this regard.
Involvement of different sections of the people is important for sustainable
development. Women representation in the governing body of Panchayats showed an
impressive increase of 42.73 per cent during the last 10 years. Highest increase was
observed in Balh block, followed by Chachyot block. The analysis indicated higher women
empowerment with regard to their role in decision making process through village
development activities. Gainful employment of the people, as denoted by work
participation, acts an accelerator for the development process. Block-wise the the highest
work participation rate in the district was observed in Sadar block, followed by Seraj and
Chachyot blocks. The work participation rate for male is generally higher, though not
distinctly higher, in all the blocks, except Darang, Chauntra and Dharampur where female
work participation is higher than that of males. The total employment of about 3.81 lakh
110
man-days was generated, with highest in Sunder Nagar followed by Karsog, during the year
2005-06 in the district. Among the workers, majority of the marginal workers, irrespective
of their sex, are cultivators. Proportion of female marginal workers working as cultivators is
relatively higher in the district. At the overall level, the proportion of female cultivators
worked out to be as high as 71.85 per cent of the total cultivators. The population of non-
workers was more in urban areas (66.12%) as compared to rural areas. Distribution of main
workers reveals that majority of the male workers are cultivators. Only a small number of
workers are engaged in household industry in the district.
Forest, water, slate & sand mines, etc. are important natural resources of the
district. The stone mines are predominant followed by sand and slate mines. There exist
numerous sources of water in the district and almost all sources are tapped by the locals to
meet their water requirements. The main natural sources of drinking water are bauli, nalu,
chashma, wells, shuah, maggar, naun, hand-pumps, and tube-wells. As far as irrigation is
concerned, kuhls, nala, wells, and khad, are the main sources. During the year 2003-04,
14.72 per cent of the net sown area was under irrigation in the district. The main source of
irrigation is Kuhls which account for 98.40 per cent of total irrigated area in the district.
Wells accounted for only 1.60 per cent of net irrigated area. The creation of additional
irrigation infrastructure constitutes the important challenge for the enhancement of
productivity and production levels in agricultural sector.
Physical access to the public services and infrastructure plays an important role
in developmental process. It was noted that there was no change in the distance to be
traveled from block headquarters to the nearest facility during the period 2001 to 2005. At
overall level, 49.35 per cent villages were having primary schools within a distance of less
than one kilometer, 34.97 per cent within a radius of 1-2 kms, 11.20 per cent within a
distance of 2-3 kms, 4.29 per cent within 3-5 kms, and only 0.18 per cent villages had
primary school at a distance of more than 5 kilometers. Out of 3338 villages of the district,
nearly 46 per cent are connected with roads. Of these 981 villages (29%) are linked with
pucca roads, while 560 villages (17%) have semi-pucca/ katcha roads. A wide variation in
regard to the road network across the blocks was noticed in the district.
111
The financial institutions are having a wider network in all the blocks with
highest network of commercial banks followed by RRBs and cooperative banks. A
significant growth in number of branches of commercial and cooperative banks was noted
during the study period 2001 to 2005. In the year 2005 the number of cooperative society
shops operating in different blocks registered a 20.15 per cent growth over the year 2001.
The government has taken various measures to ensure the supply of food materials through
the fair price shops to the people. The supply of food items through public distribution
system (PDS) has been strengthened both for below and above poverty line people in the
district. There has also been an attempt to promote establishment of self-help groups
(SHGs) for local level employment and income generation. Number of SHGs and their male
and female representatives registered a positive growth in the year 2005 over 2001 in all the
blocks of the district.
Allocation of land to different activities and to different components under an
activity reflects the socio-economic decision making environment of the people. Wheat,
maize and paddy, the dominant cereal crops grown in the district, account for 41.93, 29.33
and 12.67 per cent of the gross cropped area of 1.59 lakh hectares respectively. So far as
the net area sown and total cropped area are concerned, the district seems to have enough
scope for incorporating new technologies and high pay-off enterprises in the crop and
livestock sub-sectors for enhancing the economic status of the farming community. Beside
agriculture, animal husbandry plays an important role in the economy of the district. Cows
accounted for the maximum proportion (50.04%), followed by goats (21.70%), sheep
(14.85%) of the total of 874231 livestock.
Among the cereals, the area under maize in district has increased by 2.74 per
cent with a maximum increase in Balh block (55.64%) followed by Dharampur (9.23%),
and Chauntra (8.58%) during the period 2001-02 to 2005-06. In some blocks, there was a
decline in area as well. In the matter of production, the district as a whole posted negative
growth of 24.36 per cent in 2005-06 over the base year 2001-02. In case of paddy acreage a
marginal increase of 2.33 per cent in 2005-06 over 2001-02 was noted. The production
however registered a decline of 12.59 per cent during this period. Except Seraj block where
112
paddy registered positive growth in both area and production, other blocks showed negative
growth in the production. This indicates that blocks having large area falling in low hills are
concentrating more on cereals crops while blocks with high hills are shifting gradually
towards fruits and vegetable crops. Wheat is one of the most important cereal crops of the
rabi season in the district. It occupies largest area of gross cropped area in almost all the
blocks. Gopalpur, Sadar, Balh and Karsog are among the most notable blocks with
relatively larger area under wheat. In case of ragi, millets and pulses, the area and
production in the district declined drastically during 2002-03 to 2005-06. Potato also
happens to be one of the important crops of the district. The area and production of potato in
the district indicated a decline of 12.25 and 6.23 per cent respectively between 2002-03 and
2005-06 period. Seraj, Drang, Chachyot, Sadar and Sunder Nagar were noted to be major
potato producing blocks.
Many small production niches provide congenial conditions for the cultivation of
high-value horticultural crops in the district. Within horticulture sector, fruits and
vegetables have recorded a significant increase, both in area as well as production. Among
the fruits, apple is the most important. Karsog, Sadar, Seraj and Chachyot are prominent
blocks as far as apple cultivation is concerned. Increase in apple acreage was the highest
(20.21%) in Seraj block, followed by Drang (16.66%) and Karsog (12.62%) during 2001-02
to 2005-06. The temperate stone fruits like peach, plum, apricot, and pear seem to be
loosing their relevance in the horticultural scenario of the district over time, and their
production declined by 62.42 per cent in the district during this period. Area and production
of dry-nuts also decreased by 0.63 and 21.30 per cent respectively, during 2001-02 and
2005-06. The cultivation of citrus fruits is quite popular in Mandi district. During 2005-06
the area under citrus fruits was 3647 hectare with the production of 527 metric tonnes. The
area under citrus fruits recorded a decline of 4.60 per cent in the district during the study
period. The other sub-tropical fruits such as pomegranate recorded an impressive growth of
17.91 and 20.24 per cent in areas and production respectively. The increase in the area
under these fruits was significant in Chachyot, Sunder Nagar, Sadar, Balh and Drang
blocks.
113
Mandi district is gradually picking up momentum towards high value vegetable
crops to augment income and employment. The vegetable sector has recorded a significant
shift in area and output in the district. Area under total vegetables increased from 2769 ha in
1985-86 to 4874 ha in 2003-04, an impressive increase of 76.02 per cent, against the 105.50
per cent at the state level. This suggests that although the situation in this regard in the
district is improving it still can go further to catch up with other districts. Among all
vegetables grown in the district, tomato has emerged as fastest commercial farm activity.
The above discussion suggests that most developmental programmes are adding
to the socio-economic welfare of the people of the district. Nevertheless, it is suggested that
the pace of development can be hastened by taking into consideration the local natural and
other resources for their optimal utilization. The natural forests, water resources and the
religious places of importance and many other such resources can be considered in a holistic
way to promote sustainable economic activities in the district. Variations in infrastructural
facilities and services across blocks must be addressed on priority because equity is the core
of the philosophy of development. People of the district are alive to the social and economic
opportunities in farming and other sectors. However, there is a need to provide policy
support to better harness these potentials.
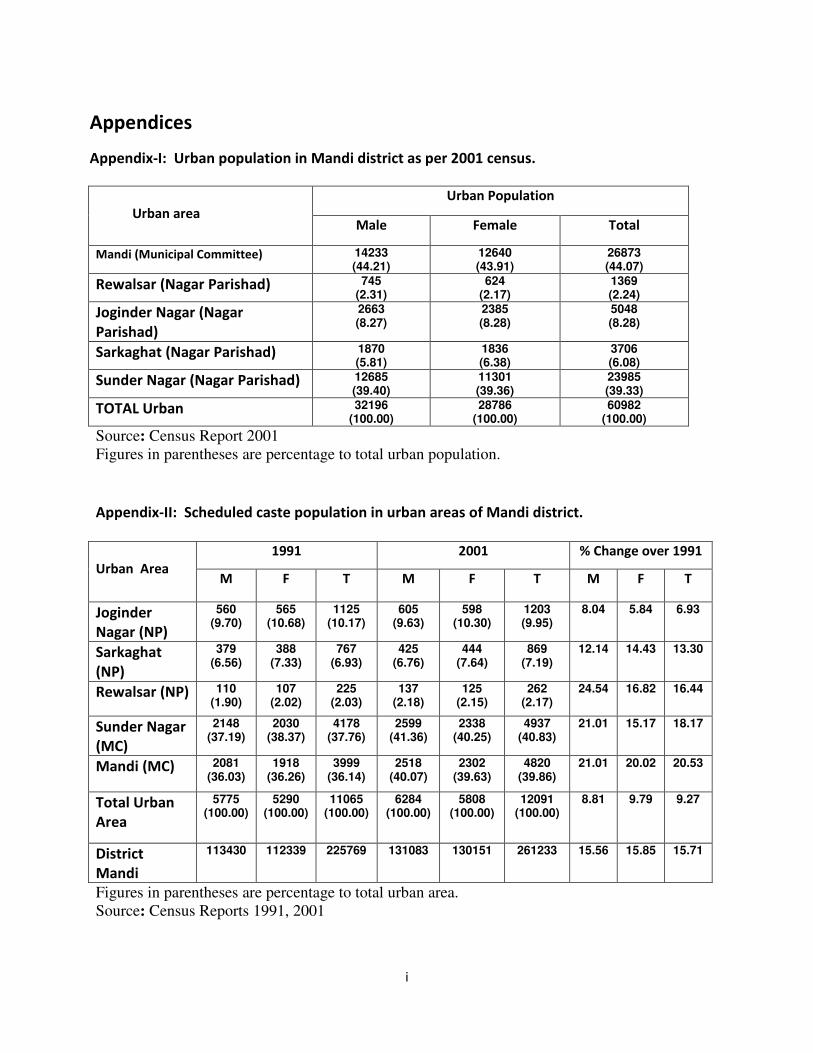
i
Appendices
Appendix-I: Urban population in Mandi district as per 2001 census.
Urban Population
Urban area Male Female Total
Mandi (Municipal Committee) 14233 (44.21)
12640 (43.91)
26873 (44.07)
Rewalsar (Nagar Parishad) 745 (2.31)
624 (2.17)
1369 (2.24)
Joginder Nagar (Nagar
Parishad)
2663 (8.27)
2385 (8.28)
5048 (8.28)
Sarkaghat (Nagar Parishad) 1870 (5.81)
1836 (6.38)
3706 (6.08)
Sunder Nagar (Nagar Parishad) 12685 (39.40)
11301 (39.36)
23985 (39.33)
TOTAL Urban 32196 (100.00)
28786 (100.00)
60982 (100.00)
Source: Census Report 2001
Figures in parentheses are percentage to total urban population.
Appendix-II: Scheduled caste population in urban areas of Mandi district.
1991 2001 % Change over 1991
Urban Area M F T M F T M F T
Joginder
Nagar (NP)
560 (9.70)
565 (10.68)
1125 (10.17)
605 (9.63)
598 (10.30)
1203 (9.95)
8.04 5.84 6.93
Sarkaghat
(NP)
379 (6.56)
388 (7.33)
767 (6.93)
425 (6.76)
444 (7.64)
869 (7.19)
12.14 14.43 13.30
Rewalsar (NP) 110 (1.90)
107 (2.02)
225 (2.03)
137 (2.18)
125 (2.15)
262 (2.17)
24.54 16.82 16.44
Sunder Nagar
(MC)
2148 (37.19)
2030 (38.37)
4178 (37.76)
2599 (41.36)
2338 (40.25)
4937 (40.83)
21.01 15.17 18.17
Mandi (MC) 2081 (36.03)
1918 (36.26)
3999 (36.14)
2518 (40.07)
2302 (39.63)
4820 (39.86)
21.01 20.02 20.53
Total Urban
Area
5775 (100.00)
5290 (100.00)
11065 (100.00)
6284 (100.00)
5808 (100.00)
12091 (100.00)
8.81 9.79 9.27
District
Mandi
113430 112339 225769 131083 130151 261233 15.56 15.85 15.71
Figures in parentheses are percentage to total urban area. Source: Census Reports 1991, 2001
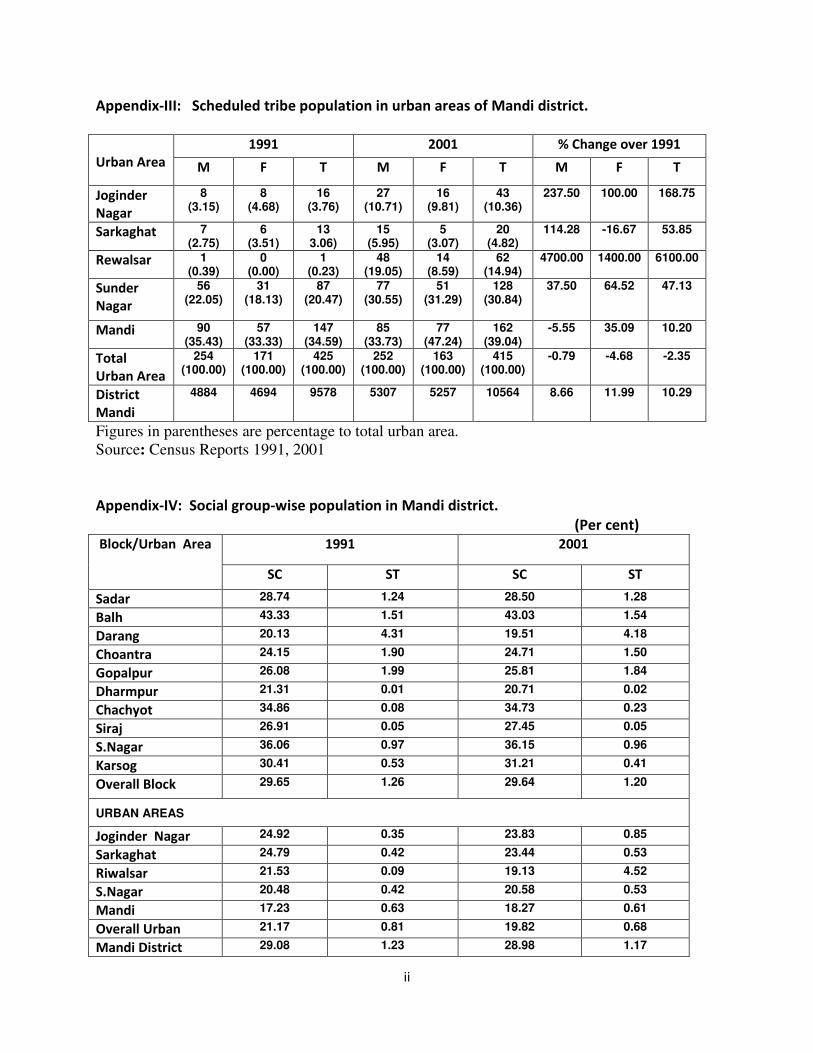
ii
Appendix-III: Scheduled tribe population in urban areas of Mandi district.
1991 2001 % Change over 1991
Urban Area M F T M F T M F T
Joginder
Nagar
8 (3.15)
8 (4.68)
16 (3.76)
27 (10.71)
16 (9.81)
43 (10.36)
237.50 100.00 168.75
Sarkaghat 7 (2.75)
6 (3.51)
13 3.06)
15 (5.95)
5 (3.07)
20 (4.82)
114.28 -16.67 53.85
Rewalsar 1 (0.39)
0 (0.00)
1 (0.23)
48 (19.05)
14 (8.59)
62 (14.94)
4700.00 1400.00 6100.00
Sunder
Nagar
56 (22.05)
31 (18.13)
87 (20.47)
77 (30.55)
51 (31.29)
128 (30.84)
37.50 64.52 47.13
Mandi 90 (35.43)
57 (33.33)
147 (34.59)
85 (33.73)
77 (47.24)
162 (39.04)
-5.55 35.09 10.20
Total
Urban Area
254 (100.00)
171 (100.00)
425 (100.00)
252 (100.00)
163 (100.00)
415 (100.00)
-0.79 -4.68 -2.35
District
Mandi
4884 4694 9578 5307 5257 10564 8.66 11.99 10.29
Figures in parentheses are percentage to total urban area. Source: Census Reports 1991, 2001
Appendix-IV: Social group-wise population in Mandi district.
(Per cent)
1991 2001 Block/Urban Area
SC ST SC ST
Sadar 28.74 1.24 28.50 1.28
Balh 43.33 1.51 43.03 1.54
Darang 20.13 4.31 19.51 4.18
Choantra 24.15 1.90 24.71 1.50
Gopalpur 26.08 1.99 25.81 1.84
Dharmpur 21.31 0.01 20.71 0.02
Chachyot 34.86 0.08 34.73 0.23
Siraj 26.91 0.05 27.45 0.05
S.Nagar 36.06 0.97 36.15 0.96
Karsog 30.41 0.53 31.21 0.41
Overall Block 29.65 1.26 29.64 1.20
URBAN AREAS
Joginder Nagar 24.92 0.35 23.83 0.85
Sarkaghat 24.79 0.42 23.44 0.53
Riwalsar 21.53 0.09 19.13 4.52
S.Nagar 20.48 0.42 20.58 0.53
Mandi 17.23 0.63 18.27 0.61
Overall Urban 21.17 0.81 19.82 0.68
Mandi District 29.08 1.23 28.98 1.17
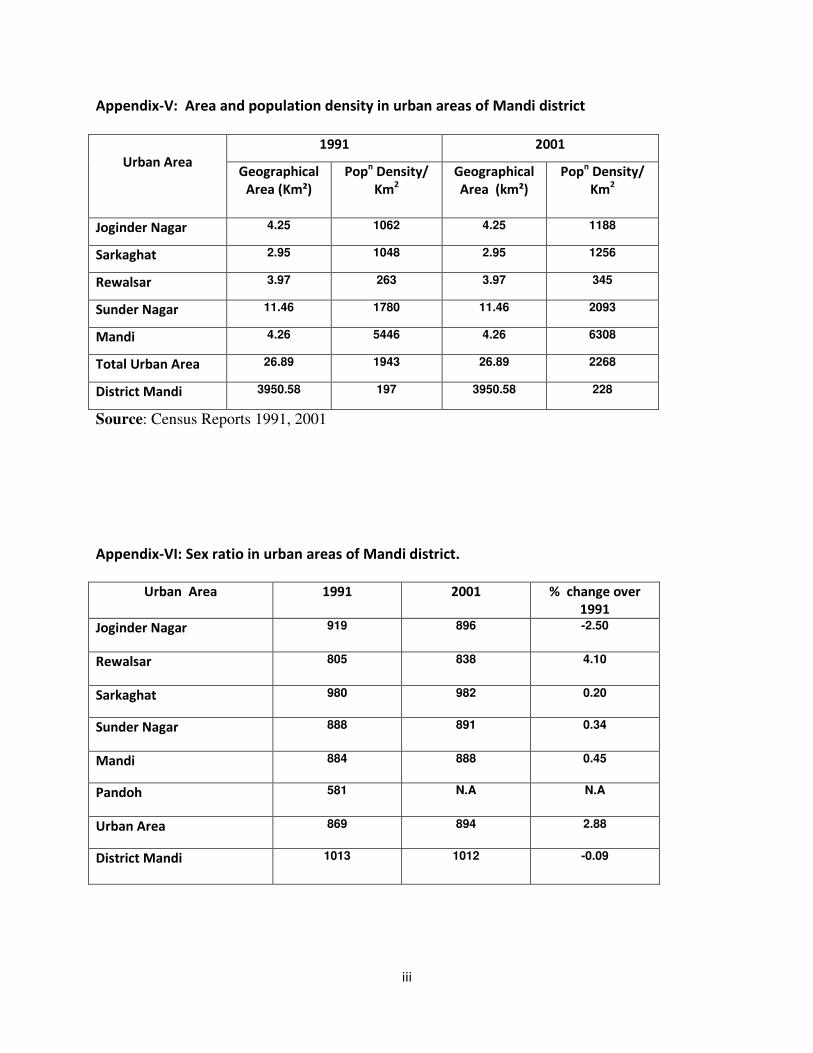
iii
Appendix-V: Area and population density in urban areas of Mandi district
1991 2001
Urban Area Geographical
Area (Km²)
Popn Density/
Km2
Geographical
Area (km²)
Popn Density/
Km2
Joginder Nagar 4.25 1062 4.25 1188
Sarkaghat 2.95 1048 2.95 1256
Rewalsar 3.97 263 3.97 345
Sunder Nagar 11.46 1780 11.46 2093
Mandi 4.26 5446 4.26 6308
Total Urban Area 26.89 1943 26.89 2268
District Mandi 3950.58 197 3950.58 228
Source: Census Reports 1991, 2001
Appendix-VI: Sex ratio in urban areas of Mandi district.
Urban Area 1991 2001 % change over
1991
Joginder Nagar 919 896 -2.50
Rewalsar 805 838 4.10
Sarkaghat 980 982 0.20
Sunder Nagar 888 891 0.34
Mandi 884 888 0.45
Pandoh 581 N.A N.A
Urban Area 869 894 2.88
District Mandi 1013 1012 -0.09
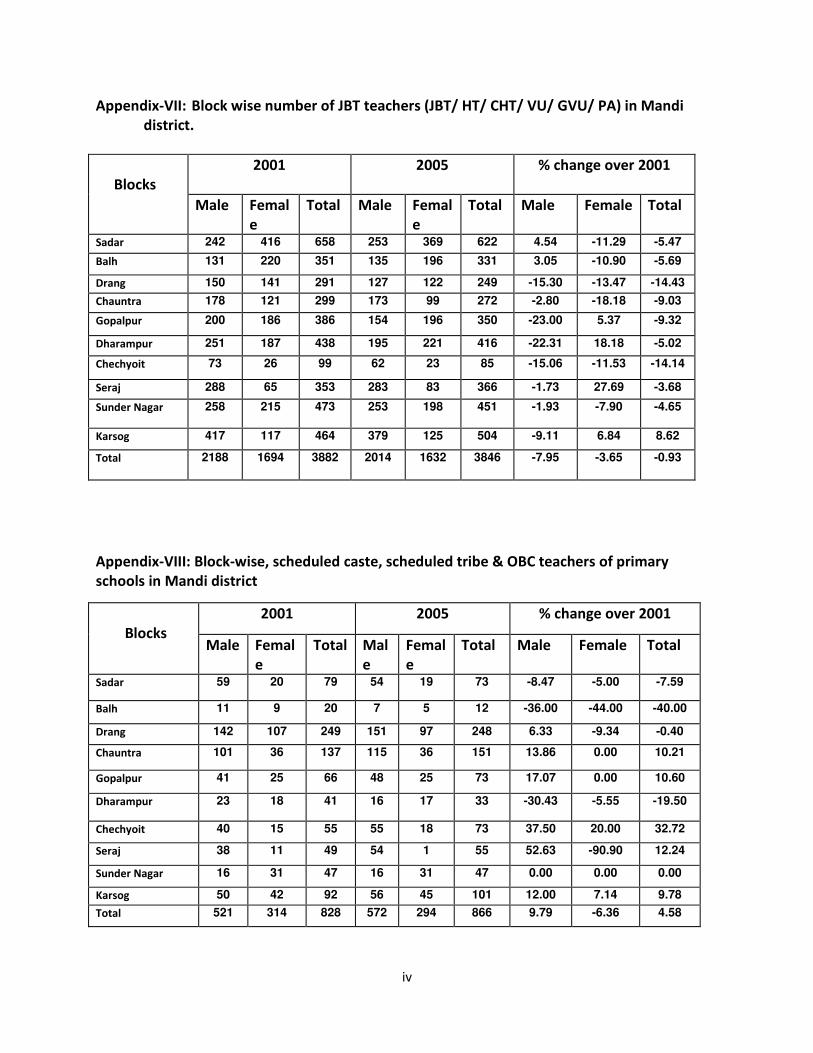
iv
Appendix-VII: Block wise number of JBT teachers (JBT/ HT/ CHT/ VU/ GVU/ PA) in Mandi
district.
2001
2005 % change over 2001
Blocks
Male Femal
e
Total Male Femal
e
Total Male Female Total
Sadar 242 416 658 253 369 622 4.54 -11.29 -5.47
Balh 131 220 351 135 196 331 3.05 -10.90 -5.69
Drang 150 141 291 127 122 249 -15.30 -13.47 -14.43
Chauntra 178 121 299 173 99 272 -2.80 -18.18 -9.03
Gopalpur 200 186 386 154 196 350 -23.00 5.37 -9.32
Dharampur 251 187 438 195 221 416 -22.31 18.18 -5.02
Chechyoit 73 26 99 62 23 85 -15.06 -11.53 -14.14
Seraj 288 65 353 283 83 366 -1.73 27.69 -3.68
Sunder Nagar 258 215 473 253 198 451 -1.93 -7.90 -4.65
Karsog 417 117 464 379 125 504 -9.11 6.84 8.62
Total 2188 1694 3882 2014 1632 3846 -7.95 -3.65 -0.93
Appendix-VIII: Block-wise, scheduled caste, scheduled tribe & OBC teachers of primary
schools in Mandi district
2001 2005 % change over 2001
Blocks Male Femal
e
Total Mal
e
Femal
e
Total Male Female Total
Sadar 59 20 79 54 19 73 -8.47 -5.00 -7.59
Balh 11 9 20 7 5 12 -36.00 -44.00 -40.00
Drang 142 107 249 151 97 248 6.33 -9.34 -0.40
Chauntra 101 36 137 115 36 151 13.86 0.00 10.21
Gopalpur 41 25 66 48 25 73 17.07 0.00 10.60
Dharampur 23 18 41 16 17 33 -30.43 -5.55 -19.50
Chechyoit 40 15 55 55 18 73 37.50 20.00 32.72
Seraj 38 11 49 54 1 55 52.63 -90.90 12.24
Sunder Nagar 16 31 47 16 31 47 0.00 0.00 0.00
Karsog 50 42 92 56 45 101 12.00 7.14 9.78
Total 521 314 828 572 294 866 9.79 -6.36 4.58
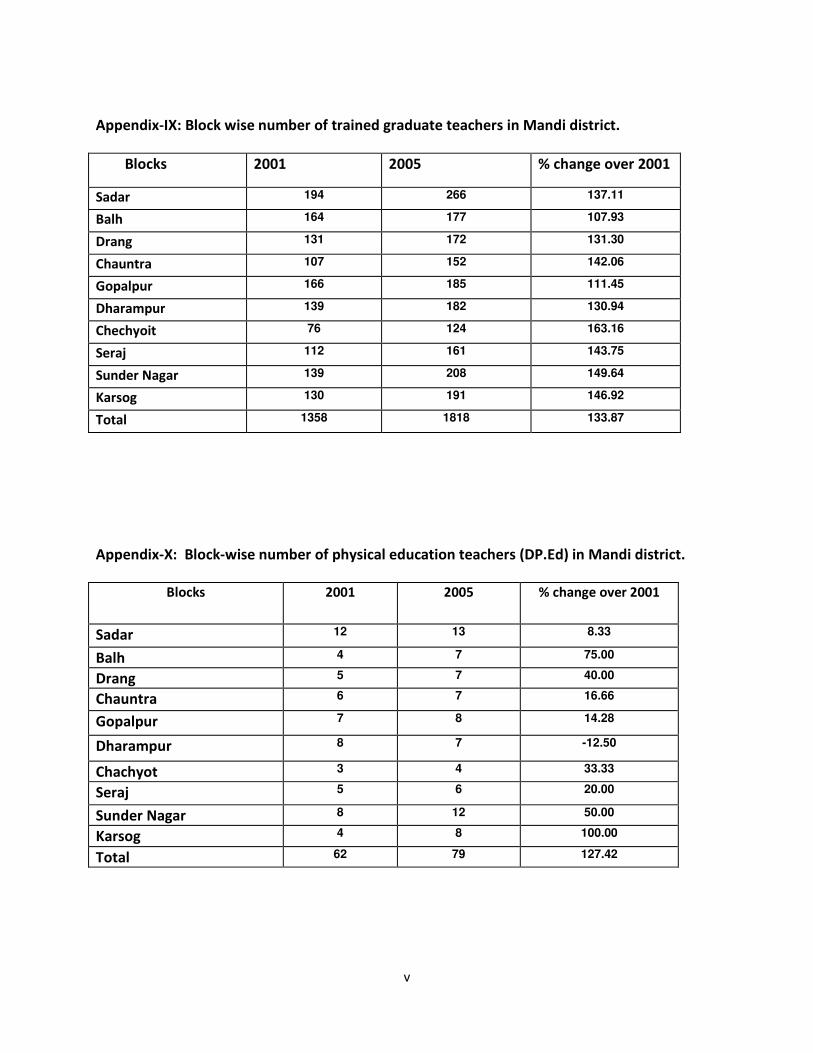
v
Appendix-IX: Block wise number of trained graduate teachers in Mandi district.
Blocks 2001 2005 % change over 2001
Sadar 194 266 137.11
Balh 164 177 107.93
Drang 131 172 131.30
Chauntra 107 152 142.06
Gopalpur 166 185 111.45
Dharampur 139 182 130.94
Chechyoit 76 124 163.16
Seraj 112 161 143.75
Sunder Nagar 139 208 149.64
Karsog 130 191 146.92
Total 1358 1818 133.87
Appendix-X: Block-wise number of physical education teachers (DP.Ed) in Mandi district.
Blocks 2001 2005 % change over 2001
Sadar 12 13 8.33
Balh 4 7 75.00
Drang 5 7 40.00
Chauntra 6 7 16.66
Gopalpur 7 8 14.28
Dharampur 8 7 -12.50
Chachyot 3 4 33.33
Seraj 5 6 20.00
Sunder Nagar 8 12 50.00
Karsog 4 8 100.00
Total 62 79 127.42
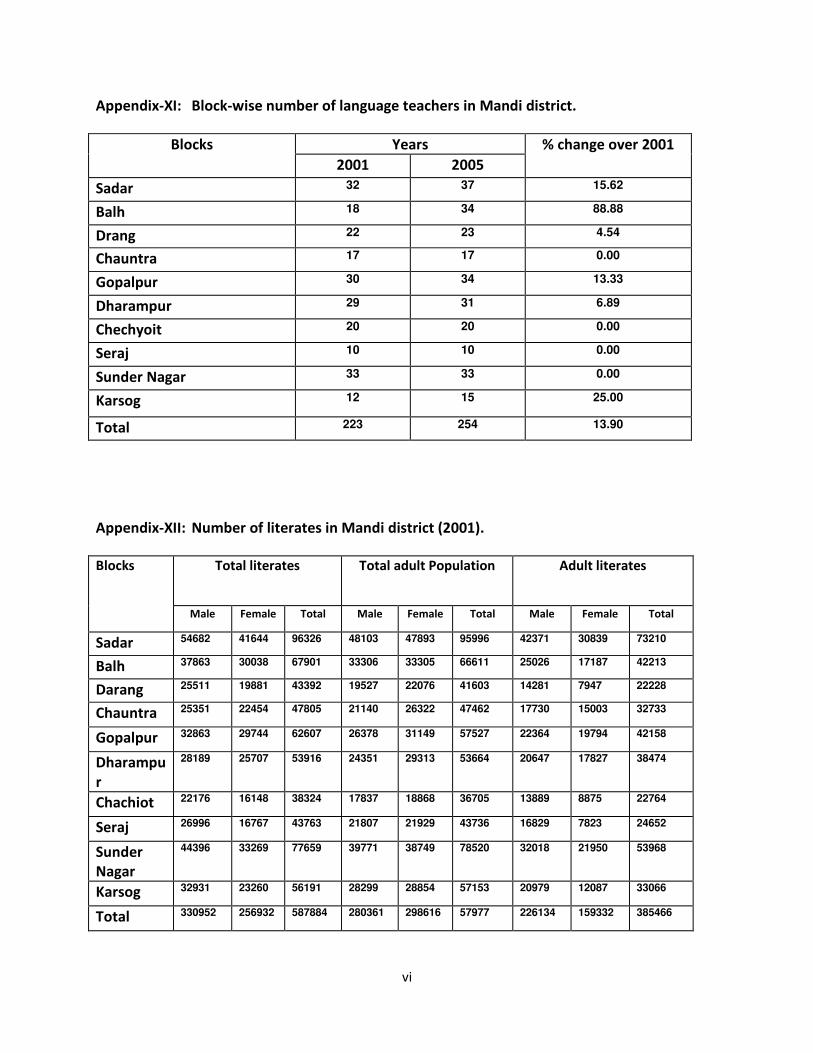
vi
Appendix-XI: Block-wise number of language teachers in Mandi district.
Years Blocks
2001 2005
% change over 2001
Sadar 32 37 15.62
Balh 18 34 88.88
Drang 22 23 4.54
Chauntra 17 17 0.00
Gopalpur 30 34 13.33
Dharampur 29 31 6.89
Chechyoit 20 20 0.00
Seraj 10 10 0.00
Sunder Nagar 33 33 0.00
Karsog 12 15 25.00
Total 223 254 13.90
Appendix-XII: Number of literates in Mandi district (2001).
Total literates
Total adult Population
Adult literates
Blocks
Male Female Total Male Female Total Male Female Total
Sadar 54682 41644 96326 48103 47893 95996 42371 30839 73210
Balh 37863 30038 67901 33306 33305 66611 25026 17187 42213
Darang 25511 19881 43392 19527 22076 41603 14281 7947 22228
Chauntra 25351 22454 47805 21140 26322 47462 17730 15003 32733
Gopalpur 32863 29744 62607 26378 31149 57527 22364 19794 42158
Dharampu
r
28189 25707 53916 24351 29313 53664 20647 17827 38474
Chachiot 22176 16148 38324 17837 18868 36705 13889 8875 22764
Seraj 26996 16767 43763 21807 21929 43736 16829 7823 24652
Sunder
Nagar
44396 33269 77659 39771 38749 78520 32018 21950 53968
Karsog 32931 23260 56191 28299 28854 57153 20979 12087 33066
Total 330952 256932 587884 280361 298616 57977 226134 159332 385466
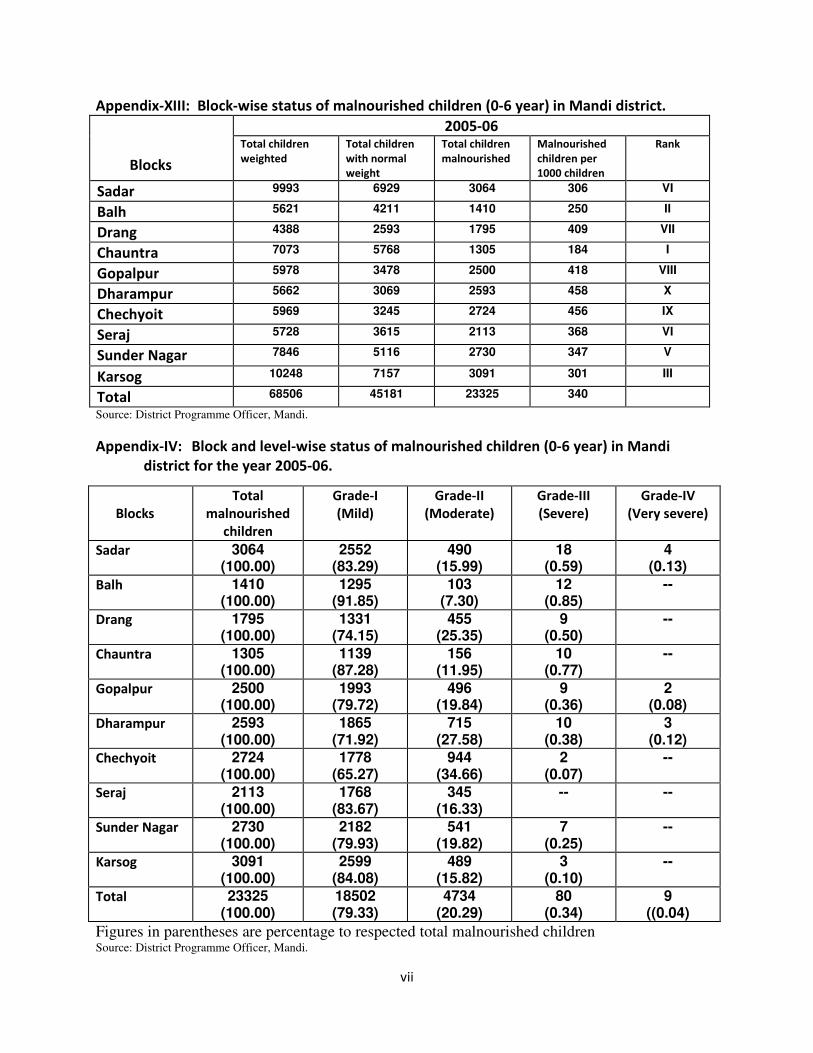
vii
Appendix-XIII: Block-wise status of malnourished children (0-6 year) in Mandi district.
2005-06
Blocks
Total children
weighted
Total children
with normal
weight
Total children
malnourished
Malnourished
children per
1000 children
Rank
Sadar 9993 6929 3064 306 VI
Balh 5621 4211 1410 250 II
Drang 4388 2593 1795 409 VII
Chauntra 7073 5768 1305 184 I
Gopalpur 5978 3478 2500 418 VIII
Dharampur 5662 3069 2593 458 X
Chechyoit 5969 3245 2724 456 IX
Seraj 5728 3615 2113 368 VI
Sunder Nagar 7846 5116 2730 347 V
Karsog 10248 7157 3091 301 III
Total 68506 45181 23325 340
Source: District Programme Officer, Mandi.
Appendix-IV: Block and level-wise status of malnourished children (0-6 year) in Mandi
district for the year 2005-06.
Figures in parentheses are percentage to respected total malnourished children Source: District Programme Officer, Mandi.
Blocks
Total
malnourished
children
Grade-I
(Mild)
Grade-II
(Moderate)
Grade-III
(Severe)
Grade-IV
(Very severe)
Sadar 3064 (100.00)
2552 (83.29)
490 (15.99)
18 (0.59)
4 (0.13)
Balh 1410 (100.00)
1295 (91.85)
103 (7.30)
12 (0.85)
--
Drang 1795 (100.00)
1331 (74.15)
455 (25.35)
9 (0.50)
--
Chauntra 1305 (100.00)
1139 (87.28)
156 (11.95)
10 (0.77)
--
Gopalpur 2500 (100.00)
1993 (79.72)
496 (19.84)
9 (0.36)
2 (0.08)
Dharampur 2593 (100.00)
1865 (71.92)
715 (27.58)
10 (0.38)
3 (0.12)
Chechyoit 2724 (100.00)
1778 (65.27)
944 (34.66)
2 (0.07)
--
Seraj 2113 (100.00)
1768 (83.67)
345 (16.33)
-- --
Sunder Nagar 2730 (100.00)
2182 (79.93)
541 (19.82)
7 (0.25)
--
Karsog 3091 (100.00)
2599 (84.08)
489 (15.82)
3 (0.10)
--
Total 23325 (100.00)
18502 (79.33)
4734 (20.29)
80 (0.34)
9 ((0.04)
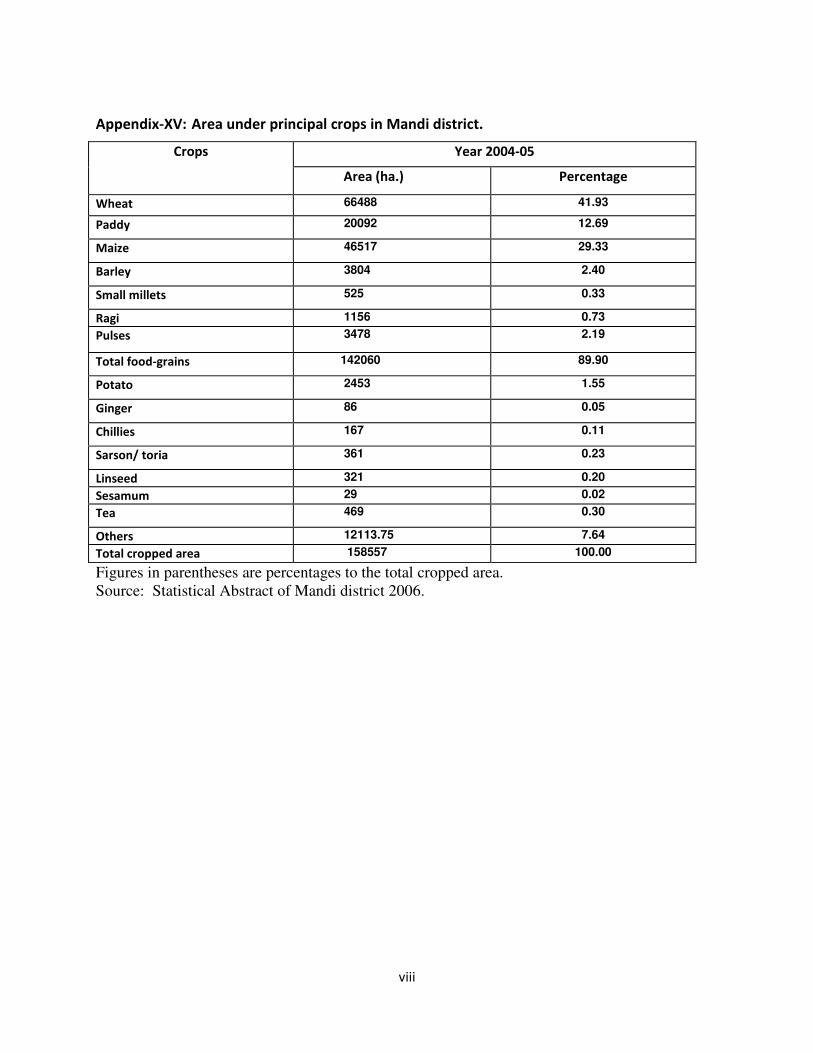
viii
Appendix-XV: Area under principal crops in Mandi district.
Year 2004-05 Crops
Area (ha.) Percentage
Wheat 66488 41.93
Paddy 20092 12.69
Maize 46517 29.33
Barley 3804 2.40
Small millets 525 0.33
Ragi 1156 0.73
Pulses 3478 2.19
Total food-grains 142060 89.90
Potato 2453 1.55
Ginger 86 0.05
Chillies 167 0.11
Sarson/ toria 361 0.23
Linseed 321 0.20
Sesamum 29 0.02
Tea 469 0.30
Others 12113.75 7.64
Total cropped area 158557 100.00
Figures in parentheses are percentages to the total cropped area. Source: Statistical Abstract of Mandi district 2006.
ix
References Jing, Feng. 2006. Repositioning Human Health in Development. Sustainable Mountain Development. No. 52, Spring. ICIMOD, Kathmandu, Nepal.
Kollmair, Michael. Greater Voices for all Mountain People in the Himalayan Region. Sustainable Mountain Development. No. 52, Spring. ICIMOD, Kathmandu, Nepal.
PROBE (1991), Public Report on Basic Education, New Delhi; Oxford University Press, Oxford.
Sharma, LR and Negi, YS. (2005). Approaches for Marketing and Crop Diversification of Commercial Vegetables in Himachal Pradesh. Department of Social sciences, Dr YS Parmar University of Horticulture and Forestry, Nauni, Solan, Himachal Pradesh.
Sinha, S. (1996). Child Labour and Education Policy in India. The Administrator, Vol.41, no.3.
Viner, J. (1953). International trade and Economic Development. Oxford University Press, Oxford.
Weiner, M. (1991) The Child and the State in India. Princeton University Press.
Gazetteer of the Mandi State (1920). Indus Publishing Company, New Delhi.
Gazetteer of the Suket State (1927). Indus Publishing Company, New Delhi.
Primary Census Survey Abstract (2001). Directorate of Census Operation, Himachal Pradesh.
Primary Census Survey Abstract, Community Development Block-wise (2001). Directorate of Census Operation, Himachal Pradesh.
Village Directory, Amenities and Land Use Census (2001).Directorate of Census Operation, Himachal Pradesh.
Statistical Abstract of Mandi District (2006). District Statistical Officer, Mandi, Himachal Pradesh.
Statistical Outline of Himachal Pradesh, (Various Issues). Economics and Statistics Department, Himachal Pradesh.
School Listing Report. HP Primary Education Society-cum- Sarva Shiksha Abhiyan, State Mission Authority, DPEP Bhawan, Lalpani, Shimla, Himachal Pradesh. http://www.hpmandi.gov.in http://www.himachal.nic.in