Embed Size (px)
Citation preview
Complementary genomic approaches highlight thePI3K/mTOR pathway as a common vulnerabilityin osteosarcomaJennifer A. Perrya,1, Adam Kiezunb,1, Peter Tonzia, Eliezer M. Van Allenb,c, Scott L. Carterb, Sylvan C. Bacab,c,Glenn S. Cowleyb, Ami S. Bhattb,c, Esther Rheinbayb, Chandra Sekhar Pedamallub,c, Elena Helmanb,c,Amaro Taylor-Weinerb, Aaron McKennab, David S. DeLucab, Michael S. Lawrenceb, Lauren Ambrogiob,Carrie Sougnezb, Andrey Sivachenkob, Loren D. Walenskya,d, Nikhil Wagleb,c,e, Jaume Moraf, Carmen de Torresf,Cinzia Lavarinof, Simone Dos Santos Aguiarg,h, Jose Andres Yunesg,i, Silvia Regina Brandaliseg,Gabriela Elisa Mercado-Celisj, Jorge Melendez-Zajglaj, Rocío Cárdenas-Cardósk, Liliana Velasco-Hidalgok,Charles W. M. Robertsa,d, Levi A. Garrawayb,c,e, Carlos Rodriguez-Galindoa,d, Stacey B. Gabrielb, Eric S. Landerb,l,m,Todd R. Golubb,d,n, Stuart H. Orkina,d,n,2, Gad Getzb,o,2,3, and Katherine A. Janewaya,d,2,3
aDepartment of Pediatric Oncology, Dana–Farber/Boston Children’s Cancer and Blood Disorders Center, Boston, MA 02215; bThe Broad Institute of MITand Harvard, Cambridge, MA 02142; cDepartment of Medical Oncology, Dana–Farber Cancer Institute, Boston, MA 02215; dDepartment of Pediatrics,eDepartment of Medicine, lDepartment of Systems Biology, oDepartment of Pathology, Harvard Medical School, Boston, MA 02115; fDepartment of PediatricHematology and Oncology, Hospital Sant Joan de Déu, 08950 Barcelona, Spain; gDepartment of Pediatric Oncology, Centro Infantil Boldrini, Campinas,13083-210, Brazil; hCenter for Pediatric Research, iMedical Genetics Department, Faculty of Medical Sciences, State University of Campinas, Campinas13083-887, Brazil; jSubdirection of Basic Research, National Institute of Genomic Medicine, 14610, Mexico City, Mexico; kDepartment of Oncology, NationalInstitute of Pediatrics, 04530, Mexico City, Mexico; mDepartment of Biology, Massachusetts Institute of Technology, Cambridge, MA 02139; and nHowardHughes Medical Institute, Chevy Chase, MD 20815
Contributed by Stuart H. Orkin, October 9, 2014 (sent for review July 25, 2014)
Osteosarcoma is the most common primary bone tumor, yet therehave been no substantial advances in treatment or survival in threedecades. We examined 59 tumor/normal pairs by whole-exome,whole-genome, and RNA-sequencing. Only the TP53 gene was mu-tated at significant frequency across all samples. The mean nonsilentsomatic mutation rate was 1.2 mutations per megabase, and therewas a median of 230 somatic rearrangements per tumor. Complexchains of rearrangements and localized hypermutation weredetected in almost all cases. Given the intertumor heterogeneity,the extent of genomic instability, and the difficulty in acquiring alarge sample size in a rare tumor, we used several methods to identifygenomic events contributing to osteosarcoma survival. Pathwayanalysis, a heuristic analytic algorithm, a comparative oncology ap-proach, and an shRNA screen converged on the phosphatidylinositol3-kinase/mammalian target of rapamycin (PI3K/mTOR) pathway asa central vulnerability for therapeutic exploitation in osteosarcoma.Osteosarcoma cell lines are responsive to pharmacologic and geneticinhibition of the PI3K/mTOR pathway both in vitro and in vivo.
osteosarcoma | TP53 | PI3K | mTOR | genomics
Osteosarcoma (OS), the most common primary bone tumor,is an aggressive cancer that affects children, adolescents,
and young adults. In contrast to the improvements in 5-yearoverall survival for childhood cancers from 58% to 82% in thepast three decades, the overall survival for pediatric OS hasremained static over that same time period at 60% (1, 2).Predisposition to OS is associated with germline syndromes,
including hereditary retinoblastoma and Li-Fraumeni syndrome(3, 4). OS is also seen in syndromes with mutations in RECQhelicases and SQSTM1 (5, 6). However, most cases of OS de-velop sporadically and are characterized by complex genomics.The first genome-wide association study conducted in OS onlyidentified two susceptibility loci implicating one gene, GRM4, aglutamate receptor (7).Linkage with hereditary retinoblastoma and Li Fraumeni led
to the recognition of recurrent somatic alterations in TP53, RB1,and genes interacting with TP53 and RB1 in OS (8, 9). Candi-date-gene approaches demonstrated recurrent somatic muta-tions, deletions, and rearrangement affecting TP53 (9). Additionalmechanisms of p53 inactivation described in OS are MDM2 and
COPS3 amplification (8, 9). RB1mutations are present in 6% anddeletions or structural alterations are seen in 40% of cases (10,11). CDKN2A is deleted in 10–20% of OS (9, 12). Multiple othercancer-associated genes have been reported to be altered in OS[reviewed in Kansara and Thomas (5)]. Many of these studies
Significance
We present, to our knowledge, the first comprehensive next-generation sequencing of osteosarcoma in combination witha functional genomic screen in a genetically defined mousemodel of osteosarcoma. Our data provide a strong rationale fortargeting the phosphatidylinositol 3-kinase/mammalian targetof rapamycin pathway in osteosarcoma and a foundation forrational clinical trial design. These findings present an imme-diate clinical opportunity because multiple inhibitors of thispathway are currently in clinical trials.
Author contributions: J.A.P., A.K., G.S.C., L.D.W., N.W., C.W.M.R., L.A.G., C.R.-G., E.S.L.,T.R.G., S.H.O., G.G., and K.A.J. designed research; J.A.P., A.K., P.T., E.M.V.A., S.L.C., S.C.B.,A.S.B., E.R., C.S.P., E.H., A.T.-W., A.M., D.S.D., M.S.L., A.S., and K.A.J. performed research;J.A.P., J.M., C.d.T., C.L., S.D.S.A., J.A.Y., S.R.B., G.E.M.-C., J.M.-Z., R.C.-C., L.V.-H., and E.S.L.contributed new reagents/analytic tools; J.A.P., A.K., P.T., E.M.V.A., S.L.C., S.C.B., G.S.C.,A.S.B., E.R., C.S.P., E.H., A.T.-W., M.S.L., L.A., C.S., L.A.G., S.B.G., and K.A.J. analyzed data;J.A.P., A.K., and K.A.J. wrote the paper; L.A. and C.S. managed sequencing and data;L.D.W. and N.W. developed tumor banking protocols andmanaged regulatory complianceand collection of clinical data; and J.M., C.d.T., C.L., S.D.S.A., J.A.Y., S.R.B., G.E.M.-C., J.M.-Z.,R.C.-C., and L.V.-H. recruited subjects, managed compliance, submitted samples, and col-lected clinical data.
Conflict of interest statement: C.W.M.R. receives research support and consulting feesfrom the Novartis Institutes for Biomedical Research (NIBR) via the Dana–Farber CancerInstitute/NIBR drug discovery program.
Freely available online through the PNAS open access option.
Data deposition: The sequence reported in this paper has been deposited in the NationalCenter for Biotechnology Information Database of Genotypes and Phenotypes (dbGaP),www.ncbi.nlm.nih.gov/gap (accession no. phs000699.v1.p1 and phs000694.v1.p1 for sam-ple DF01). Osteosarcoma Genomics.
See Commentary on page 18100.1J.A.P. and A.K. contributed equally to this work.2To whom correspondence may be addressed. Email: [email protected],[email protected], or [email protected].
3G.G. and K.A.J. contributed equally to this work.
This article contains supporting information online at www.pnas.org/lookup/suppl/doi:10.1073/pnas.1419260111/-/DCSupplemental.
E5564–E5573 | PNAS | Published online December 15, 2014 www.pnas.org/cgi/doi/10.1073/pnas.1419260111
investigating somatic alterations in specific genes were performedon small numbers of tumors with low-throughput techniques. Morerecently, next-generation sequencing of 34 osteosarcomas identi-fied recurrent alterations in ATRX and DLG2, in addition to TP53and RB1 (13). This next-generation sequencing study used indepth analysis of whole-genome sequence data and demonstratedthat OS tumors have multiple rearrangements across the genome,kataegis, and a high degree of intratumor heterogeneity. Chro-mothripsis has been described in selected cases (14, 15). To date,none of these discoveries have led to the development of molec-ularly targeted therapies or improved survival for OS patients.Because treatment for OS has not changed appreciably in the
past 30 years, new approaches to treating the disease are im-perative. We sought to identify tractable therapeutic targets inOS by performing next-generation sequencing and a compre-hensive analysis of the genomic alterations in OS. We antici-pated challenges in identifying a gene or genes altered in a largeproportion of cases because of the difficulty collecting a largesample size in such a rare tumor, genomic complexity and het-erogeneity. We hypothesized that we could identify genes orpathways required for OS survival by combining sequencing datawith four methods for identifying essential genes, including: (i)pathway analysis, based on the mutational profile; (ii) a heuristicalgorithm used to identify alterations with the potential to beclinically actionable; (iii) a comparative oncology approach usingwhole exome sequencing from a mouse model of OS; and (iv)a genome-wide functional shRNA screen in murine OS to identifyessential genes. Taken together, the data implicate the phosphati-dylinositol 3-kinase/mammalian target of rapamycin (PI3K/mTOR)pathway as a key target for the treatment of OS.
ResultsClinical and Sequence Data Characteristics. We examined OS tu-mor/normal (blood) sample pairs by whole-genome sequencing(WGS; 13 cases), whole-exome sequencing (WES; 59 cases), andRNA-Sequencing (RNASeq; 35 cases) (Fig. 1). Clinical featuresof the patient population including outcome were typical for OS,with the exception of a higher proportion (47%) with metastasesat diagnosis (Fig. S1A). All cases except two were sporadic, andno patients had clinically apparent germline syndromes associ-ated with OS.WES of ∼33 Mb of protein-coding sequence yielded a median of
103× tumor (range 60×–188×) and normal (range 56×–206×) depthof coverage. A median of 88.2% (range 84–91%) of exonic baseswere powered for discovering mutations. WGS yielded a median of36× tumor (range 30×–61×) tumor and 35× normal (range 27×–38×) depth of coverage. In WGS, a median of 89% of genomicbases (range 87–90%) were powered for discovering mutations.Bases were considered powered for discovering mutations if theywere covered with at least 14 reads in the tumor sample and at least8 reads in the normal sample. The thresholds were selected toachieve 80% power for mutations at an allelic fraction of 0.3 (16).
Deleterious Germline Variants in TP53 Are Common in Osteosarcoma.We examined germline variants of the 59 normal samples byWES. Twenty rare nonsilent variants were present in ninecandidate genes after excluding missense variants classified as“benign” by PolyPhen-2 (Table S1) (17). Variants present inmore than two normal samples were detected in only two genes:TP53 (n = 7) and SQSTM1 (n = 4). Germline mutations inTP53 were present at a higher frequency (12%) than previouslyreported (3%) (4). All seven TP53 variants were previouslyreported. We also examined somatic loss of heterozygosity ofthe germline variant alleles and found that only TP53 germlinevariants were subject to a “second hit” by loss of heterozygosityof the wild-type allele (Table S1). Four rare nonsilent nucleo-tide variants in SQSTM1 were identified. Three of these wereidentical: p.K238E, a SNP (rs11548633) in the TRAF6 binding
domain, and p.A426V, a mutation previously linked to Paget’sdisease of bone (18).
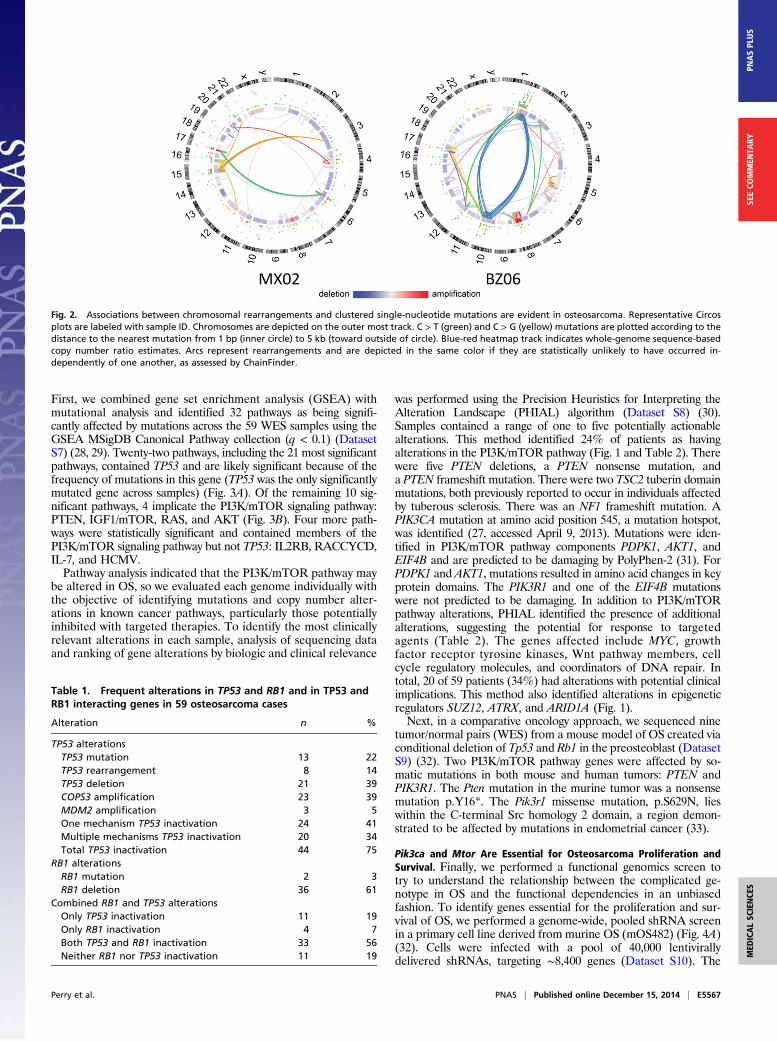
Osteosarcoma Marked by High Mutation Rate and Kataegis. In thecoding regions of the OS genomes (59 WES samples), we detecteda median of 37 somatic, nonsilent mutations per case (range 7–237), corresponding to a median somatic mutation rate of 1.2mutations per megabase. To better understand the mechanismsleading to mutations in OS, we examined the distribution andcategories of somatic point mutations across the genome. We ob-served a prevalence of localized hypermutation, in particular in-volving closely spaced C > T and C > G mutations in TpCpXtrinucleotide contexts in several samples. This phenomenon,termed kataegis, was recently described in breast cancer and,subsequently, OS (13, 19). Using “rainfall” plots of C > T and C >G mutations derived from WGS, we identified kataegis in 11 of 13(85%) OS samples. As previously described, kataegis events over-lapped with genomic rearrangements in OS (Fig. 2). Kataegis hasbeen linked, in other diseases, to APOBEC family proteins, whichplay a role in innate antiviral defense (19). To test the hypothesis ofviral involvement, we examinedWGS, WES, and RNASeq data forthe presence of viral nucleic acid sequences by PathSeq but did notdetect any enrichment (20).
Osteosarcomas Exhibit Genomic Complexity and Heterogeneity.Copy number analysis using the WES data from 59 sampleswith GISTIC2 revealed 15 significant arm-level events, 15 sig-nificant focal amplifications, and 22 significant focal deletions(Fig. S1B and Datasets S1 and S2) (21). The observed focal copynumber alterations in this study are consistent with previousreports. The most significant focal deletions included the genesRB1, TP53, and CDKN2A/B (9, 10, 12). The most significant focalamplifications were in the COPS3, CCNE1, CDK4, and MYCgenes, and 6p12.3 amplifications (8, 22).In the 13 WGS samples, a median of 230 (range 3–1,059)
rearrangements per OS genome were observed, which is muchhigher than that seen in 275 TCGA (The Cancer Genome Atlas)tumor/normal WGS samples from other tumor types [median 48(range 0–699), P < 3.5e-5, one-sided Mann–Whitney test] (23).No recurrent fusion events were found; however, rearrangementswith breakpoints near TP53 occurred with highest frequencyamong 2,586 genes (Dataset S3). Additionally, RNAseq data re-vealed that TP53 was a recurrent fusion partner (3 of 35 samples)(Dataset S3). Integrative analysis of genomic breakpoints and copynumber data were performed using the ChainFinder algorithm(24). Complex rearrangements indicative of chromoplexy wereabundant in OS, and could be identified in samples both with highand low degrees of overall genomic rearrangement (25). Wedetected complex chains of rearrangements in 11 OS genomes(Fig. 2 and Dataset S4). The percentage of chromosomal break-points involved in a chain ranged from 27–70% (median 44%)across osteosarcomas. Chains of rearrangements from all tumorsinvolved multiple chromosomes (median 4, range 3–6) and all butone involved multiple “deletion bridges” (median 6, range 0–29),which indicate large segments of DNA deletions at fusion junc-tions. Consistent with observations in other cancer types, regionsof kataegis were highly correlated with copy number breakpointsand rearrangement sites.OS samples are heterogeneous and highly complex. Among the
59 WES samples we analyzed, estimates of sample purity rangedfrom 19 to 100% (median 55%) and average cancer cell ploidyranged from 1.42 to 4.31 (median 2.09). This finding is consistentwith the massive complexity revealed by rearrangement analysisand points to frequent occurrence of genome doublings in OS:indeed, 12 of 55 (12.8%) samples for which ploidy estimationswere obtained had ploidy above 3 (Dataset S5).
Perry et al. PNAS | Published online December 15, 2014 | E5565
MED
ICALSC
IENCE
SPN
ASPL
US
SEECO
MMEN
TARY
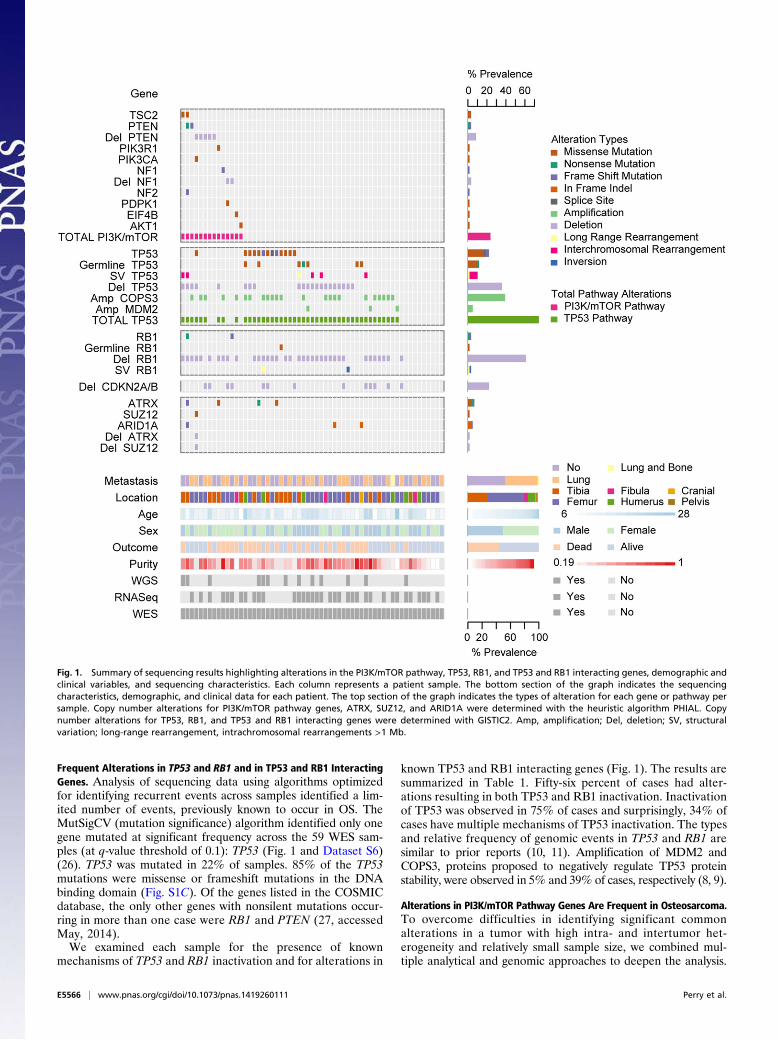
Frequent Alterations in TP53 and RB1 and in TP53 and RB1 InteractingGenes. Analysis of sequencing data using algorithms optimizedfor identifying recurrent events across samples identified a lim-ited number of events, previously known to occur in OS. TheMutSigCV (mutation significance) algorithm identified only onegene mutated at significant frequency across the 59 WES sam-ples (at q-value threshold of 0.1): TP53 (Fig. 1 and Dataset S6)(26). TP53 was mutated in 22% of samples. 85% of the TP53mutations were missense or frameshift mutations in the DNAbinding domain (Fig. S1C). Of the genes listed in the COSMICdatabase, the only other genes with nonsilent mutations occur-ring in more than one case were RB1 and PTEN (27, accessedMay, 2014).We examined each sample for the presence of known
mechanisms of TP53 and RB1 inactivation and for alterations in
known TP53 and RB1 interacting genes (Fig. 1). The results aresummarized in Table 1. Fifty-six percent of cases had alter-ations resulting in both TP53 and RB1 inactivation. Inactivationof TP53 was observed in 75% of cases and surprisingly, 34% ofcases have multiple mechanisms of TP53 inactivation. The typesand relative frequency of genomic events in TP53 and RB1 aresimilar to prior reports (10, 11). Amplification of MDM2 andCOPS3, proteins proposed to negatively regulate TP53 proteinstability, were observed in 5% and 39% of cases, respectively (8, 9).
Alterations in PI3K/mTOR Pathway Genes Are Frequent in Osteosarcoma.To overcome difficulties in identifying significant commonalterations in a tumor with high intra- and intertumor het-erogeneity and relatively small sample size, we combined mul-tiple analytical and genomic approaches to deepen the analysis.
Fig. 1. Summary of sequencing results highlighting alterations in the PI3K/mTOR pathway, TP53, RB1, and TP53 and RB1 interacting genes, demographic andclinical variables, and sequencing characteristics. Each column represents a patient sample. The bottom section of the graph indicates the sequencingcharacteristics, demographic, and clinical data for each patient. The top section of the graph indicates the types of alteration for each gene or pathway persample. Copy number alterations for PI3K/mTOR pathway genes, ATRX, SUZ12, and ARID1A were determined with the heuristic algorithm PHIAL. Copynumber alterations for TP53, RB1, and TP53 and RB1 interacting genes were determined with GISTIC2. Amp, amplification; Del, deletion; SV, structuralvariation; long-range rearrangement, intrachromosomal rearrangements >1 Mb.
E5566 | www.pnas.org/cgi/doi/10.1073/pnas.1419260111 Perry et al.
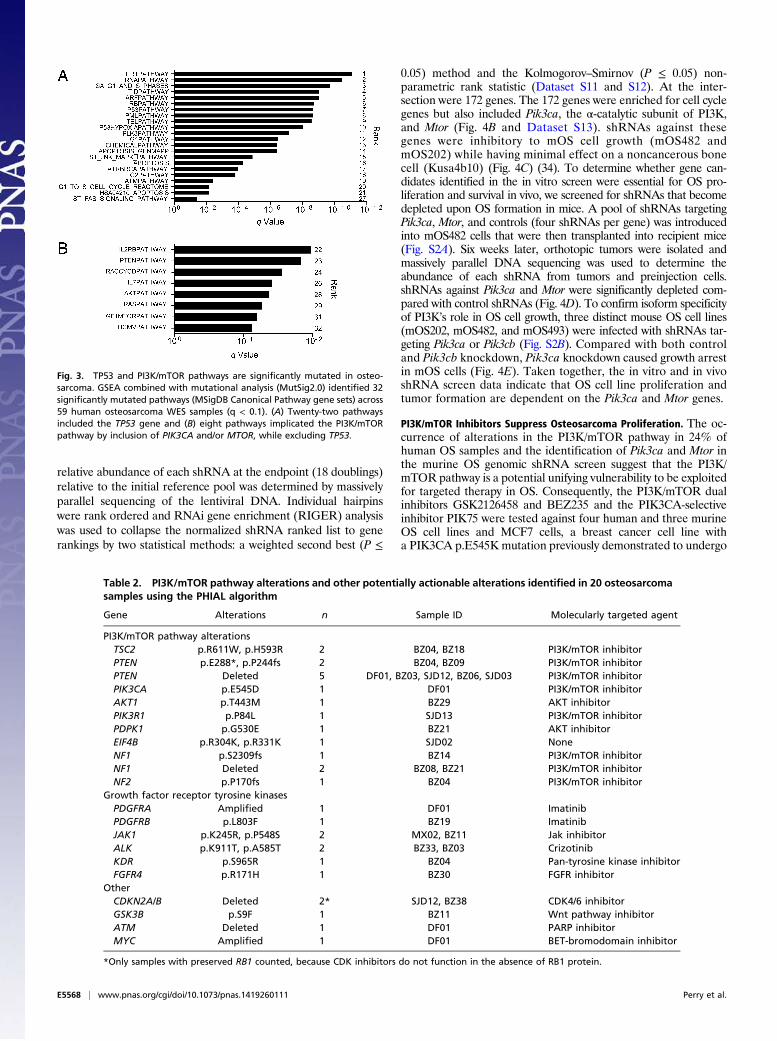
First, we combined gene set enrichment analysis (GSEA) withmutational analysis and identified 32 pathways as being signifi-cantly affected by mutations across the 59 WES samples using theGSEA MSigDB Canonical Pathway collection (q < 0.1) (DatasetS7) (28, 29). Twenty-two pathways, including the 21 most significantpathways, contained TP53 and are likely significant because of thefrequency of mutations in this gene (TP53 was the only significantlymutated gene across samples) (Fig. 3A). Of the remaining 10 sig-nificant pathways, 4 implicate the PI3K/mTOR signaling pathway:PTEN, IGF1/mTOR, RAS, and AKT (Fig. 3B). Four more path-ways were statistically significant and contained members of thePI3K/mTOR signaling pathway but not TP53: IL2RB, RACCYCD,IL-7, and HCMV.Pathway analysis indicated that the PI3K/mTOR pathway may
be altered in OS, so we evaluated each genome individually withthe objective of identifying mutations and copy number alter-ations in known cancer pathways, particularly those potentiallyinhibited with targeted therapies. To identify the most clinicallyrelevant alterations in each sample, analysis of sequencing dataand ranking of gene alterations by biologic and clinical relevance
was performed using the Precision Heuristics for Interpreting theAlteration Landscape (PHIAL) algorithm (Dataset S8) (30).Samples contained a range of one to five potentially actionablealterations. This method identified 24% of patients as havingalterations in the PI3K/mTOR pathway (Fig. 1 and Table 2). Therewere five PTEN deletions, a PTEN nonsense mutation, anda PTEN frameshift mutation. There were two TSC2 tuberin domainmutations, both previously reported to occur in individuals affectedby tuberous sclerosis. There was an NF1 frameshift mutation. APIK3CA mutation at amino acid position 545, a mutation hotspot,was identified (27, accessed April 9, 2013). Mutations were iden-tified in PI3K/mTOR pathway components PDPK1, AKT1, andEIF4B and are predicted to be damaging by PolyPhen-2 (31). ForPDPK1 and AKT1, mutations resulted in amino acid changes in keyprotein domains. The PIK3R1 and one of the EIF4B mutationswere not predicted to be damaging. In addition to PI3K/mTORpathway alterations, PHIAL identified the presence of additionalalterations, suggesting the potential for response to targetedagents (Table 2). The genes affected include MYC, growthfactor receptor tyrosine kinases, Wnt pathway members, cellcycle regulatory molecules, and coordinators of DNA repair. Intotal, 20 of 59 patients (34%) had alterations with potential clinicalimplications. This method also identified alterations in epigeneticregulators SUZ12, ATRX, and ARID1A (Fig. 1).Next, in a comparative oncology approach, we sequenced nine
tumor/normal pairs (WES) from a mouse model of OS created viaconditional deletion of Tp53 and Rb1 in the preosteoblast (DatasetS9) (32). Two PI3K/mTOR pathway genes were affected by so-matic mutations in both mouse and human tumors: PTEN andPIK3R1. The Pten mutation in the murine tumor was a nonsensemutation p.Y16*. The Pik3r1 missense mutation, p.S629N, lieswithin the C-terminal Src homology 2 domain, a region demon-strated to be affected by mutations in endometrial cancer (33).
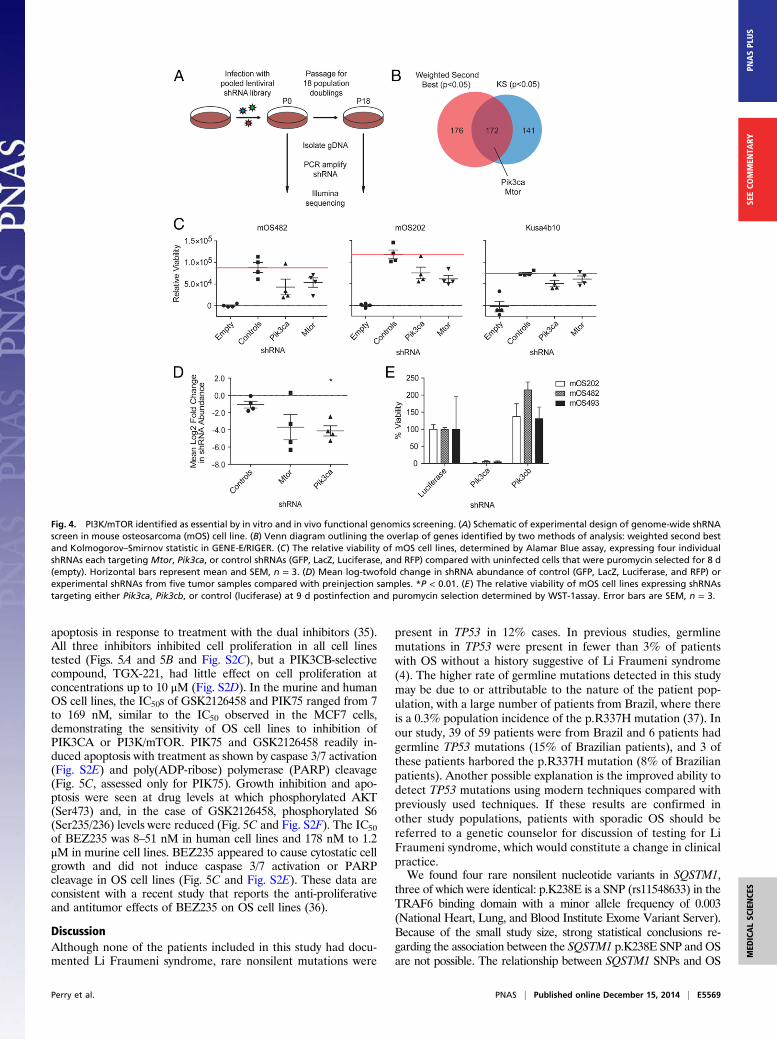
Pik3ca and Mtor Are Essential for Osteosarcoma Proliferation andSurvival. Finally, we performed a functional genomics screen totry to understand the relationship between the complicated ge-notype in OS and the functional dependencies in an unbiasedfashion. To identify genes essential for the proliferation and sur-vival of OS, we performed a genome-wide, pooled shRNA screenin a primary cell line derived from murine OS (mOS482) (Fig. 4A)(32). Cells were infected with a pool of 40,000 lentivirallydelivered shRNAs, targeting ∼8,400 genes (Dataset S10). The
Table 1. Frequent alterations in TP53 and RB1 and in TP53 andRB1 interacting genes in 59 osteosarcoma cases
Alteration n %
TP53 alterationsTP53 mutation 13 22TP53 rearrangement 8 14TP53 deletion 21 39COPS3 amplification 23 39MDM2 amplification 3 5One mechanism TP53 inactivation 24 41Multiple mechanisms TP53 inactivation 20 34Total TP53 inactivation 44 75
RB1 alterationsRB1 mutation 2 3RB1 deletion 36 61
Combined RB1 and TP53 alterationsOnly TP53 inactivation 11 19Only RB1 inactivation 4 7Both TP53 and RB1 inactivation 33 56Neither RB1 nor TP53 inactivation 11 19
Fig. 2. Associations between chromosomal rearrangements and clustered single-nucleotide mutations are evident in osteosarcoma. Representative Circosplots are labeled with sample ID. Chromosomes are depicted on the outer most track. C > T (green) and C > G (yellow) mutations are plotted according to thedistance to the nearest mutation from 1 bp (inner circle) to 5 kb (toward outside of circle). Blue-red heatmap track indicates whole-genome sequence-basedcopy number ratio estimates. Arcs represent rearrangements and are depicted in the same color if they are statistically unlikely to have occurred in-dependently of one another, as assessed by ChainFinder.
Perry et al. PNAS | Published online December 15, 2014 | E5567
MED
ICALSC
IENCE
SPN
ASPL
US
SEECO
MMEN
TARY
relative abundance of each shRNA at the endpoint (18 doublings)relative to the initial reference pool was determined by massivelyparallel sequencing of the lentiviral DNA. Individual hairpinswere rank ordered and RNAi gene enrichment (RIGER) analysiswas used to collapse the normalized shRNA ranked list to generankings by two statistical methods: a weighted second best (P ≤
0.05) method and the Kolmogorov–Smirnov (P ≤ 0.05) non-parametric rank statistic (Dataset S11 and S12). At the inter-section were 172 genes. The 172 genes were enriched for cell cyclegenes but also included Pik3ca, the α-catalytic subunit of PI3K,and Mtor (Fig. 4B and Dataset S13). shRNAs against thesegenes were inhibitory to mOS cell growth (mOS482 andmOS202) while having minimal effect on a noncancerous bonecell (Kusa4b10) (Fig. 4C) (34). To determine whether gene can-didates identified in the in vitro screen were essential for OS pro-liferation and survival in vivo, we screened for shRNAs that becomedepleted upon OS formation in mice. A pool of shRNAs targetingPik3ca, Mtor, and controls (four shRNAs per gene) was introducedinto mOS482 cells that were then transplanted into recipient mice(Fig. S2A). Six weeks later, orthotopic tumors were isolated andmassively parallel DNA sequencing was used to determine theabundance of each shRNA from tumors and preinjection cells.shRNAs against Pik3ca and Mtor were significantly depleted com-pared with control shRNAs (Fig. 4D). To confirm isoform specificityof PI3K’s role in OS cell growth, three distinct mouse OS cell lines(mOS202, mOS482, and mOS493) were infected with shRNAs tar-geting Pik3ca or Pik3cb (Fig. S2B). Compared with both controland Pik3cb knockdown, Pik3ca knockdown caused growth arrestin mOS cells (Fig. 4E). Taken together, the in vitro and in vivoshRNA screen data indicate that OS cell line proliferation andtumor formation are dependent on the Pik3ca and Mtor genes.
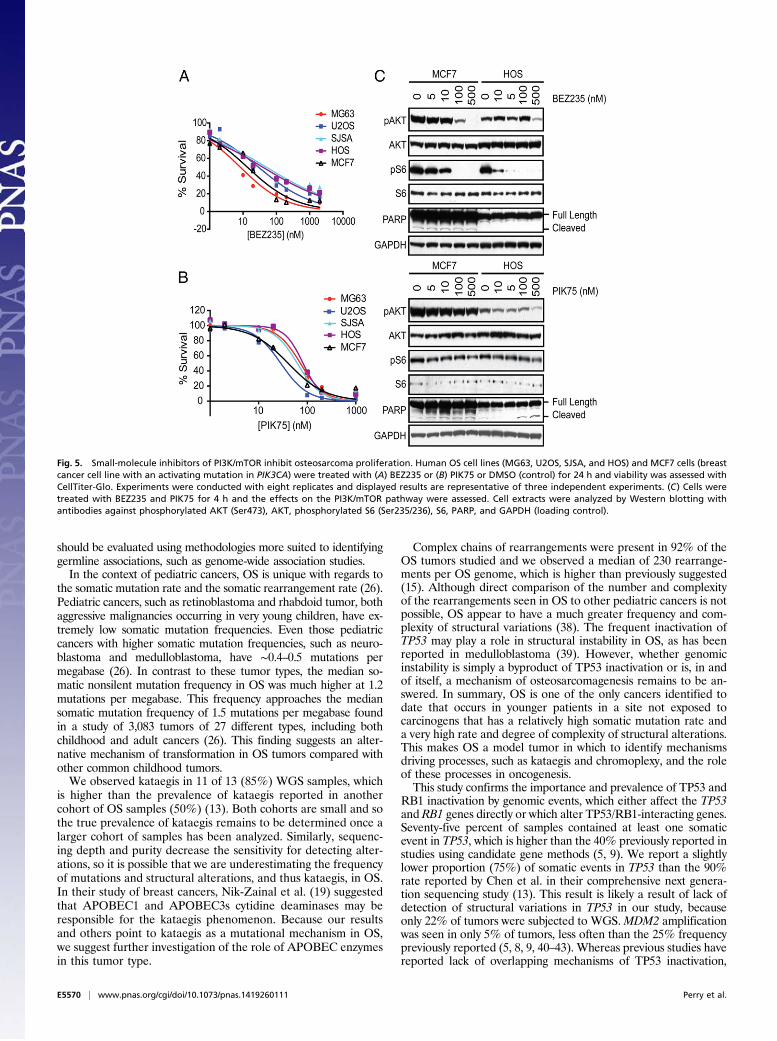
PI3K/mTOR Inhibitors Suppress Osteosarcoma Proliferation. The oc-currence of alterations in the PI3K/mTOR pathway in 24% ofhuman OS samples and the identification of Pik3ca and Mtor inthe murine OS genomic shRNA screen suggest that the PI3K/mTOR pathway is a potential unifying vulnerability to be exploitedfor targeted therapy in OS. Consequently, the PI3K/mTOR dualinhibitors GSK2126458 and BEZ235 and the PIK3CA-selectiveinhibitor PIK75 were tested against four human and three murineOS cell lines and MCF7 cells, a breast cancer cell line witha PIK3CA p.E545K mutation previously demonstrated to undergo
Table 2. PI3K/mTOR pathway alterations and other potentially actionable alterations identified in 20 osteosarcomasamples using the PHIAL algorithm
Gene Alterations n Sample ID Molecularly targeted agent
PI3K/mTOR pathway alterationsTSC2 p.R611W, p.H593R 2 BZ04, BZ18 PI3K/mTOR inhibitorPTEN p.E288*, p.P244fs 2 BZ04, BZ09 PI3K/mTOR inhibitorPTEN Deleted 5 DF01, BZ03, SJD12, BZ06, SJD03 PI3K/mTOR inhibitorPIK3CA p.E545D 1 DF01 PI3K/mTOR inhibitorAKT1 p.T443M 1 BZ29 AKT inhibitorPIK3R1 p.P84L 1 SJD13 PI3K/mTOR inhibitorPDPK1 p.G530E 1 BZ21 AKT inhibitorEIF4B p.R304K, p.R331K 1 SJD02 NoneNF1 p.S2309fs 1 BZ14 PI3K/mTOR inhibitorNF1 Deleted 2 BZ08, BZ21 PI3K/mTOR inhibitorNF2 p.P170fs 1 BZ04 PI3K/mTOR inhibitor
Growth factor receptor tyrosine kinasesPDGFRA Amplified 1 DF01 ImatinibPDGFRB p.L803F 1 BZ19 ImatinibJAK1 p.K245R, p.P548S 2 MX02, BZ11 Jak inhibitorALK p.K911T, p.A585T 2 BZ33, BZ03 CrizotinibKDR p.S965R 1 BZ04 Pan-tyrosine kinase inhibitorFGFR4 p.R171H 1 BZ30 FGFR inhibitor
OtherCDKN2A/B Deleted 2* SJD12, BZ38 CDK4/6 inhibitorGSK3B p.S9F 1 BZ11 Wnt pathway inhibitorATM Deleted 1 DF01 PARP inhibitorMYC Amplified 1 DF01 BET-bromodomain inhibitor
*Only samples with preserved RB1 counted, because CDK inhibitors do not function in the absence of RB1 protein.
Fig. 3. TP53 and PI3K/mTOR pathways are significantly mutated in osteo-sarcoma. GSEA combined with mutational analysis (MutSig2.0) identified 32significantly mutated pathways (MSigDB Canonical Pathway gene sets) across59 human osteosarcoma WES samples (q < 0.1). (A) Twenty-two pathwaysincluded the TP53 gene and (B) eight pathways implicated the PI3K/mTORpathway by inclusion of PIK3CA and/or MTOR, while excluding TP53.
E5568 | www.pnas.org/cgi/doi/10.1073/pnas.1419260111 Perry et al.
apoptosis in response to treatment with the dual inhibitors (35).All three inhibitors inhibited cell proliferation in all cell linestested (Figs. 5A and 5B and Fig. S2C), but a PIK3CB-selectivecompound, TGX-221, had little effect on cell proliferation atconcentrations up to 10 μM (Fig. S2D). In the murine and humanOS cell lines, the IC50s of GSK2126458 and PIK75 ranged from 7to 169 nM, similar to the IC50 observed in the MCF7 cells,demonstrating the sensitivity of OS cell lines to inhibition ofPIK3CA or PI3K/mTOR. PIK75 and GSK2126458 readily in-duced apoptosis with treatment as shown by caspase 3/7 activation(Fig. S2E) and poly(ADP-ribose) polymerase (PARP) cleavage(Fig. 5C, assessed only for PIK75). Growth inhibition and apo-ptosis were seen at drug levels at which phosphorylated AKT(Ser473) and, in the case of GSK2126458, phosphorylated S6(Ser235/236) levels were reduced (Fig. 5C and Fig. S2F). The IC50of BEZ235 was 8–51 nM in human cell lines and 178 nM to 1.2μM in murine cell lines. BEZ235 appeared to cause cytostatic cellgrowth and did not induce caspase 3/7 activation or PARPcleavage in OS cell lines (Fig. 5C and Fig. S2E). These data areconsistent with a recent study that reports the anti-proliferativeand antitumor effects of BEZ235 on OS cell lines (36).
DiscussionAlthough none of the patients included in this study had docu-mented Li Fraumeni syndrome, rare nonsilent mutations were
present in TP53 in 12% cases. In previous studies, germlinemutations in TP53 were present in fewer than 3% of patientswith OS without a history suggestive of Li Fraumeni syndrome(4). The higher rate of germline mutations detected in this studymay be due to or attributable to the nature of the patient pop-ulation, with a large number of patients from Brazil, where thereis a 0.3% population incidence of the p.R337H mutation (37). Inour study, 39 of 59 patients were from Brazil and 6 patients hadgermline TP53 mutations (15% of Brazilian patients), and 3 ofthese patients harbored the p.R337H mutation (8% of Brazilianpatients). Another possible explanation is the improved ability todetect TP53 mutations using modern techniques compared withpreviously used techniques. If these results are confirmed inother study populations, patients with sporadic OS should bereferred to a genetic counselor for discussion of testing for LiFraumeni syndrome, which would constitute a change in clinicalpractice.We found four rare nonsilent nucleotide variants in SQSTM1,
three of which were identical: p.K238E is a SNP (rs11548633) in theTRAF6 binding domain with a minor allele frequency of 0.003(National Heart, Lung, and Blood Institute Exome Variant Server).Because of the small study size, strong statistical conclusions re-garding the association between the SQSTM1 p.K238E SNP and OSare not possible. The relationship between SQSTM1 SNPs and OS
Fig. 4. PI3K/mTOR identified as essential by in vitro and in vivo functional genomics screening. (A) Schematic of experimental design of genome-wide shRNAscreen in mouse osteosarcoma (mOS) cell line. (B) Venn diagram outlining the overlap of genes identified by two methods of analysis: weighted second bestand Kolmogorov–Smirnov statistic in GENE-E/RIGER. (C) The relative viability of mOS cell lines, determined by Alamar Blue assay, expressing four individualshRNAs each targeting Mtor, Pik3ca, or control shRNAs (GFP, LacZ, Luciferase, and RFP) compared with uninfected cells that were puromycin selected for 8 d(empty). Horizontal bars represent mean and SEM, n = 3. (D) Mean log-twofold change in shRNA abundance of control (GFP, LacZ, Luciferase, and RFP) orexperimental shRNAs from five tumor samples compared with preinjection samples. *P < 0.01. (E) The relative viability of mOS cell lines expressing shRNAstargeting either Pik3ca, Pik3cb, or control (luciferase) at 9 d postinfection and puromycin selection determined by WST-1assay. Error bars are SEM, n = 3.
Perry et al. PNAS | Published online December 15, 2014 | E5569
MED
ICALSC
IENCE
SPN
ASPL
US
SEECO
MMEN
TARY
should be evaluated using methodologies more suited to identifyinggermline associations, such as genome-wide association studies.In the context of pediatric cancers, OS is unique with regards to
the somatic mutation rate and the somatic rearrangement rate (26).Pediatric cancers, such as retinoblastoma and rhabdoid tumor, bothaggressive malignancies occurring in very young children, have ex-tremely low somatic mutation frequencies. Even those pediatriccancers with higher somatic mutation frequencies, such as neuro-blastoma and medulloblastoma, have ∼0.4–0.5 mutations permegabase (26). In contrast to these tumor types, the median so-matic nonsilent mutation frequency in OS was much higher at 1.2mutations per megabase. This frequency approaches the mediansomatic mutation frequency of 1.5 mutations per megabase foundin a study of 3,083 tumors of 27 different types, including bothchildhood and adult cancers (26). This finding suggests an alter-native mechanism of transformation in OS tumors compared withother common childhood tumors.We observed kataegis in 11 of 13 (85%) WGS samples, which
is higher than the prevalence of kataegis reported in anothercohort of OS samples (50%) (13). Both cohorts are small and sothe true prevalence of kataegis remains to be determined once alarger cohort of samples has been analyzed. Similarly, sequenc-ing depth and purity decrease the sensitivity for detecting alter-ations, so it is possible that we are underestimating the frequencyof mutations and structural alterations, and thus kataegis, in OS.In their study of breast cancers, Nik-Zainal et al. (19) suggestedthat APOBEC1 and APOBEC3s cytidine deaminases may beresponsible for the kataegis phenomenon. Because our resultsand others point to kataegis as a mutational mechanism in OS,we suggest further investigation of the role of APOBEC enzymesin this tumor type.
Complex chains of rearrangements were present in 92% of theOS tumors studied and we observed a median of 230 rearrange-ments per OS genome, which is higher than previously suggested(15). Although direct comparison of the number and complexityof the rearrangements seen in OS to other pediatric cancers is notpossible, OS appear to have a much greater frequency and com-plexity of structural variations (38). The frequent inactivation ofTP53 may play a role in structural instability in OS, as has beenreported in medulloblastoma (39). However, whether genomicinstability is simply a byproduct of TP53 inactivation or is, in andof itself, a mechanism of osteosarcomagenesis remains to be an-swered. In summary, OS is one of the only cancers identified todate that occurs in younger patients in a site not exposed tocarcinogens that has a relatively high somatic mutation rate anda very high rate and degree of complexity of structural alterations.This makes OS a model tumor in which to identify mechanismsdriving processes, such as kataegis and chromoplexy, and the roleof these processes in oncogenesis.This study confirms the importance and prevalence of TP53 and
RB1 inactivation by genomic events, which either affect the TP53and RB1 genes directly or which alter TP53/RB1-interacting genes.Seventy-five percent of samples contained at least one somaticevent in TP53, which is higher than the 40% previously reported instudies using candidate gene methods (5, 9). We report a slightlylower proportion (75%) of somatic events in TP53 than the 90%rate reported by Chen et al. in their comprehensive next genera-tion sequencing study (13). This result is likely a result of lack ofdetection of structural variations in TP53 in our study, becauseonly 22% of tumors were subjected to WGS.MDM2 amplificationwas seen in only 5% of tumors, less often than the 25% frequencypreviously reported (5, 8, 9, 40–43). Whereas previous studies havereported lack of overlapping mechanisms of TP53 inactivation,
Fig. 5. Small-molecule inhibitors of PI3K/mTOR inhibit osteosarcoma proliferation. Human OS cell lines (MG63, U2OS, SJSA, and HOS) and MCF7 cells (breastcancer cell line with an activating mutation in PIK3CA) were treated with (A) BEZ235 or (B) PIK75 or DMSO (control) for 24 h and viability was assessed withCellTiter-Glo. Experiments were conducted with eight replicates and displayed results are representative of three independent experiments. (C) Cells weretreated with BEZ235 and PIK75 for 4 h and the effects on the PI3K/mTOR pathway were assessed. Cell extracts were analyzed by Western blotting withantibodies against phosphorylated AKT (Ser473), AKT, phosphorylated S6 (Ser235/236), S6, PARP, and GAPDH (loading control).
E5570 | www.pnas.org/cgi/doi/10.1073/pnas.1419260111 Perry et al.
specifically lack of MDM2 or COPS3 amplification in osteosarco-mas with TP53 mutations, 34% of our cases have multiple mech-anisms of TP53 inactivation. The analysis of mutations (germlineand somatic), copy number changes, and rearrangements of mul-tiple genes in one study also allowed us to determine that 56% ofthe tumors have both TP53 and RB1 inactivated.Pathway analysis of mutated genes, clinical interpretation of
individual genomes (PHIAL), a comparative oncology approach,and a genomic screen all point to a dependence on PI3K/mTORpathway activation in OS. To our knowledge, this is the first studyto report genomic alterations in PI3K/mTOR pathway members ina significant proportion of OS tumors (24%). PTEN deletion hasbeen evaluated in a single study in which 4 of 27 osteosarcomashad biallelic deletion of PTEN, a similar rate of occurrence as seenin this study (44). A PTEN mutation has been detected in a singlecanine OS cell line but mutations in PTEN have not been pre-viously described in human OS samples (45). One recent studyusing a sequenom assay identified mutations in PIK3CA in 3 of 89tumors (46). However, the other PI3K/mTOR pathway members(PDPK1, AKT1, and EIF4B) containing somatic mutations in thisstudy have not previously been recognized to harbor alterations inOS. Additionally, the PI3K/mTOR pathway is activated by manyreceptor tyrosine kinases (RTKs), and the pathway has beenrecognized as a critical effector of alterations that activate RTKsin cancer (47). PHIAL analysis implicated six alterations in RTKsin eight patients (PDGFRA, PDGRFB, JAK1, ALK, KDR, andFGFR4). These patients may benefit from selective RTK inhib-itors, but it also reasons that these tumors may be sensitive toinhibition with PI3K/mTOR inhibitors.In addition, our in vitro and in vivo shRNA screen data
strongly suggest that OS cell line proliferation and tumor for-mation are dependent on the Pik3ca and Mtor genes signifyingthat kinase activity of the PI3K/mTOR pathway is required forOS survival. These data are consistent with an earlier report thatused kinome profiling to show that AKT (an intermediary kinasein the PI3K/mTOR pathway) is active in OS and its inhibitionblocks cell proliferation (48). Interestingly, genetic ablation ofeither Pik3ca or Mtor is sufficient to halt cell proliferation andslow tumor formation. This finding suggests that agents that caninhibit either Pik3ca or Mtor individually should have a similareffect, but experimental evidence from other tumor types dem-onstrates that many tumors can acquire resistance to single-targetinhibitors (49). Thus, a combination of PI3K and mTOR in-hibitors or a dual inhibitor may help overcome feedback loopsand pathway cross-talk that can mediate resistance.The universal sensitivity of both human and murine OS cells
demonstrates that mutation of PI3K/mTOR is not necessary toconfer sensitivity to PI3K/mTOR inhibitors in OS. Using datafrom the Cancer Cell Line Encyclopedia, we determined thatHOS cells, which harbor an NF1 deletion, are the only humanOS cell line used in these studies with an alteration in a PI3K/mTOR pathway member (50). In the HOS cell line the IC50 ofBEZ235 was 40 nM, the second highest IC50 of the cell linesstudied, and the IC50 of PIK75 was 82 nM, the highest IC50 of thecell lines studied. The presence of an NF1 deletion does notseem to confer increased sensitivity to PI3K/mTOR inhibitors inthis panel of human OS cell lines. However, because all of thehuman OS cell lines display a high degree of sensitivity to PI3K/mTOR pathway inhibitors, it would be difficult to detectincreased sensitivity.Genomic alterations in PI3K/mTOR pathway members is
likely only one way in which the PI3K/mTOR pathway becomesactive in OS. p70S6K expression, a measure of pathway activity,is present in 70–80% of OS and the level of expression has beencorrelated with overall and disease-free survival (51). Activationof PI3K-AKT signaling is downstream of several biologicalprocesses involved in OS metastasis, such as c-Met and Ezrinexpression (52, 53). Micro-RNA-221, expressed at high levels in
OS targets PTEN, increases cell survival, decreases apoptosis,and induces cisplatin resistance (54). These alternative mecha-nisms of PI3K/mTOR pathway activation in OS may explain theuniversal sensitivity to PI3K/mTOR inhibitors observed in hu-man osteosarcoma cell lines. In agreement with our data, thedual PI3K/mTOR inhibitor BEZ235 and the α-selective PI3Kinhibitor BYL719 have been shown to induce cell cycle arrestand decrease tumor formation in vivo (36, 55). In addition, inpreclinical models, mTOR inhibition potentiates the effect ofbisphosphonates and sorafenib, drugs being studied in clinicaltrials in OS (56–58). Other studies have focused on one gene orsmall molecule but this work demonstrates the convergence ofmultiple different approaches in human and mouse on the PI3K/mTOR pathway as a whole. In using an unbiased screen andcomprehensive genomic assessment, we strengthen the existingevidence regarding a role for the PI3K/mTOR pathway in OS.Prior clinical studies of mTOR inhibition in sarcomas and our
identification of a range of alterations in the PI3K/mTOR path-way serves as a basis for rational clinical trial design. In a phase IItrial of ridaforolimus, a second-generation mTOR inhibitor, twopatients with OS had confirmed partial responses and one patientwith OS had an unconfirmed partial response. The number of OSpatients enrolled in this phase II trial is not reported (54 bonetumor patients were enrolled) and so a response rate cannot bedetermined (59). Given the promising results seen with mTORinhibition in tuberous sclerosis-associated subependymal giant-cell astrocytomas and renal angiomyolipoma, one could hypoth-esize that the two patients with partial responses had tumorsharboring TSC2 mutations (60, 61). In a follow-up phase IIIstudy, ridaforolimus was administered as maintenance therapyto patients with advanced sarcomas. Only 69 of the 711 patientsenrolled in this phase III trial had bone tumors and conse-quently, the subgroup analysis of bone tumors does not achievestatistical significance (62). To ensure adequate enrollment ofOS patients, future clinical trials of PI3K/mTOR inhibitionshould be limited to OS patients. Given the frequency and rangeof PI3K/mTOR pathway alterations identified in this study,patient’s tumors should be genotyped and activity of the PI3K/mTOR pathway assessed by additional methods so that clinicalresponses can be correlated with genotype and pathway activity.
Materials and MethodsSample Selection and Clinical Data. Samples were contributed by hospitals inBrazil, Spain, Mexico, and the United States. All patients had histopa-thology confirmed to be OS by a pathologist at the local institution. Allpatients had consented to protocols approved by the Institutional ReviewBoard at the appropriate institution. All but five tumor specimens se-quenced were obtained prechemotherapy from the primary tumor at thetime of diagnosis. Two tumor specimens were obtained prechemotherapyfrom a metastatic tumor at the time of diagnosis. Three tumor specimenswere obtained postchemotherapy from a metastatic tumor (SJ02, SJ13,DF01). Survival curves were compared using a log-rank (Mantel-Cox) test.Patients who died from treatment toxicity were censored at the timeof death.
WGS, WES, RNA Sequencing, and Analysis. Sequencing data reported in thispaper is available via National Center for Biotechnology Information dbGap:phs000699.v1.p1 Osteosarcoma Genomics.
Detailed methods for WGS, WES, and RNAseq and analysis are provided inSI Materials and Methods. Human genomics data were used as follows: WESdata were used for the detection of variants (germline SNP/Indel, somaticSNV/Indel), copy number changes, purity/ploidy, and clonality analysis. WGSdata were used for the validation of somatic variants and copy numbervariation detected in WES and detection of structural variants. RNAseq datawere used for the validation of somatic variants detected in WES, analysis ofgene expression levels, and detection of gene fusions.
Evaluation for Known Mechanisms of TP53 and RB1 Inactivation and forAlterations in Known TP53 and RB1 Interacting Genes. A sample was clas-sified as having TP53, RB1, or CDKN2A/B, deletion if GISTIC2 score for
Perry et al. PNAS | Published online December 15, 2014 | E5571
MED
ICALSC
IENCE
SPN
ASPL
US
SEECO
MMEN
TARY
the gene was −1 or −2 (focal) and COPS3 or MDM2 amplification ifGISTIC2 score for the gene was positive, 2 or 1 (Dataset S14). Both WGS andRNASeq data were examined for evidence of TP53 or RB1 rearrangements.
Murine Osteosarcoma. Murine OS spontaneously arising in a mouse modelbased on conditional deletion of Tp53 and Rb1 restricted to the preosteo-blast were obtained by killing the animal once a visible tumor causingsymptoms was present (32). Tumors were dissected free of normal tissue andfrozen at −80 °C. Murine OS cell lines were derived by mincing fresh tumorsand culturing in αMEM.
shRNA Constructs and Lentivirus. Lentiviral shRNAs were obtained from TheRNAi Consortium (TRC) collection of the Broad Institute (www.broad-institute.org/rnai/public). shRNAs were expressed from the lentiviral ex-pression plasmid pLKO.1. Virus was produced as previously described (63,64). The TRC numbers for the shRNAs used in the in vitro and in vivo pooledshRNA screens are listed in Datasets S10 and S15, respectively. For individualtesting of shRNAs, the TRC numbers are: Luciferase, TRCN0000072261;Pik3ca, TRCN0000025615; Pik3cb, TRCN0000024792. Detailed methodsfor in vitro and in vivo screening and analysis are provided in SI Materialsand Methods.
PI3K/mTOR Inhibitor Studies. All inhibitors used in this study were purchasedfrom Selleck Chemicals. Human OS cell lines were obtained from ATCC.Human OS cell lines were cultured with drug or DMSO control for 24 h andviability was assessed with the CellTiter-Glo luminescent cell viability assay(Promega). Murine OS cell lines were cultured with drug or control for 72 hand viability was assessed with the cell proliferation reagent WST-1 (Roche).Caspase 3/7 activation after 16 h of treatment with inhibitors was determinedwith the Caspase-Glo 3/7 luminescence assay (Promega). For Western blotanalysis, human OS cell lines were treated with inhibitors for 4 h; murine OScell lines were treated for 24 h.Western blotting was performed as previouslydescribed (65). All primary antibodies were purchased from Cell Signaling.HRP-conjugated secondary antibodies were from Jackson Laboratories.
ACKNOWLEDGMENTS. We thank Ben Hubbell-Engler for technical support.This work was conducted as part of the Slim Initiative for Genomic Medicinein the Americas, a project funded by the Carlos Slim Health Institute. Thiswork was supported in part by the Foster Foundation (J.A.P.), Pedals forPediatrics (J.A.P.), a Productivity Fellowship from the Brazilian NationalCounsel of Technological and Scientific Development (CNPq, J.A.Y.), CNPqGrant 401991/2010-5 (to J.A.Y.), an Alex Lemonade Stand Innovation Award(to S.H.O.), National Cancer Institute Grant U01CA105423 (to S.H.O.), a St.Baldrick’s Foundation Career Development Award (to K.A.J.), and the TimothyO’Brien Osteosarcoma Research Fund (K.A.J.).
1. Siegel R, Naishadham D, Jemal A (2013) Cancer statistics, 2013. CA Cancer J Clin 63(1):11–30.
2. Mirabello L, Troisi RJ, Savage SA (2009) Osteosarcoma incidence and survival ratesfrom 1973 to 2004: Data from the Surveillance, Epidemiology, and End Results Pro-gram. Cancer 115(7):1531–1543.
3. Hansen MF, et al. (1985) Osteosarcoma and retinoblastoma: A shared chromosomalmechanism revealing recessive predisposition. Proc Natl Acad Sci USA 82(18):6216–6220.
4. McIntyre JF, et al. (1994) Germline mutations of the p53 tumor suppressor gene inchildren with osteosarcoma. J Clin Oncol 12(5):925–930.
5. Kansara M, Thomas DM (2007) Molecular pathogenesis of osteosarcoma. DNA CellBiol 26(1):1–18.
6. Ralston SH, Albagha OM (2011) Genetic determinants of Paget’s disease of bone. AnnN Y Acad Sci 1240:53–60.
7. Savage SA, et al. (2013) Genome-wide association study identifies two susceptibilityloci for osteosarcoma. Nat Genet 45(7):799–803.
8. Henriksen J, et al. (2003) Amplification and overexpression of COPS3 in osteosarcomaspotentially target TP53 for proteasome-mediated degradation. Oncogene 22(34):5358–5361.
9. Miller CW, et al. (1996) Alterations of the p53, Rb and MDM2 genes in osteosarcoma.J Cancer Res Clin Oncol 122(9):559–565.
10. Wadayama B, et al. (1994) Mutation spectrum of the retinoblastoma gene in osteo-sarcomas. Cancer Res 54(11):3042–3048.
11. Toguchida J, et al. (1988) Chromosomal reorganization for the expression of recessivemutation of retinoblastoma susceptibility gene in the development of osteosarcoma.Cancer Res 48(14):3939–3943.
12. Tsuchiya T, et al. (2000) Analysis of the p16INK4, p14ARF, p15, TP53, and MDM2 genesand their prognostic implications in osteosarcoma and Ewing sarcoma. Cancer GenetCytogenet 120(2):91–98.
13. Chen X, et al.; St. Jude Children’s Research Hospital–Washington University PediatricCancer Genome Project (2014) Recurrent somatic structural variations contribute totumorigenesis in pediatric osteosarcoma. Cell Reports 7(1):104–112.
14. Helman LJ, Meltzer P (2003) Mechanisms of sarcoma development. Nat Rev Cancer3(9):685–694.
15. Stephens PJ, et al. (2011) Massive genomic rearrangement acquired in a single cata-strophic event during cancer development. Cell 144(1):27–40.
16. Cibulskis K, et al. (2013) Sensitive detection of somatic point mutations in impure andheterogeneous cancer samples. Nat Biotechnol 31(3):213–219.
17. Adzhubei IA, et al. (2010) A method and server for predicting damaging missensemutations. Nat Methods 7(4):248–249.
18. Rea SL, Walsh JP, Layfield R, Ratajczak T, Xu J (2013) New insights into the role ofsequestosome 1/p62 mutant proteins in the pathogenesis of Paget’s disease of bone.Endocr Rev 34(4):501–524.
19. Nik-Zainal S, et al.; Breast Cancer Working Group of the International Cancer GenomeConsortium (2012) Mutational processes molding the genomes of 21 breast cancers.Cell 149(5):979–993.
20. Kostic AD, et al. (2011) PathSeq: Software to identify or discover microbes by deepsequencing of human tissue. Nat Biotechnol 29(5):393–396.
21. Mermel CH, et al. (2011) GISTIC2.0 facilitates sensitive and confident localization of thetargets of focal somatic copy-number alteration in human cancers. Genome Biol 12(4):R41.
22. Mejia-Guerrero S, et al. (2010) Characterization of the 12q15 MDM2 and 12q13-14CDK4 amplicons and clinical correlations in osteosarcoma. Genes ChromosomesCancer 49(6):518–525.
23. Drier Y, et al. (2013) Somatic rearrangements across cancer reveal classes of sampleswith distinct patterns of DNA breakage and rearrangement-induced hypermutability.Genome Res 23(2):228–235.
24. Baca SC, et al. (2013) Punctuated evolution of prostate cancer genomes. Cell 153(3):666–677.
25. Shen MM (2013) Chromoplexy: A new category of complex rearrangements in thecancer genome. Cancer Cell 23(5):567–569.
26. Lawrence MS, et al. (2013) Mutational heterogeneity in cancer and the search for newcancer-associated genes. Nature 499(7457):214–218.
27. Forbes SA, et al. (2014) COSMIC: exploring the world’s knowledge of somatic muta-tions in human cancer. Nucleic Acids Res, 10.1093/nar/gku1075. Available at cancer.sanger.ac.uk.
28. Lohr JG, et al. (2012) Discovery and prioritization of somatic mutations in diffuse largeB-cell lymphoma (DLBCL) by whole-exome sequencing. Proc Natl Acad Sci USA109(10):3879–3884.
29. Subramanian A, et al. (2005) Gene set enrichment analysis: A knowledge-based ap-proach for interpreting genome-wide expression profiles. Proc Natl Acad Sci USA102(43):15545–15550.
30. Van Allen EM, et al. (2014) Whole-exome sequencing and clinical interpretation offormalin-fixed, paraffin-embedded tumor samples to guide precision cancer medi-cine. Nat Med 20(6):682–688.
31. Adzhubei I, Jordan DM, Sunyaev SR (2013) Predicting functional effect of humanmissense mutations using PolyPhen-2. Curr Protoc Hum Genet, Chapter 7:Unit 7.20.
32. Walkley CR, et al. (2008) Conditional mouse osteosarcoma, dependent on p53 lossand potentiated by loss of Rb, mimics the human disease. Genes Dev 22(12):1662–1676.
33. Cheung LW, et al. (2011) High frequency of PIK3R1 and PIK3R2 mutations in endo-metrial cancer elucidates a novel mechanism for regulation of PTEN protein stability.Cancer Discov 1(2):170–185.
34. Allan EH, et al. (2003) Differentiation potential of a mouse bone marrow stromal cellline. J Cell Biochem 90(1):158–169.
35. Leung E, Kim JE, Rewcastle GW, Finlay GJ, Baguley BC (2011) Comparison of the ef-fects of the PI3K/mTOR inhibitors NVP-BEZ235 and GSK2126458 on tamoxifen-resistant breast cancer cells. Cancer Biol Ther 11(11):938–946.
36. Gobin B, et al. (2014) NVP-BEZ235, a dual PI3K/mTOR inhibitor, inhibits osteosarcomacell proliferation and tumor development in vivo with an improved survival rate.Cancer Lett 344(2):291–298.
37. Seidinger AL, et al. (2011) Association of the highly prevalent TP53 R337H mutationwith pediatric choroid plexus carcinoma and osteosarcoma in southeast Brazil. Cancer117(10):2228–2235.
38. Zhang J, et al. (2012) The genetic basis of early T-cell precursor acute lymphoblasticleukaemia. Nature 481(7380):157–163.
39. Rausch T, et al. (2012) Genome sequencing of pediatric medulloblastoma links cata-strophic DNA rearrangements with TP53 mutations. Cell 148(1-2):59–71.
40. Oliner JD, Kinzler KW, Meltzer PS, George DL, Vogelstein B (1992) Amplification ofa gene encoding a p53-associated protein in human sarcomas. Nature 358(6381):80–83.
41. Lonardo F, Ueda T, Huvos AG, Healey J, Ladanyi M (1997) p53 and MDM2 alterationsin osteosarcomas: Correlation with clinicopathologic features and proliferative rate.Cancer 79(8):1541–1547.
42. Ladanyi M, et al. (1993) MDM2 gene amplification in metastatic osteosarcoma. CancerRes 53(1):16–18.
43. Yan T, et al. (2007) COPS3 amplification and clinical outcome in osteosarcoma. Cancer109(9):1870–1876.
44. Freeman SS, et al. (2008) Copy number gains in EGFR and copy number losses in PTENare common events in osteosarcoma tumors. Cancer 113(6):1453–1461.
45. Levine RA, Forest T, Smith C (2002) Tumor suppressor PTEN is mutated in canine os-teosarcoma cell lines and tumors. Vet Pathol 39(3):372–378.
46. Choy E, et al. (2012) High-throughput genotyping in osteosarcoma identifies multiplemutations in phosphoinositide-3-kinase and other oncogenes. Cancer 118(11):2905–2914.
47. Engelman JA (2009) Targeting PI3K signalling in cancer: Opportunities, challengesand limitations. Nat Rev Cancer 9(8):550–562.
E5572 | www.pnas.org/cgi/doi/10.1073/pnas.1419260111 Perry et al.

48. Kuijjer ML, et al. (2014) Kinome and mRNA expression profiling of high-grade oste-osarcoma cell lines implies Akt signaling as possible target for therapy. BMC MedGenomics 7:4.
49. Kwong LN, Davies MA (2013) Navigating the therapeutic complexity of PI3K pathwayinhibition in melanoma. Clin Cancer Res 19(19):5310–5319.
50. Barretina J, et al. (2012) The Cancer Cell Line Encyclopedia enables predictive mod-elling of anticancer drug sensitivity. Nature 483(7391):603–607.
51. Zhou Q, et al. (2010) mTOR/p70S6K signal transduction pathway contributes to os-teosarcoma progression and patients’ prognosis. Med Oncol 27(4):1239–1245.
52. Wan X, Mendoza A, Khanna C, Helman LJ (2005) Rapamycin inhibits ezrin-mediatedmetastatic behavior in a murine model of osteosarcoma. Cancer Res 65(6):2406–2411.
53. Wang K, Zhuang Y, Liu C, Li Y (2012) Inhibition of c-Met activation sensitizes osteo-sarcoma cells to cisplatin via suppression of the PI3K-Akt signaling. Arch BiochemBiophys 526(1):38–43.
54. Zhao G, et al. (2013) MicroRNA-221 induces cell survival and cisplatin resistancethrough PI3K/Akt pathway in human osteosarcoma. PLoS ONE 8(1):e53906.
55. Gobin B, et al. (2014) BYL719, a new α-specific PI3K inhibitor: Single administrationand in combination with conventional chemotherapy for the treatment of osteo-sarcoma. Int J Cancer, 10.1002/ijc.29040.
56. Pignochino Y, et al. (2013) The combination of sorafenib and everolimus abrogatesmTORC1 and mTORC2 upregulation in osteosarcoma preclinical models. Clin CancerRes 19(8):2117–2131.
57. Moriceau G, et al. (2010) Zoledronic acid potentiates mTOR inhibition and abolishesthe resistance of osteosarcoma cells to RAD001 (everolimus): Pivotal role of theprenylation process. Cancer Res 70(24):10329–10339.
58. Tsubaki M, et al. (2012) Reduction of metastasis, cell invasion, and adhesion in mouseosteosarcoma by YM529/ONO-5920-induced blockade of the Ras/MEK/ERK and Ras/PI3K/Akt pathway. Toxicol Appl Pharmacol 259(3):402–410.
59. Chawla SP, et al. (2012) Phase II study of the mammalian target of rapamycin inhibitorridaforolimus in patients with advanced bone and soft tissue sarcomas. J Clin Oncol30(1):78–84.
60. Bissler JJ, et al. (2013) Everolimus for angiomyolipoma associated with tuberoussclerosis complex or sporadic lymphangioleiomyomatosis (EXIST-2): A multicentre,randomised, double-blind, placebo-controlled trial. Lancet 381(9869):817–824.
61. Franz DN, et al. (2013) Efficacy and safety of everolimus for subependymal giant cellastrocytomas associated with tuberous sclerosis complex (EXIST-1): A multicentre,randomised, placebo-controlled phase 3 trial. Lancet 381(9861):125–132.
62. Demetri GD, et al. (2013) Results of an international randomized phase III trial of themammalian target of rapamycin inhibitor ridaforolimus versus placebo to controlmetastatic sarcomas in patients after benefit from prior chemotherapy. J Clin Oncol31(19):2485–2492.
63. Luo B, et al. (2008) Highly parallel identification of essential genes in cancer cells. ProcNatl Acad Sci USA 105(51):20380–20385.
64. Whittaker SR, et al. (2013) A genome-scale RNA interference screen implicates NF1loss in resistance to RAF inhibition. Cancer Discov 3(3):350–362.
65. Janeway KA, et al. (2007) Pediatric KIT wild-type and platelet-derived growth factorreceptor alpha-wild-type gastrointestinal stromal tumors share KIT activation but notmechanisms of genetic progression with adult gastrointestinal stromal tumors.Cancer Res 67(19):9084–9088.
Perry et al. PNAS | Published online December 15, 2014 | E5573
MED
ICALSC
IENCE
SPN
ASPL
US
SEECO
MMEN
TARY