Embed Size (px)
Citation preview

Compiled by Directorate: Agro-Processing Support
May 2018

All correspondence can be addressed to:
Director: Agro-processing Support
Private Bag X4116, Pretoria, 0001, South Africa
Tel: +27 12319 8457/8311. Fax: +27 123198093.
Email: [email protected]
Disclaimer
This document has been compiled by the Department of Agriculture, Forestry and
Fisheries. Every effort has been made to ensure the accuracy and thoroughness of
the information contained herein and the department cannot be held responsible for
any errors, omissions or inaccuracies in such information and data, whether
inadvertent or otherwise. The department of Agriculture, Forestry and Fisheries
therefore accepts no liability that can be incurred resulting from the use of this
information.

i
Table of Contents
1. Introduction ..................................................................................................................................... 1
2. World production of rapeseed oil ............................................................................................ 1
3. South African production of rapeseed oil .............................................................................. 3
4. Rapeseed processing .................................................................................................................. 3
5. Trade patterns ................................................................................................................................ 5
5.1 Global trade of rapeseed oil ............................................................................................... 5
5.2 South Africa’s trade of rapeseed oil .................................................................................. 7
6. Summary ........................................................................................................................................ 10
Reference .......................................................................................................................................... 12

1
1. Introduction
Rapeseed oil, derived from rapeseed (canola), is mainly used in forage. In South
Africa, the major production area of canola is in the Western Cape. However,
canola, albeit in small quantity, is also produced in the Northern Cape, Free State,
Eastern Cape, Kwa-Zulu Natal, Limpopo, and North West province (Department of
Agriculture, 2016) . The purpose of this profile is to present a production and trade
analysis of rapeseed oil commonly known as Canola.
2. World production of rapeseed oil
Figure 1: World production and percentage change of rapeseed oil from 2000 to
2014
Source: FAO, 2018
Figure 1 illustrates the world production trends and the percentage changes of
rapeseed oil over the period of 15 years, from 2000 to 2014. Over the period, the
world production of rapeseed oil exhibits an increasing trend. However, a significant
reduction of about 7% year-on-year production of rapeseed oil was in 2001, though
there was a slight decline in tonnage of roughly about 5% in 2003 and 1% in 2007.
During the period 2008 to 2014, there was a significant increase in the production
of rapeseed oil ranging from 19 million to 26 million tonnes.
-10
-5
-
5
10
15
20
25
-
5
10
15
20
25
30
% c
han
ge
Ton
ne
s(m
illio
n)
Production % change

2
Figure 2: Top ten producers of rapeseed oil in the world, 2004 to 2014
Source: FAO, 2018
Figure 2 above presents top ten producers of rapeseed oil in the world over the
period 2004 to 2014. In 2004, a slightly above 10 million tonnes of rapeseed oil
production was accounted for by the leading top ten producers. China was the
main producer of rapeseed oil, with production ranging from value of 3,54 to 4,25
million tonnes, followed by Germany ranging from 2,08 to 3,54 million tonnes,
Canada ranging from 1,38 to 2,47 million tonnes.
-
5.00
10.00
15.00
20.00
25.00To
nn
es(
mill
ion
)
year
United States of
America
United Kingdom
Japan
Poland
France
India
Canada
Germany
China

3
3. South African production of rapeseed oil
Figure 3: South African production of rapeseed oil, 2004 to 2014
Source: FAO, 2018
Figure 3 above illustrates the production of rapeseed oil in South Africa over the
period 2004 to 2014. In addition, it depicts the percentage changes in the volume
of production. There was a substantial growth in the South African production of
rapeseed oil of about 19% in 2005, though a decline of about 9% is seen in 2007.
However, subsequent to 2007, there has been an increase in South African
rapeseed oil production, with 2012 recording the highest growth of about 47%. In
tonnage terms, the production of rapeseed ranged from 12 to 46 thousand tonnes
over the period 2004 to 2014.
4. Rapeseed processing
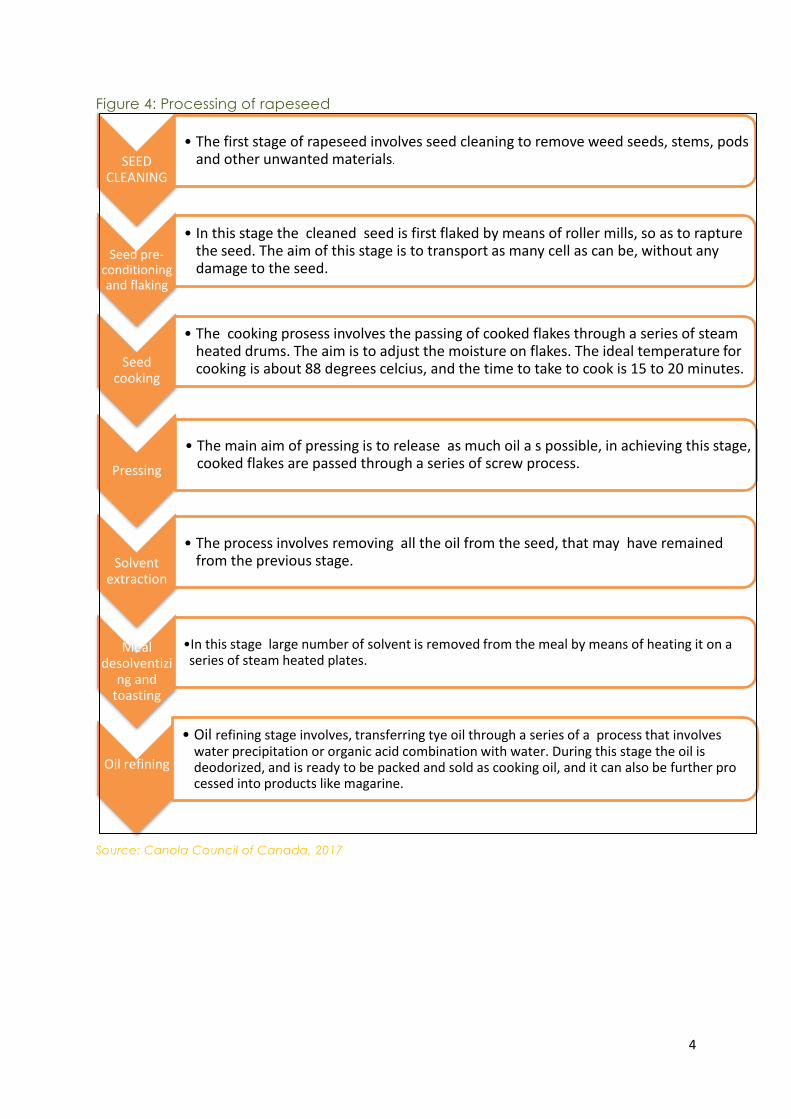
Figure 4 shows various stages of processing rapeseed, with the first stages involving
primary processing such cleaning. However, the last stages of processing are
solvent extraction, meal desolventising and toasting, and oil refining.
-20
-10
-
10
20
30
40
50
-
5
10
15
20
25
30
35
40
45
50
%ch
ange
Ton
ne
ss('0
00
)
Production % change
4
Figure 4: Processing of rapeseed
Source: Canola Council of Canada, 2017
SEED CLEANING
• The first stage of rapeseed involves seed cleaning to remove weed seeds, stems, pods and other unwanted materials.
Seed pre-conditioning and flaking
• In this stage the cleaned seed is first flaked by means of roller mills, so as to rapture the seed. The aim of this stage is to transport as many cell as can be, without any damage to the seed.
Seed cooking
• The cooking prosess involves the passing of cooked flakes through a series of steam heated drums. The aim is to adjust the moisture on flakes. The ideal temperature for cooking is about 88 degrees celcius, and the time to take to cook is 15 to 20 minutes.
Pressing
• The main aim of pressing is to release as much oil a s possible, in achieving this stage, cooked flakes are passed through a series of screw process.
Solvent extraction
• The process involves removing all the oil from the seed, that may have remained from the previous stage.
Meal desolventizi
ng and toasting
•In this stage large number of solvent is removed from the meal by means of heating it on a series of steam heated plates.
Oil refining
• Oil refining stage involves, transferring tye oil through a series of a process that involves water precipitation or organic acid combination with water. During this stage the oil is deodorized, and is ready to be packed and sold as cooking oil, and it can also be further pro cessed into products like magarine.

5
5. Trade patterns
5.1 Global trade of rapeseed oil
Figure 5: World exports and imports of rapeseed oil, 2013 to 2016
Source: TradeMaps, 2018
Figure 5 above depicts total exports and imports of rapeseed oil in the world over
the period 2013 to 2016. Global trade of rapeseed oil appears to remain slightly
stable. In 2016, the value of the world exports and imports of rapeseed oil were
R121, 62 billion and R136, 60 billion, respectively.
Figure 6: Top 10 exporters of rapeseed oil, 2016
Source: TradeMaps, 2018
-
20.00
40.00
60.00
80.00
100.00
120.00
140.00
160.00
R_b
illio
n
Exports Imports
-
10.00
20.00
30.00
40.00
50.00
60.00
70.00
Exp
ort
va
lue
(R
bill
ion
)
6
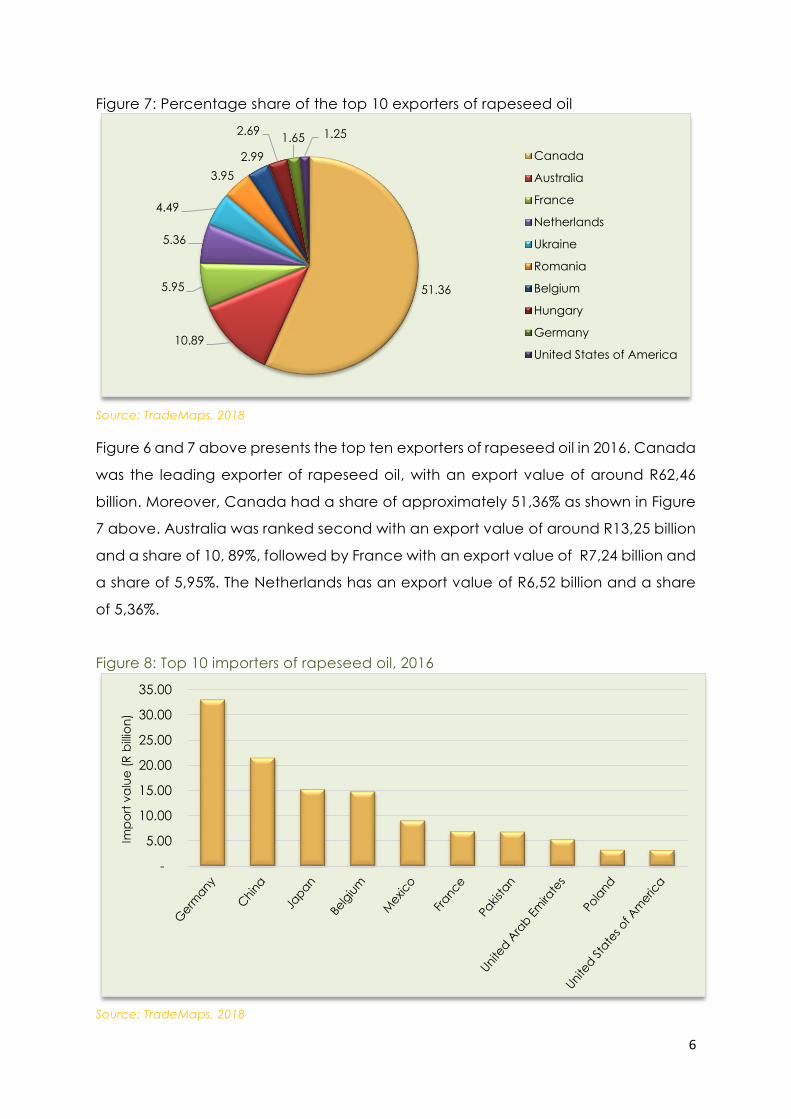
Figure 7: Percentage share of the top 10 exporters of rapeseed oil
Source: TradeMaps, 2018
Figure 6 and 7 above presents the top ten exporters of rapeseed oil in 2016. Canada
was the leading exporter of rapeseed oil, with an export value of around R62,46
billion. Moreover, Canada had a share of approximately 51,36% as shown in Figure
7 above. Australia was ranked second with an export value of around R13,25 billion
and a share of 10, 89%, followed by France with an export value of R7,24 billion and
a share of 5,95%. The Netherlands has an export value of R6,52 billion and a share
of 5,36%.
Figure 8: Top 10 importers of rapeseed oil, 2016
Source: TradeMaps, 2018
51.36
10.89
5.95
5.36
4.49
3.95
2.99
2.69 1.65 1.25
Canada
Australia
France
Netherlands
Ukraine
Romania
Belgium
Hungary
Germany
United States of America
-
5.00
10.00
15.00
20.00
25.00
30.00
35.00
Imp
ort
va
lue
(R
bill
ion
)
7
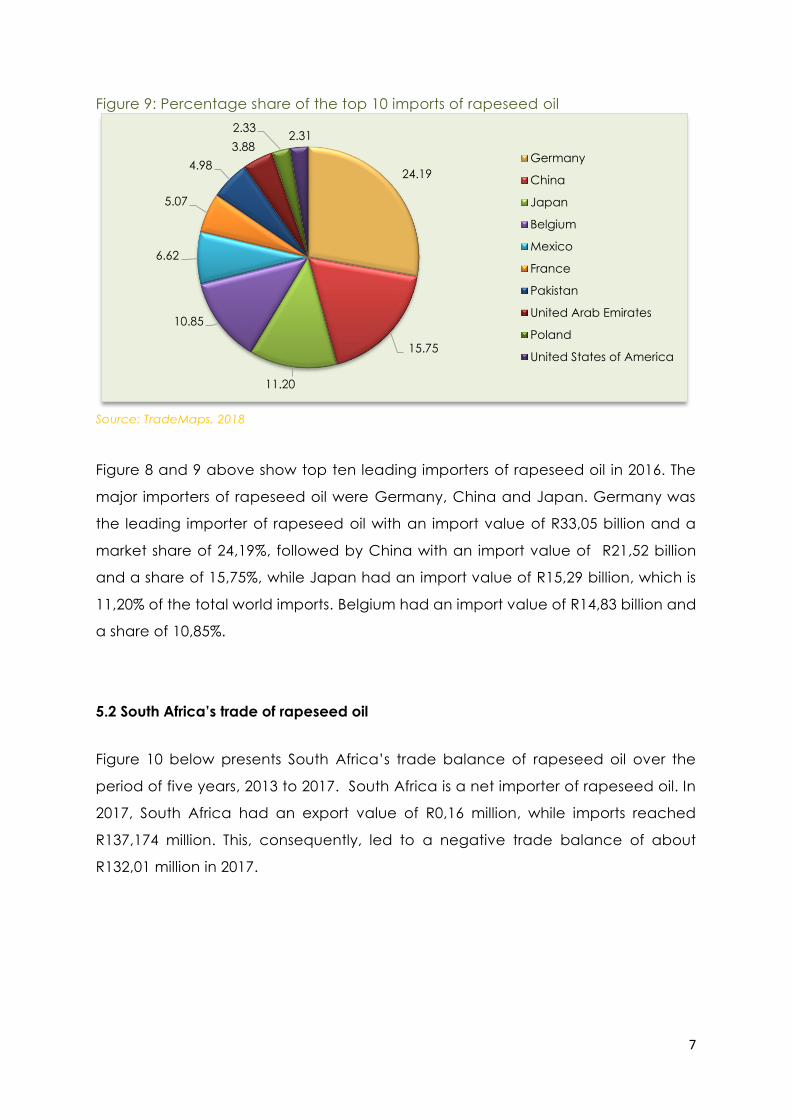
Figure 9: Percentage share of the top 10 imports of rapeseed oil
Source: TradeMaps, 2018
Figure 8 and 9 above show top ten leading importers of rapeseed oil in 2016. The
major importers of rapeseed oil were Germany, China and Japan. Germany was
the leading importer of rapeseed oil with an import value of R33,05 billion and a
market share of 24,19%, followed by China with an import value of R21,52 billion
and a share of 15,75%, while Japan had an import value of R15,29 billion, which is
11,20% of the total world imports. Belgium had an import value of R14,83 billion and
a share of 10,85%.
5.2 South Africa’s trade of rapeseed oil
Figure 10 below presents South Africa’s trade balance of rapeseed oil over the
period of five years, 2013 to 2017. South Africa is a net importer of rapeseed oil. In
2017, South Africa had an export value of R0,16 million, while imports reached
R137,174 million. This, consequently, led to a negative trade balance of about
R132,01 million in 2017.
24.19
15.75
11.20
10.85
6.62
5.07
4.98
3.88
2.33 2.31
Germany
China
Japan
Belgium
Mexico
France
Pakistan
United Arab Emirates
Poland
United States of America

8
Figure 10: South Africa’s trade of balance of olive oil, 2013 to 2017
Source: TradeMaps, 2018
Table 1 below shows South Africa’s exports of rapeseed oil in 2017. Lesotho was
the sole importer of South African rapeseed oil, which amounted to around R0.16
million.
Table 1: South Africa’s exports of rapeseed oil in 2017
Country Export value ( R million) % share
World 0,16
100,0
Lesotho 0,16
100,0
Source: TradeMaps, 2018
Table 2 below highlights South Africa’s imports of rapeseed oil in 2017. Bulgaria is
the leading supplier of rapeseed oil to South Africa with a market share of 89,65 %,
followed by Chile (4,11%) and Australia (3,63%).
-150
-100
-50
0
50
100
150
2013 2014 2015 2016 2017R'm
illon
Exports Imports Trade balance

9
Table 2: South Africa’s imports of rapeseed oil in 2017
Country Import value ( R million) % share
World 132,17
100,0
Bulgaria 118,50
89,65
Chile 5,43
4,11
Australia 4,80
3,63
Denmark 1,14
0,87
Germany 1,14
0,87
Spain 1,14
0,87
Netherlands 0,01
0,01
Source: TradeMaps, 2018
Figure 11 below illustrates prospects for market diversification for South Africa’s
exports of rapeseed oil. As shown in the Figure 11 South Africa is not a major exporter
of rapeseed oil in the world. South Africa exports rapeseed oil mainly to Lesotho,
with no prospects to diversity exports due to its limited production capacity.

10
Figure 11: Prospects for market diversification, 2016
Source: TradeMaps, 2018a
6. Summary
The global production of rapeseed oil continues to grow over the reviewed period.
The dominant producer of rapeseed oil is China, followed by Germany and
Canada. South Africa, though its production of rapeseed oil has shown an upward
trend, depends mainly on imports to meet its local consumption.
The major exporter of rapeseed oil was Canada, exporting approximately R62,46
billion, which constitutes 51,36% of the world’s total exports. Australia, France and
the Netherlands had an export share of 10,89%, 5,95% and 5,36%, respectively, in
2017. The leading importers of rapeseed were Germany, China and Japan with a
market share of 24,19%, 15,75%, and 11,20%, respectively.

11
However, South Africa is not a major exporter of rapeseed oil, it mainly exports a
meagre of R0.16 million to Lesotho. South Africa had a huge negative trade
balance, relying primarily on imports to meet local demand.

12
Reference
Canola Council of Canada, (2017). Steps in oil and meal processing. Available from
URL: https://www.canolacouncil.org [accessed on 16May 2018]
Department of Agriculture, (2016). Production guide for Canola. Pretoria
FAO, (2018). Rapeseed oil production. Available from URL:
http://www.fao.org/faostat/en/#data/QD [accessed on 18 May 2018]
ITC TradeMaps, (2018). Exports and imports of rapeseed oil. Avaliable from URL
https://www.trademap.org/Index.aspx [accessed on 02 May 2018]
ITC TradeMaps, (2018a).Prospects for market diversification for product exported by
South Africa. Available from URL: https://www.trademap.org/Index.aspx
[accessed on 21 May 2018]