Embed Size (px)
Citation preview

Compilation of Statistical Material Prepared at the Request of Dairy Farmers of America
Federal Order 5
Appalachian Marketing Area
Prepared by: Market Administrator's Office 45 I 1 Bardstown Road Suite 103 Louisville, Kentucky 402 18
For Use in Public Hearing Docket No. AO-388-A17 and AO-366-A46; DA-05-06 Louisville, Kentucky January 2006
RRR.430.1521 FAX 502.899.7976

TABLE OF CONTENTS
Appalachian Marketing Order - Federal Order 5
Page No. 1. Total Payments from Proposed Intra-Market Transportation Credit Fund
Based on Calculations Using Varying Mileage Rates.. .......................... .1
2. Estimated Total Pounds and Dollars from Proposed Intra-Market Transportation
Credit Fund to Proponents of Proposal 1, 2, and 3 .............................. 2
3. Total Pounds of Milk Produced From Counties In the Appalachian
and Southeast Marketing Areas and Pooled on Federal Order 5.. ............. .3
4. Summary Data from Analysis of the Proposed Intra-Market Transportation
.......................................................................... Credit Fund.. .4
5. Estimated Total Pounds and Dollars from Current Transportation Credit Fund
............................................. to Proponents of Proposal 1,2, and 3 -5
6 . Entities Requesting Class Price Announcements.. ...................................... 6
....................................... 7. Total Milk Pooled on Federal Order 5 By State.. .7
8. Producer Milk Produced in Counties Located in the Appalachian Marketing
........................................... Area and Pooled on the Order by State.. 9
9. Total Milk Pooled on Federal Order 5 That Was Delivered to a Pool
.. ......................... Distributing Plant in Either Federal Order 5 or 7.. .-. . I0
10. Daily Deliveries of Total Milk Pooled on Federal Order 5 That Was
............... Delivered to a Pool Distributing Plant in Either Order 5 or 7.. .12
1 1. Proposal 5 - Estimated Uniform Price at the Location of the Plants
Receiving 75 Percent of Total Diversions, Cities Listed in
................................................................ I Alphabetical Order.. .15

Exhibit Total Payments from Proposed Intra-Market Transportation Credit Fund Based on
Calculations Using Varying Mileage Rates, April and October 2005 11 Appalachian Marketing Area - Federal Order 5
April and October 2005 Prepared at the request of Dairy Farmers of America
Alternate Rates April 2005 October 2005
$0.0042 per cwt per mile
$0.0044 per cwt per mile
$0.0046 per cwt per mile
$0.0048 per cwt per mile
11 Payments computed based on Class I utilization of all pool distributing plants of 82.83% for April 2005 and 82.74% for October 2005.
Prepared by: Market Administrator
Louisville, KY
Page 1

Exhibit
Estimated Total Pounds and Doilars from Proposed Intra-Market Transportation Credit Fund to Proponents of Proposal 1, 2, and 3, Based on Calculations Using Varying Mileage Rates
Appalachian Marketing Area - Federal Order 5 April and October 2005
Prepared at the request of Dairy Farmers of America
$0.0042 per $0.0044 per $0.0046 per $0.0048 per cwt per mile cwt per mile cwt per mile cwt per mile
April 2005 Total Pounds Receiving Credit 96,822,739 96,822,739 96,822,739 96,822,739
Percent of Total Pounds 74.7% 74.7% 74.7% 74.7% Total Dollars $257,088.88 $275,141.80 $293,217.40 $31 1,346.95
Percent of Total Dollars 85.9% 85.9% 85.8% 85.8%
OctoQer 2005 Total Pounds Receiving Credit 79,859,723 79,859,723 79,859,723 79,859,723
Percent of Total Pounds 75.63% 75.63% 75.63% ' 75.63% Total Dollars $1 88,721.22 $202,431.39 $21 6,620.1 9 $230,887.43
Percent of Total Dollars 83.4% 83.3% 83.3% 83.2%
I i Proponents pooled on Federal Order 5 are Dairy Farmers of America, Lone Star Milk Producers, and Maryland and Virginia Milk Producers.
Prepared by: Market Administrator
Louisville, KY
Page 2

Exhibit '
Total Pounds of Milk Produced From Counties In the Appalachian and Southeast Marketing Areas and Pooled on Federal Order 5
Appalachian Marketing Area - Federal Order 5 April and October 2005
Prepared at the request of Dairy Farmers of America
Milk Pooled from Milk Pooled from Proponent Non-Proponent Milk Pooled from
Cooperatives 11 Cooperatives Nonmembers
April 2005 236,869,953 22,847,383 79,176,069
October 2005 197,907,769 19,482,767 66,616,949 . ,
11 Proponents of Proposal 1,2, and 3. Proponents pooled on Federal Order 5 are Dairy Farmers of America, Lone Star Milk Producers, and Maryland and Virginia Milk Producers.
Prepared by: Market Administrator
Louisville, KY
Page 3

Exhibit
Summary Data from Analysis of the Proposed Intra-Market Transportation Credit Fund, April and October 2005
Federal Order 5 -Appalachian Marketing Area Prepared at the Request of Dairy Farmers of America
April 2005 October 2005
Average Distance Milk Moved Beyond Nearest Pool Distributing Plant (miles)
Simple Average Weighted Average
Average zone Adjustment Between Plant of the Actual Receipt and Nearest Pool Distributing Plant ($lcwt)
Simple Average Weighted Average
Average Class I Utilization For All Pool Distributing Plants
Prepared by: Market Administrator
Louisville, KY ,,
Page 4

Exhibit
Estimated Total Pounds and Dollars from Current Transportation Credit Fund Received by Proponents of Proposal 1, 2, and 3, Based on Calculations Using Varying Mileage Rates 11
Appalachian Marketing Area - Federal Order 5 October and November 2005
Prepared at the request of Dairy Farmers of America
Total TC Requested at $0.0035 per cwt per $0.0042 per cwt $0.0044 per $0.0046 per $0.0048 per
mile 21 per mile cwt per mile cwt per mile cwt per mile
October 2005 Total Pounds Receiving Credit
Percent of Total Pounds Total Dollars
Percent of Total Dollars
November 2005 ~ o t a i ~ o u n d s Receiving Credit
Percent of Total Pounds Total Dollars
Percent of Total Dollars
I1 Proponents pooled on Federal Order 5 are Dairy Farmers of America, Lone Star Milk Producers, and Maryland and Virginia Milk Producers. 21 Actual transportation credit fund payments were prorated in October and November 2005.
Prepared by: Market Administrator
Louisville, KY
Page 5

Exhibit
Appalachian Marketing Area, Federal Order No. 5
Dairy Farmers of America Request
1) The months of September - December 2005 recap of all entities requesting a FMMO Class Price announcement. Total
Other Federal Order Offices 5
Federal Government Entities that might purchase milk or dairy products 4
State Government Entities that might purchase milk or dairy products 1
County or City Government Entities that might purchase milk or dairy products 0
School Districts (if a school district might be a County or City government entity include it in this grouping) 15
Institutional or college university entity (hospital, nursing home, college) 5
Milk processing company 37
Cooperative 13
Retail or Wholesale grocery company or food broker 9
Other (agricultural finance institutions, agricultural statisticians, consultants, dairy farmers, dairy publications, groceries, marketing groups, restaurants, state mitk commissioner.) 49
Prepared by: Market Administrator
Louisville, KY
Page 6

Exhibit Total Milk Pooled on Federal Order 5 By State Appalachian Marketing Area - Federal Order 5
January 2004 - November 2005 Prepared at the Request of Dairy Farmers of America
Georgia Indiana Kentucky Maryland Michigan IJ. Carolina 0 hio
Page 7

Total Milk Pooled on Federal Order 5 By State Appalachian Marketing Area - Federal Order 5
January 2004 - November 2005 Prepared at the Request of Dairy Farmers of America
Pennsylvania S. Carolina Tennessee Virginia Other If Total
Nw-05 38,217,349 22,082,090 44,992,336 92,410,610 51,073,542 508,479,1 79 I1 Due to confidentiality issues, other contains milk production from Alabama, Delaware, Illinois, Iowa, Kansas, Missouri, New Mexico, New York, Oklahoma, Texas, West Virginia, and Wisconsin .
Prepared by: Market Administrator
Louisville, KY
Page 8

Exhibit Producer Milk Produced In Counties Located in the A~wlachian Marketina Area and Pooled on the Order. BY State
Appalachian ~ a r k e t i n ~ Area - Federal order 5 January 2004 - November 2005
Prepared at the Request of Daily Farmers of America
Tennessee and Additional Expanded Indiana Kentucky N. Carolina S. Carolina Georgia 21 Virginia Total In-Area Virginia 21 Area 21
NOV-05 13,335,296 48,908,277 73,179,232 22,082,090 41,097,346 76,772,301 275,374,542 275,374,542 I/ Georgia prduction data was combhed with Tennessee due to confidentiality issues. 21 ~e f le&s the additional counties added to the Appalachian Marketing Area, eiiective November 1. 2005.
Prepared by: Market Administrator
Louisville. KY
Page 9

Exhihiit Total Milk Pooled on Federal Order 5 that was Delivered to a Pool Distributing Plant in Either Federal Order 5 or 7
Appalachian Marketing Area - Federal Order 5 January 2004 - November 2005
Prepared at the Request of Dairy Farmers of America
Georgia Indiana Kentucky MaryIand Michigan N. Carolina Ohio
Page 10

Total Milk Pooled on Federal Order 5 that was Delivered to a Pool Distributing Plant in Either Federal Order 5 or 7 Appalachian Marketing Area - Federal Order 5
January 2004 - November 2005 Prepared at the Request of Dairy Farmers of America
Pennsylvania S. Carolina Tennessee Virginia Other 11 Total
NOV-05 23,459.432 22,016,099 41,547,654 78,322,939 15,562,446 41 1,210,384
I/ Due to confidentialjty issues, other contains deliveries from milk produced in Alabama, Delaware, lllinois, Iowa, Kansas, Missouri, New Mexico, New York, Oklahoma, Texas, West Virginia, and Wisconsin.
Prepared by: Market Administrator
touisvilte, KY
Page 11

Exhibit
Daily Deliveries of Total Milk Pooled on Federal Order 5 that was Delivered to a Pool Distributing PIant in Either Federai Order 5 or 7 11 Appalachian Marketing Area - Federal Order 5
January 2004 - November 2005 Prepared at the Request of Dairy Farmers of America
Days of the Month Jan-04 F e w Mar-04 Apr-04 May44 Jun-04 Jul-04 Aug-M S e p M Oct-04
Total 21 395,540,737 359,024,502 384519,348 360,609,077 340,?95.408 340,934,942 348,491,606 372,009,694 360,294,947 266,446,955 Percent of Totat Pod Distributing Plant Deliveries 88.2% 87.6% 87.570 86.5% 85.7% 87.0% 86.8% 87.7% 87.6% 87.5%
Page 12
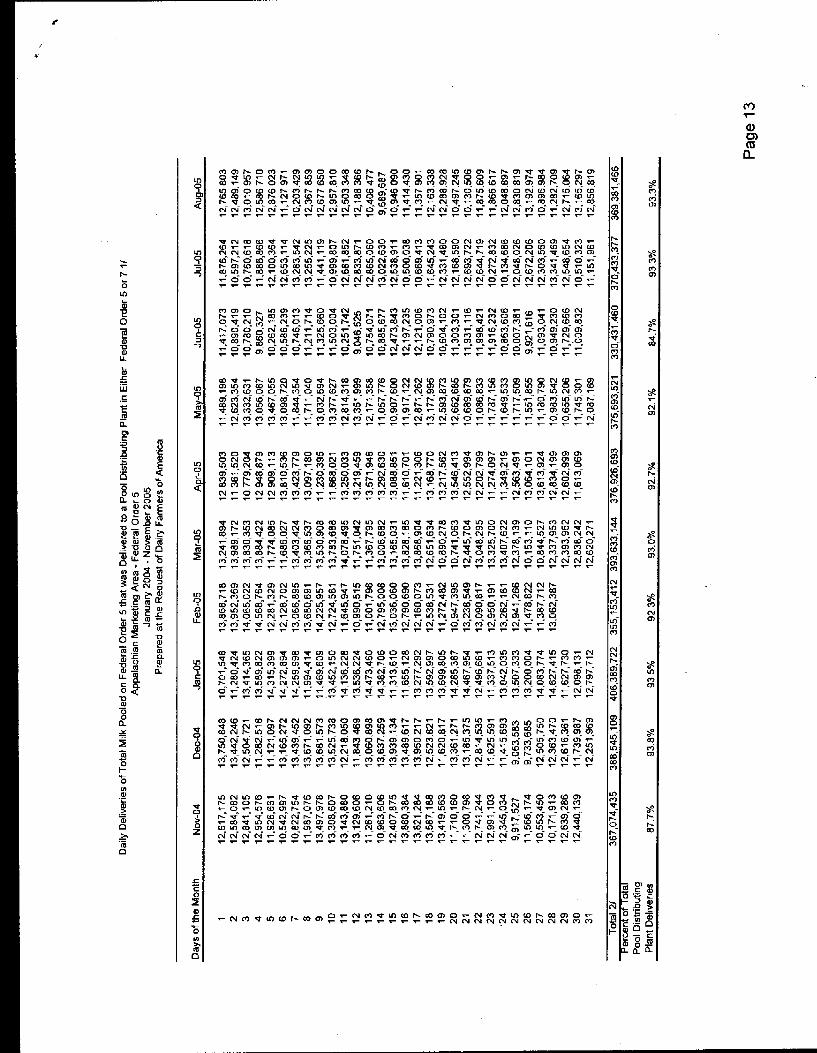
Daily Deliveries of Total Milk Pooled on Federal Order 5 hat was Delivered to a Pool Distributing Plant in Either Federal Order 5 or 7 11 Appaiachian Marketing Area - Federal Order 5
January 2004 - November 2005 'Prepared at the Request of Dairy Farmers of America
Days of the Month Sep-05 Oct-05 Nov-05
Total 21 347,588,571 366,446,955 385,667,823 Percent of Total Pool Distributing Plant ~eliver& 92.6% 91.2% 93.8%
11 Daily delivery data was not available for all handlers, percent of pod distributing plant deliveries reflect the total daily delivery data shown relative to the total volume deliveried to a pool distibuting plant for the month. 21 Total of daily deliveries by month shown in table.
Page 14

Exhibii
Proposal 5 - Estimated Uniform Price at the Location of the Plants Receiving 75 Percent of Total Diversions, Cities Listed in Alphabetical Order Appalachian Marketing Area - Federal Order 5
January 2004 - November 2005 Prepared at the Request of Dairy Farmers of America
Uniform Actual Class Ill k Adual
Class IV k Month Wnh the Lowest Diverted Volume in the last 12 months December 2004
Brenham, TX 3.30 17.18 16.14 Broken Arrow, OK 2.60 16.48 16.14 Carlisle, PA 2.80 16.68 16.14 Freernont, OH 2.00 15.88 16.t4 Laurel, MD 3.00 16.88 16.14 Marietta, OH 2.00 15.88 16.14 New Wilmington, PA 2.10 15.98 16.14 Newark. OH 2.00 15.88 16.1 4 Sulphur Springs, TX 3.00 16.88 16.14 W~nnsboro, f X 3.00 16.88 16.14
Month With Highest Diverted Volume in the last 12 months March 2005
Broken Amw, OK 2.60 16.24 Kiel, WI 5.75 15.39 Laurel, MD 3.00 16.64 Layton, UT 1.90 1 5.54 Minster, OH 2.00 15.64 Newark, OH 2.00 15.64 Newport, KY 2.20 15.84 Oklahoma City, OK 2.60 16.24 Portales, NM 2.10 15.74
I Closest Pool Distributing I Estimated Uniform Price at Location - Percent of Plant Proposal 5 31 Total Out of $0.003 per $0.0035 per $0.004 per
Area mite per cwt mile per wt mile per cwt Diversions 111 Miles 1 Differential I rate [ rate I rate
Roswell, NM 2.10 15.74 14.08 12.66 74.2% 651 2.80 Smithfield, UT 1.90 15.54 14.08 12.66 74.2% 1289 2.20 Sulphur Springs, TX 3.00 16.64 14.08 12.66 74.2% 126 3.10 Waupun, WI 1.75 15.39 14.08 12.66 74.256 452 2 70
I! Per~entage of total diversions that the locations represent. 21 The Appahchian or Southeast Order pool distributing plant dosest to the plantieceiving diverted milk. Morningstar, Mt. Crawford, VA, was included as a pool distributing plant for all months. The plant became a pool distributing plant on FO 5 effective November 1,2005. 31 Estimated uniform price at the location of the plant receiving the diverted milk.
Page 15