Embed Size (px)
Citation preview

Compilation and uses of the Multi-Country Input-Output tables:Lessons from the ADB MRIO databaseBangkok, Thailand
11 July 2019
Objectives
2
DATA SOURCESTop-down approach
METHODS AND ISSUESFrom compilation to reconciliation
THE ADB MRIO TABLESStructure, and coverage
USES AND ANALYSISCommon applications and utility
Data
valu
e c
hain
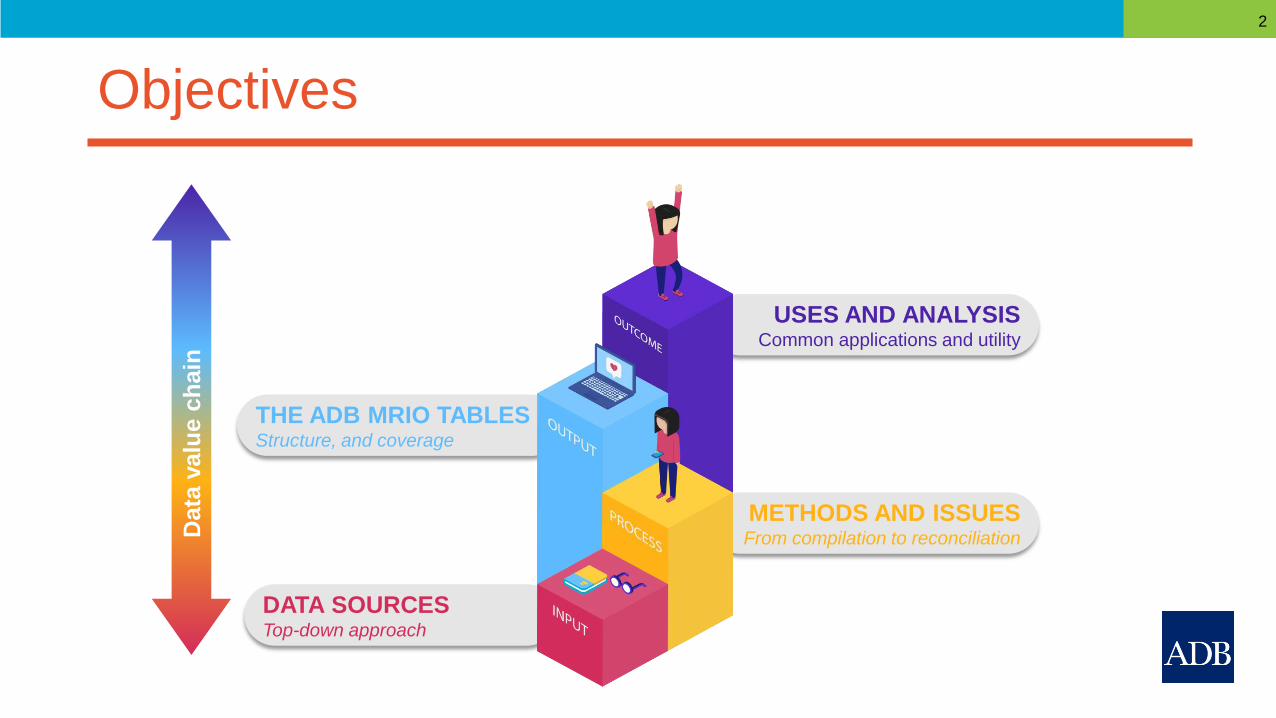
Data partners and stakeholders
3
CoreCountry national
accounts
Direct-core
Data
sources
of data
sources
Users
of direct
data
sources
Extended core
Complementary
country sources
Internationally
comparable
sources /
databases
Users of
comparative
database
Complementary
international
databases

Why compile multiregional IOTs?
4
THREE (3) KEY AREAS OF ANALYSIS
INTERNATIONAL
TRADE
ENVIRONMENT &
ECONOMY
LABOR MARKETS &
GLOBALIZATION
1 2 3

Illustration of uses of MRIO
5
2000 2004 2007 2011 2014
US
’ exp
ort
s to
PR
CP
RC
’s e
xp
ort
s to
US
Value added in exports of
respective economies (VAX_G)
US: 74% (2014)
PRC: 46% (2014)
“Third country” effects(value-added contribution of
other countries or FVA)
Trade in computer, electronics, and optical equipment

Illustration of uses of MRIO
6
Backward participation (GVCPt_B)
Fo
rward
part
icip
ati
on
(G
VC
Pt_
F)

Illustration of uses of MRIO
7

Overview of the main features of the various databases
8
Database Number of countries Number of products and industries Years
AIIOT (IDE-JETRO) 10 (8 for 1975 table) 75 products (56 for 1975 table, 77 for
1985 table)
1975, 195, 1990, 1995, 2000, 2005
EORA MRIO 187 countries Varying across countries; simplified
version with 26 industries
1990-2013
EXIOBASE Versions 2 and 3 are
more enhanced
43 countries; 5 world regions 220 products; 163 industries 2000, 2007
FIGARO 28 EU countries; USA; Rest of the
World
64 industries; 64 products 2010; 2010-2017 in progress
Global MRIO LAB 220 countries Flexible choice: 6357 products,
industry root classification
1990-2015 (preliminary data)
GTAP-MRIO 140 GTAP regions 57 GTAP commodities 2004, 2007, 2011
OECD-ICIO 64 (including Rest of the World) 34 industries; 34 products 1995-2011 (ISIC 3; nowcasted 2012-
2014); 2005-2011 (ISIC 4)
WIOD (2013 and 2016 release
versions)
43 (including Rest of the World) 64 products; 56 industries 2000-2014
ADB MRIO 63 (including Rest of the World) Varying SUT dimensions;
harmonized to 35 industries
2000; 2007-2017 (2018 update on-
going)

Stylized production chains in the Input-Output framework
9
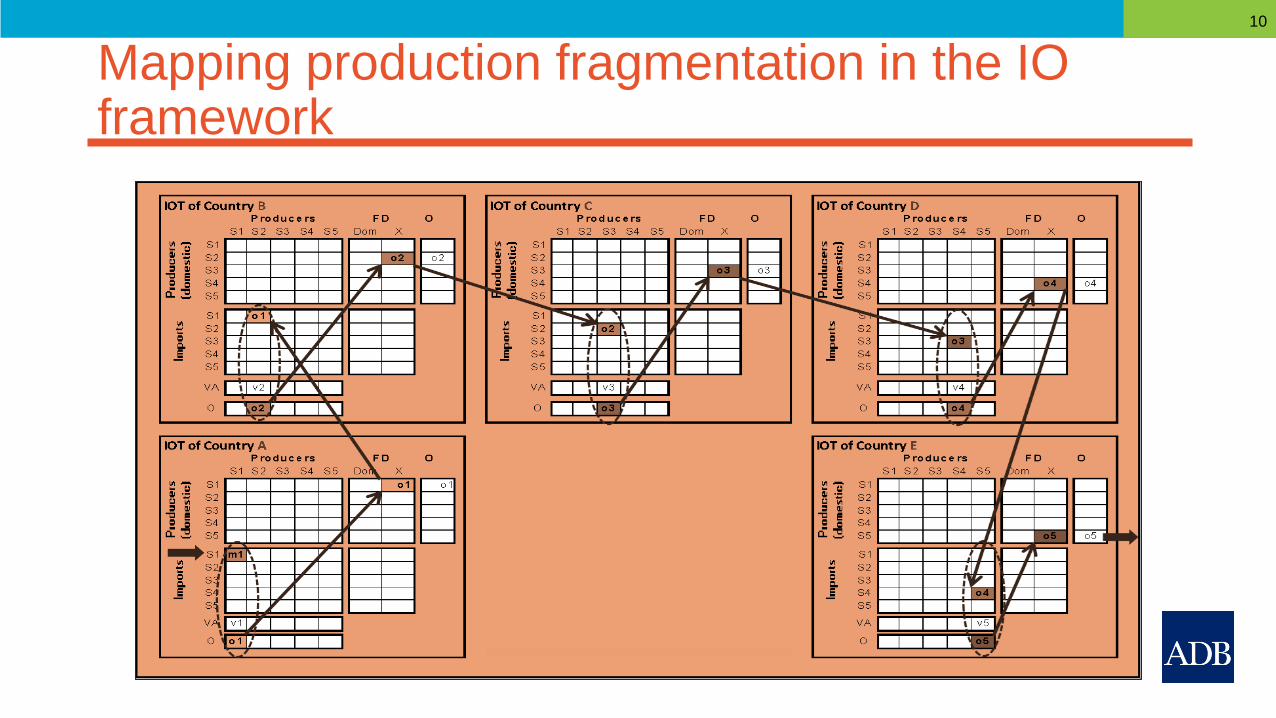
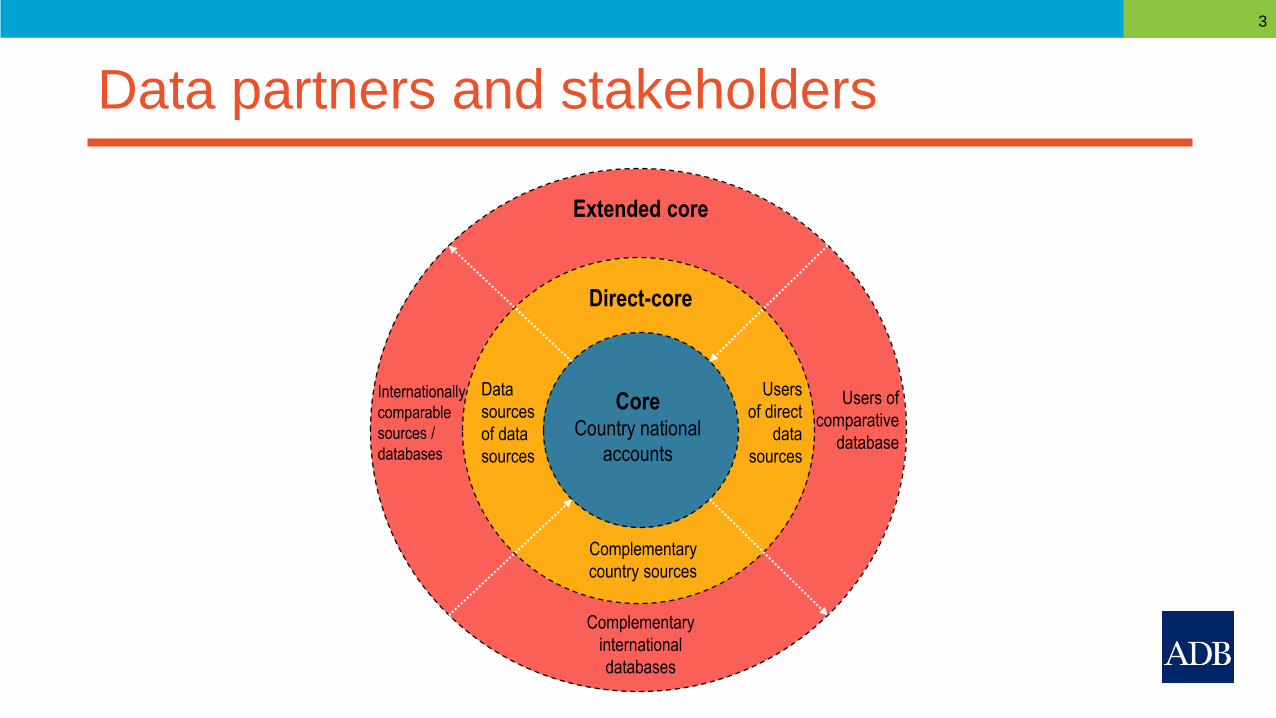
Mapping production fragmentation in the IO framework
10

Schematic of multi-country / multi-regional input-output tables (MRIO)
11
COUNTRY A COUNTRY B R.O.W. COUNTRY A COUNTRY B R.O.W.
TOTALIntermediate Intermediate Intermediate Final Final Final
Industry Industry Industry Industry Industry Industry
COUNTRY A
Indu
str
yIn
du
str
yIn
du
str
y
COUNTRY B
Rest of the
World
Value Added Value Added Value Added
Output in A Output in B Output in R.O.W.
Intermediate
use of
domestic
output
Intermediate
use by A of
exports from
B
Intermediate
use by A of
exports from
R.o.W.
Intermediate
use by B of
exports from
A
Intermediate
use of
domestic
output
Intermediate
use by B of
exports from
R.o.W.
Intermediate
use by
R.o.W. of
exports from
A
Intermediate
use by
R.o.W. of
exports from
B
Intermediate
use of
domestic
output
Final use of
domestic
output
Final use by
A of exports
from B
Final use by
A of exports
from R.o.W.
Final use by
B of exports
from A
Final use of
domestic
output
Final use by
B of exports
from R.o.W.
Final use by
R.o.W. of
exports from
A
Final use by
R.o.W. of
exports from
B
Final use of
domestic
output
OUTPUT IN
A
OUTPUT IN
B
OUTPUT IN
R.O.W.
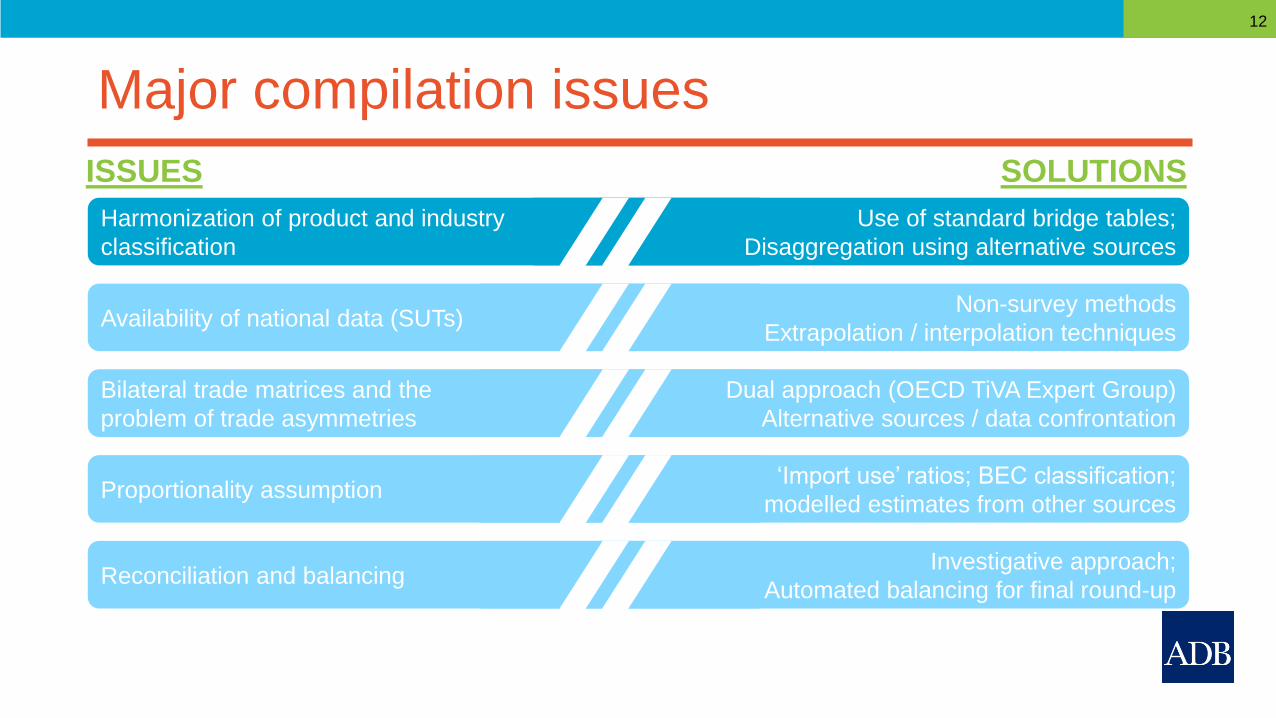
Major compilation issues
12
Harmonization of product and industry
classification
Use of standard bridge tables;
Disaggregation using alternative sources
Availability of national data (SUTs)Non-survey methods
Extrapolation / interpolation techniques
Bilateral trade matrices and the
problem of trade asymmetries
Dual approach (OECD TiVA Expert Group)
Alternative sources / data confrontation
Proportionality assumption‘Import use’ ratios; BEC classification;
modelled estimates from other sources
Reconciliation and balancingInvestigative approach;
Automated balancing for final round-up
ISSUES SOLUTIONS

Diversity in classifications and dimensions of constituent national IOTs
13
• Objective: augment existing world input-output tables (Timmer et al., 2015) by expanding to include 19 participating economies under ADB’s R-CDTA 8838
• Key publication: Compendium of Supply and Use Tables for Selected Economies in Asia and the Pacific (2017)
• Varying product dimensions, depending on the structure of the economy
“Aggregation” “Disaggregation”

Diversity in classifications and dimensions of constituent national IOTs
14
AGGREGATION APPROACH
• Heavy use of correspondence tables published by UNSD
• Mainly ISIC 3 for industries
• Trade-off between the level of uniformity and the level of information embedded in generating consistent multi-country SUTs and IOTs (UN SUT Handbook para 17.32)

Diversity in classifications and dimensions of constituent national IOTs
15
DISAGGREGATION APPROACH
• Reliance on alternative sources
Administrative
sources(e.g. turnover data,
merchandise trade,
employment)
Partner country
statistics(e.g. use of ‘similar’ country
structure, esp. when there is
presence of regional firms)
Similar ICIO
databases(e.g. use of OECD ICIOT 2015 /
2018 versions)
Modelled estimates (e.g. use of varied research publications
(UN, WB, industry reports) for
indicators; most useful on the
expenditure side)
Indirect estimation approaches Indicators (less robust)
Off
icia
l s
tati
sti
cs
A
na
lyti
ca
l d
ata
ba
se
HIGH MED-LO
MED-HI LOW

Major compilation issues
16
Harmonization of product and industry
classification
Use of standard bridge tables;
Disaggregation using alternative sources
Availability of national data (SUTs)Non-survey methods
Extrapolation / interpolation techniques
Bilateral trade matrices and the
problem of trade asymmetries
Dual approach (OECD TiVA Expert Group)
Alternative sources / data confrontation
Proportionality assumption‘Import use’ ratios; BEC classification;
modelled estimates from other sources
Reconciliation and balancingInvestigative approach;
Automated balancing for final round-up
ISSUES SOLUTIONS

Availability of timeseries national SUTs/IOTs for 63 economies
17
• Option 1: Trends and extrapolation anchored on annual national accounts statistics, directinput coefficients of benchmark year; normalized such that each element adds up to controlfigures (see for instance Timmer et al, 2013; Eurostat 2008); Back casting techniques using‘balanced’ bilateral trade database of BACI
• Option 2: Marginal inputs coefficients (Miller & Blair, 2009) relate the change (from year t −r to year t) in the amount of input i purchased by industry j to the change (over the sameperiod) in the total amount of j produced.
• Option 3: G-RAS (Temurshoev 2013) and M-RAS algorithm (Paelinck and Waelbroeck1963)
Marginal changes

Major compilation issues
18
Harmonization of product and industry
classification
Use of standard bridge tables;
Disaggregation using alternative sources
Availability of national data (SUTs)Non-survey methods
Extrapolation / interpolation techniques
Bilateral trade matrices and the
problem of trade asymmetries
Dual approach (OECD TiVA Expert Group)
Alternative sources / data confrontation
Proportionality assumption‘Import use’ ratios; BEC classification;
modelled estimates from other sources
Reconciliation and balancingInvestigative approach;
Automated balancing for final round-up
ISSUES SOLUTIONS
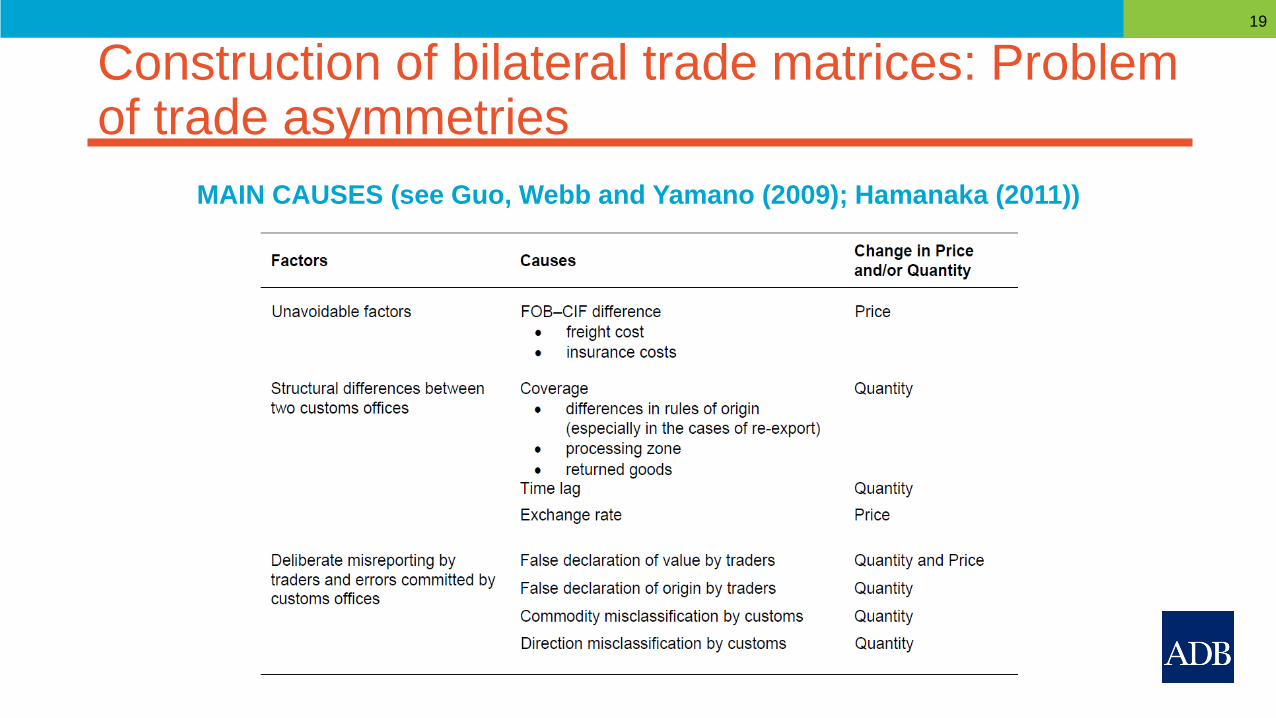
Construction of bilateral trade matrices: Problem of trade asymmetries
19
MAIN CAUSES (see Guo, Webb and Yamano (2009); Hamanaka (2011))
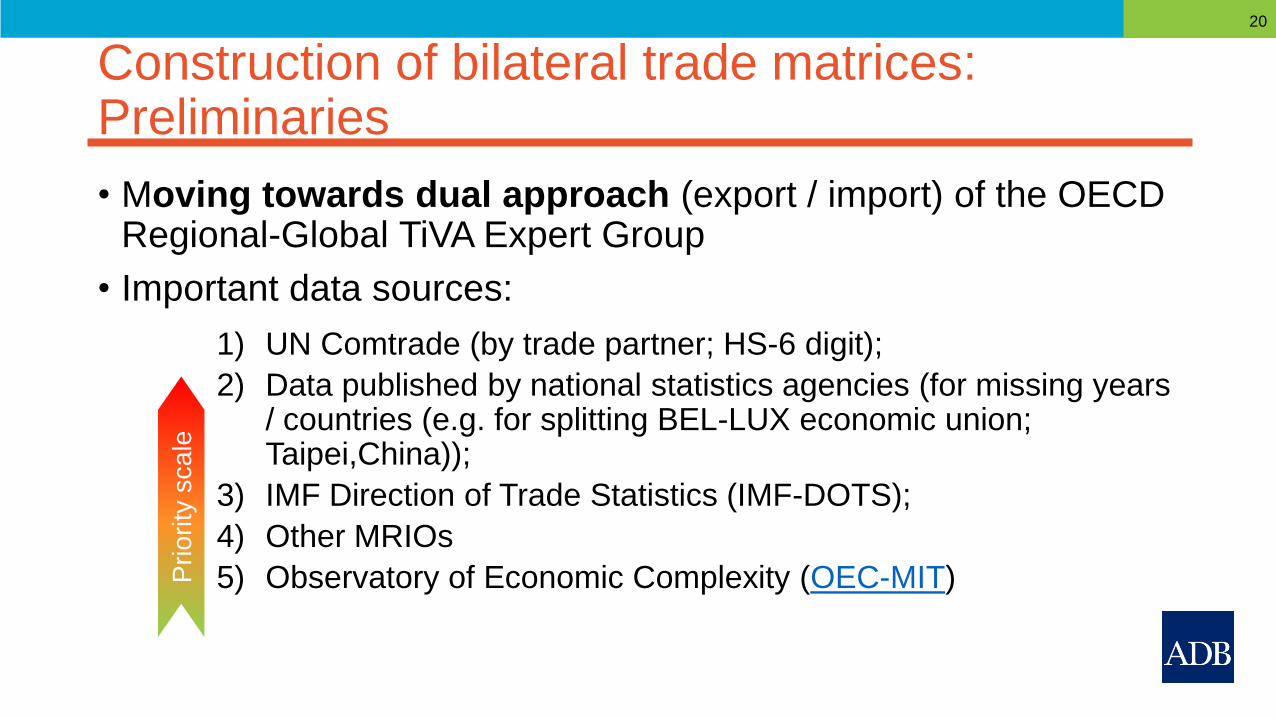
Construction of bilateral trade matrices: Preliminaries
20
• Moving towards dual approach (export / import) of the OECD Regional-Global TiVA Expert Group
• Important data sources:
1) UN Comtrade (by trade partner; HS-6 digit);
2) Data published by national statistics agencies (for missing years / countries (e.g. for splitting BEL-LUX economic union; Taipei,China));
3) IMF Direction of Trade Statistics (IMF-DOTS);
4) Other MRIOs
5) Observatory of Economic Complexity (OEC-MIT)Prio
rity
sca
le

Construction of bilateral trade matrices: Broad algorithm sketch
21
Goods
Import
vector
(cif)
Goods
import
vector
(fob)
Available from Balance of Payments;
Estimates from partner countries fob exports;
CIF-FOB bilateral margins
𝐼𝑖,𝑗𝑀
Services
import
vector
Services
import
vector
𝐹𝑖,𝑗𝑀 𝐺𝑖,𝑗
𝑀
𝐼𝑖,𝑗𝑀 𝐹𝑖,𝑗
𝑀 𝐺𝑖,𝑗𝑀
= 𝑴𝒊 ∀𝒊
Intermediate uses Final consumption Capital goods
𝐼𝑖𝑀 𝐹𝑖
𝑀 𝐺𝑖𝑀
𝐼𝑖𝑀 𝐹𝑖
𝑀 𝐺𝑖𝑀
Various databases
BEC classification
Proportionality assumption (if no data);
Import use intensity from benchmark year t, e.g. :
𝐼 𝑡 𝑖,𝑗𝑀 / 𝐼 𝑡 𝑖,𝑗
𝑈 * 𝐼 𝑡 + 𝑟 𝑖,𝑗𝑀
(and then normalized such that imported use of industries i… j…to n
is equal to total imported intermediate goods and services)
𝐼𝑖,𝑗𝑀 𝐹𝑖,𝑗
𝑀 𝐺𝑖,𝑗𝑀
𝐼𝑖,𝑗𝑀 𝐹𝑖,𝑗
𝑀 𝐺𝑖,𝑗𝑀
𝐼𝑖,𝑗,𝑘𝑀 𝐹𝑖,𝑗,𝑘
𝑀 𝐺𝑖,𝑗,𝑘𝑀
Partner country A
Partner country B
Partner country C
By trade partner
By product i
By industry j
UN Comtrade;
IMF-DOTS
UN COMTRADE;
Proportionality assumption
Eora MRIO;
OECD ICIOT
Du
al a
pp
roa
ch
Da
ta c
on
fro
nta
tio
n
𝐼𝑖,𝑗,𝑘𝑒 𝐹𝑖,𝑗,𝑘
𝑒 𝐺𝑖,𝑗,𝑘𝑒
𝐼𝑖,𝑗,𝑘𝑒 𝐹𝑖,𝑗,𝑘
𝑒 𝐺𝑖,𝑗,𝑘𝑒
𝐼𝑖,𝑗,𝑘𝑒 𝐹𝑖,𝑗,𝑘
𝑒 𝐺𝑖,𝑗,𝑘𝑒
Export matrices by trade partner
(see ‘dual approach’ of OECD Regional-Global
Expert TiVA Group)
Ideally M of c from k should be equal to the E of k to c

Construction of bilateral trade matrices: Problem of trade asymmetries
22
SOME INVESTIGATIVE APPROACHES:
▪ Which trade flow? Imports are usually recorded with more accuracy than exportsbecause imports generally generate tariff revenues while exports don’t (Based on WITS,echoed by Timmer et al 2012)
▪ Which reporter? Reliability indicators (Guo, Webb, and Yamano (2009) and Gehlhar,Wang and Yao (2008), and more recently Fortanier & Sarrazin (2016; 2017) suggestindicators for reporter reliability based on discrepancies at the commodity-partner level.E.g. reported exports and imports are then reconciled using a “symmetry index” thatgives more weight to those countries whose data more often agree with those of theirtrading partner
• Top-down approach is also used which checks highest levels of aggregation beforelooking at subcomponents; enables compiler to flag misdirected and misclassified trade.
Where Xr and Mr reflect retained exports and retained
imports, i.e. those bilateral flows that meet certain
criterion (e.g. 30% in the case of OECD BATiS).

Major compilation issues
23
Harmonization of product and industry
classification
Use of standard bridge tables;
Disaggregation using alternative sources
Availability of national data (SUTs)Non-survey methods
Extrapolation / interpolation techniques
Bilateral trade matrices and the
problem of trade asymmetries
Dual approach (OECD TiVA Expert Group)
Alternative sources / data confrontation
Proportionality assumption‘Import use’ ratios; BEC classification;
modelled estimates from other sources
Reconciliation and balancingInvestigative approach;
Automated balancing for final round-up
ISSUES SOLUTIONS
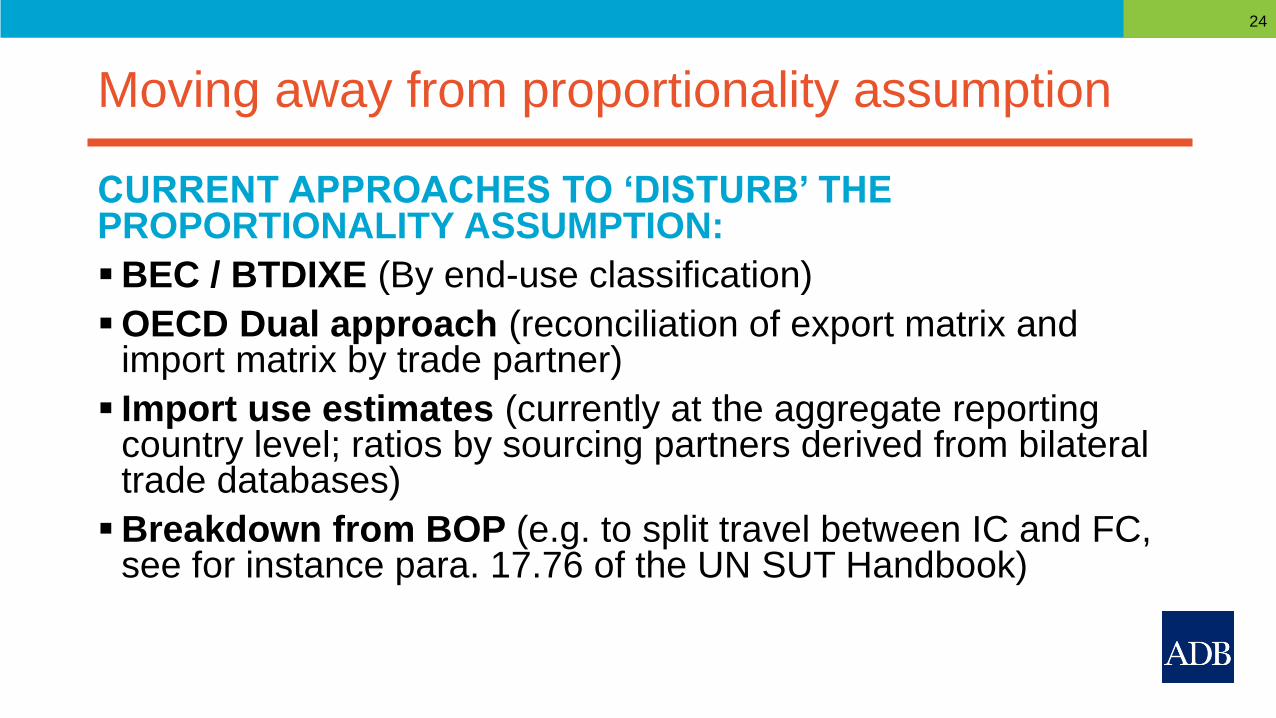
Moving away from proportionality assumption
24
CURRENT APPROACHES TO ‘DISTURB’ THE PROPORTIONALITY ASSUMPTION:
▪BEC / BTDIXE (By end-use classification)
▪OECD Dual approach (reconciliation of export matrix and import matrix by trade partner)
▪ Import use estimates (currently at the aggregate reporting country level; ratios by sourcing partners derived from bilateral trade databases)
▪Breakdown from BOP (e.g. to split travel between IC and FC, see for instance para. 17.76 of the UN SUT Handbook)

Major compilation issues
25
Harmonization of product and industry
classification
Use of standard bridge tables;
Disaggregation using alternative sources
Availability of national data (SUTs)Non-survey methods
Extrapolation / interpolation techniques
Bilateral trade matrices and the
problem of trade asymmetries
Dual approach (OECD TiVA Expert Group)
Alternative sources / data confrontation
Proportionality assumption‘Import use’ ratios; BEC classification;
modelled estimates from other sources
Reconciliation and balancingInvestigative approach;
Automated balancing for final round-up
ISSUES SOLUTIONS
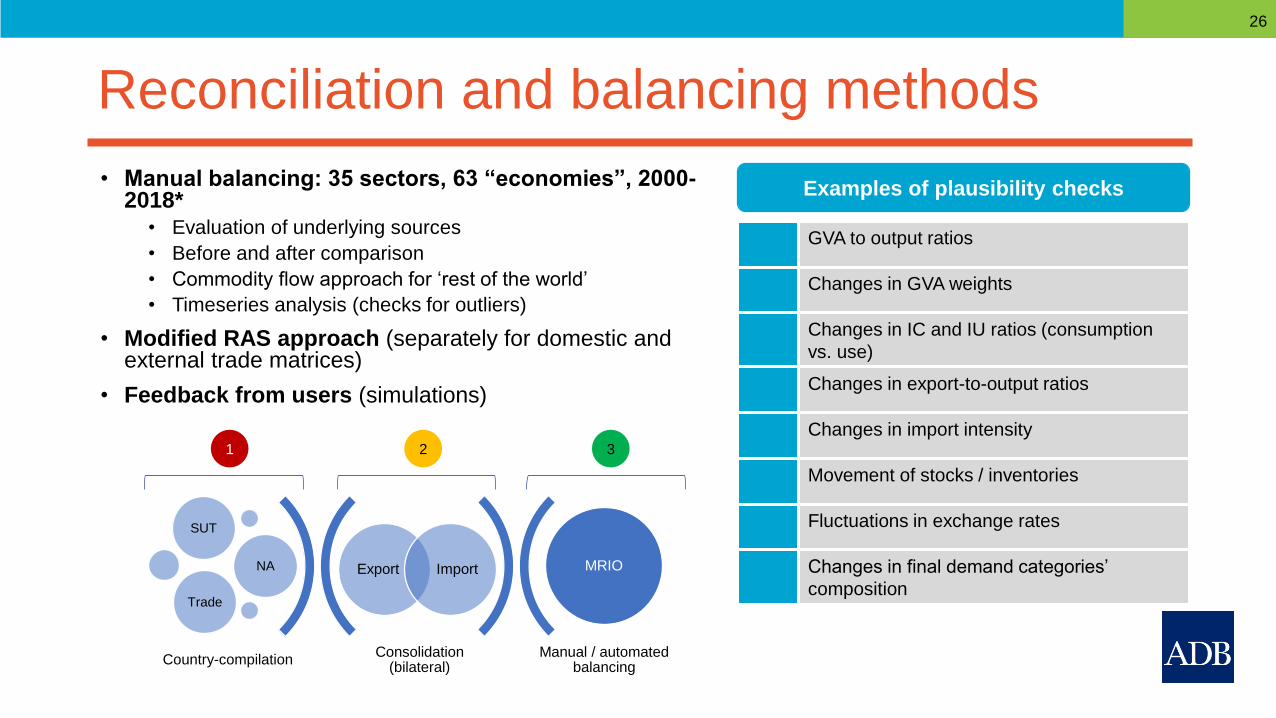
Reconciliation and balancing methods
26
• Manual balancing: 35 sectors, 63 “economies”, 2000-2018*
• Evaluation of underlying sources
• Before and after comparison
• Commodity flow approach for ‘rest of the world’
• Timeseries analysis (checks for outliers)
• Modified RAS approach (separately for domestic and external trade matrices)
• Feedback from users (simulations)
Examples of plausibility checks
GVA to output ratios
Changes in GVA weights
Changes in IC and IU ratios (consumption
vs. use)
Changes in export-to-output ratios
Changes in import intensity
Movement of stocks / inventories
Fluctuations in exchange rates
Changes in final demand categories’
composition
Consolidation (bilateral)
Manual / automated balancing
Export Import
SUT
NA
Trade
MRIO
Country-compilation
1 2 3
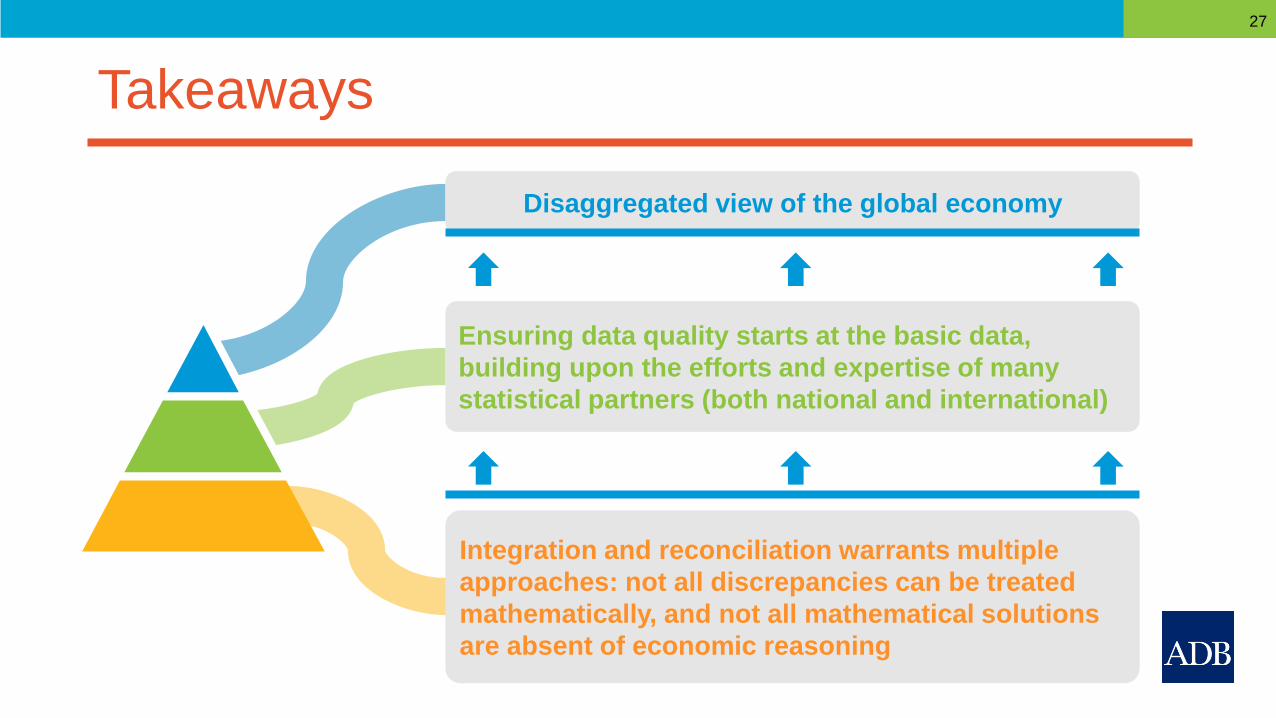
Takeaways
27
Disaggregated view of the global economy
Ensuring data quality starts at the basic data,
building upon the efforts and expertise of many
statistical partners (both national and international)
Integration and reconciliation warrants multiple
approaches: not all discrepancies can be treated
mathematically, and not all mathematical solutions
are absent of economic reasoning

Ways forward
28
More countriesand years
Sectoral disaggregation (also updating ISIC)
Enhanced balancing methods (Möhr, Crown and Polenske, 1987; Ghanem, 2004)
Extendedinput-output tables (e.g. employment, capital)
Satellite accounts
Constant prices
Social accounting matrices

Thank you very much for your attention!