Embed Size (px)
Citation preview
8/2/2019 Competiveness Index
http://slidepdf.com/reader/full/competiveness-index 1/39
CHAPTER 1.1
The Global Competitiveness
Index: Prioritizing the
Economic Policy AgendaXAVIER SALA-I-MARTIN
JENNIFER BLANKE
MARGARETA DRZENIEK HANOUZ
THIERRY GEIGER
IRENE MIA
FIONA PAUA
World Economic Forum
After several years of rapid and almost unhampered
growth, the global economic landscape is changing.
Rising food and energy prices, a major international
financial crisis, and the related slowdown in the world’s
leading economies are confronting policymakers with
new economic management challenges.Today’s volatility
underscores the importance of a competitiveness-
supporting economic environment that can help nationaleconomies to weather these types of shocks in order to
ensure solid economic performance going into the future.
A nation’s level of competitiveness reflects the extent
to which it is able to provide rising prosperity to its citi-
zens. Since 1979, the World Economic Forum’s annual
Global Competitiveness Report s have examined the many
factors enabling national economies to achieve sustained
economic growth and long-term prosperity. Our goal
over the years has been to provide benchmarking tools
for business leaders and policymakers to identify obstacles
to improved competitiveness, stimulating discussion onstrategies to overcome them. For the past several years,
the World Economic Forum has based its competitive-
ness analysis on the Global Competitiveness Index (GCI),
a highly comprehensive index for measuring national
competitiveness, which captures the microeconomic and
macroeconomic foundations of national competitiveness.
We define competitiveness as the set of institutions,
policies, and factors that determine the level of productivity
of a country. The level of productivity, in turn, sets the
sustainable level of prosperity that can be earned by an
economy. In other words, more competitive economies
tend to be able to produce higher levels of income for
their citizens.The productivity level also determines the
rates of return obtained by investments in an economy.
Because the rates of return are the fundamental drivers
of the growth rates of the economy, a more competitive
economy is one that is likely to grow faster over the
medium to long run.
The concept of competitiveness thus involves static
and dynamic components: although the productivity of
a country clearly determines its ability to sustain a high
level of income, it is also one of the central determinants
of the returns to investment, which is one of the keyfactors explaining an economy’s growth potential.
The 12 pillars of competitiveness
The determinants of competitiveness are many and
complex. For hundreds of years, economists have tried
to understand what determines the wealth of nations.
This attempt has ranged from Adam Smith’s focus on
specialization and the division of labor to neoclassical
economists’ emphasis on investment in physical capital
and infrastructure, and, more recently, to interest in other
mechanisms such as education and training, technological
progress (whether created within the country or adopted
from abroad),1 macroeconomic stability, good gover-
nance, the rule of law, transparent and well-functioning
3
1 . 1
: T h e
G l o b a l C o m p e t i t i v e n e s s I n d e x
The Global Competitiveness Report 2008-2009 © 2008 World Economic Forum
8/2/2019 Competiveness Index
http://slidepdf.com/reader/full/competiveness-index 2/39
institutions, firm sophistication, demand conditions,
market size, and many others. Each of these conjectures
rests on solid theoretical foundations and makes common
sense.The central point, however, is that they are not
mutually exclusive—so that two or more of them could
be true at the same time. Hundreds of econometric
studies show that many of these conjectures are, in fact,
simultaneously true.2 This also can partly explain why,despite the present global financial crisis, we do not
necessarily see large swings in competitiveness ratings,
for example in the United States. Financial markets are
only one of several important components of national
competitiveness.
The GCI captures this open-ended dimension by
providing a weighted average of many different compo-
nents, each of which reflects one aspect of the complex
reality that we call competitiveness.We group all these
components into 12 pillars of economic competitiveness:
First pillar: Institutions
The institutional environment forms the framework
within which individuals, firms, and governments interact
to generate income and wealth in the economy.The
institutional framework has a strong bearing on compet-
itiveness and growth.3 It plays a central role in the ways
in which societies distribute the benefits and bear the
costs of development strategies and policies, and it influ-
ences investment decisions and the organization of pro-
duction. Owners of land, corporate shares, and even
intellectual property are unwilling to invest in the
improvement and upkeep of their property if their rights
as owners are insecure.4 Of equal importance, if property
cannot be bought and sold with the confidence that the
authorities will endorse the transaction, the market itself
will fail to generate dynamic growth.
The importance of institutions is not restricted to
the legal framework. Government attitudes toward mar-
kets and freedoms and the efficiency of its operations
are also very important: excessive bureaucracy and red
tape,5 overregulation, corruption, dishonesty in dealing
with public contracts, lack of transparency and trustwor-
thiness, or the political dependence of the judicial systemimpose significant economic costs to businesses and slow
down the process of economic development.
Although the economic literature has mainly
focused on public institutions, private institutions are
also an important element in the process of creation of
wealth.The significant corporate scandals that have
occurred over the past few years, and the present global
financial crisis, have highlighted the relevance of
accounting and reporting standards and transparency for
preventing fraud and mismanagement, ensuring good
governance, and maintaining investor and consumer
confidence.An economy is well served by businesses
that are run honestly, where managers abide by strong
ethical practices in their dealings with the government,
other firms, and the public.6 Private-sector transparency
is indispensable to business, and can be brought about
through the use of standards as well as auditing and
accounting practices that ensure access to information in
a timely manner.7
Second pillar: Infrastructure
Extensive and efficient infrastructure is an essential driver of competitiveness. It is critical for ensuring the effective
functioning of the economy, as it is an important factor
determining the location of economic activity and the
kinds of activities or sectors that can develop in a partic-
ular economy.Well-developed infrastructure reduces the
effect of distance between regions, with the result of
truly integrating the national market and connecting it
to markets in other countries and regions. In addition,
the quality and extensiveness of infrastructure networks
significantly impact economic growth and reduce
income inequalities and poverty in a variety of ways.8
Inthis regard, a well-developed transport and communica-
tions infrastructure network is a prerequisite for the
ability of less-developed communities to connect to
core economic activities and schools.
Effective modes of transport for goods, people, and
services—such as quality roads, railroads, ports, and air
transport—enable entrepreneurs to get their goods to
market in a secure and timely manner, and facilitate
the movement of workers to the most suitable jobs.
Economies also depend on electricity supplies that are
free of interruptions and shortages so that businesses
and factories can work unimpeded. Finally, a solid and
extensive telecommunications network allows for a
rapid and free flow of information, which increases
overall economic efficiency by helping to ensure that
decisions made by economic actors take into account
all available relevant information.
Third pillar: Macroeconomic stability
The stability of the macroeconomic environment is
important for business and, therefore, is important for
the overall competitiveness of a country.9 Although it is
certainly true that macroeconomic stability alone cannotincrease the productivity of a nation, it is also recognized
that macroeconomic disarray harms the economy. Firms
cannot make informed decisions when inflation is raging
out of control.The government cannot provide services
efficiently if it has to make high-interest payments on its
past debts. In sum, the economy cannot grow unless the
macro environment is stable.
Fourth pillar: Health and primary education
A healthy workforce is vital to a country’s competitiveness
and productivity.Workers who are ill cannot function to
their potential, and will be less productive. Poor health
leads to significant costs to business, as sick workers
are often absent or operate at lower levels of efficiency.
4
1 . 1
: T h e
G l o b a l C o m p e t i t i v e n e s s I n d e x
The Global Competitiveness Report 2008-2009 © 2008 World Economic Forum
8/2/2019 Competiveness Index
http://slidepdf.com/reader/full/competiveness-index 3/39
Investment in the provision of health services is thus
critical for clear economic, as well as moral, considera-
tions.10
In addition to health, this pillar takes into account
the quantity and quality of basic education received by
the population, which is increasingly important in
today’s economy. Basic education increases the efficiency
of each individual worker.Moreover, a workforce thathas received little formal education can carry out only
basic manual work and finds it much more difficult to
adapt to more advanced production processes and tech-
niques. Lack of basic education can therefore become a
constraint on business development, with firms finding
it difficult to move up the value chain by producing
more sophisticated or value-intensive products.
Fifth pillar: Higher education and training
Quality higher education and training is crucial for
economies that want to move up the value chain beyondsimple production processes and products.11 In particular,
today’s globalizing economy requires economies to nur-
ture pools of well-educated workers who are able to
adapt rapidly to their changing environment.This pillar
measures secondary and tertiary enrollment rates as well
as the quality of education as assessed by the business
community.The extent of staff training is also taken into
consideration because of the importance of vocational
and continuous on-the-job training—which is neglected
in many economies—for ensuring a constant upgrading
of workers’ skills to the changing needs of the evolving
economy.
Sixth pillar: Goods market efficiency
Countries with efficient goods markets are well positioned
to produce the right mix of products and services given
supply-and-demand conditions, as well as to ensure that
these goods can be most effectively traded in the econo-
my. Healthy market competition, both domestic and for-
eign, is important in driving market efficiency and thus
business productivity, by ensuring that the most efficient
firms, producing goods demanded by the market, are
those that thrive.The best possible environment for theexchange of goods requires a minimum of impediments
to business activity through government intervention to
be in place. For example, competitiveness is hindered by
distortionary or burdensome taxes, and by restrictive and
discriminatory rules on foreign ownership or foreign
direct investment (FDI). Market efficiency also depends
on demand conditions such as customer orientation and
buyer sophistication. For cultural reasons, customers in
some countries may be more demanding than in others.
This can create an important competitive advantage, as
it forces companies to be more innovative and customer-
oriented and thus imposes the discipline necessary for
efficiency to be achieved in the market.
Seventh pillar: Labor market efficiency
The efficiency and flexibility of the labor market are
critical for ensuring that workers are allocated to their
most efficient use in the economy, and provided with
incentives to give their best effort in their jobs. Labor
markets must therefore have the flexibility to shift work-
ers from one economic activity to another rapidly and
at low cost, and to allow for wage fluctuations withoutmuch social disruption.Efficient labor markets must also
ensure a clear relationship between worker incentives
and their efforts, as well as the best use of available talent
—which includes equity in the business environment
between women and men.
Eighth pillar: Financial market sophistication
The present global financial crisis has highlighted the
critical importance of financial markets for the function-
ing of national economies.An efficient financial sector is
necessary to allocate the resources saved by a nation’scitizens as well as those entering the economy from
abroad to their most productive uses. It channels
resources to the entrepreneurial or investment projects
with the highest expected rates of return, rather than to
the politically connected.A thorough assessment of risk
is therefore a key ingredient.
Business investment is critical to productivity.
Therefore economies require sophisticated financial
markets that can make capital available for private-sector
investment from such sources as loans from a sound
banking sector, well-regulated securities exchanges, ven-
ture capital, and other financial products.An efficient
financial sector also ensures that innovators with good
ideas have the financial resources to turn those ideas
into commercially viable products and services. In order
to fulfill all those functions, the banking sector needs to
be trustworthy and transparent.12
Ninth pillar: Technological readiness
This pillar measures the agility with which an economy
adopts existing technologies to enhance the productivity
of its industries.13 In today’s globalized world, technology
has increasingly become an important element for firmsto compete and prosper. In particular, information and
communication technologies (ICT) have evolved into
the “general purpose technology” of our time,14 given
the critical spillovers to the other economic sectors and
their role as efficient infrastructure for commercial
transactions.Therefore ICT access (including the pres-
ence of an ICT-friendly regulatory framework) and
usage are included in the pillar as essential components
of economies’ overall level of technological readiness.
Whether the technology used has or has not been
developed within national borders is irrelevant for its
effect on competitiveness.The central point is that the
firms operating in the country have access to advanced
products and blueprints and the ability to use them.
That is, it does not matter whether the personal
5
1 . 1
: T h e
G l o b a l C o m p e t i t i v e n e s s I n d e x
The Global Competitiveness Report 2008-2009 © 2008 World Economic Forum
8/2/2019 Competiveness Index
http://slidepdf.com/reader/full/competiveness-index 4/39
computer or the Internet was invented in a particular
country.What is important is that these inventions are
available to the business community.This does not mean
that the process of innovation is irrelevant. However, the
level of technology available to firms in a country needs
to be distinguished from the country’s ability to inno-
vate and expand the frontiers of knowledge.That is why
we separate technological readiness from innovation,which is captured in the 12th pillar below.
Tenth pillar: Market size
The size of the market affects productivity because large
markets allow firms to exploit economies of scale.
Traditionally, the markets available to firms have been
constrained by national borders. In the era of globaliza-
tion, international markets have become a substitute for
domestic markets, especially for small countries.There is
vast empirical evidence that shows that trade openness is
positively associated with growth. Even if some recentresearch casts doubts on the robustness of this relation-
ship, the general sense is that trade has a positive effect
on growth, especially for countries with small domestic
markets.15
Thus, exports can be thought of as a substitute for
domestic demand in determining the size of the market
for the firms of a country.16 By including both domestic
and foreign markets in our measure of market size, we
give credit to export-driven economies and geographic
areas (such as the European Union) that are broken into
many countries but have one common market.
Eleventh pillar: Business sophistication
Business sophistication is conducive to higher efficiency
in the production of goods and services.This leads, in
turn, to increased productivity, thus enhancing a nation’s
competitiveness. Business sophistication concerns the
quality of a country’s overall business networks as well as
the quality of individual firms’ operations and strategies.
It is particularly important for countries at an advanced
stage of development, when the more basic sources of
productivity improvements have been exhausted to a
large extent.The quality of a country’s business networks and
supporting industries, which we capture by using vari-
ables on the quantity and quality of local suppliers and
the extent of their interaction, is important for a variety
of reasons.When companies and suppliers from a partic-
ular sector are interconnected in geographically proxi-
mate groups (“clusters”), efficiency is heightened,
greater opportunities for innovation are created, and
barriers to entry for new firms are reduced. Individual
firms’ operations and strategies (branding, marketing, the
presence of a value chain, and the production of unique
and sophisticated products) all lead to sophisticated and
modern business processes.
Twelfth pillar: Innovation
The last pillar of competitiveness is technological inno-
vation.Although substantial gains can be obtained by
improving institutions, building infrastructures, reducing
macroeconomic instability,or improving the human cap-
ital of the population, all these factors eventually seem to
run into diminishing returns.The same is true for the
efficiency of the labor, financial, and goods markets. Inthe long run, standards of living can be expanded only
with technological innovation. Innovation is particularly
important for economies as they approach the frontiers
of knowledge and the possibility of integrating and
adapting exogenous technologies tends to disappear.17
Although less-advanced countries can still improve
their productivity by adopting existing technologies or
making incremental improvements in other areas, for
countries that have reached the innovation stage of
development, this is no longer sufficient to increase pro-
ductivity. Firms in these countries must design anddevelop cutting-edge products and processes to maintain
a competitive edge.This requires an environment that is
conducive to innovative activity, supported by both the
public and the private sectors. In particular, this means
sufficient investment in research and development
(R&D) especially by the private sector, the presence of
high-quality scientific research institutions, extensive
collaboration in research between universities and indus-
try, and the protection of intellectual property.
The interrelation of the 12 pillars
Although the 12 pillars of competitiveness are described
separately, this should not obscure the fact that they are
not independent: not only they are related to each other,
but they tend to reinforce each other. For example,
innovation (12th pillar) is not possible in a world with-
out institutions (1st pillar) that guarantee intellectual
property rights, cannot be performed in countries with
poorly educated and poorly trained labor force (5th
pillar), and will never take place in economies with
inefficient markets (6th, 7th, and 8th pillars) or without
extensive and efficient infrastructure (2nd pillar).
Although the actual construction of the Index willinvolve the aggregation of the 12 pillars into a single
index, measures are reported for the 12 pillars separately
because offering a more disaggregated analysis can be
more useful to countries and practitioners: such an
analysis gets closer to the actual areas in which a partic-
ular country needs to improve.
6
1 . 1
: T h e
G l o b a l C o m p e t i t i v e n e s s I n d e x
The Global Competitiveness Report 2008-2009 © 2008 World Economic Forum
8/2/2019 Competiveness Index
http://slidepdf.com/reader/full/competiveness-index 5/39
Stages of development and the weighted IndexIt is clear that different pillars affect different countries
differently: the best way for Chad to improve its com-
petitiveness is not the same as the best way for the
United States.This is because Chad and the United
States are in different stages of development: as countries
move along the development path, wages tend to
increase and, in order to sustain this higher income,
labor productivity must improve.18
According to the GCI, in the first stage, the econo-
my is factor-driven and countries compete based on their
factor endowments, primarily unskilled labor and natu-
ral resources.Companies compete on the basis of price
and sell basic products or commodities, with their low
productivity reflected in low wages.Maintaining com-
petitiveness at this stage of development hinges primari-
ly on well-functioning public and private institutions
(pillar 1), well-developed infrastructure (pillar 2), a stable
macroeconomic framework (pillar 3), and a healthy and
literate workforce (pillar 4).
As wages rise with advancing development, coun-
tries move into the efficiency-driven stage of development,
when they must begin to develop more efficient pro-
duction processes and increase product quality.At thispoint, competitiveness is increasingly driven by higher
education and training (pillar 5), efficient goods markets
(pillar 6), well-functioning labor markets (pillar 7),
sophisticated financial markets (pillar 8), a large domesticor foreign market (pillar 10), and the ability to harness
the benefits of existing technologies (pillar 9).
Finally, as countries move into the innovation-driven
stage, they are able to sustain higher wages and the asso-
ciated standard of living only if their businesses are able
to compete with new and unique products.At this stage,
companies must compete through innovation (pillar 12),
producing new and different goods using the most
sophisticated production processes (pillar 11).
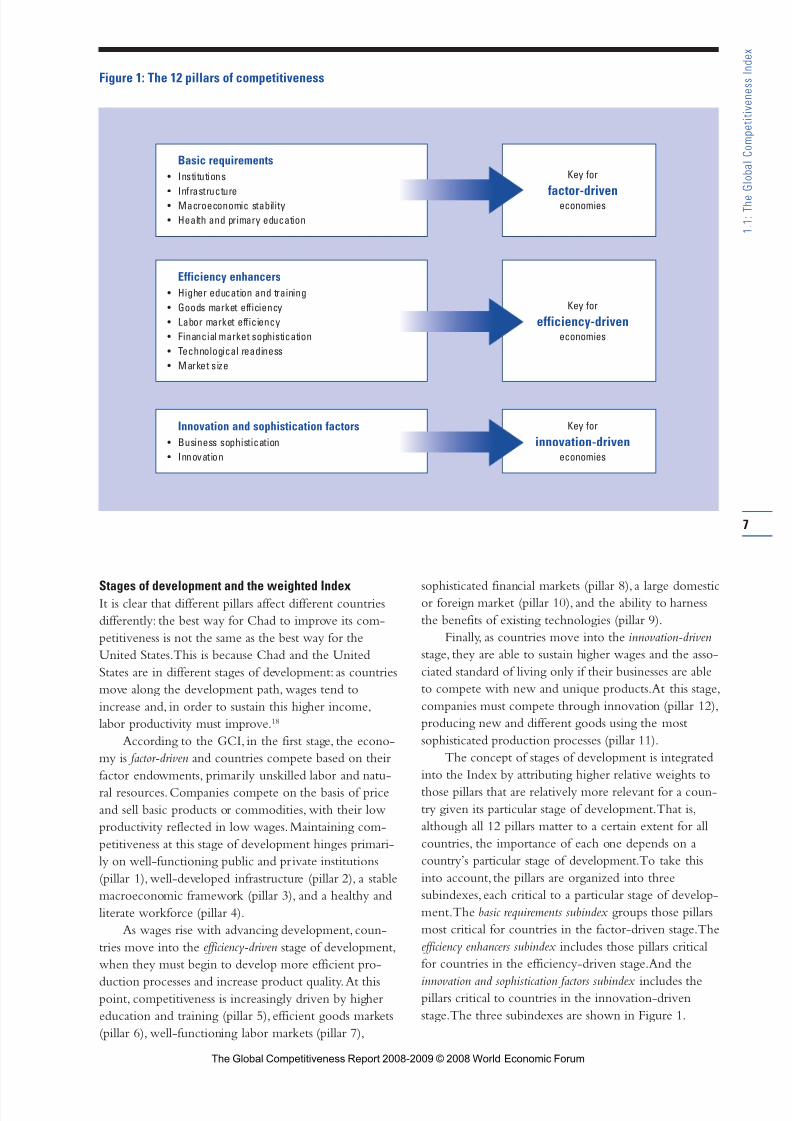
The concept of stages of development is integrated
into the Index by attributing higher relative weights to
those pillars that are relatively more relevant for a coun-
try given its particular stage of development.That is,
although all 12 pillars matter to a certain extent for all
countries, the importance of each one depends on a
country’s particular stage of development.To take this
into account, the pillars are organized into three
subindexes, each critical to a particular stage of develop-
ment.The basic requirements subindex groups those pillars
most critical for countries in the factor-driven stage.The
efficiency enhancers subindex includes those pillars critical
for countries in the efficiency-driven stage.And the
innovation and sophistication factors subindex includes thepillars critical to countries in the innovation-driven
stage.The three subindexes are shown in Figure 1.
7
1 . 1
: T h e
G l o b a l C o m p e t i t i v e n e s s I n d e x
Figure 1: The 12 pillars of competitiveness
Basic requirements
• Institutions
• Infrastructure• Macroeconomic stability
• Health and primary education
Efficiency enhancers
• Higher education and training
• Goods market efficiency
• Labor market efficiency
• Financial market sophistication
• Technological readiness
• Market size
Innovation and sophistication factors
• Business sophistication
• Innovation
Key for
factor-driveneconomies
Key for
efficiency-driveneconomies
Key for
innovation-driveneconomies
The Global Competitiveness Report 2008-2009 © 2008 World Economic Forum
8/2/2019 Competiveness Index
http://slidepdf.com/reader/full/competiveness-index 6/39
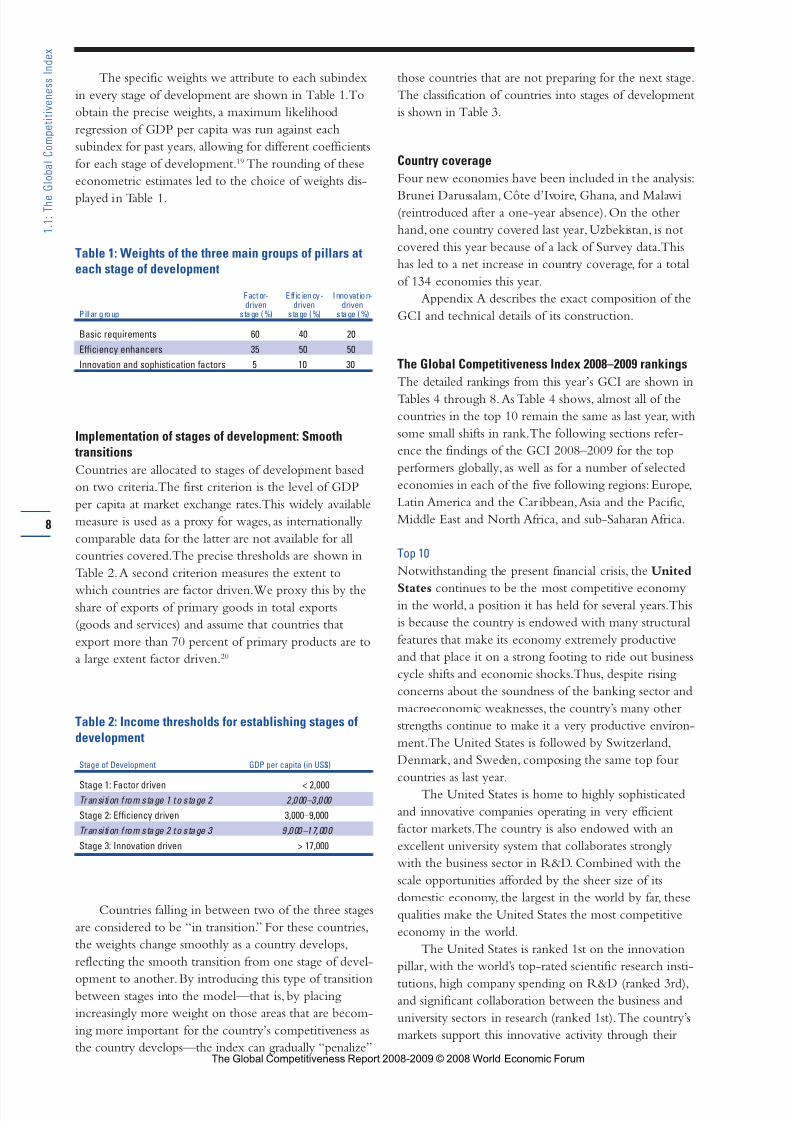
The specific weights we attribute to each subindex
in every stage of development are shown in Table 1.To
obtain the precise weights, a maximum likelihood
regression of GDP per capita was run against each
subindex for past years, allowing for different coefficients
for each stage of development.19 The rounding of these
econometric estimates led to the choice of weights dis-
played in Table 1.
Table 1: Weights of the three main groups of pillars ateach stage of development
Factor- Eff ic iency- Innovat ion-driven driven driven
Pillar group stage (%) stage (%) stage (%)
Basic requirements 60 40 20
Efficiency enhancers 35 50 50
Innovation and sophistication factors 5 10 30
Implementation of stages of development: Smooth transitions
Countries are allocated to stages of development based
on two criteria.The first criterion is the level of GDP
per capita at market exchange rates.This widely available
measure is used as a proxy for wages, as internationally
comparable data for the latter are not available for all
countries covered.The precise thresholds are shown in
Table 2.A second criterion measures the extent to
which countries are factor driven.We proxy this by theshare of exports of primary goods in total exports
(goods and services) and assume that countries that
export more than 70 percent of primary products are to
a large extent factor driven.20
Table 2: Income thresholds for establishing stages ofdevelopment
Stage of Development GDP per capita (in US$)
Stage 1: Factor driven < 2,000Transi tion from stage 1 to stage 2 2,000–3,000
Stage 2: Efficiency driven 3,000–9,000
Transi tion from stage 2 to stage 3 9,000–17,000
Stage 3: Innovation driven > 17,000
Countries falling in between two of the three stages
are considered to be “in transition.” For these countries,
the weights change smoothly as a country develops,
reflecting the smooth transition from one stage of devel-
opment to another.By introducing this type of transitionbetween stages into the model—that is, by placing
increasingly more weight on those areas that are becom-
ing more important for the country’s competitiveness as
the country develops—the index can gradually “penalize”
those countries that are not preparing for the next stage.
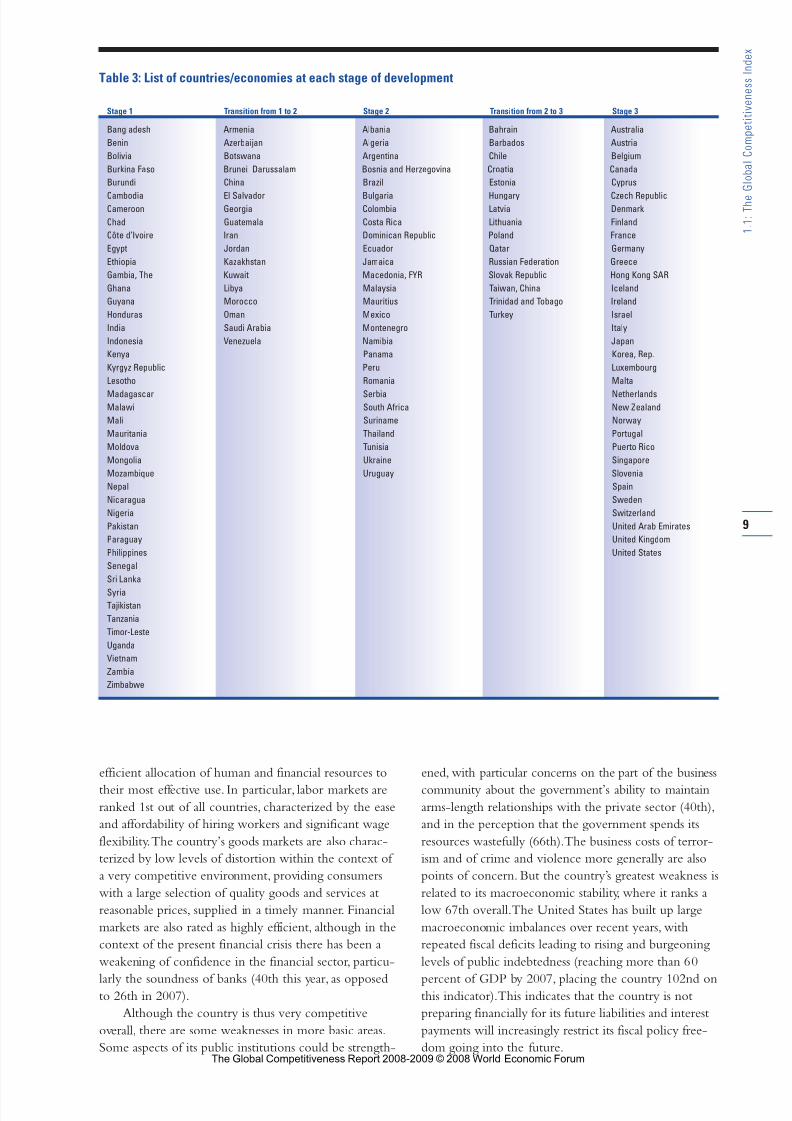
The classification of countries into stages of development
is shown in Table 3.
Country coverage
Four new economies have been included in the analysis:
Brunei Darussalam, Côte d’Ivoire, Ghana, and Malawi(reintroduced after a one-year absence). On the other
hand,one country covered last year,Uzbekistan, is not
covered this year because of a lack of Survey data.This
has led to a net increase in country coverage, for a total
of 134 economies this year.
Appendix A describes the exact composition of the
GCI and technical details of its construction.
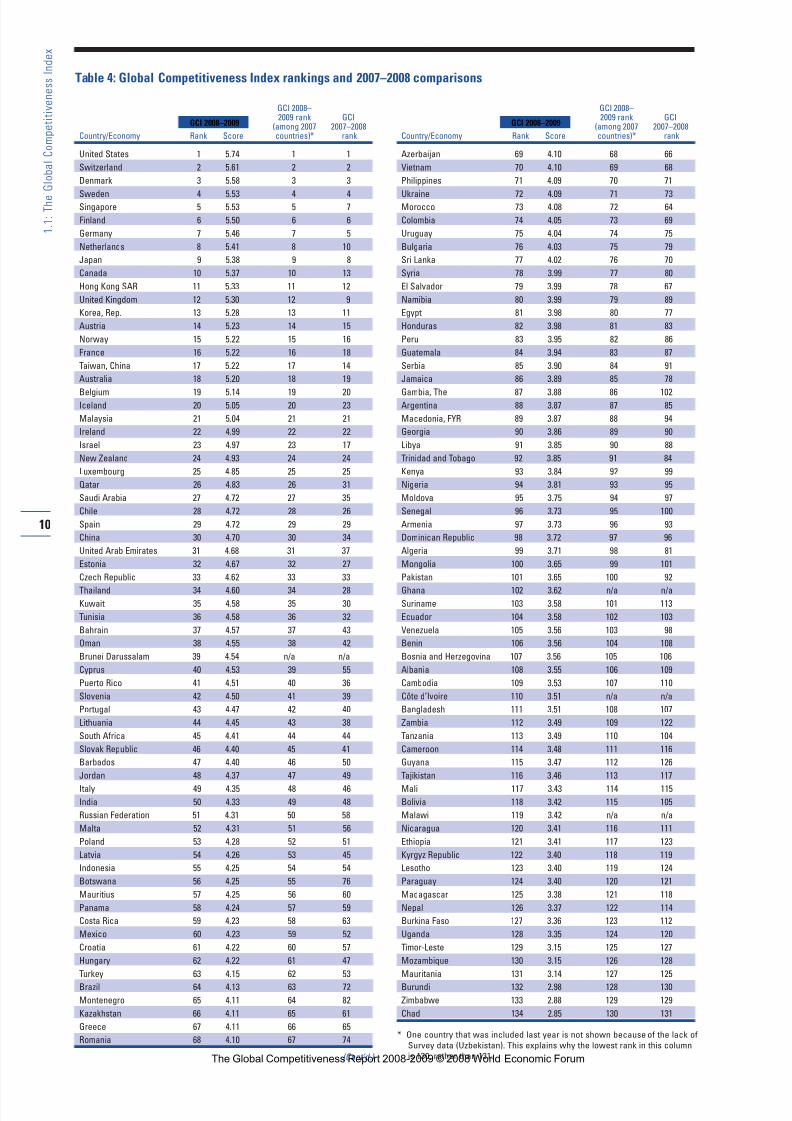
The Global Competitiveness Index 2008–2009 rankings
The detailed rankings from this year’s GCI are shown in
Tables 4 through 8.As Table 4 shows, almost all of the
countries in the top 10 remain the same as last year, with
some small shifts in rank.The following sections refer-
ence the findings of the GCI 2008–2009 for the top
performers globally, as well as for a number of selected
economies in each of the five following regions: Europe,
Latin America and the Car ibbean,Asia and the Pacific,
Middle East and North Africa, and sub-Saharan Africa.
Top 10
Notwithstanding the present financial crisis, the United
States continues to be the most competitive economyin the world, a position it has held for several years.This
is because the country is endowed with many structural
features that make its economy extremely productive
and that place it on a strong footing to ride out business
cycle shifts and economic shocks.Thus, despite rising
concerns about the soundness of the banking sector and
macroeconomic weaknesses, the country’s many other
strengths continue to make it a very productive environ-
ment.The United States is followed by Switzerland,
Denmark, and Sweden, composing the same top four
countries as last year.
The United States is home to highly sophisticated
and innovative companies operating in very efficient
factor markets.The country is also endowed with an
excellent university system that collaborates strongly
with the business sector in R&D. Combined with the
scale opportunities afforded by the sheer size of its
domestic economy, the largest in the world by far, these
qualities make the United States the most competitive
economy in the world.
The United States is ranked 1st on the innovation
pillar, with the world’s top-rated scientific research insti-
tutions, high company spending on R&D (ranked 3rd),and significant collaboration between the business and
university sectors in research (ranked 1st).The country’s
markets support this innovative activity through their
8
1 . 1
: T h e
G l o b a l C o m p e t i t i v e n e s s I n d e x
The Global Competitiveness Report 2008-2009 © 2008 World Economic Forum
8/2/2019 Competiveness Index
http://slidepdf.com/reader/full/competiveness-index 7/39
efficient allocation of human and financial resources to
their most effective use. In particular, labor markets are
ranked 1st out of all countries, characterized by the ease
and affordability of hiring workers and significant wage
flexibility.The country’s goods markets are also charac-
terized by low levels of distortion within the context of
a very competitive environment, providing consumers
with a large selection of quality goods and services at
reasonable prices, supplied in a timely manner. Financial
markets are also rated as highly efficient, although in the
context of the present financial crisis there has been a
weakening of confidence in the financial sector, particu-
larly the soundness of banks (40th this year, as opposedto 26th in 2007).
Although the country is thus very competitive
overall, there are some weaknesses in more basic areas.
Some aspects of its public institutions could be strength-
ened, with particular concerns on the part of the business
community about the government’s ability to maintain
arms-length relationships with the private sector (40th),
and in the perception that the government spends its
resources wastefully (66th).The business costs of terror-
ism and of crime and violence more generally are also
points of concern. But the country’s greatest weakness is
related to its macroeconomic stability, where it ranks a
low 67th overall.The United States has built up large
macroeconomic imbalances over recent years, with
repeated fiscal deficits leading to rising and burgeoning
levels of public indebtedness (reaching more than 60
percent of GDP by 2007, placing the country 102nd onthis indicator).This indicates that the country is not
preparing financially for its future liabilities and interest
payments will increasingly restrict its fiscal policy free-
dom going into the future.
9
1 . 1
: T h e
G l o b a l C o m p e t i t i v e n e s s I n d e x
Table 3: List of countries/economies at each stage of development
Stage 1 Transition from 1 to 2 Stage 2 Transition from 2 to 3 Stage 3
Bangladesh Armenia Albania Bahrain Australia
Benin Azerbaijan Algeria Barbados Austria
Bolivia Botswana Argentina Chile Belgium
Burkina Faso Brunei Darussalam Bosnia and Herzegovina Croatia Canada
Burundi China Brazil Estonia Cyprus
Cambodia El Salvador Bulgaria Hungary Czech RepublicCameroon Georgia Colombia Latvia Denmark
Chad Guatemala Costa Rica Lithuania Finland
Côte d’Ivoire Iran Dominican Republic Poland France
Egypt Jordan Ecuador Qatar Germany
Ethiopia Kazakhstan Jamaica Russian Federation Greece
Gambia, The Kuwait Macedonia, FYR Slovak Republic Hong Kong SAR
Ghana Libya Malaysia Taiwan, China Iceland
Guyana Morocco Mauritius Trinidad and Tobago Ireland
Honduras Oman Mexico Turkey Israel
India Saudi Arabia Montenegro Italy
Indonesia Venezuela Namibia Japan
Kenya Panama Korea, Rep.
Kyrgyz Republic Peru Luxembourg
Lesotho Romania Malta
Madagascar Serbia NetherlandsMalawi South Africa New Zealand
Mali Suriname Norway
Mauritania Thailand Portugal
Moldova Tunisia Puerto Rico
Mongolia Ukraine Singapore
Mozambique Uruguay Slovenia
Nepal Spain
Nicaragua Sweden
Nigeria Switzerland
Pakistan United Arab Emirates
Paraguay United Kingdom
Philippines United States
Senegal
Sri Lanka
Syria
Tajikistan
Tanzania
Timor-Leste
Uganda
Vietnam
Zambia
Zimbabwe
The Global Competitiveness Report 2008-2009 © 2008 World Economic Forum
8/2/2019 Competiveness Index
http://slidepdf.com/reader/full/competiveness-index 8/39
10
1 . 1
: T h e
G l o b a l C o m p e t i t i v e n e s s I n d e x
GCI 2008–2009 rank GCI
(among 2007 2007–2008Country/Economy Rank Score countries)* rank
United States 1 5.74 1 1
Switzerland 2 5.61 2 2
Denmark 3 5.58 3 3
Sweden 4 5.53 4 4Singapore 5 5.53 5 7
Finland 6 5.50 6 6
Germany 7 5.46 7 5
Netherlands 8 5.41 8 10
Japan 9 5.38 9 8
Canada 10 5.37 10 13
Hong Kong SAR 11 5.33 11 12
United Kingdom 12 5.30 12 9
Korea, Rep. 13 5.28 13 11
Austria 14 5.23 14 15
Norway 15 5.22 15 16
France 16 5.22 16 18
Taiwan, China 17 5.22 17 14
Australia 18 5.20 18 19
Belgium 19 5.14 19 20Iceland 20 5.05 20 23
Malaysia 21 5.04 21 21
Ireland 22 4.99 22 22
Israel 23 4.97 23 17
New Zealand 24 4.93 24 24
Luxembourg 25 4.85 25 25
Qatar 26 4.83 26 31
Saudi Arabia 27 4.72 27 35
Chile 28 4.72 28 26
Spain 29 4.72 29 29
China 30 4.70 30 34
United Arab Emirates 31 4.68 31 37
Estonia 32 4.67 32 27
Czech Republic 33 4.62 33 33
Thailand 34 4.60 34 28Kuwait 35 4.58 35 30
Tunisia 36 4.58 36 32
Bahrain 37 4.57 37 43
Oman 38 4.55 38 42
Brunei Darussalam 39 4.54 n/a n/a
Cyprus 40 4.53 39 55
Puerto Rico 41 4.51 40 36
Slovenia 42 4.50 41 39
Portugal 43 4.47 42 40
Lithuania 44 4.45 43 38
South Africa 45 4.41 44 44
Slovak Republic 46 4.40 45 41
Barbados 47 4.40 46 50
Jordan 48 4.37 47 49
Italy 49 4.35 48 46
India 50 4.33 49 48
Russian Federation 51 4.31 50 58
Malta 52 4.31 51 56
Poland 53 4.28 52 51
Latvia 54 4.26 53 45
Indonesia 55 4.25 54 54
Botswana 56 4.25 55 76
Mauritius 57 4.25 56 60
Panama 58 4.24 57 59
Costa Rica 59 4.23 58 63
Mexico 60 4.23 59 52
Croatia 61 4.22 60 57
Hungary 62 4.22 61 47
Turkey 63 4.15 62 53
Brazil 64 4.13 63 72
Montenegro 65 4.11 64 82
Kazakhstan 66 4.11 65 61
Greece 67 4.11 66 65
Romania 68 4.10 67 74
(Cont’d.)
GCI 2008–2009 rank GCI
(among 2007 2007–2008Country/Economy Rank Score countries)* rank
Azerbaijan 69 4.10 68 66
Vietnam 70 4.10 69 68
Philippines 71 4.09 70 71
Ukraine 72 4.09 71 73Morocco 73 4.08 72 64
Colombia 74 4.05 73 69
Uruguay 75 4.04 74 75
Bulgaria 76 4.03 75 79
Sri Lanka 77 4.02 76 70
Syria 78 3.99 77 80
El Salvador 79 3.99 78 67
Namibia 80 3.99 79 89
Egypt 81 3.98 80 77
Honduras 82 3.98 81 83
Peru 83 3.95 82 86
Guatemala 84 3.94 83 87
Serbia 85 3.90 84 91
Jamaica 86 3.89 85 78
Gambia, The 87 3.88 86 102Argentina 88 3.87 87 85
Macedonia, FYR 89 3.87 88 94
Georgia 90 3.86 89 90
Libya 91 3.85 90 88
Trinidad and Tobago 92 3.85 91 84
Kenya 93 3.84 92 99
Nigeria 94 3.81 93 95
Moldova 95 3.75 94 97
Senegal 96 3.73 95 100
Armenia 97 3.73 96 93
Dominican Republic 98 3.72 97 96
Algeria 99 3.71 98 81
Mongolia 100 3.65 99 101
Pakistan 101 3.65 100 92
Ghana 102 3.62 n/a n/aSuriname 103 3.58 101 113
Ecuador 104 3.58 102 103
Venezuela 105 3.56 103 98
Benin 106 3.56 104 108
Bosnia and Herzegovina 107 3.56 105 106
Albania 108 3.55 106 109
Cambodia 109 3.53 107 110
Côte d’Ivoire 110 3.51 n/a n/a
Bangladesh 111 3.51 108 107
Zambia 112 3.49 109 122
Tanzania 113 3.49 110 104
Cameroon 114 3.48 111 116
Guyana 115 3.47 112 126
Tajikistan 116 3.46 113 117
Mali 117 3.43 114 115
Bolivia 118 3.42 115 105
Malawi 119 3.42 n/a n/a
Nicaragua 120 3.41 116 111
Ethiopia 121 3.41 117 123
Kyrgyz Republic 122 3.40 118 119
Lesotho 123 3.40 119 124
Paraguay 124 3.40 120 121
Madagascar 125 3.38 121 118
Nepal 126 3.37 122 114
Burkina Faso 127 3.36 123 112
Uganda 128 3.35 124 120
Timor-Leste 129 3.15 125 127
Mozambique 130 3.15 126 128
Mauritania 131 3.14 127 125
Burundi 132 2.98 128 130
Zimbabwe 133 2.88 129 129
Chad 134 2.85 130 131
* One country that was included last year is not shown because of the lack of
Survey data (Uzbekistan). This explains why the lowest rank in this column
is 130, rather than 131.
Table 4: Global Competitiveness Index rankings and 2007–2008 comparisons
GCI 2008–2009 GCI 2008–2009
The Global Competitiveness Report 2008-2009 © 2008 World Economic Forum
8/2/2019 Competiveness Index
http://slidepdf.com/reader/full/competiveness-index 9/39
Switzerland retains the same ranking as last year,
second only to the United States. Similar to the United
States, Switzerland’s economy is characterized by an
excellent capacity for innovation and a very sophisticated
business culture, ranked 2nd for its business sophistication
and 3rd for its innovation capacity.The country is char-
acterized by high spending on R&D. Switzerland’s sci-
entific research institutions are among the world’s best,and the strong collaboration between the academic and
business sectors ensures that much of this research is
translated into marketable products and processes, but-
tressed by strong intellectual property protection.This
strong innovative capacity is captured by the high rate of
patenting in the country, for which Switzerland ranks
6th worldwide on a per capita basis.
Switzerland’s public institutions are rated among the
most effective and transparent in the world (4th), ensuring
a level playing field and enhancing business confidence,
including an independent judiciary, a strong rule of law,and strong accountability of the public sector. Competi-
tiveness is also buttressed by excellent infrastructure and
labor markets that are among the most flexible in the
world, both ranked 3rd overall.And Switzerland’s
macroeconomic environment receives excellent marks
(ranked 10th), attributable to a government budget sur-
plus, high national savings, low interest rates, and low
inflation at a time when inflation is rising around the
world.
On the other hand, the relatively low university
enrollment rate—just shy of 46 percent—places the
country 45th on this indicator.Efforts should be made
to boost higher education attainment to provide more
home-grown talent with the necessary skills for innova-
tive activities.
The Nordic members of the European Union con-
tinue to hold privileged positions in the rankings.
Denmark is ranked 3rd, with Sweden and Finland
following closely at 4th and 6th places, respectively, the
same rankings as last year for all three countries. As in
past years, the Nordic countries outperform the United
States in a number of areas. For example, like
Switzerland they receive among the best marks world-wide in terms of the macroeconomic environment, as
they are also running healthy budget surpluses and have
achieved very low levels of public indebtedness.The
three countries have among the best functioning and
most transparent institutions in the world, ranked only
behind Singapore on this pillar.
Given the significant focus that the Nordic countries
have placed on higher education and training over
recent decades, it is not surprising that Finland, Denmark,
and Sweden continue to occupy the top three positions
in the higher education and training pillar.This has
provided the workforce with the skills needed to adapt
rapidly to a changing environment and has laid the
ground for their high levels of technological adoption
and innovation in recent years.
A marked difference among these three countries
relates to labor market flexibility.While Denmark
(ranked 4th) distinguishes itself as having one of the
most flexible and efficient labor markets internationally,
in Finland and Sweden, as is the case in a number of
other European countries, companies have little flexibil-
ity in setting wages, nonwage labor costs remain very
high, and firing and therefore hiring workers is deemedexcessively expensive.
Singapore, at 5th place, is the top-ranked country
from Asia on the strength of its institutional environment,
moving up two places from last year as a result of a
strengthening across all aspects of the institutional
framework. Singapore also places among the top two
countries for the efficiency of all of its markets—goods,
labor, and financial—ensuring the proper allocation of
these factors to their best use. Singapore also has world-
class infrastructure, leading the world in the quality of its
port and air transport facilities. But Singapore’s overallranking is constrained by its domestic market size and
mixed performance in the macroeconomic stability pil-
lar, where it ranks 59th and 121st for its interest rate
spread and government debt, respectively.
Germany remains among the top-10 ranked
countries, although it slips two positions to 7th place.
The country is ranked 1st for the quality of infrastruc-
ture, with particularly good marks for its transport and
telephony infrastructure.The efficiency of its goods and
financial markets is another strength, buttressed by a
very high level of business sophistication (ranked 1st on
this pillar), although it should be noted that there has
been a measurable decline in the business sector’s assess-
ment of the country’s financial markets over the past
year.These attributes allow Germany to benefit greatly
from its significant market size (ranked 4th on this pil-
lar). On the other hand, Germany’s labor market contin-
ues to be very rigid (ranked 122nd on the labor market
flexibility subpillar), where a lack of flexibility in wage
determination, high nonwage labor costs, and the cost of
firing provide a hindrance to job creation.
The Netherlands moves up two spots to 8th place
and rounds out the list of the European countries in thetop 10.The country’s companies are highly sophisticated
and are the most aggressive internationally in absorbing
new technologies (ranked 1st for its technological readi-
ness), buttressed by an excellent educational system and
extremely efficient factor markets.The improvement in
the rankings can be traced mainly to an even better
assessment than last year of the functioning of its mar-
kets.The labor market in the Netherlands is notably
efficient compared with the situation in many other
European economies, and its goods market is ranked 3rd
for its excellent functioning.
Japan, at 9th place, enjoys a major competitive
edge in the areas of business sophistication and innova-
tion, characterized by a high availability of scientists and
engineers, high company spending on R&D, and an
11
1 . 1
: T h e
G l o b a l C o m p e t i t i v e n e s s I n d e x
The Global Competitiveness Report 2008-2009 © 2008 World Economic Forum
8/2/2019 Competiveness Index
http://slidepdf.com/reader/full/competiveness-index 10/39
12
1 . 1
: T h e
G l o b a l C o m p e t i t i v e n e s s I n d e x
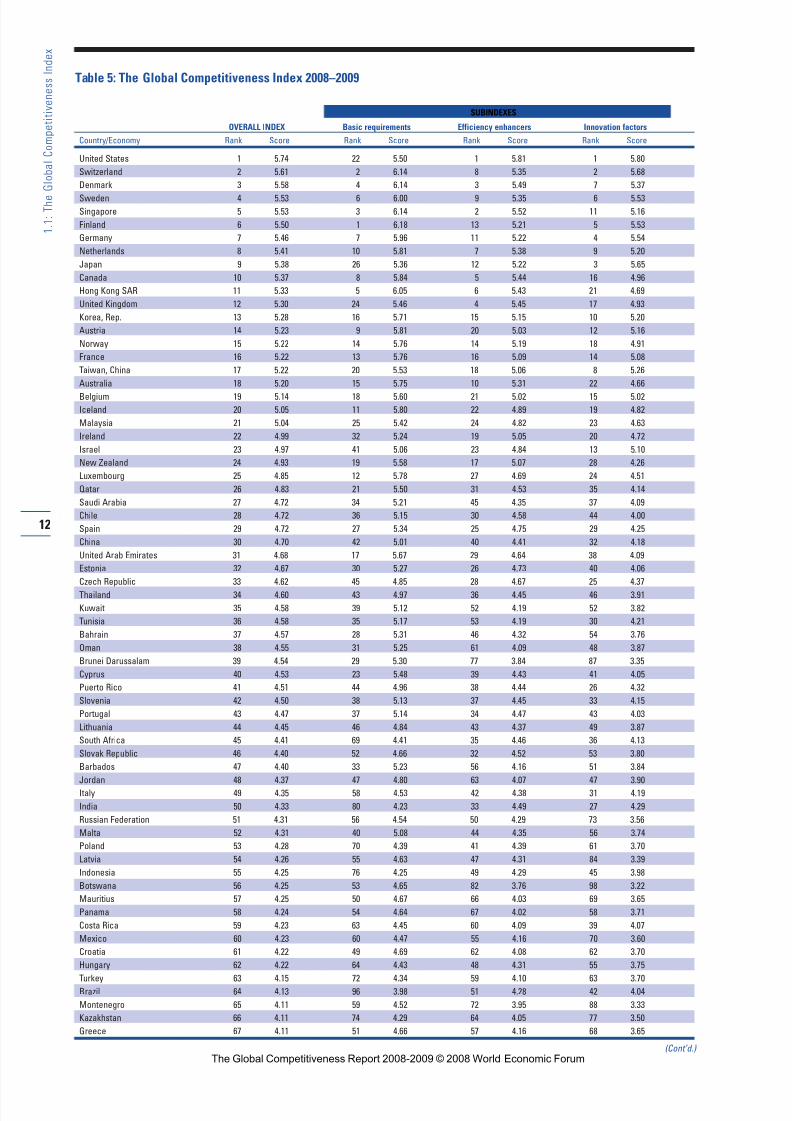
Table 5: The Global Competitiveness Index 2008–2009
SUBINDEXES
OVERALL INDEX Basic requirements Efficiency enhancers Innovation factors
Country/Economy Rank Score Rank Score Rank Score Rank Score
United States 1 5.74 22 5.50 1 5.81 1 5.80
Switzerland 2 5.61 2 6.14 8 5.35 2 5.68
Denmark 3 5.58 4 6.14 3 5.49 7 5.37
Sweden 4 5.53 6 6.00 9 5.35 6 5.53
Singapore 5 5.53 3 6.14 2 5.52 11 5.16
Finland 6 5.50 1 6.18 13 5.21 5 5.53
Germany 7 5.46 7 5.96 11 5.22 4 5.54
Netherlands 8 5.41 10 5.81 7 5.38 9 5.20
Japan 9 5.38 26 5.36 12 5.22 3 5.65
Canada 10 5.37 8 5.84 5 5.44 16 4.96
Hong Kong SAR 11 5.33 5 6.05 6 5.43 21 4.69
United Kingdom 12 5.30 24 5.46 4 5.45 17 4.93
Korea, Rep. 13 5.28 16 5.71 15 5.15 10 5.20
Austria 14 5.23 9 5.81 20 5.03 12 5.16
Norway 15 5.22 14 5.76 14 5.19 18 4.91
France 16 5.22 13 5.76 16 5.09 14 5.08
Taiwan, China 17 5.22 20 5.53 18 5.06 8 5.26
Australia 18 5.20 15 5.75 10 5.31 22 4.66
Belgium 19 5.14 18 5.60 21 5.02 15 5.02
Iceland 20 5.05 11 5.80 22 4.89 19 4.82
Malaysia 21 5.04 25 5.42 24 4.82 23 4.63
Ireland 22 4.99 32 5.24 19 5.05 20 4.72
Israel 23 4.97 41 5.06 23 4.84 13 5.10
New Zealand 24 4.93 19 5.58 17 5.07 28 4.26
Luxembourg 25 4.85 12 5.78 27 4.69 24 4.51
Qatar 26 4.83 21 5.50 31 4.53 35 4.14
Saudi Arabia 27 4.72 34 5.21 45 4.35 37 4.09
Chile 28 4.72 36 5.15 30 4.58 44 4.00
Spain 29 4.72 27 5.34 25 4.75 29 4.25
China 30 4.70 42 5.01 40 4.41 32 4.18
United Arab Emirates 31 4.68 17 5.67 29 4.64 38 4.09
Estonia 32 4.67 30 5.27 26 4.73 40 4.06
Czech Republic 33 4.62 45 4.85 28 4.67 25 4.37
Thailand 34 4.60 43 4.97 36 4.45 46 3.91
Kuwait 35 4.58 39 5.12 52 4.19 52 3.82
Tunisia 36 4.58 35 5.17 53 4.19 30 4.21
Bahrain 37 4.57 28 5.31 46 4.32 54 3.76
Oman 38 4.55 31 5.25 61 4.09 48 3.87
Brunei Darussalam 39 4.54 29 5.30 77 3.84 87 3.35
Cyprus 40 4.53 23 5.48 39 4.43 41 4.05
Puerto Rico 41 4.51 44 4.96 38 4.44 26 4.32
Slovenia 42 4.50 38 5.13 37 4.45 33 4.15
Portugal 43 4.47 37 5.14 34 4.47 43 4.03
Lithuania 44 4.45 46 4.84 43 4.37 49 3.87
South Africa 45 4.41 69 4.41 35 4.46 36 4.13
Slovak Republic 46 4.40 52 4.66 32 4.52 53 3.80
Barbados 47 4.40 33 5.23 56 4.16 51 3.84
Jordan 48 4.37 47 4.80 63 4.07 47 3.90
Italy 49 4.35 58 4.53 42 4.38 31 4.19
India 50 4.33 80 4.23 33 4.49 27 4.29
Russian Federation 51 4.31 56 4.54 50 4.29 73 3.56
Malta 52 4.31 40 5.08 44 4.35 56 3.74
Poland 53 4.28 70 4.39 41 4.39 61 3.70
Latvia 54 4.26 55 4.63 47 4.31 84 3.39
Indonesia 55 4.25 76 4.25 49 4.29 45 3.98
Botswana 56 4.25 53 4.65 82 3.76 98 3.22
Mauritius 57 4.25 50 4.67 66 4.03 69 3.65
Panama 58 4.24 54 4.64 67 4.02 58 3.71
Costa Rica 59 4.23 63 4.45 60 4.09 39 4.07
Mexico 60 4.23 60 4.47 55 4.16 70 3.60
Croatia 61 4.22 49 4.69 62 4.08 62 3.70
Hungary 62 4.22 64 4.43 48 4.31 55 3.75
Turkey 63 4.15 72 4.34 59 4.10 63 3.70Brazil 64 4.13 96 3.98 51 4.28 42 4.04
Montenegro 65 4.11 59 4.52 72 3.95 88 3.33
Kazakhstan 66 4.11 74 4.29 64 4.05 77 3.50
Greece 67 4.11 51 4.66 57 4.16 68 3.65
(Cont’d.) The Global Competitiveness Report 2008-2009 © 2008 World Economic Forum
8/2/2019 Competiveness Index
http://slidepdf.com/reader/full/competiveness-index 11/39
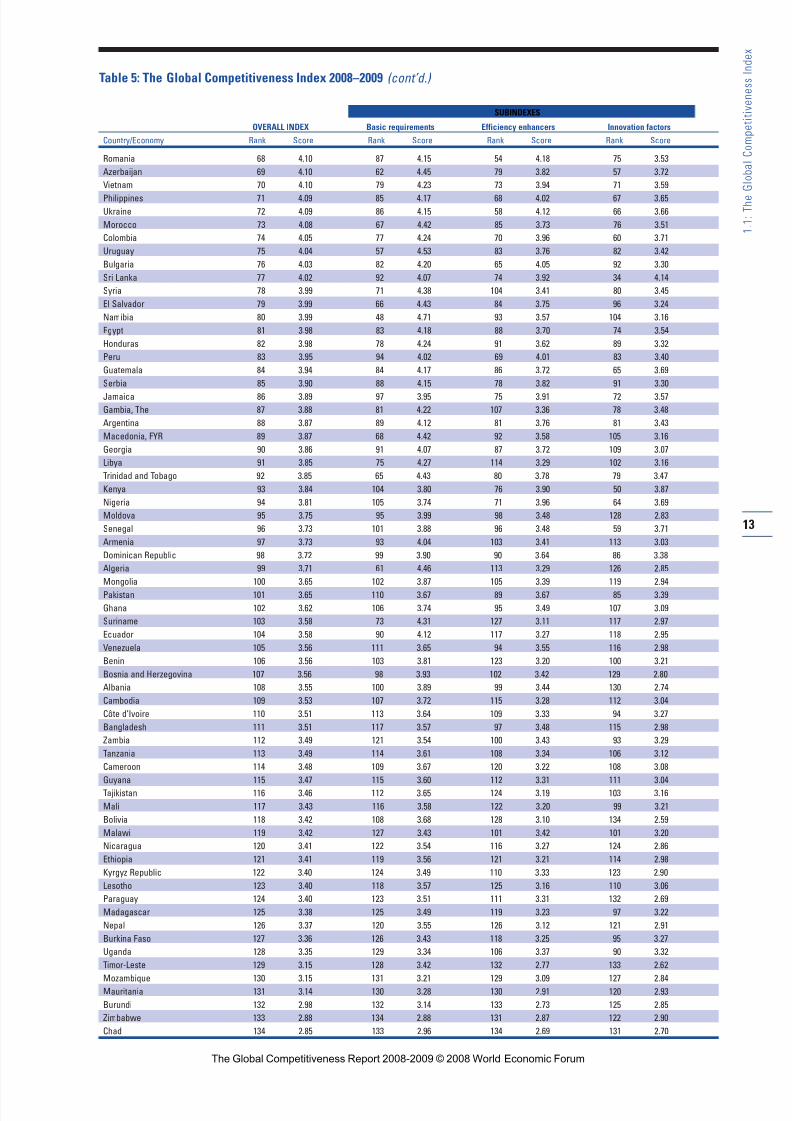
Table 5: The Global Competitiveness Index 2008–2009 (cont’d.)
SUBINDEXES
OVERALL INDEX Basic requirements Efficiency enhancers Innovation factors
Country/Economy Rank Score Rank Score Rank Score Rank Score
Romania 68 4.10 87 4.15 54 4.18 75 3.53
Azerbaijan 69 4.10 62 4.45 79 3.82 57 3.72
Vietnam 70 4.10 79 4.23 73 3.94 71 3.59
Philippines 71 4.09 85 4.17 68 4.02 67 3.65
Ukraine 72 4.09 86 4.15 58 4.12 66 3.66
Morocco 73 4.08 67 4.42 85 3.73 76 3.51
Colombia 74 4.05 77 4.24 70 3.96 60 3.71
Uruguay 75 4.04 57 4.53 83 3.76 82 3.42
Bulgaria 76 4.03 82 4.20 65 4.05 92 3.30
Sri Lanka 77 4.02 92 4.07 74 3.92 34 4.14
Syria 78 3.99 71 4.38 104 3.41 80 3.45
El Salvador 79 3.99 66 4.43 84 3.75 96 3.24
Namibia 80 3.99 48 4.71 93 3.57 104 3.16
Egypt 81 3.98 83 4.18 88 3.70 74 3.54
Honduras 82 3.98 78 4.24 91 3.62 89 3.32
Peru 83 3.95 94 4.02 69 4.01 83 3.40
Guatemala 84 3.94 84 4.17 86 3.72 65 3.69
Serbia 85 3.90 88 4.15 78 3.82 91 3.30
Jamaica 86 3.89 97 3.95 75 3.91 72 3.57
Gambia, The 87 3.88 81 4.22 107 3.36 78 3.48
Argentina 88 3.87 89 4.12 81 3.76 81 3.43
Macedonia, FYR 89 3.87 68 4.42 92 3.58 105 3.16
Georgia 90 3.86 91 4.07 87 3.72 109 3.07
Libya 91 3.85 75 4.27 114 3.29 102 3.16
Trinidad and Tobago 92 3.85 65 4.43 80 3.78 79 3.47
Kenya 93 3.84 104 3.80 76 3.90 50 3.87
Nigeria 94 3.81 105 3.74 71 3.96 64 3.69
Moldova 95 3.75 95 3.99 98 3.48 128 2.83
Senegal 96 3.73 101 3.88 96 3.48 59 3.71
Armenia 97 3.73 93 4.04 103 3.41 113 3.03
Dominican Republic 98 3.72 99 3.90 90 3.64 86 3.38
Algeria 99 3.71 61 4.46 113 3.29 126 2.85
Mongolia 100 3.65 102 3.87 105 3.39 119 2.94
Pakistan 101 3.65 110 3.67 89 3.67 85 3.39
Ghana 102 3.62 106 3.74 95 3.49 107 3.09
Suriname 103 3.58 73 4.31 127 3.11 117 2.97
Ecuador 104 3.58 90 4.12 117 3.27 118 2.95
Venezuela 105 3.56 111 3.65 94 3.55 116 2.98
Benin 106 3.56 103 3.81 123 3.20 100 3.21
Bosnia and Herzegovina 107 3.56 98 3.93 102 3.42 129 2.80
Albania 108 3.55 100 3.89 99 3.44 130 2.74
Cambodia 109 3.53 107 3.72 115 3.28 112 3.04
Côte d’Ivoire 110 3.51 113 3.64 109 3.33 94 3.27
Bangladesh 111 3.51 117 3.57 97 3.48 115 2.98
Zambia 112 3.49 121 3.54 100 3.43 93 3.29
Tanzania 113 3.49 114 3.61 108 3.34 106 3.12
Cameroon 114 3.48 109 3.67 120 3.22 108 3.08
Guyana 115 3.47 115 3.60 112 3.31 111 3.04
Tajikistan 116 3.46 112 3.65 124 3.19 103 3.16
Mali 117 3.43 116 3.58 122 3.20 99 3.21
Bolivia 118 3.42 108 3.68 128 3.10 134 2.59
Malawi 119 3.42 127 3.43 101 3.42 101 3.20
Nicaragua 120 3.41 122 3.54 116 3.27 124 2.86
Ethiopia 121 3.41 119 3.56 121 3.21 114 2.98
Kyrgyz Republic 122 3.40 124 3.49 110 3.33 123 2.90
Lesotho 123 3.40 118 3.57 125 3.16 110 3.06
Paraguay 124 3.40 123 3.51 111 3.31 132 2.69
Madagascar 125 3.38 125 3.49 119 3.23 97 3.22
Nepal 126 3.37 120 3.55 126 3.12 121 2.91
Burkina Faso 127 3.36 126 3.43 118 3.25 95 3.27
Uganda 128 3.35 129 3.34 106 3.37 90 3.32
Timor-Leste 129 3.15 128 3.42 132 2.77 133 2.62
Mozambique 130 3.15 131 3.21 129 3.09 127 2.84Mauritania 131 3.14 130 3.28 130 2.91 120 2.93
Burundi 132 2.98 132 3.14 133 2.73 125 2.85
Zimbabwe 133 2.88 134 2.88 131 2.87 122 2.90
Chad 134 2.85 133 2.96 134 2.69 131 2.70
13
1 . 1
: T h e
G l o b a l C o m p e t i t i v e n e s s I n d e x
The Global Competitiveness Report 2008-2009 © 2008 World Economic Forum
8/2/2019 Competiveness Index
http://slidepdf.com/reader/full/competiveness-index 12/39
14
1 . 1
: T h e
G l o b a l C o m p e t i t i v e n e s s I n d e x
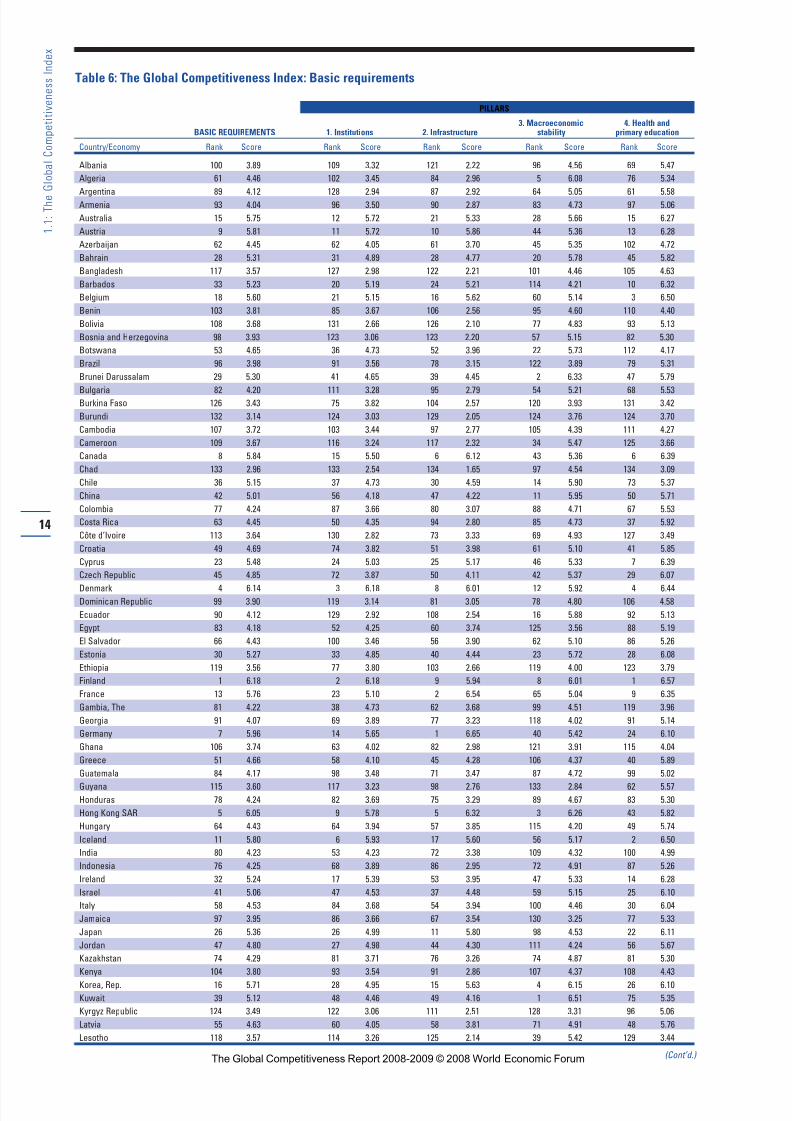
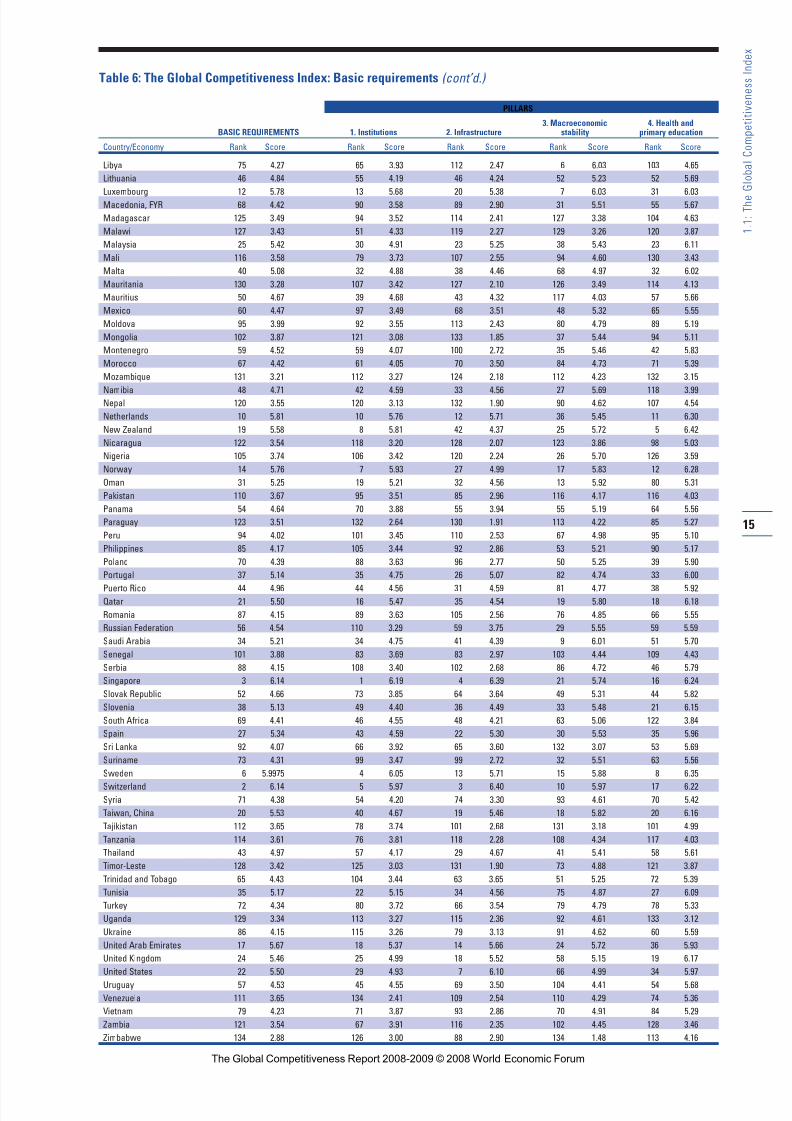
Table 6: The Global Competitiveness Index: Basic requirements
PILLARS
3. Macroeconomic 4. Health andBASIC REQUIREMENTS 1. Institutions 2. Infrastructure stability primary education
Country/Economy Rank Score Rank Score Rank Score Rank Score Rank Score
Albania 100 3.89 109 3.32 121 2.22 96 4.56 69 5.47
Algeria 61 4.46 102 3.45 84 2.96 5 6.08 76 5.34
Argentina 89 4.12 128 2.94 87 2.92 64 5.05 61 5.58Armenia 93 4.04 96 3.50 90 2.87 83 4.73 97 5.06
Australia 15 5.75 12 5.72 21 5.33 28 5.66 15 6.27
Austria 9 5.81 11 5.72 10 5.86 44 5.36 13 6.28
Azerbaijan 62 4.45 62 4.05 61 3.70 45 5.35 102 4.72
Bahrain 28 5.31 31 4.89 28 4.77 20 5.78 45 5.82
Bangladesh 117 3.57 127 2.98 122 2.21 101 4.46 105 4.63
Barbados 33 5.23 20 5.19 24 5.21 114 4.21 10 6.32
Belgium 18 5.60 21 5.15 16 5.62 60 5.14 3 6.50
Benin 103 3.81 85 3.67 106 2.56 95 4.60 110 4.40
Bolivia 108 3.68 131 2.66 126 2.10 77 4.83 93 5.13
Bosnia and Herzegovina 98 3.93 123 3.06 123 2.20 57 5.15 82 5.30
Botswana 53 4.65 36 4.73 52 3.96 22 5.73 112 4.17
Brazil 96 3.98 91 3.56 78 3.15 122 3.89 79 5.31
Brunei Darussalam 29 5.30 41 4.65 39 4.45 2 6.33 47 5.79
Bulgaria 82 4.20 111 3.28 95 2.79 54 5.21 68 5.53Burkina Faso 126 3.43 75 3.82 104 2.57 120 3.93 131 3.42
Burundi 132 3.14 124 3.03 129 2.05 124 3.76 124 3.70
Cambodia 107 3.72 103 3.44 97 2.77 105 4.39 111 4.27
Cameroon 109 3.67 116 3.24 117 2.32 34 5.47 125 3.66
Canada 8 5.84 15 5.50 6 6.12 43 5.36 6 6.39
Chad 133 2.96 133 2.54 134 1.65 97 4.54 134 3.09
Chile 36 5.15 37 4.73 30 4.59 14 5.90 73 5.37
China 42 5.01 56 4.18 47 4.22 11 5.95 50 5.71
Colombia 77 4.24 87 3.66 80 3.07 88 4.71 67 5.53
Costa Rica 63 4.45 50 4.35 94 2.80 85 4.73 37 5.92
Côte d’Ivoire 113 3.64 130 2.82 73 3.33 69 4.93 127 3.49
Croatia 49 4.69 74 3.82 51 3.98 61 5.10 41 5.85
Cyprus 23 5.48 24 5.03 25 5.17 46 5.33 7 6.39
Czech Republic 45 4.85 72 3.87 50 4.11 42 5.37 29 6.07
Denmark 4 6.14 3 6.18 8 6.01 12 5.92 4 6.44Dominican Republic 99 3.90 119 3.14 81 3.05 78 4.80 106 4.58
Ecuador 90 4.12 129 2.92 108 2.54 16 5.88 92 5.13
Egypt 83 4.18 52 4.25 60 3.74 125 3.56 88 5.19
El Salvador 66 4.43 100 3.46 56 3.90 62 5.10 86 5.26
Estonia 30 5.27 33 4.85 40 4.44 23 5.72 28 6.08
Ethiopia 119 3.56 77 3.80 103 2.66 119 4.00 123 3.79
Finland 1 6.18 2 6.18 9 5.94 8 6.01 1 6.57
France 13 5.76 23 5.10 2 6.54 65 5.04 9 6.35
Gambia, The 81 4.22 38 4.73 62 3.68 99 4.51 119 3.96
Georgia 91 4.07 69 3.89 77 3.23 118 4.02 91 5.14
Germany 7 5.96 14 5.65 1 6.65 40 5.42 24 6.10
Ghana 106 3.74 63 4.02 82 2.98 121 3.91 115 4.04
Greece 51 4.66 58 4.10 45 4.28 106 4.37 40 5.89
Guatemala 84 4.17 98 3.48 71 3.47 87 4.72 99 5.02
Guyana 115 3.60 117 3.23 98 2.76 133 2.84 62 5.57Honduras 78 4.24 82 3.69 75 3.29 89 4.67 83 5.30
Hong Kong SAR 5 6.05 9 5.78 5 6.32 3 6.26 43 5.82
Hungary 64 4.43 64 3.94 57 3.85 115 4.20 49 5.74
Iceland 11 5.80 6 5.93 17 5.60 56 5.17 2 6.50
India 80 4.23 53 4.23 72 3.38 109 4.32 100 4.99
Indonesia 76 4.25 68 3.89 86 2.95 72 4.91 87 5.26
Ireland 32 5.24 17 5.39 53 3.95 47 5.33 14 6.28
Israel 41 5.06 47 4.53 37 4.48 59 5.15 25 6.10
Italy 58 4.53 84 3.68 54 3.94 100 4.46 30 6.04
Jamaica 97 3.95 86 3.66 67 3.54 130 3.25 77 5.33
Japan 26 5.36 26 4.99 11 5.80 98 4.53 22 6.11
Jordan 47 4.80 27 4.98 44 4.30 111 4.24 56 5.67
Kazakhstan 74 4.29 81 3.71 76 3.26 74 4.87 81 5.30
Kenya 104 3.80 93 3.54 91 2.86 107 4.37 108 4.43
Korea, Rep. 16 5.71 28 4.95 15 5.63 4 6.15 26 6.10
Kuwait 39 5.12 48 4.46 49 4.16 1 6.51 75 5.35
Kyrgyz Republic 124 3.49 122 3.06 111 2.51 128 3.31 96 5.06
Latvia 55 4.63 60 4.05 58 3.81 71 4.91 48 5.76
Lesotho 118 3.57 114 3.26 125 2.14 39 5.42 129 3.44
(Cont’d.) The Global Competitiveness Report 2008-2009 © 2008 World Economic Forum
8/2/2019 Competiveness Index
http://slidepdf.com/reader/full/competiveness-index 13/39
Table 6: The Global Competitiveness Index: Basic requirements (cont’d.)
PILLARS
3. Macroeconomic 4. Health andBASIC REQUIREMENTS 1. Institutions 2. Infrastructure stability primary education
Country/Economy Rank Score Rank Score Rank Score Rank Score Rank Score
Libya 75 4.27 65 3.93 112 2.47 6 6.03 103 4.65
Lithuania 46 4.84 55 4.19 46 4.24 52 5.23 52 5.69
Luxembourg 12 5.78 13 5.68 20 5.38 7 6.03 31 6.03Macedonia, FYR 68 4.42 90 3.58 89 2.90 31 5.51 55 5.67
Madagascar 125 3.49 94 3.52 114 2.41 127 3.38 104 4.63
Malawi 127 3.43 51 4.33 119 2.27 129 3.26 120 3.87
Malaysia 25 5.42 30 4.91 23 5.25 38 5.43 23 6.11
Mali 116 3.58 79 3.73 107 2.55 94 4.60 130 3.43
Malta 40 5.08 32 4.88 38 4.46 68 4.97 32 6.02
Mauritania 130 3.28 107 3.42 127 2.10 126 3.49 114 4.13
Mauritius 50 4.67 39 4.68 43 4.32 117 4.03 57 5.66
Mexico 60 4.47 97 3.49 68 3.51 48 5.32 65 5.55
Moldova 95 3.99 92 3.55 113 2.43 80 4.79 89 5.19
Mongolia 102 3.87 121 3.08 133 1.85 37 5.44 94 5.11
Montenegro 59 4.52 59 4.07 100 2.72 35 5.46 42 5.83
Morocco 67 4.42 61 4.05 70 3.50 84 4.73 71 5.39
Mozambique 131 3.21 112 3.27 124 2.18 112 4.23 132 3.15
Namibia 48 4.71 42 4.59 33 4.56 27 5.69 118 3.99Nepal 120 3.55 120 3.13 132 1.90 90 4.62 107 4.54
Netherlands 10 5.81 10 5.76 12 5.71 36 5.45 11 6.30
New Zealand 19 5.58 8 5.81 42 4.37 25 5.72 5 6.42
Nicaragua 122 3.54 118 3.20 128 2.07 123 3.86 98 5.03
Nigeria 105 3.74 106 3.42 120 2.24 26 5.70 126 3.59
Norway 14 5.76 7 5.93 27 4.99 17 5.83 12 6.28
Oman 31 5.25 19 5.21 32 4.56 13 5.92 80 5.31
Pakistan 110 3.67 95 3.51 85 2.96 116 4.17 116 4.03
Panama 54 4.64 70 3.88 55 3.94 55 5.19 64 5.56
Paraguay 123 3.51 132 2.64 130 1.91 113 4.22 85 5.27
Peru 94 4.02 101 3.45 110 2.53 67 4.98 95 5.10
Philippines 85 4.17 105 3.44 92 2.86 53 5.21 90 5.17
Poland 70 4.39 88 3.63 96 2.77 50 5.25 39 5.90
Portugal 37 5.14 35 4.75 26 5.07 82 4.74 33 6.00
Puerto Rico 44 4.96 44 4.56 31 4.59 81 4.77 38 5.92Qatar 21 5.50 16 5.47 35 4.54 19 5.80 18 6.18
Romania 87 4.15 89 3.63 105 2.56 76 4.85 66 5.55
Russian Federation 56 4.54 110 3.29 59 3.75 29 5.55 59 5.59
Saudi Arabia 34 5.21 34 4.75 41 4.39 9 6.01 51 5.70
Senegal 101 3.88 83 3.69 83 2.97 103 4.44 109 4.43
Serbia 88 4.15 108 3.40 102 2.68 86 4.72 46 5.79
Singapore 3 6.14 1 6.19 4 6.39 21 5.74 16 6.24
Slovak Republic 52 4.66 73 3.85 64 3.64 49 5.31 44 5.82
Slovenia 38 5.13 49 4.40 36 4.49 33 5.48 21 6.15
South Africa 69 4.41 46 4.55 48 4.21 63 5.06 122 3.84
Spain 27 5.34 43 4.59 22 5.30 30 5.53 35 5.96
Sri Lanka 92 4.07 66 3.92 65 3.60 132 3.07 53 5.69
Suriname 73 4.31 99 3.47 99 2.72 32 5.51 63 5.56
Sweden 6 5.9975 4 6.05 13 5.71 15 5.88 8 6.35
Switzerland 2 6.14 5 5.97 3 6.40 10 5.97 17 6.22Syria 71 4.38 54 4.20 74 3.30 93 4.61 70 5.42
Taiwan, China 20 5.53 40 4.67 19 5.46 18 5.82 20 6.16
Tajikistan 112 3.65 78 3.74 101 2.68 131 3.18 101 4.99
Tanzania 114 3.61 76 3.81 118 2.28 108 4.34 117 4.03
Thailand 43 4.97 57 4.17 29 4.67 41 5.41 58 5.61
Timor-Leste 128 3.42 125 3.03 131 1.90 73 4.88 121 3.87
Trinidad and Tobago 65 4.43 104 3.44 63 3.65 51 5.25 72 5.39
Tunisia 35 5.17 22 5.15 34 4.56 75 4.87 27 6.09
Turkey 72 4.34 80 3.72 66 3.54 79 4.79 78 5.33
Uganda 129 3.34 113 3.27 115 2.36 92 4.61 133 3.12
Ukraine 86 4.15 115 3.26 79 3.13 91 4.62 60 5.59
United Arab Emirates 17 5.67 18 5.37 14 5.66 24 5.72 36 5.93
United Kingdom 24 5.46 25 4.99 18 5.52 58 5.15 19 6.17
United States 22 5.50 29 4.93 7 6.10 66 4.99 34 5.97
Uruguay 57 4.53 45 4.55 69 3.50 104 4.41 54 5.68
Venezuela 111 3.65 134 2.41 109 2.54 110 4.29 74 5.36
Vietnam 79 4.23 71 3.87 93 2.86 70 4.91 84 5.29
Zambia 121 3.54 67 3.91 116 2.35 102 4.45 128 3.46
Zimbabwe 134 2.88 126 3.00 88 2.90 134 1.48 113 4.16
15
1 . 1
: T h e
G l o b a l C o m p e t i t i v e n e s s I n d e x
The Global Competitiveness Report 2008-2009 © 2008 World Economic Forum
8/2/2019 Competiveness Index
http://slidepdf.com/reader/full/competiveness-index 14/39
16
1 . 1
: T h e
G l o b a l C o m p e t i t i v e n e s s I n d e x
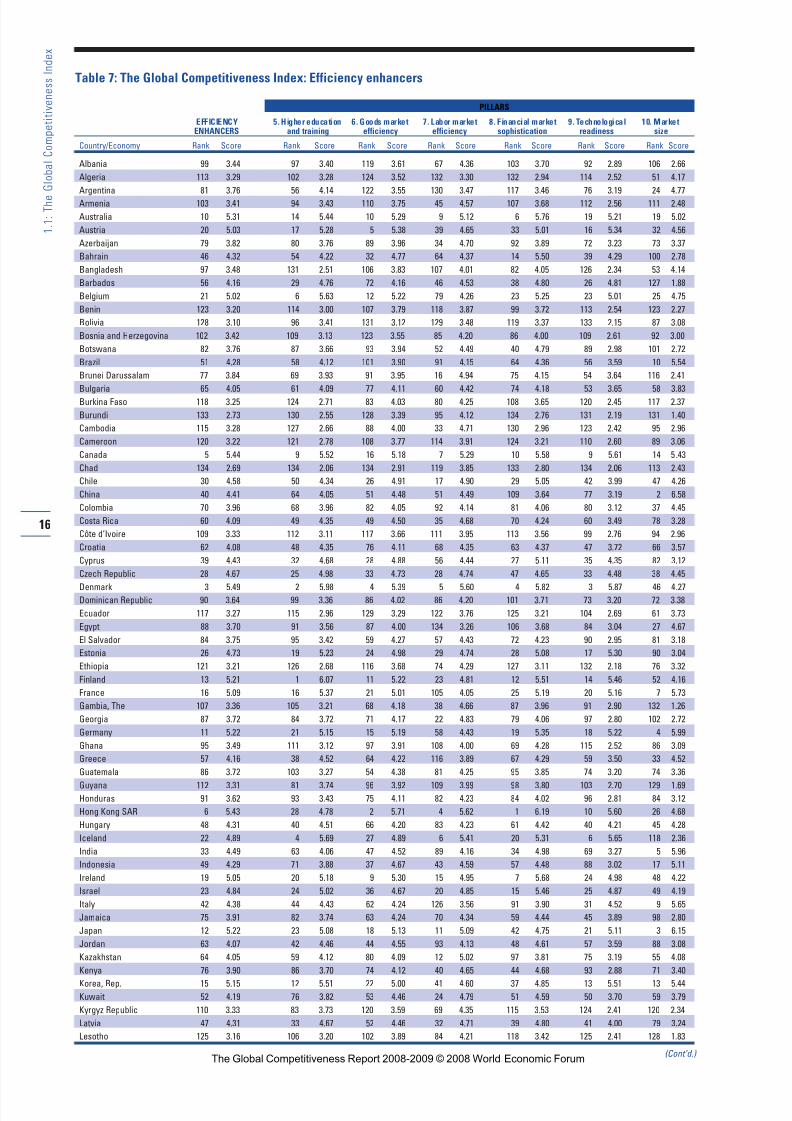
Table 7: The Global Competitiveness Index: Efficiency enhancers
PILLARS
EFFICIENCY 5. Higher education 6. Goods market 7. Labor market 8. Financial market 9. Technological 10. MarketENHANCERS and training efficiency efficiency sophistication readiness size
Country/Economy Rank Score Rank Score Rank Score Rank Score Rank Score Rank Score Rank Score
Albania 99 3.44 97 3.40 119 3.61 67 4.36 103 3.70 92 2.89 106 2.66
Algeria 113 3.29 102 3.28 124 3.52 132 3.30 132 2.94 114 2.52 51 4.17
Argentina 81 3.76 56 4.14 122 3.55 130 3.47 117 3.46 76 3.19 24 4.77
Armenia 103 3.41 94 3.43 110 3.75 45 4.57 107 3.68 112 2.56 111 2.48
Australia 10 5.31 14 5.44 10 5.29 9 5.12 6 5.76 19 5.21 19 5.02
Austria 20 5.03 17 5.28 5 5.38 39 4.65 33 5.01 16 5.34 32 4.56
Azerbaijan 79 3.82 80 3.76 89 3.96 34 4.70 92 3.89 72 3.23 73 3.37
Bahrain 46 4.32 54 4.22 32 4.77 64 4.37 14 5.50 39 4.29 100 2.78
Bangladesh 97 3.48 131 2.51 106 3.83 107 4.01 82 4.05 126 2.34 53 4.14
Barbados 56 4.16 29 4.76 72 4.16 46 4.53 38 4.80 26 4.81 127 1.88
Belgium 21 5.02 6 5.63 12 5.22 79 4.26 23 5.25 23 5.01 25 4.75
Benin 123 3.20 114 3.00 107 3.79 118 3.87 99 3.72 113 2.54 123 2.27
Bolivia 128 3.10 96 3.41 131 3.12 129 3.48 119 3.37 133 2.15 87 3.08
Bosnia and Herzegovina 102 3.42 109 3.13 123 3.55 85 4.20 86 4.00 109 2.61 92 3.00
Botswana 82 3.76 87 3.66 93 3.94 52 4.49 40 4.79 89 2.98 101 2.72
Brazil 51 4.28 58 4.12 101 3.90 91 4.15 64 4.36 56 3.59 10 5.54
Brunei Darussalam 77 3.84 69 3.93 91 3.95 16 4.94 75 4.15 54 3.64 116 2.41
Bulgaria 65 4.05 61 4.09 77 4.11 60 4.42 74 4.18 53 3.65 58 3.83Burkina Faso 118 3.25 124 2.71 83 4.03 80 4.25 108 3.65 120 2.45 117 2.37
Burundi 133 2.73 130 2.55 128 3.39 95 4.12 134 2.76 131 2.19 131 1.40
Cambodia 115 3.28 127 2.66 88 4.00 33 4.71 130 2.96 123 2.42 95 2.96
Cameroon 120 3.22 121 2.78 108 3.77 114 3.91 124 3.21 110 2.60 89 3.06
Canada 5 5.44 9 5.52 16 5.18 7 5.29 10 5.58 9 5.61 14 5.43
Chad 134 2.69 134 2.06 134 2.91 119 3.85 133 2.80 134 2.06 113 2.43
Chile 30 4.58 50 4.34 26 4.91 17 4.90 29 5.05 42 3.99 47 4.26
China 40 4.41 64 4.05 51 4.48 51 4.49 109 3.64 77 3.19 2 6.58
Colombia 70 3.96 68 3.96 82 4.05 92 4.14 81 4.06 80 3.12 37 4.45
Costa Rica 60 4.09 49 4.35 49 4.50 35 4.68 70 4.24 60 3.49 78 3.28
Côte d’Ivoire 109 3.33 112 3.11 117 3.66 111 3.95 113 3.56 99 2.76 94 2.96
Croatia 62 4.08 48 4.35 76 4.11 68 4.35 63 4.37 47 3.72 66 3.57
Cyprus 39 4.43 32 4.68 28 4.88 56 4.44 27 5.11 35 4.35 82 3.12
Czech Republic 28 4.67 25 4.98 33 4.73 28 4.74 47 4.65 33 4.48 38 4.45
Denmark 3 5.49 2 5.98 4 5.39 5 5.60 4 5.82 3 5.87 46 4.27Dominican Republic 90 3.64 99 3.36 86 4.02 86 4.20 101 3.71 73 3.20 72 3.38
Ecuador 117 3.27 115 2.96 129 3.29 122 3.76 125 3.21 104 2.69 61 3.73
Egypt 88 3.70 91 3.56 87 4.00 134 3.26 106 3.68 84 3.04 27 4.67
El Salvador 84 3.75 95 3.42 59 4.27 57 4.43 72 4.23 90 2.95 81 3.18
Estonia 26 4.73 19 5.23 24 4.98 29 4.74 28 5.08 17 5.30 90 3.04
Ethiopia 121 3.21 126 2.68 116 3.68 74 4.29 127 3.11 132 2.18 76 3.32
Finland 13 5.21 1 6.07 11 5.22 23 4.81 12 5.51 14 5.46 52 4.16
France 16 5.09 16 5.37 21 5.01 105 4.05 25 5.19 20 5.16 7 5.73
Gambia, The 107 3.36 105 3.21 68 4.18 38 4.66 87 3.96 91 2.90 132 1.26
Georgia 87 3.72 84 3.72 71 4.17 22 4.83 79 4.06 97 2.80 102 2.72
Germany 11 5.22 21 5.15 15 5.19 58 4.43 19 5.35 18 5.22 4 5.99
Ghana 95 3.49 111 3.12 97 3.91 108 4.00 69 4.28 115 2.52 86 3.09
Greece 57 4.16 38 4.52 64 4.22 116 3.89 67 4.29 59 3.50 33 4.52
Guatemala 86 3.72 103 3.27 54 4.38 81 4.25 95 3.85 74 3.20 74 3.36
Guyana 112 3.31 81 3.74 96 3.92 109 3.99 98 3.80 103 2.70 129 1.69Honduras 91 3.62 93 3.43 75 4.11 82 4.23 84 4.02 96 2.81 84 3.12
Hong Kong SAR 6 5.43 28 4.78 2 5.71 4 5.62 1 6.19 10 5.60 26 4.68
Hungary 48 4.31 40 4.51 66 4.20 83 4.23 61 4.42 40 4.21 45 4.28
Iceland 22 4.89 4 5.69 27 4.89 6 5.41 20 5.31 6 5.65 118 2.36
India 33 4.49 63 4.06 47 4.52 89 4.16 34 4.98 69 3.27 5 5.96
Indonesia 49 4.29 71 3.88 37 4.67 43 4.59 57 4.48 88 3.02 17 5.11
Ireland 19 5.05 20 5.18 9 5.30 15 4.95 7 5.68 24 4.98 48 4.22
Israel 23 4.84 24 5.02 36 4.67 20 4.85 15 5.46 25 4.87 49 4.19
Italy 42 4.38 44 4.43 62 4.24 126 3.56 91 3.90 31 4.52 9 5.65
Jamaica 75 3.91 82 3.74 63 4.24 70 4.34 59 4.44 45 3.89 98 2.80
Japan 12 5.22 23 5.08 18 5.13 11 5.09 42 4.75 21 5.11 3 6.15
Jordan 63 4.07 42 4.46 44 4.55 93 4.13 48 4.61 57 3.59 88 3.08
Kazakhstan 64 4.05 59 4.12 80 4.09 12 5.02 97 3.81 75 3.19 55 4.08
Kenya 76 3.90 86 3.70 74 4.12 40 4.65 44 4.68 93 2.88 71 3.40
Korea, Rep. 15 5.15 12 5.51 22 5.00 41 4.60 37 4.85 13 5.51 13 5.44Kuwait 52 4.19 76 3.82 53 4.46 24 4.79 51 4.59 50 3.70 59 3.79
Kyrgyz Republic 110 3.33 83 3.73 120 3.59 69 4.35 115 3.53 124 2.41 120 2.34
Latvia 47 4.31 33 4.67 52 4.46 32 4.71 39 4.80 41 4.00 79 3.24
Lesotho 125 3.16 106 3.20 102 3.89 84 4.21 118 3.42 125 2.41 128 1.83
(Cont’d.) The Global Competitiveness Report 2008-2009 © 2008 World Economic Forum
8/2/2019 Competiveness Index
http://slidepdf.com/reader/full/competiveness-index 15/39
Table 7: The Global Competitiveness Index: Efficiency enhancers (cont’d.)
PILLARS
EFFICIENCY 5. Higher education 6. Goods market 7. Labor market 8. Financial market 9. Technological 10. MarketENHANCERS and training efficiency efficiency sophistication readiness size
Country/Economy Rank Score Rank Score Rank Score Rank Score Rank Score Rank Score Rank Score
Libya 114 3.29 75 3.83 121 3.56 133 3.27 131 2.95 98 2.79 77 3.31
Lithuania 43 4.37 26 4.85 48 4.52 49 4.52 56 4.50 38 4.29 69 3.51
Luxembourg 27 4.69 47 4.39 13 5.21 48 4.52 17 5.39 12 5.52 83 3.12
Macedonia, FYR 92 3.58 73 3.85 98 3.91 113 3.92 83 4.04 83 3.05 104 2.69
Madagascar 119 3.23 119 2.83 85 4.02 72 4.30 128 3.09 111 2.58 109 2.58
Malawi 101 3.42 116 2.85 84 4.03 42 4.60 62 4.40 127 2.33 121 2.34
Malaysia 24 4.82 35 4.63 23 5.00 19 4.86 16 5.40 34 4.41 28 4.65
Mali 122 3.20 122 2.77 95 3.93 94 4.13 120 3.35 105 2.64 119 2.36
Malta 44 4.35 39 4.51 43 4.55 100 4.08 18 5.36 27 4.75 97 2.84
Mauritania 130 2.91 133 2.35 126 3.45 112 3.92 126 3.13 102 2.71 126 1.91
Mauritius 66 4.03 67 3.97 40 4.64 65 4.37 32 5.02 55 3.62 110 2.54
Mexico 55 4.16 74 3.83 73 4.14 110 3.97 66 4.30 71 3.25 11 5.48
Moldova 98 3.48 88 3.62 105 3.84 55 4.45 104 3.69 95 2.85 114 2.42
Mongolia 105 3.39 85 3.71 109 3.76 71 4.32 110 3.63 101 2.74 124 2.16
Montenegro 72 3.95 55 4.18 69 4.17 53 4.47 35 4.96 43 3.96 125 1.95
Morocco 85 3.73 90 3.57 58 4.34 128 3.54 93 3.88 78 3.18 57 3.91
Mozambique 129 3.09 129 2.56 127 3.44 98 4.10 122 3.27 116 2.52 107 2.63
Namibia 93 3.57 110 3.13 94 3.93 50 4.49 53 4.54 85 3.03 122 2.31Nepal 126 3.12 125 2.69 113 3.73 124 3.61 105 3.69 130 2.22 99 2.80
Netherlands 7 5.38 11 5.52 3 5.39 30 4.72 11 5.57 1 6.01 18 5.06
New Zealand 17 5.07 15 5.40 17 5.17 10 5.10 3 5.87 22 5.09 60 3.78
Nicaragua 116 3.27 113 3.06 112 3.73 99 4.10 100 3.72 122 2.42 108 2.61
Nigeria 71 3.96 108 3.13 56 4.37 59 4.43 54 4.53 94 2.87 39 4.41
Norway 14 5.19 10 5.52 20 5.05 14 4.97 13 5.51 4 5.81 44 4.29
Oman 61 4.09 66 3.98 39 4.65 44 4.58 50 4.60 68 3.34 75 3.36
Pakistan 89 3.67 123 2.74 100 3.90 121 3.79 71 4.24 100 2.75 29 4.58
Panama 67 4.02 77 3.82 57 4.36 77 4.27 26 5.17 62 3.45 85 3.10
Paraguay 111 3.31 117 2.85 104 3.87 117 3.87 96 3.81 119 2.46 93 2.98
Peru 69 4.01 89 3.62 61 4.25 75 4.28 45 4.68 87 3.03 50 4.19
Philippines 68 4.02 60 4.10 81 4.08 101 4.08 78 4.09 70 3.26 34 4.50
Poland 41 4.39 34 4.64 65 4.22 62 4.40 68 4.28 46 3.79 20 5.00
Portugal 34 4.47 37 4.59 45 4.53 87 4.18 43 4.71 32 4.51 43 4.32
Puerto Rico 38 4.44 36 4.62 29 4.87 37 4.66 30 5.04 44 3.92 68 3.53Qatar 31 4.53 31 4.69 38 4.66 31 4.71 22 5.25 37 4.31 67 3.54
Romania 54 4.18 52 4.29 67 4.18 97 4.10 60 4.42 48 3.70 42 4.38
Russian Federation 50 4.29 46 4.40 99 3.90 27 4.74 112 3.60 67 3.36 8 5.71
Saudi Arabia 45 4.35 53 4.29 34 4.71 63 4.37 73 4.22 51 3.69 22 4.81
Senegal 96 3.48 92 3.44 60 4.26 120 3.82 111 3.60 81 3.11 105 2.66
Serbia 78 3.82 70 3.91 115 3.68 66 4.36 89 3.94 61 3.45 65 3.59
Singapore 2 5.52 8 5.56 1 5.83 2 5.71 2 5.94 7 5.65 41 4.41
Slovak Republic 32 4.52 45 4.43 35 4.71 36 4.67 31 5.04 36 4.35 56 3.94
Slovenia 37 4.45 22 5.15 50 4.49 61 4.41 46 4.67 30 4.53 70 3.44
South Africa 35 4.46 57 4.13 31 4.79 88 4.17 24 5.22 49 3.70 23 4.77
Spain 25 4.75 30 4.75 41 4.63 96 4.11 36 4.93 29 4.59 12 5.47
Sri Lanka 74 3.92 65 3.98 42 4.59 115 3.89 65 4.34 82 3.07 64 3.63
Suriname 127 3.11 100 3.30 125 3.50 104 4.07 114 3.54 108 2.61 130 1.64
Sweden 9 5.35 3 5.83 7 5.34 26 4.74 8 5.65 2 5.99 30 4.57
Switzerland 8 5.35 7 5.60 6 5.34 3 5.66 21 5.26 5 5.76 35 4.49Syria 104 3.41 101 3.28 92 3.94 123 3.67 121 3.28 107 2.64 63 3.63
Taiwan, China 18 5.06 13 5.46 14 5.19 21 4.83 58 4.45 15 5.34 16 5.11
Tajikistan 124 3.19 104 3.24 118 3.64 78 4.26 123 3.26 128 2.31 115 2.41
Tanzania 108 3.34 132 2.42 111 3.74 73 4.30 94 3.86 117 2.51 80 3.21
Thailand 36 4.45 51 4.31 46 4.53 13 4.98 49 4.60 66 3.37 21 4.92
Timor-Leste 132 2.77 128 2.57 130 3.19 90 4.15 129 3.05 118 2.48 134 1.18
Trinidad and Tobago 80 3.78 78 3.81 90 3.96 76 4.28 52 4.57 63 3.40 103 2.69
Tunisia 53 4.19 27 4.85 30 4.80 103 4.07 77 4.09 52 3.68 62 3.63
Turkey 59 4.10 72 3.87 55 4.38 125 3.57 76 4.11 58 3.53 15 5.16
Uganda 106 3.37 120 2.81 114 3.69 25 4.75 102 3.70 121 2.44 96 2.85
Ukraine 58 4.12 43 4.46 103 3.87 54 4.47 85 4.00 65 3.38 31 4.56
United Arab Emirates 29 4.64 41 4.48 25 4.94 18 4.88 41 4.77 28 4.63 54 4.14
United Kingdom 4 5.45 18 5.27 19 5.05 8 5.19 5 5.81 8 5.62 6 5.77
United States 1 5.81 5 5.67 8 5.32 1 5.79 9 5.61 11 5.57 1 6.91
Uruguay 83 3.76 62 4.07 79 4.10 106 4.02 88 3.95 64 3.39 91 3.04Venezuela 94 3.55 79 3.76 132 3.09 131 3.43 116 3.50 86 3.03 36 4.49
Vietnam 73 3.94 98 3.36 70 4.17 47 4.52 80 4.06 79 3.12 40 4.41
Zambia 100 3.43 118 2.83 78 4.11 102 4.08 55 4.51 106 2.64 112 2.43
Zimbabwe 131 2.87 107 3.18 133 3.05 127 3.56 90 3.92 129 2.28 133 1.25
17
1 . 1
: T h e
G l o b a l C o m p e t i t i v e n e s s I n d e x
The Global Competitiveness Report 2008-2009 © 2008 World Economic Forum
8/2/2019 Competiveness Index
http://slidepdf.com/reader/full/competiveness-index 16/39
18
1 . 1
: T h e
G l o b a l C o m p e t i t i v e n e s s I n d e x
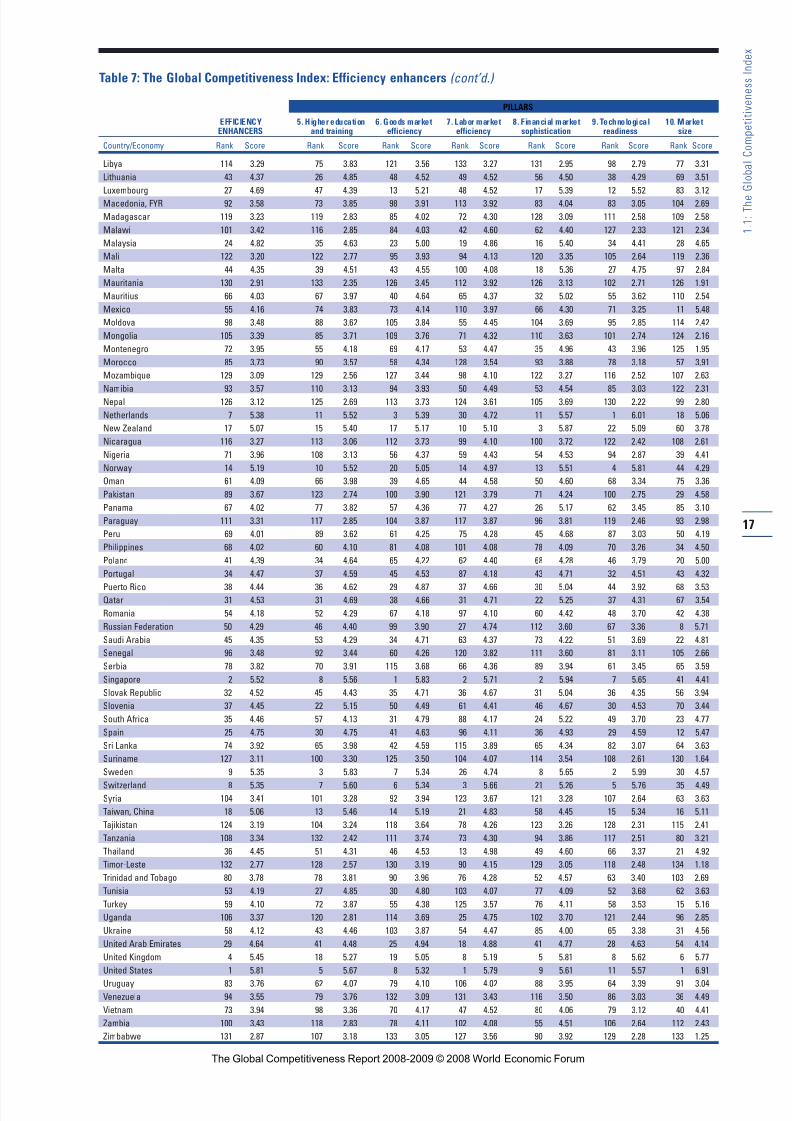
INNOVATION ANDPILLARS
SOPHISTICATION 11. Business 12 .FACTORS sophistication Innovation
Country/Economy Rank Score Rank Score Rank Score
Albania 130 2.74 123 3.27 132 2.22
Algeria 126 2.85 132 3.03 113 2.66
Argentina 81 3.43 71 3.99 98 2.87
Armenia 113 3.03 120 3.30 106 2.77
Australia 22 4.66 26 4.86 20 4.46
Austria 12 5.16 6 5.65 15 4.68
Azerbaijan 57 3.72 81 3.91 40 3.53
Bahrain 54 3.76 44 4.49 75 3.04
Bangladesh 115 2.98 105 3.46 122 2.51
Barbados 51 3.84 56 4.27 49 3.41
Belgium 15 5.02 11 5.36 14 4.69
Benin 100 3.21 103 3.49 95 2.93
Bolivia 134 2.59 133 3.03 133 2.16
Bosnia and Herzegovina 129 2.80 125 3.23 128 2.37
Botswana 98 3.22 106 3.45 83 2.98
Brazil 42 4.04 35 4.58 43 3.50
Brunei Darussalam 87 3.35 89 3.75 91 2.94
Bulgaria 92 3.30 92 3.69 96 2.91Burkina Faso 95 3.27 96 3.58 89 2.95
Burundi 125 2.85 127 3.21 123 2.50
Cambodia 112 3.04 110 3.41 112 2.67
Cameroon 108 3.08 108 3.43 108 2.72
Canada 16 4.96 18 5.10 13 4.82
Chad 131 2.70 129 3.06 130 2.35
Chile 44 4.00 31 4.65 56 3.35
China 32 4.18 43 4.50 28 3.87
Colombia 60 3.71 64 4.20 61 3.22
Costa Rica 39 4.07 42 4.51 38 3.62
Côte d’Ivoire 94 3.27 88 3.76 105 2.78
Croatia 62 3.70 72 3.98 50 3.41
Cyprus 41 4.05 36 4.57 41 3.53
Czech Republic 25 4.37 29 4.77 25 3.98
Denmark 7 5.37 5 5.66 10 5.09Dominican Republic 86 3.38 75 3.97 103 2.78
Ecuador 118 2.95 99 3.54 129 2.36
Egypt 74 3.54 77 3.93 67 3.15
El Salvador 96 3.24 79 3.93 118 2.56
Estonia 40 4.06 50 4.38 31 3.74
Ethiopia 114 2.98 122 3.27 109 2.69
Finland 5 5.53 10 5.49 2 5.57
France 14 5.08 9 5.50 16 4.67
Gambia, The 78 3.48 74 3.97 81 2.99
Georgia 109 3.07 112 3.39 107 2.74
Germany 4 5.54 1 5.87 8 5.22
Ghana 107 3.09 98 3.56 114 2.62
Greece 68 3.65 66 4.13 63 3.18
Guatemala 65 3.69 52 4.33 74 3.05
Guyana 111 3.04 95 3.60 124 2.49Honduras 89 3.32 82 3.87 104 2.78
Hong Kong SAR 21 4.69 13 5.26 24 4.11
Hungary 55 3.75 68 4.05 45 3.45
Iceland 19 4.82 20 5.03 18 4.62
India 27 4.29 27 4.85 32 3.74
Indonesia 45 3.98 39 4.55 47 3.42
Ireland 20 4.72 19 5.05 21 4.39
Israel 13 5.10 23 4.95 6 5.26
Italy 31 4.19 21 4.99 53 3.38
Jamaica 72 3.57 69 4.01 68 3.14
Japan 3 5.65 3 5.78 4 5.52
Jordan 47 3.90 47 4.41 51 3.40
Kazakhstan 77 3.50 86 3.79 62 3.21
Kenya 50 3.87 63 4.21 42 3.52
Korea, Rep. 10 5.20 16 5.22 9 5.18Kuwait 52 3.82 38 4.56 71 3.07
Kyrgyz Republic 123 2.90 121 3.28 121 2.51
Latvia 84 3.39 83 3.85 93 2.94
Lesotho 110 3.06 126 3.22 97 2.91
(Cont’d.)
INNOVATION ANDPILLARS
SOPHISTICATION 11. Business 12.FACTORS sophistication Innovation
Country/Economy Rank Score Rank Score Rank Score
Libya 102 3.16 101 3.51 100 2.82
Lithuania 49 3.87 49 4.39 55 3.35
Luxembourg 24 4.51 25 4.87 23 4.15
Macedonia, FYR 105 3.16 107 3.45 99 2.86
Madagascar 97 3.22 102 3.49 87 2.96
Malawi 101 3.20 104 3.46 94 2.93
Malaysia 23 4.63 22 4.99 22 4.28
Mali 99 3.21 111 3.41 79 3.01
Malta 56 3.74 59 4.23 60 3.25
Mauritania 120 2.93 114 3.38 125 2.48
Mauritius 69 3.65 55 4.29 80 3.01
Mexico 70 3.60 58 4.24 90 2.95
Moldova 128 2.83 131 3.05 116 2.61
Mongolia 119 2.94 130 3.06 102 2.82
Montenegro 88 3.33 90 3.71 88 2.96
Morocco 76 3.51 70 3.99 78 3.02
Mozambique 127 2.84 128 3.14 120 2.55
Namibia 104 3.16 94 3.63 111 2.68Nepal 121 2.91 117 3.34 126 2.47
Netherlands 9 5.20 8 5.58 12 4.82
New Zealand 28 4.26 37 4.57 26 3.95
Nicaragua 124 2.86 119 3.30 127 2.42
Nigeria 64 3.69 61 4.23 65 3.16
Norway 18 4.91 15 5.22 19 4.60
Oman 48 3.87 54 4.29 44 3.45
Pakistan 85 3.39 87 3.79 82 2.99
Panama 58 3.71 51 4.36 73 3.07
Paraguay 132 2.69 118 3.32 134 2.06
Peru 83 3.40 67 4.12 110 2.68
Philippines 67 3.65 57 4.26 76 3.04
Poland 61 3.70 62 4.23 64 3.17
Portugal 43 4.03 48 4.39 35 3.66
Puerto Rico 26 4.32 28 4.85 30 3.80Qatar 35 4.14 45 4.47 29 3.81
Romania 75 3.53 78 3.93 69 3.14
Russian Federation 73 3.56 91 3.70 48 3.41
Saudi Arabia 37 4.09 41 4.51 34 3.68
Senegal 59 3.71 65 4.15 59 3.27
Serbia 91 3.30 100 3.51 70 3.09
Singapore 11 5.16 14 5.25 11 5.08
Slovak Republic 53 3.80 53 4.33 58 3.28
Slovenia 33 4.15 34 4.59 33 3.72
South Africa 36 4.13 33 4.62 37 3.64
Spain 29 4.25 24 4.89 39 3.61
Sri Lanka 34 4.14 32 4.64 36 3.65
Suriname 117 2.97 113 3.38 117 2.57
Sweden 6 5.53 7 5.64 5 5.42
Switzerland 2 5.68 2 5.81 3 5.54Syria 80 3.45 76 3.94 84 2.97
Taiwan, China 8 5.26 12 5.28 7 5.23
Tajikistan 103 3.16 116 3.35 85 2.97
Tanzania 106 3.12 109 3.41 101 2.82
Thailand 46 3.91 46 4.43 54 3.38
Timor-Leste 133 2.62 134 2.92 131 2.32
Trinidad and Tobago 79 3.47 73 3.98 86 2.97
Tunisia 30 4.21 40 4.51 27 3.91
Turkey 63 3.70 60 4.23 66 3.16
Uganda 90 3.32 97 3.57 72 3.07
Ukraine 66 3.66 80 3.91 52 3.40
United Arab Emirates 38 4.09 30 4.76 46 3.42
United Kingdom 17 4.93 17 5.20 17 4.66
United States 1 5.80 4 5.75 1 5.84
Uruguay 82 3.42 85 3.82 77 3.02Venezuela 116 2.98 115 3.35 115 2.61
Vietnam 71 3.59 84 3.84 57 3.35
Zambia 93 3.29 93 3.64 92 2.94
Zimbabwe 122 2.90 124 3.26 119 2.55
Table 8: The Global Competitiveness Index: Innovation and sophistication factors
The Global Competitiveness Report 2008-2009 © 2008 World Economic Forum
8/2/2019 Competiveness Index
http://slidepdf.com/reader/full/competiveness-index 17/39
excellent capacity for innovation (ranked 2nd on all
three indicators).The country’s overall competitive per-
formance, however, is dragged down by its macroeco-
nomic weaknesses, with an extremely high budget deficit
(ranked 110th), which have led to the buildup of one of
the highest public debt levels in the world (ranked
129th). Financial markets also remain an area of concern,
traced to a lack of trust in the banking sector, for exam-ple (Japan ranks 93rd on the soundness of its banks).
Japan’s current ranking marks a drop of one position
since last year,with a measurable weakening across a
broad range of areas, most notably a number of aspects
of the country’s public institutions. In particular, the
business community perceives that government spending
has become more wasteful and public trust in politicians
has diminished further since last year’s assessment.
Canada moves up three places to join the top 10
(ranked 10th). Canada benefits from top-notch transport
and telephony infrastructure; highly efficient markets,particularly labor and financial markets (ranked 7th and
10th respectively); and well-functioning and transparent
institutions (ranked 15th). In addition, the educational
system gets excellent marks for quality, which has pre-
pared the country’s workforce to adopt the latest tech-
nologies for productivity enhancements (ranked 9th).
Canada’s main weakness remains its macroeconomic sta-
bility, where it is ranked 43rd, mainly linked to the sig-
nificant government debt of nearly 70 percent of GDP,
which places the country 107th out of 134 countries on
this indicator. On a more positive note, however, the
government has been running small surpluses over
recent years, which is allowing the country to put the
debt level on a downward trend.
Europe
Europe continues to feature prominently among the
most competitive regions in the world, with 12 European
countries among the top 20, as follows: Switzerland
(2nd), Denmark (3rd), Sweden (4th), Finland (6th),
Germany (7th), the Netherlands (8th), the United
Kingdom (12th),Austria (14th), Norway (15th), France
(16th), Belgium (19th), and Iceland (20th). However, thepicture for Central and Eastern Europe is bleaker, with
several countries losing positions in the rankings echo-
ing the recent economic downturn in the region.
The United Kingdom falls three positions to
12th place this year.Among the country’s notable
strengths is the efficiency of its labor market (ranked
8th), standing in contrast to the rigidity of many other
EU countries. In addition, notwithstanding the recent
financial crisis, the United Kingdom’s financial markets
continue to be assessed as among the most efficient in
the world, although they have slipped from 2nd to 5th
place since last year, attributable to rising concerns in
the business sector about the soundness of banks and the
ease of access to various forms of capital.The United
Kingdom is also harnessing the latest technologies for
productivity improvements; it is ranked 8th on the
technological readiness pillar. On the other hand, the
country’s greatest weakness remains its macroeconomic
environment (ranked 58th), with low national savings, a
growing public-sector deficit, and consequential public
indebtedness.A more detailed analysis of the United
Kingdom’s competitiveness can be found in Box 1.
France is ranked 16th in this year’s GCI, up twoplaces from last year and demonstrating a number of
competitive strengths.The country’s infrastructure is
among the best in the world (ranked 2nd), with out-
standing transport links, energy infrastructure, and com-
munications.The health of the workforce and the quality
and quantity of education provision are other clear
strengths (ranked 9th for health and primary education
and 16th for higher education and training), ensuring a
healthy and educated workforce. In addition, the sophis-
tication of its business culture (9th in the business
sophistication pillar) and its leadership in the area of technological innovation (16th in the innovation pillar)
are important attributes that have helped to boost the
country’s growth potential.
On the other hand, a number of weaknesses are
hindering the country from unleashing its competitive
potential. France’s labor market flexibility continues to
be ranked very low (131st) because of the rigidity of
wage determination, high nonwage labor costs, and the
strict rules on firing and hiring, as well as the poor labor
employer relations in the country. It is clear that struc-
tural reforms in this area, long mooted, are long overdue.
Another area of concern is macroeconomic stability
(65th): the government budget deficit and the related
public-sector debt ratio remain large, and the national
savings rate, while growing, still remains low by interna-
tional standards.
In spite of the economic slowdown recently
observed in Spain, the country remains stable at 29th
place. Spain’s competitiveness performance continues to
be boosted by the large market (12th) available to its
national companies; a highly sophisticated business sector
(24th), which is effectively leveraging ICT and exoge-
nous technology (29th in the technological readinesspillar); first-class infrastructure (22nd); good-quality
higher education and training (30th); and strong macro-
economic fundamentals (30th). On a more negative
note, its institutional environment (43rd) and innovation
potential (39th) could be strengthened to further buttress
its economic potential.And the greatest area of concern
remains the highly inflexible labor market (126th), a
matter of particular concern given the recently rising
unemployment in the country.
On a less positive note, Italy (ranked 49th) is down
by three places this year.The country continues to do
well in more complex areas measured by the GCI, par-
ticularly the sophistication of its businesses environment.
Italy is ranked 21st for its business sophistication, pro-
ducing goods high on the value chain using the latest
19
1 . 1
: T h e
G l o b a l C o m p e t i t i v e n e s s I n d e x
The Global Competitiveness Report 2008-2009 © 2008 World Economic Forum
8/2/2019 Competiveness Index
http://slidepdf.com/reader/full/competiveness-index 18/39
20
1 . 1
: T h e
G l o b a l C o m p e t i t i v e n e s s I n d e x
Over the past decade, the United Kingdom (UK) has seen a peri-
od of rapid growth. GDP per capita increased more than in most
European Union (EU) and G7 economies, and the country has
undergone profound shifts as it took advantage of globalization.
Yet despite this positive growth trend, the United Kingdom’sranking in the Global Competitiveness Index (GCI) has dropped
by 10 positions since 2006, to 12th place this year.1
There is no doubt that the UK economy benefits from a
number of clear assets. Liberal policies in the area of trade and
investment ensured efficient markets for goods and services
through high levels of domestic and foreign competition. This in
turn increased productivity. The country’s highly sophisticated
financial institutions took advantage of the increasing interna-
tionalization of financial flows to strengthen London’s position
as a key global financial center. The highly flexible and efficient
labor markets, ranked 8th, enabled the shifting of workers from
declining manufacturing industries to the rapidly growing serv-
ices sector. As a result, unemployment was at a low 5.3 percent
in 2006 despite considerable migration from Eastern Europe
after the 2004 EU enlargement. All of these attributes con-
tributed to healthy and stable economic growth over the past
decade. Yet GDP growth in 2008 is now expected to be less than
half the rate registered in 2007,2 in large part because of the
impact of the present financial crisis. This has highlighted the
importance of addressing a number of challenges to improve
the United Kingdom’s competitiveness and better buttress the
economy from future shocks.
Among the pillars of the GCI, the macroeconomic environ-
ment remains the weakest aspect of the UK competitiveness
assessment. The United Kingdom ranks 58th on this pillar, downby 10 positions from last year. The significant and increasing
budget deficit, ranked 105th and amounting to over 3 percent of
GDP in 2007, has contributed to this worsening assessment. And
although the 2008 budget is committed to tighter fiscal policy
over the next two years, the efficiency as well as the quantity of
spending are of concern: business leaders consider govern-
ment spending to be increasingly wasteful, with the United
Kingdom placing 76th on the related indicator, down from 40th
last year. A recent OECD report echoes this perception,3 in par-
ticular for publicly funded services such as the health sector.4
Improving spending efficiency will be particularly important in
the shorter term, because the current economic downturn islikely to decrease tax revenues.5 Over the longer term, the aging
of the population will put additional pressures on the budget.
The institutions pillar is another component of the GCI that
stands out for its fairly weak and deteriorating assessment in
the case of the United Kingdom. The country places 25th this
year, 12 positions below last year’s ranking. The more fragile
security situation following the 2005 terrorist attacks, and the
threat of new attacks, impose significant costs on business, as
reflected in the rank of 124 on the related indicator. More gen-
erally, the business community has less faith in government
institutions than in the past: there is less trust in politicians, and
a feeling that policymaking is more opaque.
As mentioned above, the financial markets remain one of
the competitive advantages of the United Kingdom. However,
compared with last year, there has been a notable weakening of
this area as measured by the GCI. Specifically, the assessment
of the overall sophistication of financial markets has droppedfrom 2nd to 5th place over the past year. This drop is linked to
less easy access to various forms of capital and to rising con-
cerns in the business sector about the soundness of banks
(falling by 40 positions to 44th place), not surprising given the
collapse or near collapse of significant financial institutions in
the country. In response to this development, the government
has initiated substantial changes to the financial regulatory
framework.
Another area for reform, as indicated by the GCI, is the
educational system. Enrollment rates in secondary and, to a
lesser extent, tertiary education are below the average of the
EU15 countries, ranking 34th and 26th, respectively. This may
lead to skills shortages in the future, particularly as the quality
of the educational system is not among the world's best, with
overall quality ranked 28th and the quality of math and science
education 47th. A more efficient use of talent could be achieved
through efforts to increase social mobility, as the socioeconom-
ic background of a student is currently quite decisive for his or
her educational attainment.
In light of the present economic downturn, policy priorities
will certainly focus on supporting a rapid return to past growth
rates. Yet it is equally important not to neglect these fundamen-
tal challenges that undermine the country’s underlying competi-
tiveness and may put longer-term growth at risk.
Notes
1 The United Kingdom was 2nd in the 2006 edition of the GCI and
9th last year.
2 IMF 2008b.
3 OECD 2007.
4 In 2005 public expenditure on health amounted to 7.2 percent of
GDP (OECD 2008).
5 Increasing efficiency is also a more appropriate policy response
than fiscal tightening given the slowing economy.
Box 1: The United Kingdom: Ensuring its future competitiveness
The Global Competitiveness Report 2008-2009 © 2008 World Economic Forum
8/2/2019 Competiveness Index
http://slidepdf.com/reader/full/competiveness-index 19/39
production processes, thanks also to strong business clus-
ters. However, Italy’s overall competitiveness performance
is held back by some critical structural weaknesses in the
economy.The labor market remains among the most
rigid in the world, with Italy ranked 129th out of 134
countries for its labor market flexibility, creating a large
hindrance to job creation.Another problematic area is
its weak public finances and extremely high levels of public indebtedness (ranked 123rd on this indicator),
related to the inefficient use of public resources (it is
ranked 128th for the wastefulness of government spend-
ing). Other institutional weaknesses are its high levels of
corruption and organized crime and a perceived lack of
independence within the judicial system, which increase
business costs and undermine investor confidence.
Among the 12 countries that joined the European
Union (EU) since 2004, Estonia (ranked 32nd) contin-
ues to be, by a significant margin, the most competitive
economy, despite a fall of five places in the rankingssince last year.Estonia has built up efficient government
institutions (ranked 23rd) and well-functioning markets.
The government manages public finances adeptly and
has been successful in its efforts to make Estonia one of
the most aggressive countries in adopting new tech-
nologies for productivity enhancements (17th).The drop
in the country’s ranking is mainly attributable to a lower
government budget surplus and increasing inflation, and
echoes the recent economic downturn in the Baltic
region.This stands in contrast to Bulgaria (ranked
76th), one of the newest and the lowest ranked EU
members. Bulgaria’s low ranking is attributed, among
other factors, to infrastructure inadequacies and institu-
tional weaknesses including burgeoning corruption.
However, on a positive note, Bulgaria has moved up
four places in the rankings since last year, an improve-
ment possibly linked to the perceived benefits brought
about by accession, a trend also witnessed in Romania
(up six positions at 68th position), the other new EU
member since 2007.
Russia is ranked 51st, up seven places from last year.
Russia’s main strengths are its large market size and
improving macroeconomic stability (partly thanks towindfall oil revenues). However, to improve its competi-
tiveness further, the country must tackle a number of
structural weaknesses. Of major concern is a perceived
lack of government efficiency (116th), the lack of inde-
pendence of the judiciary in meting out justice (109th),
and more general concerns about government favoritism
in its dealings with the private sector. Private institutions
also get poor marks, with corporate ethics in the coun-
try placing Russia 112th overall on this indicator. In
addition, goods and financial markets are inefficient by
international standards (ranked 99th and 112th respec-
tively).All these areas make it very difficult to do busi-
ness in the country and should be addressed to place
Russia on a more sustainable development path going
forward.
After improving last year, Turkey (63rd) has
dropped by 10 places in the rankings this year.Turkey
continues to benefit from its large market, which is
characterized by relatively high competition (46th).
However, some more basic issues must still be tackled,
such as upgrading the quality of infrastructure (especial-
ly ports and the electricity supply), improving the
human resources base through better primary educationand better health care (78th), addressing the burgeoning
inefficiencies in the labor market (125th), and reinforcing
the efficiency and transparency of public institutions.
Indeed, there has been measurable decrease since last
year in the public’s trust in government institutions,
demonstrated by a drop in rank from 57th to 82nd on
this subpillar, likely related in part to recent political tur-
bulence, such as the failed attempt to ban the ruling
party.The overall drop in rank can also be traced to a
weakening of the country’s perceived financial market
efficiency (which fell from 61st to 76th place), with adrying up of credit through the banking sector and
increasing concerns about the soundness of banks more
generally in the country.
Latin America and the Caribbean
As was the case last year, the important progress recently
made by Latin America in improving its macroeconomic
stability and ensuring more stable growth does not seem
to be fully reflected in the competitiveness performance
of the region, as appraised by the GCI.21 Only Chile, at
28th, continues to feature among the most competitive
economies in the world, followed by the small Caribbean
economies of Puerto Rico (41st) and Barbados (47th),
and showing a significant gap with respect to the second
highest ranked Latin American country,Panama (58th).
Costa Rica (59th), Mexico (60th), and Brazil (64th) also
figure in the top half of the rankings.
Chile remains at a comparatively high rank of 28,
despite a fall of two places since last year, and is once
again leading the region and most of the world in com-
petitiveness.The country’s remarkable success story has
much to do with its sound macroeconomic manage-
ment, coupled with timely market liberalization andopening to trade, all taking place within the context of
a transparent and predictable regulatory framework.
Specifically, Chile has successfully laid most of the basic
foundations for competitiveness, including strong
macroeconomic fundamentals (14th), well-developed
infrastructure (30th), efficient institutions (37th), and a
good health-care system (31st in the health subpillar).
Moreover it displays efficient goods (26th) and labor
(17th) markets, together with a fairly sophisticated
financial market (29th), buttressed by the largest pension
industry in the region (worth over 60 percent of GDP).22
All of these attributes have contributed to Chile’s “Asian
style” growth rates for the past 25 years.
The current challenge for Chile, which is bound to
become even more pressing as the country moves up
21
1 . 1
: T h e
G l o b a l C o m p e t i t i v e n e s s I n d e x
The Global Competitiveness Report 2008-2009 © 2008 World Economic Forum
8/2/2019 Competiveness Index
http://slidepdf.com/reader/full/competiveness-index 20/39
the growth path and gets closer to the technological
frontier, relates to the quality of its educational system.
Both basic (105th) and higher (50th) education receive
middling to poor marks,which bodes poorly for the
country’s capacity for knowledge generation and inno-
vation. In particular, a well-functioning higher educa-
tional system producing a sufficient pool of skilled
workers (especially scientists and engineers) is crucialnot only to address the changing needs of an efficiency-
driven production system, but also to provide the neces-
sary environment for technology absorption. Although
Chile has significantly increased its investment in educa-
tion in recent years, accompanied by rising educational
attainment rates, much remains to be done to catch up
with the standards of countries such as Korea, Israel, and
the European Nordic countries, presently the world
leaders in this area.
Down five places from last year and now ranked
41st, Puerto Rico is the second highest ranked econo-my in Latin America and the Caribbean.The island’s
competitiveness continues to rest on its well-functioning
goods (29th), labor (37th), and financial (30th) markets,
coupled with a dynamic and sophisticated business
sector (28th), which displays an important innovative
potential (30th).Within the Caribbean, Barbados is
also very successful by regional standards, moving up
three places to 47th this year.The rather worrisome
macroeconomic weaknesses displayed by the country
(114th) are counterbalanced by its excellent institutional
environment (20th), first-class infrastructure (24th), and
high-quality primary (5th) and higher (29th) education,
among other factors.
Panama, fairly stable at 58th, and Costa Rica, up
four positions to 59th, are the most competitive coun-
tries in Central America. Costa Rica, in particular, has
showed an impressive upward trend in the past few years, gaining a total of nine positions since 2006.The
country’s main competitive advantages can be found in
its fairly efficient institutions (50th), relatively good pri-
mary (36th) and higher (49th) educational systems, flex-
ible labor markets (35th), and the impressive sophistica-
tion (42nd) and capacity for innovation (38th) displayed
by its business sector.The country has also made impor-
tant progress toward macroeconomic stability, improving
its ranking significantly from 111th in 2007 to 85th in
this area. For a more detailed analysis of Costa Rica’s
competitiveness performance, see Box 2.Mexico, with a fairly stable score, loses eight
positions from last year, and is now placed 60th.The
country has made impressive strides toward macroeco-
nomic stability (reflected in a relatively strong 48th
position in the macroeconomic stability pillar) and
toward opening, liberalizing, and diversifying its economy
over the last decade, emerging as the second-largest
economy after Brazil and the top FDI destination in the
region.23 Mexico has been able to leverage its privileged
22
1 . 1
: T h e
G l o b a l C o m p e t i t i v e n e s s I n d e x
Blessed with rich natural resources and long standing political
stability, Costa Rica is assessed by the GCI as one of the most
competitive economies in Latin America and the Caribbean; at
59th position, it comes in ahead of Mexico (60th) and Brazil
(64th), among others. Furthermore, an analysis of Costa Rica’s
evolution in the rankings over the last three years highlights a
remarkable upward trajectory, with a nine-place improvement
since 2006.The unique development strategy followed by the country
since its return to democracy in 1948 has allowed it to build up
important competitive strengths, thus providing the rest of the
region with best practices examples in dimensions as diverse
as education, public governance, and product and export diver-
sification.
The importance of good governance standards,1 as well as
high-quality education, are seen as prerequisites for a viable
democracy, sustained growth and development. These ele-
ments have consistently underpinned the country’s policy agen-
da over the decades. In particular, the early and steady focus
on education, with the creation of the first public university in
1940 (the University of Costa Rica) followed by three more in the
1970s, and the establishment of world-class private higher edu-
cation and training and research institutions—such as INCAE,
EARTH University, and INBio—equipped the productive system
with a relatively large pool of highly qualified professionals.2
The policy agenda has placed particular emphasis on
diversifying the economy away from commodities toward more
value-added products. In this sense, Costa Rica has been par-
ticularly successful in nurturing its high-tech sector over the
last 15 years, with high-tech exports accounting for 30 percentand 40 percent of total and industrial exports in 2006, respec-
tively, and with a 13 percent rise in the 2001–05 period.3 The
development of the high-tech sector has been boosted by the
establishment in Costa Rica of an important group of multina-
tionals in the 1990s, with Intel at the forefront, investing first in a
large assembly and testing plant,4 and later in a software devel-
opment center. Instrumental in bringing about this development
have been the targeted FDI promotion strategy pursued by the
national investment promotion agency CINDE, the export fiscal
incentives (namely the Export Processing Zone and the Export
Contract regimes) adopted in the 1990s in parallel with trade lib-
eralization,5 and Costa Rica’s geographical location and strong
transportation logistics. Also critical have been the country’s
political stability and respect for the rule of the law, coupled
Box 2: Costa Rica: A Central American success story in competitiveness
The Global Competitiveness Report 2008-2009 © 2008 World Economic Forum
8/2/2019 Competiveness Index
http://slidepdf.com/reader/full/competiveness-index 21/39
23
1 . 1
: T h e
G l o b a l C o m p e t i t i v e n e s s I n d e x
with the availability of a relatively low cost and educated labor
force with good English language skills.
CINDE targeted high-tech FDI with a view toward diversi-
fying Costa Rica’s production structure away from agriculture
and unskilled labor-intensive manufacturing (i.e., apparel pro-duced in the maquiladoras ), in which the country was already
losing its competitiveness, to skill-intensive industries. This
leveraged the country’s educated labor force and ensured a
more advantageous position in international markets. FDI was a
crucial component of the cluster strategy envisaged by CINDE,
since they were to develop backward linkages through the
domestic suppliers and foster training and collaboration with
national universities.
Another cluster that has been targeted and developed in a
similar spirit of promoting higher value added industries is that
surrounding the eco-tourism industry. Building on Costa Rica’s
extraordinary biodiversity (accounting for 5 percent of the
world’s total biodiversity), natural beauty, and pristine environ-
ment, the tourism sector has experienced an impressive
dynamism in recent years, representing 6.3 percent of total GDP
and 6.5 percent of total employment in 2007. Moreover, with
1.725 million tourist arrivals in 2007, bringing in an average
US$940 in receipts per visitor, Costa Rica leads Central America
and displays a more lucrative tourism sector than Mexico, the
most-visited country in Latin America (with 21.35 million visi-
tors), for which the average receipt per visitor is only US$570.6
It is not by chance that Costa Rica, at 44th, is the second high-
est ranking country in the LAC region, after Barbados (29th), in
the World Economic Forum’s Travel & Tourism Competitiveness
Index 2008.The fairly successful economic diversification described
above feeds into strong levels of business sophistication (42nd)
and innovation (38th), particularly by regional standards.
Companies established in Costa Rica are operating quite high
on the value chain (34th), with comparative advantages based
predominantly on sophisticated products and processes (30th).
Further, their innovation capacity is assessed as being fairly
high (43rd), thanks to high R&D spending (30th) and wide-rang-
ing research collaboration with academia (33rd). The country
gets good marks in the innovation and sophistication factors
subindex (39th), the best showing across the three subindexes
composing the GCI, which bodes well for the preparedness ofCosta Rica’s economy to evolve toward a higher, innovation-
driven, stage of development.
Furthermore, Costa Rica has made important progress in
the macroeconomic aspects of competitiveness, consistently
improving its public finances over the last three years: public
debt has been brought down from 55.2 percent of GDP in 2005 to
46.6 percent in 2007, while the government budget balance has
been turned from a 1.6 percent (of GDP) deficit in 2005 to a 0.6
percent surplus in 2007. This has been facilitated by the strong
growth experienced by the country in the last couple of years,
but is also indicative of the current government’s effective tax
administration, with reduced tax evasion and tight control on
nonpriority spending.7
On a less positive note, inflation continues to be a source
of concern at 9.4 percent in 2007, reflecting high oil and food
prices worldwide. Moreover, the poor state of the country’s
infrastructure (94th) looms as a potential bottleneck for the fur-
ther modernization and diversification of the economy, as well
as for its overall growth prospects. The adoption of fiscal
reforms broadening the tax base should therefore be high on the government’s agenda in order to free up important
resources for investment in infrastructure and social programs,
while not increasing the debt burden.
In addition, the long-awaited ratification of the Dominican
Republic-Central American Free Trade Agreement (DR-CAFTA)
could prompt the politically thorny liberalization of the telecom-
munications and insurance sectors, traditionally closed to private
investors, thus enhancing their efficiency and eliminating impor-
tant rigidities in the goods market.8 This should be done in par-
allel with efforts to reduce red tape and excessive regulation.
This area remains a major concern in the country, as reflected
by the disappointing marks registered by Costa Rica in aspects
such as the number of procedures to start a business (12, cor-
responding to 103rd position), the time required to start a busi-
ness (77 days, corresponding to 118th place), and the burden of
government regulation (72nd).
By tackling such weaknesses, Costa Rica will further
strengthen the foundations of its competitiveness and ensure
sustained economic growth and prosperity going forward.
Notes
1 The focus on good governance is reflected in the comparatively
good marks the country gets for several aspects of its institutional
environment, in particular public ethics (41st), undue influence(34th), and government efficiency (47th). This stands in marked
contrast with the performance of other countries in the region.
2 In this respect, Costa Rica is ranked 46th for its availability of sci-
entists and engineers, only behind Puerto Rico (12th) and Chile
(35th) in the region, and well above countries such as Argentina
(81st), Peru (103rd), and Mexico (105th).
3 Reyes and Condo 2007.
4 Intel has invested a record US$700 million since 1996 and is cur-
rently employing around 3,500 people in the country. The spillovers
of Intel’s investment in Costa Rica were many and diverse, ranging
from a simplification of FDI regulation to creating specialized
degrees in national universities and catalyzing further FDI in the
country. In this respect, IT companies such as DSC
Communications Corp., Remec, Sawtec Inc., Merrimac Industries,
and Abbot and Baxter invested in the country, followed by Procter& Gamble, Western Union, and Sykes, which established service
centers.
5 See Rodríguez-Clare 2001.
6 World Travel & Tourism Council, TSA Research 2007.
7 IMF 2008a.
8 Costa Rica was the last country among the signatories to ratify the
DR-CAFTA, thanks to a narrow yes vote (51.6 percent) in a referen-
dum called by President Arias in October 2007. Costa Ricans were
bitterly divided on the agreement, because of the clauses impos-
ing the liberalization and opening of the sensitive sectors of
telecommunications, financial services, and energy.
Box 2: Costa Rica: A Central American success story in competitiveness (cont’d.)
The Global Competitiveness Report 2008-2009 © 2008 World Economic Forum
8/2/2019 Competiveness Index
http://slidepdf.com/reader/full/competiveness-index 22/39
geographical position between two oceans as well as
between Latin and North America, its impressive net-
work of preferential trade agreements, and its large
domestic market of over 100 million people (ranked
12th in the world) to diversify its productive and export
structure away from commodities: according to the
Economist Intelligence Unit (EIU), 81 percent of
Mexico’s total exports in 2007 were in manufactures.This is also reflected by the country’s fairly good marks
for its business sophistication (58th), with reasonably
developed clusters (58th), quality local suppliers (46th),
and the fact that it has begun producing goods that are
higher on the value chain (59th).
On the other hand, a number of important weak-
nesses continue to hinder Mexico’s competitiveness.
These include its weak public institutions (97th) and
rampant violence (123rd).Also problematic is its inflexi-
ble labor market (99th), characterized by burdensome
labor regulations and high payroll taxes and social con-tributions, as well as a higher education and training sys-
tem (74th) that does not provide the economy with the
appropriate pool of skilled labor, notably scientists and
engineers (105th). In addition, the goods market suffers
from inadequate (foreign and domestic) competition,
with overregulated and closed key economic sectors
such as telecommunications and energy.The current
administration has managed to pass some bills aimed at
addressing some of these concerns, including reforms in
the pension, fiscal, electoral, and criminal justice systems
and in the energy sector. However, further action is
required to continue liberalizing markets, upgrade the
educational system, and improve public governance in
the country.
Brazil, at 64th place, posts a remarkable eight-
position improvement, partially closing the competitive-
ness gap with Mexico.The country has continued to
move in the direction of sounder public finances and
has seen improvements in many of the areas assessed by
the Index. In particular, government debt has been sig-
nificantly reduced from last year (from 65.5 percent of
GDP to 47 percent). Brazil’s main competitive advantages
include the large size of the market available to its firms(10th out of 134 economies), access to one of the most
sophisticated financial markets in the region (64th), a
dexterity in absorbing and adapting technology from
abroad and leveraging ICT (56th in the technological
readiness pillar), and especially the remarkable degree of
sophistication displayed by its business sector (35th),
together with a prowess for generating innovation (43rd).
The latter two elements are reflected in the rapid inter-
nationalization of a number of Brazilian large enterpris-
es that have become global players in the international
markets, also massively investing abroad. In this sense,
Brazil in 2006 was a net source of FDI, whereby the
outward flows amounted to US$26 billion vis-à-vis
US$18 billion of inflows.24
Despite these encouraging trends, Brazil still faces
important challenges in view of improving its competi-
tiveness further.These include the still high debt levels
(even after the reduction mentioned above), contributing
to a low national savings rate and high interest rates,
and a worrisome 122nd position in the macroeconomic
stability pillar.There is also a general distrust of public
institutions among the business community (98th),withweak public ethics (121st) and government inefficiencies
(124th) as well as serious concerns regarding the security
situation in the country (103rd). Educational standards
also require upgrading (presently ranked 85th for primary
education and 58th for higher education and training),
with high dropout rates and large regional disparities in
terms of attainment and quality. Last but not least, goods
(101st) and labor (91st) markets are hampered by over-
regulation and important rigidities, which contribute to
shifting a significant amount of activity and labor to the
informal sector. Improvements in these structural andmicroeconomic weaknesses will better prepare Brazil to
unleash its full competitive potential.
Peru is up three places to 83rd.This confirms the
notable progress toward macroeconomic stability, based
on a competent monetary and fiscal policy as well as
goods and labor market liberalization, made by the
country in recent years. Indeed, Peru has posted an
important improvement since last year in the macroeco-
nomic stability pillar (from 78th to 67th), due to
increasing public surpluses (from 2.1 percent to 3.1
percent of GDP) and the related lowering of public debt
(from 32.7 percent in 2006 to 29.2 percent of GDP
in 2007). Peru has also seen improvements in the two
pillars capturing goods and labor market efficiency
(from 67th to 61st and from 87th to 75th, respectively).
The country also continues to benefit from other com-
petitive strengths, such as the reasonable size of its both
foreign and domestic market (50th), and its fairly devel-
oped financial market (45th). Coupled with the high
growth rates realized by the country in recent years,25 as
well as the investment grade status achieved in April
2008 for its foreign currency debt, the overall picture
bodes well for Peru’s competitiveness prospects. Goingforward, a number of weaknesses will need to be
addressed, including the poor quality of the country’s
institutional environment (101st), its underdeveloped
infrastructure system (110th), and the inadequate state of
health and primary education (95th) and higher educa-
tion and training programs (89th). On a related note,
poverty levels in Peru remain critical, despite the current
administration’s efforts to increase social expenditure
and public investments in infrastructure.
Notwithstanding its strong recovery after the deep
economic crisis of 2001, with high growth rates since
2003,26 Argentina continues to place quite low in the
rankings at 88th position, with an assessment similar to
last year.The country has a number of important com-
petitive advantages, including its relatively well educated
24
1 . 1
: T h e
G l o b a l C o m p e t i t i v e n e s s I n d e x
The Global Competitiveness Report 2008-2009 © 2008 World Economic Forum
8/2/2019 Competiveness Index
http://slidepdf.com/reader/full/competiveness-index 23/39
labor force (ranked 61st and 56th, respectively, on the
health and primary education, and higher education and
training pillars) and the large market size available to its
enterprises (24th). However, the economy is character-
ized by some serious weaknesses, representing enduring
elements of vulnerability going into the future. For
example, despite debt restructuring, the public debt
remains high, estimated at 56.1 percent of GDP in 2007(placing the country 97th on this indicator); this, com-
bined with continuing high inflation,may undermine
the steps taken toward macroeconomic stability.
On a related note, the GCI highlights a deep dis-
trust on the part of the business community regarding
the quality and efficiency of the country’s public institu-
tions (128th), the respect and enforcement of the rule of
law, and the even-handedness of the public sector in its
relations with the private sector.This is likely linked to
the government’s tendency over recent years to adopt
discretionary policies (such as the attempt to increasetaxes on agricultural exports), coupled with the ongoing
renegotiation of a number of utility provision contracts
since 2001, eroding business confidence. Indeed, this
tendency can also be seen in the country’s overregulated
and rigid goods (122nd), labor (130th), and financial
(117th) markets, which are impeded from allocating
resources to their most effective use. In this context, the
most pressing challenges will be the institutionalization
of sound fiscal policies and the restoration of investors’
trust in the business climate and proper functioning of
the economy.
Venezuela, at 105th place, continues to fall in the
rankings, a trend seen over the past several years.This
year the country has fallen seven more places despite
some marginal improvements in its health and primary
education standards and in the quality of the higher
education and training system.This is due in large part
to the fact that, despite windfall oil revenues, the macro-
economic environment continues to deteriorate: expan-
sionary fiscal policies and discretionary administrative
measures have led to increasing levels of public indebt-
edness and rampant and increasing inflation (ranked
132nd).Related to the poor fiscal and monetary manage-
ment, as last year,Venezuela ranks last out of all countries
for the perceived quality of its institutions, reflecting the
business sector’s enduring concerns about the weak rule
of law, government inefficiencies, and the government’s
lack of evenhandedness in its dealings with the private
sector.There has been an increase in red tape, and
goods, labor, and financial markets are not able to effec-
tively allocate resources in the economy, with goods
(132nd) and labor (131st) markets in particular assessed
as among the least efficient in the world. Structural
reforms are clearly needed to address the growing dis-
tortions in the economy and the high vulnerability to
changes in oil prices. Competitiveness would also be
improved if the increased public spending on health and
education were better targeted. Perhaps most important
would be actions to restore investors’ confidence in the
business environment and the rule of law in the country.
Suriname (103rd), Ecuador (104th), Bolivia
(118th), Nicaragua (120th), and Paraguay (124th)
continue to figure at the bottom of the GCI rankings,
displaying similar weaknesses in their poor institutional
environments and lack of respect for the rule of law,excessive red tape and overregulated markets, underde-
veloped infrastructure and inefficient educational systems.
Asia
The competitive performances of Asia-Pacific economies
continue to encompass the entire gamut, from highly
competitive countries to the most challenged. Singapore,
Hong Kong (11th), and Australia (18th) continued their
ascent in the rankings while Japan, Korea (13th), and
Taiwan (17th) dipped in their positions. Nine Asia-Pacific
countries are among the top 30, led by Singapore andfollowed by Japan, Korea, Hong Kong,Taiwan,Australia,
Malaysia (21st), New Zealand (24th)—and this year
China enters the top 30, displacing Thailand (34th).
Other members of the next tier include new entrant
Brunei (39th) as well as India (50th), Indonesia (55th),
Vietnam (70th), the Philippines (71st), and Sri Lanka
(77th). Pakistan (101st) declined in the rankings to join
those countries ranked 100 and below, which include
Mongolia (100th), Bangladesh (111th), Cambodia
(109th), Nepal (126th), and Timor-Leste (129th).
Hong Kong SAR, at 11th place, leads the world
in financial market sophistication and also benefits from
very efficient goods markets and a high level of macro-
economic stability.With regard to financial markets,
Hong Kong is ranked 1st for its legal rights, capital flows,
and access to financing through the local equity market.
And Hong Kong’s goods markets are characterized by
openness to foreign ownership, extremely low tariffs,
and low trade barriers (ranked 1st in these indicators).
The country ranks 3rd for its macroeconomic stability,
due to its excellent fiscal management which has result-
ed in a notably low level of government debt, and an
improving macroeconomic environment more generally.On the other hand, Hong Kong’s competitive dis-
advantages stem primarily from its small domestic mar-
ket size and its mixed performance in the areas of health
and primary education as well as higher education and
training. On health, although life expectancy in the
country is among the highest in the world, there are
some concerns related to high rates of diseases such as
tuberculosis (ranked 79th) and malaria (ranked 66th).
And attainment rates remain quite low at all levels of
the educational ladder, with primary, secondary, and ter-
tiary enrollment rates so low as to place Hong Kong
101st, 72nd, and 63rd, respectively.
Korea, at 13th place, derives its strong position
from attributes such as its macroeconomic stability and a
very innovative business sector. Korea’s macroeconomic
25
1 . 1
: T h e
G l o b a l C o m p e t i t i v e n e s s I n d e x
The Global Competitiveness Report 2008-2009 © 2008 World Economic Forum
8/2/2019 Competiveness Index
http://slidepdf.com/reader/full/competiveness-index 24/39
environment is characterized by government budget
surpluses, which have led to the reduction of the public
debt, a high national savings rate, and a very low interest
rate spread (ranked 3rd on this indicator).The country is
also highly innovative, with high company spending on
R&D and a strong government focus on procuring
advanced technology products (ranked 2nd), which have
contributed to the country becoming one of the mostinnovative in the world (ranked 7th for utility patents).
Korea’s competitiveness would be strengthened further
by addressing a number of weaknesses,most notably
inefficiencies in its financial and labor markets.
Taiwan, China, at 17th place, down three places
from last year, draws its greatest competitive strengths
from its education sector and related business innovation.
With regard to education,Taiwan has high enrollment
rates at all levels, and the educational system gets good
marks for quality (although the quality rating is weaker
than in past years). In addition, companies provide ahigh level of continuing on-the-job training, ensuring
that the workforce can adapt to the rapidly changing
economy. Related to innovation,Taiwan has a large pool
of scientists and engineers, and it benefits from high
company spending on R&D and strong collaboration
between research institutes and the business sector in
innovation.All of this has come together to place
Taiwan 1st worldwide in terms of the patenting per
capita of new inventions.
On the other hand,Taiwan’s financial markets rep-
resent a comparative weakness, with concerns about the
soundness of banks (ranked 117th) and the restriction of
capital flows (78th). Similarly, public institutions could
be further strengthened.The drop of three places in the
rankings is due in large part to a deterioration of various
aspects of the institutional environment, with relatively
low public trust in politicians, some concerns about a
lack of judicial independence, and increasing complaints
about the regulatory burden faced by companies operat-
ing in the economy.
Australia, at 18th place, draws its strongest com-
petitive advantages from the excellent functioning of its
goods, labor, and financial markets. In terms of financialmarket sophistication, the country ranks 3rd for the reg-
ulation of its securities exchanges and for legal rights,
and 4th for the soundness of its banks. Australia’s goods
markets are characterized by the ease of starting a busi-
ness: the number of procedures and the time required to
start a business are both ranked 1st internationally.And
labor markets are very flexible, characterized by signifi-
cant ease in hiring and firing employees and a lack of
nepotism in the business sector by international standards.
Australia also has very strong private institutions, ranked
2nd for the efficacy of its corporate boards and 3rd for
the strength of auditing and reporting standards in the
country. Higher education and training is also an area of
strength, with high enrollment rates at all levels, and
very good marks for the quality of the educational system
(ranked 9th).
Malaysia, at 21st place, also benefits from the
excellent functioning of its goods, labor, and especially
financial markets. Labor markets are well evaluated for
their efficiency (19th), with a strong relationship
between productivity and pay (6th) as well as good
cooperation in labor-employer relations (13th).Goodsmarkets are assessed as efficient (23rd) with strong com-
petition and business-friendly taxation.The financial
market continues to perform well, clearly well recovered
from the 1998 financial crisis, and is ranked 16th inter-
nationally for its sophistication, with a sound banking
sector and a relative ease of access to various forms of
finance for business development.Other strengths
include the quality of the country’s transport infrastruc-
ture and its strong business sophistication and innovative
potential, which have contributed greatly to the coun-
try’s growth over recent years.On the other hand, efforts should be made in the
area of education, where attainment rates at the second-
ary level remain low; and also in addressing the relatively
poor health of the workforce. Finally, greater fiscal disci-
pline would better ensure sustainable macroeconomic
stability going into the future, with repeated govern-
ment deficits (ranked 109th) to build up substantial gov-
ernment debt over the years.
New Zealand, at 24th place, benefits from the
excellent health of its workforce as well as the high
quality and quantity of education provided.The country
also has transparent and well-functioning institutions—it
is ranked 1st for its judicial independence, for example,
and has very strong private institutions (ranked 3rd for
the efficacy of corporate boards and 4th for the protec-
tion of minority shareholder interests). New Zealand’s
financial, goods, and labor markets are also highly effi-
cient, with excellent investor protection and legal rights,
low agricultural policy costs (ranked 1st on this indica-
tor), few obstacles to starting a business, and very low
trade barriers.The country’s competitiveness would be
enhanced by upgrading infrastructure, especially roads
and the electricity supply.China enters the top 30 this year, up four places
from last year.The country benefits greatly from its large
and rapidly growing foreign and domestic market size
(ranked 1st and 2nd, respectively), allowing for signifi-
cant economies of scale. Macroeconomic stability also
remains a source of competitive advantage,with the
government budget moving into surplus, and manage-
able debt levels, although rising inflation has become an
area of concern, as in many other countries. Innovation
is becoming another competitive advantage, with rising
company spending on R&D coupled with strong uni-
versity-industry research collaboration, and an increasing
rate of patenting.
China’s key competitive weakness is related to its
financial market (109th), with restricted capital flows
26
1 . 1
: T h e
G l o b a l C o m p e t i t i v e n e s s I n d e x
The Global Competitiveness Report 2008-2009 © 2008 World Economic Forum
8/2/2019 Competiveness Index
http://slidepdf.com/reader/full/competiveness-index 25/39
(ranked 121st), inadequate regulation of securities
exchanges (ranked 109th), and concerns about the
soundness of the banking sector (ranked 108th). Related
to these weaknesses is the need to strengthen private
institutions (ranked 77th), with insufficient protection of
minority shareholders’ interests (ranked 94th), inefficient
corporate boards (90th), and weak accounting and
auditing standards (86th).And, given the increasingimportance of innovation for the country’s competitive-
ness, improving higher education and training should be
a priority to address the low enrollment rates at the sec-
ondary and tertiary levels, and to upgrade the quality of
the educational system more generally. See Box 3 for
more details about China’s competitive performance.
Thailand, ranked 34th, has fallen six places since
last year.The country derives certain competitive strengths
from its market size as well as the efficiency of its labor
market (ranked 13th), the result of strong cooperation in
labor-employer relations (ranked 17th) and low non-wagelabor costs (ranked 20th), for example.The country’s
infrastructure is also very good, particularly roads and air
transport. But the country lags in technological readiness
(66th), with low penetration rates for Internet use,
broadband, and mobile telephones in particular.The
health of Thailand’s workforce is another area of con-
cern (ranked 76th), with high rates of HIV, tuberculosis,
and malaria (ranked 108th, 96th, and 93rd, respectively).
Some aspects of the financial market also require atten-
tion, especially concerns about the soundness of the
banking sector. Given the political turmoil experienced
over the past year, it is notable that the decline in the
overall ranking this year can be traced in part to a weak-ening assessment of government institutions, with
increasing concerns about the transparency of policy-
making and public-sector efficiency more generally.
Brunei Darussalam enters the rankings for the
first time this year at 39th place, buoyed by its strong
macroeconomic stability, where it ranks 2nd internation-
ally, thanks to its high government surplus and the
complete absence of public debt. However, important
competitive disadvantages abound, particularly regarding
the sophistication of business operations and strategy
(ranked 97th) as well as innovation and goods marketefficiency (ranked 91st in both pillars).
India, at 50th place, derives substantial advantages
not only from its market size (ranked 4th for its domes-
tic market size and 5th for its foreign market size) but
also from its strong business sophistication (ranked 27th)
27
1 . 1
: T h e
G l o b a l C o m p e t i t i v e n e s s I n d e x
With annual average growth rates of 9.7 percent since the late
1970s, China has made impressive strides in developing and
diversifying its economy, as well as in reducing poverty and
improving standards of living for its population.1 Its enormous
GDP, estimated at US$3.3 trillion in 2007,2 makes China one of
the largest economies in the world, behind only the United
States, Japan, and Germany, and an increasingly key player in
the global economy. The size of the (domestic and export) mar-
ket available to the companies established in its territory is sec-
ond only to that of the United States globally, allowing extraordi-
nary economies of scale and efficiency gains.
China ranks 30th in the Global Competitiveness Index (GCI)2008–2009, up four positions from last year, entering the group
of the 30 most competitive nations in the world, and well ahead
the other three BRIC economies of India (50th), Russia (51st),
and Brazil (64th).
This remarkable showing should not deemphasize the
enormous challenges that face China in maintaining its compet-
itiveness, in view of sustaining its rapid growth and moving up
the value chain. As wealth is created, wages rise inexorably.
Productivity must increase in line with rising prices and wages,
as well the added value, quality, and diversity of the national
production system. Practically, this means two things for China.
First, the country must bolster the basic foundations of its com-
petitiveness, namely the quality of its institutions, infrastructure,
public health, and primary education, which are still very much
lagging behind international norms, while maintaining sound
macroeconomic management. Further, it needs to improve its
efficiency-enhancing factors, notably the quality of higher
education and its capacity to leverage information and commu-
nication technologies (ICT) and other technologies coming
from abroad, as well as the efficiency of the goods, labor, and
financial markets.3
Starting from the basic requirements of competitiveness,
the quality of the institutional environment appears to be
improving in the country, as reflected by an encouraging 21-
place improvement in the institutions pillar since 2007. Although
business executives in China estimate that there has been astrengthening in property rights and intellectual property pro-
tection, as well as public ethics and government efficiency,
the overall rank of 56 points to the need for further progress. In
particular, the quality of private institutions remains a concern,
notwithstanding a dramatic 41-position improvement (from 101st
in 2007 to 60th this year). The assessments of the country’s
auditing and reporting standards (86th), the efficacy of corpo-
rate boards (90th), and the protection of minority shareholders
(94th) indicate significant room for improvement.
China’s macroeconomic environment remains fairly favor-
able, despite the recent trend of rising inflation (4.5 percent in
2007, up from 1.50 percent in 2006), due in large part to increas-
ing food and commodity prices. The other macro indicators
point in the right direction. In 2007, the government budget
Box 3: China: An emerging giant in global competitiveness
(Cont’d.)
The Global Competitiveness Report 2008-2009 © 2008 World Economic Forum
8/2/2019 Competiveness Index
http://slidepdf.com/reader/full/competiveness-index 26/39
28
1 . 1
: T h e
G l o b a l C o m p e t i t i v e n e s s I n d e x
balance was back in the black with a surplus equivalent to 0.7
percent of GDP, compared with a deficit of 1.2 percent the previ-
ous year. The national savings rate reached a staggering 52
percent of GDP in 2007 and the interest rate spread is narrow-
ing, while government debt is down to a low 18 percent of GDP.Sound public finances should provide the country with the
resources needed to improve social services and to address
social and geographical inequalities. Indeed, China faces the
challenges of its economically lagging western and northeast-
ern regions and of widespread absolute poverty, with approxi-
mately 128 million people living on less than a dollar per day,
often without access to clean water or sufficient education and
health services;4 this is reflected in the rather poor showing in
the health subpillar (73rd).
In terms of efficiency enhancers, China presents some
serious shortcomings, notably in the financial sector, ranked a
dismal 109th this year. Efficiency and trustworthiness still lag
behind in this area, with heavy restrictions placed on capital
flows (121st) and inefficient and opaque stock exchange regula-
tions (109th). The soundness of banks is assessed equally poor-
ly, at 108th. Moreover, the country ranks 93rd for the extent to
which borrowers’ and lenders’ rights are protected by law, as
measured by the World Bank’s Legal Rights Index. However,
there are several encouraging signs. First, the government is
aware of these issues and is taking major steps to tackle the
problems, with some success as evidenced by the fact that the
country is improving in eight of the nine indicators composing
the pillar. Second, Chinese stock markets are large and active,
based on a tremendous interest from national and international
investors alike. It is expected that this will persuade the authori- ties of the need for more profound reforms.5 Finally, if access to
stock markets remains problematic, private equity and venture
capital, as alternative sources of financing, are expanding rap-
idly, as indicated by China’s 22-position leap to 49th place for
venture capital availability.6 Liberalizing, opening, and deepen-
ing financial markets should remain an absolute priority, in view
of avoiding a potential bottleneck to China’s further development.
Another area of weaknesses, although less severe, is
China’s level of technological readiness. This is critical for
China’s competitiveness given its present stage of development.
ICT, in particular, enhances productivity through facilitating bet-
ter production processes, and improves the efficiency of mar-kets and resource allocation, thereby enhancing productivity. In
addition, ICT has been shown to bring about important
spillovers, notably for reducing poverty and social inequality.
China lags behind its fellow BRIC countries in the technological
readiness pillar, at a disappointing 77th place. The country
ranks 83rd for availability of the latest technology, while foreign
investment also is not viewed as an important source of new
technology (79th). On a more positive note, Chinese firms seem
to be relatively adept at adopting the technologies once they
become available (46th). In terms of ICT infrastructure, penetra-
tion rates remain low by international standards, rendered more
difficult by the large size of the Chinese population and land
area. It is therefore encouraging that the government has
placed ICT penetration high on its agenda of reforms through
various initiatives such as the Golden Projects for E-govern-
ment.7
Domestic and foreign competition, despite some progress,
is in need of further liberalization in order to improve goods
market efficiency. Creating a business in China remains veryburdensome and time consuming, and the effective total tax
rate represents a staggering 74 percent of corporate profits,
one of the highest rates in the world (120th). Trade barriers are
also significant, with the effective trade-weighted tariff rate on
imports at over 14 percent, placing China in 122nd position on
this indicator. In addition, the labor market remains inflexible,
with costly firing procedures (108th), and non-wage labor costs
as high as 44 percent of an employee’s salary, placing China
126th.
The general portrait of China’s competitiveness as depict-
ed by this year’s GCI results is largely positive, with most indica-
tors moving in the right direction. Nevertheless, it will become
increasingly challenging to sustain its competitiveness. China is
reaching a critical point in its development, when it can no
longer rely solely on the abundance of low-cost inputs to sus-
tain growth. At home, a growing middle class is becoming ever
more discriminating, while international companies continue to
shop around for the best cost-to-productivity ratio in deciding
where to locate activities. For the time being, many factors—
including the size of its market, increasing domestic demand,
and numerous reforms—place China in a strong position to
maintain its vigorous growth and navigate the troubled global
economic landscape.
Notes
1 According to the World Bank (World Bank 2007), China alone has
been responsible for 75 percent of poverty reduction in the devel-
oping world over the last two decades.
2 IMF 2008c.
3 In the Global Competitiveness Index, this reality is captured
through the concept of stages of development: the importance of
each determinant of competitiveness shifts as a country moves up
along the value chain. See text for details. In 2005, China was still
in the most basic, factor-driven, stage of development (GDP per
capita inferior to US$2,000). China has since entered a transition
phase toward the second, efficiency-driven, stage (GDP per capita
between US$3,000 and US$9,000), which, according to the IMF,
China will reach by 2009.
4 World Bank 2008.
5 For instance, in May 2008, the total daily trading volume of the
two main Chinese stock markets (Shanghai and Shenzhen)
amounted to a record US$41 billion, more than all the other Asian
markets combined. See IASC 2008. Also, the value of Chinese ini-
tial public offerings reached US$62.1 million in 2007, a world
record. See World Bank 2008a.
6 According to a recent report by Deloitte (2007), China has become
the primary target of American venture capitalists.
7 For more information, see World Bank 2007. For a detailed assess-
ment of technological readiness across nations, see World
Economic Forum 2008.
Box 3: China: An emerging giant in global competitiveness (cont’d.)
The Global Competitiveness Report 2008-2009 © 2008 World Economic Forum
8/2/2019 Competiveness Index
http://slidepdf.com/reader/full/competiveness-index 27/39
and innovation (ranked 32nd).The country is endowed
with strong business clusters and many local suppliers,
and ranks an impressive 3rd for the availability of scien-
tists and engineers and 27th for the quality of its
research institutions.
However, India’s overall competitive position is
weakened by its macroeconomic instability (109th) with
the government running one of the highest deficits inthe world (ranked 127th), unsustainable levels of gov-
ernment debt (ranked 113th), and fairly high inflation.
Health and primary education is another area of con-
cern, with poor health indicators (ranked 105th for both
infant mortality and life expectancy), related to the high
prevalence of diseases such as tuberculosis and malaria.
Educational enrollment rates also remain low at all lev-
els, with the primary educational system in particular
getting poor marks for quality. Certain labor market
efficiency indicators are also poor, including female par-
ticipation in the labor force (ranked 122nd) and thefacility with which firms can hire and fire employees
(ranked 104th).
Indonesia, at 55th place, enjoys competitive advan-
tage in selected areas, such as labor market efficiency,
ranking 18th in pay and productivity and 19th in both
cooperation in labor-employer relations and hiring and
firing practices. In contrast, the country’s main competi-
tive weaknesses lie in the areas of technological readi-
ness, infrastructure, and the quality of public institutions.
With regard to technological readiness, Indonesia’s pen-
etration rates of ICT remain low (ranked 107th for
Internet users, 105th for personal computers, and 100th
for both mobile telephone subscribers and broadband
Internet subscribers).The country’s infrastructure also
requires upgrading, with poor ratings for the quality of
roads (ranked 105th) and ports (ranked 104th). Public
institutions would also benefit from greater efficiency,
with low rankings for the transparency of government
policymaking (121st), the protection of property rights
(ranked 117th), and intellectual property protection
(102nd).
Kazakhstan is ranked 66th in this year’s GCI, the
highest ranked country in central Asia. Kazakhstan getsexcellent marks for its labor market efficiency, which is
ranked 12th worldwide, with high levels of flexibility in
the hiring and firing process and in determining wages.
Moreover, boosted by the country’s natural resource
wealth, it benefits from a number of macroeconomic
strengths, including a balanced budget and a very low
debt-to-GDP ratio. However, rising inflation, which has
reached double digits, raises some cause for concern,
placing the country 121st on this indicator. In addition,
more will have to be done in Kazakhstan to improve
the institutional environment. Particular attention should
be focused on addressing weaknesses related to the qual-
ity of its institutions, notably judicial independence, the
protection of property rights, government inefficiency,
public trust of politicians, and security.A focus on
improving the health of the workforce and the quality
of the educational system, and placing a greater focus on
technological adoption, will also be important in the
country’s efforts to improve its competitiveness.
Vietnam, at 70th place, enjoys specific key advan-
tages in various areas, particularly related to its relatively
large market size and the functioning of its labor mar-
ket, with strong female participation in the labor force(ranked 10th) and a strong relationship between pay and
productivity in the economy (ranked 17th). But the
country’s overall competitive position is eroded by
weaknesses in the quality of infrastructure and institu-
tions, as well as in higher education and training.
Vietnam’s infrastructure gets a poor rating overall (93rd),
especially with regard to roads and port facilities. In
terms of the quality of its institutions,Vietnam suffers
from burdensome government regulation and weak
auditing and reporting standards, where it is ranked
105th and 106th, respectively.And given the increasingimportance of innovation for the country’s competitive-
ness, its low university enrollment rate (placing the
country 106th) and the poor assessment of the quality
of its educational system (ranked 120th) require urgent
attention.
The Philippines, at 71st place, benefits from its
relatively large market size (ranked 34th). In addition,
the country has seen an improvement in its macroeco-
nomic stability since last year, with a shrinking govern-
ment budget deficit and lower public debt. On the other
hand, the main obstacles to greater competitiveness are
related to the quality of the country’s public institutions
and a lack of efficiency in its labor market.The institu-
tional environment is characterized by the perception
that government spending is highly wasteful (ranked
120th), a lack of evenhandedness in the government’s
dealings with the private sector (117th), and general
concerns about corruption in the public sphere. In addi-
tion, the threat of terrorism imposes significant costs on
businesses in the country (ranked 125th).With regard to
labor market inefficiencies, wages are not flexibly deter-
mined by companies (108th), regulations impede firms
from freely hiring and firing workers (101st), and firingcosts are excessive (ranked 108th), all of which hinders
job creation.
Sri Lanka, at 77th place, has fallen seven places
since last year.The country suffers from macroeconomic
instability, ranked a low 132nd on this pillar, with the
government running budget deficits that are among the
highest in the world (ranked 130th), leading to the
buildup of high levels of public debt (nearly 84 percent
of GDP, placing the country 118th on this indicator). In
addition, lax monetary policy has produced the second
to highest inflation rate of all countries covered bar
Zimbabwe.Another area requiring urgent attention is
Sri Lanka’s labor market, which lacks flexibility and effi-
ciency (ranked 115th overall), and is characterized by
29
1 . 1
: T h e
G l o b a l C o m p e t i t i v e n e s s I n d e x
The Global Competitiveness Report 2008-2009 © 2008 World Economic Forum
8/2/2019 Competiveness Index
http://slidepdf.com/reader/full/competiveness-index 28/39
high firing costs, low female participation in the labor
force, and a very high total tax rate.
Pakistan, at 101st place, benefits from its large
market size (ranked 29th overall). However, a number of
competitive weaknesses are hindering its ability to fully
benefit from the potential economies of scale, mainly
related to the human resources base. Specifically,
Pakistan’s rankings are low in the pillars measuringhealth and primary education (116th), higher education
and training (123rd), labor market efficiency (121st), and
technological readiness (100th). In addition, there has
also been a measurable weakening over the past year in
the perceived quality of public institutions.
Cambodia at 109th, Bangladesh at 111th, Nepal
at 126th, and Timor-Leste at 129th constitute the least
competitive economies in the region. Many of the dis-
advantages are common to these countries, but there are
variations in the degrees of weakness. For example, in
Cambodia, competitive disadvantages manifest in thefinancial market (130th) and higher education and train-
ing (127th) pillars. In Bangladesh, weaknesses are most
concentrated in institutions (127th) and technological
readiness (126th) pillars. More generally, in order to
improve their economic prospects, these countries need
to make efforts across all areas, particularly those impor-
tant for countries at the more basic stage of development.
Middle East and North Africa
Record oil prices coupled with sound policies over the
past few years have buoyed economic growth across the
Middle East and North Africa region. Business environ-
ment reforms, investment in infrastructure, and targeted
diversification are now paying off in many countries
through higher competitiveness rankings.The rising
energy prices have benefited not only the hydrocarbon
exporters, but have also generated spillover effects
throughout the entire region through increasing intra-
regional FDI.27 However, while the Gulf economies
tend to improve in the rankings this year, all North
African countries and Israel lose positions.
As in previous years, Israel, at 23rd position, leads
the regional ranking, despite a drop of six places sincelast year.The most significant area of weakening is
linked to the country’s public institutions, with increas-
ing concerns about the protection of property rights
(49th), inefficient government spending (60th), and a
deteriorating public trust in politicians (61st), perhaps
related to last year’s conflict with the Lebanese Hezbollah
as well as corruption allegations against the country’s
leading politicians over the past year.28
Yet despite this more critical assessment of econom-
ic and political institutions, the country’s well-developed
human and institutional infrastructure for innovation, in
particular at the early stage, as well as its widespread
adoption of the latest technologies, continue to con-
tribute to Israel’s strong competitiveness and productive
potential. Israel ranks 6th in terms of overall innovative
capacity, with excellent national research institutes (3rd)
and the government taking a proactive role in procuring
high-tech products.The success of the resulting research
activity is reflected in the high rate of patenting per
capita (5th) registered by Israeli residents.The well-
developed financial markets play a key role in supporting
the process of turning ideas into marketable products
through facilitated access to venture capital (8th) andequity finance (14th).
The competitiveness of most Gulf countries cov-
ered by the GCI shows a robust upward trend.The most
competitive among them, Qatar, 26th overall, has
moved up by five places since last year, buoyed by the
country’s consistently well assessed institutions, but also
by advances in the functioning of financial markets, as
well as enhanced innovative capacity.The educational
system has also received a better assessment than in pre-
vious years, possibly reflecting a signaling effect of the
graduation of the first class from the Qatar EducationCity in early 2008, where many American universities
have set up regional schools over the past few years.
Yet despite progress made in ensur ing high-quality
education, tertiary enrollment remains low given the
country’s advanced stage of development, and the econ-
omy remains characterized by a very low participation
rate of women in the labor force.Another threat that
could put Qatar’s future competitiveness at risk is rising
inflation, partly imported through the dollar peg and
partly mirroring the economic boom on the peninsula
as well as rising food prices. Inflation reached almost
14 percent in 2007, placing Qatar 129th out of 134
countries on this indicator.
Qatar is followed by Saudi Arabia, a country that
has experienced a robust improvement by eight posi-
tions to place 27th this year, mirroring the government’s
determination to improve its performance on a number
of competitiveness indicators under the ambitious 10x10
program (see Box 4 for more details on Saudi Arabia’s
competitive performance).
The United Arab Emirates confirms its position
as one of the most competitive economies in the region,
moving up by six positions to 31st place. Overall, thecountry improves its ranking across all pillars of the GCI,
with a more stable macroeconomic environment and a
better assessment of the educational system (at the basic
and the advanced levels) as the main driving forces
behind the significant improvement in the overall ranking.
The country’s institutional environment remains, as
in previous years, a competitive advantage, characterized
by a low regulatory burden (5th), high public trust in
politicians (8th), and reliable police services. Since the
last edition of the Report, the macroeconomic environ-
ment in the Emirates has improved significantly to 24th
place, with a narrowing interest rate spread testifying to
a more efficient financial system. On the negative side,
the country has one of the highest inflation rates in the
world, ranked 123rd in international comparison.The
30
1 . 1
: T h e
G l o b a l C o m p e t i t i v e n e s s I n d e x
The Global Competitiveness Report 2008-2009 © 2008 World Economic Forum
8/2/2019 Competiveness Index
http://slidepdf.com/reader/full/competiveness-index 29/39
31
1 . 1
: T h e
G l o b a l C o m p e t i t i v e n e s s I n d e x
sources for increasing prices are to be seen in rising
demand from investment projects and a quickly growing
population of expatriates, as well as supply-side bottle-
necks along with rising prices of imported goods, and in
the dollar peg of the national currency.29
The country’s efforts to expand access to higher
education through the creation of state universities,while
also encouraging foreign and domestic private investment
in the sector, helped move the Emirates toward becom-
ing a regional hub for higher education.Yet the share of
young Emiratis attending higher-education institutions
remains low by international standards, positioning the
country at 79th overall. On the other hand, despite fair-
ly low enrollment rates, the quality of education is
improving in the eyes of the business sector, with the
Emirates now ranking 33rd on this indicator.
In 2004, Saudi Arabia embarked on a visionary program aimed
at turning the country into one of the most competitive
economies worldwide by 2010, as measured by the three main
indexes assessing the competitiveness of nations,1 including
the GCI. The framework, put into practice by the Saudi ArabianGeneral Investment Authority and the newly created National
Competitiveness Centre, encompasses reforms and investment
that aim at diversifying the economy into industries where the
country has comparative advantages in order to create 1.3
million jobs.2 Major reforms in the areas of the investment cli-
mate, education, health, the financial sector, and the judiciary
are envisaged or being implemented.
The progress made is reflected in this year’s GCI, where
Saudi Arabia moves up eight ranks from last year, placing 27th
out of 134 countries. The most notable advances have been
achieved with respect to the institutional framework for doing
business, where the country moved from 41st to 34th, and the
efficiency of goods markets, where it improved by 17 ranks, up
from 51st to 34th. These results mirror recent reforms such as
the greater ease of setting up new businesses and the overhaul
of the judiciary, which has been initiated.
Yet despite those improvements, and alongside many com-
petitive advantages—such as the stable macroeconomic envi-
ronment, a solid institutional framework, and the large market
size that allows for exploiting economies of scale—Saudi
Arabia’s assessment in the GCI points to important challenges
that will have to be addressed if the country wants to move up
the development ladder. In light of its ambitious goals, the ques-
tion inevitably arises as to which are the most important
remaining challenges to improving competitiveness. Three
emerge from the analysis of the GCI results: a fairly weak edu-
cational system that prepares graduates insufficiently for jobs
in the private sector, low levels of foreign competition, and
underdeveloped financial markets.
Its low educational attainment has been Saudi Arabia’s
Achilles’ heel for a long time. Aware of this weakness, the gov-
ernment has made impressive strides over the past decades
toward increasing enrollment rates at all levels. Tertiary enroll-
ment, for example, has tripled over the past 20 years.3 However,
the quality of education in the country did not keep up with this
development and remains weak by international standards.
Business leaders’ appraisal of the suitability of national educa- tion for a competitive economy is low, ranking only 70th. In par-
ticular, math and science education and management training
are not considered adequate, ranked 85th and 75th, respective-
ly. In addition, when asked to name the most problematic fac-
tors for doing business, Saudi business leaders point to an inad-
equately educated workforce as the most important factor,obtaining 15.7 percent of the responses. Restrictive labor regu-
lations and poor work ethic of the national labor force are also
mentioned among the important aspects, receiving 14.5 and 8.3
percent of the responses, respectively.
Improving the quality of education will therefore be crucial
toward both resolving the employment shortage looming on the
horizon and removing constraints to private-sector growth.
Changing demographics are putting increasing pressure on
labor markets, and the problem is likely to be exacerbated in the
future. To date, over 80 percent of the native workforce have
been absorbed by the public sector while the private sector
mainly relies on migrant labor.4 Yet, with rising numbers of
young Saudis entering the workforce every year,5 only a very
dynamic private sector will be able to create sufficient jobs, and
higher private-sector employment in turn necessitates a better
alignment of educational content with the needs of the business
sector. Upgrading the quality of education in Saudi Arabia is set
to be a lengthy process, as it will require a thorough overhaul of
the curricula and setting up more powerful incentive schemes
for both teachers and students.6 The nexus of a fairly weak edu-
cational system, labor markets that rely on migrant labor and
rapid population growth remains one of the most important
challenges facing the Saudi society today, and addressing it will
be crucial for ensuring social cohesion and securing current
levels of prosperity for future generations.7
Despite WTO accession in 2005 and the increasing inflows
of FDI, local business leaders consider Saudi Arabia to be fairly
sheltered from foreign competition, as captured by the 82nd
rank on the foreign competition component of the GCI. Barriers
to trade remain fairly high, ranked 71st, with higher tariffs for
agricultural products.8 At the same time, the country is consid-
ered to be fairly difficult to enter for foreign investors because
of investor-unfriendly regulations: Saudi Arabia ranks a low
92nd in the corresponding variable, and 114th on the prevalence
of foreign ownership. Despite efforts to attract investment into
key industries, many sectors remain sheltered from foreign
engagement, and transparency in the corporate sector is notwidespread. Further lowering barriers to entry for foreign
Box 4: Saudi Arabia: Unleashing its competitive potential
(Cont’d.)
The Global Competitiveness Report 2008-2009 © 2008 World Economic Forum
8/2/2019 Competiveness Index
http://slidepdf.com/reader/full/competiveness-index 30/39
The positive developments in innovation, techno-
logical readiness, and business sophistication bode well
for the country’s future and reflect the business leaders’
optimism about the prospects going forward.The use and
penetration of ICTs and other advanced technologies
are widespread and are increasingly catching up with the
rest of the world, allowing the country to move up in
the rankings to 28th position in this area.Yet, althoughthe country’s firms are producing goods and services
increasingly high on the value chain and are engaging
more in marketing and distribution (21st and 38th rank,
respectively), businesses still do not rely sufficiently on
professional management (52nd).At the same time, the
fairly low quality of research institutions (74th) and
companies’ low spending on R&D (50th), as well as
shortages in qualified research staff (75th), constrain the
strengthening of the innovative capacity, which, at 46th,
remains far behind top international levels.
Kuwait ranks 35th in this year’s edition of theGCI.The country’s macroeconomic environment
remains for the second year in a row the most favorable
worldwide.A budgetary surplus of nearly 44 percent of
GDP (the highest of all countries), the highest national
savings rate, and extremely low government debt con-
tribute to this excellent result.Yet in order to put the
country’s recent surge in growth on a more solid footing,
Kuwait must continue to carry out structural reforms. A
major priority will be an overhaul of the educational
system, both in terms of providing more access and also
in improving its quality. Kuwait ranks 81st and 106th,
respectively, for the quantity of higher and primary edu-
cation, and 83rd for the quality of education provided.
More generally, business leaders perceive the educational
system to be out of sync with the needs of a competitive
economy, with math and science education highlighted
in particular as needing improvement. In addition, fur-
ther intensifying domestic competition by facilitating
the entry of foreign firms and new business creation
would benefit the country’s competitiveness.This would
allow the business sector to take advantage of the flexible
labor market and inject new energy into the country’s
markets for goods and services.Tunisia tops the rankings among the North African
countries at 36th position, preceding Bahrain and Oman
by a narrow margin.The country’s institutions, which
have been favorably assessed for a number of years, are
one of its major competitive advantages.They rest on
fairly transparent and trustworthy relations between the
government and the civil society as expressed in the
high public trust of politicians (16th), a favorable assess-
ment of the efficiency of government spending (2nd),
and transparent policies (15th), as well as limited
favoritism on the part of government officials (14th).A
well-functioning health and educational system, as well
as sound levels of domestic competition (34th) and a
strong innovative capacity (27th), round out the positive
picture. Moving forward,Tunisia will need to focus on
32
1 . 1
: T h e
G l o b a l C o m p e t i t i v e n e s s I n d e x
goods, services, and capital would intensify competition in
the country, thereby raising the efficiency of the domestic
economy.
Saudi Arabia’s financial sector has been undergoing amajor overhaul since 2002. The competition among banks
was intensified by allowing foreign banks to set up branches
in the country, legal gaps are being filled, and regulation has
been reformed—in particular for capital markets and Islamic
finance. In addition, greater transparency requirements for
banks have strengthened bank supervision. Nevertheless,
business leaders are assessing the financial sector as insuf-
ficiently meeting the needs of a competitive economy.
Although credit and other forms of finance, such as venture
capital, are fairly easily accessible, the overall level of
sophistication is assessed low by international standards
(63rd). In this respect, the poor assessment of the trustwor-
thiness of the financial system, positioning at a low 98th rank,
is noteworthy. Within this category, the legal system obtains
low marks for its ability to protect investors (93rd). This is
certainly a reflection of the fact that, until recently, the Saudi
judicial system was ill adapted to protect commercial inter-
ests. The situation is set to improve in the wake of the recent
judicial reform. In addition, despite progress made in the reg-
ulation of securities exchanges, business leaders assess its
quality, ranked 88th, as not sufficient. Although new regulato-
ry standards have been recently introduced, the implementa-
tion of these laws is lagging behind. The gradual opening of
the Saudi stock market to foreigners may provide additional
pressure for more transparency and a more consistentimplementation of existing regulations.
Notes
1 In addition to the GCI, these measures include the Doing
Business report of the World Bank and the World
Competitiveness Yearbook published by IMD.
2 The reform program includes the construction of six so-called
economic cities set up as special economic zones throughout
the country that will provide modern infrastructure and a busi-
ness environment free of red tape. These cities should also
ensure equitable development in all regions.
3 Despite great progress achieved, Saudi Arabia’s current rankingin terms of enrollment in tertiary education remains fairly low
by international standards (70th).
4 World Bank 2008b.
5 According to ILO data (ILO 2008), about 515,000 people are
entering the workforce in the first decade of the new millenni-
um, as opposed to about 415,000 in the 1990s and about
635,000 in the 2020s.
6 Saudi Arabia has one of the highest education expenditure-to-
GDP ratios in the world, and a high teacher-to-pupil ratio. For
more information on the challenges the Saudi educational sys-
tem is facing, see World Bank 2008b.
7 Related to this challenge is the enormous untapped opportunity
of increasing women’s participation in the labor force (Saudi
Arabia ranks 134th on this variable).
8 WTO 2008.
Box 4: Saudi Arabia: Unleashing its competitivepotential (cont’d.)
The Global Competitiveness Report 2008-2009 © 2008 World Economic Forum
8/2/2019 Competiveness Index
http://slidepdf.com/reader/full/competiveness-index 31/39
reforming the rigid labor market (ranked 103rd) and
further streamlining its macroeconomic management in
order to improve its competitive position.
Bahrain and Oman rank 37th and 38th, respec-
tively. Similar to most of their geographical neighbors,
both countries improve this year (by six and four posi-
tions, respectively).As is the case within many countries
in the region, prudently managed hydrocarbon wealthhas ensured a stable macroeconomic environment in
both economies.While Oman displays a solid institution-
al environment, the GCI results point to shortcomings
in the educational system that will need to be addressed
if the country wishes to advance its competitiveness.
Bahrain is host to the most sophisticated financial market
in the region, but needs to further improve the efficien-
cy of its labor market and upgrade its innovative capacity.
Jordan occupies the 48th rank this year, much in
line with previous years’ assessments.Well-defined prop-
erty rights (23rd), efficient government spending (26th),a low burden of government regulation (18th), and a
fairly efficient legal framework (29th), coupled with a
very safe and secure environment (14th) ensure that the
country’s institutions receive a positive assessment.At the
same time, the country’s weak and deteriorating macro-
economic position is worrying, ranked a low 111th, 11
positions lower than last year, with a growing budget
deficit and accompanying debt level. Moving forward,
Jordan should also address its low primary education
enrollment rate, which could otherwise lead to a literacy
gap that will become increasingly difficult to close over
time. In addition, policies aimed at making the labor
market more flexible would also be beneficial for the
country’s business sector and employment creation.
Morocco has fallen by nine ranks this year, to 73rd
place, in line with the deteriorating performance of
North Africa as a whole. In the case of Morocco, a
weakening security environment and a deteriorating
assessment of the quality of the educational system con-
tribute to the country’s declining competitive position.
At the same time, the macroeconomic environment—
traditionally one of the country’s weaknesses—has
improved because of laudable efforts to curb inflation,control spending, and streamline the tax collection sys-
tem.30 The country also boasts a regulatory environment
that is conducive to business activity and to business
creation, ranked 19th and 22nd for the number of pro-
cedures and time required to start a business.At the
same time, the rigid labor market, assessed at a low
128th rank, remains a serious drag on the country’s
competitiveness.
Syria, at 78th position, has moved up by two ranks
since last year. Syria is a still largely state-controlled
economy that only recently embarked on a reform path.
The successful reforms of the business environment
are reflected in the relatively favorable and improving
assessment of institutions, although business leaders still
identify corruption (100th) and the lack of transparency
of government policymaking (106th) as major shortcom-
ings.Tighter monetary policy has helped to curtail
inflation, which nevertheless still remains at a relatively
high level (ranked 88th),31 while the high government
budget deficit (121st) further undermines macroeco-
nomic stability (93rd).As well as imposing more fiscal
and monetary discipline, moving forward, Syria should
also focus on upgrading higher education and traininginstitutions (101st), freeing up the very rigid labor mar-
ket (123rd), and continuing to reform its financial insti-
tutions (121st).32
Egypt ranks 81st in this year’s edition of the GCI,
down four places compared with last year. Despite some
improvements, macroeconomic instability remains a
major challenge for the government as mirrored in the
very low 125th rank the country obtains on this pillar.
High government debt, double-digit inflation, and a still
high—although decreasing—budget deficit continue to
weaken the macroeconomic environment, despiteimproving fiscal management.33 In addition, labor market
efficiency is poor in international comparison, ranked
last among all 134 countries. Firing costs (119th), a sig-
nificant brain drain of the country’s talent (129th), and
reliance on friends and relatives for professional manage-
ment positions (124th) are the most important weak-
nesses in this context.
At the same time, Egypt has made progress in fos-
tering technological readiness (84th), although the
increased penetration of the latest technologies, such as
the Internet, PCs, and mobile telephones, has not been
sufficient for the country to move up in the rankings, as
other countries are improving more quickly.To further
benefit from internationally available technology, Egypt
will need to upgrade its educational institutions, which
continue to receive weak assessments (124th).
Libya ranks 91st, down three positions since the
last edition of our Report. Benefiting from increasing
exports of hydrocarbons, the country boasts one of the
strongest macroeconomic environments in the world
(ranked 6th).The high government surplus and low
government debt contribute to this good assessment.Yet
mounting inflationary pressures are putting the country’smacroeconomic stability at risk. Although educational
enrollment rates are overall satisfactory, the curricula
need to be overhauled to become more in line with the
needs of present economic realities: the quality of the
educational system receives one of the weakest assess-
ments among all countries covered (121st). Similarly, the
quality of infrastructure is assessed as dismal, in particular
air transport (126th), ports (110th), and railroads (116th).
In this context, to improve its competitiveness, windfall
oil profits should be invested in structural improvements
such as upgrading the educational system and the trans-
port infrastructure.
Algeria has dropped 18 positions to 99th rank, and
is now the weakest regional performer. Despite robust
growth reaching on average 4.8 percent over 2003–07,34
33
1 . 1
: T h e
G l o b a l C o m p e t i t i v e n e s s I n d e x
The Global Competitiveness Report 2008-2009 © 2008 World Economic Forum
8/2/2019 Competiveness Index
http://slidepdf.com/reader/full/competiveness-index 32/39
and relative macroeconomic stability, the business sector
assesses the operating environment in the country as
more difficult than in previous years, in particular with
respect to public and private institutions as well as inno-
vative capacity.Trust in politicians is eroding, as business
leaders see the institutional framework deteriorate and
the already precarious security situation worsen.35 In
addition to upgrading the institutional environment,improving the country’s competitive position will
require reforms in what is one of the most rigid labor
markets in the world (132nd) and a restructuring of the
very inefficient and unstable financial system (132nd).
Labor market reforms could also contribute to improv-
ing the security situation by creating more jobs for the
rising numbers of fairly well educated yet unemployed
young people.
Sub-Saharan Africa
The improving economic climate observed in sub-Saharan Africa in recent years, with annual GDP growth
accelerating to 6.8 percent in 2007 according to the
IMF, is at last being reflected in the improved competi-
tiveness rankings of a number of countries in the region.
South Africa and Mauritius, already in the top half of
the rankings last year, have been joined by Botswana,
and there have been measurable improvements across
specific areas in a number of other African countries.
However, notwithstanding this positive development,
sub-Saharan Africa as a whole continues to lag behind
the rest of the world in competitiveness, requiring
efforts across many areas to place the region on a firmly
sustainable growth path going forward.
South Africa, ranked 45th overall, remains the
highest ranked country in sub-Saharan Africa, with a
very stable performance. Among the country’s strengths
is the large size of the economy, particularly by regional
standards (ranked 23rd in the market size pillar).The
country continues to receive good marks in more com-
plex areas measured by the GCI, such as intellectual
property protection (23rd), the quality of private institu-
tions (25th), and goods (31st), as well as financial market
efficiency (24th), business sophistication (33rd), andinnovation (37th). South Africa benefits from high
spending on R&D, accompanied by strong collaboration
between universities and the business sector in innova-
tion (both ranked 28th). It is thus not surprising that in
recent years the country has a higher rate of patenting
than a number of European countries.These combined
strengths explain South Africa’s position at the top of
the regional ranking.
However, South Africa does face a number of
obstacles to competitiveness. For example, the country
ranks 88th in labor market flexibility, encompassing hir-
ing and firing practices (129th), flexibility of wage
determination (123rd), and poor labor-employer relations
(119th). Further, the country’s innovative potential could
be at risk with a university enrollment rate of only 15
percent, which places the country 93rd overall. South
Africa’s infrastructure, although good by regional stan-
dards, requires upgrading (ranked 48th), with particular
concerns about the quality of the electricity supply that
has been getting worse in recent years (ranked 101st,
down from 83rd last year) and the short supply of tele-
phone lines.The poor security situation remains another
important obstacle to doing business in South Africa.The business costs of crime and violence (134th) and
the sense that the police are unable to provide protec-
tion from crime (109th) are highlighted as particular
concerns.The greatest obstacle, however, remains the
health of the workforce, ranked 129th out of 134 coun-
tries, due to high rates of communicable diseases and
poor health indicators more generally.These are areas
that must be tackled in order to improve South Africa’s
competitiveness outlook.
Botswana, ranked 56th, follows only South Africa
in sub-Saharan Africa.The country regains its positionthis year in the top half of the rankings, moving up a
remarkable 20 places, the largest improvement this year.
In this light, the GCI is beginning to weight more
heavily those more complex factors from which
Botswana derives its competitive strengths.The govern-
ment has succeeded in using its wealth from key natural
resources to invest in factors that have set it on a more
sustainable growth trajectory.Among the country’s
strengths are its reliable and legitimate institutions, rank-
ing a high 21st worldwide for the efficiency of govern-
ment spending, 22nd for public trust of politicians, and
26th for judicial independence. Botswana is rated as the
country with the lowest corruption in Africa (22nd out
of 134 countries). Over past years, the transparency and
accountability of public institutions have contributed to
a stable macroeconomic environment, and this is one
key area of improvement: the government has been run-
ning a healthy budget surplus, which is allowing it to
reduce debt levels, and inflation has come down from its
peak in 2006 as well.
Botswana’s primary weaknesses are related to the
country’s human resources base. Despite high spending
on education, educational attainment rates at all levelsof the educational ladder remain low by international
standards, and the quality of the educational system
receives mediocre marks.Yet it is clear that by far the
biggest obstacle facing Botswana in its efforts to improve
its competitiveness is the health situation in the country.
Botswana has the highest HIV prevalence rate of all
countries covered, as well as very high malaria (111th)
and tuberculosis (128th) incidence. However, these rates
are for the most part coming down, leading to an
improvement in life expectancy from 40 to 52 years
by the most recent estimate. Continuing to improve
the health and educational levels of the workforce will
remain the main priorities for the government for
some time.
34
1 . 1
: T h e
G l o b a l C o m p e t i t i v e n e s s I n d e x
The Global Competitiveness Report 2008-2009 © 2008 World Economic Forum
8/2/2019 Competiveness Index
http://slidepdf.com/reader/full/competiveness-index 33/39
Mauritius has seen an improvement of three places
since last year, moving up to 57th position and following
Botswana directly in the rankings.The country is char-
acterized by strong and transparent public institutions,
with well-protected property rights (ranked 22nd), rea-
sonable levels of judicial independence, and a security
situation that is good by regional standards (37th). Private
institutions are rated as accountable and improving, withstrong auditing and accounting standards and a system
that protects minority shareholders’ interests.The coun-
try’s infrastructure is well developed by regional standards,
and goods and financial markets function well, ensuring
an efficient allocation of resources in the country.
However, efforts will be required in the area of
education. Educational attainment rates remain low, par-
ticularly at the university level (placing Mauritius 90th),
education spending remains low, and the educational
system gets mediocre marks for quality. Beyond the edu-
cational weaknesses, labor markets could be made moreflexible, with stringent hiring and firing laws (110th)
and wages that are not flexibly determined (118th).
Furthermore, there are some health concerns with
regard to the workforce—particularly the high preva-
lence of HIV. Finally, Mauritius must work to improve
the stability of the macroeconomic environment going
forward (ranked 117th), with a government budget
deficit that places the country 115th (which over time
has led to the buildup of significant national debt and
high interest rates), as well as high and rising inflation.
Namibia has moved up nine places to 80th place
this year,with improvements across many of the areas
measured by the GCI. Among Namibia’s comparative
strengths is the quality of the institutional environment
(ranked 42nd). Property rights are well protected
(ranked 25th) and the judiciary is perceived as inde-
pendent from undue influence (22nd).With regard to
private institutions, auditing and accounting standards
are strong and minority shareholders’ interests are well
protected.The country’s strong institutional environment
continues to contribute to responsible macroeconomic
management.The government budget remained in sur-
plus between 2006 and 2007, helping to significantlyrelieve the country’s debt burden, although rising infla-
tion still remains high by international standards (ranked
83rd on this indicator).The quality of the country’s infra-
structure is also excellent by regional standards (ranked
33rd), most particularly the transport infrastructure.
With regard to weaknesses, Namibia’s health and
education indicators are worrisome, with the country
ranked a low 124th on the health subpillar.The country
is characterized by high infant mortality, low (albeit ris-
ing) life expectancy, the result in great part of the high
prevalence rates of HIV and malaria (ranked 130th and
129th, respectively) as well as the second-to-highest
incidence of tuberculosis of all 134 countries. On the
educational side, attainment rates remain low, with pri-
mary, secondary, and tertiary enrollment rates placing
the country 114th, 103rd, and 112th, respectively.The
quality of the educational system is assessed as being
among the worst of all countries in the Index, ranked
114th overall, despite high government per capita
spending on education. In addition,Namibia’s goods
markets suffer from a number of distortions, such as a
long time required for starting a business (99 days, plac-
ing the country 122nd), ineffective antitrust policy, andpoor customer orientation. Finally, the country could do
more to harness new technologies to improve its pro-
ductivity levels. Companies are not considered to be suf-
ficiently aggressive in absorbing new technologies, and
Namibia has low penetration rates of new technologies
such as mobile phones and the Internet.
Notwithstanding the post-election political and
social turmoil ravaging the country earlier in the year,
Kenya (ranked 93rd overall) has moved up by six places
this year, with its key strengths found in the more com-
plex areas normally reserved for countries at higher stages of development. For example, Kenya’s innovative
capacity is ranked an impressive 42nd, with high compa-
ny spending on research and development, and good
scientific research institutions collaborating well with
the business sector in research activities. Supporting this
innovative potential is an educational system that—
although educating a relatively small proportion of the
population compared with most other countries (pri-
mary, secondary, and tertiary enrollment rates are ranked
116th, 108th, and 126th, respectively)—gets good marks
for quality (33rd) for those attending schools.The econ-
omy is also supported by financial markets that are
sophisticated by international standards (44th), with rela-
tively easy access to loans and share issues on the local
stock market.
However, there are a number of basic weaknesses
that are eroding at Kenya’s overall competitive potential.
The country’s public institutions continue to be assessed
as highly inefficient (100th), plagued by undue influence
(111th) and high levels of corruption (101st).The secu-
rity situation in Kenya is also extremely worrisome,
particularly crime and violence (126th), the potential of
terrorism (129th), and the prevalence of organized crime(118th). Health is another area of serious concern (ranked
117th), with a high prevalence of diseases—particularly
tuberculosis and HIV, which are among the highest of
all countries covered (124th and 125th, respectively),
contributing to the low life expectancy of 53 years.
Nigeria is ranked 94th this year.The country’s
greatest area of strength remains the macroeconomic
environment (ranked 26th), with windfall oil revenues
contributing to large (although declining) government
budget surpluses, and a high national savings rate.
Nigeria also benefits from a relatively large market,
allowing for economies of scale. In addition, its financial
markets are quite sophisticated by regional standards
(ranked 54th).
35
1 . 1
: T h e
G l o b a l C o m p e t i t i v e n e s s I n d e x
The Global Competitiveness Report 2008-2009 © 2008 World Economic Forum
8/2/2019 Competiveness Index
http://slidepdf.com/reader/full/competiveness-index 34/39
On the other hand, the GCI shows that Nigeria’s
economy is characterized by weak and deteriorating
institutions (ranked 106th, down from 87th in 2006)—
including a serious security problem (125th)—and poor
assessments for its infrastructure (120th) as well as basic
health and education (126th). In addition, the country is
not harnessing the latest technologies for productivity
enhancements, as demonstrated by its low levels of ICTpenetration.The rankings show that Nigeria is not tak-
ing the opportunity presented by the windfall oil rev-
enues to upgrade the population’s access to basic health
care and education, and to make improvements in other
areas such as infrastructure. Movements in this direction
would be critical to set the basis for sustainable growth
going forward.
Zimbabwe continues to be ranked among the least
competitive economies included in the GCI, second to
last at 133rd overall.This compares with last year’s rank
of 129, and represents a decline of one place even in aconstant sample.The institutional environment is among
the worst of all countries, with a complete absence of
property rights (ranked last out of all countries at
134th), high levels of corruption (130th), and a lack of
even-handedness of the government in its dealings with
the public (129th) as well as basic government ineffi-
ciency (130th).The extreme mismanagement of the
public finances and monetary policy has placed
Zimbabwe once again at the bottom of all countries
covered with regard to macroeconomic stability (ranked
134th), with enormous—and growing—deficit spend-
ing, negligible national savings, and raging hyperinflation
that is unparalleled anywhere else in the world.The
economy is now characterized by mismanagement and
weaknesses across all areas, including health (ranked
128th in the health subpillar), low educational enroll-
ment rates, and official markets that have ceased to func-
tion for all intents and purposes (particularly goods and
labor markets, ranked 133rd and 127th, respectively).
Conclusions
This chapter has presented and analyzed the results of the World Economic Forum’s Global Competitiveness
Index. Covering 134 countries in this year’s edition, the
GCI provides a comprehensive picture of the numerous
factors, institutions, and policies that determine the pro-
ductivity and prosperity of a nation.
Since its introduction in 2004, the GCI has been
used by an increasing number of countries and institu-
tions to benchmark national competitiveness.The clear
and intuitive structure of the GCI framework is useful
for prioritizing policy reforms as it allows countries to
determine the strengths and weaknesses of the national
competitiveness environment and to identify those fac-
tors most constraining its economic development.
At the national level, numerous entities—such as
competitiveness councils and observatories—have been
created to analyze and closely monitor the competitive-
ness performance of their countries, and several national
competitiveness reports have been prepared based on the
GCI framework.At the global level, international organ-
izations specializing in economic development studies
increasingly use the GCI alongside other methodologi-
cal approaches, as a tool for identifying and prioritizing
areas for growth-enhancing reform.In this context, the particular strength of the World
Economic Forum’s competitiveness work is that it pro-
vides a platform for dialogue among government, busi-
ness, and civil society that can serve as a catalyst for
productivity-raising reforms, with the aim of boosting
the living standards of the world’s citizens.
Notes
1 Schumpeter 1942; Solow 1956; and Swan 1956.
2 See, for example, Sala-i-Martin et al. 2004 for an extensive list of
potential robust determinants of economic growth.
3 See Acemoglu et al. 2001, 2002; Rodrik et al. 2002; Easterly and
Levine 1997; and Sala-i-Martin and Subramanian 2003.
4 See de Soto 2000.
5 See de Soto and Abbot 1990.
6 See Shleifer and Vishny 1997; Zingales 1998.
7 See Kaufmann and Vishwanath 2001.
8 See World Bank 1994; Gramlich 1994; Aschauer 1989; Canning et
al. 1994; and Easterly 2002.
9 See Fischer 1993.
10 See Sachs 2001.
11 See Schultz 1961; Becker 1993; Lucas 1988; and Kremer 1993.
12 It is important to note that the effects of the global financial crisis
may not be fully reflected in the GCI results discussed in this
chapter, as they are based on data from the past year.
13 See Aghion and Howitt 1992 and Barro and Sala-i-Martin 2003 for
a technical exposition of technology-based growth theories.
14 A general purpose technology (GPT), according to Trajtenberg
(2005), is one which in any given period makes a particular contri-
bution to overall economy’s growth thanks to its ability to trans-
form the methods of production in a wide array of industries.
Examples of GPTs have been the invention of the steam engine
and the electric dynamo.
15 See Frenkel and Romer 1999; Rodrik and Rodriguez 1999; Sachs
and Warner 1995; and Alesina et al. 2005.
16 This is particularly important in a world in which economic borders
are not as clearly delineated as political ones. In other words,
when Belgium sells goods to the Netherlands, the national
accounts register the transaction as an export (so the Netherlands
is a foreign market of Belgium), but when California sells the
same kind of output to Nevada, the national accounts register the
transaction as domestic (so Nevada is a domestic market of
California).
17 See Romer 1990; Aghion and Howitt 1992; and Grossman and
Helpman 1991.
18 Probably the most famous theory of stages of development was
developed by the American historian W.W. Rostow in the 1960s
(see Rostow 1960). Here we adapt Michael Porter’s theory of
stages (see Porter 1990). Please see Chapter 1.1 of The Global Competitiveness Report 2007–2008 for a complete description of
how we have adapted Michael Porter’s theory for the present
application.
36
1 . 1
: T h e
G l o b a l C o m p e t i t i v e n e s s I n d e x
The Global Competitiveness Report 2008-2009 © 2008 World Economic Forum
8/2/2019 Competiveness Index
http://slidepdf.com/reader/full/competiveness-index 35/39
19 Some restrictions were imposed on the coefficients estimated.
For example, the three coefficients for each stage had to add up
to one, and all the weights had to be non-negative.
20 In order to capture the resource intensity of the economy, we use
as a proxy the exports of mineral products as a share of overall
exports according to the sector classification developed by the
International Trade Centre in their Trade Performance Index. In
addition to crude oil and gas, this category also contains all metal
ores and other minerals as well as petroleum products, liquefied
gas, coal, and precious stones. Further information on these datacan be found at the following site:
http://www.intracen.org/menus/countries.htm.
All countries that export more than 70 percent of mineral prod-
ucts are considered to be to some extent factor driven. The stage
of development for these countries is adjusted downward
smoothly depending on the exact primary export share. The high-
er the minerals export share, the stronger the adjustment and the
closer the country will move to stage 1. For example, a country
that exports 95 percent of mineral exports and that, based on the
income criteria, would be in stage 3, will be in transition between
stage 1 and 2. The income and primary exports criteria are
weighted identically. Stages of development are dictated uniquely
by income for countries that export less than 70 percent minerals.
Countries that export only primary products would automatically
fall into the factor-driven stage (stage 1).
21 According to the IMF (IMF 2008b), the region has withstood
rather well the global financial slowdown so far, also thanks to
strong commodity prices, with a still solid 5.6 percent growth rate
in 2007. This is projected to slow gradually to 4.4 percent and 3.6
percent respectively in 2008 and 2009.
22 OECD Development Centre 2007.
23 Attracting US$19.04 billion in FDI in 2006 (UNCTAD 2007), ahead
of Brazil (US$18.78 billion) and Chile (US$7.95 billion).
24 OECD Development Centre 2007.
25 These growth rates are an average annual 6.5 percent of GDP in
the 2003–2007 period according to the IMF (2008a).
26 Argentina experienced average annual growth of 8.8 percent from
2003 to 2007 IMF (2008a).
27 See IMF 2008e for more details.
28 See The Economist 2008c.
29 IMF 2008e.
30 OECD Development Centre 2008.
31 IMF 2007a.
32 IMF 2007a.
33 IMF 2007b.
34 IMF 2008e.
35 The Economist 2008d.
ReferencesAcemoglu, D., S. Johnson, and J. Robinson. 2001. “The Colonial
Origins of Comparative Development: An Empirical Investigation.”
American Economic Review 91: 1369–1401.
———. 2002. “Reversal of Fortune: Geography and Institutions in the
Making of the Modern World Distribution of Income.” Quarterly
Journal of Economics 117 (4): 1231–94.
Aghion P. and P. Howitt. 1992. “A Model of Growth through Creative
Destruction.” Econometrica LX: 323–51.
Alesina, A., E. Spolaore, and R. Enrico. 2005. “Trade, Growth and the
Size of Countries.” In P. Aghion and S. Durlauf, eds., Handbook of
Economic Growth, 1st Edition, Volume 1:1499–1542. Amsterdam:
Elsevier.
———. 1998. Endogenous Growth. Cambridge, MA: MIT Press.
Aschauer, D. A. 1989. “Is Public Expenditure Productive?” Journal of
Monetary Economics 23 (2): 117–200.
Barro, R. J. and X. Sala-i-Martin. 1992. “Convergence.” Journal of
Political Economy 100 (April): 223–51.
———. 2003. Economic Growth, 2nd Edition. Cambridge, MA: MIT
Press.
Becker, G. S. 1993. Human Capital: A Theoretical and Empirical
Analysis, with Special Reference to Education, 3rd Edition.
Chicago: University of Chicago Press.
Canning, D., M. Fay, and R. Perotti. 1994. “Infrastructure and Economic
Growth.” In M. Baldarassi, L. Paganetto, and E. Phelps, eds.International Differences in Growth Rates. New York: MacMillan.
CEPAL/ECLAC (Comisión Económica para América Latina y el
Caribe/Economic Commission for Latin America and the
Caribbean). 2007. Balance preliminar de las economías de
América Latina y el Caribe. Santiago del Chile: CEPAL/ECLAC.
———. 2008. Estudio económico de América Latina y el Caribe, 2007-
2008. Política macroeconómica y volatilidad. Santiago del Chile:
CEPAL/ECLAC.
Deloitte. 2007. Global Trends in Venture Capital 2007 Survey. U.S.
Report sponsored by Deloitte & Touche USA LLP in association
with the National Venture Capital Association (NVCA). Deloitte
Development LLC. Available at
http://www.nvca.org/pdf/US_Rpt_Global_VC_Survey_7-25-07.pdf.
De Soto, H. 2000. The Mystery of Capital: Why Capitalism Triumphs inthe West and Fails Everywhere Else. New York: Basic Books.
De Soto, H. and J. Abbot. 1990. The Other Path: The Economic Answer
to Terrorism. New York: Harper Perennial.
Easterly, W. 2002. The Elusive Quest for Growth. Cambridge, MA: MIT
Press.
Easterly W. and R. Levine. 1997. “Africa’s Growth Tragedy: Policies and
Ethnic Divisions.” Quarterly Journal of Economics CXII: 1203–50.
The Economist. 2008a. Costa Rica: Economic data. Available online at
www.economist.com.
———. 2008b. Costa Rica: Factsheet. Available online at www.econo-
mist.com.
———. 2008c. “Gang Warfare, in the Courts: A Politician Hits Back
Against a Rampant Judiciary.” August 7. Available at
http://www.economist.com/world/mideast-
africa/displaystory.cfm?story_id=11897757.
———. 2008d. “Not Again, Please: Islamists Linked to al-Qaeda May
Be Reviving Their Campaign in the Maghreb.” August 21.
Available at http://www.economist.com/world/mideast-africa/dis-
playstory.cfm?story_id=11975470&fsrc=rss.
Fischer, S. 1993. “The Role of Macroeconomic Factors in Growth.”
Journal of Monetary Economics 32 (3): 485–512.
Frenkel, J. and D. Romer. 1999. “Does Trade Cause Growth?”
American Economic Review 89 (3): 379–99.
Global Policy Network. 2007. “Desenvolvimiento Reciente del Mercado
de Trabajo en Costa Rica.” Report prepared for Universidad de
Costa Rica. August 18. Available athttp://www.gpn.org/data/costarica/costarica-esp.pdf.
Gramlich, E. M. 1994. “Infrastructure Investment: A Review Essay.”
Journal of Economic Literature 32 (3): 1176–96.
Grossman, G. and E. Helpman. 1991. Innovation and Growth in the
World Economy. Cambridge, MA: MIT Press, Chapters 3 and 4.
IDB (Inter-American Development Bank). 2007a. IDEA: Fiscal Pacts in
Latin America. 12 (January–April 2007): 1–7.
———. 2007b. IDEA: Fiscal Structure in Latin America. 12
(January–April 2007): 2–7.
International Business Times. 2008. “Fitch Gives Peru Investment
Grade Rating.” April 3rd.
ILO (International Labour Office). 2008. LABORSTA Labour Statistics
Database. Geneva: International Labour Office.
IMF (International Monetary Fund). 2007a. Article IV Consultation with
the Syrian Arab Republic Public Information Notice No. 07/104.
August 15.
37
1 . 1
: T h e
G l o b a l C o m p e t i t i v e n e s s I n d e x
The Global Competitiveness Report 2008-2009 © 2008 World Economic Forum
8/2/2019 Competiveness Index
http://slidepdf.com/reader/full/competiveness-index 36/39
———. 2007b. Article IV consultation with Egypt. Staff Report.
December 13.
———. 2008a. Article IV Consultation with Costa Rica. Public
Information Notice No. 08/31. March 10.
———. 2008b. Article IV Consultation—Staff Supplement; Staff Report;
Public Information Notice on the Executive Board Discussion; and
Statement by the Executive Director for the United Kingdom. IMF
Country Report No. 08/271. August 6.
———. 2008c. World Economic Outlook Database. April.
———. 2008d. Regional Economic Outlook: Western Hemisphere.
April. Washington, DC: IMF.
———. 2008e. Regional Economic Outlook Middle East and Central
Asia, May. Washington, DC: IMF.
Jaramillo, C. F. and D. Lederman. 2005. “CAFTA-RD: Desafios y oportu-
nidades para América Central.” Departamento de América Central
y Oficina del Economista Jefe, Region de América Latina y el
Caribe. Washington, DC: World Bank.
Kaufmann D. and T. Vishwanath. 2001. “Toward Transparency: New
Approaches and their Application to Financial Markets.” World
Bank Observer 16 (1): 41–57.
Kremer, M. 1993. “The O-Ring Theory of Economic Development.”
Quarterly Journal of Economics 108 (3): 551–75.
Lucas, R. E. 1988. “On the Mechanics of Economic Development.”
Journal of Monetary Economics 22 (1): 3–42.
Mia I. and E. Lozoya Austin. 2008. Assessing the Foundations of
Mexico’s Competitiveness: Findings from the Global
Competitiveness Index 2007–2008. Geneva: World Economic
Forum.
OECD Development Centre. 2007. Latin American Economic Outlook
2008. Paris: OECD.
———. 2008. African Economic Outlook: Morocco. Paris: OECD.
OECD (Organisation for Economic Co-operation and Development).
2007. Economic Survey of the United Kingdom, 2007. Policy
Brief. September 27. Paris: OECD.
———. 2008. Country Statistical Profiles: United Kingdom. Paris:OECD.
Porter, M. 1990. The Competitive Advantage of Nations. New York: The
Free Press.
Reyes L. and A. Condo. 2007. “Sectores con Potencial de Crecimiento
en Centroamérica.” Revista Central America, April.
Rodríguez-Clare, A. 2001. “Costa Rica’s Development Strategy Based
on Human Capital and Technology: How It Got There, the Impact
of Intel, and Lessons for Other Countries.” Paper prepared for the
Human Development Report of 2001, UNDP.
Rodrik, D. and F. Rodriguez. 1999. “Trade Policy and Growth: A
Skeptics’ Guide to Cross National Evidence.” NBER Working
Paper No. 7081, April. Cambridge, MA: National Bureau of
Economic Research.
Rodrik, D., A. Subramanian, and F. Trebbi. 2002. “Institutions Rule: The
Primacy of Institutions over Geography and Integration in
Economic Development.” Mimeo. Harvard University, October.
Romer, P. 1990. “Endogenous Technological Change.” Journal of
Political Economy 98 (October): X71–S102.
Rostow, W. W. 1960. The Stages of Economic Growth, a Non-
Communist Manifesto. Cambridge: University Press.
Sachs, J. 2001. Macroeconomics and Health: Investing in Health for
Economic Development: Report of the Commission on
Macroeconomics and Health. Geneva: World Health Organization.
Sachs, J. and A. Warner. 1995. “Economic Reform and the Process of
Economic Integration.” Brookings Papers on Economic Activity
1995 (1): 1–118.
Sala-i-Martin, X. and E. V. Artadi, 2004. “The Global Competitiveness
Index.” The Global Competitiveness Report 2004–2005.
Hampshire: Palgrave Macmillan. 51–80.
Sala-i-Martin, X., J. Blanke, M. Drzeniek Hanouz, T. Geiger, I. Mia, and F.
Paua. 2007. “The Global Competitiveness Index: Measuring the
Productive Potential of Nations.” The Global Competitiveness
Report 2007–2008. Hampshire: Palgrave Macmillan. 3–50.
Sala-i-Martin, X., G. Doppelhoffer, and R. Miller. 2004. “Cross-Sectional
Growth Regressions: Robustness and Bayesian Model
Averaging.” American Economic Review 94 (4) September.
Sala-i-Martin and A. Subramanian. 2003. “Addressing the Natural
Resources Curse: An Illustration From Nigeria.” NBER Working
Paper No. 9804, June. Cambridge, MA: National Bureau ofEconomic Research.
Schultz, T. W. 1961. “Investment in Human Capital.” American
Economic Review 1 (2): 1–17.
Schumpeter, J. 1942. Capitalism, Socialism and Democracy. New York:
Harper & Row; 3rd Edition, 1950.
Shleifer, A. and R. Vishny. 1997, “A Survey of Corporate Governance.”
Nobel Symposium on Law and Finance, August, 1995. Journal of
Finance 52 (June): 737–83.
Solow, R. 1956. “A Contribution to the Theory of Economic Growth.”
Quarterly Journal of Economics 70 (February): 65–94.
Swan, T. W. 1956. “Economic Growth and Capital Accumulation.”
Economic Record 32 (2): 334–61.
Trajtenberg, M. 2005. “Innovation Policy for Development: An
Overview.” Paper prepared for LAEBA, Second Annual Meeting.
28-29 November, 2005. Tel Aviv University.
UNCTAD (United Nations Conference on Trade and Development).
World Investment Report 2007. Geneva: UNCTAD. 2007
Waldron, A. 2007. “The Chinese Stock Market.” IASC (International
Assessment and Strategy Center), May 13. Available at
http://www.strategycenter.net/research/pubID.159/pub_detail.asp.
World Bank. 1994. World Development Report: Infrastructure for
Development. Washington DC: World Bank.
———. 2007. China’s Information Revolution: Managing Economic and
Social Transformation. Washington, DC: The World Bank.
———. 2008a. China Quarterly Update. February.
———. 2008b. The Road Not Travelled: Education Reform in the Middle
East and North Africa. MENA Development Report. Washington,
DC: World Bank.
World Economic Forum. 2008. The Global Information Technology
Report 2007–2008. Hampshire: Palgrave Macmillan.
WTO (World Trade Organization). 2008. Trade Profile Saudi Arabia.
Available at www.wto.org.
Zingales, L. 1998. “Corporate Governance.” In P. Newman, ed.,The
New Palgrave Dictionary of Economics and the Law New York:
Macmillan.
38
1 . 1
: T h e
G l o b a l C o m p e t i t i v e n e s s I n d e x
The Global Competitiveness Report 2008-2009 © 2008 World Economic Forum
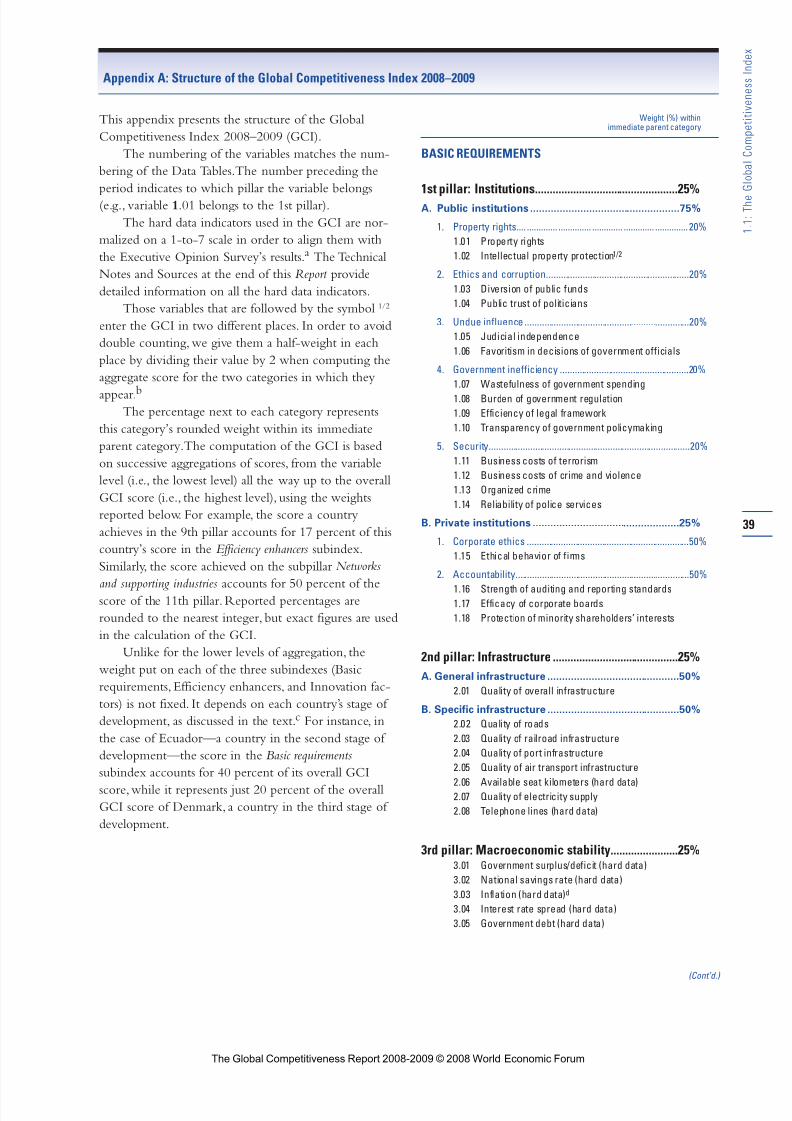
8/2/2019 Competiveness Index
http://slidepdf.com/reader/full/competiveness-index 37/39
39
1 . 1
: T h e
G l o b a l C o m p e t i t i v e n e s s I n d e x
This appendix presents the structure of the Global
Competitiveness Index 2008–2009 (GCI).
The numbering of the variables matches the num-
bering of the Data Tables.The number preceding the
period indicates to which pillar the variable belongs
(e.g., variable 1.01 belongs to the 1st pillar).
The hard data indicators used in the GCI are nor-
malized on a 1-to-7 scale in order to align them with
the Executive Opinion Survey’s results.a The Technical
Notes and Sources at the end of this Report provide
detailed information on all the hard data indicators.
Those variables that are followed by the symbol 1/2
enter the GCI in two different places. In order to avoid
double counting, we give them a half-weight in each
place by dividing their value by 2 when computing the
aggregate score for the two categories in which they
appear.bThe percentage next to each category represents
this category’s rounded weight within its immediate
parent category.The computation of the GCI is based
on successive aggregations of scores, from the variable
level (i.e., the lowest level) all the way up to the overall
GCI score (i.e., the highest level), using the weights
reported below. For example, the score a country
achieves in the 9th pillar accounts for 17 percent of this
country’s score in the Efficiency enhancers subindex.
Similarly, the score achieved on the subpillar Networks
and supporting industries accounts for 50 percent of thescore of the 11th pillar. Reported percentages are
rounded to the nearest integer, but exact figures are used
in the calculation of the GCI.
Unlike for the lower levels of aggregation, the
weight put on each of the three subindexes (Basic
requirements, Efficiency enhancers, and Innovation fac-
tors) is not fixed. It depends on each country’s stage of
development, as discussed in the text.c For instance, in
the case of Ecuador—a country in the second stage of
development—the score in the Basic requirements
subindex accounts for 40 percent of its overall GCI
score,while it represents just 20 percent of the overall
GCI score of Denmark, a country in the third stage of
development.
Weight (%) withinimmediate parent category
BASIC REQUIREMENTS
1st pillar: Institutions.................................................25%
A. Public institutions ...................................................75%
1. Property rights.... ............. .............. ............. ............. ..............20%
1.01 Property rights
1.02 Intellectual property protection1/2
2. Ethics and corruption...........................................................20%
1.03 Diversion of public funds
1.04 Public trust of politicians
3. Undue influence ....................................................................20%
1.05 Judicial independence
1.06 Favoritism in decisions of government officials
4. Government inefficiency .....................................................20%
1.07 Wastefulness of government spending
1.08 Burden of government regulation
1.09 Efficiency of legal framework
1.10 Transparency of government policymaking
5. Security...................................................................................20%
1.11 Business costs of terrorism
1.12 Business costs of crime and violence
1.13 Organized crime
1.14 Reliability of police services
B. Private institutions ..................................................25%
1. Corporate ethics ...................................................................50%
1.15 Ethical behavior of firms
2. Accountability........................................................................50%
1.16 Strength of auditing and reporting standards1.17 Efficacy of corporate boards
1.18 Protection of minority shareholders’ interests
2nd pillar: Infrastructure ...........................................25%
A. General infrastructure .............................................50%
2.01 Quality of overall infrastructure
B. Specific infrastructure .............................................50%
2.02 Quality of roads
2.03 Quality of railroad infrastructure
2.04 Quality of port infrastructure
2.05 Quality of air transport infrastructure
2.06 Available seat kilometers (hard data)2.07 Quality of electricity supply
2.08 Telephone lines (hard data)
3rd pillar: Macroeconomic stability.......................25%3.01 Government surplus/deficit (hard data)
3.02 National savings rate (hard data)
3.03 Inflation (hard data) d
3.04 Interest rate spread (hard data)
3.05 Government debt (hard data)
(Cont’d.)
Appendix A: Structure of the Global Competitiveness Index 2008–2009
The Global Competitiveness Report 2008-2009 © 2008 World Economic Forum
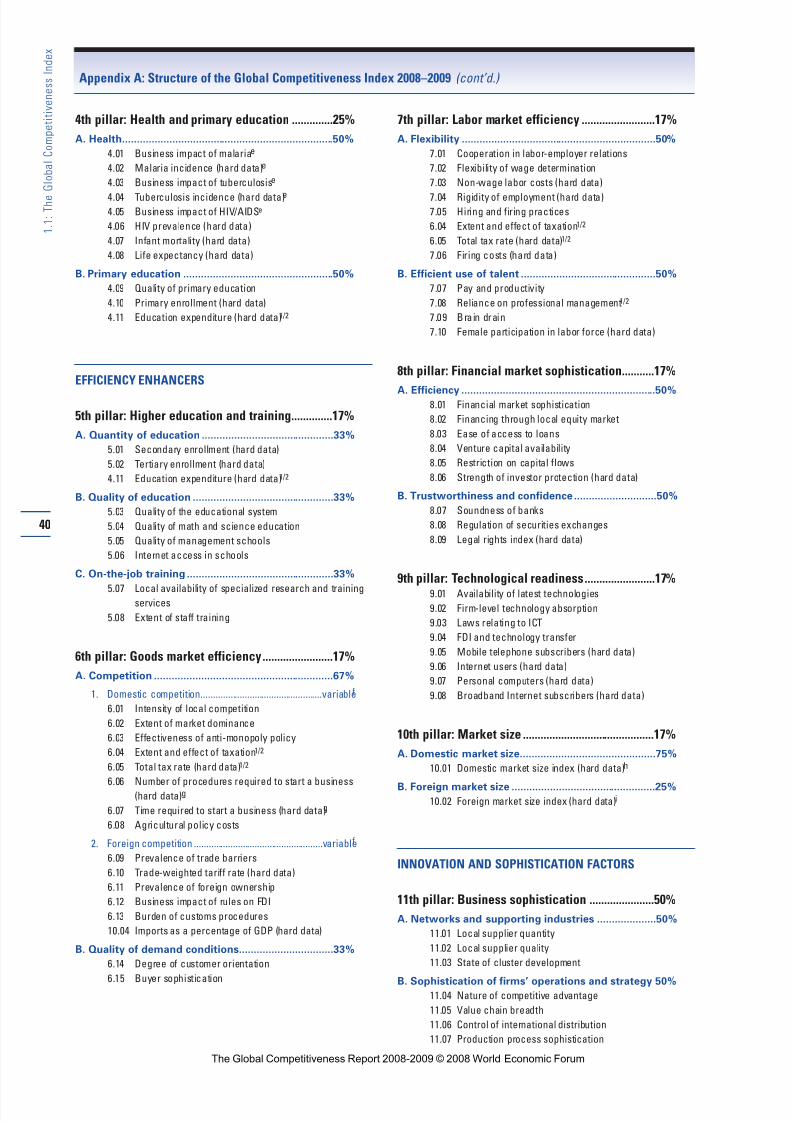
8/2/2019 Competiveness Index
http://slidepdf.com/reader/full/competiveness-index 38/39
40
1 . 1
: T h e
G l o b a l C o m p e t i t i v e n e s s I n d e x
4th pillar: Health and primary education ..............25%
A. Health........................................................................50%
4.01 Business impact of malariae
4.02 Malaria incidence (hard data)e
4.03 Business impact of tuberculosise
4.04 Tuberculosis incidence (hard data)e4.05 Business impact of HIV/AIDSe
4.06 HIV prevalence (hard data)
4.07 Infant mortality (hard data)
4.08 Life expectancy (hard data)
B. Primary education ...................................................50%
4.09 Quality of primary education
4.10 Primary enrollment (hard data)
4.11 Education expenditure (hard data)1/2
EFFICIENCY ENHANCERS
5th pillar: Higher education and training..............17%
A. Quantity of education .............................................33%
5.01 Secondary enrollment (hard data)
5.02 Tertiary enrollment (hard data)
4.11 Education expenditure (hard data)1/2
B. Quality of education ................................................33%
5.03 Quality of the educational system
5.04 Quality of math and science education
5.05 Quality of management schools
5.06 Internet access in schools
C. On-the-job training ..................................................33%
5.07 Local availability of specialized research and trainingservices
5.08 Extent of staff training
6th pillar: Goods market efficiency........................17%
A. Competition .............................................................67%
1. Domestic competition..................................................variable f
6.01 Intensity of local competition
6.02 Extent of market dominance
6.03 Effectiveness of anti-monopoly policy
6.04 Extent and effect of taxation1/2
6.05 Total tax rate (hard data)1/2
6.06 Number of procedures required to start a business(hard data)g
6.07 Time required to start a business (hard data)g
6.08 Agricultural policy costs
2. Foreign competition .....................................................variablef
6.09 Prevalence of trade barriers
6.10 Trade-weighted tariff rate (hard data)
6.11 Prevalence of foreign ownership
6.12 Business impact of rules on FDI
6.13 Burden of customs procedures
10.04 Imports as a percentage of GDP (hard data)
B. Quality of demand conditions................................33%
6.14 Degree of customer orientation
6.15 Buyer sophistication
7th pillar: Labor market efficiency .........................17%
A. Flexibility ..................................................................50%
7.01 Cooperation in labor-employer relations
7.02 Flexibility of wage determination
7.03 Non-wage labor costs (hard data)
7.04 Rigidity of employment (hard data)7.05 Hiring and firing practices
6.04 Extent and effect of taxation1/2
6.05 Total tax rate (hard data)1/2
7.06 Firing costs (hard data)
B. Efficient use of talent ..............................................50%
7.07 Pay and productivity
7.08 Reliance on professional management1/2
7.09 Brain drain
7.10 Female participation in labor force (hard data)
8th pillar: Financial market sophistication...........17%
A. Efficiency ..................................................................50%8.01 Financial market sophistication
8.02 Financing through local equity market
8.03 Ease of access to loans
8.04 Venture capital availability
8.05 Restriction on capital flows
8.06 Strength of investor protection (hard data)
B. Trustworthiness and confidence............................50%
8.07 Soundness of banks
8.08 Regulation of securities exchanges
8.09 Legal rights index (hard data)
9th pillar: Technological readiness........................17%9.01 Availability of latest technologies
9.02 Firm-level technology absorption
9.03 Laws relating to ICT
9.04 FDI and technology transfer
9.05 Mobile telephone subscribers (hard data)
9.06 Internet users (hard data)
9.07 Personal computers (hard data)
9.08 Broadband Internet subscribers (hard data)
10th pillar: Market size .............................................17%
A. Domestic market size..............................................75%
10.01 Domestic market size index (hard data)h
B. Foreign market size .................................................25%10.02 Foreign market size index (hard data)i
INNOVATION AND SOPHISTICATION FACTORS
11th pillar: Business sophistication ......................50%
A. Networks and supporting industries ....................50%
11.01 Local supplier quantity
11.02 Local supplier quality
11.03 State of cluster development
B. Sophistication of firms’ operations and strategy 50%11.04 Nature of competitive advantage
11.05 Value chain breadth
11.06 Control of international distribution
11.07 Production process sophistication
Appendix A: Structure of the Global Competitiveness Index 2008–2009 (cont’d.)
The Global Competitiveness Report 2008-2009 © 2008 World Economic Forum
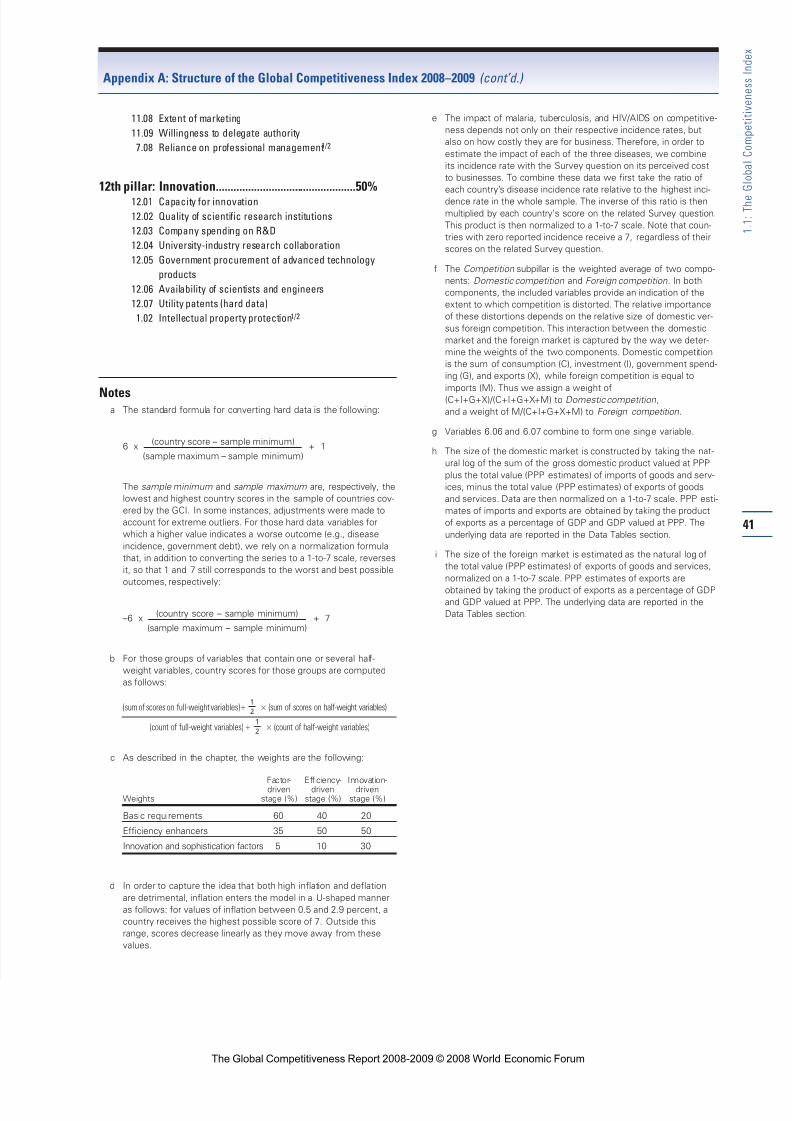
8/2/2019 Competiveness Index
http://slidepdf.com/reader/full/competiveness-index 39/39
11.08 Extent of marketing
11.09 Willingness to delegate authority
7.08 Reliance on professional management1/2
12th pillar: Innovation................................................50%12.01 Capacity for innovation
12.02 Quality of scientific research institutions
12.03 Company spending on R&D
12.04 University-industry research collaboration
12.05 Government procurement of advanced technology
products
12.06 Availability of scientists and engineers
12.07 Utility patents (hard data)
1.02 Intellectual property protection1/2
Notesa The standard formula for converting hard data is the following:
6 x(country score – sample minimum)
+ 1(sample maximum – sample minimum)
The sample minimum and sample maximum are, respectively, the
lowest and highest country scores in the sample of countries cov-
ered by the GCI. In some instances, adjustments were made to
account for extreme outliers. For those hard data variables for
which a higher value indicates a worse outcome (e.g., disease
incidence, government debt), we rely on a normalization formula
that, in addition to converting the series to a 1-to-7 scale, reverses
it, so that 1 and 7 still corresponds to the worst and best possible
outcomes, respectively:
–6 x(country score – sample minimum)
+ 7(sample maximum – sample minimum)
b For those groups of variables that contain one or several half-
weight variables, country scores for those groups are computed
as follows:
(sum of scores on full-weight variables) (sum of scores on half-weight variables)
(count of full-weight variables) (count of half-weight variables)
c As described in the chapter, the weights are the following:
Factor- Efficiency- Innovation-driven driven driven
Weights stage (%) stage (%) stage (%)
Basic requirements 60 40 20
Efficiency enhancers 35 50 50
Innovation and sophistication factors 5 10 30
d In order to capture the idea that both high inflation and deflation
are detrimental, inflation enters the model in a U-shaped manner
as follows: for values of inflation between 0.5 and 2.9 percent, a
country receives the highest possible score of 7. Outside this
range, scores decrease linearly as they move away from these
values.
e The impact of malaria, tuberculosis, and HIV/AIDS on competitive-
ness depends not only on their respective incidence rates, but
also on how costly they are for business. Therefore, in order to
estimate the impact of each of the three diseases, we combine
its incidence rate with the Survey question on its perceived cost
to businesses. To combine these data we first take the ratio of
each country’s disease incidence rate relative to the highest inci-
dence rate in the whole sample. The inverse of this ratio is then
multiplied by each country’s score on the related Survey question.
This product is then normalized to a 1-to-7 scale. Note that coun-
tries with zero reported incidence receive a 7, regardless of their
scores on the related Survey question.
f The Competition subpillar is the weighted average of two compo-
nents: Domestic competition and Foreign competition. In both
components, the included variables provide an indication of the
extent to which competition is distorted. The relative importance
of these distortions depends on the relative size of domestic ver-
sus foreign competition. This interaction between the domestic
market and the foreign market is captured by the way we deter-
mine the weights of the two components. Domestic competition
is the sum of consumption (C), investment (I), government spend-
ing (G), and exports (X), while foreign competition is equal to
imports (M). Thus we assign a weight of
(C+I+G+X)/(C+I+G+X+M) to Domestic competition,
and a weight of M/(C+I+G+X+M) to Foreign competition.
g Variables 6.06 and 6.07 combine to form one single variable.
h The size of the domestic market is constructed by taking the nat-
ural log of the sum of the gross domestic product valued at PPP
plus the total value (PPP estimates) of imports of goods and serv-
ices, minus the total value (PPP estimates) of exports of goods
and services. Data are then normalized on a 1-to-7 scale. PPP esti-
mates of imports and exports are obtained by taking the product
of exports as a percentage of GDP and GDP valued at PPP. The
underlying data are reported in the Data Tables section.
i The size of the foreign market is estimated as the natural log of
the total value (PPP estimates) of exports of goods and services,
normalized on a 1-to-7 scale. PPP estimates of exports are
obtained by taking the product of exports as a percentage of GDPand GDP valued at PPP. The underlying data are reported in the
Data Tables section.
Appendix A: Structure of the Global Competitiveness Index 2008–2009 (cont’d.)
41
1 . 1
: T h e
G l o b a l C o m p e t i t i v e n e s s I n d e x


![[Global HR Forum 2011] Creation of A New Corporate Competiveness: Social Marketing and Utilizing Human Resources](https://img.pdfslide.us/doc/110x75/5590df121a28ab39578b46f2/global-hr-forum-2011-creation-of-a-new-corporate-competiveness-social-marketing-and-utilizing-human-resources.jpg)