Embed Size (px)
Citation preview
Competitive Mechanisms Subserve Attention in Macaque AreasV2 and V4
John H. Reynolds,1 Leonardo Chelazzi,2 and Robert Desimone1
1Laboratory of Neuropsychology, National Institute of Mental Health, National Institutes of Health, Bethesda, Maryland20892-4415, and 2Dipartimento di Scienze Neurologiche e della Visione, Sezione di Fisiologia, University of Verona,Verona, Italy
It is well established that attention modulates visual processingin extrastriate cortex. However, the underlying neural mecha-nisms are unknown. A consistent observation is that attentionhas its greatest impact on neuronal responses when multiplestimuli appear together within a cell’s receptive field. One wayto explain this is to assume that multiple stimuli activate com-peting populations of neurons and that attention biases thiscompetition in favor of the attended stimulus. In the absence ofcompeting stimuli, there is no competition to be resolved.Accordingly, attention has a more limited effect on the neuronalresponse to a single stimulus. To test this interpretation, wemeasured the responses of neurons in macaque areas V2 andV4 using a behavioral paradigm that allowed us to isolateautomatic sensory processing mechanisms from attentionaleffects. First, we measured each cell’s response to a single
stimulus presented alone inside the receptive field or pairedwith a second receptive field stimulus, while the monkey at-tended to a location outside the receptive field. Adding thesecond stimulus typically caused the neuron’s response tomove toward the response that was elicited by the secondstimulus alone. Then, we directed the monkey’s attention to oneelement of the pair. This drove the neuron’s response towardthe response elicited when the attended stimulus appearedalone. These findings are consistent with the idea that attentionbiases competitive interactions among neurons, causing themto respond primarily to the attended stimulus. A quantitativeneural model of attention is proposed to account for theseresults.
Key words: spatial attention; monkey; extrastriate cortex; V2;V4; model
Experiments on attention in extrastriate visual cortex can bedivided into two types. Those that have used a single receptivefield stimulus have found that attention can increase the magni-tude of neuronal responses (Bushnell et al., 1981; Mountcastle etal., 1987; Spitzer et al., 1988; Treue and Maunsell, 1996; Gottliebet al., 1998). In contrast, studies using multiple receptive fieldstimuli have found that the effect of attention depends on theneuron’s stimulus selectivity. If two stimuli appear togetherwithin a neuron’s receptive field, the response is smaller whenattention is directed to the poorer stimulus relative to whenattention is directed to the preferred stimulus (Moran and Desi-mone, 1985; Treue and Maunsell, 1996; Luck et al., 1997).
The purpose of the present experiments was to test a modelthat can unify these two streams of research by explaining bothtypes of results as arising from a common neural mechanism.This “biased-competition model” (Desimone and Duncan, 1995)depends on two assumptions. (1) When multiple stimuli appeartogether, they activate populations of neurons that automaticallycompete with one another. (2) Attending to a stimulus biases thiscompetition in favor of neurons that respond to the attendedstimulus. We tested these hypotheses by recording neuronal re-
sponses in areas V2 and V4, where attention has been studiedpreviously using both single and multiple receptive field stimuli.
We tested the first hypothesis of the model in Experiment 1.We measured neuronal responses to two stimuli, both preferredand nonpreferred, within the receptive field when the monkeywas not required to attend to either stimulus. The stimuli werepresented one at a time and also together as a pair. If the firsthypothesis of the model is true, then the response to a preferredstimulus should be suppressed by the nonpreferred stimulus,because of the action of the competing neuronal populationactivated by that stimulus.
We tested the second hypothesis of the model in Experiment 2.As in Experiment 1, we measured neuronal responses to tworeceptive field stimuli, presented individually and as a pair. Wethen measured the response to the pair while the monkey at-tended to each individual stimulus. If the second hypothesis ofthe model is true, then this should cause the pair response tomove toward the response that was elicited when the attendedstimulus appeared alone.
A simple three-parameter implementation of the biased-competition model demonstrates that it can satisfy the two linearconstraints that are imposed by the results of these experiments.Using the parameters derived to fit these data, the model also fitspreviously published data on response modulation when attentionis directed to a single receptive field stimulus. We conclude bydescribing two easily tested predictions of the model.
MATERIALS AND METHODSSurgeryMany of the details of the recording techniques have been describedpreviously (Miller et al., 1993a). Briefly, three adult male rhesus monkeys
Received Aug. 18, 1998; revised Nov. 5, 1998; accepted Dec. 8, 1998.This work was supported by the National Institute of Mental Health Intramural
Research Program. J.H.R. was supported by a fellowship from the McDonnell-PewFoundation. L.C. was supported in part by a grant from the Human Frontier ScienceProgram Organization.
Correspondence should be addressed to Dr. Robert Desimone, Chief, Laboratoryof Neuropsychology, 49 Convent Drive MSC 4415, Building 49, Room 1B80,Bethesda, MD 20892-4415.Copyright © 1999 Society for Neuroscience 0270-6474/99/191736-18$05.00/0
The Journal of Neuroscience, March 1, 1999, 19(5):1736–1753
(Macaca mulatta) were surgically implanted with a head post, a scleraleye coil, and recording chambers. Surgery was conducted under asepticconditions with isofluorane anesthesia, and antibiotics and analgesicswere administered postoperatively. Preoperative magnetic resonanceimaging (MRI) was used to identify the stereotaxic coordinates of V2and V4. V4 recording chambers were placed over the prelunate gyrus.Additional plastic recording chambers were used for V2 recordings,centered 15 mm lateral and 15 mm dorsal to the occipital pole. The skullremained intact during the initial surgery, and small holes (;3 mm indiameter) were later drilled within the recording chambers under ket-amine anesthesia and xylazine analgesic to expose the dura for electrodepenetrations.
Confirmation of recording sitesAt the beginning of the study, several penetrations were made in eachchamber to ensure that the electrode was in the appropriate visual area.This was determined by assessing receptive field sizes, topographicorganization, and feature preferences at each site. All implants werenonferromagnetic (plastic recording chambers, titanium screws, andbrass head posts), so it was possible to verify the locations of ourrecording sites using additional MRI scans. After our experimental datawere collected, we rescanned two monkeys with a marker electrode(sharpened tungsten microelectrode; Frederick Haer & Co., Brunswick,ME) inserted in each recording chamber at the coordinates used duringrecording. We used a plastic cylinder that fit snugly inside the recordingwell to hold the marker electrode in place during the scan. At each endof the cylinder was a grid that was perforated with small holes, spaced 1mm apart (Christ Instruments, Damascus, MD). Each marker electrodewas lowered through the grids and into the brain to a depth of ;2 cmbeneath the dura using the same micropositioner and x–y stage that hadbeen used during recording. Before the micropositioner and x–y stagewere removed, a drop of glue was applied to hold the marker electrodein the grid. After the micropositioner and x–y stage were removed, theend of the electrode that was protruding from the recording well was thencut, and a plastic cap was placed over the recording chamber during thescan.
These marker electrodes were clearly visible in each scan. The posi-tions of these markers, the positions of electrode tracks made duringrecording, and the positions of the holes in the skull beneath eachrecording chamber all verified that our recording sites were appropriatelylocated in areas V2 and V4. The third monkey, from which eight neuronswere recorded, has not been rescanned.
Recording techniqueRecordings were obtained from a tungsten microelectrode that wascontrolled by a hydraulic microdrive. We made no effort to select neuronsfrom a particular layer of cortex. We recorded from the first neuronsencountered that could be clearly isolated and had sufficiently largereceptive fields (see Receptive field mapping). The portion of area V4where we recorded was directly beneath the recording chamber, so thefirst cells encountered were those in the superficial cortical layers. Neu-rons in area V2 were recorded by passing the electrode through V1 on theopercular surface, through the underlying white matter, and into theportion of V2 that lies on the posterior bank of the lunate sulcus.Therefore, the first cells encountered in V2 recordings were typically inthe deep layers. Thus, there may be a bias toward deeper recordings inV2 and more superficial recordings in V4.
In most cases, two neurons could be recorded simultaneously anddifferentiated on the basis of the size and shape of the spike waveform,and an on-line spike-sorting computer was used to classify these spikes bymeans of a template-matching procedure. Although this system allowedthe concurrent recording of two neurons, spikes arising from both neu-rons simultaneously (within a 1 msec interval) could not be detected.
StimuliThe stimuli used throughout all experiments in both cortical areas wereselected from a set of 16 stimuli composed of all combinations of fouroriented bars (0, 45, 90, and 135°) presented in four colors (red, blue,green, and yellow). The bars were 0.25° of visual arc wide by 1° in length.The colors were chosen to be photometrically equiluminant, with aluminance of 8.60 cd/m 2, presented against a gray background of lumi-nance 0.65 cd/m 2. In Experiment 1, all stimuli were 250 msec in dura-tion. In Experiment 2, stimulus duration ranged from 50 to 250 msec.
Receptive field mappingA manually (computer mouse) controlled flashing bar stimulus was usedto establish the outer boundaries of the multiunit receptive field. Aftercells were isolated, this same flashing bar stimulus was used to estimatethe position in the visual field where stimuli would generate the strongestresponse (the “hot spot” of the cell). Each of the 16 possible stimulidescribed above was then presented at this position, and the stimulus thatgave the greatest response was identified. This stimulus was then repeat-edly presented in a random sequence at 11 positions falling at regularintervals along an arc of equal eccentricity centered on the hot spot andextending bilaterally into the surround of the receptive field. The re-sponses of the cell at these 11 positions constituted a one-dimensionalprofile of the receptive field. Two of these 11 positions were usedthroughout the rest of the recording session. These two positions wereselected to give approximately equivalent responses to the mappingstimulus and to be clearly inside the receptive field. To achieve these twogoals, we found that it was necessary to place stimuli closer together forneurons with smaller receptive fields. Therefore, the stimuli used to testneurons in area V2 typically were closer together than were those used totest neurons in area V4. Because most receptive fields in both V2 and V4were approximately symmetric around the hot spot, the two positionswere typically approximately symmetric around the hot spot. For neu-rons with small receptive fields (including most V2 neurons), it wasusually the case that the 11 positions used in this automatic mappingprocedure were spaced closely together. We were careful to choosepositions that were far enough apart to avoid overlap between thestimulus pairs that would appear together in the main experiment. If areceptive field was too small to fit two stimuli easily at equally potentpositions inside the receptive field, the neuron was excluded, and weattempted to isolate a different neuron.
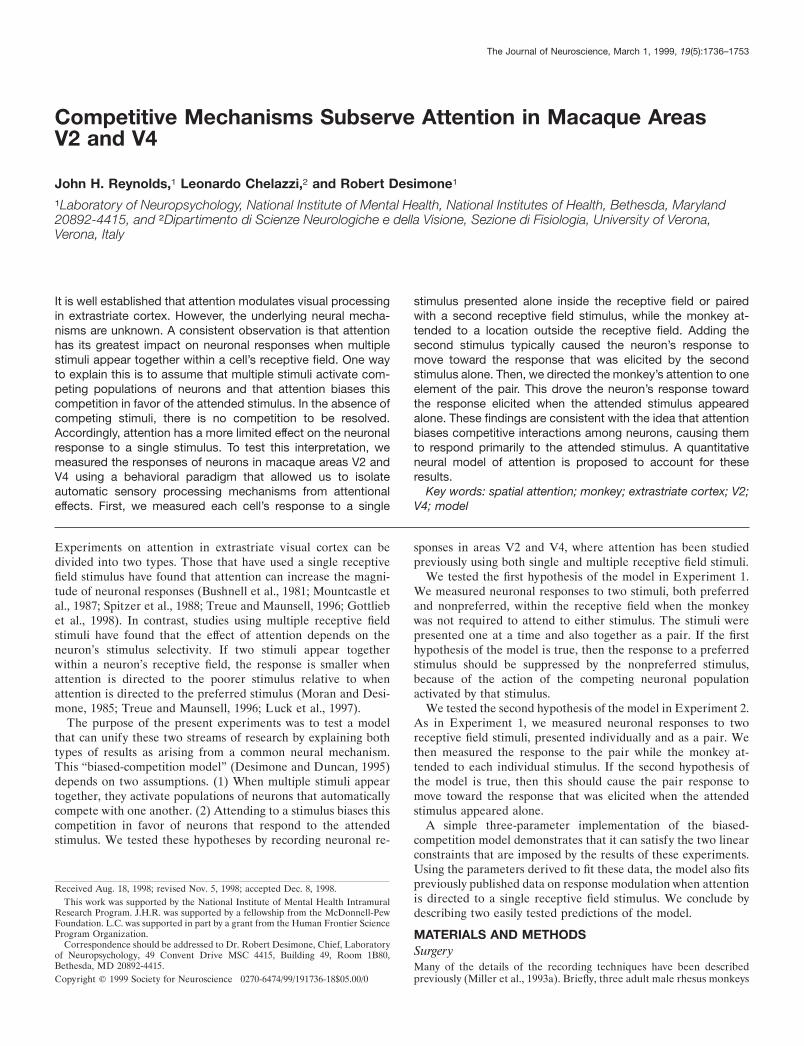
Experiment 1: characterization of V4 neurons’ responses tostimulus pairsStimulus configurations and experimental procedures. The stimulus con-figuration used in Experiment 1 is shown in Figure 1 A. The monkey wasrewarded for passively fixating a fixation spot at the center of thecomputer screen while stimuli were presented within the receptive fieldof the neuron under study. Stimuli could appear at one of two possiblelocations within the receptive field, which were selected as describedabove. At the beginning of a recording session, the stimulus that wouldappear at position one, designated the reference stimulus, was chosenfrom the set of 16 possible stimuli (four orientations 3 four colors)described above. The identity of the reference stimulus was fixedthroughout the recording session. On each trial, the stimulus that wouldappear at position two, designated a probe stimulus, was selected atrandom from the same set of 16 possible stimuli. We sought to testneuronal responses to stimulus pairs across the full spectrum of possiblereference–probe selectivity values. Therefore, the reference stimulus waschosen sometimes to be the stimulus (among the set of 16 possiblestimuli) eliciting the largest response, sometimes to be that eliciting thesmallest response, and sometimes to be that eliciting a response that fellbetween the largest and the smallest response. There is no reason tobelieve that the best stimulus of the 16 was the “optimal” stimulus forthe cell.
On any given trial, stimuli appeared in one of three possible configu-rations. (1) the reference stimulus appeared at position one, 2) a probestimulus appeared at position two, or 3) the reference stimulus appearedat position one together with a probe stimulus at position two. Whenevera trial included a probe stimulus (i.e., configurations 2 or 3), the identityof the probe stimulus was selected for that trial at random from the setof 16 possible stimuli. A recording session consisted of 540 completetrials. These were composed of 60 trials in which the reference stimulusappeared alone, 240 trials in which each of the 16 possible probesappeared alone (15 repetitions of each probe), and 240 trials in whicheach of the 16 possible probes appeared with the reference stimulus (15repetitions of each pair).
Data analysis. For each cell, we computed the average firing rate overa 250 msec window (stimulus duration) beginning 70 msec after stimulusonset (typical V4 neuron response onset). We chose this time window tocover the neuron’s full response period. To verify that our results are notan artifact of this particular time window, we have repeated this analysisusing time windows that included only the first 100 msec of response, thesecond 100 msec of response, and the time window that was used inExperiment 2. All of these analyses yielded qualitatively similar results.
Averages were computed in three stimulus configurations: (1) the
Reynolds et al. • Competitive Attention Mechanisms in Macaque V2 and V4 J. Neurosci., March 1, 1999, 19(5):1736–1753 1737
reference stimulus appearing alone, (2) each of the 16 probe stimuliappearing alone, and (3) each of the 16 resulting reference–probe pairs.We normalized all responses by dividing by the highest firing rateobserved within that time window in any stimulus condition. We thencomputed the difference between the normalized response of the cell tothe reference stimulus (REF) and each probe (PROBEi). This yielded 16selectivity values, denoted SEi, for each cell: SEi 5 PROBEi 2 REF.This selectivity index can range from 21 to 11, with negative valuesindicating that the reference stimulus elicited the stronger response, avalue of 0 indicating identical responses to reference and probe, andpositive values indicating that the probe stimulus elicited the strongerresponse.
We then computed an index that quantified the change in firing ratethat resulted from adding the probe stimulus to the reference stimulus.
This sensory interaction index (SIi) is the difference between the nor-malized response to the reference stimulus (REF) and the normalizedresponse to the pair composed of the reference stimulus and the ithprobe stimulus (PAIRi): SIi 5 PAIRi 2 REF. Like the selectivity index,the sensory interaction index can take on values from 21 to 11. Negativevalues indicate that the response to the pair was smaller than theresponse to the reference stimulus (i.e., adding the probe stimulussuppressed the neuronal response). A value of 0 indicates that adding theprobe stimulus had no effect on the neuron’s response. Positive valuesindicate that adding the probe increased the neuron’s response. For eachneuron, we quantified the relationship between selectivity and sensoryinteractions by performing a linear regression on the 16 selectivity andsensory interaction indices. A criterion level of p , 0.05 was used in allstatistical analyses.
These indices were computed to test the first assumption of thebiased-competition model. According to the model, when two stimuliappear within a neuron’s receptive field, the pair response is predicted tofall between the responses elicited when the stimuli appear individually.Thus, the response to a preferred reference stimulus (SE , 0) is pre-dicted to be suppressed by the addition of a poor probe stimulus withinthe receptive field (SI , 0). Likewise, the response to a poor referencestimulus (SE . 0) should be increased by the addition of a preferredprobe stimulus within the receptive field (SI . 0). Finally, if a referencestimulus and a probe stimulus generate equivalent responses (SE 5 0),then the pair response is predicted to be equal to either individualstimulus response (SI 5 0). Thus, according to the biased-competitionhypothesis, the relationship between sensory interactions and selectivityshould be positive and should pass through the origin (SE 5 SI 5 0).
The possibilit y that stimulus onset may have captured attention. Onepossible concern is that the appearance of a stimulus can capture atten-tion, even if behaviorally irrelevant. If this occurred for the stimuli usedin the present experiment, it might have caused a change in neuronalresponse. Although we cannot eliminate this possibility, we do notbelieve that this presents a serious problem. The empirical relationshipfound between selectivity and sensory interactions under passive fixationin Experiment 1 was replicated in Experiment 2, in which the monkeyactively attended to stimuli presented simultaneously outside the recep-tive field. Thus, any exogenous attention effects in Experiment 1 wereevidently small in magnitude, possibly because the monkey learned toignore the peripheral stimuli after thousands of stimulus presentations.Second, our conclusions do not depend on the absolute magnitude ofneuronal responses. Instead, they depend on a comparison of responsesto the different stimuli. Provided that attention was not directed prefer-entially to a particular stimulus, any effect of attention would not beexpected to influence the observed dependence of sensory interactionson selectivity.
Experiment 2: characterization of the effect of attention onsensory interactions in areas V2 and V4Stimulus configurations and experimental procedures. The attention task,which is similar to a task described previously (Luck et al., 1997), isillustrated in Figure 1, B and C. At the beginning of a recording session,a reference stimulus and a probe were selected from the same set of 16possible stimuli used in Experiment 1. These two stimuli were usedthroughout a recording session.
Stimuli could appear at four locations: two locations within the recep-tive field and two other locations outside the receptive field. To minimizethe possibility that the extrareceptive field stimuli appeared within thesurround of the receptive field, we placed these stimuli across the verticalmeridian. As an added precaution, we avoided recording from cellswhose receptive fields were near the vertical meridian. For the majorityof recordings, the across-meridian stimuli appeared at positions that weremirror images of the receptive field locations, as depicted in Figure 1 B.For a few recordings, the across-meridian stimuli appeared at positionsthat were above the horizontal meridian, 180° from the receptive field.The results of the experiment did not seem to depend on which of thesetwo configurations was used. Nevertheless, it remains possible that forsome cells, the extrareceptive field stimuli may have fallen within thesurround of the receptive field. However, these stimuli appeared in allattention conditions and all configurations of receptive field stimuli(probe, reference, and pair). Therefore, any effect that they potentiallymay have had on neuronal responses would not be expected to bias ourresults. Also, similar patterns of attention effects were observed in areasV2 and V4, despite the fact that V4 receptive fields and surrounds aresignificantly larger.
Figure 1. Stimulus configurations, Experiments 1 and 2, and task, Ex-periment 2. A, In Experiment 1, stimuli could appear at two locationswithin the receptive field (indicated by the dotted outline). On a given trial,either (1) the reference stimulus appeared at position 1, (2) a probestimulus appeared once at position 2, or (3) the reference appeared atposition 1 and a probe appeared at position 2. B, In Experiment 2, stimulicould appear at four positions: two within the receptive field and twoacross the vertical meridian. In the attend-away condition, the monkeyattended to one of the stimuli across the midline from the receptive field.On each trial, the reference, the probe, or the pair appeared within thereceptive field. In the attend-receptive-field-stimulus condition, stimuliappeared at all four positions, and the monkey attended to the referenceor probe stimulus within the receptive field. C, Examples of stimulussequences. The monkey’s task was to respond when a diamond-shapedtarget appeared at the attended location, while ignoring distractor targets,which occasionally appeared at the other locations. From trial to trial, thelength of the stimulus sequence varied at random, so the monkey neverknew when the target would appear. At the beginning of a block of trials,there were a few instruction trials, in which a bright cue box appeared atthe location to be attended. After the monkey was reliably responding tothe targets appearing at the cued location and ignoring distractors ap-pearing at other locations, the cue was removed, and the task continued inthe absence of the cue. From block to block, the monkey was recued toattend to a different location.
1738 J. Neurosci., March 1, 1999, 19(5):1736–1753 Reynolds et al. • Competitive Attention Mechanisms in Macaque V2 and V4
During a block of trials, the monkey had to attend to one of thepositions and ignore the others to detect a target stimulus at the attendedlocation. In the “attend-away” condition, the monkey attended to stimuliappearing at one of the two positions across the vertical meridian fromthe receptive field while the reference stimulus, the probe stimulus, orthe pair appeared within the receptive field. In the “attend-receptive-field-stimulus” condition, the reference and probe stimuli both appearedtogether within the receptive field, and attention was directed to eitherthe reference stimulus or the probe stimulus within the receptive field.Simultaneously, unattended stimuli appeared at the two positions acrossthe vertical meridian from the receptive field.
We directed the monkey’s attention to a given location as follows. Atthe beginning of each block of trials, the monkey received a few (typicallythree to five) “instruction trials” that indicated where it was to attend forthat block of trials. On these instruction trials, a bright cue box appearedat the location to be attended (see Fig. 1C.) The monkey’s task was todetect the presence of a diamond-shaped target stimulus appearing at thecued location. This target appeared at the end of a variable-lengthsequence of zero to six nontarget (reference or probe) stimuli. Thelength of a given sequence varied from trial to trial. Therefore, themonkey could not know in advance when the target diamond wouldappear and had to attend to the cued location throughout the trial todistinguish the target from the nontargets, release the bar, and earnreward. Stimulus sequences appeared synchronously at the other posi-tions, and distractor targets occasionally appeared embedded withinthem. If the monkey released the response lever after the appearance ofa distractor target, the trial was aborted, and another trial began after abrief delay. After the monkey was reliably releasing the response leverwhen the target appeared at the cued location, the cue was removed, andthe monkey had to continue performing the task without the cue.
It was rarely the case that the monkey would work long enough for usto complete an experiment, find a new set of cells, and complete a secondexperiment within a single recording session. However, it was oftenpossible to continue recording from the same neuron using an additionalstimulus pair. Therefore, to maximize the amount of data collected, werecorded from a neuron with one or more additional reference–probepairs, whenever possible.
Data analysis. Neuronal responses were analyzed for trials occurringafter the spatial cue was removed (i.e., the instruction trials were ex-cluded from the analysis). We measured neuronal responses during a 150msec time window beginning 120 msec after stimulus onset (the periodover which we typically observed attentional modulation). To verify thatour results are not an artifact of this particular time window, we haverepeated this analysis using time windows that depend on stimulusduration and on response onset time and windows that varied from cellto cell to cover the period of attentional modulation. All of these analysesyielded qualitatively similar results. However, it is worth noting that, asa result of variability in the timing of sensory interactions and attentioneffects, we did miss some effects that fell outside the time window. See,for example, the figure that shows the response of a neuron for whichsensory interactions and attention effects began before the beginning ofthis time window (see Fig. 7).
Because nontarget stimuli greatly outnumbered target stimuli anddistractor targets, the nontarget responses could be measured morereliably than the target responses. Therefore, our results are based onanalysis of responses to nontarget stimuli. However, under similar ex-perimental conditions, Luck et al. (1997) have compared the effect ofattention on neuronal responses to target versus nontarget stimuli. Theyfound that spatial attention has comparable effects on responses to targetand nontarget stimuli.
Responses were measured in five conditions. In the attend-away con-dition, we measured responses to (1) the reference stimulus, (2) theprobe stimulus, or (3) the pair, while the monkey attended away from thereceptive field. In the attend-receptive-field-stimulus condition, we mea-sured the pair response, while attention was directed to (4) the referencestimulus or (5) the probe.
As in Experiment 1, we normalized each cell’s responses by dividingall firing rates by the highest firing rate observed, for that cell, in any ofthe five conditions. Using these normalized responses, we then computeda selectivity index, SE, for each reference and probe: SE 5 PROBE 2REF. We then computed a sensory interaction index for each of the threeattentional conditions (attend away, attend to reference, and attend toprobe). This was the difference between the response to the referencestimulus (REF) and the response to the pair of stimuli, with attentiondirected either away from the receptive field (PAIRa), toward the refer-
ence stimulus (PAIRr), or toward the probe (PAIRp): SIa 5 PAIRa 2REF, SIr 5 PAIRr 2 REF, and SIp 5 PAIRp 2 REF. These indices arecomparable with the indices derived in Experiment 1, except that SIr andSIp correspond to sensory interactions when attention was directed to thereference and probe stimulus, respectively.
Experiment 2 included many more experimental conditions than didExperiment 1. Therefore, to avoid a combinatorial explosion, it wasnecessary to reduce the number of probe stimuli from the 16 probes usedin Experiment 1. Typically the monkey worked long enough to enable usto record from at most four different reference–probe pairs. For manycells, only one pair could be tested completely. It was therefore impos-sible, in Experiment 2, to quantify the relationship between selectivityand sensory interactions across stimuli within single cells. Instead, thesecomparisons were made across neurons within each cortical area. As inExperiment 1, we quantified the relationship between selectivity andsensory interactions in each cortical area by performing linear regres-sions on the selectivity and sensory interaction indices derived foreach cell.
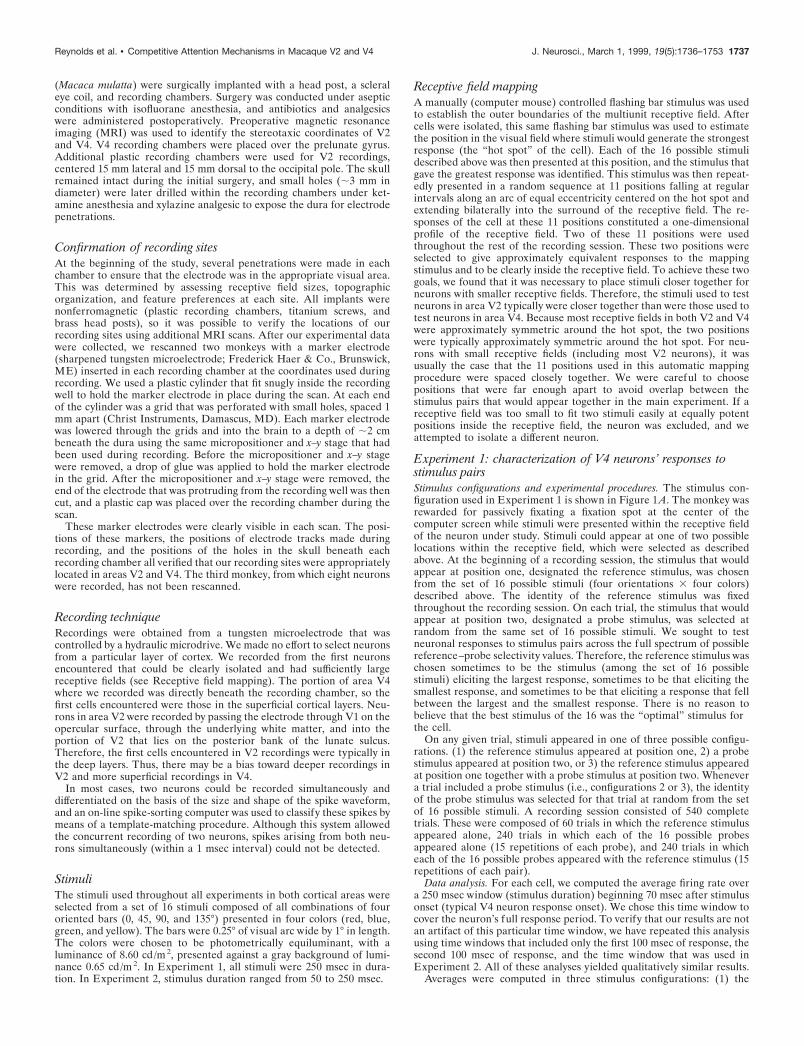
Model simulationsA simple model neural circuit, illustrated in Figure 2, was used tosimulate the results of Experiments 1 and 2. The model, which is a simplefeedforward competitive neural network, is defined by the four equationsshown at the bottom of Figure 2. The model includes two classes of cells.The circle at the top of Figure 2 represents the neuron (output) beingmeasured. The two circles at the bottom of the diagram in Figure 2represent populations of upstream neurons (inputs) that respond to the
Figure 2. Model circuit diagram. The circle on top represents the neuronbeing recorded. The variable y is the firing rate of this neuron. The twocircles at the bottom of the diagram represent populations of “input”neurons that respond to the reference (lef t) and probe (right) stimuli andthat project to the measured cell. The average response of the ith inputpopulation is designated xi. Black lines indicate the excitatory projectionsfrom each input population to the measured cell, and gray lines indicatethe inhibitory projections, which are assumed to depend on inhibitoryinterneurons (not shown). The variable wi
1 is the magnitude, or weight,of the excitatory projection from the ith input population, and wi
2 is theweight of the inhibitory projection from the ith input population. For acomplete description of the model, see Materials and Methods.
Reynolds et al. • Competitive Attention Mechanisms in Macaque V2 and V4 J. Neurosci., March 1, 1999, 19(5):1736–1753 1739
reference (left) and probe (right) stimuli. Lines connecting the inputs tothe output represent feedforward synaptic connections. Inhibitory inputsare assumed to depend on inhibitory interneurons (not shown).
Equations 1 and 2 (Fig. 2) describe the total excitatory and inhibitoryinputs, respectively, to the measured cell. The total excitatory input tothe cell ( E) is simply the sum of the activities of the two input popula-tions multiplied by their respective excitatory weights, as shown inEquation 1. The total inhibitory input to the cell ( I) is the sum of theactivities of the two input populations multiplied by their respectiveinhibitory weights, as shown in Equation 2.
Equation 3 (Fig. 2) describes how the firing rate of the output neuron( y) changes over time. This equation was originally introduced byGrossberg (1973) to provide an explanation of how feedforward compet-itive neural networks can be constructed to avoid saturating their re-sponses to strong inputs (e.g., high-contrast stimuli) while remainingsensitive to weak inputs. See Grossberg and Levine (1975) and Grossberg(1976, 1980) for further discussion.
The first term [(B 2 y)E] governs excitatory input. B is the maximumresponse of the cell. Therefore, (B 2 y) is always positive. If excitatoryinput is greater than zero, then (B 2 y)E is positive, resulting in anincrease in response that grows smaller as the cell’s response y ap-proaches its maximum rate. The second term (2 yI ) governs inhibitoryinput. If inhibitory input is greater than zero, then 2 yI is negative,resulting in a decrease in response toward zero. The third term (2 Ay) isa passive decay term.
The net effect of excitatory and inhibitory input is described byEquation 4 (Fig. 2), which is the equilibrium response of the outputneuron. The passive decay parameter A and the cell’s maximum responseB are constants. Therefore, the equilibrium response depends on therelative contributions of the excitatory input E and the inhibitory input I.Large values of E will drive the equilibrium firing rate toward the cell’smaximum firing rate B. Large values of I will cause the cell to remainsilent.
Attention is assumed to increase the strength of the signal coming fromthe population of cells activated by the attended stimulus. The exactmechanism by which this increase could occur is unknown. It is imple-mented here by increasing the efficacy of synapses projecting to themeasured cell from the population activated by the attended stimulus.Increasing the strength of the signal from the attended stimulus popula-tion causes it to have a greater influence on the total mix of excitation andinhibition. Consequently, the response of the cell is driven toward theresponse that would be elicited if the attended stimulus were presentedalone.
For all simulations, the maximum neuronal firing rate B was arbitrarilyset to 1, and the passive decay parameter A was set to 0.2. For each modelneuron, the excitatory and inhibitory weights projecting from the popu-lations of neurons activated by the reference and probe stimuli wereselected at random from a uniform distribution ranging from 0 to 1. Tosimulate the stochastic nature of neural responses, 610% random noise,selected from a uniform distribution, was added to the response of thecell in each condition. Attention was implemented by increasing by afactor of 5 the excitatory and inhibitory synaptic weights projecting fromthe input neuron population responding to the attended stimulus. Noother parameters appear in the model.
Simulation of Experiment 1. The responses of each model neuron to thereference stimulus, the 16 probes, and the corresponding 16 pairs werecomputed as follows. The reference stimulus and each of the 16 probeswere assumed to activate their own input populations. Each of theseinput populations was assigned an excitatory and an inhibitory weight atrandom from a uniform distribution ranging from 0 to 1. In the circuitdiagram shown in Figure 2, the input on the left is intended to corre-spond to the reference stimulus, which is constant for a given cell in thesimulation of Experiment 1. The input on the right is intended tocorrespond to one of the 16 probe stimuli.
For each probe, the model was activated in three conditions. In thereference condition, the reference input activity level was set to 1, andthe probe input was set to 0. In the probe condition, the probe input wasset to 1, and the reference input was set to 0. In the pair condition, theprobe and reference inputs were both set to 1. In each of the threeconditions, the equilibrium response of the model neuron was computedaccording to Equation 4 in Figure 2. The resulting responses were thenused to compute the indices of selectivity and sensory interaction, asdescribed for Experiment 1.
Simulation of Experiment 2. The model simulation of Experiment 2was conducted in the same manner as was the simulation of Experiment
1, with two changes. First, only one probe and one reference werepresented to each model neuron. So, in the circuit diagram shown inFigure 2, the left input is intended to correspond to the referencestimulus, and the right input is intended to correspond to the probe.Second, to incorporate attention to the reference and probe stimulus, themodel was also simulated in two additional conditions. In both of theseconditions, the reference and probe input activity levels were both set to1. In the attend-reference condition, the strengths of synaptic weightsfrom the reference stimulus input were multiplied by a factor of 5. In theattend-probe condition, the strengths of synaptic weights from the probestimulus input were multiplied by a factor of 5.
RESULTSExperiment 1Experiment 1 was designed to examine how the responses elicitedby a single stimulus within the receptive field (the referencestimulus) are influenced by the addition of a second receptivefield stimulus (the probe), in the absence of attentional modula-tion. Depending on the mechanisms that govern responses tostimulus pairs, adding the probe might be expected to result in anincrease, a reduction, or a more complex change in the pairresponse, compared with the response elicited by the referencestimulus. An increase in response could occur as a result ofadditional recruitment of V1 afferents by the second stimulus. Areduction in response could occur as a result of diminishedbottom-up or top-down excitatory drive. Response suppression byextrareceptive field stimuli has been observed in area V1(Knierim and Van Essen, 1992; Levitt and Lund, 1997). Re-sponse suppression has also been observed in higher-order areasthat provide feedback to areas V2 and V4 (Miller et al., 1993b;Rolls and Tovee, 1995). Alternatively, the individual stimulusresponses might bear no systematic relationship to the responseelicited by the pair. For example, the pair response might dependon factors other than the firing rates elicited by the individualstimuli, such as the geometric relationships between the stimuli(Kapadia et al., 1995; Sillito et al., 1995) or their color contrast(Kiper et al., 1997). Or, V2 and V4 cells might simply treat thepair as a third, independent stimulus, with its own arbitraryresponse.
In contrast to these alternatives, the biased-competition hy-pothesis predicts that the pair response should fall between theresponses to the reference and probe stimuli. According to thehypothesis, stimuli activate competing populations of neurons. Tothe extent that a probe stimulus has any influence on the neuronalresponse, the probe should move the pair response toward theresponse the probe would give if it had been presented alone.Adding a low-firing rate probe should drive down the response toa high-firing rate reference stimulus. Adding a high-firing rateprobe should drive up the response to a low-firing rate referencestimulus. If probe and reference stimuli individually elicit identi-cal responses, then this same response should be generated whenthey appear together as a pair.
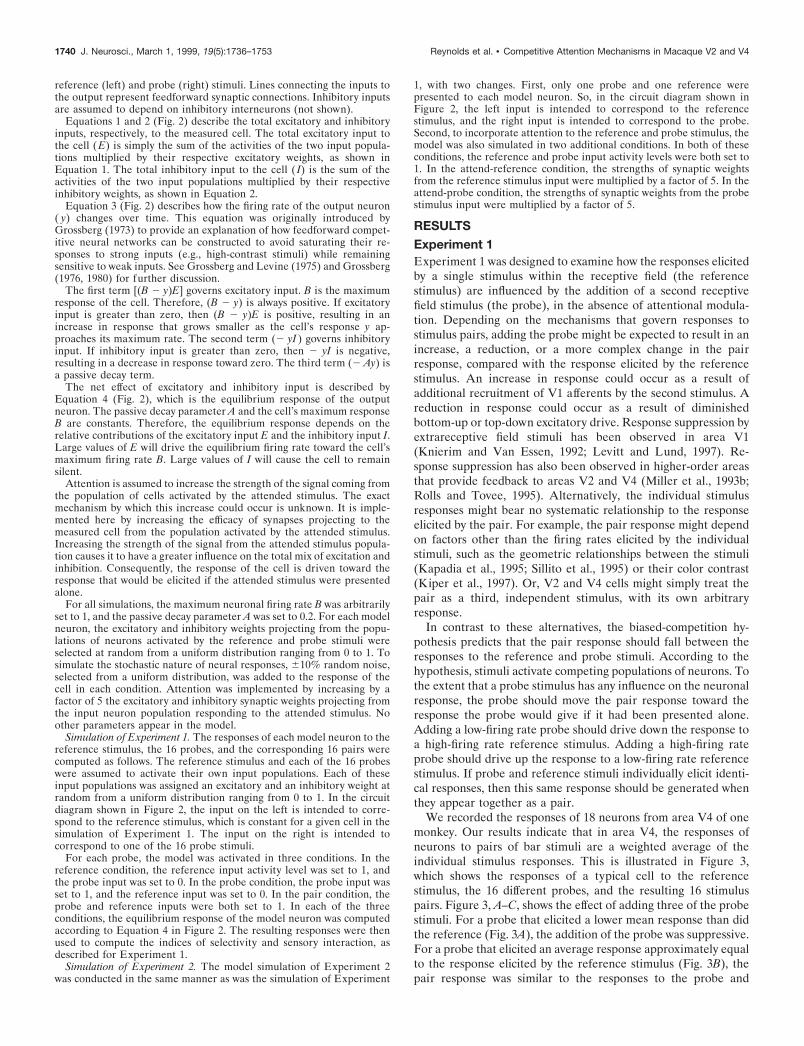
We recorded the responses of 18 neurons from area V4 of onemonkey. Our results indicate that in area V4, the responses ofneurons to pairs of bar stimuli are a weighted average of theindividual stimulus responses. This is illustrated in Figure 3,which shows the responses of a typical cell to the referencestimulus, the 16 different probes, and the resulting 16 stimuluspairs. Figure 3, A–C, shows the effect of adding three of the probestimuli. For a probe that elicited a lower mean response than didthe reference (Fig. 3A), the addition of the probe was suppressive.For a probe that elicited an average response approximately equalto the response elicited by the reference stimulus (Fig. 3B), thepair response was similar to the responses to the probe and
1740 J. Neurosci., March 1, 1999, 19(5):1736–1753 Reynolds et al. • Competitive Attention Mechanisms in Macaque V2 and V4
reference. For a probe stimulus that elicited a stronger responsethan did the reference stimulus (Fig. 3C), the addition of theprobe caused an increase in the cell’s mean response.
This relationship held across all 16 probe stimuli, as illustratedin Figure 3D. Each point corresponds to the indices of sensoryinteraction ( y-axis) versus selectivity (x-axis) for each probestimulus. Points labeled A–C correspond to the examples shownin Figure 3, A–C. The data were positively correlated [r2 5 0.53;r 2 significantly different from 0, F(1,15) 5 16.91 and p 5 0.001] and
fell along a line with a positive slope (10.67), indicating that theeffect of adding a probe stimulus was proportional to the selec-tivity of the cell’s response to the reference and the probestimulus. Adding a probe tended to suppress the neuronal re-sponse if the probe presented alone elicited a smaller responsethan did the reference stimulus. A probe tended to increase theneuronal response if the probe alone elicited a larger responsethan did the reference stimulus. The most suppressive probestended to be those that elicited the smallest responses, when
Figure 3. Single cell, Experiment 1. A–C, The response of a single V4 neuron to the reference, a probe, and the corresponding pair is shown in eachpanel. Stimulus conditions are indicated by the square icons in A–C. The receptive field is indicated by the dotted outline in each icon. The dot in the topright corner of each icon represents the fixation point. The x-axis shows time (in milliseconds) from stimulus onset, and the thick horizontal bar indicatesstimulus duration. The vertical bar in the upper lef t corner shows the SEM of the response of this neuron, averaged over the three stimulus conditionsfor each panel. The blue line that is constant across all three panels shows the response to the reference stimulus, which was a vertical green bar. Theresponse to the reference stimulus averaged over the defined time window (70–320 msec after stimulus onset) was 11.75 spikes/sec. A, The green lineindicates the response to a vertical yellow probe that drove the cell at a low average rate (4.51 spikes/sec). The response to the pair, indicated by a redline, was strongly suppressed by the probe stimulus (5.31 spikes/sec). B, A 45° blue bar probe, which elicited a response that was slightly smaller than theresponse to the reference stimulus (mean response, 8.76 spikes/sec), caused a smaller suppression in the cell’s response (mean pair response, 8.82spikes/sec). C, A 45° green bar probe, which elicited a response that was larger than the response to the reference (mean response, 17.80 spikes/sec),increased the cell’s response (mean response to pair, 13.81 spikes/sec). D, Indices of selectivity (x-axis) and sensory interaction ( y-axis) for all 16 probestimuli are shown. The indices corresponding to each of the probes illustrated in A–C are indicated by squares and are labeled in D. A negative selectivityindex (indicating that the response to the probe was less than the response to the reference stimulus) was typically paired with a negative sensoryinteraction index (indicating that the addition of the poor probe suppressed the response of the cell). Nonselective reference–probe pairs showed littleor no sensory interactions. Preferred probes increased the response to the reference stimulus. Ref, Reference stimulus.
Reynolds et al. • Competitive Attention Mechanisms in Macaque V2 and V4 J. Neurosci., March 1, 1999, 19(5):1736–1753 1741
presented alone. The probes causing the greatest increase inresponse tended to be those that elicited the largest responses,when presented alone. The intercept (20.02) was not significantlydifferent from 0 [t(14) 5 20.40; p 5 0.3486]. Thus, probes such asthe one corresponding to point B in Figure 3D, which gaveresponses similar to that of the reference stimulus, had little or noeffect when added to the reference stimulus.
Sensory interactions are, for this cell, approximately propor-tional to selectivity. Therefore, the slope of the best-fit lineprovides a convenient way to quantify the relative influenceexerted by the stimuli.
The equation of the best-fit line relating selectivity and sensoryinteraction indices can be written:
SIi 5 w SEi 1 offset,
where w is the slope of the regression equation, and offset is theincrease or decrease in response that is not accounted for byselectivity (i.e., the vertical intercept of the best-fit line). Thisequation can be rewritten:
PAIRi 2 REF 5 w (PROBEi 2 REF) 1 offset.
Rearranging terms, this can be expressed:
PAIRi 5 w PROBEi 1 (1 2 w)REF 1 offset.
Thus, the response to the pair (PAIRi) is the average of theresponse to the probe (PROBEi) and the response to the refer-ence stimulus (REF), weighted by the slope w, plus the offsetterm. The slope of the best-fit line (w) indicates how heavily thepair response is weighted toward the response to the probe. Thevalue (1 2 w) is the weighting factor of the reference stimulus.The slope w for the cell illustrated in Figure 3 was 0.67, and theoffset was not significantly different from 0. Therefore, for thiscell, the pair response can be described as a weighted average ofthe responses to the probe and reference stimuli, with the refer-ence stimulus exerting less influence (0.33) than the probe (0.67).Note that, for this neuron, the reference stimulus exerted lessinfluence than the probe despite the fact that the response to thereference was larger than the responses to 13 out of 16 probes(probes with negative selectivity values). Surprisingly, the degreeof influence exerted by a given stimulus does not seem to dependonly on the magnitude of the response elicited by that stimulus.
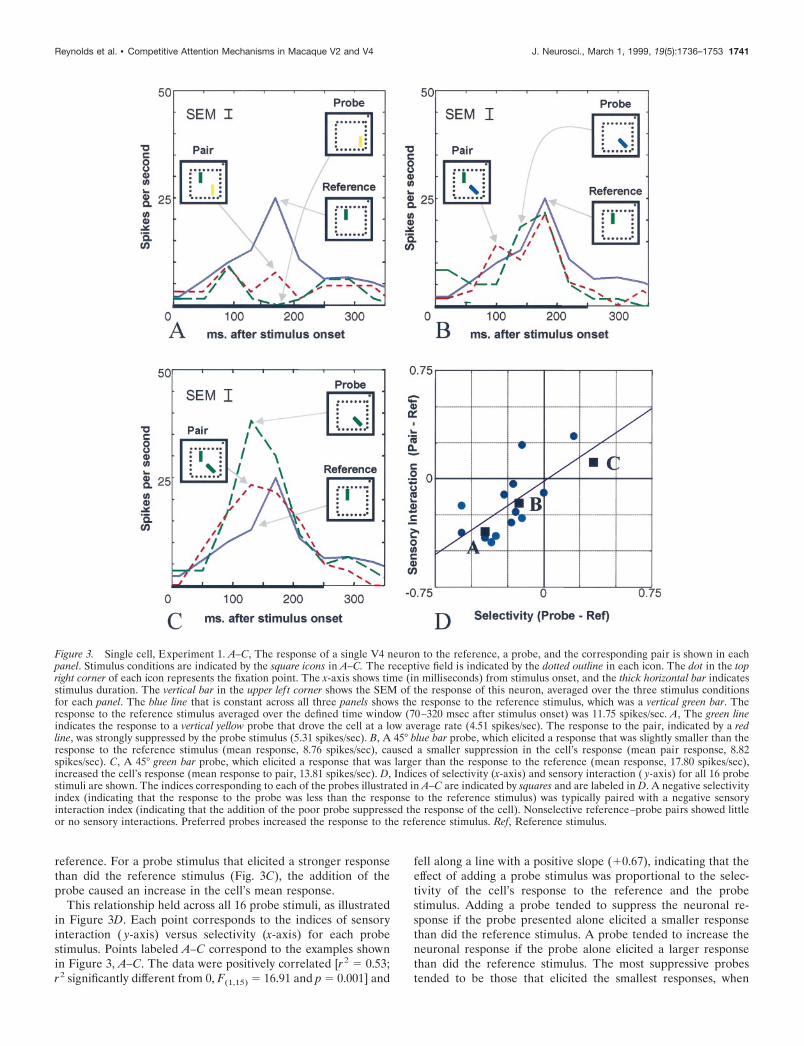
Figure 4. Six representative neurons, Ex-periment 1. A–F, The correlation betweenselectivity and sensory interactions, across16 probes, for one cell. A, The same cellthat appeared in Figure 3 shown for com-parison. B–D, Cells whose responses topairs showed a greater degree of probecontrol (slope . 0.5). E, F, Cells for whichthe reference was the dominant stimulus(slope , 0.5). In all cases, probe–referencepairs for which the cell was nonselectiveshowed little or no sensory interactions.
1742 J. Neurosci., March 1, 1999, 19(5):1736–1753 Reynolds et al. • Competitive Attention Mechanisms in Macaque V2 and V4
Although this weighting factor varied from cell to cell, re-sponses to the pair typically conformed to this pattern. Figure 4shows examples of six cells (including the example from Fig. 3Dfor comparison) that illustrate the range of correlations we ob-served. Across the population, sensory interactions were propor-tional to selectivity. However, responses to the pair showedvarying degrees of reference–probe sensitivity. For some cells,such as the one illustrated in Figure 4D, the pair responsedepended strongly on reference–probe selectivity (intercept 50.05; slope 5 0.8162), indicating that the pair response wasdetermined primarily by the probe stimulus and not by the ref-erence. For others, such as the cell illustrated in Figure 4F, theresponses to the pairs were approximately equal to the responseto the reference stimulus, regardless of the size of the responsesto the probes (intercept 5 20.006; slope 5 0.11). The cell wasselective for the probes, but there was no corresponding change inthe responses to the pairs, which were approximately equal to theresponse to the reference stimulus. Sixteen of 18 cells (89%) hadregression slopes between 0 (pair response equal to the responseto the reference stimulus, regardless of the response to the probe)and 1 (pair response equal to the response to the probe). The twocells with slopes outside this range had small slopes (20.07 and20.06) that were not significantly different from 0 [F(1,15) 50.1728 and p 5 0.6835; F(1,15) 5 0.0669 and p 5 0.80, respective-ly]. Across the population, the mean regression intercept was0.01, which was not significantly different from 0 [t(17) 5 0.5619;p 5 0.5815], indicating that, on average, the addition of the probestimulus did not result in a net change in neuronal response thatcould not be attributed to the selectivity of the cell for referenceand probe.
When the probe influenced the neuronal response, it typicallymoved the pair response toward the response that was elicited bythe probe alone. Across cells, the neuronal response was signifi-cantly changed by the addition of the probe for 83 stimulus pairstested (two-tailed t test, p , 0.05). For 35 out of 83 (42%) ofthese, the probe suppressed the pair response, and for the re-maining 48 out of 83 (58%), the probe increased the pair re-sponse. Of the 35 pairs for which the probe was significantlysuppressive, 34 out of 35 (97%) of these probes were less pre-ferred than was the reference stimulus (i.e., poor probes thatsuppressed the neuronal response). Of the 48 pairs for which theprobe increased the response, 37 out of 48 (77%) of these probeswere relatively more preferred than was the reference stimulus(i.e., preferred probes that increased the neuronal response).Thus, when the probe caused a significant change in the neuronalresponse, this change was toward the response elicited by theprobe 86% (71 out of 83 probes) of the time.
These data are incompatible with some possible models ofsensory processing in areas V2 and V4. In particular, we caneliminate models in which the response to a pair of stimuli isgreater than the response to the preferred stimulus appearingalone or less than the response to the poor stimulus alone. We canalso eliminate models in which the pair is treated as a third,independent stimulus, with its own arbitrary response.
Experiment 2The second experiment was designed to examine the relationshipbetween (1) selectivity, (2) the sensory interactions resulting fromadding a probe stimulus within the receptive field of the cell, and(3) the effect of directing attention to either the reference orprobe stimulus. In agreement with the finding of Luck et al.(1997), we often observed increases in the spontaneous firing rate
of neurons when attention was directed to a location within thereceptive field, during the period before the stimulus appeared.However, in the present experiment, we were interested in char-acterizing the effects of attention on neuronal responses evokedby stimuli within the receptive field. Therefore all of the resultsdescribed below are based on stimulus-evoked responses.
We recorded in areas V2 and V4, where previous studies havefound attentional modulation of neuronal responses. We mea-sured the responses of 158 neurons in three monkeys (86 in V2; 72in V4). For some cells, the monkey worked long enough to recordresponses from more than one reference–probe pair. Responseswere analyzed for all reference–probe pairs for which referenceand probe each gave significant responses, relative to the neuron’sspontaneous firing rate, with attention directed away from thereceptive field of the cell. A total of 208 stimulus pairs in 67 V2cells and 138 stimulus pairs in 57 V4 cells gave significant re-sponses (two-tailed t test, p , 0.05) for both reference and probe.
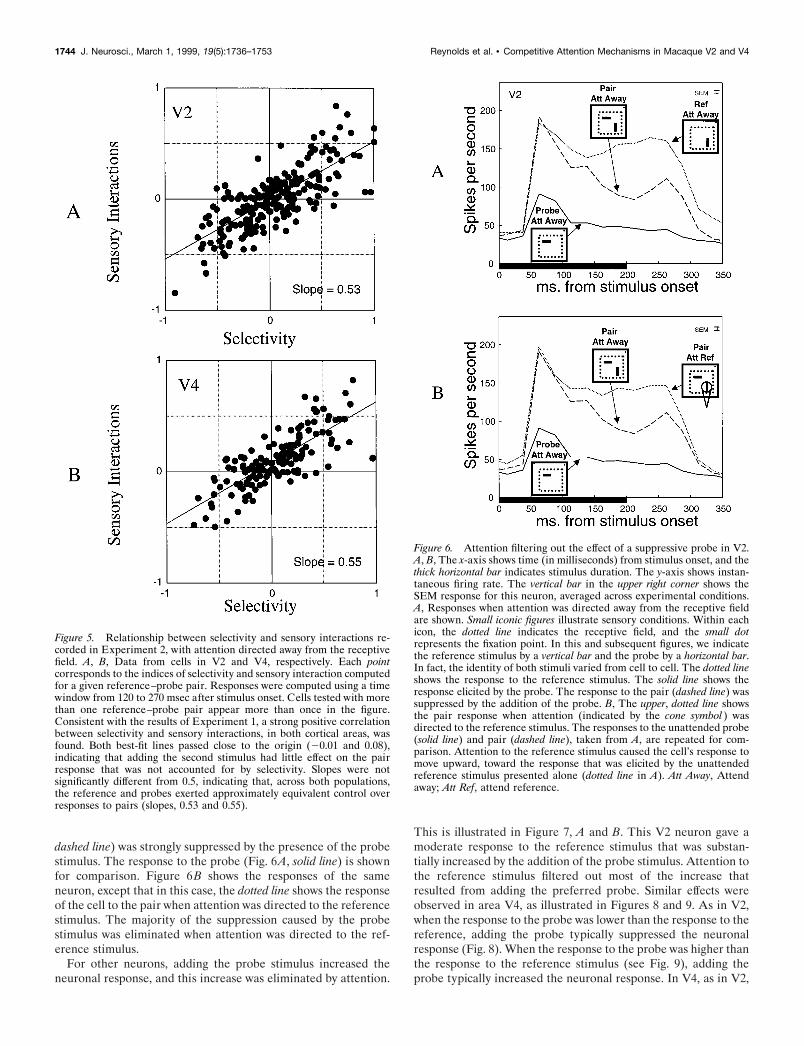
For these 124 neurons (346 stimulus pairs), we analyzed therelationship between selectivity and sensory interactions. Consis-tent with the results of Experiment 1, the effect of adding a probedepended on the cell’s selectivity for reference and probe. This isillustrated in Figure 5, which shows the relationship betweenselectivity (x-axis) and sensory interactions ( y-axis) for cells inV2 (Fig. 5A) and V4 (Fig. 5B). In both cortical areas, there is astrong correlation between selectivity and sensory interactions[V2, r2 5 0.58; r2 significantly different from 0, F(1,207) 5 285.9and p , 0.000001; V4, r 2 5 0.61; r 2 significantly different from 0,F(1,137) 5 213.3 and p , 0.000001]. This relationship appearslinear and passes near the origin (intercept, 20.01 and 10.08 forV2 and V4, respectively). In V2, the intercept (20.01) is notsignificantly different from 0 [t(206) 5 21.082; p 5 0.14]. However,in V4, the intercept (0.08) is significantly .0 [t(136) 5 6.1476; p ,0.000001], indicating that adding the probe stimulus within thereceptive field caused an increase in response that does notdepend on the cell’s selectivity for the reference and probestimuli. However, the magnitude of this increase is very small,relative to the changes in response that depend on selectivity forreference and probe. Both populations have slopes near 0.5(10.53 and 10.55 for V2 and V4, respectively) that are notsignificantly different from 0.5 [t(206) 5 1.0395; p 5 0.15; t(136) 51.2403; p 5 0.11], indicating that, on average, reference and probestimuli exerted approximately equivalent influence over pair re-sponses. Thus, as in Experiment 1, these results are incompatiblewith models in which the response to a pair of stimuli falls outsidethe range of responses defined by the two individual stimulipresented alone. As in Experiment 1, these results are alsoincompatible with models in which the pair is treated as a third,independent stimulus, with its own arbitrary response.
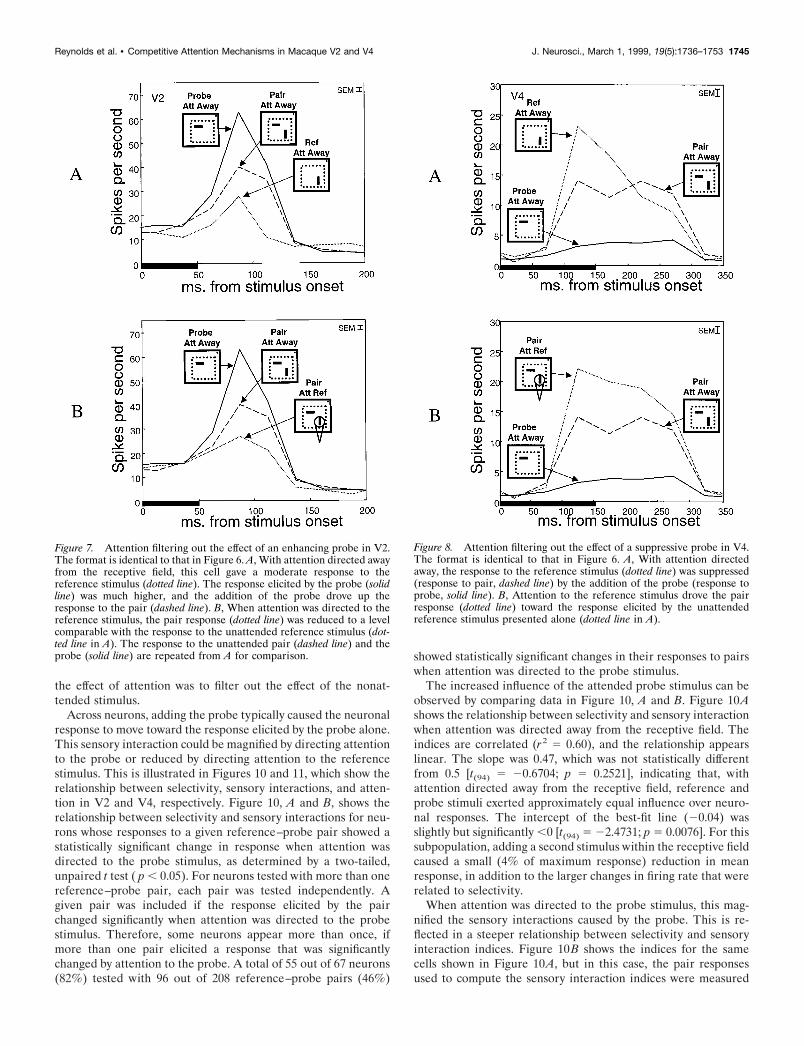
When attention was directed to one of the stimuli, this causeda substantial reduction in the influence of the nonattended stim-ulus. If the neuronal response was reduced as a result of addingthe probe, then this suppressive effect was diminished whenattention was directed to the reference stimulus. Likewise, ifadding the probe increased the neuronal response, then directingattention to the reference stimulus caused the response to moveback toward the reference stimulus response. This is illustrated inseveral figures (see Figs. 6–9) that show responses of individualneurons in areas V2 and V4. Figure 6A shows the responses of aV2 neuron for which adding the probe stimulus reduced theresponse. Attention was directed away from the receptive field ofthe cell (attend-away condition). The reference stimulus elicited arobust response (Fig. 6A, dotted line). The pair response (Fig. 6A,
Reynolds et al. • Competitive Attention Mechanisms in Macaque V2 and V4 J. Neurosci., March 1, 1999, 19(5):1736–1753 1743
dashed line) was strongly suppressed by the presence of the probestimulus. The response to the probe (Fig. 6A, solid line) is shownfor comparison. Figure 6B shows the responses of the sameneuron, except that in this case, the dotted line shows the responseof the cell to the pair when attention was directed to the referencestimulus. The majority of the suppression caused by the probestimulus was eliminated when attention was directed to the ref-erence stimulus.
For other neurons, adding the probe stimulus increased theneuronal response, and this increase was eliminated by attention.
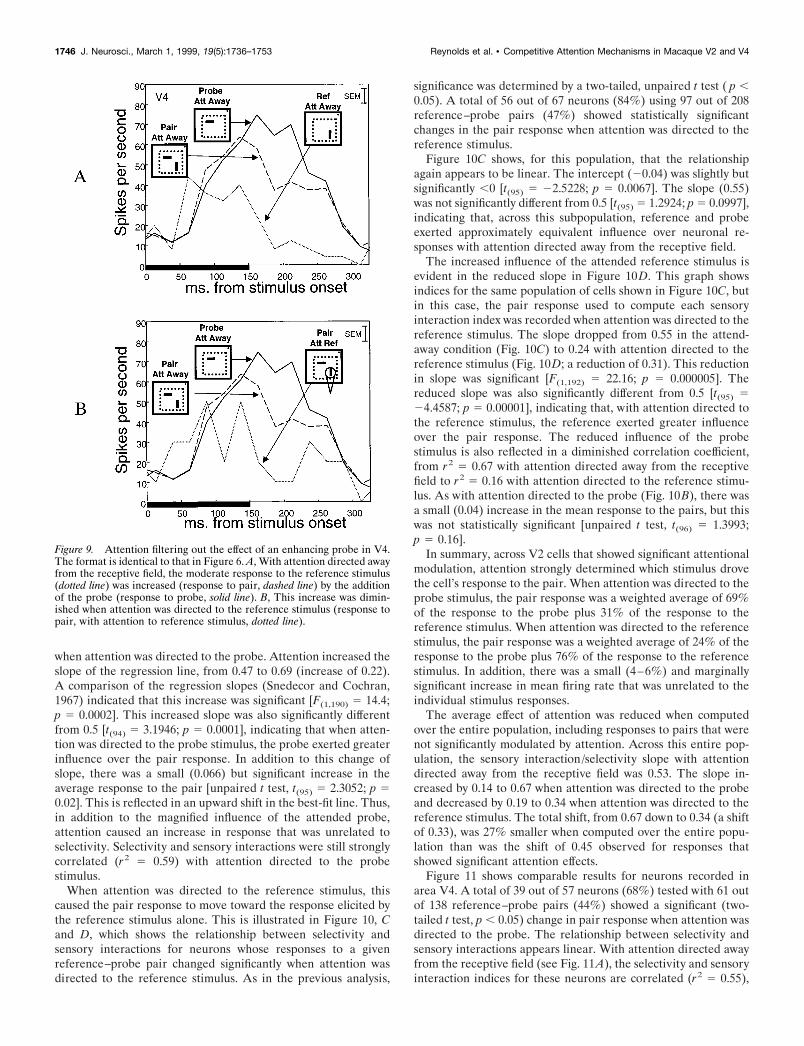
This is illustrated in Figure 7, A and B. This V2 neuron gave amoderate response to the reference stimulus that was substan-tially increased by the addition of the probe stimulus. Attention tothe reference stimulus filtered out most of the increase thatresulted from adding the preferred probe. Similar effects wereobserved in area V4, as illustrated in Figures 8 and 9. As in V2,when the response to the probe was lower than the response to thereference, adding the probe typically suppressed the neuronalresponse (Fig. 8). When the response to the probe was higher thanthe response to the reference stimulus (see Fig. 9), adding theprobe typically increased the neuronal response. In V4, as in V2,
Figure 5. Relationship between selectivity and sensory interactions re-corded in Experiment 2, with attention directed away from the receptivefield. A, B, Data from cells in V2 and V4, respectively. Each pointcorresponds to the indices of selectivity and sensory interaction computedfor a given reference–probe pair. Responses were computed using a timewindow from 120 to 270 msec after stimulus onset. Cells tested with morethan one reference–probe pair appear more than once in the figure.Consistent with the results of Experiment 1, a strong positive correlationbetween selectivity and sensory interactions, in both cortical areas, wasfound. Both best-fit lines passed close to the origin (20.01 and 0.08),indicating that adding the second stimulus had little effect on the pairresponse that was not accounted for by selectivity. Slopes were notsignificantly different from 0.5, indicating that, across both populations,the reference and probes exerted approximately equivalent control overresponses to pairs (slopes, 0.53 and 0.55).
Figure 6. Attention filtering out the effect of a suppressive probe in V2.A, B, The x-axis shows time (in milliseconds) from stimulus onset, and thethick horizontal bar indicates stimulus duration. The y-axis shows instan-taneous firing rate. The vertical bar in the upper right corner shows theSEM response for this neuron, averaged across experimental conditions.A, Responses when attention was directed away from the receptive fieldare shown. Small iconic figures illustrate sensory conditions. Within eachicon, the dotted line indicates the receptive field, and the small dotrepresents the fixation point. In this and subsequent figures, we indicatethe reference stimulus by a vertical bar and the probe by a horizontal bar.In fact, the identity of both stimuli varied from cell to cell. The dotted lineshows the response to the reference stimulus. The solid line shows theresponse elicited by the probe. The response to the pair (dashed line) wassuppressed by the addition of the probe. B, The upper, dotted line showsthe pair response when attention (indicated by the cone symbol ) wasdirected to the reference stimulus. The responses to the unattended probe(solid line) and pair (dashed line), taken from A, are repeated for com-parison. Attention to the reference stimulus caused the cell’s response tomove upward, toward the response that was elicited by the unattendedreference stimulus presented alone (dotted line in A). Att Away, Attendaway; Att Ref, attend reference.
1744 J. Neurosci., March 1, 1999, 19(5):1736–1753 Reynolds et al. • Competitive Attention Mechanisms in Macaque V2 and V4
the effect of attention was to filter out the effect of the nonat-tended stimulus.
Across neurons, adding the probe typically caused the neuronalresponse to move toward the response elicited by the probe alone.This sensory interaction could be magnified by directing attentionto the probe or reduced by directing attention to the referencestimulus. This is illustrated in Figures 10 and 11, which show therelationship between selectivity, sensory interactions, and atten-tion in V2 and V4, respectively. Figure 10, A and B, shows therelationship between selectivity and sensory interactions for neu-rons whose responses to a given reference–probe pair showed astatistically significant change in response when attention wasdirected to the probe stimulus, as determined by a two-tailed,unpaired t test ( p , 0.05). For neurons tested with more than onereference–probe pair, each pair was tested independently. Agiven pair was included if the response elicited by the pairchanged significantly when attention was directed to the probestimulus. Therefore, some neurons appear more than once, ifmore than one pair elicited a response that was significantlychanged by attention to the probe. A total of 55 out of 67 neurons(82%) tested with 96 out of 208 reference–probe pairs (46%)
showed statistically significant changes in their responses to pairswhen attention was directed to the probe stimulus.
The increased influence of the attended probe stimulus can beobserved by comparing data in Figure 10, A and B. Figure 10Ashows the relationship between selectivity and sensory interactionwhen attention was directed away from the receptive field. Theindices are correlated (r2 5 0.60), and the relationship appearslinear. The slope was 0.47, which was not statistically differentfrom 0.5 [t(94) 5 20.6704; p 5 0.2521], indicating that, withattention directed away from the receptive field, reference andprobe stimuli exerted approximately equal influence over neuro-nal responses. The intercept of the best-fit line (20.04) wasslightly but significantly ,0 [t(94) 5 22.4731; p 5 0.0076]. For thissubpopulation, adding a second stimulus within the receptive fieldcaused a small (4% of maximum response) reduction in meanresponse, in addition to the larger changes in firing rate that wererelated to selectivity.
When attention was directed to the probe stimulus, this mag-nified the sensory interactions caused by the probe. This is re-flected in a steeper relationship between selectivity and sensoryinteraction indices. Figure 10B shows the indices for the samecells shown in Figure 10A, but in this case, the pair responsesused to compute the sensory interaction indices were measured
Figure 7. Attention filtering out the effect of an enhancing probe in V2.The format is identical to that in Figure 6. A, With attention directed awayfrom the receptive field, this cell gave a moderate response to thereference stimulus (dotted line). The response elicited by the probe (solidline) was much higher, and the addition of the probe drove up theresponse to the pair (dashed line). B, When attention was directed to thereference stimulus, the pair response (dotted line) was reduced to a levelcomparable with the response to the unattended reference stimulus (dot-ted line in A). The response to the unattended pair (dashed line) and theprobe (solid line) are repeated from A for comparison.
Figure 8. Attention filtering out the effect of a suppressive probe in V4.The format is identical to that in Figure 6. A, With attention directedaway, the response to the reference stimulus (dotted line) was suppressed(response to pair, dashed line) by the addition of the probe (response toprobe, solid line). B, Attention to the reference stimulus drove the pairresponse (dotted line) toward the response elicited by the unattendedreference stimulus presented alone (dotted line in A).
Reynolds et al. • Competitive Attention Mechanisms in Macaque V2 and V4 J. Neurosci., March 1, 1999, 19(5):1736–1753 1745
when attention was directed to the probe. Attention increased theslope of the regression line, from 0.47 to 0.69 (increase of 0.22).A comparison of the regression slopes (Snedecor and Cochran,1967) indicated that this increase was significant [F(1,190) 5 14.4;p 5 0.0002]. This increased slope was also significantly differentfrom 0.5 [t(94) 5 3.1946; p 5 0.0001], indicating that when atten-tion was directed to the probe stimulus, the probe exerted greaterinfluence over the pair response. In addition to this change ofslope, there was a small (0.066) but significant increase in theaverage response to the pair [unpaired t test, t(95) 5 2.3052; p 50.02]. This is reflected in an upward shift in the best-fit line. Thus,in addition to the magnified influence of the attended probe,attention caused an increase in response that was unrelated toselectivity. Selectivity and sensory interactions were still stronglycorrelated (r 2 5 0.59) with attention directed to the probestimulus.
When attention was directed to the reference stimulus, thiscaused the pair response to move toward the response elicited bythe reference stimulus alone. This is illustrated in Figure 10, Cand D, which shows the relationship between selectivity andsensory interactions for neurons whose responses to a givenreference–probe pair changed significantly when attention wasdirected to the reference stimulus. As in the previous analysis,
significance was determined by a two-tailed, unpaired t test ( p ,0.05). A total of 56 out of 67 neurons (84%) using 97 out of 208reference–probe pairs (47%) showed statistically significantchanges in the pair response when attention was directed to thereference stimulus.
Figure 10C shows, for this population, that the relationshipagain appears to be linear. The intercept (20.04) was slightly butsignificantly ,0 [t(95) 5 22.5228; p 5 0.0067]. The slope (0.55)was not significantly different from 0.5 [t(95) 5 1.2924; p 5 0.0997],indicating that, across this subpopulation, reference and probeexerted approximately equivalent influence over neuronal re-sponses with attention directed away from the receptive field.
The increased influence of the attended reference stimulus isevident in the reduced slope in Figure 10D. This graph showsindices for the same population of cells shown in Figure 10C, butin this case, the pair response used to compute each sensoryinteraction index was recorded when attention was directed to thereference stimulus. The slope dropped from 0.55 in the attend-away condition (Fig. 10C) to 0.24 with attention directed to thereference stimulus (Fig. 10D; a reduction of 0.31). This reductionin slope was significant [F(1,192) 5 22.16; p 5 0.000005]. Thereduced slope was also significantly different from 0.5 [t(95) 524.4587; p 5 0.00001], indicating that, with attention directed tothe reference stimulus, the reference exerted greater influenceover the pair response. The reduced influence of the probestimulus is also reflected in a diminished correlation coefficient,from r 2 5 0.67 with attention directed away from the receptivefield to r2 5 0.16 with attention directed to the reference stimu-lus. As with attention directed to the probe (Fig. 10B), there wasa small (0.04) increase in the mean response to the pairs, but thiswas not statistically significant [unpaired t test, t(96) 5 1.3993;p 5 0.16].
In summary, across V2 cells that showed significant attentionalmodulation, attention strongly determined which stimulus drovethe cell’s response to the pair. When attention was directed to theprobe stimulus, the pair response was a weighted average of 69%of the response to the probe plus 31% of the response to thereference stimulus. When attention was directed to the referencestimulus, the pair response was a weighted average of 24% of theresponse to the probe plus 76% of the response to the referencestimulus. In addition, there was a small (4–6%) and marginallysignificant increase in mean firing rate that was unrelated to theindividual stimulus responses.
The average effect of attention was reduced when computedover the entire population, including responses to pairs that werenot significantly modulated by attention. Across this entire pop-ulation, the sensory interaction/selectivity slope with attentiondirected away from the receptive field was 0.53. The slope in-creased by 0.14 to 0.67 when attention was directed to the probeand decreased by 0.19 to 0.34 when attention was directed to thereference stimulus. The total shift, from 0.67 down to 0.34 (a shiftof 0.33), was 27% smaller when computed over the entire popu-lation than was the shift of 0.45 observed for responses thatshowed significant attention effects.
Figure 11 shows comparable results for neurons recorded inarea V4. A total of 39 out of 57 neurons (68%) tested with 61 outof 138 reference–probe pairs (44%) showed a significant (two-tailed t test, p , 0.05) change in pair response when attention wasdirected to the probe. The relationship between selectivity andsensory interactions appears linear. With attention directed awayfrom the receptive field (see Fig. 11A), the selectivity and sensoryinteraction indices for these neurons are correlated (r2 5 0.55),
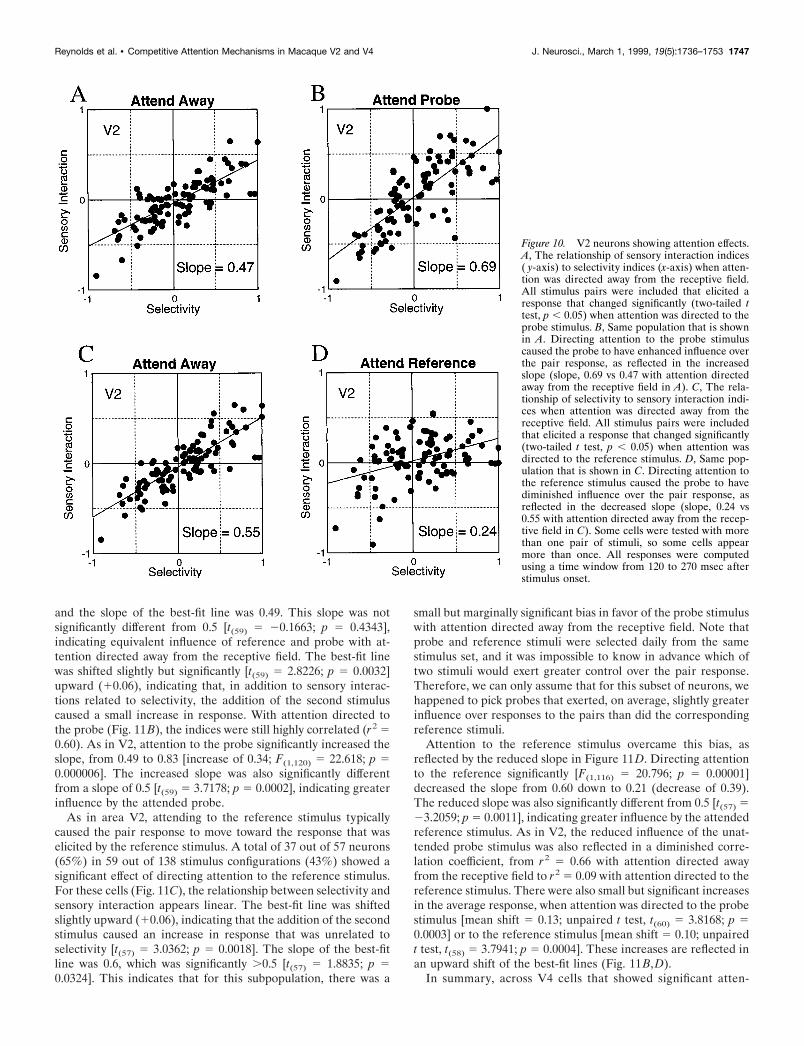
Figure 9. Attention filtering out the effect of an enhancing probe in V4.The format is identical to that in Figure 6. A, With attention directed awayfrom the receptive field, the moderate response to the reference stimulus(dotted line) was increased (response to pair, dashed line) by the additionof the probe (response to probe, solid line). B, This increase was dimin-ished when attention was directed to the reference stimulus (response topair, with attention to reference stimulus, dotted line).
1746 J. Neurosci., March 1, 1999, 19(5):1736–1753 Reynolds et al. • Competitive Attention Mechanisms in Macaque V2 and V4
and the slope of the best-fit line was 0.49. This slope was notsignificantly different from 0.5 [t(59) 5 20.1663; p 5 0.4343],indicating equivalent influence of reference and probe with at-tention directed away from the receptive field. The best-fit linewas shifted slightly but significantly [t(59) 5 2.8226; p 5 0.0032]upward (10.06), indicating that, in addition to sensory interac-tions related to selectivity, the addition of the second stimuluscaused a small increase in response. With attention directed tothe probe (Fig. 11B), the indices were still highly correlated (r 2 50.60). As in V2, attention to the probe significantly increased theslope, from 0.49 to 0.83 [increase of 0.34; F(1,120) 5 22.618; p 50.000006]. The increased slope was also significantly differentfrom a slope of 0.5 [t(59) 5 3.7178; p 5 0.0002], indicating greaterinfluence by the attended probe.
As in area V2, attending to the reference stimulus typicallycaused the pair response to move toward the response that waselicited by the reference stimulus. A total of 37 out of 57 neurons(65%) in 59 out of 138 stimulus configurations (43%) showed asignificant effect of directing attention to the reference stimulus.For these cells (Fig. 11C), the relationship between selectivity andsensory interaction appears linear. The best-fit line was shiftedslightly upward (10.06), indicating that the addition of the secondstimulus caused an increase in response that was unrelated toselectivity [t(57) 5 3.0362; p 5 0.0018]. The slope of the best-fitline was 0.6, which was significantly .0.5 [t(57) 5 1.8835; p 50.0324]. This indicates that for this subpopulation, there was a
small but marginally significant bias in favor of the probe stimuluswith attention directed away from the receptive field. Note thatprobe and reference stimuli were selected daily from the samestimulus set, and it was impossible to know in advance which oftwo stimuli would exert greater control over the pair response.Therefore, we can only assume that for this subset of neurons, wehappened to pick probes that exerted, on average, slightly greaterinfluence over responses to the pairs than did the correspondingreference stimuli.
Attention to the reference stimulus overcame this bias, asreflected by the reduced slope in Figure 11D. Directing attentionto the reference significantly [F(1,116) 5 20.796; p 5 0.00001]decreased the slope from 0.60 down to 0.21 (decrease of 0.39).The reduced slope was also significantly different from 0.5 [t(57) 523.2059; p 5 0.0011], indicating greater influence by the attendedreference stimulus. As in V2, the reduced influence of the unat-tended probe stimulus was also reflected in a diminished corre-lation coefficient, from r2 5 0.66 with attention directed awayfrom the receptive field to r 2 5 0.09 with attention directed to thereference stimulus. There were also small but significant increasesin the average response, when attention was directed to the probestimulus [mean shift 5 0.13; unpaired t test, t(60) 5 3.8168; p 50.0003] or to the reference stimulus [mean shift 5 0.10; unpairedt test, t(58) 5 3.7941; p 5 0.0004]. These increases are reflected inan upward shift of the best-fit lines (Fig. 11B,D).
In summary, across V4 cells that showed significant atten-
Figure 10. V2 neurons showing attention effects.A, The relationship of sensory interaction indices( y-axis) to selectivity indices (x-axis) when atten-tion was directed away from the receptive field.All stimulus pairs were included that elicited aresponse that changed significantly (two-tailed ttest, p , 0.05) when attention was directed to theprobe stimulus. B, Same population that is shownin A. Directing attention to the probe stimuluscaused the probe to have enhanced influence overthe pair response, as reflected in the increasedslope (slope, 0.69 vs 0.47 with attention directedaway from the receptive field in A). C, The rela-tionship of selectivity to sensory interaction indi-ces when attention was directed away from thereceptive field. All stimulus pairs were includedthat elicited a response that changed significantly(two-tailed t test, p , 0.05) when attention wasdirected to the reference stimulus. D, Same pop-ulation that is shown in C. Directing attention tothe reference stimulus caused the probe to havediminished influence over the pair response, asreflected in the decreased slope (slope, 0.24 vs0.55 with attention directed away from the recep-tive field in C). Some cells were tested with morethan one pair of stimuli, so some cells appearmore than once. All responses were computedusing a time window from 120 to 270 msec afterstimulus onset.
Reynolds et al. • Competitive Attention Mechanisms in Macaque V2 and V4 J. Neurosci., March 1, 1999, 19(5):1736–1753 1747
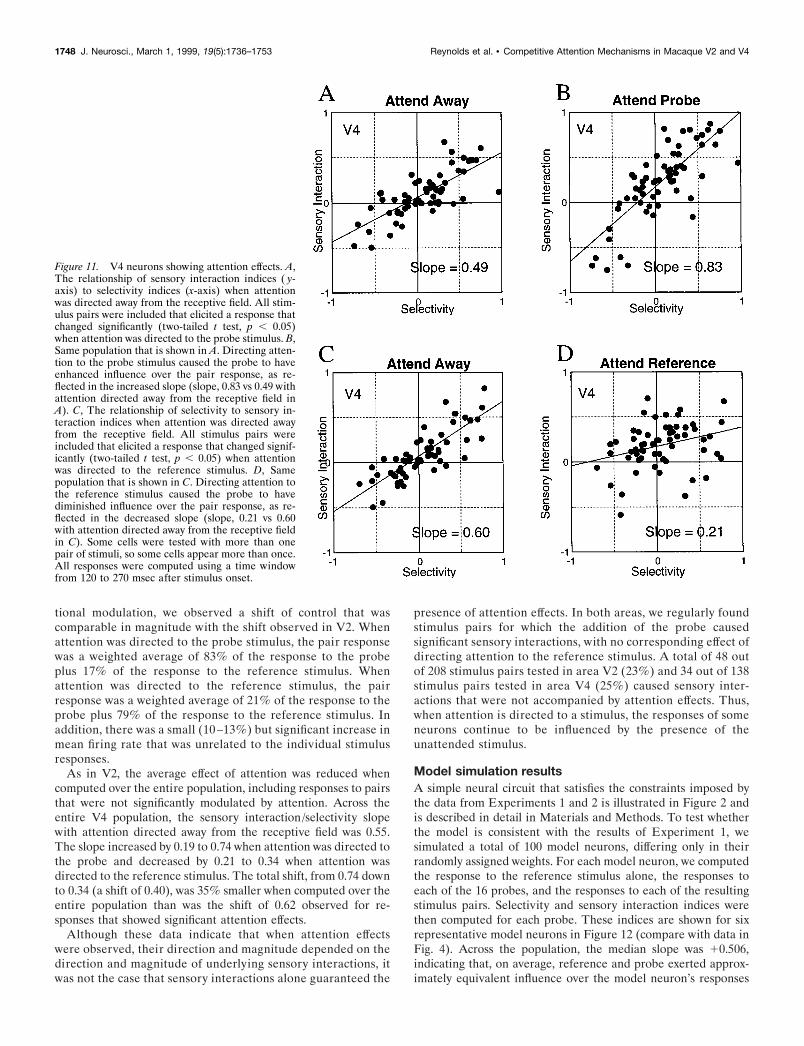
tional modulation, we observed a shift of control that wascomparable in magnitude with the shift observed in V2. Whenattention was directed to the probe stimulus, the pair responsewas a weighted average of 83% of the response to the probeplus 17% of the response to the reference stimulus. Whenattention was directed to the reference stimulus, the pairresponse was a weighted average of 21% of the response to theprobe plus 79% of the response to the reference stimulus. Inaddition, there was a small (10 –13%) but significant increase inmean firing rate that was unrelated to the individual stimulusresponses.
As in V2, the average effect of attention was reduced whencomputed over the entire population, including responses to pairsthat were not significantly modulated by attention. Across theentire V4 population, the sensory interaction/selectivity slopewith attention directed away from the receptive field was 0.55.The slope increased by 0.19 to 0.74 when attention was directed tothe probe and decreased by 0.21 to 0.34 when attention wasdirected to the reference stimulus. The total shift, from 0.74 downto 0.34 (a shift of 0.40), was 35% smaller when computed over theentire population than was the shift of 0.62 observed for re-sponses that showed significant attention effects.
Although these data indicate that when attention effectswere observed, their direction and magnitude depended on thedirection and magnitude of underlying sensory interactions, itwas not the case that sensory interactions alone guaranteed the
presence of attention effects. In both areas, we regularly foundstimulus pairs for which the addition of the probe causedsignificant sensory interactions, with no corresponding effect ofdirecting attention to the reference stimulus. A total of 48 outof 208 stimulus pairs tested in area V2 (23%) and 34 out of 138stimulus pairs tested in area V4 (25%) caused sensory inter-actions that were not accompanied by attention effects. Thus,when attention is directed to a stimulus, the responses of someneurons continue to be influenced by the presence of theunattended stimulus.
Model simulation resultsA simple neural circuit that satisfies the constraints imposed bythe data from Experiments 1 and 2 is illustrated in Figure 2 andis described in detail in Materials and Methods. To test whetherthe model is consistent with the results of Experiment 1, wesimulated a total of 100 model neurons, differing only in theirrandomly assigned weights. For each model neuron, we computedthe response to the reference stimulus alone, the responses toeach of the 16 probes, and the responses to each of the resultingstimulus pairs. Selectivity and sensory interaction indices werethen computed for each probe. These indices are shown for sixrepresentative model neurons in Figure 12 (compare with data inFig. 4). Across the population, the median slope was 10.506,indicating that, on average, reference and probe exerted approx-imately equivalent influence over the model neuron’s responses
Figure 11. V4 neurons showing attention effects. A,The relationship of sensory interaction indices ( y-axis) to selectivity indices (x-axis) when attentionwas directed away from the receptive field. All stim-ulus pairs were included that elicited a response thatchanged significantly (two-tailed t test, p , 0.05)when attention was directed to the probe stimulus. B,Same population that is shown in A. Directing atten-tion to the probe stimulus caused the probe to haveenhanced influence over the pair response, as re-flected in the increased slope (slope, 0.83 vs 0.49 withattention directed away from the receptive field inA). C, The relationship of selectivity to sensory in-teraction indices when attention was directed awayfrom the receptive field. All stimulus pairs wereincluded that elicited a response that changed signif-icantly (two-tailed t test, p , 0.05) when attentionwas directed to the reference stimulus. D, Samepopulation that is shown in C. Directing attention tothe reference stimulus caused the probe to havediminished influence over the pair response, as re-flected in the decreased slope (slope, 0.21 vs 0.60with attention directed away from the receptive fieldin C). Some cells were tested with more than onepair of stimuli, so some cells appear more than once.All responses were computed using a time windowfrom 120 to 270 msec after stimulus onset.
1748 J. Neurosci., March 1, 1999, 19(5):1736–1753 Reynolds et al. • Competitive Attention Mechanisms in Macaque V2 and V4
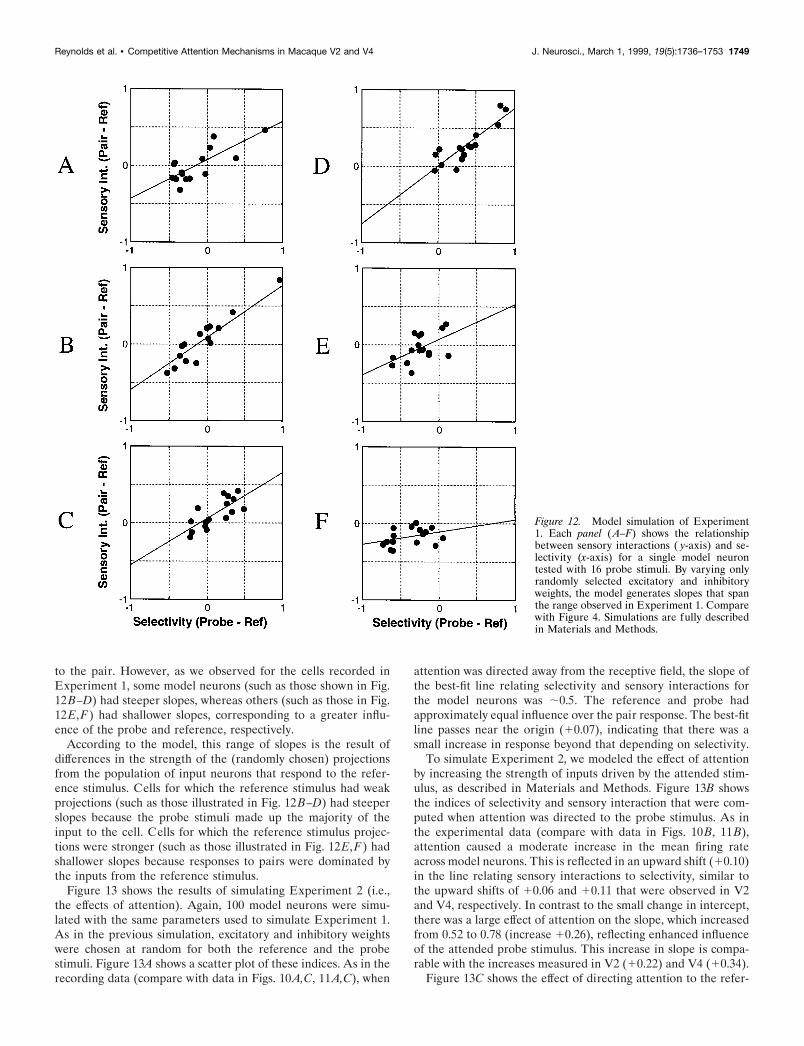
to the pair. However, as we observed for the cells recorded inExperiment 1, some model neurons (such as those shown in Fig.12B–D) had steeper slopes, whereas others (such as those in Fig.12E,F) had shallower slopes, corresponding to a greater influ-ence of the probe and reference, respectively.
According to the model, this range of slopes is the result ofdifferences in the strength of the (randomly chosen) projectionsfrom the population of input neurons that respond to the refer-ence stimulus. Cells for which the reference stimulus had weakprojections (such as those illustrated in Fig. 12B–D) had steeperslopes because the probe stimuli made up the majority of theinput to the cell. Cells for which the reference stimulus projec-tions were stronger (such as those illustrated in Fig. 12E,F) hadshallower slopes because responses to pairs were dominated bythe inputs from the reference stimulus.
Figure 13 shows the results of simulating Experiment 2 (i.e.,the effects of attention). Again, 100 model neurons were simu-lated with the same parameters used to simulate Experiment 1.As in the previous simulation, excitatory and inhibitory weightswere chosen at random for both the reference and the probestimuli. Figure 13A shows a scatter plot of these indices. As in therecording data (compare with data in Figs. 10A,C, 11A,C), when
attention was directed away from the receptive field, the slope ofthe best-fit line relating selectivity and sensory interactions forthe model neurons was ;0.5. The reference and probe hadapproximately equal influence over the pair response. The best-fitline passes near the origin (10.07), indicating that there was asmall increase in response beyond that depending on selectivity.
To simulate Experiment 2, we modeled the effect of attentionby increasing the strength of inputs driven by the attended stim-ulus, as described in Materials and Methods. Figure 13B showsthe indices of selectivity and sensory interaction that were com-puted when attention was directed to the probe stimulus. As inthe experimental data (compare with data in Figs. 10B, 11B),attention caused a moderate increase in the mean firing rateacross model neurons. This is reflected in an upward shift (10.10)in the line relating sensory interactions to selectivity, similar tothe upward shifts of 10.06 and 10.11 that were observed in V2and V4, respectively. In contrast to the small change in intercept,there was a large effect of attention on the slope, which increasedfrom 0.52 to 0.78 (increase 10.26), reflecting enhanced influenceof the attended probe stimulus. This increase in slope is compa-rable with the increases measured in V2 (10.22) and V4 (10.34).
Figure 13C shows the effect of directing attention to the refer-
Figure 12. Model simulation of Experiment1. Each panel (A–F) shows the relationshipbetween sensory interactions ( y-axis) and se-lectivity (x-axis) for a single model neurontested with 16 probe stimuli. By varying onlyrandomly selected excitatory and inhibitoryweights, the model generates slopes that spanthe range observed in Experiment 1. Comparewith Figure 4. Simulations are fully describedin Materials and Methods.
Reynolds et al. • Competitive Attention Mechanisms in Macaque V2 and V4 J. Neurosci., March 1, 1999, 19(5):1736–1753 1749
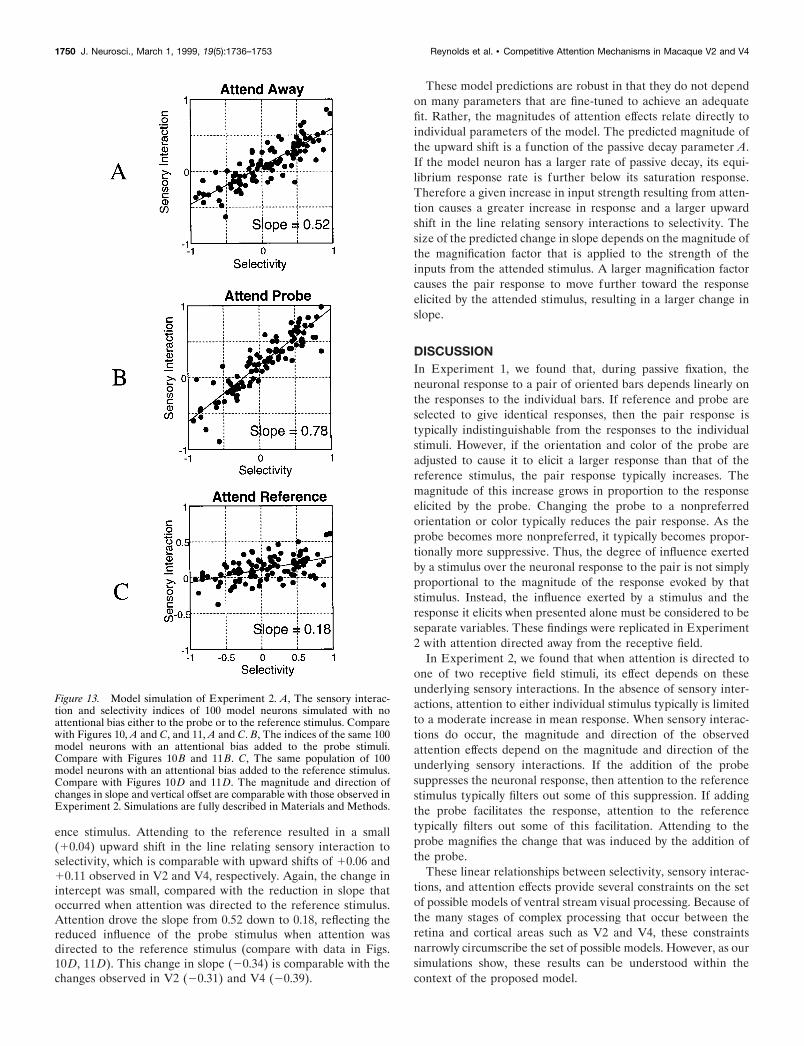
ence stimulus. Attending to the reference resulted in a small(10.04) upward shift in the line relating sensory interaction toselectivity, which is comparable with upward shifts of 10.06 and10.11 observed in V2 and V4, respectively. Again, the change inintercept was small, compared with the reduction in slope thatoccurred when attention was directed to the reference stimulus.Attention drove the slope from 0.52 down to 0.18, reflecting thereduced influence of the probe stimulus when attention wasdirected to the reference stimulus (compare with data in Figs.10D, 11D). This change in slope (20.34) is comparable with thechanges observed in V2 (20.31) and V4 (20.39).
These model predictions are robust in that they do not dependon many parameters that are fine-tuned to achieve an adequatefit. Rather, the magnitudes of attention effects relate directly toindividual parameters of the model. The predicted magnitude ofthe upward shift is a function of the passive decay parameter A.If the model neuron has a larger rate of passive decay, its equi-librium response rate is further below its saturation response.Therefore a given increase in input strength resulting from atten-tion causes a greater increase in response and a larger upwardshift in the line relating sensory interactions to selectivity. Thesize of the predicted change in slope depends on the magnitude ofthe magnification factor that is applied to the strength of theinputs from the attended stimulus. A larger magnification factorcauses the pair response to move further toward the responseelicited by the attended stimulus, resulting in a larger change inslope.
DISCUSSIONIn Experiment 1, we found that, during passive fixation, theneuronal response to a pair of oriented bars depends linearly onthe responses to the individual bars. If reference and probe areselected to give identical responses, then the pair response istypically indistinguishable from the responses to the individualstimuli. However, if the orientation and color of the probe areadjusted to cause it to elicit a larger response than that of thereference stimulus, the pair response typically increases. Themagnitude of this increase grows in proportion to the responseelicited by the probe. Changing the probe to a nonpreferredorientation or color typically reduces the pair response. As theprobe becomes more nonpreferred, it typically becomes propor-tionally more suppressive. Thus, the degree of influence exertedby a stimulus over the neuronal response to the pair is not simplyproportional to the magnitude of the response evoked by thatstimulus. Instead, the influence exerted by a stimulus and theresponse it elicits when presented alone must be considered to beseparate variables. These findings were replicated in Experiment2 with attention directed away from the receptive field.
In Experiment 2, we found that when attention is directed toone of two receptive field stimuli, its effect depends on theseunderlying sensory interactions. In the absence of sensory inter-actions, attention to either individual stimulus typically is limitedto a moderate increase in mean response. When sensory interac-tions do occur, the magnitude and direction of the observedattention effects depend on the magnitude and direction of theunderlying sensory interactions. If the addition of the probesuppresses the neuronal response, then attention to the referencestimulus typically filters out some of this suppression. If addingthe probe facilitates the response, attention to the referencetypically filters out some of this facilitation. Attending to theprobe magnifies the change that was induced by the addition ofthe probe.
These linear relationships between selectivity, sensory interac-tions, and attention effects provide several constraints on the setof possible models of ventral stream visual processing. Because ofthe many stages of complex processing that occur between theretina and cortical areas such as V2 and V4, these constraintsnarrowly circumscribe the set of possible models. However, as oursimulations show, these results can be understood within thecontext of the proposed model.
Figure 13. Model simulation of Experiment 2. A, The sensory interac-tion and selectivity indices of 100 model neurons simulated with noattentional bias either to the probe or to the reference stimulus. Comparewith Figures 10, A and C, and 11, A and C. B, The indices of the same 100model neurons with an attentional bias added to the probe stimuli.Compare with Figures 10B and 11 B. C, The same population of 100model neurons with an attentional bias added to the reference stimulus.Compare with Figures 10D and 11D. The magnitude and direction ofchanges in slope and vertical offset are comparable with those observed inExperiment 2. Simulations are fully described in Materials and Methods.
1750 J. Neurosci., March 1, 1999, 19(5):1736–1753 Reynolds et al. • Competitive Attention Mechanisms in Macaque V2 and V4
Model predictionsIn addition to providing a way to satisfy these constraints, themodel also makes predictions about neuronal responses underconditions that were not tested in the present experiments. First,it predicts the conditions under which attention to a single recep-tive field stimulus should result in an increase in neuronal re-sponse. According to the model, attention increases thebottom-up drive reaching the measured neuron, which forces theneuron’s response upward, toward its maximum firing rate forthat particular stimulus. If the bottom-up inputs driven by aparticular stimulus are strong enough that the cell’s response hassaturated, then attention is predicted to have no influence on theresponse. However, if the response is not saturated, then atten-tion is predicted to increase it. Thus, a prediction of the model isthat attention should increase neuronal responses to stimuli thatelicit responses within the dynamic range of the cell. These wouldinclude stimuli that activate populations of afferents that projectweakly to the measured cell or stimuli of low brightness or colorcontrast.
In addition, the model makes a novel prediction about howneuronal responses should depend on the relative salience of tworeceptive field stimuli, when attention is directed away from thereceptive field. Specifically, if the salience of one receptive fieldstimulus is increased relative to the salience of another receptivefield stimulus, this should cause the pair response to move towardthe response elicited by the first stimulus. For example, supposethe response to a preferred stimulus is suppressed by the additionof a less-preferred stimulus. Then, according to the model, in-creasing the luminance contrast of the less-preferred stimulusshould increase the strength of the inputs from that stimulus,resulting in greater suppression of the response to the pair. Thisis predicted to occur even when the less-preferred stimulus elicitsa significant excitatory response on its own. Finally, the modelpredicts that the increased influence of the more salient stimuluscan be offset if attention is directed to the lower salience stimulus.
Baseline shiftThe model can also account for a number of previously reportedresults, such as the observation (Luck et al., 1997) that thespontaneous firing rate of V2 and V4 neurons increases whenattention is directed to a location within the receptive field.According to the model, attention increases the efficacy of syn-apses projecting from afferent neurons whose receptive fields areat the attended location. As a result of this increase, spontaneousactivity among these afferents is predicted to be better able toactivate the measured neuron, resulting in higher spontaneousactivity in the measured neuron. If the synapses of inputs pro-jecting from the afferent neurons are weak or sparse, this shift inbaseline firing rate is predicted to be small. It is predicted to belarger for afferents with stronger projections to the measured cell.In agreement with this prediction, Luck et al. (1997) found thatthe increase in spontaneous activity is larger when attention isdirected to the center of the receptive field (stronger afferentprojections) versus a position near the edge of the receptive field(weaker afferent projections).
Attention to a single receptive field stimulusThe model is also consistent with previously reported spatialattention effects in the ventral stream using single stimuli withinthe receptive field (Haenny et al., 1988; Spitzer et al., 1988;Maunsell et al., 1991). These studies have reported no change orsmall increases in responsiveness with attention directed to the
receptive field stimulus. These findings are compatible with themodel’s prediction that increases in response will be observed fora single stimulus, provided the stimulus has not already saturatedthe neuronal response. With the same parameters used to simu-late the results of the present experiments, the model predicts amean increase of 17.5% in neuronal response to a single stimuluswith attention, which falls within the range of effects reported inthese studies.
According to the model, these increases in response shoulddepend on the magnitude of the attentional signal. Strongertop-down attentional feedback is assumed to result in largerincreases in input strength for the attended stimulus. Therefore,the magnitude of the response increase caused by attention to asingle stimulus in a difficult task is predicted to be equal to orgreater than any increase observed in an easy task, using identicalstimuli. In agreement with this, Spitzer et al. (1988) reportedmoderate (18%) increases in neuronal responsiveness in V4 whenattention was directed to a single stimulus in a difficult discrimi-nation task but not in a less-demanding task.
Three additional spatial attention studies conducted with asingle receptive field stimulus should be considered within thecontext of the present results. Motter (1993) has reported that inthe ventral stream, attention to a stimulus inside the receptivefield can cause increases or decreases in response when stimuliappear outside the receptive field. Connor et al. (1996, 1997) havereported that the response to a single receptive field stimulus canincrease or decrease, depending on which of several extrarecep-tive field stimuli is attended. One possible explanation for both ofthese findings is that attention modulated sensory interactionsresulting from the addition of the extrareceptive field stimuli.
None of these studies compared the response of the receptivefield stimulus with and without the extrareceptive field stimuli,with attention directed away from the receptive field. Therefore,it is unknown whether the extrareceptive field stimuli inducedsensory interactions. However, extrareceptive field stimuli areknown to modulate the responses of cells in the areas examinedin these studies. Cells in V4, for example, have large, stimulus-selective, silent surrounds that can be either inhibitory or excita-tory (Schein and Desimone, 1990). Because of the relationshipbetween attention effects and sensory interactions demonstratedin the present experiment, it would be useful to know whether theattention effects observed in these three studies were accompa-nied by sensory interactions resulting from the presence of theextrareceptive field stimuli.
Comparing these results with those of previousexperiments with multiple receptive field stimuliThe attention effects observed in the present experiment arecompatible with those of previous studies that have examined theeffect of attention when multiple stimuli appeared within thereceptive fields of neurons in the ventral stream (Moran andDesimone, 1985; Luck et al., 1997). These studies have foundneuronal responses to be larger when attention was directed tothe preferred stimulus relative to when the poor stimulus wasattended. Among these studies, the experiment that is moreclosely related to the present experiment is the study of Luck etal. (1997), which used the same stimuli and the same behavioraltask. Luck et al. (1997) reported that, among V4 neurons thatshowed attention effects, responses were, on average, 63% higherwhen attention was directed to the preferred stimulus than whenattention was directed to the poor stimulus. Using the sameselection criteria, we find that, on average, responses were 69%
Reynolds et al. • Competitive Attention Mechanisms in Macaque V2 and V4 J. Neurosci., March 1, 1999, 19(5):1736–1753 1751
higher. We find attention effects of comparable magnitude in areaV2, where, on average, responses to stimulus pairs were 79%higher when attention was directed to the preferred stimulusrelative to when attention was directed to the poor stimulus.
The remaining studies of attention in the ventral stream did notexplicitly manipulate spatial attention. Instead, they manipulatednonspatial variables such as whether the stimuli matched the formof a cue (Haenny et al., 1988; Chelazzi and Desimone, 1994;Ferrera et al., 1994; Motter, 1994) or whether the monkey wasengaged in a particular task (Fischer and Boch, 1985). In thesestudies, the stimulus-evoked responses and/or baseline firingrates of neurons were found to vary depending on behavioralcondition, but the relationship between such nonspatial attentioneffects and the findings of the present study is not yet clear.
The purpose and limitations of the modelThe biased-competition model provides a unified, quantitativeframework within which to place a number of observed andpredicted attention effects. However, our implementation of thismodel is not intended to be an account of the actual neuralcircuitry underlying visual attention. Many of the details of thiscircuitry are simply unknown. For instance, the source of thebiasing feedback is unknown, as are the neural elements that arethe targets of feedback in the cortex. In the absence of detailedknowledge of the circuitry underlying attention, it is not yetpossible to distinguish between a number of alternative models.These include models that implement competitive interactionsusing lateral inhibitory connections and that assume that theattentional bias is mediated either by a direct excitatory signal orby invoking synchronous discharge among cells whose receptivefields overlap with the focus of attention (for example, see Kochand Ullman, 1985; Anderson and Van Essen, 1987; Niebur et al.,1993; Olshausen et al., 1993; Ferrera and Lisberger, 1995; Gross-berg, 1995, 1999a,b; Stemmler et al., 1995; Pouget and Sejnowski,1997; Borisyuk et al., 1998). Our purpose in providing a simplebut mathematically complete implementation of the biased-competition model is to provide a demonstration proof thatbiased competition can satisfy the constraints imposed by thepresent experiments while remaining compatible with results thathave been reported using single receptive field stimuli. Because itis simple, has a closed-form solution, and depends on only threeparameters, it is possible to use the model to make quantitativepredictions that can be tested experimentally, to refute themodel, or to determine better how it is implemented in the brain.
Biased competition in the dorsal streamRecent experiments suggest that similar mechanisms may be atwork in the dorsal stream. Ferrera and Lisberger (1995) havefound that the onset time of a smooth pursuit eye movement to atarget moving in one direction can be increased by the presenceof a distractor moving in the opposite direction or reduced by thepresence of a distractor moving with the target. They have mod-eled this result using a winner-take-all competitive network thatreceives top-down feedback that biases competition between thetarget and distractor. They have also found that the responses ofsome neurons in areas MT and MST to a moving stimulus dependon whether the stimulus is a target of a smooth pursuit eyemovement (Ferrera and Lisberger, 1997) and have suggested thatthis might reflect a top-down biasing signal. In related experi-ments, Treue and Maunsell (1996) have found that attentionmodulates the responses of directionally selective neurons inareas MT and MST. They found that the response to a single
stimulus is increased in magnitude when the stimulus is attended.However, larger attention effects were observed when attentionwas directed to one of two receptive field stimuli. When attentionwas directed to a dot moving in the neuron’s preferred directionof motion, the response was greater than when attention wasdirected to a dot moving in the opposite direction. Recanzone etal. (1997) have found that neurons in areas MT and MST respondto pairs of stimuli in a manner that is highly consistent with whatwe have found in the ventral stream; namely, the response to astimulus moving in a nonpreferred direction was increased by theaddition of a second stimulus moving in the preferred direction.Likewise, the response to a stimulus moving in a non-null direc-tion for the cell was suppressed by the addition of a stimulusmoving in the null direction. Taken together, these results seemto suggest that biased competition may be a basic computationalstrategy that has been adopted throughout the visual system andpossibly in other modalities as well.
REFERENCESAnderson CH, Van Essen DC (1987) Shifter circuits: a computational
strategy for dynamic aspects of visual processing. Proc Natl Acad SciUSA 84:6297–6301.
Borisyuk RM, Borisyuk GN, Kazanovich YB (1998) The synchroniza-tion principle in modelling of binding and attention. Membr Cell Biol11:753–761.
Bushnell MC, Goldberg ME, Robinson DL (1981) Behavioral enhance-ment of visual responses in monkey cerebral cortex. I. Modulation inposterior parietal cortex related to selective visual attention. J Neuro-physiol 46:755–772.
Chelazzi L, Desimone R (1994) Responses of V4 neurons during visualsearch. Soc Neurosci Abstr 20:1054.
Connor CE, Gallant JL, Preddie DC, Van Essen DC (1996) Responsesin area V4 depend on the spatial relationship between stimulus andattention. J Neurophysiol 75:1306–1308.
Connor CE, Preddie DC, Gallant JL, Van Essen DC (1997) Spatialattention effects in macaque area V4. J Neurosci 17:3201–3214.
Desimone R, Duncan J (1995) Neural mechanisms of selective visualattention. Annu Rev Neurosci 18:193–222.
Ferrera VP, Lisberger SG (1995) Attention and target selection forsmooth pursuit eye movements. J Neurosci 15:7472–7484.
Ferrera VP, Lisberger SG (1997) Neuronal responses in visual areas MTand MST during smooth pursuit target selection. J Neurophysiol78:1433–1446.
Ferrera VP, Rudolph KK, Maunsell JHR (1994) Responses of neuronsin the parietal and temporal visual pathways during a motion task.J Neurosci 14:6171–6186.
Fischer B, Boch R (1985) Peripheral attention versus central fixation:modulation of the visual activity of prelunate cortical cells of the rhesusmonkey. Brain Res 345:111–123.
Gottlieb J, Kusunoki M, Goldberg M (1998) The representation of vi-sual salience in monkey parietal cortex. Nature 391:481–484.
Grossberg S (1973) Contour enhancement, short-term memory, and con-stancies in reverberating neural networks. Stud App Math 52:217–257.
Grossberg S (1976) Adaptive pattern classification and universal recod-ing. I. Parallel development and coding of neural feature detectors. BiolCybern 23:121–134.
Grossberg S (1980) How does a brain build a cognitive code? PsycholRev 87:1–51.
Grossberg S (1995) The attentive brain. Am Scientist 83:438–449.Grossberg S (1999a) The link between brain, learning, attention, and
consciousness. Conscious Cogn, in press.Grossberg S (1999b) How does the cerebral cortex work? Learning,
attention, and grouping by the laminar circuits of visual cortex. SpatialVision, in press.
Grossberg S, Levine DS (1975) Some developmental and attentionalbiases in the contrast enhancement and short term memory of recurrentneural networks. J Theor Biol 52:341–380.
Haenny PD, Maunsell JHR, Schiller PH (1988) State dependent activityin monkey visual cortex. II. Retinal and extraretinal factors in V4. ExpBrain Res 69:245–259.
Kapadia MK, Ito M, Gilbert CD, Westheimer G (1995) Improvement in
1752 J. Neurosci., March 1, 1999, 19(5):1736–1753 Reynolds et al. • Competitive Attention Mechanisms in Macaque V2 and V4
visual sensitivity by changes in local context: parallel studies in humanobservers and in V1 of alert monkeys. Neuron 15:843–856.
Kiper DC, Fenstemaker SB, Gegenfurtner KR (1997) Chromatic prop-erties of neurons in macaque area V2. Vis Neurosci 14:1061–1072.
Knierim JJ, Van Essen DC (1992) Neuronal responses to static texturepatterns in area V1 of the alert macaque monkey. J Neurophysiol67:961–980.
Koch C, Ullman S (1985) Shifts in selective visual attention: towards theunderlying neural circuitry. Hum Neurobiol 4:219–227.
Levitt JB, Lund JS (1997) Contrast dependence of contextual effects inprimate visual cortex. Nature 387:73–76.
Luck SJ, Chelazzi L, Hillyard S, Desimone R (1997) Neural mechanismsof spatial selective attention in areas V1, V2, and V4 of macaque visualcortex. J Neurophysiol 77:24–42.
Maunsell JHR, Sclar G, Nealey TA, DePriest D (1991) Extraretinal repre-sentations in area V4 of the macaque monkey. Vis Neurosci 7:561–573.
Miller EK, Li L, Desimone R (1993a) Activity of neurons in anteriorinferior temporal cortex during a short-term memory task. J Neurosci13:1460–1478.
Miller EK, Gochin PM, Gross CG (1993b) Suppression of visual re-sponses of neurons in inferior temporal cortex of the awake macaque byaddition of a second stimulus. Brain Res 616:25–29.
Moran J, Desimone R (1985) Selective attention gates visual processingin extrastriate cortex. Science 229:782–784.
Motter B (1993) Focal attention produces spatially selective processingin visual cortical areas V1, V2, and V4 in the presence of competingstimuli. J Neurophysiol 70:909–919.
Motter BC (1994) Neural correlates of attentive selection for color orluminance in extrastriate area V4. J Neurosci 14:2178–2189.
Mountcastle VB, Motter BC, Steinmetz MA, Sestokas AK (1987) Com-mon and differential effects of attentive fixation on the excitability of
parietal and prestriate (V4) cortical visual neurons in the macaquemonkey. J Neurosci 7:2239–2255.
Niebur E, Koch C, Rosin C (1993) An oscillation-based model for theneuronal basis of attention. Vision Res 33:2789–2802.
Olshausen BA, Anderson CH, Van Essen DC (1993) A neurobiologicalmodel of visual attention and invariant pattern recognition based ondynamic routing of information. J Neurosci 13:4700–4719.
Pouget A, Sejnowski TJ (1997) A new view of hemineglect based on theresponse properties of parietal neurones. Philos Trans R Soc Lond[Biol] 352:1449–1459.
Recanzone GH, Wurtz RH, Schwarz U (1997) Responses of MT andMST neurons to one and two moving objects in the receptive field.J Neurophysiol 78:2904–2915.
Rolls ET, Tovee MJ (1995) The responses of single neurons in thetemporal visual cortical areas of the macaque when more than onestimulus is present in the receptive field. Exp Brain Res 103:409–420.
Schein SJ, Desimone R (1990) Spectral properties of V4 neurons in themacaque. J Neurosci 10:3369–3389.
Sillito AM, Grieve KL, Jones HE, Cudeiro J, Davis J (1995) Visualcortical mechanisms detecting focal orientation discontinuities. Nature378:492–496.
Snedecor G, Cochran W (1967) Analysis of covariance. In: Statisticalmethods, Sixth Edition, pp 419–446. Ames, IA: Iowa State UP.
Spitzer H, Desimone R, Moran J (1988) Increased attention enhancesboth behavioral and neuronal performance. Science 240:338–340.
Stemmler M, Usher M, Niebur E (1995) Lateral interactions in primaryvisual cortex: a model bridging physiology and psychophysics. Science269:1877–1880.
Treue S, Maunsell S (1996) Attentional modulation of visual motionprocessing in cortical areas MT and MST. Nature 382:539–541.
Reynolds et al. • Competitive Attention Mechanisms in Macaque V2 and V4 J. Neurosci., March 1, 1999, 19(5):1736–1753 1753


![The Barbary Macaque Jake Taylor And Reggie [“steven”] Swoverland](https://img.pdfslide.us/doc/110x75/5697bfd71a28abf838cae5ce/the-barbary-macaque-jake-taylor-and-reggie-steven-swoverland.jpg)