Embed Size (px)
Citation preview

Attention and normalization circuits in macaque V1
M. Sanayei,1 J. L. Herrero,1 C. Distler2 and A. Thiele11Institute of Neuroscience, Newcastle University, Newcastle upon Tyne, NE2 4HH, UK2Allgemeine Zoologie und Neurobiologie, Ruhr-Universitaet Bochum, Bochum, Germany
Keywords: attention, normalization, orientation tuning, striate cortex, surround suppression
Abstract
Attention affects neuronal processing and improves behavioural performance. In extrastriate visual cortex these effects have beenexplained by normalization models, which assume that attention influences the circuit that mediates surround suppression. Whilenormalization models have been able to explain attentional effects, their validity has rarely been tested against alternative models.Here we investigate how attention and surround/mask stimuli affect neuronal firing rates and orientation tuning in macaque V1.Surround/mask stimuli provide an estimate to what extent V1 neurons are affected by normalization, which was compared againsteffects of spatial top down attention. For some attention/surround effect comparisons, the strength of attentional modulation wascorrelated with the strength of surround modulation, suggesting that attention and surround/mask stimulation (i.e. normalization)might use a common mechanism. To explore this in detail, we fitted multiplicative and additive models of attention to our data. Inone class of models, attention contributed to normalization mechanisms, whereas in a different class of models it did not. Modelselection based on Akaike’s and on Bayesian information criteria demonstrated that in most cells the effects of attention werebest described by models where attention did not contribute to normalization mechanisms. This demonstrates that attentionalinfluences on neuronal responses in primary visual cortex often bypass normalization mechanisms.
Introduction
Attention aids perceptual abilities. The neuronal underpinnings ofthis have been studied in detail, whereby some studies havereported that attention changes tuning curves, whereas others haveargued that it changes neuronal gain in either a multiplicative man-ner, an additive manner or that it mostly affects contrast gain (Spit-zer et al., 1988; McAdams & Maunsell, 1999; Reynolds et al.,1999, 2000; Treue & Maunsell, 1999; Martinez-Trujillo & Treue,2004; Williford & Maunsell, 2006; Roberts et al., 2007; Thieleet al., 2009). Normalization models of attention can reconcile manyof these apparently conflicting results (Ghose, 2009; Lee & Maun-sell, 2009; Reynolds & Heeger, 2009), with notable success inexplaining the interactions between attention and stimulus contrast(Reynolds & Heeger, 2009; Herrmann et al., 2010). Normalizationcan be viewed as a canonical neural computation (Carandini &Heeger, 2012), which computes the ratio between the activity of aneuron and the summed activity of a large pool of neurons. Nor-malization is thus a divisive (non-linear) operation, and it has beensuccessfully used to explain properties of neurons at differentstages of sensory processing, in different model organisms and zoo-logical phyla, as well as different cognitive operations (for a reviewsee Carandini & Heeger, 2012). It ensures that neurons retain asufficient dynamic range under varying input regimes, and therebypreserves selectivity of responses. One of the phenomena captured
by divisive normalization is centre surround suppression (Cava-naugh et al., 2002a). As pointed out above, normalization modelshave been used also to explain certain effects of attention on neu-ronal activity in cortical areas. Normalization models argue thatattention affects neuronal processing by interacting multiplicativelywith the stimulus drive and with the suppressive drive (Reynolds& Heeger, 2009). As a consequence, attention itself contributes tonormalization circuits, and response normalization is not only deter-mined by the stimulus size, but also by the strength of attentionand the size of the attentional field. Normalization should thereforeaffect different parameters of neuronal tuning functions in a mannersimilar to attention. This proposal cannot strictly be true, as nor-malization usually results in a reduction of neuronal activity(Carandini et al., 1997; Britten & Heuer, 1999; Anderson et al.,2000; Sceniak et al., 2001; Albrecht et al., 2002; Cavanaugh et al.,2002a; Carandini & Heeger, 2012), while attention most oftenresults in an increase (Moran & Desimone, 1985; Luck et al.,1997; Roelfsema et al., 1998; Ito & Gilbert, 1999; McAdams &Maunsell, 1999; Thiele et al., 1999; Treue, 2001; Ghose & Maun-sell, 2002; Martinez-Trujillo & Treue, 2002; Reynolds & Chelazzi,2004; Williford & Maunsell, 2006; Mitchell et al., 2007; Robertset al., 2007). However, across a neuronal population the effects ofstimulus-driven and attention-driven normalization could still becorrelated, even if the average sign of the effect differs betweenthe two. For example, only few neurons show increased responsesupon presentation of stimuli that strongly engage normalizationmechanisms, such as surround/mask stimuli (Walker et al., 2000).However, those that do might show reduced firing rates induced byattention. Conversely, neurons most strongly suppressed by
Correspondence: Dr A. Thiele, as above.E-mail: [email protected]
Received 20 August 2014, revised 13 January 2015, accepted 22 January 2015
© 2015 The Authors. European Journal of Neuroscience published by Federation of European Neuroscience Societies and John Wiley & Sons Ltd.This is an open access article under the terms of the Creative Commons Attribution License, which permits use, distribution and reproductionin any medium, provided the original work is properly cited.
European Journal of Neuroscience, pp. 1–16, 2015 doi:10.1111/ejn.12857

surround stimuli might show the largest activity increase whenattention is deployed to the neuron’s receptive field (RF). It sug-gests that surround/mask stimulus modulation indices would becorrelated with attention modulation indices. This has been demon-strated for tuned normalization of middle temporal area (MT) neu-rons (Ni et al., 2012), where normalization was tested when twostimuli were in the RF. Under those conditions a normalizationmodel yielded a good description of the data. A similar study per-formed in area V4, however, came to the conclusion that attentionacts most likely by altering the input gain of neurons (Ghose &Maunsell, 2008), while it acts through normalization mechanismsin < 40% of the neurons. To what extent normalization modelsalso account for attentional effects in primary visual cortex is cur-rently unknown. Moreover, it is unclear to what extent alternativemodels, not employing normalization mechanisms, yield equivalentor better fits. In area V1 the effects of attention cannot be com-pared when attention is alternately directed to one of two stimuli,both placed inside the RF, because V1 (parafoveal) RFs are toosmall for such a manipulation. We thus compared the effects ofattention (inside the RF vs. outside the RF) and of surround/maskstimuli on V1 orientation tuning functions and on V1 firing rates.We used Akaike’s and Bayesian information criteria for modelselection and found that for the majority of V1 cells attention isbest described by models where attention does not contribute tonormalization.
Methods
All procedures were carried out in accordance with the EuropeanCommunities Council Directive RL 2010/63/EC, the US NationalInstitutes of Health Guidelines for the Care and Use of Animals forExperimental Procedures, and the UK Animals Scientific ProceduresAct. The study received institutional review board committeeapproval (Animal Welfare and Ethical Review Body – AWERB,Newcastle University). In the present investigation two adult awakemale macaques (Macaca mulatta, age 7–9 years, weight 11–13 kg)were used.
Surgical preparation
The monkeys were implanted with a headpost and recording cham-bers over area V1 under sterile conditions and under general anaes-thesia. Surgery and post-operative care were identical to thatpublished in detail previously (Thiele et al., 2006).At the end of the experiments the animals were killed with an
overdose of pentobarbital and perfused through the heart. Details ofthe perfusion and histological procedures are given in Distler &Hoffmann (2001). The location of the recording sites in area V1was verified in histological sections stained for cyto- and myeloar-chitecture.
RF mapping
The location and size of RFs was measured by a reverse correlationmethod. A black square (0.1° size, 100% contrast) was presented atpseudorandom locations on a 1° by 1° sized grid, spaced into10 9 10 squares of 0.1° (five repetitions for each location, 100-msstimulus presentation, 100-ms interstimulus interval), while monkeyskept fixation on a central fixation point. Details of the RF mappingwere published previously (Gieselmann & Thiele, 2008). RF eccen-tricity in this study ranged from 2° to 5°, and RFs were located inthe lower quadrants of the visual field.
Behavioural task and stimuli
Monkeys were trained to fixate a red fixation point (FP, 0.1° diame-ter) on a grey background (38 cd/m2) presented centrally on a 20-inch analogue cathode ray tube monitor (110 Hz, 1600 9 1200 pix-els, 57 cm from the animal). Eye position was monitored with aninfrared-based system (220 Hz, Thomas Recording, Giessen, Ger-many) with a fixation window of �0.7–1.1°. Each trial was initiatedwhen the monkey held the touch bar and fixated the central point(Fig. 1). Then, 400 ms after fixation onset, a cue (blue annulus,0.24° outer diameter, 0.18° inner diameter) was presented for400 ms. The cue indicated to the monkey the location it had toattend to. The location to be attended to was spatially offset fromthe cue location. The cue appeared at one-quarter the distancebetween RF centre and fixation point, or at the equivalent locationin the opposite visual hemifield on ‘attend away’ trials. The locationthe animal had to attend to was either at the centre of the RF or atan equivalent location in the opposite visual hemifield (on attendaway trials). Following a 900-ms blank period, ensuring temporalseparation between cue offset and stimulus onset, two identical barsappeared, one in the neuron’s RF and one in the opposite hemifield.The spatial and temporal offset between cue and stimulus locationwas introduced to minimize effects of, for example, adaptation/sum-mation/facilitation at the neuron’s RF. The difference in cueing loca-tion and RF location could in principle have resulted in some spatialuncertainty about the allocation of focus of attention. However, webelieve that this will have been a small effect, as the animals would,on a daily basis, rapidly know where the stimuli would appear andthus where the focus of attention should be directed to. Moreover,any spatial uncertainty would be eliminated with the onset of thebar stimuli. Stimuli were dark bars (0.5° length and 0.1° width,12.5 cd/m2). Stimulus orientation varied pseudo-randomly from trialto trial in steps of 15°, ranging from 0 to 165° (i.e. 12 different ori-entations). After 500–800 ms (randomly assigned in steps of 1 ms)
FP
FPRF
cue
FPRF
FP
FPRF
cue
FPRF
With surround condition No surround condition
Tim
e
Fig. 1. Task and stimuli used. Animals were required to fixate a fixationpoint (FP) on the monitor. A cue indicated to the animal where to attend toon the current trial. Then, 900 ms after cue offset two stimuli appeared, onecentred on the neuron’s RF and one in the opposite hemifield equidistant tothe FP. Animals had to detect a subtle change in the middle of the centre barin the cued location, and ignore changes in the un-cued location. The lefttimeline shows the conditions when the centre stimulus was surrounded bydistractor stimuli (with surround condition). The right timeline shows thecondition when the centre bar was presented in isolation (no surround condi-tion). The exact orientation of surrounding bars used on every trial in theexperiments is shown here.
© 2015 The Authors. European Journal of Neuroscience published by Federation of European Neuroscience Societies and John Wiley & Sons Ltd.European Journal of Neuroscience, 1–16
2 M. Sanayei et al.

a brighter patch (0.1°9 0.1°, 28 cd/m2) appeared at the centre ofone of the bars. The patch had 50% probability of being at the cued(target) or un-cued (distracter) location. If the patch occurred in thecued location monkeys had to release the touch bar within 500 msto receive a juice reward. If the patch occurred in the un-cued loca-tion, the monkeys had to wait for the second patch to appear at thecued location. The bars were presented either alone or centred onthe RF of the neuron (and at an equivalent distance in the oppositehemifield), or the centre bars were surrounded by multiple orientatedbars. The surround bars were identical in size and luminance to thebar at the centre, but varied in orientation. The surround bars wereplaced equidistantly on two concentric circles (circle radius 1° and2°, eight bars on the inner circle and 12 bars on the outer circle)around the centre bar location (Fig. 1). The distribution of surroundorientations was the same for all the experiments reported here, andit was identical to the orientations shown in Fig. 1. The distancebetween individual surround bars was 0.8° for the inner circle and1° for the outer circle, respectively (centre-to-centre). To determinethe influence of the surround bars on neuronal responses in theabsence of the central bar stimulation we also presented the sur-round bars in isolation. We refer to this as the ‘surround only’ con-dition. The monkey’s task in the ‘surround only’ condition was todetect the occurrence of the patch at the cued location, but on thosetrials the patch occurred on the background, rather than on the bar.Its location in the visual field was unaffected by the presence orabsence of a central bar.The surround/mask stimuli activate normalization mechanisms
(Carandini & Heeger, 2012), and they therefore yielded for everycell an estimate of to what extent neuronal activity is affected bysurround normalization. This effect could then be compared with theeffect of attention on neuronal firing, and thereby assess whetherattention employs normalization mechanisms (see Data analysisbelow). Note that we do not make a specific distinction between sur-round and mask stimuli here, as the surround may have intruded onsome occasions into the neuron’s summation area. Based on mini-mal RF mapping the surround bars were presented outside the clas-sic RF, but some surround/mask stimuli presented on their ownnevertheless elicited a residual response in some of our neurons (fordetails see below under Surround intrusion).The order of stimulus and attend conditions was presented in
pseudorandom manner. Neither attention nor surround conditionswere blocked.
Data analysis
We analysed neuronal responses for the different stimulus conditionsin a response window from 200 to 500 ms after stimulus onset. Thisperiod captured the sustained response where attentional modulationis usually more profound (Roelfsema et al., 1998; Roberts et al.,2007), although this may depend on the task (Ghose & Maunsell,2002). Within this response period we calculated the stimulus-drivenactivity for the different centre stimulus orientations, for the condi-tions when no surround stimulus was present [referred to as R(C),whereby R indicates ‘response’ and C indicates ‘RF centre’], as wellas the conditions when a surround stimulus was present [referred toas R(C,M), whereby M represents ‘mask/surround’]. This was doneseparately for the attend RF [R(Catt) and R(Catt,M)] and for theattend away [R(C) and R(C,M)] conditions. Additionally we deter-mined the response in the ‘surround only’ condition for attend RF[R(Matt)] and for attend away trials [R(M)].To determine the orientation tuning at the population level for the
different stimulus and behavioural conditions, we normalized the
activity of each cell by dividing all stimulus-driven responses by theresponse obtained when the preferred orientation in the ‘attend RF –no surround’ [R(Catt)] condition was presented. To establish the timecourse of attentional modulation for the different stimulus conditionswe calculated the population peri-stimulus-time histogram (PSTH)for the population of cells when the preferred orientation was pres-ent. This was done based on normalized single-cell activity,whereby the maximum of the response in the attend RF – no sur-round condition [R(Catt)] was taken as the denominator in the nor-malization process.
Surround intrusion
For each cell we determined whether the ‘surround only’ stimulusaffected neuronal activity by comparing the surround-drivenresponse (if any) [R(M)] with the spontaneous activity (300 to 0 msbefore stimulus onset) and determined whether the two differed sig-nificantly (t-test). Cells where the ‘surround only’ stimulus inducedsignificant responses were labelled as such and could be excludedfrom analysis as necessary, to control for surround intrusion effects(for details see Results section and explanation therein). As an addi-tional control we subtracted the response during the ‘surround only’condition response from the responses when the surround and thecentre stimulus was present. For those controls we then also sub-tracted the spontaneous activity from the centre only responses (i.e.when no surround stimuli were presented) to control for offseteffects.
Orientation tuning
A wrapped Gaussian function was fitted to the mean response elic-ited by each centre bar orientation in the four different conditions(least square fitting):
YðhÞ ¼ Bþ AXn¼5
n¼�5
exp��ðh� Pþ 180nÞ2
2r2
�
.Here Y(h) is the predicted response for the given bar orientation (h),
B is the baseline, A is the amplitude of the tuning curve, P is the pre-ferred orientation and r is the bandwidth of the tuning curve. Weassessed the goodness of each fit by calculating the v2 error betweenthe data and the model predictions (Press et al., 2002). The fitting wasperformed such that the baseline value was within 20% of the mini-mum response obtained for the respective attention/surround condi-tion, and the sum of the baseline plus amplitude was within 20% ofthe maximum response obtained for the respective attention/surroundcondition. This was done to ensure a fit which describes all aspects ofthe data well, and does not perform too much of a trade-off between,for example, the bandwidth and the baseline vs. the amplitude parame-ter. Otherwise the fitting might result in parameter estimates where,for example, the amplitude reaches very large (or small) values, whichwould not describe the maximal measured response, while the overallfit could still be good. Based on this fitting procedure we calculatedthe percentage of variance accounted for by the model (Carandiniet al., 1997), and included cells into further analysis of tuning parame-ter changes, provided the fits for the four conditions (attend away/attend RF with and without surround) accounted for ≥50% of the vari-ance. Based on these fits we determined the orientation index, whichwas defined as OI = B/(A+B). We excluded cells where the OI was< 0.33. As an additional control we excluded cells where the maxi-mum response did not exceed the minimum response by at least5 spikes/s.
© 2015 The Authors. European Journal of Neuroscience published by Federation of European Neuroscience Societies and John Wiley & Sons Ltd.European Journal of Neuroscience, 1–16
Normalization models of attention 3

To determine the effect of surround stimuli on the above listedestimates we calculated a surround modulation index (MIsurr)according to:
MIsurr ¼ parameterno surround � parametersurroundparameterno surround þ parametersurround
where parameter was either the amplitude, baseline or tuning width(calculated as half width at half height of the tuning curve, HWHH).This yielded separate MIsurr values for the attend away conditionand for the attend RF condition. We also calculated the attentionmodulation index (MIatt) according to:
MIatt ¼parameterattendRF � parameterattend awayparameterattendRF þ parameterattend away
Again, parameter represented either the amplitude, baseline ortuning width. Thus, the parameters yielded separate MIatt values forthe no surround and the surround conditions.
Modulation indices based on firing rates
In addition to calculating MIs based on the orientation tuning curveparameters, we also calculated MIs based on raw firing rates, usingthe above formulas, but replacing ‘parameter’ with ‘firing rate’. Thiswas done for preferred orientation firing rates, and for firing ratesaveraged across all stimulus orientation conditions.
Strength of surround suppression
To determine the strength of surround suppression based on the mea-sured, not fitted data, we calculated the suppression index (SI) as
SI ¼ 1� RðhÞsurroundRðhÞno surround
where R(h)no surround was the response to the preferred orientation inthe attend away condition when no surround was present, and R(h)surround was the respective response in the condition when a sur-round was present (attend away). The preferred orientation wastaken to be the stimulus orientation that was closest to the locationof the maximum of the fitted wrapped Gaussian function.
Correlations between surround suppression strength andattentional modulation
To determine whether surround stimulus-induced changes in a tun-ing parameter (or in raw firing rates) were correlated with changesin any of the other parameters (raw firing rates), we calculatedSpearman rank correlations using the respective MIs. To furtherdetermine whether attentional MIs were correlated with surroundMIs, we calculated Spearman rank correlations using the attentionalMIs obtained with and without surround and correlated it with thesurround MI obtained from the attend away condition. We alsocalculated Spearman rank correlations between attentional MIs andsurround MIs in the attend RF conditions.
Model fitting
Normalization captures the phenomenon of surround suppressionand the phenomenon of masking. The response of a V1 neuron toan orientated bar of a given contrast is suppressed by the presenceof various orientated bars presented either at the fringe or outside
the neuron’s summation area. Within the context of this study, weemphasize the notion of ‘fringe or outside the neuron’s summationarea’, as the surround stimuli presented alone elicited a smallresponse in some of our neurons. For the purpose of this paper thedifference between pure surround suppression and some form ofmasking (i.e. non-preferred stimuli placed in the summation area) isnot very important, as the equations that describe the two forms ofnormalization are basically identical (Carandini & Heeger, 2012).Specifically, the phenomenon of surround and mask suppression canbe captured by the following formula:
RðC;MÞ ¼ w1 � c1 þ w2 � c2rþ c1 þ a � c2 ð1Þ
where R(C,M) denotes the response of the neuron to a given centreorientation when the surround/mask stimulus is simultaneously pres-ent. w1 corresponds to the drive the neuron receives given the orien-tation of the centre stimulus, c1 is the contrast of the centrestimulus, and w2 and c2 are the respective drives and contrasts forthe surround/mask stimulus. As different neurons show differentamounts of normalization, a normalization scaling term a is addedto the equation. The symbol r determines how the response satu-rates with increasing contrast, and also prevents division by zero. Inour study we did not determine the contrast response function ofneurons. We thus did not know the value r for each neuron, butrather fixed it to be 0.2. We also used different values, and weallowed it to be a free parameter in the fitting procedures (seebelow), but none of these manipulations changed the main conclu-sions, and we thus report results obtained when r = 0.2. Values ofc1 and c2 were either 0.32 or 0. We redefined them to be 1 or 0, i.e.stimulus on or stimulus off. This was done because we used theresponse measured at 32% contrast for the fitting (see below), andthis response should thus not be scaled by the contrast itself. In theabsence of attention, w1 then corresponds to the neuron’s responseto a given centre orientation, and w2 corresponds to the neuron’sresponse to the surround/mask only stimulus (i.e. when no centrestimulus was present and attention was directed to the oppositehemifield).
Multiplicative attention models
When attention is directed to the RF, the response to the centre andmask/surround stimulus R(Catt,Matt) can be predicted from the attendaway responses by altering Eq. (1) as follows:
RðCatt;MattÞ ¼ b � c1 � RðCÞ þ b � c2 � RðMÞrþ b � c1 þ b � a � c2 ð2Þ
where R(C) and R(M) were the respective responses to the centre andto the mask stimulus when presented in isolation (after subtraction ofspontaneous activity), b corresponds to the attention term and a corre-sponds to the surround/mask normalization scaling term. Equation (2)assumes a large attention field as b affects centre and surround/maskresponses. A small attention field would be captured by
RðCatt;MÞ ¼ b � c1 � RðCÞ þ c2 � RðMÞrþ b � c1 þ a � c2 ð3Þ
where b only affects centre responses.Equations (2) and (3) can also be used to predict R(Catt) from R
(C) responses, i.e. the response to an attended centre only stimulusfrom unattended centre only stimulus, by setting c2 = 0. Similarly,
© 2015 The Authors. European Journal of Neuroscience published by Federation of European Neuroscience Societies and John Wiley & Sons Ltd.European Journal of Neuroscience, 1–16
4 M. Sanayei et al.
R(C, M) (i.e. the unattended response to a centre and surround stim-ulus) can be predicted from the centre only and surround only unat-tended responses, by setting b = 1. Equally, R(Catt, Matt) responsescan be predicted from R(Catt) and R(Matt) responses, by settingb = 1.Ni et al. (2012), argued for a model where attention and mask
stimuli equally contribute to normalization, and that differences innormalization strength were sufficient to explain differences in atten-tional modulation at the firing rate level. To account for this, theyused a single fixed attentional parameter b for their data fitting. Thiswas implemented in our case by forcing b to be fixed when atten-tion was directed to the RF and b = 1 otherwise. The fixed b valuesrepresented the population mean attentional modulation (mean b)that was obtained for the multiplicative and additive model, respec-tively, when b was allowed to vary freely (multiplicative modelmean b = 1.30, additive model mean b = 7.39).To compare normalization models of attention with models where
attention does not contribute to normalization we changed Eqns (2)and (3) such that the attention term b does not appear in the denom-inator. This is shown in Eqns (4) and (5):
RðCatt;MattÞ ¼ b � c1 � RðCÞ þ b � c2 � RðMÞrþ c1 þ a � c2 ð4Þ
RðCatt;MÞ ¼ b � c1 � RðCÞ þ c2 � RðMÞrþ c1 þ a � c2 ð5Þ
These models would thus argue for simple multiplicative scalingof responses by attention.
Additive attention models
In V1 the effects of attention were sometimes best accounted for byadditive attention models (Buracas & Boynton, 2007; Thiele et al.,2009). To test the validity of these models in the context of thisstudy we altered Eqns (2)–(5) such that the attention term would beadditive, rather than multiplicative:
RðCatt;MattÞ ¼ bþ c1 � RðCÞ þ b � c2 þ c2 � RðMÞrþ bþ c1 þ b � c2 þ a � c2 ð6Þ
RðCatt;MÞ ¼ bþ c1 � RðCÞ þ c2 � RðMÞrþ bþ c1 þ a � c2 ð7Þ
For the case where attention was directed away from the RF, bwas set to 0 [we also tested models where b was set to 1 as in themultiplicative models (even if we felt it was not sensible to do so),which gave qualitatively similar results to those reported below].The single parameter additive model (as described above for themultiplicative case) was tested by setting b = 7.39 (mean populationb obtained for the additive model when b was allowed to varyfreely), for conditions when attention was directed to the RF, andb = 0 (or 1 as described above) otherwise.Finally, an additive attention model, where attention does not con-
tribute to normalization was implemented as:
RðCatt;MattÞ ¼ bþ c1 � RðCÞ þ b � c2 þ c2 � RðMÞrþ c1 þ a � c2 ð8Þ
RðCatt;MÞ ¼ bþ c1 � RðCÞ þ c2 � RðMÞrþ c1 þ a � c2 ð9Þ
Note, that in Eqns (6) and (8), b is still multiplied by c2, as itshould not affect the second half of the numerator for conditionswhen the surround stimulus had 0% contrast. The effect under thoseconditions would still be additive as the product (b * c2) is added tothe R(M) response, rather than multiplying it.We used unconstrained non-linear optimization to determine the
parameters a, and b (v2 error minimization) aiming to predict thefollowing responses:(1) Effect of normalization: R(C,M) from R(C) and R(M) responses(i.e. the surround/mask normalization in the absence of attentionfrom centre only responses and mask only responses) for each ofthe 12 different centre orientations [here b was set to 1 for the mul-tiplicative models and 0 (but see above) for additive models].(2) Effect of normalization: R(Catt,Matt) from R(Catt) and R(Matt)responses, i.e. another determination of normalization effects foreach of the 12 different centre orientations [b was set to 1 for themultiplicative models and 0 (but see above) for additive models forthis condition again].(3) Effect of attention: R(Catt) from R(C) responses (i.e. the effectof attention on centre only responses from centre only responses(attend away condition) for each of the 12 different centre orienta-tions.(4) Effect of attention: R(Catt,Matt) from R(C) and R(M) responses(effects of attention on centre and surround/mask responses pre-dicted from attend away – no surround and from attend away sur-round only responses) for each of the 12 different centreorientations.(5) Effect of attention: R(Catt,Matt) from R(Caway,Maway) responses(effects of attention on centre and surround/mask responses pre-dicted from attend away centre/surround responses) for each of the12 different centre orientations.
We performed v2 error minimization for the 60 differentresponses (five predictions as outlined above for 12 different centrestimulus orientations each). The models were able to accommodatethe hypothesis that the focus of attention was narrow for all stimu-lus conditions (i.e. affecting only the drive centre stimuli yield), orthat the focus of attention was wide for all stimulus conditions (i.e.affecting the drive that centre stimuli yield and the drive that sur-round stimuli yield). However, it might be assumed that the ani-mals would alter their focus of attention depending on the stimuluscondition, whereby they use a wide focus of attention when centreonly stimuli were presented, while they use a narrow focus ofattention when centre and surround stimuli were present. Thishypothesis was also accommodated by one set of models, wherebyit required us to alter the value for c2, when no surround stimuluswas present as the narrow focus of attention and the variable focusof attention models would otherwise be identical. To test for thevalidity of the variable attention focus model it was set to 0.01when no surround was present. Overall, this approach yielded 18different models [three different multiplicative models, three differ-ent additive models, for three conditions each (wide, narrow andvariable attention field)].To determine which model best explained our data we calculated
Akaike’s information criterion (AIC). Under the assumption of inde-pendent normally distributed errors, AIC corresponds to (Burnham& Anderson, 2004):
© 2015 The Authors. European Journal of Neuroscience published by Federation of European Neuroscience Societies and John Wiley & Sons Ltd.European Journal of Neuroscience, 1–16
Normalization models of attention 5
AIC ¼ v2 þ 2k ð10Þ
where v2 is the summed squared error across the fitted data for eachneuron and model, and k corresponds to the number of free parame-ters in the model, i.e. 1 and 2, respectively. This yielded AIC1 toAIC18 for the 18 models. Final model comparison was based onAkaike weights (wi):
wi ¼eð� di
2ÞP18n¼1 eð� dn
2 Þð11Þ
Here, di corresponded to AICi – AICmin, where AICmin was thesmallest AIC obtained for the 18 model fits. The larger the wi, themore evidence existed in favour of model i.The Bayesian information criterion (BIC) is often used instead of
AIC. BIC applies a larger penalty on free parameters in the modeland is calculated according to
BIC ¼ v2 þ k � lnðnÞ ð12Þwhere v2 is the summed squared error across the fitted data for eachneuron and model, k corresponds to the number of free parametersin the model, i.e. 1 and 2, respectively, and n corresponds to thenumber of data points (i.e. 60, as we aimed to predict five differentconditions with 12 different responses each). The BIC weights arecalculated as in Eqn (11). The larger the BIC weight, the more evi-dence existed in favour of a given model.
Eye position analysis/control
We calculated the mean x and y eye position for each stimulus (cen-tre only, centre surround, surround only) and attention condition[attend away/attend RF for the period of interest (100–500 ms afterstimulus onset; we started at 100 ms, to ensure that differential eyemovements shortly before analysis start did not affect our data)].For each neuron recorded (i.e. for each recording session) we calcu-lated a grand mean x-position and a grand mean y-position (acrossall stimulus conditions; correct trials only) and subtracted thesegrand mean values from the mean single trial x- and y-position. This
procedure eliminates potential differences in eye-position calibrationbetween recording sessions, and thus allows comparison across ses-sions. We performed separate two-factor ANOVAs on the x- andy-position eye-movement data to determine whether mean eye-posi-tion in x or in y differed between the attention and stimulus condi-tion. We found no significant difference in mean x-position betweendifferent attention conditions (effect of attention: P = 0.623; effectof surround: P = 0.974; interaction: P = 0.893). Similar results wereobtained for the y-position eye data (effect of attention: P = 0.348;effect of surround: P = 0.865; interaction: P = 0.993). This suggeststhat differences in mean eye position did not contaminate our analy-sis.
Results
We recorded 105 neurons in two monkeys (62 in monkey HU, 43in monkey HO). Post-mortem histological analysis confirmed thatrecordings from intended V1 craniotomies were indeed in V1 inboth animals.Neuronal tuning width, tuning amplitude and tuning baseline were
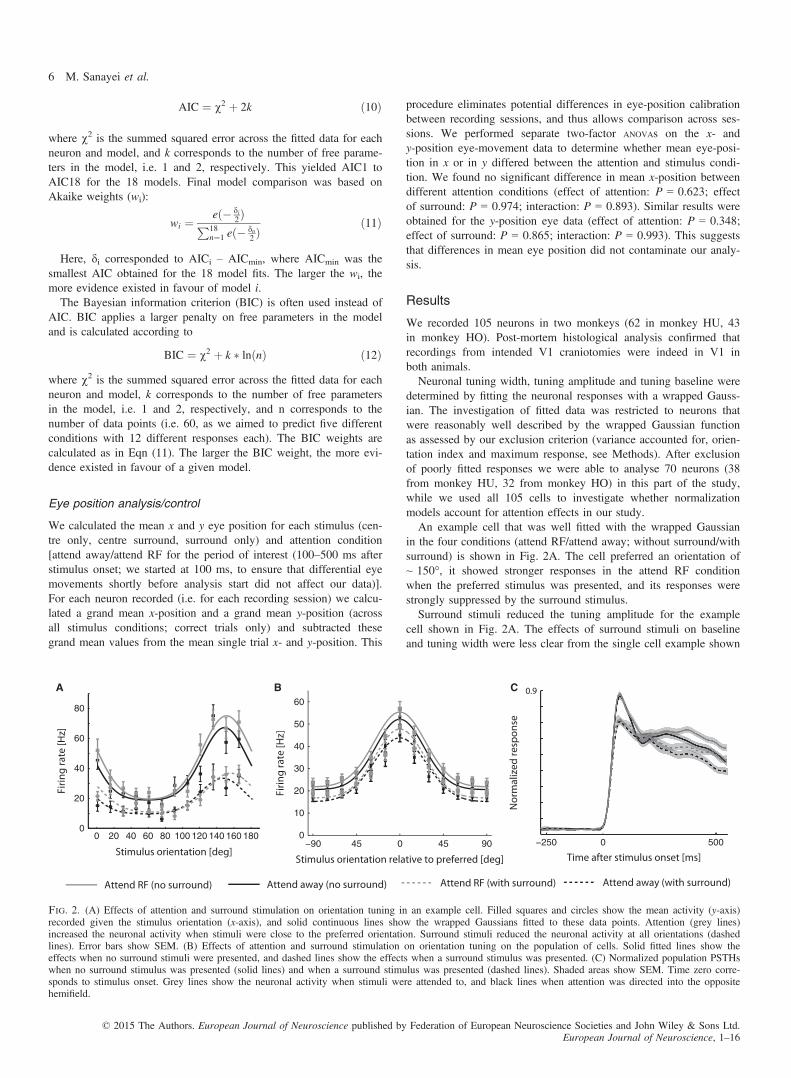
determined by fitting the neuronal responses with a wrapped Gauss-ian. The investigation of fitted data was restricted to neurons thatwere reasonably well described by the wrapped Gaussian functionas assessed by our exclusion criterion (variance accounted for, orien-tation index and maximum response, see Methods). After exclusionof poorly fitted responses we were able to analyse 70 neurons (38from monkey HU, 32 from monkey HO) in this part of the study,while we used all 105 cells to investigate whether normalizationmodels account for attention effects in our study.An example cell that was well fitted with the wrapped Gaussian
in the four conditions (attend RF/attend away; without surround/withsurround) is shown in Fig. 2A. The cell preferred an orientation of~ 150°, it showed stronger responses in the attend RF conditionwhen the preferred stimulus was presented, and its responses werestrongly suppressed by the surround stimulus.Surround stimuli reduced the tuning amplitude for the example
cell shown in Fig. 2A. The effects of surround stimuli on baselineand tuning width were less clear from the single cell example shown
0 20 40 60 80 100 120 140 160 1800
20
40
60
80
Stimulus orientation [deg]
Firin
g ra
te [H
z]
−250 0 500
0.9
Nor
mal
ized
resp
onse
−90 45 0 45 900
10
20
30
40
50
60
Time after stimulus onset [ms]
Firin
g ra
te [H
z]
Stimulus orientation relative to preferred [deg]
Attend RF (no surround) Attend away (no surround) Attend RF (with surround) Attend away (with surround)
A B C
Fig. 2. (A) Effects of attention and surround stimulation on orientation tuning in an example cell. Filled squares and circles show the mean activity (y-axis)recorded given the stimulus orientation (x-axis), and solid continuous lines show the wrapped Gaussians fitted to these data points. Attention (grey lines)increased the neuronal activity when stimuli were close to the preferred orientation. Surround stimuli reduced the neuronal activity at all orientations (dashedlines). Error bars show SEM. (B) Effects of attention and surround stimulation on orientation tuning on the population of cells. Solid fitted lines show theeffects when no surround stimuli were presented, and dashed lines show the effects when a surround stimulus was presented. (C) Normalized population PSTHswhen no surround stimulus was presented (solid lines) and when a surround stimulus was presented (dashed lines). Shaded areas show SEM. Time zero corre-sponds to stimulus onset. Grey lines show the neuronal activity when stimuli were attended to, and black lines when attention was directed into the oppositehemifield.
© 2015 The Authors. European Journal of Neuroscience published by Federation of European Neuroscience Societies and John Wiley & Sons Ltd.European Journal of Neuroscience, 1–16
6 M. Sanayei et al.

in Fig. 2A. To establish the effects of surround stimuli at the popu-lation level, we fitted each cell’s response as shown in Fig. 2A,whereby the preferred orientation in the attend away – no surroundcondition was set to be at 0°, and arranged all other orientationrelated responses accordingly. The population-averaged responsesare shown in Fig. 2B. To provide an impression of the effects ofsurround stimulus presentation and attention as a function of timeafter response onset we show the normalized PSTH for preferredorientation responses in Fig. 2C. Figure 2B and C show that sur-round stimuli reduced the overall activity. Attention, conversely,increased the activity. From Fig. 2C it is apparent that attentioneffects are more prominent during the later response period, whilesurround effects are prominent during early and late response peri-ods. Given our interest in the interaction between attention and sur-round effects, we focus on the late response period for theremainder of the paper.The surround stimulus used was identical for all cells. The spe-
cific distribution of orientations present in the surround might there-fore yield different effects on neurons, depending on their preferredorientation. This argument is based on the established differentialeffects of iso- and cross-orientation inhibition (Sengpiel et al., 1998;Jones et al., 2001, 2002; Freeman et al., 2002). Therefore we calcu-lated the suppression index (SI) for each neuron and plotted thisagainst the neuron’s preferred orientation (Fig. 3A). Neurons withstronger SI (larger than the median of the population) showed no
obvious clustering around specific orientations, and there was alsono obvious relationship between strength of SI, preferred orientationof a neuron and clustering of surround orientations (Fig. 3B).The relationship between the features of the distracter and the
neuronal tuning for the attended stimulus (feature-based attention)influences the effects of attention/normalization for area MT neurons(Khayat et al., 2010). While Fig. 3A addresses the question ofwhether there was a relationship between the tuning of the neurons,the stimuli in the surround and the strength of normalization in ourstudy, it does not address whether there is a relationship with thestrength of attentional modulation. This is addressed in Fig. 3C,where attentional modulation indices are plotted in relation to thepreferred orientation of neurons, along with the distribution of sur-round orientations (shown above in Fig. 3B). Neurons with strongerattentional modulation showed no obvious clustering around specificorientations, and there was also no obvious relationship betweenstrength of MI, preferred orientation of a neuron and clustering ofsurround orientations. This is not really surprising, as our task was aspatial attention one, not a feature-based attention task, and only thelatter shows systematic influences of different stimulus features onattentional modulation (Treue & Trujillo, 1999; McAdams & Maun-sell, 2000).To determine whether any of the surround- and attention-induced
changes seen in Fig. 2 were significant we used the three differentparameter estimates from the wrapped Gaussian fitting for each cell
–0.4
–0.2
0
0.2
0.4
0.6
0.8
1
–0.2
0
0.2
0.4
0.6
Surround bar orientation [deg]
Preferred orientation without surround, attend away [deg]
0 20 40 60 80 100 120 140 160 180
0 20 40 60 80 100 120 140 160 180
0 20 40 60 80 100 120 140 160 180
Preferred orientation without surround, attend away [deg]
No surroundWith surround
Sup
pres
sion
inde
xA
ttent
ion
mod
ulat
ion
inde
x
A
B
C
Median SI
Fig. 3. (A) Suppression index (SI) plotted against the preferred orientation of a given cell. Preferred orientations in the cell sample were relatively uniformlydistributed (spread of points along the x-axis in the upper graph). SIs were mostly positive, i.e. in most cells surround stimuli reduced the neuronal activity. (B)Orientation of the bars in the surround. Grey tick marks show the orientation of bars on the inner ring, and black tick marks show the orientation of bars on theouter ring of the surround stimulus. (C) Attentional modulation indices plotted against the preferred orientation of a given cell. Attentional modulation indiceswere mostly positive, i.e. in most cells attention increased neuronal activity. Neither suppression nor attentional modulation indices showed an obvious relation-ship to preferred orientation of the neurons, or to the distribution of orientations in the surround stimulus.
© 2015 The Authors. European Journal of Neuroscience published by Federation of European Neuroscience Societies and John Wiley & Sons Ltd.European Journal of Neuroscience, 1–16
Normalization models of attention 7

under the four different conditions (attend away – attend RF; no sur-round – with surround) and subjected them to a two-factor repeated-measure ANOVA with attention and surround as the two factors. Theresults are given in Table 1. In short, neither the surround nor atten-tion had a significant effect on the tuning widths, attention signifi-cantly increased the tuning amplitude and baseline (P < 0.05,Table 1), while the surround significantly reduced the tuning base-line (P < 0.05, Table 1). The effects, as described above, were sig-nificant when assessed for each of the two monkeys individually(P < 0.05, two-factor repeated-measure ANOVA).It could be argued that the effects described above were a conse-
quence of ‘direct’ surround intrusion, whereby the RFs of the cellsextended into the area that was covered by the surround stimulus.To account for that possibility we restricted our analysis to cells thatwere not directly affected by the ‘surround only’ stimulus condition.We also performed the surround control measures as described inthe Methods (i.e. surround only activity subtracted). This controlreduced our cell sample to 36 cells, but it did not change the basicresults. For this reduced sample size, the surround stimulus reducedthe tuning baseline (P < 0.001), and there was a trend towards areduction of the tuning amplitude (P = 0.083). Attention signifi-cantly increased the tuning amplitude (P < 0.05), and it showed atrend towards increasing the tuning baseline (P = 0.095). Thechanges in significance are probably accounted for by the reducedsample size. Thus, the effects described are not a consequence ofdirect surround intrusion.The above analysis directly used the values of the fitted wrapped
Gaussian parameters as input variables. A corresponding pictureemerges when analysing modulation indices (MIs of fitted parame-ters) instead. The MI distributions are plotted in Fig. 4. Surroundstimuli had a limited effect on tuning amplitude (Fig. 4A, top histo-gram). The distributions for the attend RF conditions were not dif-ferent from zero (P > 0.05, Wilcoxon sign rank test), but the MIdistribution for the attend away condition was significantly largerthan zero. Surround stimuli significantly reduced tuning baseline forboth attention conditions (Fig. 4A, rotated histograms, distributionswere significantly larger than zero, P < 0.05, Wilcoxon sign ranktest). Surround stimuli did not have systematic effects on the tuningwidth (Fig. 4B, rotated histograms), i.e. the median tuning width MIwas close to zero and the distributions were not significantlydifferent from zero (P > 0.05, Wilcoxon sign rank test). The effectsdescribed were also found when the ‘surround only’ stimulus-induced activity was subtracted from the surround plus centre stimu-lus conditions, and when neurons that exhibited significant activitychanges upon ‘surround only’ stimulus presentation were excluded
from the sample (see Methods). Thus, the main effect of surroundstimulus presentation was an overall reduction in stimulus-drivenactivity, irrespective of the stimulus orientation, i.e. an offset effect,which was reflected in the overall reduced tuning baseline.Previous studies have reported that surround-dependent suppres-
sion of tuning amplitude was positively correlated with surroundeffects on tuning bandwidth (Chen et al., 2005; Okamoto et al.,2009). In those studies surround stimuli sharpened tuning curvesand cells that were most strongly suppressed by surround stimulishowed the most profound sharpening. To determine whether such arelationship could also be found in V1 of the awake macaque (and/or whether other correlations existed), we calculated the correlation(Methods) between surround-dependent amplitude MI and the sur-round-dependent tuning width MI (Fig. 4B), between surround-dependent amplitude and surround-dependent baseline MI (Fig. 4A),and between surround-dependent baseline MI and tuning width MI(Fig. 4C). The surround-dependent amplitude MI was not correlatedwith the baseline MI, but the amplitude and tuning width were nega-tively correlated in the attend away and the attend RF condition(P < 0.05, Spearman correlation). Baseline MI and tuning width MIwere also significantly negatively correlated (P < 0.05, Spearmancorrelation). The negative correlations were present in each monkeyindividually (P < 0.05, Spearman partial correlation). The abovedescribed significant negative correlations were equally found whenthe ‘surround only’ stimulus-induced activity was subtracted fromthe surround plus centre stimulus conditions and neurons with sig-nificant activity changes upon ‘surround only’ stimulus presentationwere excluded from the sample. Thus, if surround stimuli induced areduction in tuning amplitude (or baseline) then they usually alsocaused a widening of the tuning curve. Conversely, if surround stim-uli induced an increase in tuning amplitude (or baseline), then theyusually also caused a sharpening of the tuning curve. Note that anincrease in tuning amplitude does not necessarily imply an increasein neuronal activity with surround presentation, as the tuning ampli-tude can increase if the presence of a surround reduces the tuningbaseline more profoundly than it reduces the tuning amplitude.So far we have investigated how the different tuning parameters
are affected by surround stimulation and attention, and whetherchanges in a given parameter were correlated with changes in a dif-ferent parameter. We now turn to the question of whether the effectsof attention and of surround stimulation on the neuronal activitywere correlated. This might suggest that attention and surround sup-pression use a similar mechanism, as proposed by normalizationmodels of attention. A recent study reported that strength of normal-ization was correlated with the strength of attentional modulation,
Table 1. Effects of surround stimuli and of attention on amplitude, baseline and half width-half heights (HWHH) of the tuning functions n = 70
Attend away (median [25% 75%]) Attend RF (median [25% 75%]) P(surr.) P(att.) P(surr*att.)
HWHHNo surround 24.21 [15.79 34.80] 23.98 [18.02 35.85] 0.880 0.732 0.404Surround 23.58 [16.16 37.85] 24.11 [15.52 32.89]
AmplitudeNo surround 21.27 [13.32 39.69] 26.70 [12.32 41.18] 0.631 0.018 0.654Surround 22.26 [11.70 33.53] 23.00 [15.33 37.90]
BaselineNo surround 17.90 [11.62 29.54] 19.22 [11.32 31.29] < 0.001 0.002 0.772Surround 12.27 [7.80 22.18] 14.24 [8.16 26.26]
The values in the left two columns show the median [25/75 percentiles] of the respective value distributions. The three columns to the right show P-values (two-fac-tor repeated-measures ANOVA) relating to the effects of surround stimuli (surr.), of attention (att.) and the possible interaction between the two factors (surr*att.).
© 2015 The Authors. European Journal of Neuroscience published by Federation of European Neuroscience Societies and John Wiley & Sons Ltd.European Journal of Neuroscience, 1–16
8 M. Sanayei et al.

when attention was shifted between preferred and anti-preferredstimuli that were placed within the RF of MT neurons (Ni et al.,2012), in fact a condition more similar to masking than surroundsuppression. Here we explore whether similar correlations can befound for V1 neurons. RFs in area V1 are usually too small to allowfor placement of separate stimuli inside the RF and for differentialallocation of attention to these two stimuli. For this reason, ourattentional modulation index is based upon attention away from theRF and attention inside the RF conditions and the normalizationindex is based on data acquired when the RF centre was stimulatedand when the RF centre and the RF surround were both stimulated.For this analysis we used the entire neuronal sample (n = 105). Weused two approaches to calculate the MIs. For the first approach weonly used the preferred orientation responses, while for the secondwe used the average response to all 12 orientations. From theseresponses attention MIs and normalization MIs were obtained. Wefound that the correlation for one of our comparisons depended onthe approach taken to calculate MIs. Using MIs calculated from pre-ferred orientation responses only, we found a trend for a negativecorrelation between attention MI – no surround and surround –attend away MIs (Fig. 5A, P = 0.082 r = �0.171). This is contraryto predictions from attentional normalization models. However,using the same MI types calculated from responses to all bar orien-tation yielded a trend for a positive correlation between the surroundMI – attend away condition and the attention MI – no surround(r = 0.179, P = 0.068, Spearman rank correlation, data not shown),results somewhat reminiscent of those described previously forMT neurons (Ni et al., 2012), even though the effect in these datawas much smaller (and only approaching significance). Other
Amplitude MI
−1 0 1−1
−0.5
0
0.5
1 r:−0.011 p:0.924r:0.029 p:0.799
Amplitude MI
−1 0 1
m: 0.036 p:0.022m: 0.023 p:0.070
m: 0.147 p:0.000m: 0.139 p:0.000
−1 0 1−1
−0.5
0
0.5
1r:−0.433 p:0.000r:−0.239 p:0.030
Amplitude MI
m: −0.000 p:0.747m: 0.005 p:0.874
−1 0 1−1
−0.5
0
0.5
1r:−0.284 p:0.010r:−0.279 p:0.011
Baseline MI
−1 0 1
m: 0.147 p:0.000m: 0.139 p:0.000
m: −0.000 p:0.747m: 0.005 p:0.874
Bas
elin
e M
IH
WH
H M
IH
WH
H M
I
020
020
020
0
20
0
20
Attend RFAttend away
A
B
C
Fig. 4. Effects of surround stimuli on tuning amplitude, baseline and band-width of the wrapped Gaussian fitted to the responses of each cell. Effectsare shown separately for the attend away (black) and the attend RF (grey)condition. Centre plots (and associated text: r = correlation coefficient,P = significance of correlation) show whether modulation indices (MIs) werecorrelated between amplitude, baseline and tuning width. Histograms aboveand to the side of centre plots show distributions of MIs. Associated textindicates the median of these distributions and whether these were signifi-cantly different from 0 (associated P-value).
Attend MI, no surround
Sur
roun
d M
I, at
tend
aw
ay
Attend MI, no surround
Sur
roun
d M
I, at
tend
aw
ay
A
B
C
D
Attend MI, surroundAttend MI, surround
Sur
roun
d M
I, at
tend
RF
Sur
roun
d M
I, at
tend
RF
–0.2 0 0.5
–0.2
0
0.5P = 0.082 r = –0.171
–0.2 0 0.5
–0.2
0
0.5P = 0.002 r = 0.305
–0.2 0 0.5
–0.2
0
0.5P < 0.001 r = 0.429
–0.2 0 0.5
–0.2
0
0.5P = 0.991 r = –0.001
Fig. 5. Correlation of attentional and surround modulation index (based onraw firing rates averaged for the preferred stimulus orientation). Four differ-ent comparisons were possible which are shown in A–D, respectively. Spe-cifically, we obtained an attentional MI when no surround stimulus waspresent and when a surround stimulus was present. Moreover we obtained asurround MI when attention was directed away from the RF and one when itwas directed towards the RF. Text insets report the correlation coefficient (r)and the significance of the correlation (P).
© 2015 The Authors. European Journal of Neuroscience published by Federation of European Neuroscience Societies and John Wiley & Sons Ltd.European Journal of Neuroscience, 1–16
Normalization models of attention 9
comparisons were more consistent across responses used to calculateMIs. We found a significant positive correlation between the sur-round MI in the attend away condition and the attention MI when asurround was present (P < 0.001, r = 0.429, Spearman rank correla-tion, Fig. 5B preferred orientation responses; P < 0.001, r = 0.309,responses to all bar orientations, data not shown). Moreover, sur-round MIs (measured when attention was directed to the RF) werepositively correlated with attention MIs measured in the absence ofsurround stimuli (P = 0.002, r = 0.305, Spearman rank correlation,Fig. 5C preferred orientation responses; r = 0.334, P < 0.001,responses to all bar orientations, data not shown). No correlationbetween surround MIs measured in the attend RF condition andattention MIs measured when surround stimuli were present wasfound (P = 0.991, r = �0.001, preferred orientation response MIs,Fig. 5D; P = 0.819, r = �0.023, MIs from responses to all bar ori-entations, data not shown, Spearman rank correlation). To summa-rize, correlations between surround suppression indices andattentional modulation are at best weak to moderate. Some of ourdata support a normalization model of attention, but the latter wouldhave predicted positive correlations between attentional MIs and sur-round MIs for all comparisons, which we did not find, and notablynot for a critical comparison as shown in Fig. 5A.To further explore the relationship of our data to normalization
models of attention further, we fitted our data to attention–surroundmodels that were based on current discussions about the effects ofattention on neuronal activity (but note that these models are byno means exhaustive). We decided to use two main types of mod-els (additive vs. multiplicative) based on previous reports about theeffects of attention on neuronal activity for single stimuli insidethe RF in striate and extrastriate cortex (McAdams & Maunsell,1999; Thiele et al., 2009). Given the results shown in Fig. 5, weadopted each of the models to either allow or not allow attentionto contribute to normalization. The model that assumes attention tocontribute to normalization was further subdivided into two modelsbased on the results reported by Ni et al. (2012), whereby attentionand surround stimulation either used exactly the same mechanisms(single parameter model) or they were allowed to use separatedmechanisms (two-parameter models). This resulted in six modelswhich were based on current discussions about the effects of atten-tion on neuronal activity, without intending to imply that there areno other models that are used to explain attentional effects. Eachof these six models could then either assume that the attentionalfocus was narrow for all stimulus conditions (whereby the atten-tional scaling term b would only affect centre stimulus responses),
or that the attentional focus was wide for all stimulus conditions(whereby the attentional scaling term b would also affect surround/mask responses), or finally that the attentional focus was widewhen centre only stimuli were presented, while it was narrowwhen surround stimuli were also presented. This resulted in a totalof 18 models that were initially fitted to our data. For this analysiswe included all 105 cells, as these models do not make assump-tions about the responses of the cells to different stimulus orienta-tions, and thus responses did not need to be accounted for bywrapped Gaussians. We also did not exclude neurons based onanalysis of surround intrusion, as previous studies intentionallyplaced the second stimulus inside the RF, which would be com-plete surround intrusion.The models assuming narrow fields of attention consistently
resulted in better fits [and thus larger Akaike (or BIC) weights] thanmodels assuming either variable or wide fields of attention. Specifi-cally, 60/105 neurons were best fit with a narrow focus of attentionmodel, 32/105 were best fit with a variable focus of attention modeland 13/105 neurons were best fit with a wide focus of attentionmodel. Using models for all three focal attention sizes, we foundthat the majority of cells were best described by an additive modelwhich assumes that attention does not contribute to normalization(59/105), with a further ten cells which were best described by amultiplicative model which assumes that attention does not contrib-ute to normalization mechanisms, Thus, 69/105 cells were bestdescribed by models where attention does not contribute to normali-zation. While it is possible that monkeys used different attentionalstrategies in different sessions (and thus different neurons wouldneed to be fit with different basic models), we assume it is moreparsimonious that monkeys used the same approach throughout, andtherefore applied a single fitting approach (narrow focus of attentionwhich yielded the best fit for the majority of cells) for model com-parison. We thus excluded wide and variable attentional focus mod-els from further analysis (i.e. we re-ran our analysis based onnarrow attention field assumptions only). Importantly, this reductionin model numbers has no effect on our main conclusions that wedraw from the data in the next few sections (compare, for example,the number of cell best fitted with models where attention does notcontribute to normalization with those presented in Table 2). Usingthe narrow field attentional focus model exclusively meant that theattentional scaling term b only affected centre stimulus responses(i.e. the definition of narrow attentional focus). Table 2 gives anoverview of the different narrow field models and the assumptionsthey make regarding the size of the attentional field.
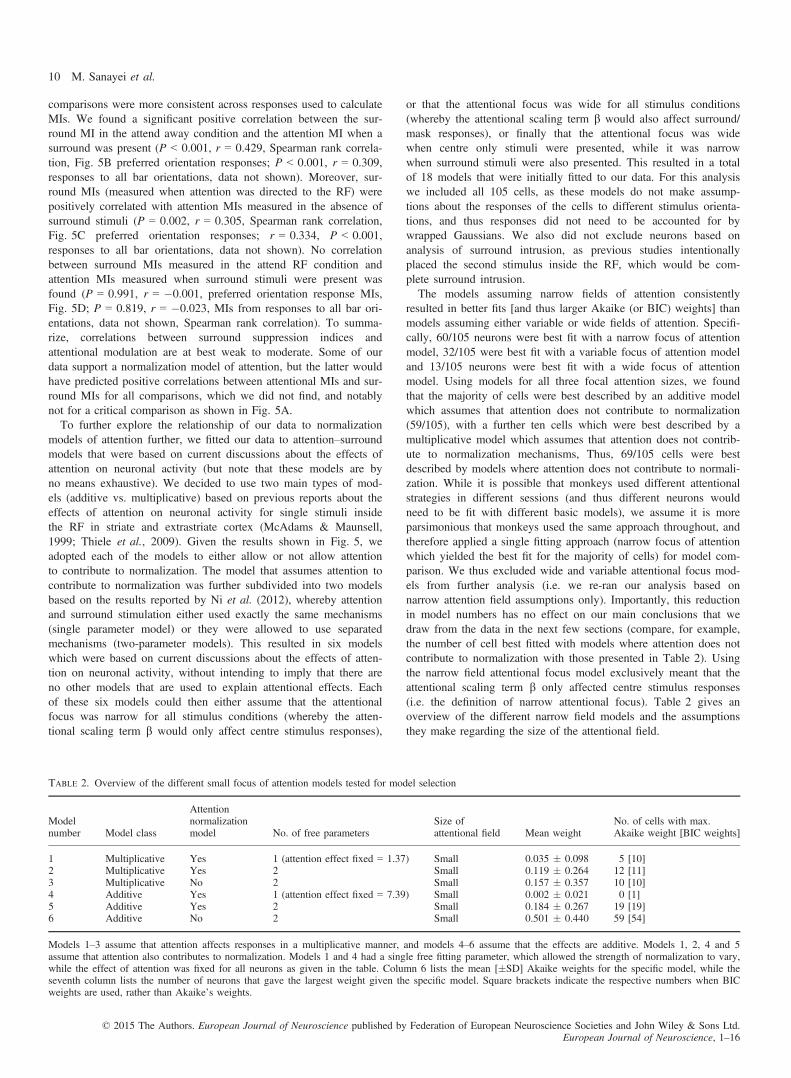
Table 2. Overview of the different small focus of attention models tested for model selection
Modelnumber Model class
Attentionnormalizationmodel No. of free parameters
Size ofattentional field Mean weight
No. of cells with max.Akaike weight [BIC weights]
1 Multiplicative Yes 1 (attention effect fixed = 1.37) Small 0.035 � 0.098 5 [10]2 Multiplicative Yes 2 Small 0.119 � 0.264 12 [11]3 Multiplicative No 2 Small 0.157 � 0.357 10 [10]4 Additive Yes 1 (attention effect fixed = 7.39) Small 0.002 � 0.021 0 [1]5 Additive Yes 2 Small 0.184 � 0.267 19 [19]6 Additive No 2 Small 0.501 � 0.440 59 [54]
Models 1–3 assume that attention affects responses in a multiplicative manner, and models 4–6 assume that the effects are additive. Models 1, 2, 4 and 5assume that attention also contributes to normalization. Models 1 and 4 had a single free fitting parameter, which allowed the strength of normalization to vary,while the effect of attention was fixed for all neurons as given in the table. Column 6 lists the mean [�SD] Akaike weights for the specific model, while theseventh column lists the number of neurons that gave the largest weight given the specific model. Square brackets indicate the respective numbers when BICweights are used, rather than Akaike’s weights.
© 2015 The Authors. European Journal of Neuroscience published by Federation of European Neuroscience Societies and John Wiley & Sons Ltd.European Journal of Neuroscience, 1–16
10 M. Sanayei et al.

To decide which model best captured our data, we re-determinedAkaike (and Bayesian) weights based on these six models only (seeMethods). We counted how often a given model had the largest evi-dence (when compared with the other models). The number of cellsbest described by a particular model (using AIC and BIC weights)is listed in Table 2. Given that AIC and BIC yielded almost identi-cal results we will focus on AIC results. Most neurons were bestdescribed by a model where attention acted in an additive and non-normalizing manner, followed by an additive model where attentiondoes contribute to normalization. The pairwise distribution ofweights comparing the two best models (additive non-normalizingvs. additive normalizing) is shown in Fig. 6A, and the pairwise dis-tribution of weights comparing the best and the third best model(additive non-normalizing vs. multiplicative normalizing) is shownin Fig. 6B. Even the best model yields Akaike weights that areclose to zero for a fairly large number of cells (see frequency histo-grams along the x-axes in Fig. 6). However, this does not necessar-ily mean that the model poorly fitted the data, but simply thatanother model yielded a substantially better fit. In summary, mostcells were better described by additive models (74.3%), when com-pared with multiplicative models. Moreover, 65.7% of cells werebest described by models where attention does not contribute to nor-malization mechanisms.To test whether the above reported data would also hold for con-
ditions where fitting was entirely based on attend RF vs. attendaway conditions (i.e. ignoring the fits where the effects of surround/mask stimuli were estimated under constant attention conditions),we refitted our data for just three conditions, namely attend RF ratespredicted from attend away – no surround conditions, and attend RFrates predicted from attend away – with surround/mask conditions(two versions as outlined in Methods). These fits yielded similarresults with respect to the effect of attention on normalization,Under these more constrained fitting conditions, 60/105 cells werebest supported by the two-parameter attention additive non-normali-zation model, while 23/105 were best described by a multiplicativenon-normalization model (i.e. 79.5% of cells were best described bya model where attention does not contribute to normalization). Fif-teen cells were best described by a two-parameter additive normali-zation model (i.e. 71.4% of cells were best described by an additivemodel under conditions when the effect of surround stimulations is
not part of the fitting routine). Finally, we restricted our fitting tothe conditions where we predict attend RF – no surround responsesfrom attend away – no surround responses (i.e. excluding any sur-round modulation). Under these conditions, 60/105 cells were bestsupported by a two-parameter attention additive non-normalizationmodel, 19/105 cells were best supported by the two-parameter multi-plicative non-normalization model and 17/105 cells were bestdescribed by a two-parameter additive normalization model (i.e.75.2% of cells were best described by a model where attention doesnot contribute to normalization). These controls demonstrate that theresults do not simply arise from specific fitting selections.While the above data show the relative quality of fits when com-
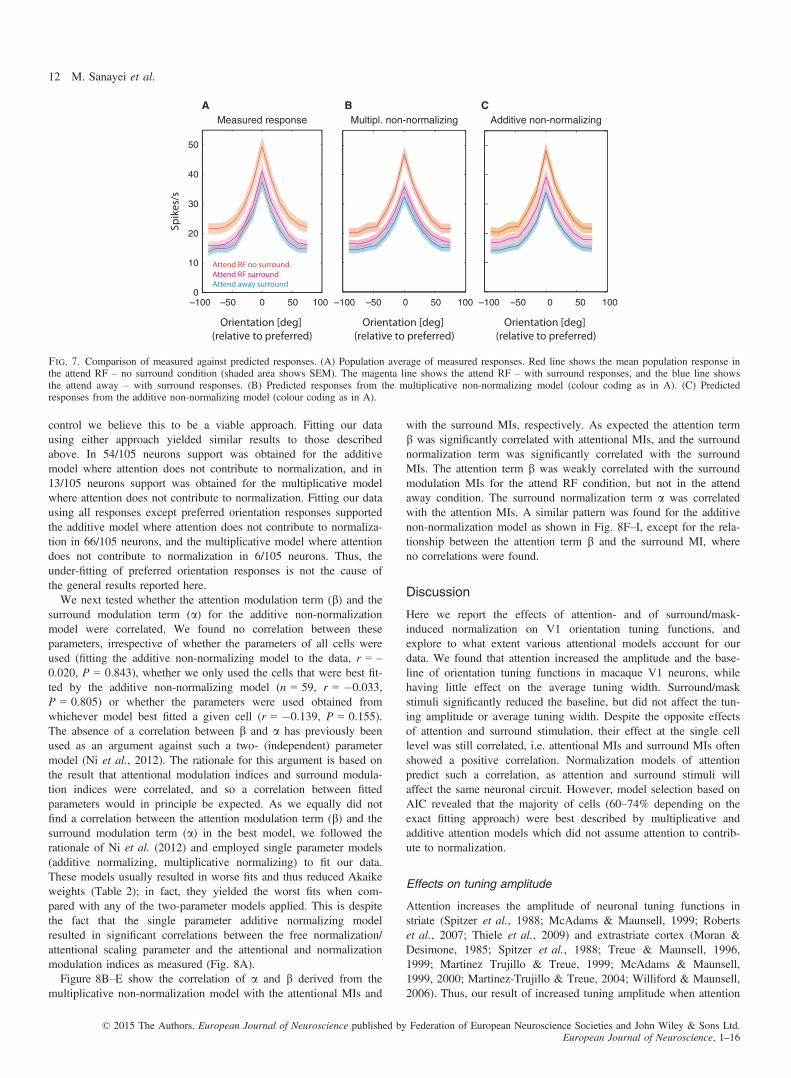
pared among the different models, they do not provide insight intothe absolute quality of the fits. It might be that none of the modelsdescribe the data well, and therefore account for little of the vari-ance. Figure 7 shows that this was not the case. It displays the mea-sured population responses (Fig. 7A) and the fitted populationresponse for the two non-normalizing models [multiplicative(Fig. 7B) and additive non-normalizing models (Fig. 7C)]. Acrossthe population of 105 cells the two models fitted the data well. Themultiplicative non-normalization model accounted for 94.1% of thevariance (across all five fitting conditions) while the additive non-normalization model accounted for 96.4% of the variance (across allfive fitting conditions). It is noteworthy, however, that our models,despite accounting for most of the variance, underestimate the peakamplitude response for some of the conditions by about 5–10% (seeFig. 7), which was less pronounced for the additive non-normalizingmodel (Fig. 7B). This raises the question of whether normalizationmodels of attention might account for the data, if fits were (i) con-strained to preferred orientation responses only or (ii) constrained toresponses excluding preferred orientation responses. Preferred orien-tation responses here are simply defined as the responses thatyielded the largest activity in the attend away no surround condition,as defined above. Given that the analysis included all neurons, notjust those that could well be described as orientation tuned under allstimulus conditions (n = 70, see above), it may include neuronswhere a genuine preferred orientation cannot be delineated. Butgiven the results shown in Fig. 7A, even including the remaining 35neurons yields clear orientation-tuned population responses. Andbecause the exclusion approaches described above simply serve as a
A B
Fig. 6. Pairwise distribution of Akaike weights for three different models. (A) Distribution of Akaike weights for the additive non-normalizing two-parametermodel (x-axis) vs. the additive normalizing two-parameter model. The average weight (�SEM) for both models is indicated by the location of the square anderror bars. (B) Distribution of Akaike weights for the additive non-normalizing two-parameter model (x-axis) vs. the multiplicative non- normalizing two-param-eter model. The average weight (�SEM) for both models is indicated by the location of the square and error bars. Histograms along the axes show the fre-quency distributions.
© 2015 The Authors. European Journal of Neuroscience published by Federation of European Neuroscience Societies and John Wiley & Sons Ltd.European Journal of Neuroscience, 1–16
Normalization models of attention 11
control we believe this to be a viable approach. Fitting our datausing either approach yielded similar results to those describedabove. In 54/105 neurons support was obtained for the additivemodel where attention does not contribute to normalization, and in13/105 neurons support was obtained for the multiplicative modelwhere attention does not contribute to normalization. Fitting our datausing all responses except preferred orientation responses supportedthe additive model where attention does not contribute to normaliza-tion in 66/105 neurons, and the multiplicative model where attentiondoes not contribute to normalization in 6/105 neurons. Thus, theunder-fitting of preferred orientation responses is not the cause ofthe general results reported here.We next tested whether the attention modulation term (b) and the
surround modulation term (a) for the additive non-normalizationmodel were correlated. We found no correlation between theseparameters, irrespective of whether the parameters of all cells wereused (fitting the additive non-normalizing model to the data, r = –0.020, P = 0.843), whether we only used the cells that were best fit-ted by the additive non-normalizing model (n = 59, r = �0.033,P = 0.805) or whether the parameters were used obtained fromwhichever model best fitted a given cell (r = �0.139, P = 0.155).The absence of a correlation between b and a has previously beenused as an argument against such a two- (independent) parametermodel (Ni et al., 2012). The rationale for this argument is based onthe result that attentional modulation indices and surround modula-tion indices were correlated, and so a correlation between fittedparameters would in principle be expected. As we equally did notfind a correlation between the attention modulation term (b) and thesurround modulation term (a) in the best model, we followed therationale of Ni et al. (2012) and employed single parameter models(additive normalizing, multiplicative normalizing) to fit our data.These models usually resulted in worse fits and thus reduced Akaikeweights (Table 2); in fact, they yielded the worst fits when com-pared with any of the two-parameter models applied. This is despitethe fact that the single parameter additive normalizing modelresulted in significant correlations between the free normalization/attentional scaling parameter and the attentional and normalizationmodulation indices as measured (Fig. 8A).Figure 8B–E show the correlation of a and b derived from the
multiplicative non-normalization model with the attentional MIs and
with the surround MIs, respectively. As expected the attention termb was significantly correlated with attentional MIs, and the surroundnormalization term was significantly correlated with the surroundMIs. The attention term b was weakly correlated with the surroundmodulation MIs for the attend RF condition, but not in the attendaway condition. The surround normalization term a was correlatedwith the attention MIs. A similar pattern was found for the additivenon-normalization model as shown in Fig. 8F–I, except for the rela-tionship between the attention term b and the surround MI, whereno correlations were found.
Discussion
Here we report the effects of attention- and of surround/mask-induced normalization on V1 orientation tuning functions, andexplore to what extent various attentional models account for ourdata. We found that attention increased the amplitude and the base-line of orientation tuning functions in macaque V1 neurons, whilehaving little effect on the average tuning width. Surround/maskstimuli significantly reduced the baseline, but did not affect the tun-ing amplitude or average tuning width. Despite the opposite effectsof attention and surround stimulation, their effect at the single celllevel was still correlated, i.e. attentional MIs and surround MIs oftenshowed a positive correlation. Normalization models of attentionpredict such a correlation, as attention and surround stimuli willaffect the same neuronal circuit. However, model selection based onAIC revealed that the majority of cells (60–74% depending on theexact fitting approach) were best described by multiplicative andadditive attention models which did not assume attention to contrib-ute to normalization.
Effects on tuning amplitude
Attention increases the amplitude of neuronal tuning functions instriate (Spitzer et al., 1988; McAdams & Maunsell, 1999; Robertset al., 2007; Thiele et al., 2009) and extrastriate cortex (Moran &Desimone, 1985; Spitzer et al., 1988; Treue & Maunsell, 1996,1999; Martinez Trujillo & Treue, 1999; McAdams & Maunsell,1999, 2000; Martinez-Trujillo & Treue, 2004; Williford & Maunsell,2006). Thus, our result of increased tuning amplitude when attention
–100 –50 0 50 1000
10
20
30
40
50
Attend RF no surroundAttend RF surroundAttend away surround
Spik
es/s
Orientation [deg] (relative to preferred)
Multipl. non-normalizing Additive non-normalizingMeasured responseBA C
Orientation [deg] (relative to preferred)
Orientation [deg] (relative to preferred)
–100 –50 0 50 100–100 –50 0 50 100
Fig. 7. Comparison of measured against predicted responses. (A) Population average of measured responses. Red line shows the mean population response inthe attend RF – no surround condition (shaded area shows SEM). The magenta line shows the attend RF – with surround responses, and the blue line showsthe attend away – with surround responses. (B) Predicted responses from the multiplicative non-normalizing model (colour coding as in A). (C) Predictedresponses from the additive non-normalizing model (colour coding as in A).
© 2015 The Authors. European Journal of Neuroscience published by Federation of European Neuroscience Societies and John Wiley & Sons Ltd.European Journal of Neuroscience, 1–16
12 M. Sanayei et al.

was deployed to the neuron’s RF was predicted. Surround stimuligenerally reduce tuning amplitude in striate and extrastriate areas (Liet al., 2000; Walker et al., 2000; Angelucci et al., 2002; Cavanaughet al., 2002b; Bair et al., 2003; Ozeki et al., 2004; Chen et al.,2005; Xing et al., 2005; Okamoto et al., 2009; Bartolo et al.,2011), and our results are also in line with those data. While atten-tion and surround stimuli have opposite effects on the amplitude ofthe tuning function at the population level, normalization models ofattention (Lee & Maunsell, 2009; Reynolds & Heeger, 2009) predictthat surround modulation indices and attentional modulation indicesare correlated across the population and that the effects of attentionand surround stimuli can be adequately captured by normalizationmodels. By and large we found that cells most strongly suppressedby surround/mask stimuli yielded the strongest increase in activitywhen spatial attention was directed to the cell’s RF.
Effects on tuning width
Previous studies have reported cells that were most strongly sup-pressed by surround stimuli showed the most profound sharpening
of tuning curves (Chen et al., 2005; Okamoto et al., 2009). Wefound the opposite in our study. A sharpening of tuning functionscould in principle be a ‘tip of the iceberg’ effect. If surround stimulireduce firing rates for non-preferred orientation stimuli to zero, a fitto those data may yield ‘apparently’ more narrow tuning curves, ascells cannot exhibit negative firing rates. But whether this contrib-utes to the discrepancy between our and previous data, or whether itis a result of anaesthesia or species differences is currently undeter-mined.
Effects on tuning baseline (asymptote)
Surround stimuli reduced the tuning baseline, which is in line withprevious studies (Li et al., 2000; Walker et al., 2000; Angelucciet al., 2002; Cavanaugh et al., 2002b; Bair et al., 2003; Ozekiet al., 2004; Chen et al., 2005; Xing et al., 2005; Okamoto et al.,2009; Bartolo et al., 2011), and this was independent of whetherthe surround stimuli encroached upon the ‘classical RF’. Attentionincreased the tuning baseline in V1, which differs from previousreports in area V1 (McAdams & Maunsell, 1999) and area MT
A
B C F G
D E H I
Fig. 8. Correlation of fitting parameters with modulation indices. (A) Correlation between the attentional and normalization fitting parameter from the multipli-cative model (single parameter model) and measured attention and surround modulation indices. (B–E) Correlation between the attentional and normalization fit-ting parameters from the multiplicative non-normalizing two-parameter model with the measured attention and surround modulation indices. (F–I) Correlationbetween the fitting parameters from the best fitting additive attention non-normalizing two-parameter model and measured attention and surround modulationindices. The normalization term captures surround effects, while the parameter b captures attention effects. Text insets give correlation coefficients (r, Spearmanrank correlation) and significance (P). Grey and black symbols/text delineate different MI conditions as labelled along the x- and y-axes.
© 2015 The Authors. European Journal of Neuroscience published by Federation of European Neuroscience Societies and John Wiley & Sons Ltd.European Journal of Neuroscience, 1–16
Normalization models of attention 13

(Treue & Trujillo, 1999), where the asymptote of the tuning func-tion was not affected. In our data the effect was only significantwhen all neurons were analysed. When neurons with surround intru-sion were removed from the sample, the effect on tuning baselinewas no longer significant, which we assign to the reduced samplesize. This leaves the question of why we found changes in tuningbaseline with attention, while the above studies have not. It couldbe related to differences in the visual stimuli used, as McAdams &Maunsell (1999) used Gabor stimuli, which usually will havestimulated the RF centre in full, but also encroached into thesurround, but it is unclear whether that is sufficient to explain thedifferences.
Effects of attention: additive or multiplicative?
A previous study argued that the effects of attention in area V1 arebest described by an additive model (Thiele et al., 2009), which isin contrast to other cortical areas, where multiplicative effects (Willi-ford & Maunsell, 2006) or contrast gain changes (Reynolds et al.,2000) have been reported. Our modelling (based on the full set offitting procedures, see Methods) supports the notion that effects ofattention in V1 are best described by additive models, as the largestnumber of neurons was best described by these models. However, asizeable number of neurons were best explained by multiplicativemodels, which demonstrates that both effects can be present inter-mixed within an area.
Normalization models of attention
Normalization models have successfully explained visual responsesunder a variety of stimulus conditions (Heeger, 1992; Carandiniet al., 1997; Tolhurst & Heeger, 1997; Britten & Heuer, 1999;Anderson et al., 2000; Sceniak et al., 2001; Thiele et al., 2004;Rust et al., 2006). These models assume that tuned local excitatoryinputs are normalized by the sum of inputs, whereby the ‘normaliz-ing’ inputs can be tuned themselves (Ni et al., 2012). Normalizationmodels have more recently been used to successfully explain con-flicting results regarding the influence of attention on neuronal tun-ing functions (Lee & Maunsell, 2009; Reynolds & Heeger, 2009),and they have gained experimental support from human psycho-physics and functional magnetic resonance imaging (Herrmannet al., 2010), and single cell data (Lee & Maunsell, 2010; Ni et al.,2012). A key prediction of the normalization model of attention isthat presentation of surround stimuli and deployment of attention tothe RF should have correlated effects. A recent paper provided evi-dence in favour of this prediction, employing normalization modelsto explain the effects of attending to one of two stimuli that are pre-sented inside the RFs of MT neurons (Ni et al., 2012). The authorsreported a correlation between the strength of normalization modula-tion and attentional modulation (their Fig. 3). We also found a cor-relation between the strength of normalization modulation andattentional modulation for some of our comparisons (see Fig. 5),which provides partial support for the normalization model of atten-tion. However, a key comparison showed a trend towards a negativecorrelation (using preferred orientation responses) for the conditionwhich could be viewed as showing ‘pure’ effects of surround influ-ences and pure effects of attention, i.e. when the surround MI(attend away) was compared with the attend MI (no surround).Using the responses from all 12 bar orientations to calculate MIs forthis comparison, by contrast, yielded a weak positive correlation.This negative (or weak positive) correlation for the most ‘pure’effects questions the link between attention and normalization for
our sample, but it is noteworthy that we did not investigate tunednormalization (as Ni et al. did), but rather a form of un-tuned nor-malization. Ni et al. (2012) furthermore found a correlation betweenparameters from their fitted normalization models and attention, aswell as between parameters from their fitted normalization modelsand normalization modulation indices. We also found that thederived parameter from a multiplicative attention normalizing modelwas significantly correlated with attentional and with surround mod-ulation indices. However, model validation based on AIC (and BIC)weights (Akaike, 1992; Burnham & Anderson, 2004) suggests thatthis particular model yielded a relatively poor description of thedata, when compared with other models. In most cases an additiveattention model, where attention did not contribute to normalizationmechanisms, was the best model (in relative terms) for our data. Weemphasize the fact of ‘relatively’ best model, as Akaike weights,while taking the number of model comparisons into account, do notassess the quality of the model in an absolute sense. There may wellbe other models, which we did not explore, that would give yet bet-ter accounts of our data, even though the fits shown in Fig. 7 andthe variance accounted for (as reported) demonstrate that the modelsdid capture the features of the data well. Our results demonstratethat there are conditions (and areas) where a single attention mecha-nism is unable to account for the effects seen in all neurons. Thisfinding emphasizes the importance of exploring different models (inconjunction with model validation) to understand brain mechanismsthat support cognitive operations.The discrepancy between our data and previously published data
(Ni et al., 2012) begs the question of where the differences arisefrom. Are they due to differences in the areas recorded from, forexample V1 being an early visual cortical area which shows smallerattention effects than MT? Do they arise from differences in experi-mental design, i.e. attention being directed to the RF and away fromit (our study) vs. towards two different locations/stimuli inside theRF (Ni et al., 2012)? Would our results change if attention wasdirected to different locations within the same visual hemifield? Ordo the differences arise from differences in visual stimulation, i.e.single vs. multiple stimuli inside the RF, and normalization inside(two stimuli inside the RF) vs. outside the RF (surround stimuluspresentation)? At this stage we can only speculate, but it is possiblethat area differences contribute to the discrepancy. In area V1increased normalization (by increasing the stimulus size or increas-ing the contrast) results not only in altered spiking activity but alsoin increased oscillatory activity in the gamma frequency range (Hen-rie & Shapley, 2005; Gieselmann & Thiele, 2008; Ray & Maunsell,2010). At the same time, attention (to a very small part of visualspace) in primary visual cortex reduces oscillatory activity in thegamma frequency band (Chalk et al., 2010; Herrero et al., 2013),i.e. it has opposite effects to those seen by increasing normalization.Thus, attention may serve as a surround exclusion mechanism (Rob-erts et al., 2007; Sundberg et al., 2009), whereby it reduces the nor-malization induced by surround stimuli. At the same time,differences in experimental design could also account for the differ-ences found. In Ni et al.’s study attention was directed either to apreferred or an anti-preferred stimulus inside the RF (they also hadan outside attend control condition), while in our study attentionwas either directed to the RF centre (a 0.1*0.1° patch representingthe behaviourally relevant location), or into the opposite hemifield.Shifting attention between different parts of the RF (Ni et al., 2012)may engage different (normalization) mechanisms than shiftingattention between the RF centre and a location in the opposite hemi-field (our study). Moreover, in our study the stimuli inducing nor-malization were presented largely outside the classical RF, while
© 2015 The Authors. European Journal of Neuroscience published by Federation of European Neuroscience Societies and John Wiley & Sons Ltd.European Journal of Neuroscience, 1–16
14 M. Sanayei et al.

they occupied parts of the RF centre in Ni et al.’s (2012) study.Given that normalization models argue that attention affects neuro-nal processing by interacting multiplicatively with the stimulus driveand with the suppressive drive (Reynolds & Heeger, 2009), whileCavanaugh et al. (2002a) suggest that centre and surround gains areregulated independently in V1 (i.e. not by a single source), it is con-ceivable that the task/stimulus differences outlined above are criticalin terms of whether attention and normalization affect the same cir-cuitry. Designing a study similar to Ni et al. (2012) for area V1 isvery difficult, if not impossible (due to their small size of V1 par-afoveal RFs). However, our study design could be applied to MT(or V4). This would answer whether the discrepancies are based onarea or design differences or both. A partial answer to that questioncan already be obtained from reports for area V4 (Ghose & Maun-sell, 2008), where the effects of attention were measured under con-ditions similar to those reported by Ni et al. (2012). Ghose &Maunsell (2008) reported that attention affects mostly the input gainof V4 neurons, which thereby allows neurons to differently weighrelevant vs. irrelevant incoming information. Their study did notfind strong evidence for normalization to contribute to attentionalmodulation, even though for some neurons (~25–30% depending onthe model tested) the fits were significantly improved when a freeparameter of power (equivalent to some form of normalization) wasadded to the model. This proportion of neurons is roughly equiva-lent to what we found. Based on these multiple findings we suggestthat attention affects neuronal responses by multiple mechanisms,whereby the relative weighting of these mechanisms may be affectedby the stimulus and task conditions, and possibly also by the archi-tecture of the area where responses are measured. Neurons that werebest fitted with normalizing attention vs. non-normalizing attentionmodels possibly have different connections with downstream areasand also may receive different feedback signals. The increase in fir-ing rate usually seen with attention could be implemented by indi-rect feedback connection from parietal or frontal areas (viaextrastriate areas), targeting excitatory and inhibitory neurons in V1.Given our results of non-normalizing models being the better de-scriptors for the majority of cells, the latter may not be very promi-nent. However, an increase in neuromodulator tone such asacetylcholine could also result in increased firing rates (Herreroet al., 2008), either by directly affecting firing rates on a trial bytrial basis, or by allowing feedback to have increased impact (Deco& Thiele, 2011). These hypotheses can probably soon be tested withthe advancement in optogenetics in primates. Whatever the answerto these questions, our current results demonstrate that there are con-ditions where attention does not contribute to normalization in themajority of V1 neurons.
Acknowledgements
We thank the staff of the Comparative Biology Centre (Newcastle Univer-sity) for excellent technical support. The work was supported by the MRCand the Wellcome Trust.
Abbreviations
AIC, Akaike’s information criterion; BIC, Bayesian information criterion;MI, modulation index; MT, middle temporal area; PSTH, peri-stimulus–timehistogram; RF, receptive field; SI, suppression index.
References
Akaike, H. (1992) Data analysis by statistical models. Brain Dev.-Jpn., 24,127–133.
Albrecht, D.G., Geisler, W.S., Frazor, R.A. & Crane, A.M. (2002) Visualcortex neurons of monkeys and cats: temporal dynamics of the contrastresponse function. J. Neurophysiol., 88, 888–913.
Anderson, J.S., Carandini, M. & Ferster, D. (2000) Orientation tuning ofinput conductance, excitation, and inhibition in cat primary visual cortex.J. Neurophysiol., 84, 909–926.
Angelucci, A., Levitt, J.B. & Lund, J.S. (2002) Anatomical origins of theclassical receptive field and modulatory surround field of single neurons inmacaque visual cortical area V1. Prog. Brain Res., 136, 373–388.
Bair, W., Cavanaugh, J.R. & Movshon, J.A. (2003) Time course and time-distance relationships for surround suppression in macaque V1 neurons. J.Neurosci., 23, 7690–7701.
Bartolo, M.J., Gieselmann, M.A., Vuksanovic, V., Hunter, D., Sun, L., Chen,X., Delicato, L.S. & Thiele, A. (2011) Stimulus-induced dissociation ofneuronal firing rates and local field potential gamma power and its rela-tionship to the resonance blood oxygen level-dependent signal in macaqueprimary visual cortex. Eur. J. Neurosci., 34, 1857–1870.
Britten, K.H. & Heuer, H.W. (1999) Spatial summation in the receptivefields of MT neurons. J. Neurosci., 19, 5074–5084.
Buracas, G.T. & Boynton, G.M. (2007) The effect of spatial attention oncontrast response functions in human visual cortex. J. Neurosci., 27, 93–97.
Burnham, K.P. & Anderson, D.R. (2004) Multimodel inference: understand-ing AIC and BIC in model selection. Sociol. Method. Res., 33, 261–304.
Carandini, M. & Heeger, D.J. (2012) Normalization as a canonical neuralcomputation. Nat. Rev. Neurosci., 13, 51–62.
Carandini, M., Heeger, D.J. & Movshon, J.A. (1997) Linearity and normali-zation in simple cells of the macaque primary visual cortex. J. Neurosci.,17, 8621–8644.
Cavanaugh, J.R., Bair, W. & Movshon, J.A. (2002a) Nature and interactionof signals from the receptive field center and surround in macaque V1neurons. J. Neurophysiol., 88, 2530–2546.
Cavanaugh, J.R., Bair, W. & Movshon, J.A. (2002b) Selectivity and spatialdistribution of signals from the receptive field surround in macaque v1neurons. J. Neurophysiol., 88, 2547–2556.
Chalk, M., Herrero, J., Gieselmann, M.A., Delicato, L.S., Gotthardt, S. &Thiele, A. (2010) Attention reduces stimulus-driven gamma frequencyoscillations and spike field coherence in V1. Neuron, 66, 114–125.
Chen, G., Dan, Y. & Li, C.Y. (2005) Stimulation of non-classical receptivefield enhances orientation selectivity in the cat. J. Physiol., 564, 233–243.
Deco, G. & Thiele, A. (2011) Cholinergic control of cortical network interac-tions enables feedback-mediated attentional modulation. Eur. J. Neurosci.,34, 146–157.
Distler, C. & Hoffmann, K.P. (2001) Cortical input to the nucleus of theoptic tract and dorsal terminal nucleus (NOT-DTN) in macaques: a retro-grade tracing study. Cereb. Cortex, 11, 572–580.
Freeman, T.C., Durand, S., Kiper, D.C. & Carandini, M. (2002) Suppressionwithout inhibition in visual cortex. Neuron, 35, 759–771.
Ghose, G.M. (2009) Attentional modulation of visual responses by flexibleinput gain. J. Neurophysiol., 101, 2089–2106.
Ghose, G.M. & Maunsell, J.H. (2002) Attentional modulation in visual cor-tex depends on task timing. Nature, 419, 616–620.
Ghose, G.M. & Maunsell, J.H. (2008) Spatial summation can explain theattentional modulation of neuronal responses to multiple stimuli in areaV4. J. Neurosci., 28, 5115–5126.
Gieselmann, M.A. & Thiele, A. (2008) Comparison of spatial integration andsurround suppression characteristics in spiking activity and the local fieldpotential in macaque V1. Eur. J. Neurosci., 28, 447–459.
Heeger, D.J. (1992) Normalization of cell responses in cat striate cortex.Visual Neurosci., 9, 181–197.
Henrie, J.A. & Shapley, R. (2005) LFP power spectra in V1 cortex: thegraded effect of stimulus contrast. J. Neurophysiol., 94, 479–490.
Herrero, J.L., Roberts, M.J., Delicato, L.S., Gieselmann, M.A., Dayan, P. &Thiele, A. (2008) Acetylcholine contributes through muscarinic receptorsto attentional modulation in V1. Nature, 454, 1110–1114.
Herrero, J.L., Gieselmann, M.A., Sanayei, M. & Thiele, A. (2013) Attention-induced variance and noise correlation reduction in macaque V1 is medi-ated by NMDA receptors. Neuron, 78, 729–739.
Herrmann, K., Montaser-Kouhsari, L., Carrasco, M. & Heeger, D.J. (2010)When size matters: attention affects performance by contrast or responsegain. Nat. Neurosci., 13, 1554–1559.
Ito, M. & Gilbert, C.D. (1999) Attention modulates contextual influences inthe primary visual cortex of alert monkeys. Neuron, 22, 593–604.
Jones, H.E., Grieve, K.L., Wang, W. & Sillito, A.M. (2001) Surround sup-pression in primate V1. J. Neurophysiol., 86, 2011–2028.
© 2015 The Authors. European Journal of Neuroscience published by Federation of European Neuroscience Societies and John Wiley & Sons Ltd.European Journal of Neuroscience, 1–16
Normalization models of attention 15

Jones, H.E., Wang, W. & Sillito, A.M. (2002) Spatial organization and mag-nitude of orientation contrast interactions in primate v1. J. Neurophysiol.,88, 2796–2808.
Khayat, P.S., Niebergall, R. & Martinez-Trujillo, J.C. (2010) Attention differ-entially modulates similar neuronal responses evoked by varying contrastand direction stimuli in area MT. J. Neurosci., 30, 2188–2197.
Lee, J. & Maunsell, J.H. (2009) A normalization model of attentional modu-lation of single unit responses. PLoS One, 4, e4651.
Lee, J. & Maunsell, J.H. (2010) Attentional modulation of MT neurons withsingle or multiple stimuli in their receptive fields. J. Neurosci., 30, 3058–3066.
Li, W., Thier, P. & Wehrhahn, C. (2000) Contextual influence on orientationdiscrimination of humans and responses of neurons in V1 of alert mon-keys. J. Neurophysiol., 83, 941–954.
Luck, S.J., Chelazzi, L., Hillyard, S.A. & Desimone, R. (1997) Neural mech-anisms of spatial selective attention in areas V1, V2, and V4 of macaquevisual cortex. J. Neurophysiol., 77, 24–42.
Martinez Trujillo, J.C. & Treue, S. (1999) Reducing stimulus contrastincreases attentional modulation in the superior temporal sulcus of themacaque monkey. Soc. Neurosci., 25, 6.6.
Martinez-Trujillo, J. & Treue, S. (2002) Attentional modulation strengthin cortical area MT depends on stimulus contrast. Neuron, 35,365–370.
Martinez-Trujillo, J.C. & Treue, S. (2004) Feature-based attention increasesthe selectivity of population responses in primate visual cortex. Curr.Biol., 14, 744–751.
McAdams, C.J. & Maunsell, J.H.R. (1999) Effects of attention on orientationtuning functions of single neurons in macaque cortical area V4. J. Neuro-sci., 19, 431–441.
McAdams, C.J. & Maunsell, J.H.R. (2000) Attention to both space and fea-ture modulates neuronal responses in macaque area V4. J. Neurophysiol.,83, 1751–1755.
Mitchell, J.F., Sundberg, K.A. & Reynolds, J.H. (2007) Differential atten-tion-dependent response modulation across cell classes in macaque visualarea V4. Neuron, 55, 131–141.
Moran, J. & Desimone, R. (1985) Selective attention gates visual processingin the extrastriate cortex. Science, 229, 782–784.
Ni, A.M., Ray, S. & Maunsell, J.H. (2012) Tuned normalization explains thesize of attention modulations. Neuron, 73, 803–813.
Okamoto, M., Naito, T., Sadakane, O., Osaki, H. & Sato, H. (2009) Sur-round suppression sharpens orientation tuning in the cat primary visualcortex. Eur. J. Neurosci., 29, 1035–1046.
Ozeki, H., Sadakane, O., Akasaki, T., Naito, T., Shimegi, S. & Sato, H.(2004) Relationship between excitation and inhibition underlying size tun-ing and contextual response modulation in the cat primary visual cortex. J.Neurosci., 24, 1428–1438.
Press, W.H., Teukolsky, S.A., Vetterling, W.T. & Flannery, B.P. (2002)Numerical Recip. Cambridge University Press, Cambridge.
Ray, S. & Maunsell, J.H. (2010) Differences in gamma frequencies acrossvisual cortex restrict their possible use in computation. Neuron, 67,885–896.
Reynolds, J.H. & Chelazzi, L. (2004) Attentional modulation of visualprocessing. Annu. Rev. Neurosci., 27, 611–647.
Reynolds, J.H. & Heeger, D.J. (2009) The normalization model of attention.Neuron, 61, 168–185.
Reynolds, J.H., Chelazzi, L. & Desimone, R. (1999) Competitive mecha-nisms subserve attention in macaque areas V2 and V4. J. Neurosci., 19,1736–1753.
Reynolds, J.H., Pasternak, T. & Desimone, R. (2000) Attention increasessensitivity of V4 neurons. Neuron, 26, 703–714.
Roberts, M., Delicato, L.S., Herrero, J., Gieselmann, M.A. & Thiele, A.(2007) Attention alters spatial integration in macaque V1 in an eccentric-ity-dependent manner. Nat. Neurosci., 10, 1483–1491.
Roelfsema, P.R., Lamme, V.A. & Spekreijse, H. (1998) Object-based atten-tion in the primary visual cortex of the macaque monkey. Nature, 395,376–381.
Rust, N.C., Mante, V., Simoncelli, E.P. & Movshon, J.A. (2006) How MTcells analyze the motion of visual patterns. Nat. Neurosci., 9, 1421–1431.
Sceniak, M.P., Hawken, M.J. & Shapley, R. (2001) Visual spatial character-ization of macaque V1 neurons. J. Neurophysiol., 85, 1873–1887.
Sengpiel, F., Baddeley, R.J., Freeman, T.C., Harrad, R. & Blakemore, C.(1998) Different mechanisms underlie three inhibitory phenomena in catarea 17. Vision Res., 38, 2067–2080.
Spitzer, H., Desimone, R. & Moran, J. (1988) Increased attention enhancesboth behavioral and neuronal performance. Science, 240, 338–340.
Sundberg, K.A., Mitchell, J.F. & Reynolds, J.H. (2009) Spatial attentionmodulates center-surround interactions in macaque visual area v4. Neuron,61, 952–963.
Thiele, A., Distler, C. & Hoffmann, K.P. (1999) Decision-related activity inthe macaque dorsal visual pathway. Eur. J. Neurosci., 11, 2044–2058.
Thiele, A., Distler, C., Korbmacher, H. & Hoffmann, K.-P. (2004) Contribu-tion of inhibitory mechanisms to direction selectivity and response normal-ization in macaque middle temporal area. Proc. Natl. Acad. Sci. USA, 101,9810–9815.
Thiele, A., Delicato, L.S., Roberts, M.J. & Gieselmann, M.A. (2006) A novelelectrode-pipette design for simultaneous recording of extracellular spikesand iontophoretic drug application in awake behaving monkeys. J. Neuro-sci. Meth., 158, 207–211.
Thiele, A., Pooresmaeili, A., Delicato, L.S., Herrero, J.L. & Roelfsema, P.R.(2009) Additive effects of attention and stimulus contrast in primary visualcortex. Cereb. Cortex, 19, 2970–2981.
Tolhurst, D.J. & Heeger, D.J. (1997) Contrast normalization and a linearmodel for the directional selectivity of simple cells in cat striate cortex.Visual Neurosci., 14, 19–25.
Treue, S. (2001) Neural correlates of attention in primate visual cortex.Trends Neurosci., 24, 295–300.
Treue, S. & Maunsell, J.H.R. (1996) Attentional modulation of visual motionprocessing in cortical areas MT and MST. Nature, 382, 539–541.
Treue, S. & Maunsell, J.H.R. (1999) Effects of attention on the processing ofmotion in macaque middle temporal and medial superior temporal visualcortical areas. J. Neurosci., 19, 7591–7602.
Treue, S. & Trujillo, J.C.M. (1999) Feature-based attention influences motionprocessing gain in macaque visual cortex. Nature, 399, 575–579.
Walker, G.A., Ohzawa, I. & Freeman, R.D. (2000) Suppression outside theclassical cortical receptive field. Visual Neurosci., 17, 369–379.
Williford, T. & Maunsell, J.H. (2006) Effects of spatial attention on contrastresponse functions in macaque area V4. J. Neurophysiol., 96, 40–54.
Xing, D., Shapley, R.M., Hawken, M.J. & Ringach, D.L. (2005) Effect ofstimulus size on the dynamics of orientation selectivity in Macaque V1. J.Neurophysiol., 94, 799–812.
© 2015 The Authors. European Journal of Neuroscience published by Federation of European Neuroscience Societies and John Wiley & Sons Ltd.European Journal of Neuroscience, 1–16
16 M. Sanayei et al.