Embed Size (px)
Citation preview

Competition and pricing behavior in long-term care markets
Evidence from the Market for Assistance in Daily Housekeeping Activities Remco van EijkelMark KattenbergAb van der Torre
CPB Discussion Paper | 373

3
Competition and pricing behavior in long term care markets: Evidence from the Market for Assistance in Daily Housekeeping Activities
Remco van Eijkel a,b
Mark Kattenberga
Ab van der Torrec
Abstract
Exploiting a rich data set on the Dutch market for assistance in daily housekeeping activities (ADHA), we find that larger providers obtain a higher price than do small providers. However, compared to other studies on market power in care markets this price difference is considered small to moderate. Our identification strategy relies on the exogenous variation in market shares in January ’07, the very first month after ADHA was decentralized to municipalities. Zooming in on our main outcome, we obtain that the small but significant effect of market size on price is merely driven by the pricing behavior of for-profit providers.
1. Introduction
In the last few decades, spending on long-term care (LTC) has worldwide taken up an increasing share of national income, a trend expected to persist in the foreseeable future (OECD, 2013). Besides an ageing population, giving rise to an increased need for nursing home services and home health care, rising prices for LTC services have been put forward as another important cause for the increase in LTC expenditures.1 Understanding the driving forces of price developments in long-term care thus helps to design policies that bring the future costs of long term care within affordable limits for society as a whole.
In an attempt to control costs, policy makers in many high-income countries around the world have implemented market-oriented features into the long-term care system – including price deregulation.2 As on virtually any other market, the degree of competition potentially has a vast impact on the pricing behavior of suppliers in deregulated LTC markets.3 Despite the importance of gaining a better understanding of the extent to which competitive forces affect pricing behavior in a CPB Netherlands Bureau for Economic Policy Analysis. b Corresponding author: [email protected], +31 6 27858360. c The Netherlands Institute for Social Research. 1 See e.g. the Forbes news article on 09/26/’17 about the main findings of the Genworth 2017 Cost of Care Survey: https://www.forbes.com/sites/nextavenue/2017/09/26/the-staggering-prices-of-long-term-care-2017/#78d6c68c2ee2. One of the noteworthy outcomes of this survey is that in 2017 the monthly cost for a private room in a U.S. nursing room rose by a yearly 5.5 percent and by almost 50 percent since 2004. The yearly increase of the cost for home health care was even higher and has been mainly attributed to changes in price drivers. In comparison, the U.S. Consumer Price Index rose by only 1.4 percent in 2017. Martin et al. (2011) show that for health care expenditures in general, price increases accounted for 60 percent of the growth in U.S. health care spending in 2009. Finally, Anderson et al. (2003) argue that the variability in health care spending among OECD countries is mainly due to differences in prices for health care goods and services. 2 See e.g. Bartlett and Phillips (1996) and Glendinning and Moran (2009). 3 Gaynor and Town (2012), discussing recent trends in health care markets in general, show that the upward trend in prices for health care services is associated with an increase in the concentration on the supply side of the market.
4
these markets, relatively little research has been conducted into this direction. One important reason for this is that in most countries around the world prices for quite a few LTC services are still administered rather than determined by market forces (see e.g. Gaynor and Town, 2012). Another complicating factor is that in cases where prices are market determined, they are often not available to the researcher – at least, not at a very detailed level – due to confidentiality reasons.
Our paper aims to expand the limited knowledge about how competitive forces shape the pricing behavior of LTC providers, using a unique data set on the Dutch market for assistance in daily housekeeping activities (ADHA). This type of long term care services has been decentralized to municipalities as of 2007. At the same time, the entry of for-profit care providers gained full momentum in the years after decentralization: In 2013, for-profit providers accounted for more than 60 percent of ADHA-provision countrywide. Moreover, many municipalities chose not to regulate prices in their procurement process. As a result, we have market-determined price data for more than 150 local markets (of just over 400 Dutch municipalities in total) for the period 2009-2013.
Our identification strategy relies on the exogenous variation in the market shares in the first month after decentralization. This period can be seen as a mere transition phase, as existing users retained the right to receive ADHA from the very same provider as before the decentralization. Market shares in January ’07 are thus exogenous to any market developments in the years to come. Moreover, the January ’07 market share is a strong instrument as it turns out to be substantially correlated with the market shares in later years, despite the relatively high entry rates during this period.
Focusing on the most common form of ADHA (‘basic ADHA’), we obtain that a provider’s market position – proxied by his market share – has a positive and significant effect on the price he receives. The average market leader in a municipality – possessing a 65 percent market share – secures a price that is 2.1 percent above the price of an atomistic provider, which we consider to be a small to moderate effect (in economic terms). Translating this result to the overall market level tells us that the average price on the market decreases by 0.5 percent as the market becomes 10 percent less concentrated. In comparison, Forder and Allen (2014) find for the English care homes market that a drop in market concentration by 10 percent corresponds to a decrease in prices by 2.2 percent.4
Our study thus shows that high degrees of market concentration do not hinder competitive pressures on suppliers’ pricing behavior per se. A plausible explanation for this outcome is that incumbents face a serious threat of entry by newcomers, an idea that is backed by the observation that new providers enter relatively easy into the local markets. This also indicates that in order to stimulate competition on health care and long-term markets, lowering entry barriers might be more important than bringing the level of market concentration below some threshold value.
Zooming in on our main outcome, we show that the small but significant effect of market size on price is merely driven by the pricing behavior of for-profit providers: while for this type of provider 4 From the results found by Melnick and Keeler (2007) for the Californian hospital market, one obtains that a reduction of the degree of market concentration by 10 percent – using the sample average as the benchmark – yields a price decrease of 3.6 percent. Gaynor and Town (2000) present an overview of the pre-2000 studies on this issue. All of these studies consider a hypothetical “standard merger case” in which there is a market initially consisting of five identical hospitals and where two of these hospitals merge. Most of these studies find that such an increase of market concentration by 40 percent are associated with higher prices, ranging from 2 to 17 percent. A few studies however obtain a small negative relation between market concentration and hospital prices.

5
the average market leader receives a prices that exceeds the price of an atomistic supplier by 2.7 percent, there is no systematic relation between size and price for non-profit organizations. From this, we cannot conclude that the entry of for-profit suppliers has led to higher prices, as for-profits may be more efficient than non-profits. Still, the result indicates that the extent to which market concentration influences price formation may very well depend on the ownership composition at the supply side. If the exercise of market power is a major concern and any potential gains in (productive) efficiency are deemed small, granting for-profit companies access to the market may be socially suboptimal.
The empirical strategy adopted in this paper follows a reduced-form approach, but due to the rich panel structure of our data we are able to tackle the main issues that come with this method.5 As already mentioned, our data allows us to construct a valid and strong instrument that controls for possible endogeneity bias. Furthermore, since providers in our data set are typically active in more than one local market and during several years we can control for unobserved heterogeneity between suppliers that is time-invariant. Thus, including supplier fixed effects drastically limits the likelihood that the estimates found are driven by differences in quality or costs between providers.
Our paper contributes to the existing literature on the effects of competition on market outcomes for LTC services. Given that most of the existing studies in this field rely on price-administered data, the market outcome of interest is typically the quality of the long term care provided.6 Two notable exceptions in this respect are Nyman (1994) and Forder and Allen (2014), both focusing on the impact of greater competitiveness on pricing behavior in long term care. Analyzing the nursing home market in Wisconsin, Nyman (1984) finds that higher degrees of market concentration are associated with higher prices. He argues that this effect is driven by significant barriers to entry created by state regulations, which render the market incontestable. Forder and Allen (2014) show for the English care homes market that greater competition leads to lower (market determined) prices but at the same time reduces quality. According to the authors, the latter effect is likely due to local authorities – commissioning long-term care on behalf of service users – being insensitive to quality offerings above minimum quality standards.
Concerning our finding on the differences in market behavior between for-profit providers and non-profit organizations, our work relates to Chou (2002), Kim and Norton (2015) and Lin (2015).7 While the former of these papers shows that ownership type has a significant impact on the provision of nursing home quality, the latter two do not find any marked differences in market strategies adopted by for-profit and non-profit providers in LTC markets.8 Our paper lends new support for the
5 See e.g. Bresnahan (1989) for a thorough discussion on these issues. 6 The empirical evidence on the effects of competition on quality is rather mixed: while Lin (2015), based on a counterfactual analysis, concludes that entry deregulation does not improve the quality of care in U.S. nursing homes, Jung and Polsky (2014) find for the U.S. home health care market a nonlinear relationship between competition and various quality measures, indicating that too intensive competition hurts market outcomes. Taking a somewhat broader perspective, recent studies by Cooper et al. (2011) and Bloom et al. (2015) find that stronger competitive pressures lead to improvements in quality in the English hospital market. 7 See e.g. Glaeser and Schleifer (2001) and Besley and Ghatak (2005) for theoretical explanations for why the incentives for non-profit organizations divert from the incentives for for-profit companies. 8 Another paper on this issue, studying spillover effects between the different ownership types, is Grabowski and Hirth (2003). It shows for the U.S. case that a higher market share of non-profit nursing homes has a positive impact on the quality provided by competing for-profit homes, a result in line with the idea that the
6
idea that non-profit organizations divert from the profit-maximizing objective that is typically pursued by for-profit suppliers. This is an important notion for policy makers, as it provides insight on how granting for-profit firms access to health care markets shapes market outcomes.
The rest of the paper is organized as follows. The next section discusses the institutional context of our study. It mainly focuses on the measures that have been implemented to create more room for competition on the market for ADHA. Section 3 describes the empirical strategy employed in this paper to estimate the impact of market shares on suppliers’ pricing behavior. The data used for our study and the main summary statistics are discussed in Section 4. The results of our main empirical analysis can be found in Section 5. In Section 6, we show that our main results are robust to various robustness checks. The paper ends with some concluding remarks.
2. The market for daily housekeeping services (ADHA) in the Netherlands
ADHA is a form of home health care that enables people to live at home when they, or their household members, are unable to fulfill daily housekeeping activities. It can be provided in a basic form (including tasks such as cleaning or shopping for groceries) and in an advanced form in which the home help assists the household with the planning of household tasks as well (i.e. making an inventory of goods that should be bought). Advanced ADHA is typically provided to users who suffer from physical or mental disabilities. About 2.7 percent of the Dutch population uses ADHA, although its uptake is strongly concentrated among the elderly: About ten percent of the people aged 70 uses ADHA, versus 60 percent of the people aged ninety (Pommer et al., 2009). The average ADHA user is 73 years old and eligible patients use about 120 hours of ADHA per year on average.
2.1 The decentralization of daily housekeeping services
Before 2007 ADHA was part of the Exceptional Medical Expenses Act (EMEA), an insurance-based health scheme covering various types of home health care, mental health care and institutional care. About ten percent of all EMEA expenditures in the Netherlands was on ADHA. The country was divided into 32 EMEA-regions and in each region a purchasing agency, owned by the largest health insurance company in that area, was responsible for contracting health care. Contracted prices and quantities for the various products were the outcome of negotiations between providers and purchasing agencies, with prices being capped by the Dutch Healthcare Authority (NZa). Eligibility was determined by the Centre for Care Assessment (CIZ), an independent organization operating at the national level.
Total spending on EMEA rose from 2.9 percent in 1991 to 4.6 percent of GDP in 2005, making EMEA-care the fastest growing type of health care in terms of expenditures (CPB, 2005). This sharp increase was due partly to an ageing population and partly to purchasing agencies facing limited financial incentives to economize on health care expenditures. The latter was reflected by the fact that large providers within an EMEA-region were able to negotiate a price with the purchasing agency that was at (or very close to) the price cap in place at the time (see Mosca et al., 2010).
non-profit status acts as a quality signal thereby alleviating asymmetric information problems throughout the entire industry.
7
To curb this trend, the organization of ADHA was decentralized from the health care purchasing agencies to the municipal level with the passing of the social support act in 2007.9 One of the main goals of this decentralization was the reduction of ADHA costs by stimulating competition among health care providers and by improving the targeting of ADHA. A lump sum grant flowing from the national government compensated municipalities for this new task. The grant was unconditional and spending it on goods and services different from ADHA was explicitly allowed, which provided an incentive for municipalities to economize on ADHA expenditures.10
2.2 Competition policies in the local markets
One way for municipalities to economize on expenditures – and which is the focus of this paper – is the creation of competitive local markets, with the ultimate goal of lowering prices for ADHA. In order to stimulate entry of new providers, municipalities were obliged by law to purchase ADHA on behalf of their citizens via procurements and to grant at least two participants a contract. Irrespective of the procurement form, in order to stimulate competition on the market almost none of the municipalities included minimum turnover clauses in their contracts with providers.11 Given that users were free to choose their health care provider, the only way for suppliers to earn revenue was to become the most preferred provider for part of the user population within the municipality.
Another policy measure aimed at creating a more market-oriented environment was the opening up of the ADHA market for for-profit firms. Although this policy was implemented already in 2006, the entry of for-profit firms only gained full momentum in the years after decentralization. At the national level for-profit companies accounted for almost 50 percent of ADHA-provision in 2009 and for more than 60 percent in 2013.
2.3 Procurement procedures
Municipalities vary in the way they designed their procurement process for purchasing ADHA, with common methods used being scoring auctions and price-only auctions. In case of a scoring auction, interested market participants submit a tender which includes the price they require for delivery of ADHA and information about nonmonetary attributes (e.g. level of schooling of their employees). The municipality evaluates these tenders on the basis of a publicly announced ‘scoring rule’ – i.e. the relative weights attached to respectively price and nonmonetary attributes – and grants contracts to those suppliers with the most favorable weighted combination of price and quality indicators. In case of a price-only auction suppliers are ranked only on the basis of the submitted price.12
Another popular type of procurement is what we refer to as the ‘regulated price auction’, a form of price regulation where the municipality chooses a fixed price that is paid to every provider and where interested market parties that comply with a minimum quality threshold are granted a 9 In 2007, there were 443 municipalities in the Netherlands with an average size of about 40.000 citizens. The 32 EMEA-regions consisted of about half a million people on average. 10 The size of the grant is based on population characteristics, except for the first year of decentralization. In this year the grant was based on expenditures by health care purchasing agencies within municipality boundaries in 2005. 11 By contrast, under the EMEA health care purchasing agencies typically guaranteed incumbents a minimal turnover equal to 90 percent of turnover in the previous year. 12 What is interesting to note here is that the municipality typically selected more than one provider, which is rather uncommon for other goods and services purchased by the public sector via scoring or price-only auctions (see also Asker and Cantillon, 2008).
8
contract. As we are interested in whether market concentration has an impact on the price setting behavior of providers, we only use data originating from scoring and price-only auctions.13
2.4 Eligibility and user fees
As of 2007 municipalities have also become responsible for determining the eligibility for ADHA of their citizens. This can be seen as another instrument available to municipalities to influence usage and expenditures. National guidelines assist them in this process, although the only legal requirement is that municipalities ‘adequately compensate’ households that cannot fulfill daily housekeeping activities. Eligible households then can choose for in-kind delivery by pre-selected suppliers in their region. Otherwise, they could ask for a cash-benefit and contract a supplier of their choice.14 Many municipalities have curtailed their ADHA expenditures by replacing assessments for more expensive advanced ADHA by assessments for cheaper basic ADHA: while in 2007 the share of basic ADHA in total ADHA use was around 30 percent, this share rose to almost 80 percent in 2013 (see also the Data Section).
Yet another potential policy instrument to control the expenditures on ADHA are user fees. Municipalities are bounded by two restrictions when it comes to charging user fees: (a) the per hour user fee cannot exceed the price municipalities pay to the supplier and (b) the total per period user fee is not allowed to surpass a user-specific, per-period payment cap, which varies with income and household composition. In the years under analysis two-thirds of users were charged their maximum user fee. On average municipalities covered only about 20 percent of ADHA expenditures by user fees. Moreover, almost none of the municipalities departed from the directive for charging user fees set at the national level.15 This implies that municipalities did not actively employ user fees as a means to curb their spending on ADHA.
3. Empirical strategy 3.1 Market definition
We identify to what extent large ADHA-providers have the ability to exercise market power in the form of obtaining higher prices than do small suppliers. Concerning our empirical strategy, a first thing to note is that due to the nature of ADHA – a long-term care service delivered at home – a user’s choice for a specific provider does not depend on the travelling distance to the provider’s location. This also implies that we do not have to deal with the difficulties in defining the geographic
13 We have estimated our main specification for suppliers active in municipalities using regulated price auctions and, as expected, did not reject the null hypothesis of a non-relationship between market share and price. Results are available upon request. 14 We only observe prices contracted by municipalities for in-kind delivery. Municipalities also have the option to offer cash benefit to users, whom in turn can purchase ADHA on their own (possibly from providers which have not been contracted by the municipality). On average, the cash benefit equals about 75 percent of the in-kind ADHA expenditures a patient is eligible for (Botter, 2010). Thus providing a cash benefit is cheaper for municipalities, although they cannot control the quality of suppliers who are hired using cash benefits. This refrains them from using them on a large scale (VNG, 2011). A small minority (0.14 promille of the population) uses a cash benefit to buy ADHA. The use of cash benefits for ADHA does not vary with the incentive to economize on ADHA (Kattenberg and Vermeulen, 2017). 15 See van Eijkel et al.(2017).
9
boundaries that typically come with analyzing health care products that are delivered at the provider’s facilities.16
Therefore, our definition of the relevant geographic market is straightforward: as in-kind users can only choose from among those providers that are contracted by the municipality, we assume that each individual municipality comprises a single geographic market. We maintain this definition in case the municipality opted for a collaborative procurement with neighboring municipalities. The reason for this is that in almost all of these collaborative procurements, the individual municipalities chose their own selection criteria. As a result, there are notable differences in prices and supplier constellations among municipalities that collaborated in the procurement process.17
Concerning the product market definition, we focus on basic ADHA in our main specifications. An important reason for this is that in our sample period the bulk of ADHA provided was of basic form. Another rationale for focusing on basic ADHA is that the quality differences among providers are expected to be smaller for this type of health care services than for advanced ADHA. While our data allows us to control for time-invariant and location-invariant quality differences among providers, quality differences between municipalities or over time for an individual supplier would lead to estimation bias. These quality differences are more likely to appear for advanced ADHA, as there are notable differences in the product definition of this type of ADHA between municipalities and within the same municipality over time. However, the results obtained for advanced ADHA turn out be very similar to the results for basic ADHA and are discussed in Section 6 (Robustness checks).
3.2 Main specification
With our definitions of the geographic market and product market at hand, we study the presence of market power in the local markets for ADHA. We follow the bulk of the health economics literature on market power by adopting a reduced-form approach. The main specification to be estimated reads:
log (𝑝𝑝𝑖𝑖,𝑗𝑗,𝑡𝑡) = 𝛽𝛽𝑚𝑚𝑚𝑚𝑖𝑖,𝑗𝑗,𝑡𝑡 + 𝑠𝑠𝑖𝑖 + 𝑦𝑦𝑡𝑡 + 𝑚𝑚𝑗𝑗 + 𝜀𝜀𝑖𝑖,𝑗𝑗,𝑡𝑡 (1)
where 𝑝𝑝𝑖𝑖,𝑗𝑗,𝑡𝑡 and 𝑚𝑚𝑚𝑚𝑖𝑖,𝑗𝑗,𝑡𝑡 are, respectively, the price supplier i receives for delivering one hour of basic ADHA and his market share in municipality j in year t. Supplier, year, and municipality fixed effects are denoted by 𝑠𝑠𝑖𝑖, 𝑦𝑦𝑡𝑡 , 𝑚𝑚𝑗𝑗. 𝜀𝜀𝑖𝑖,𝑗𝑗,𝑡𝑡 refers to the statistical error term. Given that the dependent variable is defined in log terms, 𝛽𝛽 yields the percentage change in the price due to a one percentage point change in market share.
A first important issue with the reduced-form approach is that it delivers results that are typically prone to omitted variables bias. Note that most studies in this field use a measure for the degree of market concentration and estimate its relation with a particular market outcome – typically price or some quality indicator. This also means that the level of aggregation of the analysis is usually the overall market level, as most researchers use a market-wide measure for the degree of
16 See e.g. Kessler and McClellan (2000) for a discussion on this issue and a method to deal with this. 17 We have tested whether large municipalities or municipalities in a collaborative procurement possess buyer power, i.e. are able to purchase ADHA at a lower price than small municipalities do. We do not find evidence for this in our data. See van Eijkel et al. (2017).

10
concentration.18 Then, in case price is the market outcome of interest the researcher needs to compute a ‘market price’ out of the different prices that prevail on the market – unless it concerns a fully homogeneous good or service for which all suppliers receive an identical price. This leads to estimation bias if one does not control for confounding factors that both drive market shares and prices. For instance, a provider who has a cost advantage likely obtains a large market share at a relatively moderate price. Performing a least squares regression of the average market price on the degree of market concentration would then not properly reflect the impact of concentration on prices.
Due to the institutional setting in the Netherlands – more than 400 municipalities purchasing ADHA for their local citizens thereby creating more than 400 local markets – we are able to address this issue in an adequate manner. Since many of the suppliers included in our data set are active in more than one municipality during various years, we can control for time-invariant differences among providers by including supplier fixed effects. In this way, we limit the estimation bias stemming from confounding variables like cost or quality heterogeneity among firms. Given the relatively short time span of our sample period (2009-2013), it is reasonable to assume that the supplier fixed effects control for most of the unobserved heterogeneity across providers.
3.3 Instrument to control for reverse causality
The reduced form-approach potentially also suffers from reverse causality bias, as it lacks, at least from a theoretical perspective, a clear causal link between market share and price. Both variables are endogenous to the market process, which implies they are determined simultaneously in equilibrium. Concerning such potential bias in our estimations, note that in the years under analysis two-thirds of users were charged their maximum user fee. We thus expect that users do not respond much to variation in prices, restricting the impact of prices on market shares. On the other hand, municipalities might have an incentive to convince their citizens to choose the lowest-priced provider which introduces a possible feedback effect of prices on market share. 19 Not controlling for this could then result in an underestimation of the true effect, as the feedback effect runs counter to the expected effect of market share on price.
In order to control for this potential endogeneity bias, we pursue an instrumental variables approach. Particularly, we adopt the suppliers’ local market shares in the very first month after the decentralization as an instrument for current market share in the municipality (we assign the value zero to providers that were not active in the municipality at that time). The validity of the instrument relies on the fact that this period can be seen as a mere transition phase, wherein existing users retained the right to receive ADHA from the very same provider that also provided these services
18 The method introduced by Kessler and McClellan (2000) allows the researcher to compute provider-specific (predicted) Herfindahl indices, based on a logit model that uses observables –mainly travelling distance – to predict patient flows in hospital markets. Given that in our paper travelling distance does not play a role in the market under analysis, we abstain from using this method here. 19 From conversations with people working in the field we know that in some cases it is the local policy maker who picks a provider on behalf of the user, for example when the user is indifferent or cannot make a sound judgement himself.
11
before the decentralization. The January ’07 market shares can thus be seen as exogenous to market outcomes in the years after decentralization.20
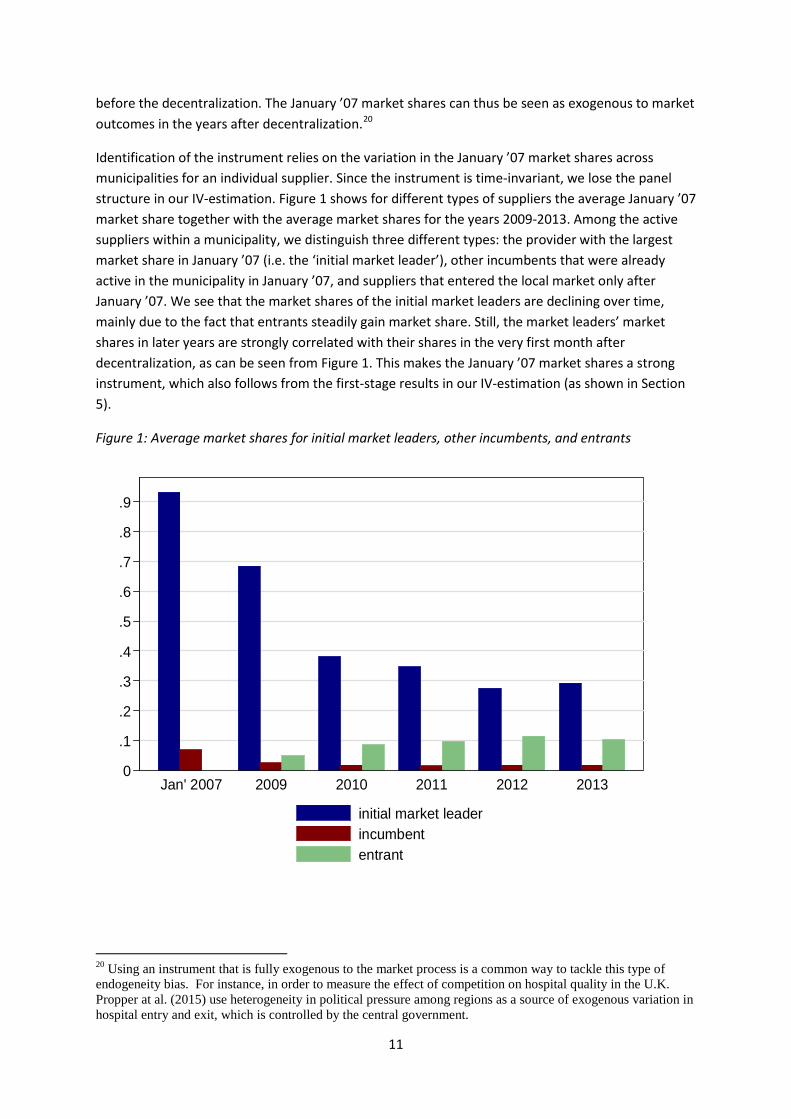
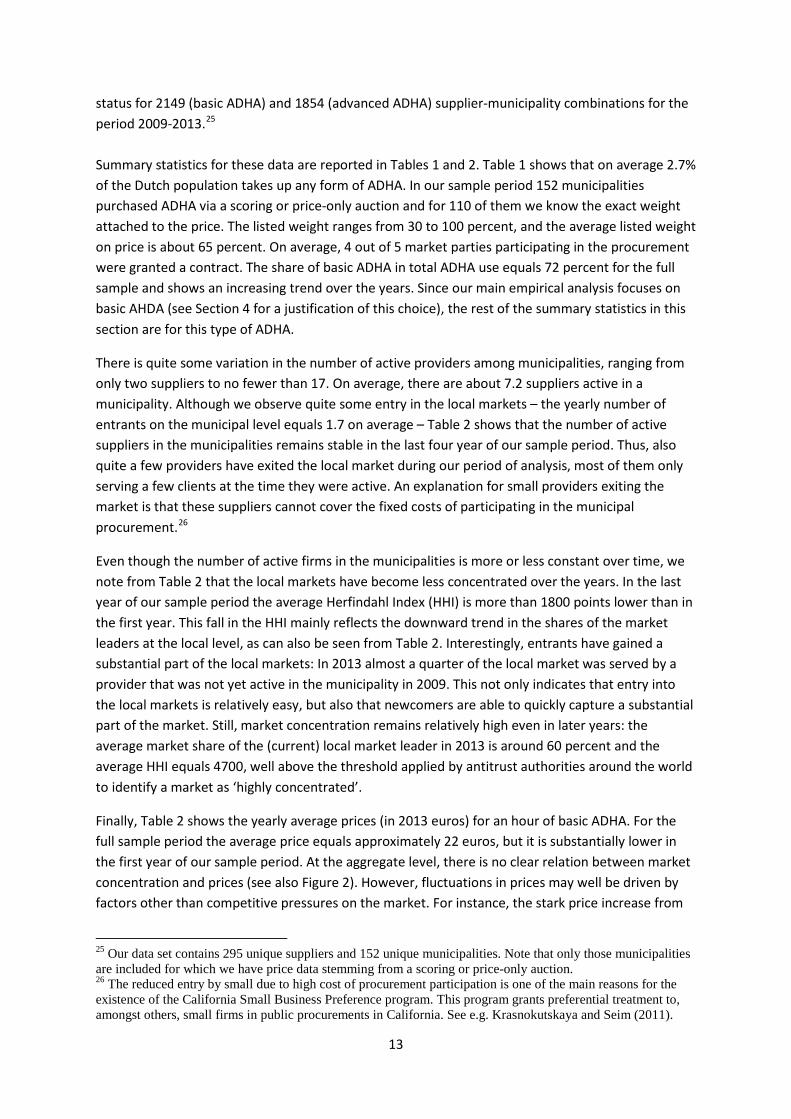
Identification of the instrument relies on the variation in the January ’07 market shares across municipalities for an individual supplier. Since the instrument is time-invariant, we lose the panel structure in our IV-estimation. Figure 1 shows for different types of suppliers the average January ’07 market share together with the average market shares for the years 2009-2013. Among the active suppliers within a municipality, we distinguish three different types: the provider with the largest market share in January ’07 (i.e. the ‘initial market leader’), other incumbents that were already active in the municipality in January ’07, and suppliers that entered the local market only after January ’07. We see that the market shares of the initial market leaders are declining over time, mainly due to the fact that entrants steadily gain market share. Still, the market leaders’ market shares in later years are strongly correlated with their shares in the very first month after decentralization, as can be seen from Figure 1. This makes the January ’07 market shares a strong instrument, which also follows from the first-stage results in our IV-estimation (as shown in Section 5).
Figure 1: Average market shares for initial market leaders, other incumbents, and entrants
20 Using an instrument that is fully exogenous to the market process is a common way to tackle this type of endogeneity bias. For instance, in order to measure the effect of competition on hospital quality in the U.K. Propper at al. (2015) use heterogeneity in political pressure among regions as a source of exogenous variation in hospital entry and exit, which is controlled by the central government.
0
.1
.2
.3
.4
.5
.6
.7
.8
.9
Jan' 2007 2009 2010 2011 2012 2013
initial market leaderincumbententrant
12
4. Data
Our period of analysis is 2009-2013. The data used for our analysis are drawn from various sources. First of all, yearly data on the number of hours of home care type – basic ADHA and advanced ADHA – delivered by each provider in a given municipality are collected by the Central Administration Agency (CAK), which is a government agency that collects the user fees on behalf of the municipalities. The CAK data also contain market shares for the first four weeks of 2007, which we use to construct our instrumental variable.
Price data is obtained from a yearly survey performed by The Netherlands Institute for Social Research (SCP). The average response rate in these years is 63.8 percent (792 municipality-year observations). Importantly, 59.5 percent of all Dutch municipalities indicated that the price they pay for ADHA equals the user fee per hour administered by CAK – which is included in the data set we obtained from CAK. In order to minimize the risk of measurement error, we only use price data from these municipalities.21 The set of municipalities for which we have price data is representative for the total population of Dutch municipalities in terms of the number of citizens, ADHA user rate and degree of competition (measured by the Herfindahl index). Data on the form of procurement chosen by the municipality is partly obtained from a Dutch website where both the national government and local governments can announce an upcoming procurement.22 Detailed information on the procurement process and contract features are typically published on this website. These procurement data have been augmented by data from Significant B.V., a Dutch consultancy that in 2010, on behalf of the Ministry of Health, Welfare and Sport (VWS), held a survey among municipalities on the features of the procurement procedure within the municipality.23
Finally, information about the legal status of individual providers is obtained from the website of the Dutch Chamber of Commerce (KvK). Based on this source we classify a provider as non-profit if the legal form is a foundation or cooperation. A supplier is classified as for-profit if its legal form is a private or limited liability company.24 Since we collected this information only in June 2017 and the KvK website only gives the provider’s current ownership type, we cannot be sure that the legal status found coincides with the provider’s legal status during our sample period. However, using annual reports from the period 2009-2013 we verify that the ten largest suppliers in our dataset – providing over 60 percent of total ADHA use in the Netherlands – did not change ownership type. Combining these data sources results in an unbalanced panel with the market share, price and legal
21 The remaining 4.3 percent of the municipalities in this survey reports the price they paid to each individual supplier, which differs from the price administered by CAK and is therefore prone to response bias. 22 www.aanbestedingskalender.nl. 23 A few observations in our procurement data are inconsistent with our price data, i.e. a municipality reporting that it employed a regulated price auction while we do observe price variation among suppliers in the municipality. In those cases, we overrule the procurement data and assume that the municipality applied a scoring or price-only auction. 24 In a few cases the legal form is a mixture of both, for instance a private entity being a subsidiary of a foundation. In these cases, we assume that the ADHA-provider is for-profit as long as the subsidiary has a for-profit status as we expect pricing decisions to be taken at the subsidiary level.
13
status for 2149 (basic ADHA) and 1854 (advanced ADHA) supplier-municipality combinations for the period 2009-2013.25 Summary statistics for these data are reported in Tables 1 and 2. Table 1 shows that on average 2.7% of the Dutch population takes up any form of ADHA. In our sample period 152 municipalities purchased ADHA via a scoring or price-only auction and for 110 of them we know the exact weight attached to the price. The listed weight ranges from 30 to 100 percent, and the average listed weight on price is about 65 percent. On average, 4 out of 5 market parties participating in the procurement were granted a contract. The share of basic ADHA in total ADHA use equals 72 percent for the full sample and shows an increasing trend over the years. Since our main empirical analysis focuses on basic AHDA (see Section 4 for a justification of this choice), the rest of the summary statistics in this section are for this type of ADHA.
There is quite some variation in the number of active providers among municipalities, ranging from only two suppliers to no fewer than 17. On average, there are about 7.2 suppliers active in a municipality. Although we observe quite some entry in the local markets – the yearly number of entrants on the municipal level equals 1.7 on average – Table 2 shows that the number of active suppliers in the municipalities remains stable in the last four year of our sample period. Thus, also quite a few providers have exited the local market during our period of analysis, most of them only serving a few clients at the time they were active. An explanation for small providers exiting the market is that these suppliers cannot cover the fixed costs of participating in the municipal procurement.26
Even though the number of active firms in the municipalities is more or less constant over time, we note from Table 2 that the local markets have become less concentrated over the years. In the last year of our sample period the average Herfindahl Index (HHI) is more than 1800 points lower than in the first year. This fall in the HHI mainly reflects the downward trend in the shares of the market leaders at the local level, as can also be seen from Table 2. Interestingly, entrants have gained a substantial part of the local markets: In 2013 almost a quarter of the local market was served by a provider that was not yet active in the municipality in 2009. This not only indicates that entry into the local markets is relatively easy, but also that newcomers are able to quickly capture a substantial part of the market. Still, market concentration remains relatively high even in later years: the average market share of the (current) local market leader in 2013 is around 60 percent and the average HHI equals 4700, well above the threshold applied by antitrust authorities around the world to identify a market as ‘highly concentrated’.
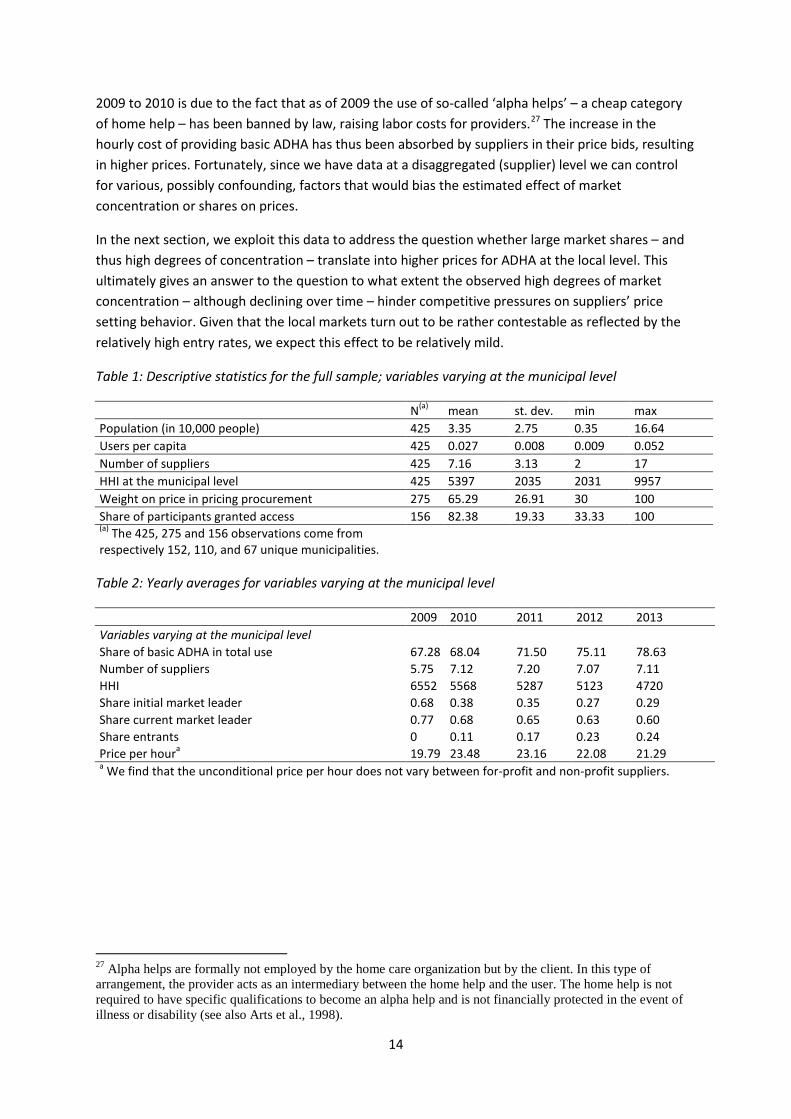
Finally, Table 2 shows the yearly average prices (in 2013 euros) for an hour of basic ADHA. For the full sample period the average price equals approximately 22 euros, but it is substantially lower in the first year of our sample period. At the aggregate level, there is no clear relation between market concentration and prices (see also Figure 2). However, fluctuations in prices may well be driven by factors other than competitive pressures on the market. For instance, the stark price increase from
25 Our data set contains 295 unique suppliers and 152 unique municipalities. Note that only those municipalities are included for which we have price data stemming from a scoring or price-only auction. 26 The reduced entry by small due to high cost of procurement participation is one of the main reasons for the existence of the California Small Business Preference program. This program grants preferential treatment to, amongst others, small firms in public procurements in California. See e.g. Krasnokutskaya and Seim (2011).
14
2009 to 2010 is due to the fact that as of 2009 the use of so-called ‘alpha helps’ – a cheap category of home help – has been banned by law, raising labor costs for providers.27 The increase in the hourly cost of providing basic ADHA has thus been absorbed by suppliers in their price bids, resulting in higher prices. Fortunately, since we have data at a disaggregated (supplier) level we can control for various, possibly confounding, factors that would bias the estimated effect of market concentration or shares on prices.
In the next section, we exploit this data to address the question whether large market shares – and thus high degrees of concentration – translate into higher prices for ADHA at the local level. This ultimately gives an answer to the question to what extent the observed high degrees of market concentration – although declining over time – hinder competitive pressures on suppliers’ price setting behavior. Given that the local markets turn out to be rather contestable as reflected by the relatively high entry rates, we expect this effect to be relatively mild.
Table 1: Descriptive statistics for the full sample; variables varying at the municipal level
N(a) mean st. dev. min max Population (in 10,000 people) 425 3.35 2.75 0.35 16.64 Users per capita 425 0.027 0.008 0.009 0.052 Number of suppliers 425 7.16 3.13 2 17 HHI at the municipal level 425 5397 2035 2031 9957 Weight on price in pricing procurement 275 65.29 26.91 30 100 Share of participants granted access 156 82.38 19.33 33.33 100 (a) The 425, 275 and 156 observations come from respectively 152, 110, and 67 unique municipalities.
Table 2: Yearly averages for variables varying at the municipal level
2009 2010 2011 2012 2013 Variables varying at the municipal level Share of basic ADHA in total use 67.28 68.04 71.50 75.11 78.63 Number of suppliers 5.75 7.12 7.20 7.07 7.11 HHI 6552 5568 5287 5123 4720 Share initial market leader 0.68 0.38 0.35 0.27 0.29 Share current market leader 0.77 0.68 0.65 0.63 0.60 Share entrants 0 0.11 0.17 0.23 0.24 Price per houra 19.79 23.48 23.16 22.08 21.29 a We find that the unconditional price per hour does not vary between for-profit and non-profit suppliers.
27 Alpha helps are formally not employed by the home care organization but by the client. In this type of arrangement, the provider acts as an intermediary between the home help and the user. The home help is not required to have specific qualifications to become an alpha help and is not financially protected in the event of illness or disability (see also Arts et al., 1998).
15
Figure 2: Yearly averages for HHI and prices per hour
5. Results
5.1 Full sample results
We firstly estimate Equation (1) by Ordinary Least Squares (OLS); the results are found in the first three columns in Table 3, where an additional fixed effect is added to the specification when moving one column to the right. All three specifications paint a similar picture: there is a significant positive relation between a supplier’s market share and the price received in the municipality. Our preferred OLS-specification (3) tells us that the average market leader in a municipality, possessing a market share of 65 percent, secures a price that is 2.5 (0.0388 x 65) percent above the price of an atomistic provider. Note that, as expected, the estimated coefficient on market share is somewhat lower in case we include supplier fixed effects (Column 3): part of the price differences between providers is driven by time-invariant supplier-specific characteristics, for instance differences in quality or cost of provision.
The results from IV estimation using January ’07 market shares as instrument are reported in Table 3, column (4). The regression results show that this variable is indeed a relevant instrument: the first stage estimate is highly significant and the Kleibergen-Paap F-statistic is well above the critical value to detect weak instruments. The second stage of the IV-estimation indicates that the average market leader receives a price that exceeds the price for an atomistic supplier by 2.1 percent (65*0.0328). The estimated effect is still significant at conventional levels and not significantly different from the OLS-estimate. The endogeneity bias stemming from reversed causality turns out to be small, which is in line with the notion that (at the margin) most users are not exposed to price differences among providers.
How do these results translate to the effects of the degree of concentration on the average price at the market level? Consider a local market in which initially the market leader serves 65 percent of
16
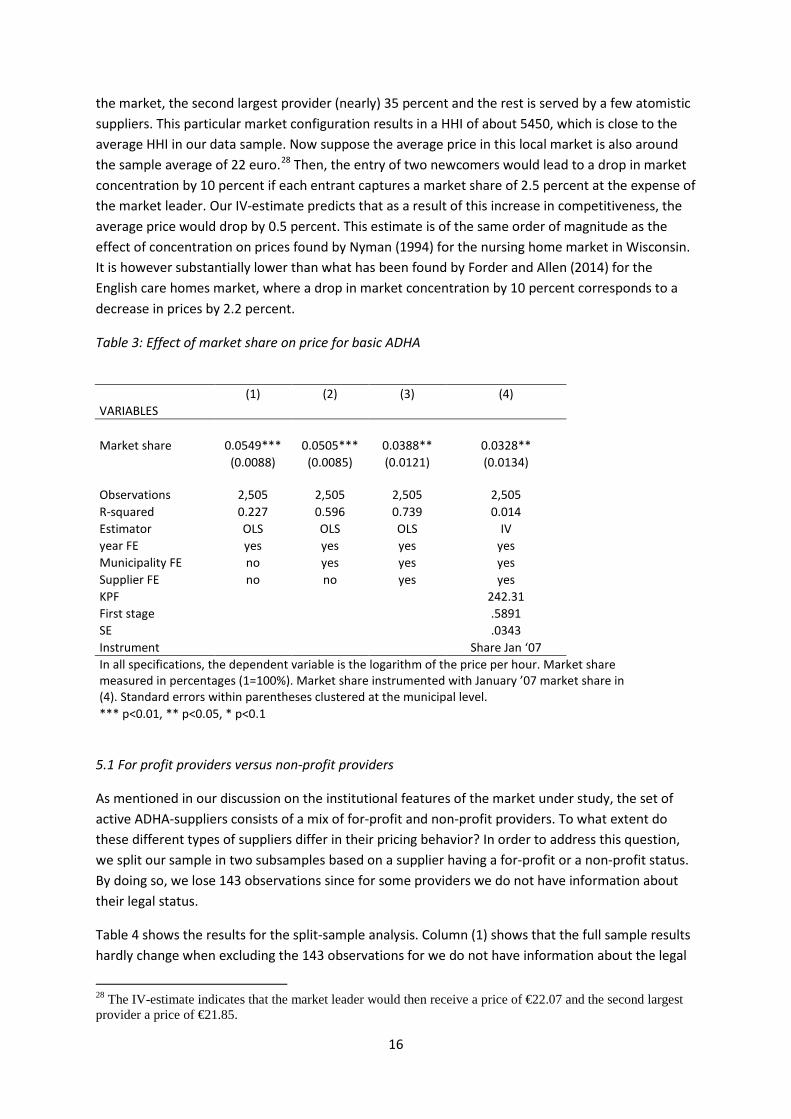
the market, the second largest provider (nearly) 35 percent and the rest is served by a few atomistic suppliers. This particular market configuration results in a HHI of about 5450, which is close to the average HHI in our data sample. Now suppose the average price in this local market is also around the sample average of 22 euro.28 Then, the entry of two newcomers would lead to a drop in market concentration by 10 percent if each entrant captures a market share of 2.5 percent at the expense of the market leader. Our IV-estimate predicts that as a result of this increase in competitiveness, the average price would drop by 0.5 percent. This estimate is of the same order of magnitude as the effect of concentration on prices found by Nyman (1994) for the nursing home market in Wisconsin. It is however substantially lower than what has been found by Forder and Allen (2014) for the English care homes market, where a drop in market concentration by 10 percent corresponds to a decrease in prices by 2.2 percent.
Table 3: Effect of market share on price for basic ADHA
(1) (2) (3) (4) VARIABLES Market share 0.0549*** 0.0505*** 0.0388** 0.0328**
(0.0088) (0.0085) (0.0121) (0.0134)
Observations 2,505 2,505 2,505 2,505 R-squared 0.227 0.596 0.739 0.014 Estimator OLS OLS OLS IV year FE yes yes yes yes Municipality FE no yes yes yes Supplier FE no no yes yes KPF
242.31
First stage
.5891 SE .0343 Instrument Share Jan ‘07 In all specifications, the dependent variable is the logarithm of the price per hour. Market share measured in percentages (1=100%). Market share instrumented with January ’07 market share in (4). Standard errors within parentheses clustered at the municipal level. *** p<0.01, ** p<0.05, * p<0.1
5.1 For profit providers versus non-profit providers
As mentioned in our discussion on the institutional features of the market under study, the set of active ADHA-suppliers consists of a mix of for-profit and non-profit providers. To what extent do these different types of suppliers differ in their pricing behavior? In order to address this question, we split our sample in two subsamples based on a supplier having a for-profit or a non-profit status. By doing so, we lose 143 observations since for some providers we do not have information about their legal status.
Table 4 shows the results for the split-sample analysis. Column (1) shows that the full sample results hardly change when excluding the 143 observations for we do not have information about the legal
28 The IV-estimate indicates that the market leader would then receive a price of €22.07 and the second largest provider a price of €21.85.
17
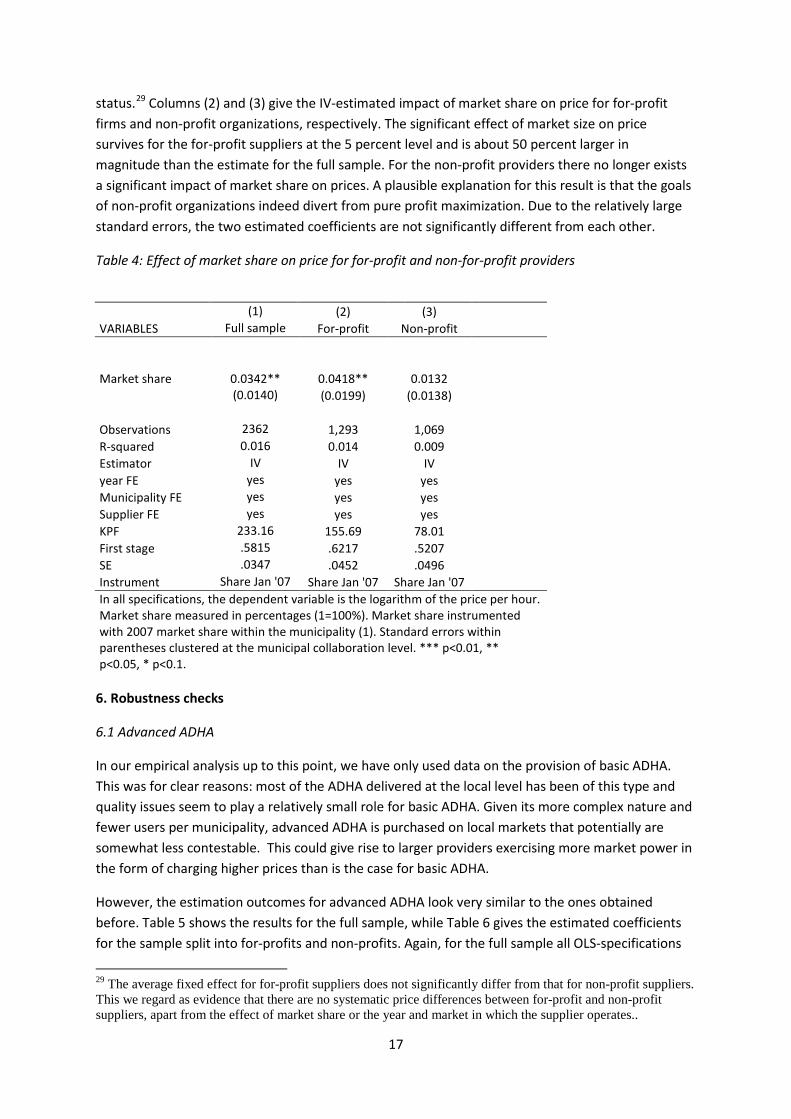
status.29 Columns (2) and (3) give the IV-estimated impact of market share on price for for-profit firms and non-profit organizations, respectively. The significant effect of market size on price survives for the for-profit suppliers at the 5 percent level and is about 50 percent larger in magnitude than the estimate for the full sample. For the non-profit providers there no longer exists a significant impact of market share on prices. A plausible explanation for this result is that the goals of non-profit organizations indeed divert from pure profit maximization. Due to the relatively large standard errors, the two estimated coefficients are not significantly different from each other.
Table 4: Effect of market share on price for for-profit and non-for-profit providers
(1) (2) (3) VARIABLES Full sample For-profit Non-profit
Market share
0.0342** 0.0418** 0.0132
(0.0140) (0.0199) (0.0138)
Observations 2362 1,293 1,069 R-squared 0.016 0.014 0.009 Estimator IV IV IV year FE yes yes yes Municipality FE yes yes yes Supplier FE yes yes yes KPF 233.16 155.69 78.01 First stage .5815 .6217 .5207 SE .0347 .0452 .0496 Instrument Share Jan '07 Share Jan '07 Share Jan '07
In all specifications, the dependent variable is the logarithm of the price per hour. Market share measured in percentages (1=100%). Market share instrumented with 2007 market share within the municipality (1). Standard errors within parentheses clustered at the municipal collaboration level. *** p<0.01, ** p<0.05, * p<0.1.
6. Robustness checks
6.1 Advanced ADHA
In our empirical analysis up to this point, we have only used data on the provision of basic ADHA. This was for clear reasons: most of the ADHA delivered at the local level has been of this type and quality issues seem to play a relatively small role for basic ADHA. Given its more complex nature and fewer users per municipality, advanced ADHA is purchased on local markets that potentially are somewhat less contestable. This could give rise to larger providers exercising more market power in the form of charging higher prices than is the case for basic ADHA.
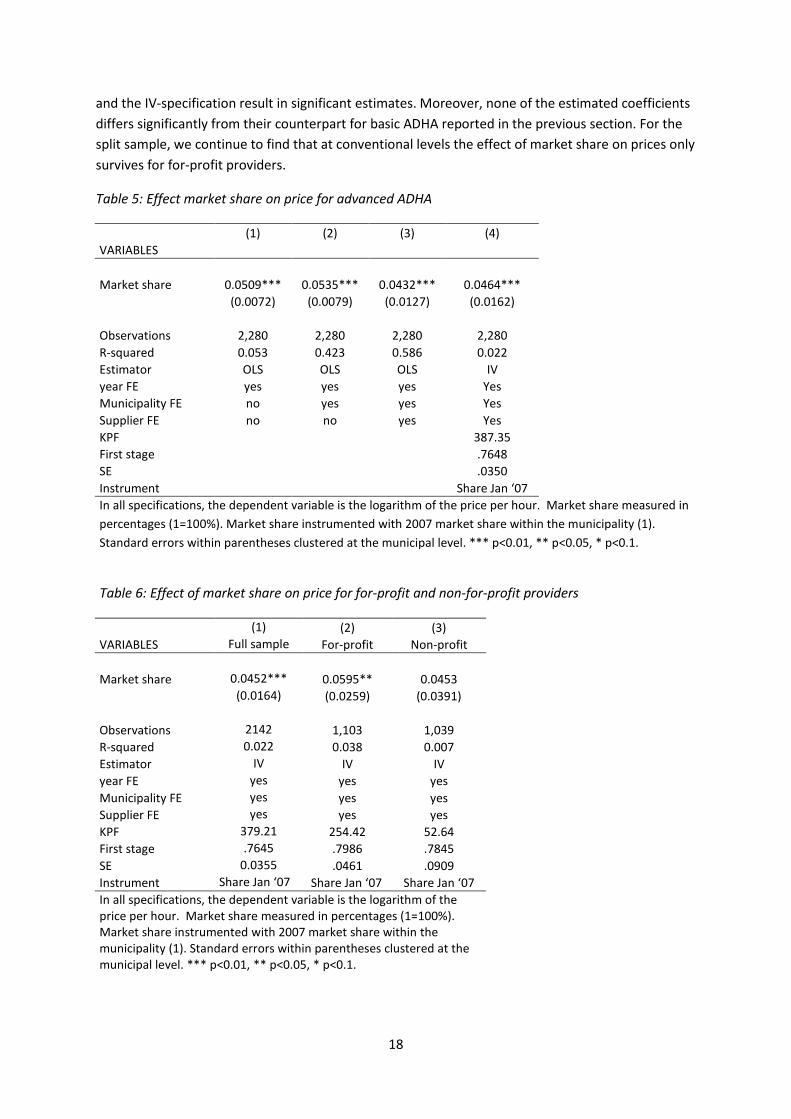
However, the estimation outcomes for advanced ADHA look very similar to the ones obtained before. Table 5 shows the results for the full sample, while Table 6 gives the estimated coefficients for the sample split into for-profits and non-profits. Again, for the full sample all OLS-specifications
29 The average fixed effect for for-profit suppliers does not significantly differ from that for non-profit suppliers. This we regard as evidence that there are no systematic price differences between for-profit and non-profit suppliers, apart from the effect of market share or the year and market in which the supplier operates..
18
and the IV-specification result in significant estimates. Moreover, none of the estimated coefficients differs significantly from their counterpart for basic ADHA reported in the previous section. For the split sample, we continue to find that at conventional levels the effect of market share on prices only survives for for-profit providers.
Table 5: Effect market share on price for advanced ADHA
(1) (2) (3) (4) VARIABLES Market share 0.0509*** 0.0535*** 0.0432*** 0.0464***
(0.0072) (0.0079) (0.0127) (0.0162)
Observations 2,280 2,280 2,280 2,280 R-squared 0.053 0.423 0.586 0.022 Estimator OLS OLS OLS IV year FE yes yes yes Yes Municipality FE no yes yes Yes Supplier FE no no yes Yes KPF
387.35
First stage
.7648 SE .0350 Instrument Share Jan ‘07 In all specifications, the dependent variable is the logarithm of the price per hour. Market share measured in percentages (1=100%). Market share instrumented with 2007 market share within the municipality (1). Standard errors within parentheses clustered at the municipal level. *** p<0.01, ** p<0.05, * p<0.1.
Table 6: Effect of market share on price for for-profit and non-for-profit providers (1) (2) (3) VARIABLES Full sample For-profit Non-profit Market share 0.0452*** 0.0595** 0.0453
(0.0164) (0.0259) (0.0391)
Observations 2142 1,103 1,039 R-squared 0.022 0.038 0.007 Estimator IV IV IV year FE yes yes yes Municipality FE yes yes yes Supplier FE yes yes yes KPF 379.21 254.42 52.64 First stage .7645 .7986 .7845 SE 0.0355 .0461 .0909 Instrument Share Jan ‘07 Share Jan ‘07 Share Jan ‘07 In all specifications, the dependent variable is the logarithm of the price per hour. Market share measured in percentages (1=100%). Market share instrumented with 2007 market share within the municipality (1). Standard errors within parentheses clustered at the municipal level. *** p<0.01, ** p<0.05, * p<0.1.
19
6.2 Controlling for degree of market concentration
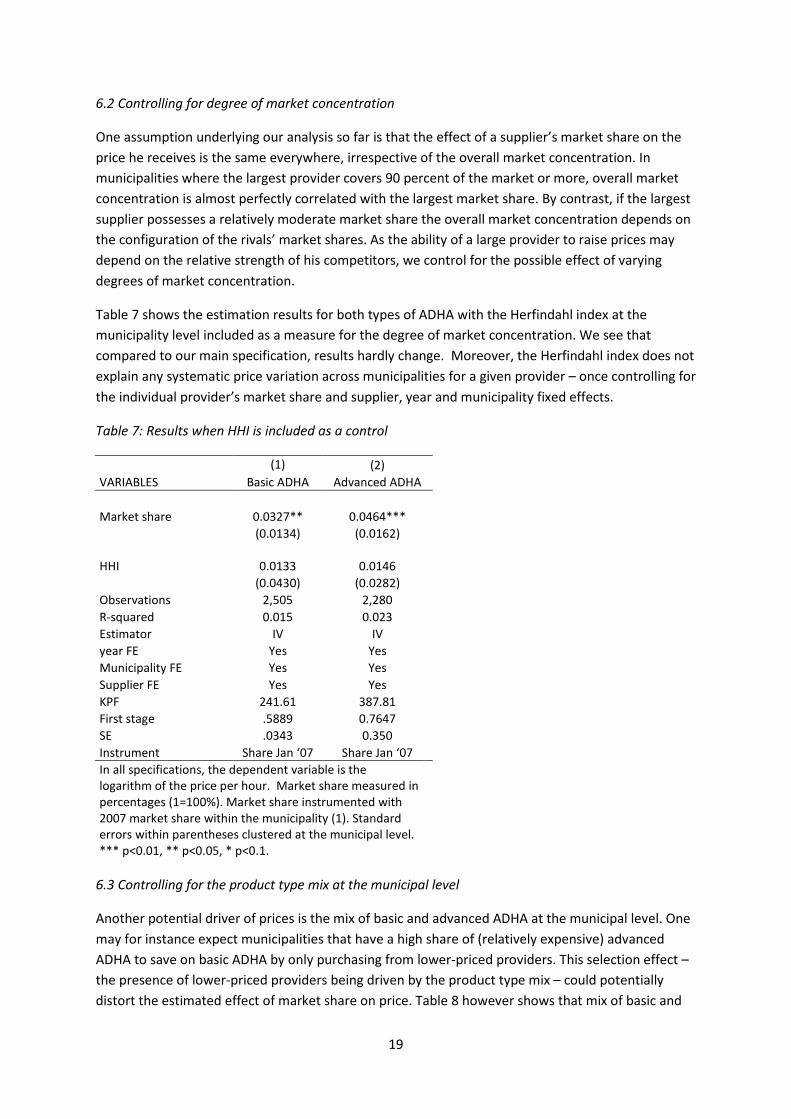
One assumption underlying our analysis so far is that the effect of a supplier’s market share on the price he receives is the same everywhere, irrespective of the overall market concentration. In municipalities where the largest provider covers 90 percent of the market or more, overall market concentration is almost perfectly correlated with the largest market share. By contrast, if the largest supplier possesses a relatively moderate market share the overall market concentration depends on the configuration of the rivals’ market shares. As the ability of a large provider to raise prices may depend on the relative strength of his competitors, we control for the possible effect of varying degrees of market concentration.
Table 7 shows the estimation results for both types of ADHA with the Herfindahl index at the municipality level included as a measure for the degree of market concentration. We see that compared to our main specification, results hardly change. Moreover, the Herfindahl index does not explain any systematic price variation across municipalities for a given provider – once controlling for the individual provider’s market share and supplier, year and municipality fixed effects.
Table 7: Results when HHI is included as a control
(1) (2) VARIABLES Basic ADHA Advanced ADHA Market share 0.0327** 0.0464***
(0.0134) (0.0162)
HHI
0.0133 0.0146
(0.0430) (0.0282) Observations 2,505 2,280 R-squared 0.015 0.023 Estimator IV IV year FE Yes Yes Municipality FE Yes Yes Supplier FE Yes Yes KPF 241.61 387.81 First stage .5889 0.7647 SE .0343 0.350 Instrument Share Jan ‘07 Share Jan ‘07
In all specifications, the dependent variable is the logarithm of the price per hour. Market share measured in percentages (1=100%). Market share instrumented with 2007 market share within the municipality (1). Standard errors within parentheses clustered at the municipal level. *** p<0.01, ** p<0.05, * p<0.1.
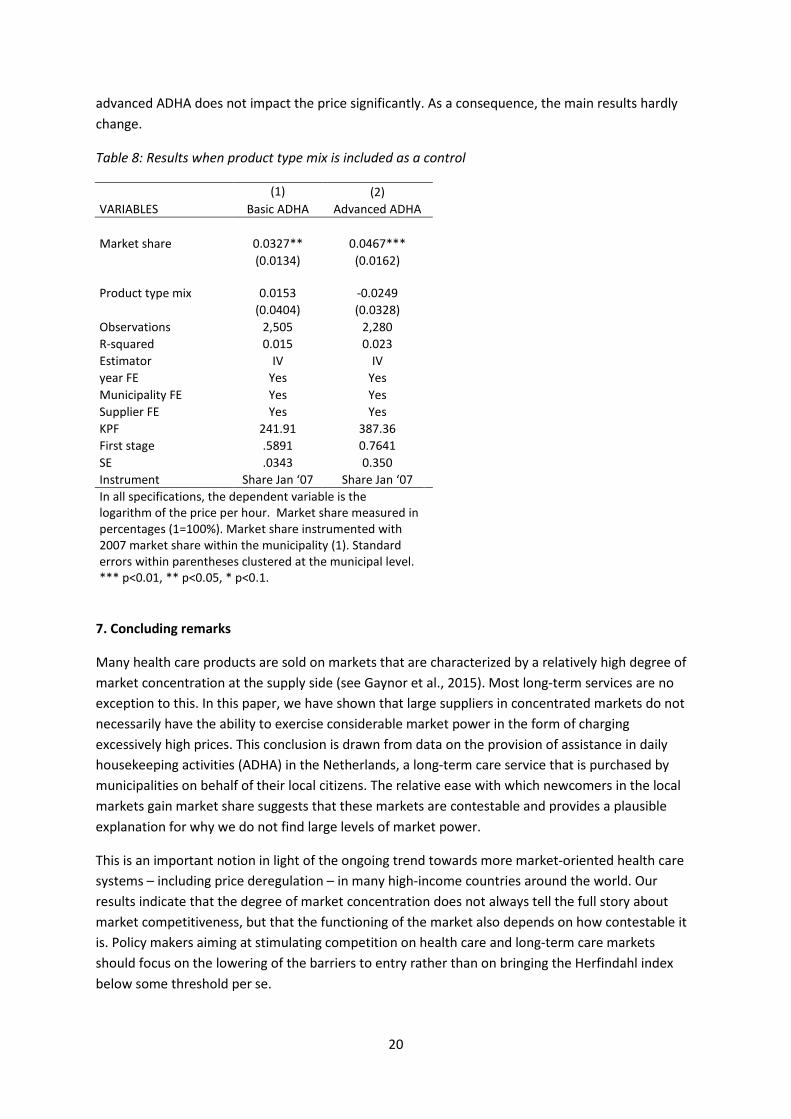
6.3 Controlling for the product type mix at the municipal level
Another potential driver of prices is the mix of basic and advanced ADHA at the municipal level. One may for instance expect municipalities that have a high share of (relatively expensive) advanced ADHA to save on basic ADHA by only purchasing from lower-priced providers. This selection effect – the presence of lower-priced providers being driven by the product type mix – could potentially distort the estimated effect of market share on price. Table 8 however shows that mix of basic and
20
advanced ADHA does not impact the price significantly. As a consequence, the main results hardly change.
Table 8: Results when product type mix is included as a control
(1) (2) VARIABLES Basic ADHA Advanced ADHA Market share 0.0327** 0.0467***
(0.0134) (0.0162)
Product type mix
0.0153 -0.0249
(0.0404) (0.0328) Observations 2,505 2,280 R-squared 0.015 0.023 Estimator IV IV year FE Yes Yes Municipality FE Yes Yes Supplier FE Yes Yes KPF 241.91 387.36 First stage .5891 0.7641 SE .0343 0.350 Instrument Share Jan ‘07 Share Jan ‘07
In all specifications, the dependent variable is the logarithm of the price per hour. Market share measured in percentages (1=100%). Market share instrumented with 2007 market share within the municipality (1). Standard errors within parentheses clustered at the municipal level. *** p<0.01, ** p<0.05, * p<0.1.
7. Concluding remarks
Many health care products are sold on markets that are characterized by a relatively high degree of market concentration at the supply side (see Gaynor et al., 2015). Most long-term services are no exception to this. In this paper, we have shown that large suppliers in concentrated markets do not necessarily have the ability to exercise considerable market power in the form of charging excessively high prices. This conclusion is drawn from data on the provision of assistance in daily housekeeping activities (ADHA) in the Netherlands, a long-term care service that is purchased by municipalities on behalf of their local citizens. The relative ease with which newcomers in the local markets gain market share suggests that these markets are contestable and provides a plausible explanation for why we do not find large levels of market power.
This is an important notion in light of the ongoing trend towards more market-oriented health care systems – including price deregulation – in many high-income countries around the world. Our results indicate that the degree of market concentration does not always tell the full story about market competitiveness, but that the functioning of the market also depends on how contestable it is. Policy makers aiming at stimulating competition on health care and long-term care markets should focus on the lowering of the barriers to entry rather than on bringing the Herfindahl index below some threshold per se.

21
To what extent does this conclusion generalize to long-term care markets in general? We note that home health care, including ADHA services, is a special type of long-term care services, as the provision of care takes place at the client’s home and often does not have a very complex nature. This makes it relatively easy for new market parties to enter in one or more local markets when they see a business opportunity. By contrast, the entry costs for providers of services like nursing care and residential youth care are typically substantially higher as these providers need to invest in capital (i.e. buildings) and acquire high-skilled workers to be able to deliver services at all. Hence, one cannot expect that for all long-term care services the same level of market contestability can be attained as for ADHA. Still, implementing measures that reduce the providers’ costs in the procurement process could be a way to lower barriers to entry in long-term care markets that are characterized by high natural entry barriers.
Our result on the difference in price setting behavior between for-profit and non-profit suppliers are relevant in a broad sense, probably even outside the health care sector. Our finding that non-profit organizations do not base their price-setting strategy on their market share gives empirical support for the idea that the goals of non-for-profits divert from the profit-maximizing objective. In concentrated health care markets that are characterized by high barriers to entry – and for which our finding on the pricing behavior of for-profit companies can be seen as a lower bound on the exercise of market power by this type of provider – facilitating the entry of non-profit organizations could be a way to curb prices increases within the health care sector. It is however important to note that such policies can have a long-lasting impact on the ownership composition at the supply side of the market, as was the case for the Hill-Burton program, a post-WWII legislation in the U.S. aimed at subsidizing non-for-profit and public hospitals.30
30 See Chung et al., 2016.

22
References
Anderson, G. F., Reinhardt, U. E., Hussey, P. S., & Petrosyan, V. (2003). It’s the prices, stupid: why the United States is so different from other countries. Health Affairs, 22(3), 89-105. Arts, S. E. J., Kerkstra, A., Huyer Abu-Saad, H., & van Der Zee, J. (1998). A job profile of home helps in the Netherlands. Health and Social Care in the Community, 6, 397-406. Asker, J., & Cantillon, E. (2008). Properties of scoring auctions. The RAND Journal of Economics, 39(1), 69-85. Bartlett, H. P., & Phillips, D. R. (1996). Policy issues in the private health sector: Examples from long-term care in the UK. Social Science & Medicine, 43(5), 731-737. Botter, F.M. P. (2010). Maatschappelijke Ondernemingen, naar een andere benadering van maatschappelijk ondernemen. Delft: Eburon. Besley, T., & Ghatak, M. (2005). Competition and incentives with motivated agents. The American Economic Review, 95(3), 616-636. Bresnahan, T. F. (1989). Empirical studies of industries with market power. Handbook of Industrial Organization, 2, 1011-1057. Chou, S. Y. (2002). Asymmetric information, ownership and quality of care: an empirical analysis of nursing homes. Journal of Health Economics, 21(2), 293-311.
Chung, A. P., Gaynor, M., & Richards-Shubik, S. (2016). Subsidies and structure: the lasting impact of the Hill-Burton program on the hospital industry. Review of Economics and Statistics, (0).
CPB (2005). Macro-Economische Verkenningen 2005, Centraal Planbureau.
Forder, J., & Allan, S. (2014). The impact of competition on quality and prices in the English care homes market. Journal of Health Economics, 34, 73-83.
Gaynor, M., & Town, R. (2012). Competition in Health Care Markets. Teoksessa Handbook of Health Economics, Vol. 2 (eds. McGuire T, Pauly M, Barros P): 499-637.
Gaynor, M., Ho, K., & Town, R. J. (2015). The industrial organization of health-care markets. Journal of Economic Literature, 53(2), 235-284.
Glendinning, C., & Moran, N. (2009). Reforming long-term care: recent lessons from other countries. Social Policy Research Unit, University of York.
Glaeser, E. L., & Shleifer, A. (2001). Not-for-profit entrepreneurs. Journal of Public Economics, 81(1), 99-115.
Grabowski, D. C., & Hirth, R. A. (2003). Competitive spillovers across non-profit and for-profit nursing homes. Journal of Health Economics, 22(1), 1-22.
23
Kattenberg, M.A.C. & Vermeulen, W. (2017). The stimulative effect of an unconditional block grant on the decentralized provision of care, International Tax Public Finance, doi:10.1007/s10797-017-9442-7.
Kessler, Daniel P., and Mark B. McClellan. "Is hospital competition socially wasteful?." The Quarterly Journal of Economics 115.2 (2000): 577-615. Kim, H., & Norton, E. C. (2015). Practice patterns among entrants and incumbents in the home health market after the prospective payment system was implemented. Health Economics, 24(S1), 118-131. Krasnokutskaya, E., & Seim, K. (2011). Bid preference programs and participation in highway procurement auctions. The American Economic Review, 101(6), 2653-2686. Lin, H. (2015). Quality choice and market structure: A dynamic analysis of nursing home oligopolies. International Economic Review, 56(4), 1261-1290. Martin, A., Lassman, D., Whittle, L., & Catlin, A. (2011). Recession contributes to slowest annual rate of increase in health spending in five decades. Health Affairs, 30, 111-122. Melnick, G., & Keeler, E. (2007). The effects of multi-hospital systems on hospital prices. Journal of Health Economics, 26(2), 400-413. Mosca, I., Pomp, M., & Shestalova, V. (2010). Market share and price in Dutch home care: Market power or quality?. De Economist, 158(1), 61-79. Nyman, J. A. (1994). The effects of market concentration and excess demand on the price of nursing home care. The Journal of Industrial Economics, 193-204. Pommer, E., Van der Torre, A., & Eggink, E. (2009). Definitief advies over het Wmo-budget huishoudelijke hulp voor 2009. Den Haag: Sociaal en Cultureel Planbureau. Van Eijkel, R., Van der Torre, A., Kattenberg, M.A.C. and Eggink, E. (2017). De markt voor huishoudelijke hulp, The Hague: Centraal Planbureau en Sociaal en Cultureel Planbureau. VNG (2011). Het PGB in de Wmo, nu en straks, Position paper Vereniging van Nederlandse Gemeenten. Van der Torre, A., Jansen, S. and Pommer, E. (2012) Advies voor het Wmo-budget huishoudelijke hulp voor 2012, The Hague: Sociaal en Cultureel Planbureau.

Publisher:
CPB Netherlands Bureau for Economic Policy Analysis P.O. Box 80510 | 2508 GM The HagueT (088) 984 60 00
February 2018