Embed Size (px)
Citation preview
1
Competition and Performance of Microfinance Institutions
Esubalew Assefa, Niels Hermes∗ and Aljar Meesters
Department of Economics, Econometrics and Finance
Faculty of Economics and Business
University of Groningen, the Netherlands
Abstract This paper examines the relationship between competition and the performance of
microfinance institutions (MFIs). We measure competition by constructing a Lerner
index. Next, we assess the association between increased competition among MFIs
on the one hand and outreach, loan repayment, efficiency and financial performance
on the other. The empirical investigation is based on data from 362 MFIs in 73
countries for the period 1995-2009. Based on our measure of competition we do find
a general trend of increased competition in microfinance during the last decade. Our
econometric analysis provides evidence that competition among MFIs is negatively
associated with various measures of performance.
JEL Codes: G21, L1, O16
Keywords: Microfinance Institutions, Competition, Financial Intermediation
∗ Corresponding author: Niels Hermes, Department of Economics, Econometrics and Finance,
Faculty of Economics and Business, University of Groningen, PO BOX 800, 9700 AV Groningen,
the Netherlands, telephone: +31-50-363 4863, fax: +31-50-363 7356, email: [email protected]
2
1. Introduction
During the last three decades, microfinance has captured the interest of both academics
and policy makers. The industry has been growing at a significant rate and in several
countries it has become an important sub-sector of the formal financial markets.
Especially during the past few years the growth of microfinance has been
unprecedented: during 2006-2008 annual growth rates amounted to 70-100 percent for a
number of countries (Sinah, 2010). The number of microfinance service providers has
also increased considerably. With the growth of the industry and the saturation of
markets, increased competition has been documented in many countries (Porteous,
2006). These recent developments do raise the question what impact increased
competition has on the financial and social performance of microfinance institutions
(MFIs). Research on this issue is important, especially because many countries have
started integrating microfinance into their poverty alleviation strategy. Understanding
the effects of competition can guide the design of policies which ensure benefits for the
poor as much as possible.
The literature on the consequences of increased competition for financial
institutions is ambiguous. On the one hand, it has been pointed out that a competitive
environment may contribute to lowering production costs and lower prices of goods and
services. Moreover, it may also encourage the development of new products and
efficient technologies (Motta, 2004). Similar benefits of competition may be expected
with respect to microfinance. On the other hand, however, several authors have pointed
3
out that competition in the financial/banking sector may have adverse effects, as it may
lead to lower borrower selection standards, to weakening of bank-customer
relationships and to multiple loan-taking and high defaults (see, e.g. Stiglitz, 2000; Boot,
2002; McIntosh and Wydick, 2005).
Although increased competition has become an important issue for the
microfinance industry, studies investigating its impact have remained limited in number.
The focus of this paper is to empirically investigate the association between increased
competition among MFIs and MFI performance. Specifically, it addresses: (1) whether
higher levels of competition are associated with higher/lower outreach in terms of the
number of clients served, as well as the poverty level of clients; (2) whether higher levels
of competition are associated with higher/lower default rates; and finally (3) whether
higher levels of competition are associated with higher/lower levels of efficiency and/or
better financial performance.
Our main contributions to the literature on the impact of competition on the
performance of MFIs are the following. First, we focus on the association between
competition and financial as well as social performance of MFIs. Second, we measure
competition for a large set of MFIs located in different countries, using the so-called
Lerner index. This index is a measure of the extent to which an institution has market
power. Although the Lerner index has been widely used in the banking literature, it has
not been applied to microfinance. We perform the analysis using a panel dataset
including information for 362 MFIs located in 73 countries for the period 1995-2009. The
results of our empirical investigation indicate that MFIs tend to have lower outreach
4
when faced with more intense competition. We also find that increased competition is
associated with lower levels of loan repayment, lower financial performance and lower
efficiency.
The remainder of this paper is organized as follows. Section 2 presents an
overview of the existing theoretical and empirical literature on the relationship between
competition and the performance of MFIs. Section 3 discusses the hypotheses we focus
on in the empirical analysis. In section 4 we present the methodology with respect to our
measure of competition, while in section 5 we discuss our empirical methodology. The
data we use in the analysis are discussed in section 6, after which we show the results of
the empirical investigation of the relationship between competition and the performance
of MFIs in section 7. Section 8 provides a summary and concluding remarks.
2. Competition and microfinance
In the early years of the development of microfinance, the idea of providing microloans
to the poor as a way to alleviate poverty mainly appealed to and attracted social
investors and non-government organizations (NGOs). Yet, over the years microfinance
has proven to be a successful, and even profitable, model of financial intermediation.
This has attracted increasing interest from commercially oriented providers of
microfinance, among which are also (international) commercial banks. Profit-oriented
MFIs thus have become increasingly important, which according to some observers has
also led to a change in focus of microfinance from being socially-oriented "poverty
lending” approach – focusing on reducing poverty through providing financial services
5
and funded mainly by donors, government subsidies and other concessional funds – to
an institution-oriented “financial systems” approach – focusing on commercially viable
financial intermediation to the poor with an emphasis on institutional financial self-
sufficiency (see, e.g., CGAP, 2001; Hulme and Arun, 2009; Cull et al., 2009a). Increased
competition among MFIs is one of the outcomes following the increasing role of profit-
oriented institutions and the change of status by NGOs from non-profit to profit making
(commercialized) institutions.
Before the commercialization of the microfinance business, many MFIs were
operating as monopolists (CGAP, 2001; McIntosh et al. 2005). In the literature on
competition, monopolistic market power has been associated with allocative and
technical inefficiencies, leading to welfare losses. Moreover, it does not provide
incentives to invest in efficient technology and introduce new products. In contrast,
increased competition among MFIs may contribute to well-functioning markets,
protection of consumers, promotion of allocative and technical efficiency, and the
provision of incentives to develop new products (Motta, 2004). In particular, it may
stimulate them to reduce costs and increase the efficiency of their operations by
improving the quality of their services in order to retain clients. Moreover, competitive
pressure from banks may stimulate MFIs to diversify their financial services to keep
clients or attract new ones. In particular, it may stimulate MFIs to offer saving accounts,
demand deposits and insurance. Based on these arguments, it may be argued that
increased competition in the microfinance business is expected to be beneficial as it
results in lower costs and interest rates, improved and new financial product designs
6
and better customer services. Moreover, with respect to outreach, it is argued that
financially sustainable MFIs are better able to cross-subsidize loans to poorer clients.
Thus, competition may also support improving outreach.
At the same time, however, one may question whether the above arguments hold
in the context of microfinance. One distinctive characteristic of the market for
microfinance is that transactions are based on the use of soft-information and strongly
depend on tight institution-client relationships. MFIs provide financial services to the
poor who are usually not considered creditworthy by traditional banks. These
institutions are able to solve problems of information asymmetry and provide loans
without collateral requirements. They do so by establishing strong personal
relationships with clients as well as by using other forms of collateral, such as group
lending, which generates social collateral.
Yet, in the presence of increased competition MFIs may be forced to search for
new clientele and/or sustain or increase market shares. At the same time, the increased
focus on cost efficiency may reduce efforts to monitor and screen new clients. This may
result in reducing the quality of their loan portfolio as they increasingly approve loans to
riskier borrowers (Vogelgesang, 2003). Consequently, repayment rates may fall, which
ultimately adversely affects efficiency levels. Moreover, increased competition makes it
easier for borrowers to take up multiple loans from different MFIs, leading to increasing
levels of indebtedness and repayment problems. The phenomenon of clients taking
multiple loans due to increased competition has been described in the literature by,
among others, Vogelgesang (2003) and McIntosh et al. (2005a and 2005b). Again,
7
reduced repayment rates lead to decreased financial performance, having adverse
consequences for the efficiency of MFIs. The pressure on reducing costs may also lead to
a reduced focus on outreach, since providing small loans to poorer clients is generally
more expensive than providing loans to better off clients.
As the above discussion makes clear, in theory the impact of competition on the
social and financial performance of MFIs may be either positive or negative. As the
outcome is not clear, this calls for an empirical investigation. Surprisingly, however,
only very few studies have examined the impact of competition on the performance of
MFIs. Some of them are descriptive, some use more thorough econometric techniques;
some look at impact directly, some take an indirect approach; some studies use country-
or region-specific data, some use multi-country data; most studies look at one aspect of
performance, only few take a broader perspective; and they all use different (and
sometimes rather ad hoc) measures of competition.
Cull et al. (2009a) merely describe competition in the Latin American
microfinance market where the commercial approach to microfinance proceeded swiftly
during the past decade. The paper characterizes the market as witnessing rising
competition, leading to market saturation in some countries. Olivares-Polanco (2005),
using anecdotal and descriptive evidence from CGAP (2001), investigates the effect of
competition in the microfinance business. Olivares-Polanco uses a concentration index,
measured as the market share held by the four largest MFIs in a country. Higher
concentration is considered to be associated with a lower competitive environment. The
8
analysis mainly focuses on outreach (measured by average loan size) and finds that
increased competition results in lower outreach.
Navajas et al. (2003) study competition in the Bolivian microfinance market,
focusing on two major MFIs, BancoSol and Caja Los Andes and BancoSol, which
together cover around 40 percent of the total market. In particular, this study describes
the impact of the entry of Caja de Los Andes on BancoSol’s performance and behaviour,
as well as on the behaviour of BancoSol’s clients. The results of their analysis suggest
that the impact of competition is ambiguous. On the one hand, it leads to innovation
thereby allowing MFIs to expand outreach. On the other hand, however, it reduces the
ability of lenders to cross-subsidize less profitable smaller loans.
While the above studies are merely descriptive studies, there are also a few
studies that empirically investigate the impact of competition. Vogelgesang (2003)
examines how competition affects loan repayment performance of Caja Los Andes. Her
measure of competition is the fraction of clients of the bank with concurrent loans from
other MFIs. The analysis indicates that competition is related to multiple loan taking and
higher levels of borrower indebtedness. The probability of default is also shown to be
high with higher levels of indebtedness. On the other hand, she argues that for a given
level of borrower indebtedness, the probability of timely repayment is high in areas
where there is high competition and high supply of microfinance services. Again,
therefore, the results remain inconclusive.
McIntosh et al. (2005) examine the effects of competition among MFIs in the
Ugandan microfinance market, specifically focusing on its impact on borrower
9
behaviour. In particular, they argue that due to increased competition among MFIs – in
combination with non-existing formal processes of information-sharing between lenders
about borrowers’ credit history – borrowers will take up more loans from different
institutions, leading to a worsening of repayment rates and a reduction of savings. The
empirical analysis is based on data coming from FINCA (a large microcredit lender,
providing mainly group loans), from a questionnaire among clients of lending groups of
FINCA, and from a country-wide survey, which includes information on credit demand.
Competition is measured at the lending group level in terms of the presence, number
and proximity of competitors providing group loans. It is assumed that the higher the
number and presence of competitors and the smaller the distance to the nearest MFI, the
stronger the competitive environment. The empirical findings of this study provide
supportive evidence for the fact that more intense competition leads to multiple
borrowing and a decline in repayment rates. Although McIntosh et al. do not directly
analyse the impact of competition on the performance of MFIs, their study indirectly
finds evidence for the potentially negative impact of increased competition on
repayment performance of MFIs.
Hermes et al. (2009) analyze the impact of formal financial development on
microfinance efficiency using data for 435 MFIs over the period 1997-2007. They argue
that in a more developed formal financial environment efficiency of MFIs improves due
to competitive pressure. At the same time, cost reductions reduce the outreach of MFIs.
In their analysis, Hermes et al. use various standard measures of financial development,
10
such as the liquid liabilities to GDP ratio, the interest rate margin and the private credit
to GDP ratio. The empirical analysis in the paper provides support for both these effects.
In a related paper, Cull et al. (2009b) investigate the performance of MFIs under
the pressure of competition from formal banks, measuring competitive pressure by
using bank penetration variables such as the number of bank branches per capita and
per square kilometre. The dataset they use consists of 342 MFIs located in 38 developing
countries. Their results show that MFIs faced with high competition tend to reduce the
breadth of outreach but will focus more on the depth of outreach, i.e., more loans to
women borrowers and smaller loans. However, the effect on other performance
indicators, such as profitability, appears to be weak. Both Hermes et al. (2009) and Cull et
al. (2009b) use country-level measures of competition, rather than measures reflecting
competition at the institutional level.
To conclude, the recent interest for the impact of competition on the financial and
social performance of MFIs has not been matched by a surge in academic research. The
subject remains understudied. Moreover, measures of competition differ between
studies and are sometimes rather ad hoc, making comparisons of results difficult. This
paper adds to the empirical literature on microfinance performance and competition and
improves on the measurement of competition by using the so-called Lerner index, a
generally accepted measure in the banking literature. Before going into the measurement
of competition, we first discuss the hypotheses we test regarding the association
between competition and social and financial performance of MFIs.
11
3. Hypotheses
When discussing the impact of competition, we focus on outreach, loan collection,
efficiency and profitability as measures of social and financial performance of MFIs.
These are generally accepted outcome measures of MFI performance (Jansson et al. 2003;
UNDP, undated).
Competition and Outreach
The relationship between competition and outreach of microfinance institutions is
ambiguous. On the one hand, a decrease of monopoly rents and market shares
associated with increased competition may compel MFIs to expand their market base
and explore new markets and (poorer) clients, implying an increase of outreach. On the
other hand, however, if increased competition is associated with rising defaults and
falling profits (see also below), MFIs may engage in more cautious lending by extending
loans only to borrowers they consider safe and cost effective. This may reduce outreach,
as lending to new and unexplored markets, as well as lending to poorer clients, is
generally considered to be more risky and costly.
Competition and Loan Repayment and Portfolio Quality
Increased competition may trigger an increase in loan supply in case new institutions
enter the market. Research has shown that increased loan supply may lead to multiple-
loan taking (referred to as “double-dipping” in the literature) by clients, resulting in
12
heavy debt burdens and low repayment rates (see, e.g., McIntosh and Wydick, 2005 and
McIntosh et al., 2005). Moreover, increased competition may also put pressure on MFIs
to increase output and lower costs, which may lead them to relax lending and client
selection standards and reduce costly monitoring and screening procedures. This in turn
may increase default rates. We therefore expect a negative association between increased
competition and loan repayment performance and/or loan portfolio quality due to
increased default rates. Increased competition and the associated deterioration of
lending portfolios of MFIs is a growing concern and some microfinance experts have
expressed their frustration regarding the upward trend in defaults and over-
indebtedness (Rosenberg, 2010).
Competition and Cost Efficiency
In principle, increased competition puts pressure on MFIs to become cost efficient. With
increased competition, MFIs need to find ways of delivering services at lower costs to
ensure them a competitive edge. Yet, competition may also lead to higher costs. First, as
argued above, competition may result in borrower over-indebtedness, lower repayment
performance and increased default rates. Lower levels of repayments and increased
default rates add to the costs MFIs’ lending activities. Second, with increased
competition in the market for microfinance, MFIs may also not only have to compete for
clients and market shares, but also for capital and labour inputs. Thus, interest rates at
which they borrow money and loan officer salaries may rise, leading to higher costs. To

13
conclude, the association between intensified competition and cost efficiency is not clear
a priory.
Competition and Profitability
Increased competition is expected to be associated with falling profit rates. As MFIs
come under competitive pressure, leading to declining market shares and monopoly
rents, they are expected to report lower profit rates, to the point where it is no longer
attractive for new institutions to enter the microfinance market.
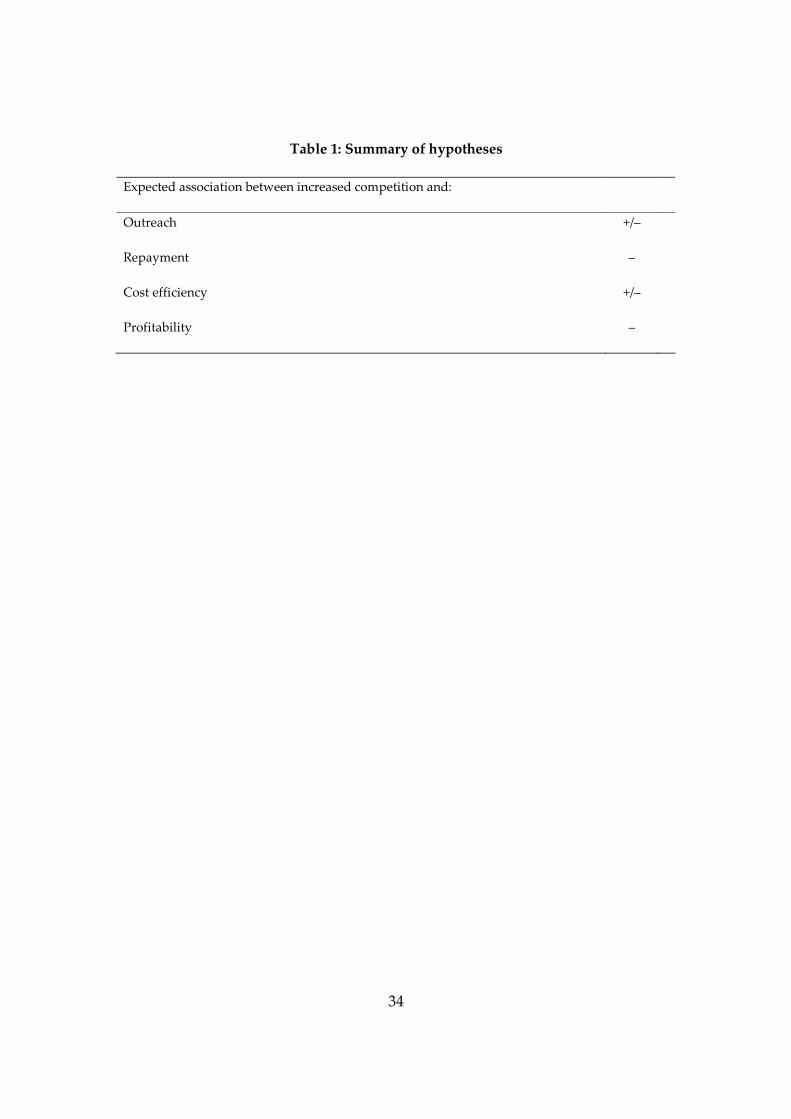
Table 1 provides a summary of the expected associations between competition on
the one hand and various measures of social and financial performance of MFIs.
<Insert Table 1 here>
4. Measuring competition
One important contribution of this paper is the measurement of competition. Here, we
borrow from the banking literature. Studies on competition in banking have applied a
range of measures of competition. Concentration indices, such as the Herfindhal-
Hirschman index, are one of the early and frequently used measures of competition,
where low concentration is associated with high competition (see, e.g., Olivares-Polanco,
2005). However, the use of this measure is criticized on the ground that first, the relation
14
between concentration and competition is not straightforward and second, that higher
concentration does not always imply a lack of competition (Bikker and Haaf, 2002).
Another measure used frequently is the Panzar-Rosse (PR) measure. The PR
measure is an empirical method, measuring the impact of variations in factor input
prices on firm-level revenues and uses cross-sectional data to assess competitive
behaviour (Bikker and Haaf, 2002). The degree of competition in a market is reflected by
an index called the H statistic, which is the sum of input price elasticities of total revenue
of firms with respect to their factor input prices. The H statistic represents the degree of
competition within an industrial sector, where H=0 implies perfect competition and H=1
refers to a full monopoly situation. The PR measure is also not without limitations,
however. Koetter et al. (2008) point out that, first the H statistic does not vary over time,
making it less relevant to investigate the evolution of competition, and second that it is a
measure at the industry level, thus not allowing for the measurement of competition at
the individual firm level.
A third and frequently used measure of competition in banking is the Lerner
index (see, e.g., Angelini and Cetorelli, 2003; Fernández de Guevara et al., 2005, 2007;
Maudos and Fernández de Guevara, 2004, 2007; Koetter and Vins, 2008; Koetter et al.
2008). This index is a firm-level measure of competition and may vary over time, which
is why we prefer this measure over the PR approach. The index measures competition
by examining the difference between the output price and the marginal cost of
production (scaled by the output price) at the firm level. The Lerner index ranges
between 0 and 1. In a perfectly competitive market, where price is equal to marginal cost,
15
the value of the Lerner index equals 0, whereas in a monopolistic market, where firms
can set prices above marginal cost, the index will be close to 1 (Fernández de Guevara et
al., 2005).
Applying the Lerner index to microfinance poses a challenge. Especially in the
early years of the business, but even today, several MFIs obtain subsidies to financially
support their activities. This means that in those cases output prices (i.e. lending rates)
may not reflect associated costs. Ideally, the measurement of the individual MFI-level
Lerner index should be corrected for the amount of subsidies received. Unfortunately,
however, the data we apply, which we take from the MIX market (see below), does not
contain information on subsidies received. We therefore focus the measurement and
analysis of the consequences of competition on commercially oriented MFIs for three
main reasons. First, given their profit maximizing behaviour, these MFIs are less likely
to depend on subsidies. As a result, their revenues are assumed to be a fairly good
reflection of underlying costs. Second, during the last decade commercially oriented
MFIs have become increasingly important. This is partly due to the growing movement
of many established non-profit MFIs to start operating on a commercial basis. Moreover,
several established commercial banks and financial institutions have started a process of
scaling-down by moving into the microfinance business. Third, the MIX market data set
is based on self-reporting, which creates a selection bias in that it mainly provides data
for the better established commercially driven MFIs.

16
Estimating the Lerner index
The Lerner index is defined as:
p
MCpL
)( −= (1)
Here, p is the output price and MC total marginal cost. In the banking literature, the
output price, which is a measure of average revenue, is generally calculated as the ratio
of total operating income (i.e. interest income plus other operating income) to total assets
(Maudos and Fernández de Guevara, 2004). The marginal cost is derived from the
following standard translog cost function:
∑∑==
++++=2
1
22
1
2
210 )(ln2
1ln)(ln
2
1lnln
j
jitj
j
jitjititit wwyyC ββααα
trendwwwykj
iktijtjk
j
ijtitj 1
2
1
lnlnlnln δγγ +++ ∑∑∑<=
it
j
ijtjit trendwtrendytrend εηδδ ++++ ∑=
2
1
3
2
2 logln2
1 (2)
Here, itC is the total production cost of MFI i at year t. The explanatory variable
y represents output and jw represents different input prices. All variables are
transformed into logs. Applying the cost function in the context of the microfinance
business, we follow a specification similar to Hermes et al. (2009). Total cost ( C ) is the
17
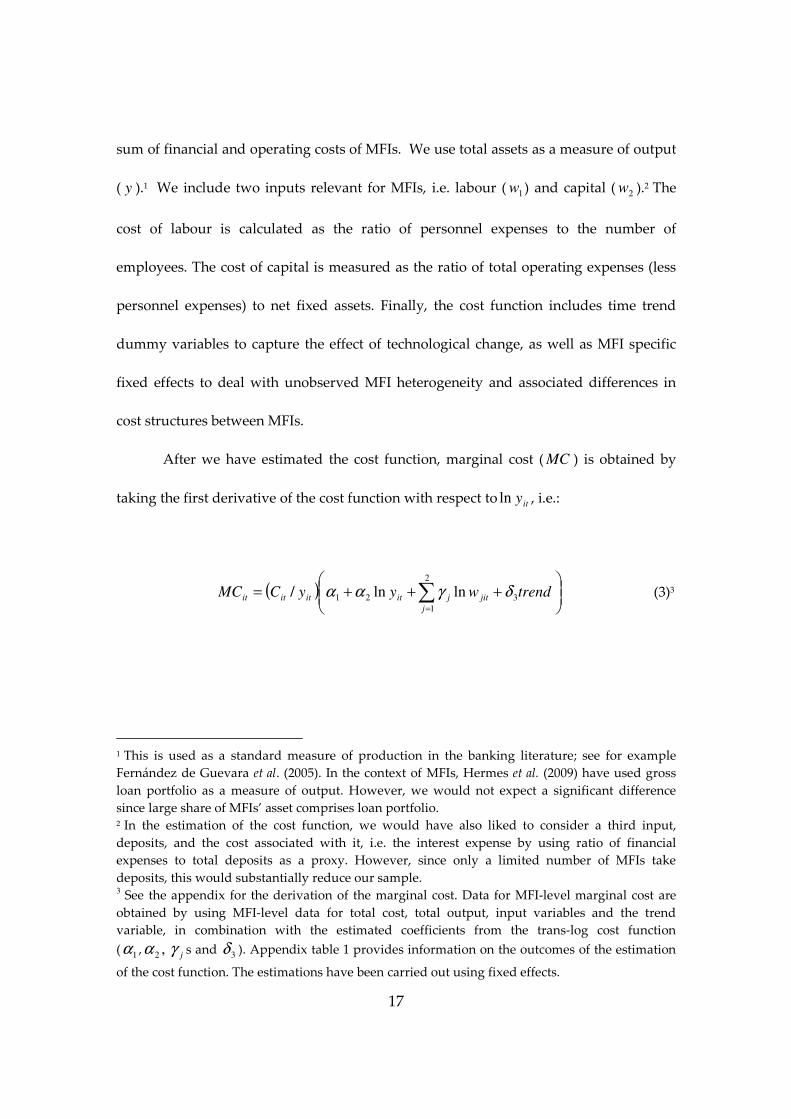
sum of financial and operating costs of MFIs. We use total assets as a measure of output
( y ).1 We include two inputs relevant for MFIs, i.e. labour ( 1w ) and capital ( 2w ).2 The
cost of labour is calculated as the ratio of personnel expenses to the number of
employees. The cost of capital is measured as the ratio of total operating expenses (less
personnel expenses) to net fixed assets. Finally, the cost function includes time trend
dummy variables to capture the effect of technological change, as well as MFI specific
fixed effects to deal with unobserved MFI heterogeneity and associated differences in
cost structures between MFIs.
After we have estimated the cost function, marginal cost ( MC ) is obtained by
taking the first derivative of the cost function with respect to ityln , i.e.:
( )
+++= ∑
=
trendwyyCMCj
jitjitititit 3
2
1
21 lnln/ δγαα (3)3
1 This is used as a standard measure of production in the banking literature; see for example
Fernández de Guevara et al. (2005). In the context of MFIs, Hermes et al. (2009) have used gross
loan portfolio as a measure of output. However, we would not expect a significant difference
since large share of MFIs’ asset comprises loan portfolio. 2 In the estimation of the cost function, we would have also liked to consider a third input,
deposits, and the cost associated with it, i.e. the interest expense by using ratio of financial
expenses to total deposits as a proxy. However, since only a limited number of MFIs take
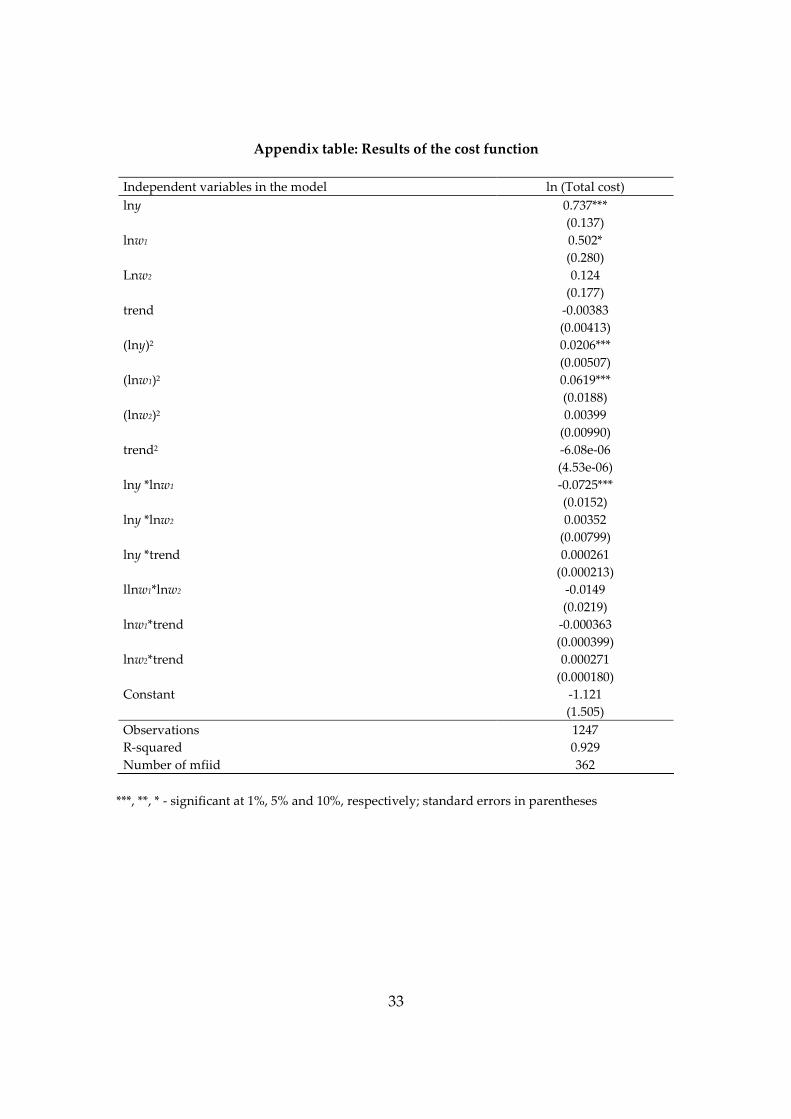
deposits, this would substantially reduce our sample. 3 See the appendix for the derivation of the marginal cost. Data for MFI-level marginal cost are
obtained by using MFI-level data for total cost, total output, input variables and the trend
variable, in combination with the estimated coefficients from the trans-log cost function
(1α , ,2α jγ s and
3δ ). Appendix table 1 provides information on the outcomes of the estimation
of the cost function. The estimations have been carried out using fixed effects.
18
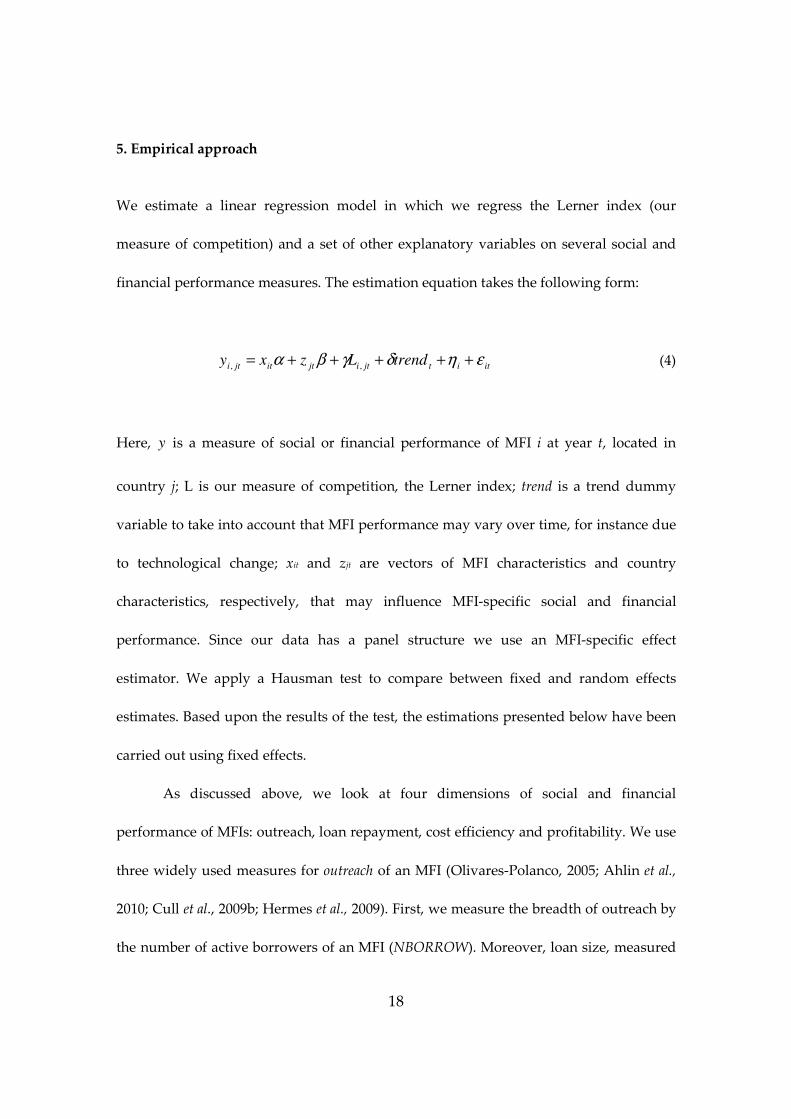
5. Empirical approach
We estimate a linear regression model in which we regress the Lerner index (our
measure of competition) and a set of other explanatory variables on several social and
financial performance measures. The estimation equation takes the following form:
ititjtijtitjti trendLzxy εηδγβα +++++= ,, (4)
Here, y is a measure of social or financial performance of MFI i at year t, located in
country j; L is our measure of competition, the Lerner index; trend is a trend dummy
variable to take into account that MFI performance may vary over time, for instance due
to technological change; xit and zjt are vectors of MFI characteristics and country
characteristics, respectively, that may influence MFI-specific social and financial
performance. Since our data has a panel structure we use an MFI-specific effect
estimator. We apply a Hausman test to compare between fixed and random effects
estimates. Based upon the results of the test, the estimations presented below have been
carried out using fixed effects.
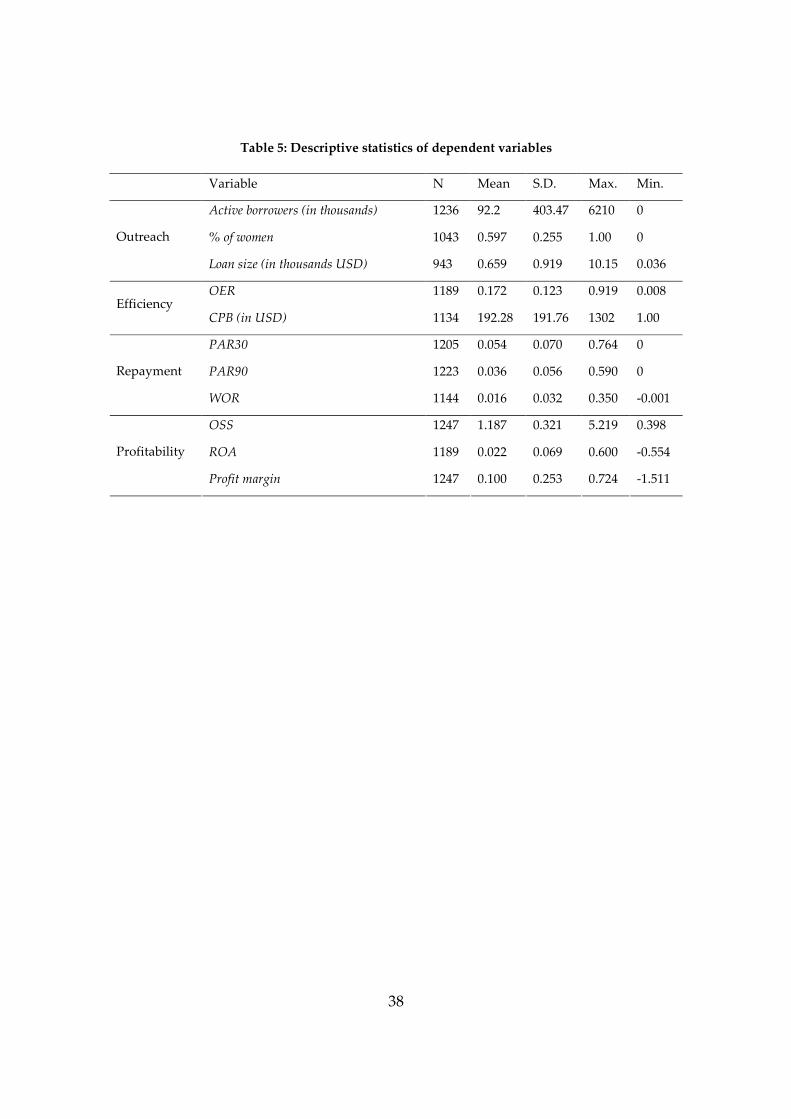
As discussed above, we look at four dimensions of social and financial
performance of MFIs: outreach, loan repayment, cost efficiency and profitability. We use
three widely used measures for outreach of an MFI (Olivares-Polanco, 2005; Ahlin et al.,
2010; Cull et al., 2009b; Hermes et al., 2009). First, we measure the breadth of outreach by
the number of active borrowers of an MFI (NBORROW). Moreover, loan size, measured
19
as the average loan balance per borrower (LOANSIZE) and the number of women
borrowers as a share of all borrowers (WOMEN) of an MFI are included in the analysis.
The latter two measures are proxies for the depth of outreach, referring to the extent to
which an MFI reaches out to poor clients.
We have two commonly used measures of the cost efficiency of an MFI, i.e. the
operating expenses ratio (OER), which is the ratio of operating expenses to average gross
loan portfolio and the average cost per borrower (CPB).
With respect to the performance in terms of loan repayment performance and loan
portfolio quality we use three measures: the portfolio at risk greater than 30 days (PAR30)
and 90 days (PAR90), and the write-off ratio (WOR). The first two are measures of the
share of the loan portfolio of an MFI that is overdue (30 or 90 days) and is at risk of not
being repaid. WOR measures the share of outstanding loans that is expected not to be
repaid.
We measure profitability of MFIs in terms of the return on assets (ROA), the profit
margin (MARGIN) and financial sustainability as measured by their operational self-
sufficiency (OSS).
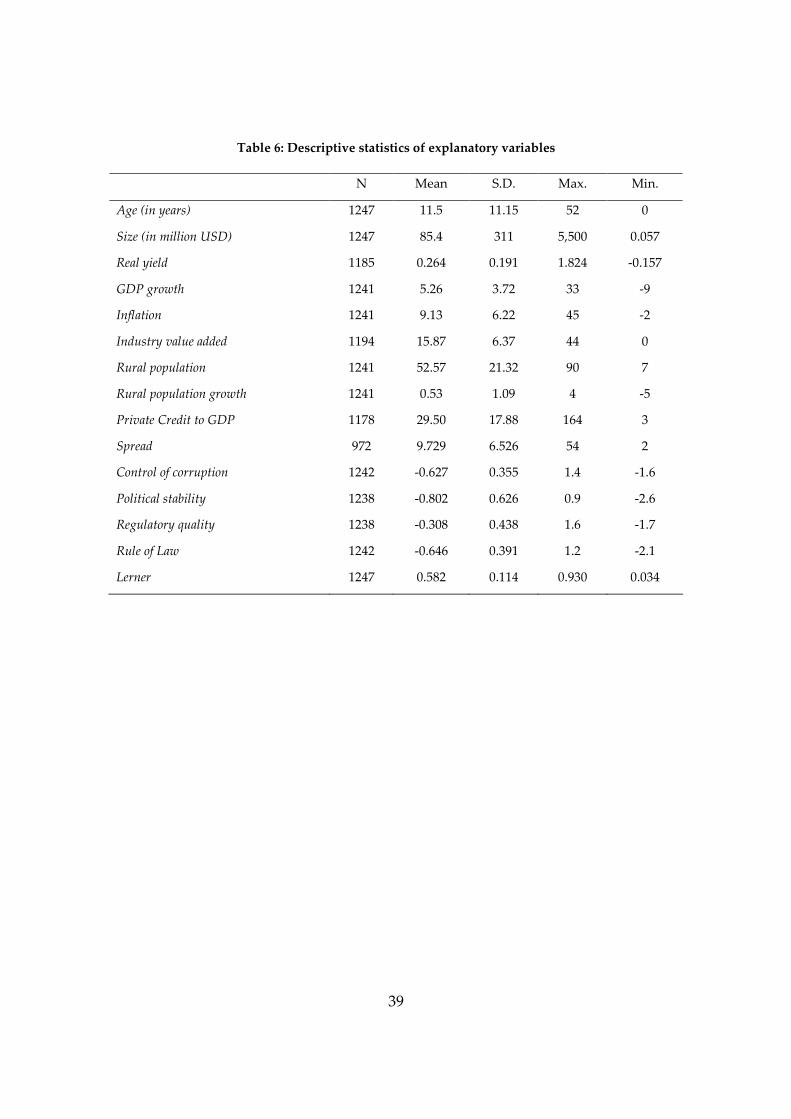
Next to the Lerner index, our measure of competition at the MFI-level, we use
the following MFI-specific explanatory variables: AGE (number of years since
establishment) and AGE squared, SIZE (measured as the log of total assets) and YIELD
(measured as the average interest charges customers of the MFI face). Moreover, we add
a number of country-level variables, controlling for the macroeconomic environment (i.e.
real GDP growth (GDPGR), inflation (INFL), industry value added to GDP (IND), share
20
of rural population (RPOP) as well as rural population growth (RPOPGR)), the quality of
institutions (i.e. control of corruption, political stability, regulatory quality and rule of law) and
the level of financial development (i.e. private credit to GDP ratio (CREDIT) and the net
interest rate margin (SPREAD)). These variables have been used in other cross-country
studies focusing on explaining MFI performance (see, e.g., Ahlin et al., 2010; Cull et al.,
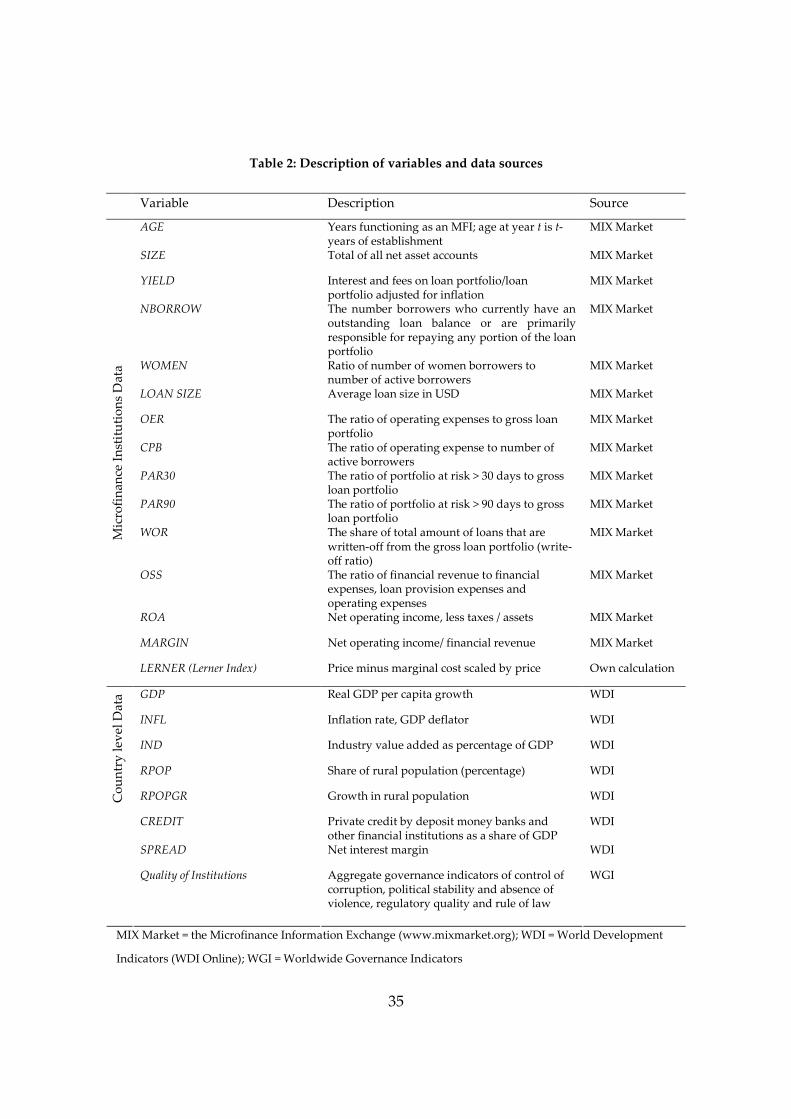
2009b, Vanroose and d’Espallier, 2009; Hermes et al., 2009). 4 Table 2 provides a
description of all variables used in the analysis.
<Insert Table 2 here>
6. Data
As was already discussed above, we use the MIX market data base for the measurement
of the Lerner index. Moreover, data for MFI-specific variables, including our measures
of social and financial performance, are also taken from this source. This database has
been widely used in the microfinance literature. Reporting to MIX market by MFIs is
done on a voluntary basis, which may, at least potentially, have consequences for the
reliability of the data. In order to ensure quality and availability of data, we limit
ourselves to commercially oriented MFIs with three or more diamonds. 5 By the time of
4 See these references for a more elaborate discussion of the relationship between the
macroeconomic, institutional and financial development variables on the one hand and MFI
social and financial performance on the other hand. 5 The MIX market data base employs a diamond system indicating the availability and quality of
the data obtained from MFIs. Higher levels of diamonds indicate higher level of disclosure and
data quality. Three diamonds represents MFIs reporting for two or more consecutive years with
respect general information, outreach and financial data; four diamonds implies data as with
21
constructing the dataset for this study (March 2010), there were 461 commercially
oriented MFIs with three or more diamonds, rendering 2,544 observations. The
information collected for this study covers the period 1995-2008. More than 90 per cent
of the data is from year 2000 onwards.
Yet, due to missing values with respect to either of components of the Lerner
index (i.e. price and/or marginal cost) several MFIs had to be dropped from the initial
dataset. Moreover, in very few cases we found values for the Lerner index outside the 0
to 1 range. These observations were treated as outliers.6 The final sample contains 1,247
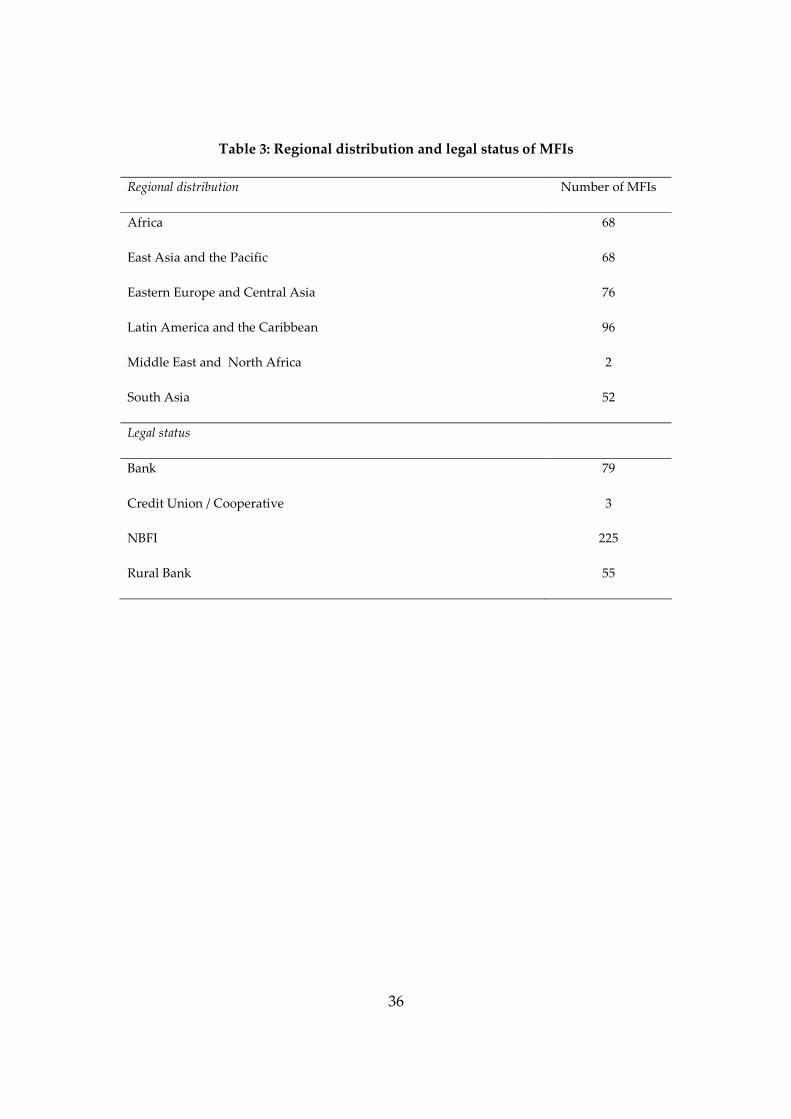
observations relating to 362 commercially oriented MFIs located in 73 countries. Table 2
summarizes the regional distribution and legal status of the MFIs in our dataset.
<Insert Table 3 here>
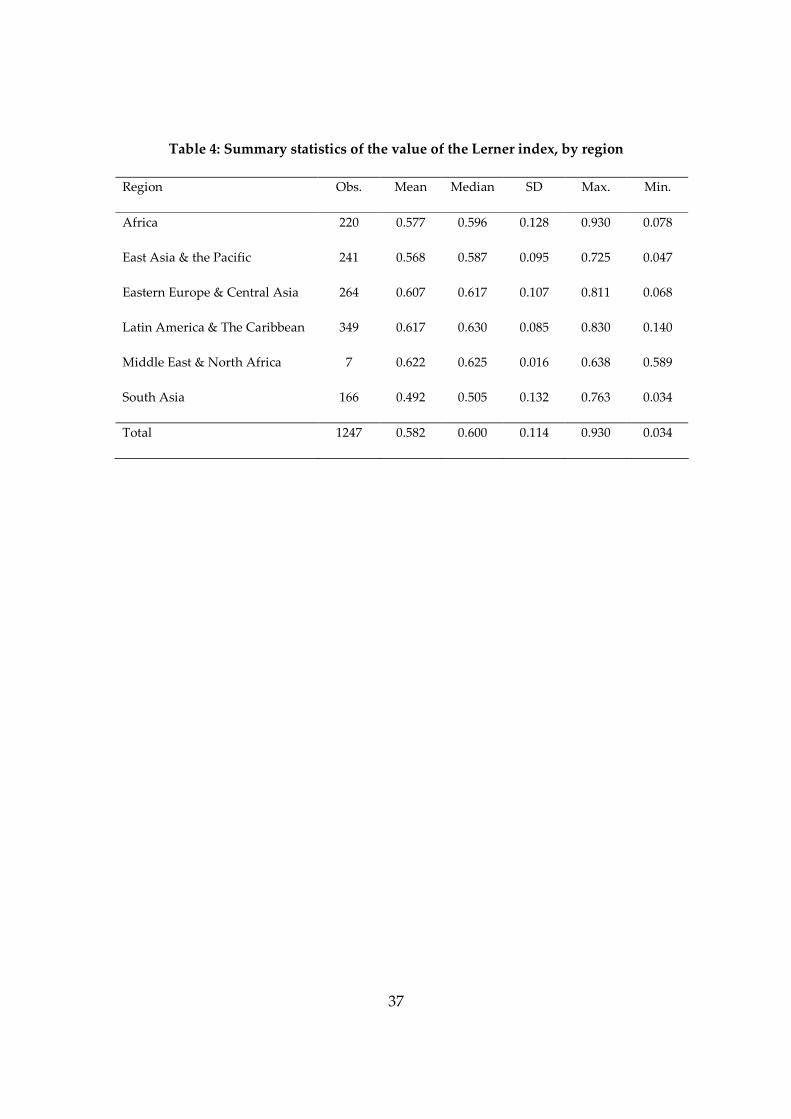
Table 3 provides information on the average value of the Lerner index for the whole
sample of MFIs, as well as for MFIs in different regions. The average Lerner index is 0.58.
This outcome suggests that MFIs in our dataset are confronted with modest levels of
three diamonds plus audited financial statements; five diamonds represent data as with four
diamonds plus rating and other benchmarking assessments. 6 Theoretically it is possible to observe values for the Lerner index below zero. This would
indicate that organizations are making losses as marginal costs are higher than marginal returns.
In the context of our analysis, if we observe MFIs still being in business while they have a Lerner
index below zero, this may indicate that they obtain substantial subsidies to cover costs. A Lerner
index with a value above one means that either price or marginal cost is negative, which seems to
be unrealistic. For these reasons, we have considered these cases to be outliers. We estimated the
cost function and calculated the Lerner index in two steps. In the first step we calculated the cost
function and Lerner index using the full sample and deleted values of the Lerner index below 0
and above 1 (eight observations were below zero, one above one) cases); in the second step we
repeated the calculation of the cost function and Lerner index, returning observations for the
Lerner index that range between 0 and 1 only (one observation below zero).
22
competition, at least if we compare our results with those of other studies using the
Lerner index to investigate competition in the banking industry. For example, Maudos
and Fernández de Guevara (2004) report an average Lerner index of 0.15 based on a
large sample of European banks for the period 1993-2000. Fernández de Guevara et al.
(2007), using a sample of banks from a larger number of European countries for the same
period, the average Lerner index is reported to be similar in size. They also show,
however, that whereas for some countries, such as Denmark, Germany and Luxemburg
banking competition has increased, in other countries (e.g., Finland, UK, Italy and Spain),
market power of banks has actually increased over the period under investigation.
Koetter et al. (2008) present results on the Lerner index for a sample of around 4,000 US
bank holding companies, indicating that the index is between 0.20 and 0.25 (depending
on the methodology used to calculate the cost function). Koetter and Vins 2008 find an
average Lerner index of 0.23 for a set of German savings banks covering the period 1996-
2006. Angelini and Cetorelli (2003) show that for a sample of Italian banks the Lerner
index drops from above 0.15 in 1984 to slightly below 0.10 in 1997.
The above findings suggest that for commercial banks in European countries and
the US, competition appears to be relatively strong. In contrast, the average MFI in our
dataset seems to enjoy quite some level of market power, enabling them to charge
interest rates above marginal costs.
Table 3 also shows that competitive environments differ for MFIs located in
different regions of the world. In particular, for MFIs in Latin America and Eastern
Europe competition appears to be lower on average than for MFIs in South Asia (the
23
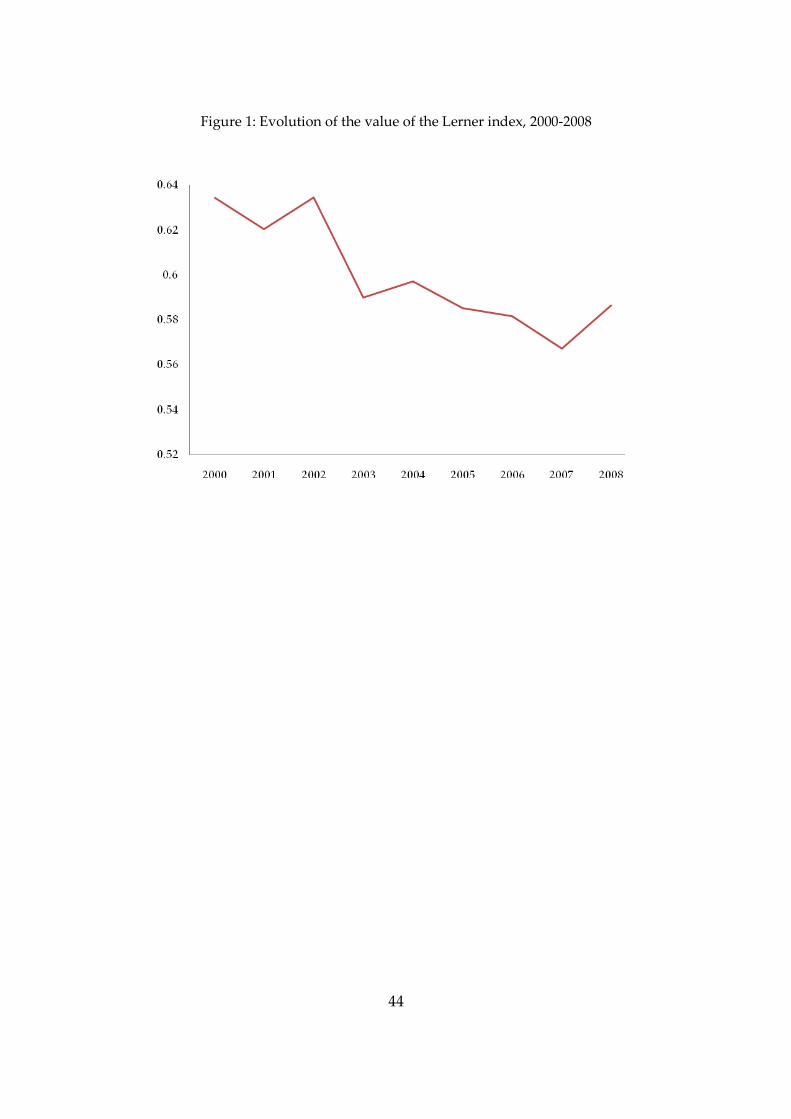
Lerner index being 0.62, 0.61 and 0.49, respectively). Figure 1 shows that the average
value of the Lerner index gradually declines from 2000 to 2007, suggesting that
competition in the microfinance business increases over time.7
<Insert Table 4 here>
<Insert Figure 1 here>
Data on institutional quality is obtained from Worldwide Governance Indicators (WGI),
also known as the Kaufmann governance indicators. Information with respect to the
macroeconomic and financial development variables is taken from the Wold
Development Indicators (WDI) of the World Bank. Combining micro and macro
variables results in a further loss of observations, since for several of these variables
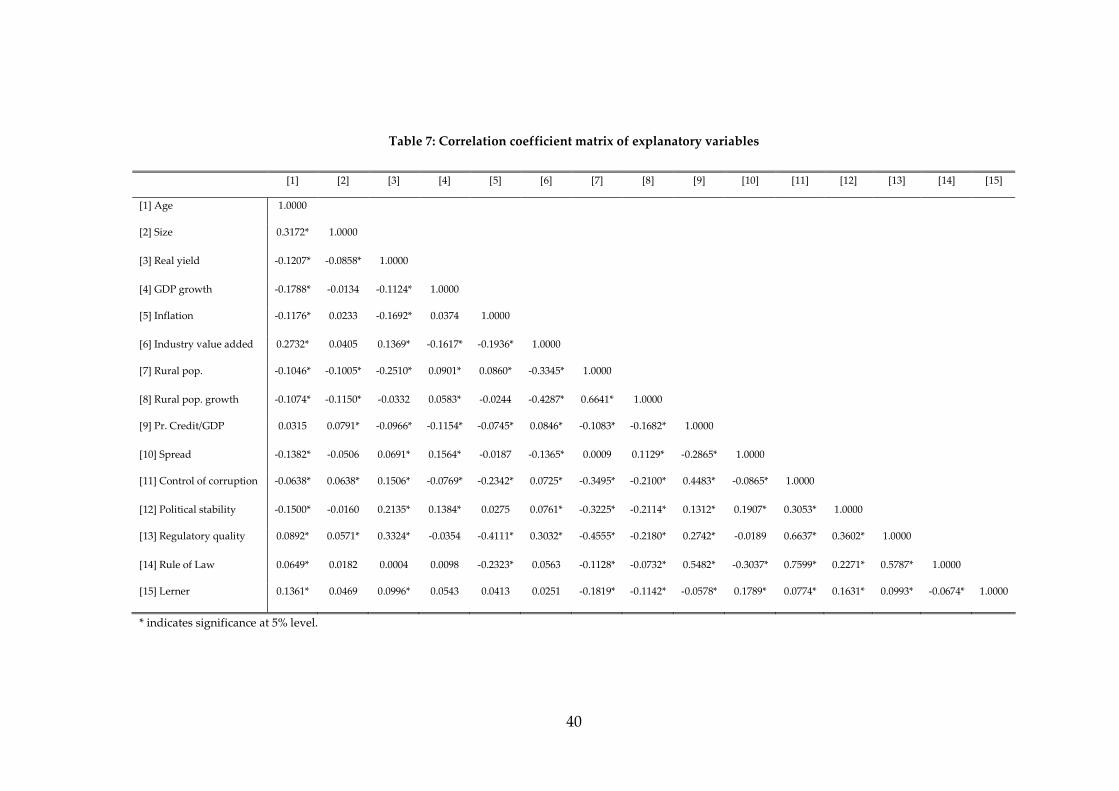
information is not available for all years. Tables 6 and Table 7 provide descriptive
statistics of the dependent and explanatory variables, respectively. Table 8 presents
correlation coefficients of the explanatory variables. The results in table 8 suggest that
most of the correlations between explanatory variables are low, with the exception of the
correlation between some of the institutional variables, as well as between rural
population and rural population growth.
<Insert Table 5 here>
7 The increase of the value of the Lerner index in 2008 may be due to the relatively small number
of observations we have for this year.
24
<Insert Figure 6 here>
<Insert Table 7 here>
7. Empirical analysis
Next, we estimate the empirical model described in equation (4). The results of the
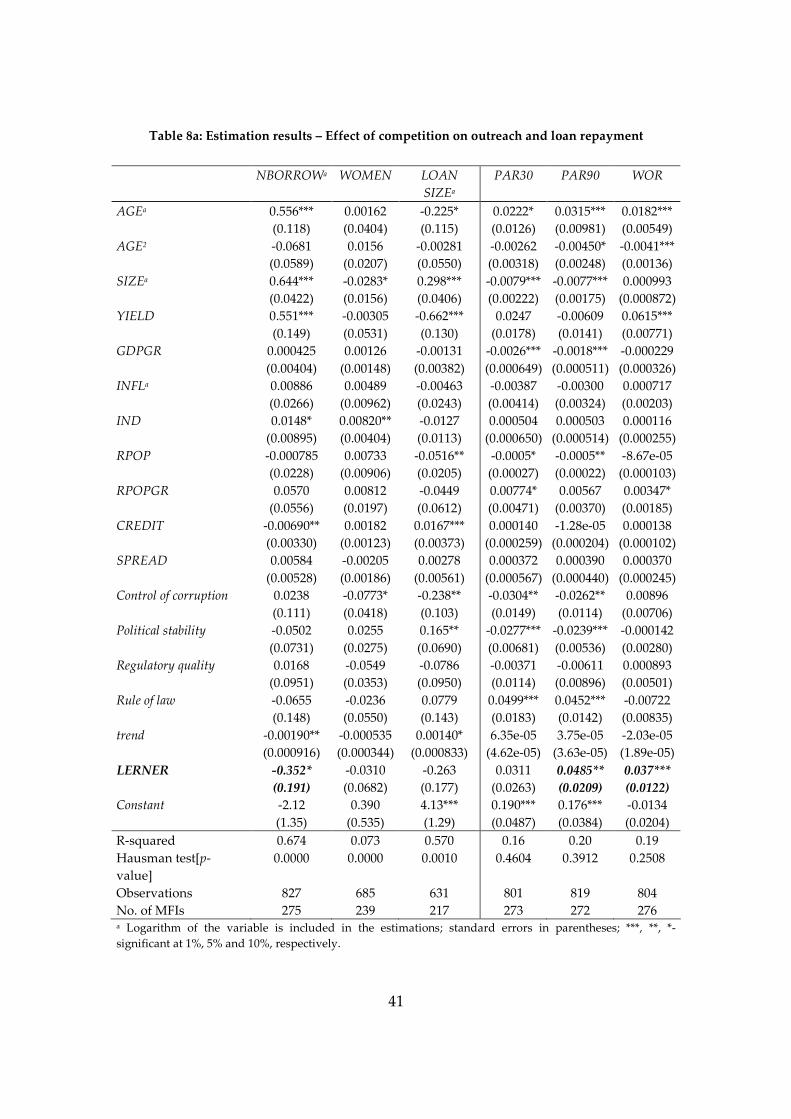
multivariate analysis are described in tables 8a (with outreach and loan repayment
performance as dependent variable) and 8b (dependent variables: cost efficiency and
profitability). The focus of the analysis is on the relationship between competition and
social and financial performance, controlling for macroeconomic, institutional and
financial development variables.
As explained above, the Lerner index, our measure of competition, takes a value
between 0 and 1; a low (high) value of the index indicates high (low) competition. For
ease of interpretation of the estimation results, we have multiplied the values for the
Lerner index with -1. The results are presented in tables 8a (with outreach and loan
repayment performance as dependent variable) and 8b (dependent variables: cost
efficiency and profitability).
The results in table 8a with respect to social performance in terms of outreach
show that there is some evidence that higher competition is associated with lower
outreach. The coefficient for our competition measure is negative for all three measures
25
of outreach; it is significant in only one case (i.e. the number of active borrowers). This
supports the hypothesis that increased competition forces MFIs into more cautious
lending operations.
For loan repayment performance table 8a shows that there seems to be support that
competition is associated with this dimension of financial performance of MFIs. The
coefficient of the competition measure is positive for all three measures of repayment
performance and it is significant for two (PAR90 and WOR). These results strongly
suggest that more competition leads to more loans at risk and higher levels of loan
write-offs (i.e. lower loan repayment performance).
<Insert Table 8 here>
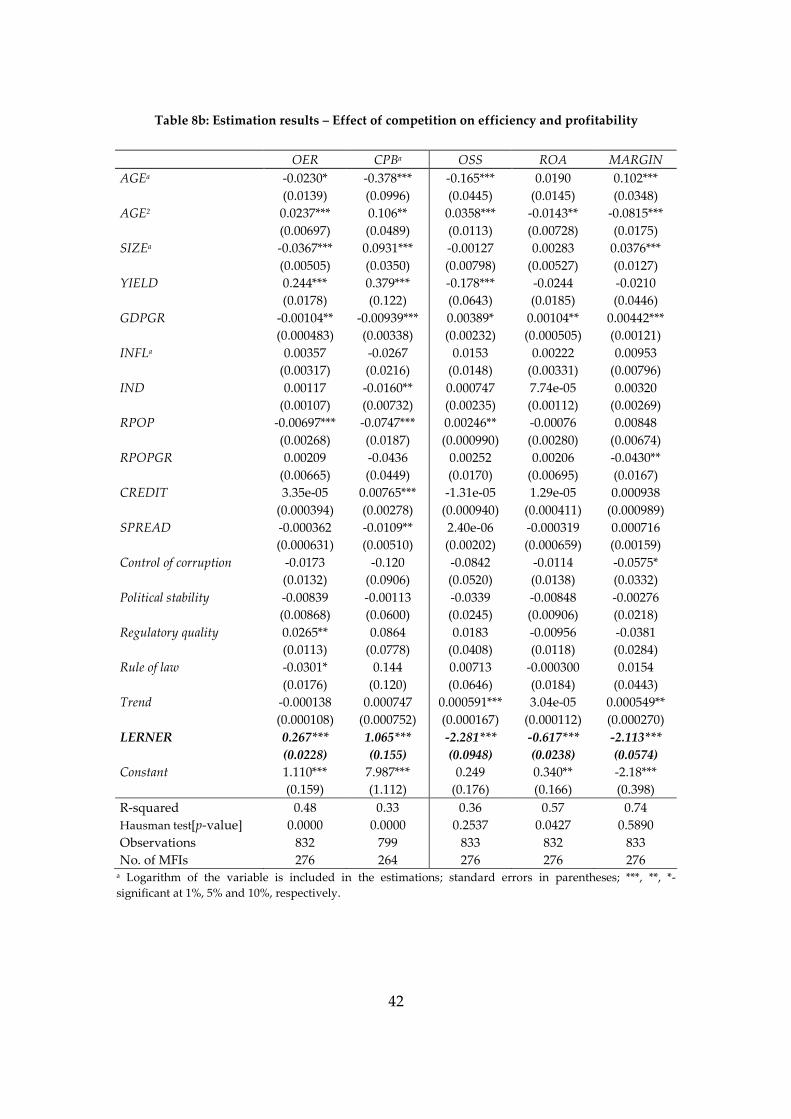
With respect to cost efficiency we find evidence that more competitive markets are
associated with higher costs for MFIs (see table 8b). For both measures of cost efficiency
(i.e. operating expenses ratio and the cost per borrower) the coefficient for the
competition is positive and significant. This lends support to the hypothesis that higher
competition leads to lower repayment rates and default rates, adding to the costs of
lending. It may also support the notion that in highly competitive environments MFIs
are not only competing for clients and market shares, but also for inputs such as capital
and labour. Increased competition for these inputs may lead to rising interest rates at
which they borrow money and to higher loan officer salaries, leading to higher costs.
26
Finally, table 8b shows that with respect to profitability higher competition is
associated with lower return on assets, lower operational self-sufficiency and lower
profit margins, since the coefficient of the competition measure is positive and
significant in all three cases. These results support the hypothesis that increased
competition is associated with falling profitability: due to competitive pressure, market
shares and monopoly rents decline, forcing MFIs to reduce profit rates.
The results for the control variables in the model are not significant in several
cases, but the general picture that emerges is that the association between
macroeconomic conditions, institutional quality and financial development on the one
hand, and social and financial performance of MFIs on the other hand, are in line with
those that have been reported in previous empirical work (see, e.g., Ahlin et al., 2010;
Cull et al. 2009b; Hermes et al., 2009). Our contribution in this paper, however, is
focused on measuring competition in the microfinance business and investigating the
association between competition and MFI performance, which is why we do not further
go into details with respect to the empirical results for the macroeconomic, institutional
and financial development variables.
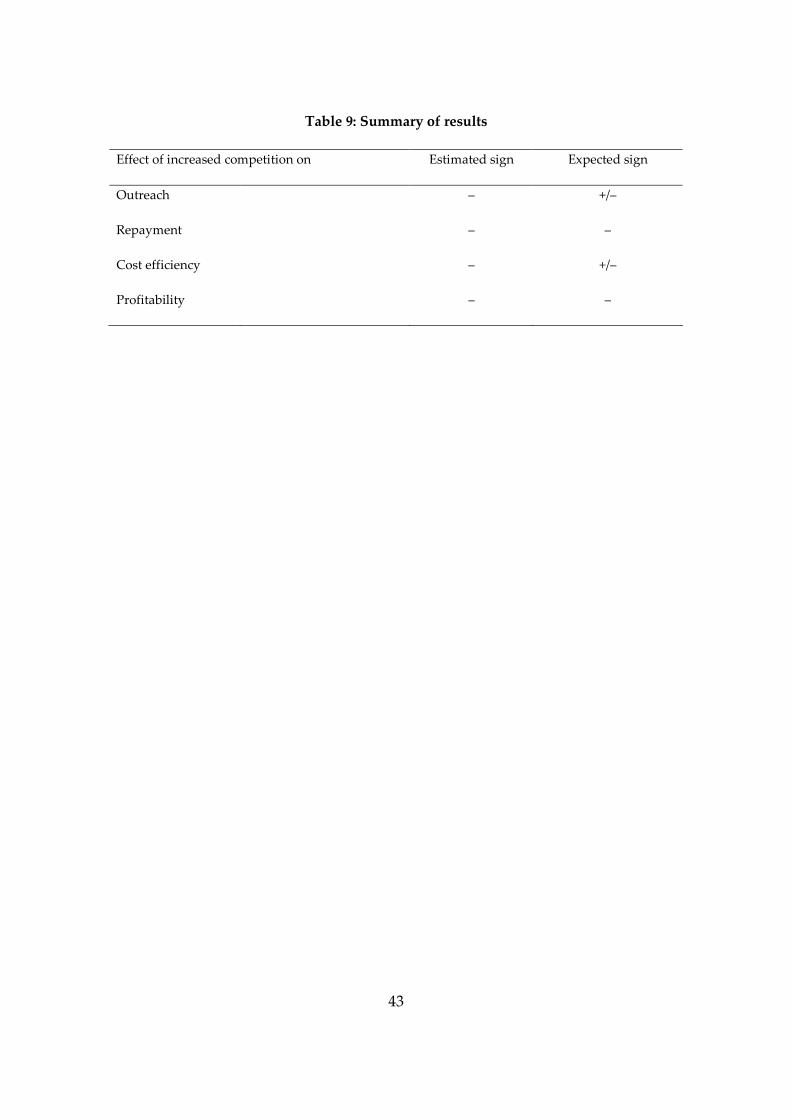
To summarize, our empirical results by and large point towards adverse
associations between competition and social and financial performance of MFIs.
Competition appears to be negatively associated with outreach, loan repayment,
efficiency and profitability. Table 9 summarizes the results of the empirical analysis.
<Insert Table 9 here>
27
8. Summary and conclusions
The microfinance business has been enjoying increased attention. One consequence of
this is that the number of microfinance service providers has increased rapidly over the
last 10 to 15 years. Yet, this has also led to strongly increasing competition between
microfinance providers. As we have argued in the first part of this paper, the literature
on the consequences of competition for the performance of MFIs is ambiguous. On the
one hand, it may contribute to lowering production costs and lower prices of goods and
services and encourage the development of new products and efficient technologies. On
the other hand, however, competition may lead to lower borrower selection standards,
to weakening of bank-customer relationships, and to multiple loan-taking and high
defaults.
We have also discussed the empirical evidence on the consequences of increased
competition for the microfinance business. Studies on this issue appeared to be scarce.
Moreover, measurement was a critical issue, as the few studies available generally used
sometimes rather ad hoc measures of competition. The contribution of this paper,
therefore, was first to add to the limited empirical evidence on competition and its
consequences for microfinance in the broadest sense, and second, to elaborate on the
measurement of competition in the context of the microfinance market. With respect to
the latter issue we applied the Lerner index, a measure of competition widely used in
28
the banking literature, measuring the extent to which an institution has market power.
As far as we, this study is the first to apply the Lerner index to the microfinance business.
The results of our empirical investigation indicate first that since 2000
competition in microfinance has indeed increased. Moreover, competition appears to be
especially strong in South Asia, while it is less strong in Latin America and Eastern
Europe. The results of the multivariate analysis further indicate that MFIs have lower
outreach when faced with more intense competition. We also find that increased
competition is associated with lower levels of loan repayment, lower financial
performance and lower efficiency.
All in all, then, the analysis seems to support the view of those who see increased
competition and the related commercialization of the microfinance sector as a threat to
its longer term stability and success, both in terms of its social and financial objectives.
The results may also support calls for designing ways to ensure the (negative) effects of
increased competition on the sector are minimized. These calls may include improved
regulatory measures, reducing the risk MFIs compromise lower lending standards for
increased market share. Moreover, it may stimulate initiatives focusing on promoting
information sharing between MFIs. This may contribute to lower delinquency rates as
well as helping to improve borrowers’ welfare by preventing borrowers from taking
multiple loans. In addition, promoting financial literacy among clients may also help
them in their borrowing decisions and reduce the risk of multiple loan-taking.
29
References
Ahlin, C., J. Lin and M. Maio (2010), “Where does Microfinance Flourish: Microfinance
Institution Performance in Macroeconomic Context”, Journal of Development
Economics, forthcoming
Angelini, P. and N. Cetorelli (2003), “The Effects of Regulatory Reform on Competition
in the Banking Industry”, Journal of Money, Credit and Banking 35: 663-684
Bikker, J. and K. Haaf (2002), “Measures of Competition in the Banking Industry: A
Review of the Literature. Economic and Financial Modelling 9: 53-98
CGAP (2001), “Commercialization and Mission Drift: The Transformation of
Microfinance in Latin America”, CGAP Occasional Paper No. 5
CGAP (2009), Financial Access 2009: Measuring Access to Financial Services around the World.
Washington D.C.: the Consultative Group to Assist the Poor (CGAP)/World Bank
Chen, G., S. Rasmussen and X. Reille (2010), “Growth and Vulnerabilities in
Microfinance”, CGAP Focus Note No. 61
Cull, R., A. Demirgüç-Kunt and J. Morduch (2009a), “Microfinance Meets the Market”,
Journal of Economic Perspectives 23: 167:192
Cull, R., A. Demirgüç-Kunt and J. Morduch (2009b), “Banks and Microbanks”, Policy
Research Working Paper 5078, World Bank
Fernández de Guevara, J., J. Maudos and F. Pérez (2005), “Market Power in European
Banking Sectors”, Journal of Financial Services Research 27: 109–137
Fernández de Guevara, J., J. Maudos and F. Pérez (2007), “Integration and Competition
in the European Financial Markets”, Journal of International Money and Finance 26:
26-45
Hermes, N., R. Lensink and A. Meesters (2009), “Financial Development and the
Efficiency of Microfinance Institutions”, Centre for International Banking, Insurance
and Finance Working Paper, University of Groningen
Hulme, D. and T. Arun (2009), “The Future of Microfinance”, in: D. Hulme and T. Arun
(eds.), Microfinance: A Reader, New York: Routledge, pp. 225–231
30
Jansson, T., D. von Stauffenberg, N. Kenyon and M. Barluenga-Badiola (2003),
Performance Indicators for Microfinance Institutions: Technical Guide, Washington D.C:
MicroRate and Inter-American Development Bank
Koetter, M. and O. Vins (2008), The Quiet Life Hypothesis in Banking – Evidence from
German Savings Banks, Finance and Accounting Working Paper No. 190, Johann-
Wolfgang Goethe-Universität Frankfurt.
Koetter, M., J. Kolari and L. Spierdijk (2008), Efficient Competition: Testing the 'Quiet
Life' of U.S. Banks with Adjusted Lerner Indices (Unpublished)
Maudos, J. and J. Fernández de Guevara (2004), “Factors Explaining the Interest Margin
in the Banking Sectors of the European Union”, Journal of Banking and Finance 28:
2259–2281
Maudos, J. and J. Fernández de Guevara (2007), “The Cost of Market Power in Banking:
Social Welfare Loss vs. Cost Inefficiency”, Journal of Banking and Finance 31: 2103–
2125
McIntosh, C. and B. Wydick (2005), “Competition and Microfinance”, Journal of
Development Economics 78: 271–298
McIntosh, C., A. de Janvry and E. Sadoulet (2005), “How Rising Competition among
Microfinance Institutions Affects Incumbent Lenders”, Economic Journal 115: 987-
1004
Motta, M. (2004), Competition Policy: Theory and Practice, Cambridge: Cambridge
University Press.
Navajas, S., J. Conning and C. Gonzalez-Vega (2003), “Lending Technologies,
Competition and Consolidation in the Market for Microfinance in Bolivia”, Journal
of International Development 15: 747-770
Olivares-Polanco, F. (2005), “Commercializing Microfinance and Deepening Outreach:
Empirical Evidence from Latin America, Journal of Microfinance 7: 47-69
Porteous, D. (2006), “Competition and Microcredit Interest Rates”, CGAP Focus Note No.
33
31
Rosenberg, R., A. Gonzalez and S. Narain (2009) The New Moneylenders: Are the Poor
Being Exploited by High Microcredit Interest Rates? CGAP Occasional Paper No. 15
Rosenberg, R. (2010), Perplexed about Over-indebtedness: Part 1. CGAP Microfinance
Blog, April 28, 2010 – (See http://microfinance.cgap.org/2010/04/08/perplexed-
about-over-indebtedness-part-1)
Sinah, S. (2010), “How to Calm the Charging Bull – An Agenda for CGAP in the Decade
of the ‘Teenies’”, Microfinance Focus, June 15, 2010
UNDP (undated), Core Performance Indicators for Microfinance, see:
http://www.uncdf.org/english/microfinance/uploads/evaluations/Core%20Indicator
s--UNDP%20version.pdf
Vanroose, A. and B. D’Espallier (2009), Microfinance and Financial Sector Development,
Centre Emile Bernheim (CEB) Working Paper No. 09/040, Solvay Brussels School of
Economics and Management
Vogelgesang, U. (2003) “Microfinance in Times of Crisis: The Effects of Competition,
Rising Indebtedness and Economic Crisis on Repayment Behaviour”, World
Development 31: 2085-2114
32
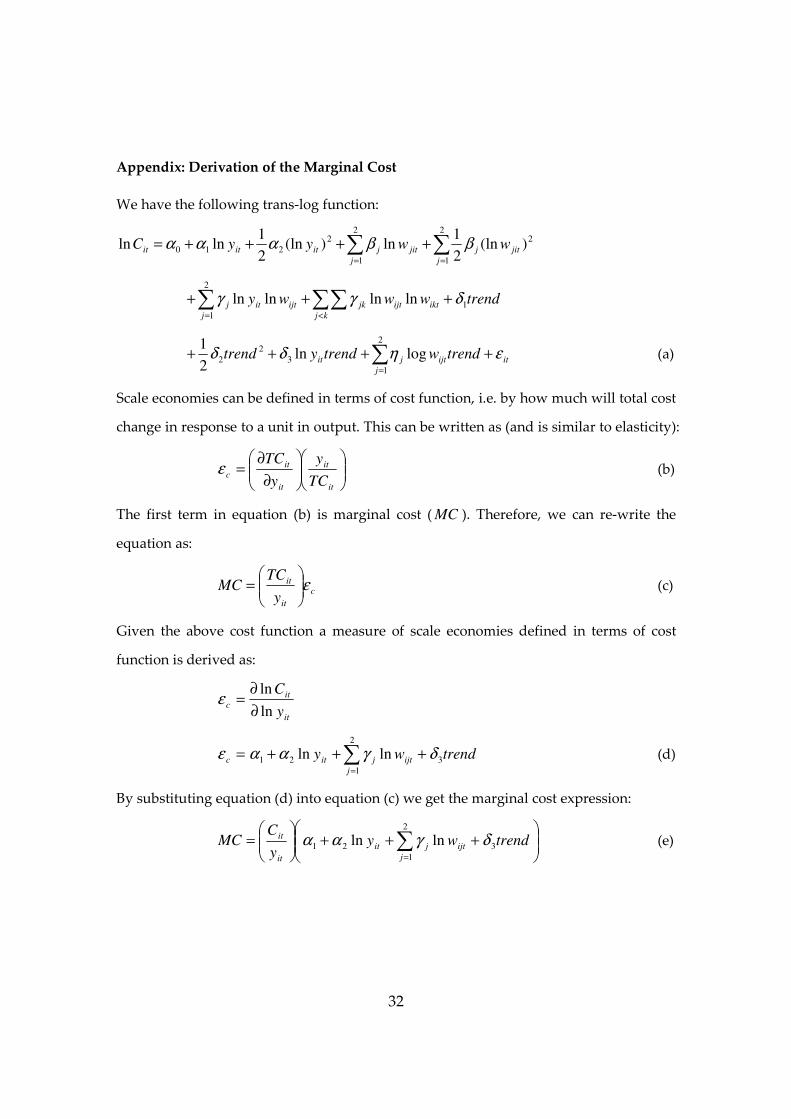
Appendix: Derivation of the Marginal Cost
We have the following trans-log function:
∑∑==
++++=2
1
22
1
2
210 )(ln2
1ln)(ln
2
1lnln
j
jitj
j
jitjititit wwyyC ββααα
trendwwwykj
iktijtjk
j
ijtitj 1
2
1
lnlnlnln δγγ +++ ∑∑∑<=
it
j
ijtjit trendwtrendytrend εηδδ ++++ ∑=
2
1
3
2
2 logln2
1 (a)
Scale economies can be defined in terms of cost function, i.e. by how much will total cost
change in response to a unit in output. This can be written as (and is similar to elasticity):
∂
∂=
it
it
it
it
cTC
y
y
TCε (b)
The first term in equation (b) is marginal cost ( MC ). Therefore, we can re-write the
equation as:
c
it
it
y
TCMC ε
= (c)
Given the above cost function a measure of scale economies defined in terms of cost
function is derived as:
it
it
cy
C
ln
ln
∂
∂=ε
trendwy ijt
j
jitc 3
2
1
21 lnln δγααε +++= ∑=
(d)
By substituting equation (d) into equation (c) we get the marginal cost expression:
+++
= ∑
=
trendwyy
CMC ijt
j
jit
it
it
3
2
1
21 lnln δγαα (e)
33
Appendix table: Results of the cost function
Independent variables in the model ln (Total cost)
lny 0.737***
(0.137)
lnw1 0.502*
(0.280)
Lnw2 0.124
(0.177)
trend -0.00383
(0.00413)
(lny)2 0.0206***
(0.00507)
(lnw1)2 0.0619***
(0.0188)
(lnw2)2 0.00399
(0.00990)
trend2 -6.08e-06
(4.53e-06)
lny *lnw1 -0.0725***
(0.0152)
lny *lnw2 0.00352
(0.00799)
lny *trend 0.000261
(0.000213)
llnw1*lnw2 -0.0149
(0.0219)
lnw1*trend -0.000363
(0.000399)
lnw2*trend 0.000271
(0.000180)
Constant -1.121
(1.505)
Observations 1247
R-squared 0.929
Number of mfiid 362
***, **, * - significant at 1%, 5% and 10%, respectively; standard errors in parentheses
34
Table 1: Summary of hypotheses
Expected association between increased competition and:
Outreach +/–
Repayment –
Cost efficiency +/–
Profitability –
35
Table 2: Description of variables and data sources
Variable Description Source
AGE Years functioning as an MFI; age at year t is t-years of establishment
MIX Market
SIZE Total of all net asset accounts MIX Market
YIELD Interest and fees on loan portfolio/loan portfolio adjusted for inflation
MIX Market
NBORROW The number borrowers who currently have an outstanding loan balance or are primarily responsible for repaying any portion of the loan portfolio
MIX Market
WOMEN Ratio of number of women borrowers to number of active borrowers
MIX Market
LOAN SIZE Average loan size in USD MIX Market
OER The ratio of operating expenses to gross loan portfolio
MIX Market
CPB The ratio of operating expense to number of active borrowers
MIX Market
PAR30 The ratio of portfolio at risk > 30 days to gross loan portfolio
MIX Market
PAR90 The ratio of portfolio at risk > 90 days to gross loan portfolio
MIX Market
WOR The share of total amount of loans that are written-off from the gross loan portfolio (write-off ratio)
MIX Market
OSS The ratio of financial revenue to financial expenses, loan provision expenses and operating expenses
MIX Market
ROA Net operating income, less taxes / assets MIX Market
MARGIN Net operating income/ financial revenue MIX Market
Mic
rofi
nan
ce I
nst
itu
tio
ns
Dat
a
LERNER (Lerner Index) Price minus marginal cost scaled by price Own calculation
GDP Real GDP per capita growth WDI
INFL Inflation rate, GDP deflator WDI
IND Industry value added as percentage of GDP WDI
RPOP Share of rural population (percentage) WDI
RPOPGR Growth in rural population WDI
CREDIT Private credit by deposit money banks and other financial institutions as a share of GDP
WDI
SPREAD Net interest margin WDI
Quality of Institutions Aggregate governance indicators of control of corruption, political stability and absence of violence, regulatory quality and rule of law
WGI
Co
un
try
lev
el D
ata
MIX Market = the Microfinance Information Exchange (www.mixmarket.org); WDI = World Development
Indicators (WDI Online); WGI = Worldwide Governance Indicators
36
Table 3: Regional distribution and legal status of MFIs
Regional distribution Number of MFIs
Africa 68
East Asia and the Pacific 68
Eastern Europe and Central Asia 76
Latin America and the Caribbean 96
Middle East and North Africa 2
South Asia 52
Legal status
Bank 79
Credit Union / Cooperative 3
NBFI 225
Rural Bank 55
37
Table 4: Summary statistics of the value of the Lerner index, by region
Region Obs. Mean Median SD Max. Min.
Africa 220 0.577 0.596 0.128 0.930 0.078
East Asia & the Pacific 241 0.568 0.587 0.095 0.725 0.047
Eastern Europe & Central Asia 264 0.607 0.617 0.107 0.811 0.068
Latin America & The Caribbean 349 0.617 0.630 0.085 0.830 0.140
Middle East & North Africa 7 0.622 0.625 0.016 0.638 0.589
South Asia 166 0.492 0.505 0.132 0.763 0.034
Total 1247 0.582 0.600 0.114 0.930 0.034
38
Table 5: Descriptive statistics of dependent variables
Variable N Mean S.D. Max. Min.
Active borrowers (in thousands) 1236 92.2 403.47 6210 0
% of women 1043 0.597 0.255 1.00 0 Outreach
Loan size (in thousands USD) 943 0.659 0.919 10.15 0.036
OER 1189 0.172 0.123 0.919 0.008 Efficiency
CPB (in USD) 1134 192.28 191.76 1302 1.00
PAR30 1205 0.054 0.070 0.764 0
PAR90 1223 0.036 0.056 0.590 0 Repayment
WOR 1144 0.016 0.032 0.350 -0.001
OSS 1247 1.187 0.321 5.219 0.398
ROA 1189 0.022 0.069 0.600 -0.554 Profitability
Profit margin 1247 0.100 0.253 0.724 -1.511
39
Table 6: Descriptive statistics of explanatory variables
N Mean S.D. Max. Min.
Age (in years) 1247 11.5 11.15 52 0
Size (in million USD) 1247 85.4 311 5,500 0.057
Real yield 1185 0.264 0.191 1.824 -0.157
GDP growth 1241 5.26 3.72 33 -9
Inflation 1241 9.13 6.22 45 -2
Industry value added 1194 15.87 6.37 44 0
Rural population 1241 52.57 21.32 90 7
Rural population growth 1241 0.53 1.09 4 -5
Private Credit to GDP 1178 29.50 17.88 164 3
Spread 972 9.729 6.526 54 2
Control of corruption 1242 -0.627 0.355 1.4 -1.6
Political stability 1238 -0.802 0.626 0.9 -2.6
Regulatory quality 1238 -0.308 0.438 1.6 -1.7
Rule of Law 1242 -0.646 0.391 1.2 -2.1
Lerner 1247 0.582 0.114 0.930 0.034
40
Table 7: Correlation coefficient matrix of explanatory variables
[1] [2] [3] [4] [5] [6] [7] [8] [9] [10] [11] [12] [13] [14] [15]
[1] Age 1.0000
[2] Size 0.3172* 1.0000
[3] Real yield -0.1207* -0.0858* 1.0000
[4] GDP growth -0.1788* -0.0134 -0.1124* 1.0000
[5] Inflation -0.1176* 0.0233 -0.1692* 0.0374 1.0000
[6] Industry value added 0.2732* 0.0405 0.1369* -0.1617* -0.1936* 1.0000
[7] Rural pop. -0.1046* -0.1005* -0.2510* 0.0901* 0.0860* -0.3345* 1.0000
[8] Rural pop. growth -0.1074* -0.1150* -0.0332 0.0583* -0.0244 -0.4287* 0.6641* 1.0000
[9] Pr. Credit/GDP 0.0315 0.0791* -0.0966* -0.1154* -0.0745* 0.0846* -0.1083* -0.1682* 1.0000
[10] Spread -0.1382* -0.0506 0.0691* 0.1564* -0.0187 -0.1365* 0.0009 0.1129* -0.2865* 1.0000
[11] Control of corruption -0.0638* 0.0638* 0.1506* -0.0769* -0.2342* 0.0725* -0.3495* -0.2100* 0.4483* -0.0865* 1.0000
[12] Political stability -0.1500* -0.0160 0.2135* 0.1384* 0.0275 0.0761* -0.3225* -0.2114* 0.1312* 0.1907* 0.3053* 1.0000
[13] Regulatory quality 0.0892* 0.0571* 0.3324* -0.0354 -0.4111* 0.3032* -0.4555* -0.2180* 0.2742* -0.0189 0.6637* 0.3602* 1.0000
[14] Rule of Law 0.0649* 0.0182 0.0004 0.0098 -0.2323* 0.0563 -0.1128* -0.0732* 0.5482* -0.3037* 0.7599* 0.2271* 0.5787* 1.0000
[15] Lerner 0.1361* 0.0469 0.0996* 0.0543 0.0413 0.0251 -0.1819* -0.1142* -0.0578* 0.1789* 0.0774* 0.1631* 0.0993* -0.0674* 1.0000
* indicates significance at 5% level.
41
Table 8a: Estimation results – Effect of competition on outreach and loan repayment
NBORROWa WOMEN LOAN
SIZEa
PAR30 PAR90 WOR
AGEa 0.556*** 0.00162 -0.225* 0.0222* 0.0315*** 0.0182***
(0.118) (0.0404) (0.115) (0.0126) (0.00981) (0.00549)
AGE2 -0.0681 0.0156 -0.00281 -0.00262 -0.00450* -0.0041***
(0.0589) (0.0207) (0.0550) (0.00318) (0.00248) (0.00136)
SIZEa 0.644*** -0.0283* 0.298*** -0.0079*** -0.0077*** 0.000993
(0.0422) (0.0156) (0.0406) (0.00222) (0.00175) (0.000872)
YIELD 0.551*** -0.00305 -0.662*** 0.0247 -0.00609 0.0615***
(0.149) (0.0531) (0.130) (0.0178) (0.0141) (0.00771)
GDPGR 0.000425 0.00126 -0.00131 -0.0026*** -0.0018*** -0.000229
(0.00404) (0.00148) (0.00382) (0.000649) (0.000511) (0.000326)
INFLa 0.00886 0.00489 -0.00463 -0.00387 -0.00300 0.000717
(0.0266) (0.00962) (0.0243) (0.00414) (0.00324) (0.00203)
IND 0.0148* 0.00820** -0.0127 0.000504 0.000503 0.000116
(0.00895) (0.00404) (0.0113) (0.000650) (0.000514) (0.000255)
RPOP -0.000785 0.00733 -0.0516** -0.0005* -0.0005** -8.67e-05
(0.0228) (0.00906) (0.0205) (0.00027) (0.00022) (0.000103)
RPOPGR 0.0570 0.00812 -0.0449 0.00774* 0.00567 0.00347*
(0.0556) (0.0197) (0.0612) (0.00471) (0.00370) (0.00185)
CREDIT -0.00690** 0.00182 0.0167*** 0.000140 -1.28e-05 0.000138
(0.00330) (0.00123) (0.00373) (0.000259) (0.000204) (0.000102)
SPREAD 0.00584 -0.00205 0.00278 0.000372 0.000390 0.000370
(0.00528) (0.00186) (0.00561) (0.000567) (0.000440) (0.000245)
Control of corruption 0.0238 -0.0773* -0.238** -0.0304** -0.0262** 0.00896
(0.111) (0.0418) (0.103) (0.0149) (0.0114) (0.00706)
Political stability -0.0502 0.0255 0.165** -0.0277*** -0.0239*** -0.000142
(0.0731) (0.0275) (0.0690) (0.00681) (0.00536) (0.00280)
Regulatory quality 0.0168 -0.0549 -0.0786 -0.00371 -0.00611 0.000893
(0.0951) (0.0353) (0.0950) (0.0114) (0.00896) (0.00501)
Rule of law -0.0655 -0.0236 0.0779 0.0499*** 0.0452*** -0.00722
(0.148) (0.0550) (0.143) (0.0183) (0.0142) (0.00835)
trend -0.00190** -0.000535 0.00140* 6.35e-05 3.75e-05 -2.03e-05
(0.000916) (0.000344) (0.000833) (4.62e-05) (3.63e-05) (1.89e-05)
LERNER -0.352* -0.0310 -0.263 0.0311 0.0485** 0.037***
(0.191) (0.0682) (0.177) (0.0263) (0.0209) (0.0122)
Constant -2.12 0.390 4.13*** 0.190*** 0.176*** -0.0134
(1.35) (0.535) (1.29) (0.0487) (0.0384) (0.0204)
R-squared 0.674 0.073 0.570 0.16 0.20 0.19
Hausman test[p-
value]
0.0000 0.0000 0.0010 0.4604 0.3912 0.2508
Observations 827 685 631 801 819 804
No. of MFIs 275 239 217 273 272 276 a Logarithm of the variable is included in the estimations; standard errors in parentheses; ***, **, *-
significant at 1%, 5% and 10%, respectively.
42
Table 8b: Estimation results – Effect of competition on efficiency and profitability
OER CPBa OSS ROA MARGIN
AGEa -0.0230* -0.378*** -0.165*** 0.0190 0.102***
(0.0139) (0.0996) (0.0445) (0.0145) (0.0348)
AGE2 0.0237*** 0.106** 0.0358*** -0.0143** -0.0815***
(0.00697) (0.0489) (0.0113) (0.00728) (0.0175)
SIZEa -0.0367*** 0.0931*** -0.00127 0.00283 0.0376***
(0.00505) (0.0350) (0.00798) (0.00527) (0.0127)
YIELD 0.244*** 0.379*** -0.178*** -0.0244 -0.0210
(0.0178) (0.122) (0.0643) (0.0185) (0.0446)
GDPGR -0.00104** -0.00939*** 0.00389* 0.00104** 0.00442***
(0.000483) (0.00338) (0.00232) (0.000505) (0.00121)
INFLa 0.00357 -0.0267 0.0153 0.00222 0.00953
(0.00317) (0.0216) (0.0148) (0.00331) (0.00796)
IND 0.00117 -0.0160** 0.000747 7.74e-05 0.00320
(0.00107) (0.00732) (0.00235) (0.00112) (0.00269)
RPOP -0.00697*** -0.0747*** 0.00246** -0.00076 0.00848
(0.00268) (0.0187) (0.000990) (0.00280) (0.00674)
RPOPGR 0.00209 -0.0436 0.00252 0.00206 -0.0430**
(0.00665) (0.0449) (0.0170) (0.00695) (0.0167)
CREDIT 3.35e-05 0.00765*** -1.31e-05 1.29e-05 0.000938
(0.000394) (0.00278) (0.000940) (0.000411) (0.000989)
SPREAD -0.000362 -0.0109** 2.40e-06 -0.000319 0.000716
(0.000631) (0.00510) (0.00202) (0.000659) (0.00159)
Control of corruption -0.0173 -0.120 -0.0842 -0.0114 -0.0575*
(0.0132) (0.0906) (0.0520) (0.0138) (0.0332)
Political stability -0.00839 -0.00113 -0.0339 -0.00848 -0.00276
(0.00868) (0.0600) (0.0245) (0.00906) (0.0218)
Regulatory quality 0.0265** 0.0864 0.0183 -0.00956 -0.0381
(0.0113) (0.0778) (0.0408) (0.0118) (0.0284)
Rule of law -0.0301* 0.144 0.00713 -0.000300 0.0154
(0.0176) (0.120) (0.0646) (0.0184) (0.0443)
Trend -0.000138 0.000747 0.000591*** 3.04e-05 0.000549**
(0.000108) (0.000752) (0.000167) (0.000112) (0.000270)
LERNER 0.267*** 1.065*** -2.281*** -0.617*** -2.113***
(0.0228) (0.155) (0.0948) (0.0238) (0.0574)
Constant 1.110*** 7.987*** 0.249 0.340** -2.18***
(0.159) (1.112) (0.176) (0.166) (0.398)
R-squared 0.48 0.33 0.36 0.57 0.74
Hausman test[p-value] 0.0000 0.0000 0.2537 0.0427 0.5890
Observations 832 799 833 832 833
No. of MFIs 276 264 276 276 276 a Logarithm of the variable is included in the estimations; standard errors in parentheses; ***, **, *-
significant at 1%, 5% and 10%, respectively.
43
Table 9: Summary of results
Effect of increased competition on Estimated sign Expected sign
Outreach – +/–
Repayment – –
Cost efficiency – +/–
Profitability – –
44
Figure 1: Evolution of the value of the Lerner index, 2000-2008