Embed Size (px)
Citation preview
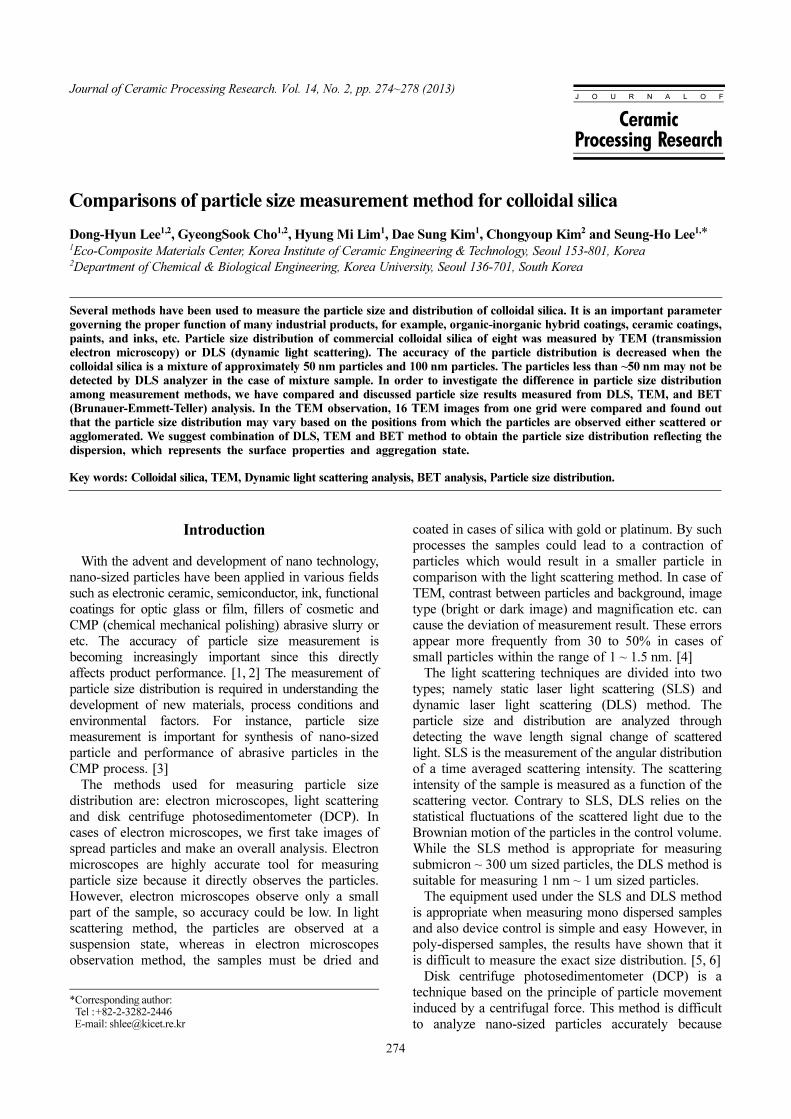
Journal of Ceramic Processing Research. Vol. 14, No. 2, pp. 274~278 (2013)
274
J O U R N A L O F
CeramicProcessing Research
Comparisons of particle size measurement method for colloidal silica
Dong-Hyun Lee1,2, GyeongSook Cho1,2, Hyung Mi Lim1, Dae Sung Kim1, Chongyoup Kim2 and Seung-Ho Lee1,*1Eco-Composite Materials Center, Korea Institute of Ceramic Engineering & Technology, Seoul 153-801, Korea2Department of Chemical & Biological Engineering, Korea University, Seoul 136-701, South Korea
Several methods have been used to measure the particle size and distribution of colloidal silica. It is an important parametergoverning the proper function of many industrial products, for example, organic-inorganic hybrid coatings, ceramic coatings,paints, and inks, etc. Particle size distribution of commercial colloidal silica of eight was measured by TEM (transmissionelectron microscopy) or DLS (dynamic light scattering). The accuracy of the particle distribution is decreased when thecolloidal silica is a mixture of approximately 50 nm particles and 100 nm particles. The particles less than ~50 nm may not bedetected by DLS analyzer in the case of mixture sample. In order to investigate the difference in particle size distributionamong measurement methods, we have compared and discussed particle size results measured from DLS, TEM, and BET(Brunauer-Emmett-Teller) analysis. In the TEM observation, 16 TEM images from one grid were compared and found outthat the particle size distribution may vary based on the positions from which the particles are observed either scattered oragglomerated. We suggest combination of DLS, TEM and BET method to obtain the particle size distribution reflecting thedispersion, which represents the surface properties and aggregation state.
Key words: Colloidal silica, TEM, Dynamic light scattering analysis, BET analysis, Particle size distribution.
Introduction
With the advent and development of nano technology,
nano-sized particles have been applied in various fields
such as electronic ceramic, semiconductor, ink, functional
coatings for optic glass or film, fillers of cosmetic and
CMP (chemical mechanical polishing) abrasive slurry or
etc. The accuracy of particle size measurement is
becoming increasingly important since this directly
affects product performance. [1, 2] The measurement of
particle size distribution is required in understanding the
development of new materials, process conditions and
environmental factors. For instance, particle size
measurement is important for synthesis of nano-sized
particle and performance of abrasive particles in the
CMP process. [3]
The methods used for measuring particle size
distribution are: electron microscopes, light scattering
and disk centrifuge photosedimentometer (DCP). In
cases of electron microscopes, we first take images of
spread particles and make an overall analysis. Electron
microscopes are highly accurate tool for measuring
particle size because it directly observes the particles.
However, electron microscopes observe only a small
part of the sample, so accuracy could be low. In light
scattering method, the particles are observed at a
suspension state, whereas in electron microscopes
observation method, the samples must be dried and
coated in cases of silica with gold or platinum. By such
processes the samples could lead to a contraction of
particles which would result in a smaller particle in
comparison with the light scattering method. In case of
TEM, contrast between particles and background, image
type (bright or dark image) and magnification etc. can
cause the deviation of measurement result. These errors
appear more frequently from 30 to 50% in cases of
small particles within the range of 1 ~ 1.5 nm. [4]
The light scattering techniques are divided into two
types; namely static laser light scattering (SLS) and
dynamic laser light scattering (DLS) method. The
particle size and distribution are analyzed through
detecting the wave length signal change of scattered
light. SLS is the measurement of the angular distribution
of a time averaged scattering intensity. The scattering
intensity of the sample is measured as a function of the
scattering vector. Contrary to SLS, DLS relies on the
statistical fluctuations of the scattered light due to the
Brownian motion of the particles in the control volume.
While the SLS method is appropriate for measuring
submicron ~ 300 um sized particles, the DLS method is
suitable for measuring 1 nm ~ 1 um sized particles.
The equipment used under the SLS and DLS method
is appropriate when measuring mono dispersed samples
and also device control is simple and easy. However, in
poly-dispersed samples, the results have shown that it
is difficult to measure the exact size distribution. [5, 6]
Disk centrifuge photosedimentometer (DCP) is a
technique based on the principle of particle movement
induced by a centrifugal force. This method is difficult
to analyze nano-sized particles accurately because
*Corresponding author: Tel : +82-2-3282-2446E-mail: [email protected]
Comparisons of particle size measurement method for colloidal silica 275
these particles are affected by Brownian motion as well
as centrifugal force. [6]
As mentioned above, the measurement result of
colloid particle can vary depending on the equipment
used. Thus, it is necessary to understand and analyze
the morphology, distribution and size of particle using
various equipments such as electron microscopes, DLS
and DCP; rather than using only one tool in observing
the size of the particle. If the colloidal silica particles
are uniform and spherical, the BET, TEM and DLS
methods shows similar results. In this study, we measured
8 kinds of commercial colloidal silica using DLS, TEM
and BET and compared its mean particle size.
In DLS method, since the particle size of multimodal
distribution or bimodal distribution sample affects the
detecting sensitivity, this could lead to a deviation from
the actual value. In order to identify these differences,
we studied particle size distribution of bimodal silica
colloids by mixing two mono-dispersed silica colloids
having different particle size using DLS and TEM.
Experimental procedure
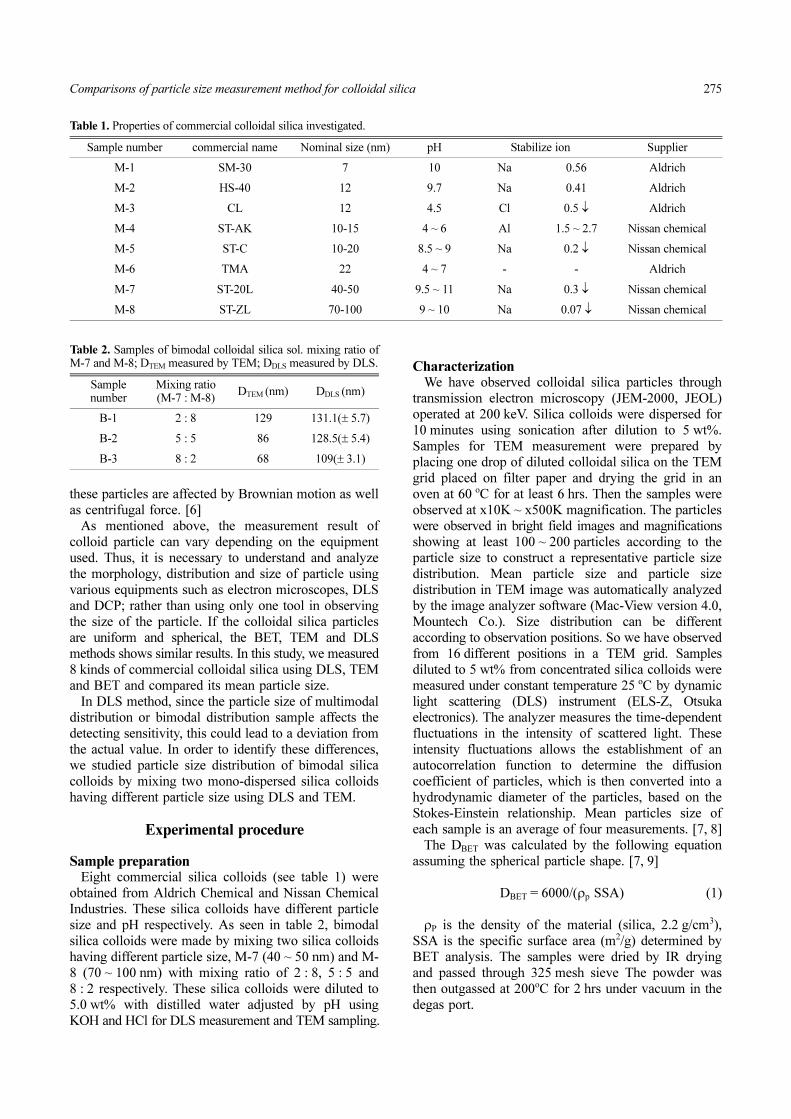
Sample preparationEight commercial silica colloids (see table 1) were
obtained from Aldrich Chemical and Nissan Chemical
Industries. These silica colloids have different particle
size and pH respectively. As seen in table 2, bimodal
silica colloids were made by mixing two silica colloids
having different particle size, M-7 (40 ~ 50 nm) and M-
8 (70 ~ 100 nm) with mixing ratio of 2 : 8, 5 : 5 and
8 : 2 respectively. These silica colloids were diluted to
5.0 wt% with distilled water adjusted by pH using
KOH and HCl for DLS measurement and TEM sampling.
CharacterizationWe have observed colloidal silica particles through
transmission electron microscopy (JEM-2000, JEOL)
operated at 200 keV. Silica colloids were dispersed for
10 minutes using sonication after dilution to 5 wt%.
Samples for TEM measurement were prepared by
placing one drop of diluted colloidal silica on the TEM
grid placed on filter paper and drying the grid in an
oven at 60 oC for at least 6 hrs. Then the samples were
observed at x10K ~ x500K magnification. The particles
were observed in bright field images and magnifications
showing at least 100 ~ 200 particles according to the
particle size to construct a representative particle size
distribution. Mean particle size and particle size
distribution in TEM image was automatically analyzed
by the image analyzer software (Mac-View version 4.0,
Mountech Co.). Size distribution can be different
according to observation positions. So we have observed
from 16 different positions in a TEM grid. Samples
diluted to 5 wt% from concentrated silica colloids were
measured under constant temperature 25 oC by dynamic
light scattering (DLS) instrument (ELS-Z, Otsuka
electronics). The analyzer measures the time-dependent
fluctuations in the intensity of scattered light. These
intensity fluctuations allows the establishment of an
autocorrelation function to determine the diffusion
coefficient of particles, which is then converted into a
hydrodynamic diameter of the particles, based on the
Stokes-Einstein relationship. Mean particles size of
each sample is an average of four measurements. [7, 8]
The DBET was calculated by the following equation
assuming the spherical particle shape. [7, 9]
DBET = 6000/(ρp SSA) (1)
ρP is the density of the material (silica, 2.2 g/cm3),
SSA is the specific surface area (m2/g) determined by
BET analysis. The samples were dried by IR drying
and passed through 325 mesh sieve The powder was
then outgassed at 200oC for 2 hrs under vacuum in the
degas port.
Table 1. Properties of commercial colloidal silica investigated.
Sample number commercial name Nominal size (nm) pH Stabilize ion Supplier
M-1 SM-30 7 10 Na 0.56 Aldrich
M-2 HS-40 12 9.7 Na 0.41 Aldrich
M-3 CL 12 4.5 Cl 0.5 ↓ Aldrich
M-4 ST-AK 10-15 4 ~ 6 Al 1.5 ~ 2.7 Nissan chemical
M-5 ST-C 10-20 8.5 ~ 9 Na 0.2 ↓ Nissan chemical
M-6 TMA 22 4 ~ 7 - - Aldrich
M-7 ST-20L 40-50 9.5 ~ 11 Na 0.3 ↓ Nissan chemical
M-8 ST-ZL 70-100 9 ~ 10 Na 0.07 ↓ Nissan chemical
Table 2. Samples of bimodal colloidal silica sol. mixing ratio ofM-7 and M-8; DTEM measured by TEM; DDLS measured by DLS.
Samplenumber
Mixing ratio(M-7 : M-8)
DTEM (nm) DDLS (nm)
B-1 2 : 8 129 131.1(± 5.7)
B-2 5 : 5 86 128.5(± 5.4)
B-3 8 : 2 68 109(± 3.1)
276 Dong-Hyun Lee, GyeongSook Cho, Hyung Mi Lim, Dae Sung Kim, Chongyoup Kim and Seung-Ho Lee
Results and discussion
Particle size of mono-dispersed colloidal silicaWe studied the mean particle size of commercial
silica colloids using TEM image analysis, DLS analyzer
and BET measurement. The results were compared
with one another.
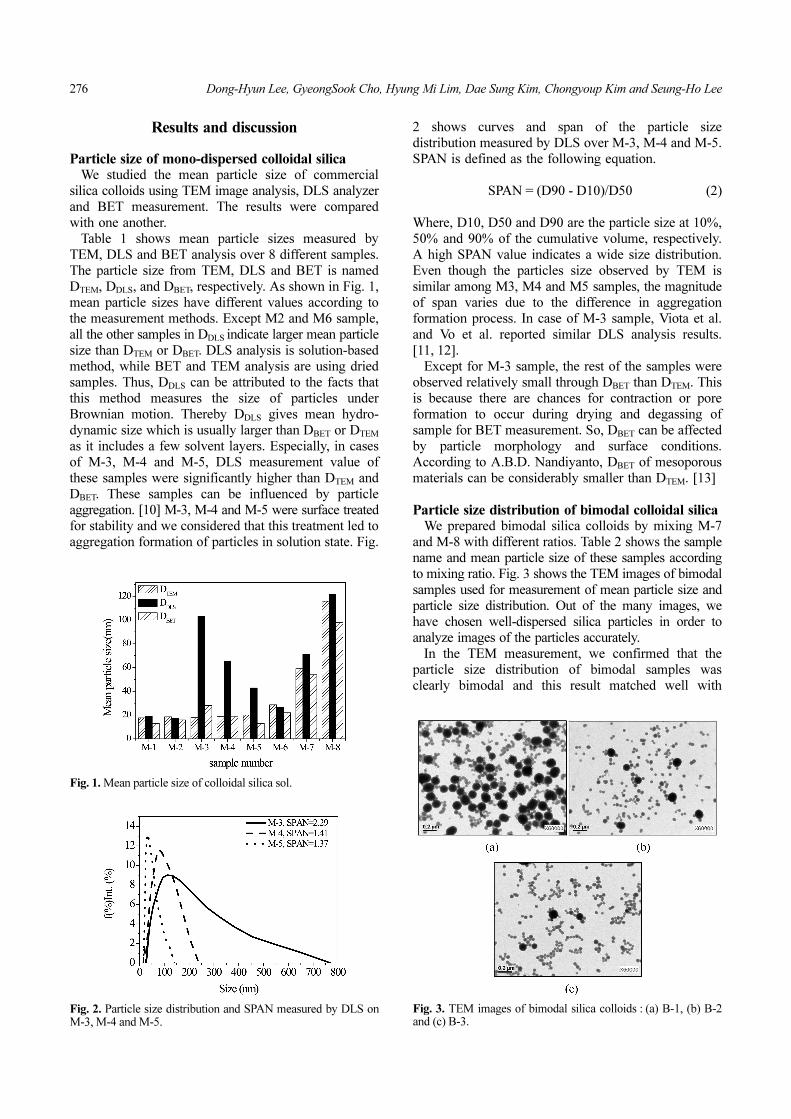
Table 1 shows mean particle sizes measured by
TEM, DLS and BET analysis over 8 different samples.
The particle size from TEM, DLS and BET is named
DTEM, DDLS, and DBET, respectively. As shown in Fig. 1,
mean particle sizes have different values according to
the measurement methods. Except M2 and M6 sample,
all the other samples in DDLS indicate larger mean particle
size than DTEM or DBET. DLS analysis is solution-based
method, while BET and TEM analysis are using dried
samples. Thus, DDLS can be attributed to the facts that
this method measures the size of particles under
Brownian motion. Thereby DDLS gives mean hydro-
dynamic size which is usually larger than DBET or DTEM
as it includes a few solvent layers. Especially, in cases
of M-3, M-4 and M-5, DLS measurement value of
these samples were significantly higher than DTEM and
DBET. These samples can be influenced by particle
aggregation. [10] M-3, M-4 and M-5 were surface treated
for stability and we considered that this treatment led to
aggregation formation of particles in solution state. Fig.
2 shows curves and span of the particle size
distribution measured by DLS over M-3, M-4 and M-5.
SPAN is defined as the following equation.
SPAN = (D90 - D10)/D50 (2)
Where, D10, D50 and D90 are the particle size at 10%,
50% and 90% of the cumulative volume, respectively.
A high SPAN value indicates a wide size distribution.
Even though the particles size observed by TEM is
similar among M3, M4 and M5 samples, the magnitude
of span varies due to the difference in aggregation
formation process. In case of M-3 sample, Viota et al.
and Vo et al. reported similar DLS analysis results.
[11, 12].
Except for M-3 sample, the rest of the samples were
observed relatively small through DBET than DTEM. This
is because there are chances for contraction or pore
formation to occur during drying and degassing of
sample for BET measurement. So, DBET can be affected
by particle morphology and surface conditions.
According to A.B.D. Nandiyanto, DBET of mesoporous
materials can be considerably smaller than DTEM. [13]
Particle size distribution of bimodal colloidal silicaWe prepared bimodal silica colloids by mixing M-7
and M-8 with different ratios. Table 2 shows the sample
name and mean particle size of these samples according
to mixing ratio. Fig. 3 shows the TEM images of bimodal
samples used for measurement of mean particle size and
particle size distribution. Out of the many images, we
have chosen well-dispersed silica particles in order to
analyze images of the particles accurately.
In the TEM measurement, we confirmed that the
particle size distribution of bimodal samples was
clearly bimodal and this result matched well with
Fig. 1. Mean particle size of colloidal silica sol.
Fig. 2. Particle size distribution and SPAN measured by DLS onM-3, M-4 and M-5.
Fig. 3. TEM images of bimodal silica colloids : (a) B-1, (b) B-2and (c) B-3.
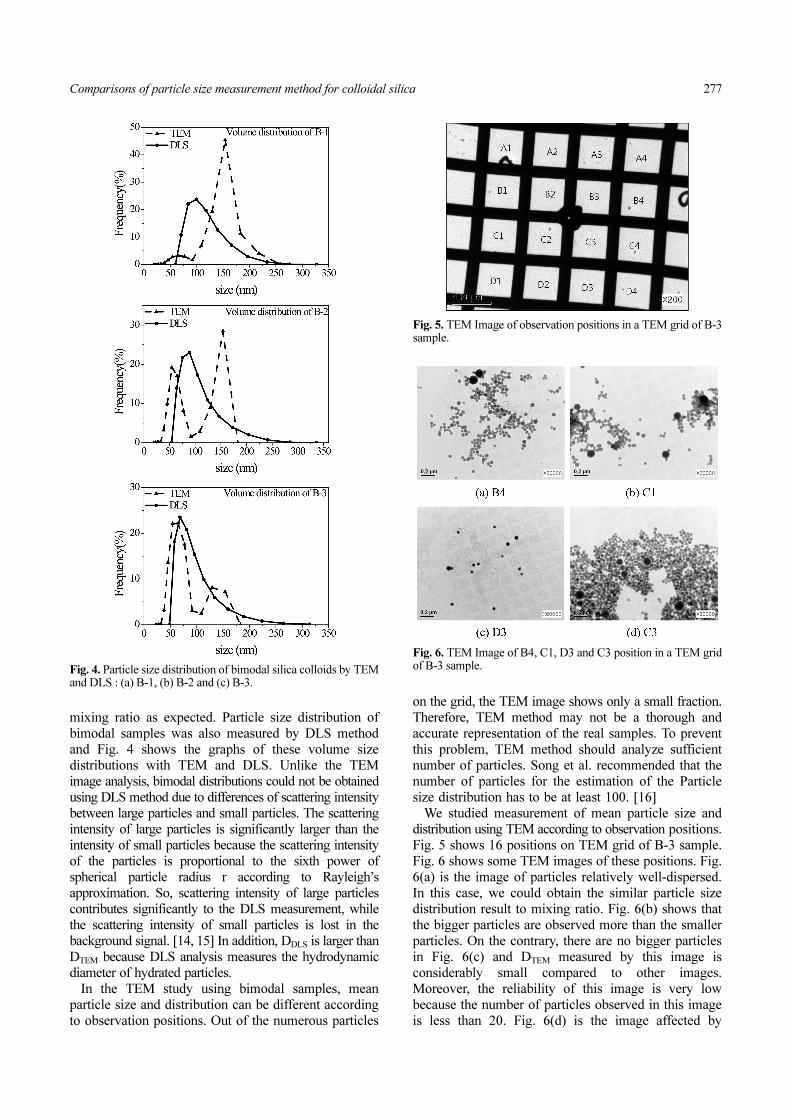
Comparisons of particle size measurement method for colloidal silica 277
mixing ratio as expected. Particle size distribution of
bimodal samples was also measured by DLS method
and Fig. 4 shows the graphs of these volume size
distributions with TEM and DLS. Unlike the TEM
image analysis, bimodal distributions could not be obtained
using DLS method due to differences of scattering intensity
between large particles and small particles. The scattering
intensity of large particles is significantly larger than the
intensity of small particles because the scattering intensity
of the particles is proportional to the sixth power of
spherical particle radius r according to Rayleigh’s
approximation. So, scattering intensity of large particles
contributes significantly to the DLS measurement, while
the scattering intensity of small particles is lost in the
background signal. [14, 15] In addition, DDLS is larger than
DTEM because DLS analysis measures the hydrodynamic
diameter of hydrated particles.
In the TEM study using bimodal samples, mean
particle size and distribution can be different according
to observation positions. Out of the numerous particles
on the grid, the TEM image shows only a small fraction.
Therefore, TEM method may not be a thorough and
accurate representation of the real samples. To prevent
this problem, TEM method should analyze sufficient
number of particles. Song et al. recommended that the
number of particles for the estimation of the Particle
size distribution has to be at least 100. [16]
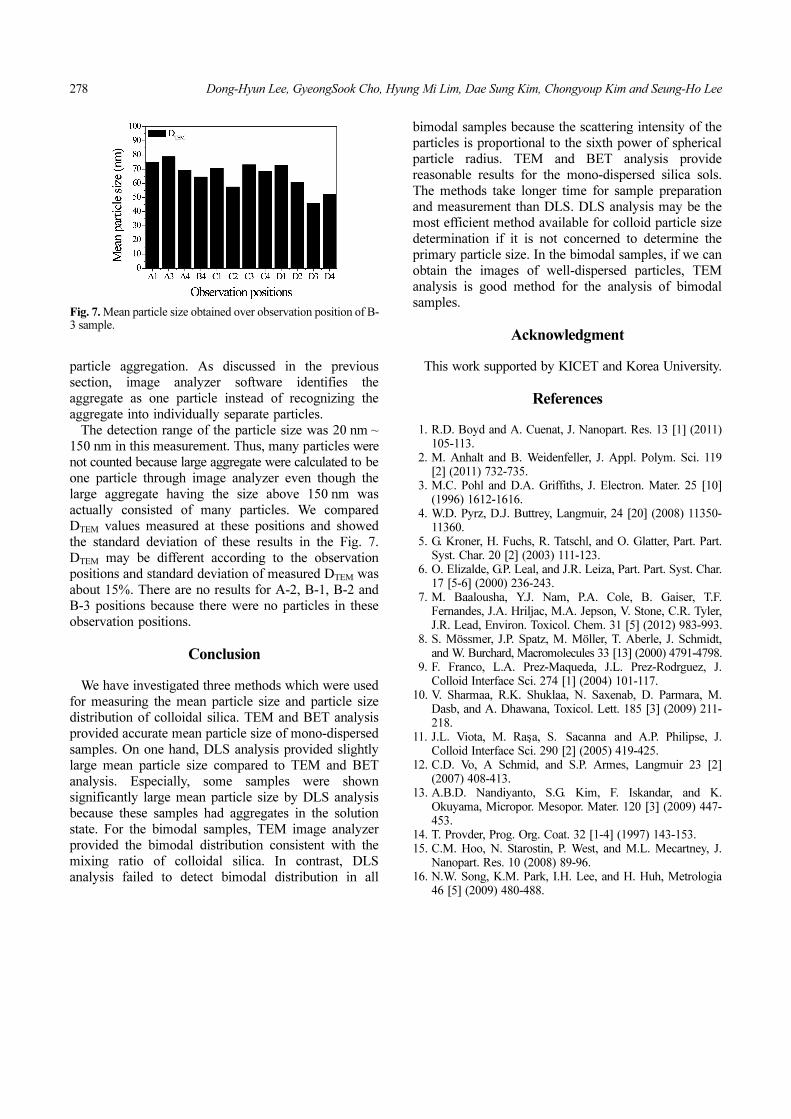
We studied measurement of mean particle size and
distribution using TEM according to observation positions.
Fig. 5 shows 16 positions on TEM grid of B-3 sample.
Fig. 6 shows some TEM images of these positions. Fig.
6(a) is the image of particles relatively well-dispersed.
In this case, we could obtain the similar particle size
distribution result to mixing ratio. Fig. 6(b) shows that
the bigger particles are observed more than the smaller
particles. On the contrary, there are no bigger particles
in Fig. 6(c) and DTEM measured by this image is
considerably small compared to other images.
Moreover, the reliability of this image is very low
because the number of particles observed in this image
is less than 20. Fig. 6(d) is the image affected by
Fig. 4. Particle size distribution of bimodal silica colloids by TEMand DLS : (a) B-1, (b) B-2 and (c) B-3.
Fig. 5. TEM Image of observation positions in a TEM grid of B-3sample.
Fig. 6. TEM Image of B4, C1, D3 and C3 position in a TEM gridof B-3 sample.
278 Dong-Hyun Lee, GyeongSook Cho, Hyung Mi Lim, Dae Sung Kim, Chongyoup Kim and Seung-Ho Lee
particle aggregation. As discussed in the previous
section, image analyzer software identifies the
aggregate as one particle instead of recognizing the
aggregate into individually separate particles.
The detection range of the particle size was 20 nm ~
150 nm in this measurement. Thus, many particles were
not counted because large aggregate were calculated to be
one particle through image analyzer even though the
large aggregate having the size above 150 nm was
actually consisted of many particles. We compared
DTEM values measured at these positions and showed
the standard deviation of these results in the Fig. 7.
DTEM may be different according to the observation
positions and standard deviation of measured DTEM was
about 15%. There are no results for A-2, B-1, B-2 and
B-3 positions because there were no particles in these
observation positions.
Conclusion
We have investigated three methods which were used
for measuring the mean particle size and particle size
distribution of colloidal silica. TEM and BET analysis
provided accurate mean particle size of mono-dispersed
samples. On one hand, DLS analysis provided slightly
large mean particle size compared to TEM and BET
analysis. Especially, some samples were shown
significantly large mean particle size by DLS analysis
because these samples had aggregates in the solution
state. For the bimodal samples, TEM image analyzer
provided the bimodal distribution consistent with the
mixing ratio of colloidal silica. In contrast, DLS
analysis failed to detect bimodal distribution in all
bimodal samples because the scattering intensity of the
particles is proportional to the sixth power of spherical
particle radius. TEM and BET analysis provide
reasonable results for the mono-dispersed silica sols.
The methods take longer time for sample preparation
and measurement than DLS. DLS analysis may be the
most efficient method available for colloid particle size
determination if it is not concerned to determine the
primary particle size. In the bimodal samples, if we can
obtain the images of well-dispersed particles, TEM
analysis is good method for the analysis of bimodal
samples.
Acknowledgment
This work supported by KICET and Korea University.
References
1. R.D. Boyd and A. Cuenat, J. Nanopart. Res. 13 [1] (2011)105-113.
2. M. Anhalt and B. Weidenfeller, J. Appl. Polym. Sci. 119[2] (2011) 732-735.
3. M.C. Pohl and D.A. Griffiths, J. Electron. Mater. 25 [10](1996) 1612-1616.
4. W.D. Pyrz, D.J. Buttrey, Langmuir, 24 [20] (2008) 11350-11360.
5. G. Kroner, H. Fuchs, R. Tatschl, and O. Glatter, Part. Part.Syst. Char. 20 [2] (2003) 111-123.
6. O. Elizalde, G.P. Leal, and J.R. Leiza, Part. Part. Syst. Char.17 [5-6] (2000) 236-243.
7. M. Baalousha, Y.J. Nam, P.A. Cole, B. Gaiser, T.F.Fernandes, J.A. Hriljac, M.A. Jepson, V. Stone, C.R. Tyler,J.R. Lead, Environ. Toxicol. Chem. 31 [5] (2012) 983-993.
8. S. Mössmer, J.P. Spatz, M. Möller, T. Aberle, J. Schmidt,and W. Burchard, Macromolecules 33 [13] (2000) 4791-4798.
9. F. Franco, L.A. Prez-Maqueda, J.L. Prez-Rodrguez, J.Colloid Interface Sci. 274 [1] (2004) 101-117.
10. V. Sharmaa, R.K. Shuklaa, N. Saxenab, D. Parmara, M.Dasb, and A. Dhawana, Toxicol. Lett. 185 [3] (2009) 211-218.
11. J.L. Viota, M. Rasa, S. Sacanna and A.P. Philipse, J.Colloid Interface Sci. 290 [2] (2005) 419-425.
12. C.D. Vo, A Schmid, and S.P. Armes, Langmuir 23 [2](2007) 408-413.
13. A.B.D. Nandiyanto, S.G. Kim, F. Iskandar, and K.Okuyama, Micropor. Mesopor. Mater. 120 [3] (2009) 447-453.
14. T. Provder, Prog. Org. Coat. 32 [1-4] (1997) 143-153.15. C.M. Hoo, N. Starostin, P. West, and M.L. Mecartney, J.
Nanopart. Res. 10 (2008) 89-96.16. N.W. Song, K.M. Park, I.H. Lee, and H. Huh, Metrologia
46 [5] (2009) 480-488.
Fig. 7. Mean particle size obtained over observation position of B-3 sample.