Embed Size (px)
DESCRIPTION
Comparison of WTLN and OKLMA Data. William H. Beasley 1 , Stephanie Weiss 1 , Stan Heckman 2 1. School of Meteorology University of Oklahoma Norman, OK 73072 2. Stan Heckman Earth Networks Germantown, MD 20876. Sponsors and Supporters of the OKLMA. Compared OKLMA and WTLN Data - PowerPoint PPT Presentation
Citation preview
Comparison of WTLN and OKLMA Data
William H. Beasley1, Stephanie Weiss1, Stan Heckman2
1. School of MeteorologyUniversity of Oklahoma
Norman, OK 73072
2. Stan HeckmanEarth Networks
Germantown, MD 20876
Sponsors and Supporters of the OKLMA
Compared OKLMA and WTLN Data Detection Flash Classification
Examined limited data set Storm over the OKLMA January 20-21, 2010
Identified 116 flashes in the OKLMA VHF data Manually determined CG or IC Manually examined cognate WTLN data
Compared automated flash classification with OKLMA Examined waveforms and refined classifications
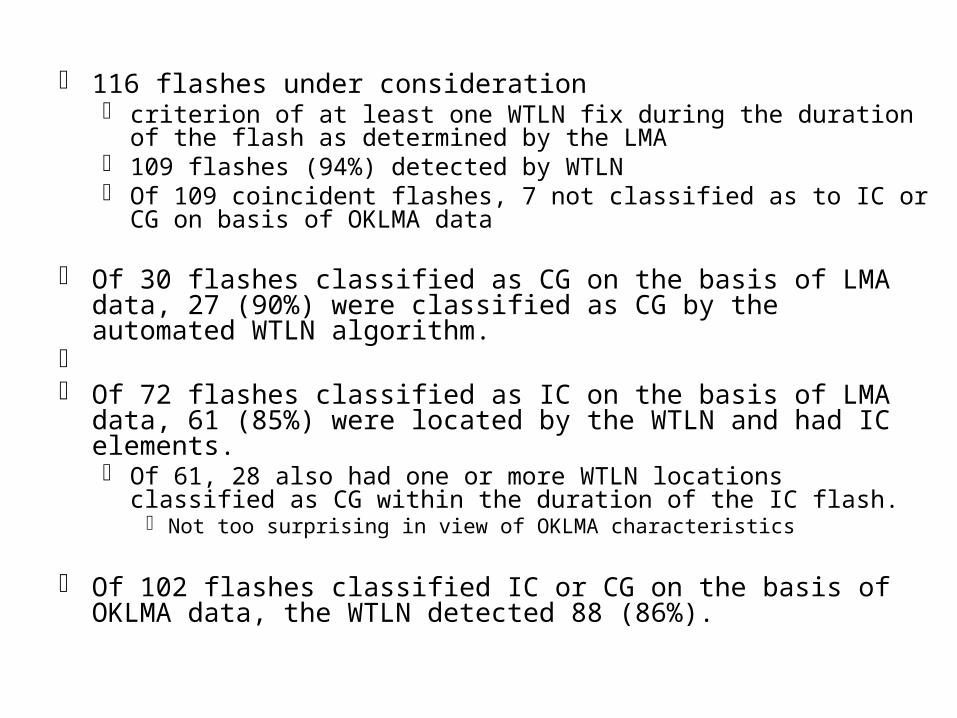
116 flashes under consideration criterion of at least one WTLN fix during the duration of the flash as
determined by the LMA 109 flashes (94%) detected by WTLN Of 109 coincident flashes, 7 not classified as to IC or CG on basis of
OKLMA data
Of 30 flashes classified as CG on the basis of LMA data, 27 (90%) were classified as CG by the automated WTLN algorithm.
Of 72 flashes classified as IC on the basis of LMA data, 61 (85%) were
located by the WTLN and had IC elements. Of 61, 28 also had one or more WTLN locations classified as CG within
the duration of the IC flash. Not too surprising in view of OKLMA characteristics
Of 102 flashes classified IC or CG on the basis of OKLMA data, the WTLN detected 88 (86%).
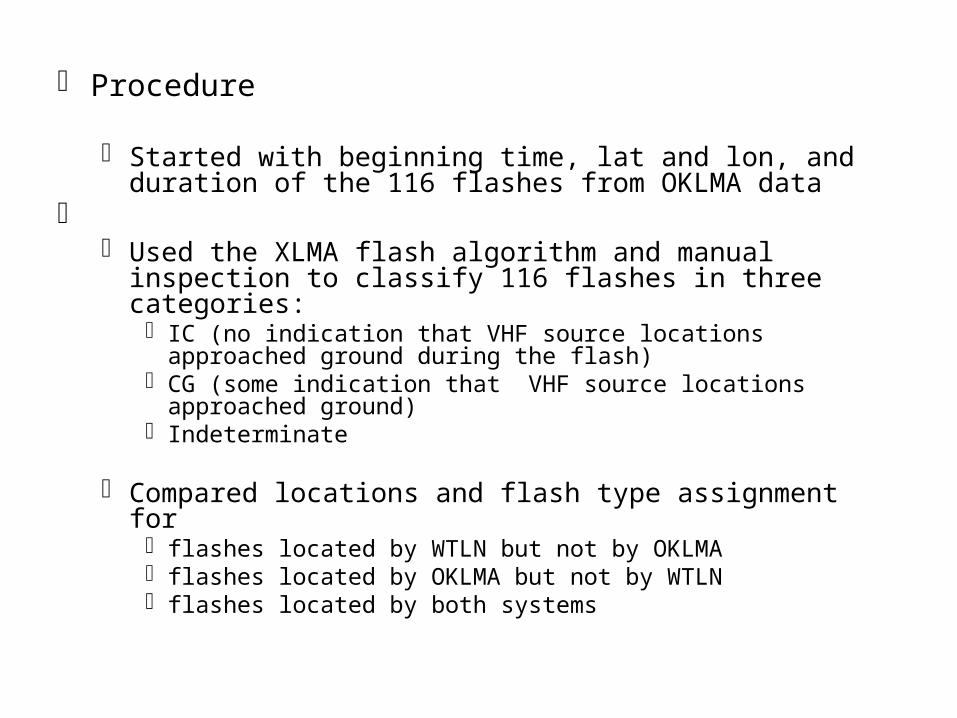
Procedure
Started with beginning time, lat and lon, and duration of the 116 flashes from OKLMA data
Used the XLMA flash algorithm and manual inspection to
classify 116 flashes in three categories: IC (no indication that VHF source locations approached ground during
the flash) CG (some indication that VHF source locations approached ground) Indeterminate
Compared locations and flash type assignment for flashes located by WTLN but not by OKLMA flashes located by OKLMA but not by WTLN flashes located by both systems
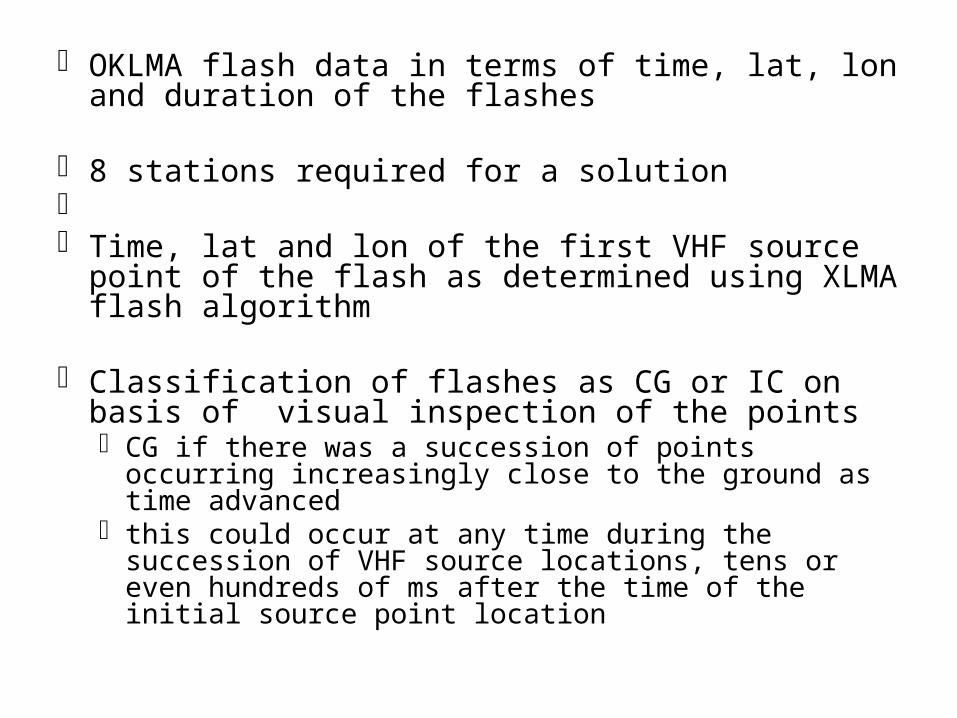
OKLMA flash data in terms of time, lat, lon and duration of the flashes
8 stations required for a solution Time, lat and lon of the first VHF source point of the
flash as determined using XLMA flash algorithm
Classification of flashes as CG or IC on basis of visual inspection of the points CG if there was a succession of points occurring
increasingly close to the ground as time advanced this could occur at any time during the succession of VHF
source locations, tens or even hundreds of ms after the time of the initial source point location
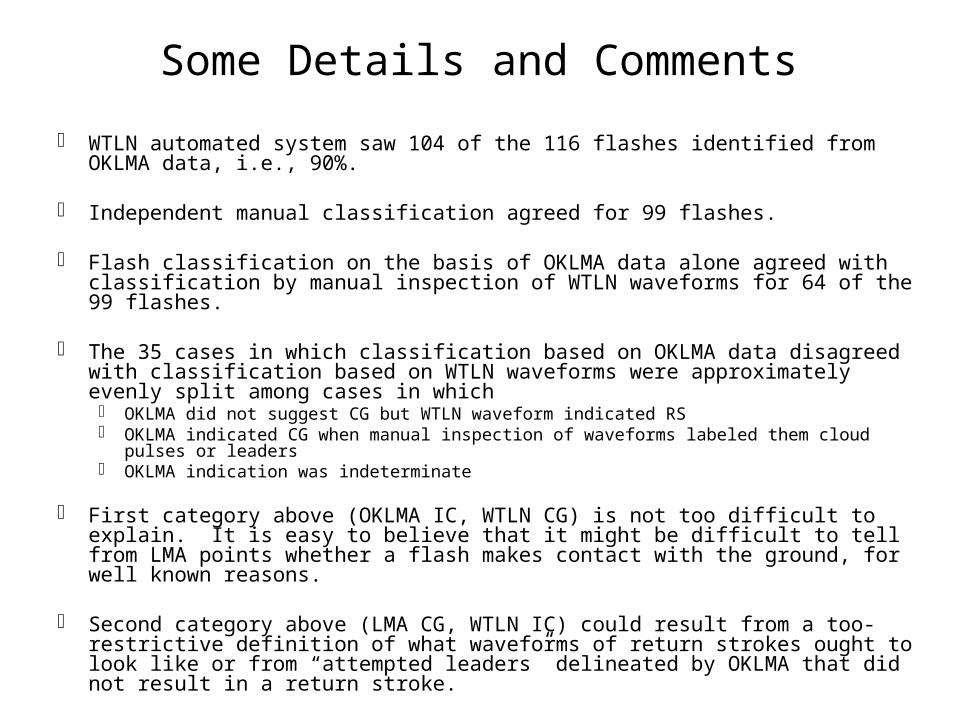
WTLN automated system saw 104 of the 116 flashes identified from OKLMA data, i.e., 90%.
Independent manual classification agreed for 99 flashes.
Flash classification on the basis of OKLMA data alone agreed with classification by manual inspection of WTLN waveforms for 64 of the 99 flashes.
The 35 cases in which classification based on OKLMA data disagreed with classification based on WTLN waveforms were approximately evenly split among cases in which OKLMA did not suggest CG but WTLN waveform indicated RS OKLMA indicated CG when manual inspection of waveforms labeled them cloud pulses or leaders OKLMA indication was indeterminate
First category above (OKLMA IC, WTLN CG) is not too difficult to explain. It is easy to believe that it might be difficult to tell from LMA points whether a flash makes contact with the ground, for well known reasons.
Second category above (LMA CG, WTLN IC) could result from a too-restrictive definition of what waveforms of return strokes ought to look like or from “attempted leaders” delineated by OKLMA that did not result in a return stroke.
Some Details and Comments
Flash Type as Function of Time
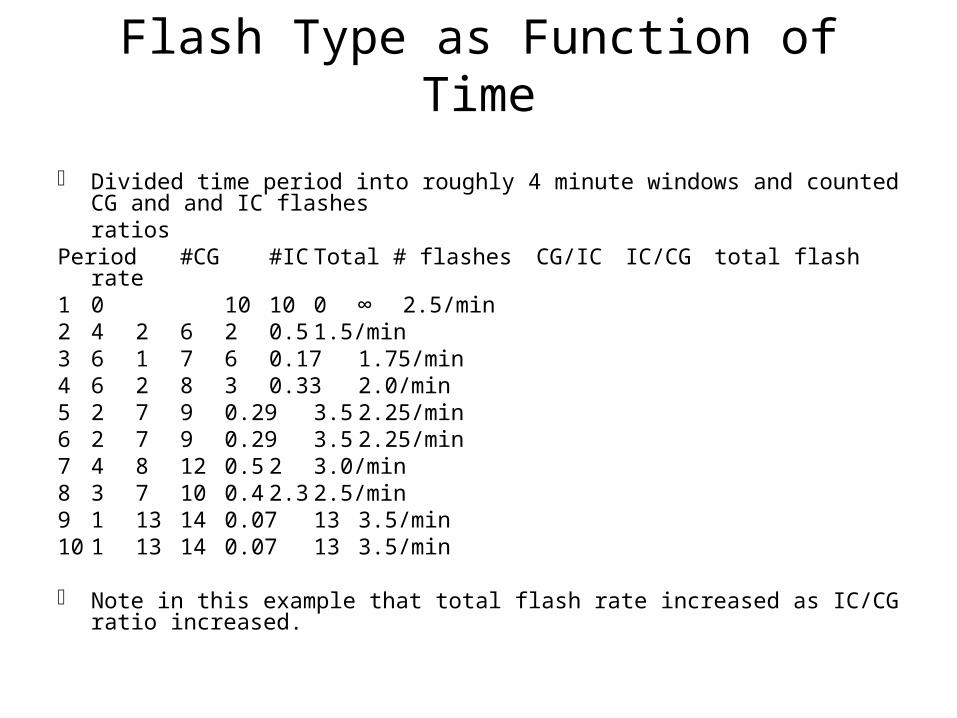
Divided time period into roughly 4 minute windows and counted CG and and IC flashes
ratiosPeriod #CG #IC Total # flashes CG/IC IC/CG total flash rate1 0 10 10 0 ∞ 2.5/min2 4 2 6 2 0.5 1.5/min3 6 1 7 6 0.17 1.75/min4 6 2 8 3 0.33 2.0/min5 2 7 9 0.29 3.5 2.25/min6 2 7 9 0.29 3.5 2.25/min7 4 8 12 0.5 2 3.0/min8 3 7 10 0.4 2.3 2.5/min9 1 13 14 0.07 13 3.5/min10 1 13 14 0.07 13 3.5/min
Note in this example that total flash rate increased as IC/CG ratio increased.
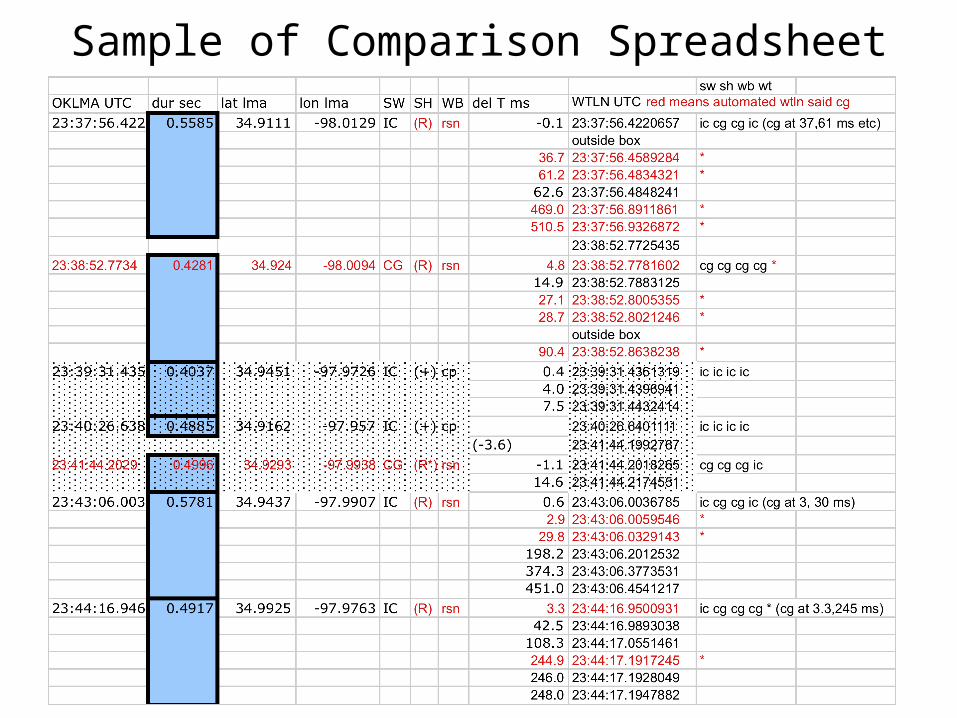
Sample of Comparison Spreadsheet
Comparison of LMA and WTLN classifications was based on WTLN waveform at time nearest the beginning of the OKLMA flash interval can be misleading CG sometimes ms to hundreds of ms after first point
CG flash in the WTLN data at a later time for many of the cases in which there was not one at the beginning
Determine best estimates of times of CG flashes as indicated by sources approaching the ground in the LMA data
Compare times with WTLN CG and IC flash times
Establish “ground truth”
video, delta E network
Suggestions for Future Comparisons

For this study
⚡WTLN detected approximately 90% of total lightning flashes as determined by OKLMA
⚡WTLN automated flash categorization was approximately 95% correct
Conclusion