Embed Size (px)
Citation preview

COMPARISON OF WIND LOAD STANDARDS
by
SHRINIVAS KOLA, B.S.C.E..
A THESIS
IN
CIVIL ENGINEERING
Submitted to the Graduate Faculty of Texas Tech University in
Partial Fulfillment of the Requirements for
the Degree of
MASTER OF SCIENCE
IN
CIVIL ENGINEERING
Approved
December, 1995
\-\^ ACKNOWLEDGMENTS
I would like to thank my committee chairperson, Dr. Kishor C. Mehta, for his
direction and support of this thesis. I also like to express my sincere thanks to
Dr. James R. McDonald for his helpful suggestions.
u
TABLE OF CONTENTS
ACKNOWLEDGMENTS ii
ABSTRACT vi
LIST OF TABLES vii
LIST OF HGURES x
CHAPTER
I. INTRODUCTION 1
II. NATIONAL STANDARDS 5
2.1 American Standard 7
2.2 Australian Standard 11
2.2.1 Simplified Procedure 12
2.2.2 Detailed Procedure 13
2.2.2.1 Static Analysis 13
2.2.2.2 Dynamic Analysis 15
2.3 British Standard 16
2.3.1 Standard Method 16
2.3.2 Directional Method 17
2.4 Canadian Standard 19
2.5 Summary 21
III. FORMULATION OF WIND LOAD PARAMETERS 23
3.1 Reference Wind Speed 24
3.2 Annual Probability 26
3.2.1 American Standard 30
3.2.2 Australian Standard 30
3.2.3 British Standard 31
3.2.4 Canadian Standard 31
3.3 Terrain Factor 32
3.3.1 American Standard 36
m
3.3.2 Ausu-alian Standard 38
3.3.3 British Standard 38
3.3.4 Canadian Standard 40
3.4 Gust Effect Factor 40
3.4.1 American Standard 42
3.4.2 Australian Standard 44
3.4.3 British Standard 44
3.4.4 Canadian Standard 45
3.5 Pressure Coefficients 46
3.5.1 American Standard 49
3.5.2 Australian Standard 50
3.5.3 British Standard 51
3.5.4 Canadian Standard 51
3.6 Summary 52
IV. CASE STUDY 54
4.1 Low Building 100 ft X 60 ft X 15 ft 57
4.2 160 ft High Building 100 ft X 200 ft X 160 ft 67
4.3 Use of Standards 84
4.3.1 American Standard 84
4.3.2 Australian Standard 85
4.3.3 British Standard 86
4.3.4 Canadian Standard 87
4.4 Summary 87
4.4.1 Low Building 88
4.4.2 160 ft High Building 88
V. LIMIT STATE LOADING 90
5.1 Low Building 93
5.2 160 ft High Building 93
VI. CONCLUSIONS 94
IV
REFERENCES 96
APPENDICES
A. CALCULATIONS USING AMERICAN STANDARD 98
B. CALCULATIONS USING AUSTRALIAN STANDARD 112
C. CALCULATIONS USING BRITISH STANDARD 128
D. CALCULATIONS USING CANADIAN STANDARD 144
ABSTRACT
The objective of this thesis is to compare major recognized national standards of wind
loads and to determine the correlation among them. The four national standards
compared are American Society of Civil Engineering Standard, ASCE 7-95 (ASCE 7-95),
Australian standard, SAA Loading Code, Part 2: Wind Loads, AS 1170.2-1989 (SAA,
1989), British standard, Part 2, Code of Practice for Wind Loads, BS 6399, 1994 (BS
1994), and National Building Code of Canada, 1990 (NRCC 1990).
The objective was accomplished by calculating wind loads on two buildings: a low
building with dimensions of 100 ft x 60 ft x 15 ft and a 160 ft high building with a plan
dimensions of 200 ft x 100 ft. Limit state base shear and overturning moments for the two
buildings were calculated and then compared. The study shows that the four national
standards give similar limit state base shear for the two specific buildings selected for the
study. It is also seen that the overturning moment depends largely on the roof uplift. The
roof uplift force obtained from using the four national standards vary significantly which
indicates that a thorough parametric study on roof uplift loads should be conducted to
assess the real loads. The design pressures on components and claddings differ between
the standards by as much as 200 percent. While accomplishing the objective it was
observed that the comfurtability in using any standard depicts the format of the standard in
some manner. The study shows that for that the format of the American and the Canadian
standards are easy to follow, while the Australian and the British standard are more
difficult to use to when determining the wind loads.
VI
LIST OF TABLES
2.1. Parameters and their terminology 6
2.2 Levels of approach 8
2.3 Equations used in the American standard 9
3.1 Probability of exceeding the reference wind speed during the
reference period for various values of annual probability 29
3.2 Exposure categories used in the four standards 33
3.3 Gradient heights and the exponential coefficients
used in the American standard 37
3.4 Roughness lengths used by the Australian standard 39
3.5 Roughness lengths used by the British standard 39
3.6 Exponential coefficients used by the Canadian standard 41
4.1 Wind load parameters used in the calculations of low building 59
4.2 Base shear, overturning moment and roof uplift for low building 64 4.3 Wind load parameters used in the calculations of 160 ft
building 70
4.4 Baseshear, overturning moment and roof uplift for 160 ft building 78
5.1 Limit state base shear, overturning moments and roof uplift for low buildings 92
5.2 Limit state base shear, overturning moments and roof uplift for high-rise buildings 92
A. 1 Design wind pressures and extemal pressure coefficient values for CASE A 101
vu
A.2 Design wind pressures and extemal pressure coefficient
values for CASE B 102
A.3 External pressure coefficients for components and claddings 104
A.4 Design wind pressures for components and claddings 104
A.5 Velocity pressure exposure coefficients and velocity pressures 105
A.6 Design wind pressures for wind parallel and normal to
100 ft side 107
A.7 Extemal pressure coefficients for components and claddings HO
A.8 Design pressures for zone l(roof middle surface), zone 2 (roof edges), and zone 3(roof corners) H I
A.9 Design pressures for zone 4(wall middle surface) and zone 5
wall edges) I l l
B.l Design pressures for roof 116
B.2 External pressure coefficients for components and claddings 118
B.3 Design wind pressures for components and claddings 118
B.4 Values of terrain and structure height multiplier M(z,cat).
design gust wind speed Vz and velocity pressure qz 120
B.5 Design windward wall pressures 122
B.6 External pressure coefficients for components and claddings 125
B.7 Design pressures for zone l(roof middle surface), zone 2 (roof edges), and zone 3(roof comers) 126
B.8 Design pressures for zone 4(wall middle surface) and zone 5 wall edges) 126
C.l External pressure coefficients for components and claddings 133
C.2 Design pressures for components and claddings 133
C.3 External pressure coefficients for components and claddings 137 viii
C.4 Design pressures for zone l(roof middle surface), zone 2 (roof edges), and zone 3(roof corners) 138
C.5 Design pressures for zone 4(wall middle surface) and zone 5 wall edges) 138
C.6 External pressure coefficients for components and claddings 141
C.7 Design pressures for zone l(roof middle surface), zone 2 (roof edges), and zone 3(roof corners) 143
C.8 Design pressures for zone 4(wall middle surface) and zone 5 wall edges) 143
D. 1 External peak pressure coefficients and design pressures on the main wind-force resisting system for wind perpendicular to ridge 147
D.2 External peak pressure coefficients and design pressures on the main wind-force resisting system for wind parallel to ridge 148
D.3 Extemal peak pressure coefficients for components
and claddings 150
D.4 Design pressures on components and claddings 150
D.5 Exposure factors and design pressures on the windward wall 152
D.6 External pressure coefficients for components and claddings 155
D.7 Design pressures for zone l(roof middle surface), zone 2 (roof edges), and zone 3(roof corners) 156
D.8 Design pressures for zone 4(wall middle surface) and zone 5 wall edges) 156
IX
LIST OF FIGURES
3.1 Mean wind speed vector V and turbulent wind speed vector V(t) 25
3.2 Ratio of probable maximum speed averaged over period
t to that averaged over one hour (Simiu, 1986) 27
3.3 Wind speed profile 35
3.4 Typical pressure record 47
4.1 Low building 55
4.2 160 ft building 56
4.3 Stmctural system for low building 58
4.4 Design pressures on the main wind-force resisting system 63
4.5 Design pressures for wall grits and roof purlins
(tributary area 100 sqft) 66
4.6 Design pressures for fasteners (tributary area 5 sqft) 68
4.7 Stmctural system for 160 ft building 69
4.8 Design pressures for the main wind-force resisting system, based on American standard 73
4.9 Design pressures for the main wind-force resisting system based on Australian standard 74
4.10 Design pressures for the main wind-force resisting system based on British standard 75
4.11 Design pressures for the main wind-force resisting
system based on Canadian standard 76
4.12 Design pressures for components 80
4.13 Design pressures for claddings 83 X
CHAPTER I
INTRODUCTION
Wind has major effects on mankind, both favorable and unfavorable. Property losses in
windstorms and increased concem for human comfort have resulted in a discipline called
wind engineering. "Wind engineering is best described as the rational treatment of
interaction between wind in the atmospheric boundary layer and man and his works on the
surface of the earth" (Cermak, 1975, p. 9).
When wind interacts with a building, it produces pressures on both intemal and extemal
surfaces. The magnitude of developed pressures on building surfaces depend on the
characteristics of the approaching wind and the geometry of the building. These effects
are incorporated into a standard in some manner, to form the wind load standard. A wind
load standard guides an engineer to use proper wind load for design of a building that is
exposed to the action of wind during its anticipated life. Various countries develop their
own national standards for wind loads. It is recognized that wind climate in countries can
be different resulting in different wind loads. However, wind-stmcture phenomena is
invariant, hence wind loads resulting from different national standards should be the same
for a given reference wind speed.
The objective of this thesis is to compare major recognized national standards of wind
loads and to determine the correlation among them. The four national standards selected
for comparison are:
(1) American Society of Civil Engineering Standard, ASCE 7-95 (ASCE 7-95),
(2) Australian Standard, SAA Loading Code, Part 2: Wind Loads,
AS 1170.2-1989 (SAA 1989),
(3) British Standard, Part 2, Code of Practice for Wind Loads, BS 6399, 1994
(BS 1994),
(4) National Building Code of Canada, 1990 (NRCC 1990).
The American and British standards are in the development process; latest available drafts
are used for this thesis work.
Since, only the four national standards are used in this thesis, specific references to
each standard are not given wherever the standards are mentioned. A comparative study
of the earlier editions of these four national standards was conducted by Das (1985).
Since 1985, the four national standards have been significantly revised in the
methodologies of calculating wind loads. The new editions of standards bring up to date
the considerable advances in wind engineering. The latest American standard has adopted
a 3-second gust reference wind speed (earlier edition used fastest mile wind speed) and
has included a topography factor. The latest Australian standard specifies wind speed for
the serviceability limit state, ultimate limit state and permissible stress design. The basic
wind speed in the new British standard is a mean hourly wind speed, while the previous
edition used a 3-second gust wind speed. These significant changes in reference wind
speeds affect the approach to calculation of wind loads.
The provisions in the four national standards use different terminology for similar
parameters. The descriptions such as "openings in one wall" and "one wall permeable"
are difficult to distinguish and interpret. The provisions of the four national standards
have to be interpreted correctly. In this thesis, the provisions are interpreted by the author
to the best of his ability. No responsibihty is assumed by the author or the advising
committee in interpretation of the provisions.
Chapter II of the thesis deals with the description of wind load equations and
parameters used by each standard in determining the design wind pressures. In describing
the four national standards no effort is made to explain the equations or background of the
provisions; it is beyond the scope of this thesis. The parameters which affect the design
wind pressure are reference wind speed, annual probability of wind speed, height and
terrain factor, gust effect factor and pressure coefficients. The four national standards
consider all of these parameters. However the methods to consider these parameters to
compute the design wind pressures are different. The methods and the formulation of
each parameter for each of the standard are discussed in chapter HI. Since the methods
are different in the four standards, it is meaningless to compare magnitudes of the
parameters in the standards. The four national standards can be compared by calculating
wind loads on specific buildings. In order to compare the four national standards, wind
loads are calculated on two buildings: a low building with dimensions of 100 ft x 60 ft x
15 ft and a 160 ft high building with a plan dimensions of 200 ft x 100 ft. The design
pressure are compared in chapter IV. The buildings are assumed to be located in a
suburban area in the United States, where the 3-second gust wind speed is 110 mph (49
m/s). The reference wind speeds of the British and Canadian standards are made
consistent with the reference wind speed of the American standard. Since the Australian
standard uses the 3-second gust speed, no conversion is necessary to the reference wind
speed. The appendices contain the actual wind load calculations. Chapter V deals with
the application of load factors in limit state design and compares the base shear,
overtuming moment and roof uplift for the two buildings. Conclusions drawn from this
study are presented in Chapter VI.
CHAPTER II
NATIONAL STANDARDS
"Wind load standards and codes govern design of buildings and structures to resist
wind induced loads" (Mehta, 1980, p. 1305). A majority of stmctures can be designed
using the prevailing standards. Wind tunnel tests are recommended for unusual structures
to determine the specific wind loads. "A standard is a documentation of the state-of-
knowledge" (Mehta, 1980, p. 1306). Generally, consensus groups, professional societies
or govemmental agencies develop the standards. The standard is used by engineers to
design building frames and building components to resist wind effects.
This chapter highlights equations and parameters used by the four national standards in
determining the design wind pressures. The parameters which are used by the four
standards for calculation of wind loads are: (1) reference wind speed, (2) a factor which
accounts for variation of terrain roughness and height, (3) a factor which accounts for
increase in wind speed due to local topography, (4) a factor which modifies wind speed
based on the building classification category, (5) a factor which accounts for shielding
effect, (6) a factor which accounts for additional loading due to wind gusts and,
(7) pressure coefficients. The standards compared in the study address the above
mentioned parameters. However, the methods of consideration of these parameters are
different in each of the standard. These differences are examined in chapter HI. The
parameters used by the four national standards and their terminology is shown in
Table 2.1.
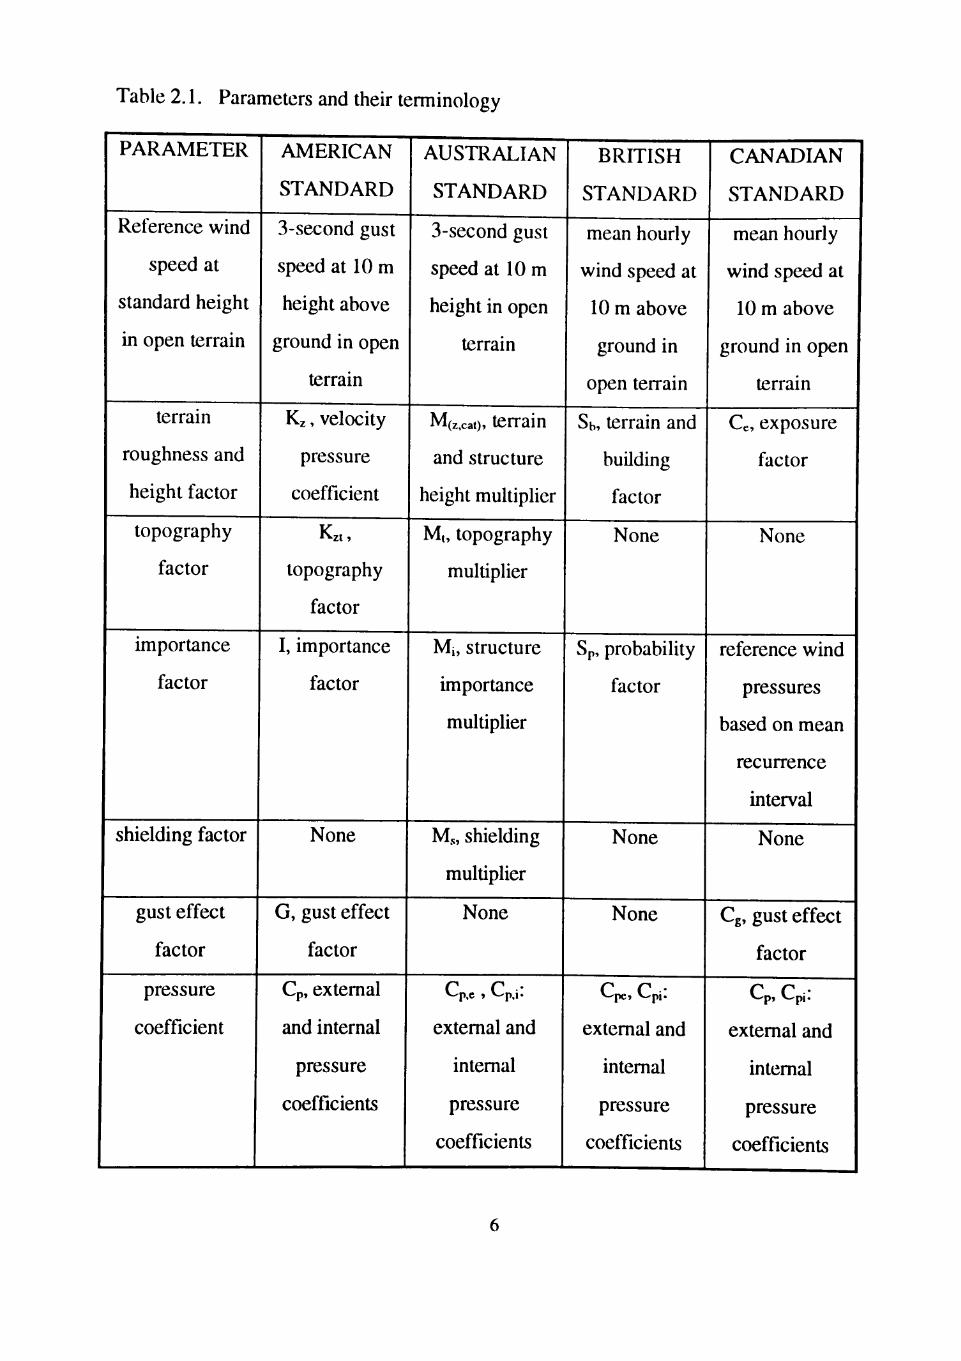
Table 2.1. Parameters and their terminology
PARAMETER
Reference wind
speed at
standard height
in open terrain
terrain
roughness and
height factor
topography
factor
importance
factor
shielding factor
gust effect
factor
pressure
coefficient
AMERICAN
STANDARD
3-second gust
speed at 10 m
height above
ground in open
terrain
Kz, velocity
pressure
coefficient
Kzt,
topography
factor
I, importance
factor
None
G, gust effect
factor
Cp, extemal
and internal
pressure
coefficients
AUSTRALIAN
STANDARD
3-second gust
speed at 10 m
height in open
terrain
M(z,cat), terrain
and structure
height multiplier
Mt, topography
multiplier
Mi, structure
importance
multiplier
Ms, shielding
multiplier
None
C C •
extemal and
intemal
pressure
coefficients
BRITISH
STANDARD
mean hourly
wind speed at
10 m above
ground in
open terrain
Sb, terrain and
building
factor
None
Sp, probability
factor
None
None
C c •
extemal and
intemal
pressure
coefficients
CANADL\N
STANDARD
mean hourly
wind speed at
10 m above
ground in open
terrain
Cc, exposure
factor
None
reference wind
pressures
based on mean
recurrence
interval
None
Cg, gust effect
factor
C C '
extemal and
intemal
pressure
coefficients
The four national standards divide buildings and stmctures into rigid structures and
flexible stmctures. Each standard formulates conditions for which a specific structure is
analyzed for static or dynamic loading. The standards use different levels of approach;
simple procedures, detailed procedures, and wind tunnel tests in attaining the design wind
pressures. Low-rise buildings and all rigid stmctures are analyzed using a simplified
procedure. Detailed procedures are used where wind loads govem the economics of
structural design. Flexible buildings are analyzed using detailed procedures, which provide
the designer with more accurate wind loads. Wind tunnel tests are performed on buildings
and stmctures which have complex shapes. Wind tunnel tests are also recommended for
monumental stmctures, where the additional design expenses are justified. Apart from the
above mentioned procedures, the British standard uses a directional method to evaluate
the design wind pressures on a rigid stmcture. Various levels of approaches used by the
four national standards are as shown in Table 2.2.
2.1 American Standard
American standard ASCE 7-95 classifies buildings and other structures into rigid
stmctures and flexible or dynamically sensitive stmctures. Rigid stmctures are further
categorized into partially enclosed, special low-rise buildings and open buildings. Rexible
structures are divided into buildings and other stmctures. The equations used for the
calculation of design wind pressures p (psf), and forces F (lb) for each category are listed
in Table 2.3. The general and simplified equation for evaluating design wind pressures
P (psO is
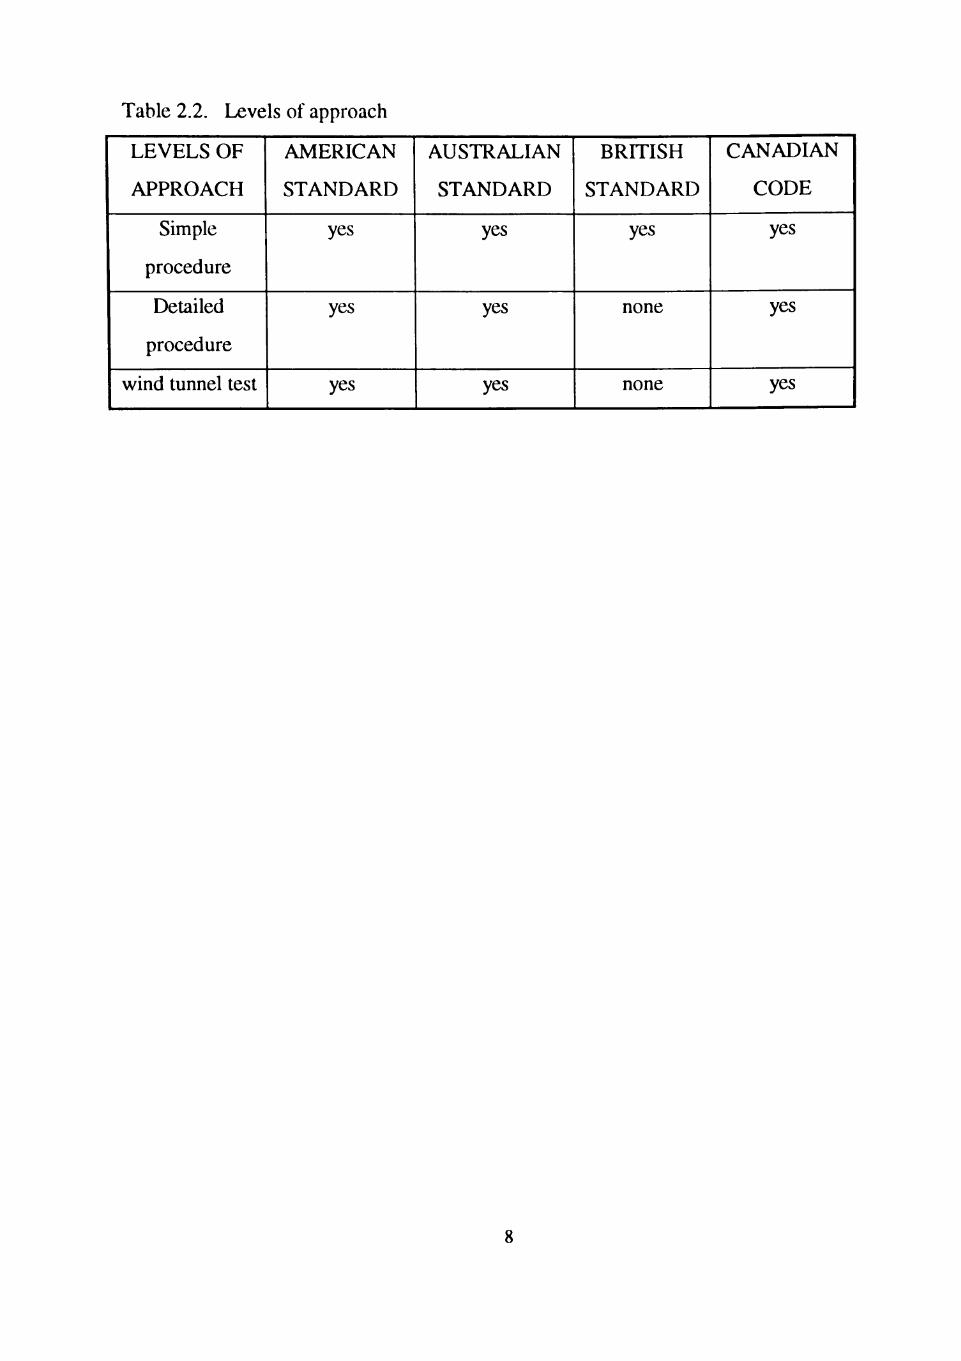
Table 2.2. Levels of approach
LEVELS OF
APPROACH
Simple
procedure
Detailed
procedure
wind tunnel test
AMERICAN
STANDARD
yes
yes
yes
AUSTRALIAN
STANDARD
yes
yes
yes
BRITISH
STANDARD
yes
none
none
CANADIAN
CODE
yes
yes
yes
8
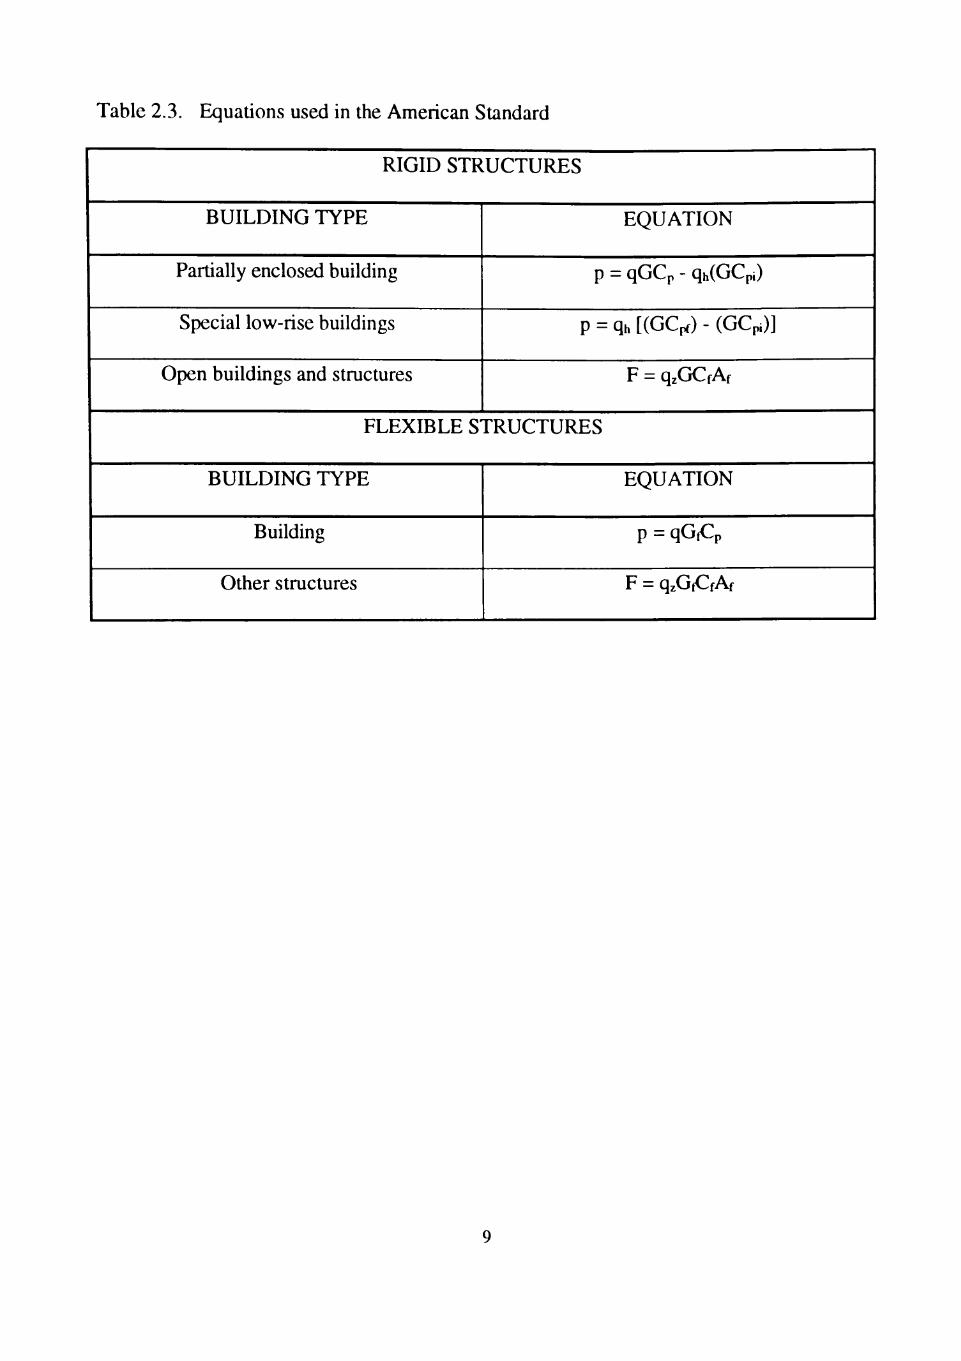
Table 2.3. Equations used in the American Standard
RIGID STRUCTURES
BUILDING TYPE
Partially enclosed building
Special low-rise buildings
Open buildings and stmctures
EQUATION
p = qGCp - qh(GCpi)
p = qh [(GCpf) - (GCpi)]
F = qzGCfAf
FLEXIBLE STRUCTURES
BUILDING TYPE
Building
Other stmctures
EQUATION
p = qGfCp
F = qzGfCfAf
P = qGCp (2.1)
where q: velocity pressure,
G: gust effect factor,
Cp: pressure coefficient.
The velocity pressure q is given by the equation
q = 0.00256KzKztV'l (2.2)
where Kz: velocity pressure exposure coefficient,
Kzt: topography factor,
V: basic wind speed,
I: importance factor.
The constant 0.00256 represents air mass density for a standard atmosphere of
0.00237 slugs/ft and constants required to convert wind speed from miles per hour to feet
per second. The basic wind speed, V, is a 3-second gust speed at 10 m height above
ground in open terrain. Basic wind speed is associated with an annual probabihty of
occurrence of 0.02 (mean recurrence interval of 50 years). The velocity pressure exposure
coefficient Kz accounts for the variations of wind speed with height above ground and
terrain roughness. The American standard define four exposure categories: Exposure A
for a large city center. Exposure B for urban or suburban areas as well as heavily wooded
areas, Exposure C for open, airport terrain, and Exposure D for wind flowing over large
bodies of water. The topography factor Kzt accounts for significant variations of wind
speed over an isolated hill or escarpment. Significant variations can occur due to the
sudden or abrupt changes in topography surrounding the site. The topography factor is
10
applied to buildings and structures which are situated in the upper part of a hill or near the
edges of escarpments. The basic wind speed map of ASCE 7-95 is based on the annual
probability of occurrence of 0.02. To modify the basic wind speed to other probabilities,
an importance factor I is used. The importance factors are based on the building and
stmctural classification categories. Each building and stmctural category is associated
with an unique importance factor. The gust effect factor G, accounts for the loading
effect due to wind turbulence. Gust effect factors for rigid structures are 0.8 for exposure
A and B, and 0.85 for exposure C and D. For flexible buildings the Commentary in the
American Standard provides a rational method for calculating gust effect factors Gf.
Pressure coefficients account for the variation in wind pressure on surfaces of buildings
and structures. Pressure coefficients are basically divided into two categories, buildings of
all height and special low-rise buildings. Combined values of pressure coefficients and
gust effect factors for special low-rise building and components and claddings, are
tabulated. Appropriate pressure coefficients must be used to calculate the design wind
pressures. For sUiictures, force coefficients Cf are provided for a limited number of
shapes.
2.2 Australian Standard
The Australian Standard, SAA Loading Code part 2: Wind Loads, describes two
procedures, a simplified procedure and a detailed procedure, to calculate the design wind
pressures.
11
2.2.1 Simphfied Procedure
This procedure is applicable to buildings, which consist of a combination of rectangles
in plan, with height and gross area of roof plan less than 15 m and 1000 m , respectively.
The applicability of this procedure is further restricted to buildings with roof slopes less
than 30 and ratio of building height to minimum plan dimension less than 5.
The design wind pressure p (kpa) is given by
p = p'BiB2B3B4 (2.3)
where p : net basic wind pressure,
B1: regional multiplying factor,
B2: terrain and height multiplying factor,
B3: topography multiplying factor,
B4: reduction factor for roofs.
The net basic wind pressure p' is obtained by combining the intemal and extemal basic
pressures. Values of extemal basic wind pressure p* (standard's nomenclature for net and
basic pressures) are tabulated for roofs and walls. Values of p are also tabulated for
intemal pressures. The factor Bi depends on the geographical region in which the building
is located. Four regional factors are specified in the standard: normal, intermediate,
tropical cyclone, and severe tropical cyclone. The terrain and height multipher B2
accounts for the changes in height and terrain surrounding the building. The factor B3 is a
topographic multiplier applied to buildings siUiated along the upper half of a hill or near
the edge of a escarpment. The roof reduction factor B4 is used to reduce the wind forces
on roof supporting structures with tributary area greater than 10 m .
12
2.2.2 Detailed Procedure
This procedure evaluates design wind pressures using two methods based on the
sensitivity of the stmcture to wind.
2.2.2.1 Static Analysis. Static analysis is applied to buildings and stmctures which are
not sensitive to wind action. The height or length to breadth ratio and the first mode of
vibration to qualify a building for static analysis should be less than 5 and greater than 1
Hz, respectively. The design pressure p (kpa), for static analysis is given by the equation
p = Cp.KaK,Kpqz (2.4)
where Cpe: extemal pressure coefficient,
Ka: area reduction factor for roofs and side walls,
Ki: local pressure factors for claddings,
Kp: reduction factor for porous claddings,
qz: velocity pressure.
The extemal pressure coefficient Cpc accounts for the variation of pressure at various
locations on the building surface. Area reduction factors for roofs and side walls are a
correction to the peak loads produced on large tributary areas. The local pressure factor
accounts for pressures developed on small areas on various locations on the building
locations. The standard recommends application of the reduction factor to porous
claddings, and to the local negative pressures, when the porosity of the claddings exceeds
0.001 but is less than 0.01. The velocity pressure is given by the equation
qz = 0.6 X 10'(M(z.ca.)MMM.V)' (2.5)
13
The constant 0.6 is one half the air mass density of 1.2 kg/m\ The basic wind speed V
is a 3-second gust wind speed at 10 m height in an open terrain. The Australian Standard
divides the basic wind speed in different regions as serviceabihty limit state wind speed V ,
permissible stress gust wind speed Vp and ultimate limit state gust wind speed Vu. The
ultimate limit state gust wind speed and the serviceability limit state wind speeds are
associated with an annual probability of occurrence of 0.001 (1000 year mean recurrence
interval) and 0.05 (20 year mean recurrence interval), respectively. The permissible stress
gust wind speed is associated with an annual probability of occurrence of 0.02 (50 year
mean recuiTence interval). The terrain and stmcture height multiplier M(z,cat) modifies the
basic wind speed to account for the variation of terrain and height. Wind speed is retarded
considerably due to shielding from adjacent buildings. To account for the reduction in
wind speed due to obstmctions, a shielding multiplier is used. The shielding multiplier
depends on the average height, breadth and distance between the buildings surrounding
the site. The topographic multiplier Mt, modifies the basic wind speed for sudden changes
occurring in the topography. The structure importance multiplier Mi modifies the basic
wind speed based on the structural classification. The values of Mi are tabulated
according to the structural classification which is, in tum, based on the importance of the
stmcture, and its impact on humans in case of failure. The multiplying factors M(z.cat), Ms,
Mt, and Mi, which modify the basic wind speed are the same for static and dynamic
analysis. The Australian standard does not use gust effect factor in the calculation of wind
loads.
14
2.2.2.2 Dynamic Analysis. Dynamic analysis is applied to buildings and sUiictures
which are sensitive to wind action. The conditions for the applicabihty of dynamic analysis
are (i) Height or length to breadth ratio should be greater than 5 (ii) Structures should
have the first-mode of frequency of vibration less than 1 Hz. In the dynamic analysis
Ausu-alian standard calculates the net horizontal force and design peak base overtuming
moment.
The horizontal force acting on a building or stmcture at height z is calculated from the
equation
Fz=ZCpcqzAz (2.6)
where Cpe: extemal pressure coefficient
q^: hourly mean velocity pressure
Az: the area of the structure at height z
The hourly mean velocity pressure is similar to the velocity pressure discussed in static
analysis, the only difference is that the basic wind speed used in the dynamic analysis is
hourly mean wind speed instead of 3-second gust speed used in static analysis. The
summation of moments resulting from the horizontal forces gives the mean overtuming
moment Ma. The design peak base overtuming moment is then calculated using the
equation
M, =GM3 (2.7)
where M^: mean overtuming moment
G: gust effect factor
15
2.3 British Standard
The Part 2. Code of Practice for Wind Loads of British Standard BS6399, describes
two methods for calculating the design wind pressures: a standard method and a
directional method. The standard method is used to obtain a standard wind speed
(standard's nomenclature), without considering wind direction. The standard effective
wind speed (standard nomenclature) with standard pressure coefficients is used to evaluate
the wind load for winds parallel and wind normal to the faces of the building. In the
directional method the effective wind speed and direction pressure coefficients are used
for different wind directions to check the critical wind loads. Velocity pressure in the
standard includes wind-stmcture interaction parameters which makes it difficult to explain
use of each of the parameter.
2.3.1 Standard Method
The wind pressure p (pa) acting on the surface of a building is given by the equation
p = qCpCa (2.8)
where q: velocity pressure,
Ca: size effect factor different for extemal and internal pressures,
Cp: Cpe for extemal pressure coefficient,
: Cpi for internal pressure coefficient.
16
2.3.2 Directional Method
The wind pressure on the extemal and intemal surface of the building is given by the
equation
P = qCp (2.9)
where q: velocity pressure,
Cp: Cpe for external pressure coefficient,
: Cpi for internal pressure coefficient,
the velocity pressure q is given by the equation
q = 0.613(SaSbSdS..SpVb)' (2.10)
where Vb: the basic wind speed,
Sa: altitude factor (elevation above sea level),
Sd: directional factor,
Ss: seasonal factor,
Sp: probabihty factor,
Sb: terrain and building factor.
The constant 0.613 is one half the air mass density of 1.226 kg/m^ The basic wind
speed Vb used here is a hourly mean wind speed at height 10 m above flat terrain with
uniform roughness at sea level. Basic wind speed is associated with an annual probability
0.02. The factors Sj, Ss, and Sp, are same for standard and directional methods. The
factor Sa is employed to harmonize the basic wind speed with the elevation of site above
sea level. The computation of Sa differs based on the topography considerations. For the
simple procedure, if topography is considered, then Sa is taken as the larger of
17
Sa= 1+0.001 As or (2.11)
Sa = 1 + O.OOIAT + 1.2\|/eS (2.12)
where A.s: site altitude.
AT: altitude of the base of significant topography,
\|/e: effective slope,
s: topographic location factor,
if topography is not significant then
Sa= 1+0.001 As. (2.13)
For the directional method, if topography is considered,
Sa= 1+O.OOIAT, (2.14)
and, if topography is not considered
Sa = 1 + O.OOlAs. (2.15)
The basic wind speed is modified by the directional factor Sd to wind speeds with same
risk of exceedence in any wind direction. The east wind is taken as a wind direction <|) =
90°. Directional factors for wind directions from <)) = 0° to (j) = 330° are tabulated with 30°
intervals. If the building position is unknown or ignored the directional factor is taken
equal to 1.0 for all directions. The probabihty factor Sp is used to modify basic wind
speed for probability of occurrence other than 0.02. The seasonal factor Ss is used to
modify basic wind speed to wind speeds that a building experiences for a specific period,
i.e., temporary works and buildings during construction. Ss is taken equal to 1.0 for
permanent structures and structures exposed to wind for a period of more than six
months. Sb is the terrain and building factor which accounts for the effective height, the
18
distance of the site from the sea and the site terrain category. Sb is calculated differently
for standard method and directional method. In the directional method, a gust peak factor
gt is introduced in the calculation of terrain and building factors, which give the
appropriate gust speed for structure or its component that produce the maximum loading.
Ca is the size effect factor, which accounts for the influence of the wind gusts operating at
different time intervals across an extemal surface and for the response of intemal
pressures. The size effect factor used in the standard method is determined assuming a
gust peak factor gt = 3.44. The factor C, depends on the exposure of the site and the
diagonal dimension of the loaded area. Pressure coefficients, which account for the shape
and form of the building, depend on the method used to calculate wind loads. It is evident
from the above discussion that the British standard is difficult to describe and is just as
difficult to interpret.
2.4 Canadian Standard
In the Canadian standard the design wind pressure p (kpa) is given by the equation:
p = qCeCgCp (2.16)
where q = reference velocity pressure,
Cc = exposure factor,
Cg = gust effect factor,
Cp = external pressure coefficient.
The National Building Code of Canada refers to three different procedures for
calculating wind loads on buildings and stmctures. The first procedure is a simplified
19
procedure used for low and medium rise buildings. The second method is a detailed
procedure, which is apphcable to tall buildings and slender sUiictures. The third
procedure is an experimental method or wind tunnel test used for complex shaped
buildings, where the details of dynamic response of the stmcture are essential.
The reference wind pressure, q, is given by q = 0.5pV^ where V is the reference wind
speed and p is the air density. The reference wind speed is a mean houriy wind speed at
10 m above ground in open terrain. The air mass density p is taken as 1.229 kg/m^ The
Canadian standard tabulates reference wind pressure q, for three annual probabilities of
0.1,0.033, and 0.01 for specific Canadian locations.
The exposure factor Ce accounts for changes in wind speed and height. The exposure
factor also takes into account the variations in terrain roughness and topography. In the
simple procedure, there is only one value of exposure factor for one reference height and
for any terrain roughness. For low-rise buildings reference height is taken as the mean
height of the roof or 6m, whichever is greater. For windward walls of tall buildings, the
reference height is taken as the total height of the building and for leeward wall the
reference height is taken as half the height of the building. In the detailed procedure three
exposure categories are specified, which depend on the terrain roughness. The gust effect
factor, Cg accounts for the additional load due to the wind gusts and the dynamic
properties of the structure. In the simple procedure, Cg is taken as 2.5 for cladding
elements and 2.0 for the entire building system. Gust effect factor for the detailed
procedure of flexible buildings is evaluated using a technique given in the "Supplement to
the National Building Code of Canada, 1990" (NRCC, supplement 1990). The pressure
20
coefficient Cp, accounts for the pressure variations on the surface due to the variation of in
shape, direction of wind and wind velocity profile. Values of pressure coefficients for
various building shapes are tabulated in the "Supplement to the National Building Code of
Canada, 1990" (NRCC, supplement 1990).
2.5 Summary
For calculating wind loads the four standards compared in the study consider the
parameters reference wind speed, terrain roughness, height above ground, topography
factor, gust effect factor and pressure coefficients. In addition to these parameters,
Australian standard uses a shielding factor. The American, Australian and Canadian
standards specify provisions to obtain wind loads for rigid and flexible buildings. The
British standard provides procedures to analyze rigid buildings only. The design pressure
equation (2.4) indicates that the Australian standard uses area reduction factor K,, local
pressure factor Ki and reduction factor for porous claddings Kp. In order to apply these
factors effectively the designer should know the details of the component tributary areas
and the porosity of the cladding elements. For calculating the terrain and stmcture height
multiplier, the designer should know the terrain conditions within a 2500 m radius from
the site, and the wind speed with respect to each direction (northeast, east, southeast,
etc.). In addition, for calculating the shielding multiplier Ms the designer should know the
average height, breadth, and distance between the buildings surrounding the site. The
interpretation and application of these factors is a time consuming process.
21
From the description of British standard (section 2.3), it is evident that the standard
includes a wind-stmcture interaction parameter (factor accounting for elevation of site
above sea level) in the velocity pressure. The determination of altitude factor requires the
knowledge of the topography surrounding the site.
22
CHAPTER III
FORMULATION OF WIND LOAD PARAMETERS
The study of the equations and parameters involved in determining the wind pressures
in Chapter II indicates that all standards take into account the surrounding terrain, the
variation of pressure coefficients at different locations on the building surface, and the
effect of sudden changes in topography. It is also seen in Chapter II that the reference
wind speed used by the American and Australian standards is a 3-second gust wind speed
while the reference wind speed used by the British and Canadian standards is a mean
hourly wind speed. Even though the American standard uses 3-second gust speed the
standard applies a gust effect factor (see section 3.4.1) and though the British standard
uses mean hourly wind speed the standard does not use gust effect factor (see section
3.4.3). One more parameter worth mentioning is the use of importance factor. The
American standard and British standard change wind speeds to probabilities of occurrence
other than the common annual probability of 0.02 (50 year mean recurrence interval) by
using importance factor and probability factor, respectively. However Canadian standard
does not use an importance factor; it specifies wind speeds associated with different
annual probabilities of occurrence. The stmctural importance multiplier of the Austrahan
standard does not change the annual probabilities of occurrence, since the basic wind
speed is itself formulated to account for specific annual probabilities, depending on the
designing method. To understand these differences, it is important to review the
formulation of these wind load parameters. In the following sections the critical
23
parameters used in the four standards are reviewed. Detail study of each of the parameter
is beyond the scope of this thesis. The common parameters which are used in four
standards are
1. reference wind speed,
2. probability of occurrence associated with the reference wind speed,
3. height and terrain factor,
4. gust effect factor,
5. pressure coefficients.
In addition to these parameters, the Australian standard uses a factor known as
shielding factor. As the name implies it accounts for the reduction in wind speed caused
by upwind buildings. The shielding factor depends on the height, number of buildings, and
the spacing between the buildings in the 45° sector of radius 20h (h is the height of the
building being shielded) upwind of the building being shielded.
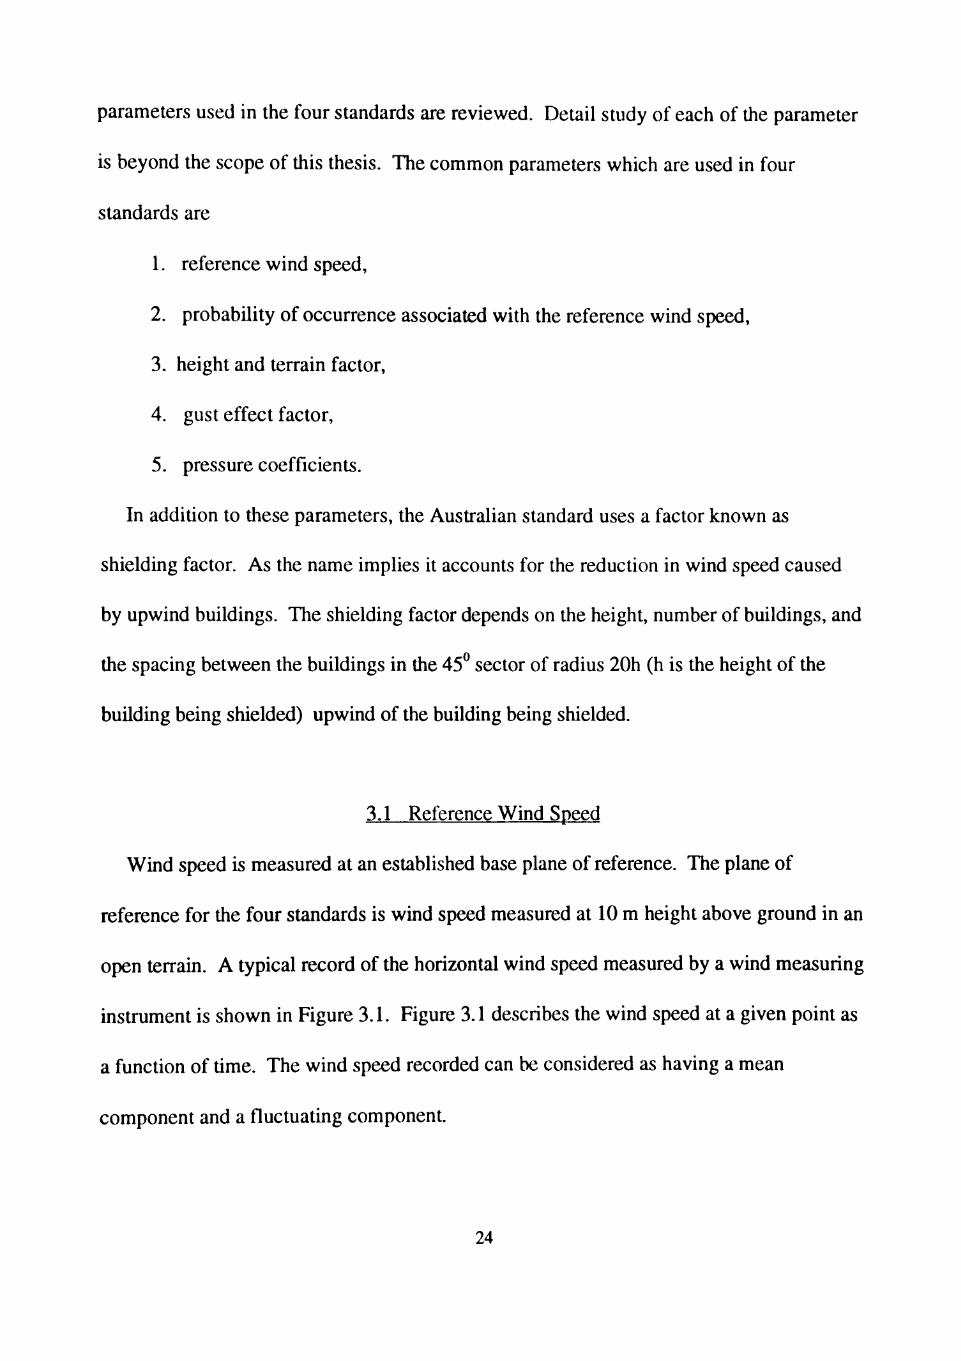
3.1 Reference Wind Speed
Wind speed is measured at an established base plane of reference. The plane of
reference for the four standards is wind speed measured at 10 m height above ground in an
open terrain. A typical record of the horizontal wind speed measured by a wind measuring
instrument is shown in Figure 3.1. Figure 3.1 describes the wind speed at a given point as
a function of time. The wind speed recorded can be considered as having a mean
component and a fluctuating component.
24
o o oo
o o
o
6 o
o o IT)
o 6 o
^
E c E D r; r5 >^
~D 'J
c ; / • .
N;
D o o ro
O
6 o N
o 6 o »"
o
d
r-
• .4_,
c TJ ^
^-. rs 'J
H
^
C".
u U i
CO (JU
paods puiM p.- . ils pUl/^
25
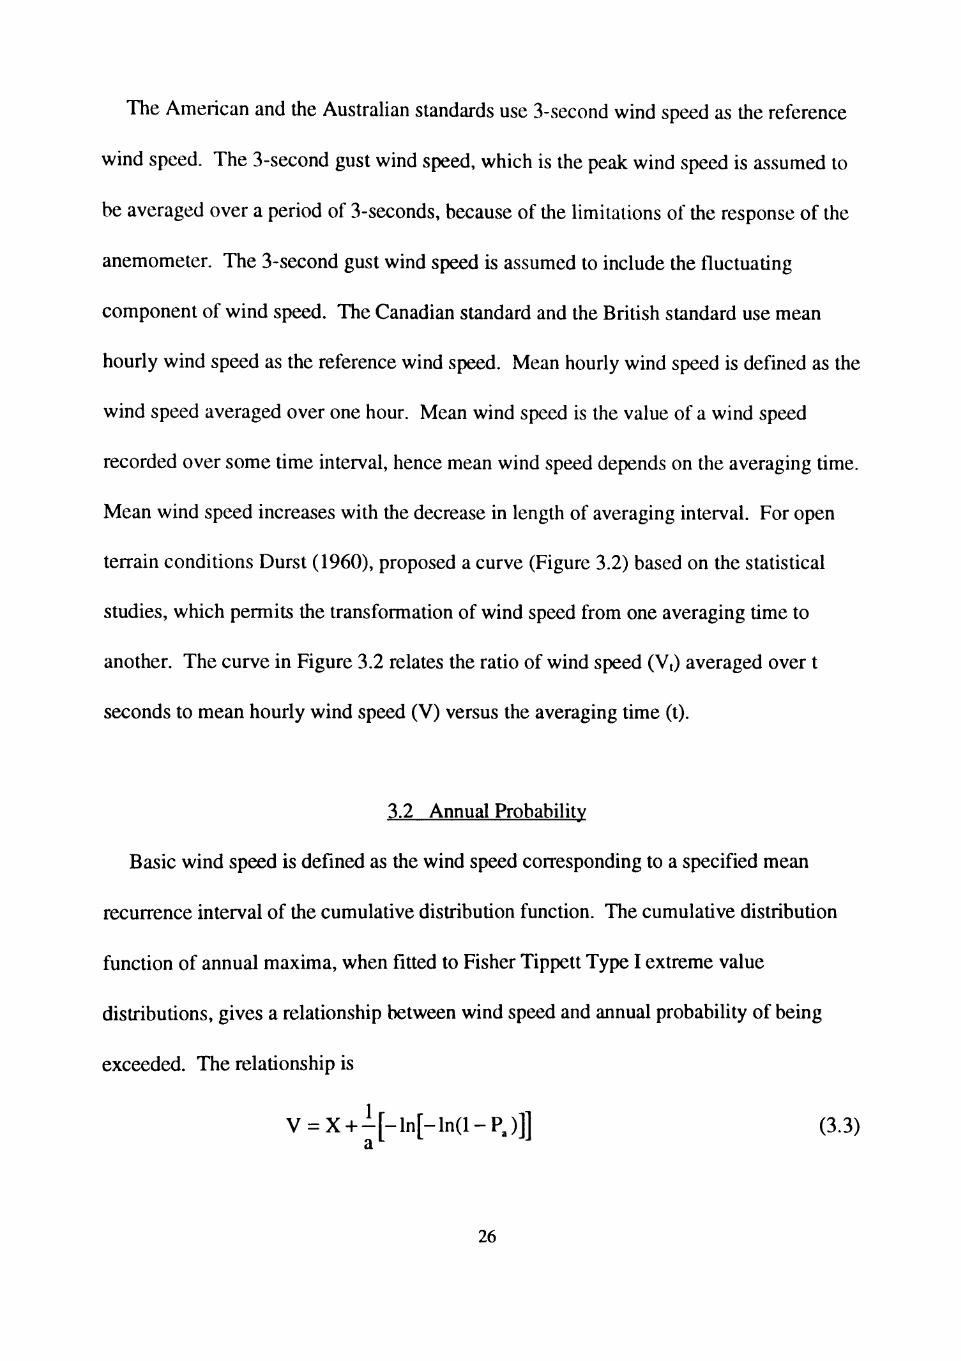
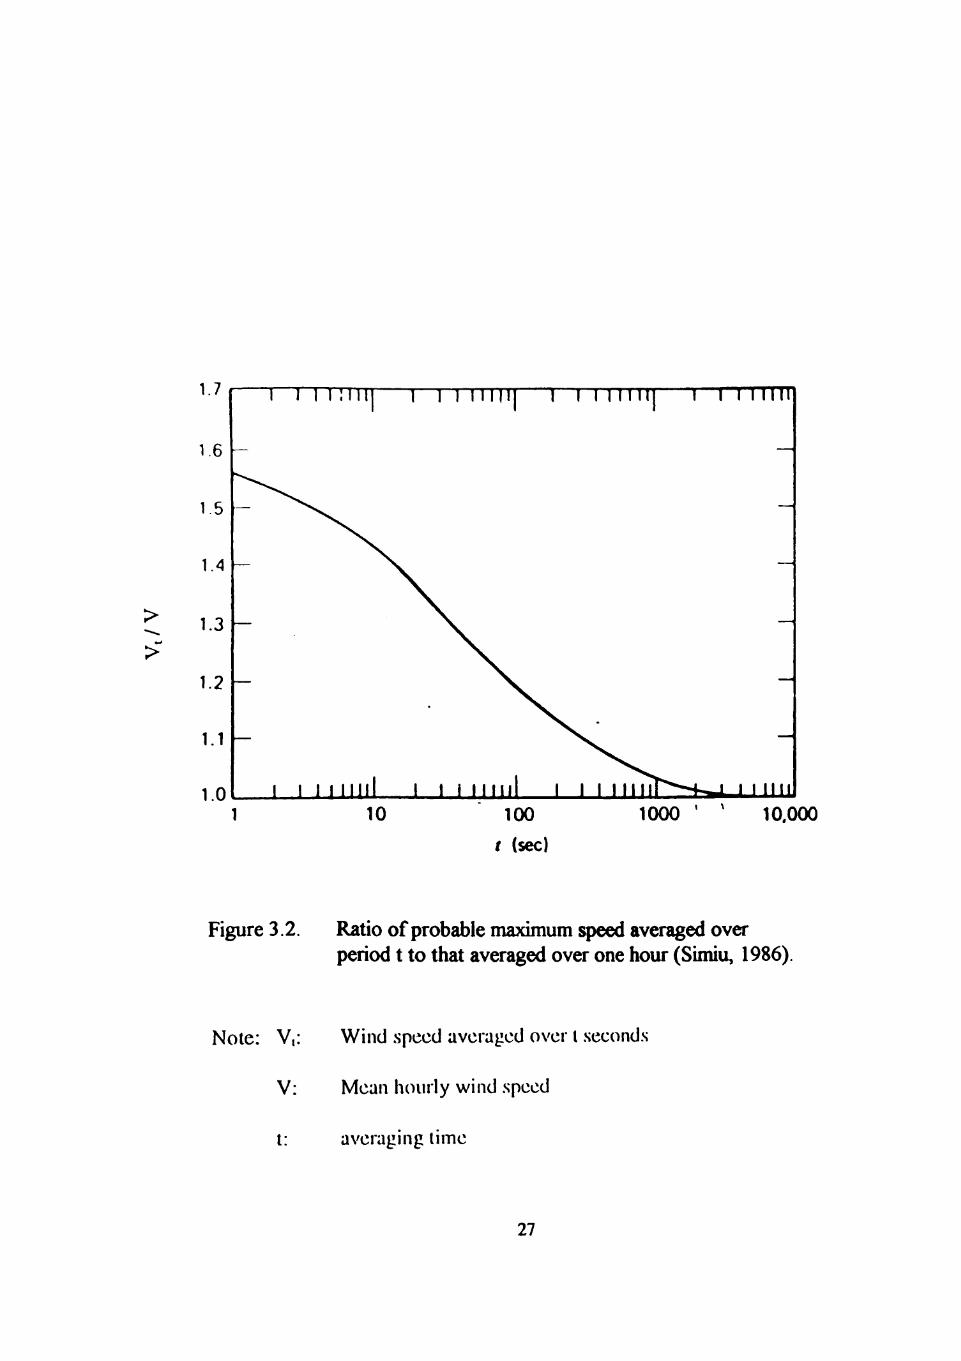
The American and the Australian standards use 3-second wind speed as the reference
wind speed. The 3-second gust wind speed, which is the peak wind speed is assumed to
be averaged over a period of 3-seconds, because of the limitations of the response of the
anemometer. The 3-second gust wind speed is assumed to include the fluctuating
component of wind speed. The Canadian standard and the British standard use mean
hourly wind speed as the reference wind speed. Mean hourly wind speed is defined as the
wind speed averaged over one hour. Mean wind speed is the value of a wind speed
recorded over some time interval, hence mean wind speed depends on the averaging time.
Mean wind speed increases with the decrease in length of averaging interval. For open
terrain conditions Durst (1960), proposed a curve (Figure 3.2) based on the statistical
studies, which permits the transformation of wind speed from one averaging time to
another. The curve in Figure 3.2 relates the ratio of wind speed (Vt) averaged over t
seconds to mean hourly wind speed (V) versus the averaging time (t).
3.2 Annual Probability
Basic wind speed is defined as the wind speed corresponding to a specified mean
recurrence interval of the cumulative distribution function. The cumulative distribution
function of annual maxima, when fitted to Fisher Tippett Type I extreme value
disU"ibutions, gives a relationship between wind speed and annual probability of being
exceeded. The relationship is
V = X + - [ - l n [ - l n ( l - P j ] ] (3.3) a^
26
>
>
1.7
1.6
1.5
1.4
1.3
1.2
1.1
1.0
I I I I ! I ] I | 1 I I l l l | l | 1 I I l l l l l | 1 I I I M i l
I I 1 i i i n i 1 i I m i l l I I I m i l 10 100
/ (sec)
1000 llAhi
10.000
Figure 3.2. Ratio of probable maximum speed averaged over period t to that averaged over one hour (Simiu, 1986).
Note: V,: Wind speed averaged over l .seconds
V: Mean hourly wind speed
t: averaging lime
27
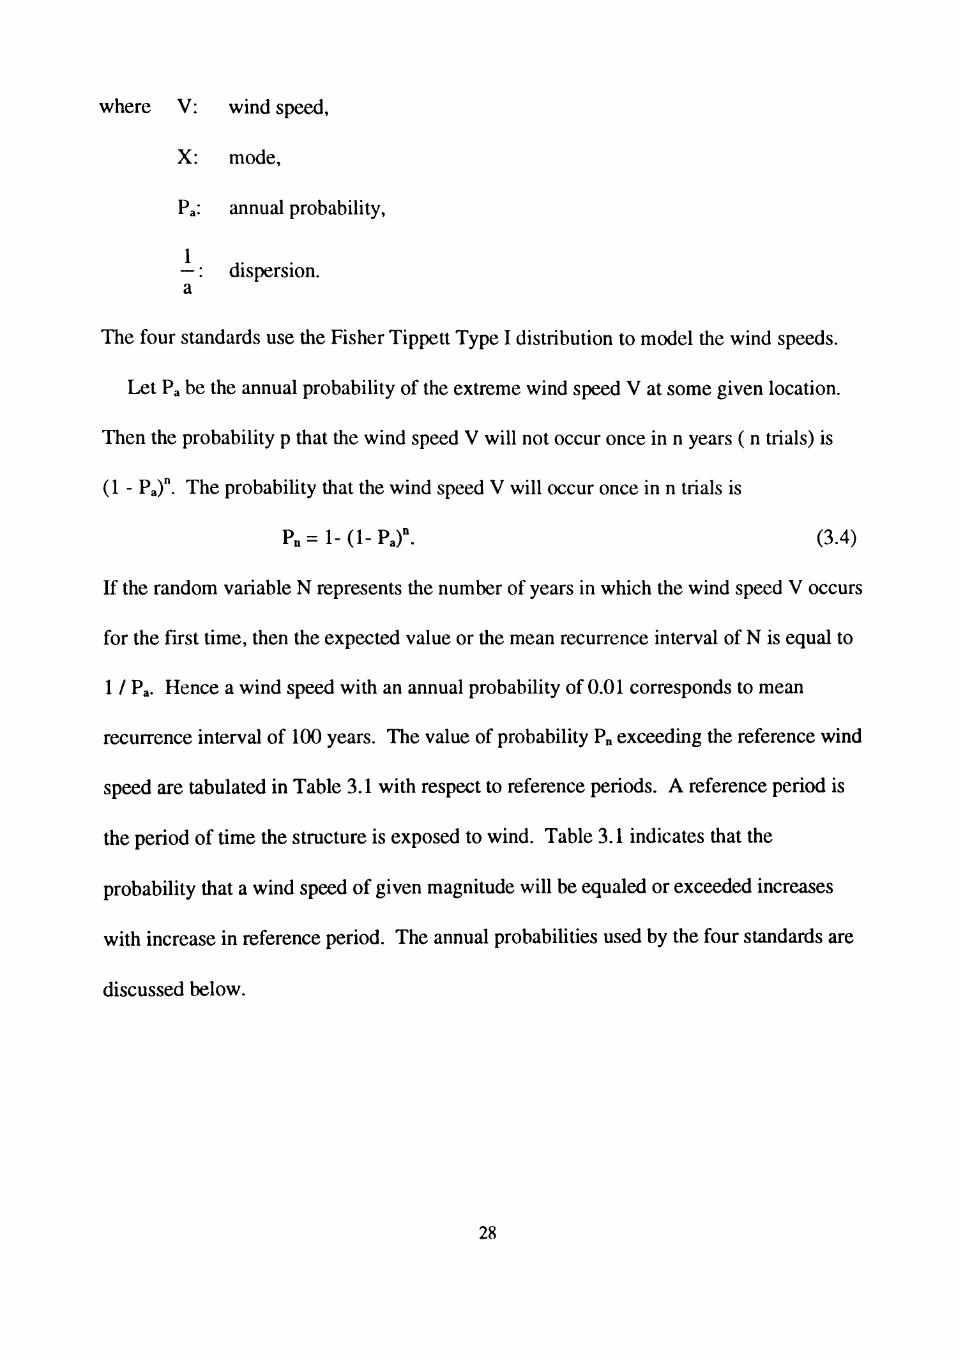
where V: wind speed,
X: mode.
Pa: annual probabihty,
—: dispersion, a
The four standards use the Fisher Tippett Type I distribution to model the wind speeds.
Let Pa be the annual probability of the extreme wind speed V at some given location.
Then the probability p that the wind speed V will not occur once in n years ( n trials) is
(1 - Pa)". The probabihty that the wind speed V will occur once in n trials is
Pn=l-(1-Pa)". (3.4)
If the random variable N represents the number of years in which the wind speed V occurs
for the first time, then the expected value or the mean recurrence interval of N is equal to
1 / Pa. Hence a wind speed with an annual probability of 0.01 corresponds to mean
recurrence interval of 100 years. The value of probability Pn exceeding the reference wind
speed are tabulated in Table 3.1 with respect to reference periods. A reference period is
the period of time the stmcture is exposed to wind. Table 3.1 indicates that the
probability that a wind speed of given magnitude will be equaled or exceeded increases
with increase in reference period. The annual probabihties used by the four standards are
discussed below.
28
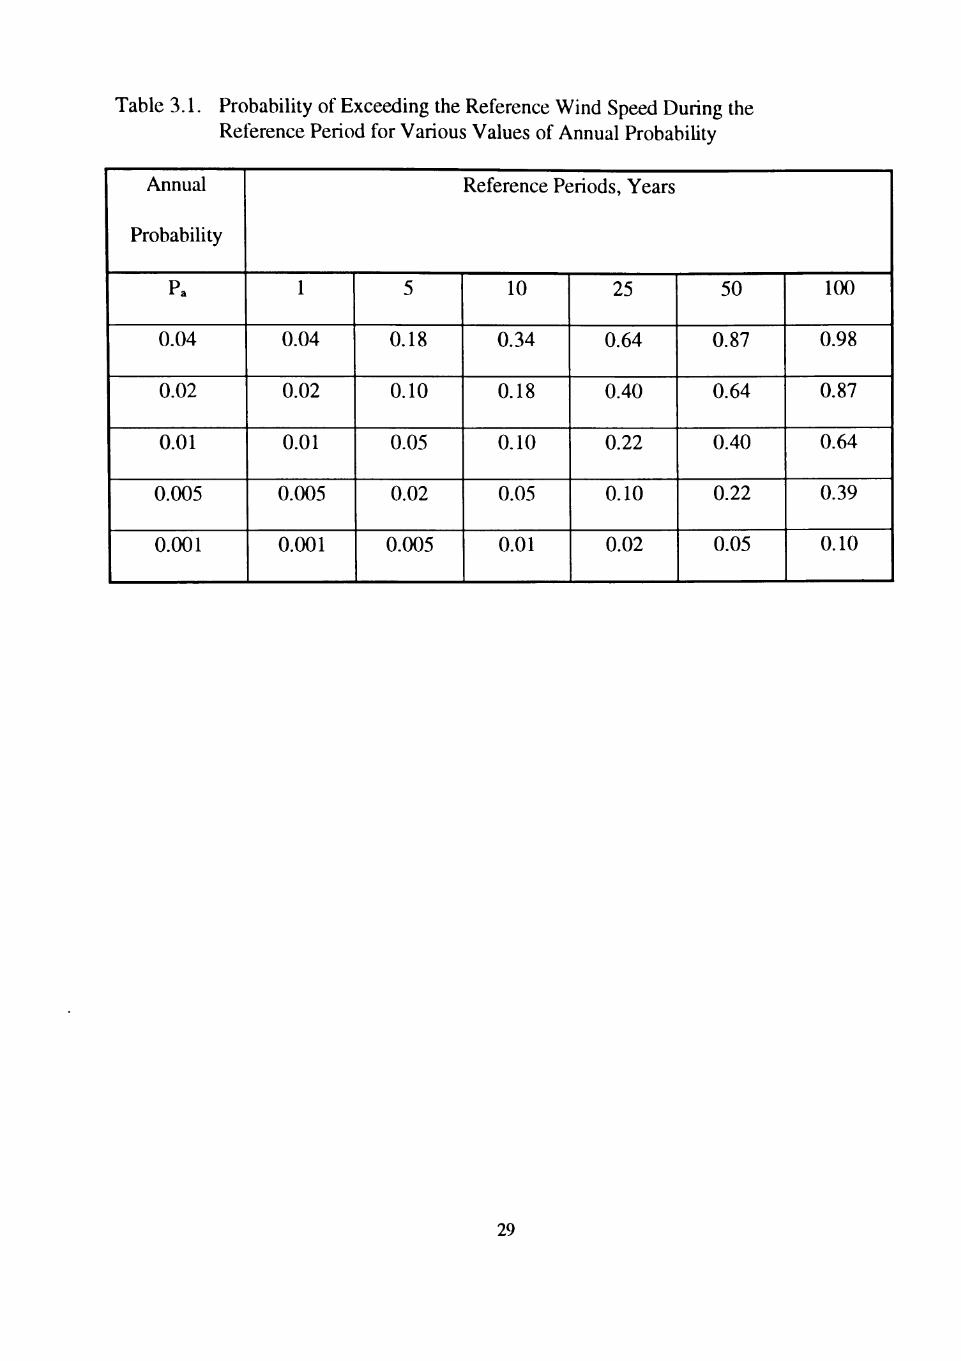
Table 3.1. Probability of Exceeding the Reference Wind Speed During the Reference Period for Various Values of Annual Probabihty
Annual
Probability
Pa
0.04
0.02
0.01
0.005
0.001
Reference Periods, Years
1
0.04
0.02
0.01
0.005
0.001
5
0.18
0.10
0.05
0.02
0.005
10
0.34
0.18
0.10
0.05
0.01
25
0.64
0.40
0.22
0.10
0.02
50
0.87
0.64
0.40
0.22
0.05
100
0.98
0.87
0.64
0.39
0.10
29
3.2.1. American Standard
The basic wind speed map of the American standard gives 3-second gust wind speeds
associated with an annual probability of 0.02. To modify the wind speed to other annual
probability of occurrences, consistent with the building classification category, an
importance factor I is used. The American standard modifies wind speed to mean
recurrence intervals other than 50 years based on building and stmcture classification
categories. For normal stmctures like the buildings associated with the Case Study, mean
recurrence interval of 50 years is used. A mean recurrence interval of 100 years is used
for important buildings and stmctures which have special post-disaster functions. For
unoccupied buildings mean recurrence interval of 25 years may be used.
3.2.2. Australian Standard
The Australian standard provides the designer with the ultimate hmit state gust speed,
Vu, permissible stress gust wind speed, Vp and serviceabihty hmit state wind speed, Vs
through the basic wind speed map. The ultimate limit state gust wind speed Vu has 0.05
probabihty of being exceeded in a 50 year reference period, which correspond to annual
probability of occurrence of 0.001 (1000 year mean recurrence interval). The
serviceabihty hmit state wind speed Vs is associated with an annual probability of 0.05 ( 20
year mean recurrence interval). The permissible stress gust wind speed Vp is similar to the
basic wind speed used by American standard and is associated with an annual probability
of 0.02 (50 year mean recurrence interval). Unlike the American standard, the Australian
standard does not modify the basic wind speed based on sUuctural classification category.
30
3.2.3. British Standard
The British standard also gives basic wind speeds associated with an annual probability
of exceedence of 0.02. To change the basic wind speed to other annual probabilities, the
basic wind speed Vb is multiplied by a probabihty factor Sp. Probability factor is obtained
by using the following expression
^ [5-ln[- ln(l-Q)]]
' ^[5-ln[-ln(0.98)]] ^^'^^
where Q is the desired annual probability of occurrence. The above equation is deduced
from the Fisher-Tipett Type I model for dynamic pressures that has mode / dispersion
ratio equal to 5. The probability factor modifies the basic wind speed to account for the
design method (limit state or working su-ess) used. For ultimate limit state a probabihty
factor of Sp = 1.18 (annual probability of 5.7 x 10" ) corresponding to mean recurrence
interval of 1754 years is used. Bridges and nuclear installations are designed with annual
probabilities of 0.0083 (120 year mean recurrence interval) and 10"* (10000 year mean
recurrence interval), respectively. For standard design, a probability factor of 1.0 is used.
3.2.4. Canadian Standard
The Canadian standard specifies velocity pressures based on annual probabilities of 0.1,
0.033 and 0.01. For the design of components and cladding the standard requires velocity
pressures with an annual probability of occurrence of 0.1 (10 year mean recurrence
interval). The design of building structural members are based on an annual probabihty of
occurrence of 0.033 (30 year mean recurrence interval). Important structures such as
31
buildings which have special post-disaster functions, are designed with an annual
probability of 0.01 (100 year mean recurrence interval). The Canadian standard does not
provide an importance factor like the American and British standards for changing the
velocity pressures to an altemate annual probabihty of occurrence.
3.3 Terrain Factor
The wind moving over the ground surface experiences retarding forces due to the
ground surface roughness. The layer of air experiencing retardation is referred to as the
boundary layer. The wind speed increases from zero at the ground surface to its
maximum value, at the gradient height Zg of the boundary layer. The depth or height of
the boundary layer depends on the wind intensity, roughness of terrain, and angle of
latitude. The wind speed at the top of the boundary layer is referred to as the gradient
speed. Above the gradient height the effect of ground roughness is negligible.
When determining the wind loads, the frictional force retarding the wind speed near the
ground surface is accounted by an exposure coefficient. The change in wind speed due to
large natural features of earth such as hills and valleys is accounted for by a topography
factor. All four standards define exposure categories based on the surface roughness. The
exposure coefficients used in the four standards are defined as the velocity pressure
coefficient in the American standard Kz, the terrain and stmcture height multiplier M(z.cat)
in the Australian standard, the terrain and building factor Sb in the British standard and the
exposure factor Cc in the Canadian standard. The exposure categories used in the four
standards are tabulated in Table 3.2.
32
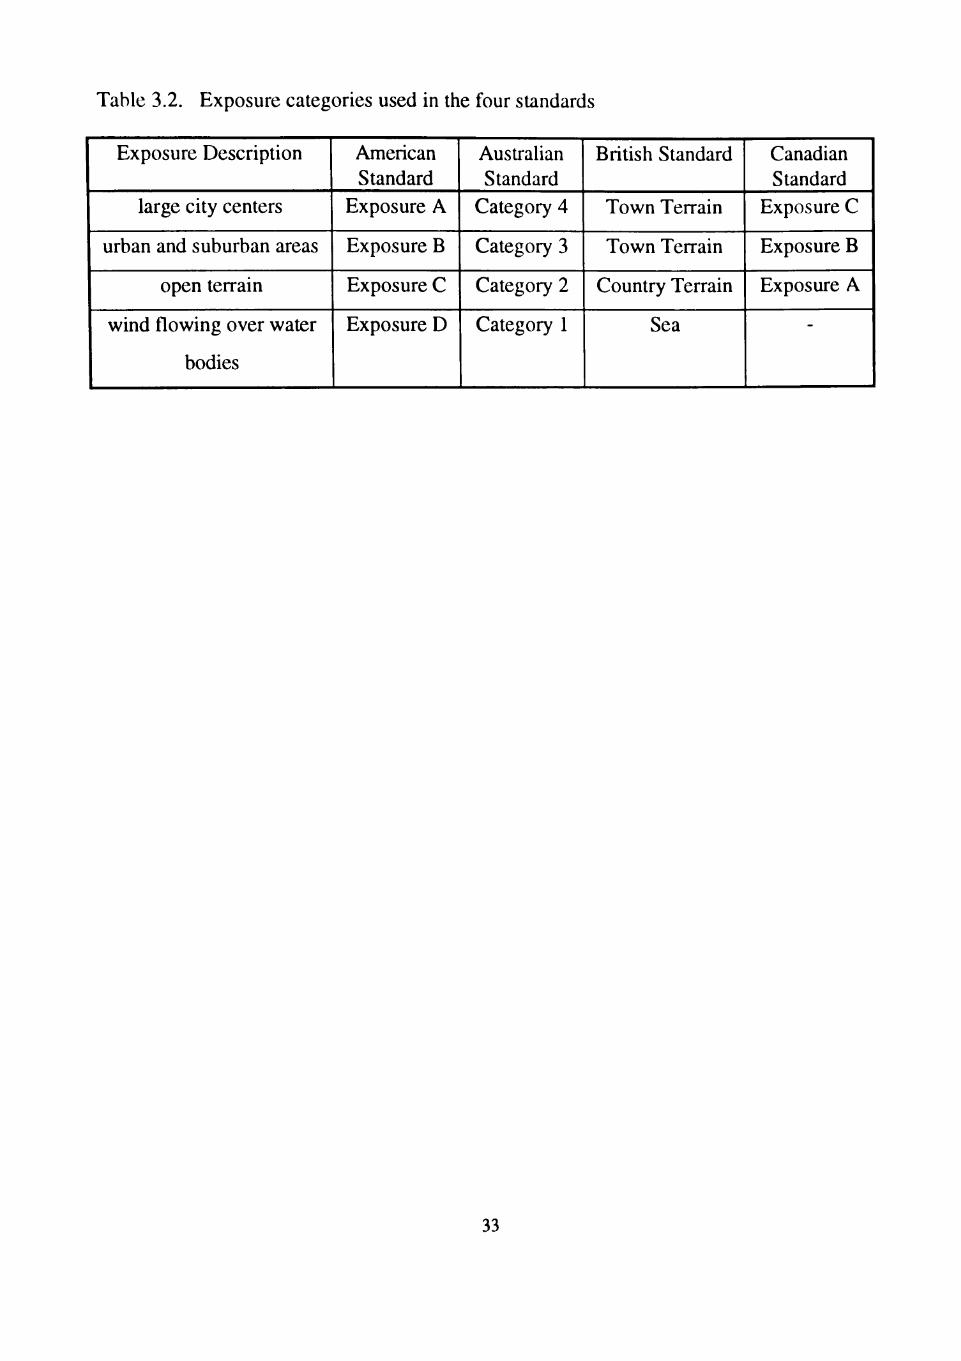
Table 3.2. Exposure categories used in the four standards
Exposure Description
large city centers
urban and suburban areas
open terrain
wind flowing over water
bodies
American Standard
Exposure A
Exposure B
Exposure C
Exposure D
Australian Standard
Category 4
Category 3
Category 2
Category 1
British Standard
Town Terrain
Town Terrain
Country Terrain
Sea
Canadian Standard
Exposure C
Exposure B
Exposure A
33
The variation in wind speed with height, known as a wind speed profile (Figure 3.3 ), can
be represented by the logarithmic law or the power law equation.
Logarithmic law:
1 z V, = - U J n —
k z„ (3.6)
where Vz: wind speed at height z,
Z(,: roughness length,
U*: frictional velocity.
Power law:
constant.
V = V * zl ^ i2 _ 2 _
or (3.7)
z
zg
7^ Z„
(3.8)
where V zg
^ g
Vz
a
gradient wind speed,
height above ground,
gradient height,
wind speed at any height Z,
exponential coefficient.
Meteorologists consider the logarithmic law as the superior representation of wind
profiles in the lower atmosphere (Simiu, 1986), but for engineering purposes the power
law is used without significant eiTor. Davenport (1965) assumed that the power law holds
34
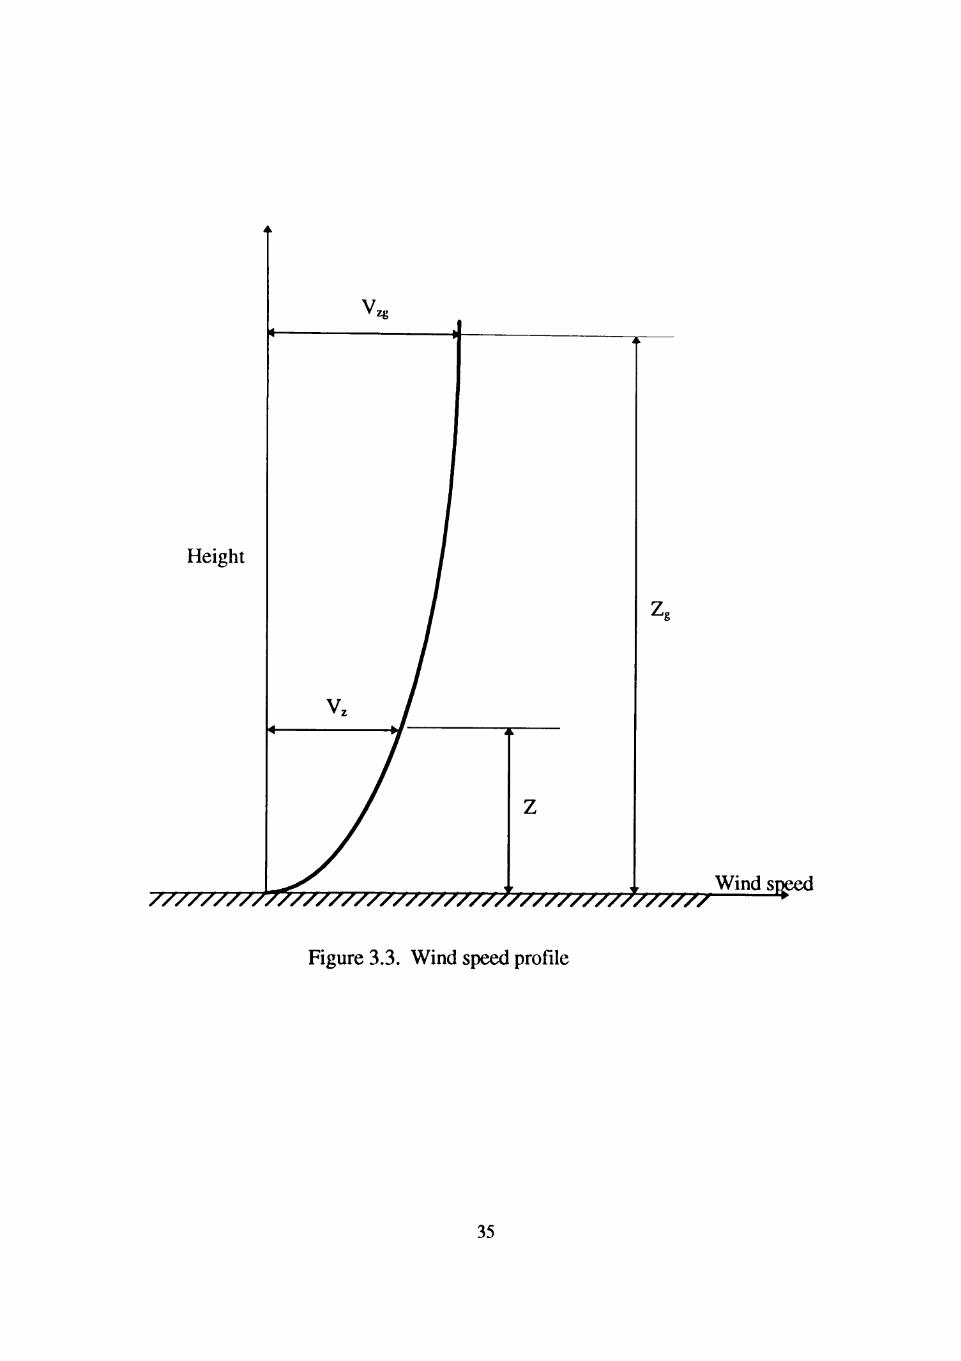
Wind speed
Figure 3.3. Wind speed profile
35
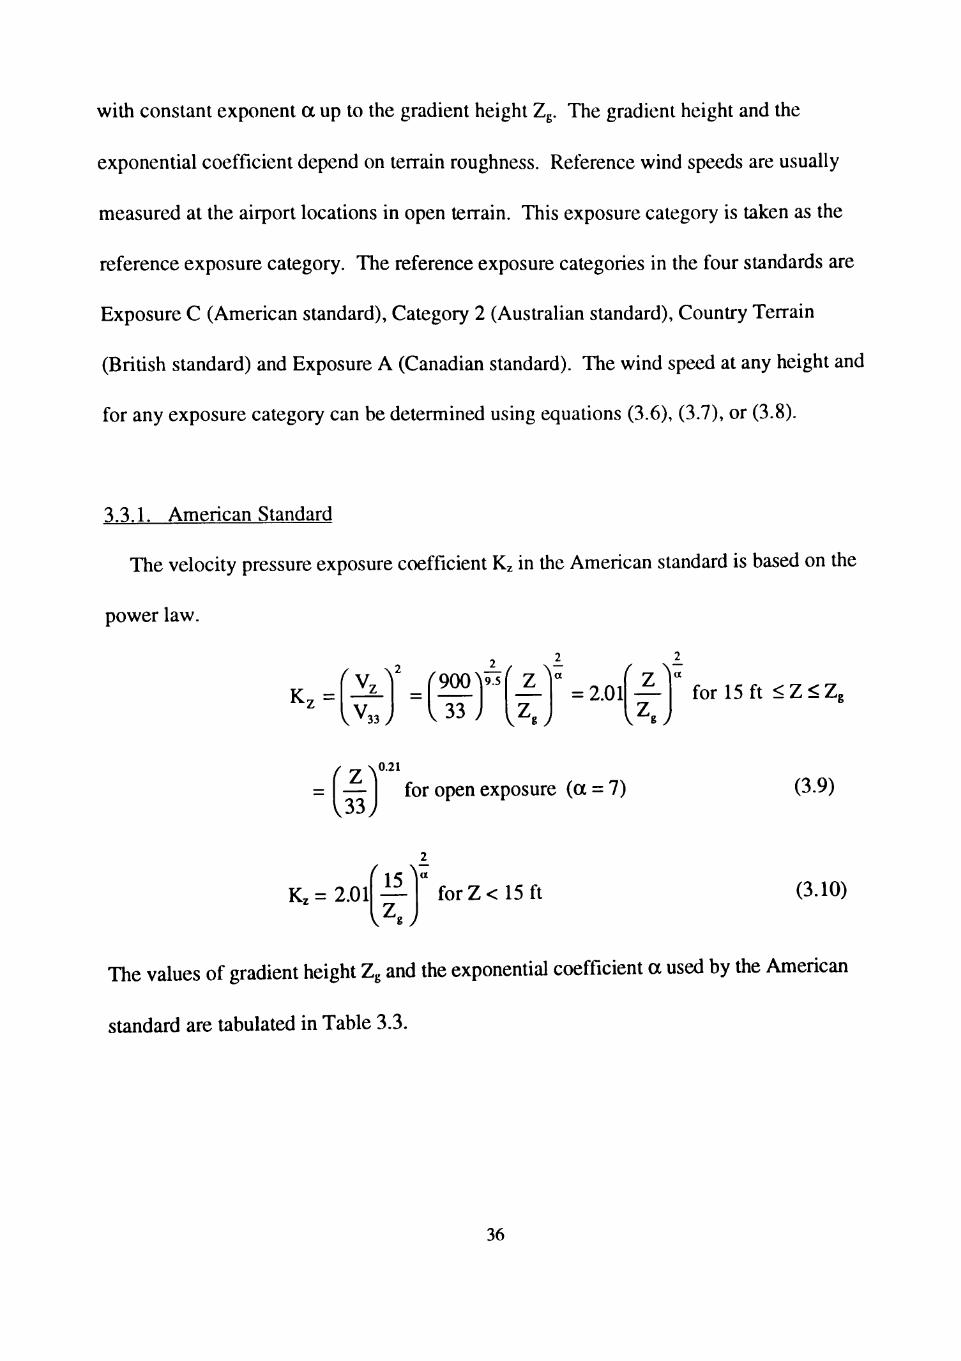
with constant exponent a up to the gradient height Zg. The gradient height and the
exponential coefficient depend on terrain roughness. Reference wind speeds are usually
measured at the airport locations in open terrain. This exposure category is taken as the
reference exposure category. The reference exposure categories in the four standards are
Exposure C (American standard). Category 2 (Australian standard). Country Terrain
(British standard) and Exposure A (Canadian standard). The wind speed at any height and
for any exposure category can be determined using equations (3.6), (3.7), or (3.8).
3.3.1. American Standard
The velocity pressure exposure coefficient Kz in the American standard is based on the
power law.
f^, V - — - - - ( -^ K:Z =
V^33y
r 900^1
v 3 3 y
9.5
V^sy = 2.01
^ Z ^
vZ.y for 15 ft <Z<Zc
/ ^ N 0 . 2 1
— I for open exposure (a = 7) U3.
(3.9)
K, = 2.01 for Z < 15 ft (3.10)
The values of gradient height Zg and the exponential coefficient a used by the American
standard are tabulated in Table 3.3.
36
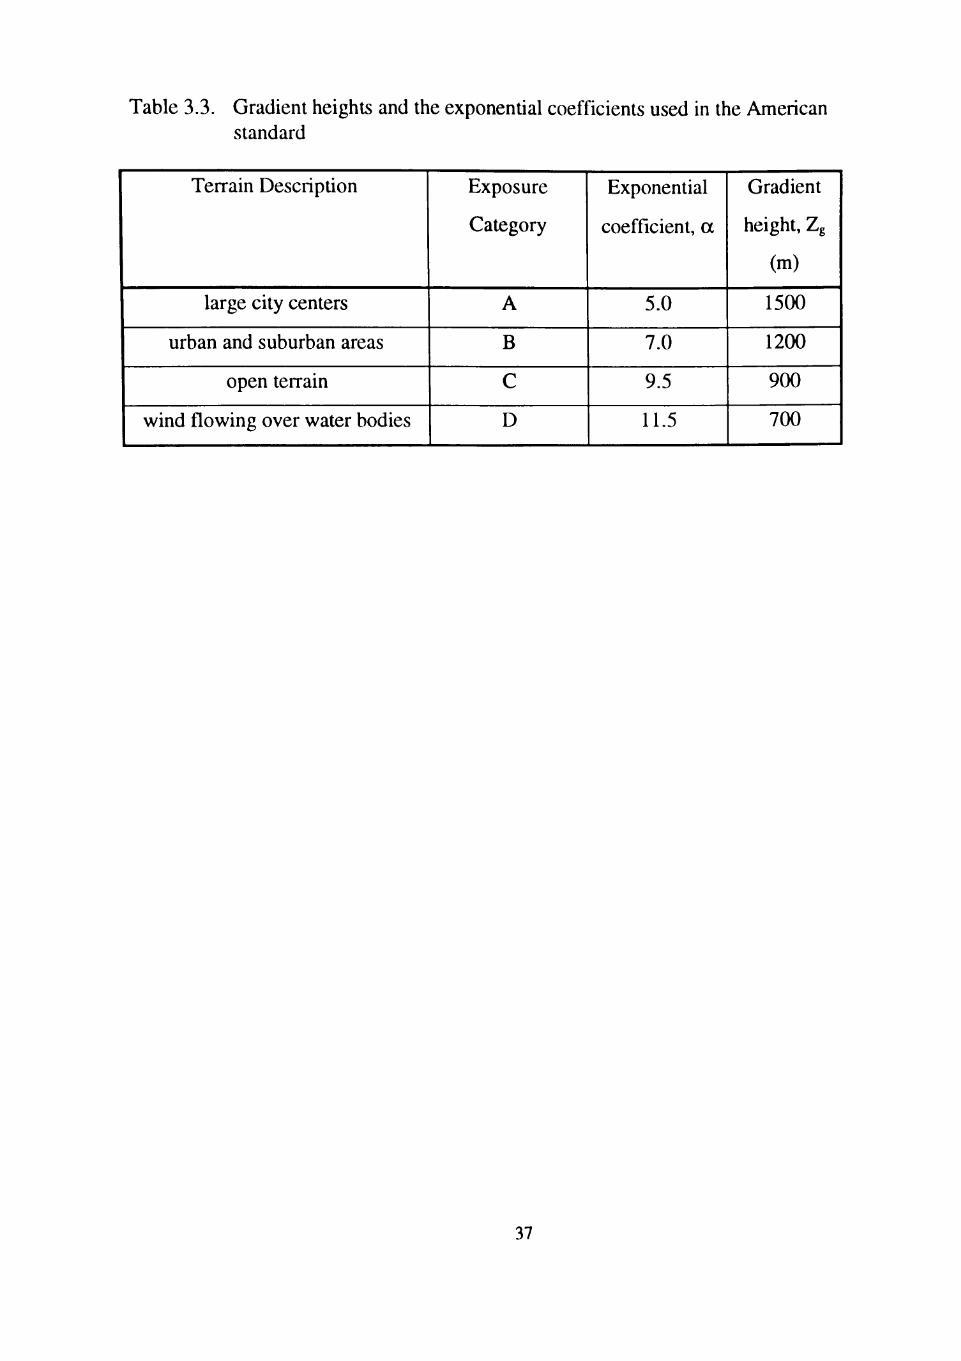
Table 3.3. Gradient heights and the exponential coefficients used in the American standard
Terrain Description
large city centers
urban and suburban areas
open terrain
wind flowing over water bodies
Exposure
Category
A
B
C
D
Exponential
coefficient, a
5.0
7.0
9.5
11.5
Gradient
height, Zg
(m)
1500
1200
900
700
37
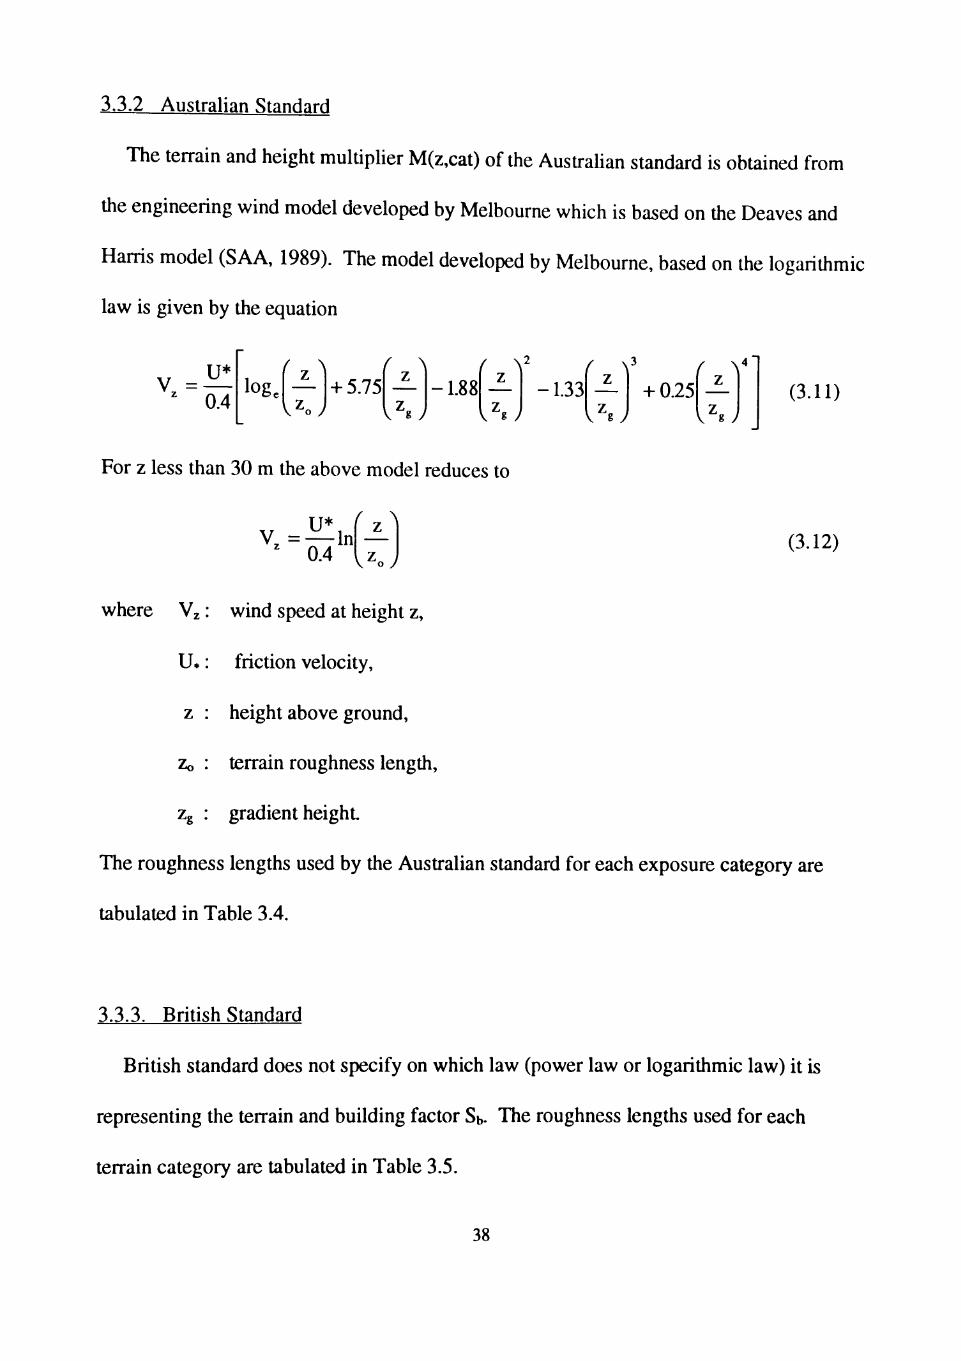
3.3.2 Australian Standard
The terrain and height multipher M(z,cat) of the Austrahan standard is obtained from
the engineering wind model developed by Melbourne which is based on the Deaves and
Harris model (SAA, 1989). The model developed by Melbourne, based on the logarithmic
law is given by the equation
U* ' 0.4
log. ^ z ^
+ 5.75 z
K^oJ v^.y -1.88
z
V ^ s /
r \' -1.33
v^sy -hO.25
z
v ^ y (3.11)
For z less than 30 m the above model reduces to
Vz = ' 0.4
u*, r z ^ In
y^oj (3.12)
where Vz: wind speed at height z,
U*: friction velocity,
z : height above ground,
Zo : terrain roughness length,
Zg : gradient height.
The roughness lengths used by the Australian standard for each exposure category are
tabulated in Table 3.4.
3.3.3. British Standard
British standard does not specify on which law (power law or logarithmic law) it is
representing the terrain and building factor Sb. The roughness lengths used for each
terrain category are tabulated in Table 3.5.
38
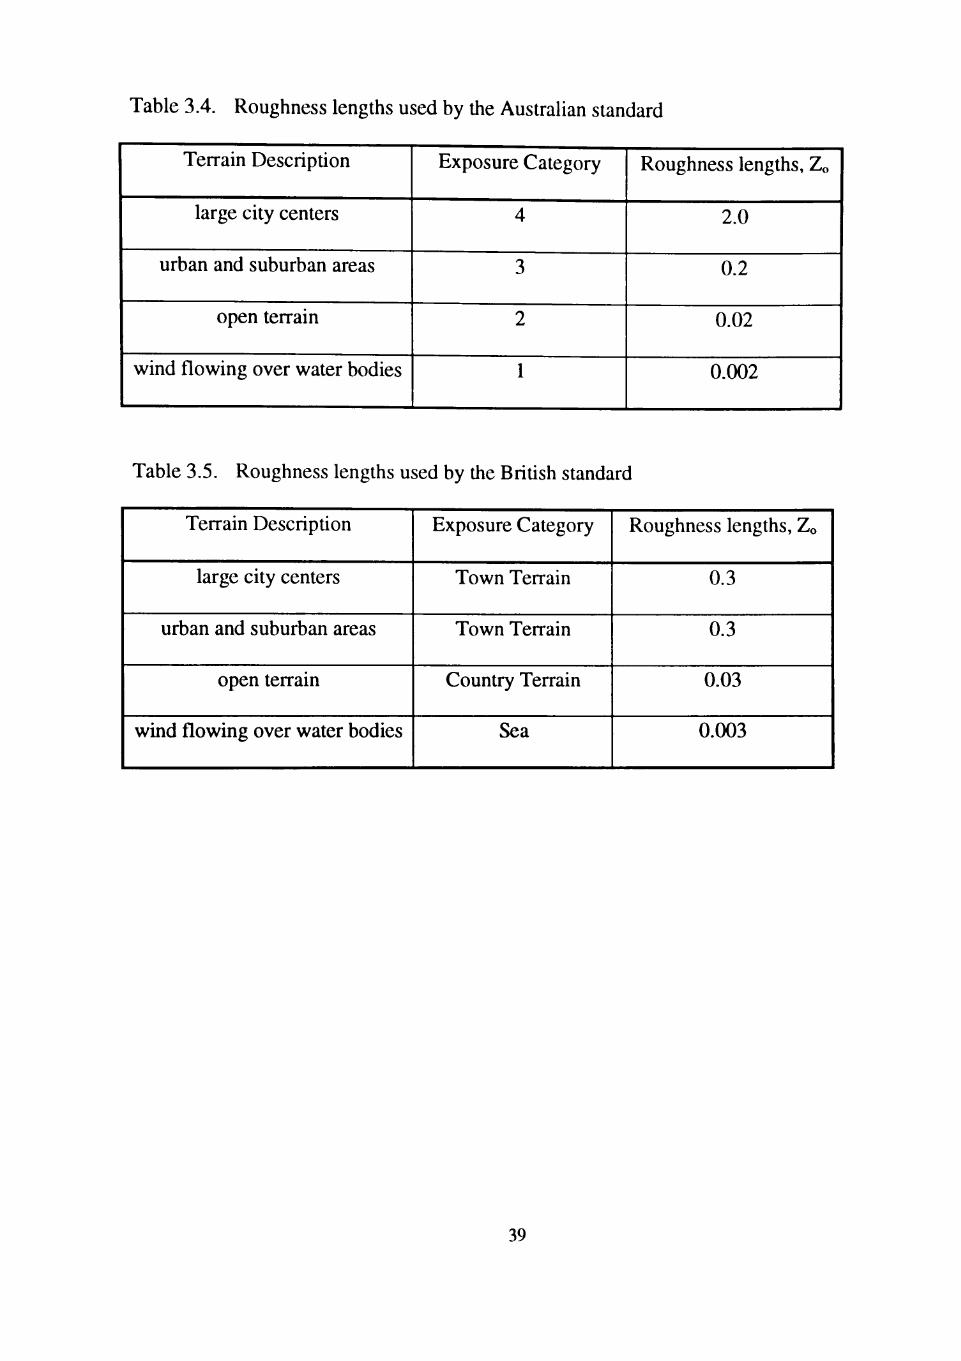
Table 3.4. Roughness lengths used by the Australian standard
Terrain Description
large city centers
urban and suburban areas
open terrain
wind flowing over water bodies
Exposure Category Roughness lengths, Zo
2.0
0.2
0.02
0.002
Table 3.5. Roughness lengths used by the British standard
Terrain Description
large city centers
urban and suburban areas
open terrain
wind flowing over water bodies
Exposure Category
Town Terrain
Town Terrain
Country Terrain
Sea
Roughness lengths, Zo
0.3
0.3
0.03
0.003
39
3.3.4. Canadian Standard
For the simple procedure, the exposure factor Ce is based on the power law with an
exponential coefficient equal to 1/5. The exposure coefficients for the detailed procedure
are obtained following an approach similar to one followed by the American standard. For
open exposure the Canadian standard gives the exposure coefficient as
C = Jo, (3.13)
The Canadian standard does not specify the gradient heights used in determining
exposure coefficient. The exponential coefficients for each terrain category are tabulated
in Table 3.6.
3.4 Gust Effect Factor
Most modem stmctures, which are more flexible, lower in damping, and hghter in
weight than the older structures, may have natural frequencies of vibrations in the same
range as the average frequencies of powerful gusts. These powerful gusts can induce
large resonant motions in alongwind direction. The resonant motions on flexible
stmctures or the additional loading effect induced by atmospheric turbulence on non-
flexible structures are accounted for by a gust effect factor. Atmospheric turbulence is
greater in rough terrain than in smooth terrain. In other words the magnitude of
turbulence increases with increase in terrain roughness and decreases with increase in
height above ground. However, gust size is smaller in rough terrain than in smooth
terrain. The rapid fluctuations of wind which cause dynamic amplification or resonant
40
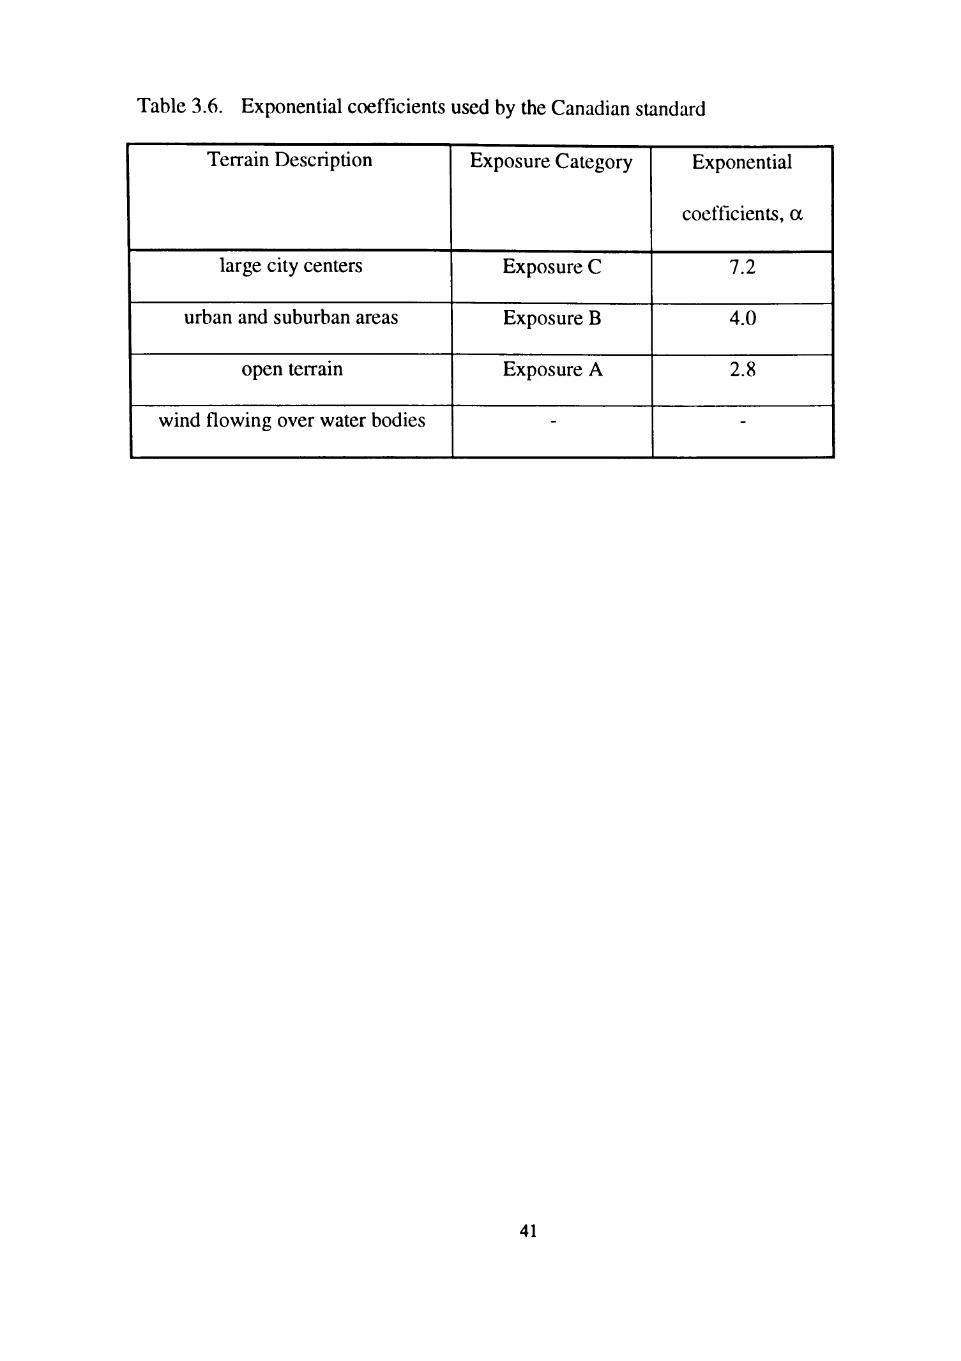
Table 3.6. Exponential coefficients used by the Canadian standard
Terrain Description
large city centers
urban and suburban areas
open terrain
wind flowing over water bodies
Exposure Category
Exposure C
Exposure B
Exposure A
-
Exponential
coefficients, a
7.2
4.0
2.8
-
41
motion are taken into account by applying a gust factor to the average wind pressure
(Davenport, 1967). Davenport (1967) accounted for the dynamic response by applying a
gust factor to the average wind pressure
P(z)n,ax =Gp(z) (3.14)
where p ^ = average pressure on the structure at height 'z',
p(z) = total wind pressure,
G = gust factor.
The four national standards, use different approaches to account for additional loading
effects due to wind turbulence.
3.4.1. American Standard
The American standard accounts for the loading effect induced by atmospheric
turbulence by applying a gust effect factor to wind pressure. The reference wind speed
used by the American standard is a 3-second gust speed. The 3-second gust speed is an
instantaneous wind speed equal to sum of mean wind speed and gusting wind speed. This
fact indicates that the American standard includes gustiness induced by the wind
turbulence in the reference wind speed itself The motion of air near the ground surface is
very turbulent. The eddies formed as a result of wind turbulence vary over a wide range
of sizes. When eddies, which are smaller than the structure, impinge on the stmcture they
will not produce maximum pressure over the entire structure surface. The wind pressures
produced by a 3-second gust speed should account for lack of correlation of wind induced
loads over large size surfaces. Hence, as the size of the stmcture increases, the gust effect
42
factor should reduce. The American standard accounts for the lack of correlation of wind
induced loads, by incorporating a gust effect factor which decreases to less than unity with
an increase in the stmcture size and with increase in the terrain roughness. Using the
above argument for rigid stmctures, the American standard uses a gust effect factor of 0.8
for Exposures A and B and 0.85 for Exposures C and D.
For flexible stmctures the American standard uses a rational method for evaluating the
gust effect factor. The approach described in the commentary of ASCE 7-95 takes into
account the terrain roughness in terms of the power law exponent, the effect of building
size, average size of the turbulent eddies (integral scale), mass, natural frequency and
damping of the structure.
For special low-rise buildings having height less than or equal to 60 ft and for
components and claddings, the American standard gives combined values of gust effect
factor and pressure coefficients in the form of graphs. The combined values of gust effect
factor and pressure coefficients are obtained from the data coUected in wind tunnel
experiments; these values should not be separated. The combined values of gust effect
factor and pressure coefficients for special low-rise buildings are tabulated in the standard
for different building areas represented by zones based on the roof angle. The combined
values of gust effect factor and pressure coefficients for components and claddings are
formulated based on the effective wind area or the tributary area pertaining to the
respective zones and roof angles.
43
3.4.2. Australian Standard
The static analysis of the Austrahan standard uses 3-second gust wind speed as the
basic wind speed. The effect of wind gustiness is included in the reference wind speed
itself Therefore, the Australian standard does not use gust effect factor to account for the
loading effects due to wind turbulence. The Australian standard applies an area reduction
factor Ka for roofs and side walls to reduce the peak loads produce on large tributary
areas. The standard uses an area reduction factor of 1.0 for tributary areas of less than 10
m and an area reduction factor of 0.8 for tributary areas of more than 100 m .
In the dynamic analysis for flexible stmctures, the AusU-alian standard uses a gust factor
similar to the gust effect factor used by Canadian standard. For the dynamic analysis of
structures the Australian standard coverts the 3-second gust wind speed to a mean hourly
wind speed. The gust effect factor used by the standard is based on the model proposed
by Davenport (1967).
3.4.3. British Standard
The British standard uses mean houriy wind speed as the reference wind speed. Since
mean hourly wind speed is converted to a gust wind speed by a gust peak factor gt, the
British standard does not use a gust effect factor. The gust peak factor is used in the
calculation of the terrain and building factor Sb, which takes into account the gust
duration, the height and the size of the stt-ucture. The size effect factor Ca, of the standard
method is based on gt = 3.44.
44
Gust peak factor gt is used for static stmctures to give the appropriate gust speed
which will envelope the structure or component to produce the maximum load. In the
calculation of terrain and building factor Sb for country terrain, gust peak factor is
multiplied by turbulence factor St which varies with height above ground. For town
terrain, turbulence factor St is multiplied by ttirbulence adjustment factor Tc. This shows
that although the standard does not use a gust effect factor it is considering the gust
influence on the building size and its variation with terrain roughness and height above
ground.
3.4.4. Canadian Standard
Canadian standard defines the gust effect factor as the ratio of the maximum and mean
effect of the loading. The procedure adopted by the Canadian standard in evaluating the
gust effect factor is essentially based on the procedure proposed by Davenport (1967), and
is similar to the one used in the detailed procedure for dynamic analysis in Austrahan
standard. The gust effect factor in the Canadian standard takes into account: the surface
roughness of the terrain, the background turbulence, size reduction factor, building
dimension, natural frequency, and damping of the stmcture. For rigid sU-uctures,
Canadian standard employs a gust effect factor of 2.5 for components and claddings and a
gust effect factor of 2.0 for the main wind resisting system.
Canadian standard divides the total response caused by the wind gustiness into two
components: the background component, acting quasi-statically without any sU-uctural
dynamic magnification, and a resonant component close to the natural frequency of the
45
structure. In the simple procedure used for rigid structures the resonant component is
assumed to be small and the gustiness is taken as a static load. Similar to the American
standard, the Canadian standard also gives combined values of gust effect factor and
pressure coefficients for low-rise buildings. Gust effect factor for flexible buildings is
calculated using the procedure given in the "Supplement to the National Building Code of
Canada" (NRCC, supplement 1990).
3.5 Pressure Coefficients
The pressure coefficients are determined from wind tunnel experiments on small
scale models or from experimental results from full scale buildings. Pressure
coefficients are represented by a non-dimensional parameter Cp as
C p = ^ ^ ^ (3.15)
\f>Vl
where p : pressure at some point on the building surface,
po : pressure of the undisturbed flow of air,
p : density of the undisturbed flow of air,
Vo: velocity of the undisturbed air flow.
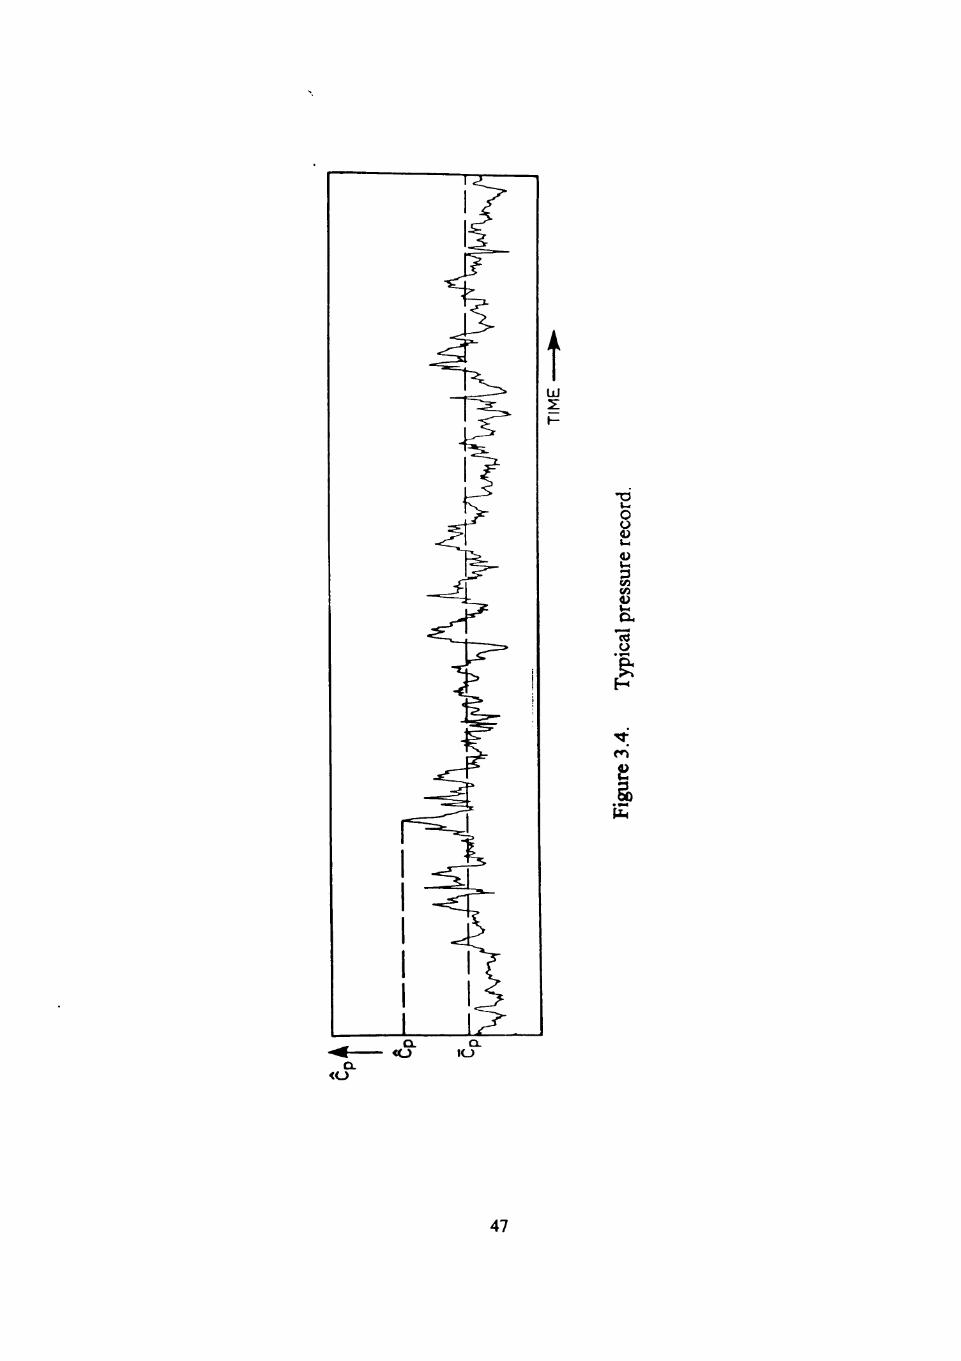
The pressures and forces obtained by using any wind load standard gives the
impression that these pressures and forces are steady or constant with time. In reality,
pressures measured on a building surface fluctuates rapidly with time and with large
amplitudes (see Figure 3.4) in a manner similar to wind speed. Figure 3.4 shows a typical
pressure record, where ^ and p represent the mean pressure and the peak pressure. The
46
o o ii
ii
Vi ii
Q.
u
rn
3)
47
mean and peak pressure coefficients are represented as
C p = f - ^ (3.16)
_ P - P . C p = - ^ - ^ (3.17)
2
The mean pressure coefficient obtained from the mean pressure correspond to the
average extemal loads on the various surfaces of a building. Mean pressure coefficients
are independent of time averaging. Peak pressure coefficients, obtained from peak
pressure, are time and specially averaged pressure coefficients. The combined values of
pressure coefficients and gust effect factors given by the American standard and Canadian
standard are peak pressure coefficients.
Pressures acting on a building can be divided into two categories; extemal and intemal
pressures. Air flowing over and around a building causes pressure on the building's
surface; this pressure is called external pressure. The obstruction of the building induces
the separation of flow from the boundary surface causing wind turbulence. The turbulent
regions where the flow separation takes place is known as the separation region. The
point where the flow separation takes place is known as the separation point. The region
downstream from the flow separation point is termed as the wake region. The pressure in
this wake region may be represented as a non-dimensional pressure coefficient Cp given
by equation (3.15). Openings in the extemal surface of a building can increase or decrease
the pressure inside the building. This increase or decrease in pressure within the building
is called intemal pressure. Openings in the windward wall increase the pressure inside the
48
building. The leeward or a side wall openings decrease pressure within the building as the
air inside the building is removed by the suction created by the wind flowing around the
building. Intemal pressure behavior differs from extemal pressure in two ways: Liu
(1983)
1. Internal pressure depends on openings such as windows and doors.
2. Intemal pressure is constant through out a room and for buildings with
loosely separated rooms, it is constant throughout the building.
The forces exerted by the wind on walls and roof depends both on the external and
internal pressure. The vector sum of the internal and external pressure gives the
magnitude and the direction of the resultant force.
In all the four standards the extemal and intemal pressure coefficients are given in
figures and tables, which facilitates the design of claddings and stmcture for many simple
building geometry's. Since pressure coefficients vary with shape, size, and wind direction
it is very difficult to provide pressure coefficients for all shapes and sizes in the standards.
The sign convention used by all four standards is +ve for pressure acting toward a surface
and negative for pressure acting away from a surface. All standards give intemal pressure
coefficients based on wall openings and porosity. To facilitate use of tables and graphs
given for pressure coefficients all standards give notes.
3.5.1. American Standard
The American standard divides extemal pressure coefficients into two main categories:
(1) pressure coefficient Cp for buildings of all height;
49
(2) combined values of pressure coefficients and gust effect factor GCp for
buildings with height less than or equal to 60 ft (special low-rise buildings)
and for components and claddings.
The extemal pressure coefficients Cp are the mean pressure coefficients which represent
the actual loading on each surface of the building based on wind direction. These
pressure coefficients are specified according to a given wind direction and various building
aspect ratios. The combined values of pressure coefficients and gust effect factor GCp
given by the standard are both time and specially averaged. For components and
claddings the American standard provides GCp values based on the tributary area. For
special low-rise buildings GCp values are given based on the zonal division of the building
surface.
3.5.2. Australian Standard
For windward walls, the Australian standard gives different average pressure
coefficients for buildings with height less than 25 m and for buildings with height greater
than 25 m. The standard gives same pressure coefficients for leeward walls, side walls,
and roofs for high-rise and low-rise buildings. Pressure coefficients for leeward walls are
based on the ratios between the two horizontal dimensions of the buildings and the roof
angle. For roofs, pressure coefficients are assigned according to the horizontal distance
from the windward edge and the h/d ratios. Pressure coefficients for side wall are also
given according to the horizontal distance from the windward face. To determine wind
pressure on components and claddings, the Australian standard gives local pressure factor
50
Ki which is multiplied by the appropriate wall or roof pressure coefficients to give the
peak pressures. The standard does not give -hve or inward acting pressure coefficients on
roofs.
3.5.3. British Standard
In contrast with the American and AusU-alian standards, which give pressure
coefficients based on the ratio of horizontal dimension, the British standard gives the
pressure coefficients for windward and leeward walls based on the D/H ratio (where D is
the dimension parallel to wind and H is the height of the building). In comparison to the
Australian standard, the British standard gives side wall and roof pressure coefficients
according to the horizontal distance from the windward edge. For components and
claddings British standard does not give separate pressure coefficients. The size effect
factor in the standard method of the British standard is taken as 1.0 for any surface area
with diagonal dimension less than 5 m. In directional method the gust peak factor for
designing components and claddings is taken equal to 3.44.
3.5.4. Canadian Standard
Similar to American standard, Canadian standard also gives combined values of
pressure coefficients and gust effect factors for components and claddings and for low-rise
buildings. For high-rise buildings separate pressure coefficients are given. The standard
does not give pressure coefficients for buildings having HAV ratio less than one. For small
51
cladding areas on high-rise buildings the standard gives local pressure coefficient which
facilitate the design of components and claddings.
3.6 Summary
The American standard and the AusU-alian standard use 3-second gust wind speed
while the British standard and the Canadian standard use mean houriy wind speed. For
dynamic analysis the AusU-ahan standard uses mean houriy wind speed. The Australian
standard gives basic wind speeds associated with mean recurrence intervals of 20, 50, and
1000 years. The mean recurrence intervals in Australian standard are based on the
designing method used. The Canadian standard gives wind speeds with mean recurrence
intervals of 10, 33, and 100 years. The American standard and the British standards
modify basic wind speed to other probability of occurrences using importance factor and
probabihty factor respectively.
All the standards account for variation in wind speed with height and terrain. In
determining the coefficients related to variation in wind speed with height and terrain, the
American and the Canadian standards adopted power law equation, while the Australian
standard adopted the logarithmic law equation. The British standard does not specify
which law (power law or logarithmic law) it has adopted.
The American and the Canadian standards use gust effect factor both for static analysis
and for dynamic analysis. The Australian standard applies gust effect actor for dynamic
analysis only. The British standard does not use gust effect factor. However, by
incorporating gust peak factor and turbulence adjusunent factor in the calculation of
52
terrain and building factor, the standard does consider gust influence on building size and
its variation with terrain roughness and height.
All the standards determine pressure coefficients similarly either by wind tunnel
experiments or by full scale experiments. However, differences in averaging time and
methods adopted for accounting exposure factor and gust effect factor result in the values
of the pressure coefficients varying significantly. For low-rise buildings, the American and
the Canadian standard gives combined values of pressure coefficients and gust effect
factor for the main wind-force resisting system and components and claddings. The
American standard also uses these combined values for calculating design pressure on
component and claddings of buildings with height greater than 60 ft.
53
CHAPTER IV
CASE STUDY
The case study deals with the calculations of wind loads on a low building (60 ft x 100
ft X 15 ft) and a 160 ft high building (100 ft x 200 ft in plan) using the four national
standards. The actual wind load computations for each standard are given in the
appendices. The low building and the 160 ft building selected for the case study are
shown in Figure 4.1 and Figure 4.2, respectively. The calculation of wind pressures on
both buildings, using the four standards, are based on the following set of conditions
(1) The buildings are assumed to be located in a suburban area.
(2) The 3-second gust wind speed associated with 0.02 annual probability of
exceedance is assumed to be 110 mph (49 m/s).
(3) Both the buildings are assumed to be conventional stmctures.
For calculating wind loads based on the Australian standard a permissible stress gust
wind speed Vp of 49 m/s (110 mph) is used. The basic wind speed used by the British
standards is mean hourly wind speed. An equivalent mean hourly wind speed for the 3-
second gust speed of 110 mph used in the American standard is 72.7 mph (32.4 m/s). The
Canadian standard recommends a reference wind speed associated with annual
probabilities of 0.033 for design of main wind-force resisting system and 0.1 for design of
components and claddings. The equivalent mean hourly wind speed associated with
annual probabihties of 0.1 and 0.033 are 61.1 mph (27.2 m/s) and 68.3 mph (30.4 m/s),
respectively. The equivalent wind speeds are obtained using the Durst curve (Figure 3.2)
54
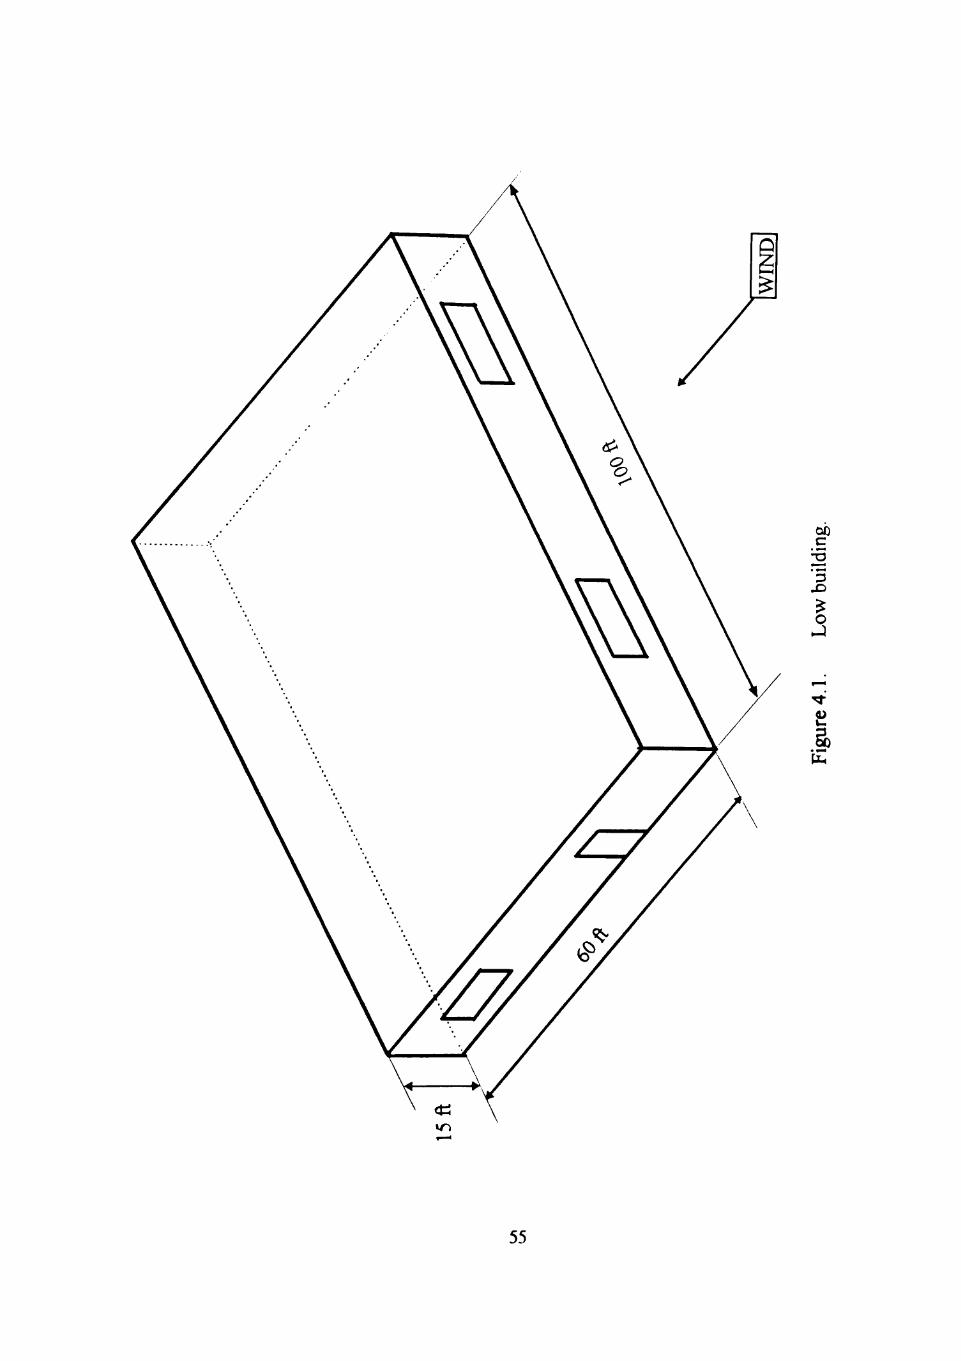
00 c
3
o
u 3>
55
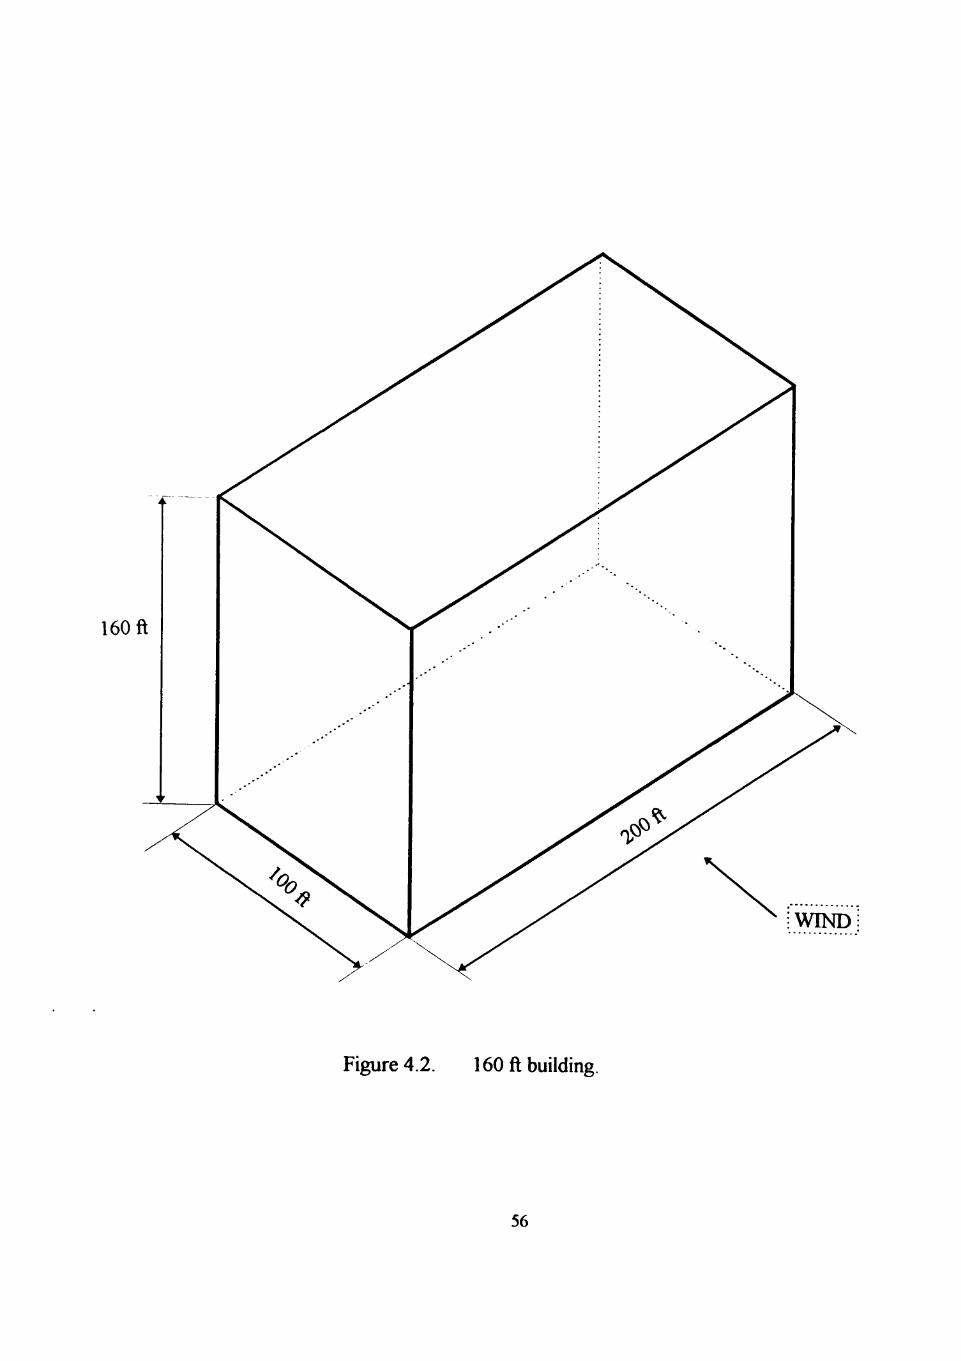
160 ft
Figure 4.2. 160 ft building.
56
and the factors given in the commentary of the American Standard (Figure C6, ASCE 7-
95).
4.1 Low Building
The low building selected for case study is a 100 ft x 60 ft x 15 ft single story flat roof
building. The building structural framing contains six portal frames spaced at 25 ft on
center. Roof purlins and wall grits span between main frames with a 5 ft spacing between
them. The stmctural framing system is shown in Figure 4.3. The building is provided
with one 10 ft x 8 ft door in one of the 60 ft walls. One 6 ft x 5 ft window is provided in
each of the 60 ft long walls and two windows of the same area are in each of the 100 ft
long walls. For the selection of intemal pressure coefficients, the building is considered to
have uniform openings in all four walls. None of the openings are considered a dominant
opening in one particular wall.
The wind load parameters used in the computations for each standard are shown in
Table 4.1. The detailed procedure for static stmctures of the Australian standard does not
use gust effect factor. An area reduction factor K, is used as a correction factor to the
peak loads on side walls and roof when large U-ibutary areas are involved. The area
reduction factor decreases to a minimum value of 0.80 with increase in tributary area from
10 m^ to 100 ml The computational methods given in the British standard not use gust
effect factor, since the mean houriy wind speed is converted to a gust wind speed by the
gust peak factor. The gust peak factor accounts for the gust duration, height and size of
the structure. The size effect factor used in standard method of the British standard is
57
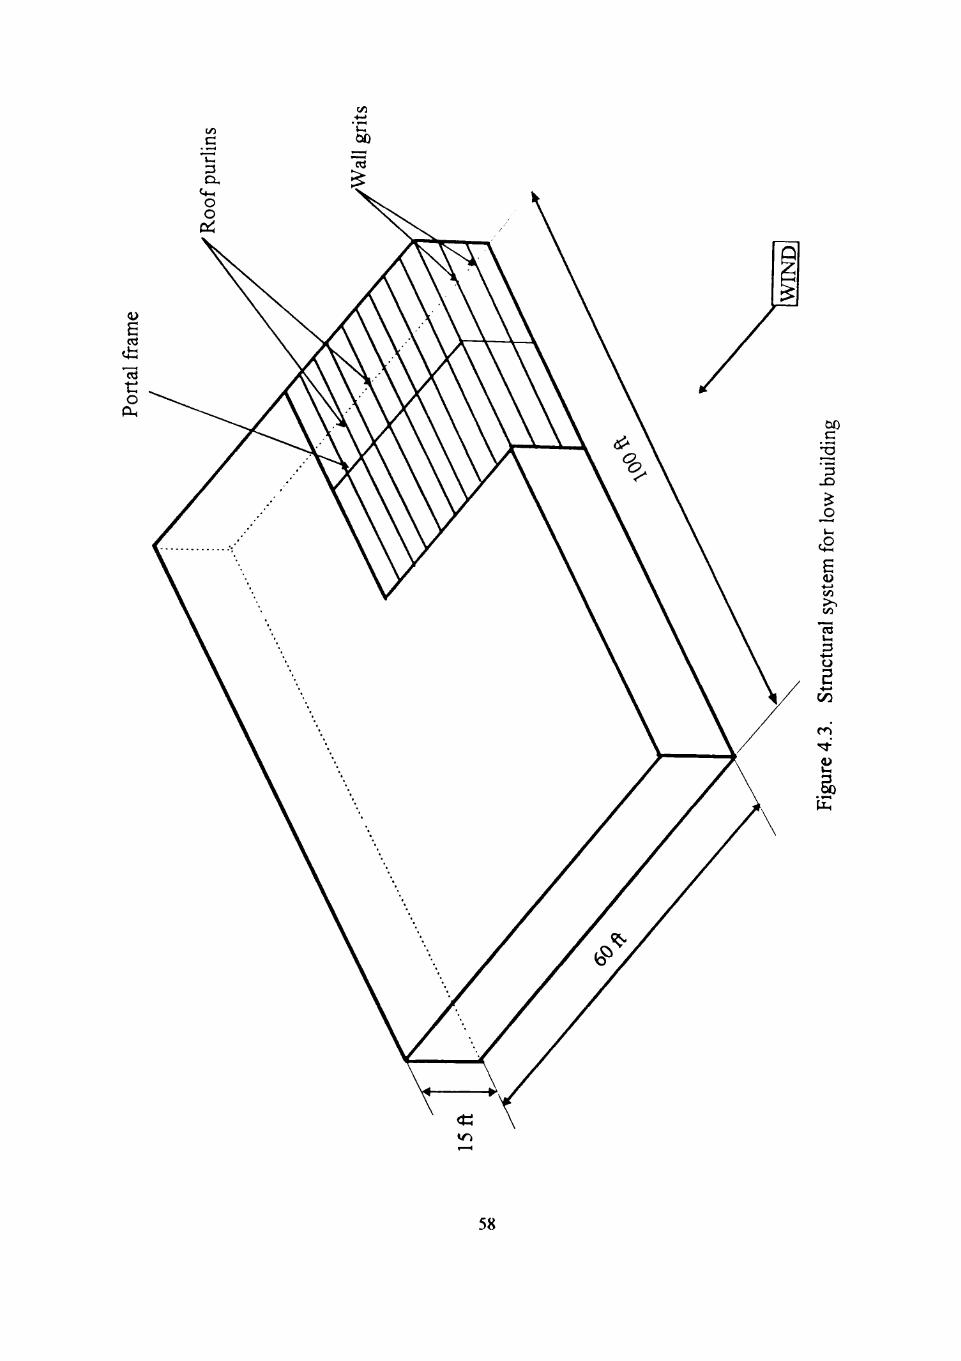
Vi
Vi
C no
ii B a
In t: o 00
c
is "5 X) o a ii *-> Vi >^ Vi
u 3
•4-)
o s
• « - >
r-i rf ii
58
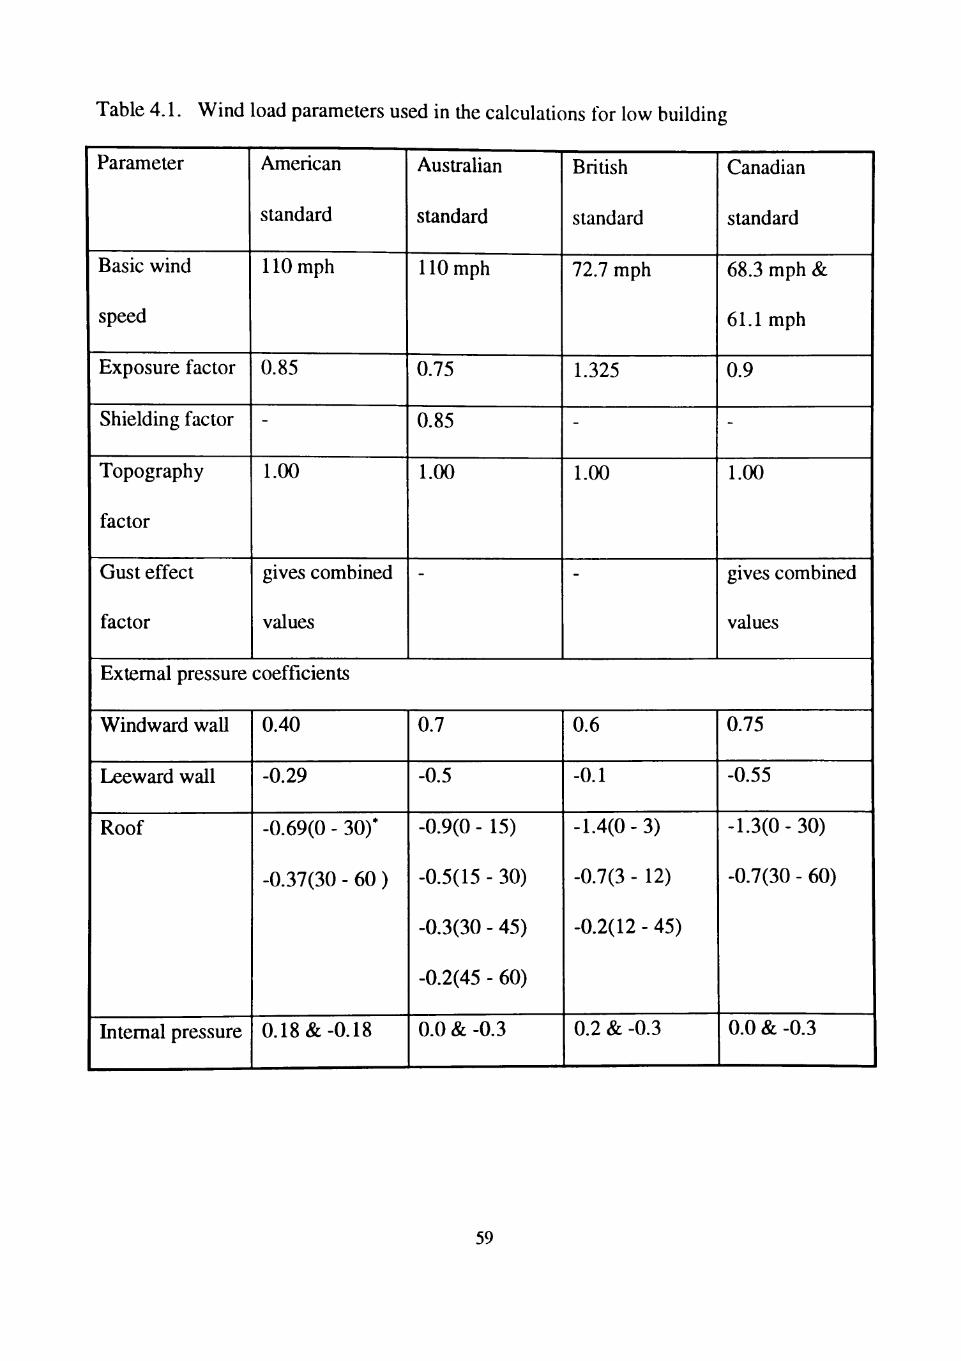
Table 4.1. Wind load parameters used in the calculations for low building
Parameter
Basic wind
speed
Exposure factor
Shielding factor
Topography
factor
Gust effect
factor
American
standard
110 mph
0.85
-
1.00
gives combined
values
Australian
standard
110 mph
0.75
0.85
1.00
British
standard
72.7 mph
1.325
-
1.00
Canadian
standard
68.3 mph &
61.1 mph
0.9
-
1.00
gives combined
values
Extemal pressure coefficients
Windward wall
Leeward wall
Roof
Intemal pressure
0.40
-0.29
-0.69(0 - 30)*
-0.37(30 - 60)
0.18 &-0.18
0.7
-0.5
-0.9(0 - 15)
-0.5(15 - 30)
-0.3(30 - 45)
-0.2(45 - 60)
0.0 & -0.3
0.6
-0.1
-1.4(0-3)
-0.7(3 - 12)
-0.2(12 - 45)
0.2 & -0.3
0.75
-0.55
-1.3(0-30)
-0.7(30 - 60)
0.0 & -0.3
59
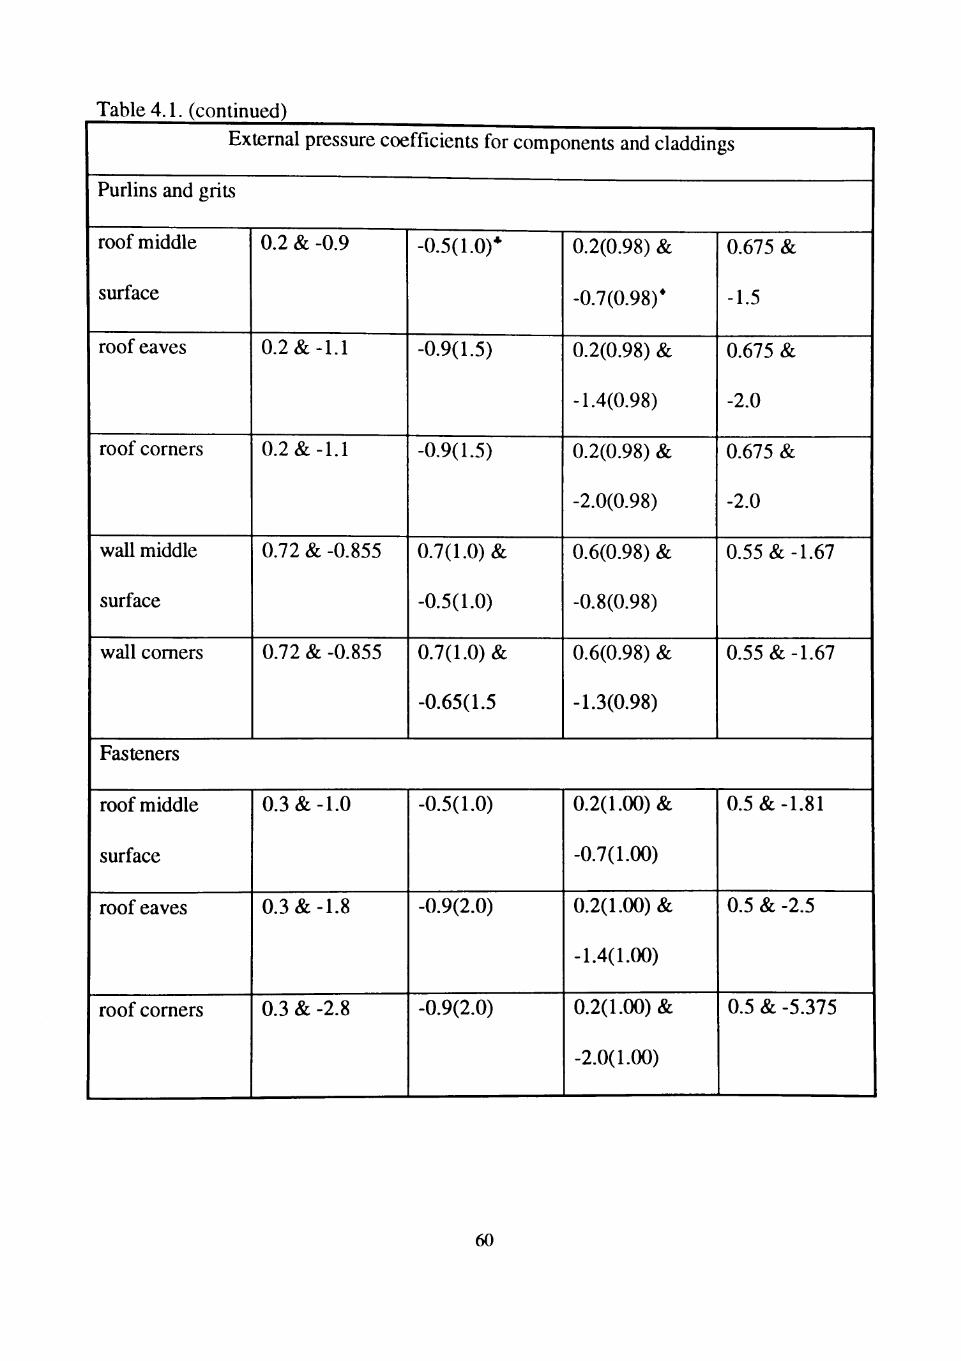
Table 4.1. (continued)
External pressure coefficients for components and claddings
Purlins and grits
roof middle
surface
roof eaves
roof corners
wall middle
surface
wall comers
0.2 & -0.9
0.2 &-1.1
0.2 &-1.1
0.72 & -0.855
0.72 & -0.855
-0.5(1.0)*
-0.9(1.5)
-0.9(1.5)
0.7(1.0) &
-0.5(1.0)
0.7(1.0) &
-0.65(1.5
0.2(0.98) &
-0.7(0.98)*
0.2(0.98) &
-1.4(0.98)
0.2(0.98) &
-2.0(0.98)
0.6(0.98) &
-0.8(0.98)
0.6(0.98) &
-1.3(0.98)
0.675 &
-1.5
0.675 &
-2.0
0.675 &
-2.0
0.55 &-1.67
0.55 &-1.67
Fasteners
roof middle
surface
roof eaves
roof corners
0.3 &-1.0
0.3 &-1.8
0.3 & -2.8
-0.5(1.0)
-0.9(2.0)
-0.9(2.0)
0.2(1.00) &
-0.7(1.00)
0.2(1.00) &
-1.4(1.00)
0.2(1.00) &
-2.0(1.00)
0.5 &-1.81
0.5 & -2.5
0.5 & -5.375
60
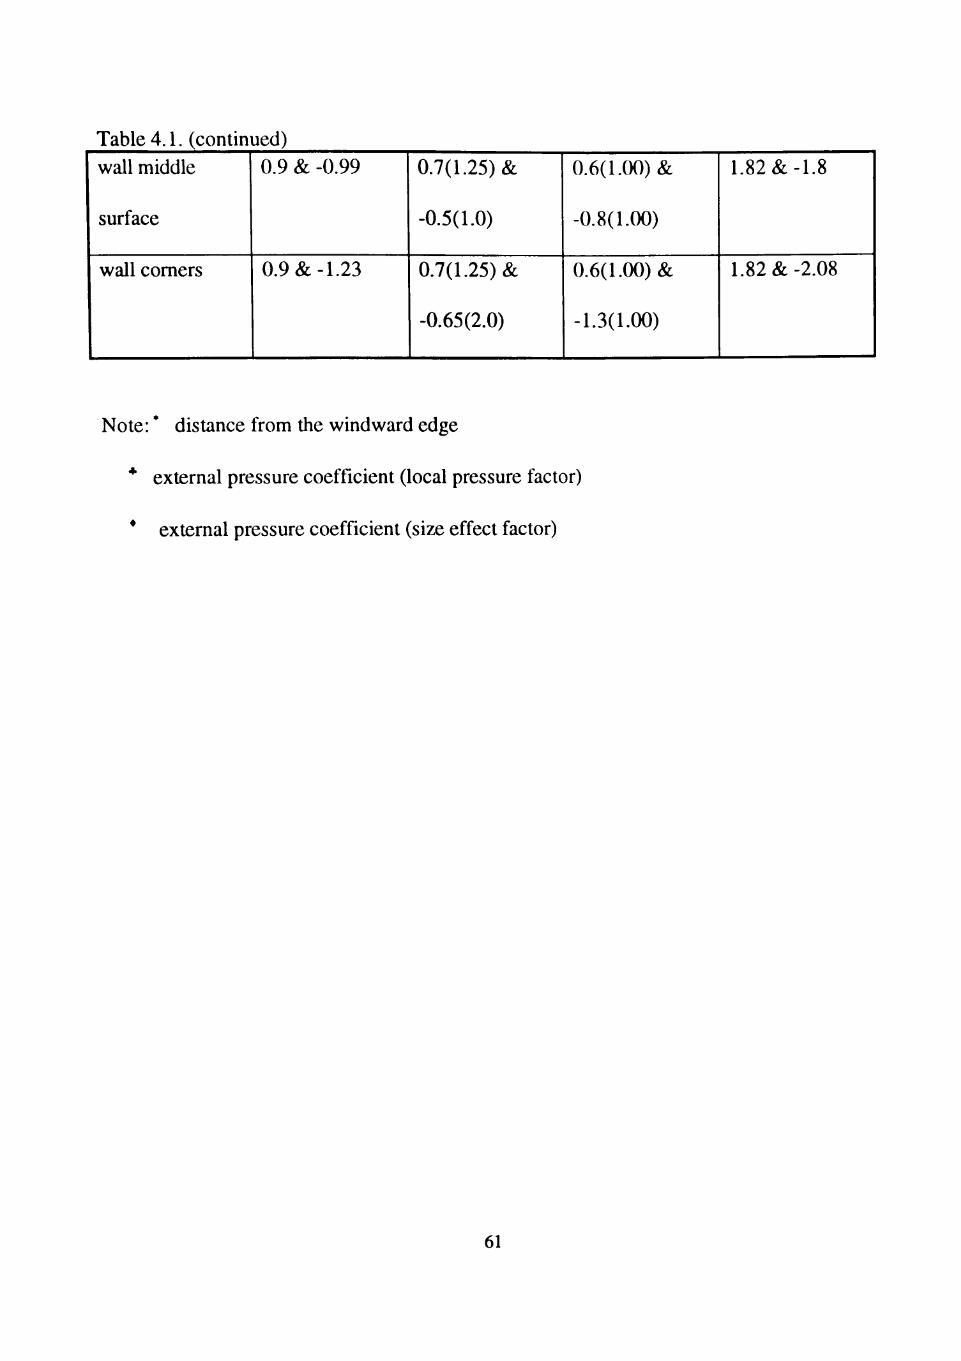
Table 4.1. (continued) wall middle
surface
wall comers
0.9 & -0.99
0.9 &-1.23
0.7(1.25) &
-0.5(1.0)
0.7(1.25) &
-0.65(2.0)
0.6(1.00) &
-0.8(1.00)
0.6(1.00) &
-1.3(1.00)
1.82 &-1.8
1.82 &-2.08
Note: * distance from the windward edge
* external pressure coefficient (local pressure factor)
* external pressure coefficient (size effect factor)
61
determined based on gust peak factor gt = 3.44. The American and Canadian standards
give combined values of pressure coefficients and gust effect factor for the components
and claddings and the main wind force resisting system of a low building. The Austrahan
standard gives a single value for the pressure coefficient on a windward wall. The
pressure coefficients on leeward walls are divided based on the d/b ratio, where 'b' and 'd'
are the across wind and along wind dimensions. The British standard gives the windward
wall and leeward wall pressure coefficients based on the D/H ratio, where D is the
alongwind dimension and H is the height of the stmcture. The American and the Canadian
standards give pressure coefficients for components and claddings based on the tributary
areas. The peak loads arising on small tributary areas are accounted by size effect factor
in the Bridsh standard and by local pressure factor and area reduction factor in the
Austrahan standard.
The design pressures on the main wind force resisting system obtained for each
standard are shown in Figure 4.4. The base shear, overtuming moment and roof uplift
calculated from the design pressures for each standard are given in Table 4.2. The base
shear obtained from using the four standards ranges from 21.7 to 23.1 kips, while the
overtuming moment ranges from 1527 to 3346 ft-kips. The mean base shear value of
22.25 kips shows that the difference in base shear values obtained from using the four
standards is small. The significant difference in the overtuming moments is due to the
difference in roof zonal classification with respect to the windward edge. For roof uplift
the American and the Canadian standards divide roof surface area into two zones, while
the Australian and the British standards divide roof surface area into four and three zones
62
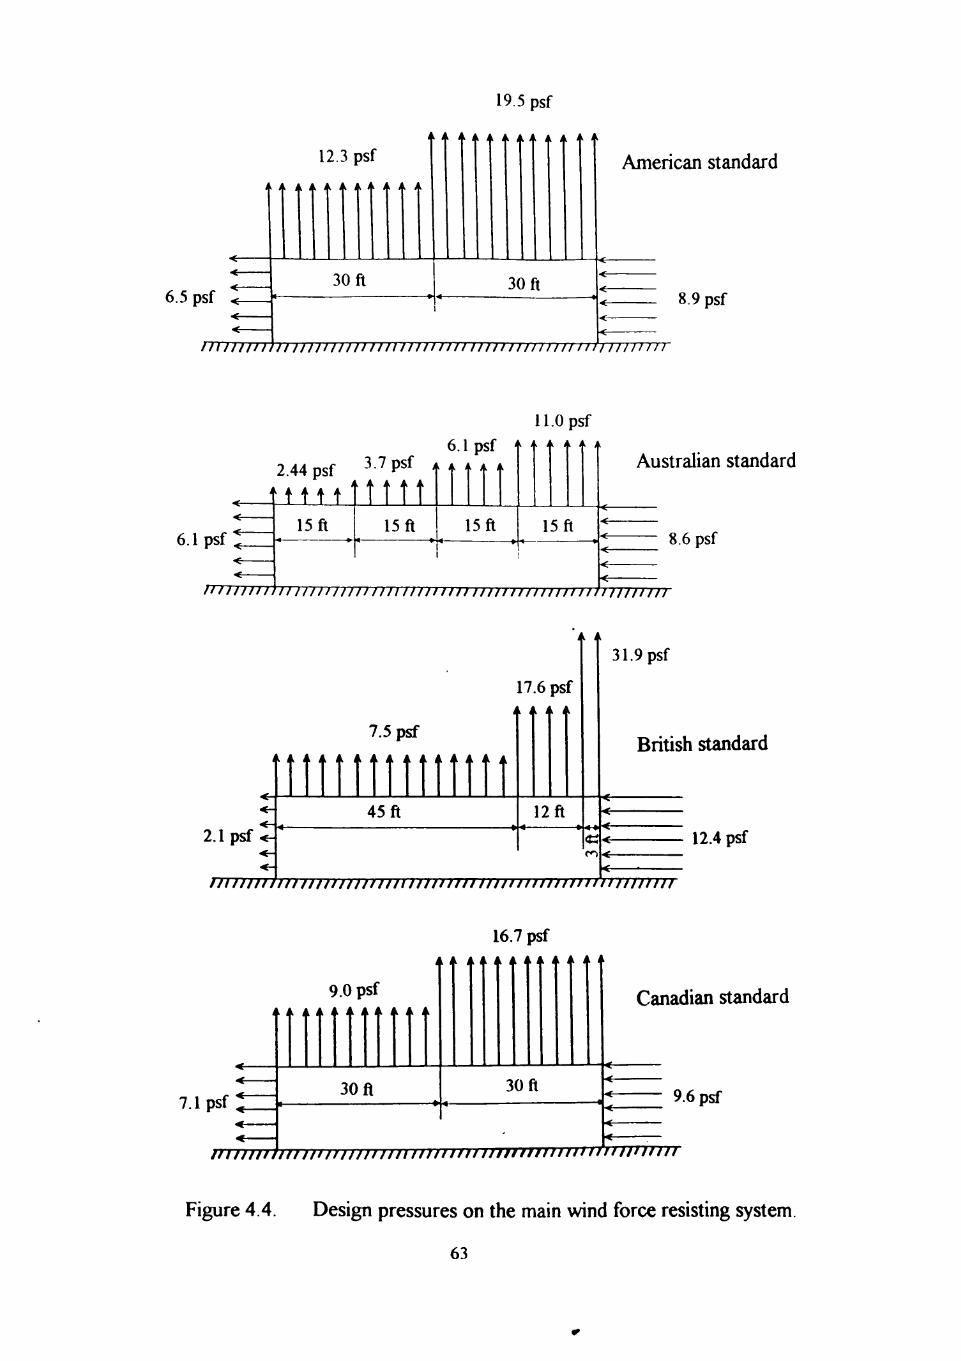
19.5 psf
12.3 psf
i A A A A A A A A i f A
6.5 psf 30 ft
<-
30 ft
American standard
8.9 psf
immniii innnniminiinnnnniinnni nfniiinn
2A4 psf
6.1 psf J
unnin)
15 ft
3.7 psf
llii 6.1 psf
A A A A i i
11.0 psf U i I M A U i i
15 ft 15 ft 15 ft
Australian standard
8.6 psf
n iinmimnuimnn )iinnimmnt)m}iin
i i n
17.6 psf k. k k i\
7.5 psf
45 ft 12ft
31.9 psf
British standard
2.1 psf .
}nmnnmnmnimnnnnnnnnim}nini
12.4 psf
rrrmrrrr
16.7 psf
9.0 psf
7.1 psf J 30 fl 30 ft
Canadian standard
9.6 psf
/nnn/hf/jfurnf/nnnnmniiiinifnininniiintin i/mhi
Figure 4.4. Design pressures on the main wind force resisting system.
63
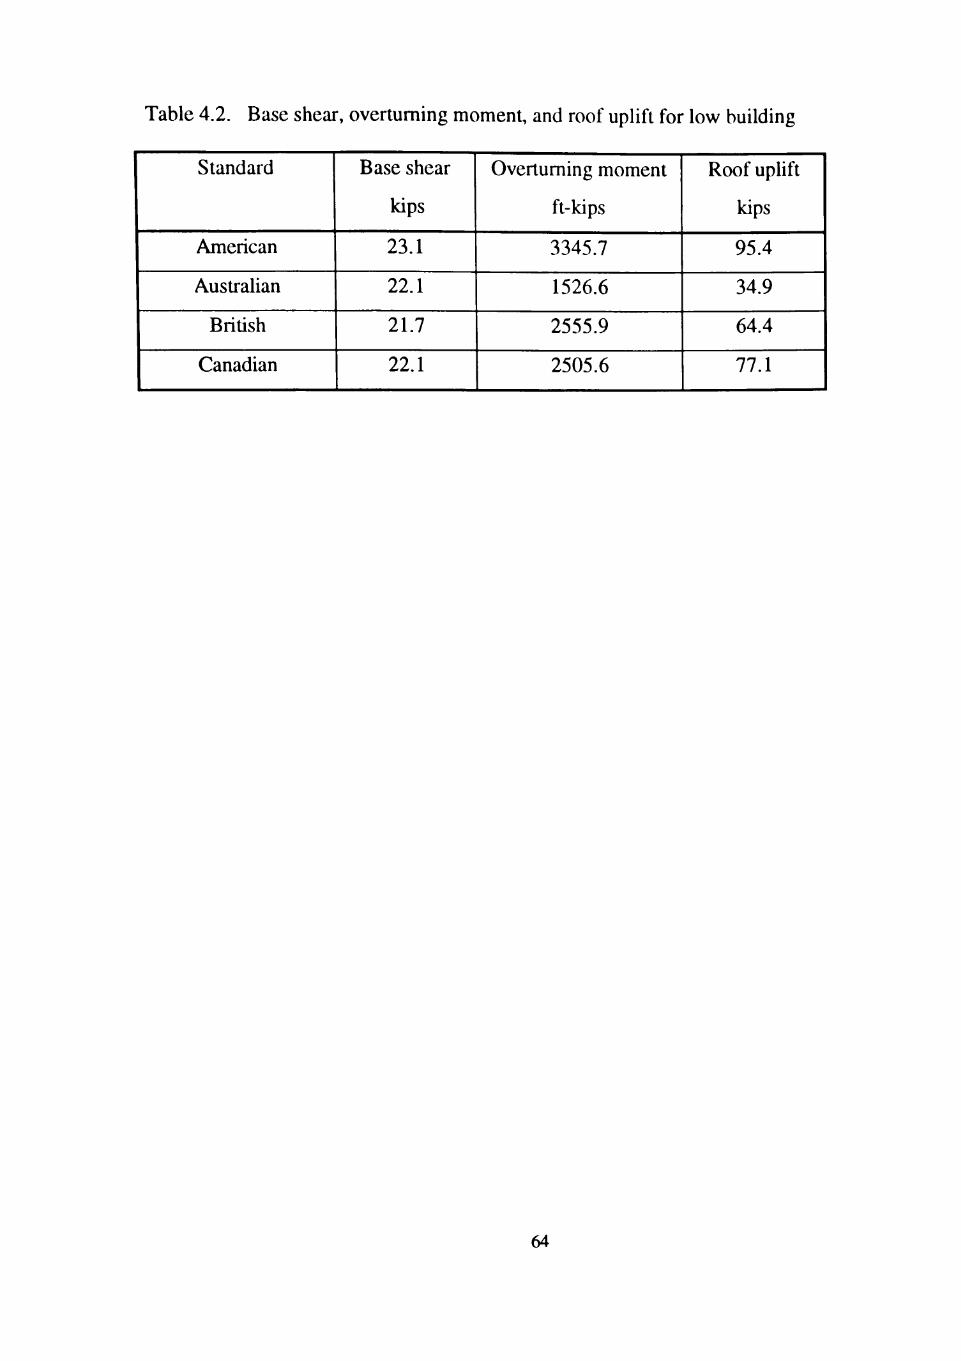
Table 4.2. Base shear, overtuming moment, and roof uplift for low building
Standard
American
Australian
British
Canadian
Base shear
kips
23.1
22.1
21.7
22.1
Overtuming moment
ft-kips
3345.7
1526.6
2555.9
2505.6
Roof uphft
kips
95.4
34.9
64.4
77.1
64
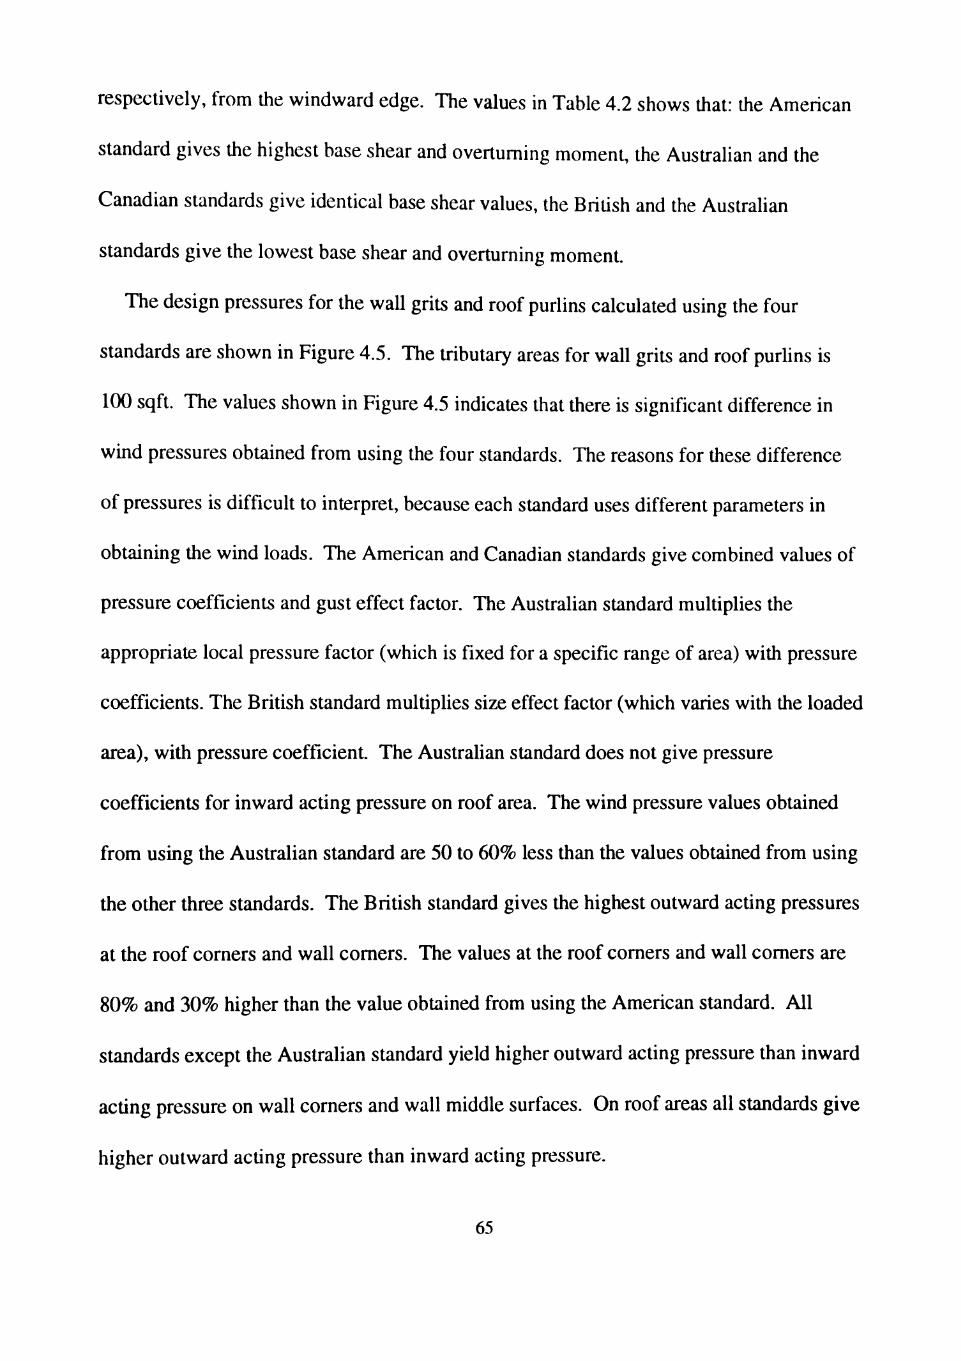
respectively, from the windward edge. The values in Table 4.2 shows that: the American
standard gives the highest base shear and overtuming moment, the AusUalian and the
Canadian standards give identical base shear values, the British and the Austrahan
standards give the lowest base shear and overturning moment.
The design pressures for the wall grits and roof puriins calculated using the four
standards are shown in Figure 4.5. The tributary areas for wall grits and roof purhns is
100 sqft. The values shown in Figure 4.5 indicates that there is significant difference in
wind pressures obtained from using the four standards. The reasons for these difference
of pressures is difficult to interpret, because each standard uses different parameters in
obtaining the wind loads. The American and Canadian standards give combined values of
pressure coefficients and gust effect factor. The Australian standard multiplies the
appropriate local pressure factor (which is fixed for a specific range of area) with pressure
coefficients. The British standard multiphes size effect factor (which varies with the loaded
area), with pressure coefficient. The Austrahan standard does not give pressure
coefficients for inward acting pressure on roof area. The wind pressure values obtained
from using the Australian standard are 50 to 60% less than the values obtained from using
the other three standards. The British standard gives the highest outward acting pressures
at the roof corners and wall comers. The values at the roof comers and wall comers are
80% and 30% higher than the value obtained from using the American standard. All
standards except the Australian standard yield higher outward acting pressure than inward
acting pressure on wall corners and wall middle surfaces. On roof areas all standards give
higher outward acting pressure than inward acting pressure.
65
-ve
1
> +
Stan
dard
28
.6
1 8.
5 A
mer
ican
16
.5
•
Aus
tral
ian
51.7
10
.0
Bri
tish
18
.1
1 8.
8 C
anad
ian
'
-vc
1
> +
Stan
dard
23
.2 1
20
.1
1 A
mer
ican
6.
1 12
.2
1 A
ustr
alia
n 22
.8
1 19
.7
1 B
riti
sh
15.1
1
7.7
Can
adia
n
C/5
< w
8
-ve
1 +v
e St
anda
rd
28.6
1
8.5
Am
eric
an
16.5
1
Aus
tral
ian
37.2
10
.0
1 B
ritis
h 18
.1
1 8.
8 1
Can
adia
n -v
e 1
4>
>
Stan
dard
24
.2
1 8.
5 1
Am
eric
an
vd
1
1 A
ustr
alia
n 20
.4
1 10
.0
1 B
ritis
h 13
.6
8.8
1 C
anad
ian
-ve
1
0) > +
1 St
anda
rd
23.2
1
20.1
1
Am
eric
an
11.9
1
12.2
1
Aus
u-al
ian
34.8
1
19.7
1
Bri
tish
15
.9
1 7.
7 1
Can
adia
n
Vi
O
o ed ii u. en
en •*->
x>
Vi
c 3 CL
o o (_
T3
c en Vi
• • -J
a Vi ii Vi Vi ii l - l
a. G
'vi ii
in
a U i
3
66
Wind pressure on fasteners obtained from using the four standards are shown in Figure
4.6. The tributary area used for fasteners is 5 sqft. The AusUalian standard does not give
positive or inward acting pressure coefficients for complete roof area. All standards give
higher pressures for roof comer areas than any other area on the building. The American
standard gives highest outward acting pressure on roof comers, roof eaves, roof middle
surface and on wall middle surface. The Australian standard gives least wind pressure
values on all parts of the building surface.
4.2 160 ft High Building
The building selected for this part of the case study is a 200 ft x 100 ft x 157 ft, 15-
story typical office building. A 3 ft parapet is provide above the roof making total height
of the building equal to 160 ft. The stmctural system contains reinforced concrete rigid
frames in both directions as shown in Figure 4.7. The floor slabs are assumed to provide
diaphragm action. The mullions dividing the panes of glazing panels span 11 ft between
floor slabs. The center to center distance between mullions is 5 ft. The wall glazing
panels are 5 ft wide x 5.5 high.
Wind load parameters used in wind pressure computations for each standard are shown
in Table 4.3. As discussed earlier, for computing wind pressures using the Australian,
British, and the Canadian standards the basic wind speeds are made consistent with the
American standard. The design wind pressures on the main wind force resisting system
obtained for each standard are shown in Figure 4.8 to Figure 4.11. For all standards,
except the British standard, design wind pressures on windward wall are the same for
67
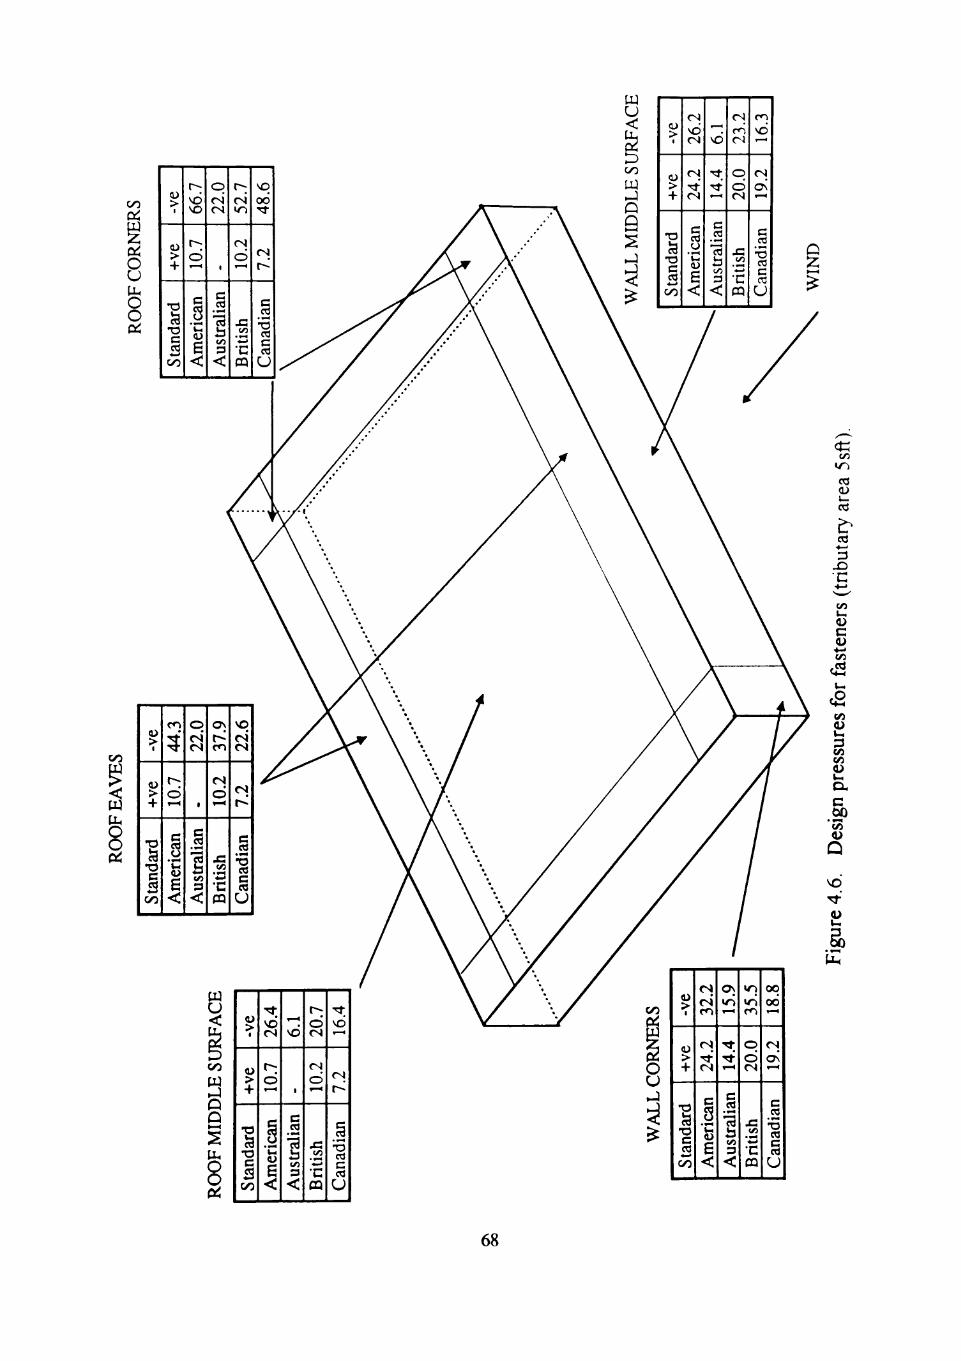
-ve
> +
Stan
dard
66
.7
1 10
.7
Am
eric
an
22.0
1
1
Aus
tral
ian
52.7
1
10.2
B
ritis
h 48
.6
7.2
Can
adia
n
-ve
1
> +
Stan
dard
26
.2
24.2
A
mer
ican
6.
1 14
.4
1 Aus
tral
ian
23.2
1
20.0
1 B
riti
sh
16.3
1
19.2
1
Can
adia
n oo
< W
o O Pi
-ve
1
9A-I-
1 St
anda
rd
44.3
10
.7
1 A
mer
ican
22
.0
1
1
1 A
ustr
alia
n 37
.9
1 10
.2
1 B
ritis
h 22
.6
1 7.
2 1
Can
adia
n -v
e 1
> +
Stan
dard
26
.4
1 10
.7
1 A
mer
ican
1-H
vd
1
1 A
ustr
alia
n 20
.7
1 10
.2
1 B
riti
sh
164
1 7.
2 1
Can
adia
n
-ve
1
> +
1 St
anda
rd
32.2
1
24.2
1
Am
eric
an
15.9
1
14.4
1 A
usu-
alia
n 35
.5
1 20
.0
1 B
riti
sh
18.8
1
19.2
1
Can
adia
n
Vi in en a i— en
cd • * - •
_o C
••-<
Vi u ii C ii
•4-> Vi
C+H
u a Vi ii u, Vi Vi
ii ex C
.SP '(A ii Q vo '^' ii U i
68
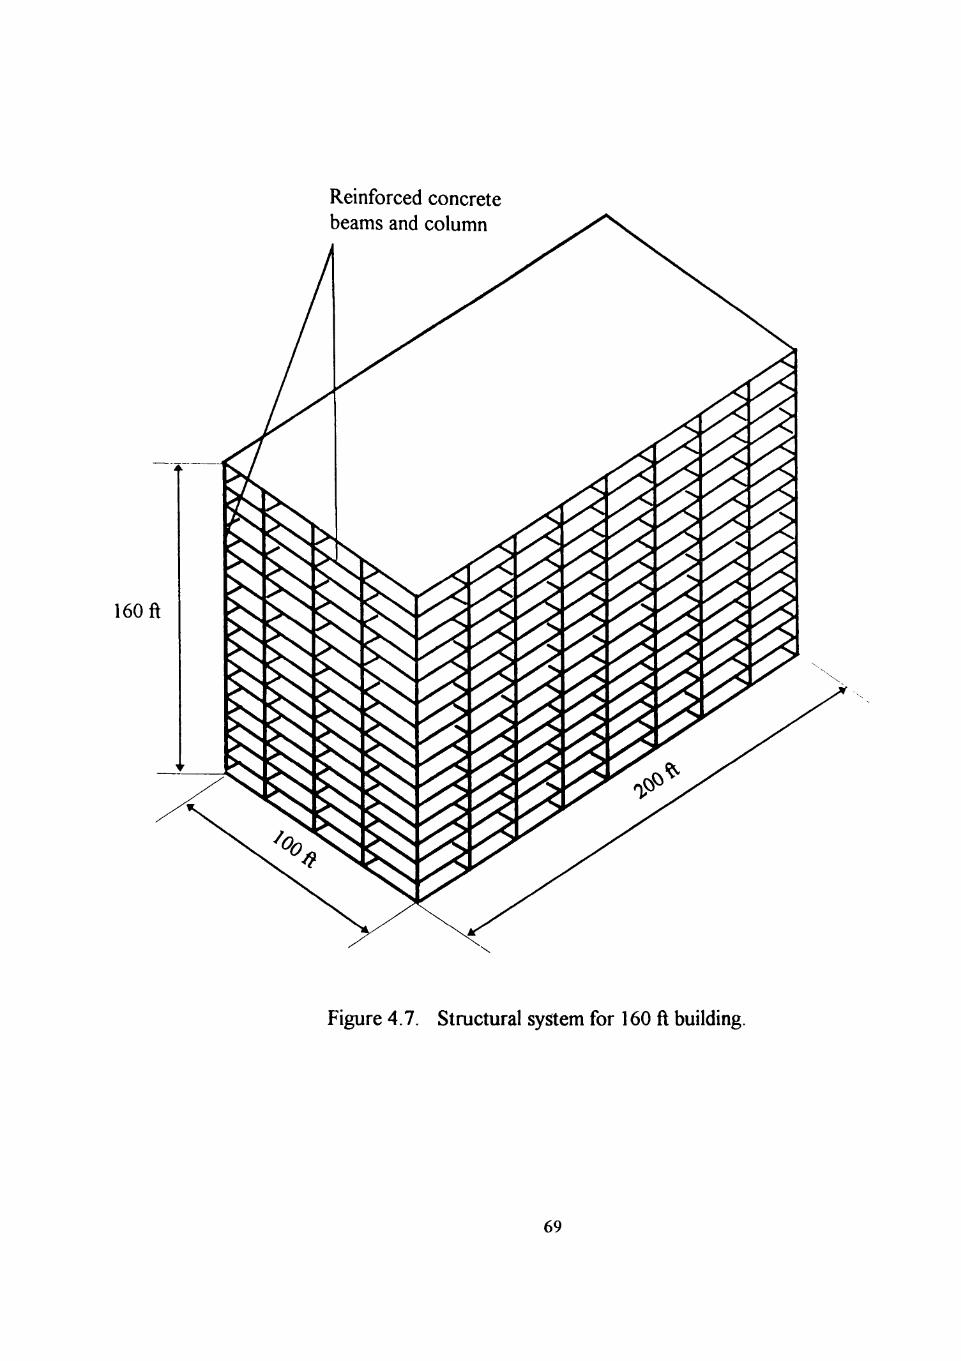
Reinforced concrete beams and column
160 ft
Figure 4.7. Stmctural system for 160 ft building.
69
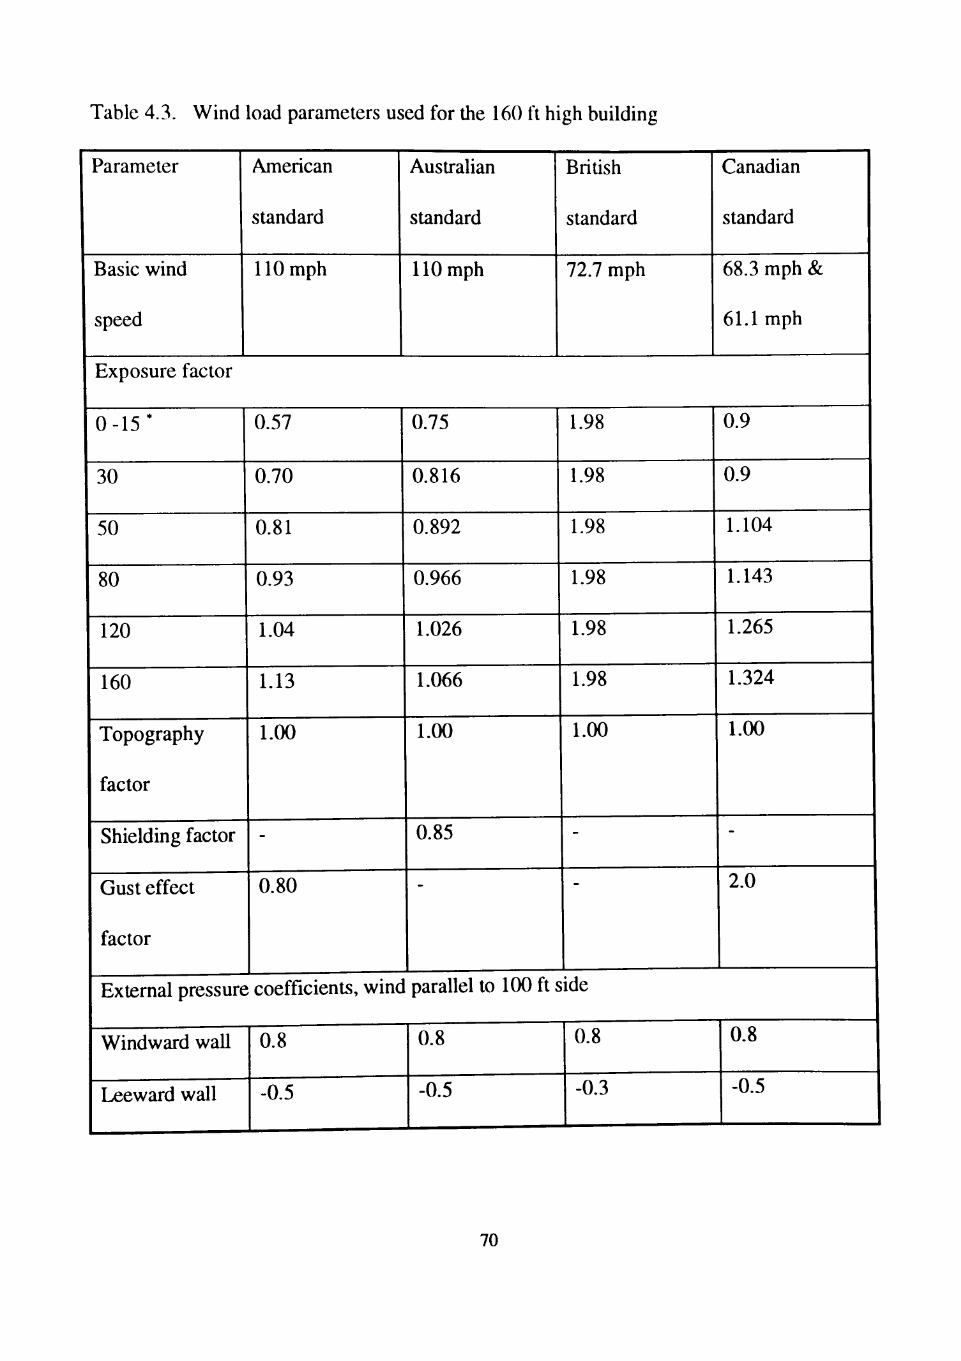
Table 4.3. Wind load parameters used for the 160 ft high building
Parameter
Basic wind
speed
American
standard
110 mph
Australian
standard
110 mph
British
standard
72.7 mph
Canadian
standard
68.3 mph &
61.1 mph
Exposure factor
0-15*
30
50
80
120
160
Topography
factor
Shielding factor
Gust effect
factor
0.57
0.70
0.81
0.93
1.04
1.13
1.00
-
0.80
0.75
0.816
0.892
0.966
1.026
1.066
1.00
0.85
1.98
1.98
1.98
1.98
1.98
1.98
1.00
-
0.9
0.9
1.104
1.143
1.265
1.324
1.00
-
2.0
External pressure coefficients, wind parallel to 100 ft side
Windward wall
Leeward wall
0.8
-0.5
0.8
-0.5
0.8
-0.3
0.8
-0.5
70
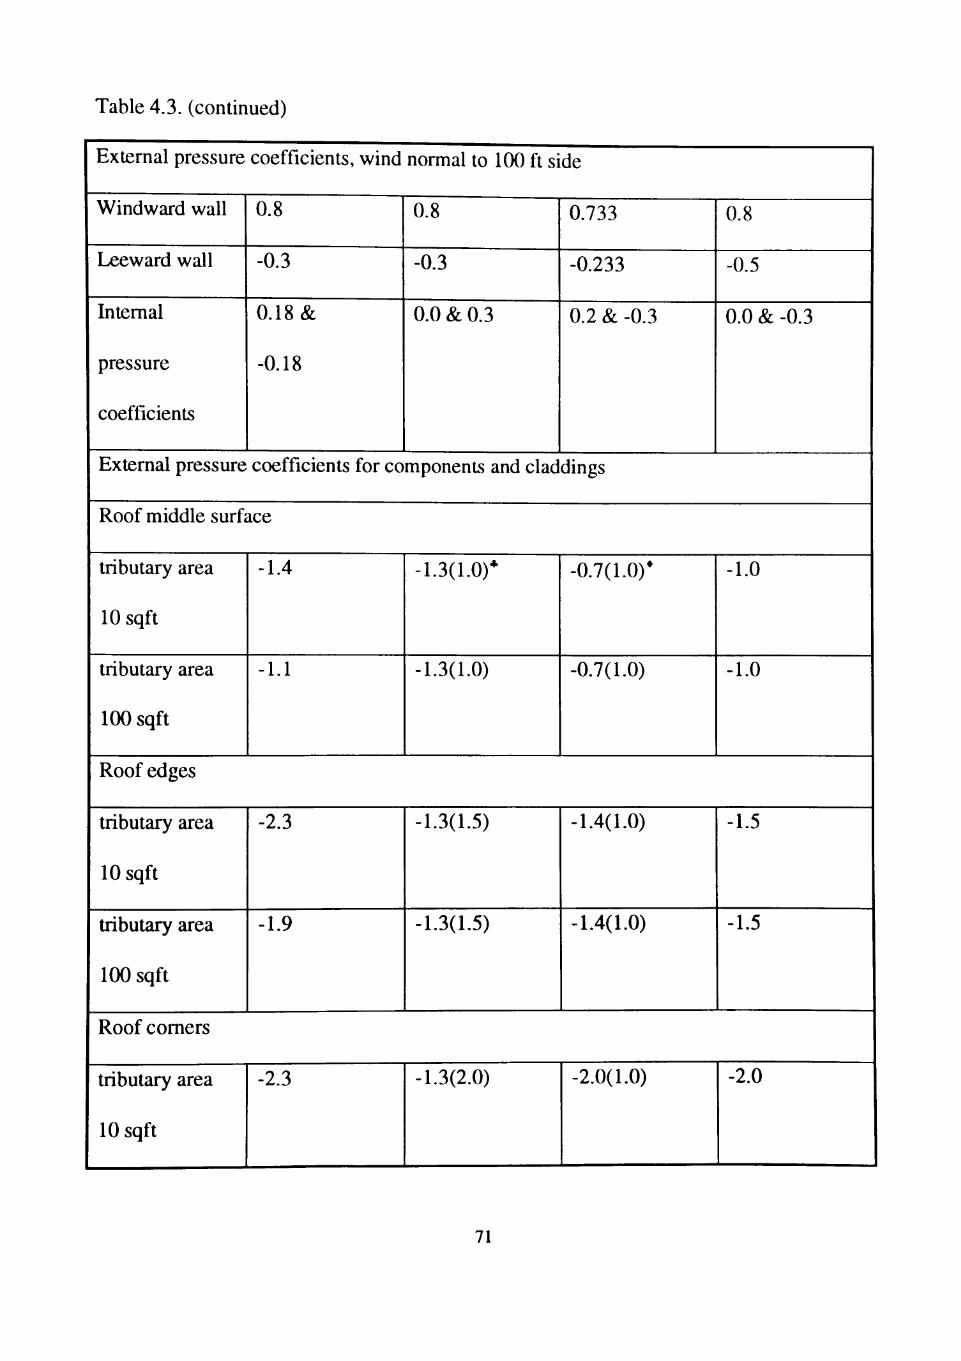
Table 4.3. (continued)
External pressure coefficients, wind normal to 100 ft side
Windward wall
Leeward wall
Intemal
pressure
coefficients
0.8
-0.3
0.18 &
-0.18
0.8
-0.3
0.0 & 0.3
0.733
-0.233
0.2 & -0.3
0.8
-0.5
0.0 & -0.3
Extemal pressure coefficients for components and claddings
Roof middle surface
tributary area
10 sqft
tributary area
100 sqft
-1.4
-1.1
-1.3(1.0)*
-1.3(1.0)
-0.7(1.0)*
-0.7(1.0)
-1.0
-1.0
Roof edges
tributary area
10 sqft
tributary area
100 sqft
-2.3
-1.9
-1.3(1.5)
-1.3(1.5)
-1.4(1.0)
-1.4(1.0)
-1.5
-1.5
Roof comers
tributary area
10 sqft
-2.3 -1.3(2.0) -2.0(1.0) -2.0
71
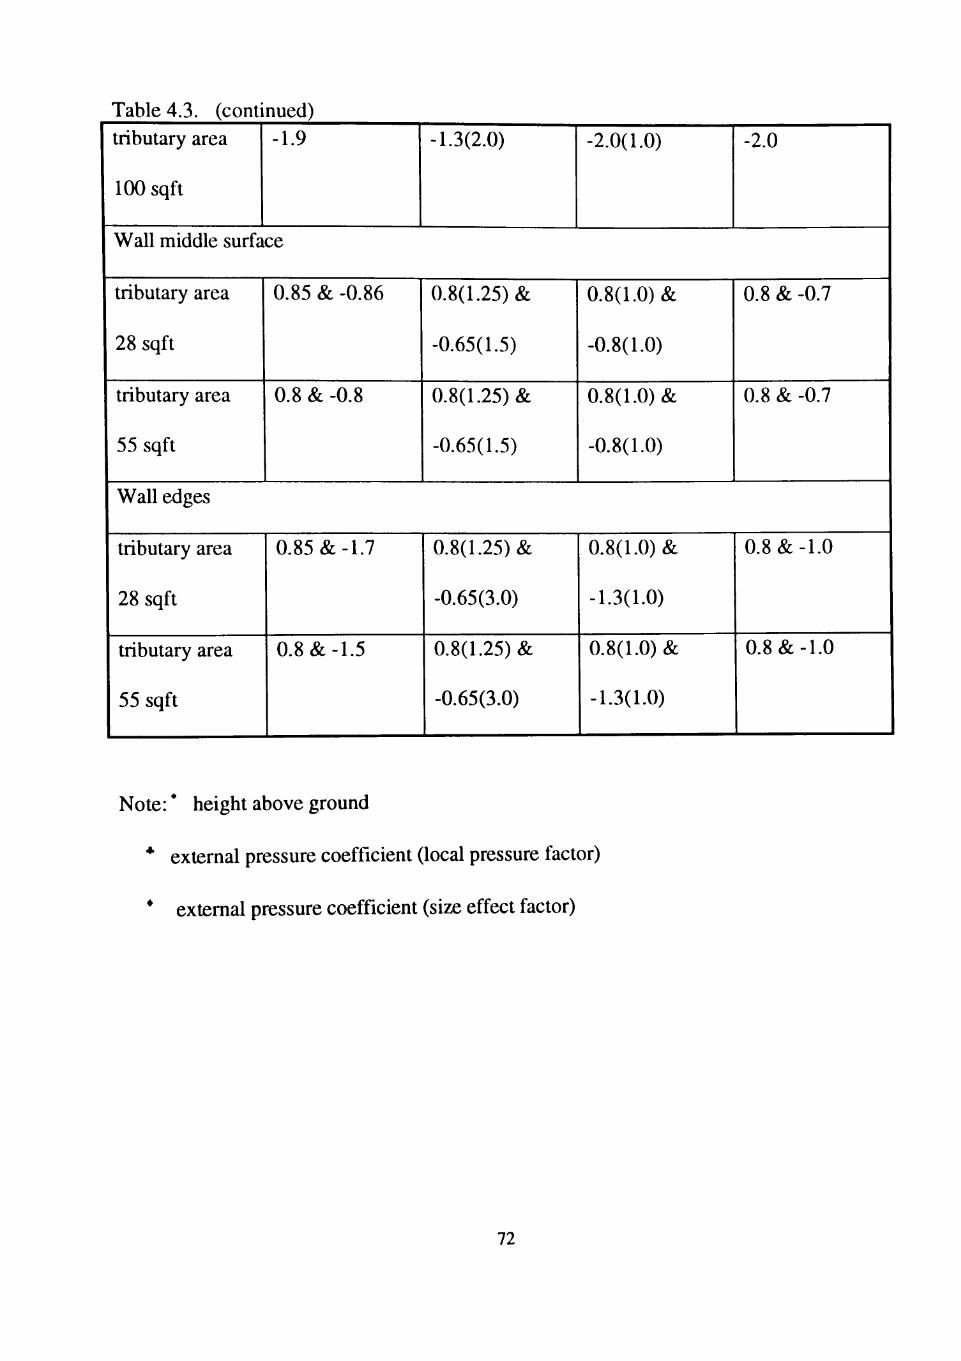
Table 4.3. (continued) tributary area
100 sqft
-1.9 -1.3(2.0) -2.0(1.0) -2.0
Wall middle surface
tributary area
28 sqft
tributary area
55 sqft
0.85 & -0.86
0.8 & -0.8
0.8(1.25) &
-0.65(1.5)
0.8(1.25) &
-0.65(1.5)
0.8(1.0) &
-0.8(1.0)
0.8(1.0) &
-0.8(1.0)
0.8 & -0.7
0.8 & -0.7
Wall edges
tributary area
28 sqft
tributary area
55 sqft
0.85 &-1.7
0.8 &-1.5
0.8(1.25) &
-0.65(3.0)
0.8(1.25) &
-0.65(3.0)
0.8(1.0) &
-1.3(1.0)
0.8(1.0) &
-1.3(1.0)
0.8 &-1.0
0.8 &-1.0
Note: * height above ground
* external pressure coefficient (local pressure factor)
* extemal pressure coefficient (size effect factor)
72
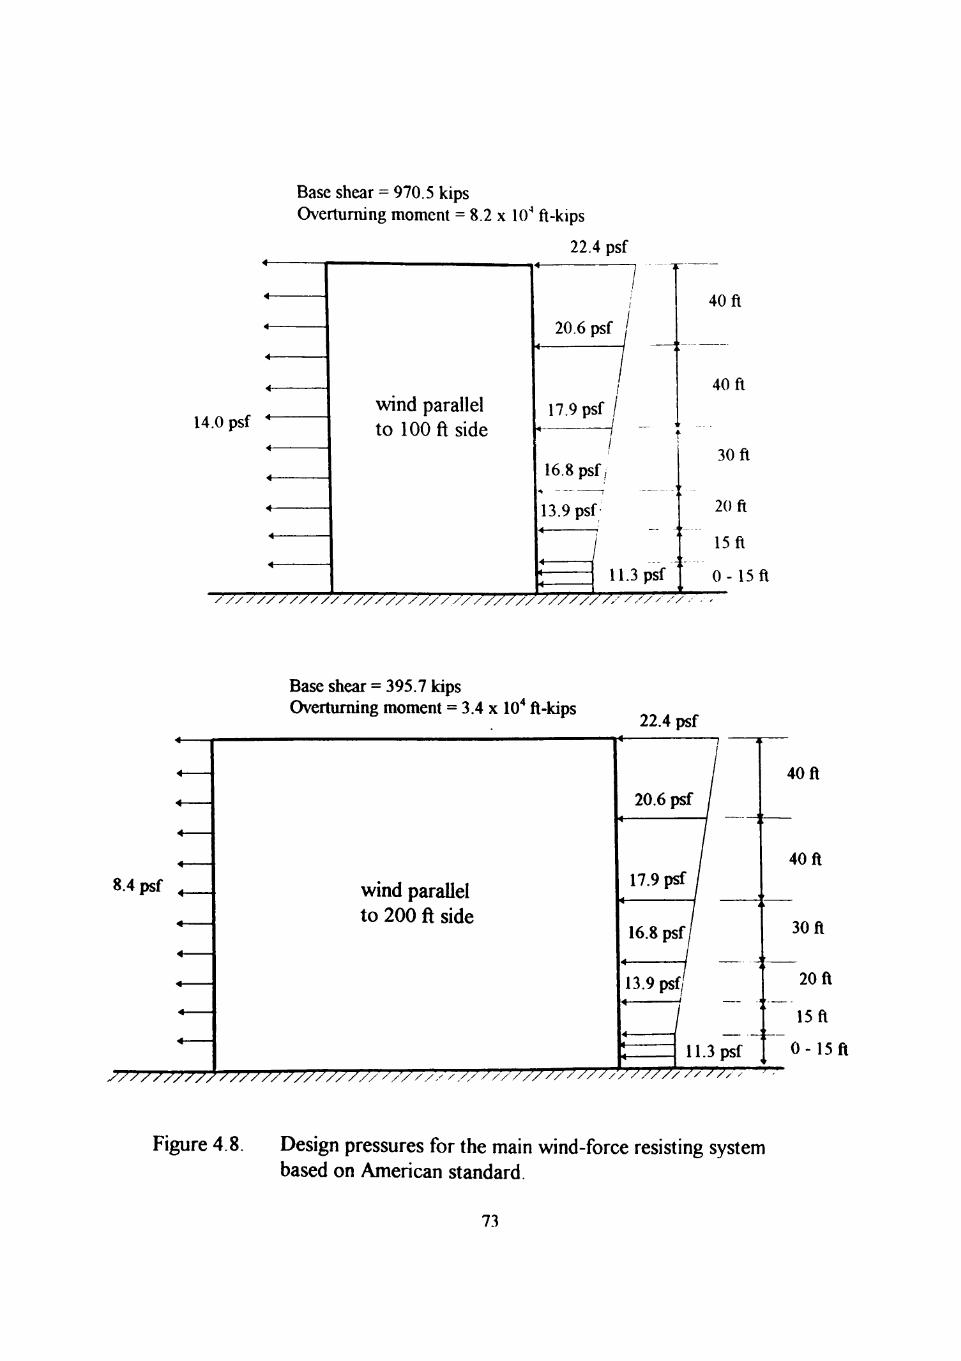
Base shear = 970.5 kips Overtuming moment = 8.2 x 10 ft-kips
14.0 psf wind parallel to 100 ft side
22.4 psf
20.6 psf
17.9 psf /
40 ft
/
16.8 psf;
13.9 psf
11.3 psf
40 ft
30 ft
20 ft
15ft
0- 15ft
/////////////////////////. - 0 - ' / / / / • / / ••'
8.4 psf
Base shear = 395.7 kips Overtuming moment = 3.4 x lO" ft-kips
wind parallel to 200 ft side
22.4 psf
20.6 psf
17.9 psf
16.8 psf i
40 ft
40 ft
13.9 psf
30 ft
20 ft
15 ft
yyx^yyyyx'y/^/^^.^yy/^/yyyyyy/x^y/x/,^xyyy/yyyy^y/-yy///V/^yy>^^^ 11.3 psf I 0-15 ft / / // ^
Figure 4.8. Design pressures for the main wind-force resisting system based on American standard.
73
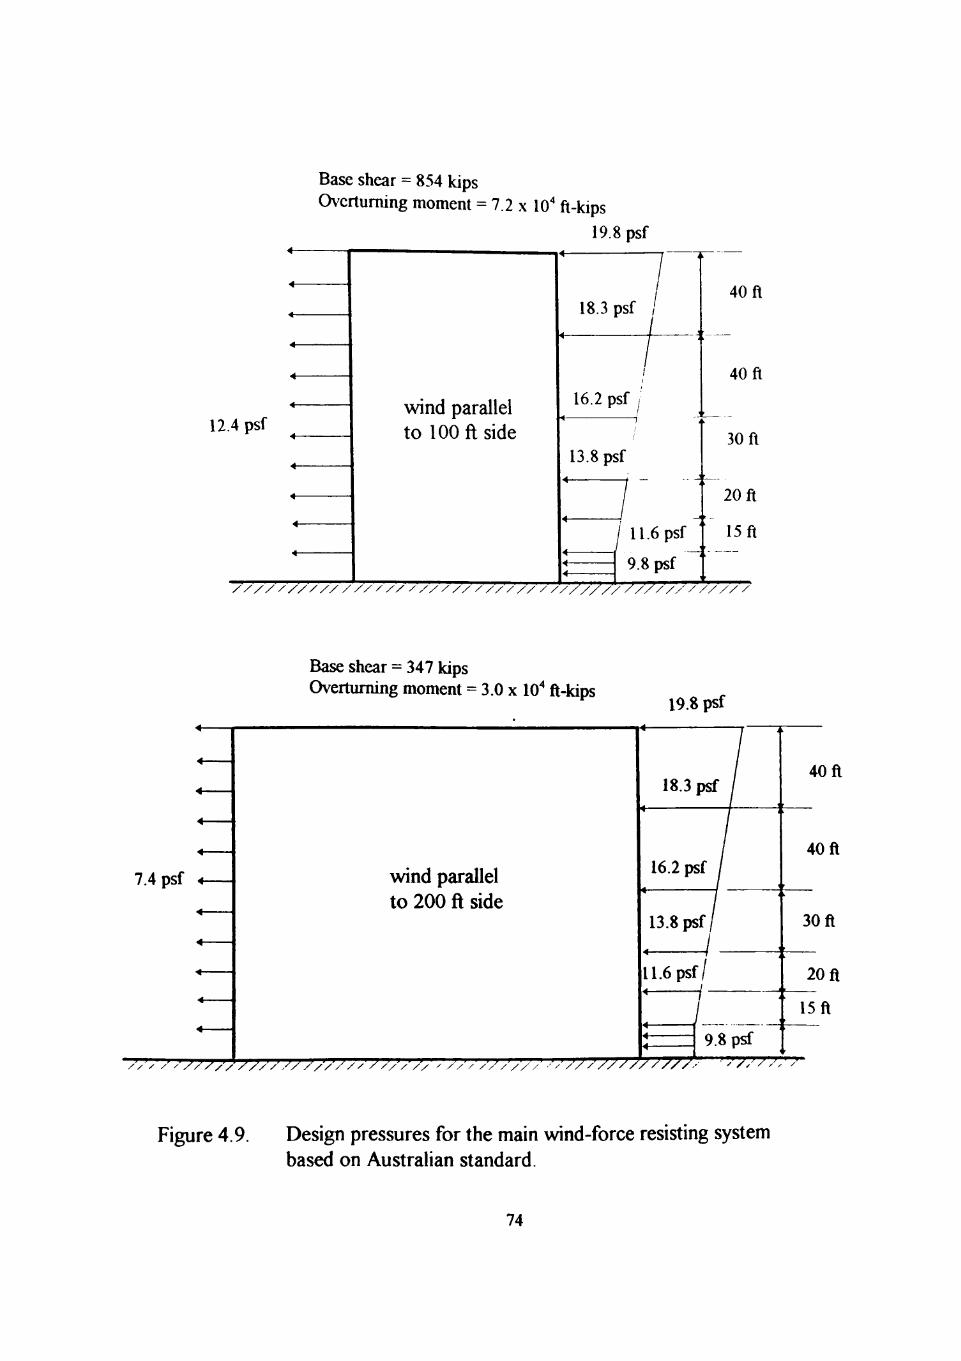
Base shear = 854 kips Overturning moment = 7.2 x 10" ft-kips
19.8 psf
12.4 psf
///////////
wind parallel to 100 ft side
/ / / / / / / / y " / / / / / / / / / /
A 1 18.3 psf /
/ .
/ •
/
16.2 psf ,
13.8 psf ^ J
4. 1 j 11.6 psf '
9.8 psf " 1
k
40 ft
k
40 ft
I
30 ft
20 ft
15 ft L
' ////// //// // //////
Base shear = 347 kips Overtuming moment = 3.0 x IO"* ft-kips
7.4 psf wind parallel to 200 ft side
19.8 psf
18.3 psf
16.2 psf
13.8 psf,
11.6 psf/
40 ft
40 ft
30 ft
20 ft
15 ft
yy. / -Vyyy/V/VVy/xVVVx^ r yVVV ^yxVVV/V/v •/////////////.
9.8 psf rTTTTTT-
Figure 4.9. Design pressures for the main wind-force resisting system based on Australian standard.
74
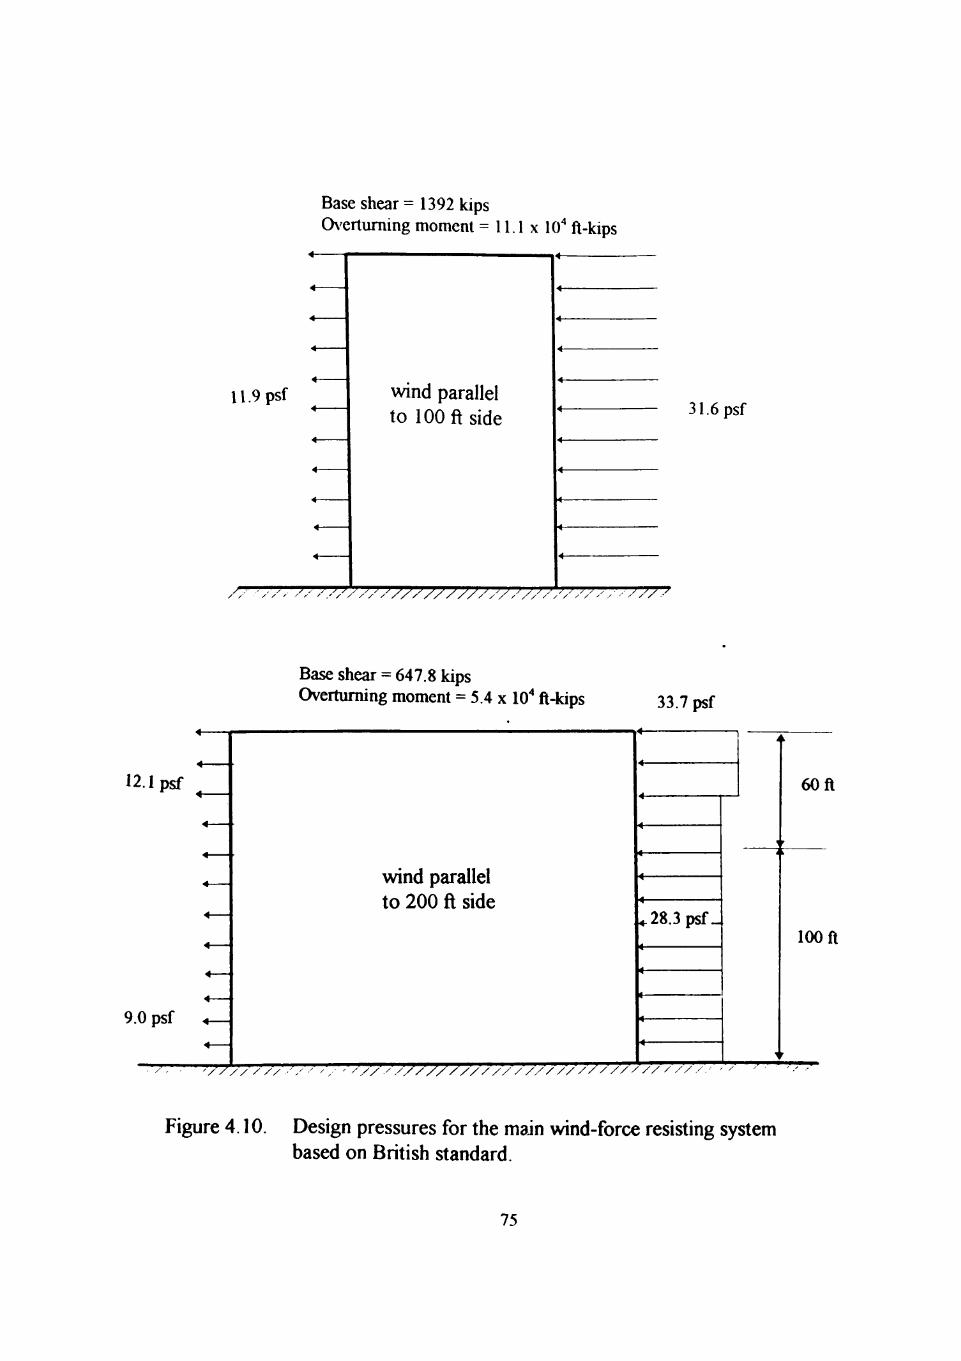
Base shear = 1392 kips 0\'ertuming moment - 11.1 x lO" ft-kips
11.9 psf wind parallel to 100 ft side
.rr-rrrrTT'rrrT'T-rrrrTTy / / y / ' / / / / /
31.6 psf
-TTTTTTTTTTTTTTTTTTTTTTTTT?
12.1 psf
9.0 psf
Base shear = 647.8 kips Overtuming moment = 5.4 x 10'' ft-kips
wind parallel to 200 ft side
33.7 psf
28.3 psf.
/////// t
/ / y / / / / / / / / / / / / / / / / / / / / / / / / / / / / ,
60ft
100 ft
/ r ' /
Figure 4.10. Design pressures for the main wind-force resisting system based on British standard.
75
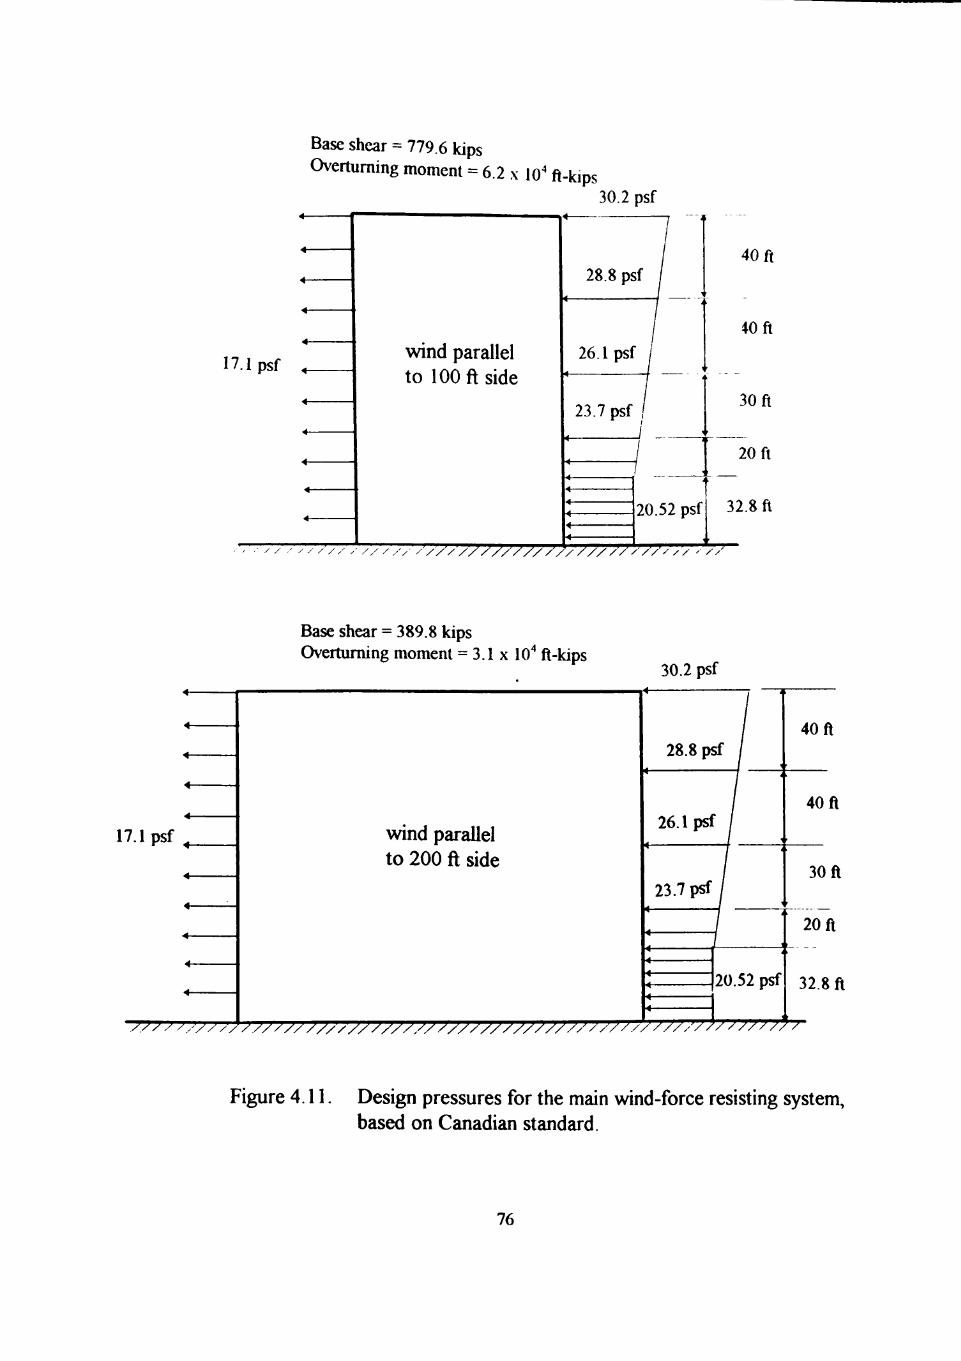
Base shear = 779.6 kips Overtuming moment = 6.2 x 10' ft-kips
30.2 psf
17.1 psf wind parallel to 100 ft side
28.8 psf
26.1 psf
23.7 psf
20.52 psf
/ / • ' / / / '// y // / // / / / / / / / / / / / / / / / / / / / / ' / / / y / x
40 ft
40 ft
30 ft
20 ft
32.8 ft
//
Base shear = 389.8 kips Overtuming moment = 3.1 x IO"* ft-kips
30.2 psf
7.1 psf ^
/.// / //Vy^ //
wind parallel to 200 ft side
/'.^yvyyyy/'/y/'/'/V/yyyy/y/V/'/vy/'/yy^yyy/
^ 7 ,
28.8 psf / / '
26.1 psf /
23.7 psf / /
//>////^/
20.52 psf
/'/'/'/'/'/'J
k
40 ft
• .
40 ft
'
30 ft
'
20 ft • -.
32.8 ft
^7"
Figure 4.11. Design pressures for the main wind-force resisting system, based on Csmadian standard.
76
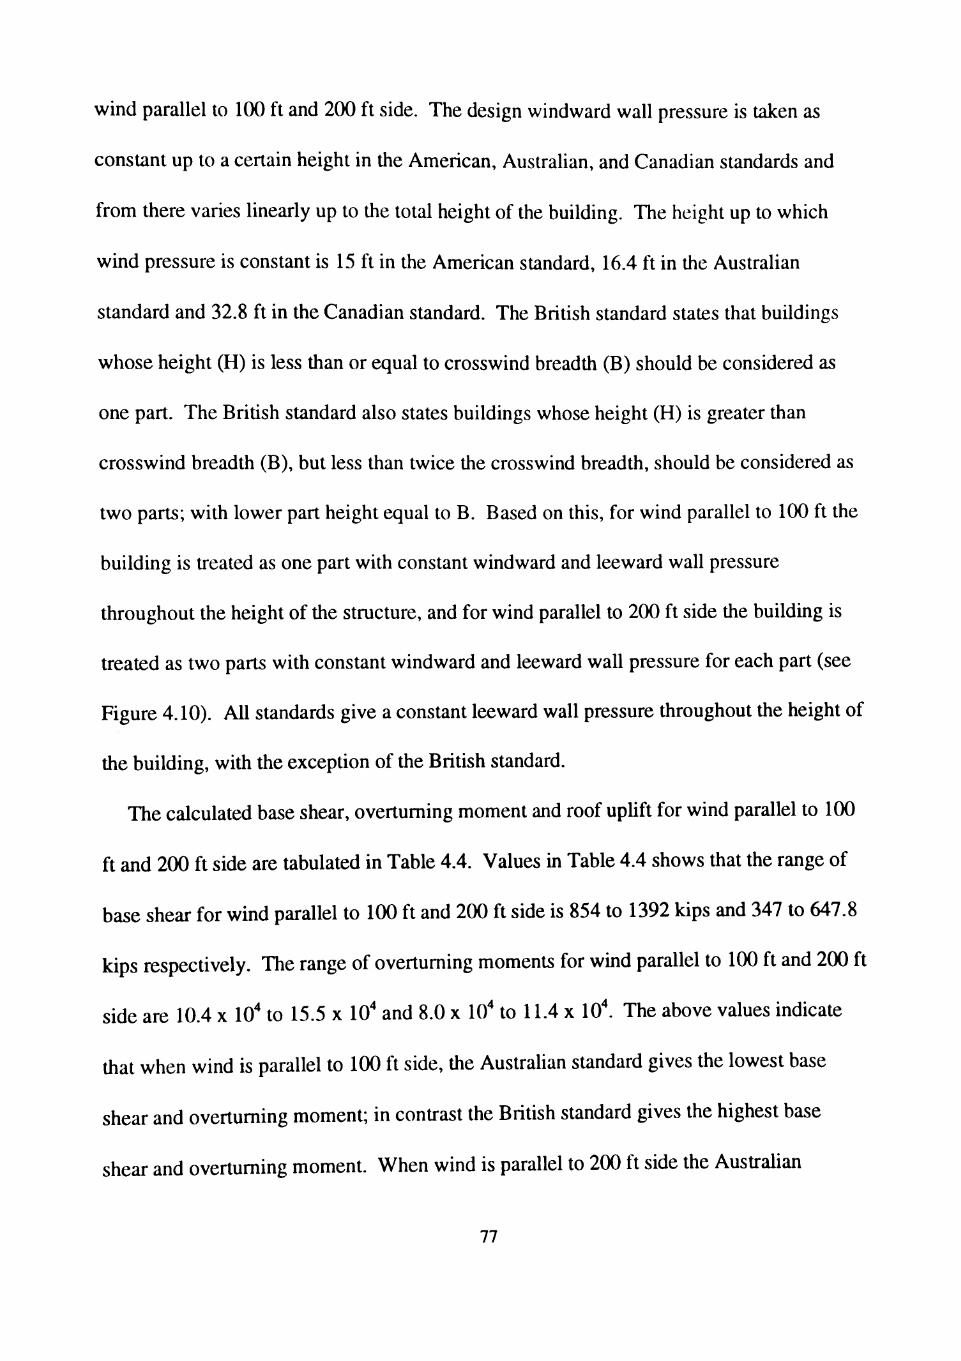
wind parallel to 100 ft and 200 ft side. The design windward wall pressure is taken as
constant up to a certain height in the American, Australian, and Canadian standards and
from there varies linearly up to the total height of the building. The height up to which
wind pressure is constant is 15 ft in the American standard, 16.4 ft in the Australian
standard and 32.8 ft in the Canadian standard. The British standard states that buildings
whose height (H) is less than or equal to crosswind breadth (B) should be considered as
one part. The British standard also states buildings whose height (H) is greater than
crosswind breadth (B), but less than twice the crosswind breadth, should be considered as
two parts; with lower part height equal to B. Based on this, for wind parallel to 100 ft the
building is treated as one part with constant windward and leeward wall pressure
throughout the height of the stmcture, and for wind parallel to 200 ft side the building is
treated as two parts with constant windward and leeward wall pressure for each part (see
Figure 4.10). All standards give a constant leeward wall pressure throughout the height of
the building, with the exception of the British standard.
The calculated base shear, overtuming moment and roof uphft for wind parallel to 100
ft and 200 ft side are tabulated in Table 4.4. Values in Table 4.4 shows that the range of
base shear for wind parallel to 100 ft and 200 ft side is 854 to 1392 kips and 347 to 647.8
kips respectively. The range of overtuming moments for wind parallel to 100 ft and 200 ft
side are 10.4 x 10"* to 15.5 x IO"* and 8.0 x 10* to 11.4 x 10^ The above values indicate
that when wind is parallel to 100 ft side, the Australian standard gives the lowest base
shear and overtuming moment; in conUast the British standard gives the highest base
shear and overtuming moment. When wind is parallel to 200 ft side the AusU-alian
77
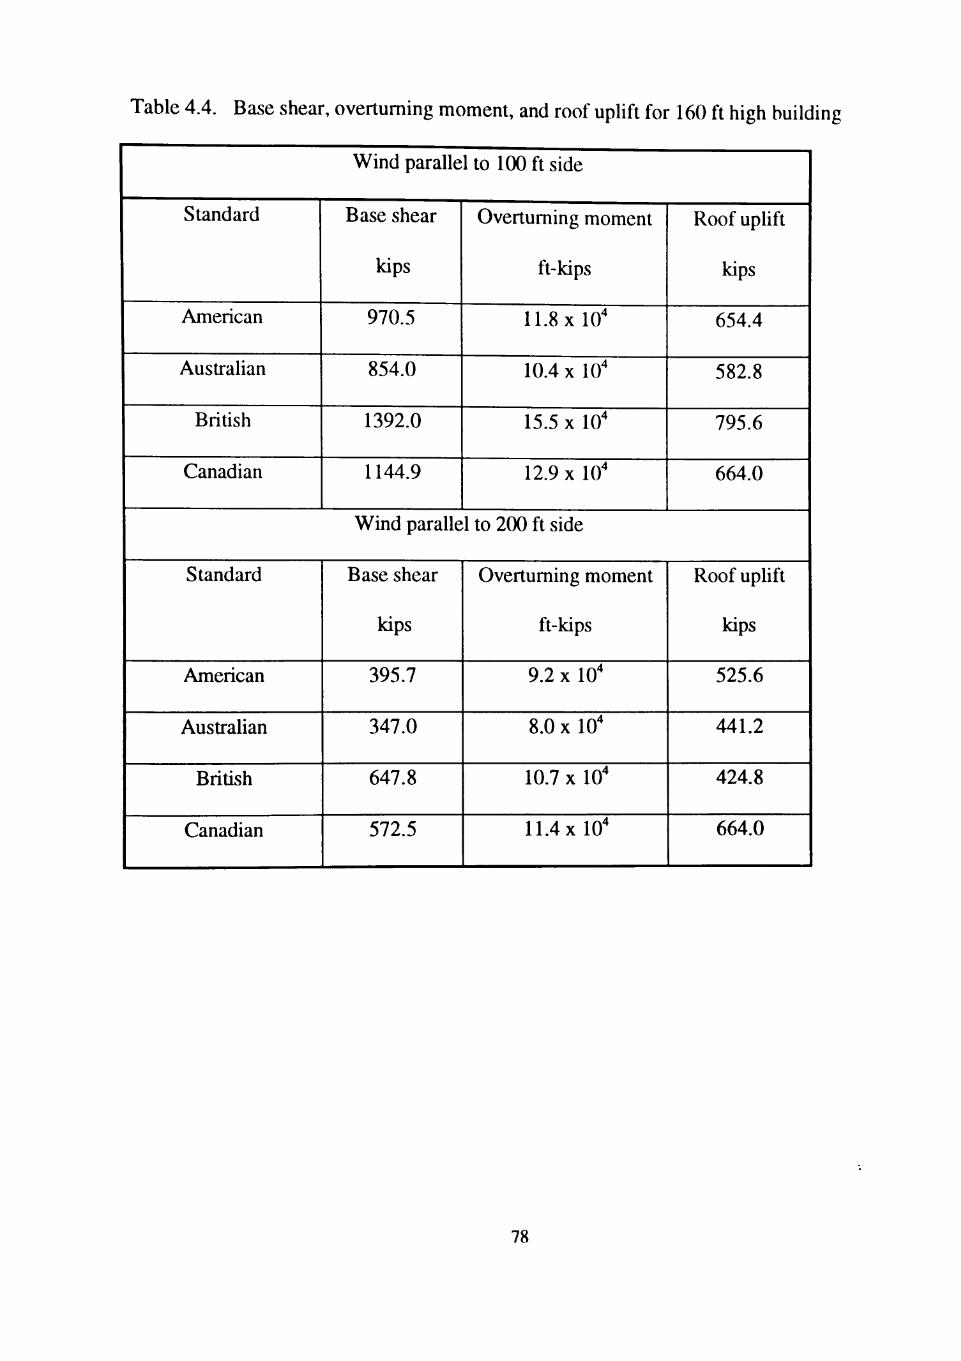
Table 4.4. Base shear, overtuming moment, and roof uplift for 160 ft high building
Wind parallel to 100 ft side
Standard
American
Australian
British
Canadian
Base shear
kips
970.5
854.0
1392.0
1144.9
Overtuming moment
ft-kips
11.8 X 10
10.4 X 10'
15.5 X 10'
12.9 X 10'
Roof uphft
kips
654.4
582.8
795.6
664.0
Wmd parallel to 200 ft side
Standard
American
Australian
British
Canadian
Base shear
kips
395.7
347.0
647.8
572.5
Overtuming moment
ft-kips
9.2 X 10'
8.0 X 10'
10.7 X 10'
11.4x10'
Roof uplift
kips
525.6
441.2
424.8
664.0
78
standard gives the lowest base shear, while the Canadian standard gives the highest
overturning moment.
Design pressures for components obtained from using four standards are shown in
Figure 4.12. The tributary areas for roof and wall areas are 10 sqft and 28 sqft
respectively. The 28 sqft tributary area pertains to the mullions separating the panes of the
glazing panels. The values shown in Figure 4.12 indicates that there is significant
difference in wind pressure obtained from using the four standards. As discussed earher,
the significant differences in the wind pressures obtained from using the four standards is
difficult to interpret. American standard gives the combined values of pressure
coefficients and gust effect factor based on the tributary area and component location.
Australian standard gives local effect factors for a fixed range of areas for different
locations of the component on the building. For 160 ft buildings, Canadian standard gives
outward acting local pressure coefficients C* for walls and roof areas. For inward acting
pressures, the pressure coefficients used for the main wind-force resisting system are
multiplied by a gust effect factor of 2.5. In the British standard the pressure coefficients
used for the main wind-force resisting system are multiplied by the size effect factor of the
loaded area. In the wind pressure calculations for the components and claddings the
loaded area is taken as the tributary area and the size effect factor is obtained based on the
diagonal dimension of this tributary area. Canadian standard does not differentiate
between the wall middle and wall edge areas. This is the reason for the design pressures
being same for wall middle surface and for wall edges. With the exception of the
Australian standard, all other standards account for the 3 ft parapet provided above the
79
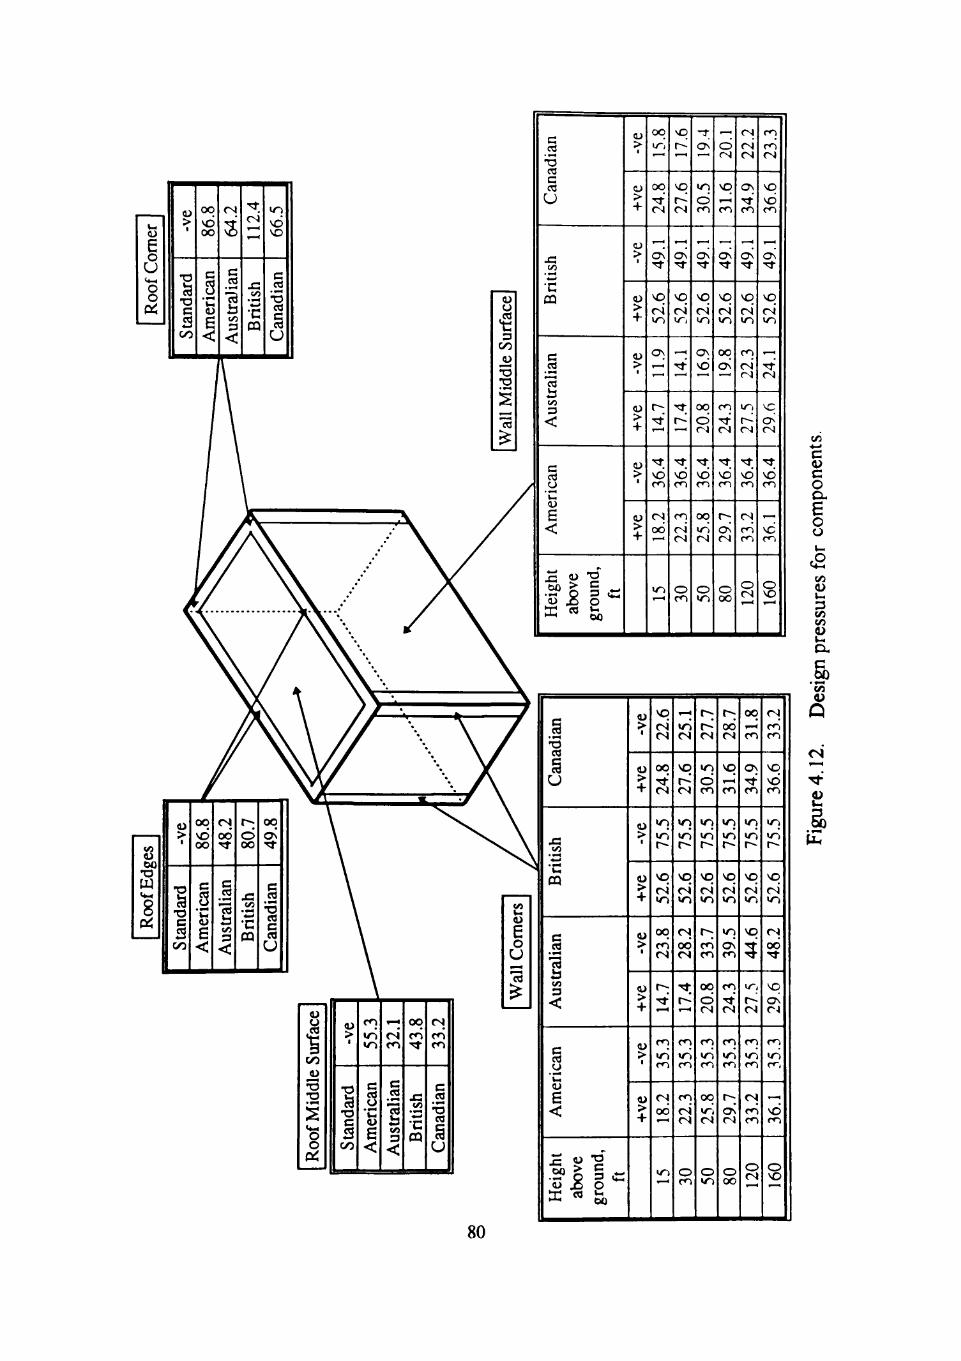
Roo
f C
omer
-ve
1 St
anda
rd
86.8
1
Am
eric
an
64.2
I
c ed
b Vi 3
<
112.
4 1
Bri
tish
66.5
1
Can
adia
n
Roo
f E
dges
-ve
1 1
Stan
dard
86
.8
1 1
Am
eric
an
48.2
1
1 A
ustr
alia
n 80
.7
1 1
Bri
tish
49.8
1
1 C
anad
ian
Can
adia
n B
ritis
h A
ustr
alia
n A
mer
ican
H
eigh
t ab
ove
grou
nd,
ft -v
e
>
-ve
>
+
-ve
> +
-ve
>
+
15.8
1
24.8
ON
52.6
11
.9
14.7
36
.4
18.2
in
17.6
27
.6
as
52.6
14
.1
17.4
36
.4
22.3
o CO
19.4
30
.5
ON rl-
52.6
16
.9
20.8
vd CO
25.8
o uo
20.1
31
.6
as rt
52.6
19
.8
24.3
36
.4
29.7
o 00
22.2
34
.9
as
52.6
22
.3
27.5
36
.4
33.2
1
120
23.3
1
36.6
ON
52.6
24
.1
29.6
,
36.4
36
.1
1 16
0
D
^ ^ OO
iddl
O
fM
o
0)
>
T3
tand
C/3
5.3
•n
can
mer
i
<
2.1
CO
lian
Listr
a
<
3.8
• ^
J3
4H
c CQ
11
CO
UB
I
anad
U
Can
adia
n B
ritis
h A
ustr
alia
n A
mer
ican
H
eigh
t ab
ove
grou
nd,
ft -v
e
9A-I-
-ve
> +
-ve
9A-I-
-ve
9A+
22.6
24
.8
75.5
52
.6
23.8
14
.7
35.3
18
.2
m
25.1
27
.6
75.5
52
.6
28.2
17
.4
35.3
22
.3
o CO
27.7
1
30.5
75
.5
52.6
33
.7
20.8
35
.3
25.8
o «n
28.7
31
.6
75.5
52
.6
39.5
24
.3
35.3
29
.7
o oo
31.8
34
.9
75.5
52
.6
44.6
27
.5
35.3
33
.2
1 12
0 33
.2 |
| 36
.6
75.5
52
.6
48.2
29
.6
35.3
36
.1
I 16
0
Vi •*->
C ii c o
B o o
a Vi ii
Vi Vi ii
Vi ii
80
roof line of the building. American standard treats the roof comer areas as roof edge
areas because of the parapet. The Canadian standard reduced the local pressure
coefficient for roof comers of -2.3 for roofs with out parapet to -2.0 for roofs with
parapets greater than Im. British standard reduces the pressure coefficients for complete
roof area depending on the h/b ratio; where h is the height of the parapet and b is the
scaling length equal to crosswind breadth B or twice the height of the stmcture H,
whichever is smaller. The values in Figure 4.12 shows that the American standard gives
higher design pressures on roof middle surface and on roof edges, while the Australian
standard gives the lowest design pressures on these roof areas. The British standard yields
the highest wind pressure value for roof comer areas. All standards give higher outward
acting pressure on roof corners than any other area of the building surface. The design
pressures on roof areas are comparable for the Australian and Canadian standards.
The design pressures on walls varies linearly with the height of building. The American
standard gives a constant value of outward acting pressure, since the velocity pressure qz
(which varies with height) is replaced by velocity pressure qh (corresponding to the total
height of the stmcture). At the total height (160 ft) of the sUiicture the British standard
gives highest wind pressures on wall middle and wall edge areas. On wall middle and wall
edges; the Australian standard gives the lowest inward acting pressures, while the
Canadian standard gives the lowest outward acting pressures. On wall middle surfaces the
Australian, the British and the Canadian standards give higher inward acting pressure,
while the American standard gives higher outward acting pressure. On wall edges all
81
standards, except the Canadian standard, give higher outward acting pressure than inward
acting pressure.
The design pressures for claddings calculated using the four standards are shown in
Figure 4.13. The tributary area for claddings on the wall and the roof are 55 sqft and 100
sqft respectively. The values in Figure 4.13 shows that the American standard gives
higher wind pressure value on roof middle surface and on roof edge areas, while the
British standard gives higher value on the roof corner. Australian standard gives least
design pressures on all areas of the building. All standards give higher wind pressure on
the roof comer areas than on any other area of the building. The British standard gives
higher wind pressure than any other standard for the wall middle surface and wall comers
at the total height of the building. The wind pressures obtained using the Canadian
standard for wall middle and for wall comer areas are the same, since the Canadian
standard specifies that the local pressure C* = -1.0 can occur any where at any height on
the building and is not hmited to comer areas. The inward acting pressures on the wall
middle surface and on the wall comers obtained from using the American standard are
about 50% less and about 20% greater than the pressure obtained from using British or
Australian standards. The outward acting pressure at a height of 160 ft obtained from
using the American standard are about 40% greater on the wall middle surface and 30%
greater on the wall edge area than the pressures obtained from using the Australian
standard. As seen in the case of claddings, the design pressures for components on roof
areas are the same for the Australian and Canadian standards.
82
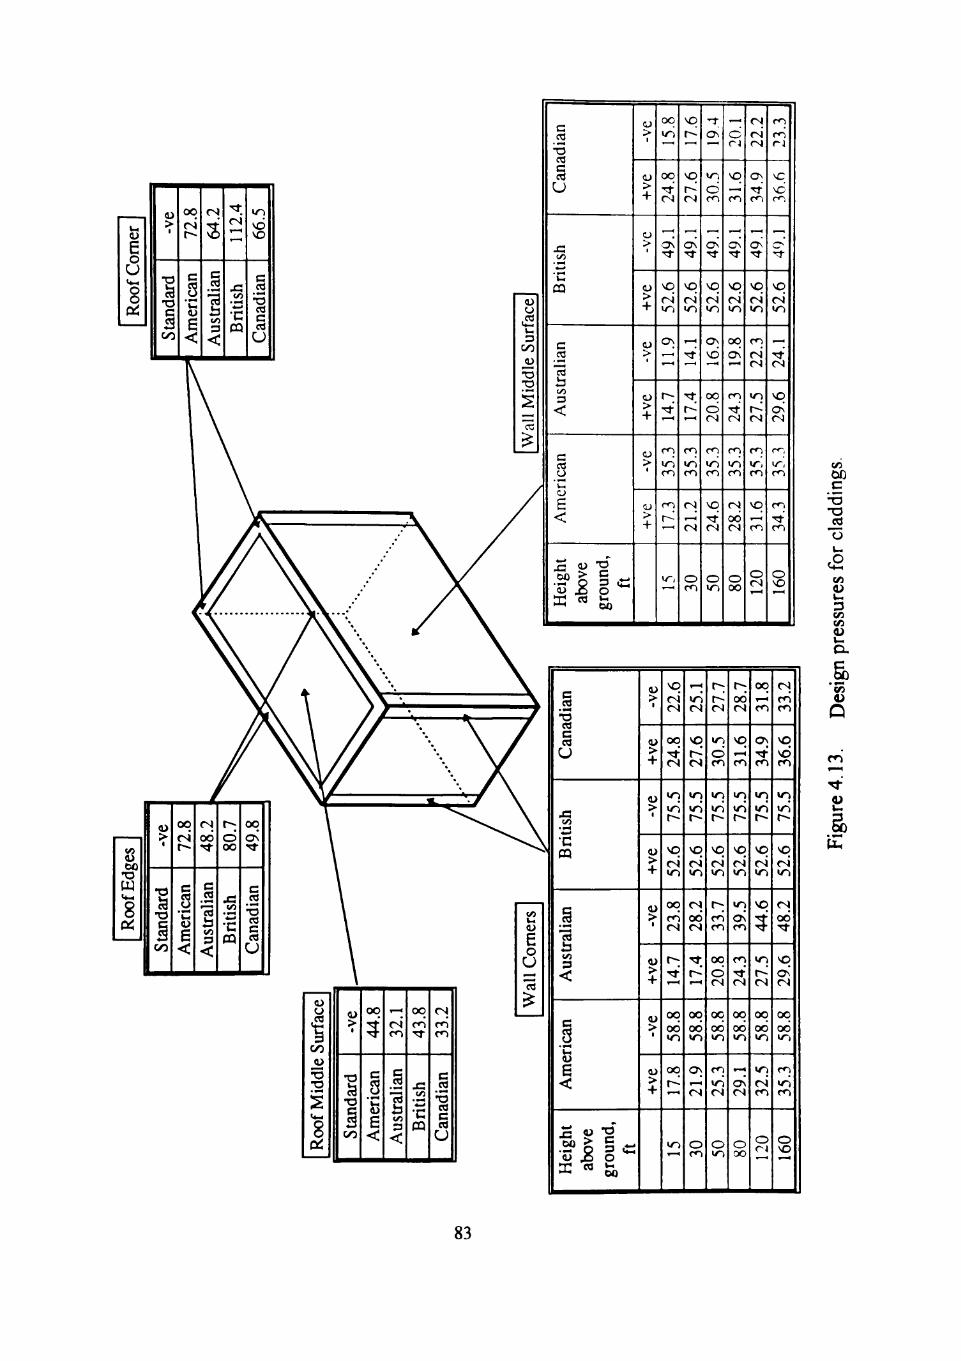
ii e o U O O
ii > 1
tand
ard
C/3
OO CN
mer
ican
<
CN
3 us
tral
ian
<
• *
CN T-H
Bri
tish
>o vo vo
anad
ian
u
face
di
e Su
rl W
all M
id
Can
adia
n B
ritis
h A
ustr
alia
n A
mer
ican
H
eigh
t ab
ove
grou
nd,
ft -v
e
> -f-
-ve
> -f-
-ve
>
+
-ve
>
+
15.8
24
.8
as
52.6
11
.9
14.7
35
.3
17.3
V,
17.6
27
.6
ON
52.6
14
.1
17.4
35
.3
21.2
o CO
19.4
30
.5
Ov
52.6
16
.9
20.8
35
.3
24.6
o IO
20.1
31
.6
ON
52.6
19
.8
24.3
35
.3
28.2
o OO
22.2
34
.9
o -"i-
52.6
22
.3
27.5
35
.3
31.6
o cs
£•£3
36.6
52
.6
24.1
29
.6
35.3
34
.3
o vo
Roo
f Edg
es -v
e 1
1 St
anda
rd
72.8
1
1 A
mer
ican
48
.2 1
1
Aus
tral
ian
80.7
1
1 B
ritis
h 49
.8 1
1
Can
adia
n
a
CO
a •o ."2
Roo
fM
-ve
"O fa
tand
CO
44.8
c s
mer
i
<
32.1
lia
n
ed
tl n <
43.8
JZ
Briti
33
.2
c .2
anad
u
Can
adia
n B
ritis
h A
usua
lian
Am
eric
an
Hei
ght
abov
e gr
ound
, ft
-v
e
a > -f-
-ve
9A-f-
-ve
9A+
-ve
> -f-
22.6
24
.8
75.5
52
.6
23.8
14
.7
58.8
17
.8
lO
25.1
27
.6
75.5
52
.6
28.2
17
.4
58.8
21
.9
o CO
27.7
1
30.5
75
.5
52.6
33
.7
20.8
58
.8
25.3
o IO
28.7
1
31.6
75
.5
52.6
39
.5
24.3
58
.8
29.1
o oo
31.8
34
.9
75.5
52
.6
44.6
27
.5
58.8
32
.5
1 12
0 33
.2 1
36
.6
75.5
52
.6
48.2
29
.6
58.8
35
.3
) 16
0
Vi 00 c
'-5 •o J2 o u
a Vi ii u Vi Vi ii
. ! > en ii
»-H
ii
83
4.3 Use of Standard.
The principal aim of any sUindard is to guide a practicing professional in assessing wind
loads on buildings and sU-uctures with minimum effort and chance of misinterpretation. As
any other standard wind load standards are also developed to make wind load
requirements as simple as possible. However, the format of wind load standards, in order
to be applicable to all structures create, situations which are hard to deal with, while
determining the wind loads on a particular stmcture.
The evaluation of wind loads for low and 160 ft buildings involves the completion of
the following three tasks:
1. Calculation of velocity pressure.
2. Interpretation of pressure coefficients for the main wind-force resisting
system and the calculation of design pressures on the windward wall,
leeward wall and roof.
3. Interpretation of pressure coefficients for the wall middle, wall edge, roof
middle, roof edge and roof comer surfaces and the calculation of design
pressures.
The simplicities and the difficulties encountered during the determination of loads using
each standard will be the topic discussed below.
4.3.1. American Standard
The format of American standard allows for quick interpretation of wind load
parameter, making the calculation of velocity pressure very simple. For special low-rise
84
buildings and for components and claddings the American standard gives combined values
of extemal pressure coefficients and gust effect factors. The combined values of pressure
coefficients and gust effect factor for components and claddings given in the American
standard are based on the U-ibutary area and the location of components and claddings on
the building surface. This makes the calculation of design pressures on components and
claddings very simple. For buildings with height greater than 60 ft the standard provides
simple figures and tables. The intemal pressures coetTicients are also given as combined
values of pressure coefficients and gust effect factor. The notes pertaining to figures and
tables in the standard make the interpretations even more simpler.
4.3.2. Australian Standard
The calculation of velocity pressure using the Australian standard is a lengthy process.
Calculation of velocity pressure involves the determination of the design wind speed. The
shielding multipher Ms and the terrain and structure height multiplier M(z.cat) must be
determined to calculate the design wind speed. To determine the shielding multipher the
designer should know the average height, breadth and distance between the buildings
surrounding the site. In the case study a typical value of 0.85 for Australian suburbs is
used, reducing the complications involved in determining the shielding factor. The terrain
and structure height multipher M(z,cat) of the Australian standard takes into account the
changes in terrain categories surrounding the site. Therefore, the standard requires the
terrain conditions for a upwind distance of at least 2500 m. The application of these
parameters without any assumptions is a time consuming process. In addition, the
85
interpretation of the area reduction factor Ka, and the reduction factor for claddings Kp, is
difficult. Further difficulty in using the Australian standard is encountered during the
calculation of design pressures on components and claddings. The descriptions given for
the local pressures factors Ki is difficult to interpret with respect to each component
location. The Australian standard does not give pressure coefficients for components and
claddings with respect to specific tributary area. The local pressure factors given in the
standard are for a range of areas from 0.25a^ or smaller and l.Oa or smaller, where "a" is
taken as a minimum of 0.2 x crosswind breadth or 0.2 x alongwind breadth. For a given
building, Australian standard gives design pressure on components and claddings for a
fixed range of areas. To calculate and compare design pressures on components and
claddings with tributary areas of 5 sqft, 10 sqft, 28 sqft, 55 sqft and 100 sqft for roof
middle surface, roof corners, wall edges (inward acting pressure), and wall middle surface
(outward acting pressure), logical reasoning is required.
4.3.3. British Standard
As discussed in Section 2.3 the determination of velocity pressure involves parameters
which are difficult to interpret. The inclusion of the altitude factor (elevation above sea
level) with the other parameters modifying the basic wind speed makes it difficult to
explain the use of each parameter. In addition, the British standard also does not give
external pressure coefficients based on tributary area and component location on the
building surface. The size effect factor C, requires the diagonal dimension of the loaded
area (tributary area). The designer has to calculate the diagonal dimension of the tribuUry
86
area with respect to the component location. This dependence on the diagonal dimension
could result in different design pressures being given for two identical areas with different
diagonal dimension. The format of the British standard makes the interpretation of
pressure coefficients for the components and claddings very difficult.
4.3.4. Canadian Standard
The format of the Canadian standard, though different from the American standard is
easy to interpret. The calculation of velocity pressure is quite simple. Similar to the
American standard, the Canadian standard gives combined values of extemal pressure
coefficients and gust effect factor for low buildings and for components and claddings
with height less than or equal to 6 m, which is simple to interpret for the given tributary
areas. External pressure coefficients for buildings with height greater than 6 m, or for
buildings having height greater than width, the standard provides figures which are easy to
interpret.
4.4 Summary
The two buildings considered in the case study are (i) a low building (60 ft x 100 ft x
15 ft) (u) a 160 ft high building (100 ft x 200 ft in plan). Both the buildings are assumed
to be located in a suburban area. The 3-second gust wind speed is assumed to be 110 mph
(49 m/s). The equivalent mean houriy wind speed is 72.7 mph (32.4 m/s) for 50 year
mean recurrence interval, 68.3 mph (30.4 m/s) for 30 year mean recurrence interval and is
87
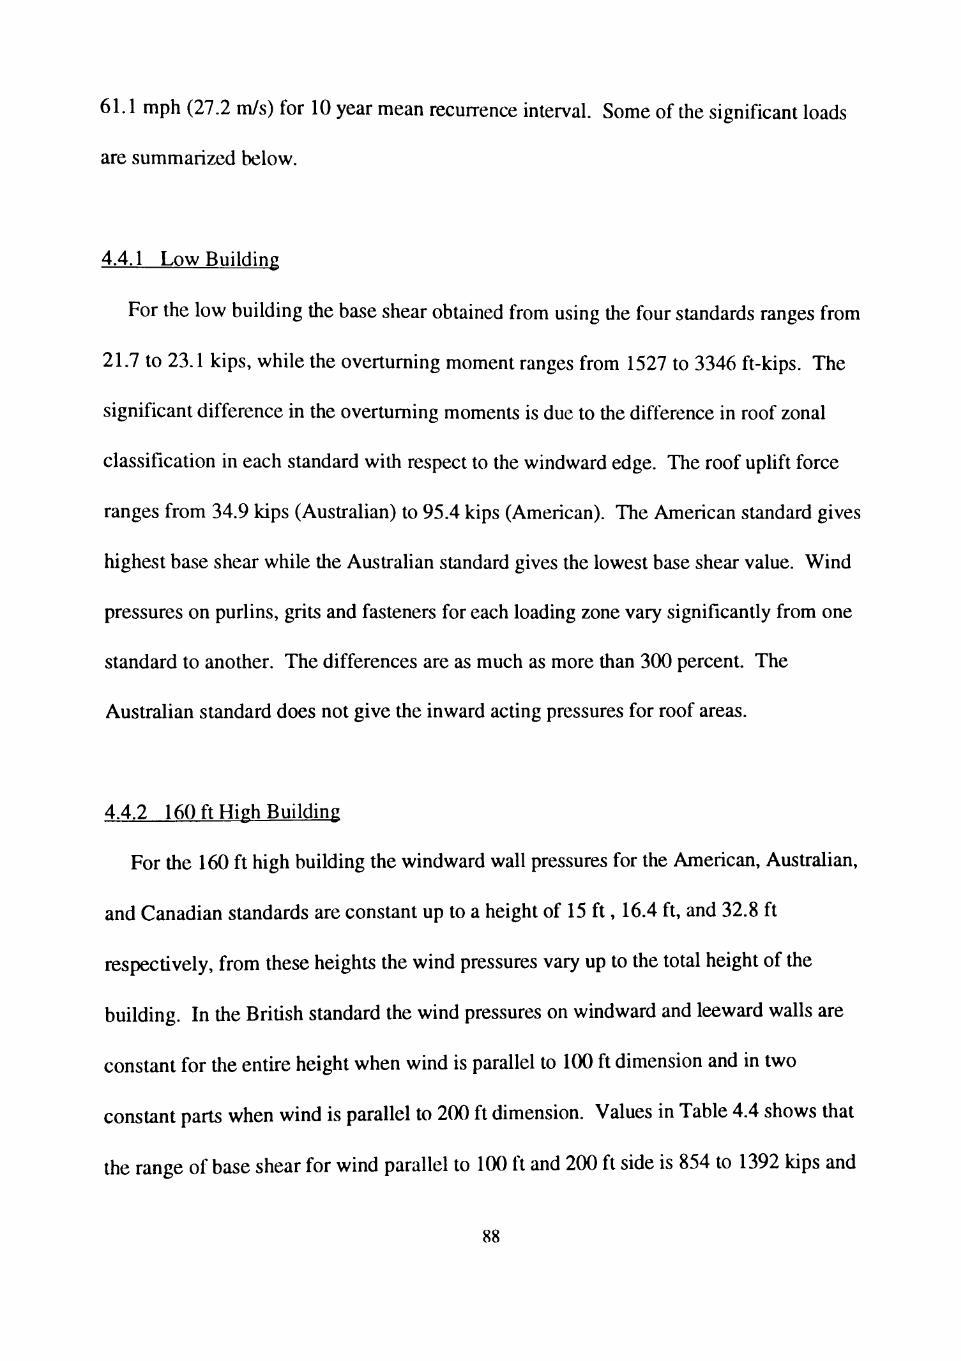
61.1 mph (27.2 m/s) for 10 year mean recurrence interval. Some of the significant loads
are summarized below.
4.4.1 Low Building
For the low building the base shear obtained from using the four standards ranges from
21.7 to 23.1 kips, while the overtuming moment ranges from 1527 to 3346 ft-kips. The
significant difference in the overtuming moments is due to the difference in roof zonal
classification in each standard with respect to the windward edge. The roof uplift force
ranges from 34.9 kips (Australian) to 95.4 kips (American). The American standard gives
highest base shear while the Australian standard gives the lowest base shear value. Wind
pressures on purlins, grits and fasteners for each loading zone vary significantly from one
standard to another. The differences are as much as more than 3(X) percent. The
Australian standard does not give the inward acting pressures for roof areas.
4.4.2 160 ft High Building
For the 160 ft high building the windward wall pressures for the American, Australian,
and Canadian standards are constant up to a height of 15 ft, 16.4 ft, and 32.8 ft
respectively, from these heights the wind pressures vary up to the total height of the
building. In the British standard the wind pressures on windward and leeward walls are
constant for the entire height when wind is parallel to 100 ft dimension and in two
constant parts when wind is parallel to 200 ft dimension. Values in Table 4.4 shows that
the range of base shear for wind parallel to 100 ft and 200 ft side is 854 to 1392 kips and
88
347 to 647.8 kips respectively. The range of overturning moments for wind parallel to
100 ft and 200 ft side are 10.4 x 10 to 15.5 x IO'' and 8.0 x 10 to 11.4 x 10^ When wind
is parallel to 1(X) ft side, the Australian standard gives the lowest base shear and
overtuming moment while the British standard gives the highest base shear and
overtuming moment. When wind is parallel to 200 ft side, the Australian standard gives
the lowest base shear, while the Canadian standard gives the highest overtuming moment.
Wind pressures on components and claddings for each zone vary significantly from one
standard to another.
89
CHAPTER V
LIMIT STATE LOADING
Design based on failure conditions rather than the working load conditions is known as
hmit state. The failure loads are always more than actual loads by a factor of safety
known as load factor. Load and resistance factor design (LRFD) is similar to plastic
design. In LRFD the theoretical su-ength of a member is reduced by application of a
resistance factor in addition to multiplying the loads by a load factor. The criterion that
must be satisfied in selecting a member is
factored load < factored strength,
^(working loads x load factor) < nominal strength x resistance factor.
LRFD is similar to the limit state design or the ultimate limit state design used in the
Australian, British and Canadian standards. The American standard gives six load
combinations, which should be checked to give the most critical load on a member. The
load factor for a given load effect is not the same in all load combinations given. This is
because in each combination one of the load effects (live, dead, wind or snow loads) is
considered to be at its life time maximum, while the others are at their arbitrary point in
time.
For wind loads, the American standard uses a load factor of 1.3 in combinations with
dead load. This load factor of 1.3 is used in the calculations of hmit state base shear and
overturning moment using the American standard. In Chapter IV, the wind load
computations based on the Australian standard are accomphshed using the permissible
90
stress gust wind speed, which is based on a 50 year mean recurrence interval. To obtain
the limit state wind loads ( wind speed associated with 1000 year mean recurrence
interval) Australian standard multiplies the permissible sUess wind loads by a load factor
of 1.5 (E 3.2.2(4); SAA, 1989). The British standard obtains the ultimate hmit state wind
loads by applying a probability factor Sp = 1.183 (1754 years mean recurrence interval) in
the calculation of site wind speed; this translates into the load factor of 1.4. The factored
loads for the Canadian standard are obtained by multiplying the wind loads by a load
factor of 1.5.
The wind load factors of 1.5 and 1.4, given by the Australian and the British standards,
are based on mean recurrence intervals. For limit state design, load factors should
increase with increase in mean recurrence interval since the chance of experiencing high
wind speed (which may become the failure load) increases with the increase in mean
recurrence interval. However, it is noteworthy to see a low load factor used by the British
standard for 1754 year mean recurrence interval compared to the load factor used by the
Australian standard for 1000 year mean recurrence interval; this anomaly is difficult to
reconcile.
The loads obtained using the four standards in chapter IV for both the low and 160 ft
buildings are multiplied by their respective load factors to give limit state base shear,
overtuming moment, and roof uplift, for the buildings. The calculated limit state base
shear, overturning moment, and roof uplift, for low and 160 ft buildings are tabulated in
Table 5.1 and Table 5.2.
91
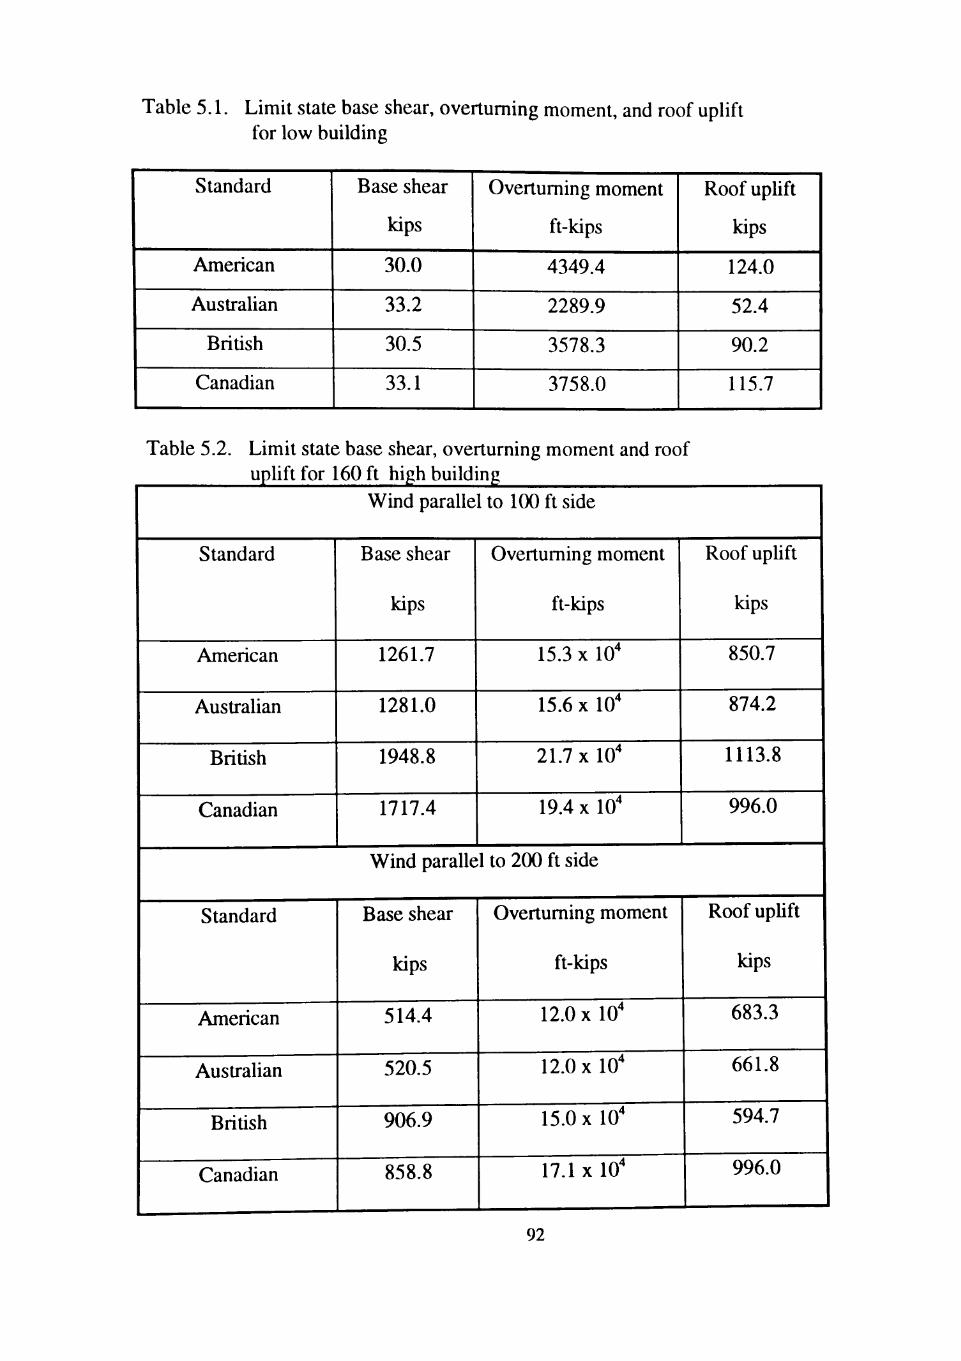
Table 5.1. Limit state base shear, overtuming moment, and roof uplift for low building
Standard
American
Australian
British
Canadian
Base shear
kips
30.0
33.2
30.5
33.1
Overtuming moment
ft-kips
4349.4
2289.9
3578.3
3758.0
Roof uphft
kips
124.0
52.4
90.2
115.7
Table 5.2. Limit state base shear, overturning moment and roof uphft for 160 ft high building
Wind parallel to 100 ft side
Standard
American
Australian
British
Canadian
Base shear
kips
1261.7
1281.0
1948.8
1717.4
Overtuming moment
ft-kips
15.3 X 10
15.6 X IO''
21.7 X IO'*
19.4 X 10'
Roof uphft
kips
850.7
874.2
1113.8
996.0
Wind parallel to 200 ft side
Standard
American
Australian
British
Canadian
Base shear
kips
514.4
520.5
906.9
858.8
Overtuming moment
ft-kips
12.0 X 10'
12.0x10'
15.0 X 10'
17.1 X 10'
Roof uphft
kips
683.3
661.8
594.7
996.0
92
5.1 Low Building
For the low building, limit state base shear values are comparable for the American and
the British standards; and for the Ausu-alian and the Canadian standards. The base shears
for all standards are within 10 percent of each other. However, die limit state overtuming
moments obtained from the four standards differ significanUy due to the differences in roof
uplift forces. Table 5.1 shows that the American standard yields highest roof uplift force,
while the AusU-ahan standard yields the lowest roof uplift force. The roof uplift force
yielded from the American standard is about 200% greater than the value obtained from
the Austrahan standard.
5.2 160 ft High Building
Limit state base shear, overturning moment and roof uplift for the 160 ft building are
shown in Table 5.2. The American and Australian standards give almost the same values
of limit state base shear, overtuming moment and roof uplift. The limit state values
yielded by the British and the Canadian standards differ significantly from the values
obtained by the American and the Australian standards. The British standard gives the
highest roof uplift load when wind is parallel to 100 ft while the Canadian standard gives
the highest roof uplift when wind is parallel to 200 ft side. The roof uplift forces given by
the British and the Canadian standards are about 150% greater than the values given by
the Australian and the American standards.
93
CHAPTER VI
CONCLUSIONS
The four national standards American, Australian, British and Canadian are compared
by calculating wind loads on two buildings: a low building with dimensions of 100 ft x 60
ft X 15 ft, and a 160 ft high building with a plan dimensions of 200 ft x 100 ft. The
reference wind speeds of the British and Canadian standards are made consistent with the
reference wind speed of the American standard. Since the AusUalian standard uses the 3-
second gust wind speed, no conversion to the reference wind speed is necessary. In
calculating the wind loads all standards follow a similar approach. For reference wind
speed all standards except the Canadian standard use a 50-year mean recurrence interval.
The Canadian standard uses a 30-year mean recurrence interval for the design of main
wind-force resisting system and a 10-year mean recurrence interval for the design of
components and claddings. The wind loads obtained from using the four standards are
multiphed by there respective limit state load factors and then compared. The conclusions
drawn from the above study are as follows:
1. The format of the American and Canadian standards are easy to follow when
determining wind loads. The Australian and British standards are more difficult to
use. In Australian standard several parameters are difficult to interpret including
shielding parameter Ms, structure height multiplier (M(z, cat)), area reduction factor
Ka, factor for porous cladding Kp and pressure coefficients for components and
94
claddings. The format of the British standard is difficult to use because several
factors are interrelated.
2. Limit state base shear for the low building example are comparable for Australian
and Canadian standards and for American and British standards. The Australian and
Canadian standards specify a base shear 10 percent larger than the American and the
British standards.
3. The limit state base shear for the 160-ft high building is the very similar in all four
standards.
4. Overturning moments largely depend on roof uplift. Limit state roof uplift for the
low building ranged from 52.4 kips (Australian standard) to 124 kips (American
standard); while for 160 ft high building it ranged between 850.7 kips (American
standard) and 1113.8 kips (Canadian standard) with wind parallel to 1(X) ft side.
These variations in roof uphft suggest that it is not appropriate to compare
overtuming moments and that a thorough parametric study on roof uplift loads
should be conducted to assess the real loads.
5. The design pressures on components and claddings differ between the standards by
as much as 2(X) percent.
95
REFERENCES
ASCE, 1995: "Minimum Design Loads for Buildings and Other Stmctures," Proposed Wind Load Provisions, Draft 6, ASCE 7-95, American Society of CivU Engineers, New York, NY.
BS, 1994: "Code of Practice for Wind Loads," Part 2, BS6399, Calibrated Draft, British Standards Institution, London, England.
Cermak, J. E, 1975: "Applications of Fluid Mechanics to Wind Engineering." A Freeman Scholar Lecture, Journal of Fluid Engineering, American Society of Mechanical Engineers, United Engineering Center, New York, NY.
Das, N. K, 1985: "A Comparative Study of Wind Load Standards," A M.S Degree Thesis, DeparUnent of Civil Engineering, Texas Tech University, Lubbock, Texas
Davenport, A. G, 1967: "Gust Loading Factors," Joumal of the Stmctural Division, ASCE, Vol. 93 pp 11-34.
Dursts, C. S, 1960: "Wind Speeds Over Short Periods of Time," Meteorological Mag., Vol 89, 181-187-
ESDU, 1983: "Strong Winds in the Aunospheric Boundary Layer," Part 2: Discrete Gust Speeds, Engineering Science Data Item Number 83045, London, England.
Green way, M. E, 1979: "An Analytical Approach to Wind Velocity Gust Factors," Joumal of Industrial Aerodynamics, Vol 5, pp 61-91.
Holmes, J. D, Melbourne, W. H, and Walker, G. R, 1990: "A Commentary on the Australian Standard For Wind Loads," Australian Wind Engineering Society, Lilidale, Victoria, Australia.
Holmes, J.D. and Best, R. J, 1979: "A Wind Tunnel Study of Wind Pressures on Grouped Tropical Houses," James Cook University, Wind Engineering Report 5/79.
Houston, E. L, And Carruthers, N. B, 1976: " Wind Forces on Buildings and Su-uctures an Introduction," John Wiley and Sons, New York NY.
Liu, H, 1983: "Internal Pressure and Cladding Loads in Buildings," Fall Convention of the American Society of Civil Engineers, Houston, Texas.
96
Mehta, K. C, 1980: "Wind Load Standards and Codes," Proceedings of the Fifth Intemational Conference on Wind Engineering, J.E. Cermak. ed.. Ft. Colhns, Colorado, Pergaman Press.
Mehta, K. C, 1981: "Evolution of Wind Load Standards," Fourth U.S. National Conference on Wind Engineering Research, B.Hartz. ed.. University of Washington, Seattle.
Mehta, K. C , Marshall, R. D., and Perry, D. C, 1991: "Guide to the Use of the Wind Load Provisions of ASCE 7-88," American Society of Civil Engineers, New York, NY.
NRCC, 1990: "Nafional Building Code of Canada, 1990," Associate Committee on die National Building Code, National Research Council of Canada, NRCC No. 32379, Ottawa, Canada.
NRCC, Supplement 1990: "Supplement to the National Building Code of Canada," Associate Committee on the National Building Code, National Research Council of Canada, NRCC No. 30629, Ottawa, Canada.
SAA, 1989: "Minimum Design Loads on Stmctures, Part 2: Wind Loads," AS 1170.2, Standards Association of AusUalia, Standards House, North Sydney, Austraha.
Simiu, E and Scanlan, R.H, 1986:, "Wind Effects on Stmctures: An Introduction to Wind Engineering," John Wily and Sons, New York, NY.
97
APPENDDC A
CALCULATIONS USING AMERICAN STANDARD
This appendix contains the wind pressure calculations using the American standard.
Wind pressure calculations for the 160 ft building follow the wind pressure calculations for
the low building. The references cited herein regarding sections, tables, and figures,
belong to the American standard.
98
A.1 Low Building
Dimension: 100 ft x 60 ft x 15 ft
Exposure: B, urban and suburban area
Basic wind speed: 110 mph, 3-second gust wind speed
As per section 6.2, buildings with mean roof height less than or equal to 60 ft are
designed as special low buildings. For special low buildings, the main wind-force resisting
systems and the components and claddings are designed based on Exposure C; as per
section 6.5.3.2.2 and section 6.5.3.3.1. The basic wind speed of 110 mph is a 3-second
gust speed at 33 ft above ground in Exposure C and is associated with an annual
probabihty of occurrence of 0.02 (50-year mean recurrence interval). The building and
structural classification category in Table 1-1 indicates that present buildings falls under
Category II. The importance factor I, in accordance with classification category II, is 1.00
(from Table 6-2).
Design Wind Pressures for the Main Wind-Force Resisting System:
For special low-rise buildings. Table 6-1 gives the following equation for main wind-
force resisting system
p = qi,[(GCpf)]
Velocity pressure, q,. = 0.00256K„KztV^I (psf)
Ki, = 0.85 for Exposure C from Table 6-3
Kzt= 1.00 as per provisions of 6.5.5
q,. = 0.00256(0.85)(1.00)(1 lO)'(l.OO) = 26.3 psf
99
GCpf from Figure 6-4 of the ANSI standard are given in Table A. 1 and Table A.2 for
Case A and Case B. The internal pressure coefficient GCp, (Table 6-4) is taken equal to
±0.18, as the building does not have any unusual openings. Note #6 of Figure 6-4 suites
that, for buildings sighted within Exposure B in all directions, calculated pressures must be
multiplied by 0.85.
The design pressure for Case A and Case B are tabulated in Table A. 1 and Table A.2 for
each building surface (zones). A few sample calculations are shown below
Design pressures for CASE A:
zone 1:
p = 26.3[(0.40)](0.85)= 8.9 psf
zone 4:
p = 26.3[(-0.29)] (0.85)= -6.5 psf
Base shear for the entire building:
= [8.9(15)(100) -+- 6.5(15)(100)] / 1000 = 23.10 kips
Overtuming moment:
= [8.9(15)(100)(7.5) + 19.5(30)(100)(45) + 12.3(30)(10{))(15) +
6.5(15)(100)(7.5)] /1000 = 3345.7 ft-kips
Roof uphft:
= 100[ 19.5(30) + 12.3(30)] / 1000 = 95.4 kips
Design Wind Pressures for Components and Claddings:
The design wind pressure for components and claddings of a special low buildings is
given by the equation
100
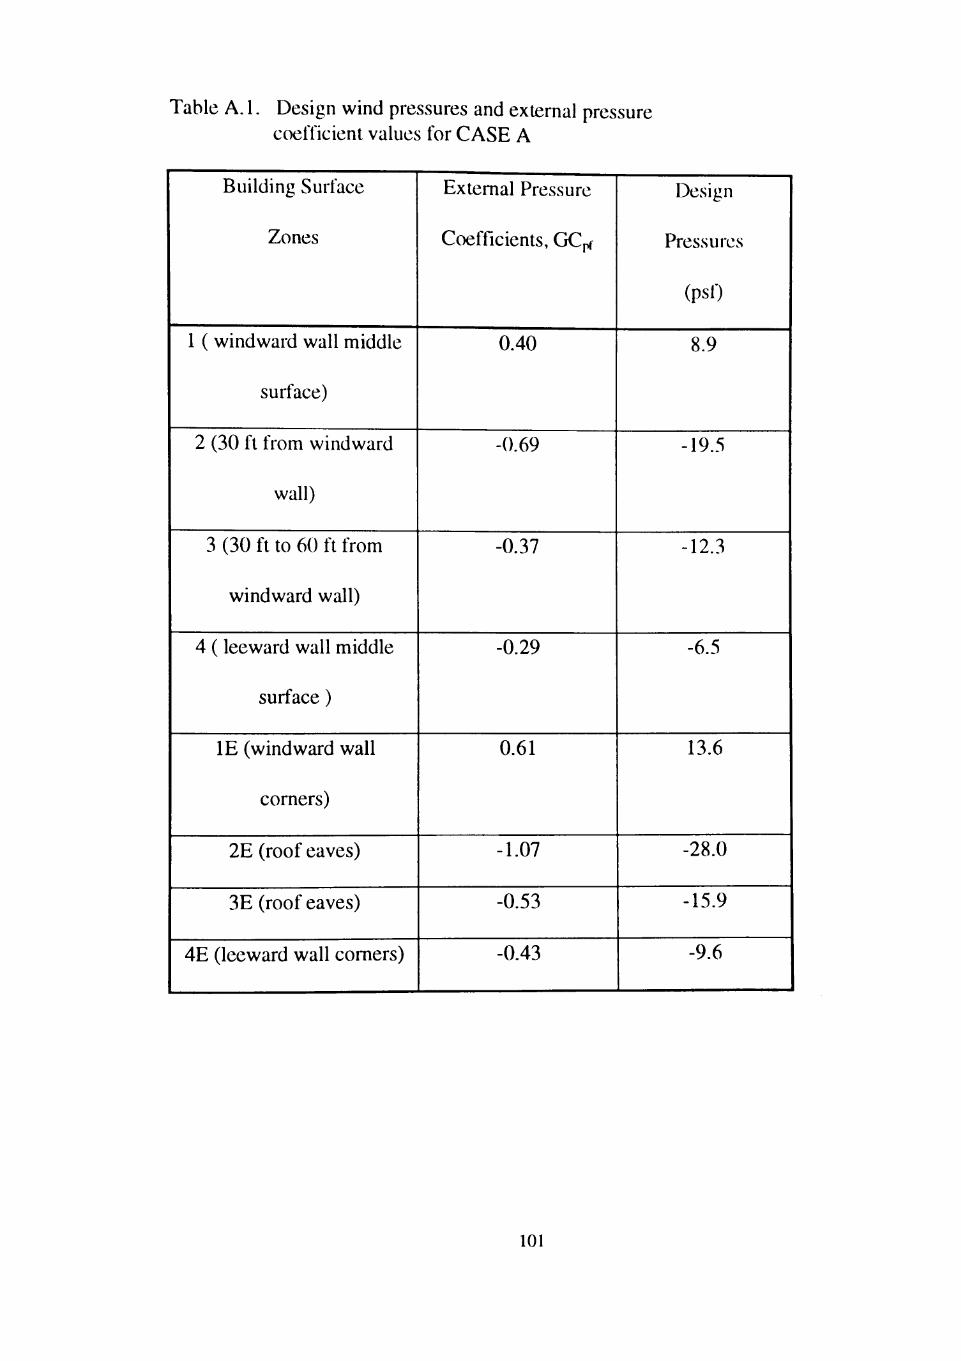
Table A. 1. Design wind pressures and external pressure coefficient values for CASE A
Building Surface
Zones
1 ( windward wall middle
surface)
2 (30 ft from windward
wall)
3 (30 ft to 60 ft fiom
windward wall)
4 (leeward wall middle
surface)
IE (windward wall
corners)
2E (roof eaves)
3E (roof eaves)
4E (leeward wall comers)
Extemal Pressure
Coefficients, GCpf
0.40
-0.69
-0.37
-0.29
0.61
-1.07
-0.53
-0.43
Design
Pressures
(psf)
8.9
-19.5
-12.3
-6.5
13.6
-28.0
-15.9
-9.6
101
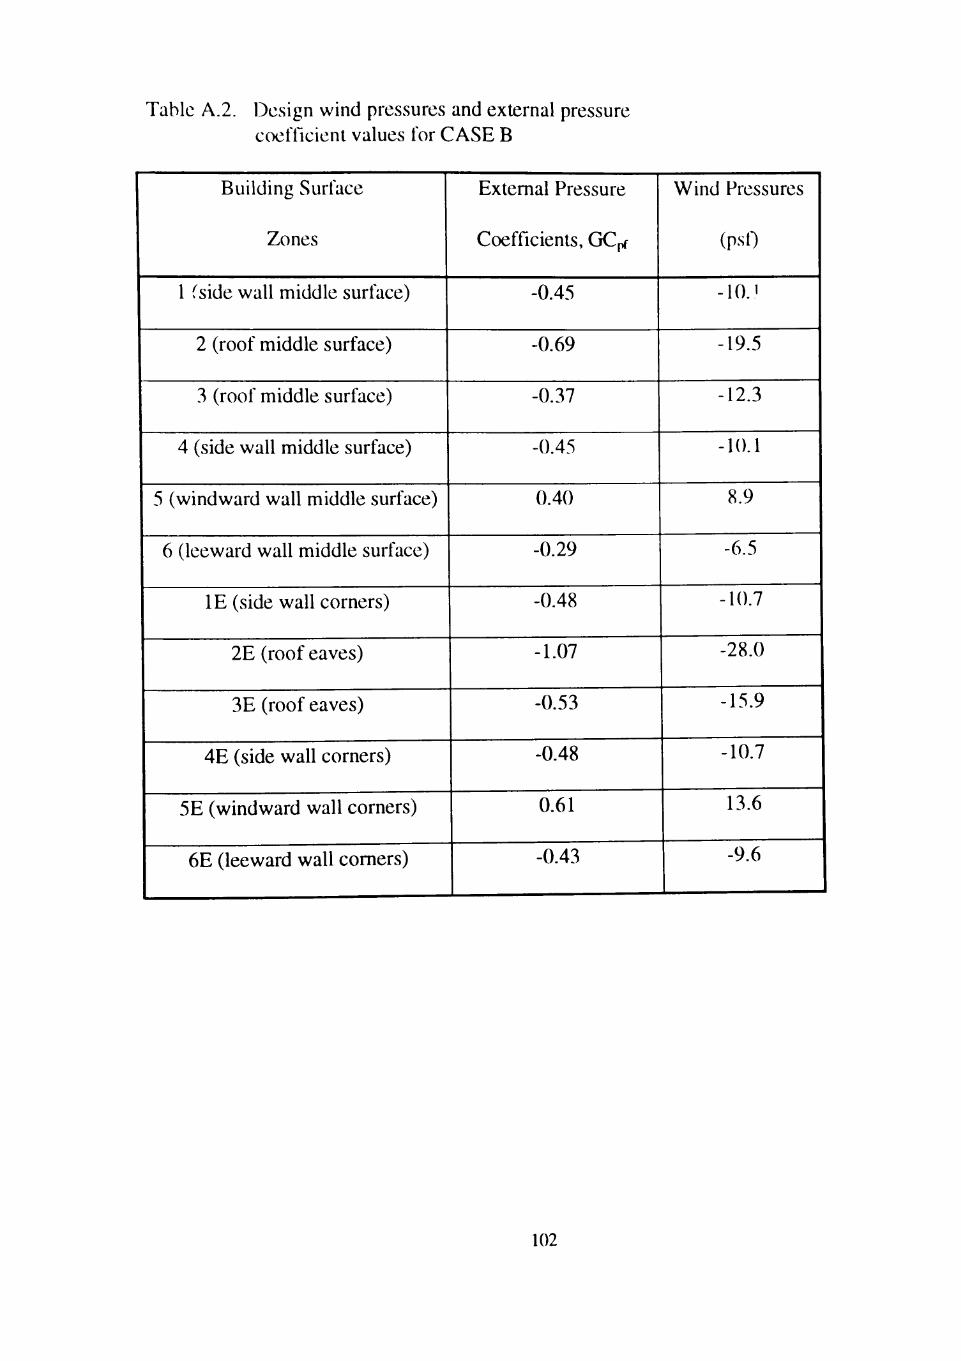
Table A.2. Design wind pressures and external pressure coefficient values for CASE B
Building Surface
Zones
1 fside wall middle surface)
2 (roof middle surface)
3 (roof middle surface)
4 (side wall middle surface)
5 (windward wall middle surface)
6 (leeward wall middle surface)
IE (side wall corners)
2E (roof eaves)
3E (roof eaves)
4E (side waU comers)
5E (windward wall corners)
6E (leeward wall comers)
Extemal Pressure
Coefficients, GCpf
-0.45
-0.69
-0.37
-0.45
0.40
-0.29
-0.48
-1.07
-0.53
-0.48
0.61
-0.43
Wind Pressures
(psf)
-10.1
-19.5
-12.3
-10.1
8.9
-6.5
-10.7
-28.0
-15.9
-10.7
13.6
-9.6
102
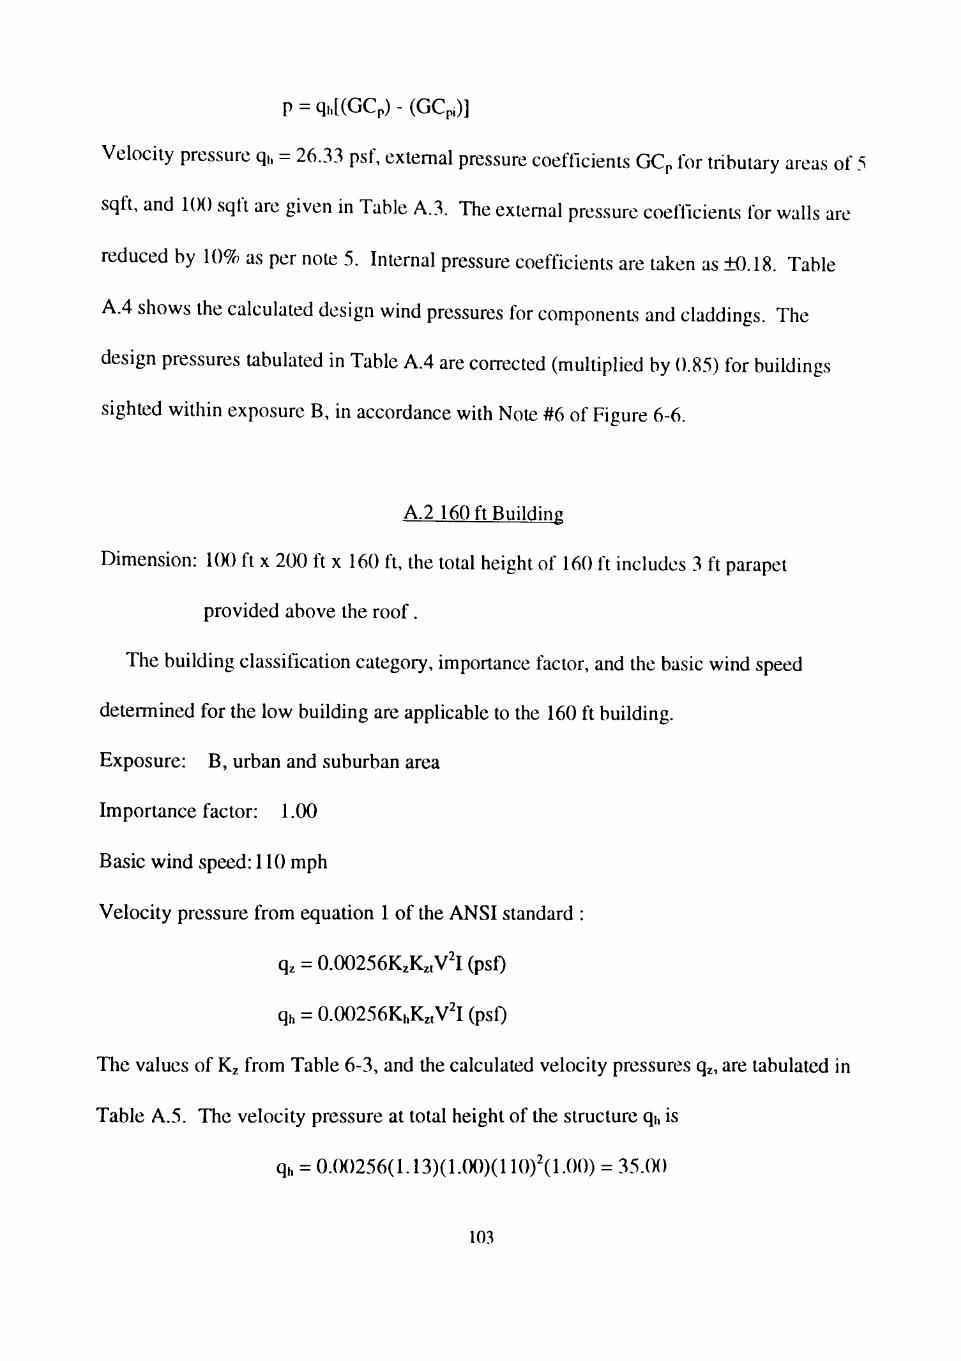
p = q,.[(GCp) - (GCp.)]
Velocity pressure q,, = 26.33 psf, extemal pressure coefficients GCp for tributary areas of 5
sqft, and 1(K) sqft are given in Table A.3. The extemal pressure coefficients for walls are
reduced by 10% as per note 5. Internal pressure coefficients are taken as ±0.18. Table
A.4 shows the calculated design wind pressures for components and claddings. The
design pressures tabulated in Table A.4 are corrected (multiplied by 0.85) for buildings
sighted within exposure B, in accordance with Note #6 of Figure 6-6.
A.2 160 ft Building
Dimension: 100 ft x 200 ft x 160 ft, the total height of 160 ft includes 3 ft parapet
provided above the roof.
The building classification category, importance factor, and the basic wind speed
determined for the low building are applicable to the 160 ft building.
Exposure: B, urban and suburban area
Importance factor: 1.00
Basic wind speed: 110 mph
Velocity pressure from equation 1 of the ANSI standard :
qz = 0.00256KzKztV^I (psf)
qh = 0.00256KhKztV^I (psQ
The values of Kz from Table 6-3, and the calculated velocity pressures qz, are tabulated in
Table A.5. The velocity pressure at total height of the structure qi, is
qh = 0.(K)256(1.13)(1.00)(110)^(1.00) = 35.00
103
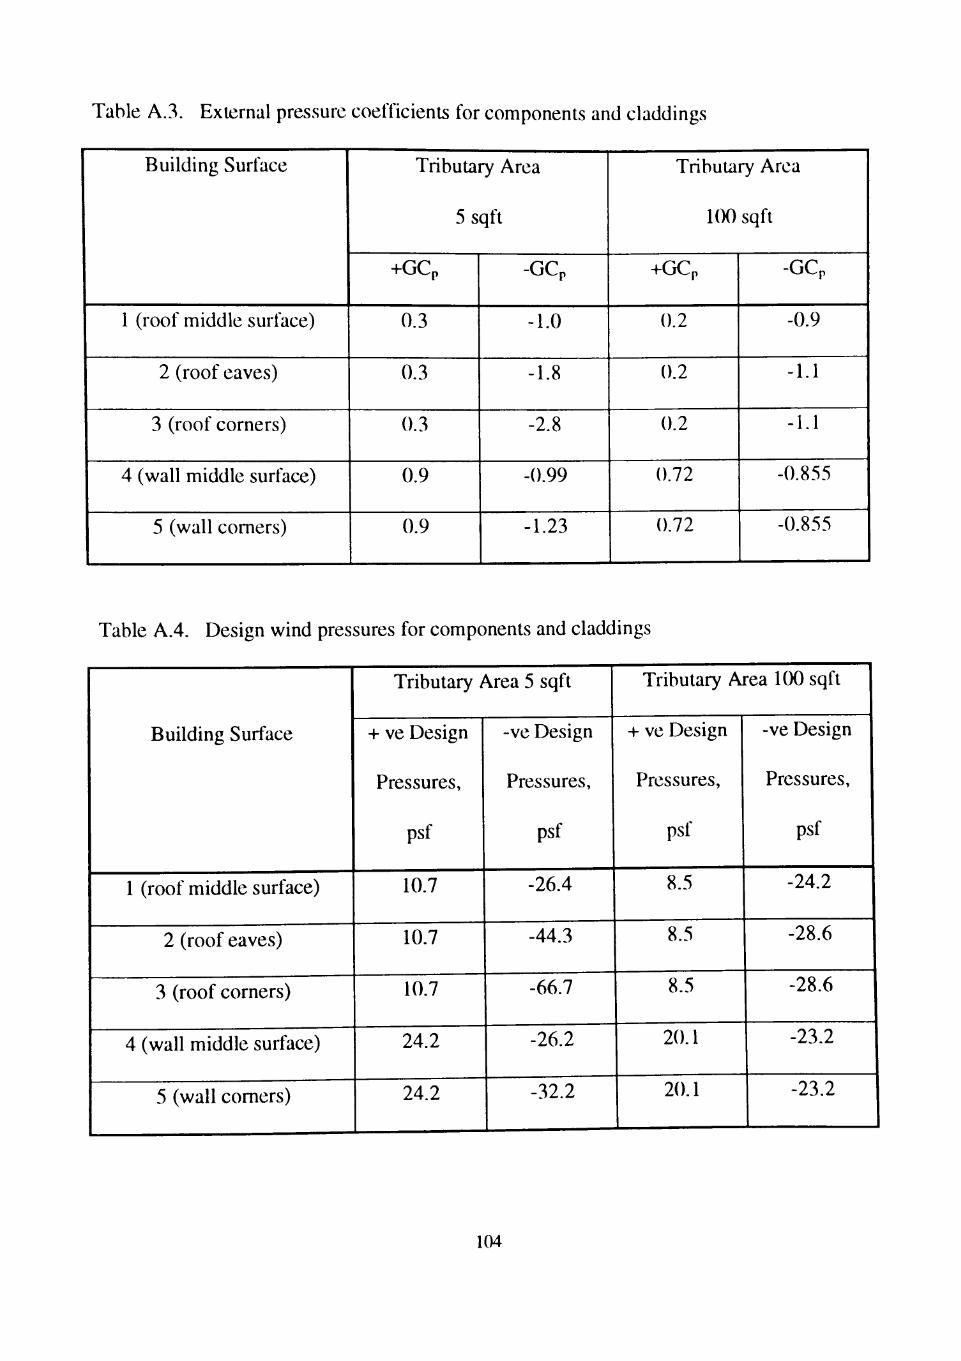
Table A.3. External pressure coefficients for components and claddings
Building Surface
1 (roof middle surface)
2 (roof eaves)
3 (roof corners)
4 (wall middle surface)
5 (wall comers)
Tributary Area
5 sqft
+GCp
0.3
0.3
0.3
0.9
0.9
-GCp
-1.0
-1.8
-2.8
-0.99
-1.23
TribuUiry Area
1(X) sqft
- ^GCp
0.2
0.2
0.2
0.72
0.72
-GCp
-0.9
-1.1
-1.1
-0.855
-0.855
Table A.4. Design wind pressures for components and claddings
Building Surface
1 (roof middle surface)
2 (roof eaves)
3 (roof corners)
4 (wall middle surface)
5 (wall comers)
Tributary Area 5 sqft
-I- ve Design
Pressures,
psf
10.7
10.7
10.7
24.2
24.2
-ve Design
Pressures,
psf
-26.4
-44.3
-66.7
-26.2
-32.2
Tributary Area 100 sqft
+ ve Design
Pressures,
psf
8.5
8.5
8.5
20.1
20.1
-ve Design
Pressures,
psf
-24.2
-28.6
-28.6
-23.2
-23.2
104
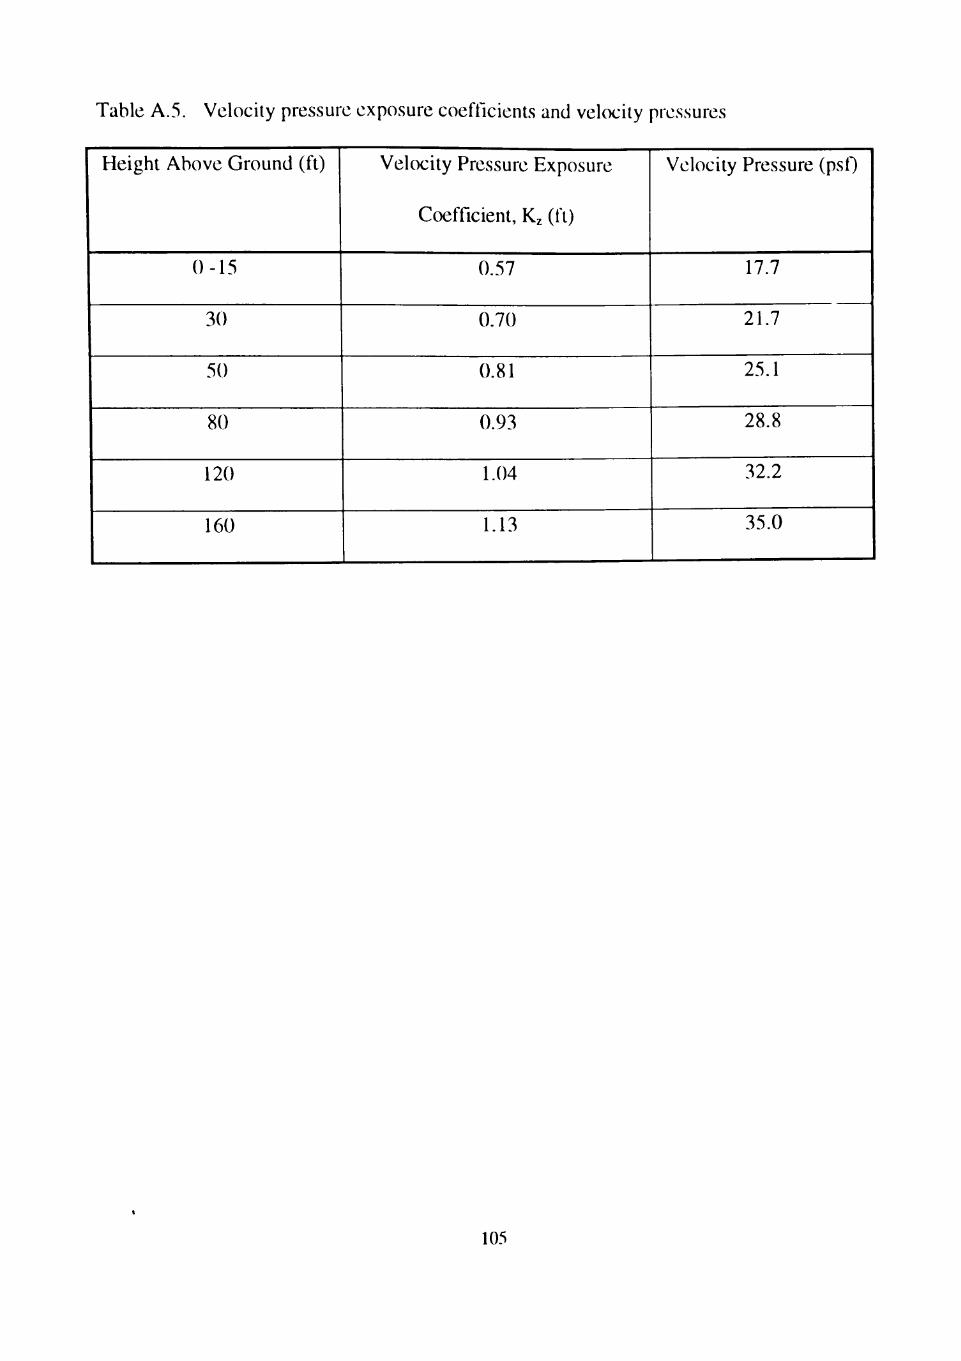
Table A.5. Velocity pressure exposure coefficients and velocity pressures
Height Above Ground (ft)
0-15
30
50
80
120
160
Velocity Pressure Exposure
Coefficient, Kz (ft)
0.57
0.70
0.81
0.93
1.04
1.13
Velocity Pressure (pst)
17.7
21.7
25.1
28.8
32.2
35.0
105
As the suiTounding topography near the building location does not constitute any
abmpt changes, the topography multiplier Kzt is taken as l.(K).
Design Pressures for the Main Wind-Force Resisting System:
From Table 6-1, the equation for determining design wind pressures for the main wind
force resisting systems is given by
P = qGCp
Velocity pressure q:
= qz for windward wall (as tabulated in Table A.5)
= qi, for leeward wall, side walls and roof = 35.00
Gust effect factor G:
= 0.80 for exposure B as per section 6.6.1
Pressure coefficients Cp:
= 0.8 for windward wall
= -0.5 for leeward wall for I7B ratio of 100 ft / 200 ft = 0.5
= -0.3 for leeward wall for L/B ratio of 200 ft / 100 ft = 2.0
Design wind pressures on the windward wall for wind parallel to 100 ft and 200 ft side are
the same as Uibulated in Table A.6. For leeward wall design pressure is constant through
out the height of the building. Design leeward pressure for wind parallel to 100 ft side is
p = 35.0(0.80)(-0.5) = -14.00 psf
and for wind parallel to 2(K) ft side is
p = 35.0(0.80)(-0.3) = -8.4 psf
Base shear and over tuming moment for the entire building when wind is parallel to 1(X) ft
106
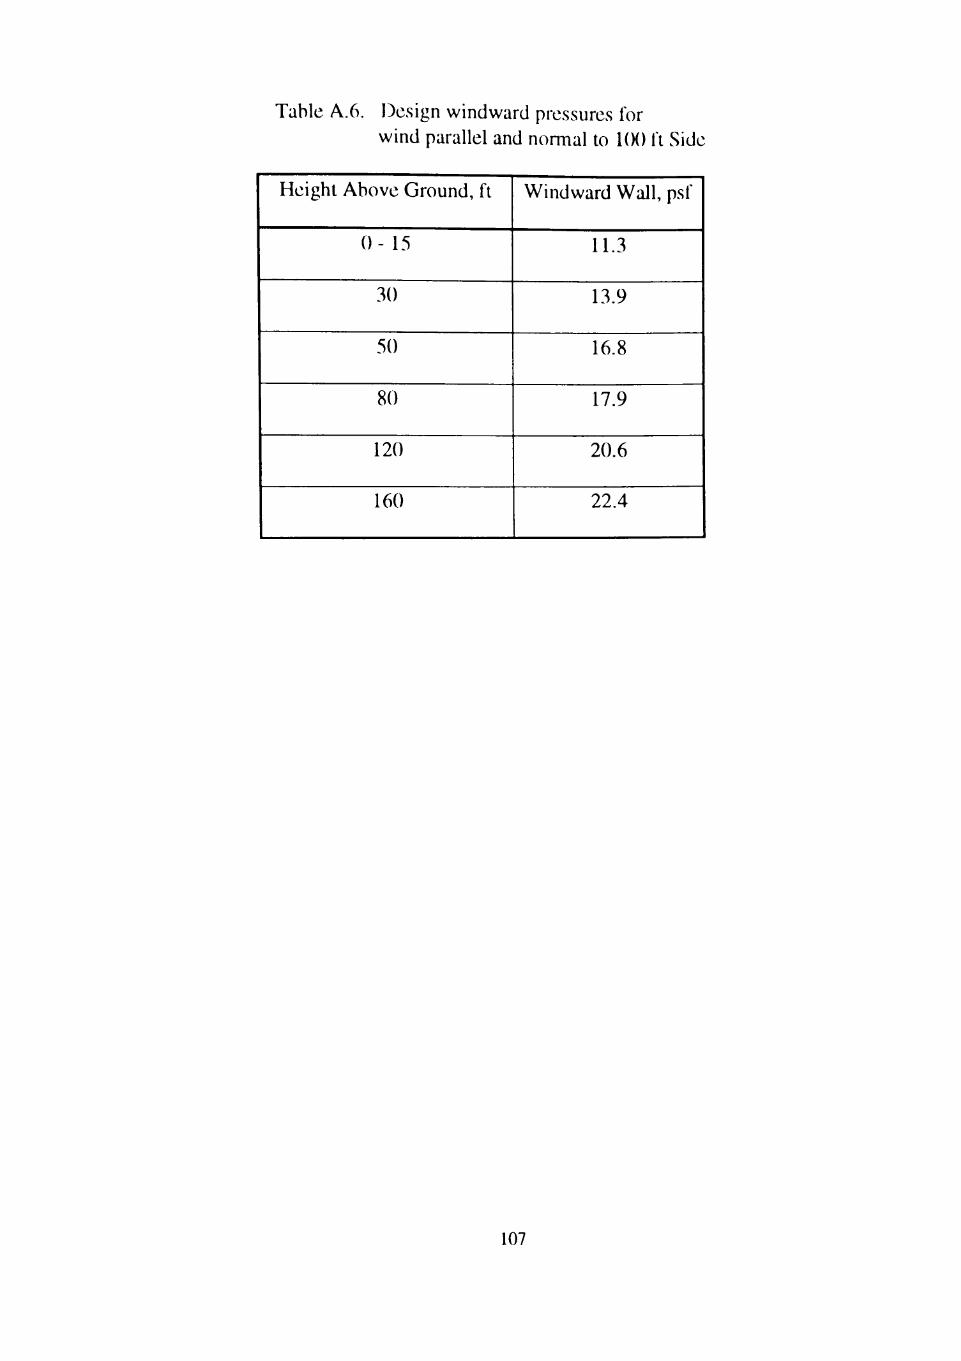
Table A.6. Design windward pressures for wind parallel and normal to 1(K) ft Side
Height Above Ground, ft
0 - 15
30
50
80
120
160
Windward Wall, psf
11.3
13.9
16.8
17.9
20.6
22.4
107
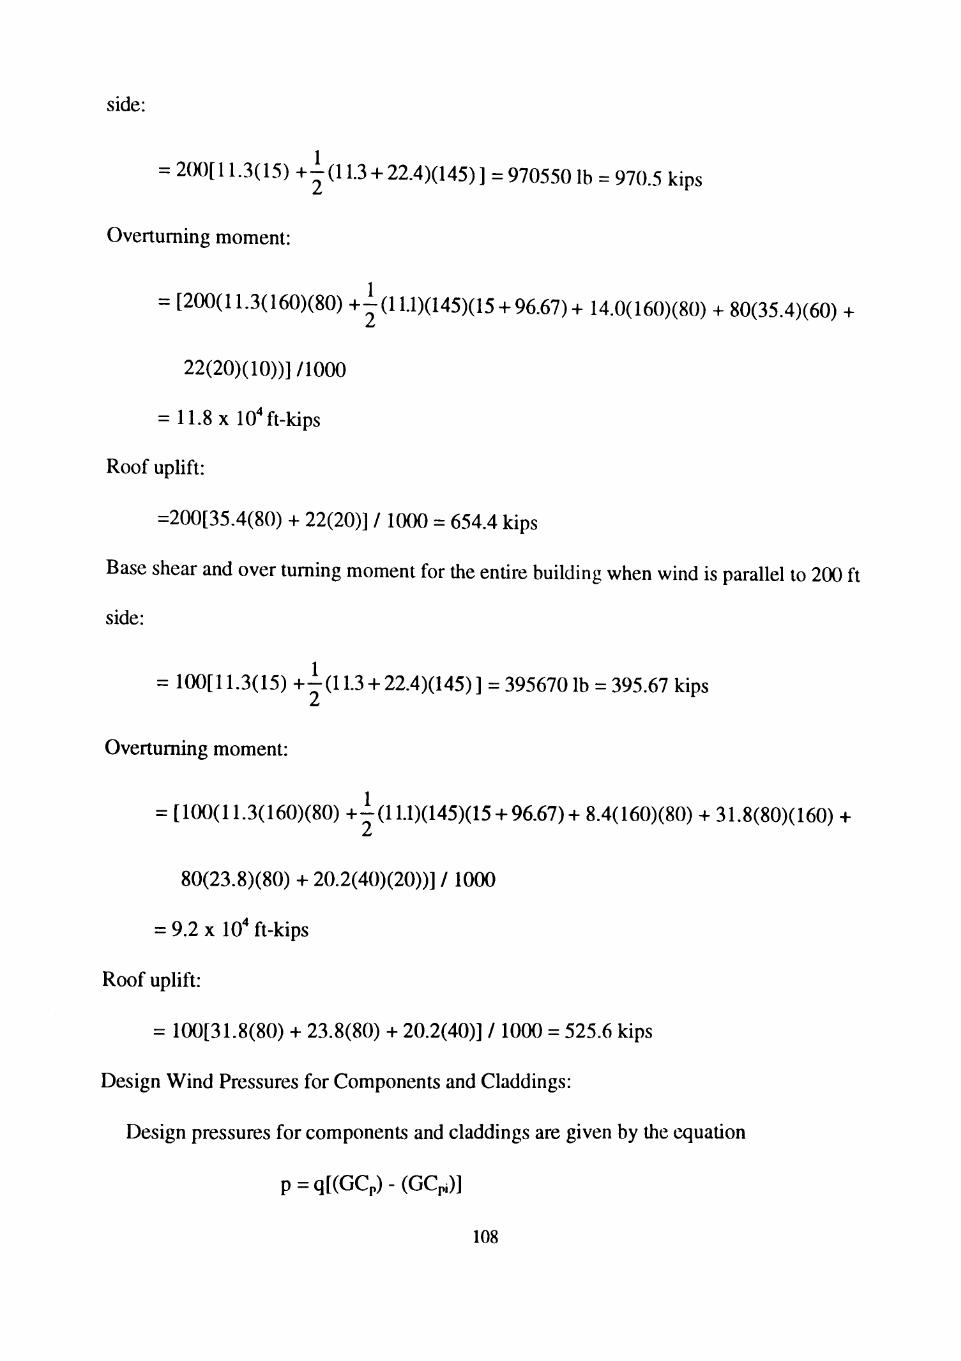
side:
= 200[ 11.3( 15) + i (11.3 + 22.4)(145) ] = 970550 lb = 970.5 kips
Overtuming moment:
= [200(11.3(160)(80) +-(ll.l)(145)(15-h 96.67)-f 14.0(160)(80) + 80(35.4)(60) +
22(20)(10))]/1000
= 11.8x10'ft-kips
Roof uphft:
=200[35.4(80) + 22(20)] / 1000 = 654.4 kips
Base shear and over tuming moment for the entire building when wind is parallel to 200 ft
side:
= 100[11.3(15)-h|(l 1.3-H22.4)(145)] = 395670 lb = 395.67 kips
Overtuming moment:
= [100(11.3(160)(80) -h | ( l 1.1)(145)(15-H96.67)-h 8.4(160)(80) -h 31.8(80)(160) -i-
80(23.8)(80) + 20.2(40)(20))] / 1000
= 9.2 X 10' ft-kips
Roof uplift:
= 100[31.8(80) + 23.8(80) -»- 20.2(40)] / 1000 = 525.6 kips
Design Wind Pressures for Components and Claddings:
Design pressures for components and claddings are given by the equation
p = q[(GCp) - (GCpi)]
108
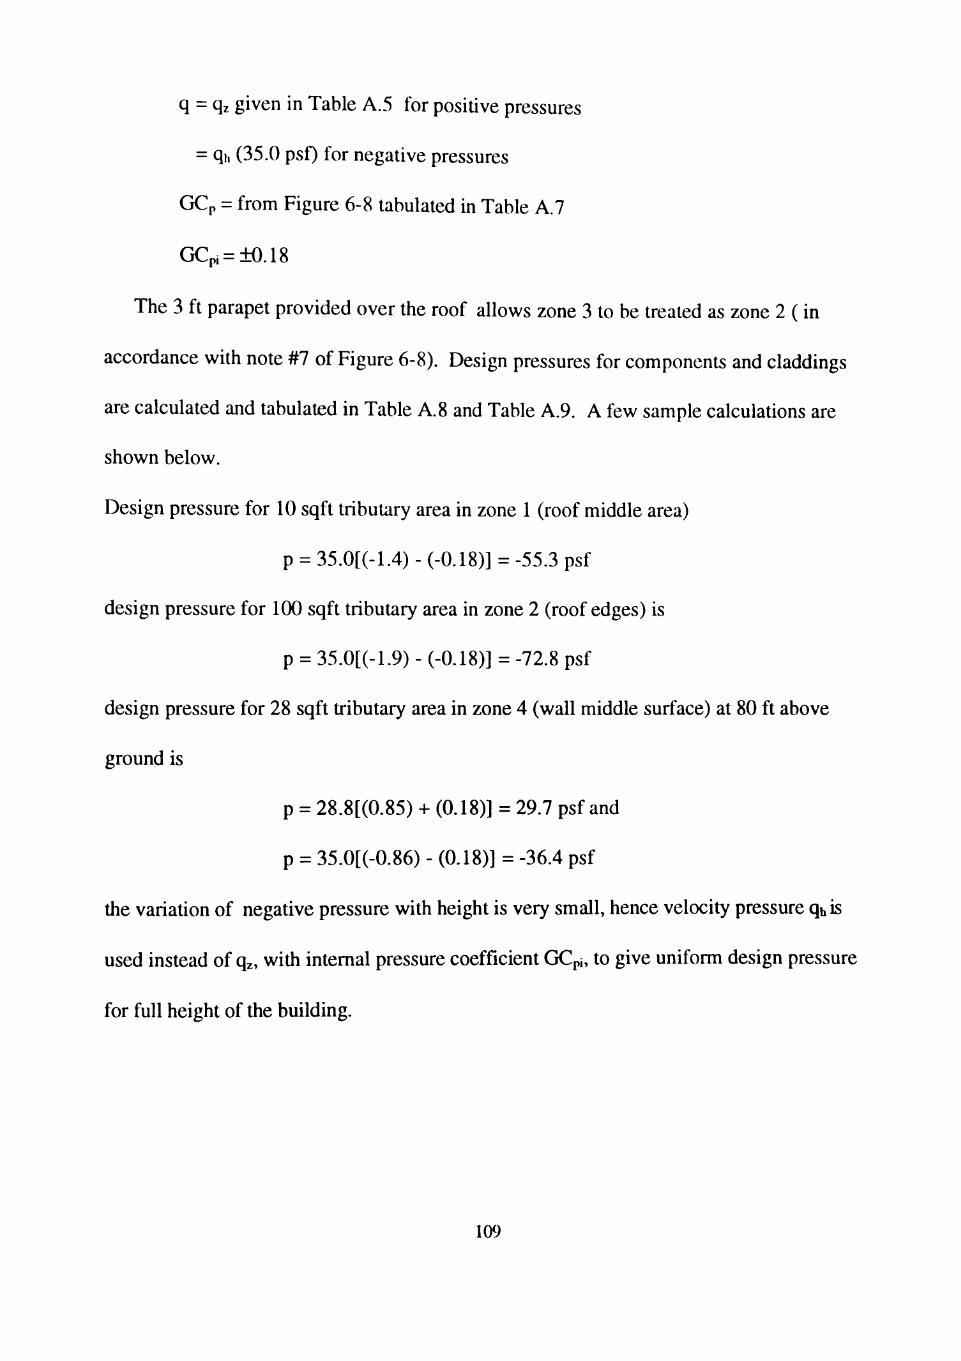
q = qz given in Table A.5 for positive pressures
= qi, (35.0 psO for negative pressures
GCp = from Figure 6-8 tabulated in Table A.7
GCpi = ±0.18
The 3 ft parapet provided over the roof allows zone 3 to be treated as zone 2 (in
accordance with note #7 of Figure 6-8). Design pressures for components and claddings
are calculated and tabulated in Table A.8 and Table A.9. A few sample calculations are
shown below.
Design pressure for 10 sqft tribuUiry area in zone 1 (roof middle area)
p = 35.0[(-1.4) - (-0.18)] = -55.3 psf
design pressure for 100 sqft tributary area in zone 2 (roof edges) is
p = 35.0[(-1.9) - (-0.18)] = -72.8 psf
design pressure for 28 sqft tributary area in zone 4 (wall middle surface) at 80 ft above
ground is
p = 28.8[(0.85) + (0.18)] = 29.7 psf and
p = 35.0[(-0.86) - (0.18)] = -36.4 psf
the variation of negative pressure with height is very small, hence velocity pressure qh is
used instead of qz, with intemal pressure coefficient GCpi, to give uniform design pressure
for full height of the building.
109
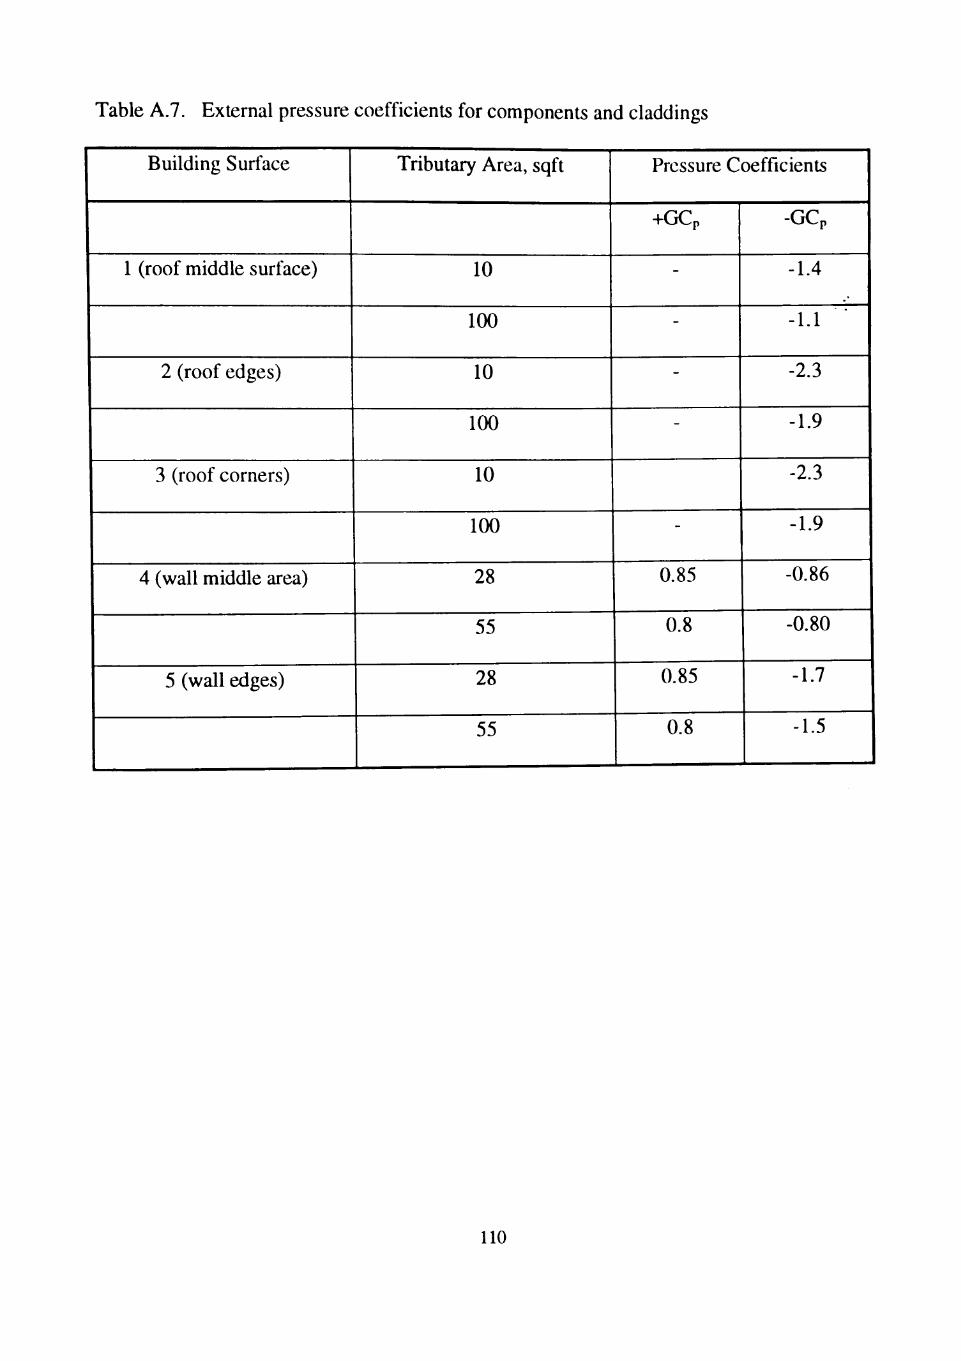
Table A.7. External pressure coefficients for components and claddings
Building Surface
1 (roof middle surface)
2 (roof edges)
3 (roof corners)
4 (wall middle area)
5 (wall edges)
Tributary Area, sqft
10
100
10
100
10
100
28
55
28
55
Pressure Coefficients
+GCp
-
-
-
-
-
0.85
0.8
0.85
0.8
-GCp
-1.4
-1.1
-2.3
-1.9
-2.3
-1.9
-0.86
-0.80
-1.7
-1.5
110
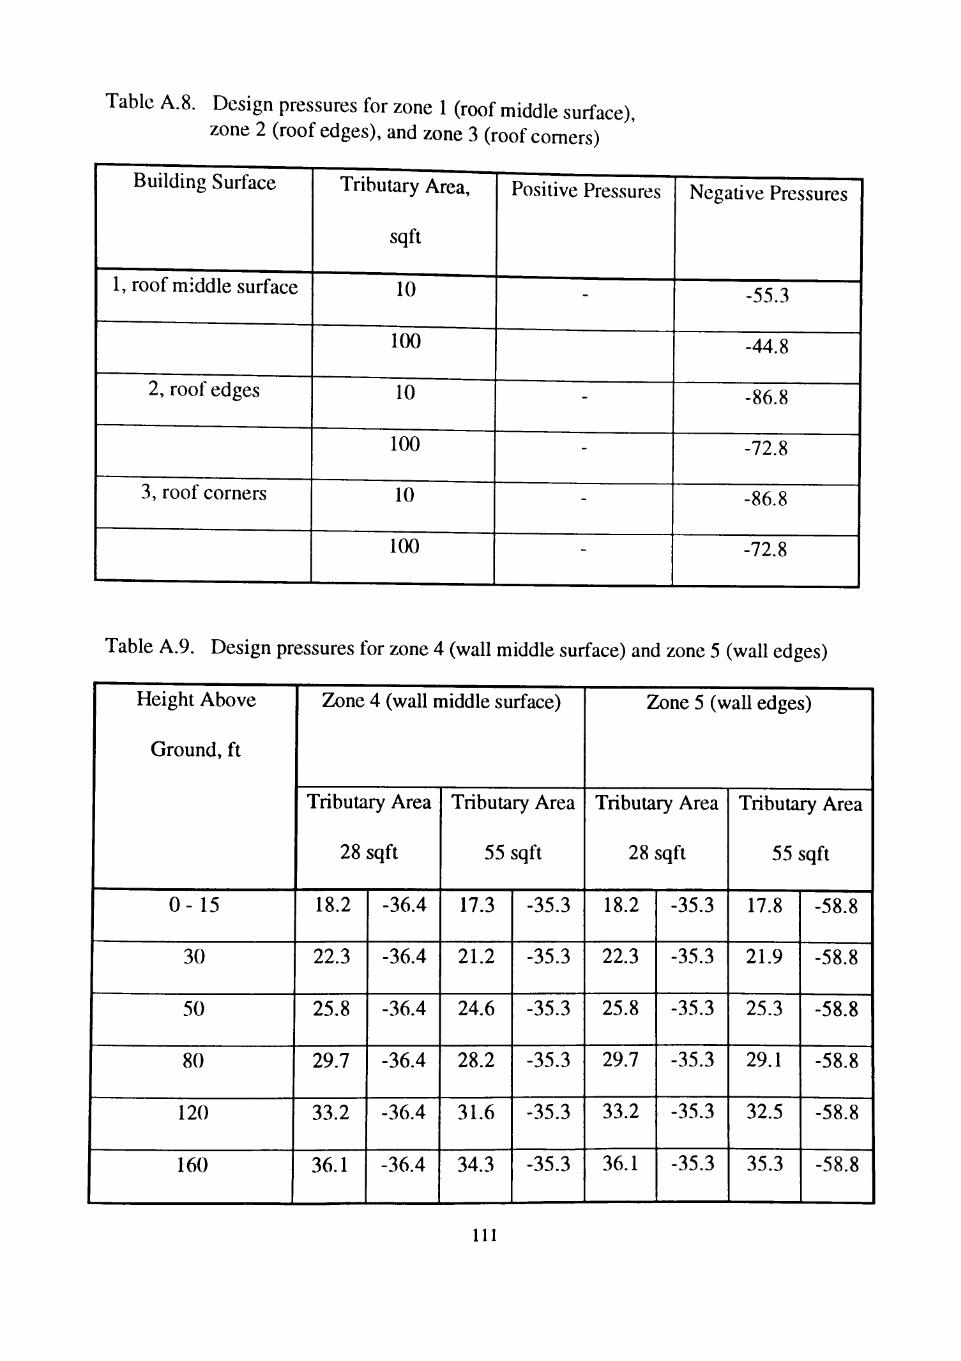
Table A.8. Design pressures for zone 1 (roof middle surf-ace), zone 2 (roof edges), and zone 3 (roof comers)
Building Surface
1, roof middle surface
2, roof edges
3, roof corners
Tributary Area,
sqft
10
100
10
100
10
100
Positive Pressures
-
-
-
-
-
Negative Pressures
-55.3
-44.8
-86.8
-72.8
-86.8
-72.8
Table A.9. Design pressures for zone 4 (wall middle surface) and zone 5 (wall edges)
Height Above
Ground, ft
0 - 15
30
50
80
120
160
Zone 4 (wall middle surface)
Tributary Area
28 sqft
18.2
22.3
25.8
29.7
33.2
36.1
-36.4
-36.4
-36.4
-36.4
-36.4
-36.4
Tributary Area
55 sqft
17.3
21.2
24.6
28.2
31.6
34.3
-35.3
-35.3
-35.3
-35.3
-35.3
-35.3
Zone 5 (waU edges)
Tributary Area
28 sqft
18.2
22.3
25.8
29.7
33.2
36.1
-35.3
-35.3
-35.3
-35.3
-35.3
-35.3
Tributary Area
55 sqft
17.8
21.9
25.3
29.1
32.5
35.3
-58.8
-58.8
-58.8
-58.8
-58.8
-58.8
111
APPENDIX B
CALCULATIONS USING AUSTRALIAN STANDARD
This appendix contains the wind pressure calculations using the Australian standard.
Wind pressure calculations for the 160 ft building follow the wind pressure calculations for
the low building. The references cited herein regarding sections, tables, and figures, belong
to the Australian standard.
112
B.l Low Building
The simplified procedure given in section 2 yields greater loads than loads calculated
using the detailed procedure given in section 3. In order to make a dependable
comparison, the detailed procedure is used in the following compuUitions. Australian
standard defines three basic gust wind speeds for each region in Australia; namely,
serviceabihty limit states gust wind speed, Vs, ultimate limit states gust wind speed, Vu,
and permissible or working sUess gust wind speed, Vp. Each type of gust wind speed is
associated with a specific retum period or mean recurrence interval. The permissible
stress gust wind speed Vp is a 3-second gust speed at 10 m height in open terrain
associated with a 50 year mean recurrence interval, which is similar to the basic wind
speed used in the American standard. Hence, the 110 mph (49 m/s) basic wind speed used
in the wind load calculations using American standard is applicable for the computations
using Australian standard. The building is assumed to be located in a sub-urban area;
therefore. Terrain Category 3 is chosen for the following calculations. Terrain Category 3
is equivalent to the Exposure Category B in the American standard.
The design gust wind speed Vz, assumed constant in any wind direction, is given by
Vz = VM(z.cat)MsMtMi.
Basic wind speed V: 49 m/s (permissible sU-ess gust wind speed)
Terrain and stmcture height multiplier M(z:4.57.cat:3) :0.75 (from Table 3.2.5.1)
Shielding multiplier, Ms:
As the parameters (average spacing, height and breadth of shielding buildings) involved
in the calculation of building spacing parameter D are not defined, an average value of
113
0.85 (typically used for AusU-alian suburbs) is used (section E3.2.7).
Topographic multipher, Mt:
As the building falls outside the local topographic zone M,= 1.00 (section 3.2.8).
Stmcture importance multiplier. Mi:
1.00, since the present building comes under normal class of structure (from Table
3.2.9).
The design gust wind speed Vz = 49(0.75)(0.85)(1.00)(1.00) = 31.24 m/s.
Design Pressures for the Main Wind-Force Resisting System:
The velocity pressure or the dynamic wind pressure qz is given by
q, = 0.0006V ' = 0.0006(31.24)^ = 0.585 kpa = 12.23 psf
The design wind pressure p for the main wind force resisting system is given by the
equation
p = qzKCpeKaKp)]
Extemal pressure coefficient Cpc : 0.7 for windward wall (Table 3.4.3.1)
: -0.5 for leeward waU with d/b ratio = 60 ft/100 ft
= 0.6<1 (Table 3.4.3.1(B))
: for roofs -0.9 for a distance of 0 - 15 ft from
windward edge
-0.5 for 15 ft - 30 ft from windward edge
-0.3 for 30 ft - 45 ft from windward edge
-0.2 for 45 ft - 60 ft from windward edge
Internal pressure coefficient, Cpi : condition 3 (openings of equal area on all walls) is
114
an appropriate choice for the present building which
gives mtemal pressure as -0.3 or 0.0 (whichever is
more severe) for combined loading
Area reduction factor, Ka: 1.00 for windward, leeward and side waUs (section
3.4.4)
Reduction factor for porous claddings Kp: 1.00 (assumed)
The design pressures for the windward wall is
P = 12.23[(0.7)(1.00)(1.00)] = 8.6 psf
The design pressure for the leeward wall is
p = 12.23[(-0.5)(1.00)(1.00)] = -6.1 psf
The calculated design wind pressures for the roof are tabulated in Table B.l.
Base shear and over tuming moment for the entire building:
Base shear:
= [8.6(15)(100) -I- 6.1(15)(100)] / 1000 = 22.1 kips
Overtuming moment:
= [8.6(15)(7.5)(100) -I- 11(15)(52.5)(100) + 6.11(15)(100)(37.5) -i-
3.67(15)(100)(22.5) + 2.44(15)(100)(7.5) -f 6.1(15)(100)(7.5)] / 1000
= 1526.6 ft-kips
Roof uphft:
= 15(100)[11+6.1+3.1 + 2.44] / 1000 = 34.9 kips
Design Wind Pressures for Components and Claddings:
In the Australian standard, pressures on the components and claddings are defined as
115
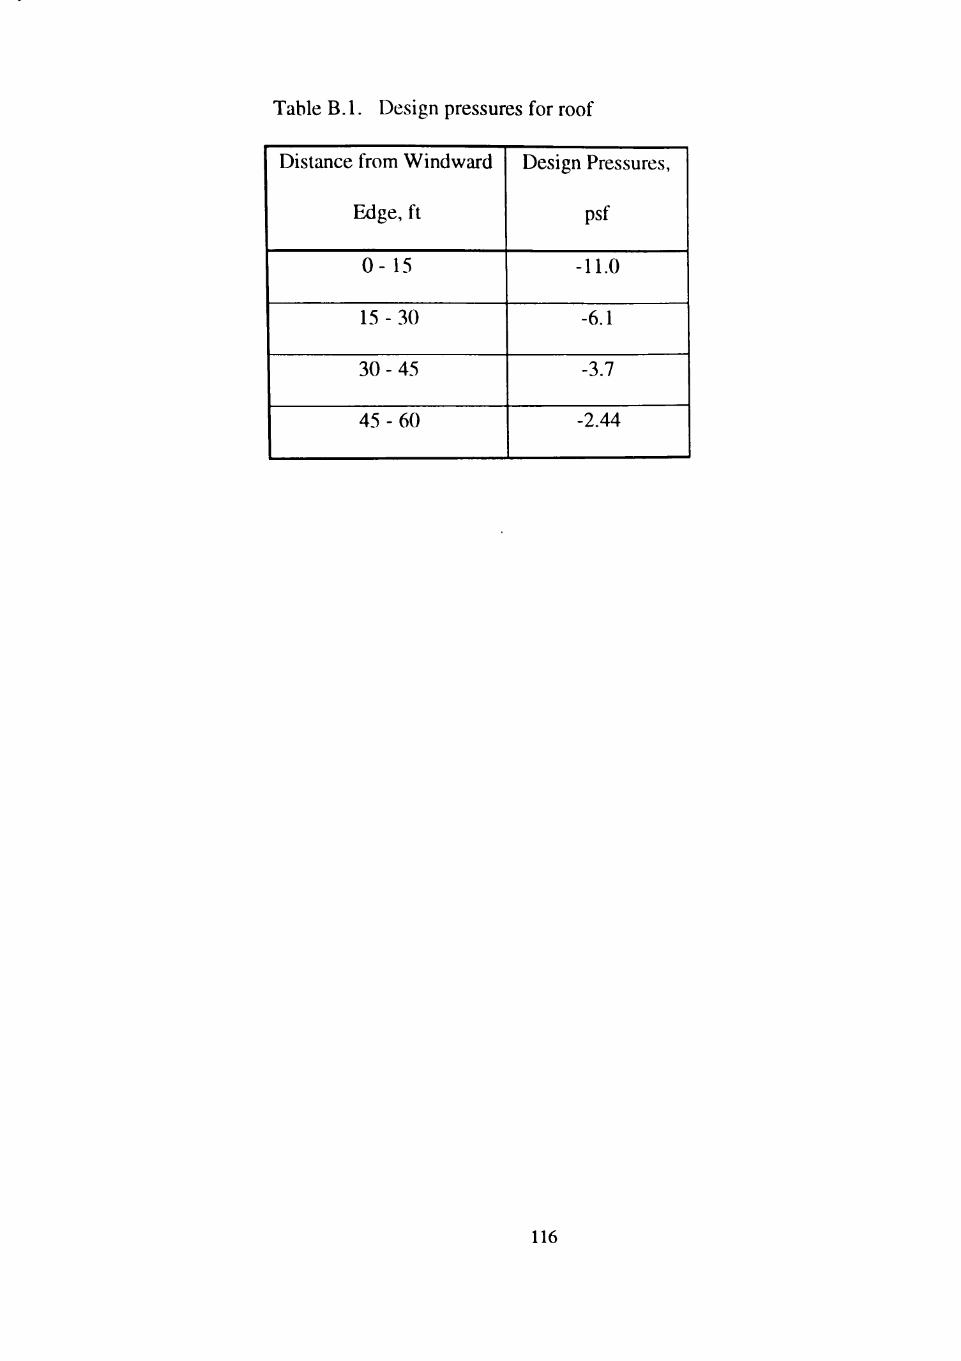
Table B.l. Design pressures for roof
Distance from Windward
Edge, ft
0 - 15
15 - 30
30 - 45
45 - 60
Design Pressures,
psf
-11.0
-6.1
-3.7
-2.44
116
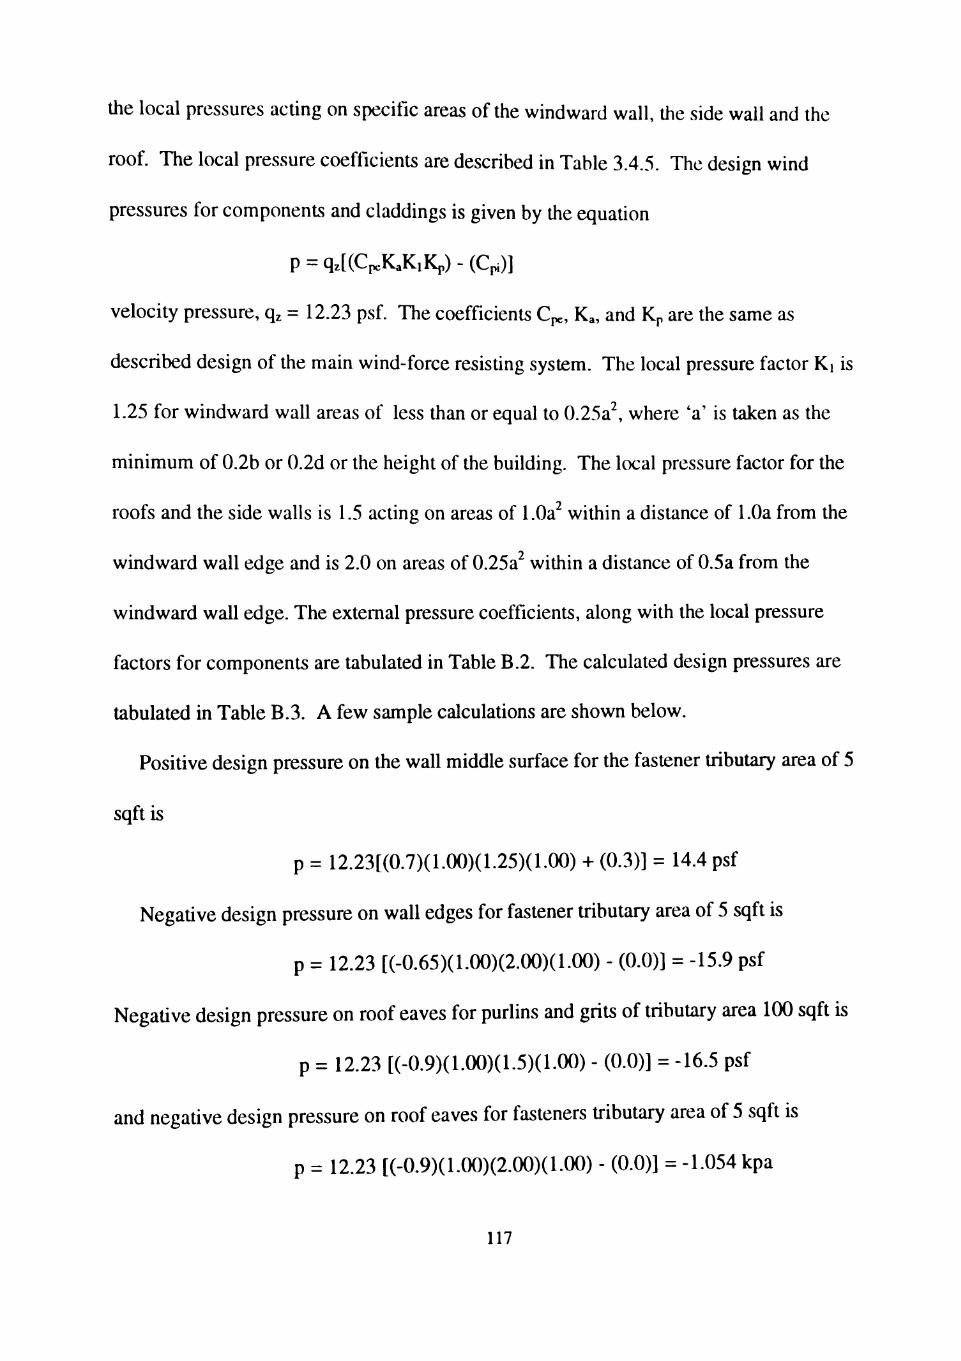
the local pressures acting on specific areas of the windward wall, the side wall and the
roof The local pressure coefficients are described in Table 3.4.5. The design wind
pressures for components and claddings is given by the equation
P = qz[(Cp.KaK,Kp) - (Cp.)]
velocity pressure, qz = 12.23 psf The coefficients Cpe, Ka, and Kp are the same as
described design of the main wind-force resisting system. The local pressure factor Ki is
1.25 for windward wall areas of less than or equal to 0.25a^, where 'a' is taken as the
minimum of 0.2b or 0.2d or the height of the building. The local pressure factor for the
roofs and the side walls is 1.5 acting on areas of l.Oa within a distance of 1.0a from the
windward wall edge and is 2.0 on areas of 0.25a within a distance of 0.5a from the
windward wall edge. The extemal pressure coefficients, along with the local pressure
factors for components are tabulated in Table B.2. The calculated design pressures are
tabulated in Table B.3. A few sample calculations are shown below.
Positive design pressure on the wall middle surface for the fastener tributary area of 5
sqft is
p = 12.23[(0.7)(1.00)(1.25)(1.00) + (0.3)] = 14.4 psf
Negative design pressure on wall edges for fastener tributary area of 5 sqft is
p = 12.23 [(-0.65)(1.00)(2.00)(1.00) - (0.0)] = -15.9 psf
Negative design pressure on roof eaves for puriins and grits of tribuUry area 100 sqft is
p = 12.23 [(-0.9)(1.00)(1.5)(1.00) - (0.0)] = -16.5 psf
and negative design pressure on roof eaves for fasteners u-ibutary area of 5 sqft is
p = 12.23 [(-0.9)(1.00)(2.00)(1.00) - (0.0)] = -1.054 kpa
117
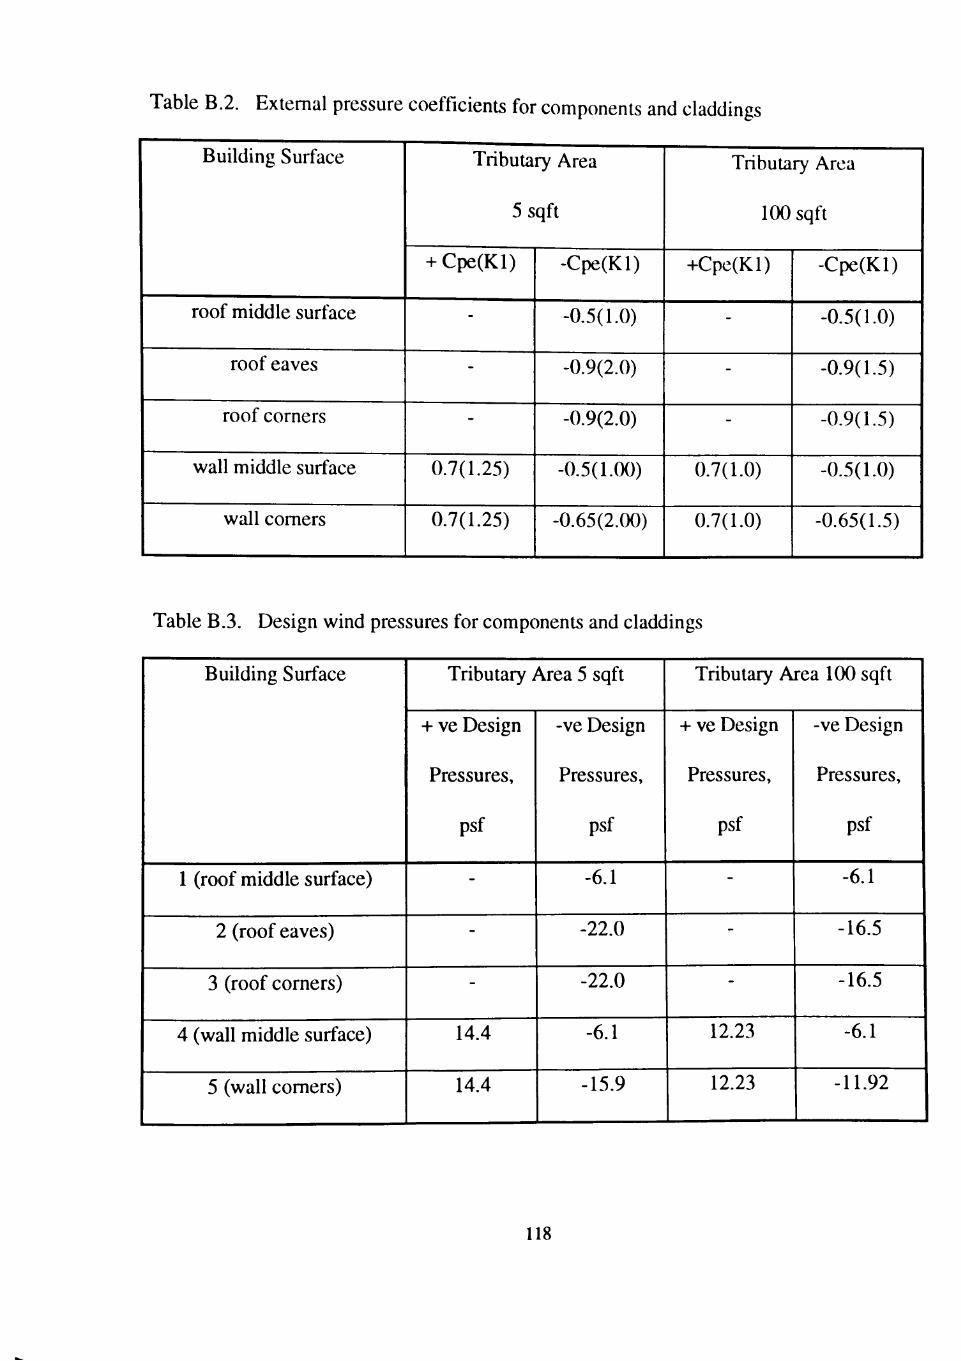
Table B.2. Extemal pressure coefficients for components and claddings
Building Surface
roof middle surface
roof eaves
roof corners
wall middle surface
wall comers
Tributary Area
5 sqft
+ Cpe(Kl)
-
-
-
0.7(1.25)
0.7(1.25)
-Cpe(Kl)
-0.5(1.0)
-0.9(2.0)
-0.9(2.0)
-0.5(1.00)
-0.65(2.00)
Tributary Area
100 sqft
-hCpe(Kl)
-
-
-
0.7(1.0)
0.7(1.0)
-Cpe(Kl)
-0.5(1.0)
-0.9(1.5)
-0.9(1.5)
-0.5(1.0)
-0.65(1.5)
Table B.3. Design wind pressures for components and claddings
Building Surface
1 (roof middle surface)
2 (roof eaves)
3 (roof corners)
4 (wall middle surface)
5 (wall comers)
Tributary Area 5 sqft
+ ve Design
Pressures,
psf
-
-
-
14.4
14.4
-ve Design
Pressures,
psf
-6.1
-22.0
-22.0
-6.1
-15.9
Tributary Area 1(X) sqft
+ ve Design
Pressures,
psf
-
-
-
12.23
12.23
-ve Design
Pressures,
psf
-6.1
-16.5
-16.5
-6.1
-11.92
118
B.2 160 ft Building
Dimension: 100 ft (30.5 m) x 200 ft (61 m) x 160 ft (48.8 m)
The basic wind speed, Vp, and the terrain category are the same for the office building
as for the low building. Summarizing the values again
Basic wind speed Vp : 49 m/s
Terrain category : 3 (suburban terrain)
The design gust wind speed Vz is given by the equation:
Vz = VM(z,cat)MsM.M.,
the terrain and stmcture height multiplier, M(z,cat: 3) obtained from Table 3.2.5.1 is
tabulated in Table B.4. As explained in the case of the low building, an average value of
0.85 is taken as shielding multiplier, Ms, for Australian suburbs. The stmcture falls outside
the local topographic zone, making the topographic multiplier, Mt = 1.00. The 160 ft
building considered here is a normal structure. The stmcture importance multiplier. Mi =
l.(X) is taken from Table 3.2.9. The computed design gust wind speeds for the
corresponding heights above ground are tabulated in Table B.4. The velocity pressure qz
is given by the equation:
q^= 0.0006 V ^
where Vz is the design gust wind speed. The calculated velocity pressures in psf for the
respective heights above ground are tabulated in Table B.4.
Design Pressures for the Main Wind-Force Resisting System:
The design wind pressures for the main wind force resisting system is given by the equation:
119
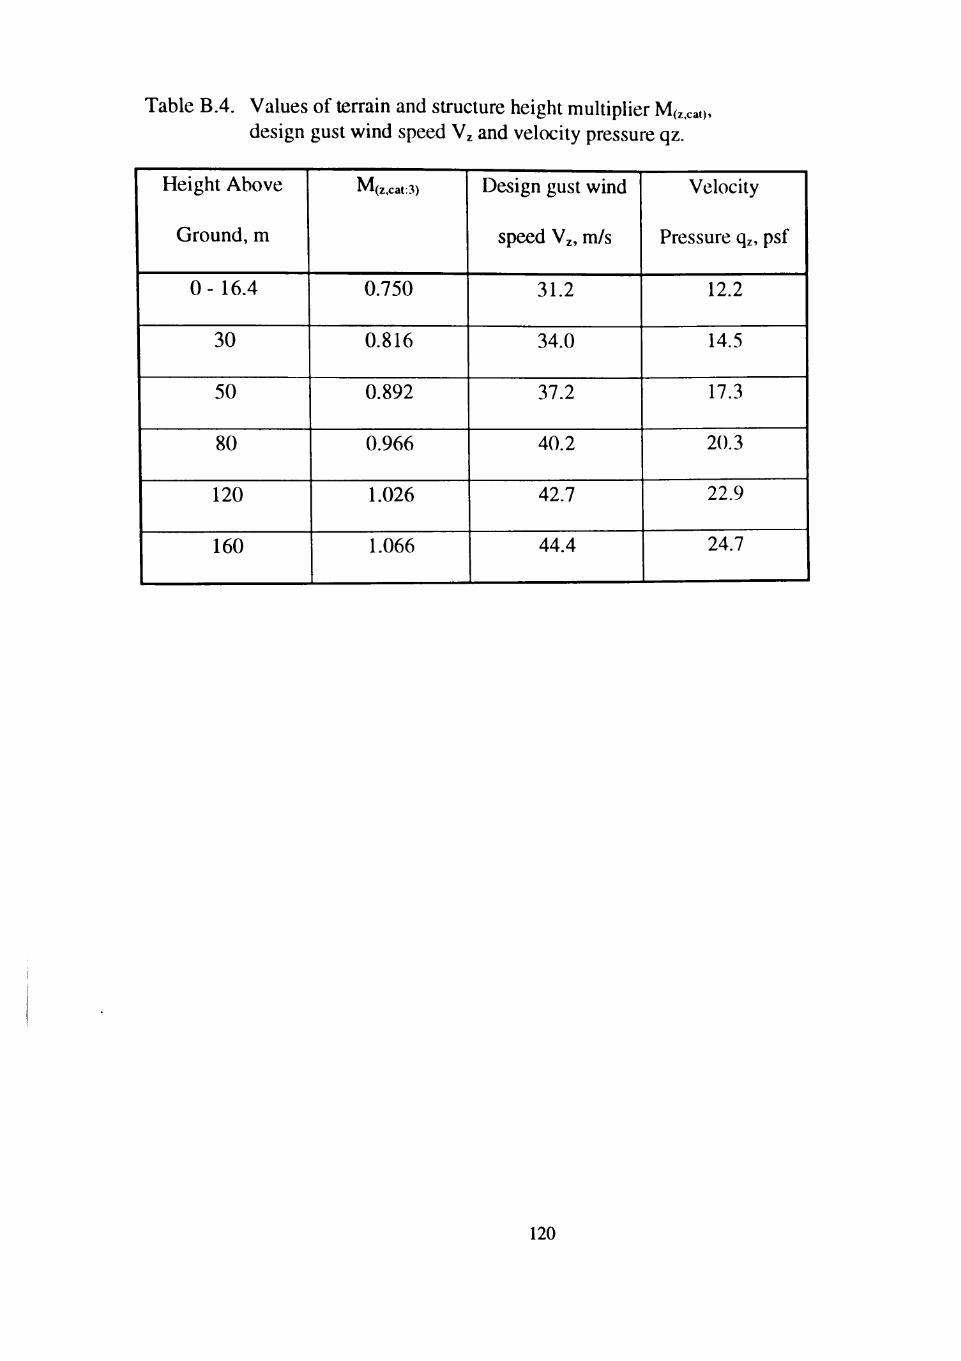
Table B.4. Values of terrain and sUucture height multiplier M(z,cai), design gust wind speed Vz and velocity pressure qz.
Height Above
Ground, m
0 - 16.4
30
50
80
120
160
M(z,cat:3)
0.750
0.816
0.892
0.966
1.026
1.066
Design gust wind
speed Vz, m/s
31.2
34.0
37.2
40.2
42.7
44.4
Velocity
Pressure qz, psf
12.2
14.5
17.3
20.3
22.9
24.7
120
p = qz[(Cp.KaKp)],
the area reducfion factor Ka, and the reduction factor Kp for porous claddings, are uiken as
equal to 1.00.
External pressure coefficients, Cpe:
Wind ward wall: 0.80 for wind parallel to 100 ft or 200 ft side,
(Table 3.4.3.1(A)) with qz
Leeward waU: -0.3 for wind parallel to 200 ft side (d/b = 2.0, Table
3.4.3.1(B)) with q„
-0.5 for wind parallel to 100 ft side (d/b = 0.5) with qh
Calculated values of design windward wall pressures are tabulated in Table B.5. The
windward wall pressures are the same when the wind is parallel to the 100 ft and the 200
ft side. The design leeward wall pressure when the wind is normal to the 100 ft side is:
p = 24.7(-0.3)(1.00)(1.00) = -7.4 psf, and
when the wind is parallel to the 30.5 m side
p = 24.7(-0.5)(1.00)(1.00) = -12.4 psf
Base shear and overtuming moment for the entire building when the wind is parallel to the
100 ft side:
Base shear:
= [200(9.8(16.4)-h-(143.6)(9.8-h 19.8)-h 12.4(160))]/1000 = 854 kips
Overtuming moment:
121
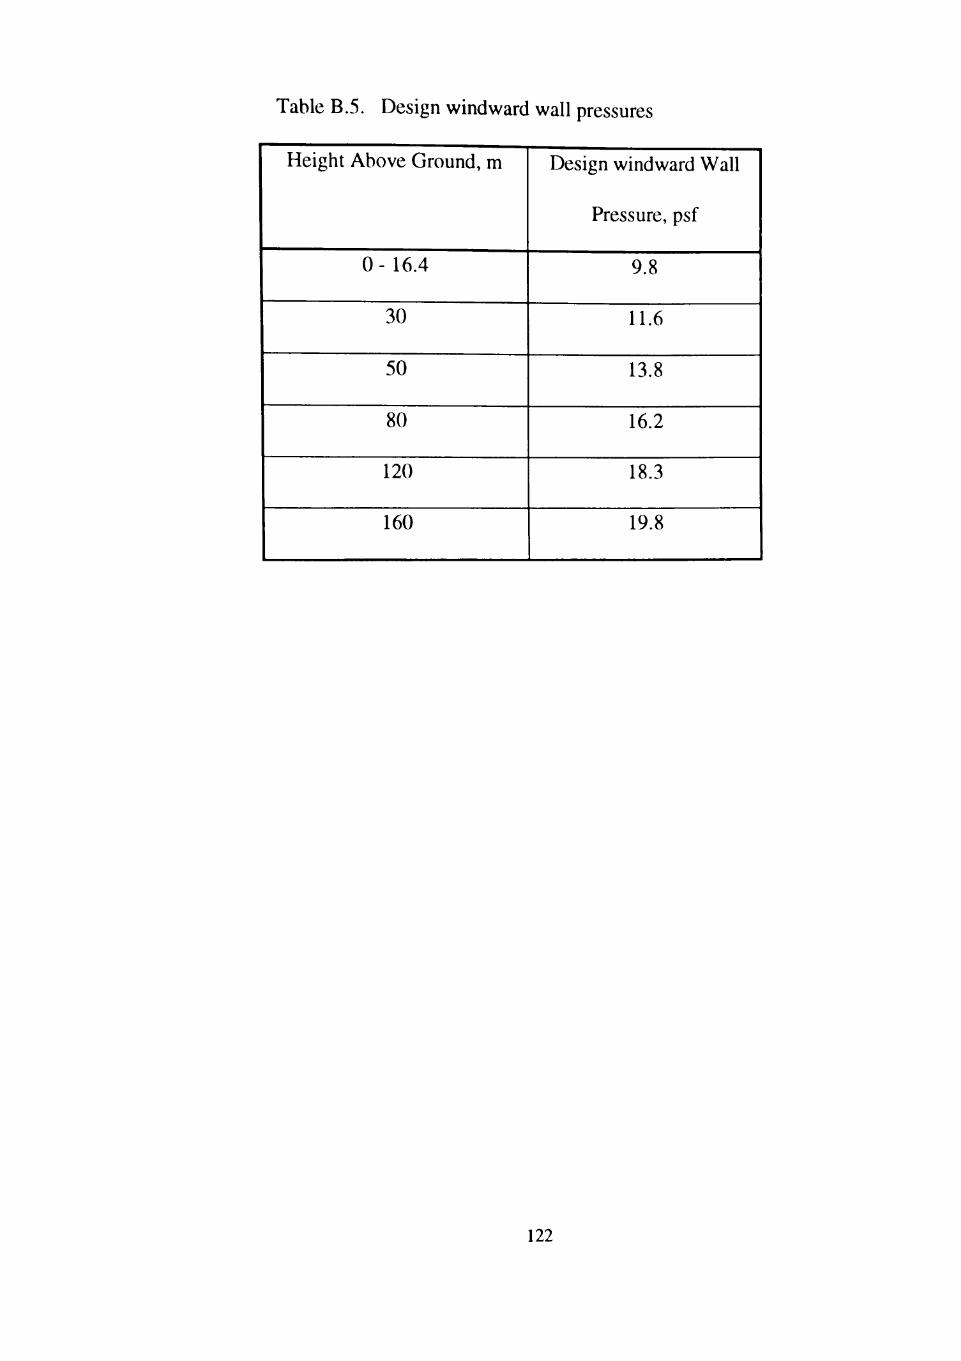
Table B.5. Design windward wall pressures
Height Above Ground, m
0- 16.4
30
50
80
120
160
Design windward Wall
Pressure, psf
9.8
11.6
13.8
16.2
18.3
19.8
122
= [200(9.8(160)(80) +^(143.6)(10.0)(16.4 + 95.7) +12.4(160)(80) + 32.1(80)(60) +
17.3(20)(10))]/1000
= 10.4 X 10' ft-kips
Roof uphft:
= 2OO[32.1(80) + 17.3(20)] /1000 = 582.8 kips
Base shear and over tuming moment when the wind is parallel to the 200 ft side:
Base shear:
= [100(9.8(16.4) +i(i43.6)(9.8 -f 19.8) + 7.4(160))] / 1000 = 347 kips
Overtuming moment:
= [100(9.8(160)(80) 4--(143.6)(10.0)(16.4 + 95.7)-h7.4(160)(80) + 28.2(80)(160) +
19.3(80)(80) -f 15.3(40)(20))] /lOOO
= 8.0 X 10' ft-kips
Roof uphft:
= 100[28.2(80) -f 19.3(80) + 15.3(40)] / 1000 = 441.2 kips
Design Pressures for Components and Claddings:
The local pressure acting on the windward wall, side wall and roof is given by the
equation
p = qh[(CpeKaKiKp)-(Cpi)]
the extemal pressure coefficient for the windward wall is 0.8. For the leeward wall,
external pressure coefficient is taken as -0.3 for wind normal to 30.5 m side and -0.5 for
123
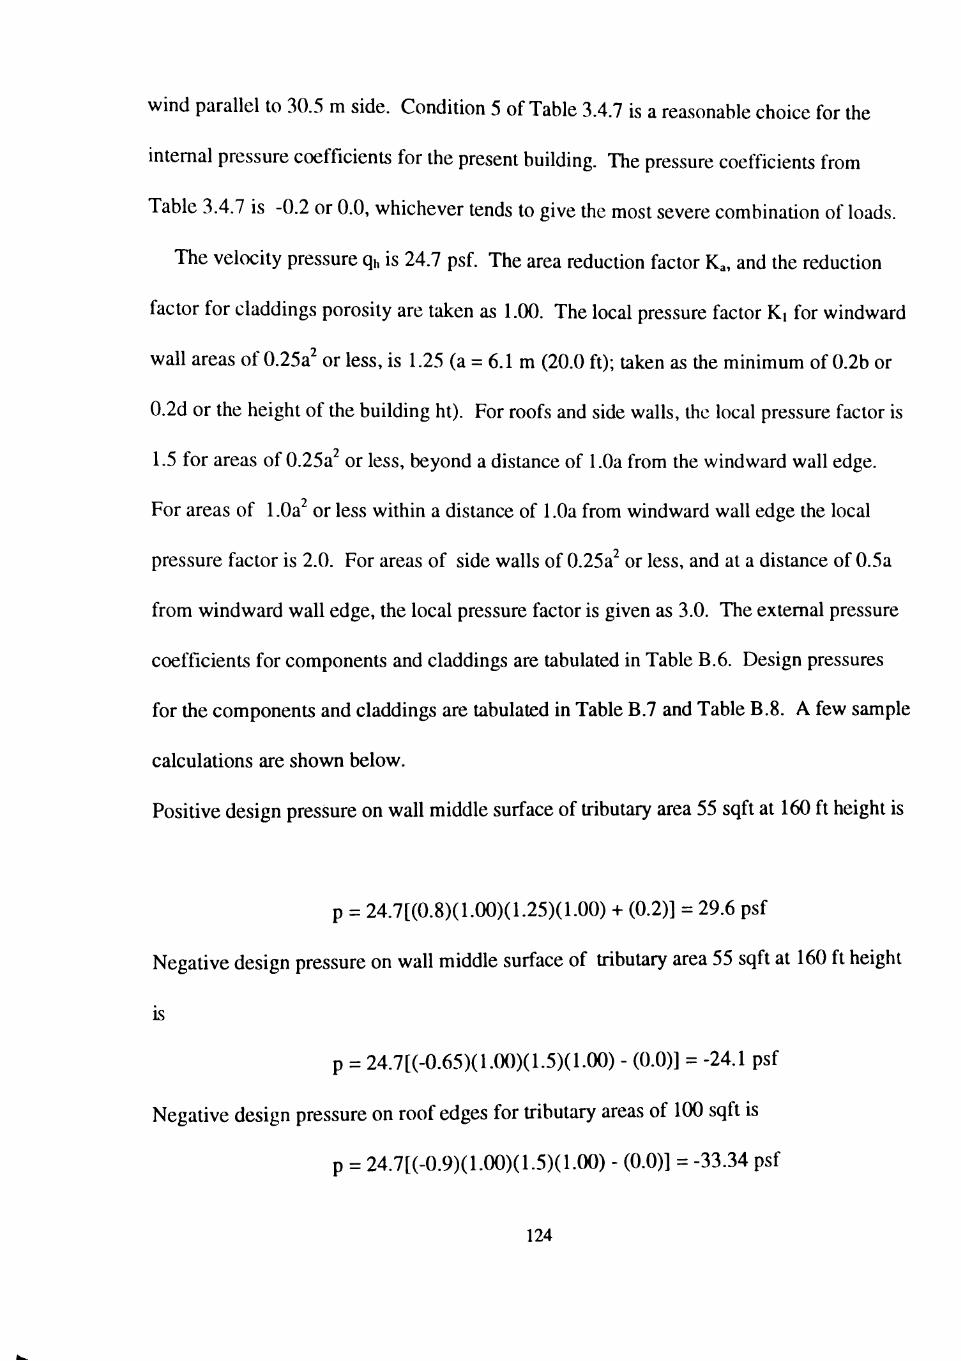
wind parallel to 30.5 m side. Condition 5 of Table 3.4.7 is a reasonable choice for the
intemal pressure coefficients for the present building. The pressure coefficients from
Table 3.4.7 is -0.2 or 0.0, whichever tends to give the most severe combination of loads.
The velocity pressure q,, is 24.7 psf The area reduction factor Ka, and the reduction
factor for claddings porosity are taken as 1.00. The local pressure factor Ki for windward
wall areas of 0.25a^ or less, is 1.25 (a = 6.1 m (20.0 ft); taken as the minimum of 0.2b or
0.2d or the height of the building ht). For roofs and side walls, the local pressure factor is
1.5 for areas of 0.25a^ or less, beyond a distance of 1.0a from the windward wall edge.
For areas of 1 .Oa or less within a distance of 1 .Oa from windward wall edge the local
pressure factor is 2.0. For areas of side walls of 0.25a^ or less, and at a distance of 0.5a
from windward wall edge, the local pressure factor is given as 3.0. The extemal pressure
coefficients for components and claddings are tabulated in Table B.6. Design pressures
for the components and claddings are tabulated in Table B.7 and Table B.8. A few sample
calculations are shown below.
Positive design pressure on wall middle surface of Uibutary area 55 sqft at 160 ft height is
p = 24.7[(0.8)(1.00)(1.25)(1.00) + (0.2)] = 29.6 psf
Negative design pressure on wall middle surface of Uibutary area 55 sqft at 160 ft height
IS
p = 24.7[(-0.65)(1.00)(1.5)(1.00) - (0.0)] = -24.1 psf
Negative design pressure on roof edges for u-ibutary areas of 100 sqft is
p = 24.7[(-0.9)(1.00)(1.5)(1.00) - (0.0)] = -33.34 psf
124
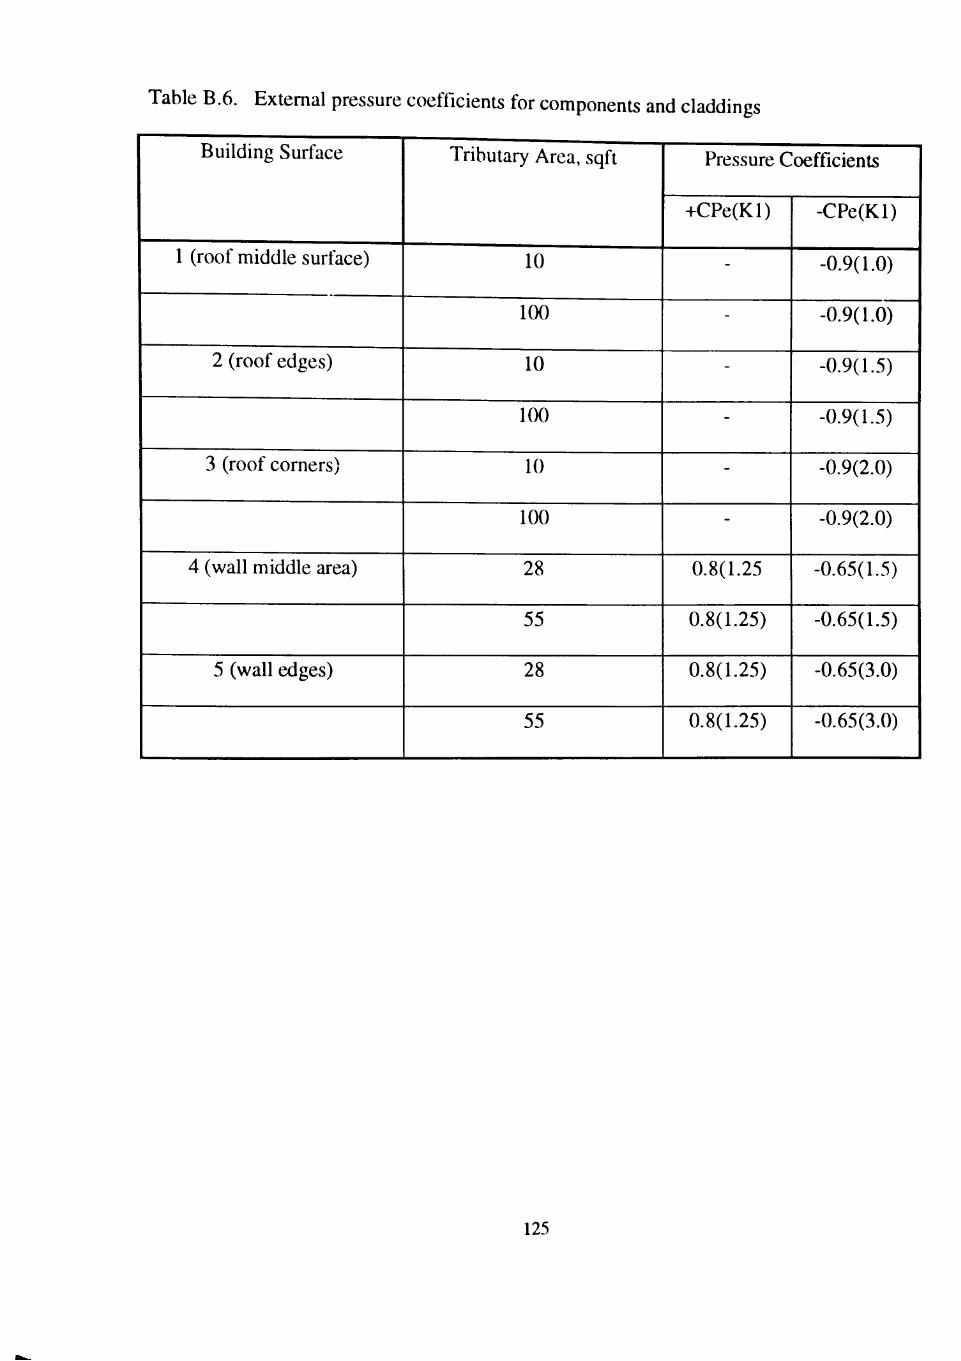
Table B.6. Extemal pressure coefficients for components and claddings
Building Surface
1 (roof middle surface)
2 (roof edges)
3 (roof corners)
4 (wall middle area)
5 (wall edges)
Tributary Area, sqft
10
100
10
100
10
100
28
55
28
55
Pressure Coefficients
-i-CPe(Kl)
-
-
-
-
-
-
0.8(1.25
0.8(1.25)
0.8(1.25)
0.8(1.25)
-CPe(Kl)
-0.9(1.0)
-0.9(1.0)
-0.9(1.5)
-0.9(1.5)
-0.9(2.0)
-0.9(2.0)
-0.65(1.5)
-0.65(1.5)
-0.65(3.0)
-0.65(3.0)
125
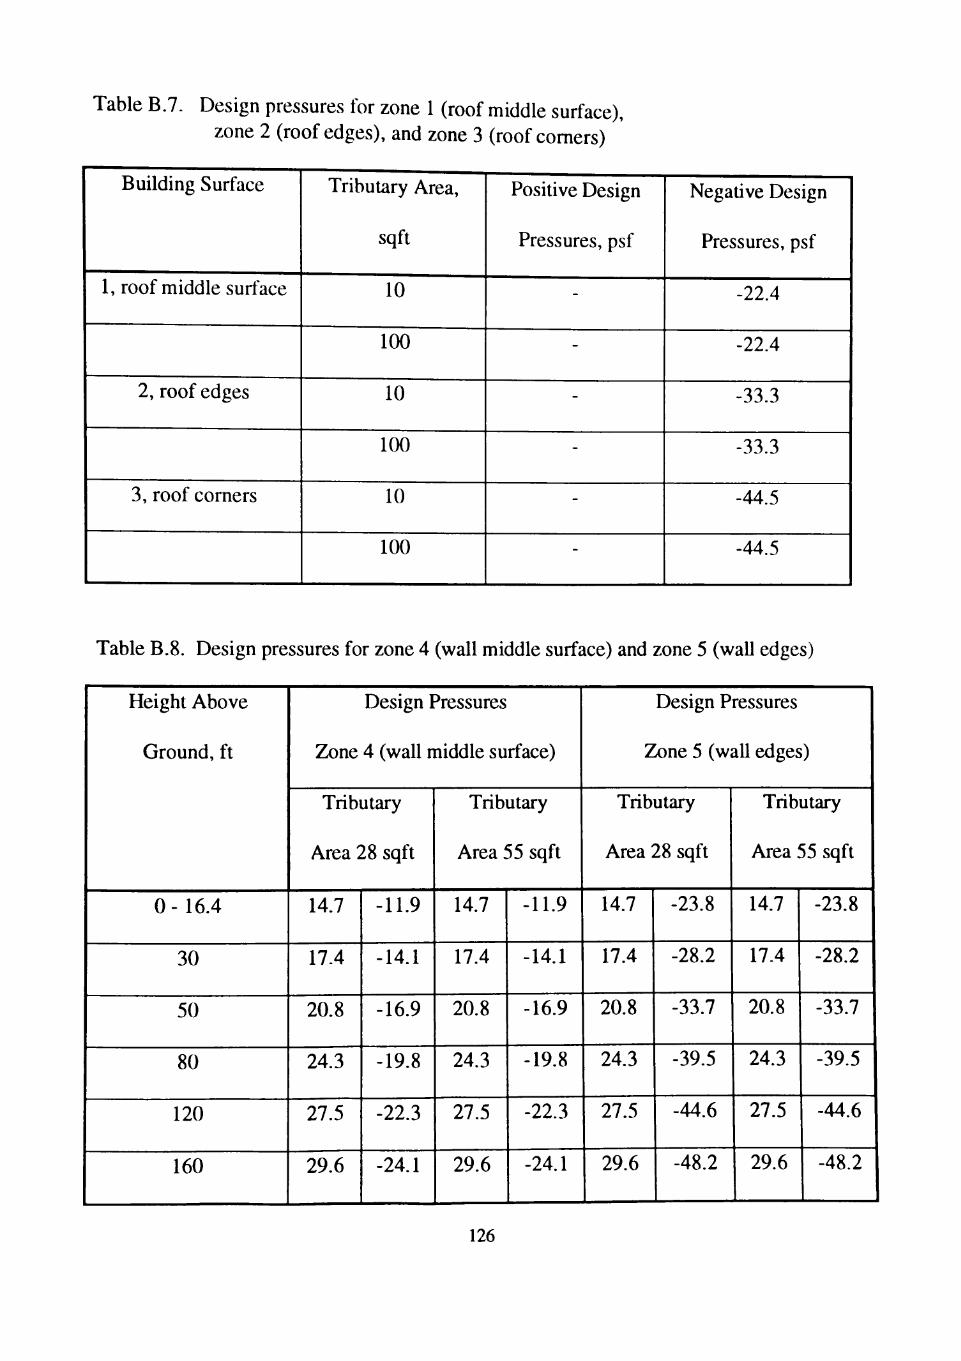
Table B.7. Design pressures for zone 1 (roof middle surface), zone 2 (roof edges), and zone 3 (roof comers)
Building Surface
1, roof middle surt'ace
2, roof edges
3, roof corners
Tributary Area,
sqft
10
100
10
100
10
100
Positive Design
Pressures, psf
-
-
-
-
-
-
Negative Design
Pressures, psf
^22.4
-22.4
-33.3
-33.3
-44.5
-44.5
Table B.S. Design pressures for zone 4 (wall middle surface) and zone 5 (wall edges)
Height Above
Ground, ft
0-16.4
30
50
80
120
160
Design Pressures
Zone 4 (wall middle surface)
Tributary
Area 28 sqft
14.7
17.4
20.8
24.3
27.5
29.6
-11.9
-14.1
-16.9
-19.8
-22.3
-24.1
Tributary
Area 55 sqft
14.7
17.4
20.8
24.3
27.5
29.6
-11.9
-14.1
-16.9
-19.8
-22.3
-24.1
Design Pressures
Zone 5 (waU edges)
Tributary
Area 28 sqft
14.7
17.4
20.8
24.3
27.5
29.6
-23.8
-28.2
-33.7
-39.5
-44.6
-48.2
Tributary
Area 55 sqft
14.7
17.4
20.8
24.3
27.5
29.6
-23.8
-28.2
-33.7
-39.5
-44.6
-48.2
126
Negative design pressure on roof comers for tributary areas of 100 sqft is
p = 24.7[(-0.9)(1.00)(2.0)(1.00) - (0.0)] = -44.5 psf
127
APPENDIX C
CALCULATIONS USING BRFFISH STANDARD
This appendix contains the wind pressure calculations using the British standard. Wind
pressure calculations for the 160 ft building follow the wind pressure calculations for the
low building. The references cited herein regarding sections, tables, and figures, belong to
the British standard.
128
c . l Low Building
The basic wind speed used in the British standard is a mean houriy wind speed,
measured at 10 m height in open flat terrain with an annual probability of occurrence of
0.02. The equivalent mean houriy wind speed for the 110 mph (49 m/s) 3-second gust
wind speed used in the American standard is 72.7 mph (32.4 m/s). The equivalent
suburban terrain category of exposure B used in the American standard is town category
in the British standard. The basic wind speed, Vb of 32.4 m/s is modified by following
four factors to give the site wind speed Vs.
Altitude factor Sa: a value of 1.00 is assumed based on the following conditions
(a) the building falls outside the local topographic zone
(b) the site altitude A* is not defined (section 5.2.2.2)
Direction factor Sa: l.(X), since the building orientation is ignored (section 5.2.3)
Seasonal factor Ss: 1.00, since the present building is a permanent construction
(section 5.2.4.2).
Probability factor Sp: l.(X), since the annual probability is not changed from the standard
value of 0.02 (section 5.2.5.1).
From the above factors the site wind speed is calculated as
Vs = (32.4)(1.00)(1.00)(1.00)(1.00) = 32.4 m/s.
The effective wind speed Vc is given by the equation:
Ve = Vs(Sb)
from Table 4, for town terrain Sb is 1.352 with effective height He = 4.57 m and 64.4 km
(40 miles) away from sea.
129
Ve = (32.4)(1.352) = 43.8 m/s
The velocity or dynamic pressure is given by the equation:
q, = 0.613V, = 0.613(43.8)^ = 1176 pa = 24.6 psf
Design Pressures on the Main Wind-Force Resisting System:
The design pressure on the main wind-force resisting system is given by the equation:
P = q-s[(CpeCa)]
External pressure coefficients:
windward wall: 0.6 for D/H = 60 ft / 15 ft = 4, where D is the dimension of
the building parallel to wind duection and H is the height of the
stmcture.
leeward waU: -0.1 for D/H = 60 ft / 15 ft = 4
roof: -2.0 for zone A
-1.4 for zone B
-0.7 for Zone C
±0.2 for zone D
Size effect factor for extemal pressures:
windward and leeward walls: 0.84 for diagonal dimension of 30.84 m of windward
and leeward wall (Figure 4)
roofs: 0.82 for diagonal dimension of 35.56 m (Figure 4).
Intemal pressure coefficients: values of -0.3 or -1-0.2 given in clause 9.1.2 is an appropriate
choice for the present building.
Size effect factor for internal pressure: diagonal dimension 'a' for the intemal pressure is
130
a = 10[y (internal volume of room)]
= 137m
from Figure 4 for a = 137 m, Ca = 0.71
Design wind pressure for the windward wall is
p = 24.6 [(0.6)(0.84)] = 12.4 psf
design wind pressure for the leeward wall is
p = 24.6 [(-0.1)(0.84)] =-2.1 psf
design wind pressure for the roof
zone A p = 24.6 [(-2.0)(0.82) - (0.2)(0.71)] = -43.8 psf
zone B p = 24.6 [(-1.4)(0.82) - (0.2)(0.71)] = -31.9 psf
zone C p = 24.6 [(-0.7)(0.82) - (0.2)(0.71)] = -17.6 psf
zone D p = 24.6 [(-0.2)(0.82) - (0.2)(0.71)] = -7.5 psf and
p = 24.6 [(0.2)(0.82) -i- (0.3)(0.71)] = 9.3 psf
Base shear and overtuming moment for the entire building:
Base shear:
= [12.4(15)(100) + 2.1(15)(100)] = 21.75 kips
Overtuming moment:
= [12.4(15)(100)(7.5) + 31.7(3.0)(100)(58.5) + 17.6(12)(100)(51) -»-
7.5(45)(100)(22.5) + 2.1(15)(100)(7.5)] / 1000 = 2555.9 ft-kips
Roof uphft:
= 100[31.9(3) + 17.6(12) + 7.5(45)] / 1000 = 64.4 kips
131
Design Wind Pressures for Components and Claddings:
The design pressure for components and claddings is given by the equation
P = q.s[(CpeCa) - (CpiCa)]
the internal pressure coefficient is the same as used for the design of the main wind force
resisting system. The extemal pressure coefficients are tabulated in Table C. 1, along with
size effect factor. The uibutary areas considered in the computations involving American
standard are 5 sqft (0.465 m ) and 100 sqft (9.3 m^). The diagonal dimension for the
1.525 m X 6.1 m cladding area is 6.3 m, which from Figure 4 gives a size effect factor Ca
of 0.98. For fasteners, the diagonal dimension for 0.305 m x 1.525 m area is 1.55 m,
which gives a size effect factor of 1.00. The calculated values of design pressures are
tabulated in Table C.2.
Sample calculation for purhns and grits of tributary area 100 sqft:
Positive pressure on wall middle surface:
p = 24.6 [(0.6)(0.98) + (0.3)(0.71)] = 19.7 psf
Negative pressure on roof eaves:
p = 24.6 [(-2.0)(0.98) - (0.2)(0.71)] = -51.7 psf
Sample calculation for fasteners of tributary area 5 sqft:
Positive pressure on wall middle surface:
p = 24.6 [(0.6)(1.00) + (0.3)(0.71)] = 20.0 psf
Negative pressure on roof corners:
p = 24.6 [(-2.0)(1.00) - (0.2)(0.71)] = -52.7 psf
132
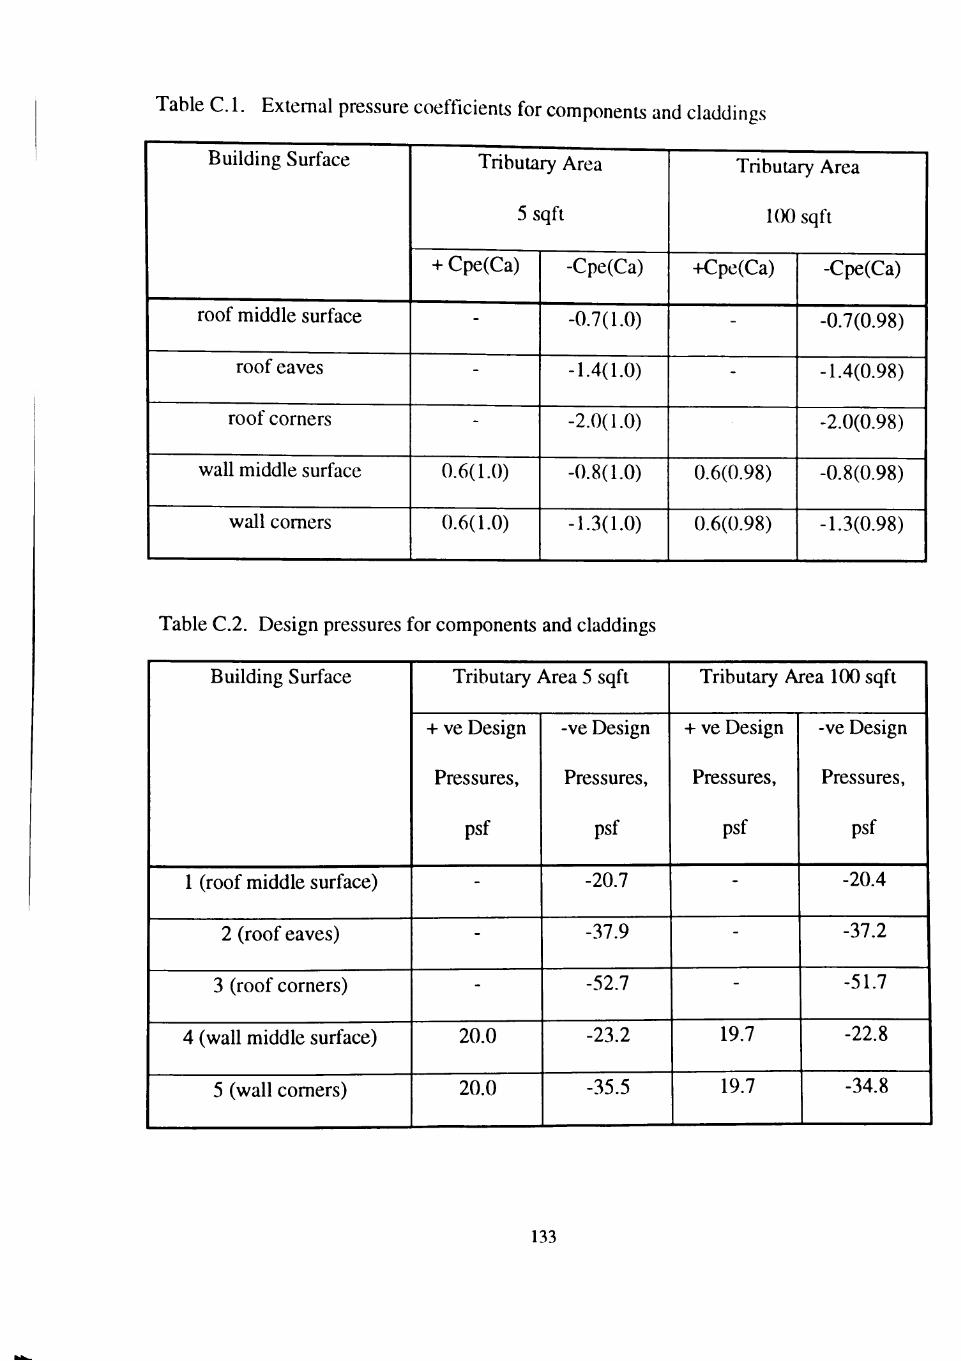
Table C. 1. Extemal pressure coefficients for components and claddings
Building Surface
roof middle surface
roof eaves
roof corners
waU middle surface
wall comers
Tributary Area
5 sqft
+ Cpe(Ca)
-
-
-
0.6(1.0)
0.6(1.0)
-Cpe(Ca)
-0.7(1.0)
-1.4(1.0)
-2.0(1.0)
-0.8(1.0)
-1.3(1.0)
Tributary Area
100 sqft
-i<:pe(Ca)
-
-
0.6(0.98)
0.6(0.98)
-Cpe(Ca)
-0.7(0.98)
-1.4(0.98)
-2.0(0.98)
-0.8(0.98)
-1.3(0.98)
Table C.2. Design pressures for components and claddings
Building Surface
1 (roof middle surface)
2 (roof eaves)
3 (roof corners)
4 (wall middle surface)
5 (wall comers)
Tributary Area 5 sqft
+ ve Design
Pressures,
psf
-
-
-
20.0
20.0
-ve Design
Pressures,
psf
-20.7
-37.9
-52.7
-23.2
-35.5
Tributary Area 100 sqft
+ ve Design
Pressures,
psf
-
-
-
19.7
19.7
-ve Design
Pressures,
psf
-20.4
-37.2
-51.7
-22.8
-34.8
133
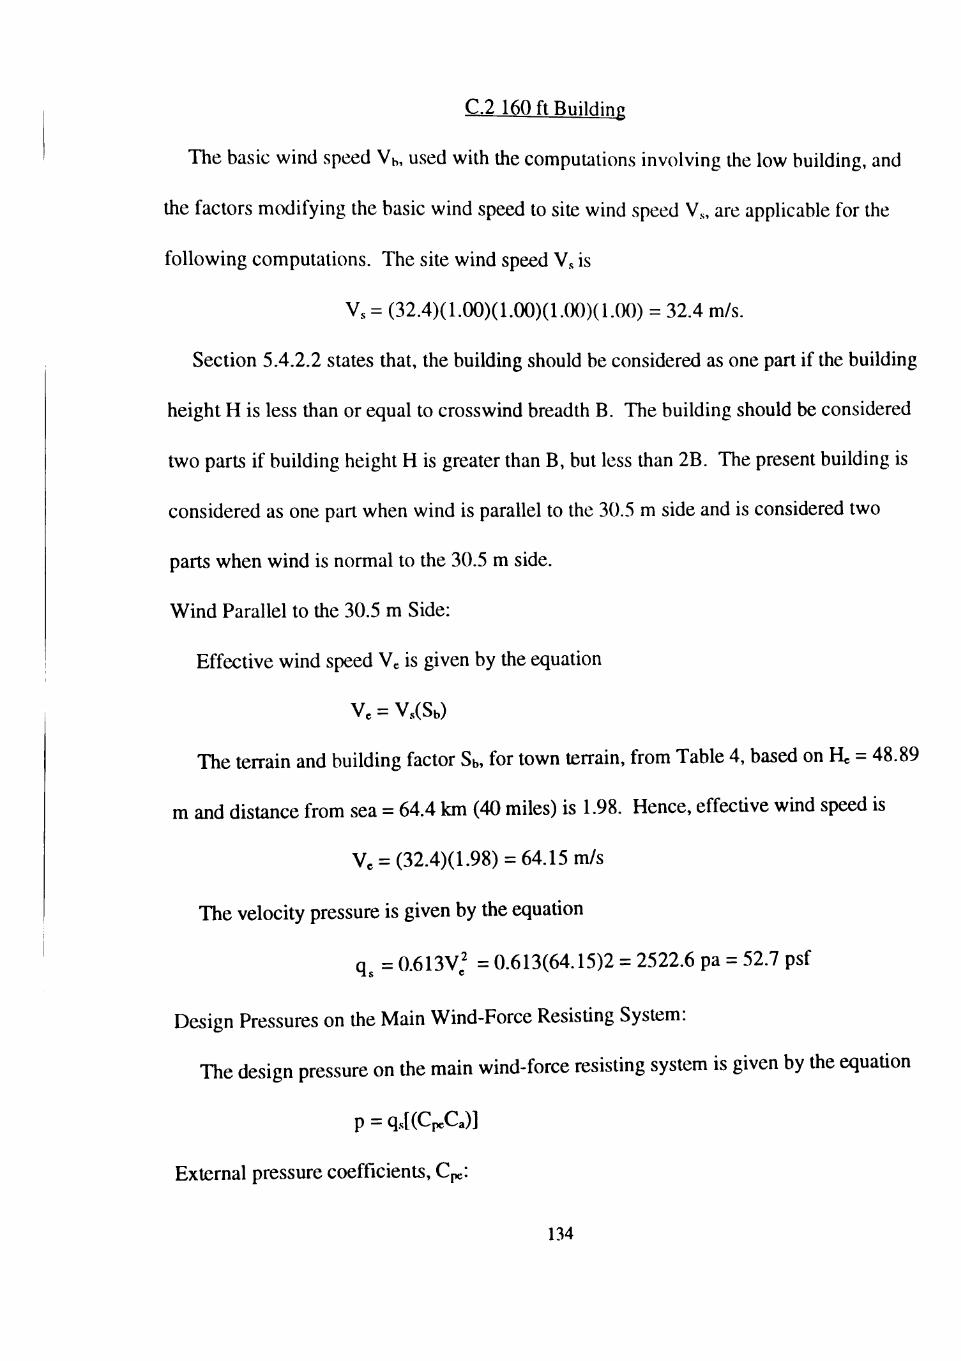
c.2 160 ft Building
The basic wind speed Vb, used with the compuUitions involving the low building, and
the factors modifying the basic wind speed to site wind speed V,, are applicable for the
following computations. The site wind speed Vs is
Vs = (32.4)(1.00)(1.00)(1.00)(1.00) = 32.4 m/s.
Section 5.4.2.2 states that, the building should be considered as one part if the building
height H is less than or equal to crosswind breadth B. The building should be considered
two parts if building height H is greater than B, but less than 2B. The present building is
considered as one part when wind is parahel to the 30.5 m side and is considered two
parts when wind is normal to the 30.5 m side.
Wind Parallel to the 30.5 m Side:
Effective wind speed Ve is given by the equation
Ve = Vs(Sb)
The terrain and building factor Sb, for town terrain, from Table 4, based on He = 48.89
m and distance from sea = 64.4 km (40 miles) is 1.98. Hence, effective wind speed is
Vc = (32.4)(1.98) = 64.15 m/s
The velocity pressure is given by the equation
q = 0.613V,' = 0.613(64.15)2 = 2522.6 pa = 52.7 psf
Design Pressures on the Main Wind-Force Resisting System:
The design pressure on the main wind-force resisting system is given by the equation
p = q.s[(CpcCa)]
External pressure coefficients, Cpc:
134
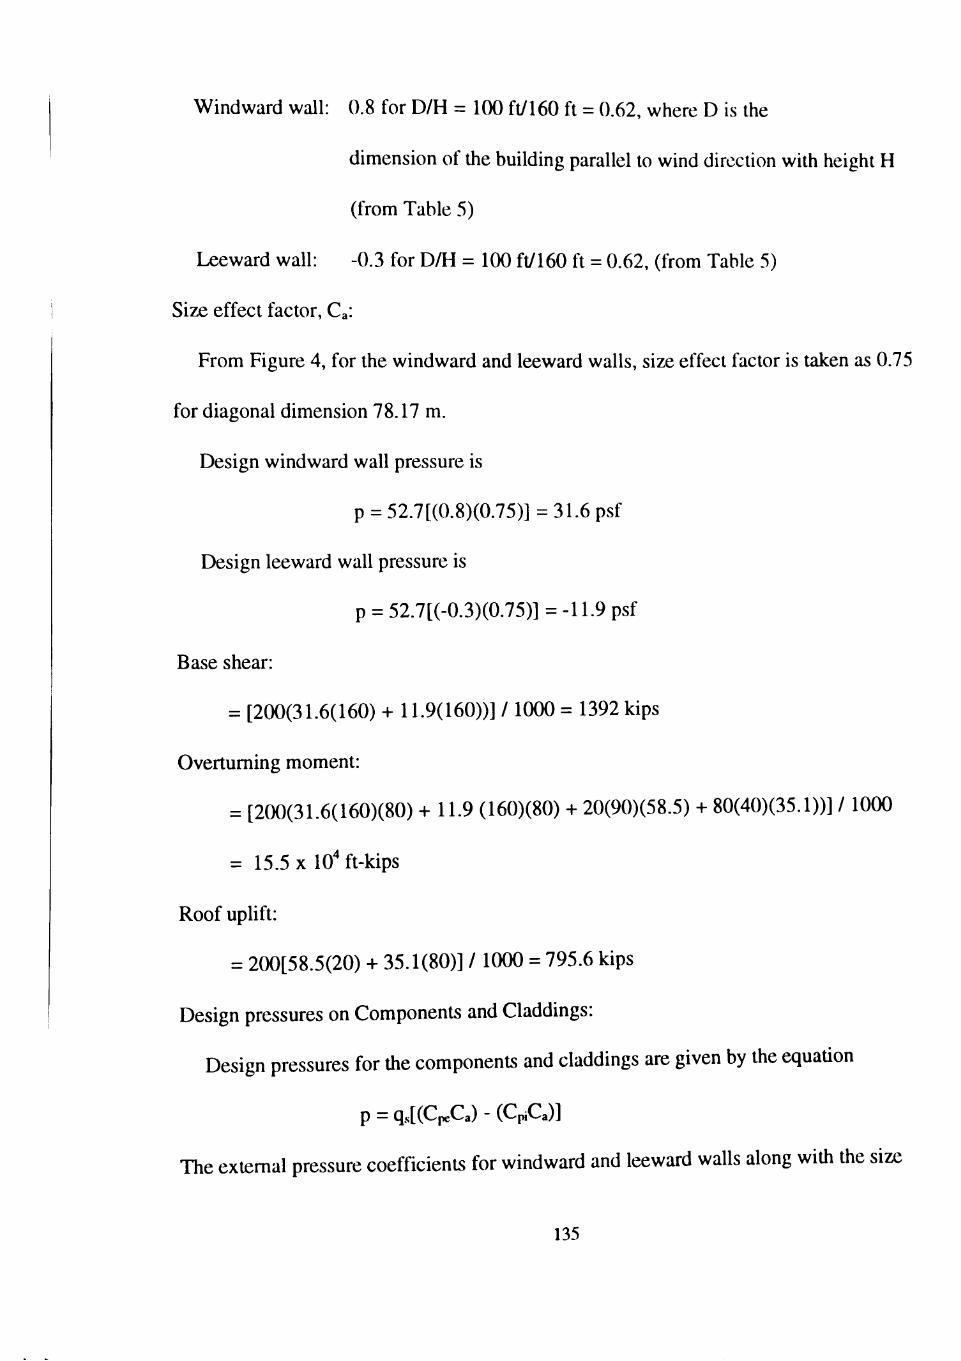
Windward wall: 0.8 for D/H = 100 ft/160 ft = 0.62, where D is the
dimension of the building parallel to wind direction with height H
(from Table 5)
Leeward wall: -0.3 for D/H = 100 ft/160 ft = 0.62, (from Table 5)
Size effect factor, Ca:
From Figure 4, for the windward and leeward walls, size effect factor is taken as 0.75
for diagonal dimension 78.17 m.
Design windward wall pressure is
p = 52.7[(0.8)(0.75)]= 31.6 psf
Design leeward wall pressure is
p = 52.7[(-0.3)(0.75)] = -11.9 psf
Base shear:
= [200(31.6(160) + 11.9(160))] /1000 = 1392 kips
Overtuming moment:
= [200(31.6(160)(80) + 11.9 (160)(80) -f- 20(90)(58.5) + 80(40)(35.1))] / 1000
= 15.5x10'ft-kips
Roof uphft:
= 200[58.5(20) + 35.1(80)] / 1000 = 795.6 kips
Design pressures on Components and Claddings:
Design pressures for the components and claddings are given by the equation
P = q.s[(CpeCa) - (CpiCa)]
The extemal pressure coefficients for windward and leeward walls along with the size
135
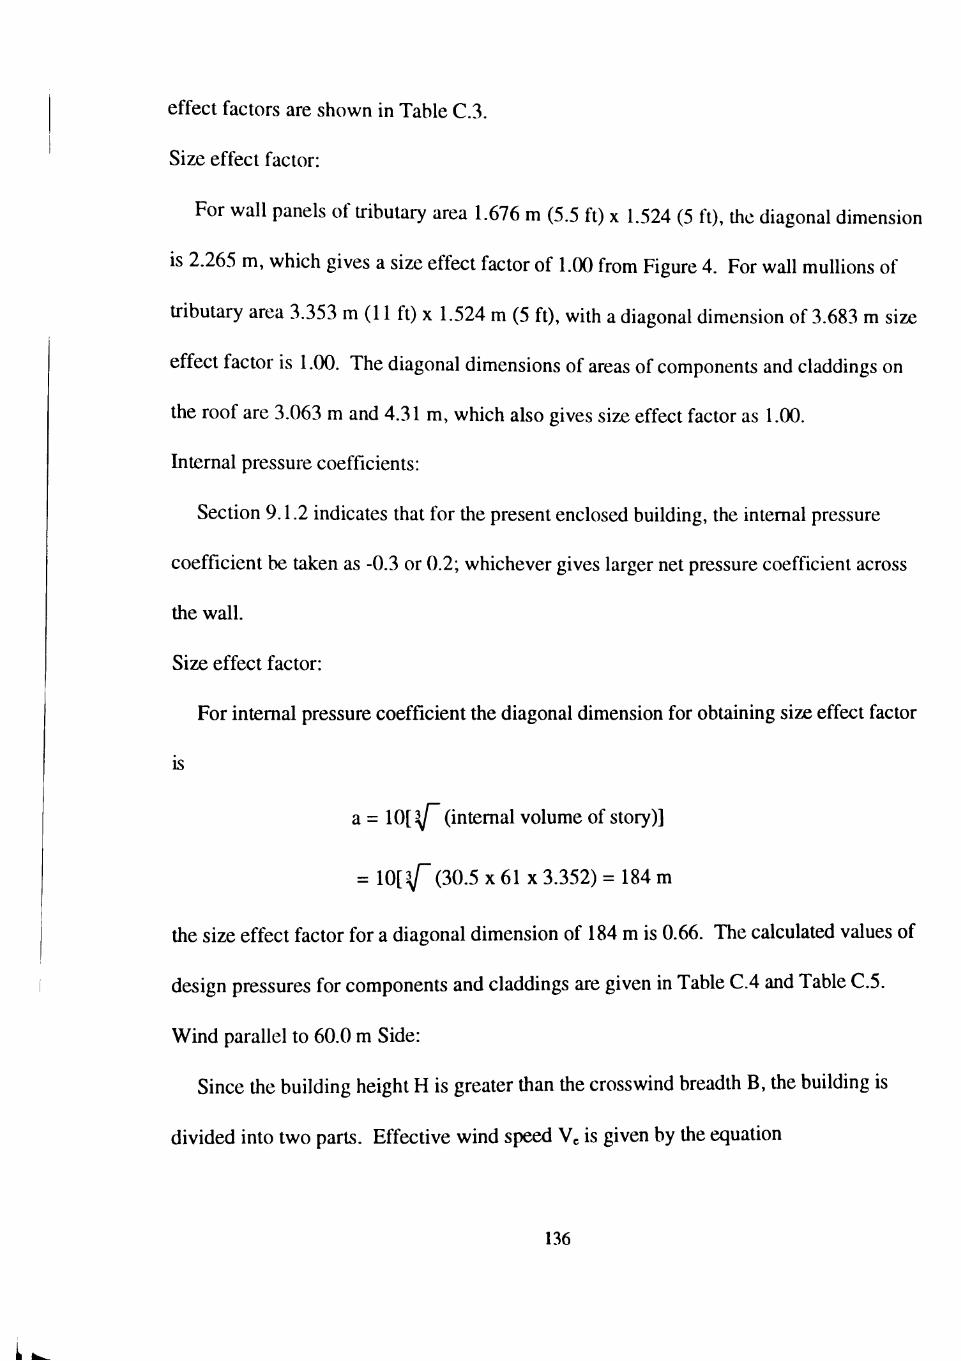
effect factors are shown in Table C.3.
Size effect factor:
For wall panels of Uibutary area 1.676 m (5.5 ft) x 1.524 (5 fO, the diagonal dimension
is 2.265 m, which gives a size effect factor of 1.00 from Figure 4. For wall mullions of
U-ibutary area 3.353 m (11 ft) x 1.524 m (5 ft), with a diagonal dimension of 3.683 m size
effect factor is 1.00. The diagonal dimensions of areas of components and claddings on
the roof are 3.063 m and 4.31 m, which also gives size effect factor as 1.00.
Internal pressure coefficients:
Section 9.1.2 indicates that for the present enclosed building, the intemal pressure
coefficient be taken as -0.3 or 0.2; whichever gives larger net pressure coefficient across
the wall.
Size effect factor:
For intemal pressure coefficient the diagonal dimension for obtaining size effect factor
IS
a = 10[y (intemal volume of story)]
= 10[^(30.5 X 61 X 3.352) = 184 m
the size effect factor for a diagonal dimension of 184 m is 0.66. The calculated values of
design pressures for components and claddings are given in Table C.4 and Table C.5.
Wind parallel to 60.0 m Side:
Since the building height H is greater than the crosswind breadth B, the building is
divided into two parts. Effective wind speed Ve is given by the equation
136
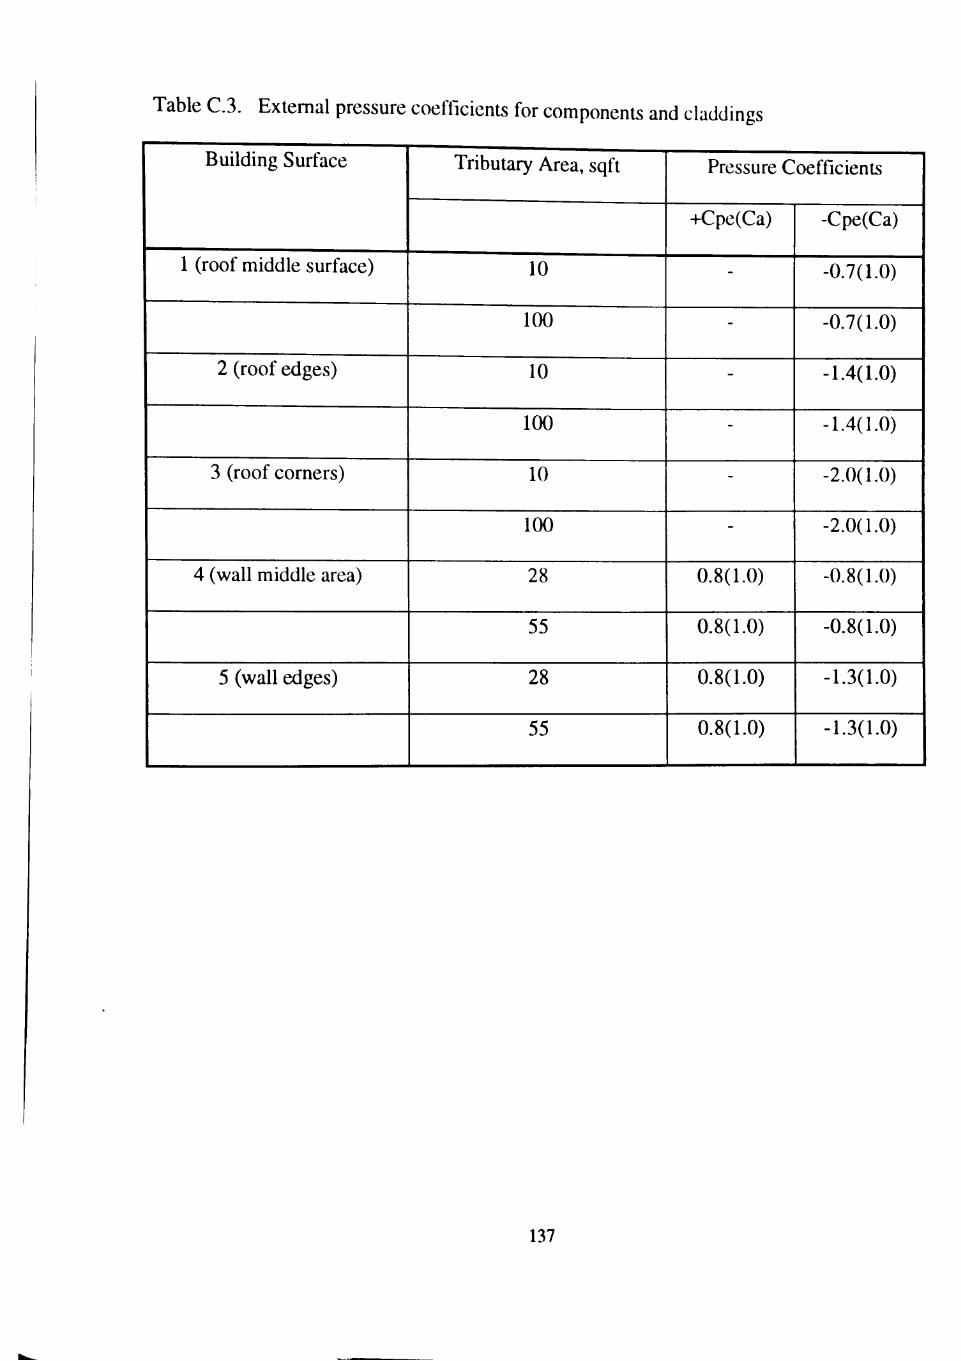
Table C.3. Extemal pressure
Building Surface
1 (roof middle surface)
2 (roof edges)
3 (roof corners)
4 (wall middle area)
5 (wall edges)
coefficients for components and claddings
Tributary Area, sqft
10
100
10
100
10
100
28
55
28
55
Pressure Coefficients
-i-Cpe(Ca)
-
-
-
-
-
-
0.8(1.0)
0.8(1.0)
0.8(1.0)
0.8(1.0)
-Cpe(Ca)
-0.7(1.0)
-0.7(1.0)
-1.4(1.0)
-1.4(1.0)
-2.0(1.0)
-2.0(1.0)
-0.8(1.0)
-0.8(1.0)
-1.3(1.0)
-1.3(1.0)
137
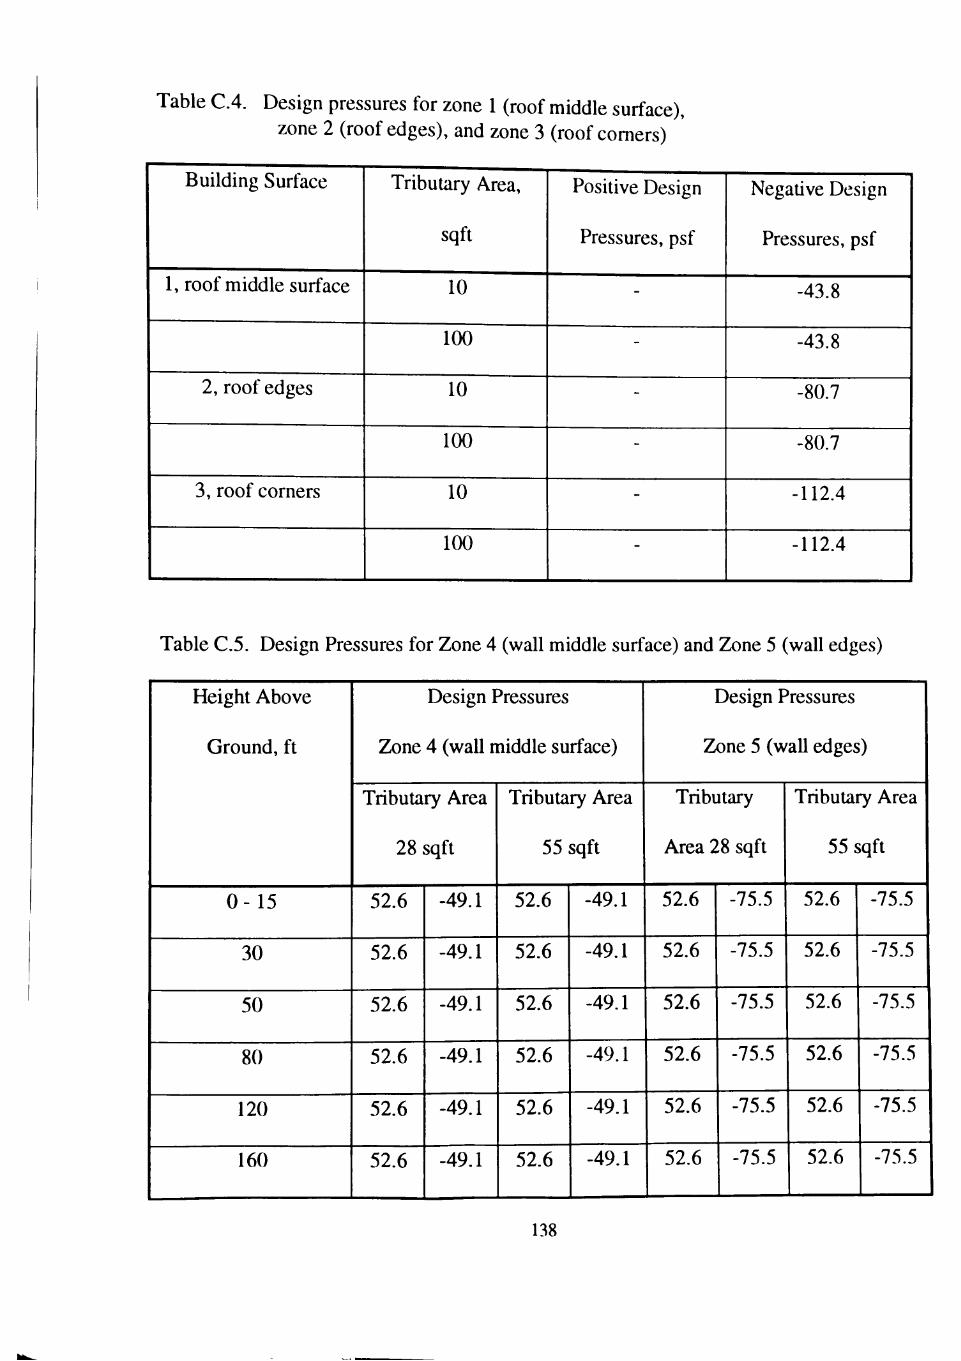
Table C.4. Design pressures for zone 1 (roof middle surface), zone 2 (roof edges), and zone 3 (roof comers)
Building Surface
1, roof middle surface
2, roof edges
3, roof corners
TribuUiry Area,
sqft
10
100
10
100
10
100
Positive Design
Pressures, psf
-
-
-
-
-
-
Negative Design
Pressures, psf
-43.8
-43.8
-80.7
-80.7
-112.4
-112.4
Table C.5. Design Pressures for Zone 4 (wall middle surface) and Zone 5 (wall edges)
Height Above
Ground, ft
0 - 15
30
50
80
120
160
Design Pressures
Zone 4 (wall middle surface)
Tributary Area
28 sqft
52.6
52.6
52.6
52.6
52.6
52.6
-49.1
-49.1
-49.1
-49.1
-49.1
-49.1
Tributary Area
55 sqft
52.6
52.6
52.6
52.6
52.6
52.6
-49.1
-49.1
-49.1
-49.1
-49.1
-49.1
Design Pressures
Zone 5 (wall edges)
Tributary
Area 28 sqft
52.6
52.6
52.6
52.6
52.6
52.6
-75.5
-75.5
-75.5
-75.5
-75.5
-75.5
Tributary Area
55 sqft
52.6
52.6
52.6
52.6
52.6
52.6
-75.5
-75.5
-75.5
-75.5
-75.5
-75.5
138
Ve = Vs(Sb)
For part 1, the terrain and building factor Sb is 1.895 with effective height He = 30.5 m and
64.4 km (40 miles) away from the sea. For part 2, Sb is 1.980 for H, = 48.89 m and 64.4
km (40 miles) away from the sea.
Effective wind speed Ve, is 61.4 m/s for part 1 and is 64.15 m/s for part 2.
Design Pressures on the Main Wind-Force Resisting system:
Design pressures for the main wind force resisting system is given by the equation
P = q.s[(CpeCa)]
Velocity pressure is given by the equation
q ,= 0.613V,'
for part 1 qs = 48.3 psf and for part 2 qs = 52.7 psf
Extemal pressure coefficients for part 1:
windward waU: 0.733 for D/H = 200 ft/100 ft = 2
leeward waU: -0.233 for D/H = 2
Size effect factor:
From Figure 4 for diagonal dimension of 43.13 the size effect factor Ca is 0.80
Design windward wall pressure is p = 48.3[(0.733)(0.80)] = 28.3
Design leeward wall pressure is
p = 48.3[(-0.233)(0.80)] = -9.0 psf
Extemal pressure coefficients for Part 2:
windward wall: 0.78 for D/H = 200 ft/100 ft = 1.247 from Table 5
leeward wall: -0.28 for D/H = 1.247
139
Size effect factor:
For the loaded area of Part 2 the diagonal dimension is 35.61 m, which gives a size
effect factor of 0.82.
Design windward wall pressure is
p = 52.7[(0.78)(0.82)] = 33.7 psf
Design leeward wall pressure is
p = 52.7[(-0.28)(0.82)]=-12.1 psf
Base shear and overturning moment for the entire building:
Base shear:
= [100(28.3(100) + 33.7(60) -f- 9.0(100) + 12.1(60))] /1000 = 647.8 kips
Overtuming moment:
= [100((28.3 + 9.0)(100)(50) -f- (33.7 + 12.1)(60)(130) + 10(195)(57.9) +
40(170)(35.1) + 150(75)(15.1))] / 1000 = 10.7 x lO' ft-kips
Roof uplift:
= 100[57.9(10) + 35.1(40) + 15.1(150)] /1000 = 424.8 kips
Design Pressure on Components and Claddings:
Design pressures on components and claddings is given by the equation
P = qs[(CpcCa) - (CpiCa)]
The extemal pressure coefficients, along with the size effect factor, are tabulated in
Table C.6. Velocity pressure is equal to 52.7 psf
The internal pressure coefficients are -0.3 or 0.2; whichever gives the larger net
pressure coefficient across the wall. The size effect factor used with the internal pressure
140
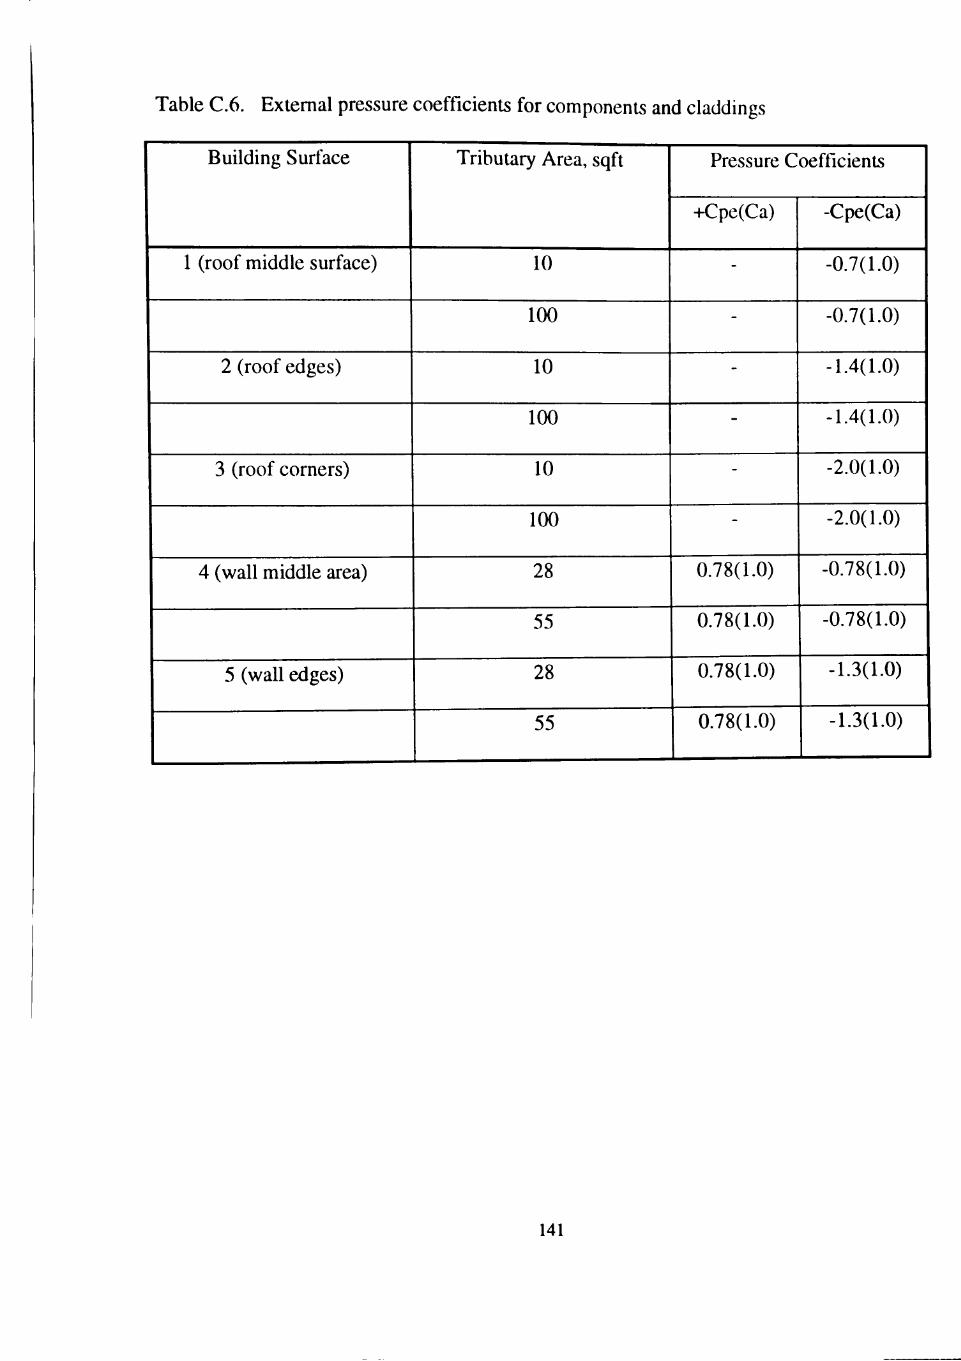
Table C.6. Extemal pressure coefficients for components and claddings
Building Surface
1 (roof middle surface)
2 (roof edges)
3 (roof corners)
4 (wall middle area)
5 (wall edges)
Tributary Area, sqft
10
100
10
100
10
100
28
55
28
55
Pressure Coefficients
-i-Cpe(Ca)
-
-
-
-
-
-
0.78(1.0)
0.78(1.0)
0.78(1.0)
0.78(1.0)
-Cpe(Ca)
-0.7(1.0)
-0.7(1.0)
-1.4(1.0)
-1.4(1.0)
-2.0(1.0)
-2.0(1.0)
-0.78(1.0)
-0.78(1.0)
-1.3(1.0)
-1.3(1.0)
141
coefficient is 0.66. The size effect factor Ca is 1.00 for waU panels of tributary area 2.6
m', waU mullions of tribuUiry area 5.12 m , and for roof tributary areas of 0.93 m' and 9.3
m . The calculated values of design pressures for components and claddings are tabulated
in Table C.7 and Table C.8.
142
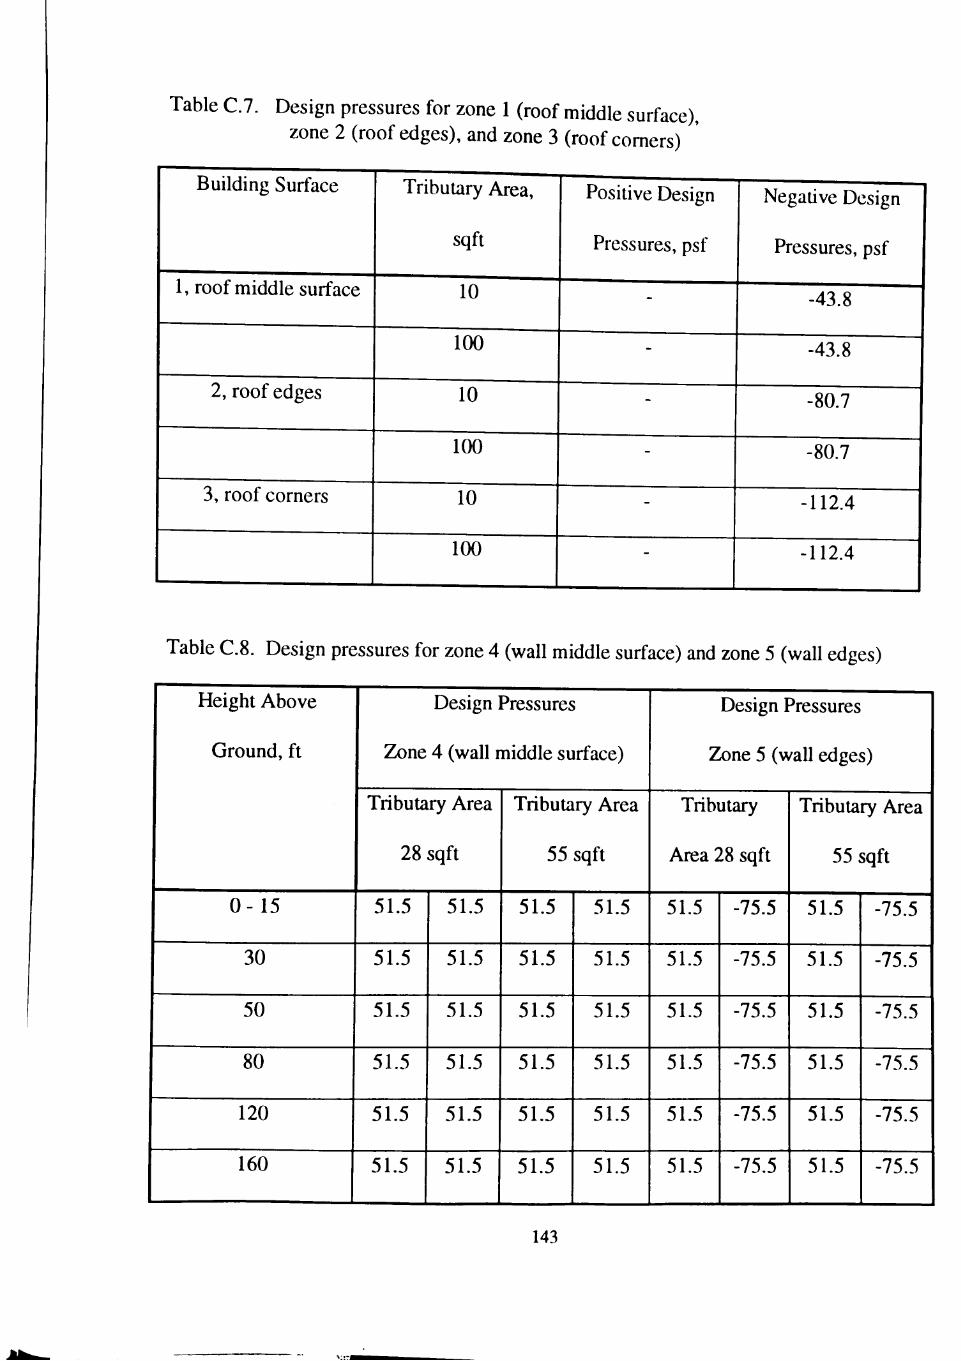
Table C.7. Design pressures for zone 1 (roof middle surface), zone 2 (roof edges), and zone 3 (roof comers)
Building Surface
1, roof middle surface
2, roof edges
3, roof corners
TribuUiry Area,
sqft
10
100
10
100
10
100
Positive Design
Pressures, psf
-
-
-
-
-
-
Negative Design
Pressures, psf
-43.8
-43.8
-80.7
-80.7
-112.4
-112.4
Table C.8. Design pressures for zone 4 (wall middle surface) and zone 5 (wall edges)
Height Above
Ground, ft
0 -15
30
50
80
120
160
Design Pressures
Zone 4 (wall middle surface)
Tributary Area
28 sqft
51.5
51.5
51.5
51.5
51.5
51.5
51.5
51.5
51.5
51.5
51.5
51.5
Tributary Area
55 sqft
51.5
51.5
51.5
51.5
51.5
51.5
51.5
51.5
51.5
51.5
51.5
51.5
Design Pressures
Zone 5 (wall edges)
Tributary
Area 28 sqft
51.5
51.5
51.5
51.5
51.5
51.5
-75.5
-75.5
-75.5
-75.5
-75.5
-75.5
Tributary Area
55 sqft
51.5
51.5
51.5
51.5
51.5
51.5
-75.5
-75.5
-75.5
-75.5
-75.5
-75.5
143
APPENDIX D
CALCULATIONS USING CANADIAN STANDARD
This appendix contains the wind pressure calculations using the Canadian standard.
Wind pressure calculations for the 160 ft building follow the wind pressure calculations for
the low building. The references cited herein regarding sections, tables, and figures,
belong to the Canadian standard.
144
D.l Low Building
The reference wind speed used by the Canadian standard is a mean houriy wind speed
measured at 10 m height in an open terrain and associated with an annual probability of
occurrence of 0.01,0.033 and 0.01. hi the commentary for Canadian standard reference
wind pressures based on reference wind speed are tabulated for many Canadian locations.
Canadian standard recommends a reference velocity pressure, q, associated with an annual
probability of 0.1, for design of claddings and a reference velocity pressure, q, associated
with an annual probability of 0.033 is recommended for design of the main wind-force
resisting system. The reference wind speed employed for calculations using American
standard is a 3-second gust wind speed of 110 mph associated with an annual probabihty
of 0.02. To modify the wind speed to annual probabilities of 0.1 and 0.033, the wind
speed is multiphed by 0.84 and 0.94 respectively. The obtamed wind speeds are then
converted to mean hourly wind speed to give reference wind speeds 27.2 m/s (61.07 mph)
and 30.4 m/s (68.34 mph), to be used with the calculation of design wind pressures for
components and claddings and for the design of the main wind-force resisting system.
Design Pressures on the Main Wind-Force Resisting System:
The design pressures on the main wind-force resisting system is given by the equation
p = qCc[(CgCp)].
The reference wind pressure for the main wind-force resisting system is given by the
equation
q = 650 X lO- (V) = 650 x 10" (30.4) = 0.6007 kpa = 12.55 psf
From section 12 (commentary) for low-rise structures with roof slope less than lO", the
145
mean roof height is taken as the eave height. The exposure factor C , for reference height
4.57 m, is 0.9 (from Table 4.1.8.A).
External peak pressure coefficients, CpCg:
External peak pressure coefficients obtained ftom Figure B.7 for wind generally
perpendicular and parallel to ridge are tabulated in Table D.l and Table D.2.
Internal pressure coefficients, Cp,:
Section 37 of commentary gives three basic design categories into which a given
building can be categorized based on the prevailing condition of the building. For the
present building category 1 (uniformly distributed openings) is an appropriate choice,
which gives internal pressure coefficients as 0.0 to -0.3. The intemal pressure coefficients
of category 1 should be used with a gust effect factor Cg = 1.0.
The calculated design pressures for wind normal and parallel to ridge are tabulated in
Table D.l and Table D.2. A few sample calculations are given below.
Wind perpendicular to ridge:
wind pressure on building surface 1 is
p = 12.54(0.90)[(0.75)] = 8.5 psf
wind pressure on building surface 2 is
p = 12.54(0.90)[(-1.3)] = -14.7 psf
Wind parallel to ridge:
wind pressure on building surface IE is
p = 12.54(0.90)[(-0.9)] = -10.2 psf
wind pressure on building surface 5E is
146
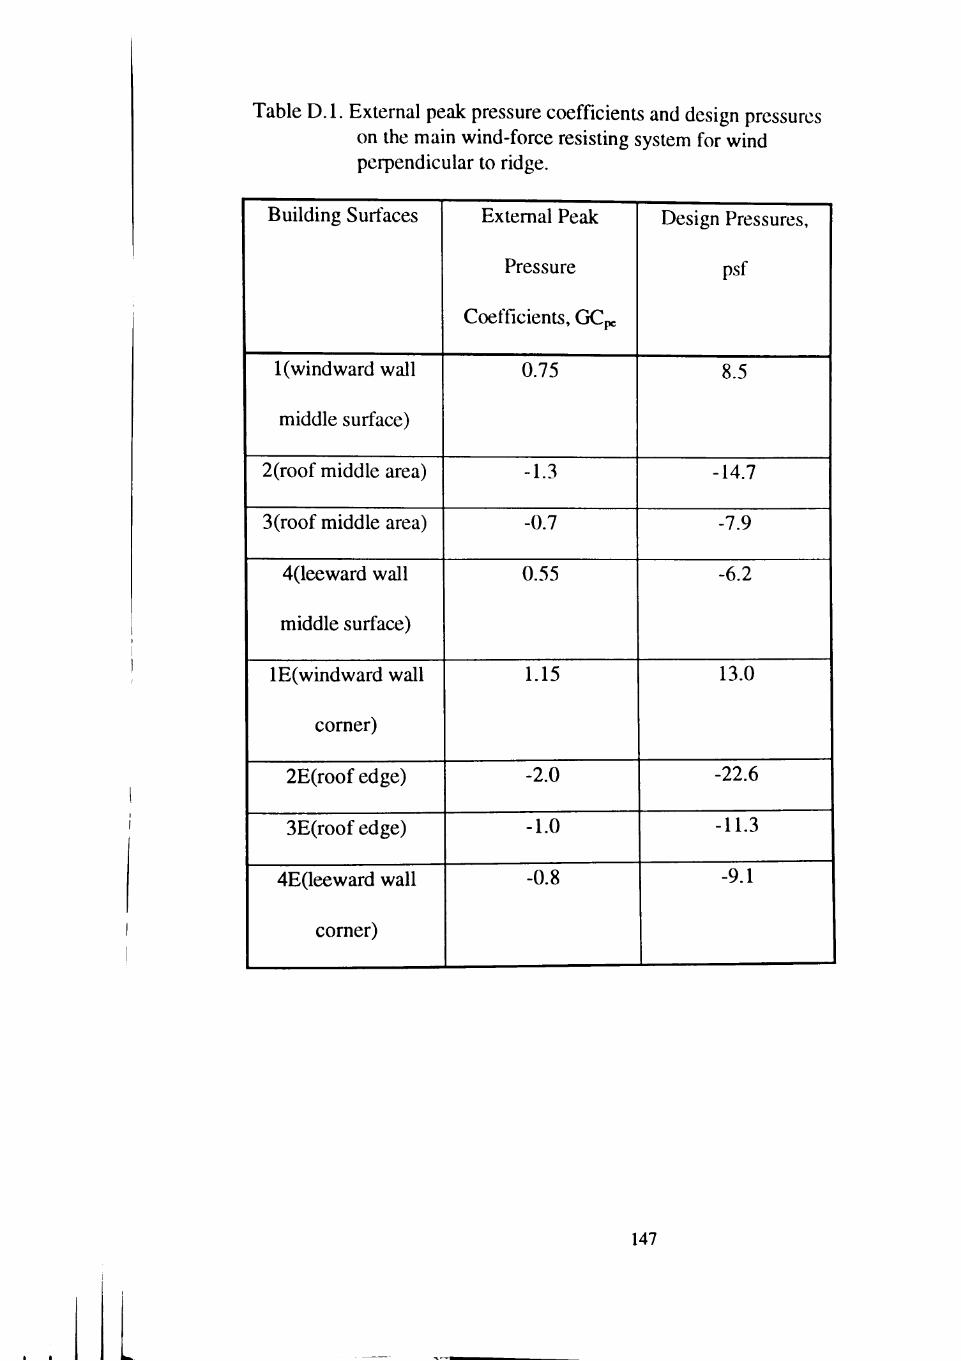
Table D.l. External peak pressure coefficients and design pressures on the main wind-force resisting system for wind perpendicular to ridge.
Building Surfaces
1 (windward wall
middle surface)
2(roof middle area)
3(roof middle area)
4(leeward wall
middle surface)
lE(windward wall
corner)
2E(roof edge)
3E(roof edge)
4E(leeward wall
corner)
Extemal Peak
Pressure
Coefficients, GCpe
0.75
-1.3
-0.7
0.55
1.15
-2.0
-1.0
-0.8
Design Pressures,
psf
8.5
-14.7
-7.9
-6.2
13.0
-22.6
-11.3
-9.1
147
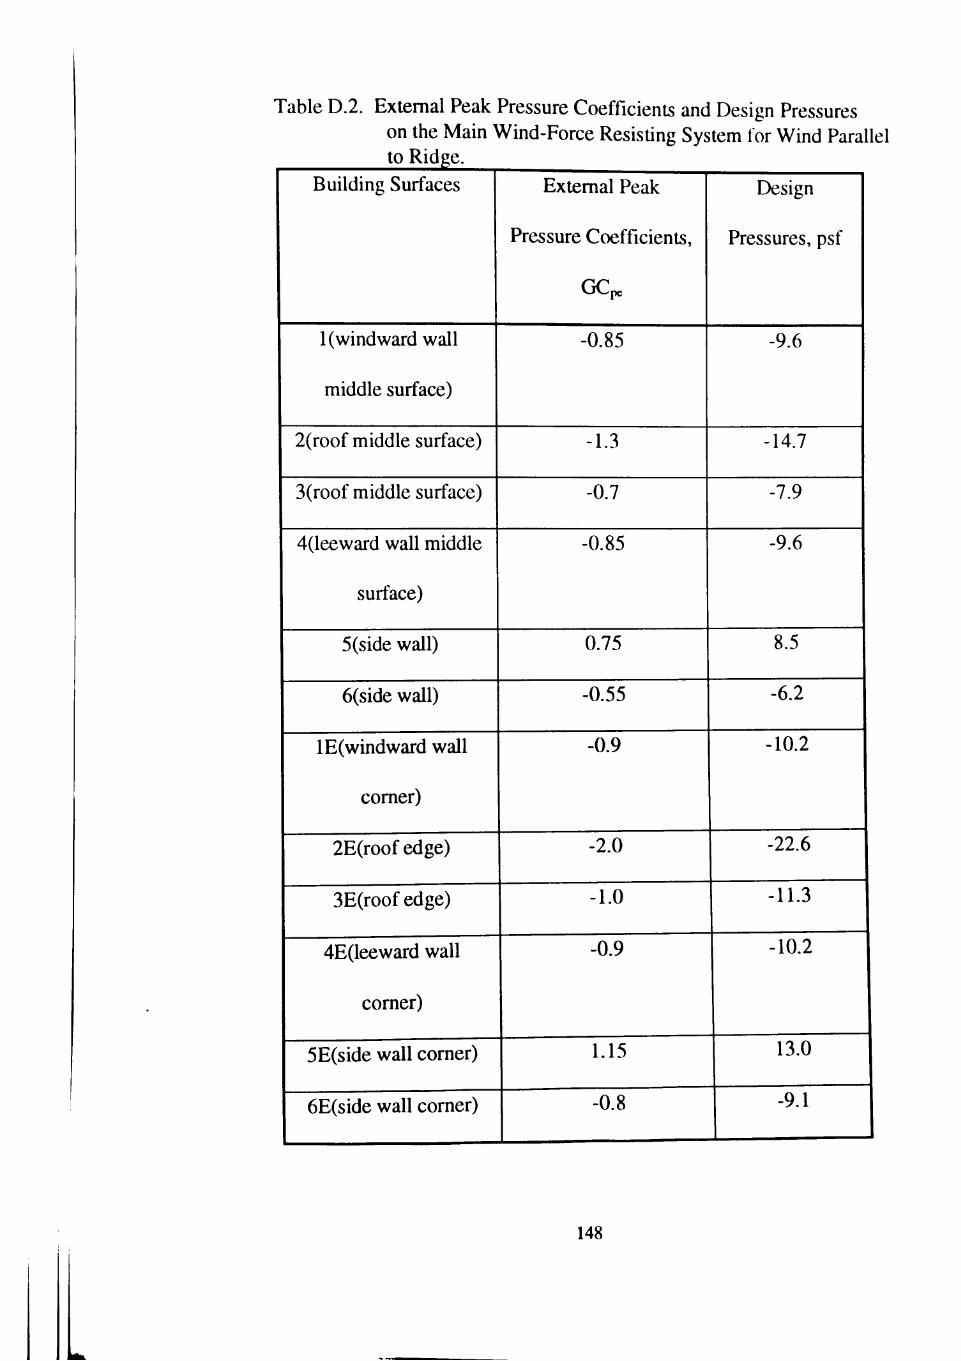
Table D.2. Extemal Peak Pressure Coefficients and Design Pressures on the Main Wind-Force Resisting System for Wind Parallel to Ridge.
Building Surfaces
1 (windward wall
middle surface)
Extemal Peak
Pressure Coefficients,
GC PC
-0.85
Design
Pressures, psf
-9.6
2(roof middle surface) -1.3 14.7
3(roof middle surface) -0.7 -7.9
4(leeward wall middle
surface)
-0.85 -9.6
5(side wall)
6(side wall)
lE(windward wall
comer)
2E(roof edge)
3E(roofedge)
4E(leeward wall
corner)
5E(side wall corner)
6E(side wall corner)
0.75
-0.55
-0.9
-2.0
-1.0
-0.9
1.15
-0.8
8.5
-6.2
10.2
-22.6
11.3
-10.2
13.0
-9.1
148
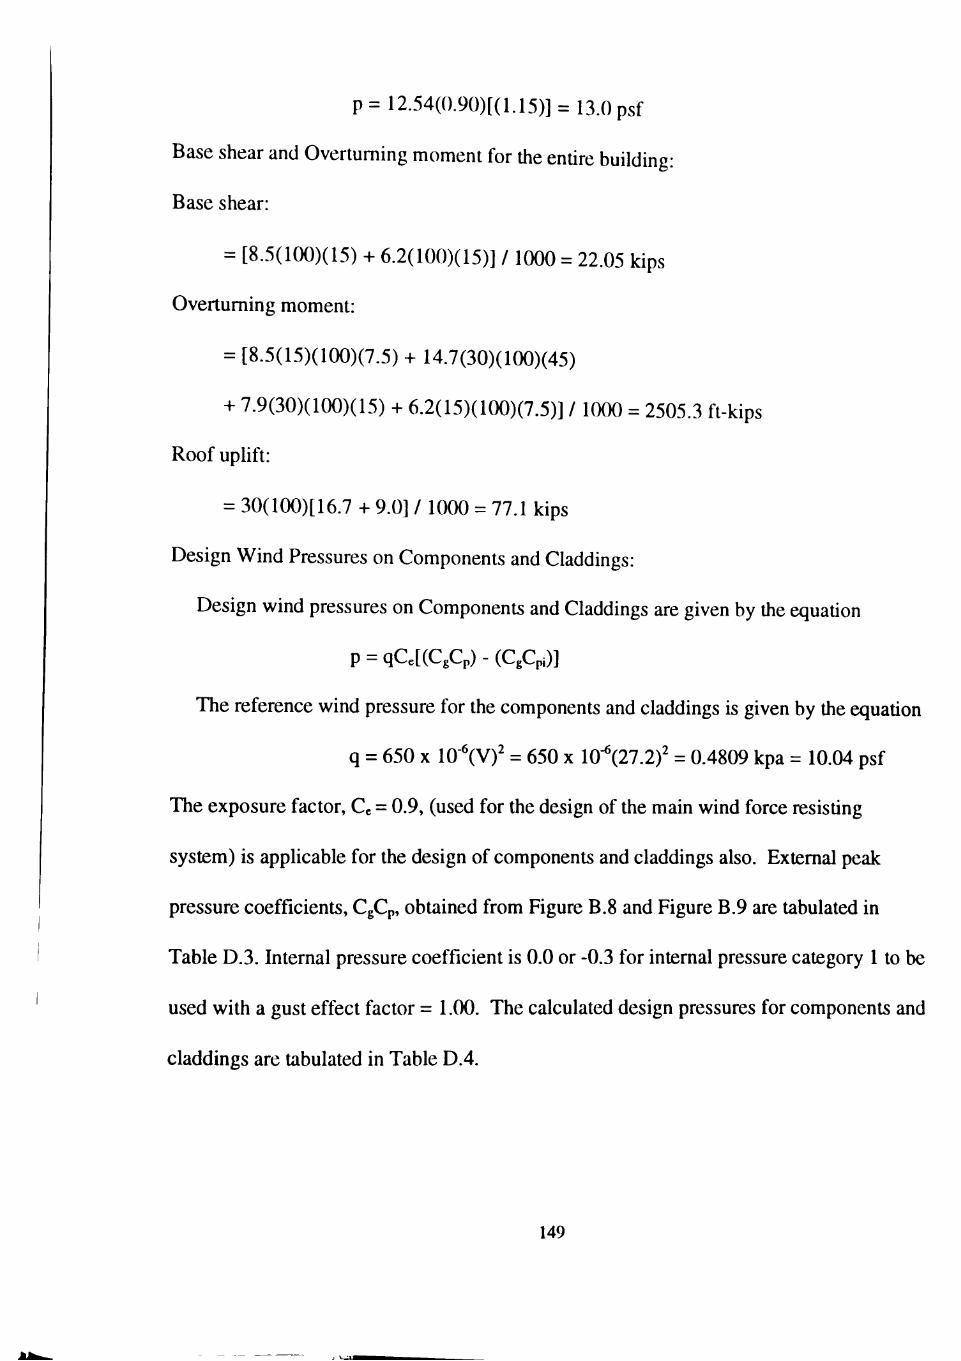
p=12.54(0.90)[(1.15)] = 13.0 psf
Base shear and Overtuming moment for the entire building:
Base shear:
= [8.5(100)(15) + 6.2(100)(15)] / 1000 = 22.05 kips
Overtuming moment:
= [8.5(15)(100)(7.5) + 14.7(30)(100)(45)
+ 7.9(30)(100)(15) + 6.2(15)(100)(7.5)] / 1000 = 2505.3 ft-kips
Roof uplift:
= 30(100)[16.7 + 9.0] / 1000 = 77.1 kips
Design Wind Pressures on Components and Claddings:
Design wind pressures on Components and Claddings are given by the equation
p = qCcKCgCp) - (CgCpi)]
The reference wind pressure for the components and claddings is given by the equation
q = 650 X lO- (V) = 650 x 10- (27.2) = 0.4809 kpa = 10.04 psf
The exposure factor, Ce = 0.9, (used for the design of the main wind force resisting
system) is applicable for the design of components and claddings also. Extemal peak
pressure coefficients, CgCp, obtained from Figure B.8 and Figure B.9 are tabulated in
Table D.3. Internal pressure coefficient is 0.0 or -0.3 for intemal pressure category 1 to be
used with a gust effect factor = l.(K). The calculated design pressures for components and
claddings are tabulated in Table D.4.
149
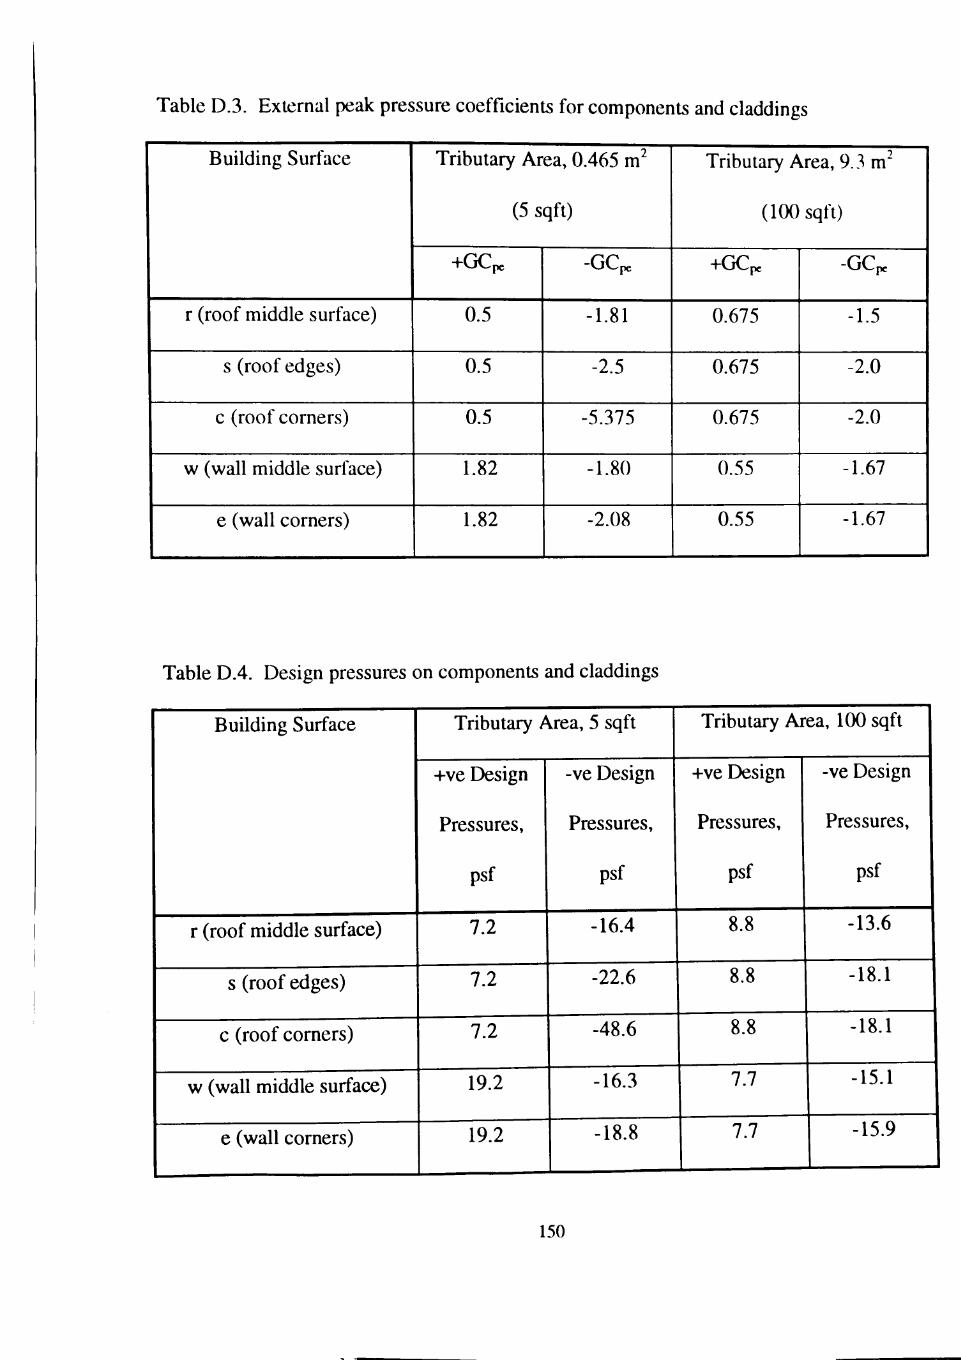
Table D.3. External peak pressure coefficients for components and claddings
Building Surface
r (roof middle surface)
s (roof edges)
c (roof corners)
w (wall middle surface)
e (wall corners)
Tributary Area, 0.465 m^
(5 sqft)
+GCpc
0.5
0.5
0.5
1.82
1.82
-GCpe
-1.81
-2.5
-5.375
-1.80
-2.08
•y
Tributary Area, 9.3 m'
(100 sqft) +GCpe
0.675
0.675
0.675
0.55
0.55
-GCpe
-1.5
-2.0
-2.0
-1.67
-1.67
Table D.4. Design pressures on components and claddings
Building Surface
r (roof middle surface)
s (roof edges)
c (roof corners)
w (wall middle surface)
e (wall corners)
Tributary Area, 5 sqft
-Hve Design
Pressures,
psf
7.2
7.2
7.2
19.2
19.2
-ve Design
Pressures,
psf
-16.4
-22.6
-48.6
-16.3
-18.8
Tributary Area, 100 sqft
-i-ve Design
Pressures,
psf
8.8
8.8
8.8
7.7
7.7
-ve Design
Pressures,
psf
-13.6
-18.1
-18.1
-15.1
-15.9
150
D.2 160 ft Building
Design Pressures on the Main Wind-Force Resisting System:
The design pressures for the main wind-force resisting system is given by the equation
p = qCeCgCp
The reference wind pressure for the main wind-force resisting system is given by the
equation
q = 650 X lO- (V) = 650 x 10"^(30.4)' = 0.6(K)7 kpa = 12.54 psf
Exposure factor:
The reference height, H, (used to obtain the exposure factor Ce) depends on the surface
the design pressure is calculated upon. For windward waU exposure factor various with
height above the constant of 10 m. Note 6 of Figure B-11 indicates that for simple
procedure a constant value of exposure factors up to a height of 10 m should be used.
The exposure factors for the windward wall are tabulated in Table D.5. Exposure factor
for leeward wall is obtained based on one half the height of the stmcture. For the present
buildmg the exposure factor for the leeward wall is 1.143 (Table 4.1.8.A).
Gust effect factor Cg:
From 4.1.8.1 .(6) the gust effect factor Cg, for the design of main wind-force resisUng
system, is 2.0.
External pressure coefficient, Cp (same for wind parallel to 100 ft and 200 ft side):
windward wall: 0.8 used with H
leeward: -0.5 used with 0.5H
151
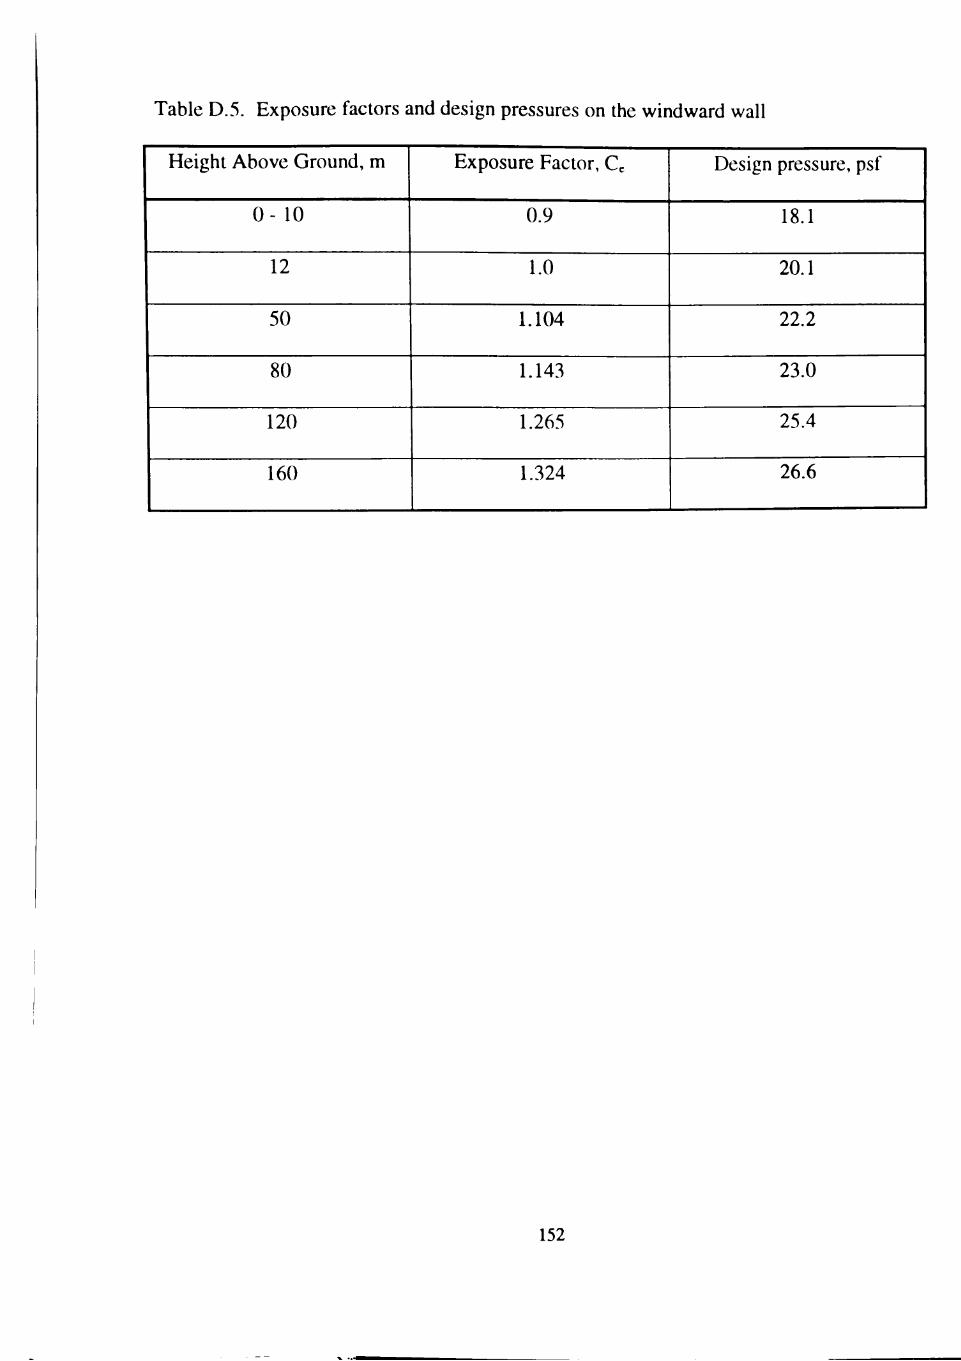
Table D.5. Exposure factors and design pressures on the windward wall
Height Above Ground, m
0 - 10
12
50
80
120
160
Exposure Factor, Ce
0.9
1.0
1.104
1.143
1.265
1.324
Design pressure, psf
18.1
20.1
22.2
23.0
25.4
26.6
152
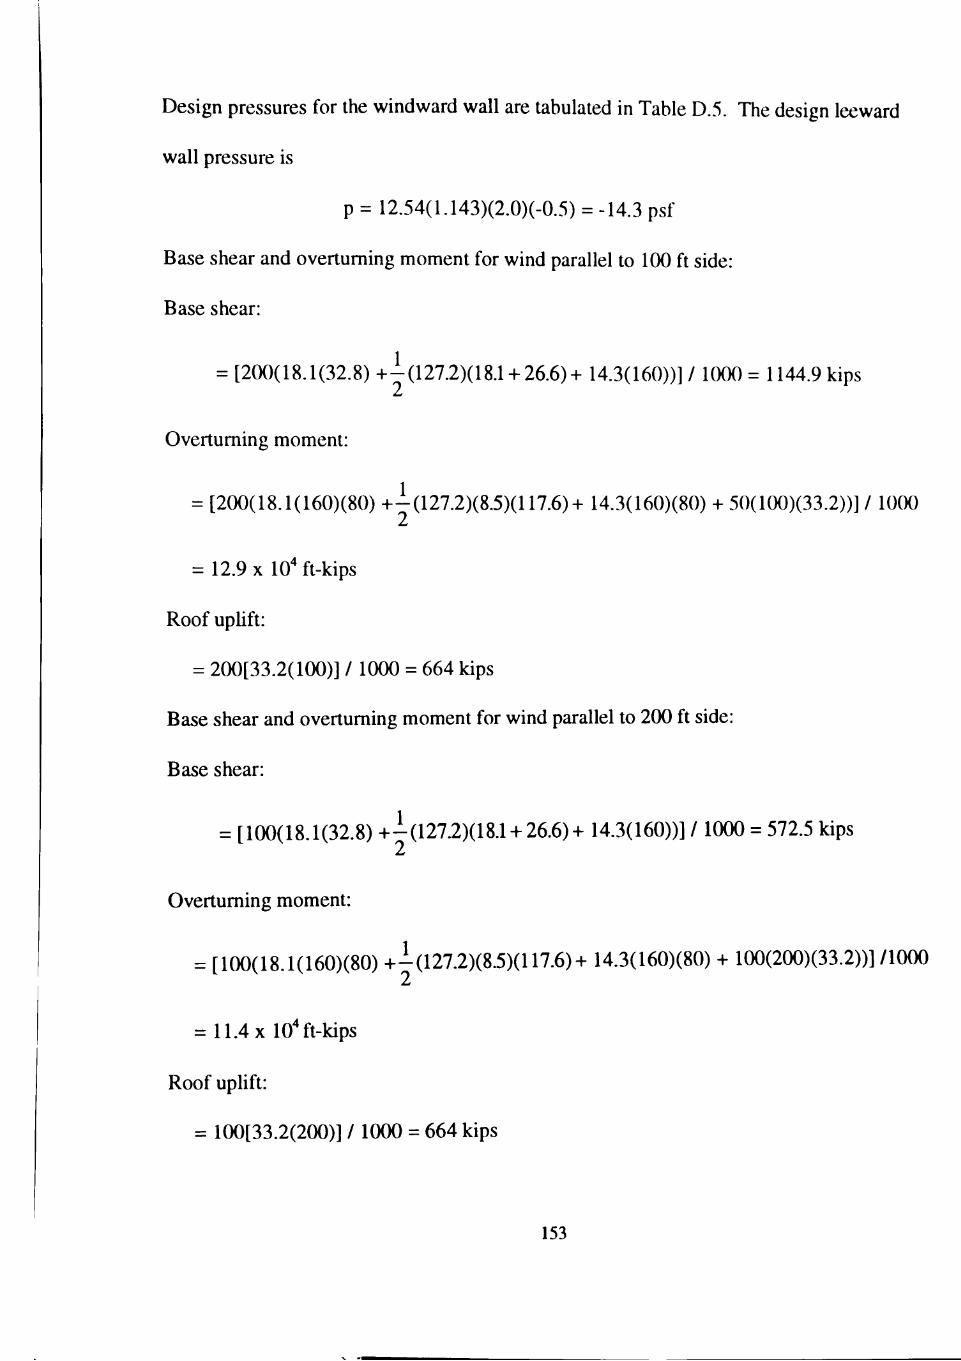
Design pressures for the windward wall are tabulated in Table D.5. The design leeward
wall pressure is
p = 12.54(1.143)(2.0)(-0.5) = -14.3 psf
Base shear and overtuming moment for wind parallel to 1(X) ft side:
Base shear:
= [200(18.1(32.8)-f--(127.2)(18.1 + 26.6)-h 14.3(160))] / 1000 = 1144.9 kips
Overtuming moment:
= [200(18.1(160)(80) -»-i(127.2)(8.5)(117.6)-h 14.3(160)(80) + 50(100)(33.2))] / 1000
= 12.9 X 10' ft-kips
Roof uphft:
= 200[33.2(100)] / 1000 = 664 kips
Base shear and overtuming moment for wind parallel to 200 ft side:
Base shear:
= [100(18.1(32.8) -h-^(127.2)(18.1 + 26.6)+ 14.3(160))] /1000 = 572.5 kips
Overtuming moment:
= [100(18.1(160)(80) -h-(127.2)(8.5)(117.6)-h 14.3(160)(80) + 100(200)(33.2))] /lOOO
= 11.4x 10'ft-kips
Roof uphft:
= 100[33.2(200)] / 1000 = 664 kips
153
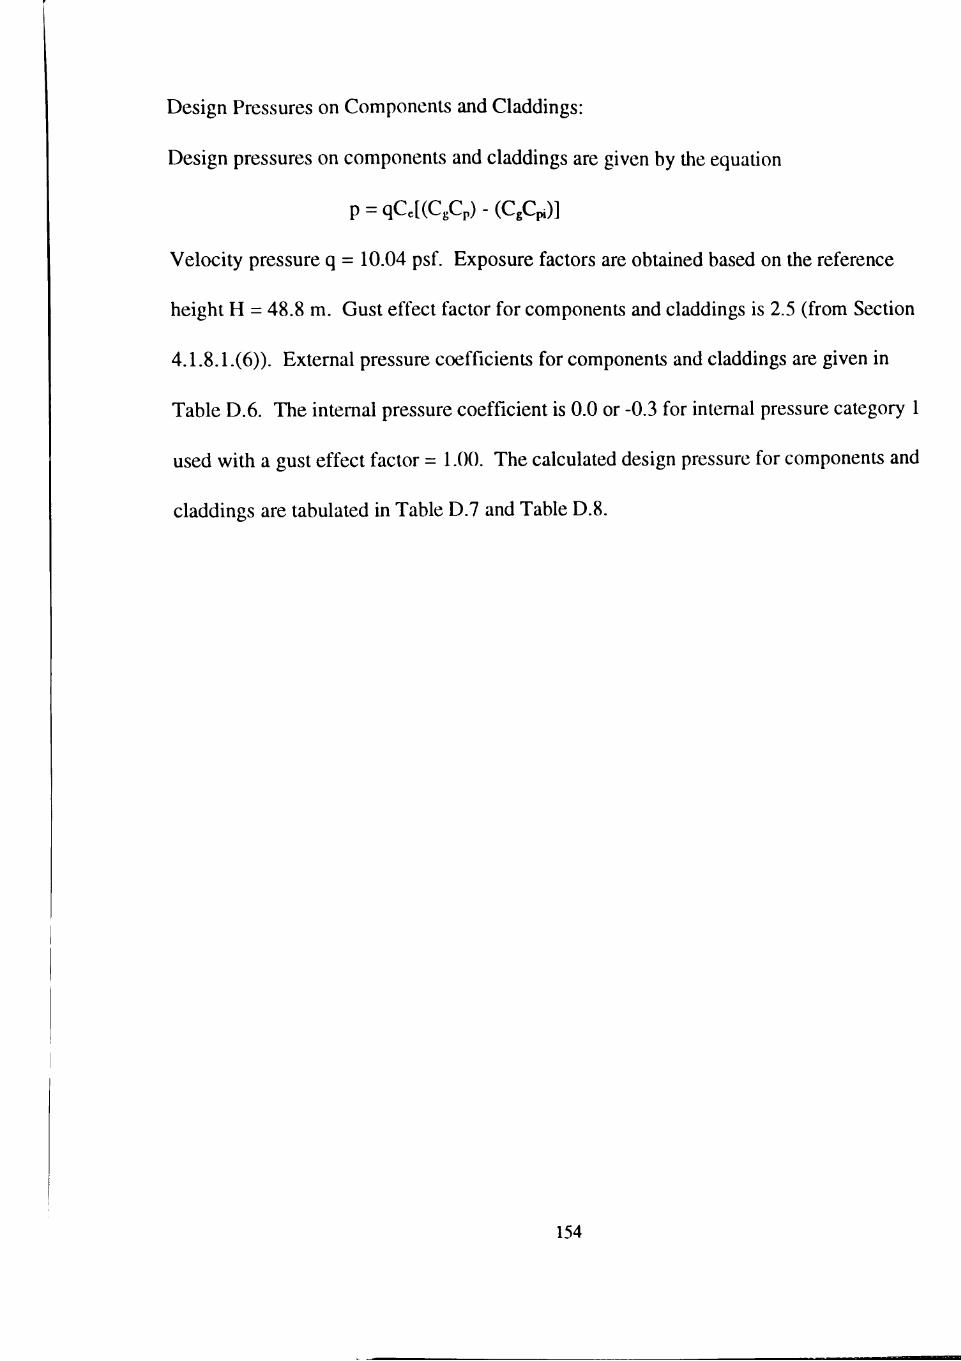
Design Pressures on Components and Claddings:
Design pressures on components and claddings are given by the equation
p = qCe[(CgCp) - (CgCpi)]
Velocity pressure q = 10.04 psf Exposure factors are obtained based on the reference
height H = 48.8 m. Gust effect factor for components and claddings is 2.5 (from Section
4.1.8.1.(6)). External pressure coefficients for components and claddings are given in
Table D.6. The intemal pressure coefficient is 0.0 or -0.3 for intemal pressure category 1
used with a gust effect factor = 1.00. The calculated design pressure for components and
claddings are tabulated in Table D.7 and Table D.8.
154
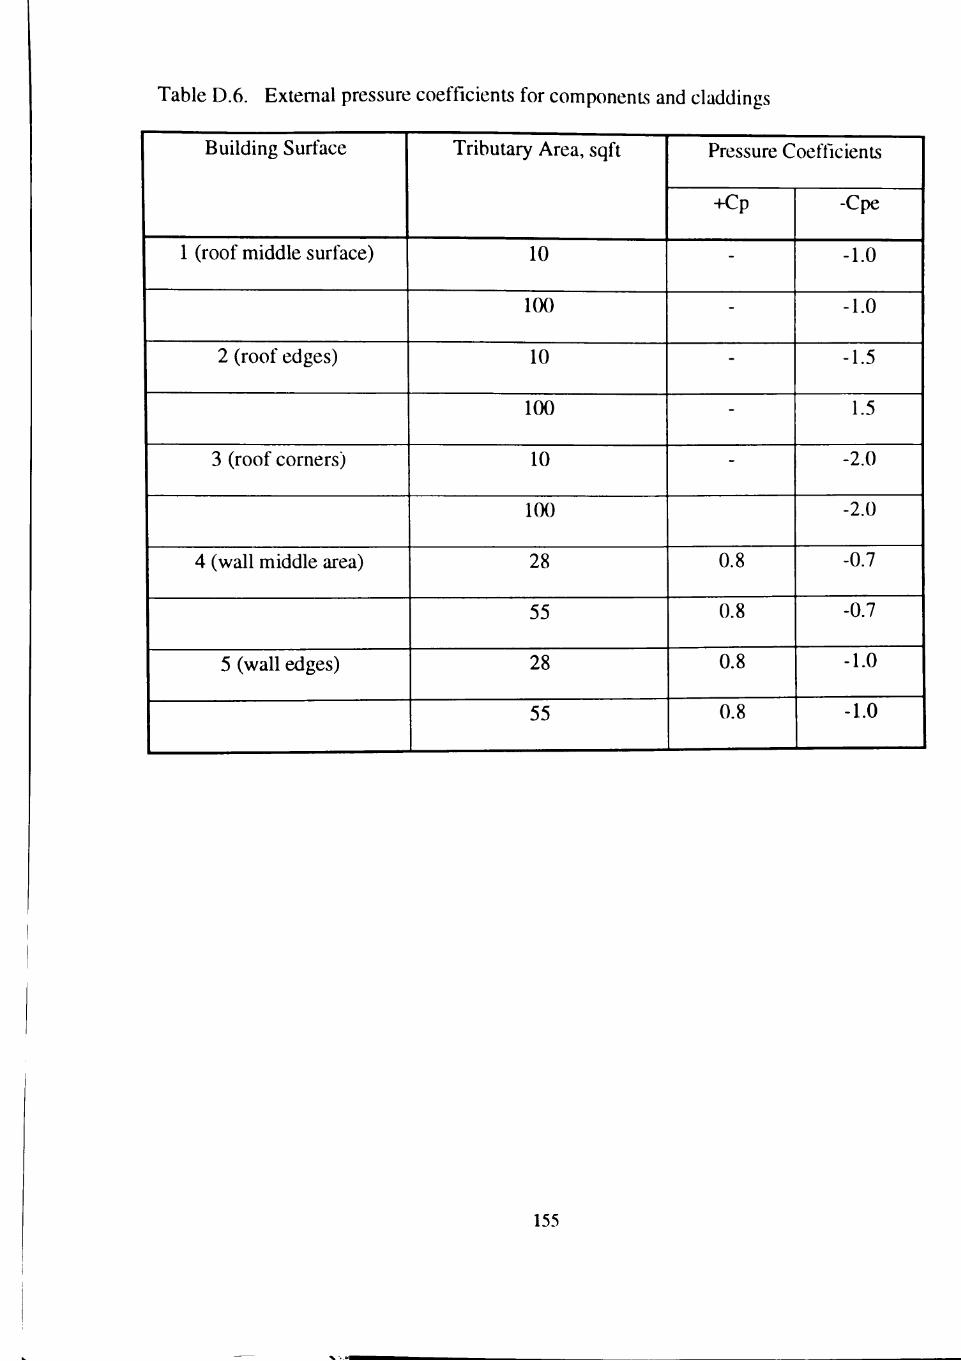
Table D.6. Extemal pressure coefficients for components and claddings
Building Surface
1 (roof middle surface)
2 (roof edges)
3 (roof corners)
4 (wall middle area)
5 (wall edges)
Tributary Area, sqft
10
100
10
100
10
100
28
55
28
55
Pressure Coefficients
+Cp
-
-
-
-
-
0.8
0.8
0.8
0.8
-Cpe
-1.0
-1.0
-1.5
1.5
-2.0
-2.0
-0.7
-0.7
-1.0
-1.0
155
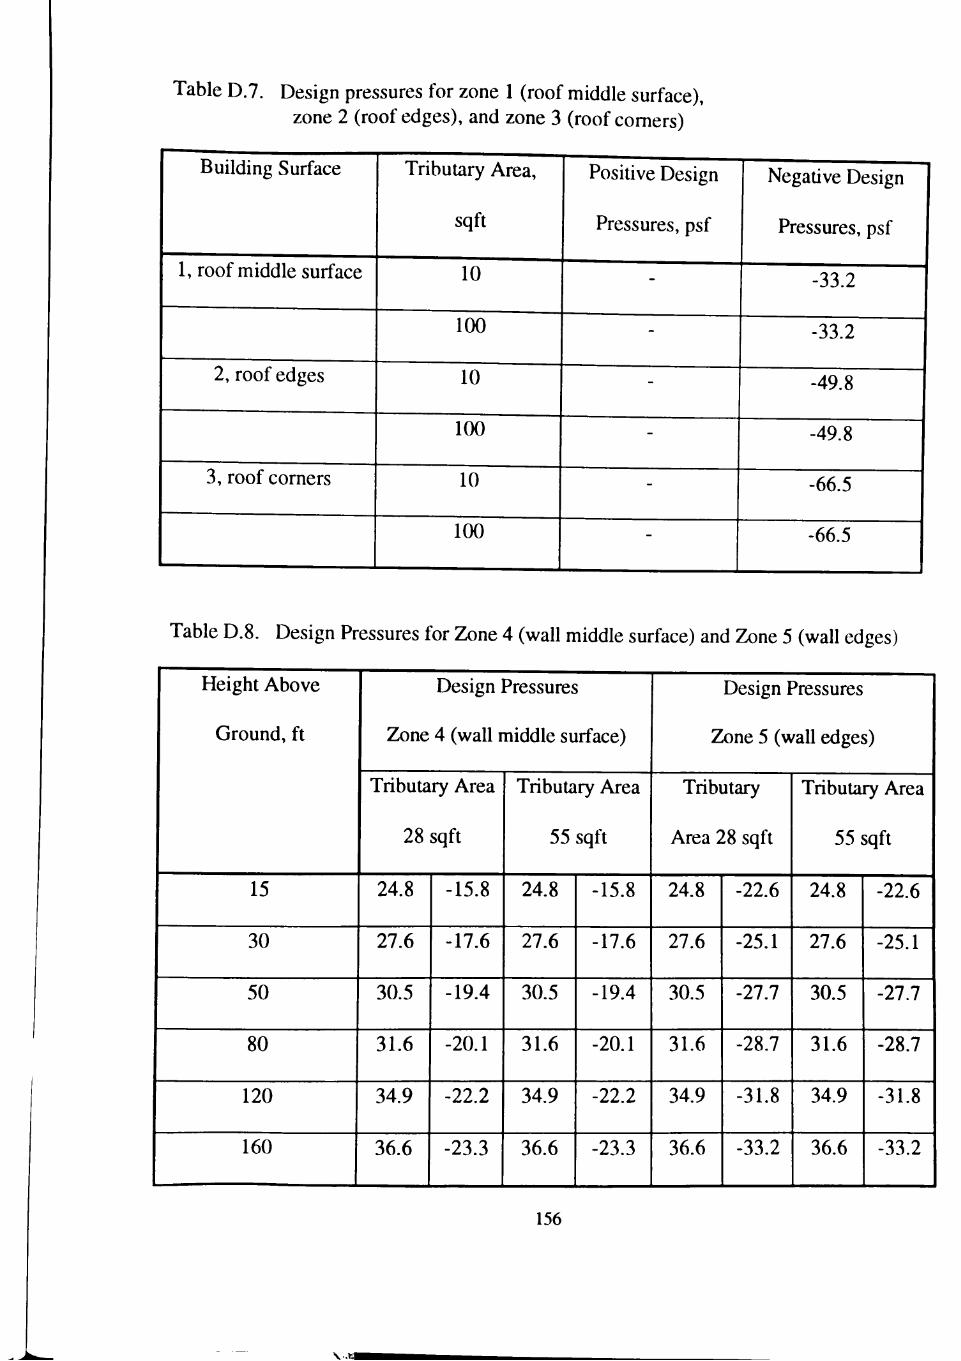
Table D.7. Design pressures for zone 1 (roof middle surface), zone 2 (roof edges), and zone 3 (roof comers)
Building Surface
1, roof middle surface
2, roof edges
3, roof corners
Tributary Area,
sqft
10
100
10
100
10
100
Positive Design
Pressures, psf
-
-
-
-
-
-
Negative Design ]
Pressures, psf
-33.2
-33.2
-49.8
-49.8
-66.5
-66.5
Table D.8. Design Pressures for Zone 4 (wall middle surface) and Zone 5 (wall edges)
Height Above
Ground, ft
15
30
50
80
120
160
Design Pressures
Zone 4 (wall middle surface)
Tributary Area
28 sqft
24.8
27.6
30.5
31.6
34.9
36.6
-15.8
-17.6
-19.4
-20.1
-22.2
-23.3
TribuUiry Area
55 sqft
24.8
27.6
30.5
31.6
34.9
36.6
-15.8
-17.6
-19.4
-20.1
-22.2
-23.3
Design Pressures
Zone 5 (wall edges)
Tributary
Area 28 sqft
24.8
27.6
30.5
31.6
34.9
36.6
-22.6
-25.1
-27.7
-28.7
-31.8
-33.2
Tributary Area
55 sqft
24.8
27.6
30.5
31.6
34.9
36.6
-22.6
-25.1
-27.7
-28.7
-31.8
-33.2
156
\..1S1
PERMISSION TO COPY
In presenting this thesis in partial fulfillment of the
requirements for a master's degree at Texas Tech University or
Texas Tech University Health Sciences Center, I agree that the Library
and my major department shall make it freely available for research
purposes. Permission to copy this thesis for scholarly purposes may
be granted by the Director of the Library or my major professor. It
is understood that any copying or publication of this thesis for
financial gain shall not be allowed without my further written
permission and that any user may be liable for copyright infringement.
Agree (Permission is granted.)
Date
Disagree (Permission is not granted.)
Student's Signature Date