Embed Size (px)
Citation preview

..
PEER-REVIEW
Comparison of U.S. EPA and European Emission Standards for Combustion and Incineration Technologies
Anthony Licata, Technical Advisor L.& C. Steinmiiller GmbH
345 Concord Road Yonkers, NY 10710-1848
Hans Ulrich Hartenstein L.& C. Steinmiiller GmbH
F abrikstrasse, 1 Gummersbach D-51641, Germany
Louis Terracciano Licata Energy & Environmental Consultants, Inc.
345 Concord Road Yonkers, NY 10710-1848
701

ABSTRACT
There has been considerable debate, misunderstanding, and controversy when comparing emission standards used in Europe and the United States. One of the first questions you hear whenever U.S. EPA publishes a new emission standard is , "Is it as restrictive or is it the same as the German standard".
Although both systems of regulation call for the use of CEMS for compliance, there are substantial differences in how emission standards are structured in Europe and in the U.S. They include reference points, averaging times, sampling methods, and technology. Generally, the European standards tend to be more restrictive, due in part to the fact that the facilities are of necessity sited in close proximity to residential areas. In Germany, for example, regulations in general are comprehensive and include both design standards and emission limits while U.S. EPA's rules are source specific and, in most cases, limited to numerical emission standards.
In some cases, comparisons can be made between emission standards and, in some cases, comparisons can only be made with restrictive caveats. The paper will present a comprehensive overview of the emission standards and how they are applied.
INTRODUCTION
The emission standards promulgated in Europe and in the U.S. by the EPA are standards intended to control air pollution from MWCs. In this sense, the standards are very similar but they differ markedly in their philosophical approach. The U.S. EPA approach is to balance the economics of the waste combustor and health benefits of the country. The European approach is to control emissions to the lowest value possible which is technologically achievable regardless of economic considerations.
To make any rational comparisons to each other, emission standards in Europe and in the U.S. must be related to each other in equivalent units. The air standards in most of Europe are on a dry basis and referenced to eleven percent oxygen content, whereas most American standards are on a dry basis and referenced to seven percent oxygen content. The U.S. EPA considers standard conditions to be at a temperature of 68°F (20°C) and a pressure of 29.92 inches of mercury (101.3 kPa), while in Europe, standard conditions are at a temperature of O°C (32°F) and a pressure of 101.3 kilopascals (29.92 in. of Hg}l. The American standards are based on the English system of weights and concentration (i.e., grains, pounds, cubic feet, parts per million by volume, etc.), while in Europe the standards are based on the metric system (grams, cubic meter, liters, etc.).
In addition to the different units of measurement, the emission standards of both utilize different averaging periods. There are also differences in sampling and testing methods which are to develop emission standards. The European standards are different for each country and vary between ten-minute averaging periods to daily averaging periods, while the American standards are based on averaging periods specific to each pollutant.
(I) The European standard flue gas condition is referenced to as a nonnal cubic meter (Nm3) whereas the American standard flue gas conditions are referenced to as a dry standard cubic meter or foot (dscm or dscf) respectively.
PEER-REVIEW 702
U.S. and European regulations also differ in other ways such as in the measures for the calibration of the instruments which are different even among the countries of Europe.
u.s. EPA EMISSION STANDARDS
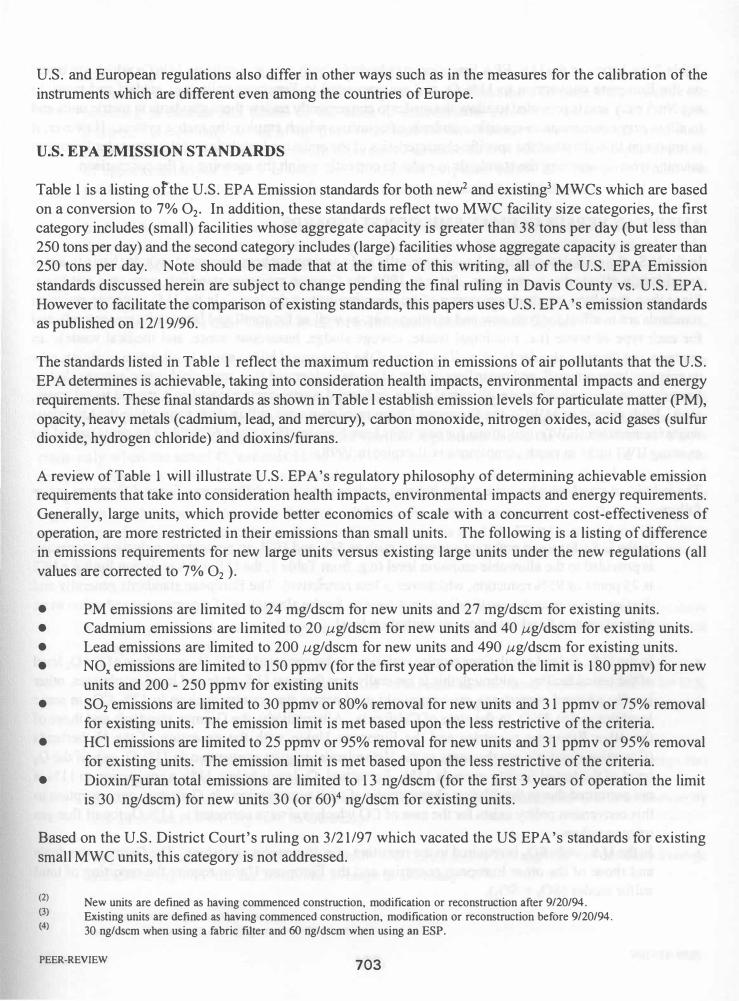
Table 1 is a listing or the U.S. EPA Emission standards for both new2 and existing3 MWCs which are based on a conversion to 7% 02' In addition, these standards reflect two MWC facility size categories, the first category includes (small) facilities whose aggregate capacity is greater than 38 tons per day (but less than 250 tons per day) and the second category includes (large) facilities whose aggregate capacity is greater than 250 tons per day. Note should be made that at the time of this writing, all of the U.S. EPA Emission standards discussed herein are subject to change pending the final ruling in Davis County vs. U.S. EPA. However to facilitate the comparison of existing standards, this papers uses U.S. EPA's emission standards as published on 12/19/96.
The standards listed in Table 1 reflect the maximum reduction in emissions of air pollutants that the U.S. EPA determines is achievable, taking into consideration health impacts, environmental impacts and energy requirements. These final standards as shown in Table I establish emission levels for particulate matter (PM), opacity, heavy metals (cadmium, lead, and mercury), carbon monoxide, nitrogen oxides, acid gases (sulfur dioxide, hydrogen chloride) and dioxins/furans.
A review of Table 1 will illustrate U.S. EPA's regulatory philosophy of determining achievable emission requirements that take into consideration health impacts, environmental impacts and energy requirements. Generally, large units, which provide better economics of scale with a concurrent cost-effectiveness of operation, are more restricted in their emissions than small units. The following is a listing of difference in emissions requirements for new large units versus existing large units under the new regulations (all values are corrected to 7% O2 ).
• PM emissions are limited to 24 mgldscm for new units and 27 mgldscm for existing units. • Cadmium emissions are limited to 20 ,Ugldscm for new units and 40 ,Ugldscm for existing units. • Lead emissions are limited to 200 ,Ugldscm for new units and 490 ,Ugldscm for existing units. • NOx emissions are limited to 150 ppmv (for the first year of operation the limit is 180 ppmv) for new
units and 200 - 250 ppmv for existing units • S02 emissions are limited to 30 ppmv or 80% removal for new units and 31 ppmv or 75% removal
for existing units. The emission limit is met based upon the less restrictive of the criteria. • HCI emissions are limited to 25 ppmv or 95% removal for new units and 31 ppmv or 95% removal
for existing units. The emission limit is met based upon the less restrictive of the criteria. • Dioxin/Furan total emissions are limited to 13 ngldscm (for the first 3 years of operation the limit
is 30 ngldscm) for new units 30 (or 60)4 ngldscm for existing units.
Based on the U.S. District Court's ruling on 3121/97 which vacated the US EPA's standards for existing small MWC units, this category is not addressed.
(2) (3) (4)
New units are defined as having commenced construction, modification or reconstruction after 9/20/94. Existing units are defined as having commenced construction, modification or reconstruction before 9/20/94. 30 ng/dscm when using a fabric filter and 60 ng/dscm when using an ESP.
PEER-REVIEW 703

Table 2 is a listing of the U.S. EPA Emission standards for both new and existing MWCs which are based on the European conversion to 11 % O2 and are converted to European units (i.e., gr/dscf and ppmv to mglNm3, etc.) and is provided to allow the reader to conveniently review these standards in metric units and to allow easy comparison to specific standards of countries which employ the metric system. However, it is important to understand the specific characteristics of the emission legislation of the particular European country when comparing the standards in order to correctly weigh the meaning of the comparison.
AMERICAN VERSUS GERMAN EMISSION STANDARDS
In the U.S., the emission standards have historically and consistently been presented on a dry basis to avoid any dilution effects due to moisture. Prior to 1990, the German emission standards were on a wet basis. Since then, they have required conversion of emission results to a dry basis. In the U.S., separate emission standards are in effect for both new and existing units, as well as for small and large units respectively and for each type of waste (i.e. municipal waste, sewage sludge, hazardous waste, and medical waste). In contrast, the German standards, as well as those of the European Union, apply to all waste facilities, new or existing, large or small, and regardless of type of waste incinerated (i.e. municipal waste, sewage sludge, hazardous waste, medical waste, chemical waste, industrial waste, contaminated soil, treated wood waste, etc.). With respect to MWCs, the European Union regulations are still in draft form while the hazardous waste incineration (HWI) regulations for new units have been in effect since 6/29/93. The grace period for existing HWI units to reach compliance will expire in 1998.
The individual standards also have subtle but nonetheless distinctive differences. Some differences are as follow.
• In the U.S., for some pollutant emissions such as S02 and HCI, an percentage reduction alternative is provided to the allowable emission level (e.g. from Table 1, the U.S. EPA emission limit for HCI is 25 ppmv or 95% reduction, whichever is less restrictive). The European standards generally and the German standards specifically do not provide for the alternative of a percentage reduction as an alternative to a fixed emission concentration level.
• In the U.S., federal regulations require emissions to be corrected to 7% O2, regardless of the O2 level of the tested facility. Although this is generally true for most U.S. state and local regulations, other locally adopted corrections are commonly used across the country such as to 12% CO2 in some localities and to 3%02 in the state of California. Alternatively, the German standards and those of the other European countries and the European Union with the exception of the Netherlands (Canadian standards are the same as the Netherlands) require conversion to 11 % O2 only if the O2 level of the tested facility exceeds 11 %. For actual O2 levels below 11 %, a conversion to 11 % is not permitted due to the dilution characteristic of such a conversion. In Germany, one exception to this conversion policy exists for the case of CO which is always corrected to 11 % O2 for all flue gas oxygen values.
• In the U.S., only S02 is required in the reporting of sulfur oxides emissions. The German standards and those of the other European countries and the European Union require the reporting of total sulfur oxides (S02 + S03)'
PEER-REVIEW 704

• In the U.S., dioxins and furans (tetra through octa) are reported on a total mass basis (ngldscm). The German standards and those of the other European countries and the European Union require the reporting of dioxins and furans on the basis of International Toxic Equivalents (ITEQ). This difference is especially vexing in that there is no basis for direct comparison or conversion of these reporting systems an the ratios between them can be as much as 30 - 100 to 1. In this paper, a ratio of approximately 62.5 to 1 is used for comparison purposes only. The European Union has published only a guideline (target) for dioxins to date and has not established a standard.
• In the U.S., heavy metals are reported on an individual basis. The German standards and those of the other European countries and the European Union require the reporting of heavy metals on the basis of groups (i.e., Class I, Class II and Class III). Each group consists of a summation of several metals and can be composed of different metals by each country to further add to the difficulty in making direct comparison or conversion of the standards. These groupings of the various metals is done to account for their various levels of toxicity and environmental impact.
Table 3 directly compares the U.S. and German standards for large mass burn facilities (i.e., facility capacity greater than 250 tons per day) in terms of European units of measurement (i.e., mglNm3 and ng ITEQlNm3). Table 3 lists both the short-term and the long-term limits in the respective columns for the German regulations. This table illustrates the more restrictive nature of the German regulations relative to those promulgated by U. S. EPA. A unique aspect of the German regulations is that the correction to 11 % O2 is made only when the actual O2 exceeds 11 %. This detail may be lost to a reviewer when he attempts to compare emissions from facilities worldwide and more importantly frustrates "apples to apples" comparisons of data. Clearly, such a nuance highlights the fact that essential differences exist among regulations and data derived therefrom that ostensibly use the same correction factors. The following is a comparison of major pollutant emission limits in Germany versus the U.S. EPA limits and are illustrative of the more stringent emission limits under the German regulations (all values are in metric units and corrected to 11 % O2 ).
•
•
•
•
•
(5) (6)
S02 emissions are limited to 615 mglNm3 or 80% removal whichever is less restrictive for the daily average by U.S. EPA, and to 50 mglNm3 for the daily average and to 200 mglNm3 for the 30-minute average in Germany.
HCl emissions are limited to 28(1) mglNm3 or 95% removal whichever is less restrictive by U.S. EPA, and to 10 mglNm3 for the daily average and to 60 mglNm3 for the 30-minute average in Germany.
PM emissions are limited to 17 mglNm3 by U.S. EPA, and to 10 mglNm3 for the daily average and to 30 mglNm3 for the 30-minute average in Germany. Mercury emissions are limited to 0.061 mglNm3 or 85% removal whichever is less restrictive by U.S. EPA and to 0.056 mglNm3 in Germany.
NOx emissions are limited to 219(1) mglNm3 by U.S. EPA, and to 200 mglNm3 for the daily average and to 400 mglNm3 for the 30-minute average in Germany.
Based on a 24-hour geometric mean Based on: 30-minute < averaging time < 120 minute
PEER-REVIEW 705
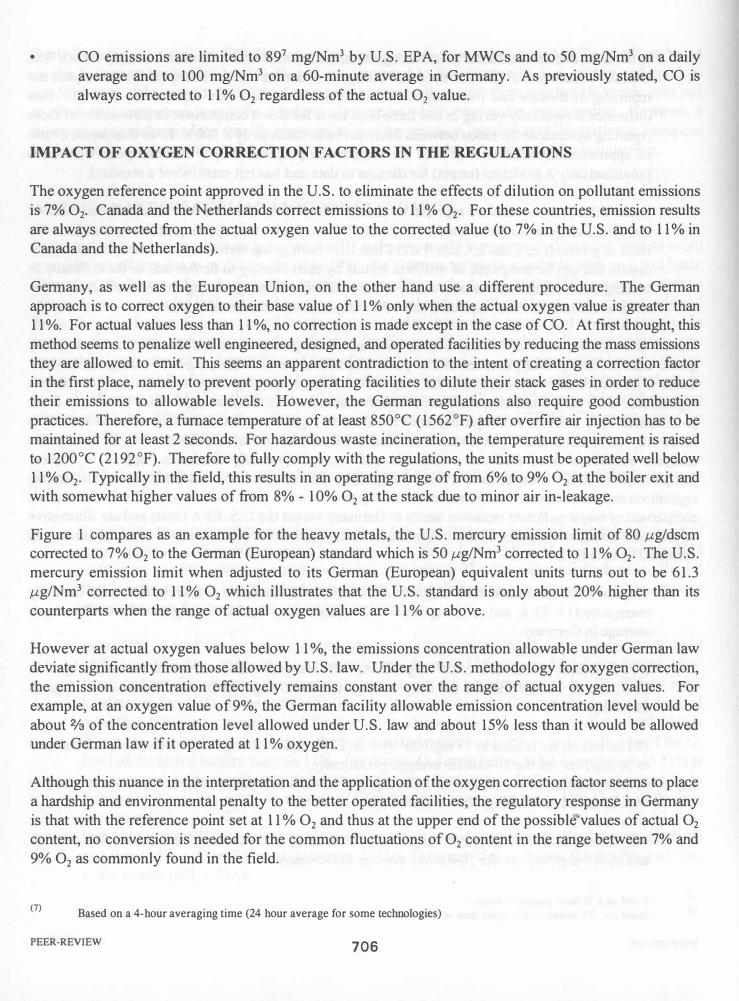
• CO emissions are limited to 897 mglNm3 by U.S. EPA, for MWCs and to 50 mglNm3 on a daily average and to 100 mglNm3 on a 60-minute average in Germany. As previously stated, CO is always corrected to 11 % O2 regardless of the actual O2 value.
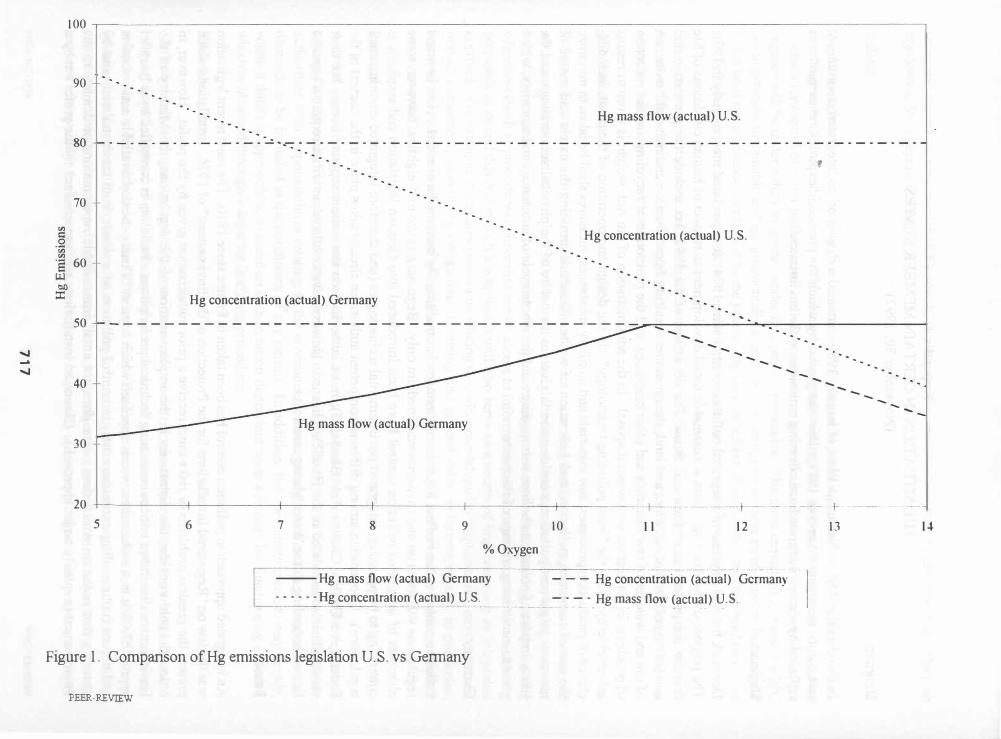
IMPACT OF OXYGEN CORRECTION FACTORS IN THE REGULATIONS
The oxygen reference point approved in the U.S. to eliminate the effects of dilution on pollutant emissions is 7% O2, Canada and the Netherlands correct emissions to 11 % O2, For these countries, emission results are always corrected from the actual oxygen value to the corrected value (to 7% in the U.S. and to 11 % in Canada and the Netherlands).
Germany, as well as the European Union, on the other hand use a different procedure. The German approach is to correct oxygen to their base value of 11 % only when the actual oxygen value is greater than 11 %. For actual values less than 11 %, no correction is made except in the case of CO. At first thought, this method seems to penalize well engineered, designed, and operated facilities by reducing the mass emissions they are allowed to emit. This seems an apparent contradiction to the intent of creating a correction factor in the first place, namely to prevent poorly operating facilities to dilute their stack gases in order to reduce their emissions to allowable levels. However, the German regulations also require good combustion practices. Therefore, a furnace temperature of at least 850°C (1562°F) after overfire air injection has to be maintained for at least 2 seconds. For hazardous waste incineration, the temperature requirement is raised to 1200°C (2192 OF). Therefore to fully comply with the regulations, the units must be operated well below 11 % O2, Typically in the field, this results in an operating range of from 6% to 9% O2 at the boiler exit and with somewhat higher values of from 8% - 10% O2 at the stack due to minor air in-leakage.
Figure 1 compares as an example for the heavy metals, the U.S. mercury emission limit of 80 ,ug/dscm corrected to 7% O2 to the German (European) standard which is 50 ,uglNm3 corrected to 11 % O2, The U.S. mercury emission limit when adjusted to its German (European) equivalent units turns out to be 61.3 ,uglNm3 corrected to 11 % O2 which illustrates that the U.S. standard is only about 20% higher than its counterparts when the range of actual oxygen values are 11 % or above.
However at actual oxygen values below 11 %, the emissions concentration allowable under German law deviate significantly from those allowed by U.S. law. Under the U.S. methodology for oxygen correction, the emission concentration effectively remains constant over the range of actual oxygen values. For example, at an oxygen value of 9%, the German facility allowable emission concentration level would be about % of the concentration level allowed under U.S. law and about 15% less than it would be allowed under German law if it operated at 11 % oxygen.
Although this nuance in the interpretation and the application of the oxygen correction factor seems to place a hardship and environmental penalty to the better operated facilities, the regulatory response in Germany is that with the reference point set at 11 % O2 and thus at the upper end of the possible values of actual O2 content, no conversion is needed for the common fluctuations of O2 content in the range between 7% and 9% O2 as commonly found in the field.
(7) Based on a 4-hour averaging time (24 hour average for some technologies)
PEER-REVIEW 706

In summary, this means that under German law with a high reference point of 11 % O2, the mass flow is kept constant above the reference point and decreases below it. Whereas the permissible actual concentration is kept constant below it and decreases above the reference point. Under U.s. EPA's rule, the reference point is set within the realistic range of actual O2 values attainable with good combustion practice. The mass flow is kept constant over the whole range of the O2 fluctuation. Due to the correction the actual concentration decreases below and increases above the reference point.
..
EMISSION STANDARDS FOR SELECTED EUROPEAN COUNTRIES
A listing of the status of air emissions regulations for selected European countries entitled "The Situation in Certain Member States" as it appears in the "Explanatory Memorandum on Integrated Pollution Prevention and Control" (IPC) section of the European Union is included as Appendix 1 to this paper. Appendix 1 provides an interesting analysis of the status of and the philosophy for environmental regulations for each of the selected countries.
In Germany, environmental regulations have taken a three pronged approach to the waste management problem.
First, they have significantly enhanced their recycling efforts by enacting laws such as the "Green Dot" law which requires increased recycling while concurrently forcing reductions in packaging materials usage.
Second, they have enacted very strict regulations governing air emissions and fly ash disposal which are covered in this paper. The consequence of this regulatory severity has been to raise the range of cost for waste disposal to the range of DM 300 - DM 400/tonne ($180 - $240Iton). All the bottom ash is currently being recycled or reused in Germany and fly ash is disposed of as a hazardous waste. Presently, there is very little ash recycling or reuse in the U.S. due to poor economics and the uncertain regulatory outlook.
Third, the German government has virtually banned the future use of landfills for MSW disposal. Further, Germany and the EU has banned the exporting of waste to other countries and Germany has greatly limited the flow of waste even from one German state to another. These policies have effectively made waste disposal via recycling and MWCs the only viable game in town. Competition with "cheap" landfills has been eliminated due to their restrictive laws governing landfills i.e. starting in 2005, no material with an organic carbon content (TO C) of �5% can be landfilled anymore.
Table 4 compares selected European emission guidelines for waste incineration including the German, Austrian, Swedish, and Dutch standards with the draft guideline for the European Union for large mass bum units. It is noteworthy that all the standards included in Table 4 are applicable to all waste incineration except for the draft guidelines for the European Union. Table 6 lists the promulgated emission standards for hazardous waste incinerators of the European Union together with the German and Dutch standards. A review of these tables reveals that they vary widely on the basis of both averaging times as well as in the quantitative emission limits although the measurement units are consistently expressed in mg/Nm3 corrected to 11 % 02. Oftentimes, this variation of averaging time in the basis of the regulations results in difficulty when attempting a direct comparison of one standard to another. To illustrate, a comparison of averaging times for each country is presented as follows.
PEER-REVIEW 707
•
•
•
•
•
Federal Republic of Germany Austria Sweden Netherlands Draft European Directive
24-hour average & maximum Yl-hour daily mean monthly mean maximum I -hour mean Yl-hour mean & 24-hour maximum
As a result of the above differences, it is not at all clear, for example, if the Netherlands' one-hour mean standard for HCI of 10 mg/Nm3 which is always corrected to 11 % O2 is more or less restrictive than say the German 24-hour average standard of 10 mg/Nm3 which is only corrected to 11 % O2 if the actual O2 value exceeds 11 %. Of course, as the informational data base is expanded over time, the problems associated with the disparity in the regulations will be ameliorated.
In the meantime, what is clear for the foreseeable future is that the European Community, driven largely by the German and Dutch regulations, will require maximum reductions in pollutant emissions together with concurrently high levels of sophistication of air pollution control technology to achieve their regulatory standards. The obvious result of this European regulatory philosophy is the allocation of unlimited economic resources to the application of technology to control air pollution at MWCs.
In the U.S., however, EPA's philosophy is, and will be for the foreseeable future, to have technology represent what is economically practicable and reasonable to the affected community to control air pollution. A new or proposed facility, in order to be constructed, is required to address the concerns of human health by means of a health risk assessment during the siting and permitting process. To this end, the health risk assessment is used to establish the level of technology required by the facility to mitigate the air pollution.
OTHER EMISSION STANDARDS WORLDWIDE
Table 5 is a listing of other standards and guidelines in effect for other selected countries around the world. Although not as comprehensive as those presented in Table 4, they further illustrate the range of values deemed appropriate by the environmental regulators of these nations at this point in time.
CONCLUSION
Although emission standards for MWCs in Europe and in the U.S. are intended to reduce and control air pollution, the similarity seems to end at this point. To the extent that the standards are similar it is in that the standards of both seek to control emission levels for particulate matter (PM), heavy metals (such as cadmium, lead, and mercury), carbon monoxide, nitrogen oxides, acid gases (sulfur dioxide, hydrogen chloride) and dioxins/furans. Differences are evident in the structure and philosophical approach to the regulation of air emissions from MWCs in Europe and in the U.S. Structurally, these differences include reference points for the emissions (i.e. to 7% O2 in the U.S: vs. 11 % in Europe), averagtng times (generally based on a country in Europe and on a pollutant in the U.S.), sampling methods, and technology. Philosophically, the U.S. EPA's approach is to balance the economics of the MWC and health benefits of the country. The European approach is to control pollution to the lowest value possible which is technologically achievable regardless of economic or other considerations.
PEER-REVIEW 708
The German standards, however, are more comprehensive compared to those adopted in this country. The German standards cover all waste management facilities regardless of whether they are new or existing, their size, the type of waste processed, the type of combustion technology used (e.g. fluid bed, rotary kiln) or the type of front-end waste processing (RDF). By contrast in the US, the regulations provide different limitations for the type of waste processed, for new or existing units, unit sizes, the type of combustion technology used (e.g. fluid bed, rotary kiln) and for the type of front-end waste processing (RDF) .
..
Comparison of data between European standards and results with those of the US cannot be accomplished without knowing the flue gas oxygen value which is often not reported8• German emission results, for example, cannot be converted to 7% O2 and U.S. measurement units unless the actual flue gas O2 is provided. U.S. results on the other hand can readily be converted to German units without difficulty. It would be an improvement to the information transfer process if a common basis for reporting results could be developed.
However, the review of all the environmental regulations covered indicates the diversity of approach to air emissions regulations across the globe. This regulatory diversity reflects the traditions, the environmental and economic priorities, and the regulatory mind-set of each country and should not be viewed in terms like better or worse, or right or wrong.
The authors have presented comparisons of the most recent emission standards as promUlgated by the U.S. EPA, the European Community, and several major European countries to provide the reader with a capsule understanding of the similarities, the differences, and some pitfalls to the gathering of data and information which presently exist among them.
(8) as well as the particular reference point (temperature, pressure) and the averaging time, which are generally reported.
PEER-REVIEW 709

REFERENCES
1. G. K. Crane, L. Brasowski, C. Craig, "Comparison Between the Clean Air Act (American Standard) and the European Directive", Paper Presented at the Conferenc.e-.OiEuropeanllemand and Scandinavian Solutions, Sweden, April 17, 1996.
2. Official Journal of the European Communities, "Proposal for a Council Directive on the Incineration of Hazardous Waste", submitted by the Commission on March 23, 1992.
3. L. L. Sloss, "Emissions and Effects of Air Toxics from Coal Combustion: An Overview", Paper Presented at Managing Hazardous Air Pollutants: State ofthe.Art, 13-15 July 1993, Washington D.C.
..
PEER-REVIEW 710

Table 1. U.S. EPA emission standards(l) for MWCs as of 12/95.
Emission Limits @7% 02
Existing MWC Facilities New MWC Facilities
Pollutant .. Units >38 TID >250 TID >38 TID >250 TID
PM mg/dscm 70 27 24 24 (gr/dscf) (0.03) (0.0 12) (0.010) (0.0 10)
Opacity 6 min. avg. 10% 10% 10% 10%
Metal Emissions
Cd ,ug/dscm 100 40 20 20
Pb ,ug/dscm 1,600 490 200 200
Hg ,ug/dscm or 80 or 80 or 80 or 80 or % reduction 85% 85% 85% 85%
CO ppmv 100 100 100 100
NOx ppmv no limit 200(2) no limit 150m
S02 ppmv or 80 or 310r 30 or 30 or % reduction 50% 75% 80% 80%
HCl ppmv or 250 or 310r 25 or 25 or % reduction 50% 95% 95% 95%
DioxinslFurans ng/dscm 125 60 (ESP) 13 13(4)
mass 30 (FF)
(1) Subject to change pending results of the Davis County case
(2) Can use off-site credits or "Bubbling".
(3) For the first year of operation, the NO. limit is 180 ppmv; then 150 ppmv thereafter.
(4) For the first 3 years of operation, the DioxinlFuran limit is 30 ng/dscm; then 13 ng/dscm thereafter
PEER-REVIEW 711
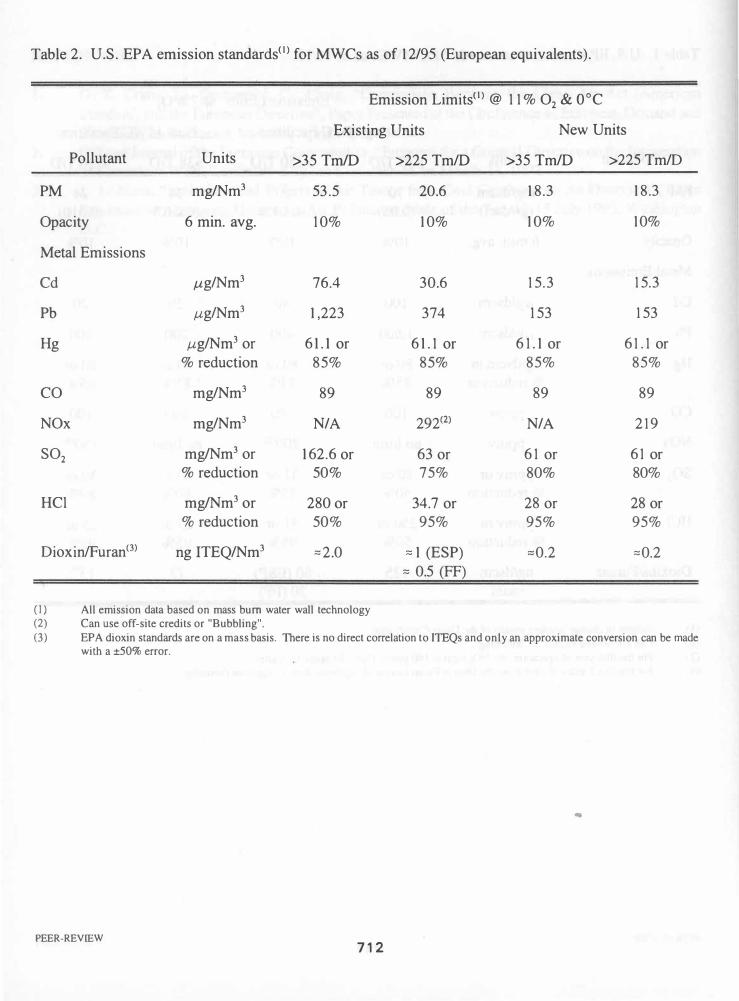
Table 2. U.S. EPA emission standards{l) for MWCs as of 12/95 (European equivalents).
Emission Limits(l) @ 1 1 % O2 & O°C
Existing Units New Units
Pollutant Units >35 TmID >225 TmID >35 TmID >225 TmID
PM mgINm3 53.5 20.6 18.3 18.3
Opacity 6 min. avg. 10% 10% 10% 10%
Metal Emissions
Cd ,uglNm3 76.4 30.6 15.3 15.3
Pb ,uglNm3 1,223 374 153 153
Hg ,uglNm3 or 61.1 or 61. 1 or 6 1.1 or 6 1. 1 or % reduction 85% 85% 85% 85%
CO mgINm3 89 89 89 89
NOx mgINm3 N/A 292(2) N/A 2 19
S02 mgINm3 or 162.6 or 63 or 6 1 or 6 1 or % reduction 50% 75% 80% 80%
HCI mgINm3 or 280 or 34.7 or 28 or 28 or % reduction 50% 95% 95% 95%
DioxinlFuran(3) ng ITEQINm3 :::::2.0 ::::: 1 (ESP) :::::0.2 :::::0.2 ::::: 0.5 (FF)
(1) All emission data based on mass burn water wall technology (2) Can use off-site credits or "Bubbling".
(3) EPA dioxin standards are on a mass basis. There is no direct correlation to lTEQs and only an approximate conversion can be made with a ±50% error.
..
PEER-REVIEW 712
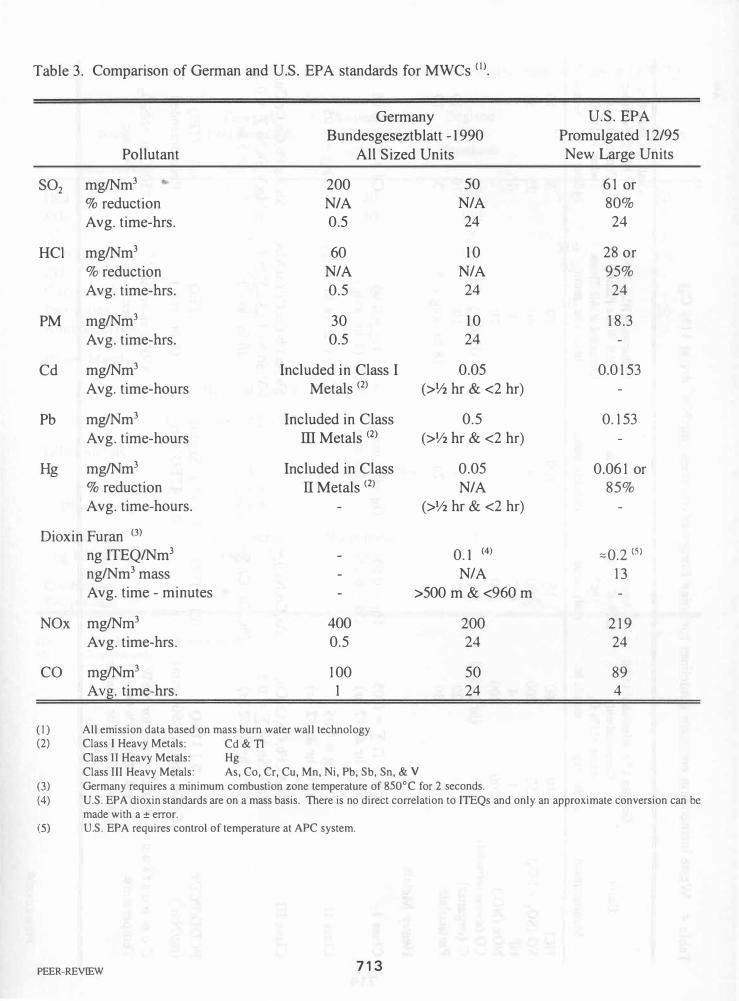
Table 3. Comparison of German and U.S. EPA standards for MWCs (I).
Germany Bundesgeseztblatt -1990
Pollutant All Sized Units
S02 mg/Nm3 200 50 % reduction N/A N/A A vg. time-hrs. 0.5 24
HCI mg/Nm3 60 10 % reduction N/A N/A A vg. time-hrs. 0.5 24
PM mg/Nm3 30 10 A vg. time-hrs. 0.5 24
Cd mg/Nm3 Included in Class I 0.05 A vg. time-hours Metals (2) (>Y2 hr & <2 hr)
Pb mg/Nm3 Included in Class 0.5 A vg. time-hours III Metals (2) (>Y2 hr & <2 hr)
Hg mg/Nm3 Included in Class 0.05 % reduction IT Metals (2) N/A A vg. time-hours. (>Y2 hr & <2 hr)
Dioxin Furan (3) ng ITEQ/Nm3 0.1 (4)
ng/Nm3 mass N/A A vg. time - minutes >500 m & <960 m
NOx mg/Nm3 400 200 A vg. time-hrs. 0.5 24
CO mg/Nm3 100 50 Avg. time-hrs. 1 24
(1) All emission data based on mass burn water wall technology (2) Class I Heavy Metals: Cd & TI
Class II Heavy Metals: Hg Class III Heavy Metals: As, Co, Cr, Cu, Mn, Ni, Pb, Sb, Sn, & V
(3) Germany requires a minimum combustion zone temperature of 850°C for 2 seconds.
U.S. EPA Promulgated 12/95 New Large Units
6 1 or 80%
24
28 or 95% 24
18.3
0.0 153
0. 153
0.06 1 or 85%
::::0.2 (5)
13
2 19 24
89 4
(4) U.S. EPA dioxin standards are on a mass basis. There is no direct correlation to lTEQs and only an approximate conversion can be made with a ± error.
(5) U.S. EPA requires control of temperature at APC system.
PEER-REVIEW 713

� -' �
Table 4. Waste incineration emission guidelines for some European countries (mg/Nm3 dry at 11% 02)'
Basis
Measurement
HCl SO (S02 + S03) HF NOx (N02) CO (always corrected)
C (organic) Particulate
Heavy Metals
Class I
Class II
Class III
PCDDIPCDF (ng/Nm3)
German 17th BImSch V 11/90 Corrected only when >11% O2
24 hr. avg max. \12 hr.
10 50 1
200 50 10 10
60 200
4 400
(hr.) 100 20 30
Cd + TI I = 0.05 (>Y2 hr & <2 hr)
Hg = 0.05 (>Y2 hr & <2 hr)
Sb,As,Pb,Co,Cr,Cu, Mn,V,Sn,Ni I = 0.5
(>Y2 hr & <2 hr)
0.1 ITEQ (>500 min & <960 min)
, C o m b u s t i o n 850°C >2 sec. for MSW Temperature and MWI >6% 02;
PEER-REVIEW
1200°C >2 sec. for Sludge >6% O2
Austria LKR-K 15.07.
1988 daily mean
15 100 0.7 100 100 20 25
Hg = 0.05 Cd = 0.05
AS,Co,Ni I= 1
Pb, Zn, Cr I= 4
0.1 ITEQ
Sweden
monthly mean
100
20
Hg =0.6 max 0.3 aim
0.5 -2.0 Stndrd 0.1 ITEQ aim
Netherlands BLA 1993 All Waste Plants
Corrected at All Times max. 1 hr. mean
10 40 1
70 (Boiler) 50
10 (8 hr. avg.) 5
Hg = 0.05 (8 hr. avg.)
Cd = 0.05 (8 hr. avg.)
Sb,As,Pb,Co,Cr,Cu,Mn, V,Sn,Ni, Te,Se I = 1
(8 hr. avg.)
0.1 ITEQ (8 hr. avg.)
850°C at >6%02 >2 sec.
A46
Draft EU Directive for MWC Facilities
Corrected only when >11% 02
24-hour \I2-hour
5 25 1
50 10 5
10 50 2
10 10
Cd + TI = 0.05
Hg = 0.05
Sb,As,Pb, Co, Cr, Cu, Mn,V,Sn,Ni I = 0.5
(>.5 hr.)
0.1 ITEQ Recommended
850°C at >6%02 >2 sec.

Table 5. Waste incineration emission guidelines for other selected countries (mglNm3 dry at 11 % 02).
Denmark Switzerland England Basis 1991 Standards 1992 Standards 1990 Japan Taiwan
>350 kw Standards Measurement daily mean
co
HCI 65 20 30 7(9P 50 S02 300 50 300 100 HF 2 2 2 2 NOx (N02) 80 350 514 370 CO 100 50 63 C (organic) 20 20 Particulate 40 10 30 20 10 Ammonia (NH3) 5
Heavy Metals
Hg Hg + Cd I= 0.2 0.1 0.1
Cd Hg +Cd I=0.2 0.1 0.1
Other Metals Pb 1 Pb +Zn I=0.2
Ni +As L= 1 Pb + Cr + Cu + Mn L=5
PCDDIPCDF Recommended Recommended 0.1 0.5 (2) (ng ITEQlNm3) Value = 0.1 Value = 0.1
Combustion 800°C at Temperature >6%02 ; >2 sec.
( 1) Dependent on area & stack height
(2) Guideline only
PEER-REVIEW 715

Table 6. HWI emission guidelines for some European countries (mg/Nm3 dry at 11 % 02)'
Basis
Measurement
HCI SO (S02 + S03) HF NOx (N02) CO C (organic) . Particulate
Heavy Metals
Class I
Class II
Class III
PCDDIPCDF (nglNm3)
Combustion Temperature
(I) Guideline only.
PEER-REVIEW
German 17th BImSch V 11190
Corrected only Netherlands BLA 1993
when > 11 % O2 Corrected at All Times 24 hr. avg maxY2 hr. max. 1 hr. mean
10 50 1
200 50 10 10
60 200
4 400
(hr.) 100 20 30
Cd + TI L = 0.05 (>Y2 hr & <2 hr)
Hg = 0.05 (>Y2 hr & <2 hr)
Sb,As,Pb,Co,Cr,Cu, Mn,V,Sn,Ni L = 0.5
(>Y2 hr & <2 hr)
0.1 ITEQ (>500 min & <960 min)
1200°C >2 sec.
10 40 1
70 (Boiler) 50
10 (8 hr. avg.) 5
Hg = 0.05 (8 hr. avg.)
Cd = 0.05 (8 hr. avg.)
Sb,As,Pb,Co,Cr,Cu,Mn, V Sn,Ni,Te, Se L = 1.0
716
(8 hr. avg.)
0.1 ITEQ (8 hr. avg.)
850°C at >6%02 >2 sec.
EU Directive
Corrected only when >11% O2
max Y2 hr. 24 hr. Max
10 50 2
10 10
5 25
50 5 5
Cd + TI L = 0.05 (>.5 hr.)
Hg = 0.05 (>.5 hr.)
Sb,As,Pb,Co,Cr,Cu, Mn,V,Sn,Ni L = 0.5
(>.5 hr.)
0.1 ITEQ (I) (8 hr. avg.)
850°C at >6%02 >2 sec.
..
--.J ..... --.J
100 ,-----------------------------------------------------------------------------------------------,
90
Hg mass flow (actual) U.S.
80r- - - - - - - --- - - - - - - �·�- - - - - - - -- - - - - - - - -- - - - - - - - - - - - - - - - ---- - - - - - - - - - - - - - - --- - - - - - - -
70
til d
.9 Hg concentration (actual) U.S.
til til 13 60 � 01)
::r: Hg concentration (actual) Germany
50 - - - - - - - - - - - - -- - - - - - - -- - - - - - - - - - - - - - - - - - - -___ ����--------------����----------------------------i
40
Hg mass flow (actual) Germany
30
��� ��, ��� - �� �
20 + ._.--t---.- . -- --- -- +-
5 6 7 8 9 10 1 1 12
%O,,:ygen
--- Hg mass flow (actual) Germany - - - Hg concentration (actual) Germany - - - - - - !fg concentration (actual) U.S .
. __ . _______ -: : � : . Hg m�ss flow �actua1) l!.S.
13
'- .....................
14
Figure l. Comparison ofHg emissions legislation u.s. vs Germany
PEER-REVIEW

Bclgium
Appendix 1 THE SITUATION IN CERTAIN MEMBER STATES
(November 30, 1992)
In Flanders the 'Milleu-Natuurlljk Plan' of January 1989 contained a chapter on an integrated environment and nature management and in 1991 a law was passed by which the previous "exploitation permit" was replaced by a more integrated one covering emissions to the environment.
Denmark
Denmark has had a system of integrated pollution control since 1974. It was revised most recently in 1991. The purpose of the Act is to ensure a sustainable social development in respect of human conditions of life and for the protection of flora and fauna. The objectives of the 1991 Act include the prevention and combating pollution of air, water and land; the nuisances resulting from vibration and noise; the reduction of use and wastage of raw materials and other resources; and the promotion of recycling and the reduction of problems in connection with waste disposal. In the administration of the Act, weight is given to results achievable by using the "least polluting technology". In the design and operation of the plant, including choice of production processes, raw materials and auxiliary substances, measures shall be taken to minimize the use of resources, pollution, and generation of waste. When determining the extent and nature of measures to prevent pollution, consideration is given to the nature of the physical surroundings, and the likely impact of pollution on those surroundings and the whole cycle of substances and materials, with a view to minimizing wastage of resources.
Germany
Pollution control in the Federal Republic of Germany has traditionally been media oriented. Most laws and regulations still focus on one environmental medium only. Beginning in the mid-eighties, however, some elements of integrated pollution control have been introduced into German legislation and emphasis is continuing to be placed on integrated environmental technologies (and therefore integrated environmental regulations). Cooperation among different competent authorities already takes place in the context of the Federal Air Quality Control Act (BlmSchG); most authorities do not issue a separate license but their viewpoint is consolidated in the BlmSchG license. However, water related activities require a separate license according to the Water Management Act.
Erance
An integrated approach to pollution control has been taken in France since 1810. The most recent legislation was the law on "Registered Installations for the Protection of the Environment" of 1976. Installations which present the greatest problems or risks must receive a prior authorization given by the prefet. However, in order to avoid considerable distortions in the implementation of the regulations, he Ministry of the Environment distributes notices containing technical prescriptions. Pollution is controlled by a "parallel approach" - that is, a technical/economic approach which consists of using the best available anti-pollution techniques (not entailing excessive costs) to control pollution as a whole from the installation and by ensuring that pollution which does occur does not entail irremediable repercussions or damage to the environment (a quality target approach). Classified installations are inspected not by the prefet but by a
PEER-REVIEW 718
separate inspection service (DRIRE) which, in fact, is also usually consulted by the operator before an application for a permit is made.
Ireland
An Act was passed earlier this year to set up a system of integrated pollution control to be operated by a new Environmental Protection Agency. The integrated permit will replace the existing system of separate licenses for control of water pollution, air pollution and waste and will also incorporate noise control. The Agency will be under a duty to operate under five general principles. The most important of those for IPC are to promote sustainable and environmentally sound development, processes or operations to have regard to the need for precaution in relation to the potentially harmful effect of emissions, and the need to ensure a balance between the need to protect the environment and the cost of such protection.
The agency may not grant an integrated license unless it is satisfied that environmental quality standards will be met and that the best available technology (not entailing excessive cost) will be used to prevent, limit or abate any emissions from the activity.
The Netherlands
Pollution control in the Netherlands has traditionally been sectoral. Most laws and regulations focus on one environmental medium alone. In 1980, the Environmental Protection Act came into force laying down the basis for more general provisions concerning, among other things, advisory bodies, planning, and the issuing of permits (such as procedures concerning public access to information). Parliament is currently considering proposals to extend this Act in such a way that it will also serve as a means of implementing an integrated approach. For example, it contains provisions relating to environmental quality requirements, environmental impact assessment, monitoring obligations, licensing and general rules, enforcement and, in particular, coordination procedures such as the bringing together of the Nuisance Act and several provisions of other environmental laws.
A new decree covering the authorization of industrial activity was published in 1991. Under the regulation a "coordinating entity" is responsible for the granting of a permit. The regulation also establishes that those authorities with responsibilities relating to the environment have the right to have their conditions and demands to be included in the conditions of any permit. In addition, the coordinating entity may decide, where it thinks it appropriate, to make an authorization dependent upon a license for discharging effluent, which is obtained through a separate licensing procedure.
United Kingdom
The belief that as long as control of the environmental media remained separate then the end result would be a haphazard disposal of pollutants unrelated to an overall assessment of the optimum environmental solution came to be widely held in the 1970s and 1980s. The Environmental Protection Act of 1990 in Great Britain set up a system of integrated pollution control. In setting the conditions within an authorization, the competent authority is under a duty to ensure that certain objectives are met. Most importantly, the act requires best available techniques (not entailing excessive cost) to be used to first of all prevent, and only
PEER-REVIEW 719

when that is not practicable, minimize the release of substance to the environment that releases which do occur are rendered harmless and do not cause the breach of environmental quality requirements and that the "best practicable environmental option" is achieved so that emissions from installations have the least effect on the environment as a whole.
..
PEER-REVIEW 720