Embed Size (px)
Citation preview

Journal o f Behavioral Medicine, Vol. 4, No. 1, 1981
Comparison of Two Modes of Stress Measurement: Daily Hassles and Uplifts Versus Major Life Events
Allen D. Kanner, ~ James C. C o y n e , ' Catherine S c h a e f e r / and Richard S. Lazarus ~
Accepted for publication: April 29, 1980
The standard life events methodology for the prediction of psychological symptoms was compared with one focusing on relatively minor events, namely, the hassles and uplifts of everyday life. Hassles and Uplifts Scales were constructed and administered once a month for 10 consecutive months to a community sample of middle-aged adults. It was found that the Hassles Scale was a better predictor o f concurrent and subsequent psychological symptoms than were the life events scores, and that the scale shared most of the variance in symptoms accounted for by life events. When the effects of life events scores were removed, hassles and symptoms remained significantly correlated. Uplifts were positively related to symptoms for women but not for men. Hassles and uplifts were also shown to be related, although only modestly so, to positive and negative affect, thus providing discriminate validation for hassles and uplifts in comparison to measures o f emotion. It was concluded that the assessment o f daily hassles and uplifts may be a better approach to the prediction of adaptational outcomes than the usual life events approach.
KEY WORDS: stressful life events; daily hassles; daily uplifts; psychological symptoms; emotion.
Writing of this paper was supported in part by a research grant from the National Institute on Aging (AG 00799). University of California, Berkeley, Berkeley, California 94720.
0160-7715/81/0300-0001$03.00/0 �9 1981 Plenum Publishing Corporation

2 Kanner, Coyne, Schaefer, and Lazarus
INTRODUCTION
One of the most striking features of modern stress research is its preoccupation with dramatic events and severely taxing situations. Although this focus is to be found in virtually every serious field of stress investigation, it is no more evident than in the literature on major life events (cf. Dohrenwend and Dohrenwend, 1974). Life events became of interest when Holmes and Rahe (1967), backed by modest empirical support, proposed that the readjustment required by major life changes substantially increases the risk of physical illness. Their approach to the study of stress, and in particular their Social Readjustment Rating Scale, has come to dominate research in behavioral medicine despite extensive criticism of its assumptions (e.g., Kaplan, 1979; Mechanic, 1974; Sarason et al., 1978) and scale construction (Rabkin and Struening, 1976). A large amount of effort has been expended in improving the scale by assigning readjustment weights to items (Dohrenwend and Dohrenwend, 1978; Holmes and Masuda, 1974; Ross and Minowsky, 1979). Other modifications have been made concerning the issues of item undesirability (Hough et al., 1976; Mueller et al., 1977; Redfield and Stone, 1979; Ross and Minowsky, 1979; Vinokur and Selzer, 1975), breadth of item content, and weighing of subjective impact (Hochstim, 1970; Horowitz et al., 1977; Sarason et al., 1978).
The domination of stress measurement by the life events approach is curious in light of the evidence that cumulated life events (whether weighted or not) correlate only weakly with health outcomes, the average relationship being perhaps 0.12 (Rabkin and Streuning, 1976). Another almost unexamined problem is that this approach provides no clues about the processes through time by which life events might have an impact on such diverse health outcomes as broken bones, infections, emotional distress, heart attacks, and cancer. Indeed, each of these outcomes may have quite distinctive psychophysiological mechanisms (Kaplan, 1979; Lazarus et al., 1980a).
One reason for the dominance of the life events approach is the difficulty of studying stress in more sophisticated and complex ways, such as considering the subjective significance of the event (e.g., Horowitz et al., 1979) or taking into account individual differences in coping skills and resources (Andrew et al., 1978). Another is the essential reasonableness of the assumption that the accumulation of life events should be relevant to health status (see Hinkle, 1974). In the absence of an alternative metric, listing and cumulating major life events seems a useful way to assess stress as a causal agent, even though such indexes tell us little or nothing about what actually happens in day-to-day living.
In contrast to the major life events approach, Richard Lazarus and his colleagues have published a series of theoretical papers proposing the immense adaptational significance of the relatively minor stresses and pleasures that characterize everyday life (Coyne et al., 1979; Kanner and

Hassles and Uplifts vs. Major Life Events 3
Coyne, 1979; Lazarus, 1980; Lazarus and Cohen, 1977; Lazarus et al., 1980b). It is these day-to-day events that ultimately should have proximal significance for health outcomes and whose cumulative impact, therefore, should also be assessed (see also Luborsky et al., 1973; Stahl et al., 1975). We term these common occurrences daily "hassles" and "uplifts." Along these lines, McLean (1976, p. 298) has suggested:
Perhaps because the unit of stress is relatively small and the stressors so familiar, these kinds of stressors have been taken for granted and considered to be less important than more dramatic stressors. Clinical and research data indicate that these "micro- stressors," [quotation marks ours] acting cumulatively, and in the relative absence of compensatory positive experience, can be potent sources of stress.
Moreover, as the above reference to compensatory experience implies, it may be of great importance also to examine concurrent positive experiences in evaluating the ultimate impact of stressful events (Gersten et al., 1974; Lazarus et al., 1980b). For this reason, the cumulative effect of hassles and uplifts, in tandem, is of particular theoretical and empirical interest to us.
The aims of this article are fourfold: first, to examine theoretical and research issues in the measurement of stress that are inherent in the contrast between major life events and minor daily hassles; second, to consider hassles in relation to uplifts; third, to compare the life events and daily hassles approach in the prediction of adaptational outcomes, in this case, positive and negative affect as measured by the Bradburn Morale Scale (Bradburn, 1969; Bradburn and Caplowitz, 1965) and mental health status as assessed by the Hopkins Symptom Checklist (HSCL; Derogatis et al., 1970, 1971); and fourth, in the interests of the above three substantive issues, to describe the development and psychometric features of two new measuring instruments, the Hassles and Uplifts Scales.
CONCEPTUALIZATION AND RESEARCH ISSUES
Hassles are the irritating, frustrating, distressing demands that to some degree characterize everyday transactions with the environment. They include annoying practical problems such as losing things or traffic jams and fortuitous occurrences such as inclement weather, as well as arguments, disappointments, and financial and family concerns. Although hassles in general have been little studied, research has been done on what could be called hassles in particular life contexts. Examples in the social sphere include status incongruity between spouses (e.g., Pearlin, 1975b), sex role conflicts (Pearlin, 1975a), demands of children and aged parents (Levine and Scotch, 1970), work overload and underload (Frankenhaeuser and Gardell, 1976), and role ambiguity (Caplan and Jones, 1975; Kahn et al., 1964). Examples in the area of the physical environment include noise

4 Kanner, Coyue, Schaefer, and Lazarus
(Glass and Singer, 1972), pollution (Evans et al., 1980), residing in areas of marked social disorganization (James and Kleinbaum, 1976), and commuting to work in rush-hour traffic (Novaco et al., 1979).
Since probably no person leads a hassle-free life, the impact of hassles on physical and mental health, if any, must depend on factors such as a chronically high frequency of hassles, the heightening of hassles during a given period, as in crisis, or the presence of one or a few repeated hassles of compelling psychological importance. Such a formulation allows us to suggest a number of possibilities about how hassles might work in the overall psychological economy of a person's life.
First, as Hinkle (1974) has suggested, major life events might owe their impact on health to the disruption of social relationships, habits, and patterns of activity, as well as to some of the health-related behaviors associated with them. In other words, major life events could operate by affecting the person "s pattern o f daily hassles. Thus, divorce might create a whole collection of unusual minor demands such as making one's meals, keeping house, handling the finances, repairing the car, and finding companionship--to mention a few--which did not have to be dealt with previously. Alternatively, as suggested by Kaplan (1979), they might operate through their affective significance for the person or by disrupting characteristic coping processes. From this standpoint, hassles might function as critical event mediators of the life events-health outcome relationship, a process that could have considerable theoretical and practical interest. They might even serve as a direct indication of how a person's routine is being affected by life changes and, therefore, be a better predictor of health status.
Separate from the impact of life events, many hassles have their origin in the person's characteristic style, routine environment, or their interaction. As such, hassles might predict health outcomes quite independently of life events. While some hassles are situationally determined (e.g,, traffic jams, unexpected phone calls, broken shoelaces) and rare (e.g., dealing with a disturbed person), others are repeated, either because the person remains in the same context (e.g., work, marriage) with consistent and predictable demands (e.g., to be a competent employee or loving spouse) or because of the person's ineffective coping with common situations, such as those involving authority or members of the opposite sex.
A poem by Charles Bukowski (1980) poses a key issue in the relation- ship between hassles and adaptational outcomes:
It is not the large things that send a man to the madhouse ....
No, it's the continuing series of small tragedies that send a man to the madhouse
Not the death of his love but a shoelace that snaps with no time left.

Hassles and Uplifts vs. Major Life Events 5
Does each hassle simply add adventitiously to the overall sum, so that merely adding them up yields a metric of stress in daily life analogous to adding up major life events to derive a life change (LCU) score? Or does the importance of a hassle lie in its significance to the person, indicating, in the example of a broken shoelace, that he or she is inept, doomed to fail at critical moments , or unable to control even the little things of life or, in the case of new chores brought on by divorce, serving as a painful reminder of loss? Ultimately we need to know whether the impact of a hassle depends merely on its cumulative impact or on its content and meaning in the person 's life. Similar quantitative versus meaning-centered questions can also be asked about the formal features of a hassle such as its timing, repetition, frequency, duration, and whether it occurs with or without warning.
In constructing models of the relationship between hassles and health outcomes, we should be alert to the diversity of factors influencing a person's endorsement o f a particular hassle as having occurred and as to how aversive it israted. The overall level o f demands on a person and her or his perception of resources to meet them may determine to a considerable degree what minor events are noticed or remembered and how bothersome they are considered. When the person is feeling particularly taxed, events that are typically ignored (i.e., the broken shoelace) or viewed positively (e.g., a compliment) may take on a negative coloration. Thus, global perceptions may influence specific responses in any assessment of hassles. From such a perspective, the details of which hassles are cited by the person are less important than the overall level of hassles and the subjective stress they indicate.
To our knowledge, only one study other than our own (Lewinsohn and Talkington, 1979) systematically attempted to assess hassles in daily life, although its focus was on depression and the term used was "unp leasan t , " and sometimes "aversive," events. Lewinsohn and Talkington constructed a 320-item measure of daily unpleasant events and found a low to moderate relationship between event aversiveness and depression as measured by the M M P I and the Beck Depression Inventory (Beck, 1961). No relationship was found between frequency of events and depression.
Lewinsohn and Talkington do not make a strong theoretical case for the advantages of assessing relatively minor stressful events (whether referred to as daily hassles or unpleasant events) as compared to major life events, and in some respects their conceptualization and findings are at variance with our own. For example, when no relationship was found between life events and unpleasant events, the suggestion was made that since the former are discrete and infrequent while the latter are ongoing and frequent, no relationship ought to be expected. Furthermore, their behavioral framework leads them to downplay the cogni t ive-phenomeno- logical factors that we have suggested may be important in a person's endorse- ment of hassles items. Instead, Lewinsohn and Talkington seem to assume that item endorsement directly reflects the occurrence of objective events.

6 Kanner, Coyne, Schaefer, and Lazarus
Although we have mentioned several ways in which hassles can have an effect on adaptational outcomes, the present study will be limited to two major issues: (1) how hassles compare to major life events in their ability to predict one adaptational outcome, psychological symptoms, and (2) whether hassles bear a relation to psychological symptoms that is independent of life events. These are central issues in establishing the validity of a measure of hassles. Other important issues, such as the mediating role of hassles vis-a-vis life events or the impact of single events (i.e., broken shoelaces), will be left to future research.
Assessing daily hassles also invites assessment of what might be considered their counterparts, namely, daily uplifts, that is, positive experiences such as the joy derived from manifestations of love, relief at hearing good news, the pleasure of a good night's rest, and so on. Elsewhere (Lazarus, et al., 1980a) we have discussed the possible significance for health outcomes of positive emotional experiences. Briefly, we had argued that just as negatively toned stress (such as hassles) can cause neurohumoral changes that result in " the diseases of adapta t ion," positively toned experiences might serve as emotional buffers against stress disorders (see Cousins, 1976). This is in contrast with the original position of Holmes and Rahe (1967) that any change, regardless of valence and coping ability, is potentially damaging to health, a position that not only ignores mediators and is increasingly controversial, but seems to us also to be increasingly untenable. Moreover, Lazarus et al. (1980b)have described three ways in which positive experiences (such as uplifts) and emotions could play a role in coping, for example, serving as "brea thers" from regular stressful encounters, "sustainers" of coping activity, and "restorers" that contribute to the replenishment of depleted resources in recovering from harm or loss. If we are to assess stress fully, not only must we supplement lists of major stress- ful life events with a day-to-day hassles measure, but also we should consider the role of positively toned events in preventing or attenuating the effects of stress.
Some evidence already seems to support the merit of studying uplifts along with hassles. For example, Lowenthal and Chiriboga (1973) report that a person's resources and deficits taken together predict adaptation better than either alone. Similarly, Bradburn (1969) has shown that psychological morale is a function of the balance between positive and negative emotions. Gersten et al. (1974) also emphasize the balance between desirability and undesirability of life events as the critical element in their effect on health status. And Epstein (1976) recently noted that pleasant experience, such as the security afforded by having a parent nearby, reduces or prevents anxiety in both humans and infrahumans. These and related studies (e.g., Kanner et al. , 1978) argue for a tandem measurement of both daily hassles and daily up!ifts, as well as negative and positive emotional reactions.

Hassles and Uplifts vs. Major Life Events 7
There could be many possible patterns of relationship between hassles and uplifts. For example, people who seek many meaningful experiences or have strong and varied commitments (e.g., to work, achievement, social relationships) would be likely to encounter numerous relatively minor victories and failures while actively engaged in their pursuits, and would therefore probably experience a high incidence of both uplifts and hassles. People with a high proportion of hassles to uplifts, conversely, might be maladjusted, unhappy, and more frequently ill, compared to those With the reverse pattern. It seems likely, therefore, that measuring merely hassles alone, without regard to their counterpart, uplifts, could produce a distorted conception of the postulated relationship between stress and illness.
Finally, from an assessment standpoint it is worth noting that two approaches to negative and positive daily experiences are possible, namely, the emotional response to the event and the transaction with the environ- ment that generated the emotion in the first place. The Bradburn Morale Scale, cited above, is an illustration of the former, since the person is asked to tell about her or his emotional response. This is by far the most common approach (see Wilson, 1967; Costa and McCrae, 1980). The work of Campbell (1976) on measures of subjective well-being, which also falls within the emotional (or affective) response perspective, is particularly interesting here because of the suggestion that different types of measures add validity to the construct by tapping different aspects of life experience. This point parallels our conviction that, in addition to traditional emotional response measures, the use of more environment- or transaction-centered instruments, such as the Hassles and Uplifts Scales to be introduced in the present study, adds substantially to our understanding of adaptational processes.
METHODS
Sample
The sample consisted of 100 respondents (52 women, 48 men), aged 45 -64 , who participated in a 12-month study of stress, coping, and emotions. The participants were white, were primarily Protestant (93; 6 Catholic and 1 Jewish), had at least a ninth-grade level of education (mean = 13.7 years), had at least an "adequate" income ($7,000 or above in 1974; mean = $11,313), and were not severely disabled. Age was further stratified into four 5-year periods: 45-49 (N = 27), 50-54 (N = 25), 55-59 (N = 24), and 6 0 - 64 (N -- 24). These persons were selected from a population previously surveyed by the Alameda County Human Population

8 Kanner, Coyne, Schaefer, and Lazarus
Labora tory (HPL) 2 in a 1965 survey of physical, mental, and social health (Hochstim, 1970). The sampling f rame consisted of almost 7000 adults aged 20 or over living in a probabili ty sample area of 4735 housing units. This population was resurveyed by H P L in 1974, and it was f rom the 1974 panel sample (N = 4864) that our participants were drawn. From the panel sample, 216 people still living in the Bay Area and who met our selection criteria of race, religion, education, income, and physical status were contacted by phone. Of these, 109 agreed to be in the study. Over the course of the study, 9 more dropped out. A comparison on income, religion, physical status, and education of the 109 in the original sample with those who refused to participate revealed that those refusing were less educated (X 2 = 11,21, df = 3, P < 0.02), with more falling into the 8 - 12 years of education level. Of the 9 who dropped out, 4 were women and 3 each came f rom the youngest three age groups.
Measures
The Hassles Scale. The Hassles Scale (see Appendix) consists of a list of 117 hassles that was generated by the research staff using the areas of work, health, family, friends, the environment, practical considerations, and chance occurrences as guidelines. 3 Examples include misplacing and losing things, declining physical abilities, not enough time for family, concerns about owing money, and pollution. An earlier version of the scale was used in a study of Kaiser Permanente patients with high life events scores (Nofsinger, 1977). Subjects were encouraged to suggest hassles that they experienced that were not included in the original scale, and a number of these were incorporated in the scale used in the current study.
Initially, participants rated each hassle--occurring during the previous m o n t h - - f o r both severity and persistence on 3-point subscales, a score of 1, 2, or 3 meaning " s o m e w h a t , " "modera t e ly , " or "ex t remely ." The severity and persistence subscales yielded essentially the same information (r ~ 0.95), and therefore in subsequent analyses only the severity scores were used. A "trai t" version of the scale was also used once and was mailed to participants 1 month before interviewing began. It solicited the checking of hassles that were " typ ica l " for the person. The Hassles and Uplifts State Scales were
2We appreciate the generosity of the Human Population Laboratory which made its archives available to us and helped facilitate this research.
3All assessment tools in this research were developed during 1976- 1977 as a group effort in which Patricia Benner, Judith Cohen, Susan Folkman, Allen Kanner, Richard S. Lazarus, Catherine Schaefer, Judith Wrubel, and others participated. However, the major responsibility for collecting and formulating the items on the Uplifts Scale was carried by Allen Kanner.

Hassles and Uplifts vs. Major Life Events 9
administered once a month for 9 consecutive months as part of the year-long longitudinal study.
Three summary scores for each Hassles Scale were generated for analysis: (1)frequency, a simple count of the number of items checked, which could range from 0 to 117; (2) cumulated severity, the sum of the 3- point severity ratings, which ranged from 0 to 351 (3 x 117); and intensity, the cumulated severity divided by the frequency, which ranged from 0 to 3. The latter score is an index of how strongly or intensely the average hassle was experienced, regardless of the number (frequency) of hassles checked. The correlations between frequency and cumulated severity were also extremely high (r _=_ 0.95), and therefore subsequent analyses were performed only for the frequency and intensity scores.
The Uplifts Scale. Constructed in a fashion similar to that of the Hassles Scale, the Uplifts Scale (see Appendix) consists of a list of 135 uplifts that was generated using the content areas of the Hassles Scale as guidelines. Examples include relaxing, spending time with family, using skills well at work, praying, and nature. Pilot data were available for the college, but not the Canadian, sample described above.
Uplifts that occurred during the previous month were rated on 3-point subscales for both "how strongly" and "how often," a score of 1, 2, or 3 indicating somewhat, moderately, or extremely. Scores for frequency, intensity, and cumulated intensity were also obtained. The how strongly and how often subscales proved to be redundant, as did the cumulated frequency and frequency scoring techniques (r = 0.95). Therefore, as with the Hassles Scale, only one subscale (how often), scored two ways (for frequency and intensity), was utilized in subsequent analyses.
Other Measures. These included a life events scale developed by Paul Berkman at HPL from in-depth interviews of the recent life stresses reported by a sample of 100 middle-aged respondents. This scale was also used in previous assessments of the large HPL sample from which our sample was drawn. Items not close in content or wording to those on the original Holmes and Rahe (1967) Social Readjustment Rating Scale were weighted by graduate students in epidemiology at the University of California, Berkeley. At face value, the items of the scale appear to refer to undesirable, rather than desirable, events. Two life events items, referring to the person's own serious illness and sexual difficulties, were excluded because of possible overlaps with the Hopkins Symptom Checklist (see below).
Extremely high correlations (r's > 0.99) existed between the Hassles Scale and a version of the Hassles Scale in which five items were deleted that were potentially confounded with the HSCL (physical illness, side effects of medication, sexual problems that result from physical problems, difficulties seeing or hearing, not enough personal energy). As would be expected, the

10 Kanner, Coyne, Schaefer, and Lazarus
modified version showed essentially the same relationships to both administra- tions of the HSCL for all 9 months as the original Hassles Scales.
Study participants were asked to check those events that occurred during the previous 2.5 years, these 2.5 years being divided into the 6-month period just prior to the study and the two yearly periods directly preceding these 6 months. The scale was administered twice, once as part of a mail-out 1 month before the study interviewing began and again as part of the 10th- month assessment. From the two administrations, it is possible to derive indexes of life events that occurred (a) only during the 10 months for which hassles and uplifts were assessed (study events) and (b) ~turing the 2.5 years directly preceding the hassles/uplifts assessments (prestudy events).
The Hopkins Symptom Checklist (HSCL; Derogatis et aL, 1970, 1971, 1974) includes psychological symptoms that are particularly likely to show short-term changes. It has also demonstrated a sensitivity to low levels of symptoms in normal populations (Rickels et aL, 1972; Uhlenhuth, et al., 1974) and, as such, is ideally suited to our sample of adequately functioning middle-aged adults.
The Bradburn Morale Scale (Bradburn, 1969; Bradburn and Caplowitz, 1965) is a widely used index of psychological well-being. Its two subscales of positive and negative emotions have been consistently shown to be relatively independent and each has a different set of correlates. The version used in the present study is the one described by Bradburn and Caplowitz (1965). Our sample also completed the Bradburn and Caplowitz scale as part of HPL's 1965 and 1974 surveys.
P R O C E D U R E
All measures were administered as part of a mail-out 1 month before the study began or as "homework" to be filled out between the monthly assessments. A prearranged time of the month was set to fill out the homework questionnaires in order to encourage relatively uniform monthly intervals between administrations; despite this, there was some variation in the exact dates of completion. (A scale left as homework at Month 3, for example, was filled out typically l week before the fourth interview.) The scales were completed at the following times: Hassles and Uplifts--trait (initial mail-out), Hassles and Uplifts--state (each of the first 9 months), Life Events (mail-out, Month 10), Hopkins Symptom Checklist (Months 2 and 10), and Bradburn Morale Scale (each of the first 9 months).
R E S U L T S
Results are described in the following order: preliminary normative data, test - retest correlations of hassles and uplifts frequency and intensity,

Hassles and Uplifts vs. Major Life Events l 1
the relationship between hassles and uplifts scores, a comparison of the present sample with two other different population samples, and first-order correlations (for hassles and uplifts) with adaptational outcome measures, including the Bradburn Morale Scale, life events, and psychological symptoms (HSCL). Finally, a comparison is made of the respective capabilities of hassles, uplifts, and life events in predicting psychological symptoms.
Preliminary Normative Data on Hassles and Uplifts
Mean levels and standard deviations of hassles and uplifts frequency and intensity scores for the trait versions of the questionnaires (administered 1 month before interviewing began) and for the 9 months of the study are presented in Table I. Examination of the data by each month separately revealed a decrease in mean scores over time, especially for uplifts. For example, uplifts mean frequency decreased from Month 1 (53.2) to Month 9 (46.5), although most of the decrease had occurred by the midperiod between Months 4 and 6. The change was statistically significant (two-tailed paired t = 2.61, P < 0.01), as was the decrease from Month 1 to Month 9 for uplifts intensity (t = 8.96, P < 0.001) and hassles frequency (t = 2.97, P < 0.001). Lewinsohn and Talkington (1979) also reported a drop in the frequency, but not the aversiveness, of unpleasant events over a 3- month period. Assuming that these drops have nothing to do with the actual hassles or uplifts that are experienced, possible reasons for them could include growing boredom with the task and concomitant inattentiveness, or a tendency to respond globally at first but to become increasingly selective in acknowledging recent hassles and uplifts. The pattern represents a methodological issue rather than being of substantive interest concerning the phenomena of hassles and uplifts themselves.
Table 1. Means and Standard Deviations of Hassles and Uplifts Frequency and Intensity Scores (N = 100) a
HassLes Uplifts
Frequency Intensity Frequency Intensity
Mean SD Mean SD Mean SD Mean SD
Trait 22.4 18.7 1.56 0.43 69.5 29.1 2.14 0.53
9-month mean 20.5 17.7 1.47 0.39 49.5 27.8 1.77 0.40
Gender Males 22.4 16.9 1.43 0.27 49.7 24.9 1.70 0.31 Females 18.9 13.3 1.49 0.29 49.8 23.9 1.84 0.33
Age 4 5 - 4 9 17.3 10.4 1.46 0.29 38.9 19.4 1.80 0.31 5 0 - 5 4 21.1 18.4 1.43 0.25 49.6 23.4 1.69 0.31 55 - 59 20.8 14.8 1.43 0.27 57.4 27.2 1.74 0.33 6 0 - 6 4 23.5 16.3 1.53 0.33 54.9 24.0 1.86 0.35
aGender and age scores are collapsed over nine administrations of the scales.
12 Kanner, Coyne, Schaefer, and Lazarus
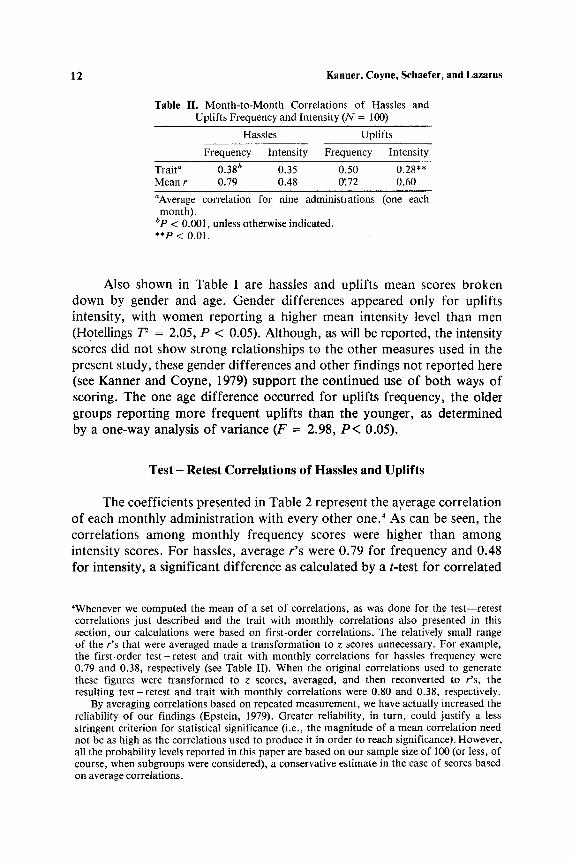
Table II. Month- to-Month Correlations o f Hassles and Uplifts Frequency and Intensity (N = 100)
Hassles Uplifts
Frequency intensity Frequency Intensity
Trait a 0.38 b 0.35 0.50 0.28** Mean r 0.79 0.48 0".72 0.60
"Average correlation for nine administrations (one each month) .
bp < 0.001, unless otherwise indicated. **P < 0.01.
Also shown in Table I are hassles and uplifts mean scores broken down by gender and age. Gender differences appeared only for uplifts intensity, with women reporting a higher mean intensity level than men (Hotellings T ~ = 2.05, P < 0.05). Although, as will be reported, the intensity scores did not show strong relationships to the other measures used in the present study, these gender differences and other findings not reported here (see Kanner and Coyne, 1979) support the continued use of both ways of scoring. The one age difference occurred for uplifts frequency, the older groups reporting more frequent uplifts than the younger, as determined by a one-way analysis of variance (F = 2.98, P < 0.05).
Test - Retest Correlat ions o f Hassles and Upl i f ts
The coefficients presented in Table 2 represent the ayerage correlation of each monthly administration with every other one. ' As can be seen, the correlations among monthly frequency scores were higher than among intensity scores. For hassles, average r 's were 0.79 for frequency and 0.48 for intensity, a significant difference as calculated by a t-test for correlated
'Whenever we computed the mean of a set of correlations, as was done for the test--retest correlations just described and the trait with monthly correlations also presented i n this section, our calculations were based on first-order correlations. The relatively small range o f the r ' s that were averaged made a t ransformat ion to z scores unnecessary. For example, the first-order t e s t - r e t e s t and trait with month ly correlations for hassles frequency were 0.79 and 0.38, respectively (see Table II). When the original correlations used to generate these figures were t ransformed to z scores, averaged, and then reconverted to r 's , the resulting t e s t - r e t e s t and trait with month ly correlations were 0.80 and 0.38, respectively.
By averaging correlations based on repeated measurement , we have actually increased the reliability o f our findings (Epstein, 1979). Greater reliability, in turn, could just ify a less stringent criterion for statistical significance (i.e., the magni tude of a mean correlation need not be as high as the correlations used to produce it in order to reach significance). However, all the probability levels reported in this paper are based on our sample size of 100 (or less, of course, when subgroups were considered), a conservative estimate in the case of scores based on average correlations.

Hassles and Uplifts vs. Major Life Events 13
means (t = 4.7, P < 0.001). The parallel figures for uplifts f requency and intensity were 0.72 and 0.60, respectively, also a significant difference (t = 1.8, P < 0.05). The relatively higher hassles and uplifts f requency scores suggest that people are experiencing roughly the same number o f hassles and uplifts f rom m o n t h to month , a l though we cannot say whether or not they are the same ones. The greater f luctuat ions in the intensity scores indicate that the a m o u n t o f distress or pleasure associated with hassles and uplifts varies more than the number o f events experienced.
Table II also presents the mean correlat ions between trait and month ly scores. The correlat ions a m o n g mon th ly scores are significantly greater than between the trait and month ly scores for hassles f requency (0.79 vs 0.38, t = 5.3, P < 0.001), uplifts f requency (0.72 vs 0.50, t = 4.8, P < 0.001), and uplifts intensity (0.60 vs 0.28, t -= 3.3, P < 0.001), with a non- significant tendency in the same direction for hassles intensity (0.48 vs 0.35, t = 1.3, P < 0.1). This indicates that in the main repeated state measures o f hassles are more highly related to each other than they are to a trait measure designed to reveal the person ' s typical hassles, and the same pat tern held true for the state and trait measures o f uplifts. As will be seen, the state measures were generally also more strongly correlated with external criteria, a finding that supports the use o f mon th ly samplings o f hassles and uplifts rather than a simple trait measure (see also Epstein, 1979). 5
The Relat ionship Between Hassles and Uplifts
The average correlations between hassles and uplifts scores for the same mon th were also calculated. The mean has s l e s -up l i f t s correlat ion using f requency scores was 0.51 (P < 0.001), and that for intensity scores was 0.28 (P < 0.01). Trait scores were not as strongly related, correlating 0.33 (P < 0.05) for f requency and 0.21 (P < 0.05) for intensity. In general, hassles and uplifts were positively related to each other (a l though only modest ly so for intensity). Such a relationship may reflect either a c o m m o n response style or a tendency for people who have many hassles to also have m a n y uplifts and for those who experience (or judge) their hassles as intense to do so also with respect to uplifts.
sOur initial efforts to develop subscales involved grouping scale items according to the major categories that guided the original item selection procedure: Work, health, family and friends, and the environment. These are roughly equivalent to the subscales constructed by Lewinsohn and Talkington (1979) for the Unpleasant Events Schedule. However, due to the extremely high internal reliability of the parent scales (r ~ 0.95), the subscales' a's, although adequate, were no greater than the a's of randomly generated subscales of equal length. Currently, other procedures are being employed that we believe will circumvent this problem (Kanner, 1981).
14 Kanner, Coyne, Schaefer, and Lazarus
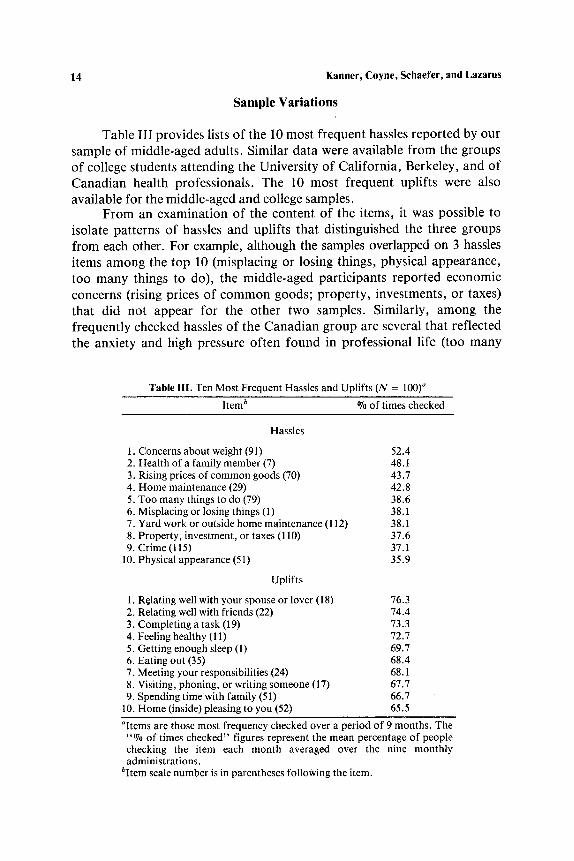
Sample Variations
Table III provides lists of the 10 most frequent hassles reported by our sample of middle-aged adults. Similar data were available from the groups of college students attending the University of California, Berkeley, and of Canadian health professionals. The 10 most frequent uplifts were also available for the middle-aged and college samples.
From an examination of the content of the items, it was possible to isolate patterns of hassles and uplifts that distinguished the three groups from each other. For example, although the samples overlapped on 3 hassles items among the top 10 (misplacing or losing things, physical appearance, too many things to do), the middle-aged participants reported economic concerns (rising prices of common goods; property, investments, or taxes) that did not appear for the other two samples. Similarly, among the frequently checked hassles of the Canadian group are several that reflected the anxiety and high pressure often found in professional life (too many
Table III. Ten Most Frequent Hassles and Uplifts (N = 100) a
Item b % of times checked
Hassles
1. Concerns about weight (91) 52.4 2. Health of a family member (7) 48.1 3. Rising prices of common goods (70) 43.7 4. Home maintenance (29) 42.8 5. Too many things to do (79) 38.6 6. Misplacing or losing things (1) 38.1 7. Yard work or outside home maintenance (112) 38.1 8. Property, investment, or taxes (110) 37.6 9. Crime (115) 37.1
10. Physical appearance (51) 35.9
Uplifts
1. R~lating well with your spouse or lover (18) 76.3 2. Relating well with friends (22) 74.4 3. Completing a task (19) 73.3 4. Feeling healthy (11) 72.7 5. Getting enough sleep (1) 69.7 6. Eating out (35) 68.4 7. Meeting your responsibilities (24) 68.1 8. Visiting, phoning, or writing someone (17) 67.7 9. Spending timewith family (51) 66.7
10. Home (inside) pleasing to you (52) 65.5
~Items are those most frequency checked over a period of 9 months. The "% of times checked" figures represent the mean percentage of people checking the item each month averaged over the nine monthly administrations.
bltem scale number is in parentheses following the item.

Hassles and Uplifts vs. Major Life Events 15
things to do, not enough time to do the things you need to do, too many responsibilities, trouble relaxing). The students, on the other hand, were struggling with academic and social problems typically associated with attending college (wasting time, concerns about meeting high standards, being lonely). The most frequent uplifts also illustrate contrasting daily experiences, with the middle-aged sample finding pleasure and satisfaction from good health (feeling healthy, getting enough sleep) and spending time at home with their family (home pleasing to you, spending time with family), whereas the students were uplifted by activities having primarily a hedonic tone (having fun, laughing, entertainment, music, etc.). Two uplifts (completing a task, relating well with friends) were shared by the latter two groups.
Three features of this analysis are of particular interest. First, the method of listing and comparing the top 10 hassles and uplifts puts the emphasis on repeated, or chronic, events, and our samples appeared to differ on these in ways consistent with their age and occupation. Second, by focusing on content patterns, hassles and uplifts themes emerge which distinguish one group from another. Finally, unlike the other analyses to be presented, this one is purely descriptive in nature, an approach that we believe is underutilized in stress measurement and behavior medicine research.
Correlations with Life Events and Adaptational Outcome Measures
Bradburn Morale Score. The Bradburn and Caplowitz (1965) positive and negative affect scales were available for the same 9 months during which hassles and uplifts were assessed. The large number of relationships produced by intercorrelating the two sets of scales was reduced following a procedure similar to the one described for the month-to-month analysis and then reported in Table IV. For example, a correlation matrix was generated relating 9 months of hassles frequency to the concurrent 9 months of negative affect, and the mean of these correlations computed (mean r = 0.34, P < 0.001). Similarly, the average correlation between the trait version of hassles frequency and nine assessments of negative affect was calculated (mean r = 0.22, P < 0.05). As can be seen in Table IV, following this procedure, three other statistically significant relationships appeared, namely, uplifts frequency with positive affect (r = 0.25, P < 0.05; trait r = 0.08, n.s.) and uplifts intensity with positive affect (r = 0.33, P < 0.001; trait r = 0.21, P < 0.05). Thus, as might be anticipated, for the sample as a whole, hassles were related to negative but not positive affect, while uplifts were correlated with positive but not negative affect. These results are consistent with Bradburn and Caplowitz's (1965) findings that their two scales each had a

16 Kanner, Coyne, Schaefer, and Lazarus
Table IV. Correlations of Hassles and Uplifts Frequency and Intensity with Bradburn and Caplowitz Affect Scales
Frequency Intensity
Hassles Uplifts Hassles Uplifts
Positive 0.07 ~ (0.14) b 0.33* (0.21)** -0.08 (-0.18) 0.25** (0.08) Negative 0.34* (0.22)* 0.03 (-0.01) 0.11 (0.12) 0.07 (0.13)
~Mean correlations of affect with 9 months of Hassles/Uplifts. bMean correlations of affect with Hassles/Uplifts trait scores. *P < 0.001. **P < 0.05.
different set of correlates. When the same relationships were examined by gender, the above pattern repeated itself with one major exception. Uplifts frequency and Bradburn negative affect tended to be negatively correlated for men (r = -0.18, n.s.) but positively correlated for women (r = 0.25, P < 0.05). The difference between these two correlations is significant (z = 2.92, P < 0.01). As will be seen, this positive relationship for women between uplifts and measures of stress consistently appears throughout our analysis.
Earlier it was noted that the assessment of daily events represents an alternative entry point into the domain of positive and negative experiences f rom the more common approach of measuring emotional response. Thus, although we would expect hassles and uplifts to be related to emotions, daily events and emotions are not the same phenomenon, a distinction we believe is reflected by the modest magnitude of the relationships just reported.
Life Events. Hassles and uplifts intensity scores were not significantly related to life events, whether the life events occurred during the study or during the period 2.5 years earlier (i.e., prestudy life events). On the other hand, frequency of hassles showed an interesting pattern of relationships with life events. The average correlation between the nine state measures of hassles and prestudy life events was 0.21 (P < 0.05). The same r was found for the trait measure. Similar results were obtained when men and women were examined separately.
However, as shown in Table V, men and women differed in relationship to study life events on both hassles and uplifts. For hassles frequency and study life events, a significant positive correlation appeared for women (r = 0.36, P < 0.01), but for men the same relationship was nonsignificant (r = 0.02, n.s.). The comparable trait correlations were also nonsignificant (see Table V). Uplifts frequency and study life events tended to be positively related for women (r -- 0.21, n.s.) but negatively so for men (r = - 0 . 2 3 , n.s.). The difference between these two correlations is significant (z = 2.67, P < 0.01). Once again, for women uplifts frequency and a measure of stress show a positive relationship.

Hassles and Uplifts vs. Major Life Events
Table V. Correlations of Hassles and Uplifts Frequency with Major Life Events Occurring During the Study Period
17
Hassles Uplifts
Total Total sample Men Women sample Men Women
( N = 100) ( N = 4 8 ) ( N = 52) ( N = 100) ( N = 4 8 ) ( N = 52)
Trait 0.04 -0.02 0.09 -0.15 -0.33* 0.12
Month 1 0.06 -0.09 0.29* -0.06 -0.15 0.06 2 0.14 -0.04 0.34* 0.03 -0.21 0.28* 3 0.16 0.05 0.30* -0.01 -0.23 0.29* 4 0.18 0.10 0.29* -0.08 -0.26 0.14 5 0.17 0.01 0.39** -0.08 -0.28 0.17 6 0.17 0.03 0.33* -0.03 -0.22 0.20 7 0.25* 0.09 0.42** 0.04 -0.15 0.28 8 0.20* 0.02 0.46** -0.08 -0.30* 0.22 9 0.17 0.03 0.38** -0.04 -0.25 0.21
Mean r 0.17 0.02 0.36** -0.03 -0.23 0.21
*P < 0.05. **P < 0.01.
To summarize these results, when significant relationships did occur, for men life events were positively correlated with hassles and negatively related to uplifts. For women life events exhibited a positive relationship to both hassles and uplifts. Lewfnsohn and Talkington (1979) reported nonsignificant correlations for unpleasant events frequency and aversiveness with major life events. In light of the above results, it is unfortunate that they did not further analyze their data by gender.
Psychological Symptom. The Hopkins Symptom Checklist (HSCL; Derogatis et al., 1970, 1971) was administered during the second and tenth months of interviewing. Test- retest coefficients from Month 2 to Month 10 were 0.76 for men and 0.66 for women. No gender differences appeared for mean level of symptomatology. Hassles and Uplifts intensity scores and the HSCL were unrelated.
Among the most important findings of this study are the substantial correlations that appeared between hassles frequency and psychological symptoms. Averaging over 9 months of hassles, hassles and Month 2 HSCL were correlated r = 0.60 (P < 0.001) for the total sample, 0.55 (P < 0.001) for men, and 0.66 (P < 0.001) for women. The parallel figures for Month 10 HSCL were 0.49 (P < 0.001), 0.41 (P < 0.01), and 0.60 (P < 0.001). These data provide initial construct validation for the Hassles Scale via its relationship to a significant adaptational outcome, namely, psychological symptoms. Also of interest are the positive correlations

18 Kanner, Coyne, Schaefer, and Lazarus
between uplifts frequency and psychological symptoms for women (r = 0.53, P < 0.001, for Month 2 HSCL; r = 0.41, P < 0.01, for Month 10 HSCL). The strength of these relationships is greater than that between uplifts and both negative affect and life events. Moreover, as with earlier-noted findings, the same relationships for men were nonsignificant. It is worth noting, too, that the correlations of psychological symptoms with hassles were stronger than the ones for uplifts, an observation that will become relevant when hassles and uplifts are compared in a regression analysis with life events.
Hassles, Uplifts, Life Events, and Psychological Symptoms
Having established a relationship between hassles frequency and psychological symptoms (and, for women, between uplifts frequency and symptoms), an important next step is to compare the respective ability of hassles, uplifts, and life events to predict such symptoms. To do this, hassles and life events, hassles and uplifts, and uplifts and life events were each separately regressed onto the Hopkins Symptom Checklist. Months 1, 2, 5, and 9 of the Hassles and Uplifts Scales were chosen as representative for this comparison, and both prestudy and life events measures were used, as were both administrations of the HSCL. Table VI reports the comparison of hassles and life events in their ability to predict symptoms. As can be seen, for the sample as a whole, and for women and men separately, hassles were a more powerful predictor of psychological symptoms than life events in every comparison made. Furthermore, only infrequently did life events add significantly to the first-order h a s s l e s - H S C L relationship, indicating that by and large hassles had completely subsumed any effects due to life events.
Although these results indicate the general superiority of hassles over life events in predicting symptomatology, they do not inform us as to whether hassles and psychological symptoms are still related after the variance due to life events has been partialed out. To address this issue, the order of the stepwise regressions just reported was reversed, so that life events became the first step in the regression equations, and hassles the second. For the sample as a whole, and for women and men, hassles always added significantly as the second step of the "reversed" regressions and, in most cases, st i l l accounted for more variance than life events.
Hassles also proved to be a better predictor of symptoms than uplifts in all of the regression analyses generated for the whole sample, and for women and men separately. This finding is of particular interest in regard to the women, for it indicates that the variance accounted for in the positive correlation between uplifts and symptoms.can also be fully accounted for

Hassles and Uplifts vs. Major Life Events
Table VI. Stepwise Regression Analyses of Psychological Symptomatology (HSCL) on Monthly Hassles and Life Events Occurring Prior to, and During, the Study
19
Total sample Men Women
Psychological symptoms (HSCL) Step a r 3 F r F r F
Life events occurring prior to the study
At mon th 2 d Hassles, mon th 1 1 0.55* 39.7* 0.47** 12.4"* 0.67* 37.3*
2 0.55* 0.5 0.47** 0.4 0.68* 0.2 Hassles, mon t h 2 1 0.52* 34.6* 0.51" 16.0" 0.55* 19.8"
2 0.54* 1.8 0.52** 0.3 0.58* 1.9 At mon th 10
Hassles, mon t h 1 1 0.41" 18.1" 0.31"** 4.6*** 0.55* 20.1" 2 0 .41 ' - - 0.31 0.2 0.55* 0.1
Hassles, mon th 2 1 0.38* 15.7" 0 .31 '** 4.7*** 0.48** 13.6"* 2 0.38** 0.2 0.32 0.2 0.48** 0.1
Hassles, mon th 5 1 0.51" 31.8" 0.39** 7.8** 0.66* 36.0* 2 0.51" 0.6 0.39*** - - 0.68* 1.8
Hassles, mon th 9 1 0.47* 26.3* 0.37*** 7.0*** 0 .61 ' 26.7** 2 0.48* 0.6 0.37 - - 0.62* 1.2
Life events occurring during the study
Hassles, mon t h 1 1 0 .41 ' 18.1" 0 .31 '** 4.6*** 0.55* 20.1" 2 0.45* 4.6***0.33 0.8 0.61" 5.3***
Hassles, mon th 2 1 0.38* 15.7" 0.31"** 4.7*** 0.48** 13.6"* 2 0.42* 3.3 0.33 0.6 0.55* 5.0***
Hassles, mon th 5 1 0.51" 31.8" 0.39** 7.8** 0.66* 35.9* 2 0.53* 2.8 0.40*** 0.5 0.69* 3.1
Hassles, mon th 9 1 0.47* 26.3* 0.37*** 7.0*** 0.61" 26.7* 2 0.50* 2.8 0.38*** 0.4 0.64* 3.4
"Hassles first step, life events second, in all regression equations. bFirst step is simple r, second is multiple r. ~Fto add or remove each step from regression equation. aOnly the first 2 months of hassles and life events prior to the study have a prospec-
tive relationship to symptoms at Month 2. *P < 0.001. **P < 0.01. ***P < 0.05.
by the hassles data. This shared variance takes on even more significance when the uplifts and life events regression analysis is considered.
When uplifts and life events were compared for men, although a tendency existed for life events to show a stronger relationship, the multiple r's of the regression analysis never reached statistical significance. This reflects the relatively weak correlations found for the HSCL with both uplifts and life events. For women, however, uplifts proved to be a stronger predictor than life events in a large majority (8 of 10) of the comparisons made.

20 Kanner, Coyne, Schaefer, and Lazarus
As just mentioned, the ability of uplifts to predict symptoms for women is a function of the "shared" variance between uplifts and hassles, Put differently, when hassles were controlled for, the positive relationship between uplifts and psychosomatic symptoms disappeared. Therefore, the intriguing aspect of the uplifts findings is the overlapping effect of both hassles and uplifts on psychological symptoms.
Overall Summary of Findings
The major findings were as follows: (1) For both hassles and uplifts, overall frequency scores were generally consistent from month to month, and more so than overall intensity scores; (2) within the same month, hassles and uplifts frequency scores were moderately correlated, whereas intensity scores were only modestly related; (3) a comparison of three disparate samples on their 10 most frequent hassles (and for two of the samples, on uplifts) yielded content "themes" unique to each sample and consistent with the samples' age and occupation; (4) hassles and uplifts state scores in general were more highly related to external criteria (adaptational outcomes) than were trait scores; (5) for women, but not for men, uplifts were positively correlated with negative affect, life events, and psychological symptoms; and (6) regression analysis showed hassles to be a considerably better predictor of psychological symptoms than life events.
GENERAL DISCUSSION
Do chronic daily hassles provide a more direct and broader estimate of stress in life than major life events? We think the findings presented here offer a surprisingly robust case that they do, regardless of how we conceive the nature and mechanism of their effects.
First, and of greatest importance, the pattern of results supports the hypothesis that hassles are more strongly associated with adaptational outcomes than are life events. The variance in symptoms that can be accounted for by life events can also be accounted for by hassles. Thus, major life events had little effect independent of daily hassles.
The results further suggest that hassles contribute to symptoms independent of major life events. In predicting symptoms, a substantial relationship remained for hassles even after the effect due to life events had been removed. Moreover, the remaining relationship between hassles and psychological symptoms was generally greater than between life events and symptoms. Thus, although daily hassles overlap considerably with life events, they also operate quite strongly and independently of life events in

Hassles and Uplifts vs. Major Life Evenls 21
predicting psychological symptoms. However, it is worth nothing that symptoms measured at Month 2 were correlated with hassles that occurred in the later as well as prior months, indicating, perhaps, that being symptomatic may lead to increased hassles. By focusing in this article on the mediating and independent roles of hassles as a source of stress, we do not intend to suggest that other important relationships among hassles, life events, and psychological symptoms do not also exist (cf. Coyne and Lazarus, 1980).
In any case, the capacity of the Hassles Scale to correlate with adaptational outcome measures quite clearly justifies its use. Although we are somewhat reluctant to regard the Bradburn and Caplowitz (1965) positive and negative affect scales solely as outcome measures, hassles scores do correlate significantly with them, especially with the negative affect scale. Thus, with two sets of adaptational outcome measures, the Bradburn Scale and the Hopkins Symptom Checklist, a good case can be made for the practical value of the Hassles Scale.
Aside from the theoretical significance we have ascribed to uplifts, the empirical value of including such a measure in the analysis of stress, coping, and adaptational outcomes has also been substantiated here. For example, we have found that for women only, uplifts are positively related to life events, as well as to outcomes such as psychological symptoms and negative affect. While these findings for women might suggest that change per se, whether positive or negative, is related to symptom onset, uplifts for men were either nonsignificantly or negatively related to the same measures. For men, therefore, general arousal theory (Holmes and Rahe, 1967; Selye, 1974), which would predict that uplifts would be positively related to psychological symptoms, is not supported. Moreover, further analysis also showed that the relationship between uplifts and psychological symptoms among women could be accounted for by common variance with the hassles score. A crucial task, therefore, is to explain the shared variance found among hassles, uplifts and psychological symptoms.
The pattern of findings reported here can be used to rule out certain artifactual explanations, such as the operation of "response sets" or of activity levels. It could be claimed, for example, that positive correlations among hassles, uplifts, and symptoms reflect a tendency for people who check many items on one scale also to do so on others. However, that such a response set could only apply go women weakens it as an explanation. Similarly, it could be proposed that active people have many hassles, uplifts, and symptoms, but this ignores the absence of a relationship between Uplifts and psychological symptoms among men.6
6Hassles and uplifts frequencies were positively correlated for women (r = 0.60, P < 0.001) and men (r = 0.46, P < 0.001), the difference between the correlations not being significant.

22 Kanner, Coyne, Schaefer, and Lazarus
With the data presented here we are unable to choose among a number of competing substantive explanations for differences between men and women in the relationship between uplifts and symptoms. It may be that uplifts have different significance for men and women, based on gender- related values. Alternatively, there may be gender differences in coping, with women emphasizing the positive aspects of situations. If this is so, then it is a lso quite possible that uplifts in women are occurring in the same situational contexts as hassles, since they are part of the coping response to hassles. On the other hand, consistent with a study of coping using the present sample (Folkman and Lazarus, 1980), it might be that apparent gender differences are due to differences in the situational contexts typically faced by men and women.
In commenting on the gender differences it is also important to make the more general point that the sample employed in this research cannot be considered representative of the population as a whole. This limitation should be taken into consideration in evaluating both the preliminary normative data and the obtained correlations. For example, Myers et al., (1974) have observed that lower-class people do not experience more life events than persons of higher socioeconomic status, nor do they in general experience more undesirable events. However, they do seem to be subject to more high-impact events of an undesirable nature. Our sample is predominantly middle-class and so it is possible that the range of life events scores may be somewhat truncated. I f this is so, our data could have under- estimated slightly the relationship between life events and psychological symptoms. This does not mean that our findings are any less useful, but only that we must be cautious in generalizing them beyond the type of sample on which they are based.
In addition to extending the measures to the prediction of other important adaptational outcomes, such as social functioning and somatic health/illness, two themes seem especially attractive for further study. One, which has not been tackled here, is the notion, developed at the outset of this paper, that it is the combinat ion of positive and negative experiences, that is, hassles and uplifts rather than one or the other, which serves best as an indicator of well-being or pathology. We need to ask, for example, whether those high in hassles and low in uplifts differ in coping effectiveness and in adaptat ional outcomes f rom those with a different pattern, say, being high in hassles and high in uplifts. 7
7As a preliminary test of a possible interaction between hassles and uplifts, four groups were created based on median splits on hassles and uplifts frequency scores collapsed over 9 months (i.e., high hassles, high uplifts; high hassles, low uplifts; etc.), and differences among the groups on psychological symptoms examined via a one-way analysis of variance. For Month 2 HSCL, the main effect was significant for men (F = 6'.66, P < 0.001) and women (F ---- 3.93,
Hassles and Uplifts vs. Major Life Evenls 23
The second theme was touched on in the present study in only a casual and limited way to add information on the construct validity of the Hassles and Uplifts Scales. This theme concerns the hassles and uplifts content patterns displayed by different groups. By comparing three samples with respect to their most frequent hassles--a middle-aged group with whom we have been working intensively and longitudinally, a group of local college students, and a group of Canadian health professionals--we begin to discern different patterns of hassle themes for each group, themes roughly consistent with their age and station in life. For example, while the middle- aged group reported being frequently hassled by economic concerns, a theme consistent with their nearness to retirement, the students were struggling with the academic and social demands of campus life, and the health professionals were preoccupied with the responsibilities and pressures of their work and home life. With respect to uplifts, our middle- aged sample found pleasure in being at home with their family, while the students looked to entertainment, music, and being with friends. An age- related difference demonstrating the tandem use of the Hassles and Uplifts Scales is that the students were often hassled by too little sleep, while the middle-aged sample reported that having enough sleep was an uplift.
Clearly, we need to assess more systematically individual and group differences in the content of hassles and uplifts, since even more than life events these are often apt to reveal the sources of stress and satisfaction that people experience and the kinds of problems with which they must cope. The task of grouping items is made more difficult by an open-ended style of scale construction in which, like adjective checklists (e.g., Gough, 1960), people list not only different items but different number of items. Methods for creating subscales that may overcome these difficulties are currently being developed (Kanner, 1981).
This study has thus far only begun the task of measuring hassles and uplifts and of demonstrating their value as descriptors of life stress in divergent populations and individuals, as state variables subject to change, and as possible mediators of the effect on adaptational outcomes of major life events. It is, we believe, a useful step toward improving and extending the measurement of stress and of sources of satisfaction in daily life, and toward advancing our understanding of stress as a factor in health and illness.
P< 0.02)i As determined by a Student -- Newman -- Keuls aposteriori range test, for men the two groups high in hassles (i.e., high hassles, high uplifts; high hassles, low uplifts) were significantly higher (significance level set at P < 0.05) on symptoms than the two groups low on hassles, whereas for women the high-high group showed higher symptomatology than the low -low group. Due to the unequal size of the groups, and the relatively low N, whether this constitutes an actual interaction effect for women awaits cross-validation and more detailed analysis.

24 Kanner, Coyne, Schaefer, and Lazarus
A P P E N D I X
THE HASSLES SCALE
Directions: Hassles are irritants that can range from minor annoyances
to fairly major pressures, problems, or difficulties. They can occur few or
many times.
Listed in the center of the following pages are a number of ways in which
a person can feel hassled. First, circle the hassles that have happened to
you in the past month. Then look at the numbers on the right of the items you
circled. Indicate by circling a i, 2, or 3 how SEVERE each of the circled
hassles has been for you in the past month. If a hassle did not occur in the
last month do NOT circle it.
.............................................................................
SEVERITY
i. Somewhat severe
HASSLES 2. Moderately severe
3. Extremely severe
(I) Misplacing or losing things ...................... i 2 3
(2) Troublesome neighbors ............................ i 2 3
(3) Social obligations ............................... 1 2 3
(4) Inconsiderate smokers ............................. i 2 3
(5) Troubling thoughts about your future ............. i 2 3
(6) Thoughts about death ............................. i 2 3
(7) Health of a family member ........................ i 2 3
(8) Not enough money for clothing .................... I 2 3
(9) Not enough money for housing ..................... 1 2 3
(i0) Concerns about owing money ....................... i 2 3
(ii) Concerns about getting credit .................... i 2 3
(12) Concerns about money for emergencies ............. i 2 3

Hasslesand Upliftsvs. M~or Life Evenls
HASSLES SCALE
HASSLES
SEVERITY
i. Somewhat severe
2. Moderately severe
3. Extremely severe
(13) Someone owes you money ........................... i
(14) Financial responsibility for someone
who doesn't live with you ................... i
(15) Cutting down on electricity, water, etc ......... 1
(16) Smoking too much ................................ 1
(17) Use of alcohol .................................. 1
(18) Personal use of drugs ........................... 1
(19) Too many responsibilities ....................... 1
(20) Decisions about having children ................. 1
(21) Non-family members living in your house ......... 1
(22) Care for pet .................................... 1
(23) Planning meals .................................. 1
(24) Concerned about the meaning of life ............. 1
(25) Trouble relaxing ................................ 1
(26) Trouble making decisions ........................ 1
(27) Problems getting along with fellow workers ...... 1
(28) Customers or clients give you a hard time ....... 1
(29) Home maintenance (inside) ....................... 1
(30) Concerns about job security ... ................. . 1
(31) Concerns about retirement ....................... 1
(32) Laid-off or out of work ......................... 1
(33) Don't like current work duties .................. 1
(34) Don't like fellow workers ....................... 1
(35) Not enough money for basic necessities .......... 1
2 3
2
2
2
2
2
2
2
2
2
2
2
2
2
2
2
2
2
2
2
2
2
2
25
3
3
3
3
3
3
3
3
3
3
3
3
3
3
3
3
3
3
3
3
3
3

26
HASSLES SCALE
HASSLES
Kanner, Coyne, Schaefer, and Lazarus
SEVERITY
i. Somewhat severe
2. Moderately severe
3. Extremely severe
(36) Not enough money for food ...................... i
(37) Too many interruptions ......................... 1
(38) Unexpected company ................ ; ............ 1
(39) Too much time on hands ......................... 1
(40) Having to wait ................................. 1
(41) Concerns about accidents ....................... 1
(42) Being lonely ................................... 1
(43) Not enough money for health care ............... 1
(44) Fear of confrontation .......................... 1
(45) Financial security ............................. 1
(46) Silly practical mistakes ....................... 1
(47) Inability to express yourself .................. 1
(48) Physical illness ............ ~ .................. i
(49) Side effects of medication ..................... 1
(50) Concerns about medical treatment .............. 1
(51) Physical appearance ........................... 1
(52) Fear of rejection ............................. 1 o
(53) Difficulties with getting pregnant ............ 1
(54) Sexual problems that result from
physical problems ......................... 1
(55) Sexual problems other than those
resulting from physical problems .......... 1
(56) Concerns about health in general .............. 1
2 3
2 3
2 3
2 3
2 3
2 3
2 3
2 3
2 3
2 3
2 3
2 3
2 3
2 3
2 3
2 3
2 3
2 3
2 3
2 3
2 3

Hasslesand Upliftsvs. MajorLife Events
HASSLES SCALE
HASSLES
(57) Not seeing enough people ........................
(58) Friends or relatives too far away ...............
(59) Preparing meals .................................
(60) Wasting time ....................................
(61) Auto maintenance ................................
(62) Filling out forms ...............................
(63) Neighborhood deterioration ......................
(64) Financing children's education ..................
(65) Problems with employees .........................
(66) Problems on job due to being a woman or man .....
(67) Declining physical abilities ..... ...............
(68) Being exploited .................................
(69) Concerns about bodily functions .................
(70) Rising prices of common goods ...................
(71) Not getting enough rest .........................
(72) Not getting enough sleep ........................
(73) Problems with aging parents .....................
(74) Problems with your children . . . . . . . . . . . . . . . . . . . . .
(75) Problems with persons younger than yourself .....
(76) Problems with your lover ........................
(77) Difficulties seeing or hearing ..................
(78) Overloaded with family responsibilities .........
(79) Too many things to do ...........................
27
SEVERITY
i. Somewhat severe
2. Moderately severe
3. Extremely severe
i 2 3
1 2 3
I 2 3
I 2 3
i 2 3
i 2 3
1 2 3
i 2 3
1 2 3
I 2 3
1 2 3
i 2 3
i 2 3
i 2 3
1 2 3
1 2 3
1 2 3
1 2 3
1 2 3
1 2 3
1 2 3
1 2 3
1 2 3

28
HASSLES SCALE
HASSLES
(80) Unchallenging work ...............................
(81) Concerns about meeting high standards ............
(82) Financial dealings with friends or acquaintances .
(83) Job dissatisfactions .............................
(84) Worries about decisions to change jobs ...........
(85) Trouble with reading, writing, or
spelling abilities ...........................
(86) Too many meetings ................................
(87) Problems with divorce or separation ..............
(88) Trouble with arithmetic skills ...................
(89) Gossip ...........................................
(90) Legal problems ...................................
(91) Concerns about weight ............................
(92) Not enough time to do the things you need to do ..
(93) Television .......................................
(94) Not enough personal energy .......................
(95) Concerns about inner conflicts ...................
(96) Feel conflicted over what to do ..................
(97) Regrets over past decisions ......................
(98) Menstrual (period) problems ......................
(99) The weather ......................................
(i00) Nightmares .......................................
(101) C o n c e r n s a b o u t g e t t i n g a h e a d . . . . . . . . . . . . . . . . . . . . .
Kanner, Coyne, Schaefer, and Lazarus
SEVERITY
i. Somewhat severe
2. Moderately severe
3. Extremely severe
1 2 3
i 2 3
i 2 3
1 2 3
1 2 3
i 2 3
1 2 3
i 2 3
i 2 3
i 2 3
i 2 3
i 2 3
i 2 3
i 2 3
i 2 3
1 2 3
i 2 3
1 2 3
i 2 3
i 2 3
1 2 3
i 2 3

Hassles and Uplifts vs.M~orEife Events
HASSLES SCALE
HASSLES
(102) Hassles from boss or supervisor ................
(103) Difficulties with friends ......................
(104) Not enough time for family .....................
(105) Transportation problems ........................
(106) Not enough money for transportation ............
(107) Not enough money for entertainment
and recreation ..............................
(108) Shopping .......................................
(109) Prejudice and discrimination from others .......
(110) Property, investments or taxes .................
(IIi) Not enough time for entertainment
and recreation ..............................
(112) Yardwork or outside home maintenance ...........
(113) Concerns about news events .....................
(114) Noise ..........................................
(115) Crime .........................................
(116) Traffic ........................................
(117) Pollution ......................................
HAVE WE MISSED ANY OF YOUR HASSLES? IF SO, WRITE
THEM'IN BELOW:
(118)
ONE MORE THING: HAS THERE BEEN A CHANGE IN YOUR
LIFE THAT AFFECTED HOW YOU ANSWERED THIS SCALE?
IF SO, TELL US WHAT IT WAS;
29
SEVERITY
i. Somewhat severe
2. Moderately severe
3. Extremely severe
1 2 3
1 2 3
1 2 3
1 2 3
1 2 3
1 2 3
1 2 3
1 2 3
1 2 3
1 2 3
1 2 3
i 2 3
1 2 3
i 2 3
i 2 3
i 2 3
1 2 3

30 Kanner, Coynel Schaefer, and Lazarus
THE UPLIFTS SCALE
Directions: Uplifts are events that make you feel good. They can be
sources of peace, satisfaction, or joy. Some occur often, others are relatively
rare.
On the following pages, circle the events that have made you feel good in
the past month. Then look at the numbers on the right of the items you circled.
Indicate by circling a i, 2, or 3 how OFTEN each of the circled uplifts has
occurred in the last month. If an uplift did not occur in the last month, do
NOT circle it.
. . . . . . . . . . . . . . . . . . . . . . . . . . . . . . . . . . . . . . . . . . . . . . . . . . . . . . . . . . . . . . . . . . . . . . . . . . . . . . . . .
UPLIFTS
(i) Getting enough sleep ............................
(2) Practicing your hobby ............. ..............
(3) Being lucky .....................................
(4) Saving money ....................................
(5) Nature ..........................................
(6) Liking fellow workers ...........................
(7) Not working (on vacation, laid-off, etc.) .......
(8) Gossiping; "shooting the bull" ..................
(9) Successful financial dealings ...................
(I0) Being rested ....................................
(ii) Feeling healthy .................................
(12) Finding something presumed lost .................
(13) Recovering from illness .........................
HOW OFTEN
i. Somewhat often
2. Moderately often
3. Extremely often
i 2 3
i 2 3
i 2 3
i 2 3
i 2 3
i 2 3
i 2 3
i 2 3
1 2 3
i 2 3
i 2 3
i 2 3
i 2 3

Hasslesand Upliftsvs. MajorLife Events
UPLIFTS SCALE
UPLIFTS
(14) Staying or getting in good physical shape .......
(15) Being with children .............................
(16) "Pulling something off"; getting
away with something .........................
(17) Visiting, phoning, or writing someone ...........
(18) Relating well with your spouse or lover .........
(19) Completing a task ...............................
(20) Giving a compliment .............................
(21) Meeting family responsibilities .................
(22) Relating well with friends ......................
(23) Being efficient .................................
(24) Meeting your responsibilities ...................
(25) Quitting or cutting down on alcohol .............
(26) Quitting or cutting down on smoking .............
(27) Solving an ongoing practical problem ............
(28) Daydreaming .....................................
(29) Weight ..........................................
(30) Financially supporting someone who doesn't
live with you ...............................
(31) Sex .............................................
(32) Friendly neighbors ..............................
(33) Having enough time to do what you want ..........
(34) Divorce or separation ...........................
31
1 2 3
i 2 3
i 2 3
1 2 3
i 2 3
i 2 3
i 2 3
i 2 3
1 2 3
i 2 3
1 2 3
i 2 3
i 2 3
i 2 3
i 2 3
I 2 3
i 2 3
1 2 3
i 2 3
HOW OFTEN
i. Somewhat often
2. Moderately often
3. Extremely often
1 2
1 2

32
UPLIFTS SCALE
UPLIFTS
(35) Eating out ......................................
(36) Having enough (personal) energy .................
(37) Resolving inner conflicts .......................
(38) Being with older people .........................
(39) Finding no prejudice or discrimination when
you expect it ...............................
(40) Cooking .........................................
(41) Capitalizing on an unexpected opportunity .......
(42) Using drugs or alcohol ..........................
(43) Life being meaningful ...........................
(44) Being well-prepared .............................
(45) Eating ..........................................
(46) Relaxing .........................................
(47) Having the "right" amount of things to do .......
(48) Being visited, phoned, or sent a letter .........
(49) The weather .....................................
(50) Thinking about the future .......................
(51) Spending time with family .......................
(52) Home (inside) pleasing to you ...................
(53) Being with younger people .......................
(54) Buying things for the house .....................
(55) Reading .........................................
(56) Shopping ........................................
Kanner, Coyne, Schaefer, and Lazarus
HOW OFTEN
i. Somewhat often
2. Moderately often
3. Extremely often
i 2 3
i 2 3
I 2 3
l 2 3
i 2 3
1 2 3
i 2 3
i 2 3
i 2 3
i 2 3
i 2 3
i 2 3
i 2 3
i 2 3
i 2 3
i 2 3
i 2 3
i 2 3
I 2 3
i 2 3
i 2 3
1 2 3

Hassles and Uplifts vs. Major Life Events
UPLIFTS SCALE
UPLIFTS
(57) Smoking .........................................
(58) Buying clothes ..................................
(59) Giving a present ................................
(60) Getting a present ...............................
(61) Becoming pregnant or contributing thereto .......
(62) Having enough money for health care .............
(63) Traveling or com~uting ..........................
(64) Doing yardwork or outside housework .............
(65) Having enough money for transportation ..........
(66) Health of a family member improving .............
(67) Resolving conflicts over what to do .............
(68) Thinking about health ...........................
(69) Being a "good" listener .........................
(70) Socializing (parties, being with friends, etc.) .
(71) Making a friend .................................
(72) Sharing something ...............................
(73) Having someone listen to you ....................
(74) Your yard or outside of house is pleasing .......
(75) Looking forward to retirement ...................
(76) Having enough money for entertainment
and recreation ..............................
(77) Entertainment (movies, concerts, TV, etc.) ......
(78) Good news on local or world level ...............
33
HOW OFTEN
i. Somewhat often
2. Moderately often
3. Extremely often
1 2 3
i 2 3
i 2 3
i 2 3
1 2 3
1 2 3
I 2 3
I 2 3
1 2 3
i 2 3
i 2 3
1 2 3
1 2 3
i 2 3
I 2 3
i 2 3
i 2 3
i 2 3
1 2 3
1 2 3
I 2 3
1 2 3

34
UPLIFTS SCALE
(79)
(80)
(81)
(82)
(83)
(84)
(85)
(86)
(87)
(S8)
UPLIFTS
(89)
(9o)
(91)
(92)
(93)
(94)
(95)
(96)
(97)
(98)
(99)
(100)
Getting good advice .............................
Recreation (sports, games, hiking, etc.) ........
Paying off debts ................................
Using skills well at work .......................
Past decisions "panning out" ....................
Growing as a person .............................
Being complimented .................... .........
Having good ideas at work .......................
Improving or gaining new skills ..: ..............
Job satisfying despite discrimination
due to your sex .............................
Free time .......................................
Expressing yourself well ........................
Laughing ........................................
Vacationing without spouse or children ...........
Liking work duties ..............................
Having good credit ..............................
Music ...........................................
Getting unexpected money ........................
Changing Jobs ...................................
Dreaming ........................................
Having fun ......................................
Going someplace that's different ................
Kanner, Coyne, Schaefer, and Lazarus
HOW OFTEN
i. Somewhat often
2. Moderately often
3. Extremely often
i 2 3
i 2 3
1 2 3
i 2 3
i 2 3
i 2 3
i 2 3
i 2 3
i 2 3
i 2 3
i 2 3
i 2 3
i 2 3
i 2 3
i 2 3
i 2 3
i 2 3
1 2 3
i 2 3
i 2 3
i 2 3
i 2 3
i 2 3

Hasslesand Upliftsvs. M~or Life Events
UPLIFTS SCALE
UPLIFTS
(i01)
(102)
(i03)
(104)
(105)
(106)
(i07)
(108)
(109)
(11o)
(Iii)
(112)
(113)
(i14)
(i15)
(i16)
(ii7)
(118)
(i19)
(120)
(121)
Deciding to have children ......................
Enjoying non-family members living
in your house ...............................
Pets ...........................................
Car working/running well .......................
Neighborhood improving .........................
Children's accomplishments .....................
Things going well with employee(s) .............
Pleasant smells ................................
Getting love ...................................
Successfully avoiding or dealing with
bureaucracy or institutions .................
Making decisions ...............................
Thinking about the past ........................
Giving good advice .............................
Praying ........................................
Meditating .....................................
Fresh air ......................................
Confronting someone or something ...............
Being accepted .................................
Giving love ....................................
Boss pleased with your work ....................
Being alone ....................................
35
HOW OFTEN
I. Somewhat often
2. Moderately often
3. Extremely often
i 2 3
i 2 3
1 2 3
1 2 3
1 2 3
i 2 3
1 2 3
i 2 3
i 2 3
i 2 3
1 2 3
1 2 3
1 2 3
i 2 3
l 2 3
i 2 3
1 2 3
I 2 3
i 2 3
i 2 3
i 2 3

36
UPLIFTS SCALE
(122)
(123)
(124)
(125)
(126)
(127)
(128)
(129)
(130)
(131)
(132)
(133)
(134)
(135)
(136)
UPLIFTS
Feeling safe ...................................
Working well with fellow workers ...............
Knowing your job is secure .....................
Feeling safe in your neighborhood ..............
Doing volunteer work ...........................
Contributing to a charity ......................
Learning something .............................
Being "one" with the world .....................
Fixing/repairing something (besides at your job)
Making something (besides at your job) .........
Exercising .......... ...........................
Meeting a challenge ............................
Hugging and/or kissing .........................
Flirting .......................................
HAVE WE MISSED ANY OF YOUR UPLIF~S? IF SO, I~RITE
THEM IN BELOW:
ONE MORE THING: HAS THERE BEEN A CHANGE IN YOUR
LIFE THAT AFFECTED HOW YOU ANSWERED THIS SCALE?
IF SO, TELL US WHAT IT WAS:
Kanner, Coyne, Schaefer, and Lazarus
HOW OFTEN
i. Somewhat often
2. Moderately often
3. Extremely often
1 2 3
i 2 3
i 2 3
i 2 3
i 2 3
i 2 3
i 2 3
i 2 3
l 2 3
i 2 3
i 2 3
i 2 3
i 2 3
I 2 3
1 2 3
REFERENCES
Andrew, G., Tennant, C., Hewson, D., and Schonell, M. (1978). The relation of social factors to physical and psychiatry illness. Am. J. Epidemiol. 108: 27-35.
Beck, A. T. (1961). An inventory for measuring depression. Arch. Gen. Psychiat. 4: 561-571. Bradburn, N. (1969). The Structure o f Well-Being, Aldifie, Chicago.

Hassles and Uplifts vs. Major Life Events 37
Bradburn, N., and Caplowitz, D. (1965). Reports on Happiness, Aldine, Chicago. Bukowski, C. (1980). The shoelace. Bukowski Reads His Poetry, Takoma Records, Santa
Monica, Calif. Campbell, A. (l 976). Subjective measures of well-being. A m. Psychol. 31 : 117-124. Caplan, R. D., and Jones, K. W. (1975). Effects of work load, role ambiguity, and Type A
personality on anxiety, depression, and heart rate. J. Appl. Psychol. 60: 713-719. Costa, P. To, Jr., and McCrae, R. R. (1980). Influence of extraversion and neuroticism on
subjective well-being: Happy and unhappy people. J. Personal. Soc. PsychoL 38: 668-678.
Cousins, N. (1976). Anatomy of an illness (as perceived by the patient). N. Engl. J. Med. 295: 1458-1463.
Coyne, J., Kanner, A., and Hulley, L. (1979). Life events, hassles, and adaptation: A test of the shoelace hypothesis. Paper presented at Meeting of the Western Psychological Association, San Diego, California, April 6, 1979.
Coyne, J. C., and Lazarus, R. S. (1980). Cognitive style, stress perspective, and coping: I n Kutash, I. L., and Schlesinger, L. B. (eds.), Handbook on Stress and Anxiety, Jossey- Bass, San Francisco pp. 144-158.
Derogatis, L. R., Lipman, R. S., Covi, L., Rickels, K., and Uhlenhuth, E. H. (1970). Dimensions of outpatient neurotic pathology: Comparison of a clinical versus an empirical assessment. J. Consult. Psychol. 34: 164-171.
Derogatis, L. R., Lipman, R. S., Covi, L., and Rickels, K. (1971). Neurotic symptom dimen- sions: As perceived by psychiatrists and patients of various social classes. Arch. Gen. Psychiat. 24: 454-464.
Derogatis, L. R., Lipman, R. S., Rickels, K., Uhlenhuth, E. H., and Covi, L. (1974). The Hopkins Symptoms Checklist (HSCL): A measure of primary symptom dimensions. In Pichot, P. (ed.), Psychological Measurements in Psyehopharmacology. Modern Problems in Pharmacopsychiatry, Vol. 7, Karger, Basel, pp. 79-110.
Dohrenwend, B. S., and Dohrenwend, B. P. (eds.) (1974). Stressful Life Events: Their Nature and Effects, Wiley, New York.
Dohrenwend, B. S., and Dohrenwend, B. P. (1978). Some issues in research on stressful life events. J. Nerv. Ment. Dis. 166: 7-15.
Epstein, S. (1976). Anxiety, arousal and the self-concept. In Sarason, I. G., and Spielberger. C. D. (eds.), Stress and Anxiety, Vol. 3, Hemisphere, Washington, D.C., pp. 185-224.
Epstein, S. (1979). The stability of behavior: On predicting most of the people much of the time. J. Personal. Soc. Psychol. 37:1097-1 t26.
Evans, G. W., Jacobs, S. V., and Frazer, N. B. (19 ). Behavioral adaptation to air pollution, Unpublished paper.
Folkman, S., and Lazarus, R. S. (1980). An analysis of coping in a middle-aged community sample. J. Health Soc. Behav. 21: 21%239.
Frankenhaeuser, M., and Gardell, B. (1976). Underload and overload in working life: Outline of a multidisciplinary approach. J. Human Stress 2: 35-46.
Friedman, M., and Rosenman, R. H. (1974). Type A Behavior and Your Heart, Knopf, New York.
Gersten, J. C., Langer, T. S., Eisenberg, J. G., and Orzeck, C. (1974). Child behavior and life events: Undesirable change or change per se? In Dohrenwend, B. S., and Dohren- wend, B. P. (eds.), Stressful Life Events: Their Nature and Effects, Wiley, New York, pp. 159-170.
Glass, D. C., and Singer, J. E. (1972). Urban Stress, Academic Press, New York. Gough, H. G. (1960). The ACL as a personality assessment research technique. Psychol. Rep.
6: 107-122. Hinkle, L. E. (1974). The concept of "stress" in the biological and social sciences. Int. J.
Psychiat. Med. 5: 355-357. Hochstim, J. R, (1970). Health and ways of living. In Kessler, I. J., Levin, M. L. (eds.),
The Community as an Epidemiological Laboratory, Johns Hopkins Press, Baltimore, pp. 149-176.
Holmes, T. H., and Masuda, M. (1974). Life change and illness susceptibility. In Dohrenwend, B. S., and Dohrenwend, B. P. (eds.), Stressful Life Events: Their Nature and Effects, Wiley, New York, pp. 45-72.

38 Kanner, Coyne, Schaefer, and Lazarus
Holmes, T. H., and Rahe, R. H. (1967). The social readjustment rating scale. J. Psychosom. Res. 4: 189-194.
Horowitz, M., Schaefer, C., Hiroto, D., Wilner, N., and Levin, B. (1977). Life events questionnaires for measuring presumptive stress. Psychosom. Med. 6:413-431.
Horowitz, M., Wilner, N., and Alverez, W. (1979). Impact of event scale: A measure of subjective stress. Psychosom. Med. 41: 209-218.
Hough, R. L., Fairbank, D. T., and Garcia, A. M. (1976). Problems in the ratio measurement of life stress. J. Health Soc. Behav. 17: 70-82.
James, S. A., and Kleinbaum, D. G. (1976). Socioecologic stress and hypertension-related mortality rates in North Caroline. Am. J. Public Health 66(4): 354-358.
Jenkins, C. D., Friedman, M., and Rosenman, R. H. (1965). The Jenkins Activity Survey for Health Prediction, C. David Kenkins, University of North Carolina, Chapel Hill.
Kahn, R. L., Wolfe, D. M., Quinn, R. P., and Snoek, J. D. (1964). Organizational Stress: Studies in Role Conflict and Ambiguity, Wiley, New York.
Kanner, A. D. (1981). Hassles and uplifts subscales: An analysis o f meaning-centered versus cumulative effects. Unpublished doctoral dissertation, University of California, Berkeley.
Kanner, A., and Coyne, J. (1979). Uplifts, hassles, and a little androgyny. Paper presented at the Meeting of the Western Psychological Association, San Diego, California, April 6, 1979.
Kanner, A. D., Kafry, D., and Pines, A. (1978). Conspicuous in its absence: The lack of positive conditions as a source of stress. J. Human Stress 4: 33-39.
Kaplan, H. D. (1979). Social psychology of disease. In Freeman, H. G., Levine, S., and Reeder, L. F. (eds.), Handbook of Medical Sociology, 3rd ed., Prent ice-Hall , Englewood Cliffs, N.J., pp. 53-70.
Lazarus, R. S. (1980). The stress and coping paradigm. In Eisdorfer, C., Cohen, D., and Kleinman, A. (eds.), Conceptual Models for Psychopathology, Spectrum, New York, pp. 173-209.
Lazarus, R. S., and Cohen, J. B. (1977). Environmental stress. In Altman, I., and WohlwiU, J. F. (eds.), Human Behavior and the Environment: Current Theory and Research, Plenum New York, pp. 89-127.
Lazarus, R. S., and Launier, R. (1978). Stress-related transactions between person and environment. In Pervin, L. A., and Lewis, M. (eds.), Perspectives in lnteractional Psychology, Plenum, New York, pp. 287-327.
Lazarus, R. S., Cohen, J. B., Folkman, S., Kanner, A., and Schaefer, C. (1980a). Psychological stress and adaptation: Some unresolved issues. In Selye, H. (ed.), Selye's Guide to Stress Research, Vol. 1, Van Nostrand Reinhold, New York, pp. 90-117.
Lazarus, R. S., Kanner, A., and Folkman, S. (1980b). Emotions: A cognitive-phenomeno- logical analysis. In Plutchik, R., and Kellerman, H. (eds.), Theories of Emotion, Academic Press, New York, pp. 189-217.
Levine, S., and Scotch, N. A. (eds.) (1970). Social Stress, Aldine, Chicago. Lewinsohn, P. M., and Talkington, J. (1979). Studies of the measurement of unpleasant
events and relations with depression. Appl. Psychol. Measure. 3: 83-101. Lowenthal, M. F., and Chiriboga, D. (1973). Social stress and adaptation: Toward a life-
course perspective. In Eisdorfer, C., and Lawton, M. P. (eds.), The Psychology of Adult Development and Aging. American Psychological Association, Washington, D.C., pp. 281-310.
Luborsky, L., Docherty, J. P., and Penick, S. (1973). Onset conditions for psychosomatic symptoms: A comparative review of immediate observation with retrospective research. Psychosom. Med. 35: 187-204.
McLean, P. (1976). Depression as a specific response to stress. In Sarason, I. G., and Spielberger, C. D. (eds.), Stress and Anxiety, Vol. 3, Hemisphere, Washington, D;C., pp. 297-323.
Mechanic, D. (1974). Discussion of research programs on relations between stressful life events and episodes of physical illness. In Dohrenwend, B. S., and Dohrenwend, B. P. (eds.), Stressful Life Events: Their Nature and Effects, Wiley, New York, pp. 87-97.
Mueller, D. P., Edwards, D. W., and Yarvis, R. M. (1977). Stressful life events and psychiatric symptomatology: Change or undesirability? J. Health Soc. Behav. 18: 307-317.

Hassles and Uplifts vs. Major Life Events 39
Myers, J. K., Lindenthal, J. J., and Pepper, M. P. (1974). Social class, life events, and psychiatric symptoms: A longitudinal study. In Dohrenwend, B. S., and Dohrenwend, B. P. (eds.), Stressful Life Events: Their Nature and Effects, Wiley, New York, pp. 191-205.
Nofsinger, E. B. (1977). Psychological Stress and Illness, Unpublished doctoral dissertation, University of California, Berkeley.
Novaco, R. W., Stokols, D., Campbell, J., and Stokols, J. (1979). Transportation, stress and community psychology. Am. J. Commun. Psychol. 7: 361-380.
Pearlin, L. I. (1975a). Sex roles and depression. In Datan, N., and Ginsberg, L. H. (eds.), Life-Span Developmental Psychology: Normative Life Crises, Academic Press, New York, pp. 191-207.
Pearlin, L. I. (1975b). Status inequality and stress in marriage. Am. Sociol. Rev. 40: 344-357. Pearlin, L. I., and Lieberman, M. A. (1977). Social sources of emotional distress. In Simmons, J.
(ed.), Research in Community and Mental Health, JAI Press, Greenwich, Conn. Rabkin, J. G., and Struening, E. L. (1976). Life events, stress, and illness. Science 194:
1013-1020. Redfield, J., and Stone, A. (1979). Individual viewpoints of stressful life events. J. Consult.
Clin. Psychol. 47: 147-154. Rickels, K., Lipman, R. S., Garcia, C. R., and Fisher, E. (1972). Evaluating clinical improve-
ment in anxious outpatients: A comparison of normal and treated neurotic patients. Am. J. Psychiat. 128:119-123.
Ross, C. E., and Minowsky, J., II (1979). A comparison of life-event-weighting schemes: Change, undesirability, and effect-proportional indices. J. Health Soc. Behav. 20: 166-177.
Sarason, I. G,, Johnson, J. H. , and Siegel, J. M. (1978). Assessing the impact of life changes: Development of the Life Experiences Survey. J. Consult. Clin. Psychol. 46: 932-946.
Selye, H. (1974). Stress Without Distress. Lipincott, Philadelphia. Stahl, S. M., Grim, C. E., Donald, S., and Neikirk, H. J. (1975). A model for the social
sciences and medicine: The case for hypertension. Soc. Sci. Med. 9- 31-38. Uhlenhuth, E. H., Lipman, R. S., Baiter, M. B., and Stern, M. (1974). Symptom intensity
and life stress in the city. Arch. Gen. Psychiat. 128: 119-123. Vinokur, A., and Selzer, M. (1975). Desirable versus undesirable events: Their relationship to
stress and mental distress. J. Personal. Soc. Psychol. 32: 329-337. Wilson, W. (1967). Correlates of avowed happiness. Psychol. Bull. 67: 294-306.
![Exploring Materials with AFM-based Electrostatic Modes · figurations including Maxwell stress microscopy and others [3, 4]. These modes were introduced for mapping the variations](https://img.pdfslide.us/doc/110x75/610104be12fd5c52aa569839/exploring-materials-with-afm-based-electrostatic-modes-figurations-including-maxwell.jpg)