Embed Size (px)
Citation preview
Comparison of the levels of presence and anxiety in an acrophobic environment viewed via HMD
or CAVE
Juan, M.Carmen1*
, Pérez, David2
1 Instituto Universitario de Automática e Informática Industrial, Universidad Politécnica de Valencia,
Camino de Vera, s/n. 46022 Valencia, Spain 2 LabHuman, Universidad Politécnica de Valencia, Camino de Vera, s/n. 46022 Valencia, Spain
Abstract
People who suffer from acrophobia fear any situation that involves heights. Several Virtual Reality
systems have been presented to treat this problem. This paper presents a comparison study of the levels
of presence and anxiety in an acrophobic environment that is viewed using a Computer Automatic
Virtual Environment (CAVE) and a Head-Mounted Display (HMD). In this environment, the floor fell
away and the walls rose up. To determine whether either of the two visualization systems induced a
greater sense of presence/anxiety in non-phobic users, an experiment comparing the two visualization
systems was carried out. Twenty-five participants took part in this study. After using each visualization
system (HMD or CAVE), the participants were asked to fill out an adapted Slater et al. questionnaire,
and a Student t test was applied to the data obtained. The CAVE induces a high level of presence in
users. The mean score was 5.01 (where 7 is the maximum value), which was higher than the score
obtained using the HMD which was 3.59. The Student t test indicates that there are significant
statistical differences. The level of anxiety was also examined at different times during the experiment.
The results indicate that both visualization systems provoke anxiety, but that the CAVE provokes more
anxiety than the HMD. The animation in which the floor falls away is the one that provoked the most
anxiety. The results from the correlation between the anxiety and the level of presence at the three
times indicated a significant correlation between the two measures.
1. Introduction
Virtual Reality Exposure Therapy (VRET) uses Virtual Reality (VR) as a tool for therapy. VR is
an attractive technology for therapy since the situation can be designed according to the key elements
of a specific problem, generating the same reactions and emotions in the patient that s/he would
experience in a similar situation in the real world. Different environments can be generated (objects,
places or situations) in which the patient experiences sensations similar to those s/he would have in a
real environment, however, since the environments are computer-generated (and therefore virtual),
there is no need for the patient to move to a real place. The therapist has significant control and can
manipulate the virtual environments to some extent. In addition, VRET is based on the assumption that
virtual environments can elicit anxiety and provide the opportunity for habituation (Rothbaum et al.,
1995a). In the DSM-IV(APA, 1994), anxiety is defined as an "apprehensive anticipation of future
danger or misfortune accompanied by a feeling of dysphoria or somatic symptoms of tension". This
definition implies that anxiety is a future-oriented state, that causes the organism to behave so that the
danger can be averted.
Several studies support the idea that emotions such as fear or anxiety, which are felt during
immersion, are related to presence. The sense of presence has been defined as the psychological
perception of "being in" or "existing in" the Virtual Environment in which one is immersed (Heeter,
1992; Witmer & Singer, 1998). Robillard et al. (2003) carried out a study that included participants
with and without specific phobias exposed to a virtual environment. They found a significant
correlation between the level of state anxiety and the level of presence experienced during immersions
in the virtual environment. In a study with participants suffering from acrophobia, Schuemie et al.
(2000) reported a significant correlation between the level of fear and the sense of presence during
immersion. In a study with participants suffering from arachnophobia, Renaud et al. (2002) found a
significant relationship between the level of anxiety during immersion and the sense of presence, and
* corresponding author e-mail: [email protected]
motor behavior in a virtual task. In another study that involved participants without phobias,
Regenbrecht, Schubert & Friedmann (1998) used regressions to control the impact of other subjective
variables on the sense of presence. They also deduced that the level of fear during immersion increases
proportionally with the sense of presence. In a study with 31 participants suffering from snake phobia,
Bouchard et al. (2008) presented a randomized within-between design with two conditions and three
counterbalanced immersions: (a) a baseline control immersion, (b) an immersion in a threatening and
anxiety-inducing environment, and (c) an immersion in a non-threatening environment that should not
induce anxiety. The measures of presence were significantly higher in b) than in either a) or c). Their
finding was not corroborated by the presence questionnaire, where scores varied significantly in the
opposite direction. However, the results from the brief one-item measure of presence did support the
significant contribution of emotions during the immersion to the subjective measure of sense of
presence. They also found correlations between anxiety and presence.
1.1. Treatment of acrophobia using Virtual Reality Exposure Therapy
Acrophobia is an intense fear of heights and consequent avoidance of locations that are related to
heights (e.g., balconies, terraces, elevators, skyscrapers, bridges, planes, etc.). People who suffer from
acrophobia know this fear is excessive or unreasonable, but they still fear any situation that involves
heights, even when it is other people who are in those same situations. The greatest fear is falling. The
most common treatment for acrophobia is “graded in vivo exposure”. In this treatment, the avoidance
behavior is broken by exposing the patient to a hierarchy of stimuli. After a time, habituation occurs
and the fear gradually diminishes. Several studies have focused on the effectiveness of treating
acrophobia with VR, some of which make comparisons with exposure in vivo.
In the early 1960s, psychologist Eleanor Gibson described her visual cliff experiment (Gibson &
Walk, 1960). For this experiment, she created an experimental environment with surfaces of two
different heights: one at surface level and one positioned a few feet below the first surfarce. A black
and white checkered cloth was then draped over the entire surfaces. Next a large sheet of heavy clear
plastic was placed to cover the entire setup, creating the perception that the floor drops sharply, even
though the plastic makes the surface level physically continuous. Even though the drop was just a
visual illusion, babies refused to cross a floor that appeared to drop steeply. A replication of a similar
setup within a virtual environment was developed by Meehan et al. (2002). Even seasoned VR
veterans had difficulty overcoming the feeling that the pit was real. Physiological signals collected
from the participants during the experiments showed that the virtual cliff induced the same
physiological responses as the traditional visual cliff or a corresponding real space.
Several case studies show that acrophobia can be treated effectively with VRET (Choi et al., 2001;
Rothbaum et al., 1995b). Rothbaum et al. (1995b) reported the first controlled study on VRET in
which 20 participants were randomly assigned to either a VRET (12 participants, 7 sessions, 35-45
minutes each) or a non-treatment control group (8 participants). They used 3 footbridges, 4 outdoor
balconies, and one glass elevator as virtual worlds. VRET was found to be significantly more effective
than non-treatment on all subjective measures of anxiety and avoidance. In another study, Emmelkamp
et al. (2001) used a within-group design, in which standard exposure in vivo was compared with
VRET. Ten participants were first treated with two 1-hour sessions of VRET followed by two 1-hour
sessions of exposure in vivo. The virtual environments were a diving tower plus swimming pool and a
tower building with a glass elevator. In vivo situations were a fire escape, balconies of an 18-story
building, and the roof of a 5-story building. VRET was found to be as effective as exposure in vivo on
all subjective measures. Nevertheless, firm conclusions about the comparative effectiveness could not
be drawn because of a potential order effect; all the participants received in vivo exposure after VRET.
In a different study, Emmelkamp et al. (2002) reproduced in the virtual environments, the places used
in real exposure (a shopping mall, a fire escape and a roof garden). Thirty-three acrophobic patients
were randomly assigned to either VRET (17 patients) or exposure in vivo (16 patients). VRET and
exposure in vivo consisted of three sessions of 60 minutes. VRET was found to be as effective as
exposure in vivo in combatting anxiety and avoidance. The improvements were maintained at a 6-
month follow-up. The study that is most closely related to our work was presented by Krijn et al.
(2004). This study was designed to investigate the effectiveness of two different conditions of VRET,
varying in the degree of presence. A CAVE was compared with a HMD. The effect of time was
studied by adding a non-treatment control group. They used a building, a fire escape and a roof garden
as virtual environments. The 37 patients who participated in the study were randomly assigned across
the three conditions. Therapy consisted of three sessions of 1 hour each. No time effect was found for
the waiting period on any measure. The participants in the non-treatment control group were randomly
assigned to either CAVE or HMD after the waiting period, and their non-treatment post tests were
used as pretests for the treatment conditions. The results showed that there were no differences in
effectiveness between the two visualization systems on any measure. Presence was significantly higher
in the CAVE, but this did not result in a more effective treatment. VRET, with either the CAVE or
HMD, was significantly more effective than non-treatment. The dropout rate was high (10 out of 35
patients). The results showed that the dropouts experienced significantly less presence and anxiety in
the virtual environments than the completers did. They did not find correlations between presence and
anxiety during the sessions. In 2007, Krijn et al. (2007) also presented a study in which the
effectiveness of VRET and VRET plus coping self-statements were compared. The results indicated
that the addition of coping self-statements did not influence the effectiveness of treatment.
1.2. Augmented Reality for psychological treatments
Recently, Augmented Reality (AR) has also been presented as an available technology for treating
phobias. Juan et al. (2005) and Botella et al. (2005) presented the first AR system for the treatment of
phobias of cockroaches and spiders. In these works, they demonstrated that, with a single one-hour
session, patients significantly reduced their fear and avoidance. Initially, the system was tested in a
case study (Botella et al., 2005), and then it was tested on nine patients suffering from phobia of small
animals (Juan et al., 2005). They have also proposed the use of immersive photography in an AR
system for the treatment of acrophobia (Juan et al., 2006). In this system, forty-one participants
without acrophobia walked around at the top of a staircase in both a real environment and in an
immersive photography environment. Immediately after their experience, the participants were given
the SUS questionnaire to assess their subjective sense of presence. The users’ scores in the immersive
photography environment were very high. The results indicated that the acrophobic context could be
useful for the treatment of acrophobia. However, statistically significant differences were found
between the real and immersive photography environments.
1.3. Measures for presence
Since presence is a subjective condition, it has most commonly been measured using self-reports,
either during the VR experience or immediately afterwards by questionnaires. Several questionnaires
have been proposed and how to best measure presence has been discussed (Barfield et al., 1995; Ellis,
1996; Lombard & Ditton, 1997; Regenbrecht et al., 1998; Schubert, Friedmann & Regenbrecht, 1999;
Sheridan, 1996; Slater, 1999; Witmer & Singer, 1998). Some attempts at measuring presence using
physiological measures have also been made. Meehan et al. (2002) used a Training Room (an ordinary
room with some furniture) and an adjacent Pit Room. The Pit Room had an unguarded hole in the floor
leading to a room 20 feet below. On the upper level, the Pit Room was bordered with a 2-foot wide
walkway. On the lower level, there was a furnished Living Room. In this environment, users equipped
with a HMD practiced walking about, picking up, and placing objects in the Training Room. Then,
they were asked to carry an object into the next room and place it at a designated spot. Meehan et al.
hypothesized that a virtual environment would evoke physiological responses similar to those evoked
by the corresponding real environment, and that a greater sense of presence would evoke a greater
response. To examine this hypothesis, they conducted three experiments, the results of which support
the use of physiological reaction as a reliable, valid, sensitive, and objective presence measure. The
experiments compared the participants’ physiological reactions to a non-threatening virtual room and
their reactions to a stressful virtual height situation. They found that changes in heart rate, as well as
changes in skin conductance to a lesser extent satisfied their requirements for a measure of presence,
but changes in skin temperature did not.
1.4. Previous comparative studies between different visualization systems
Several studies related to the effectiveness of virtual environments at different levels of immersion
have been reported. These studies can be divided into two groups. In the first group, we include
comparisons between extreme opposites, like a CAVE and a standard desktop computer (Arns, Cruz-
Neira & Cook, 1999; Gruchalla, 2004; Datey, 2002). In the second group, we include studies that
analyze external factors such as field-of-view (FOV), stereoscopy, head tracking, sounds, tactile
augmentation, etc. (Hendrix & Barfield, 1996a,b; Prothero et al., 1995; IJsselsteijn et al., 2001; Shim
& Kim, 2004; Welch et al., 1996; Waterworth & Waterworth, 2003). The Master’s thesis by Raja
(Raja, 2006) includes studies from both groups.
With regard to the first group, Arns, Cruz-Neira & Cook (1999) compared a similar application
running on a desktop tool set (XGobi) with a CAVE. Similar datasets were displayed on the two
systems, and the users performed a series of tasks in order to see if there were any tangible benefits of
viewing datasets in an immersive environment. The authors hypothesized that viewing high
dimensional statistical data would be more efficient in an immersive virtual environment. Even though
the two systems differed in many respects, the authors found that some tasks requiring spatial
understanding were performed more quickly in the virtual environment than on the desktop. Another
study comparing a desktop with a CAVE for oil well-path editing tasks was presented by Gruchalla
(2004). In this case, the systems were more similar to each other than those used in the previous case,
but they still differed in many respects. Gruchalla found significantly better task performance in the
CAVE. In a Master’s thesis presented by Datey (2002), the use of a desktop and an HMD to determine
if an immersive virtual environment provided any benefit when spatial attributes of the data were
important in task completion was presented. The author found a trend of increased task performance in
the immersive condition, but this trend was not statistically significant. In this study, there were also
many differences between the two systems. In the Master’s thesis presented by Raja, he presents a
methodology, two information visualization applications that were developed using the CAVE, and
three user studies in order to explore, examine and attempt to quantify the effects of immersion. He
focused on three major components of immersion: field of view (FOV), head-based rendering (HBR),
and stereoscopic viewing. He hypothesized that a high degree of FOV would result in increased task
performance and user satisfaction when visualizing data represented by scatter and surface plots. He
also hypothesized that HBR and stereoscopic viewing would result in increased task performance, but
the effects of these components would be greater in the scatter plots than surface plots. He conducted
three user studies. In the first study, an exploratory pilot study, he observed a trend in favor of using
high FOV and HBR. In the second exploratory pilot study, he observed a slight trend in favor of high
FOV. In the third study, thirty-two subjects performed tasks using both the scatter plots and surface
plots with eight test conditions. He observed trends in favor of high levels of FOV, HBR and
stereoscopic viewing in scatter plots. He also observed a slight trend in favor of HBR for surface plots,
and a significant interaction effect between FOV and HBR in scatter plots for a particular task.
With regard to the second group, several researchers have indicated a significant relationship
between larger FOV and greater presence (Hendrix & Barfield, 1996a). Knapp & Looomis (2004)
made a study to understand the cause of distance underestimation in virtual environments, and they
concluded that limited FOV of HMD is not the cause. Other analyses suggest that the subjective
impression of actually being part of the virtual environment may be more important than the FOV per
se (Prothero et al., 1995). Other researchers have analyzed the contribution of different aspects to the
sense of presence. Hendrix & Barfield, (1996a) and IJsselsteijn et al. (2001) suggested that stereoscopy
and tactile augmentation have a significant impact on presence. In addition, Hendrix & Barfield
(1996a,b) suggested that head tracking, sound, and spatialized sound also contribute to presence. In the
same year, Welch et al. (1996) found that pictorial realism and interactivity increase presence to some
extent. In 2003, Waterworth & Waterworth (2003) suggested that more abstract virtual environments
elicit less presence than concrete ones. In 2004, Shim & Kim (2004) reported that the level of detail in
the virtual environment is related to presence, although to a lesser extent than FOV. Thompson et al.
(2004) studied whether or not the quality of the computer graphics matter when judging distances in
visually immersive environments. Their analyses demonstrated that perceived distance was
significantly more accurate in the real world compared to three different virtual environments with
graphical rendering of varying quality. They also demonstrated that distance judgments in the virtual
environments did not vary much from each other.
1.5. Hypothesis, objectives and structure of the paper
The primary hypothesis of this study is that an acrophobic environment will provoke more anxiety
and will induce greater sense of presence in a CAVE than in a HMD with non-phobic participants, and
that a significant correlation will be found between anxiety and presence in these two visualization
systems.
The first objective of this work was to develop a virtual environment and include new acrophobic
situations in it. The second objective of our work was to examine the sense of presence, the anxiety
level, and the relationship between them using the two visualization systems.
This paper is organized as follows. Section 2 describes the software and hardware requirements as
well as the technical features of the virtual environment. Section 3 presents the results of the study for:
the sense of presence, the level of anxiety and correlation between them. Finally, in section 4, we
present our conclusions, the limitation of this study, and future work.
2. Material and methods
The virtual environment was built to be as realistic as possible and included the following features:
stereo portrayal (as opposed to mono), realistic models and lighting, low lag, high frame rate, etc.
These features contributed to an optimum virtual environment for inducing sense of presence. The
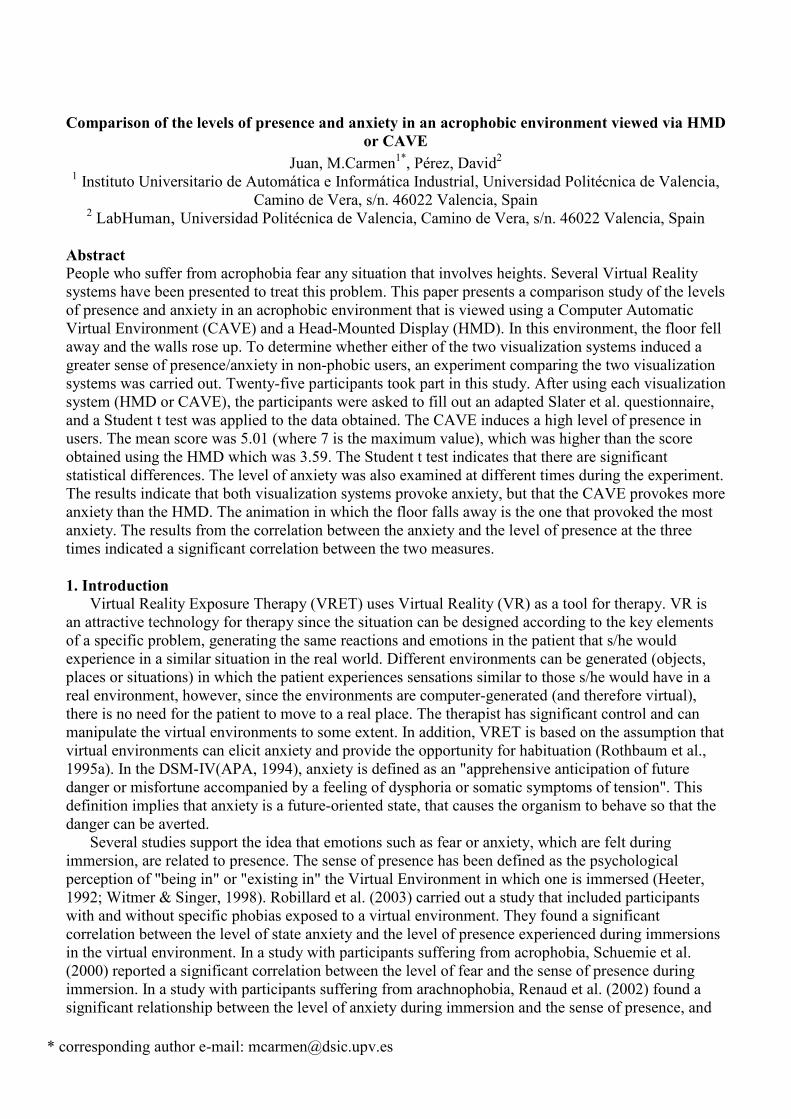
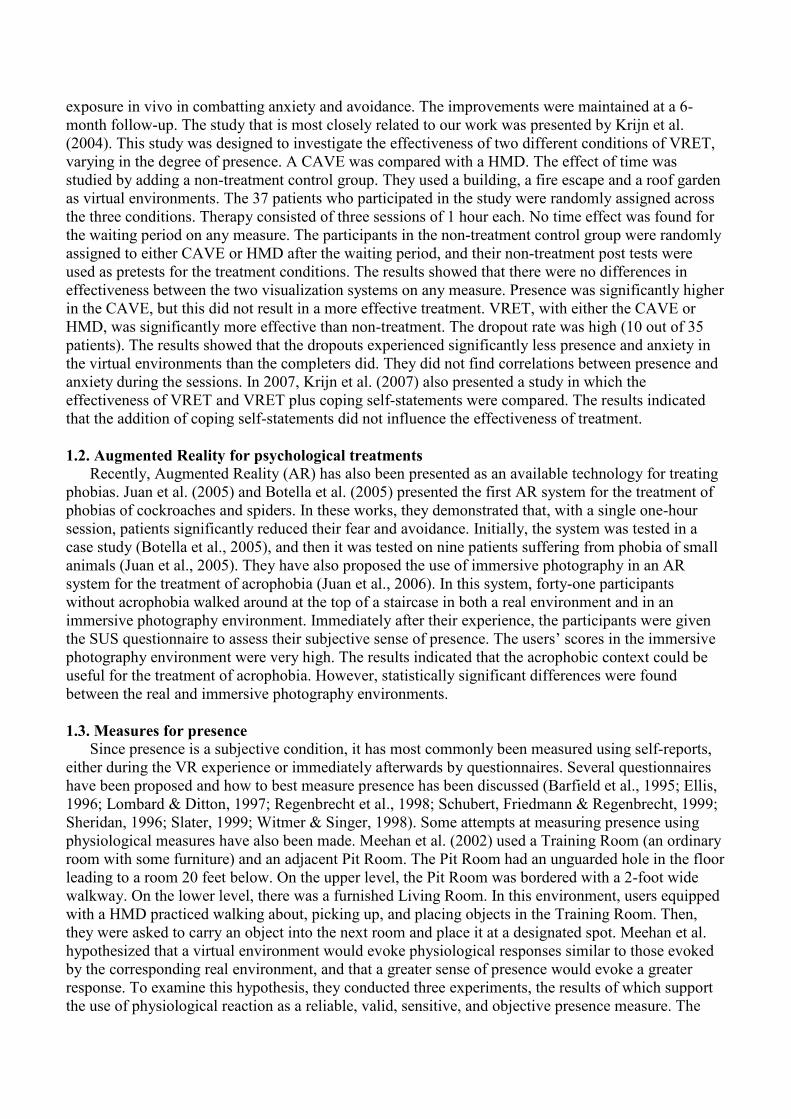
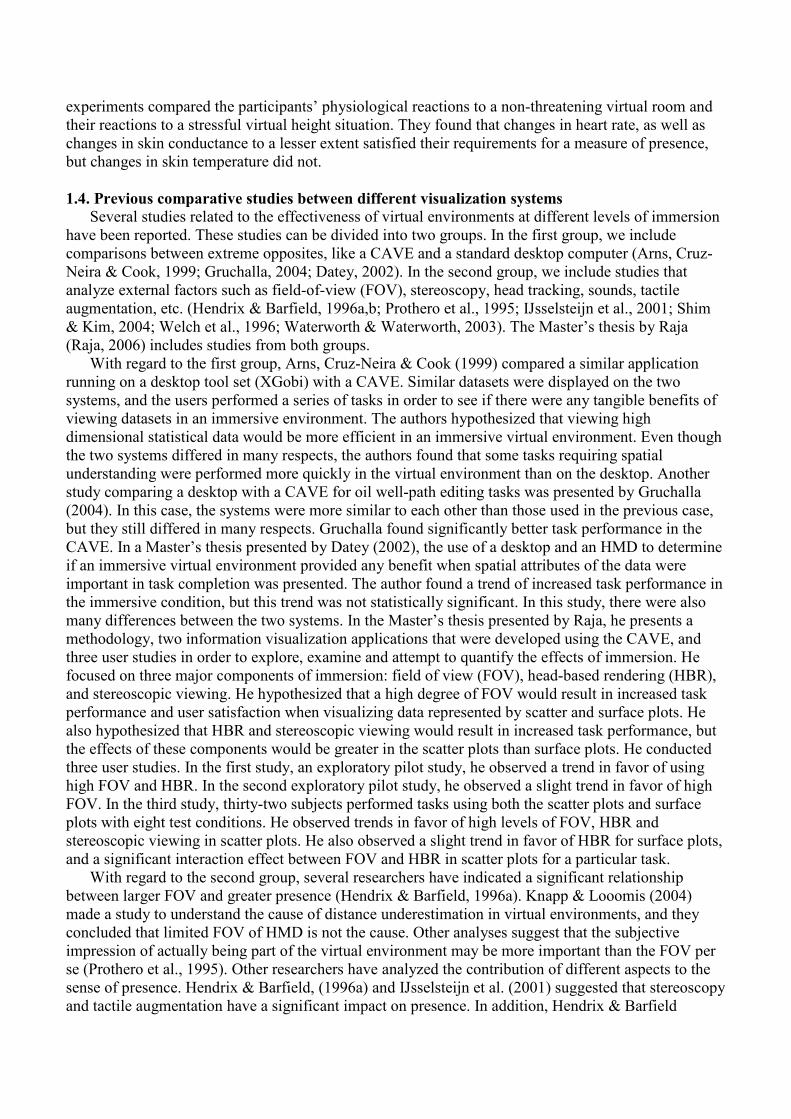
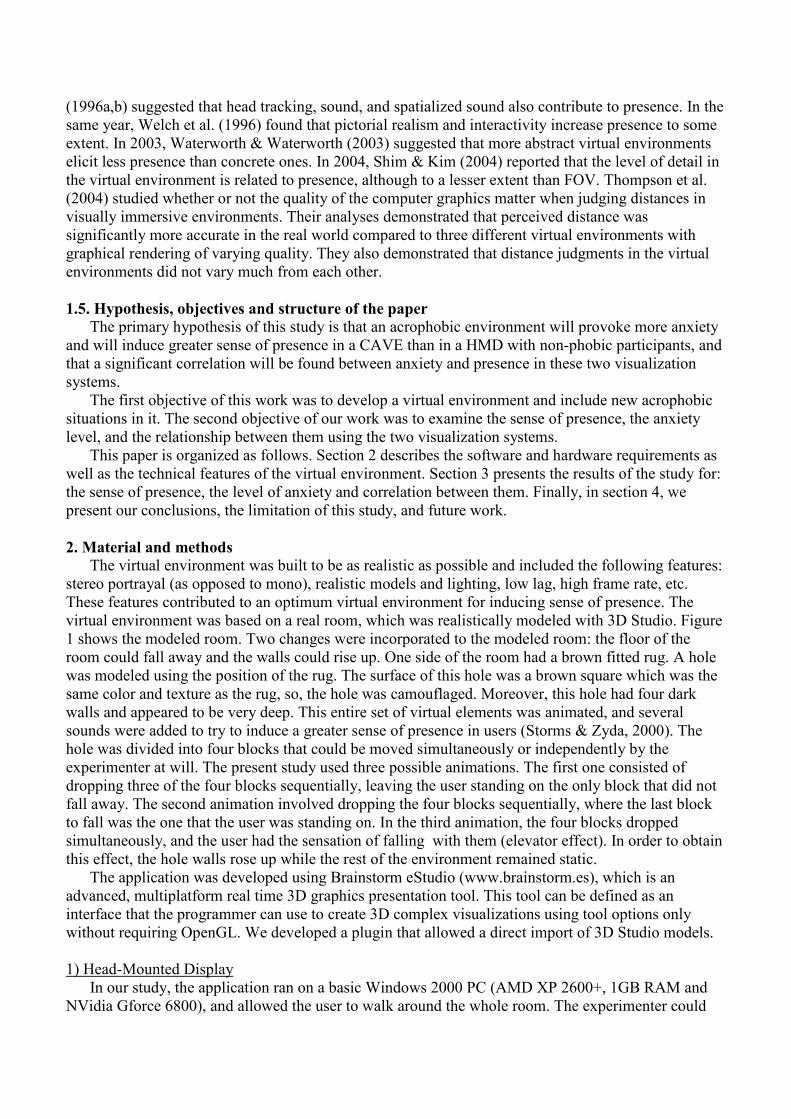
virtual environment was based on a real room, which was realistically modeled with 3D Studio. Figure
1 shows the modeled room. Two changes were incorporated to the modeled room: the floor of the
room could fall away and the walls could rise up. One side of the room had a brown fitted rug. A hole
was modeled using the position of the rug. The surface of this hole was a brown square which was the
same color and texture as the rug, so, the hole was camouflaged. Moreover, this hole had four dark
walls and appeared to be very deep. This entire set of virtual elements was animated, and several
sounds were added to try to induce a greater sense of presence in users (Storms & Zyda, 2000). The
hole was divided into four blocks that could be moved simultaneously or independently by the
experimenter at will. The present study used three possible animations. The first one consisted of
dropping three of the four blocks sequentially, leaving the user standing on the only block that did not
fall away. The second animation involved dropping the four blocks sequentially, where the last block
to fall was the one that the user was standing on. In the third animation, the four blocks dropped
simultaneously, and the user had the sensation of falling with them (elevator effect). In order to obtain
this effect, the hole walls rose up while the rest of the environment remained static.
The application was developed using Brainstorm eStudio (www.brainstorm.es), which is an
advanced, multiplatform real time 3D graphics presentation tool. This tool can be defined as an
interface that the programmer can use to create 3D complex visualizations using tool options only
without requiring OpenGL. We developed a plugin that allowed a direct import of 3D Studio models.
1) Head-Mounted Display
In our study, the application ran on a basic Windows 2000 PC (AMD XP 2600+, 1GB RAM and
NVidia Gforce 6800), and allowed the user to walk around the whole room. The experimenter could

also control the position of the user and the hole animations at all times. A 5DT HMD (5DT Inc., 800
Hx600 V, High 40º FOV) was used as the visualization system. Using a screen, the experimenter could
see the same scene that the user was seeing on the HMD. In order to allow the user to walk around the
room, we used a GamePad (in our case the Logitech WingMan Cordless Rumblepad) and a MTx
(Xsens Motion Technologies) which is a three degrees of freedom tracker that follows the user’s head
movements. The tracker was firmly attached to the HMD allowing mixed navigation. In other words,
the user can turn right/left in the scene by turning her/his head (or all of her/his body), and go forward
or backward using the GamePad’s analogical control. Furthermore, if the user is going forward (or
backward) and turns her/his head (or all of her/his body) left/right at the same time using this mixed
navigation, the direction in which the user is moving changes. As a result, the navigation is more
natural than using a GamePad only.
2) Computer Automatic Virtual Environment
A CAVE can be defined as an immersive stereoscopic room, which appeared for the first time in
1992 as a result of Cruz-Neira’s thesis (Cruz-Neira et al., 1992). In our work, a four-wall CAVE (front,
left, right and floor) was used. This CAVE was assembled by Barco (www.barco.com). Each one of
the square walls was 2.2 meters wide and active stereo images at 1280x1024 resolution were back
projected onto all of them. The CAVE used active stereo images. For 3D vision, the user wore liquid
crystal display glasses that were synchronized with the field sequential images using several infrared
sensors located at the top of the CAVE. The CAVE also needed a tracking system that captured data
regarding the position and orientation of the user’s head, thereby allowing the system to correct the
user’s point of view. Other systems have used magnetic trackers, which have the great disadvantage of
using wires. In our study, the CAVE had an optical tracking system, which provided the user with
greater freedom of movement because s/he was not connected to a wire. An infrared mark
constellation was used, which was captured (and illuminated) by four infrared USB cameras located at
the top corners of the CAVE. This mark constellation was located at the top of the active glasses that
the user was wearing. Tracking system robustness relied on using four cameras, since it would have
been very unlikely for the mark constellation not to have been captured by any of them. The user could
walk around the room by using a flystick. Another mark constellation (different from the one described
above) was attached to this flystick. The flystick was also controlled by the tracking PC, and the data it
generated were sent to the computer, which ran graphs via ethernet. This computer gathered the data
using the same plugin mentioned above. The mixed navigation system for the CAVE used a flystick
analogical control, which allows the user to go forward, backward and turn left/right. The attachment
to the flystick mark constellation was also used to allow the user to turn left/right while s/he was going
forward (or backward) simply by turning the whole flystick left/right. We used two computers. The
first computer was a SGI Prism (Silicon Graphics, Inc., www.sgi.com). It was equipped with 16 Intel
Itanium 2 processors and 8 ATI FireGL GPUs. This computer ran on SUSE Linux Enterprise Server 9,
on which the Brainstorm eStudio application was run. The second computer was a desktop PC
equipped with specific software that managed the complete tracking system. It sent the tracking data
(position and orientation) to the computer that ran graphs via ethernet. This second computer ran
Brainstorm eStudio and gathered the tracking data using a plugin. Since the SGI Prism used does not
have a sound card we used the second computer for this purpose. A new C++ application was
developed for this second PC to allow the person in charge of the experiments to control the virtual
environment from the location of the PC. The whole system required three rooms due to the size of the
visualization environment and the computer. The first room housed the first computer (computer
room); the second room was where the user could view the application (visualization room); and the
third room housed the second computer and all the controls (control room).
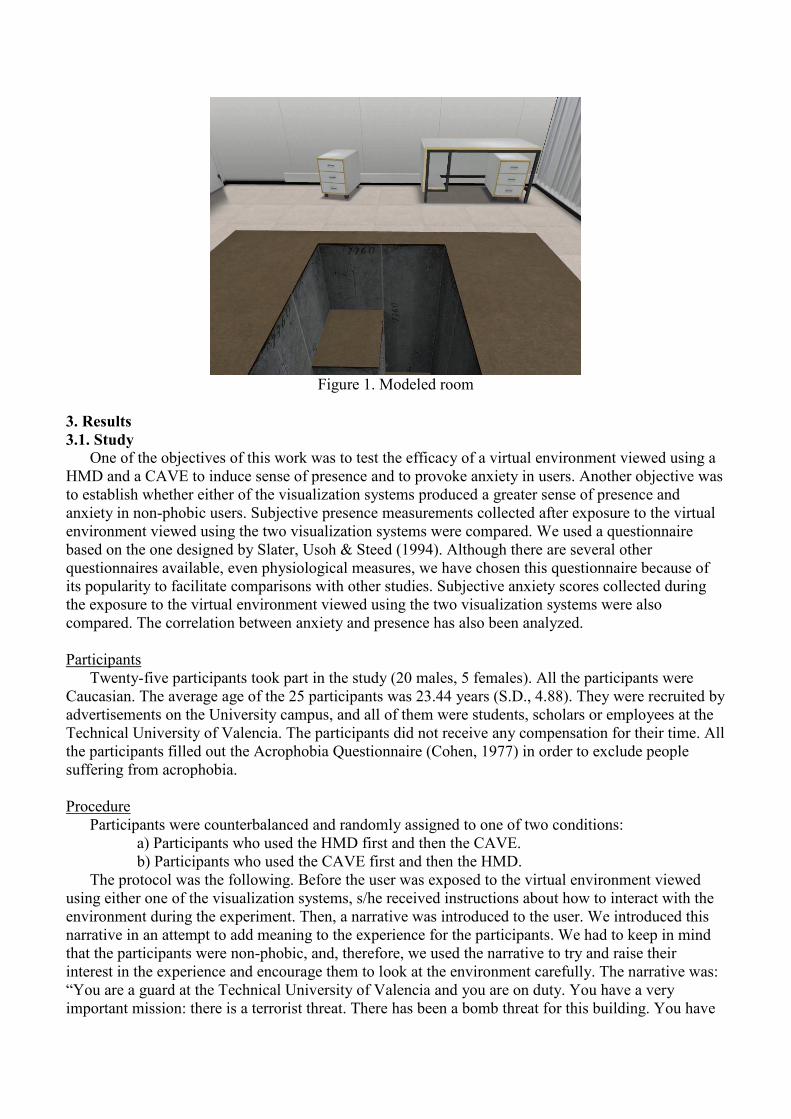
Figure 1. Modeled room
3. Results
3.1. Study
One of the objectives of this work was to test the efficacy of a virtual environment viewed using a
HMD and a CAVE to induce sense of presence and to provoke anxiety in users. Another objective was
to establish whether either of the visualization systems produced a greater sense of presence and
anxiety in non-phobic users. Subjective presence measurements collected after exposure to the virtual
environment viewed using the two visualization systems were compared. We used a questionnaire
based on the one designed by Slater, Usoh & Steed (1994). Although there are several other
questionnaires available, even physiological measures, we have chosen this questionnaire because of
its popularity to facilitate comparisons with other studies. Subjective anxiety scores collected during
the exposure to the virtual environment viewed using the two visualization systems were also
compared. The correlation between anxiety and presence has also been analyzed.
Participants
Twenty-five participants took part in the study (20 males, 5 females). All the participants were
Caucasian. The average age of the 25 participants was 23.44 years (S.D., 4.88). They were recruited by
advertisements on the University campus, and all of them were students, scholars or employees at the
Technical University of Valencia. The participants did not receive any compensation for their time. All
the participants filled out the Acrophobia Questionnaire (Cohen, 1977) in order to exclude people
suffering from acrophobia.
Procedure
Participants were counterbalanced and randomly assigned to one of two conditions:
a) Participants who used the HMD first and then the CAVE.
b) Participants who used the CAVE first and then the HMD.
The protocol was the following. Before the user was exposed to the virtual environment viewed
using either one of the visualization systems, s/he received instructions about how to interact with the
environment during the experiment. Then, a narrative was introduced to the user. We introduced this
narrative in an attempt to add meaning to the experience for the participants. We had to keep in mind
that the participants were non-phobic, and, therefore, we used the narrative to try and raise their
interest in the experience and encourage them to look at the environment carefully. The narrative was:
“You are a guard at the Technical University of Valencia and you are on duty. You have a very
important mission: there is a terrorist threat. There has been a bomb threat for this building. You have
to look around carefully and inform the central guard service of any suspicious packet or bag that you
locate in the rooms you have been assigned. Now you are in a room in one of the University
laboratories. You have to concentrate and look for any suspicious objects. Be careful because these
terrorists are extremely dangerous; they could have put booby traps in here and you may be in danger.
Moreover, you have to look at everything carefully because later you have to report back to your
superiors”. The participants stayed in each environment for about seven minutes. They first walked
around the room for a few minutes, then, the person in charge of the study placed them in the area
where the floor could fall away (the hole). Once the user was located in that place, the person in charge
of the study showed the user the three animations described above. For the HMD, the user was
equipped with the HMD and the GamePad. For the CAVE, the user had to be equipped with glasses,
the flystick and protection (a kind of sock) for her/his feet. These socks protect the CAVE floor from
damage by the users’ footwear. After using each visualization system (HMD or CAVE), the
participants were asked to fill out an adapted Slater et al. questionnaire (Slater, Usoh & Steed, 1994).
Hence, the participants filled this questionnaire twice. The 10 questions related to the sense of
presence were as follows (the presence score is taken as the number of answers that have a score of 6
or 7). The scoring was on a scale of 1-7. Q1-Please rate your sense of being in a room (where 7
represents your normal experience of being in a place); Q2-Please rate your sense of being in a room
where the floor fell away from under your feet at a given moment; Q3-Please rate your sense of being
in a room where the walls rose up and confined you at a given moment; Q4-To what extent were there
times during the experiment when the room was reality for you?; Q5-When you think back to your
experience, do you think of the room more as images that you saw (a movie, a picture), or more as
somewhere that you visited?; Q6-During the experiment, which was strongest on the whole: your
sense of being in the room, or your sense of being elsewhere?; Q7-Think about your memory of being
in “the room”. How similar is this memory to your memories of other places you have been today?;
Q8-Think about your memory of when the floor “fell away”. How similar is this memory to your
memories of other related experiences of “falling off” or ”falling down”?; Q9-Think about your
memory of the walls “rising up”. How similar is this memory to your memories of other related
experiences of “becoming confined” or ”becoming trapped”?; Q10-During the experiment, did you
often think that you were actually in the room?
3.2. Data analysis
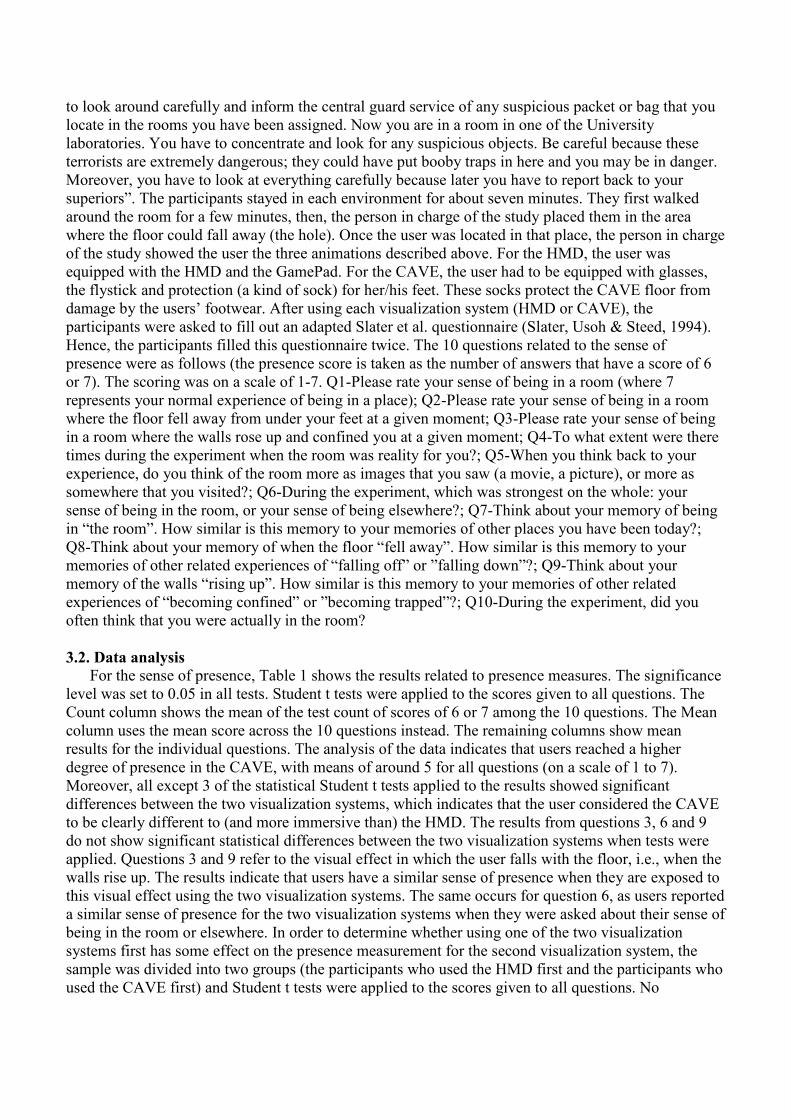
For the sense of presence, Table 1 shows the results related to presence measures. The significance
level was set to 0.05 in all tests. Student t tests were applied to the scores given to all questions. The
Count column shows the mean of the test count of scores of 6 or 7 among the 10 questions. The Mean
column uses the mean score across the 10 questions instead. The remaining columns show mean
results for the individual questions. The analysis of the data indicates that users reached a higher
degree of presence in the CAVE, with means of around 5 for all questions (on a scale of 1 to 7).
Moreover, all except 3 of the statistical Student t tests applied to the results showed significant
differences between the two visualization systems, which indicates that the user considered the CAVE
to be clearly different to (and more immersive than) the HMD. The results from questions 3, 6 and 9
do not show significant statistical differences between the two visualization systems when tests were
applied. Questions 3 and 9 refer to the visual effect in which the user falls with the floor, i.e., when the
walls rise up. The results indicate that users have a similar sense of presence when they are exposed to
this visual effect using the two visualization systems. The same occurs for question 6, as users reported
a similar sense of presence for the two visualization systems when they were asked about their sense of
being in the room or elsewhere. In order to determine whether using one of the two visualization
systems first has some effect on the presence measurement for the second visualization system, the
sample was divided into two groups (the participants who used the HMD first and the participants who
used the CAVE first) and Student t tests were applied to the scores given to all questions. No
significant statistical differences were found (see Table 2). This indicates that the order in which the
participants used the visualization systems did not influence their presence scores.
Count Mean Q1 Q2 Q3 Q4 Q5 Q6 Q7 Q8 Q9 Q10
HMD 1.2±1.53 3.59±1.14 3.88±1.13 3.36±1.7 3.98±1.64 3.4±1.53 3.04±1.49 4.26±2.05 3.52±1.08 3.08±1.61 3.84±1.57 3.52±1.64
CAVE 3.68±3.02 5.01±0.84 5.6±0.71 5.66±1.09 4.66±1.31 4.8±1.26 4.88±1.09 5.08±1.38 4.84±1.11 5.08±1.53 4.36±1.25 5.16±1.25
Student
t,
statistical
4.68
7.19
7.82 7.21
1.94
4.22
5.49
1.79
5.43
5
2.01
4.62
Table 1. Mean and standard deviation of presence scores
Q1 Q2 Q3 Q4 Q5 Q6 Q7 Q8 Q9 Q10
HMD 1HMD-
2CAVE* 3.92±1.19 3±1.41 3.77±1.48 2.92±1.5 3.15±1.52 4.69±2.06 3.69±1.03 2.92±1.44 4.08±1.38 3.77±1.69
1CAVE-2HMD+
3.83±1.11 3.75±1.96 4.21±1.83 3.92±1.44 2.92±1.51 3.79±2.02 3.33±1.15 3.25±1.82 3.58±1.78 3.25±1.6
CAVE 1HMD-
2CAVE* 5.46±0.66 5.31±1.11 4.62±1.19 5±1.15 4.62±0.96 4.92±1.66 5.15±0.9 5±1.35 4.38±0.77 5±1.15
1CAVE-2HMD+
5.75±0.75 6.04±0.96 4.71±1.48 4.58±1.38 5.17±1.19 5.25±1.06 4.5±1.24 5.17±1.75 4.33±1.67 5.33±1.37
Table 2. Comparison according to the order of exposure. (*) Scores obtained from participants who
used the HMD first and the CAVE second. (+) Scores obtained from participants who used the CAVE
first and the HMD second
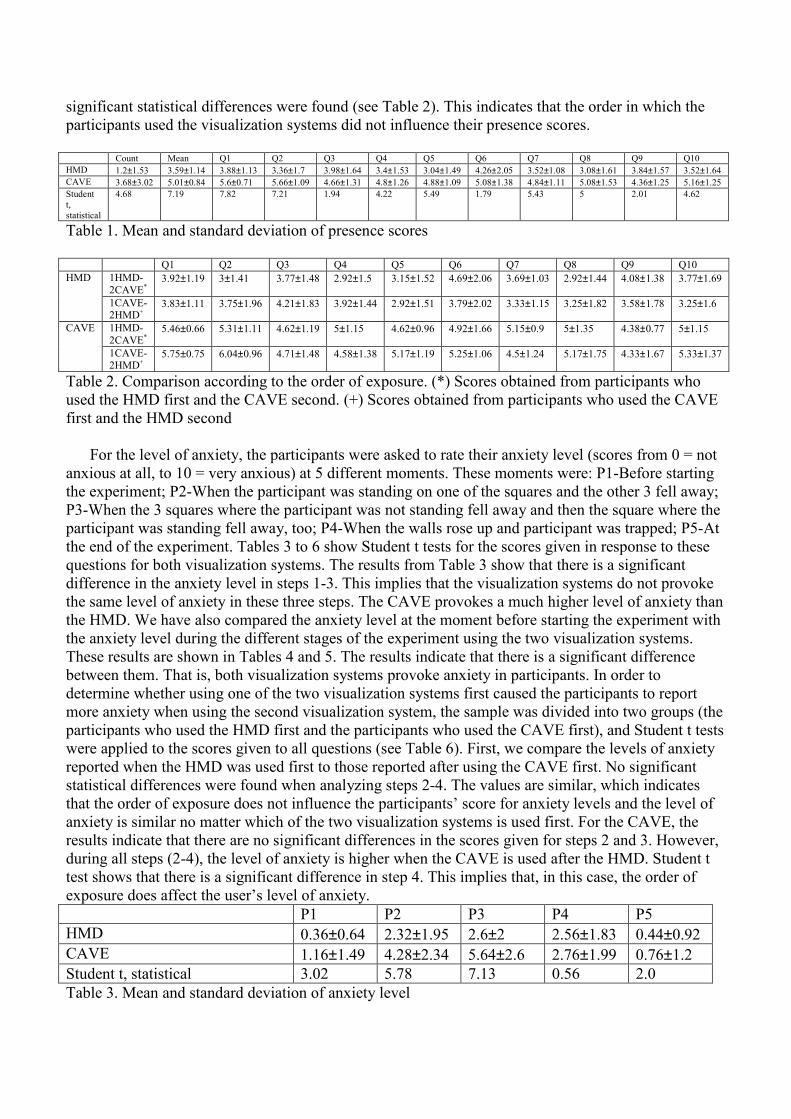
For the level of anxiety, the participants were asked to rate their anxiety level (scores from 0 = not
anxious at all, to 10 = very anxious) at 5 different moments. These moments were: P1-Before starting
the experiment; P2-When the participant was standing on one of the squares and the other 3 fell away;
P3-When the 3 squares where the participant was not standing fell away and then the square where the
participant was standing fell away, too; P4-When the walls rose up and participant was trapped; P5-At
the end of the experiment. Tables 3 to 6 show Student t tests for the scores given in response to these
questions for both visualization systems. The results from Table 3 show that there is a significant
difference in the anxiety level in steps 1-3. This implies that the visualization systems do not provoke
the same level of anxiety in these three steps. The CAVE provokes a much higher level of anxiety than
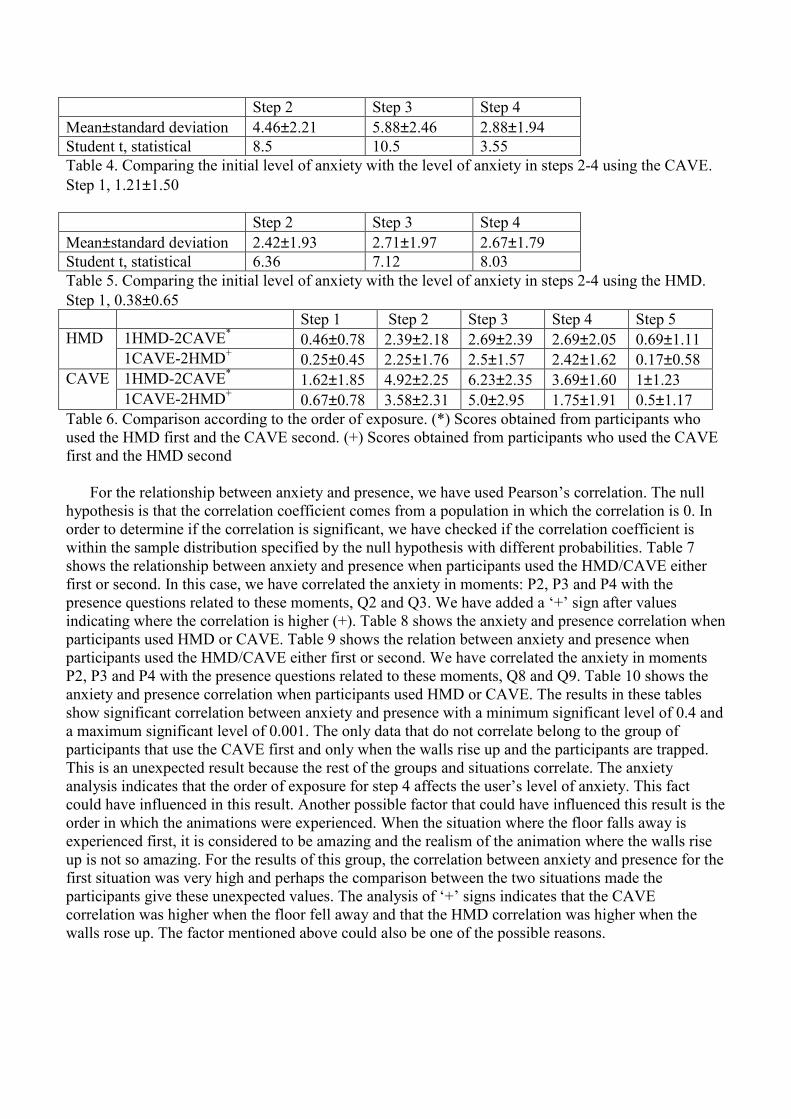
the HMD. We have also compared the anxiety level at the moment before starting the experiment with
the anxiety level during the different stages of the experiment using the two visualization systems.
These results are shown in Tables 4 and 5. The results indicate that there is a significant difference
between them. That is, both visualization systems provoke anxiety in participants. In order to
determine whether using one of the two visualization systems first caused the participants to report
more anxiety when using the second visualization system, the sample was divided into two groups (the
participants who used the HMD first and the participants who used the CAVE first), and Student t tests
were applied to the scores given to all questions (see Table 6). First, we compare the levels of anxiety
reported when the HMD was used first to those reported after using the CAVE first. No significant
statistical differences were found when analyzing steps 2-4. The values are similar, which indicates
that the order of exposure does not influence the participants’ score for anxiety levels and the level of
anxiety is similar no matter which of the two visualization systems is used first. For the CAVE, the
results indicate that there are no significant differences in the scores given for steps 2 and 3. However,
during all steps (2-4), the level of anxiety is higher when the CAVE is used after the HMD. Student t
test shows that there is a significant difference in step 4. This implies that, in this case, the order of
exposure does affect the user’s level of anxiety.
P1 P2 P3 P4 P5
HMD 0.36±0.64 2.32±1.95 2.6±2 2.56±1.83 0.44±0.92
CAVE 1.16±1.49 4.28±2.34 5.64±2.6 2.76±1.99 0.76±1.2
Student t, statistical 3.02 5.78 7.13 0.56 2.0
Table 3. Mean and standard deviation of anxiety level
Step 2 Step 3 Step 4
Mean±standard deviation 4.46±2.21 5.88±2.46 2.88±1.94
Student t, statistical 8.5 10.5 3.55
Table 4. Comparing the initial level of anxiety with the level of anxiety in steps 2-4 using the CAVE.
Step 1, 1.21±1.50
Step 2 Step 3 Step 4
Mean±standard deviation 2.42±1.93 2.71±1.97 2.67±1.79
Student t, statistical 6.36 7.12 8.03
Table 5. Comparing the initial level of anxiety with the level of anxiety in steps 2-4 using the HMD.
Step 1, 0.38±0.65
Step 1 Step 2 Step 3 Step 4 Step 5
HMD 1HMD-2CAVE* 0.46±0.78 2.39±2.18 2.69±2.39 2.69±2.05 0.69±1.11
1CAVE-2HMD+ 0.25±0.45 2.25±1.76 2.5±1.57 2.42±1.62 0.17±0.58
CAVE 1HMD-2CAVE* 1.62±1.85 4.92±2.25 6.23±2.35 3.69±1.60 1±1.23
1CAVE-2HMD+ 0.67±0.78 3.58±2.31 5.0±2.95 1.75±1.91 0.5±1.17
Table 6. Comparison according to the order of exposure. (*) Scores obtained from participants who
used the HMD first and the CAVE second. (+) Scores obtained from participants who used the CAVE
first and the HMD second
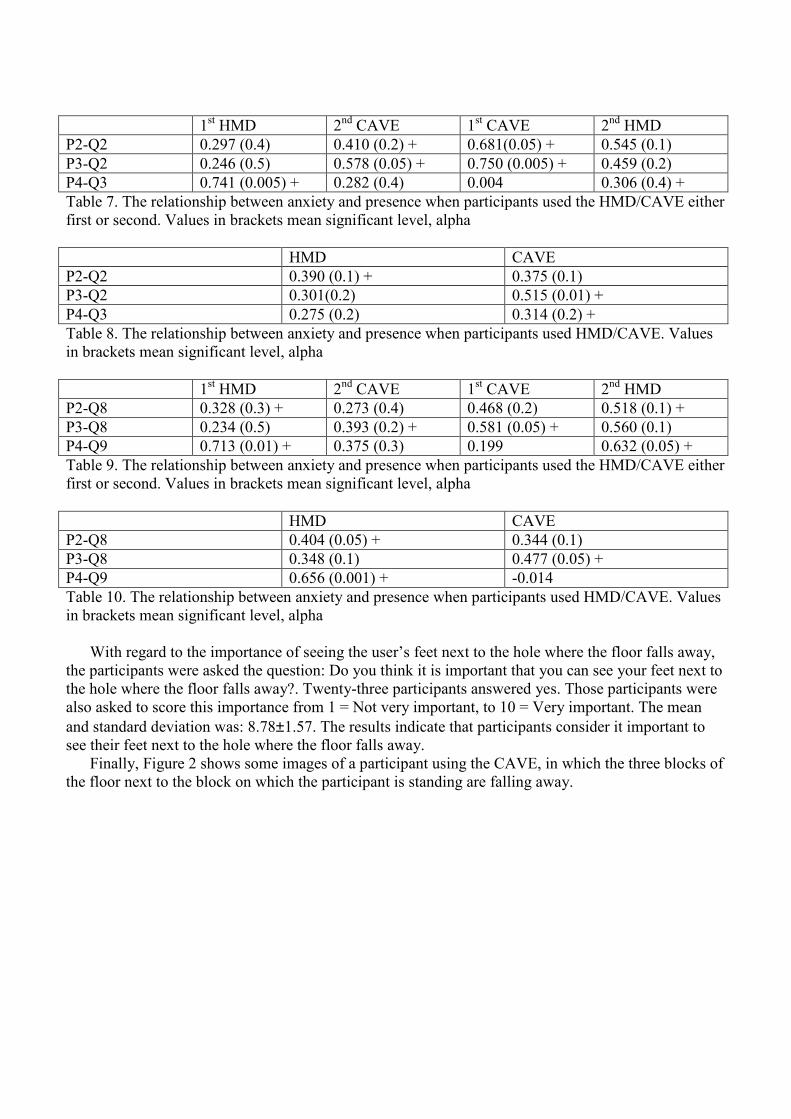
For the relationship between anxiety and presence, we have used Pearson’s correlation. The null
hypothesis is that the correlation coefficient comes from a population in which the correlation is 0. In
order to determine if the correlation is significant, we have checked if the correlation coefficient is
within the sample distribution specified by the null hypothesis with different probabilities. Table 7
shows the relationship between anxiety and presence when participants used the HMD/CAVE either
first or second. In this case, we have correlated the anxiety in moments: P2, P3 and P4 with the
presence questions related to these moments, Q2 and Q3. We have added a ‘+’ sign after values
indicating where the correlation is higher (+). Table 8 shows the anxiety and presence correlation when
participants used HMD or CAVE. Table 9 shows the relation between anxiety and presence when
participants used the HMD/CAVE either first or second. We have correlated the anxiety in moments
P2, P3 and P4 with the presence questions related to these moments, Q8 and Q9. Table 10 shows the
anxiety and presence correlation when participants used HMD or CAVE. The results in these tables
show significant correlation between anxiety and presence with a minimum significant level of 0.4 and
a maximum significant level of 0.001. The only data that do not correlate belong to the group of
participants that use the CAVE first and only when the walls rise up and the participants are trapped.
This is an unexpected result because the rest of the groups and situations correlate. The anxiety
analysis indicates that the order of exposure for step 4 affects the user’s level of anxiety. This fact
could have influenced in this result. Another possible factor that could have influenced this result is the
order in which the animations were experienced. When the situation where the floor falls away is
experienced first, it is considered to be amazing and the realism of the animation where the walls rise
up is not so amazing. For the results of this group, the correlation between anxiety and presence for the
first situation was very high and perhaps the comparison between the two situations made the
participants give these unexpected values. The analysis of ‘+’ signs indicates that the CAVE
correlation was higher when the floor fell away and that the HMD correlation was higher when the
walls rose up. The factor mentioned above could also be one of the possible reasons.
1st HMD 2
nd CAVE 1
st CAVE 2
nd HMD
P2-Q2 0.297 (0.4) 0.410 (0.2) + 0.681(0.05) + 0.545 (0.1)
P3-Q2 0.246 (0.5) 0.578 (0.05) + 0.750 (0.005) + 0.459 (0.2)
P4-Q3 0.741 (0.005) + 0.282 (0.4) 0.004 0.306 (0.4) +
Table 7. The relationship between anxiety and presence when participants used the HMD/CAVE either
first or second. Values in brackets mean significant level, alpha
HMD CAVE
P2-Q2 0.390 (0.1) + 0.375 (0.1)
P3-Q2 0.301(0.2) 0.515 (0.01) +
P4-Q3 0.275 (0.2) 0.314 (0.2) +
Table 8. The relationship between anxiety and presence when participants used HMD/CAVE. Values
in brackets mean significant level, alpha
1st HMD 2
nd CAVE 1
st CAVE 2
nd HMD
P2-Q8 0.328 (0.3) + 0.273 (0.4) 0.468 (0.2) 0.518 (0.1) +
P3-Q8 0.234 (0.5) 0.393 (0.2) + 0.581 (0.05) + 0.560 (0.1)
P4-Q9 0.713 (0.01) + 0.375 (0.3) 0.199 0.632 (0.05) +
Table 9. The relationship between anxiety and presence when participants used the HMD/CAVE either
first or second. Values in brackets mean significant level, alpha
HMD CAVE
P2-Q8 0.404 (0.05) + 0.344 (0.1)
P3-Q8 0.348 (0.1) 0.477 (0.05) +
P4-Q9 0.656 (0.001) + -0.014
Table 10. The relationship between anxiety and presence when participants used HMD/CAVE. Values
in brackets mean significant level, alpha
With regard to the importance of seeing the user’s feet next to the hole where the floor falls away,
the participants were asked the question: Do you think it is important that you can see your feet next to
the hole where the floor falls away?. Twenty-three participants answered yes. Those participants were
also asked to score this importance from 1 = Not very important, to 10 = Very important. The mean
and standard deviation was: 8.78±1.57. The results indicate that participants consider it important to
see their feet next to the hole where the floor falls away.
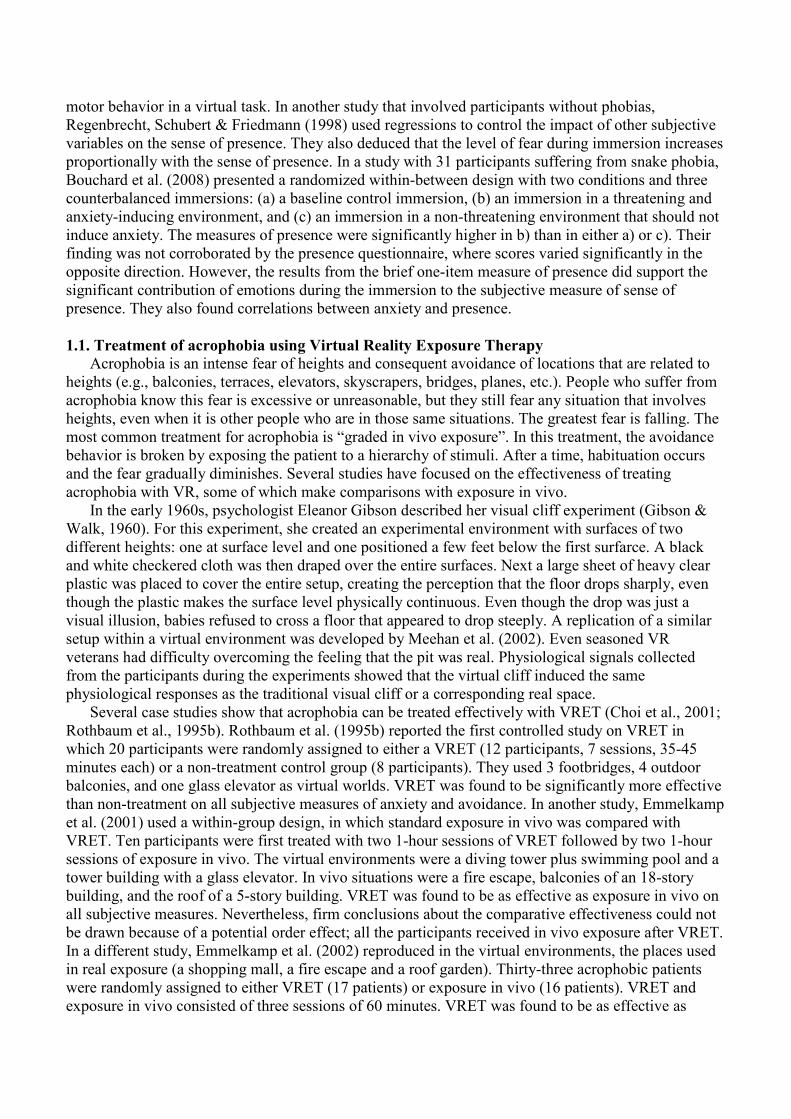
Finally, Figure 2 shows some images of a participant using the CAVE, in which the three blocks of
the floor next to the block on which the participant is standing are falling away.
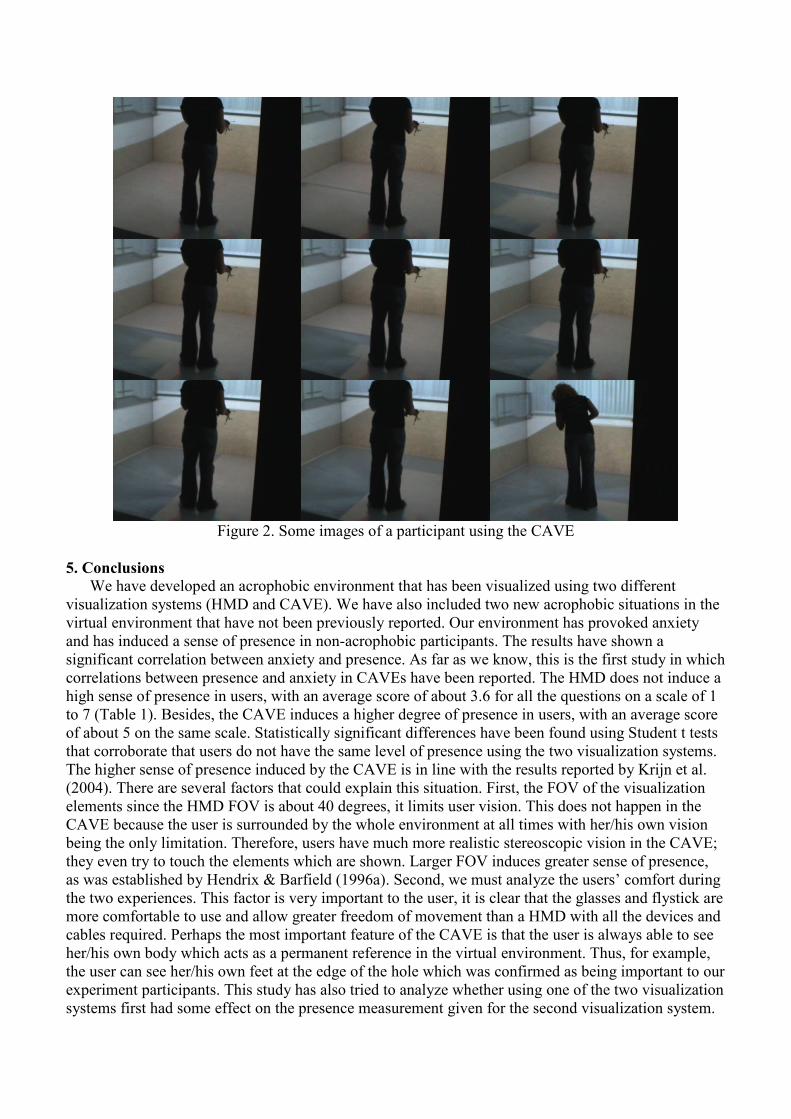
Figure 2. Some images of a participant using the CAVE
5. Conclusions
We have developed an acrophobic environment that has been visualized using two different
visualization systems (HMD and CAVE). We have also included two new acrophobic situations in the
virtual environment that have not been previously reported. Our environment has provoked anxiety
and has induced a sense of presence in non-acrophobic participants. The results have shown a
significant correlation between anxiety and presence. As far as we know, this is the first study in which
correlations between presence and anxiety in CAVEs have been reported. The HMD does not induce a
high sense of presence in users, with an average score of about 3.6 for all the questions on a scale of 1
to 7 (Table 1). Besides, the CAVE induces a higher degree of presence in users, with an average score
of about 5 on the same scale. Statistically significant differences have been found using Student t tests
that corroborate that users do not have the same level of presence using the two visualization systems.
The higher sense of presence induced by the CAVE is in line with the results reported by Krijn et al.
(2004). There are several factors that could explain this situation. First, the FOV of the visualization
elements since the HMD FOV is about 40 degrees, it limits user vision. This does not happen in the
CAVE because the user is surrounded by the whole environment at all times with her/his own vision
being the only limitation. Therefore, users have much more realistic stereoscopic vision in the CAVE;
they even try to touch the elements which are shown. Larger FOV induces greater sense of presence,
as was established by Hendrix & Barfield (1996a). Second, we must analyze the users’ comfort during
the two experiences. This factor is very important to the user, it is clear that the glasses and flystick are
more comfortable to use and allow greater freedom of movement than a HMD with all the devices and
cables required. Perhaps the most important feature of the CAVE is that the user is always able to see
her/his own body which acts as a permanent reference in the virtual environment. Thus, for example,
the user can see her/his own feet at the edge of the hole which was confirmed as being important to our
experiment participants. This study has also tried to analyze whether using one of the two visualization
systems first had some effect on the presence measurement given for the second visualization system.
The results from this analysis (Table 2) seem to show that the HMD scores are not affected by the
order of exposure, that is, better scores were not obtained when users used one of the two visualization
systems first. In fact, scores for only five of the ten questions revealed a better result in one of the two
exposure orders. The CAVE results indicate that users give a better score to this visualization system
when they are exposed to it first. This happened for seven of the ten questions, although the difference
was very small.
For the anxiety level, the results show that there is a significant difference between the level of
anxiety felt at the moment before starting the experiment and the level felt during the different stages
of the experiment. The results also show that this difference is higher when using the CAVE. There is
also a statistically significant difference between the two visualization systems since the CAVE
produces more anxiety. The results indicate that the animations included in the virtual environment
provoke anxiety in users. This is especially the case for the animation in which the floor falls away.
This implies that this kind of animation could be very useful for the treatment of acrophobia. For the
correlation between anxiety and presence, the results show a significant correlation between the two
measures. This result is not the same as the one obtained by Krijn et al. (2004). They did not find
correlations between presence and anxiety. Our correlations between anxiety and presence had a
minimum significant level of 0.4 and a maximum significant level of 0.001. Only one group among 11
did not correlate. This is not the first study in which correlations between anxiety and presence have
been obtained using HMDs (Schuemie et al., 2000; Bouchard et al., 2008). Schuemie et al. (2000) also
used acrophobic environments. In the Schuemie et al. study, all the participants did not suffer from
strong acrophobia, but at least two of them did. The differences with our study are that they did not
compare the same environment in two different visualization systems. Instead, they used the same
HMD and three different environments. In a more recent study, Bouchard et al. (2008) used anxious
environments for patients suffering from snake phobia. They used a HMD and compared three
different immersions. This study also differs from ours in many respects, but our results are in line
with the correlation they found between anxiety and presence for the HMD.
The main limitation of this study is the small sample size. A larger sample would increase
confidence in the results. Moreover, the specific reasons for the non-correlation between presence and
anxiety from the group that used the CAVE first when the walls rise up could be identified. For this
problem, special attention must be paid to this stage of the experiment. If participants gave similar
scores, specific questions could be asked to clarify this point.
With regard to future works, first, presence is a subjective condition and the use of self-reports
could give rise to some errors if the user does not give the correct score. As mentioned in subsection
1.3, it is possible to use physiological measures to measure presence (Meehan et al., 2002). One
possible future study would be to include a contrast of the results obtained with questionnaire
responses. Second, the CAVE that we used has 4 back-projected areas (3 walls and the floor) as do the
great majority of CAVEs. We believe that, with 6 back-projected areas (4 walls, the floor and the
ceiling), the immersion could be increased even further and the degree of presence could also be
higher. Finally, since the user’s sense of presence is the defining factor in the successful treatment of
acrophobia (Hodges et al., 1994) and several case studies have shown that acrophobia can be treated
effectively with VRET (Choi et al., 2001; Rothbaum et al., 1995b), we plan to use the virtual
environment with the two visualization systems for therapy in order to compare these results with both
Krijn’s study and the results presented in this paper.
Acknowledgements:
We would like to thank:
• Cristina Botella and Rosa Baños for their help without which this study would not have been
possible.
• LabHuman for letting us use the material for developing and testing the systems.
• The Technical University of Valencia for letting us use the University CAVE.
References
APA. (1994). Diagnostic and statistical manual of mental disorders. Washington, DC: American
Psychiatric Association
Arns, L., Cruz-Neira, C. & Cook, D. (1999) The Benefits of Statistical Visualization in an Immersive
Environment. IEEE Virtual Reality. 88-95.
Barfield, W., Sheridan, T.B., Zeltzer, D, & Slater M. (1995). Presence and performance within virtual
environments. In W. Barfield and T. Furness (eds) Virtual environments and advanced interface
design. London, Oxford University Press.
Botella, C., Juan, M.C., Baños, R.M., Alcañiz, M., Guillen, V. & Rey, B. (2005). Mixing realities? An
Application of Augmented Reality for the Treatment of Cockroach phobia: Cyberpsychology &
Behavior, 8: 162-171
Bouchard, S., St-Jaques, J., Robillard, G. & Renaud, P. (2008) Anxiety increases the feeling of
presence in Virtual Reality, Presence: Teleoperators and Virtual Environments, 17(4):376-390.
Cohen, D.C. (1977). Comparison of self-report and behavioral procedures for assessing acrophobia.
Behavior Therapy, 8: 17-23.
Choi, Y. H., Jang, D. P., Ku, J. H., Shin, M. B., & Kim, S. I. (2001). Short-term treatment of
acrophobia with Virtual Reality Therapy (VRT): A case report. Cyberpsychology and Behavior, 4:
349-454.
Cruz-Neira, C., Sandin, D. J., DeFanti, T., Kenyon, R. V. & Hart, J. C. (1992). The CAVE: Audio
Visual Experience Automatic Virtual Environment, Communications of the ACM, 35(6): 64-72
Datey, A. V. (2002) Experiments in the Use of Immersion for Information Visualization, Master’s
thesis, Virginia Tech Computer Science Department. Available at
http://scholar.lib.vt.edu/theses/available/etd-05092002-151043.
Ellis, S. R. (1996). Presence of mind: A reaction to Thomas Sheridan's "Further musings on the
psychophysics of presence". Presence: Teleoperators and Virtual Environments, 5(2): 247-259.
Emmelkamp, P.M.G., Bruynzeel, M., Drost, L. & van der Mast, C.A.P.G. (2001). Virtual reality
treatment in acrophobia: a comparison with exposure in vivo. CyberPsychology & Behavior 4(3):
335–339.
Emmelkamp, P.M.G., Krijn, M., Hulsbosch, A.M., de Vries, S., Schuemie, M. J., & van der Mast, C.
A. P. G. (2002). Virtual reality treatment versus exposure in vivo: a comparative evaluation in
acrophobia. Behavior Research and Therapy 40(5): 509–516.
Gibson, E. J. & Walk, R. D. (1960) The "visual cliff", Scientific American, 202: 67–71.
Gruchalla, K. (2004) Immersive Well-Path Editing: Investigating the Added Value of Immersion.
IEEE Virtual Reality, 157-164.
Heeter, C. (1992) Being There: The subjective experience of presence. Presence: Teleoperators &
Virtual Environments, 1(2), 262-271.
Hendrix, C., & Barfield, W. (1996a). Presence within virtual environments as a function of visual
display parameters. Presence: Teleoperators and Virtual Environments, 5:274–289.
Hendrix, C., & Barfield, W. (1996b). The sense of presence within auditory virtual environments.
Presence: Teleoperators and Virtual Environments, 5: 290–301.
Hodges, L., F. Rothbaum, B.O., Kooper, R. Opdyke, D., Willford, J.S., Meyer, T.C. & North, M. M.
(1994). Presence as the defining factor in a VR application. Technical Report GVU-94-06. Georgia
Tech University, Graphics, Visualization, and Usability Center.
IJsselsteijn, W. A., de Ridder, H., Freeman, J., Avons, S. E., & Bouwhuis, D. (2001). Effects of
stereoscopic presentation, image motion, and screen size on subjective and objective corroborative
measures of presence. Presence: Teleoperators and Virtual Environments, 10(3): 298–311.
Juan, M.C., Alcañiz, M., Monserrat, Botella, C., Baños, R.M. & Guerrero, B. (2005). Using
augmented reality to treat phobias, IEEE Computer Graphics and Applications. 25(6): 31-37.
Juan, M.C., Baños, R., Botella, C., Pérez, D., Alcañiz, M. & Monserrat, C. (2006). An Augmented
Reality System for acrophobia: The sense of presence using immersive photography, Presence:
Teleoperators & Virtual Environments, 15: 393-402.
Knapp, J.M., & Loomis, J.M. (2004) Limited field of view of Head-Mounted Displays is not the cause
of distance underestimation in virtual environments, Presence: Teleoperators and Virtual
Environments, 13(5):572-577.
Krijn, M., Emmelkamp, P. M. G., Biemond, R., de Wilde de Ligny, C., Schuemie, M. J., & van der
Mast, C. A. P. G. (2004b). Treatment of acrophobia in virtual reality: The role of immersion and
presence. Behavior Research and Therapy, 42: 229-239.
Krijn, M., Emmelkamp, P. M. G., Olafsson, M. A., Schuemie, M. J., & van der Mast, C. A. P. G.
(2007). Do self-statements enhance the effectiveness of Virtual Reality Exposure Therapy? A
Comparative Evaluation in Acrophobia. Cyberpsychology & Behavior, 10: 362-370.
Lombard, M. & Ditton, T. (1997). At the heart of it all: The concept of presence. Journal of Computer
Mediated Communication, 3(2):1-43.
Meehan, M., Insko, B., Whitton, M. & Boorks, F.P. (2002) Physiological measures of presence in
stressful virtual environment, ACM Transactions on Graphics, 21 (3): 645-652North, M. M.,
North, S. M., & Coble, J. R. (1996). Effectiveness of VRT for acrophobia. Virtual Reality Therapy.
An Innovative Paradigm, Colorado Springs: IPI Press, 68-70.
Prothero, J. D., Hoffman, H. G., Furness, T. A., III, Parker, D. E., & Wells, M. J. (1995).
Foreground/background manipulations affect presence. Human Factors and Ergonomics Society,
1410–1414.
Raja, D. (2006) The Effects of Immersion on 3D Information Visualization, Master’s thesis, Virginia
Polytechnic Institute and State University, available at:
http://scholar.lib.vt.edu/theses/available/etd-06072006-140038/unrestricted/Raja_Thesis.pdf.
Regenbrecht, H. T., Schubert, T.. W. & Friedmann, F. (1998) Measuring the sense of presence and its
relations to fear of heights in virtual environments. International Journal of Human-Computer
Interaction, 10(3): 23-250.
Renaud, P., Bouchard, S., & Proulx, R. (2002). Behavioral avoidance in the presence of a virtual
spider. IEEE Transactions in Information Technology and Biomedicine, 6(3): 235–243.
Robillard, G., Bouchard, S., Renaud, P., & Fournier, T. (2003). Anxiety and presence during VR
immersion: A comparative study of the reactions of phobic and non-phobic participants in
therapeutic virtual environments derived from computer games. CyberPsychology & Behavior,
6(5): 467–476.
Rothbaum, B. O., Hodges, L., Kooper, R., Opdyke, D., Williford, J. S., & North, M. (1995a).
Effectiveness of computer generated (virtual reality) graded exposure in the treatment of
acrophobia. American Journal of Psychiatry, 152: 626-628.
Rothbaum, B. O., Hodges, L., Kooper, R., Opdyke, D., Williford, J. S., & North, M. (1995b). Virtual
reality graded exposure in the treatment of acrophobia: A case report. Behavior Therapy, 26: 547–
554.
Schubert, T. W., Friedmann, F. & Regenbrecht, H.T. (1999). Embodied presence in virtual
environments. In Visual Representations and Interpretations. Eds. R. Paton & I. Neilson, Springer-
Verlag, 268-278.
Schuemie, M. J., Bruynzeel, M., Drost, L., Brinckman, M., de Haan, G., EmmelKamp, P. M. G.
(2000). Treatment of acrophobia in virtual reality: A pilot study. In F. Broeckx & L. Pauwels
(Eds.), Euromedia 2000, 271–275.
Sheridan, T. B. (1996). Further musings on the psychophysics of presence. Presence: Teleoperators
and Virtual Environments, 5(2): 241-246.
Shim, W., & Kim, G. J. (2004). Designing for presence and performance: The case of the virtual fish
tank. Presence: Teleoperators and Virtual Environments, 12(4): 374–386.
Slater, M. Usoh, M., & Steed, A. (1994). Depth of presence in virtual environments. Presence:
Teleoperators and Virtual Environments, 3: 130-144.
Slater, M. (1999). Measuring Presence: A Response to the Witmer and Singer Presence Questionnaire.
Presence: Teleoperators and Virtual Environments, 8(5): 560-565.
Storms, R. L. & Zyda, M. J. (2000). Interactions in perceived quality of auditory-visual displays.
Presence: Teleoperators & Virtual Environments, 9 (6): 557–580.
Thompson, W.B., Willemsen, P., Gooch, A., Creem-Regehr, S.H., Loomis, J.M. & Beall, A.C. (2204)
Does the quality of the computer graphics matter when judging distances in visually immersive
environments?, Presence: Teleoperators and Virtual Environments, 13(5): 560-571.
Waterworth, J. A., & Waterworth, E. L. (2003). Being and time: Judged presence and duration as a
function of media form. Presence: Teleoperators and Virtual Environments, 12(5): 495–513.
Welch, R., Blackmon, T. T., Liu, A., Mellers, B. A., & Stark, L. W. (1996). The effects of pictorial
realism, delay of visual feedback, and observer interactivity on the subjective sense of presence.
Presence: Teleoperators and Virtual Environments, 5(3): 263–273.
Witmer, B. & Singer, M. (1998). Measuring presence in virtual environments: A Presence
Questionnaire. Presence: Teleoperators & Virtual Environments, 7(3), 225-240.