Embed Size (px)
Citation preview
Comparison of Spectra in Unsequenced Species
Freddy Cliquet1,2, Guillaume Fertin1, Irena Rusu1,Dominique Tessier2
1 LINA, UMR CNRS 6241 Universite de Nantes,2 rue de la Houssiniere, 44322, Nantes, Cedex 03, France
{freddy.cliquet,guillaume.fertin,irena.rusu}@univ-nantes.fr2 UR1268 BIA, INRA, Rue de la Geraudiere, BP 71627, 44316 Nantes, France
Abstract. We introduce a new algorithm for the mass spectromet-ric identification of proteins. Experimental spectra obtained by tandemMS/MS are directly compared to theoretical spectra generated from pro-teins of evolutionarily closely related organisms. This work is motivatedby the need of a method that allows the identification of proteins ofunsequenced species against a database containing proteins of relatedorganisms. The idea is that matching spectra of unknown peptides tovery similar MS/MS spectra generated from this database of annotatedproteins can lead to annotate unknown proteins. This process is similarto ortholog annotation in protein sequence databases. The difficulty withsuch an approach is that two similar peptides, even with just one mod-ification (i.e. insertion, deletion or substitution of one or several aminoacid(s)) between them, usually generate very dissimilar spectra. In thispaper, we present a new dynamic programming based algorithm: Packet-SpectralAlignment. Our algorithm is tolerant to modifications and fullyexploits two important properties that are usually not considered: thenotion of inner symmetry, a relation linking pairs of spectrum peaks,and the notion of packet inside each spectrum to keep related peakstogether. Our algorithm, PacketSpectralAlignment is then compared toSpectralAlignment [1] on a dataset of simulated spectra. Our tests showthat PacketSpectralAlignment behaves better, in terms of results andexecution time.
1 Introduction
In proteomics, tandem mass spectrometry (MS/MS) is a general method usedto identify proteins. At first, during the MS/MS process, the peptides issuedfrom the digestion of an unknown protein by an enzyme are ionized so that theirmass may be measured. Then, the mass spectrometer isolates each peptide andfragments it into smaller ions, before measuring the corresponding masses. Thisprocess provides for each peptide an experimental spectrum in the form ofa series of peaks, each peak corresponding to a mass that has been measured.From these experimental spectra, we aim at retrieving the corresponding peptidesequences. Then, by combining the peptide sequences from different spectra, ourgoal is to relate the unknown protein to one of the proteins stored in a protein
database such as SwissProt. Given an experimental spectrum, there are two mainpossibilities to obtain the corresponding peptide sequence: de novo sequencingor spectra comparison.De novo: In de novo sequencing, the spectrum is directly interpreted and a cor-responding amino acid sequence of the peptide is inferred without using any otherdata than the spectrum itself. Currently, the analysis of unsequenced species ismainly done by de novo interpretation [2, 3]. The main reason is the speed ofeach interpretation and the fact that the peptide sequence does not need to bepart of a protein database. An important drawback is that this method requireshigh quality spectra and still leads to a lot of interpretation errors [4, 5].Spectra Comparison: In spectra comparison, an experimental spectrum iscompared with theoretically predicted spectra. The theoretical spectra are in-ferred from the different peptides generated by an in-silico digestion of all theproteins contained in a database. A score function is used to evaluate each possi-ble comparison, and the results are ordered according to this score. The theoreti-cal spectrum with the best score is associated to the corresponding experimentalspectrum. There are a number of existing softwares that match uninterpretedMS/MS experimental spectra to theoretical spectra, such as SEQUEST [6] orMASCOT [7]. They are based on the Shared Peaks Count (SPC) algorithm, analgorithm that simply counts the number of peaks in common between the twospectra, but presents zero tolerance to modifications (i.e. insertion, deletionor substitution of one or several amino acid(s)). This is due to the fact thatthe slightest modification in a peptide sequence highly changes the contents ofthe corresponding spectrum, and thus can lead to false identifications. Two ap-proaches have already been explored to take modified peptides into account.The first one consists in extending the database by applying all the possiblemodifications to each peptide of the base. However, this solution, leading to anexponential number of possibilities, is of course too time consuming [8]. Theother one, SpectralAlignment [1, 9, 10], is a dynamic programming algorithmthat has been designed to identify peptides even in presence of modifications.This method works rather well for one or two modifications, but for a largernumber of modifications, SpectralAlignment is not really sustainable [9].Spectra comparison has an essential advantage, namely the precision in the com-parison, allowing information to be drawn even from spectra which used to beunexploitable with a de novo approach. But spectra comparison has a majordownfall: the running time, that is highly dependent on the protein databasesize used to infer theoretical spectra.
Given that the proteins we are trying to identify come from unsequenced species,the idea is to find similar proteins on phylogenetically related organisms. Thisis why our method will have to allow the correspondence of a spectrum witha slightly different peptide. Yet, we need results with few errors and for mostspectra. Although de novo is specially designed to treat unsequenced species,it still leads to lots of misinterpreted or uninterpreted spectra. That is whythe development of a new spectra comparison method tolerant to modificationsappears interesting for us.
2 Definitions and Notations
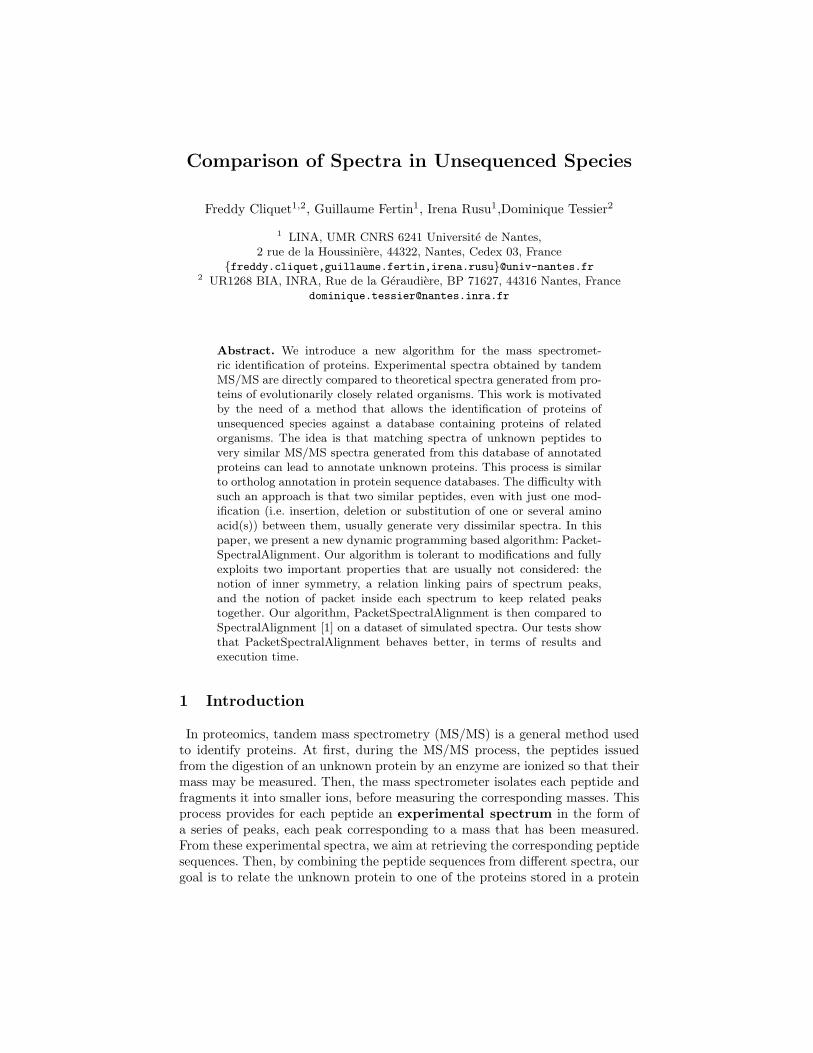
An MS/MS spectrum is obtained by selection, isolation and fragmentation ofpeptides within the mass spectrometer. Each peak results from the dissociation ofa given peptide into two fragmented ions: an N-terminal one, and a C-terminalone. The N-terminal ions (that are called a, b, c, see for instance Figure 1)represent the left part of the peptide sequence, and the C-terminal ions (thatare called x, y, z) represent the right part of the peptide sequence. The positionwhere the fragmentation appears is located around the junction of two aminoacids, as described in Figure 1. The b and y ions mark the exact junction point.In the rest of this paper, we will say that two different ions are dependent ifthey are issued from the fragmentation between the same two successive aminoacids inside a peptide. For instance, in Figure 1, for a given i ∈ [1; 3], ai, bi, ci,xi, yi and zi are mutually dependent ions. In a spectrum, a peak correspondingto a C-terminal (resp. N-terminal) ion is called C-terminal (resp. N-terminal).Moreover, peaks corresponding to dependent ions are called dependent peaks.
Fig. 1. This figure shows the fragmentation points inside a peptide containing fouramino acids (AAi with i ∈ [1; 4]). Ri (i ∈ [1; 4]) are chemical compounds that determinethe corresponding amino acid. In this example, there are three sets of dependent ions.
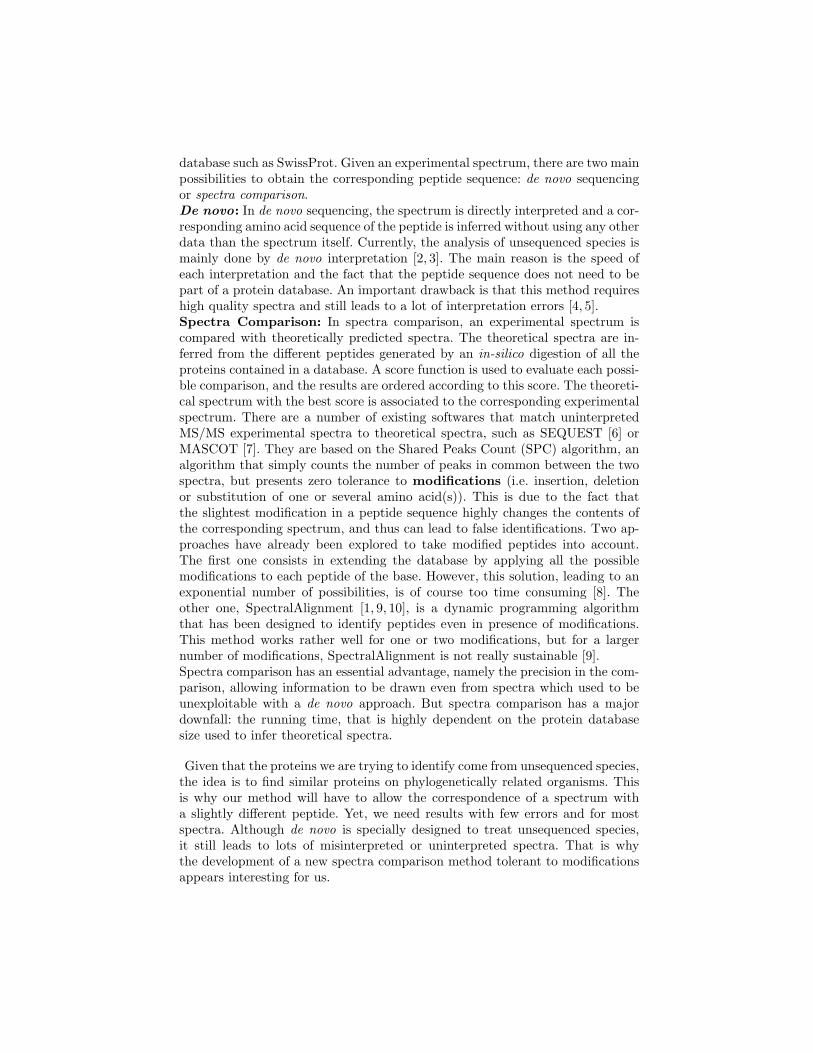
We can notice that a symmetry exists between N-terminal and C-terminalpeaks for a given fragmentation. In Figure 2 (a), the N-terminal peak locatedat position m(GL) and the C-terminal peak located at position m(MPRG) arelinked by the relation m(MPRG) = m(GLMPRG)−m(GL)− 20 (−20 is dueto the fact that the peptide is not symmetric at its extremities, see Figure 1, andto the ionization). This is a critical notion that is valid for any fragmentationand is seldom used. We call this relation inner symmetry.Any spectrum produced by a mass spectrometer is called an experimentalspectrum (Se), and any spectrum predicted in-silico from a peptide is called atheoretical spectrum (St). In the following figures, spectra will always displayall of the nine most frequent peaks coming from the fragmentation [11, 12].
Considering that the masses where the peaks appear can be seen as integers,we can represent a spectrum by a vector of booleans. This vector contains, for
(a)
(b)
Fig. 2. (a) This piece of a spectrum shows the peaks created when the peptide GLM-PRG (of mass m(GLMPRG)) is broken into peptides GL and MPRG. (b) is thespectrum of the peptide GLMPRG (for a better visualization, the N-terminal peaksare above the axis, the C-terminal ones are below the axis).
every mass, a boolean attesting the presence of a peak (‘true’) or its absence(‘false’). Vector Vt represents the spectrum St and Ve represents Se. Then, as inthe case of sequences, we can align the elements of Vt and Ve two by two whileallowing the insertion of gaps. It is only necessary to ensure that both vectorshave the same length and that a gap is not aligned with another gap. In thisrepresentation, a shift corresponds to the insertion of a gap in either Vt or Ve,which itself corresponds to a peptide modification.A score is used to evaluate an alignment, which represents the similarity be-tween both spectra, in the sense that a higher score means a higher similarity.For instance, the number of common peaks in a given alignment is a possiblescore. When transposed to Vt and Ve, this corresponds to the number of pairsof booleans in which both values are ‘true’ at the same position. In this context,the alignment having the highest score will be considered as the best alignment.Our goal is, given an experimental spectrum, to compare it to all the theoret-ical spectra from the database. For each comparison, we want to find the bestalignment.
3 Our Method
Because we want to align a spectrum Se originated from unsequenced specieswith a spectrum St generated from phylogenetically related organisms, our methodmust be able to take modifications into account. Here, modification means inser-tion, deletion or substitution of one or several amino acids, but we will see thatour algorithm, by nature, is able to handle other types of modifications such aspost translational modifications.Dynamic programming is an appropriate algorithmic method to find the bestalignment between two spectra, even in presence of modifications. It has beenused in this context by methods such as SpectralAlignement (SA) [1].
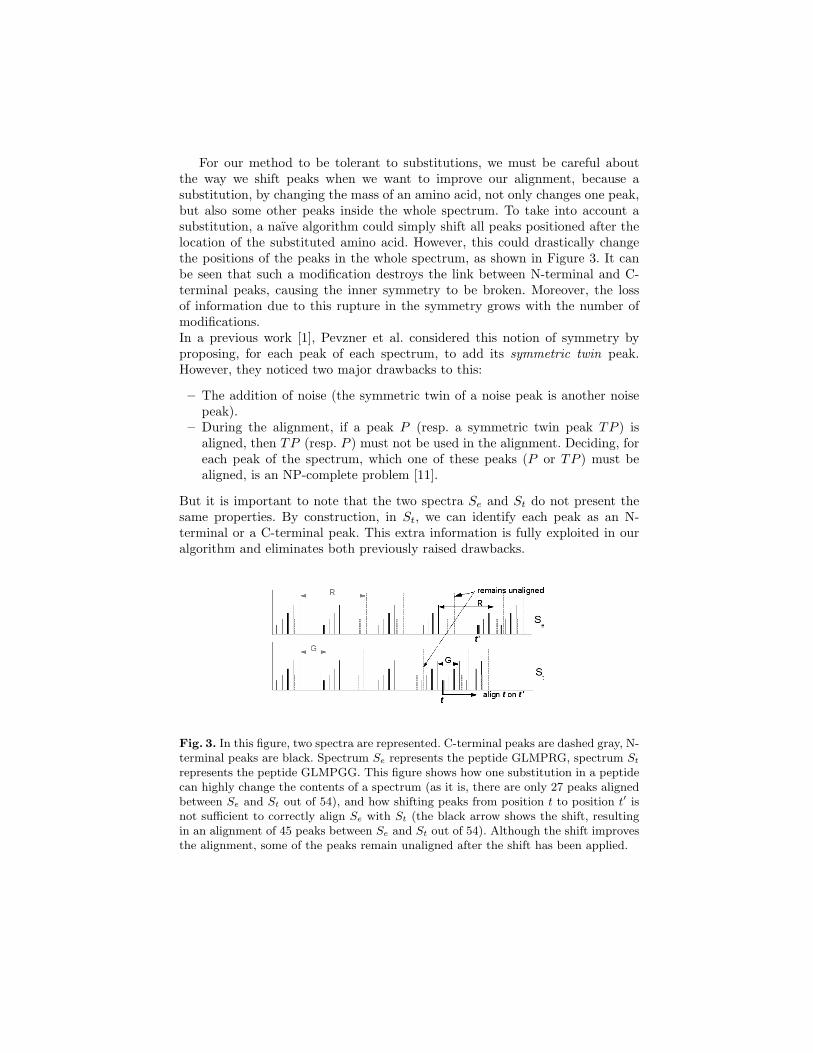
For our method to be tolerant to substitutions, we must be careful aboutthe way we shift peaks when we want to improve our alignment, because asubstitution, by changing the mass of an amino acid, not only changes one peak,but also some other peaks inside the whole spectrum. To take into account asubstitution, a naıve algorithm could simply shift all peaks positioned after thelocation of the substituted amino acid. However, this could drastically changethe positions of the peaks in the whole spectrum, as shown in Figure 3. It canbe seen that such a modification destroys the link between N-terminal and C-terminal peaks, causing the inner symmetry to be broken. Moreover, the lossof information due to this rupture in the symmetry grows with the number ofmodifications.In a previous work [1], Pevzner et al. considered this notion of symmetry byproposing, for each peak of each spectrum, to add its symmetric twin peak.However, they noticed two major drawbacks to this:
– The addition of noise (the symmetric twin of a noise peak is another noisepeak).
– During the alignment, if a peak P (resp. a symmetric twin peak TP ) isaligned, then TP (resp. P ) must not be used in the alignment. Deciding, foreach peak of the spectrum, which one of these peaks (P or TP ) must bealigned, is an NP-complete problem [11].
But it is important to note that the two spectra Se and St do not present thesame properties. By construction, in St, we can identify each peak as an N-terminal or a C-terminal peak. This extra information is fully exploited in ouralgorithm and eliminates both previously raised drawbacks.
Fig. 3. In this figure, two spectra are represented. C-terminal peaks are dashed gray, N-terminal peaks are black. Spectrum Se represents the peptide GLMPRG, spectrum St
represents the peptide GLMPGG. This figure shows how one substitution in a peptidecan highly change the contents of a spectrum (as it is, there are only 27 peaks alignedbetween Se and St out of 54), and how shifting peaks from position t to position t′ isnot sufficient to correctly align Se with St (the black arrow shows the shift, resultingin an alignment of 45 peaks between Se and St out of 54). Although the shift improvesthe alignment, some of the peaks remain unaligned after the shift has been applied.
3.1 Symmetry
Theoretical Spectrum: We build the spectrum in-silico, so the location of allthe different peaks is known. Considering this, we can easily remove all the C-terminal peaks and replace them by their respective symmetric peaks. Let mi bethe mass of the i-th C-terminal peak; its mass will be replaced by Mpeptide−mi
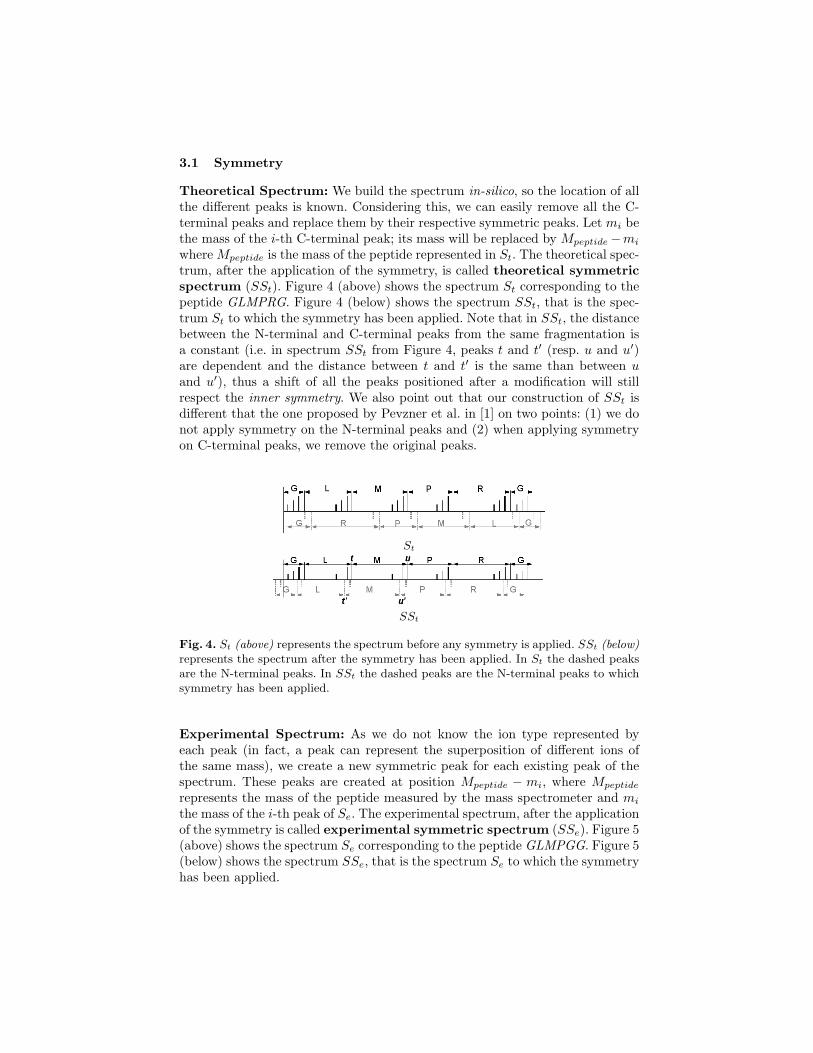
where Mpeptide is the mass of the peptide represented in St. The theoretical spec-trum, after the application of the symmetry, is called theoretical symmetricspectrum (SSt). Figure 4 (above) shows the spectrum St corresponding to thepeptide GLMPRG. Figure 4 (below) shows the spectrum SSt, that is the spec-trum St to which the symmetry has been applied. Note that in SSt, the distancebetween the N-terminal and C-terminal peaks from the same fragmentation isa constant (i.e. in spectrum SSt from Figure 4, peaks t and t′ (resp. u and u′)are dependent and the distance between t and t′ is the same than between uand u′), thus a shift of all the peaks positioned after a modification will stillrespect the inner symmetry. We also point out that our construction of SSt isdifferent that the one proposed by Pevzner et al. in [1] on two points: (1) we donot apply symmetry on the N-terminal peaks and (2) when applying symmetryon C-terminal peaks, we remove the original peaks.
St
SSt
Fig. 4. St (above) represents the spectrum before any symmetry is applied. SSt (below)represents the spectrum after the symmetry has been applied. In St the dashed peaksare the N-terminal peaks. In SSt the dashed peaks are the N-terminal peaks to whichsymmetry has been applied.
Experimental Spectrum: As we do not know the ion type represented byeach peak (in fact, a peak can represent the superposition of different ions ofthe same mass), we create a new symmetric peak for each existing peak of thespectrum. These peaks are created at position Mpeptide − mi, where Mpeptide
represents the mass of the peptide measured by the mass spectrometer and mi
the mass of the i-th peak of Se. The experimental spectrum, after the applicationof the symmetry is called experimental symmetric spectrum (SSe). Figure 5(above) shows the spectrum Se corresponding to the peptide GLMPGG. Figure 5(below) shows the spectrum SSe, that is the spectrum Se to which the symmetryhas been applied.
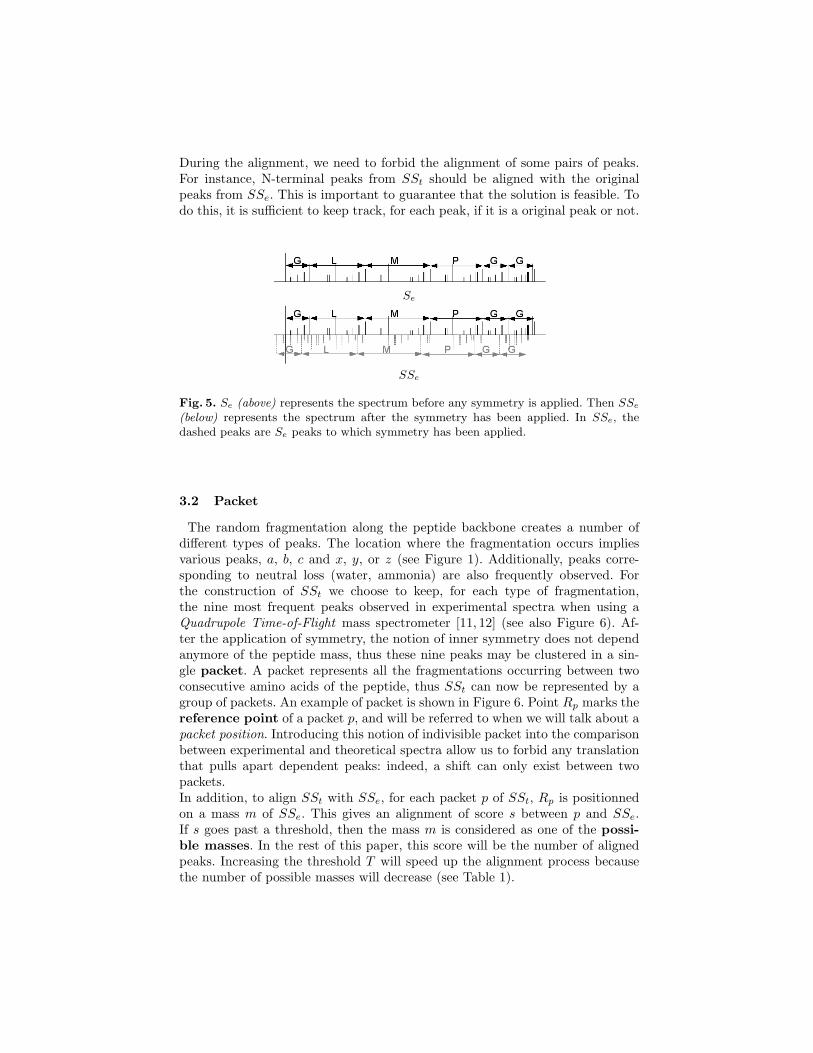
During the alignment, we need to forbid the alignment of some pairs of peaks.For instance, N-terminal peaks from SSt should be aligned with the originalpeaks from SSe. This is important to guarantee that the solution is feasible. Todo this, it is sufficient to keep track, for each peak, if it is a original peak or not.
Se
SSe
Fig. 5. Se (above) represents the spectrum before any symmetry is applied. Then SSe
(below) represents the spectrum after the symmetry has been applied. In SSe, thedashed peaks are Se peaks to which symmetry has been applied.
3.2 Packet
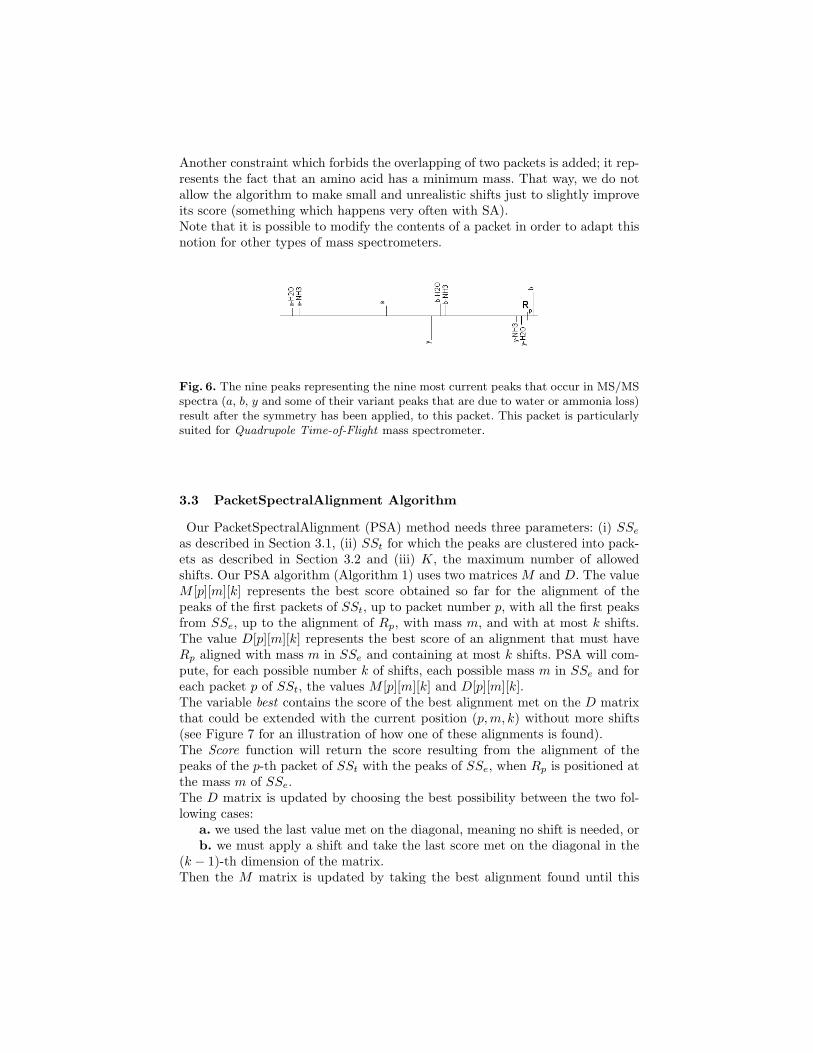
The random fragmentation along the peptide backbone creates a number ofdifferent types of peaks. The location where the fragmentation occurs impliesvarious peaks, a, b, c and x, y, or z (see Figure 1). Additionally, peaks corre-sponding to neutral loss (water, ammonia) are also frequently observed. Forthe construction of SSt we choose to keep, for each type of fragmentation,the nine most frequent peaks observed in experimental spectra when using aQuadrupole Time-of-Flight mass spectrometer [11, 12] (see also Figure 6). Af-ter the application of symmetry, the notion of inner symmetry does not dependanymore of the peptide mass, thus these nine peaks may be clustered in a sin-gle packet. A packet represents all the fragmentations occurring between twoconsecutive amino acids of the peptide, thus SSt can now be represented by agroup of packets. An example of packet is shown in Figure 6. Point Rp marks thereference point of a packet p, and will be referred to when we will talk about apacket position. Introducing this notion of indivisible packet into the comparisonbetween experimental and theoretical spectra allow us to forbid any translationthat pulls apart dependent peaks: indeed, a shift can only exist between twopackets.In addition, to align SSt with SSe, for each packet p of SSt, Rp is positionnedon a mass m of SSe. This gives an alignment of score s between p and SSe.If s goes past a threshold, then the mass m is considered as one of the possi-ble masses. In the rest of this paper, this score will be the number of alignedpeaks. Increasing the threshold T will speed up the alignment process becausethe number of possible masses will decrease (see Table 1).
Another constraint which forbids the overlapping of two packets is added; it rep-resents the fact that an amino acid has a minimum mass. That way, we do notallow the algorithm to make small and unrealistic shifts just to slightly improveits score (something which happens very often with SA).Note that it is possible to modify the contents of a packet in order to adapt thisnotion for other types of mass spectrometers.
Fig. 6. The nine peaks representing the nine most current peaks that occur in MS/MSspectra (a, b, y and some of their variant peaks that are due to water or ammonia loss)result after the symmetry has been applied, to this packet. This packet is particularlysuited for Quadrupole Time-of-Flight mass spectrometer.
3.3 PacketSpectralAlignment Algorithm
Our PacketSpectralAlignment (PSA) method needs three parameters: (i) SSe
as described in Section 3.1, (ii) SSt for which the peaks are clustered into pack-ets as described in Section 3.2 and (iii) K, the maximum number of allowedshifts. Our PSA algorithm (Algorithm 1) uses two matrices M and D. The valueM [p][m][k] represents the best score obtained so far for the alignment of thepeaks of the first packets of SSt, up to packet number p, with all the first peaksfrom SSe, up to the alignment of Rp, with mass m, and with at most k shifts.The value D[p][m][k] represents the best score of an alignment that must haveRp aligned with mass m in SSe and containing at most k shifts. PSA will com-pute, for each possible number k of shifts, each possible mass m in SSe and foreach packet p of SSt, the values M [p][m][k] and D[p][m][k].The variable best contains the score of the best alignment met on the D matrixthat could be extended with the current position (p, m, k) without more shifts(see Figure 7 for an illustration of how one of these alignments is found).The Score function will return the score resulting from the alignment of thepeaks of the p-th packet of SSt with the peaks of SSe, when Rp is positioned atthe mass m of SSe.The D matrix is updated by choosing the best possibility between the two fol-lowing cases:
a. we used the last value met on the diagonal, meaning no shift is needed, orb. we must apply a shift and take the last score met on the diagonal in the
(k − 1)-th dimension of the matrix.Then the M matrix is updated by taking the best alignment found until this

point.As an illustration, applying our algorithm PSA on the theoretical spectrum SSt
of Figure 4 and the experimental spectrum SSe of Figure 5 gives a “perfect”alignment of the peaks (i.e. that is, 54 peaks out of 54 that are aligned) with oneshift (corresponding to the substitution of the fifth amino acid R by G in SSt).
Algorithm 1 PSA(ExperimentalSpectrum SSe, TheoreticalSpectrum SSt, In-teger K)Ensure: The best alignment between SSe and SSt with a max of K shifts1: for k = 0 to K do2: for all Possible masses m from SSe do3: for all Packets p from SSt do4: best = max {D[p′][m− (Rp −Rp′)][k] | p′ < p} /*(see Figure 7)*/5: s = Score(p,m)6: D[p][m][k] = max(best+s, M [p−1][m−PacketSize][k−1]+s) /*PacketSize
is the constant representing the size of a packet (i.e. the distance betweenthe first and the last peak of a packet)*/
7: M [p][m][k] = max(D[p][m][k], M [p− 1][m][k], M [p][m− 1][k])8: end for9: end for
10: end for11: return M [NbPacket][MAX][K] /*NbPacket is the number of packets composing
SSt and MAX is the highest mass represented by a peak inside SSe*/
Fig. 7. This figure shows how to find a value val = D[p′][m − (Rp − Rp′)][k], withp′ < p.
4 Results
We compare our algorithm to SA on a set of simulated data. We generate adataset of 1000 random peptides of random size in [10, 25] in order to constitutea database that will be used to create the theoretical symmetric spectra. Each
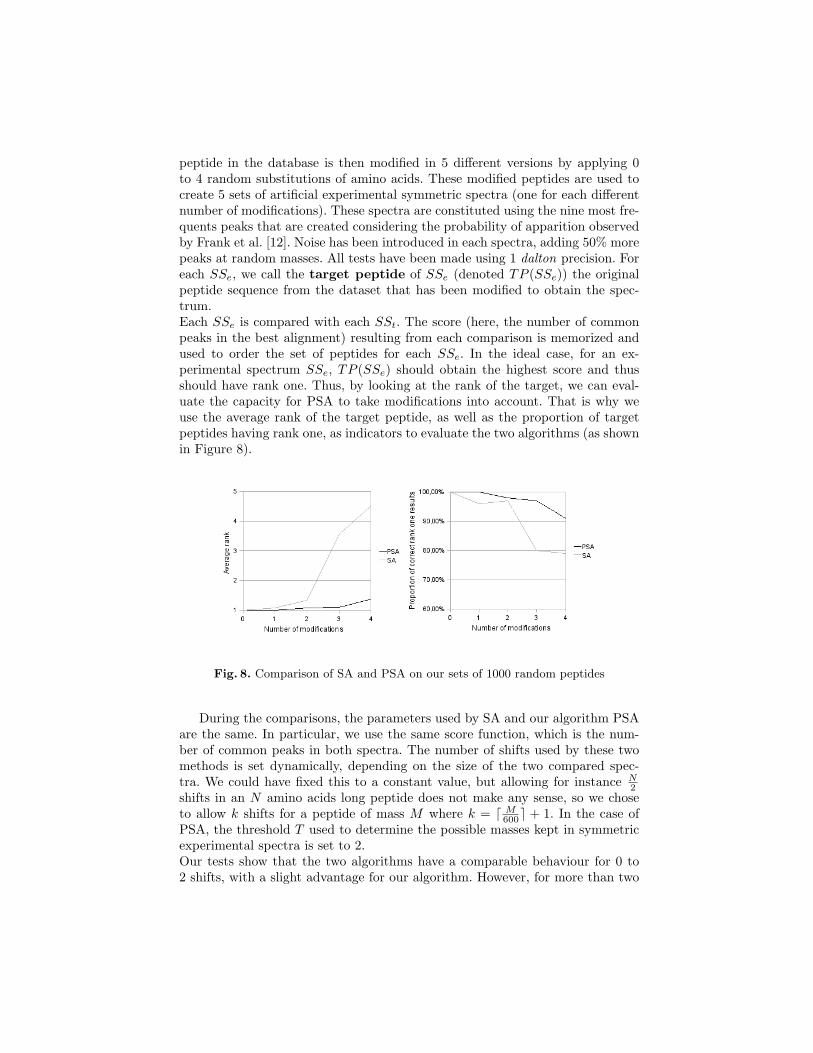
peptide in the database is then modified in 5 different versions by applying 0to 4 random substitutions of amino acids. These modified peptides are used tocreate 5 sets of artificial experimental symmetric spectra (one for each differentnumber of modifications). These spectra are constituted using the nine most fre-quents peaks that are created considering the probability of apparition observedby Frank et al. [12]. Noise has been introduced in each spectra, adding 50% morepeaks at random masses. All tests have been made using 1 dalton precision. Foreach SSe, we call the target peptide of SSe (denoted TP (SSe)) the originalpeptide sequence from the dataset that has been modified to obtain the spec-trum.Each SSe is compared with each SSt. The score (here, the number of commonpeaks in the best alignment) resulting from each comparison is memorized andused to order the set of peptides for each SSe. In the ideal case, for an ex-perimental spectrum SSe, TP (SSe) should obtain the highest score and thusshould have rank one. Thus, by looking at the rank of the target, we can eval-uate the capacity for PSA to take modifications into account. That is why weuse the average rank of the target peptide, as well as the proportion of targetpeptides having rank one, as indicators to evaluate the two algorithms (as shownin Figure 8).
Fig. 8. Comparison of SA and PSA on our sets of 1000 random peptides
During the comparisons, the parameters used by SA and our algorithm PSAare the same. In particular, we use the same score function, which is the num-ber of common peaks in both spectra. The number of shifts used by these twomethods is set dynamically, depending on the size of the two compared spec-tra. We could have fixed this to a constant value, but allowing for instance N
2shifts in an N amino acids long peptide does not make any sense, so we choseto allow k shifts for a peptide of mass M where k = d M
600e + 1. In the case ofPSA, the threshold T used to determine the possible masses kept in symmetricexperimental spectra is set to 2.Our tests show that the two algorithms have a comparable behaviour for 0 to2 shifts, with a slight advantage for our algorithm. However, for more than two
shifts, SpectralAlignment presents a fast deterioration of its results, while Pack-etSpectralAlignment still gives good results (see Figure 8). We also note that onthese tests, for a threshold T of 2, our algorithm PSA is twice as fast as SA.
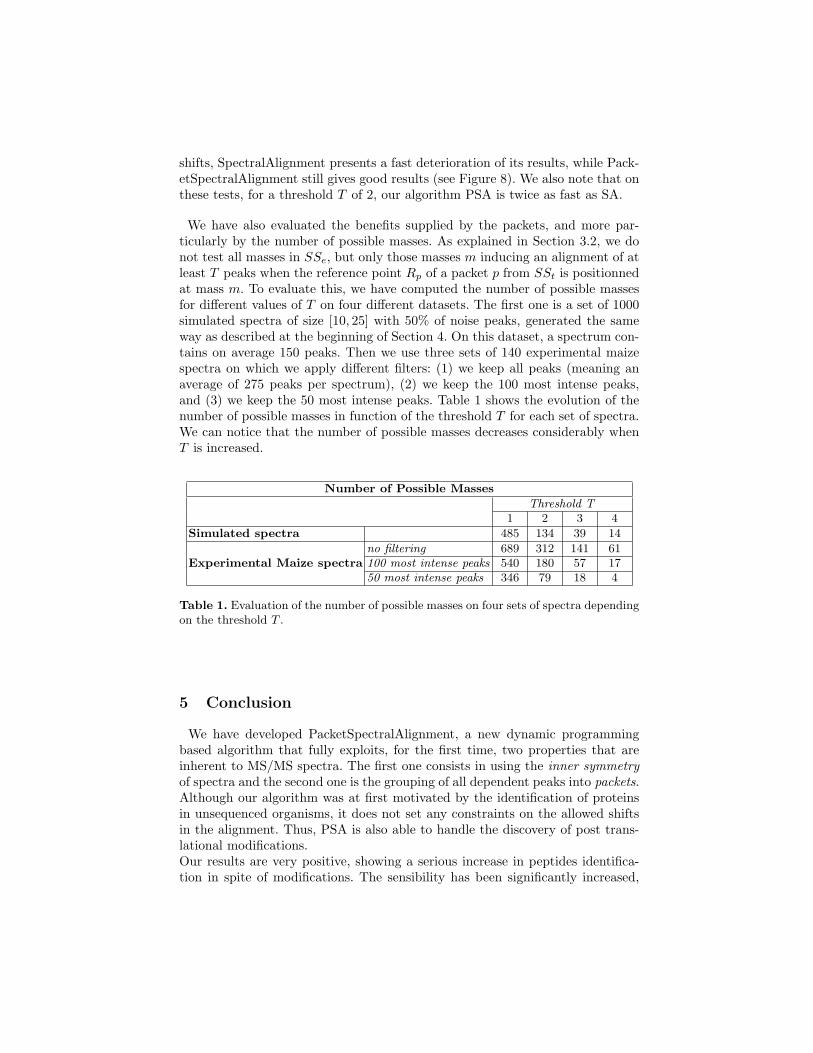
We have also evaluated the benefits supplied by the packets, and more par-ticularly by the number of possible masses. As explained in Section 3.2, we donot test all masses in SSe, but only those masses m inducing an alignment of atleast T peaks when the reference point Rp of a packet p from SSt is positionnedat mass m. To evaluate this, we have computed the number of possible massesfor different values of T on four different datasets. The first one is a set of 1000simulated spectra of size [10, 25] with 50% of noise peaks, generated the sameway as described at the beginning of Section 4. On this dataset, a spectrum con-tains on average 150 peaks. Then we use three sets of 140 experimental maizespectra on which we apply different filters: (1) we keep all peaks (meaning anaverage of 275 peaks per spectrum), (2) we keep the 100 most intense peaks,and (3) we keep the 50 most intense peaks. Table 1 shows the evolution of thenumber of possible masses in function of the threshold T for each set of spectra.We can notice that the number of possible masses decreases considerably whenT is increased.
Number of Possible Masses
Threshold T1 2 3 4
Simulated spectra 485 134 39 14
Experimental Maize spectrano filtering 689 312 141 61100 most intense peaks 540 180 57 1750 most intense peaks 346 79 18 4
Table 1. Evaluation of the number of possible masses on four sets of spectra dependingon the threshold T .
5 Conclusion
We have developed PacketSpectralAlignment, a new dynamic programmingbased algorithm that fully exploits, for the first time, two properties that areinherent to MS/MS spectra. The first one consists in using the inner symmetryof spectra and the second one is the grouping of all dependent peaks into packets.Although our algorithm was at first motivated by the identification of proteinsin unsequenced organisms, it does not set any constraints on the allowed shiftsin the alignment. Thus, PSA is also able to handle the discovery of post trans-lational modifications.Our results are very positive, showing a serious increase in peptides identifica-tion in spite of modifications. The sensibility has been significantly increased,
while the execution time has been divided by more than two. More tests onexperimental data will allow us to evaluate more precisely the benefits providedby our new algorithm. In the future, a better consideration of other points, suchas spectra quality, will be added. Moreover, the score will be improved by takinginto account other elements such as peaks intensity.
Acknowledgments. MS/MS experimental spectra were performed with thefacilities of the platform Biopolymers, Interactions and Structural Biology, INRANantes. The authors thank Dr Helene Rogniaux for fruitful discussions aboutMS/MS spectra interpretation. This research was supported by grant from theRegion Pays de la Loire, France.
References
1. Pevzner, P.A., Dancık, V., Tang, C.L.: Mutation-tolerant protein identification bymass spectrometry. J Comput Biol 7(6) (2000) 777–87
2. Habermann, B., Oegema, J., Sunyaev, S., Shevchenko, A.: The power and thelimitations of cross-species protein identification by mass spectrometry-driven se-quence similarity searches. Mol Cell Proteomics 3(3) (2004) 238–49
3. Grossmann, J., Fischer, B., Baerenfaller, K., Owiti, J., Buhmann, J.M., Gruissem,W., Baginsky, S.: A workflow to increase the detection rate of proteins fromunsequenced organisms in high-throughput proteomics experiments. Proteomics7(23) (2007) 4245–54
4. Pevtsov, S., Fedulova, I., Mirzaei, H., Buck, C., Zhang, X.: Performance evaluationof existing de novo sequencing algorithms. J Proteome Res 5(11) (2006) 3018–28
5. Pitzer, E., Masselot, A., Colinge, J.: Assessing peptide de novo sequencing al-gorithms performance on large and diverse data sets. Proteomics 7(17) (2007)3051–4
6. Eng, J., McCormack, A., Yates, J.: An approach to correlate tandem mass spectraldata of peptides with amino acid sequences in a protein database. J. Am. Soc.Mass Spectrom 5(11) (1994) 976–989
7. Perkins, D.N., Pappin, D.J., Creasy, D.M., Cottrell, J.S.: Probability-based pro-tein identification by searching sequence databases using mass spectrometry data.Electrophoresis 20(18) (1999) 3551–67
8. Yates, J.R., Eng, J.K., McCormack, A.L., Schieltz, D.: Method to correlate tandemmass spectra of modified peptides to amino acid sequences in the protein database.Anal Chem 67(8) (1995) 1426–36
9. Pevzner, P.A., Mulyukov, Z., Dancik, V., Tang, C.L.: Efficiency of database searchfor identification of mutated and modified proteins via mass spectrometry. GenomeRes 11(2) (2001) 290–9
10. Tsur, D., Tanner, S., Zandi, E., Bafna, V., Pevzner, P.A.: Identification of post-translational modifications by blind search of mass spectra. Nat Biotechnol 23(12)(2005) 1562–7
11. Dancik, V., Addona, T., Clauser, K., Vath, J., Pevzner, P.: De novo peptidesequencing via tandem mass spectrometry. Journal of Computational Biology6(3-4) (1999) 327–342
12. Frank, A.M., Savitski, M.M., Nielsen, M.L., Zubarev, R.A., Pevzner, P.A.: Denovo peptide sequencing and identification with precision mass spectrometry. JProteome Res 6(1) (2007) 114–23