Embed Size (px)
Citation preview
Ocean Systems Engineering, Vol. 6, No. 1 (2016) 1-21
DOI: http://dx.doi.org/10.12989/ose.2016.6.1.001 1
Copyright © 2016 Techno-Press, Ltd.
http://www.techno-press.org/?journal=ose&subpage=7 ISSN: 2093-6702 (Print), 2093-677X (Online)
Comparison of simulated platform dynamics in steady/dynamic winds and irregular waves for OC4 semi-submersible 5MW
wind-turbine against DeepCwind model-test results
H.C. Kim and M.H. Kim
Civil Engineering, Texas A&M University, College Station, TX 77843, USA
(Received December 17, 2015, Revised February 9, 2016, Accepted February 11, 2016)
Abstract. The global performance of the 5 MW OC4 semisubmersible floating wind turbine in random waves with or without steady/dynamic winds is numerically simulated by using the turbine-floater-mooring fully coupled dynamic analysis program FAST-CHARM3D in time domain. The numerical simulations are based on the complete second-order diffraction/radiation potential formulations along with nonlinear viscous-drag force estimations at the body‟s instantaneous position. The sensitivity of hull motions and mooring dynamics with varying wave-kinematics extrapolation methods above MWL(mean-water level) and column drag coefficients is investigated. The effects of steady and dynamic winds are also illustrated. When dynamic wind is added to the irregular waves, it additionally introduces low-frequency wind loading and aerodynamic damping. The numerically simulated results for the 5 MW OC4 semisubmersible floating wind turbine by FAST-CHARM3D are also extensively compared with the DeepCWind model-test results by Technip/NREL/UMaine. Those numerical-simulation results have good correlation with experimental results for all the cases considered.
Keywords: wind energy; FOWT (Floating Offshore Wind Turbine); OC4 semi-submersible;
turbine-hull-mooring fully coupled dynamics; second-order wave diffraction QTF; FAST-CHARM3D;
5MW wind-turbine; viscous drag; wave-crest kinematics; Irregular waves; steady/dynamic wind
1. Introduction
To meet the increased demand of energy and reduce the CO2 emission, ocean renewable energy
sources need to be seriously considered in the future. Especially, offshore wind energy is appealing
since it is economically competitive, technologically proven, infinitely renewable, and does not
make any harmful waste or emission. Particularly, the wind quality in offshore region far from the
coastal area becomes increasingly better and regulatory restriction is much less there. In this regard,
several countries installed offshore floating wind turbines (Dominique et al. 2010) in relatively
deeper water. Although they are considered to be more difficult to design than fixed offshore wind
turbines, floating wind turbines have many advantages compared to onshore or bottom fixed
offshore wind turbines. If the technology is completely developed, floating offshore wind turbines
Corresponding author, Ph.D. Student, E-mail: [email protected] a Professor, E-mail: [email protected]
H.C. Kim and M.H. Kim
are expected to be more popular to generate considerable amounts of clean renewable energy at
competitive prices compared to other energy sources (Henderson et al. 2002, Henderson et al.
2004, Musial et al. 2004, Tong 1998, Wayman et al. 2006).
One of the challenging issues on the floating offshore wind turbine is the survivability in
extreme sea conditions. From design/analysis aspect, the most difficult part is the coupled
dynamics analysis among the mooring system, floating platform, and wind turbine. Therefore, for
reliable design and technology development, it is necessary to develop the integrated tool to
accurately analyze the fully coupled dynamics including control. Some efforts are in progress
toward this direction for several selected types of floating offshore wind turbines. In this paper, the
global performance analysis of the OC4 5-MW semi-submersible floating wind turbine (e.g.,
Robertson et al. 2012) is investigated by the fully coupled dynamic analysis tool
CHARM3D-FAST, the combination of FAST (e.g., Jonkman 2004) developed by NREL and
CHARM3D (e.g., Yang and Kim 2010, Kang and Kim 2012) developed by the second author‟s
research group (e.g., Bae and Kim 2011, 2014).
For the OC4 semi-submersible case, Masciola et al. (2013) analyzed the system by including
only linear wave force and using quasi-static or lumped-mass methods for mooring model. Also,
Coulling et al. (2013a,b) performed the validation for the semi-submersible platform including
second-order wave-diffraction forces based on Newman‟s approximation. However, the mooring
model in the analysis was also quasi-static, so the true dynamic coupling between hull and
mooring lines was missing in the study. Recently, Koo et al. (2014a) analyzed the OC4
semisubmersible wind turbine and compared their numerical predictions by their own code,
MLTSIM-FAST, against DeepCWind model test results. Moreover, the second-order
wave-diffraction effects were briefly introduced and discussed in their work (Koo et al. 2014b).
A more detailed study with respect to the effects of the complete second-order diffraction/radiation
solutions including comparisons against simplified methods was conducted by authors (Kim and
Kim 2015). On the other hand, Zhao and Wan (2015) carried out motion simulations of the OC4
semi-submersible platform in waves by using their own CFD code, naoe-FOAM-SJTU. For the
3-column semisubmersible with similar hull shape called “Windfloat” (Dominique et al. 2010), the
wind turbine is not mounted at the center but on one of the three columns with the other two
columns water ballasted. The offshore system has successfully been installed and operated in full
scale in Portugal.
In the present study, the fully coupled wind-turbine/hull/mooring dynamics numerical model
developed for the OC4 semi-submersible system (Kim and Kim 2015) including viscous and
complete second-order difference-frequency wave effects is further utilized to investigate
sensitivity with empirical parameters and response characteristics for more diverse environmental
conditions including steady and dynamic winds. All the simulation results were systematically
compared against the corresponding experimental results, which shows reasonably good
agreement among them. Additionally, the effects of the extrapolated wave crest kinematics above
MWL and the role of steady/dynamic winds and viscous/aerodynamic damping on the 6DOF
motions and mooring top tensions are discussed.
2. Numerical simulation in time domain
In order to solve a wind turbine on a single floating platform, FAST (e.g., Jonkman and Buhl Jr.
2004), developed by National Renewable Energy Laboratory (NREL), was modified and extended
2
Comparison of simulated platform dynamics in steady/dynamic winds and irregular waves…
so that it can calculate the full coupled dynamics among wind turbine, floating platform, and
mooring lines. The coupled dynamic responses between the turbine and floater can be derived
from the full-DOF matrix equation including floater 6-DOFs and wind-turbine multi-DOFs with
proper platform-turbine coupling terms. The combined left-hand-side matrix with the given
forcing functions in the right-hand side is solved at each time step. Assuming that every degree of
freedom for a three-bladed turbine in FAST is turned on, the total DOFs, for example, can be
expressed as 6 (for floater) +19 (for turbine)=25. The coupled terms between the floating platform
and turbine in the coefficient matrix can be derived by accounting for every effect of generalized
inertia and active forces from both bodies. The detailed theory and equations are given in Bae and
Kim (2014)
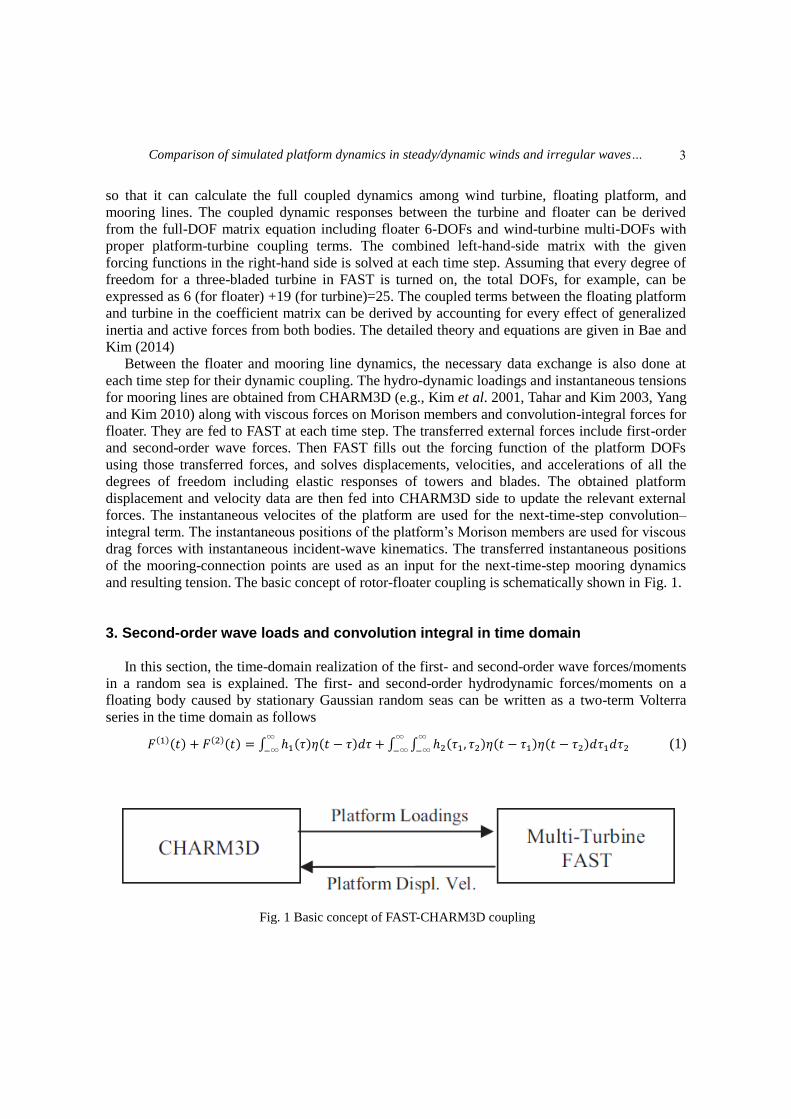
Between the floater and mooring line dynamics, the necessary data exchange is also done at
each time step for their dynamic coupling. The hydro-dynamic loadings and instantaneous tensions
for mooring lines are obtained from CHARM3D (e.g., Kim et al. 2001, Tahar and Kim 2003, Yang
and Kim 2010) along with viscous forces on Morison members and convolution-integral forces for
floater. They are fed to FAST at each time step. The transferred external forces include first-order
and second-order wave forces. Then FAST fills out the forcing function of the platform DOFs
using those transferred forces, and solves displacements, velocities, and accelerations of all the
degrees of freedom including elastic responses of towers and blades. The obtained platform
displacement and velocity data are then fed into CHARM3D side to update the relevant external
forces. The instantaneous velocites of the platform are used for the next-time-step convolution–
integral term. The instantaneous positions of the platform‟s Morison members are used for viscous
drag forces with instantaneous incident-wave kinematics. The transferred instantaneous positions
of the mooring-connection points are used as an input for the next-time-step mooring dynamics
and resulting tension. The basic concept of rotor-floater coupling is schematically shown in Fig. 1.
3. Second-order wave loads and convolution integral in time domain
In this section, the time-domain realization of the first- and second-order wave forces/moments
in a random sea is explained. The first- and second-order hydrodynamic forces/moments on a
floating body caused by stationary Gaussian random seas can be written as a two-term Volterra
series in the time domain as follows
𝐹(1)(𝑡) + 𝐹(2)(𝑡) = ∫ ℎ1(𝜏)𝜂(𝑡 − 𝜏)𝑑𝜏∞
−∞+ ∫ ∫ ℎ2(𝜏1, 𝜏2)𝜂(𝑡 − 𝜏1)𝜂(𝑡 − 𝜏2)𝑑𝜏1𝑑𝜏2
∞
−∞
∞
−∞ (1)
Fig. 1 Basic concept of FAST-CHARM3D coupling
3
H.C. Kim and M.H. Kim
Where 𝜂(𝑡) is the ambient wave free surface elevation at a reference position, ℎ1(𝑡) is the
linear impulse response function, and ℎ2(𝜏1, 𝜏2) is the quadratic impulse response function. The
above equation can also be expressed in the form of the summation of N frequency component
waves as below
𝐹𝐼(1)(𝑡) = 𝑅𝑒[∑ 𝐴𝑗𝐿(𝜔𝑗)𝑒
𝑖𝜔𝑡𝑁𝑗=1 ] (2)
𝐹𝐼(2)(𝑡) = 𝑅𝑒[∑ ∑ 𝐴𝑗𝐴𝑘
∗𝐷(𝜔𝑗, −𝜔𝑘)𝑒𝑖𝜔−𝑡𝑁
𝑘=1𝑁𝑗=1 ] (3)
Where 𝐿(𝜔𝑗) represents the linear force transfer function (LTF), A is complex wave amplitude,
and 𝐷(𝜔𝑗, −𝜔𝑘) is the difference-frequency quadratic transfer functions (QTF). The
sum-frequency second-order forces/moments are not included in (3) since they play little role for
the overall dynamics of semisubmersible platform.
The radiation-potential-induced force/moment in time domain can be expressed as follows
𝐹𝑅(𝑡) = −𝑀𝑎(∞)𝜁̈(𝑡) − ∫ 𝑅(𝑡 − 𝜏)𝜁̇(𝜏)𝑑𝜏𝑡
−∞ (4)
Where ζ is platform motion, upper dot is time derivative, 𝑀𝑎(∞) is the added mass of
platform at infinite frequency, and 𝑅(𝑡) is retardation function (or time-memory function), which
is related to the frequency-domain solutions of the radiation problem as follows
𝑅(𝑡) =2
𝜋∫ 𝐶(𝜔)∞
0cos(𝜔𝑡)𝑑𝜔 (5)
Where 𝐶(𝜔) is the radiation-wave-induced damping coefficient at frequency 𝜔.
The total wave loads in time domain can then be written by summing all the force components
as below.
𝐹𝑡𝑜𝑡𝑎𝑙(𝑡) = 𝐹𝐼(𝑡) + 𝐹𝑅(𝑡) (6)
where the total wave exciting force 𝐹𝐼(𝑡) = 𝐹𝐼(1)(𝑡) + 𝐹𝐼
(2)(𝑡).
4. DeepCwind semisubmersible wind-turbine model description
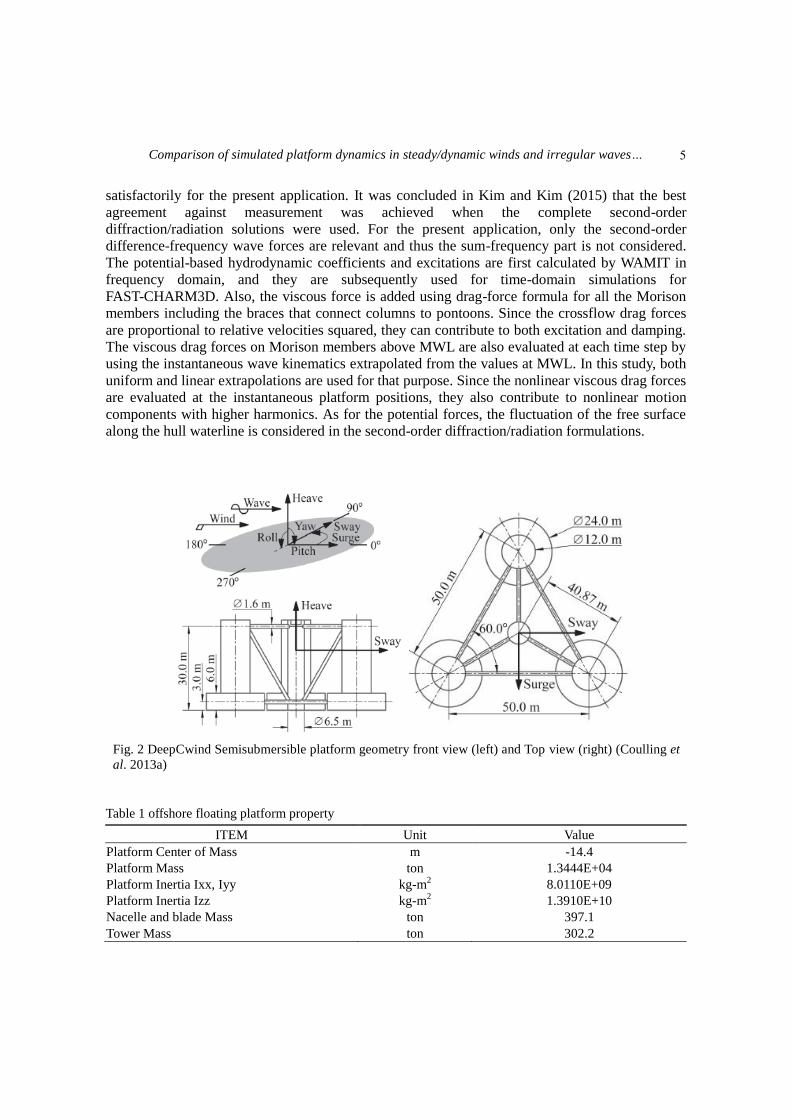
Table 1 and Fig. 2 show the floating platform properties and DeepCwind offshore wind-turbine
geometry, respectively. The property in Table 1 is about only the floating platform, and the wind
turbine part is not included. The wind turbine is based on NREL 5 MW baseline turbine (Jonkman
et al. 2007), but it is modified for a 1/50th scale model test. (Coulling et al. 2013a).
5. Numerical modeling
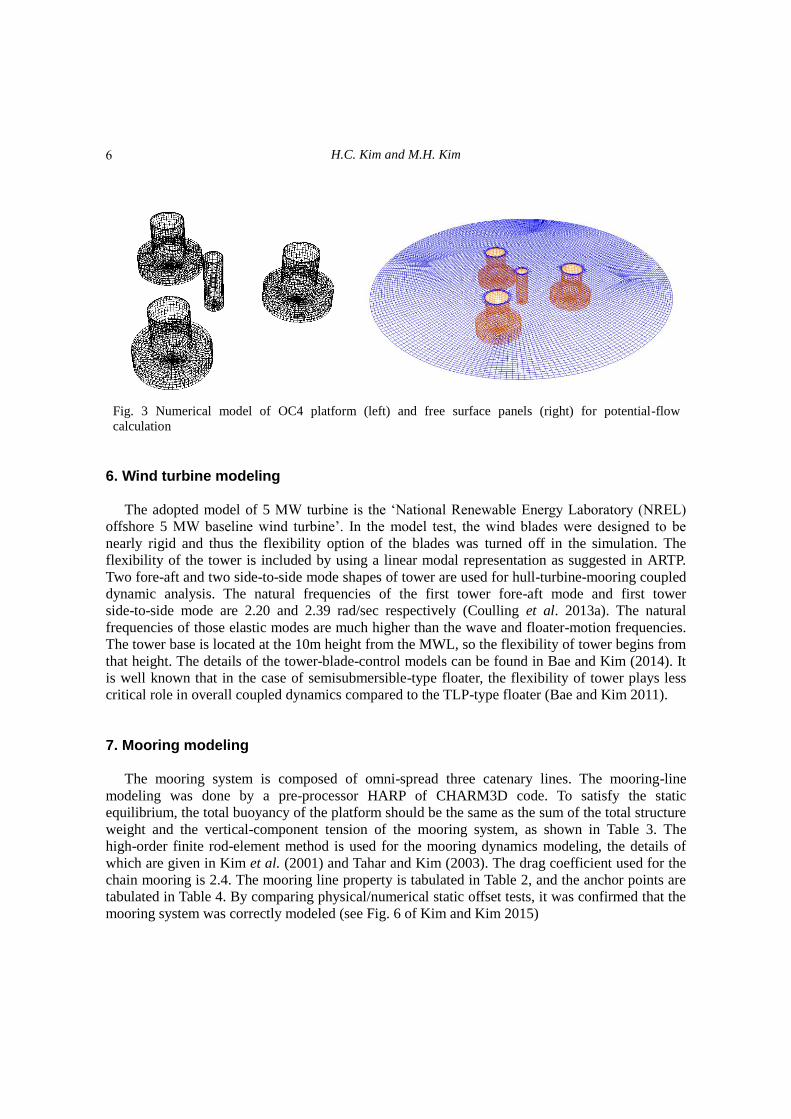
The x-axis symmetry is used and the half of the wet hull is discretized by 3600 panels. Panels
near the free surface are more finely modeled as shown in Fig. 3. The free-surface discretization is
also needed in the complete second-order diffraction/radiation problem (Kim and Yue 1989, 1990)
A total of 4888 panels are used for the free-surface discretization up to the truncated radius of 80m
(Kim and Kim 2015). The convergence test with a finer mesh are carried out and it was checked
that the added mass, radiation damping, and linear- and second-order wave forces were converged
4
Comparison of simulated platform dynamics in steady/dynamic winds and irregular waves…
satisfactorily for the present application. It was concluded in Kim and Kim (2015) that the best
agreement against measurement was achieved when the complete second-order
diffraction/radiation solutions were used. For the present application, only the second-order
difference-frequency wave forces are relevant and thus the sum-frequency part is not considered.
The potential-based hydrodynamic coefficients and excitations are first calculated by WAMIT in
frequency domain, and they are subsequently used for time-domain simulations for
FAST-CHARM3D. Also, the viscous force is added using drag-force formula for all the Morison
members including the braces that connect columns to pontoons. Since the crossflow drag forces
are proportional to relative velocities squared, they can contribute to both excitation and damping.
The viscous drag forces on Morison members above MWL are also evaluated at each time step by
using the instantaneous wave kinematics extrapolated from the values at MWL. In this study, both
uniform and linear extrapolations are used for that purpose. Since the nonlinear viscous drag forces
are evaluated at the instantaneous platform positions, they also contribute to nonlinear motion
components with higher harmonics. As for the potential forces, the fluctuation of the free surface
along the hull waterline is considered in the second-order diffraction/radiation formulations.
Fig. 2 DeepCwind Semisubmersible platform geometry front view (left) and Top view (right) (Coulling et
al. 2013a)
Table 1 offshore floating platform property
ITEM Unit Value
Platform Center of Mass m -14.4
Platform Mass ton 1.3444E+04
Platform Inertia Ixx, Iyy kg-m2 8.0110E+09
Platform Inertia Izz kg-m2 1.3910E+10
Nacelle and blade Mass ton 397.1
Tower Mass ton 302.2
5
H.C. Kim and M.H. Kim
Fig. 3 Numerical model of OC4 platform (left) and free surface panels (right) for potential-flow
calculation
6. Wind turbine modeling
The adopted model of 5 MW turbine is the „National Renewable Energy Laboratory (NREL)
offshore 5 MW baseline wind turbine‟. In the model test, the wind blades were designed to be
nearly rigid and thus the flexibility option of the blades was turned off in the simulation. The
flexibility of the tower is included by using a linear modal representation as suggested in ARTP.
Two fore-aft and two side-to-side mode shapes of tower are used for hull-turbine-mooring coupled
dynamic analysis. The natural frequencies of the first tower fore-aft mode and first tower
side-to-side mode are 2.20 and 2.39 rad/sec respectively (Coulling et al. 2013a). The natural
frequencies of those elastic modes are much higher than the wave and floater-motion frequencies.
The tower base is located at the 10m height from the MWL, so the flexibility of tower begins from
that height. The details of the tower-blade-control models can be found in Bae and Kim (2014). It
is well known that in the case of semisubmersible-type floater, the flexibility of tower plays less
critical role in overall coupled dynamics compared to the TLP-type floater (Bae and Kim 2011).
7. Mooring modeling
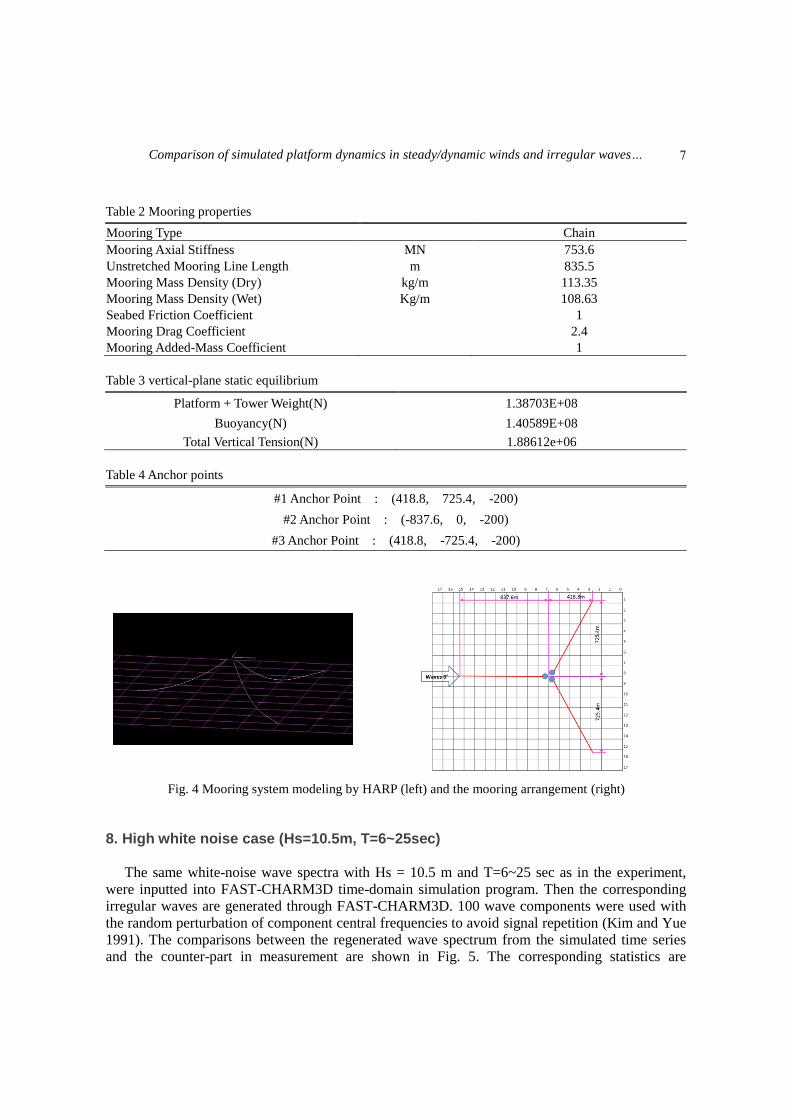
The mooring system is composed of omni-spread three catenary lines. The mooring-line
modeling was done by a pre-processor HARP of CHARM3D code. To satisfy the static
equilibrium, the total buoyancy of the platform should be the same as the sum of the total structure
weight and the vertical-component tension of the mooring system, as shown in Table 3. The
high-order finite rod-element method is used for the mooring dynamics modeling, the details of
which are given in Kim et al. (2001) and Tahar and Kim (2003). The drag coefficient used for the
chain mooring is 2.4. The mooring line property is tabulated in Table 2, and the anchor points are
tabulated in Table 4. By comparing physical/numerical static offset tests, it was confirmed that the
mooring system was correctly modeled (see Fig. 6 of Kim and Kim 2015)
6
Comparison of simulated platform dynamics in steady/dynamic winds and irregular waves…
Table 2 Mooring properties
Mooring Type Chain
Mooring Axial Stiffness MN 753.6
Unstretched Mooring Line Length m 835.5
Mooring Mass Density (Dry) kg/m 113.35
Mooring Mass Density (Wet) Kg/m 108.63
Seabed Friction Coefficient 1
Mooring Drag Coefficient 2.4
Mooring Added-Mass Coefficient 1
Table 3 vertical-plane static equilibrium
Platform + Tower Weight(N) 1.38703E+08
Buoyancy(N) 1.40589E+08
Total Vertical Tension(N) 1.88612e+06
Table 4 Anchor points
#1 Anchor Point : (418.8, 725.4, -200)
#2 Anchor Point : (-837.6, 0, -200)
#3 Anchor Point : (418.8, -725.4, -200)
Fig. 4 Mooring system modeling by HARP (left) and the mooring arrangement (right)
8. High white noise case (Hs=10.5m, T=6~25sec)
The same white-noise wave spectra with Hs = 10.5 m and T=6~25 sec as in the experiment,
were inputted into FAST-CHARM3D time-domain simulation program. Then the corresponding
irregular waves are generated through FAST-CHARM3D. 100 wave components were used with
the random perturbation of component central frequencies to avoid signal repetition (Kim and Yue
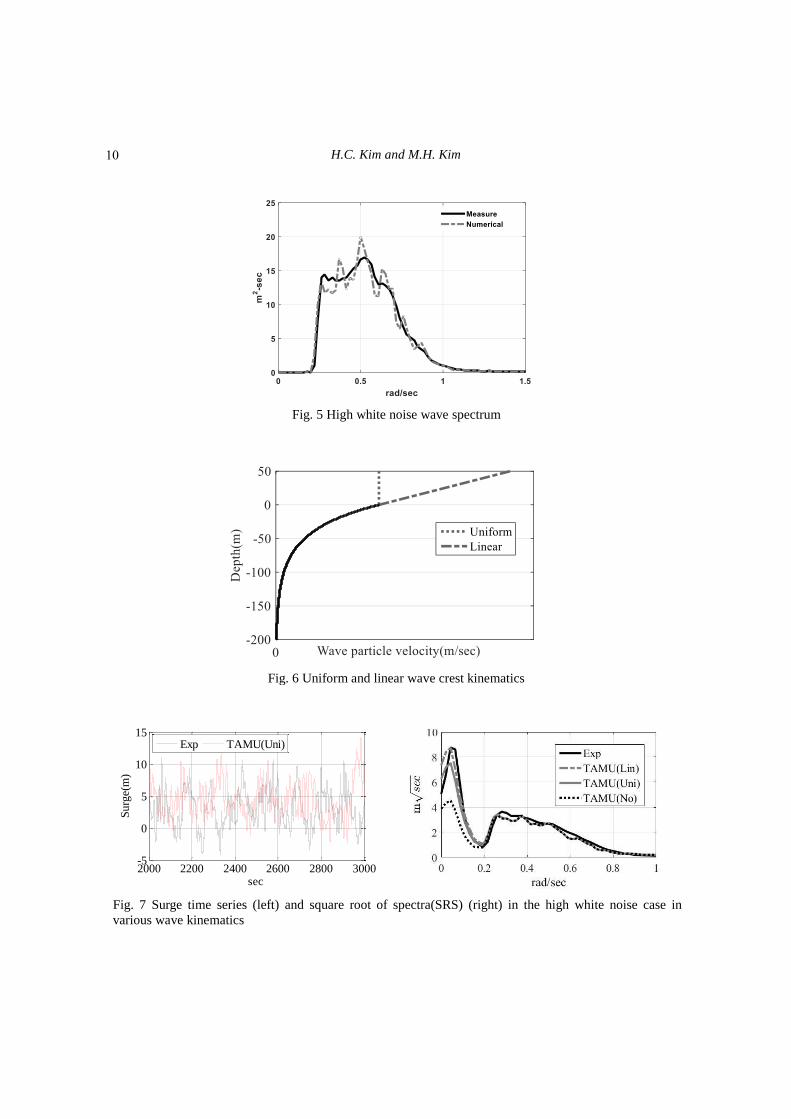
1991). The comparisons between the regenerated wave spectrum from the simulated time series
and the counter-part in measurement are shown in Fig. 5. The corresponding statistics are
7
H.C. Kim and M.H. Kim
tabulated in Table 5. The predicted and measured data generally agree well having similar trend
except that the experimental incident waves have more nonlinear features (higher crest and
shallower trough).
A sensitivity test with varying wave crest kinematics was also conducted as shown in Fig. 6.
Uniform- and linear-extrapolation techniques, which are popular empirical wave kinematic models
above MWL (Longridge et al. 1996), are selected to obtain more realistic representation of wave
kinematics above MWL. In addition, no extrapolation case is also added to see the effect of the
wave crest kinematics above MWL. The wave kinematics obtained from both techniques are
applied to the Morison equation for the moving body, and the drag forces on Morison members
were evaluated accordingly at the instantaneous body position and up to the instantaneous
free-surface elevation at every internal time step. The velocities are squared in computing the drag
force as Eq. (7), thus the different wave-kinematics-extrapolation techniques can make appreciable
differences in the motion results, especially in slowly varying surge motions
𝐹𝑑 =1
2 𝜌 𝐶𝑑 𝐴 (𝑢 − 𝑣) |𝑢 − 𝑣| (7)
where u and v are wave velocity and body velocity respectively, A is projcted area, and Cd is drag
coefficient.
For illustration, surge drag coefficient for the cylindrical columns 1.6 and heave drag
coefficient for the column footing 3.2 were selected. Those drag coefficients were decided from
the comparison between numerical and experimental free-decay tests, as shown in Kim and Kim
(2015). Fig. 6 shows the mentioned two extrapolation methods. In the case of surge, the slowly
varing motions are equally or more important than wave-frequency motions although there is no
incident wave energy at that low frequency. The low-frequency motions are caused by nonlinear
wave excitations including the diffrence-frequency second-order wave forces. The extrapolation of
the wave kinematics has appreciable effect on the slowly varing surge motions. When the
extrapolation above MWL is not applied, the resulting slowly varying surge response is
under-estiamted compared to the experimental values. However, when the uniform or linear
extrapolation is applied, the surge spectrum is much closer to the experimental surge spectrum.
When the linear extrapolation is applied, the simulated surge spectrum (or surge standard deviation)
best matches with the measured one. However, when surge mean offset is considered, the uniform
extrapolation method gives better comparison against experimental value, as can be seen in Table
7. In this regard, from this point on, uniform extrapolation method is adopted.
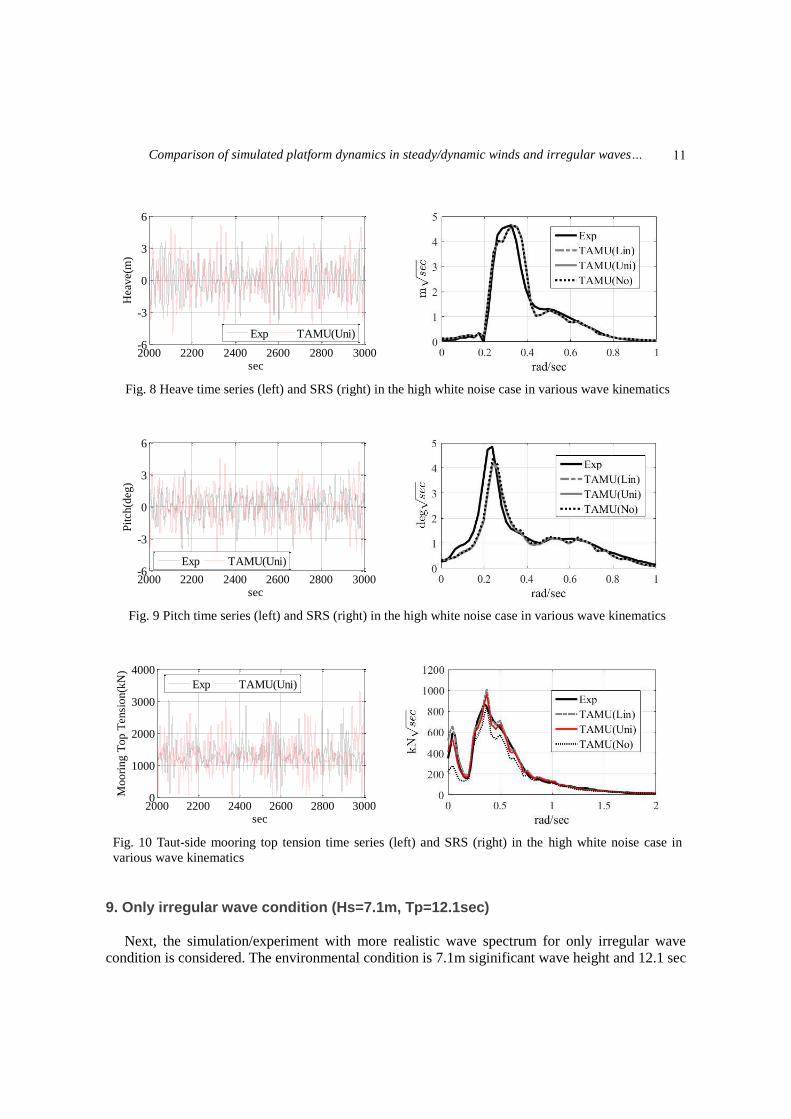
In the case of pitch, the pitch spectrum in the simulation is slightly under-estimated compared
to the measurement pitch data near the peak. It may be caused by higher crest and shallower
trough of experimentally generated waves, as shown in Table 5. Nevertheless, the overall trend is
very similar between the measurement and numerical prediction. The mean pitch is slightly
overpredicted by the simulation. As a matter of fact, it is almost impossible to have an intially
perfect vertical position of the model in the experiment due to complex cable arrangment. Also,
under the ideal model set-up, the sway and roll are supposed to be zeros in head waves but they
were not negligible in the model test, which may also contribute to the differences.
In the case of heave, unlike the surge case, the first-order wave-frequency motions are
dominant over the second-order slowly-varying motions and there is generally good agreement
between the simualtion and experiment including the peak magnitude. Heave natural frequency is
located at 0.36rad/sec as shown in Table 6. The heave damping mostly comes from the column
footing and it was modeled by a disk Morison member at its mid position. Its admping coefficient
8
Comparison of simulated platform dynamics in steady/dynamic winds and irregular waves…
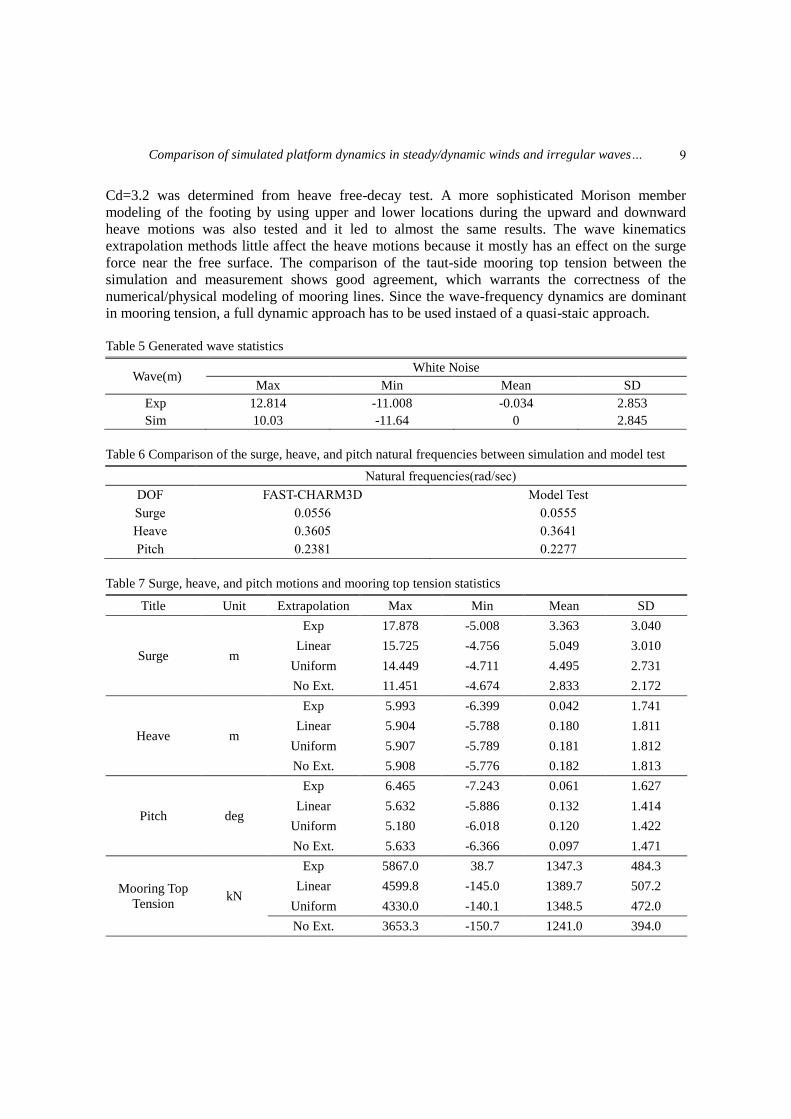
Cd=3.2 was determined from heave free-decay test. A more sophisticated Morison member
modeling of the footing by using upper and lower locations during the upward and downward
heave motions was also tested and it led to almost the same results. The wave kinematics
extrapolation methods little affect the heave motions because it mostly has an effect on the surge
force near the free surface. The comparison of the taut-side mooring top tension between the
simulation and measurement shows good agreement, which warrants the correctness of the
numerical/physical modeling of mooring lines. Since the wave-frequency dynamics are dominant
in mooring tension, a full dynamic approach has to be used instaed of a quasi-staic approach.
Table 5 Generated wave statistics
Wave(m) White Noise
Max Min Mean SD
Exp 12.814 -11.008 -0.034 2.853
Sim 10.03 -11.64 0 2.845
Table 6 Comparison of the surge, heave, and pitch natural frequencies between simulation and model test
Natural frequencies(rad/sec)
DOF FAST-CHARM3D Model Test
Surge 0.0556 0.0555
Heave 0.3605 0.3641
Pitch 0.2381 0.2277
Table 7 Surge, heave, and pitch motions and mooring top tension statistics
Title Unit Extrapolation Max Min Mean SD
Surge m
Exp 17.878 -5.008 3.363 3.040
Linear 15.725 -4.756 5.049 3.010
Uniform 14.449 -4.711 4.495 2.731
No Ext. 11.451 -4.674 2.833 2.172
Heave m
Exp 5.993 -6.399 0.042 1.741
Linear 5.904 -5.788 0.180 1.811
Uniform 5.907 -5.789 0.181 1.812
No Ext. 5.908 -5.776 0.182 1.813
Pitch deg
Exp 6.465 -7.243 0.061 1.627
Linear 5.632 -5.886 0.132 1.414
Uniform 5.180 -6.018 0.120 1.422
No Ext. 5.633 -6.366 0.097 1.471
Mooring Top
Tension kN
Exp 5867.0 38.7 1347.3 484.3
Linear 4599.8 -145.0 1389.7 507.2
Uniform 4330.0 -140.1 1348.5 472.0
No Ext. 3653.3 -150.7 1241.0 394.0
9
H.C. Kim and M.H. Kim
Fig. 5 High white noise wave spectrum
Fig. 6 Uniform and linear wave crest kinematics
Fig. 7 Surge time series (left) and square root of spectra(SRS) (right) in the high white noise case in
various wave kinematics
2000 2200 2400 2600 2800 3000-5
0
5
10
15
sec
Su
rge(
m)
Exp TAMU(Uni)
10
Comparison of simulated platform dynamics in steady/dynamic winds and irregular waves…
Fig. 8 Heave time series (left) and SRS (right) in the high white noise case in various wave kinematics
Fig. 9 Pitch time series (left) and SRS (right) in the high white noise case in various wave kinematics
Fig. 10 Taut-side mooring top tension time series (left) and SRS (right) in the high white noise case in
various wave kinematics
9. Only irregular wave condition (Hs=7.1m, Tp=12.1sec)
Next, the simulation/experiment with more realistic wave spectrum for only irregular wave
condition is considered. The environmental condition is 7.1m siginificant wave height and 12.1 sec
2000 2200 2400 2600 2800 3000-6
-3
0
3
6
sec
Hea
ve(
m)
Exp TAMU(Uni)
2000 2200 2400 2600 2800 3000-6
-3
0
3
6
sec
Pit
ch(d
eg)
Exp TAMU(Uni)
2000 2200 2400 2600 2800 30000
1000
2000
3000
4000
sec
Moori
ng T
op T
ensi
on(k
N)
Exp TAMU(Uni)
11
H.C. Kim and M.H. Kim
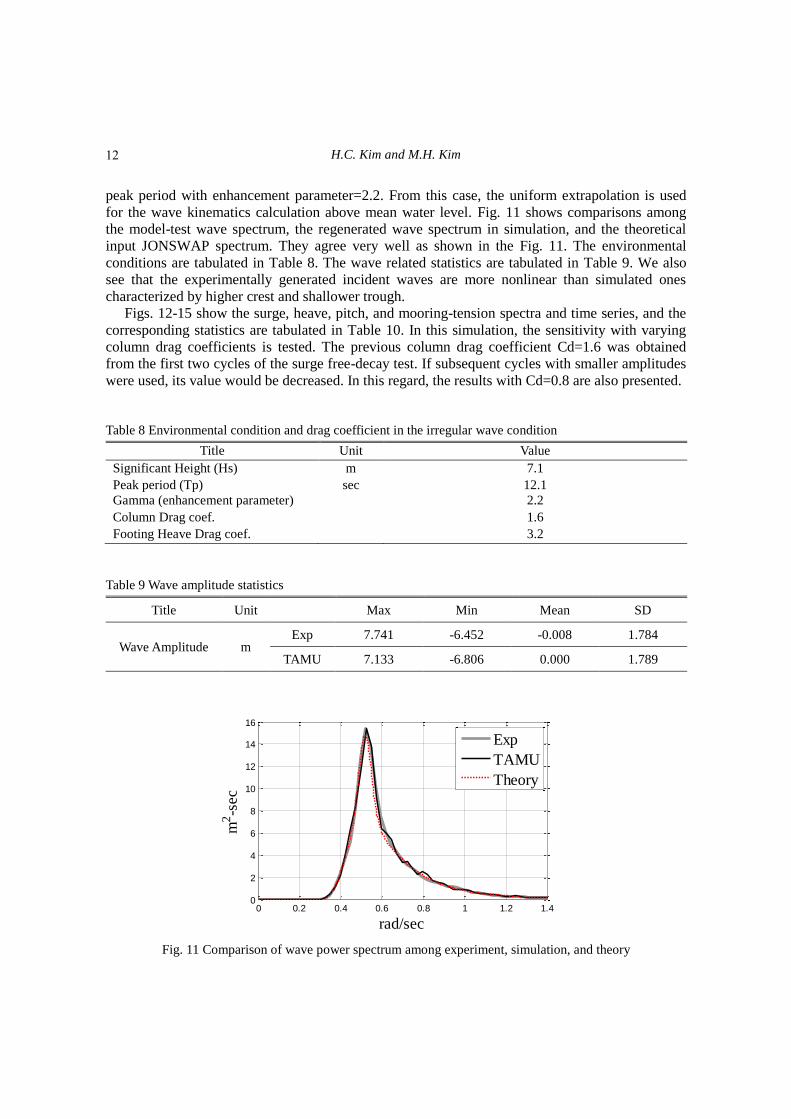
peak period with enhancement parameter=2.2. From this case, the uniform extrapolation is used
for the wave kinematics calculation above mean water level. Fig. 11 shows comparisons among
the model-test wave spectrum, the regenerated wave spectrum in simulation, and the theoretical
input JONSWAP spectrum. They agree very well as shown in the Fig. 11. The environmental
conditions are tabulated in Table 8. The wave related statistics are tabulated in Table 9. We also
see that the experimentally generated incident waves are more nonlinear than simulated ones
characterized by higher crest and shallower trough.
Figs. 12-15 show the surge, heave, pitch, and mooring-tension spectra and time series, and the
corresponding statistics are tabulated in Table 10. In this simulation, the sensitivity with varying
column drag coefficients is tested. The previous column drag coefficient Cd=1.6 was obtained
from the first two cycles of the surge free-decay test. If subsequent cycles with smaller amplitudes
were used, its value would be decreased. In this regard, the results with Cd=0.8 are also presented.
Table 8 Environmental condition and drag coefficient in the irregular wave condition
Title Unit Value
Significant Height (Hs) m 7.1
Peak period (Tp) sec 12.1
Gamma (enhancement parameter) 2.2
Column Drag coef. 1.6
Footing Heave Drag coef. 3.2
Table 9 Wave amplitude statistics
Title Unit Max Min Mean SD
Wave Amplitude m Exp 7.741 -6.452 -0.008 1.784
TAMU 7.133 -6.806 0.000 1.789
Fig. 11 Comparison of wave power spectrum among experiment, simulation, and theory
0 0.2 0.4 0.6 0.8 1 1.2 1.40
2
4
6
8
10
12
14
16
m2-s
ec
rad/sec
Exp
TAMU
Theory
12
Comparison of simulated platform dynamics in steady/dynamic winds and irregular waves…
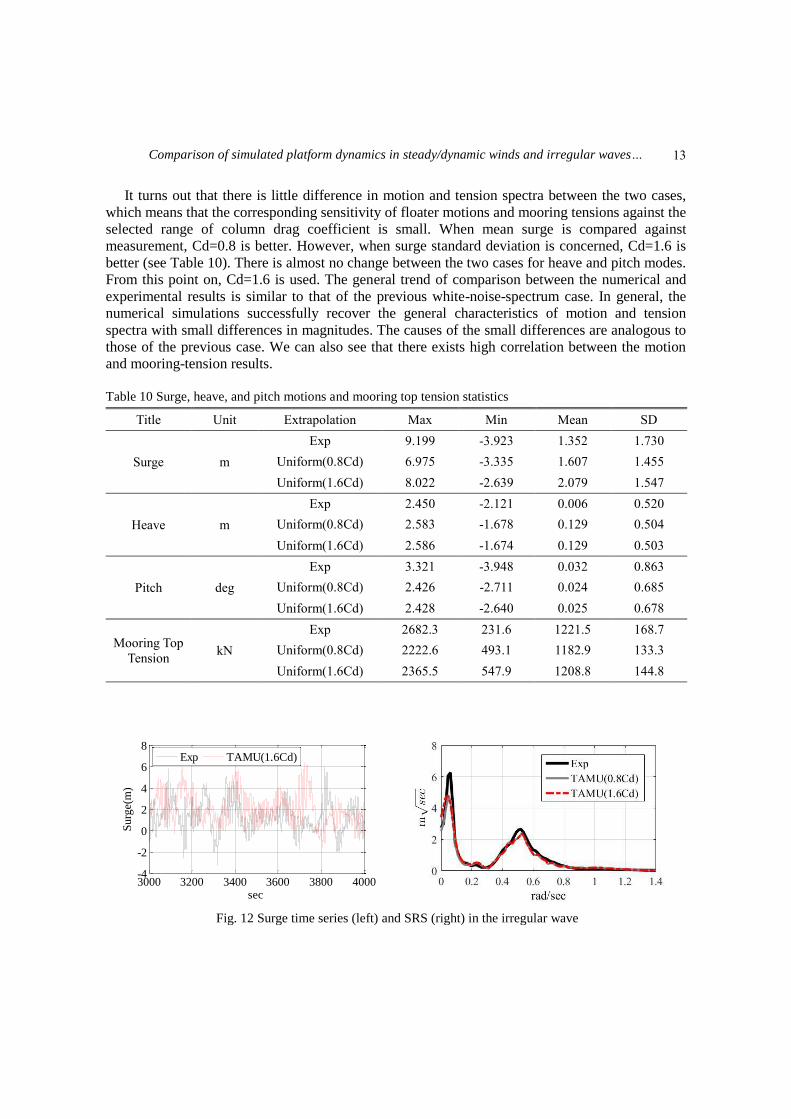
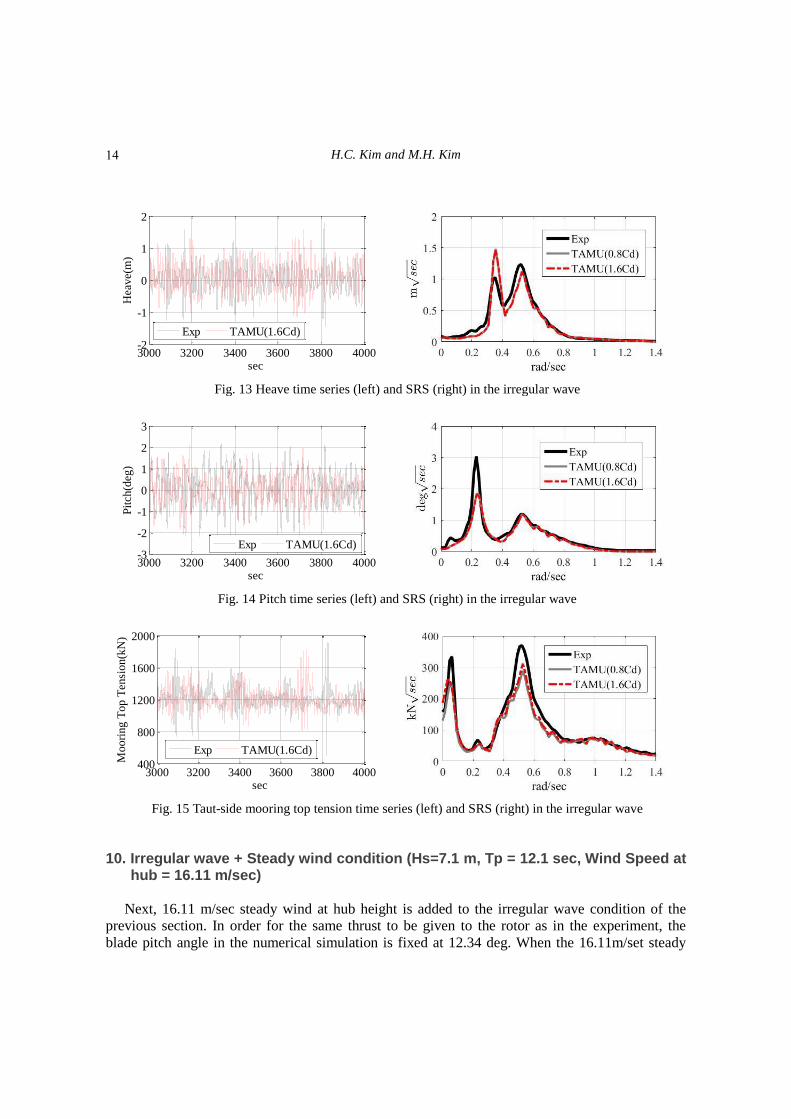
It turns out that there is little difference in motion and tension spectra between the two cases,
which means that the corresponding sensitivity of floater motions and mooring tensions against the
selected range of column drag coefficient is small. When mean surge is compared against
measurement, Cd=0.8 is better. However, when surge standard deviation is concerned, Cd=1.6 is
better (see Table 10). There is almost no change between the two cases for heave and pitch modes.
From this point on, Cd=1.6 is used. The general trend of comparison between the numerical and
experimental results is similar to that of the previous white-noise-spectrum case. In general, the
numerical simulations successfully recover the general characteristics of motion and tension
spectra with small differences in magnitudes. The causes of the small differences are analogous to
those of the previous case. We can also see that there exists high correlation between the motion
and mooring-tension results.
Table 10 Surge, heave, and pitch motions and mooring top tension statistics
Title Unit Extrapolation Max Min Mean SD
Surge m
Exp 9.199 -3.923 1.352 1.730
Uniform(0.8Cd) 6.975 -3.335 1.607 1.455
Uniform(1.6Cd) 8.022 -2.639 2.079 1.547
Heave m
Exp 2.450 -2.121 0.006 0.520
Uniform(0.8Cd) 2.583 -1.678 0.129 0.504
Uniform(1.6Cd) 2.586 -1.674 0.129 0.503
Pitch deg
Exp 3.321 -3.948 0.032 0.863
Uniform(0.8Cd) 2.426 -2.711 0.024 0.685
Uniform(1.6Cd) 2.428 -2.640 0.025 0.678
Mooring Top
Tension kN
Exp 2682.3 231.6 1221.5 168.7
Uniform(0.8Cd) 2222.6 493.1 1182.9 133.3
Uniform(1.6Cd) 2365.5 547.9 1208.8 144.8
Fig. 12 Surge time series (left) and SRS (right) in the irregular wave
3000 3200 3400 3600 3800 4000-4
-2
0
2
4
6
8
sec
Surg
e(m
)
Exp TAMU(1.6Cd)
13
H.C. Kim and M.H. Kim
Fig. 13 Heave time series (left) and SRS (right) in the irregular wave
Fig. 14 Pitch time series (left) and SRS (right) in the irregular wave
Fig. 15 Taut-side mooring top tension time series (left) and SRS (right) in the irregular wave
10. Irregular wave + Steady wind condition (Hs=7.1 m, Tp = 12.1 sec, Wind Speed at hub = 16.11 m/sec)
Next, 16.11 m/sec steady wind at hub height is added to the irregular wave condition of the
previous section. In order for the same thrust to be given to the rotor as in the experiment, the
blade pitch angle in the numerical simulation is fixed at 12.34 deg. When the 16.11m/set steady
3000 3200 3400 3600 3800 4000-2
-1
0
1
2
sec
Hea
ve(
m)
Exp TAMU(1.6Cd)
3000 3200 3400 3600 3800 4000-3
-2
-1
0
1
2
3
sec
Pit
ch(d
eg)
Exp TAMU(1.6Cd)
3000 3200 3400 3600 3800 4000400
800
1200
1600
2000
sec
Moori
ng T
op T
ensi
on(k
N)
Exp TAMU(1.6Cd)
14
Comparison of simulated platform dynamics in steady/dynamic winds and irregular waves…
speed is given, the calculated thrust is 382.0kN, which is almost the same as the measured thrust of
381.7kN converted to the full scale in the model test. When only the steady wind is given
excluding the wave, the surge and pitch offsets, taut-side mooring top tension, and fore-aft tower
base bending moment are slightly smaller than the measurement values. Their differences are
small as shown in Table 11, which shows that the steady-wind effect is reasonably modeled in the
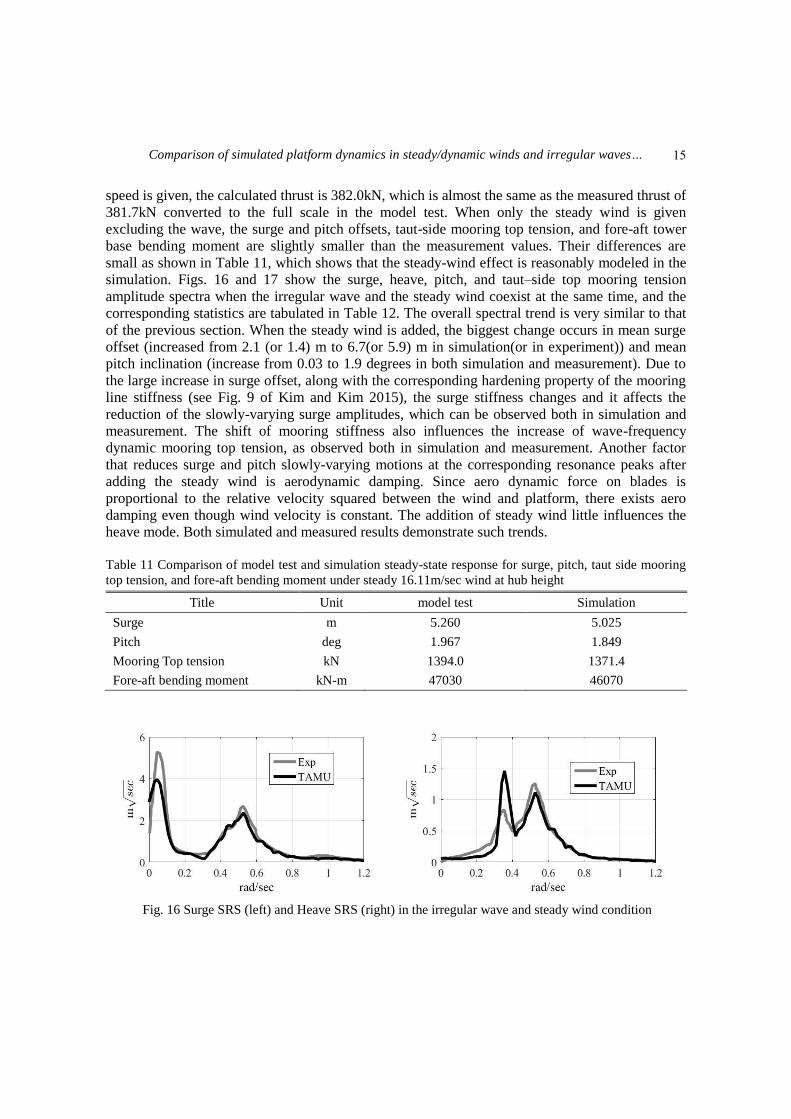
simulation. Figs. 16 and 17 show the surge, heave, pitch, and taut–side top mooring tension
amplitude spectra when the irregular wave and the steady wind coexist at the same time, and the
corresponding statistics are tabulated in Table 12. The overall spectral trend is very similar to that
of the previous section. When the steady wind is added, the biggest change occurs in mean surge
offset (increased from 2.1 (or 1.4) m to 6.7(or 5.9) m in simulation(or in experiment)) and mean
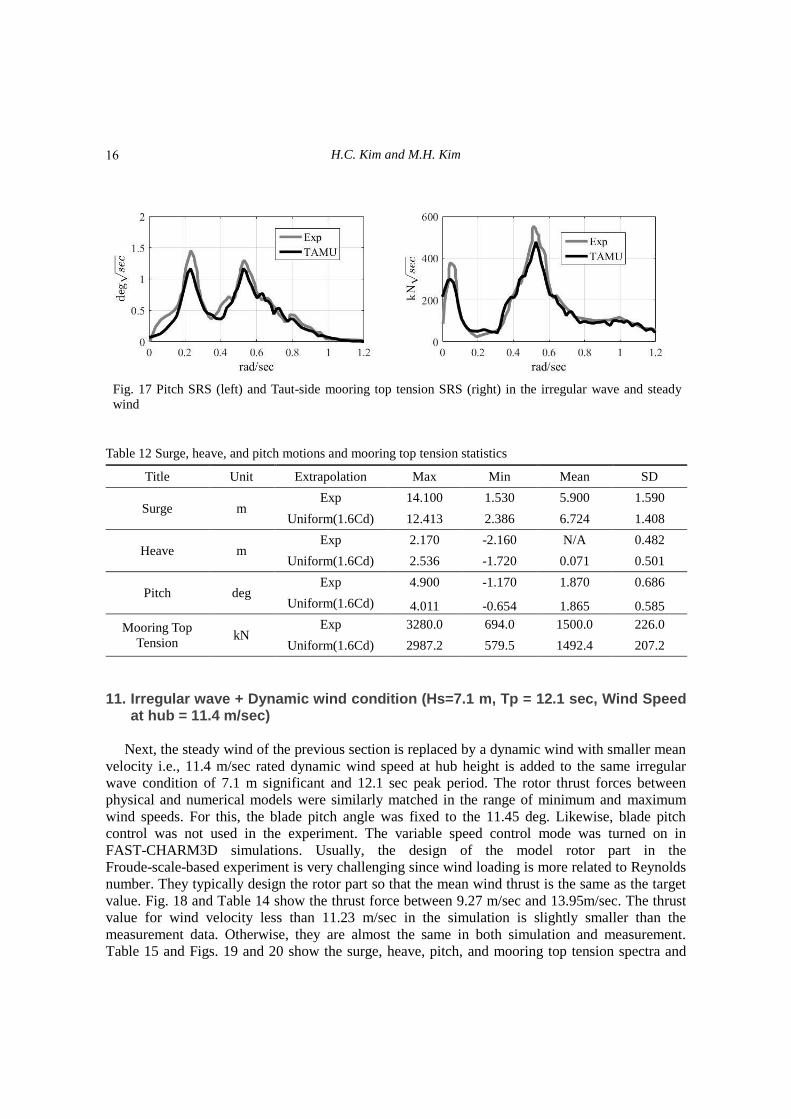
pitch inclination (increase from 0.03 to 1.9 degrees in both simulation and measurement). Due to
the large increase in surge offset, along with the corresponding hardening property of the mooring
line stiffness (see Fig. 9 of Kim and Kim 2015), the surge stiffness changes and it affects the
reduction of the slowly-varying surge amplitudes, which can be observed both in simulation and
measurement. The shift of mooring stiffness also influences the increase of wave-frequency
dynamic mooring top tension, as observed both in simulation and measurement. Another factor
that reduces surge and pitch slowly-varying motions at the corresponding resonance peaks after
adding the steady wind is aerodynamic damping. Since aero dynamic force on blades is
proportional to the relative velocity squared between the wind and platform, there exists aero
damping even though wind velocity is constant. The addition of steady wind little influences the
heave mode. Both simulated and measured results demonstrate such trends.
Table 11 Comparison of model test and simulation steady-state response for surge, pitch, taut side mooring
top tension, and fore-aft bending moment under steady 16.11m/sec wind at hub height
Title Unit model test Simulation
Surge m 5.260 5.025
Pitch deg 1.967 1.849
Mooring Top tension kN 1394.0 1371.4
Fore-aft bending moment kN-m 47030 46070
Fig. 16 Surge SRS (left) and Heave SRS (right) in the irregular wave and steady wind condition
15
H.C. Kim and M.H. Kim
Fig. 17 Pitch SRS (left) and Taut-side mooring top tension SRS (right) in the irregular wave and steady
wind
Table 12 Surge, heave, and pitch motions and mooring top tension statistics
Title Unit Extrapolation Max Min Mean SD
Surge m Exp 14.100 1.530 5.900 1.590
Uniform(1.6Cd) 12.413 2.386 6.724 1.408
Heave m Exp 2.170 -2.160 N/A 0.482
Uniform(1.6Cd) 2.536 -1.720 0.071 0.501
Pitch deg Exp 4.900 -1.170 1.870 0.686
Uniform(1.6Cd) 4.011 -0.654 1.865 0.585
Mooring Top
Tension kN
Exp 3280.0 694.0 1500.0 226.0
Uniform(1.6Cd) 2987.2 579.5 1492.4 207.2
11. Irregular wave + Dynamic wind condition (Hs=7.1 m, Tp = 12.1 sec, Wind Speed at hub = 11.4 m/sec)
Next, the steady wind of the previous section is replaced by a dynamic wind with smaller mean
velocity i.e., 11.4 m/sec rated dynamic wind speed at hub height is added to the same irregular
wave condition of 7.1 m significant and 12.1 sec peak period. The rotor thrust forces between
physical and numerical models were similarly matched in the range of minimum and maximum
wind speeds. For this, the blade pitch angle was fixed to the 11.45 deg. Likewise, blade pitch
control was not used in the experiment. The variable speed control mode was turned on in
FAST-CHARM3D simulations. Usually, the design of the model rotor part in the
Froude-scale-based experiment is very challenging since wind loading is more related to Reynolds
number. They typically design the rotor part so that the mean wind thrust is the same as the target
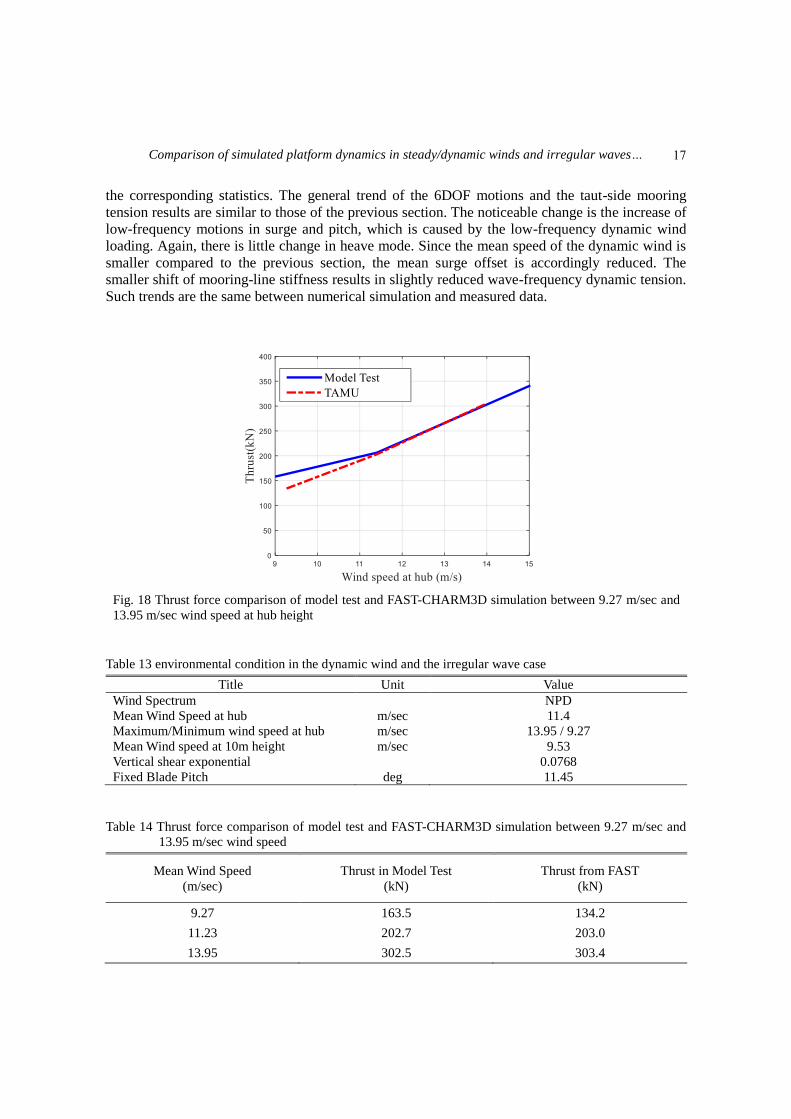
value. Fig. 18 and Table 14 show the thrust force between 9.27 m/sec and 13.95m/sec. The thrust
value for wind velocity less than 11.23 m/sec in the simulation is slightly smaller than the
measurement data. Otherwise, they are almost the same in both simulation and measurement.
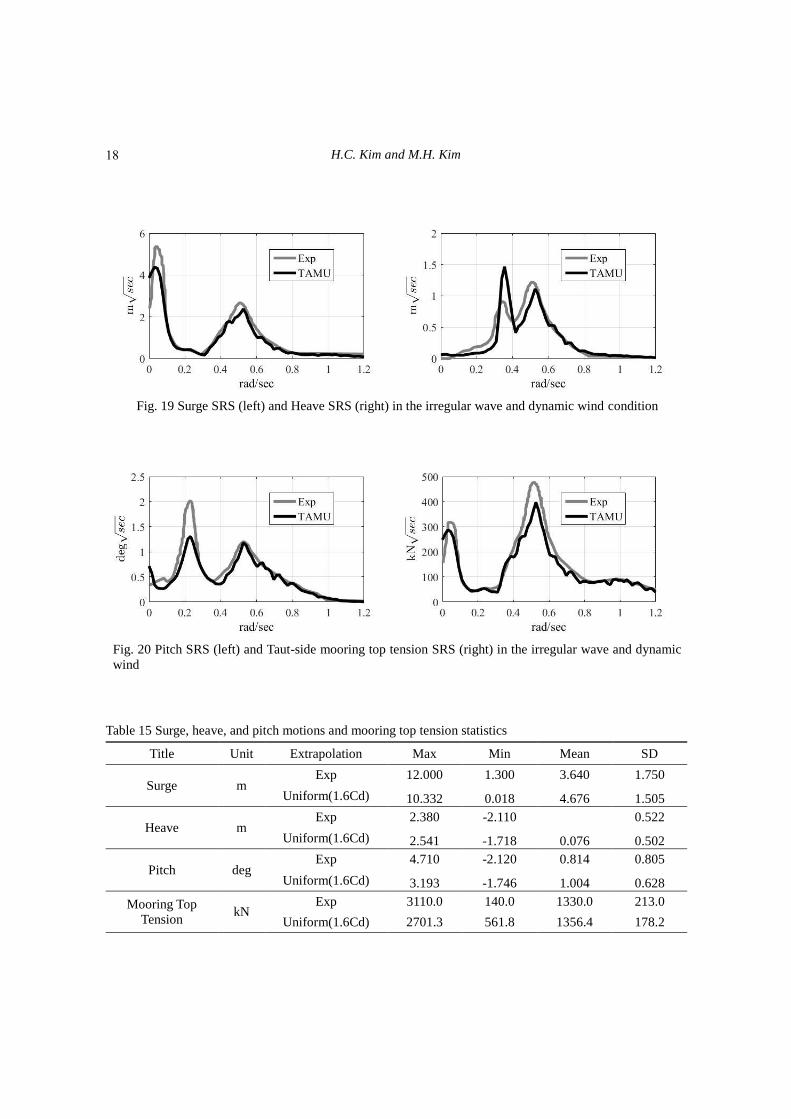
Table 15 and Figs. 19 and 20 show the surge, heave, pitch, and mooring top tension spectra and
16
Comparison of simulated platform dynamics in steady/dynamic winds and irregular waves…
the corresponding statistics. The general trend of the 6DOF motions and the taut-side mooring
tension results are similar to those of the previous section. The noticeable change is the increase of
low-frequency motions in surge and pitch, which is caused by the low-frequency dynamic wind
loading. Again, there is little change in heave mode. Since the mean speed of the dynamic wind is
smaller compared to the previous section, the mean surge offset is accordingly reduced. The
smaller shift of mooring-line stiffness results in slightly reduced wave-frequency dynamic tension.
Such trends are the same between numerical simulation and measured data.
Fig. 18 Thrust force comparison of model test and FAST-CHARM3D simulation between 9.27 m/sec and
13.95 m/sec wind speed at hub height
Table 13 environmental condition in the dynamic wind and the irregular wave case
Title Unit Value
Wind Spectrum NPD
Mean Wind Speed at hub m/sec 11.4
Maximum/Minimum wind speed at hub m/sec 13.95 / 9.27
Mean Wind speed at 10m height m/sec 9.53
Vertical shear exponential 0.0768
Fixed Blade Pitch deg 11.45
Table 14 Thrust force comparison of model test and FAST-CHARM3D simulation between 9.27 m/sec and
13.95 m/sec wind speed
Mean Wind Speed
(m/sec)
Thrust in Model Test
(kN)
Thrust from FAST
(kN)
9.27 163.5 134.2
11.23 202.7 203.0
13.95 302.5 303.4
17
H.C. Kim and M.H. Kim
Fig. 19 Surge SRS (left) and Heave SRS (right) in the irregular wave and dynamic wind condition
Fig. 20 Pitch SRS (left) and Taut-side mooring top tension SRS (right) in the irregular wave and dynamic
wind
Table 15 Surge, heave, and pitch motions and mooring top tension statistics
Title Unit Extrapolation Max Min Mean SD
Surge m Exp 12.000 1.300 3.640 1.750
Uniform(1.6Cd) 10.332 0.018 4.676 1.505
Heave m Exp 2.380 -2.110 0.522
Uniform(1.6Cd) 2.541 -1.718 0.076 0.502
Pitch deg Exp 4.710 -2.120 0.814 0.805
Uniform(1.6Cd) 3.193 -1.746 1.004 0.628
Mooring Top
Tension kN
Exp 3110.0 140.0 1330.0 213.0
Uniform(1.6Cd) 2701.3 561.8 1356.4 178.2
18
Comparison of simulated platform dynamics in steady/dynamic winds and irregular waves…
12. Conclusions
The global performance of the 5MW OC4 semisubmersible floating wind turbine was
numerically simulated by using the turbine-floater-mooring fully coupled dynamic analysis
program FAST-CHARM3D in time domain. As ocean environments, irregular waves with
white-noise and JOSWAP spectrum with and without steady/dynamic winds are considered. The
potential-theory-based first- and second-order hydrodynamics results including complete QTFs
were calculated through WAMIT in the frequency domain, which were subsequently used in the
time-domain simulations. The rotor thrust force generated by the wind in the simulation was
matched to that from the model test by adjusting blade pitch angle. The surge, heave, and pitch
motions and taut-side mooring top tension results were systematically compared against the
corresponding experiment. In the simulation, all the second-order diffraction effects were included.
Additionally, in order to see the effects of wave crest kinematics above MWL, the linear and
uniform extrapolation methods were used. They were also compared with no-extrapolation case
and the differences among them were discussed. Another sensitivity with column drag coefficient
was also tested, which is mostly related to the mean and slowly-varying surge responses. The
heave and pitch dynamic motions were little affected by either the wave kinematics extrapolation
or column drag coefficient. When steady wind was added to the irregular waves, mean surge and
pitch were significantly increased. In particular, large surge offset increased the mooring stiffness
so that it could subsequently change motion and mooring dynamics. When dynamic wind was
added to the irregular waves, it additionally introduced low-frequency wind loading. The presence
of wind also introduced aerodynamic damping. Those numerical-simulation results had good
correlation with experimental results for all the cases considered.
Acknowledgments
The present work is a result of the project “Development of the design technologies for a
10MW class wave and offshore wind hybrid power generation system” granted by the Korea
Ministry of Oceans and Fisheries. The work is also partially supported by ABS and POSCO. All
support is gratefully acknowledged.
References Bae, Y.H. and Kim, M.H. (2011), “Rotor-floater-mooring coupled dynamic analysis of
mono-column-TLP-type FOWT (Floating Offshore Wind Turbine)”, Ocean Syst. Eng., 1(1), 93-109.
Bae, Y.H., Kim, M.H. (2014), “Coupled dynamic analysis of multiple wind turbines on a large single
floater”, Ocean Eng., 92, 175-187.
Bae, Y.H. and Kim, M.H. (2014), “Influence of control strategy to FOWT global performance by
aero-elastic-control-floater-mooring coupled dynamic analysis”, J. Ocean Wind Energy, 1(1), 50-58.
Coulling, A.J., Goupee, A.J., Robertson, A.N., Jonkman, J.M. and Dagher, H.J. (2013), “Validation of a
FAST semi-submersible floating wind turbine numerical model with DeepCwind test data”, J. Renew.
Sust. Energy, 5.
Coulling, A.J., Goupee, A.J., Robertson, A.N. and Jonkman, J.M. (2013), “Importance of second-order
difference-frequency wave-diffraction forces in the validation of a fast semi-submersible floating wind
turbine model”, Proceedings of the 32th (2013) International Conference on Ocean, Offshore and Arctic
19
H.C. Kim and M.H. Kim
Engineering Nantes, France.
Coulling A.J., Goupee A.J., Robertson, A.N., Jonkman, J.M., Dagher, H.J. (2013),“Validation of a FAST
semisubmersible floating wind turbine model with DeepCwind test data”, J. Renew. Sust. Energ, in
review 2013.
Henderson, A.R., Leutz, R. and Fujii, T. (2002), “Potential for floating offshore wind energy in Japanese
waters”, Proceedings of the 12th (2002) International Offshore and Polar Engineering Conference,
Kitakyushu, Japan.
Henderson, A.R., Zaaijer, M., Bulder, B., Pierik, J., Huijsmans, R., Van Hees, M., Snijders, E., Wijnants,
G.H. and Wolf, M.J. (2004), “Floating windfarms for shallow offshore sites”, Proceedings of the 14th
(2004) International Offshore and Polar Engineering Conference, Toulon, France.
Jonkman, J.M. and Buhl Jr, M.L. (2004), FAST user’s guide, National Renewable Energy Laboratory, Rept.
NREL/EL-500–29798, Golden, Colorado.
Jonkman, J.M., Butterfield, S., Musial, W. and Scott, G. (2007), Definition of a 5-MW Reference Wind
Turbine for Offshore System Development, NREL Technical Report No. TP-500-38060.
Kang, H.Y. and Kim, M.H. (2012), “Hydrodynamic interactions and coupled dynamics between a container
ship and multiple mobile harbors”, Ocean Syst. Eng., 2(3), 217-228.
Kim, H.C. and Kim, M.H. (2015), “Global performances of a semi-submersible 5MW wind-turbine
including second-order wave-diffraction effects”, Ocean Syst. Eng., 5(3), 139-160.
Kim, M.H., Ran, Z. and Zheng, W. (2001), “Hull/mooring coupled dynamic analysis of a truss spar in time
domain”, Int. J. Offshore Polar., 11(1), 42-54.
Kim, M.H. and Yue, D.K.P. (1991), “Sum- and difference-frequency wave loads on a body in unidirectional
Gaussian seas”, J. Ship Res., 35, 127-140.
Kim, M.H. and Yue, D.K.P. (1989), “The complete second-order diffraction solution for an axisymmetric
body. Part 1. Monochromatic incident waves”, J, Fluid Mech., 200, 235-264.
Kim, M.H. and Yue, D.K.P. (1990), “The complete second-order diffraction solution for an axisymmetric
body. Part 2. Bichromatic incident waves and body motions”, J. Fluid Mech., 211, 557-593.
Koo, B.J., Goupee, A.J., Kimball, R.W. and Lambrakos, K.F. (2014a), “Model tests for a floating wind
turbine on three different floaters”, J. Offshore Mech. Arct.., 136(2), 021904.
Koo, B.J., Goupee, A.J., Lambrakos, K. and Lim, H.J. (2014b), “Model test data correlations with fully
coupled hull/mooring analysis for a floating wind turbine on a semi-submersible platform”, Proceedings
of the 33th (2014) International Conference on Ocean, Offshore and Arctic Engineering, San Francisco,
USA.
Longridge, J. K., Randall, R. E., and Zhang, J. (1996), “Comparison of experimental irregular water wave
elevation and kinematic data with new hybrid wave model predictions”, Ocean Eng., 23(4), 277-307.
Masciola, M., Robertson, A.N., Jonkman, J.M., Alexander Coulling, A.J. and Goupee, A.J. (2013),
“Assessment of the importance of mooring dynamics on the global response of the deepCwind floating
semisubmersible offshore wind turbine”, The International Society of Offshore and Polar Engineers.
Musial, W.D., Butterfield, S. and Boone, A. (2004), Feasibility of floating platform systems for wind
turbines, Paper presented at the 4second AIAA Aerospace Sciences Meeting and Exhibit, Reno, NV.
Robertson, A., Jonkman, J., Vorpahl, F., Popko,W., Qvist, J., Frøyd, L., Chen, X., Azcona, J., Uzunoglu, E.,
Guedes Soares, C., Luan, C., Yutong, H., Pengcheng, F., Yde, A., Larsen, T., Nichols, J., Buils, R., Lei,
L., Anders Nygard, T., Manolas, D., Heege, A., Ringdalen Vatne, S., Ormberg, H., Duarte, T., Godreau,
C., Fabricius Hansen, H., Wedel Nielsen, A., Riber, H., Le Cunff, C., Abele, R., Beyer, F., Yamaguchi, A.,
Jin Jung, K., Shin, H., Shi, W., Park, H., Alves, M. and Guérinel, M. (2014), “Offshore code comparison
collaboration continuation within IEA wind task 30: phase II results regarding a floating semisubmersible
wind system”, Proceedings of the 33th (2014) International Conference on Ocean, Offshore and Arctic
Engineering, San Francisco, USA.
Roddier D., Cermelli C., Aubault, A. and Weinstein A. (2010), “WindFloat: A floating foundation for
offshore wind turbines”, J. Renew. Sust. Energy, 2.
Tahar, A. and Kim, M.H. (2003), “Hull/mooring/riser coupled dynamic analysis and sensitivity study of a
tanker-based FPSO”, J. Appl. Ocean Res., 25(6), 367-382.
20

Comparison of simulated platform dynamics in steady/dynamic winds and irregular waves…
Tong, K.C. (1998), “Technical and economic aspects of a floating offshore wind farm”, J. Wind Eng. Ind.
Aerod., 74-76, 399-410.
Wayman, E.N., Sclavounos, P.D., Butterfield, S., Jonkman, J. and Musial, W. (2006), “Coupled dynamic
modeling of floating wind turbine systems”, Proceedings of the Offshore Technology Conference,
Houston, TX.
Yang, C.K. and Kim, M.H. (2010), “Transient effects of tendon disconnection of a TLP by hull-tendon-riser
coupled dynamic analysis”, Ocean Eng., 37(8-9), 667-677.
Zhao, W. and Wan, D. (2015), “Numerical study of interactions between phase ii of oc4 wind turbine and its
semi-submersible floating support system”, J. Ocean Wind Energy, 2(1), 45-53.
21