Embed Size (px)
Citation preview
Comparison of Regions of Interest Segmented from MRI and Histology in a Rabbit Model of IVD Disc Degeneration
1Bae, WC; 1He, J; 1,2Yamaguchi, T; 2Inoue, N; +1Masuda, K +1University of California-San Diego, La Jolla, CA; 2Doshisha University, Kyoto, Japan
[email protected] INTRODUCTION: Animal models1, 2 are useful for evaluating the efficacy of therapeutic intervention of intervertebral disc (IVD) repair. In many studies, MRI is often used to assess disc morphology and MR properties such as T2 values.3 Such MR measures benefit from accurate segmentation of regions of interest (ROI) in the anulus fibrosi (AF) and the nucleus pulposi (NP). This can be difficult because the MR appearance of the IVD varies with scanning parameters. It would be useful to determine accuracy of MRI segmentation by comparing it with a reference standard, such as histology, which provides better delineation between the NP, AF, and other structures, as well as a higher spatial resolution afforded by light microscopy. Thus, the objective of this study was to quantitatively compare ROI segmented from MRI to those from histology, in a rabbit model of IVD degeneration using anular puncture. METHODS: Samples − With IACUC approval, New Zealand White rabbits (n = 7, ~3 kg and 9 mo old) were obtained. Using an 18G needle device,1 the anulus fibrosus (AF) was punctured 5 mm deep in the ventral aspect into the nucleus pulposus (NP) at the L2/3 and L4/5 levels. The unpunctured L3/4 served as a control. After 4 wks, 30 µl of sterile saline was injected into the center of the NP at the punctured levels. Animals were sacrificed at wk 16. MRI & Segmentation – Immediately after sacrifice, lumbar spine segments were harvested and imaged on the same day, using a 3T GE Signa HDx with a 3" birdcage coil. T2-weighted images (Fig. 1AB) in the mid-sagittal plane were obtained using a multi-echo fast spin echo sequence: TR = 2000 ms; TE = 10~80 ms (8 TEs); matrix = 512x512 (resized to 2048x2048, or ~39 µm per pixel, to facilitate segmentation); FOV = 80 mm; and slice = 2 mm. AF and NP were segmented using Adobe Photoshop. The image from the first TE~10 ms (Fig. 1A) was used to draw the boundary of the AF. Superior and inferior margins were distinguishable due to dark bony endplates and the high intensity of the AF. The posterior margin was defined by the high intensity of the spinal cord. The anterior margin was defined by the low signal intensity bands of the AF. The image from the last TE~80 ms (Fig. 1B) was used to draw the boundary of the NP, which appears as the brightest structure. Histology & Segmentation – Spines were fixed in 10% formalin, decalcified in Cal-Ex II (Fisher), paraffin sectioned sagittally, and stained with Safranin-O and fast green. Slides were scanned digitally, and a micrograph of each disc (Fig. 1C) was exported as a digital image with spatial resolution of ~5 µm per pixel. Using Adobe Photoshop, boundaries of the AF and NP were drawn (Fig. 1C) and exported separately. Image Registration – ROI from MRI and histology were registered using a custom Matlab program with an Image Registration toolbox.4 Histology ROI was first resized to match the resolution of the MRI ROI, and a rigid body registration minimizing squared sum of pixel difference5 was performed to align the ROI. (This was performed separately for the AF and NP.) Image Analyses – After registration (Fig. 2), the area of individual ROI, as well as mismatched regions (Fig. 2AB), were determined. In addition, to quantify local deviation of ROI, each ROI was converted to a set of x-y coordinates, and the nearest distance from every point along the MRI ROI to histology ROI was determined (Fig. 2CD). From these, the Area Ratio (MRI ROI area divided by histology ROI area; Fig. 3A), Mismatch Area (as a % of histology ROI area; Fig. 3B), and root mean squared (RMS) deviation (Fig. 3C) were determined. Statistics – Using repeated measures ANOVA, effects of level (L2/3, L3/4, L4/5) and region (AF, NP) on the above measures were determined. RESULTS: The area of AF ranged from ~10 mm2 (at L2/3) to 13 mm2 (at L4/5) using either MRI or histology methods. In contrast, the area of the NP was higher at the control level (L3/4) than the puncture levels (p<0.05), and for the MRI method than the histology method (p<0.001). MRI-to-histology Area Ratio (Fig. 3A) reflects this; AF showed ~100% ratio at all levels, while NP showed 120~150% ratio. Mismatch Area (Fig. 3B) was significantly higher in the NP than the AF (p<0.01), but was similar between the levels (p=0.5). RMS Deviation in the ROI boundary (Fig. 3C) was ~150 µm on average, and it did not vary with level (p=0.3) or region (p=0.6).
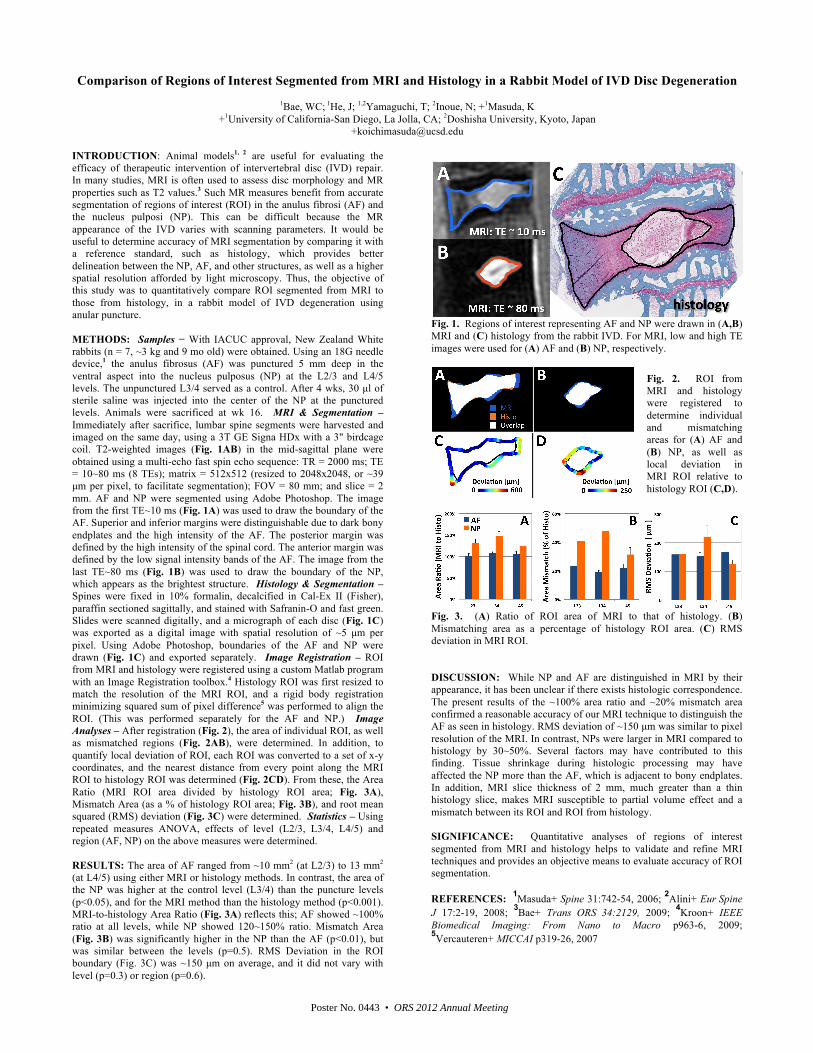
Fig. 1. Regions of interest representing AF and NP were drawn in (A,B) MRI and (C) histology from the rabbit IVD. For MRI, low and high TE images were used for (A) AF and (B) NP, respectively.
Fig. 3. (A) Ratio of ROI area of MRI to that of histology. (B) Mismatching area as a percentage of histology ROI area. (C) RMS deviation in MRI ROI. DISCUSSION: While NP and AF are distinguished in MRI by their appearance, it has been unclear if there exists histologic correspondence. The present results of the ~100% area ratio and ~20% mismatch area confirmed a reasonable accuracy of our MRI technique to distinguish the AF as seen in histology. RMS deviation of ~150 µm was similar to pixel resolution of the MRI. In contrast, NPs were larger in MRI compared to histology by 30~50%. Several factors may have contributed to this finding. Tissue shrinkage during histologic processing may have affected the NP more than the AF, which is adjacent to bony endplates. In addition, MRI slice thickness of 2 mm, much greater than a thin histology slice, makes MRI susceptible to partial volume effect and a mismatch between its ROI and ROI from histology. SIGNIFICANCE: Quantitative analyses of regions of interest segmented from MRI and histology helps to validate and refine MRI techniques and provides an objective means to evaluate accuracy of ROI segmentation. REFERENCES: 1Masuda+ Spine 31:742-54, 2006; 2Alini+ Eur Spine J 17:2-19, 2008; 3Bae+ Trans ORS 34:2129, 2009; 4Kroon+ IEEE Biomedical Imaging: From Nano to Macro p963-6, 2009; 5Vercauteren+ MICCAI p319-26, 2007
Fig. 2. ROI from MRI and histology were registered to determine individual and mismatching areas for (A) AF and (B) NP, as well as local deviation in MRI ROI relative to histology ROI (C,D).
Poster No. 0443 • ORS 2012 Annual Meeting