Embed Size (px)
Citation preview
PAGE 1 OF 32
Comparison of PIARC-based tunnel pollution estimates with measurements in M5 East
14th June 2017
COMPARISON OF PIARC-BASED POLLUTION ESTIMATES FOR TUNNEL DESIGN TO MEASUREMENTS IN THE M5 EAST TUNNEL
For Sydney Motorway Corporation
14TH JUNE 2017
Ref 1609
PAGE 2 OF 32
Comparison of PIARC-based tunnel pollution estimates with measurements in M5 East
14th June 2017
REVISION HISTORY
No. Date Comment Signed
1 18th Nov 2015 Internal draft
2 29th Aug 2016 Reworked analysis following RMS comments
3 25th Jan 2017 Revised with RMS comments
4 14th June 2017 Peer review comments addressed
Stacey Agnew Pty. Ltd
Unit 4 35 Limestone Street, Darra, QLD 4076, Australia
P: +61 7 30776770 F: +61 7 30776769
www.staceyagnew.com
PAGE 3 OF 32
Comparison of PIARC-based tunnel pollution estimates with measurements in M5 East
14th June 2017
EXECUTIVE SUMMARY
The detailed pollution estimation approach published by PIARC, as applied to tunnel design in Sydney, has been compared to data from careful measurements in Sydney’s M5 East tunnel, made in March 2015. IDA Tunnel software was used to model the tunnel operation and carry out the calculation of the vehicle emissions and advection within the tunnel. RMS methodologies for fleet prediction and NO2 estimation, as proposed for ventilation design of future road tunnels in NSW, has been used in estimating emissions through the PIARC method. The measurements were made by CSIRO at the RMS measurement station.
The PIARC method divides the fleet into several vehicle classes by size and fuel type. The M5 East data are tunnel air measurements, not vehicle measurements, and so do not permit any different accuracy assessments between the pollution tables for different vehicle classes. Overall accuracy has been estimated for PIARC-predicted CO, NOX and particulate emissions, with the fleet and tunnel geometry of these tests.
The fraction of all oxides of nitrogen that is the more harmful nitrogen dioxide (the ratio NO2:NOX) was calculated based on the work by Pastramas et.al.
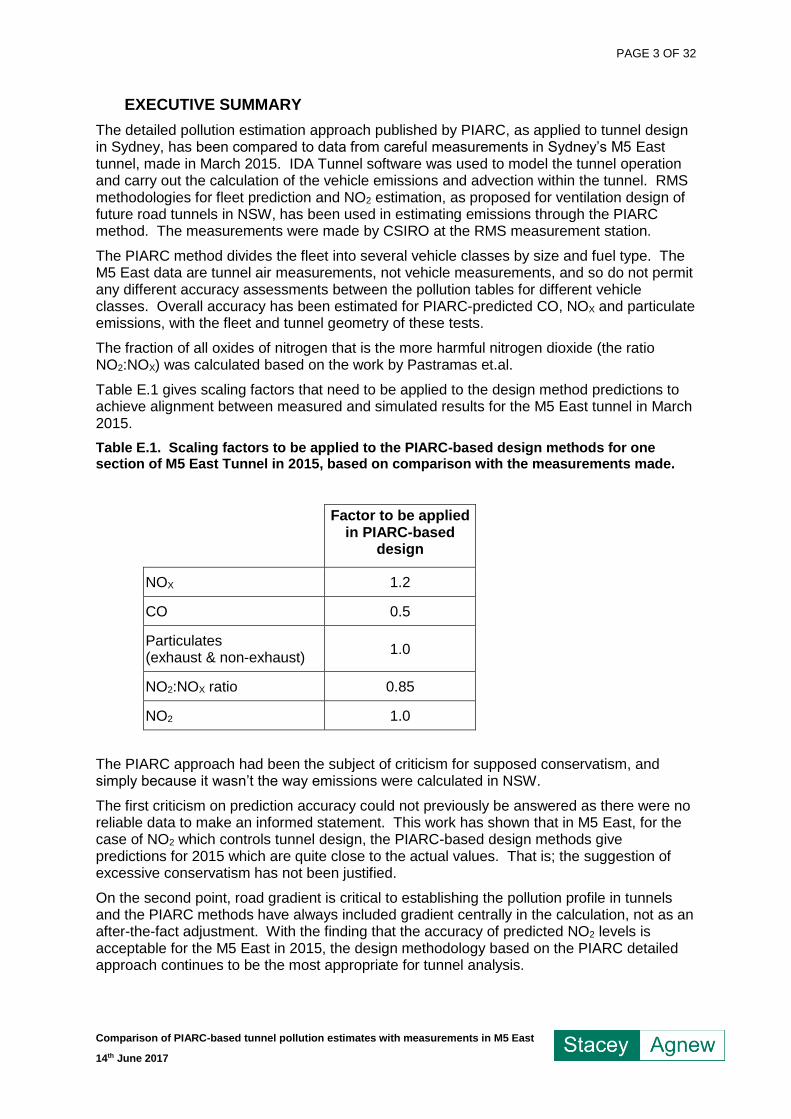
Table E.1 gives scaling factors that need to be applied to the design method predictions to achieve alignment between measured and simulated results for the M5 East tunnel in March 2015.
Table E.1. Scaling factors to be applied to the PIARC-based design methods for one section of M5 East Tunnel in 2015, based on comparison with the measurements made.
Factor to be applied in PIARC-based
design
NOX 1.2
CO 0.5
Particulates (exhaust & non-exhaust)
1.0
NO2:NOX ratio 0.85
NO2 1.0
The PIARC approach had been the subject of criticism for supposed conservatism, and simply because it wasn’t the way emissions were calculated in NSW.
The first criticism on prediction accuracy could not previously be answered as there were no reliable data to make an informed statement. This work has shown that in M5 East, for the case of NO2 which controls tunnel design, the PIARC-based design methods give predictions for 2015 which are quite close to the actual values. That is; the suggestion of excessive conservatism has not been justified.
On the second point, road gradient is critical to establishing the pollution profile in tunnels and the PIARC methods have always included gradient centrally in the calculation, not as an after-the-fact adjustment. With the finding that the accuracy of predicted NO2 levels is acceptable for the M5 East in 2015, the design methodology based on the PIARC detailed approach continues to be the most appropriate for tunnel analysis.
Table of Contents
Comparison of PIARC-based tunnel pollution estimates with measurements in M5 East
14th June 2017
EXECUTIVE SUMMARY 3
1 Introduction 5
1.1 Limitations 5
2 Experimental design 6
3 Tunnel schematic and model parameters 7
4 In-tunnel measurements and operating data 10
5 Vehicle flow model 12
6 Pollution model and parameters 15
6.1 Alignment of traffic loop data with PIARC categories 15
6.2 Fleet characterisation 17
6.4 Heat and CO2 emissions 18
7 Results – PIARC Emissions Estimate 20
7.1 Results for 26th March 2015 20
7.2 Results for 27th March 2015 23
8 Nitrogen Dioxide (NO2) 26
8.1 NO2 emissions estimate 26
8.2 NO2 results for 26th March 2016 27
8.3 NO2 results for 27th March 2016 28
9 Summary and discussion 30
APPENDIX A - List of Reference Drawings 31
PAGE 5 OF 32
Comparison of PIARC-based tunnel pollution estimates with measurements in M5 East
14th June 2017
1 INTRODUCTION
All recent road tunnels in Australia, including the M4 East and New M5 Tunnels which are part of WestConnex, have had their in-tunnel and external pollution assessed during design using the emission estimation methods given by PIARC1 (the Permanent International Association of Road Congresses). The PIARC approach is seen as the best available for tunnels. The base PIARC figures were published in 2012, also using data on the Australian fleet collected earlier. The data and methods are referred to here as “PIARC” or “PIARC 2012”. This report examines the accuracy of the design procedure based on the PIARC pollution models when extrapolated to 2015, using real-time operating data and measurements from the M5 East tunnel in Sydney.
Predictions of future emissions are based on the current understanding of emissions, extrapolated to future years where such extrapolation is possible. The uncertainty in estimates of future emissions then comes from both the uncertainty as to the current accuracy of models, and the uncertainty involved in the extrapolation of trends. The purpose of the comparison against recorded 2015 data is to give confidence in the prediction at that time, such that one source of uncertainty in estimating future emissions is greatly reduced.
The PIARC document gives a detailed estimation method and also a simplified approach, tailored (at the time) to the Australian fleet. With a lack of prediction factors beyond 2020 and a disparity in the diesel proportions for the light duty vehicle assumptions in the simple (Australian) method, the detailed estimation method is the preferred approach for future road tunnel projects in Australia. This report focuses on the detailed method which is part of the proposed basis of design of the M4-M5 Link tunnel.
1.1 Limitations
Any simulation or calculation technique used for design purposes that relies upon averaged or grouped inputs (vehicle type, speed, vehicle age distribution) will inherently be unable to replicate the fluctuations produced by a diverse fleet. Short term perturbations about a nominal average are to be expected in measurements due to factors that cannot be readily replicated in a simulated environment, for example, a group of diesel powered passenger cars travelling slowly through the tunnel would be expected to result in a locally increased level of NO2 relative to the CO level. A single poorly maintained truck could affect visibility for a minute or more until its plume is washed out. It is not the intent of this work to attempt to describe these behaviours. Rather, the purpose is to validate the methodology of PIARC for the current Sydney fleet as a basis of design using fleet-averaged pollution criteria. For these reasons, comparisons between simulated results in tunnel measurements are assessed on 15-minute rolling average basis. The period of 15 minutes was adopted for consistency with typical assessment criteria in operational road tunnels in NSW.
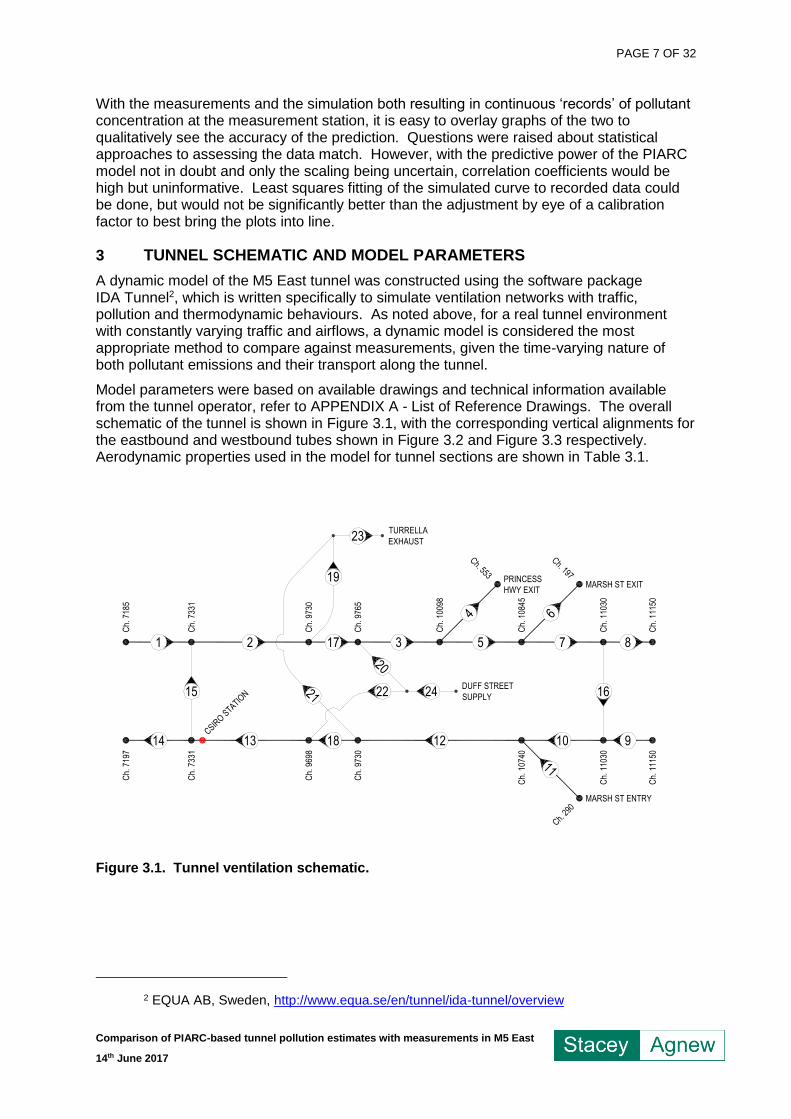
Further, the location of the measurement station and the ventilation system of the M5 East Tunnel mean that the westbound tunnel between the Duff St supply point and the western crossover dominate the pollution levels measured for much of the record. This effectively weights the assessment to gradients in the range -1 % to +6 %. Refer to the shaded region of Figure 3.3 for the tunnel geometry and test zone.
The timing of this report means that the focus of this work is the verification of design methods to be applied to the M4-M5 Link tunnel. It is accepted that there is known conservatism in some of the design assumptions. There may also be unconservative assumptions not identified. The point is not to do a first principles calibration of the PIARC
1 Road Tunnels: Vehicles, Emissions and Air Demand for Ventilation. Document 2012R05EN, Permanent International Association of Road Congresses (PIARC) Technical Committee C4 Road Tunnels Operation. December 2012.
PAGE 6 OF 32
Comparison of PIARC-based tunnel pollution estimates with measurements in M5 East
14th June 2017
tables, but to verify the design procedures as they will actually be applied. That is; it is not necessary or even desirable for the simulations to be any different to the mandated design approach. In this way, any differences of opinion as to the detail of design inputs can be put aside if it is seen that the design method produces about the right answers overall.
2 EXPERIMENTAL DESIGN
Tunnel ventilation design is sometimes done in spreadsheet calculations assuming steady state conditions for traffic and airflows. Comparisons could be made on a similar basis with the M5 East over a particular measurement period by calculating the emissions from the average vehicle and airflow behaviour over that period. There are many issues with this approach, mostly centred around the inherent assumption of linearity of emissions behaviour. For example; it is not necessarily true that an emissions calculation at 60 km/h would reflect true emissions from a tunnel that was at 80 km/h for half the test and 40 km/h for the other half. In the real tunnel, the airflows also vary continuously and so taking some period-averaged airflow for the calculation would make the result difficult to interpret with any confidence.
An averaging approach would also discard the useful minute by minute detail that can indicate whether the model is behaving realistically, or whether there was some unexplained transient in the middle of the measurement. Except for very long averaging periods, there would also be corrections to be made for the transport delay of pollutants along the test tunnel section and the different traffic at the start and end of the test period.
Performing a transient calculation allows direct comparison with the real transient tunnel behaviour on a continuous basis. It is of course more complicated to simulate the transient behaviour than to do an averaged steady state calculation, but it allows the comparison to be more meaningful. For these reasons, this work adopts a transient model.
The entire M5 East system has been simulated. This may be more elaborate than necessary, but was done in order to allow for the possibility of pollution carry-over past the mid-tunnel (Duff Street) air exchange points in the M5 East tunnel. In the end, most of the test period was not subject to such carry-over, with the Duff Street supply point effectively creating an ambient air initial condition for the test tunnel section.
The simulation used the proprietary software IDA Tunnel, which was developed for the express purpose of simulating tunnel aerodynamics, including the emission and advection of vehicle-sourced pollutants. The same software is being used by the designers of M4 East and New M5, although only for the steady traffic design cases.
Within the simulations done for this work, the IDA Tunnel traffic parameters have been adjusted to achieve the best possible match to traffic flow and speed measurements. It is known to be very difficult to model the breakdown of free traffic flow into congested flow. Where that transition behaviour created uncertainty about the replication of the traffic, the data in those periods could not be used for the purpose of this report.
While IDA Tunnel will also solve the network airflow in a transient way, the focus of the study was pollution generation, not tunnel aerodynamics. Consequently, the modelled airflows were forced to closely follow the recorded flows. This was done by including a stiff feedback control loop into the model, with the recorded flow as the variable setpoint and jet fans used to adjust the model flow. With the air flowrate and traffic inflows essentially matched to the measured values in the model, and the traffic dynamic behaviour dealt with as above, the remaining IDA Tunnel functions are essentially calculation of the vehicle emissions, using PIARC derived emission tables and the advection of the pollution along the tunnel. These procedures have then removed the question about the dynamic behaviour of IDA Tunnel interfering with the core pollution comparison being made.
PAGE 7 OF 32
Comparison of PIARC-based tunnel pollution estimates with measurements in M5 East
14th June 2017
With the measurements and the simulation both resulting in continuous ‘records’ of pollutant concentration at the measurement station, it is easy to overlay graphs of the two to qualitatively see the accuracy of the prediction. Questions were raised about statistical approaches to assessing the data match. However, with the predictive power of the PIARC model not in doubt and only the scaling being uncertain, correlation coefficients would be high but uninformative. Least squares fitting of the simulated curve to recorded data could be done, but would not be significantly better than the adjustment by eye of a calibration factor to best bring the plots into line.
3 TUNNEL SCHEMATIC AND MODEL PARAMETERS
A dynamic model of the M5 East tunnel was constructed using the software package IDA Tunnel2, which is written specifically to simulate ventilation networks with traffic, pollution and thermodynamic behaviours. As noted above, for a real tunnel environment with constantly varying traffic and airflows, a dynamic model is considered the most appropriate method to compare against measurements, given the time-varying nature of both pollutant emissions and their transport along the tunnel.
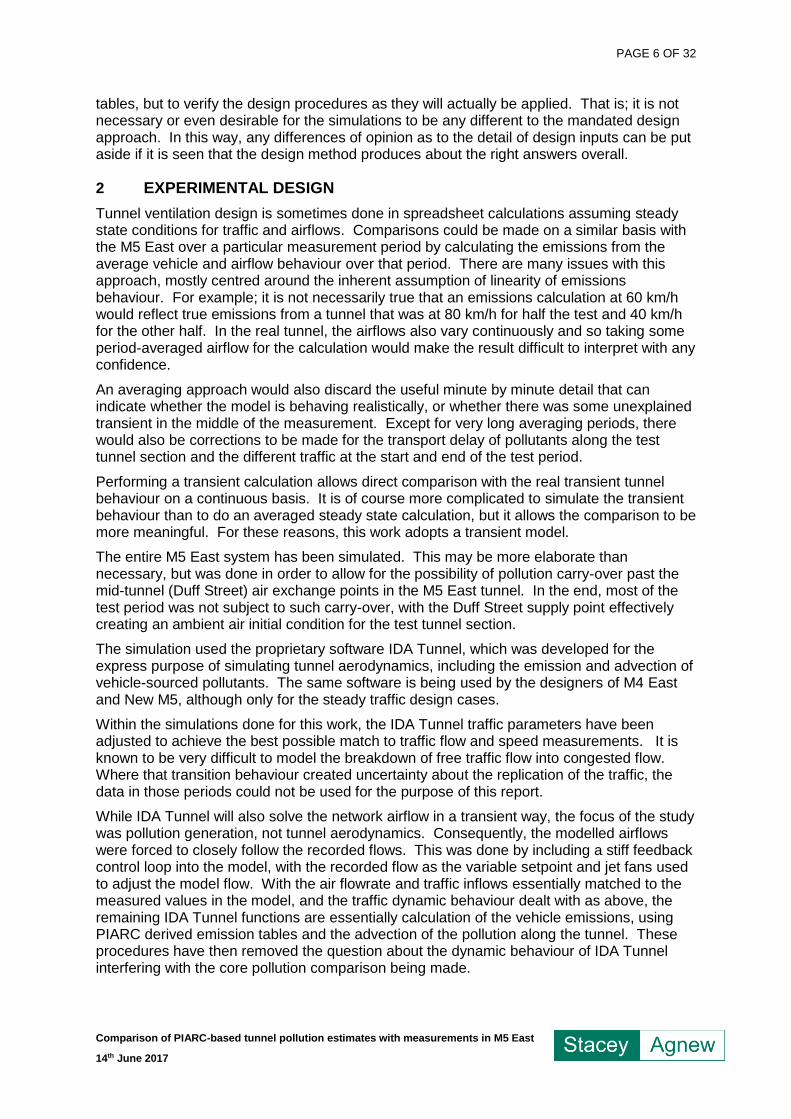
Model parameters were based on available drawings and technical information available from the tunnel operator, refer to APPENDIX A - List of Reference Drawings. The overall schematic of the tunnel is shown in Figure 3.1, with the corresponding vertical alignments for the eastbound and westbound tubes shown in Figure 3.2 and Figure 3.3 respectively. Aerodynamic properties used in the model for tunnel sections are shown in Table 3.1.
Figure 3.1. Tunnel ventilation schematic.
2 EQUA AB, Sweden, http://www.equa.se/en/tunnel/ida-tunnel/overview
Ch.
718
5
Ch.
733
1
Ch.
973
0
Ch.
976
5
Ch.
100
98
Ch.
108
45
Ch. 197
Ch.
111
501 2 17 3 5
6
8
14 13 18 12
11
9
15 16
Ch.
733
1
Ch.
719
7
Ch.
973
0
Ch.
969
8
Ch.
111
50
Ch.
110
30
10
Ch.
107
40
Ch. 2
90
7
Ch.
110
30
4
Ch. 55319
20
22 2421
23
DUFF STREET
SUPPLY
TURRELLA
EXHAUST
PRINCESS
HWY EXITMARSH ST EXIT
MARSH ST ENTRY
CSIRO S
TATION
PAGE 8 OF 32
Comparison of PIARC-based tunnel pollution estimates with measurements in M5 East
14th June 2017
Figure 3.2. Eastbound vertical alignment (traffic travels left to right).
Figure 3.3. Westbound vertical alignment, with the tested tunnel section shaded (traffic travels right to left).
PAGE 9 OF 32
Comparison of PIARC-based tunnel pollution estimates with measurements in M5 East
14th June 2017
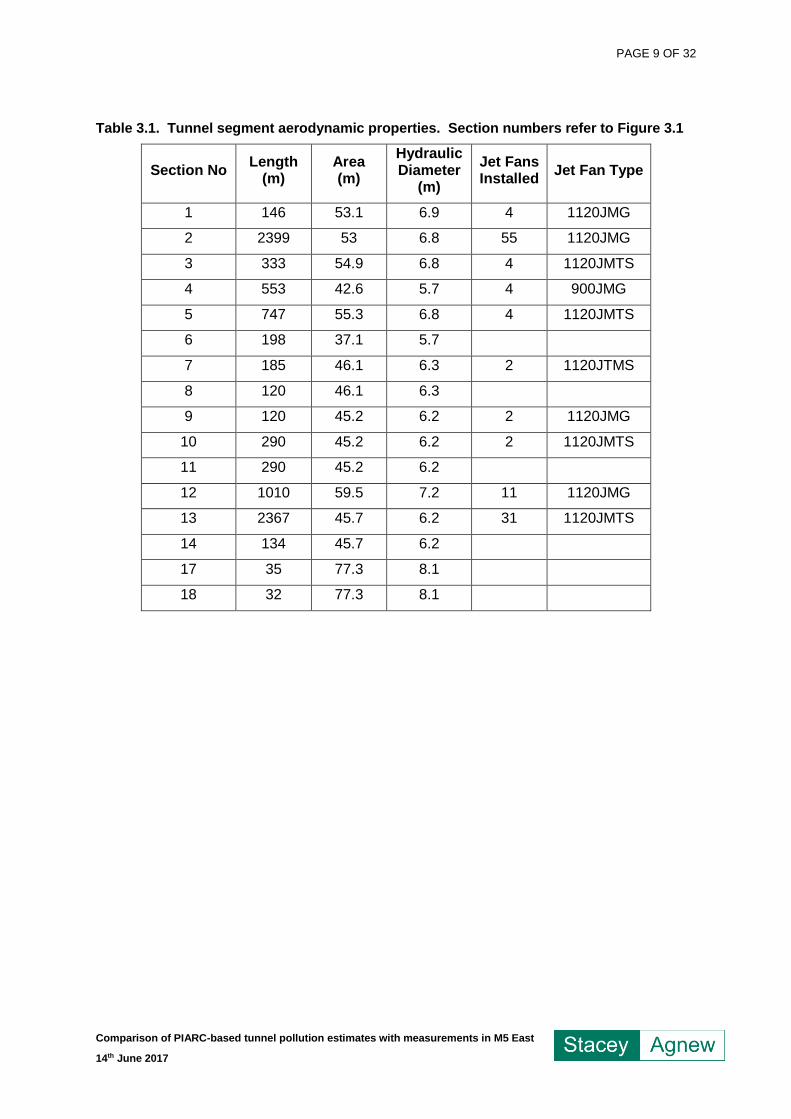
Table 3.1. Tunnel segment aerodynamic properties. Section numbers refer to Figure 3.1
Section No Length
(m) Area (m)
Hydraulic Diameter
(m)
Jet Fans Installed
Jet Fan Type
1 146 53.1 6.9 4 1120JMG
2 2399 53 6.8 55 1120JMG
3 333 54.9 6.8 4 1120JMTS
4 553 42.6 5.7 4 900JMG
5 747 55.3 6.8 4 1120JMTS
6 198 37.1 5.7
7 185 46.1 6.3 2 1120JTMS
8 120 46.1 6.3
9 120 45.2 6.2 2 1120JMG
10 290 45.2 6.2 2 1120JMTS
11 290 45.2 6.2
12 1010 59.5 7.2 11 1120JMG
13 2367 45.7 6.2 31 1120JMTS
14 134 45.7 6.2
17 35 77.3 8.1
18 32 77.3 8.1
PAGE 10 OF 32
Comparison of PIARC-based tunnel pollution estimates with measurements in M5 East
14th June 2017
4 IN-TUNNEL MEASUREMENTS AND OPERATING DATA
Data from a number of sources were used as inputs to the dynamic model and for comparison of the simulated results.
The primary source of input data to the model was obtained from the tunnel SCADA system:
• Traffic loops: Traffic loop data were used as vehicle flow inputs into the model at vehicle entrances and traffic diverges. Traffic loops are positioned at various locations through the tunnel and discriminate vehicles into three categories (small, medium and large) based on the vehicle length. Data for vehicle count and average speed were provided at 3 minute intervals which was converted to vehicle flows, in units of vehicles/h. Vehicle flows were aggregated across all lanes as IDA Tunnel does not provide the capability to simulate separate conditions for each lane in multiple-lane sections.
• Airflow: Airflow sensors are positioned at numerous locations through the tunnel system and in ventilation supply and exhaust airways, providing a full record of the network airflow conditions. Recorded data were provided at random non-concurrent times and this was pre-processed by interpolating each sensor at concurrent 3-minute intervals and applying a least squares fit methodology at each time-slice to ensure that continuity was preserved in the network airflow figures. The calibration status of airflow sensors is unknown, however the technique applied would avoid sensitivity to any one aberrant sensor. A comparison of the airflow in the dominant section of the tunnel is presented later in this report.
In-tunnel pollution measurements used for comparison against the simulated results were completed by the CSIRO on behalf of RMS. Measurement of NO, NO2, CO, CO2 and PM2.5 were performed on the 26th and 27th March 2015 in the westbound tunnel immediately upstream of the western end cross-over fan installation, see Figure 3.1.
• NO, NO2, CO and CO2 measurements (in ppmv) were performed using Fourier transform infrared (FTIR) spectroscopy at a rate of 5 Hz with the sample stream maintained (heated) at 35°C.
• PM2.5 measurements (in mg/m3) were provided at 6 minute intervals. For comparison purposes this has been converted to extinction coefficient (1/m) by multiplying by the PIARC conversion factor (0.0047 m2/mg).
In the context of this report, NOx is assumed as NO + NO2, other possible constituent parts are considered insignificant. All NOX results are stated as NO2 equivalent for consistency with PIARC.
As coincident data on ambient pollution levels were not available, emission estimates and simulations have been completed without any contribution from ambient levels external to the tunnel. Nominal design values proposed for ambient pollution levels were used to understand the contribution from in-tunnel vehicle emissions present in the measured data. While the design ambient values are at the high end of recorded ambient values and it is perhaps unfair to use the full value in this way, the values are in any case small compared to the in-tunnel contribution. Data from measurements are presented in this report labelled in each trace name as follows:
• “measured” being the measured value with no adjustment and inherently includes both vehicle emissions and ambient contributions.
• “in-tunnel” being the measured value with the background levels in Table 4.1 subtracted. This represents the estimated contribution from vehicle emissions.
PAGE 11 OF 32
Comparison of PIARC-based tunnel pollution estimates with measurements in M5 East
14th June 2017
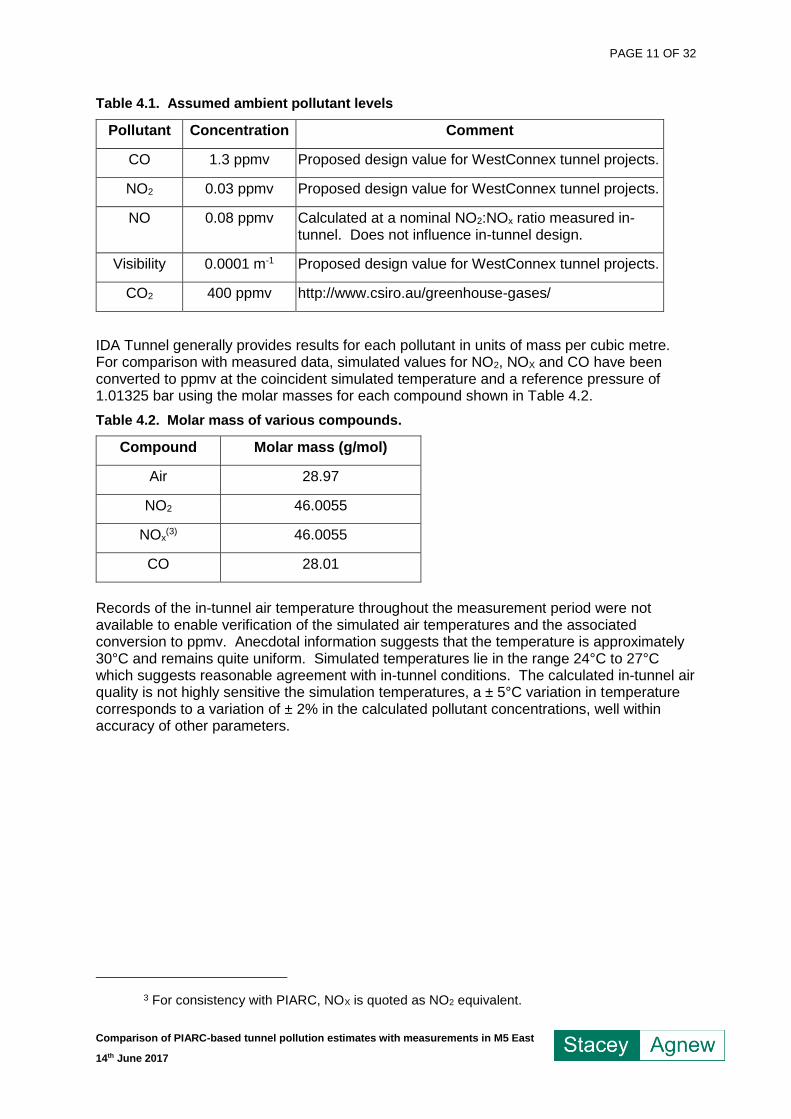
Table 4.1. Assumed ambient pollutant levels
Pollutant Concentration Comment
CO 1.3 ppmv Proposed design value for WestConnex tunnel projects.
NO2 0.03 ppmv Proposed design value for WestConnex tunnel projects.
NO 0.08 ppmv Calculated at a nominal NO2:NOx ratio measured in-tunnel. Does not influence in-tunnel design.
Visibility 0.0001 m-1 Proposed design value for WestConnex tunnel projects.
CO2 400 ppmv http://www.csiro.au/greenhouse-gases/
IDA Tunnel generally provides results for each pollutant in units of mass per cubic metre. For comparison with measured data, simulated values for NO2, NOX and CO have been converted to ppmv at the coincident simulated temperature and a reference pressure of 1.01325 bar using the molar masses for each compound shown in Table 4.2.
Table 4.2. Molar mass of various compounds.
Compound Molar mass (g/mol)
Air 28.97
NO2 46.0055
NOx(3) 46.0055
CO 28.01
Records of the in-tunnel air temperature throughout the measurement period were not available to enable verification of the simulated air temperatures and the associated conversion to ppmv. Anecdotal information suggests that the temperature is approximately 30°C and remains quite uniform. Simulated temperatures lie in the range 24°C to 27°C which suggests reasonable agreement with in-tunnel conditions. The calculated in-tunnel air quality is not highly sensitive the simulation temperatures, a ± 5°C variation in temperature corresponds to a variation of ± 2% in the calculated pollutant concentrations, well within accuracy of other parameters.
3 For consistency with PIARC, NOX is quoted as NO2 equivalent.
PAGE 12 OF 32
Comparison of PIARC-based tunnel pollution estimates with measurements in M5 East
14th June 2017
5 VEHICLE FLOW MODEL
In order to predict the vehicle emissions as accurately as possible, the traffic behaviour within the simulation (flow, speed and density) should follow the observed traffic behaviour as accurately as practicable. IDA Tunnel provides three basic models for simulating traffic behaviour;
• Congestion model
• Moving traffic
• Standing traffic
The congestion model, which was used for this work, is based on dependence between speed and density and incorporates some aspects of real driving patterns. While traffic models and driving behaviour are difficult to model accurately for every location and driving cohort, it is believed the congestion model will get closer to the real traffic behaviour than pre-processing traffic measurements using spreadsheet calculations and applying average flow and speed uniformly.
Traffic in each PIARC vehicle category was modelled in IDA Tunnel. Measured traffic flows, adjusted as detailed later, were applied at entry portals and the proportion of vehicles exiting at traffic diverges was also calculated using the available traffic loop data.
IDA Tunnel provides a base set of parameters for the congestion model, based on measurements undertaken in Stockholm, Sweden. Some adjustments were made to these to align the measured and simulated traffic conditions as closely as practicable.
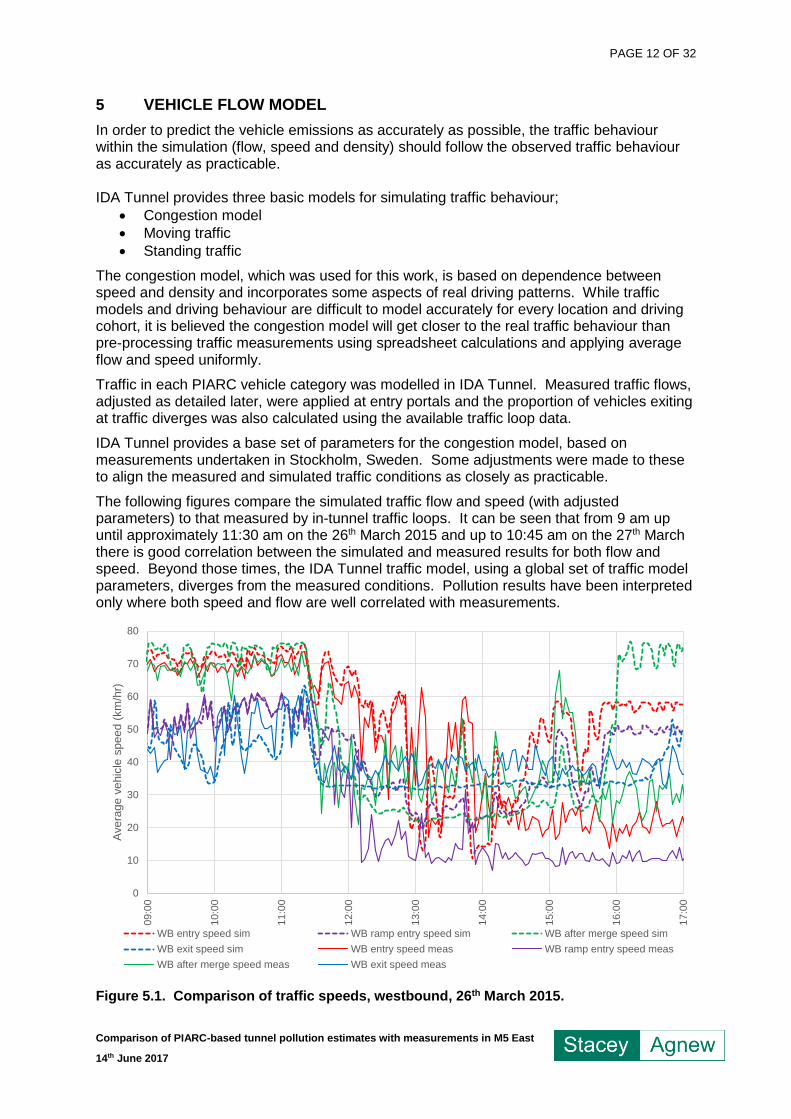
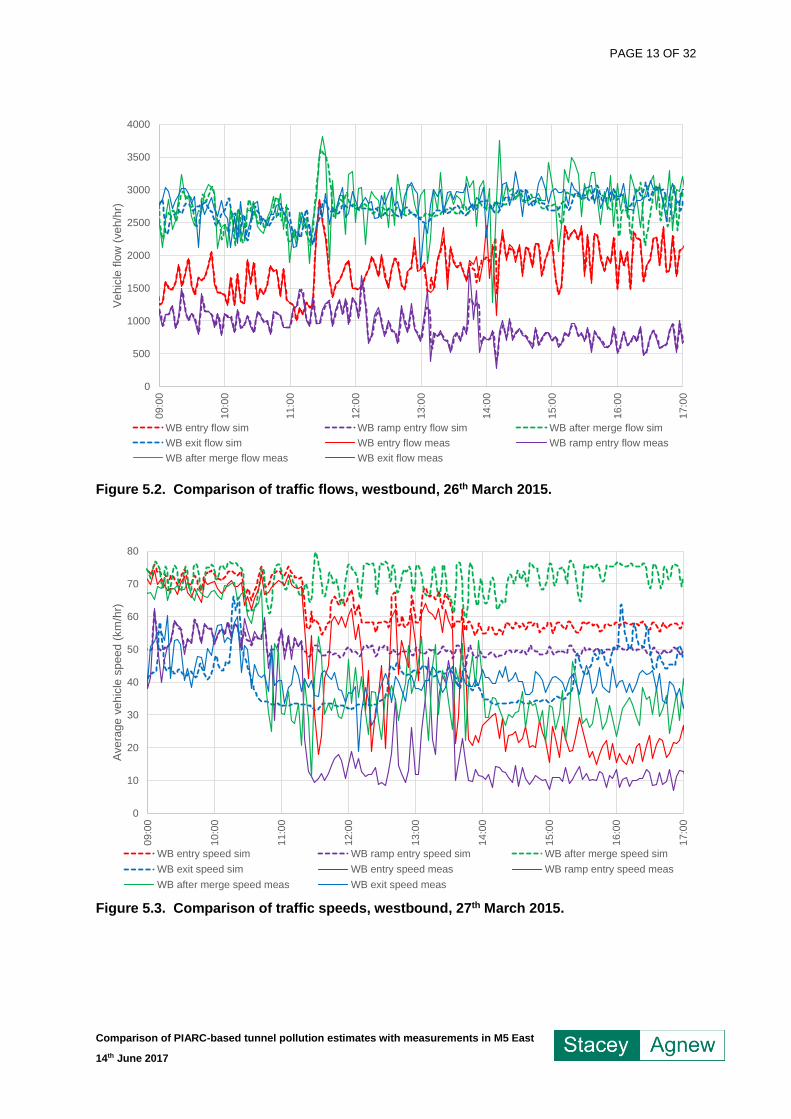
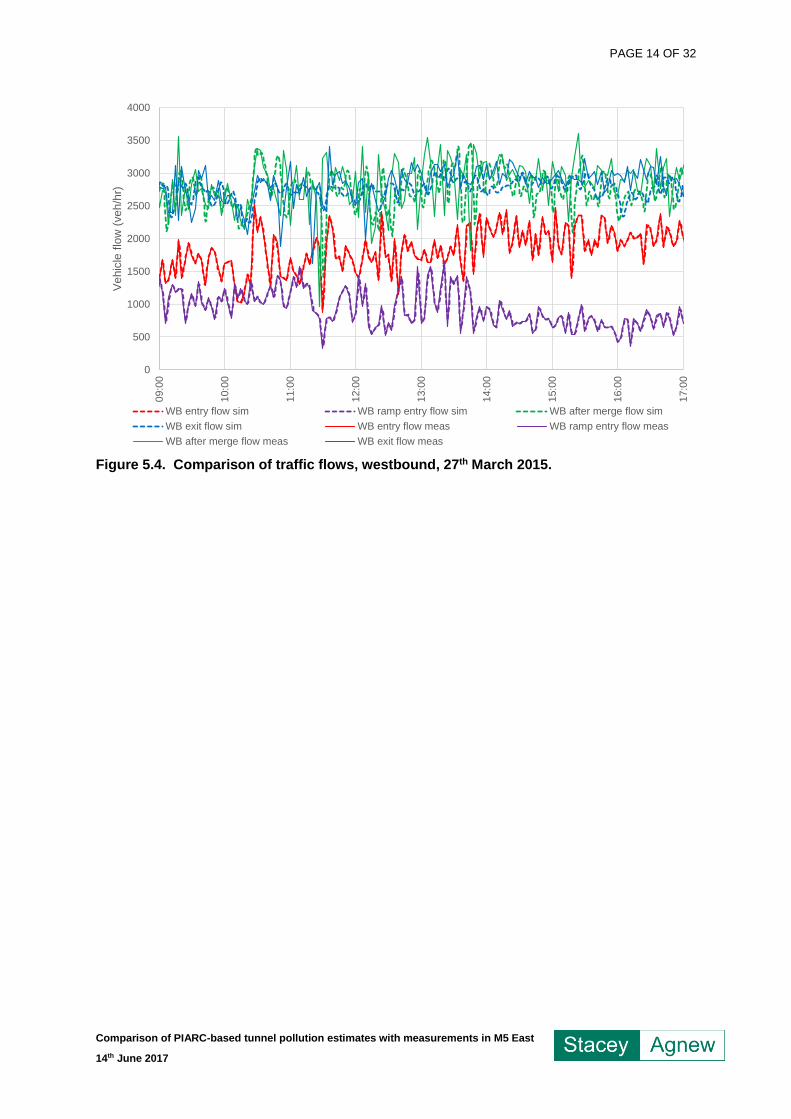
The following figures compare the simulated traffic flow and speed (with adjusted parameters) to that measured by in-tunnel traffic loops. It can be seen that from 9 am up until approximately 11:30 am on the 26th March 2015 and up to 10:45 am on the 27th March there is good correlation between the simulated and measured results for both flow and speed. Beyond those times, the IDA Tunnel traffic model, using a global set of traffic model parameters, diverges from the measured conditions. Pollution results have been interpreted only where both speed and flow are well correlated with measurements.
Figure 5.1. Comparison of traffic speeds, westbound, 26th March 2015.
0
10
20
30
40
50
60
70
80
09:0
0
10:0
0
11:0
0
12:0
0
13:0
0
14:0
0
15:0
0
16:0
0
17:0
0
Avera
ge v
ehic
le s
peed (
km
/hr)
WB entry speed sim WB ramp entry speed sim WB after merge speed sim
WB exit speed sim WB entry speed meas WB ramp entry speed meas
WB after merge speed meas WB exit speed meas
PAGE 13 OF 32
Comparison of PIARC-based tunnel pollution estimates with measurements in M5 East
14th June 2017
Figure 5.2. Comparison of traffic flows, westbound, 26th March 2015.
Figure 5.3. Comparison of traffic speeds, westbound, 27th March 2015.
0
500
1000
1500
2000
2500
3000
3500
4000
09:0
0
10:0
0
11:0
0
12:0
0
13:0
0
14:0
0
15:0
0
16:0
0
17:0
0
Vehic
le f
low
(veh/h
r)
WB entry flow sim WB ramp entry flow sim WB after merge flow sim
WB exit flow sim WB entry flow meas WB ramp entry flow meas
WB after merge flow meas WB exit flow meas
0
10
20
30
40
50
60
70
80
09:0
0
10:0
0
11:0
0
12:0
0
13:0
0
14:0
0
15:0
0
16:0
0
17:0
0
Avera
ge v
ehic
le s
peed (
km
/hr)
WB entry speed sim WB ramp entry speed sim WB after merge speed sim
WB exit speed sim WB entry speed meas WB ramp entry speed meas
WB after merge speed meas WB exit speed meas
PAGE 14 OF 32
Comparison of PIARC-based tunnel pollution estimates with measurements in M5 East
14th June 2017
Figure 5.4. Comparison of traffic flows, westbound, 27th March 2015.
0
500
1000
1500
2000
2500
3000
3500
4000
09:0
0
10:0
0
11:0
0
12:0
0
13:0
0
14:0
0
15:0
0
16:0
0
17:0
0
Vehic
le f
low
(veh/h
r)
WB entry flow sim WB ramp entry flow sim WB after merge flow sim
WB exit flow sim WB entry flow meas WB ramp entry flow meas
WB after merge flow meas WB exit flow meas
PAGE 15 OF 32
Comparison of PIARC-based tunnel pollution estimates with measurements in M5 East
14th June 2017
6 POLLUTION MODEL AND PARAMETERS
PIARC 2012 provides two basic methodologies for estimating the average fleet emissions for the purposes of assessing tunnel ventilation requirements for an Australian road tunnel:
1) Simple: Australian emission factors in accordance with Appendix 3.1 of the PIARC 2012 document.
2) Detailed: Base Euro standards in accordance with Appendix 4 of the PIARC 2012 document.
This work uses the detailed methodology to estimate emissions for comparison against measurements, as this is the preferred design methodology for future road tunnel projects.
A summary of the critical parameters adopted in the emissions estimates is described in the following sections. The following basis is used:
• Visibility (extinction coefficient) has been assessed two ways; as exhaust only, and exhaust plus non-exhaust particulates. A conversion factor of 0.0047 m2/mg is used in all cases.
• Background (ambient) levels external to the tunnel are excluded from the simulated environment (see Section 4).
• Age degradation factors (Table 78 of PIARC) are applied to all petrol vehicles.
• Influence of cold start has not been included.
• Altitude influence factors have not been included, as the M5 East tunnel is nominally at sea level.
• Average HGV mass of 15.5 tonne has been used, based on weigh-in-motion statistics which have been independently verified by RMS. This figure represents an annual mean mass of HGVs using the M5 East tunnel westbound.
6.1 Alignment of traffic loop data with PIARC categories
The in-tunnel traffic loops discriminate vehicles into three categories (small, medium and large) based on the vehicle length. This may not correlate directly to the PIARC vehicle categories. Traffic network survey data collected during the period November to December 2014 was analysed to obtain overall fleet characteristics aligned to the PIARC categories. The data consisted of 685,213 vehicle records at 21 locations around Sydney based on automated number plate recognition, with matching vehicle details from the registration database. Approximately 25% of the records did not contain registration information due to an incomplete number plate match. The registration data included information on the general type of vehicle, fuel type, gross vehicle mass and also vehicle year.
The data were analysed both as a complete data set and using only those survey locations relevant to the M5 East corridor. In this way, the fleet make-up could be estimated specifically for the M5 East, making it as specific as could be for the purposes.
For the purposes of this report:
• records without matching registration data are excluded from the analysis.
• all non-diesel fuelled vehicles are considered to be petrol fuelled.
Vehicles were categorized into a PIARC category (PC, LDV or HGV) based on the “Vehicle Type Description” and gross vehicle mass, the allocation of which is outlined in Table 6.1 below.
PAGE 16 OF 32
Comparison of PIARC-based tunnel pollution estimates with measurements in M5 East
14th June 2017
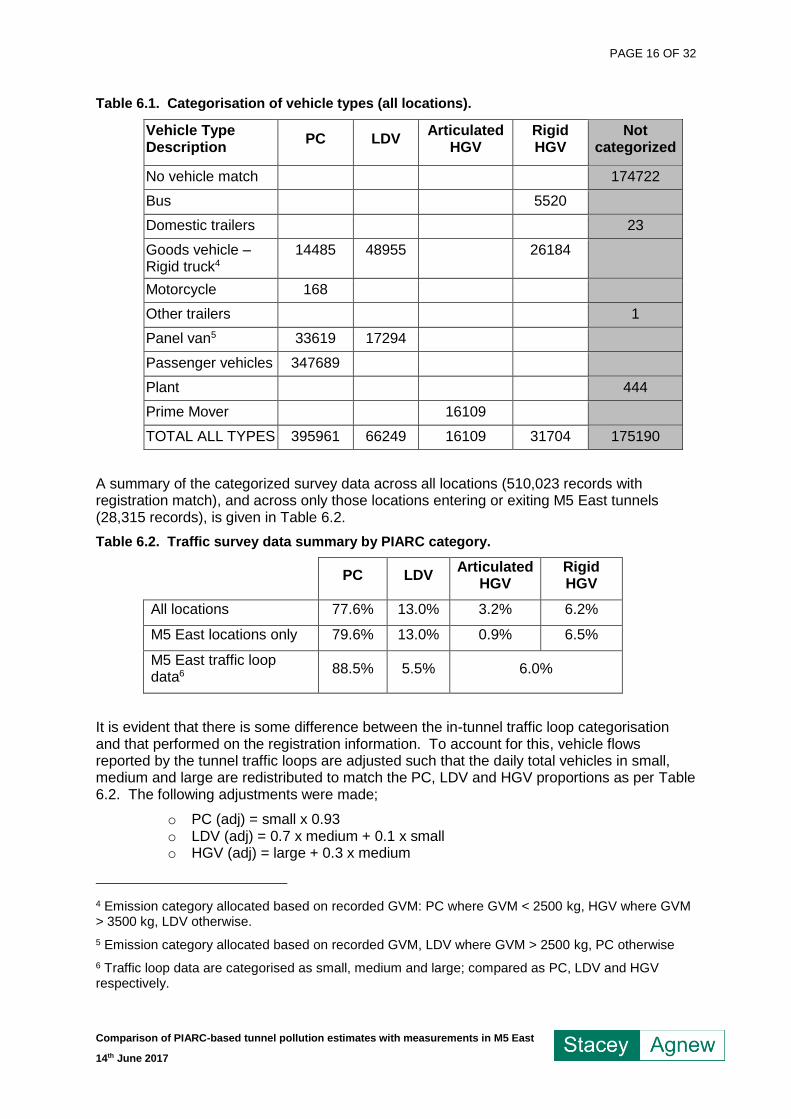
Table 6.1. Categorisation of vehicle types (all locations).
Vehicle Type Description
PC LDV Articulated
HGV Rigid HGV
Not categorized
No vehicle match 174722
Bus 5520
Domestic trailers 23
Goods vehicle – Rigid truck4
14485 48955 26184
Motorcycle 168
Other trailers 1
Panel van5 33619 17294
Passenger vehicles 347689
Plant 444
Prime Mover 16109
TOTAL ALL TYPES 395961 66249 16109 31704 175190
A summary of the categorized survey data across all locations (510,023 records with registration match), and across only those locations entering or exiting M5 East tunnels (28,315 records), is given in Table 6.2.
Table 6.2. Traffic survey data summary by PIARC category.
PC LDV Articulated
HGV Rigid HGV
All locations 77.6% 13.0% 3.2% 6.2%
M5 East locations only 79.6% 13.0% 0.9% 6.5%
M5 East traffic loop data6
88.5% 5.5% 6.0%
It is evident that there is some difference between the in-tunnel traffic loop categorisation and that performed on the registration information. To account for this, vehicle flows reported by the tunnel traffic loops are adjusted such that the daily total vehicles in small, medium and large are redistributed to match the PC, LDV and HGV proportions as per Table 6.2. The following adjustments were made;
o PC (adj) = small x 0.93 o LDV (adj) = 0.7 x medium + 0.1 x small o HGV (adj) = large + 0.3 x medium
4 Emission category allocated based on recorded GVM: PC where GVM < 2500 kg, HGV where GVM > 3500 kg, LDV otherwise.
5 Emission category allocated based on recorded GVM, LDV where GVM > 2500 kg, PC otherwise
6 Traffic loop data are categorised as small, medium and large; compared as PC, LDV and HGV respectively.
PAGE 17 OF 32
Comparison of PIARC-based tunnel pollution estimates with measurements in M5 East
14th June 2017
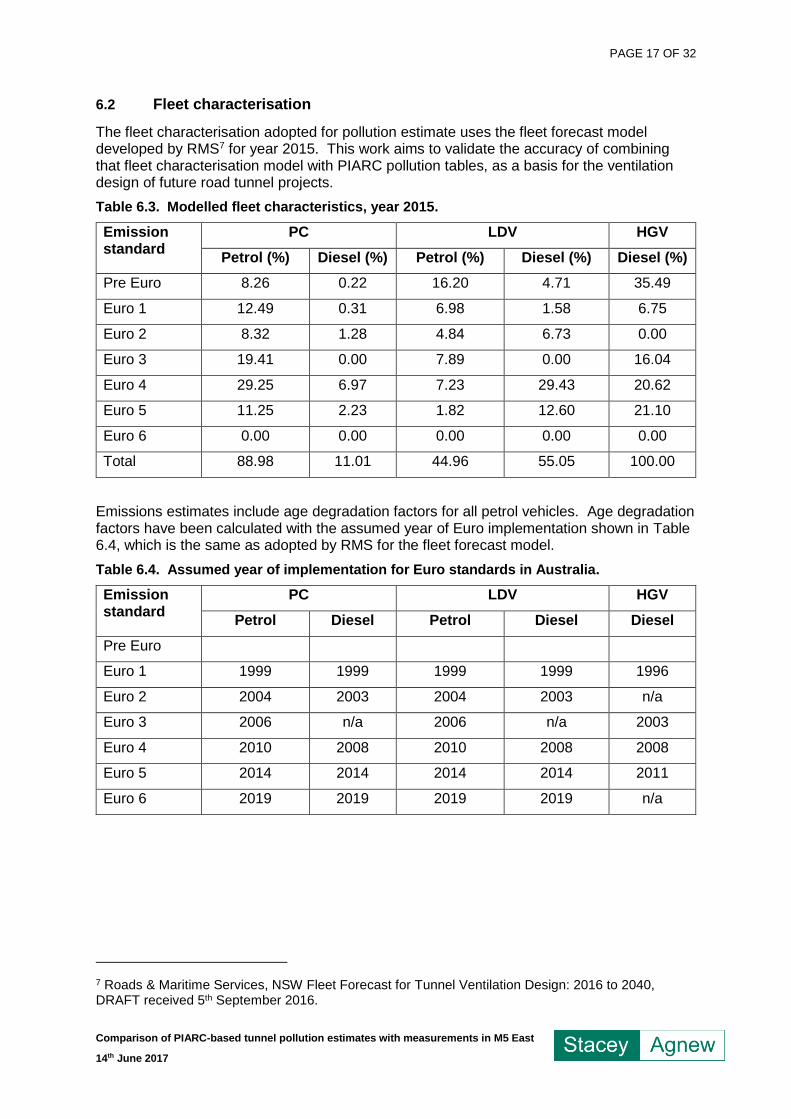
6.2 Fleet characterisation
The fleet characterisation adopted for pollution estimate uses the fleet forecast model developed by RMS7 for year 2015. This work aims to validate the accuracy of combining that fleet characterisation model with PIARC pollution tables, as a basis for the ventilation design of future road tunnel projects.
Table 6.3. Modelled fleet characteristics, year 2015.
Emission standard
PC LDV HGV
Petrol (%) Diesel (%) Petrol (%) Diesel (%) Diesel (%)
Pre Euro 8.26 0.22 16.20 4.71 35.49
Euro 1 12.49 0.31 6.98 1.58 6.75
Euro 2 8.32 1.28 4.84 6.73 0.00
Euro 3 19.41 0.00 7.89 0.00 16.04
Euro 4 29.25 6.97 7.23 29.43 20.62
Euro 5 11.25 2.23 1.82 12.60 21.10
Euro 6 0.00 0.00 0.00 0.00 0.00
Total 88.98 11.01 44.96 55.05 100.00
Emissions estimates include age degradation factors for all petrol vehicles. Age degradation factors have been calculated with the assumed year of Euro implementation shown in Table 6.4, which is the same as adopted by RMS for the fleet forecast model.
Table 6.4. Assumed year of implementation for Euro standards in Australia.
Emission standard
PC LDV HGV
Petrol Diesel Petrol Diesel Diesel
Pre Euro
Euro 1 1999 1999 1999 1999 1996
Euro 2 2004 2003 2004 2003 n/a
Euro 3 2006 n/a 2006 n/a 2003
Euro 4 2010 2008 2010 2008 2008
Euro 5 2014 2014 2014 2014 2011
Euro 6 2019 2019 2019 2019 n/a
7 Roads & Maritime Services, NSW Fleet Forecast for Tunnel Ventilation Design: 2016 to 2040, DRAFT received 5th September 2016.
PAGE 18 OF 32
Comparison of PIARC-based tunnel pollution estimates with measurements in M5 East
14th June 2017
6.4 Heat and CO2 emissions
In addition to emitting the pollutants of concern, the vehicles also generate heat and carbon dioxide (CO2) by burning fuel. The whole reason for methods to estimate the pollutant emission is that the emissions are uncertain and variable. On the other hand, the emission of heat and CO2 is very reliable and predictable as, except for a tiny fraction of other compounds, all the fuel becomes CO2 and H2O.
Engine power for a vehicle is strongly related to the vehicle mass, particularly for uphill gradients, and engine power is in turn is strongly correlated to CO2 emissions. Comparing estimated CO2 emissions with the measured values provides a secondary assessment for the model assumptions on vehicle mass, in particular the HGV mass adopted in the PIARC method.
This predictability allows CO2 particularly to be used to verify that the modelled overall fuel consumption, and hence the vehicle mass, is a reasonable approximation for what is happening in the tunnel. So, while care has been taken with the adopted fleet characteristics, we also check the overall fleet mass by comparing the measured and modelled CO2 levels.
Further to the PIARC pollutant and NO2 emissions estimates reported below, estimates for vehicle heat (engine exhaust, braking, mechanical losses) and CO2 emissions have been completed and simulated in IDA Tunnel. The purpose of these estimates is not to consider complex thermodynamic behaviour of internal combustion engines but simply to provide further confidence in the fleet assumptions.
Vehicle parameters given in Table 6.5 have been used to estimate emissions based on vehicle speed, road gradient and overall thermodynamic efficiency, assuming steady vehicle speed. Driving dynamics is not included, consistent with the design method applied to tunnels, maintaining the purpose of calibrating the design methods. Aerodynamic drag has been calculated assuming conditions of zero wind velocity, which will over-estimate the drag, however, for the vertical alignment of the test section shown in Figure 3.3, the power is dominated by hill climbing, with aerodynamic drag a smaller part. Ignoring blockage ratio effects makes a slight difference in the opposite direction. Only for the purpose of the power estimates (which are not part of the design methods), vehicle aerodynamic factors have been adjusted following the work of Jang & Chen (2002)8. These are second order effects when seen in the context of the assumption on vehicle thermal efficiency. The “Idle heat release” is incorporated at all speeds and gradients as an allowance for vehicle auxiliary loads such as air-conditioning.
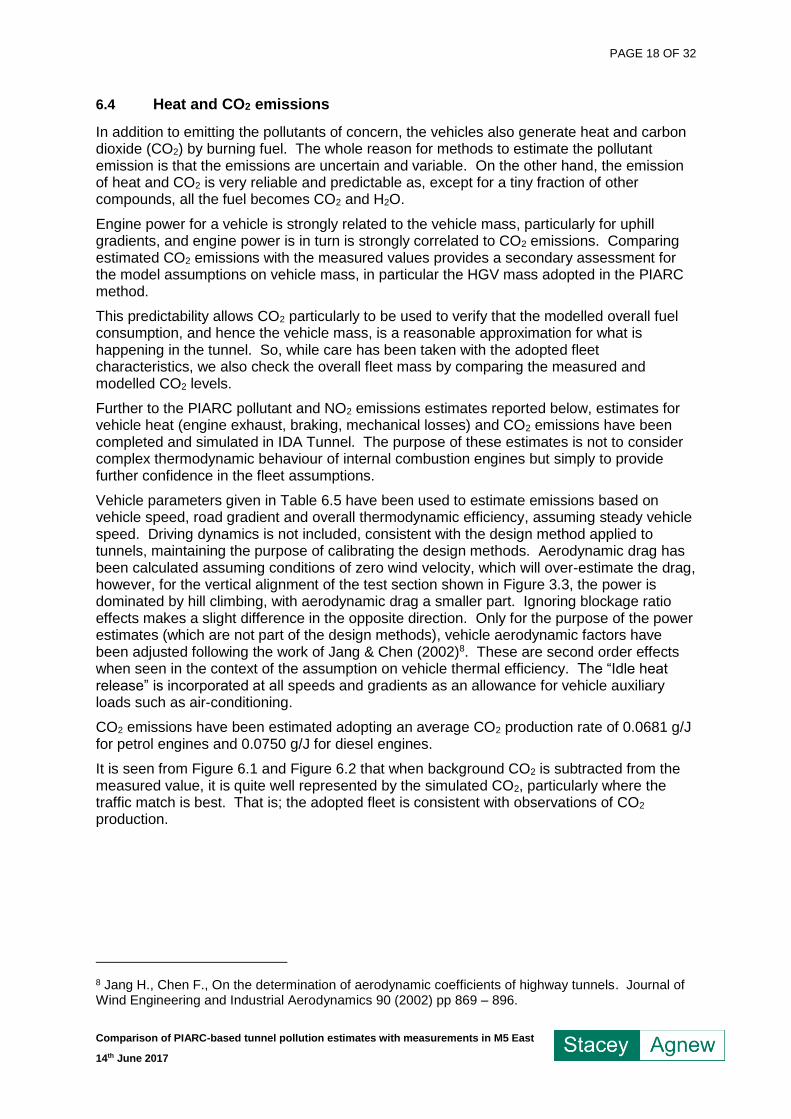
CO2 emissions have been estimated adopting an average CO2 production rate of 0.0681 g/J for petrol engines and 0.0750 g/J for diesel engines.
It is seen from Figure 6.1 and Figure 6.2 that when background CO2 is subtracted from the measured value, it is quite well represented by the simulated CO2, particularly where the traffic match is best. That is; the adopted fleet is consistent with observations of CO2 production.
8 Jang H., Chen F., On the determination of aerodynamic coefficients of highway tunnels. Journal of Wind Engineering and Industrial Aerodynamics 90 (2002) pp 869 – 896.
PAGE 19 OF 32
Comparison of PIARC-based tunnel pollution estimates with measurements in M5 East
14th June 2017
Table 6.5. Heat and CO2 emmisions estimate factors.
PC LDV HGV
Vehicle mass (kg) 1,500 3,000 15,500
Idle heat release (W) 10,000 15,000 35,000
Overall thermal efficiency – tractive effort to fuel (%)
32% 32% 32%
Frontal area (m2) 2.5 5.0 7.0
Drag coefficient 0.38 0.57 0.34
Coefficient of rolling resistance 0.01 0.01 0.01
Figure 6.1. Comparison of CO2 model, 26th March 2015.
Figure 6.2. Comparison of CO2 model, 27th March 2015.
0
200
400
600
800
1000
1200
1400
1600
1800
2000
09:00 09:30 10:00 10:30 11:00 11:30 12:00
CO
2 C
on
ce
ntr
atio
n (
ppm
v)
Adj-C02 sim (ppmv) 15min avg CO2 measured (ppmv) 15min avg
CO2 in-tunnel (ppmv) 15min avg
0
200
400
600
800
1000
1200
1400
1600
1800
2000
09:00 09:30 10:00 10:30 11:00 11:30 12:00
CO
2 C
oncentr
ation (
ppm
v)
Adj-C02 sim (ppmv) 15min avg CO2 measured (ppmv) 15min avg
CO2 in-tunnel (ppmv) 15min avg
PAGE 20 OF 32
Comparison of PIARC-based tunnel pollution estimates with measurements in M5 East
14th June 2017
7 RESULTS – PIARC EMISSIONS ESTIMATE
The figures in the following sections provide a comparison of simulated results using pollution generation tables based on the PIARC 2012 methods with in-tunnel measurements taken on 26th and 27th March 2015.
The ventilation operation resulted in carry-over past the Duff St air exchange point on both days; between 10:30 and 11:30 on both 26th and 27th March. These periods have some overlap with the periods of acceptable traffic prediction.
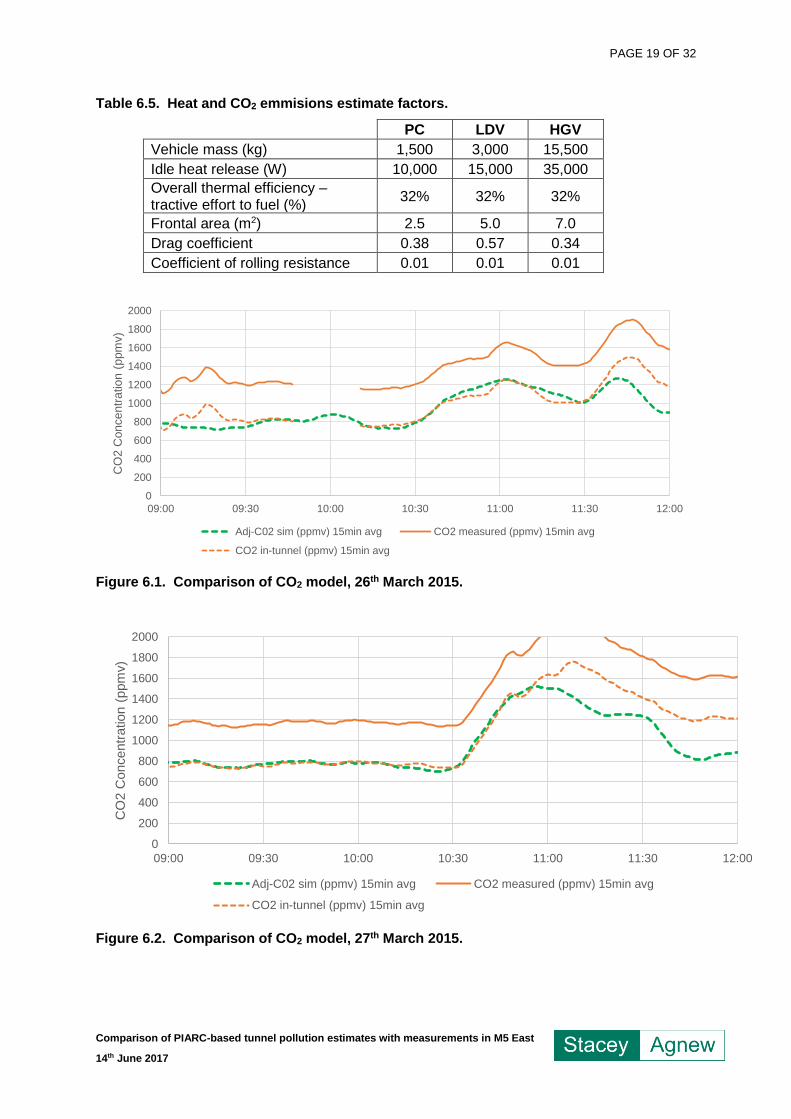
7.1 Results for 26th March 2015
Results for 26th March should be considered up until approximately 11:30 am, with the traffic predictions in the simulation remaining acceptable. Results after this time frame should not be used for comparison.
A calibration of the FTIR measurement system was performed between approximately 9:45 am and 9:55 am, the in-tunnel measurements have not been shown for this period or for a further 15 minutes to accommodate the rolling average calculations.
Figure 7.1 shows a comparison of the airflow in the dominant section with the measured value from in-tunnel sensors, the least squares continuity fit to in-tunnel data, and the simulated results. It is apparent that the simulated airflow closely followed the recorded airflow. The effective velocity of carry-over from Duff St is also shown for informed assessment of the emissions predictions.
Figure 7.1. Comparison of airflow in the dominant section, 26th March 2015
-2
-1
0
1
2
3
4
5
6
7
8
09:00 10:00 11:00 12:00
Air v
elo
city (
m/s
)
SCADA (ASS209) Simulation Least squares fit Carry-over
PAGE 21 OF 32
Comparison of PIARC-based tunnel pollution estimates with measurements in M5 East
14th June 2017
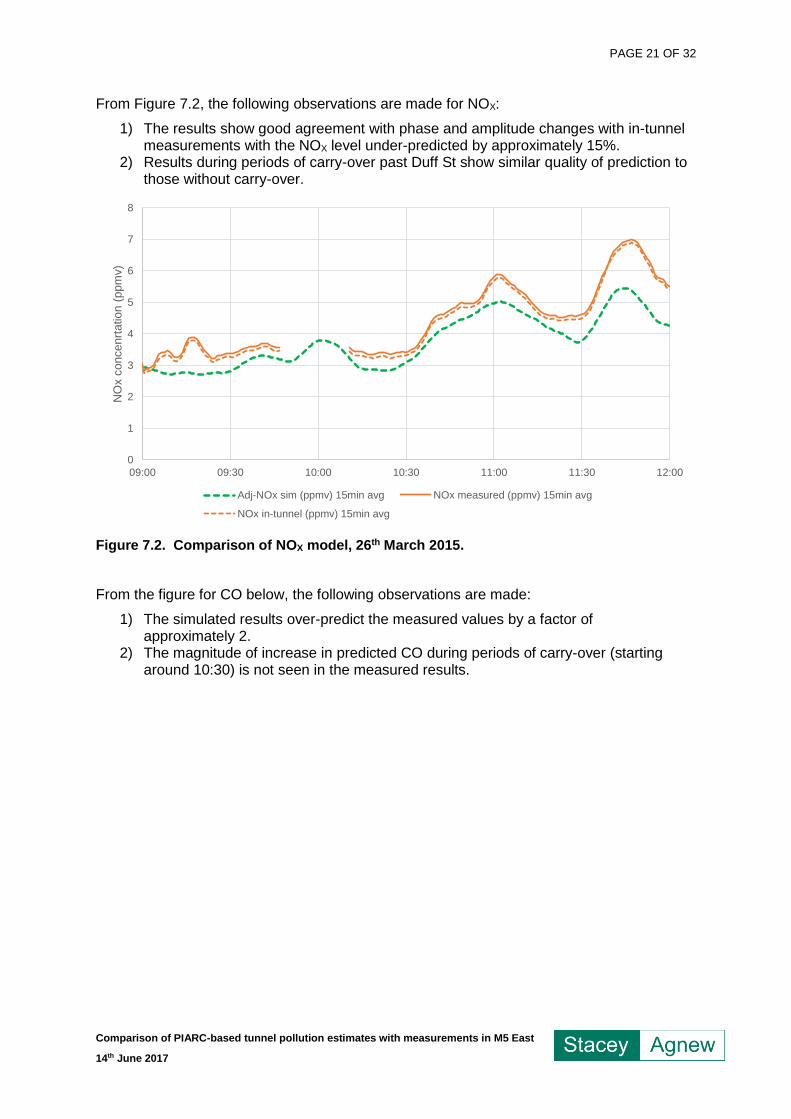
From Figure 7.2, the following observations are made for NOX:
1) The results show good agreement with phase and amplitude changes with in-tunnel measurements with the NOX level under-predicted by approximately 15%.
2) Results during periods of carry-over past Duff St show similar quality of prediction to those without carry-over.
Figure 7.2. Comparison of NOX model, 26th March 2015.
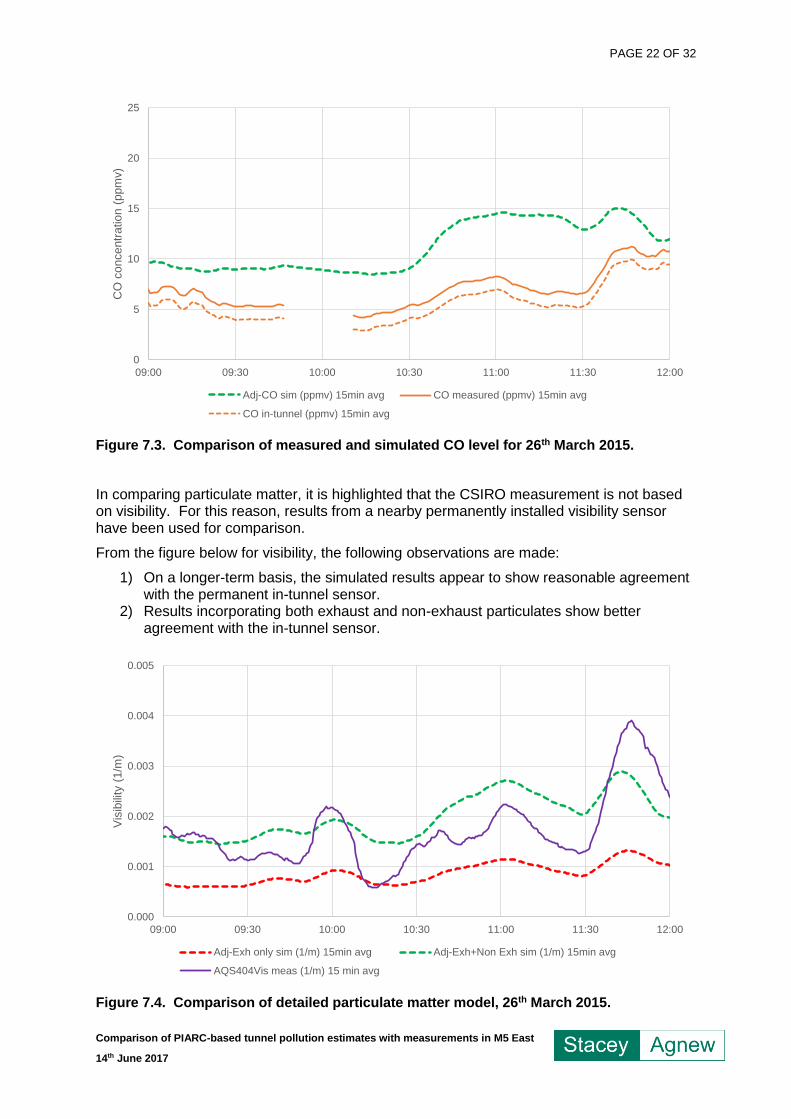
From the figure for CO below, the following observations are made:
1) The simulated results over-predict the measured values by a factor of approximately 2.
2) The magnitude of increase in predicted CO during periods of carry-over (starting around 10:30) is not seen in the measured results.
0
1
2
3
4
5
6
7
8
09:00 09:30 10:00 10:30 11:00 11:30 12:00
NO
x c
oncenrt
ation (
ppm
v)
Adj-NOx sim (ppmv) 15min avg NOx measured (ppmv) 15min avg
NOx in-tunnel (ppmv) 15min avg
PAGE 22 OF 32
Comparison of PIARC-based tunnel pollution estimates with measurements in M5 East
14th June 2017
Figure 7.3. Comparison of measured and simulated CO level for 26th March 2015.
In comparing particulate matter, it is highlighted that the CSIRO measurement is not based on visibility. For this reason, results from a nearby permanently installed visibility sensor have been used for comparison.
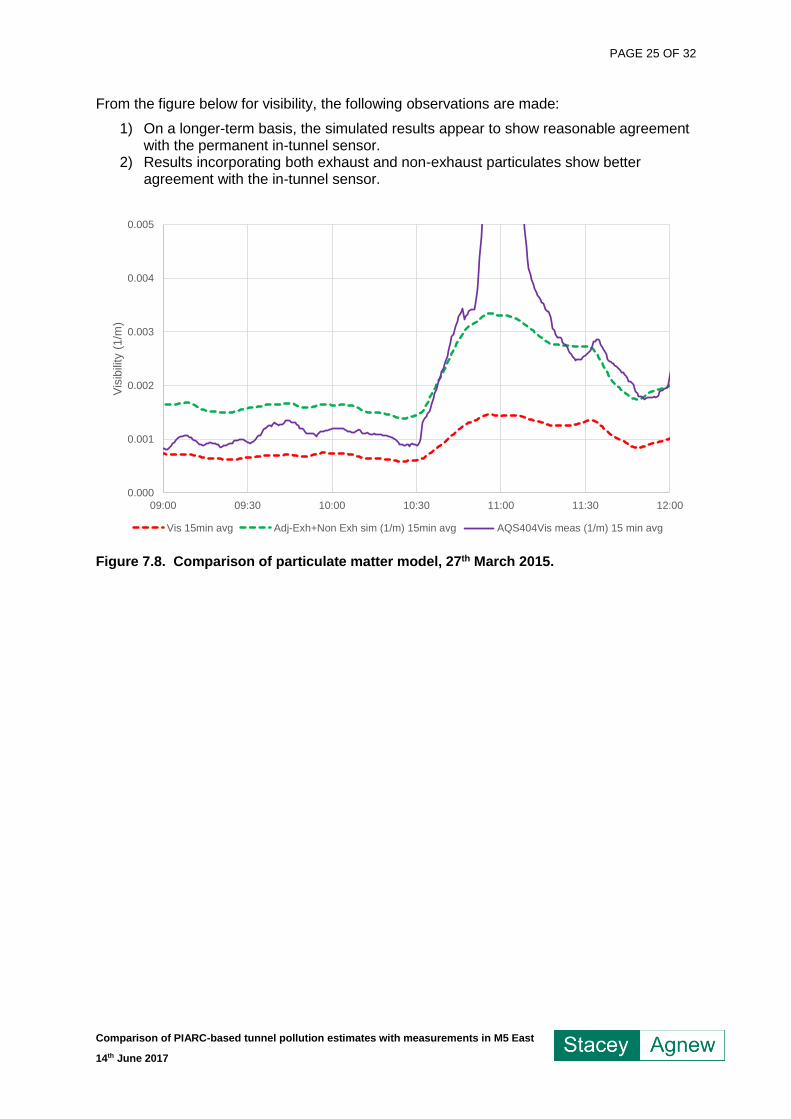
From the figure below for visibility, the following observations are made:
1) On a longer-term basis, the simulated results appear to show reasonable agreement with the permanent in-tunnel sensor.
2) Results incorporating both exhaust and non-exhaust particulates show better agreement with the in-tunnel sensor.
Figure 7.4. Comparison of detailed particulate matter model, 26th March 2015.
0
5
10
15
20
25
09:00 09:30 10:00 10:30 11:00 11:30 12:00
CO
concentr
ation (
ppm
v)
Adj-CO sim (ppmv) 15min avg CO measured (ppmv) 15min avg
CO in-tunnel (ppmv) 15min avg
0.000
0.001
0.002
0.003
0.004
0.005
09:00 09:30 10:00 10:30 11:00 11:30 12:00
Vis
ibili
ty (
1/m
)
Adj-Exh only sim (1/m) 15min avg Adj-Exh+Non Exh sim (1/m) 15min avg
AQS404Vis meas (1/m) 15 min avg
PAGE 23 OF 32
Comparison of PIARC-based tunnel pollution estimates with measurements in M5 East
14th June 2017
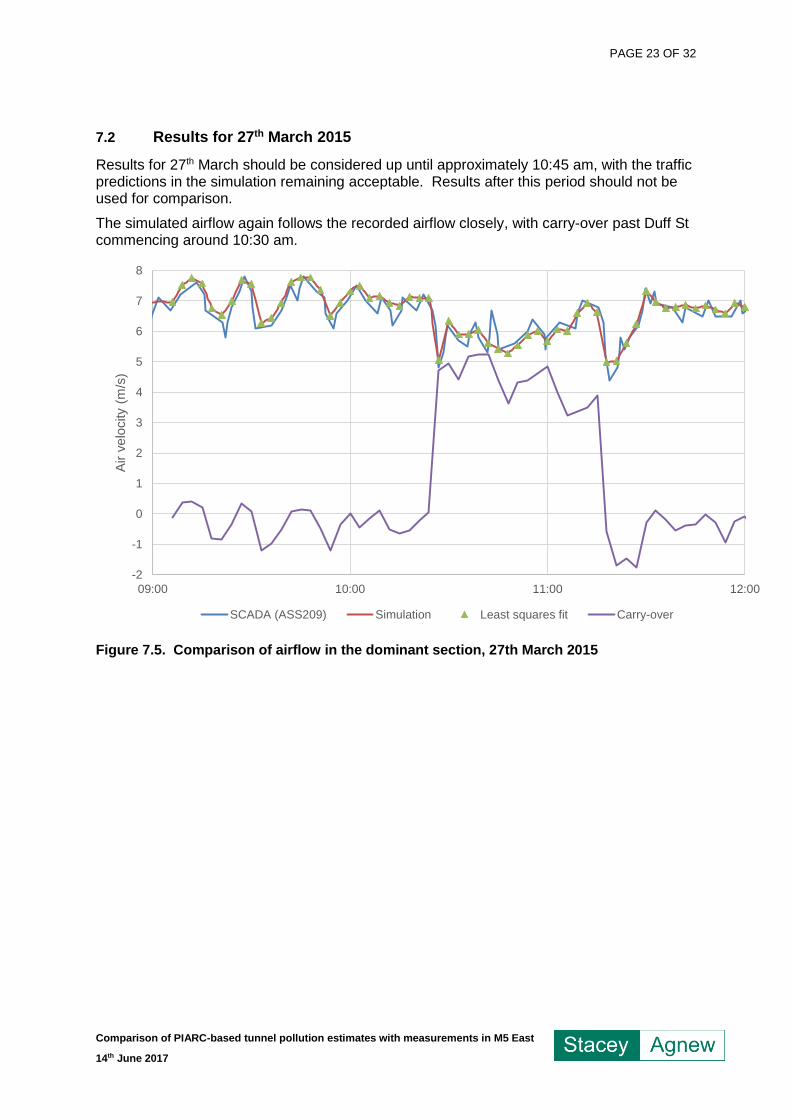
7.2 Results for 27th March 2015
Results for 27th March should be considered up until approximately 10:45 am, with the traffic predictions in the simulation remaining acceptable. Results after this period should not be used for comparison.
The simulated airflow again follows the recorded airflow closely, with carry-over past Duff St commencing around 10:30 am.
Figure 7.5. Comparison of airflow in the dominant section, 27th March 2015
-2
-1
0
1
2
3
4
5
6
7
8
09:00 10:00 11:00 12:00
Air v
elo
city (
m/s
)
SCADA (ASS209) Simulation Least squares fit Carry-over
PAGE 24 OF 32
Comparison of PIARC-based tunnel pollution estimates with measurements in M5 East
14th June 2017
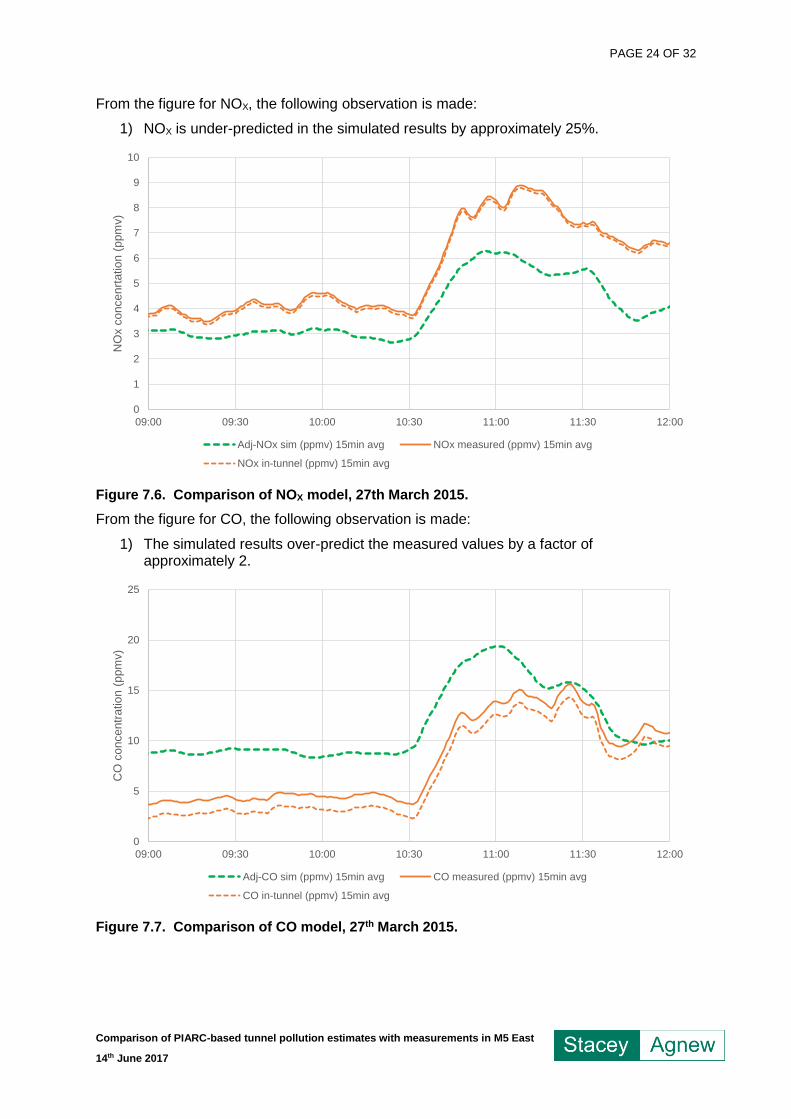
From the figure for NOX, the following observation is made:
1) NOX is under-predicted in the simulated results by approximately 25%.
Figure 7.6. Comparison of NOX model, 27th March 2015.
From the figure for CO, the following observation is made:
1) The simulated results over-predict the measured values by a factor of approximately 2.
Figure 7.7. Comparison of CO model, 27th March 2015.
0
1
2
3
4
5
6
7
8
9
10
09:00 09:30 10:00 10:30 11:00 11:30 12:00
NO
x c
oncenrt
ation (
ppm
v)
Adj-NOx sim (ppmv) 15min avg NOx measured (ppmv) 15min avg
NOx in-tunnel (ppmv) 15min avg
0
5
10
15
20
25
09:00 09:30 10:00 10:30 11:00 11:30 12:00
CO
concentr
ation (
ppm
v)
Adj-CO sim (ppmv) 15min avg CO measured (ppmv) 15min avg
CO in-tunnel (ppmv) 15min avg
PAGE 25 OF 32
Comparison of PIARC-based tunnel pollution estimates with measurements in M5 East
14th June 2017
From the figure below for visibility, the following observations are made:
1) On a longer-term basis, the simulated results appear to show reasonable agreement with the permanent in-tunnel sensor.
2) Results incorporating both exhaust and non-exhaust particulates show better agreement with the in-tunnel sensor.
Figure 7.8. Comparison of particulate matter model, 27th March 2015.
0.000
0.001
0.002
0.003
0.004
0.005
09:00 09:30 10:00 10:30 11:00 11:30 12:00
Vis
ibili
ty (
1/m
)
Vis 15min avg Adj-Exh+Non Exh sim (1/m) 15min avg AQS404Vis meas (1/m) 15 min avg
PAGE 26 OF 32
Comparison of PIARC-based tunnel pollution estimates with measurements in M5 East
14th June 2017
8 NITROGEN DIOXIDE (NO2)
8.1 NO2 emissions estimate
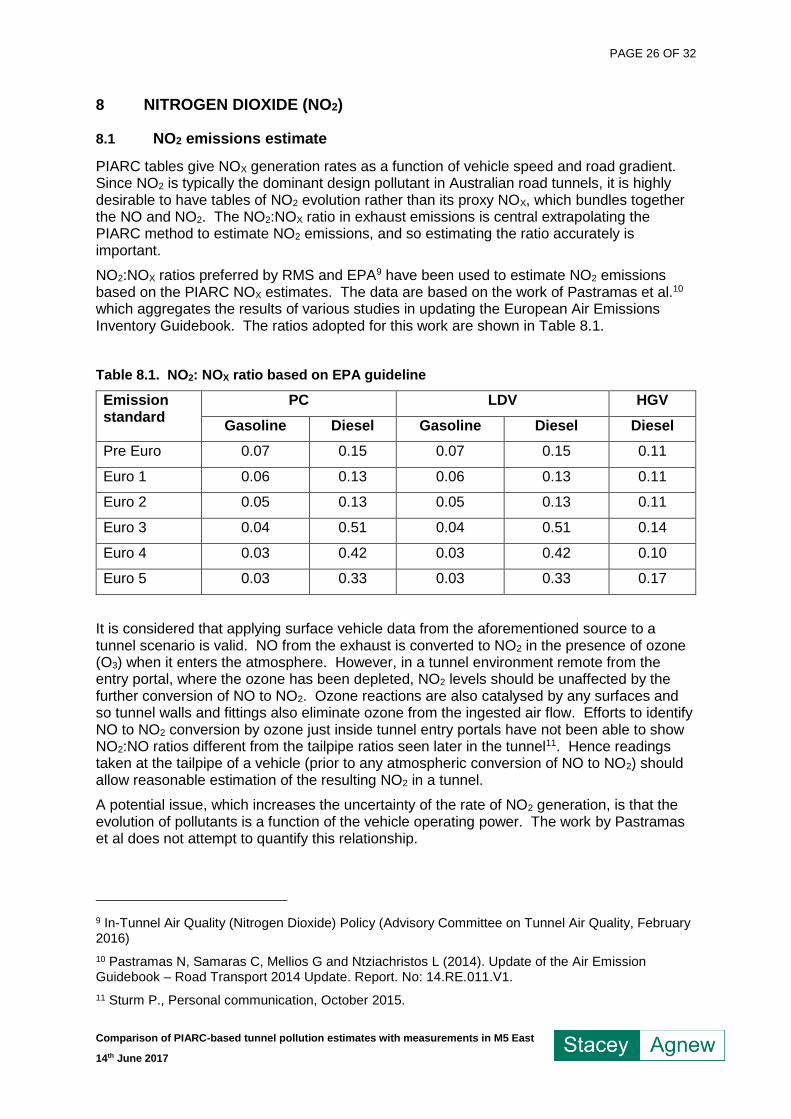
PIARC tables give NOX generation rates as a function of vehicle speed and road gradient. Since NO2 is typically the dominant design pollutant in Australian road tunnels, it is highly desirable to have tables of NO2 evolution rather than its proxy NOX, which bundles together the NO and NO2. The NO2:NOX ratio in exhaust emissions is central extrapolating the PIARC method to estimate NO2 emissions, and so estimating the ratio accurately is important.
NO2:NOX ratios preferred by RMS and EPA9 have been used to estimate NO2 emissions based on the PIARC NOX estimates. The data are based on the work of Pastramas et al.10 which aggregates the results of various studies in updating the European Air Emissions Inventory Guidebook. The ratios adopted for this work are shown in Table 8.1.
Table 8.1. NO2: NOX ratio based on EPA guideline
Emission standard
PC LDV HGV
Gasoline Diesel Gasoline Diesel Diesel
Pre Euro 0.07 0.15 0.07 0.15 0.11
Euro 1 0.06 0.13 0.06 0.13 0.11
Euro 2 0.05 0.13 0.05 0.13 0.11
Euro 3 0.04 0.51 0.04 0.51 0.14
Euro 4 0.03 0.42 0.03 0.42 0.10
Euro 5 0.03 0.33 0.03 0.33 0.17
It is considered that applying surface vehicle data from the aforementioned source to a tunnel scenario is valid. NO from the exhaust is converted to NO2 in the presence of ozone (O3) when it enters the atmosphere. However, in a tunnel environment remote from the entry portal, where the ozone has been depleted, NO2 levels should be unaffected by the further conversion of NO to NO2. Ozone reactions are also catalysed by any surfaces and so tunnel walls and fittings also eliminate ozone from the ingested air flow. Efforts to identify NO to NO2 conversion by ozone just inside tunnel entry portals have not been able to show NO2:NO ratios different from the tailpipe ratios seen later in the tunnel11. Hence readings taken at the tailpipe of a vehicle (prior to any atmospheric conversion of NO to NO2) should allow reasonable estimation of the resulting NO2 in a tunnel.
A potential issue, which increases the uncertainty of the rate of NO2 generation, is that the evolution of pollutants is a function of the vehicle operating power. The work by Pastramas et al does not attempt to quantify this relationship.
9 In-Tunnel Air Quality (Nitrogen Dioxide) Policy (Advisory Committee on Tunnel Air Quality, February 2016)
10 Pastramas N, Samaras C, Mellios G and Ntziachristos L (2014). Update of the Air Emission Guidebook – Road Transport 2014 Update. Report. No: 14.RE.011.V1.
11 Sturm P., Personal communication, October 2015.
PAGE 27 OF 32
Comparison of PIARC-based tunnel pollution estimates with measurements in M5 East
14th June 2017
Tables of NO2 emissions are calculated as the NOX weighted average for each vehicle category as follows, using the PC category for explanation purposes:
𝑞𝑁𝑂2= NO2 emission rate
𝑞𝑁𝑂𝑥= NOX emission rate
𝑓𝑁𝑂2= NO2 NOX ratio from Table 8.1
𝑓𝑓𝑙𝑒𝑒𝑡= Fraction of vehicles within the vehicle category, from Table 6.3.
𝑞𝑁𝑂2(𝑃𝐶)=𝑞𝑁𝑂𝑥(𝑃𝐶 𝐷𝑖𝑒𝑠𝑒𝑙,𝑝𝑟𝑒 𝐸𝑢𝑟𝑜)×𝑓𝑁𝑂2(𝑃𝐶 𝐷𝑖𝑒𝑠𝑒𝑙,𝑝𝑟𝑒−𝐸𝑢𝑟𝑜)×𝑓𝑓𝑙𝑒𝑒𝑡(𝑃𝐶 𝐷𝑖𝑒𝑠𝑒𝑙,𝑝𝑟𝑒−𝐸𝑢𝑟𝑜)
+ 𝑞𝑁𝑂𝑥(𝑃𝐶 𝐷𝑖𝑒𝑠𝑒𝑙,𝐸𝑢𝑟𝑜 1)×𝑓𝑁𝑂2(𝑃𝐶 𝐷𝑖𝑒𝑠𝑒𝑙,𝐸𝑢𝑟𝑜 1)×𝑓𝑓𝑙𝑒𝑒𝑡(𝑃𝐶 𝐷𝑖𝑒𝑠𝑒𝑙,𝐸𝑢𝑟𝑜 1)
+ 𝑞𝑁𝑂𝑥(𝑃𝐶 𝐷𝑖𝑒𝑠𝑒𝑙,𝐸𝑢𝑟𝑜 2)×𝑓𝑁𝑂2(𝑃𝐶 𝐷𝑖𝑒𝑠𝑒𝑙,𝐸𝑢𝑟𝑜 2)×𝑓𝑓𝑙𝑒𝑒𝑡(𝑃𝐶 𝐷𝑖𝑒𝑠𝑒𝑙,𝐸𝑢𝑟𝑜 2)
+ ⋯ … … … … … … … … … … … … … … … … … … … … … … … … … … …+ 𝑞𝑁𝑂𝑥(𝑃𝐶 𝐺𝑎𝑠,𝐸𝑢𝑟𝑜 5)×𝑓𝑁𝑂2(𝑃𝐶 𝐺𝑎𝑠,𝐸𝑢𝑟𝑜 5)×𝑓𝑓𝑙𝑒𝑒𝑡(𝑃𝐶 𝐺𝑎𝑠,𝐸𝑢𝑟𝑜 5)
+ 𝑞𝑁𝑂𝑥(𝑃𝐶 𝐺𝑎𝑠,𝐸𝑢𝑟𝑜 6)×𝑓𝑁𝑂2(𝑃𝐶 𝐺𝑎𝑠,𝐸𝑢𝑟𝑜 6)×𝑓𝑓𝑙𝑒𝑒𝑡(𝑃𝐶 𝐺𝑎𝑠,𝐸𝑢𝑟𝑜 6)
The resulting NO2 tables are used as emissions tables in IDA, with the resultant simulated NO2 and NO2:NOX ratio a function of the vehicle mix (based on the traffic loop data) over time.
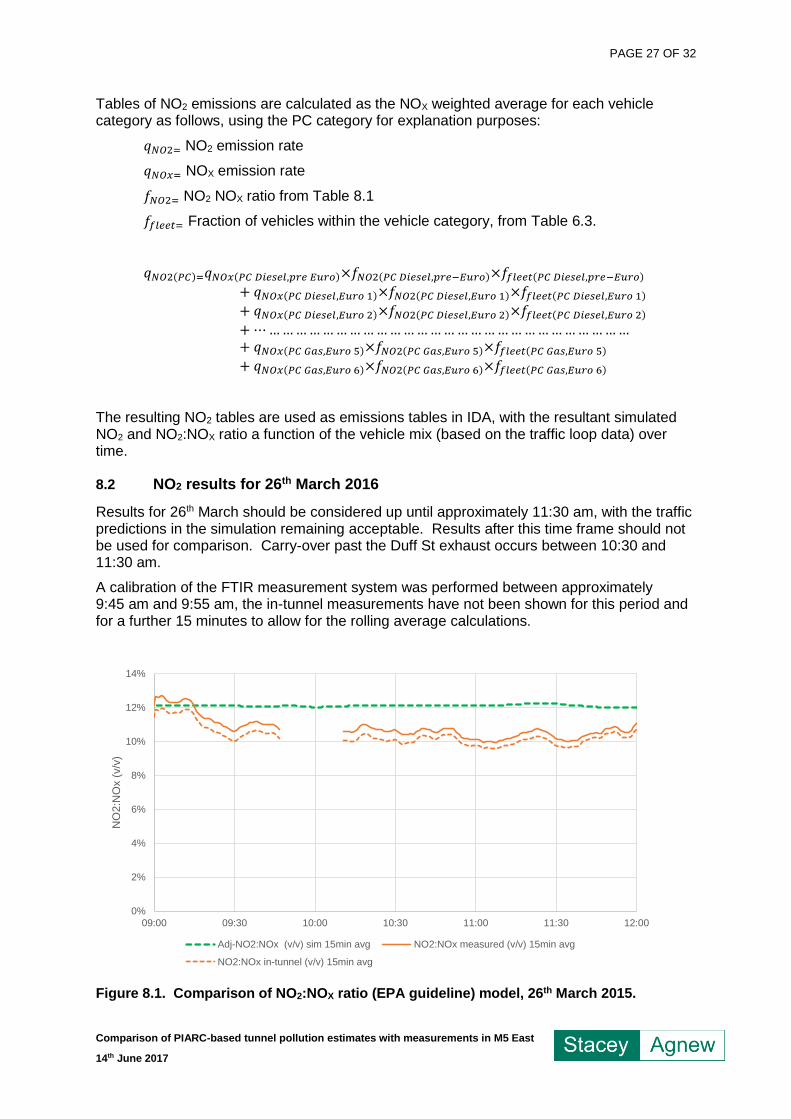
8.2 NO2 results for 26th March 2016
Results for 26th March should be considered up until approximately 11:30 am, with the traffic predictions in the simulation remaining acceptable. Results after this time frame should not be used for comparison. Carry-over past the Duff St exhaust occurs between 10:30 and 11:30 am.
A calibration of the FTIR measurement system was performed between approximately 9:45 am and 9:55 am, the in-tunnel measurements have not been shown for this period and for a further 15 minutes to allow for the rolling average calculations.
Figure 8.1. Comparison of NO2:NOX ratio (EPA guideline) model, 26th March 2015.
0%
2%
4%
6%
8%
10%
12%
14%
09:00 09:30 10:00 10:30 11:00 11:30 12:00
NO
2:N
Ox (
v/v
)
Adj-NO2:NOx (v/v) sim 15min avg NO2:NOx measured (v/v) 15min avg
NO2:NOx in-tunnel (v/v) 15min avg
PAGE 28 OF 32
Comparison of PIARC-based tunnel pollution estimates with measurements in M5 East
14th June 2017
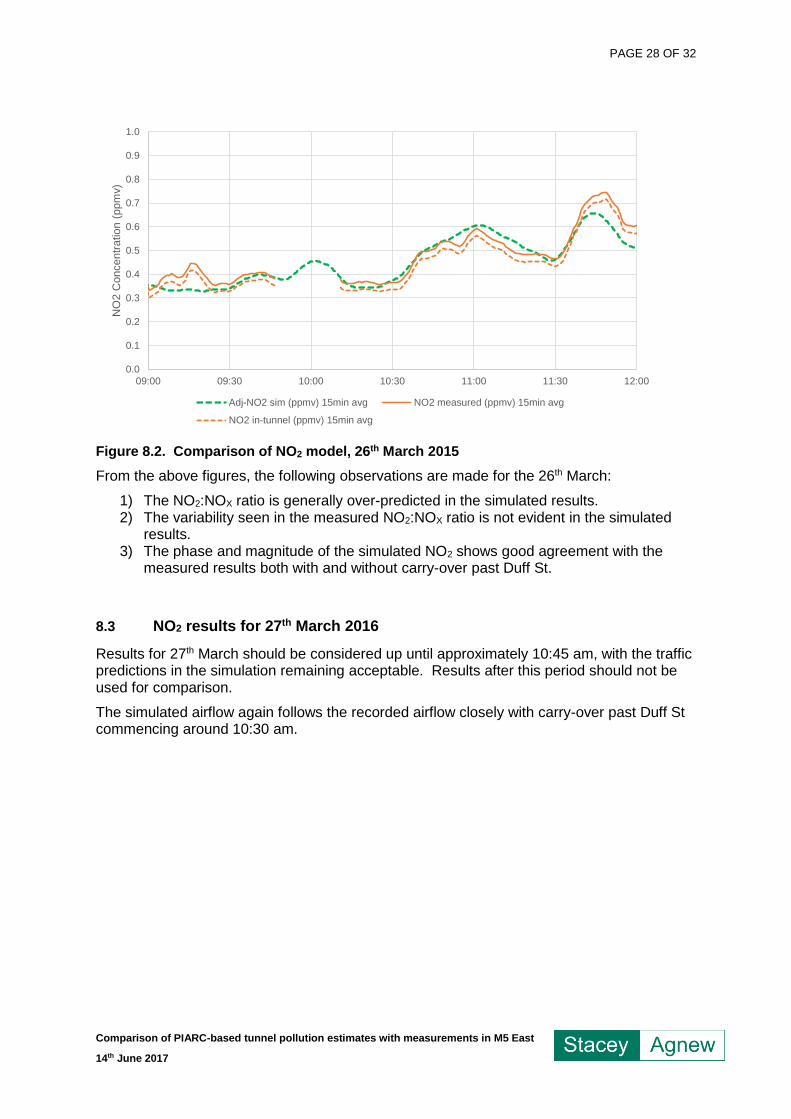
Figure 8.2. Comparison of NO2 model, 26th March 2015
From the above figures, the following observations are made for the 26th March:
1) The NO2:NOX ratio is generally over-predicted in the simulated results. 2) The variability seen in the measured NO2:NOX ratio is not evident in the simulated
results. 3) The phase and magnitude of the simulated NO2 shows good agreement with the
measured results both with and without carry-over past Duff St.
8.3 NO2 results for 27th March 2016
Results for 27th March should be considered up until approximately 10:45 am, with the traffic predictions in the simulation remaining acceptable. Results after this period should not be used for comparison.
The simulated airflow again follows the recorded airflow closely with carry-over past Duff St commencing around 10:30 am.
0.0
0.1
0.2
0.3
0.4
0.5
0.6
0.7
0.8
0.9
1.0
09:00 09:30 10:00 10:30 11:00 11:30 12:00
NO
2 C
on
ce
ntr
atio
n (
ppm
v)
Adj-NO2 sim (ppmv) 15min avg NO2 measured (ppmv) 15min avg
NO2 in-tunnel (ppmv) 15min avg
PAGE 29 OF 32
Comparison of PIARC-based tunnel pollution estimates with measurements in M5 East
14th June 2017
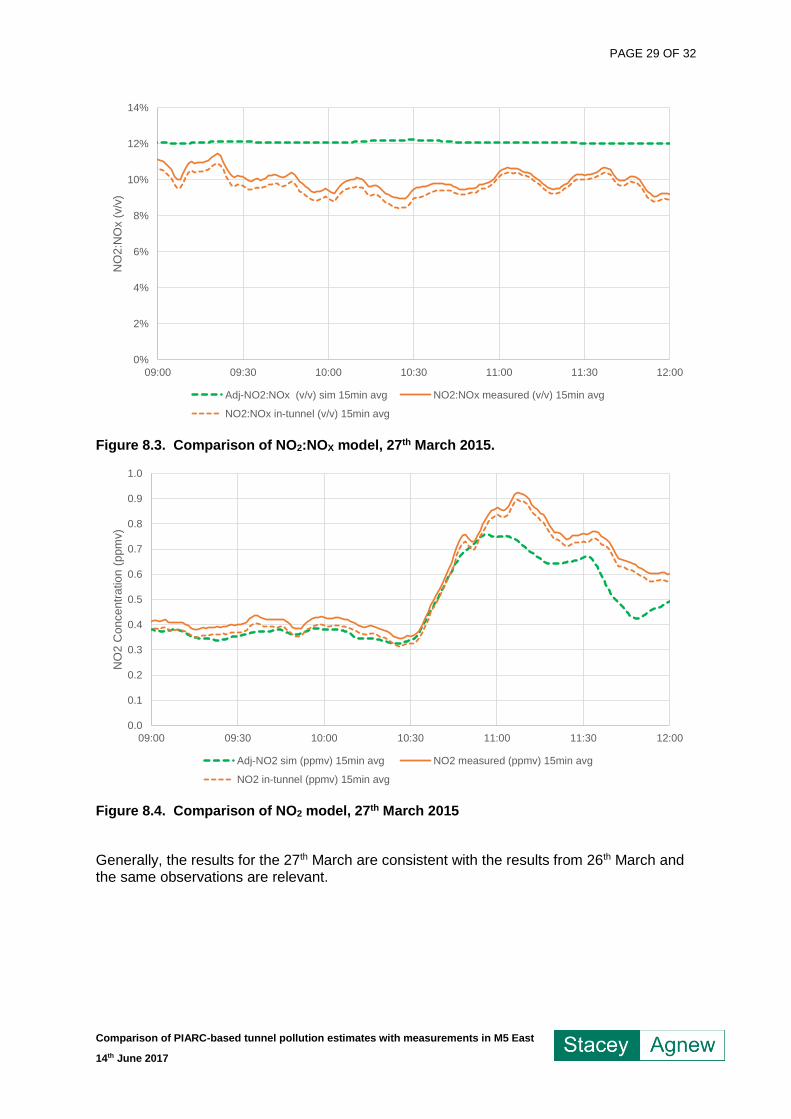
Figure 8.3. Comparison of NO2:NOX model, 27th March 2015.
Figure 8.4. Comparison of NO2 model, 27th March 2015
Generally, the results for the 27th March are consistent with the results from 26th March and the same observations are relevant.
0%
2%
4%
6%
8%
10%
12%
14%
09:00 09:30 10:00 10:30 11:00 11:30 12:00
NO
2:N
Ox (
v/v
)
Adj-NO2:NOx (v/v) sim 15min avg NO2:NOx measured (v/v) 15min avg
NO2:NOx in-tunnel (v/v) 15min avg
0.0
0.1
0.2
0.3
0.4
0.5
0.6
0.7
0.8
0.9
1.0
09:00 09:30 10:00 10:30 11:00 11:30 12:00
NO
2 C
oncentr
ation (
ppm
v)
Adj-NO2 sim (ppmv) 15min avg NO2 measured (ppmv) 15min avg
NO2 in-tunnel (ppmv) 15min avg

PAGE 30 OF 32
Comparison of PIARC-based tunnel pollution estimates with measurements in M5 East
14th June 2017
9 SUMMARY AND DISCUSSION
In reviewing the results presented within this report and any associated conclusions which may be drawn, it is necessary to understand there is a level of uncertainty with the assumptions used in estimating traffic-borne pollutants with the M5 East tunnel, the most important factors being:
• The fleet assumptions (Euro classification) of vehicles within the tunnel at the particular time of tunnel measurements.
• The adjustment of the traffic loop system data within the M5 East tunnel to determine the PIARC pollution category split for the fleet.
In general, the emissions estimate adopting “RMS Fleet Forecast for Tunnel Ventilation Design” and “PIARC detailed method” is seen to provide a reasonable estimate compared to the in-tunnel measurements, showing good correlation in phase and amplitude changes. For application to future design works within NSW, the following is noted.
• CO appears to be over-predicted by a comfortable margin. With CO no longer being the pollutant that controls design, there is no need to take further action on this.
• Incorporating both exhaust and non-exhaust particulates within the PIARC method appears to provide reasonable basis for design with some level of over-prediction evident on that basis. This should be revisited for designs which show visibility as influencing the ventilation provisions to be made.
• NOX appears to be under-estimated for the period of analysis. For in-tunnel design, NOX is not a driving factor.
• NO2 is generally the pollutant which drives ventilation design. Combining the PIARC NOX estimate with NO2:NOX ratios based on the work of Pastramas et al gives an NO2 prediction which shows good correlation with in-tunnel measurements within a range of ± 10%. That is; the predicted figures need no adjustment for use in design.
PAGE 31 OF 32
Comparison of PIARC-based tunnel pollution estimates with measurements in M5 East
14th June 2017
APPENDIX A - LIST OF REFERENCE DRAWINGS
Number Rev Title
ACC201 X Bexley Rd Cut & Cover, General Arrangement, Plan & Elevations
ACC601 X Princess Highway Ramp, General Arrangement, Plan and Longitudinal Sections
ACH201 X Mainline Westbound, Plan and Longitudinal Section, Sheet 1 of 6
ACH202 X Mainline Westbound, Plan and Longitudinal Section, Sheet 2 of 6
ACH203 X Mainline Westbound, Plan and Longitudinal Section, Sheet 3 of 6
ACH204 X Mainline Westbound, Plan and Longitudinal Section, Sheet 4 of 6
ACH205 X Mainline Westbound, Plan and Longitudinal Section, Sheet 5 of 6
ACH206 X Mainline Westbound, Plan and Longitudinal Section, Sheet 6 of 6
ACH221 X Mainline Eastbound, Plan and Longitudinal Section, Sheet 1 of 6
ACH222 X Mainline Eastbound, Plan and Longitudinal Section, Sheet 2 of 6
ACH223 X Mainline Eastbound, Plan and Longitudinal Section, Sheet 3 of 6
ACH224 X Mainline Eastbound, Plan and Longitudinal Section, Sheet 4 of 6
ACH225 X Mainline Eastbound, Plan and Longitudinal Section, Sheet 5 of 6
ACH226 X Mainline Eastbound, Plan and Longitudinal Section, Sheet 6 of 6
ACT101 X Mainline Tunnels, General Arrangement, Sheet 1 of 3
ACT102 X Mainline Tunnels, General Arrangement, Sheet 2 of 3
ACT103 X Mainline Tunnels, General Arrangement, Sheet 3 of 3
ACT321 X Marsh Street Ramps, Eastbound Exit Ramp, Excavation Sequence Plan and Longitudinal Section
ACT322 X Marsh Street Ramps, Westbound Entry Ramp, Excavation Sequence Plans and Longitudinal Section Sheet 1 of 2
ACT323 X Marsh Street Ramps, Westbound Entry Ramp, Excavation Sequence Plans and Longitudinal Section Sheet 2 of 2
ACT402 X Princess Highway Exit Ramp, Plan and Longitudinal Section, Chainage 380 to 478
ACT451 X Princess Highway Exit Ramp, Excavation Sequence, Plan and Longitudinal Section, Ramp Chainage 153 to 170
ACT452 X Princess Highway Exit Ramp, Excavation Sequence, Plan and Longitudinal Section, Ramp Chainage 170 to 380
AEC503 X Marsh Street Cut & Cover, Eastbound Exit Ramp, General Arrangement Sheet 3
AEC504 X Marsh Street Cut & Cover, Westbound Entry Ramps, General Arrangement
AEC552 X Marsh Street Interchange, Structures Between CH11070 & CH11150, Wall Elevations
M142/SD4/1702 A1 M5 East Tunnel Ventilation, System Schematic

PAGE 32 OF 32
Comparison of PIARC-based tunnel pollution estimates with measurements in M5 East
14th June 2017
Number Rev Title
M142/DGV/10000 F Air Monitoring System, Tunnel Monitoring, Equipment Locations
M142/SD4/1802 A1 Main Tunnel Ventilation System, Jet Fan Location Sheet 1 of 3
M142/SD4/1803 A1 Main Tunnel Ventilation System, Jet Fan Location Sheet 2 of 3
M142/SD4/1804 A1 Main Tunnel Ventilation System, Jet Fan Location Sheet 3 of 3


![Upgrading the Karavanken Tunnel According to the EU ... · est version of the Austrian guide line RVS 9.262 (09.02.32) [4] and the PIARC 2004 [6] recommendation. 4.1Short comings](https://img.pdfslide.us/doc/110x75/60b2aac4d150b62e444b68ae/upgrading-the-karavanken-tunnel-according-to-the-eu-est-version-of-the-austrian.jpg)