Embed Size (px)
Citation preview
i
Comparison of Plain-Concrete and Glass-Fiber-
Reinforced-Concrete Beams with Different Flexural and
Shear Reinforcement
By
Faheem Ahmad Gul
(MCE153021)
MASTER OF SCIENCE IN CIVIL ENGINEERING
(With Specialization in Structures)
APRIL 2017
DEPARTMENT OF CIVIL ENGINEERING
CAPITAL UNIVERSITY OF SCIENCE & TECHNOLOGY
ISLAMABAD, PAKISTAN
ii
Comparison of Plain-Concrete and Glass-Fiber-
Reinforced-Concrete Beams with Different Flexural and
Shear Reinforcement
By
Faheem Ahmad Gul
(MCE153021)
A research thesis submitted to the Department of Civil Engineering,
Capital University of Science & Technology, Islamabad, Pakistan
in partial fulfillment of the requirements for the degree of
MASTER OF SCIENCE IN CIVIL ENGINEERING
(With Specialization in Structures)
APRIL 2017
DEPARTMENT OF CIVIL ENGINEERING
CAPITAL UNIVERSITY OF SCIENCE & TECHNOLOGY
ISLAMABAD, PAKISTAN
iii
CAPITAL UNIVERSITY OF SCIENCE & TECHNOLOGY
ISLAMABAD
CERTIFICATE OF APPROVAL
COMPARISON OF PLAIN-CONCRETE AND GLASS-FIBER-REINOFORCED-CONCRETE
BEAMS WITH DIFFERENT FLEXURAL AND SHEAR REINFORCEMENT
By
Faheem Ahmad Gul
(MCE153021)
THESIS EXAMINING COMMITTEE
S No Examiner Name Organization
(a) External Examiner Engr. Dr. Rao Arsalan NUST, Islamabad, Pakistan
(b) Internal Examiner Engr. Dr. Munir Ahmed CUST, Islamabad, Pakistan
(c) Supervisor Engr. Dr. Majid Ali CUST, Islamabad, Pakistan
________________________________
Engr. Dr. Majid Ali
Thesis Supervisor
April, 2017
______________________________ ___________________________
Engr. Dr. Ishtiaq Hassan Prof. Engr. Dr. Imtiaz Ahmad Taj
Head Dean
Department of Civil Engineering Faculty of Engineering
CUST, Islamabad, Pakistan CUST, Islamabad, Pakistan
Dated: April, 2017 Dated: April, 2017
`
iv
Certificate
This is to certify that Mr. Faheem Ahmad Gul (Reg # MCE153021) has incorporated all
observations, suggestions and comments made by the external as well as the internal examiners
and thesis supervisor. The title of his thesis is: “Comparison of Plain-Concrete and Glass-Fiber-
Reinforced-Concrete Beams with Different Flexural and Shear Reinforcement”.
Forwarded for necessary action.
Engr. Dr. Majid Ali
(Thesis Supervisor)
v
DEDICATION
This exertion is committed to my regarded and loving parents, who helped me through every
troublesome of my life and sacrificed all the comforts of their lives for my bright future. This
is also a tribute to my best instructors who guided me to confront the difficulties of existence
with persistence and fearlessness, and who made me what I am today.
Faheem Ahmad Gul
(Reg # 153021)
vi
ACKNOWLEDGEMENTS
1. Wealthiest thanks to Almighty Allah for a tremendous measure of vitality, power and
the miraculous pushes occurring in a sweetly coordinated manner, only a few to
mention, which drive our lives.
2. This thesis appears in its current form is due to the guidance of my supervisor. I
express my gratefulness to my advisor Engr. Dr. Majid Ali. His advice and support
throughout the preparation of this research and thesis is sincerely appreciated. His
part in creating me as a researcher will never be forgotten. I have never seen such a
genuine, capable and persevering teacher/professional trainer like him. It is a great
honor for me to work with him on this research.
3. The materials donation and testing support from Department of Civil Engineering,
CUST is gratefully acknowledged. I am also exceptionally grateful to Engr. Mehran
Khan for his kind support during this research.
4. I am deeply and forever obligated to my parents for their affection, support and
encouragement. I am also extremely thankful to my siblings who upheld me in every
single moment of my life.
vii
TABLE OF CONTENTS
DEDICATION ........................................................................................................................... v
ACKNOWLEDGEMENTS ...................................................................................................... vi
TABLE OF CONTENTS ......................................................................................................... vii
LIST OF TABLES .................................................................................................................... ix
LIST OF FIGURES ................................................................................................................... x
LIST OF ABBREVIATIONS ................................................................................................... xi
ABSTRACT ............................................................................................................................ xiv
LIST OF INTENDED PUBLICATIONS ............................................................................... xvi
CHAPTER 1 INTRODUCTION ....................................................................................... 1
Prologue ...................................................................................................................... 1 1.1
Research Motivation and Problem Statement ............................................................ 2 1.2
Overall / Specific Research Objectives and Scope of Work ...................................... 3 1.3
Research Methodology ............................................................................................... 3 1.4
Thesis Layout .............................................................................................................. 4 1.5
CHAPTER 2 LITERATURE REVIEW ................................................................................ 6
Background ...................................................................................................................... 6 2.1
EAMC in Bridge Girders ................................................................................................. 6 2.2
Fiber Reinforced Concrete Without and With Steel Rebars ............................................ 7 2.3
2.3.1 Fiber Reinforced Concrete without Steel Reinforcement ....................................7
2.3.2 Fiber Reinforced Concrete with Steel Reinforcement .......................................11
Design Equations for Moment Capacities ...................................................................... 13 2.4
Summary ........................................................................................................................ 14 2.5
CHAPTER 3 EXPERIMENTAL PROCEDURES ............................................................. 16
Background ............................................................................................................... 16 3.1
Raw Materials, MD and Casting Procedures of PC and GFRC ................................ 16 3.2
Specimens.................................................................................................................. 17 3.3
3.3.1 Specimens for Material-properties .....................................................................17
3.3.2 Specimens with Steel Reinforcement .................................................................17
Procedures for Testing ............................................................................................. 20 3.4
For Material-properties of Fresh and Hard Concrete .........................................20 3.4.1
For Beam-lets with Steel Rebars ........................................................................20 3.4.2
Summary ................................................................................................................... 21 3.5
viii
CHAPTER 4 ANALYSIS AND RESULTS ....................................................................... 22
Background ............................................................................................................... 22 4.1
Material-properties of PC and GFRC........................................................................ 22 4.2
4.2.1 Slump of Fresh Concrete and Density of Hard Concrete ...................................22
4.2.2 Behavior in Compression ...................................................................................22
4.2.3 Behavior in Splitting-tension .............................................................................23
4.2.4 Behavior in Flexure ............................................................................................24
Properties and Behavior of Steel-reinforced Specimens ........................................... 27 4.3
4.3.1 Beam-lets with Varying Flexural Reinforcement and Constant Shear
Reinforcement (Ø6-76 mm) ...............................................................................27
4.3.2 Beam-lets with Varying Shear Reinforcement and Constant Flexural
Reinforcement (3-Ø6) ........................................................................................34
Summary ................................................................................................................... 41 4.4
CHAPTER 5 DISCUSSION ............................................................................................... 42
5.1 Background ............................................................................................................... 42
5.2 Trend Comparison of Material-properties with Previous Studies ............................. 42
5.3 Trend Comparison of Steel-reinforced GFRC with Steel-reinforced FRC ............... 43
5.4 Modified Design Equation for Moment Capacity ..................................................... 43
5.4.1 Prediction of Moment Capacities .......................................................................44
5.4.2 Prediction of Shear Capacities ...........................................................................47
5.5 Improvement in EAMC ............................................................................................. 47
Summary ................................................................................................................... 48 5.6
CHAPTER 6 CONCLUSIONS AND RECOMMENDATIONS ....................................... 49
6.1 Conclusions ............................................................................................................... 49
6.2 Recommendations ..................................................................................................... 50
REFERENCES ........................................................................................................................ 51
ANNEXURES ......................................................................................................................... 55
ix
LIST OF TABLES
Table 2-1 Different types of fibers and their benefits ............................................................... 8
Table 2-2 CS, SS and MoR of PC and GFRC by Previous Studies ........................................ 10
Table 3-1 Labelling scheme of beam-lets with steel rebars ..................................................... 17
Table 4-1 W/C ratio, slump, and density of plain concrete and glass-fiber-reinforced-
concrete ................................................................................................................... 23
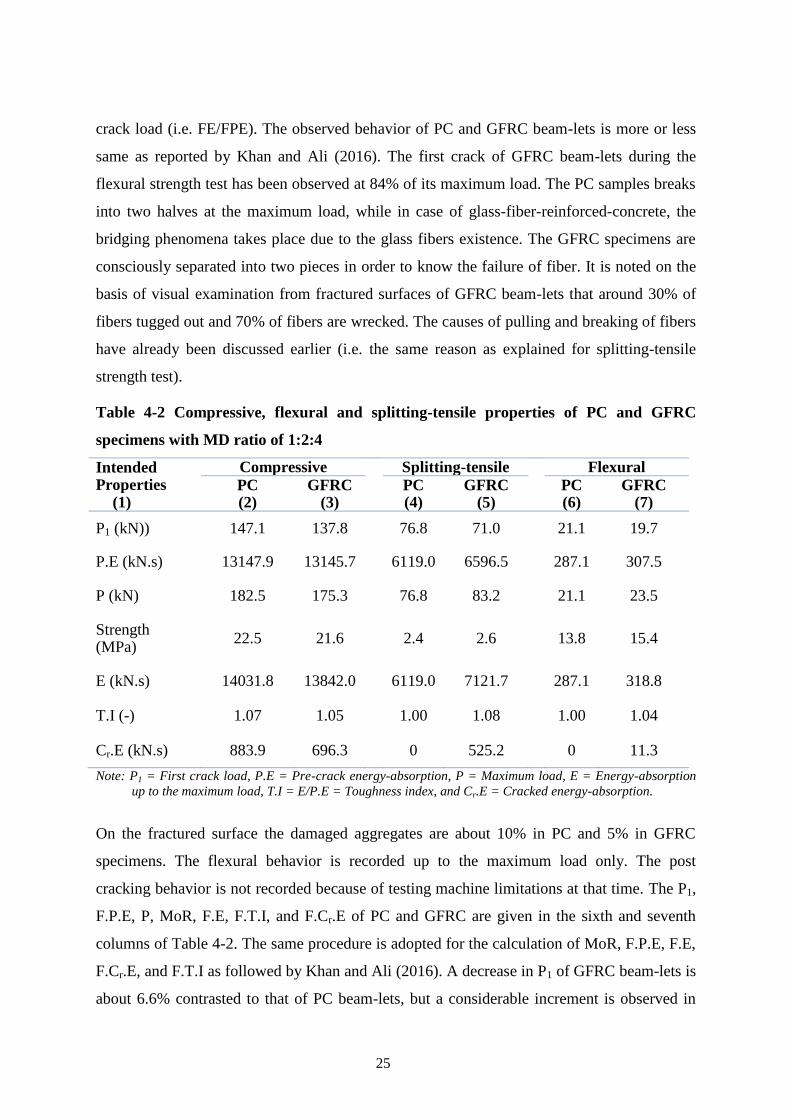
Table 4-2 Compressive, flexural and splitting-tensile properties of PC and GFRC
specimens with MD ratio of 1:2:4 ........................................................................... 25
Table 4-3 Experimental results (loads and deflections) of tested specimens with varying
flexural reinforcement and constant shear reinforcement (Ø6-76 mm) .................. 32
Table 4-4 Comparison of strength, energy-absorption, and toughness index of beams-
lets with varying flexural reinforcement and constant shear reinforcement
(Ø6-76 mm) ............................................................................................................. 35
Table 4-5 Experimental results (loads and deflections) of tested specimens with varying
shear reinforcement and constant flexural reinforcement (3-Ø6) ........................... 38
Table 4-6 Comparison of strength, energy-absorption, and toughness index of beams-
lets with varying shear reinforcement and constant flexural reinforcement (3-
Ø6) .......................................................................................................................... 40
Table 5-1 Comparison of experimental and theoretical moment capacities of beam-lets
with varying flexural reinforcement and constant shear reinforcement (Ø6-76
mm) ......................................................................................................................... 45
Table 5-2 Comparison of experimental and theoretical shear capacities of beam-lets
with varying shear reinforcement and constant flexural reinforcement (3-Ø6
i.e. ρ = 0.018) .......................................................................................................... 46
x
LIST OF FIGURES
Figure 2-1 Observed EAMC in recently constructed concrete bridge girder ............................ 7
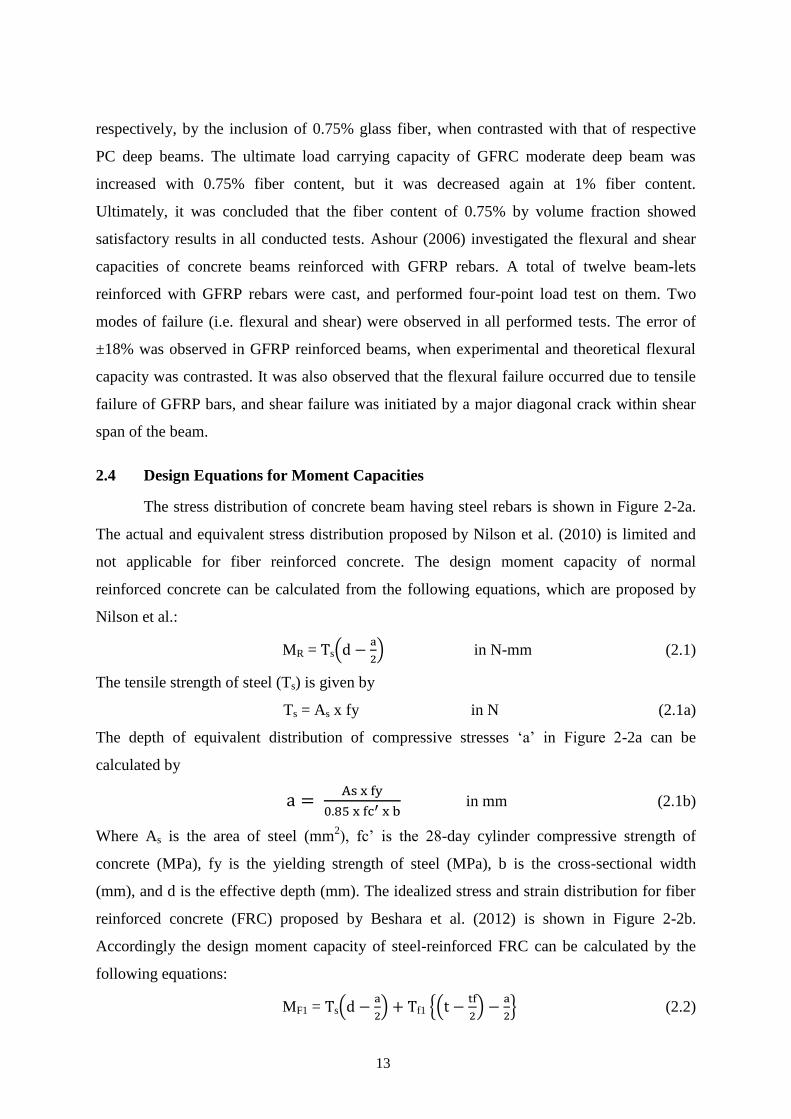
Figure 2-2 Stress distribution of concrete beam having steel rebars: (a) for plain
concrete by Nilson et al. (2010), and (b) for fiber reinforced concrete by
Beshara et al. (2012) ............................................................................................... 14
Figure 3-1 Structural details of beam-lets with steel rebars: (a) cross-sections of PC, (b)
cross-sections of GFRC, and (c) elevation of beam-lets with a decrease in
shear reinforcement ................................................................................................. 19
Figure 3-2 Testing of beam-lets with rebars: (a) schematic diagram, and (b)
experimental setup .................................................................................................. 20
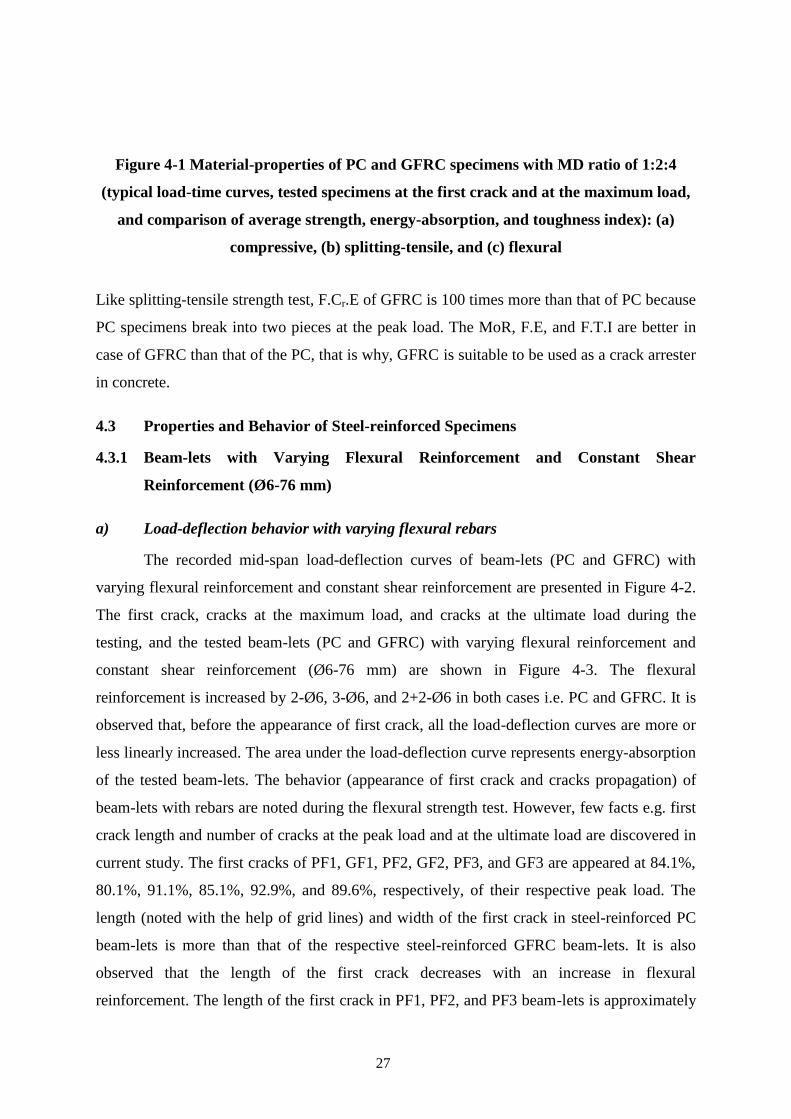
Figure 4-1 Material-properties of PC and GFRC specimens with MD ratio of 1:2:4
(typical load-time curves, tested specimens at the first crack and at the
maximum load, and comparison of average strength, energy-absorption, and
toughness index): (a) compressive, (b) splitting-tensile, and (c) flexural ............... 27
Figure 4-2 Load-deflection curve of specimens with an increase in flexural
reinforcement: (a) 2-Ø6, (b) 3-Ø6, and (c) 2+2-Ø6 ................................................ 28
Figure 4-3 Behavior of specimens with varying flexural reinforcement and constant
shear reinforcement (Ø6-76 mm) ............................................................................ 31
Figure 4-4 Load-deflection curve of specimens with a decrease in shear reinforcement:
(a) Ø6-64 mm, (b) Ø6-76 mm, and (c) Ø6-89 mm ................................................. 36
Figure 4-5 Behavior of specimens with varying shear reinforcement and constant
flexural reinforcement (3-Ø6) ................................................................................. 38
Figure A1: Material-properties of PC and GFRC specimens with MD ratio of 1:2:4
(load-time curves and tested specimens at the first crack and at the maximum
load): (a) compressive, (b) splitting-tensile, and (c) flexural .................................. 55
xi
LIST OF ABBREVIATIONS
A = Aggregate
As = Area of steel
BFRC = Basalt fiber reinforced concrete
C = Cement
C.E = Compressive energy-absorption
C.P.E = Compressive pre-crack energy-absorption
Cr.E = Cracked energy-absorption
C.Cr.E = Compressive cracked energy-absorption
CS = Compressive strength
C.T.I = Compressive toughness index
d = Effective depth
E = Energy-absorption up to the maximum load
EAMC = Early-age micro crack
Ef = Energy absorbed up to the first crack
Em = Energy absorbed from the first crack to the maximum load
Eu = Energy absorbed from the maximum load to the ultimate load
fc’ = Compressive strength of concrete
fy = Yielding strength of steel
F.E = Flexural energy-absorption
F.Cr.E = Flexural cracked energy-absorption
F.P.E = Flexural pre-crack energy-absorption
FRC = Fiber reinforced concrete
F.S = Flexural strength
F.T.I = Flexural toughness index
GF = Glass fiber
GFRC = Glass-fiber-reinforced-concrete
GFRP = Glass fiber reinforced polymer
t = Height of beam-let
HPC = High performance concrete
MD = Mix-design
Mexp = Experimental moment capacity
MF1 = Theoretical moment capacity of fiber reinforced concrete proposed by
xii
Beshara et al. (2012)
MF2 = Theoretical moment capacity of fiber reinforced concrete proposed by
Authors (Gul and Ali)
MR = Theoretical moment capacity of normal reinforced concrete
Mtheo = Theoretical moment capacity
MoR = Modulus of rupture
NFRC = Nylon-fiber-reinforced-concrete
P = Maximum load for material-properties
P1 = First crack load for material-properties
PC = Plain concrete
P.E = Pre-crack energy-absorption
PFRC = Polypropylene fiber reinforced concrete
Pf = First cracking load for steel-reinforced beam-lets (PC and GFRC)
Pm = Maximum load for steel-reinforced beam-lets (PC and GFRC)
Pu = Ultimate load for steel-reinforced beam-lets (PC and GFRC)
S = Sand
S.E = Splitting-tensile energy-absorption
S.Cr.E = Splitting-tensile cracked energy-absorption
SFRC = Steel fiber reinforced concrete
S.P.E = Splitting-tensile pre-crack energy-absorption
S.S = Splitting-tensile strength
S.T.I = Splitting-tensile toughness index
τf = Increased flexural strength of glass-fiber-reinforced-concrete w.r.t PC
with the same MD ratio
Ts = Tensile strength of steel
Tf1 = Tensile strength of FRC proposed by Beshara et al. (2012)
Tf2 = Tensile strength of FRC proposed by the authors (Gul and Ali)
T.E = Total energy-absorption
T.I = Toughness index
T.T.I = Total toughness index
Vexp = Experimental shear capacity
Vtheo = Theoretical shear capacity
w/c = Water-cement
xiii
∆ = Deflection
ρ = Steel ratio
xiv
ABSTRACT
Many defects have been found in concrete bridge girders by means of historical
assessment, including early-age-micro-cracks (EAMC), surface erosion, blisters, spalling,
crazing, scaling, and mortar flaking. Among all these defects, EAMC is the major defect
which conclusively mitigates durability and serviceability of concrete bridge girders. The
factors which cause EAMC in concrete are high compressive strength gained by high cement
content, temperature variation, water content, and shrinkage strain. The low tensile strength
also provides less resistance to EAMC. The rate of cracking in concrete can be reduced by
enhancing its tensile, compressive and flexural strengths. These improved mechanical
properties will help to reduce the flaws in concrete bridge girders. The concept of using fibers
to enhance the concrete mechanical properties is very old. The use of glass fibers as
reinforcement in matrix has gained considerable attention due to its low density, more
ductility, lightweight, and resistant to heat.
The overall aim of the research is to enhance concrete mechanical properties to
control EAMC in concrete bridge girders along with the considerable control of other flaws
by using fiber reinforced concrete (FRC). In this work, firstly glass-fiber-reinforced-concrete
(GFRC) is examined for the increase in compressive strength (CS), splitting-tensile strength
(SS), and modulus of rupture (MoR) by comparing it with that of plain concrete (PC), and
secondly GFRC beam-lets with flexural and shear reinforcements are investigated for the
increase in flexural strength (FS) by comparing it with that of respective PC beam-lets. The
mix-design (MD) ratio of PC is 1:2:4 (cement: sand: aggregate) with w/c ratio of 0.7. Glass
fibers (GF) having a 50 mm length and 5% fiber content by mass of cement, with the same
MD as that of PC, are used to prepare GFRC. For the first task, the material-properties of
specimens with MD ratio of 1:2:4 have been determined and contrasted with that of
1:3.33:1.67 (a previous study). This comparison is made in order to study the trend of
material-properties and behavior of specimens. For the second task, experimental behaviors
of PC and GFRC with varying flexural and shear reinforcement are studied. Their strengths,
energy-absorptions, and toughness indices are determined. Finally, a design equation of the
moment capacity of FRC is modified for predicting the moment capacity of GFRC.
The tests are performed on PC and GFRC in the fresh and hardened state. The slump
of GFRC is decreased by 50% when contrasted with that of respective PC. For MD ratio of
1:2:4, the considerable increase in SS and MoR of GFRC are 8.3% and 11.6%, respectively,
but CS of GFRC decreases by 4% when contrasted with that of respective PC. Almost, the
xv
same trend was observed with MD ratio of 1:3.33:1.67. It is also observed that the FS,
energy-absorption, and toughness index of GFRC beam-lets with varying flexural
reinforcement are increased up to 9.2%, 31.7%, and 17.5%, respectively. An increment of
8.8%, 30%, and 11% is observed in GFRC with varying shear reinforcement for FS, energy-
absorption, and toughness index, respectively, when contrasted with that of their respective
PC beam-lets. The modified design equation for the precise prediction of moment and shear
capacities has an error of 15% and 9%, respectively. It is concluded that GFRC with flexural
and shear reinforcements is appropriate for mitigating EAMC in concrete bridge girders.

xvi
LIST OF INTENDED PUBLICATIONS
Intended journal article
Gul, F.A., and Ali, M. (2017). “Behavior of glass-fiber-reinforced-concrete with flexural and
shear rebars for controlling early-age micro crack in bridge girders”. Materiales de
Construcción. (ISI Impact Factor = 0.960), (Under Review).
1
CHAPTER 1
INTRODUCTION
Prologue 1.1
Plain concrete (PC) is a brittle material. Brittleness of PC is the main cause of
shrinkage cracks (Panzera et al. 2013). Many flaws have been found in concrete bridge
girders, including early-age micro crack (EAMC), surface erosion, blisters, spalling, crazing,
scaling, and mortar flaking (NZ Transport Agency 2001). Among these flaws, EAMC is the
dominant defect which conclusively mitigates durability and serviceability of the structure,
reported by Schmitt and Darwin (1999), Folliard (2003), Darwin et al. (2004), Saadeghvaziri
and Hadidi (2005), Qiao et al. (2010), Wright et al. (2014), Mazzoli et al. (2015), Khan and
Ali (2016), and Fu et al. (2016). Controlling EAMC will also help to reduce the other flaws
of bridge girders. Therefore, certain properties of concrete need to be enhanced to control
EAMC. The factors which cause EAMC are rapid loss of water from concrete in the fresh
state, the sudden rise of temperature, chemical reactions or any other factors which change
the volume of concrete (Sivakumar and Santhanam 2006 and Mazzoli et al. 2015). The
EAMC allows the structures to become vulnerable to the disastrous event. These cracks can
be controlled by improving the compressive, tensile, and flexural strengths of concrete as
reported by Khan and Ali (2016) and Qiao et al. (2010). These mechanical properties can
either be enhanced by fiber reinforced concrete (FRC) and/or admixtures (James et al. 2002).
FRC is a composite material consisting of a matrix (i.e. concrete) containing a random
dispersion of small discrete fibers, either artificial or natural. Wright et al. (2014) studied the
reasons of early-age cracking near expansion joint repair sections in concrete bridge-deck.
According to this study, one of the causes of cracking in bridge-deck was material properties
of concrete. Causes of cracking in bridge-deck were divided into three broad classes: design
of structures, material-properties of concrete, and construction practices. It was observed that
the low cement content in concrete reduces EAMC in bridge-decks. Saadeghvaziri and
Hadidi (2005) reported that increased compressive strength results in EAMC in concrete if
achieved with a high cement content. The low tensile strength in concrete provided less
resistance to EAMC in bridge-decks (Qiao et al. 2010). Glass-fiber-reinforced-concrete
(GFRC) with flexural and shear reinforcements can be utilized in order to mitigate EAMC in
concrete bridge girders, which ultimately results in the improved durability and long
serviceable life of the bridge girders. This experimental program is the proceeding work of
2
Khan and Ali (2016) study, which was carried out to determine the material-properties of
GFRC and NFRC in order to control early-age cracks in bridge-decks. In this work, the
material-characteristics of GFRC are evaluated for MD ratio of 1:2:4 and contrasted with that
of 1:3.33:1.67 determined by Khan and Ali (2016). GFRC beam-lets with flexural and shear
reinforcement are also investigated for the increase in its flexural strength (FS) by comparing
with that of respective plain concrete (PC) beam-lets. In addition, a modified equation of
design moment capacity is proposed for GFRC beams having rebars.
Research Motivation and Problem Statement 1.2
The major flaws in a bridge-deck/girder can be early-age-micro-cracks (EAMC),
surface erosion, blisters, spalling, crazing, scaling, and mortar flaking (NZ Transport Agency
2001). Among these flaws, EAMC is the dominant defect due to which the durability and
serviceability of the structure reduce. The other flaws (e.g. surface erosion, blisters,
spalling, crazing, scaling, and mortar flaking as reported by NZ Transport Agency 2001) of
bridge girders may also reduce up to some extent by controlling EAMC only. The presence
of EAMC in bridges makes them vulnerable to the disastrous events. If EAMC is
controlled, then it can be claimed that the bridges will be more durable for a long
serviceable life. Many researchers have reported cracking in bridge girders at early-ages, and
this problem is a great concern in developing countries. The early-age micro crack converts
to macro cracks with the passage of time. Both environmental and traffic loading causes the
concrete to crack further, which accelerates the deterioration process by allowing agents, such
as water and chlorides to enter the concrete. Therefore, deterioration of bridge girders cannot
be reduced unless crack formation is controlled and minimized. The design of bridge-girders
can be based on mechanical performance criteria associated with enhanced post cracking
behavior of FRC. Thus, the problem statement is as follows:
“The high-performance concrete was achieved by utilizing steel/polypropylene
fiber reinforced concrete (SFRC/PFRC) in beams with steel-rebars. Even, the
concrete beams with GFRP rebars had also been investigated to replace steel-
rebars. The design equations were proposed by the researchers in order to
predict the theoretical moment capacity of SFRC/PFRC beams with steel rebars
and concrete beams with GFRP rebars. On the other hand, only the material-
properties of GFRC was investigated to control EAMC in bridge-decks. GFRC
with steel rebars was studied for deep beams only to eliminate stirrups. However,
3
GFRC with flexural and shear reinforcement still need to be investigated for thin
beams/girders. Accordingly, a modification in design equation is required to
predict their moment and shear capacities. In addition, the optimized MD of
GFRC may also help in further improving its mechanical properties.”
Overall / Specific Research Objectives and Scope of Work 1.3
The overall objective of this research program is to enhance the concrete mechanical
properties, in order to control early-age-micro-cracks in concrete bridge girders/decks (for
making them more durable and serviceable for a long life) along with the considerable
control of other defects by using fiber reinforced concrete.
The specific objective of this MS research is:
“To explore glass-fiber-reinforced-concrete (GFRC) beams with flexural
and shear reinforcement along with the modification in MD of GFRC and
design equation of moment capacity for possible application in bridge
girders, mainly to control early-age-micro-cracks”.
The above mentioned specific goal is achieved with the help of following three
tasks (defining the scope of current work):
i) To determine experimentally the material-properties PC and GFRC
with a MD ratio of 1:2:4 and to compare these with that of 1:3.33:1.67
(a previous study) for possible improvement in the MD of GFRC. A total
of 12 specimens (six for PC and six for GFRC) are investigated.
ii) To study the experimental behavior of PC and GFRC beams with
varying flexural and shear reinforcement. A total of 10 specimens (five
with PC beams having rebars and five with GFRC beams having
rebars) are investigated.
iii) To propose modification in design equation for prediction of moment
and shear capacities of GFRC beams with flexural and shear
reinforcements.
Research Methodology 1.4
For this research, a total of 22 specimens (12 for material properties and 10 for beams
with steel rebars) are considered. For investigating the material-properties, a total of 12
specimens of both PC and GFRC are cast: four for compressive strength test, four for
4
splitting-tensile strength test, and four for modulus of rupture. The ratio of cement, sand,
aggregates and water for PC is 1, 2, 4, and 0.7. Glass fibers with length and fiber content (by
cement mass) of 50 mm and 5%, respectively, with the same MD as that of PC, are used to
prepare GFRC. The material-properties investigated with MD ratio of 1:2:4 are also
contrasted with that of the material-properties with MD ratio of 1:3.33:1.67 (a previous study
by Khan and Ali 2016). All the tests are performed according to the ASTM standards. In
fresh state of concrete, the slump cone test is performed in order to measure the workability
of PC and GFRC. The CS, SS, and FS tests are carried out in hardened state of concrete (i.e.
PC and GFRC).
For investigating the strength, energy-absorption, toughness index, and behavior of
steel-reinforced beam-lets, a total of 10 beam-lets with varying flexural and shear
reinforcement are cast. The steel-reinforced beam-lets are tested with the help of servo-
hydraulic testing machine. The dial gauge is used in order to measure the mid span deflection
of the beam-lets. The load-deflection curve and crack propagation are recorded. The loads at
different stages, maximum deflection, number of cracks, and failure modes are noted. The
strength, energy-absorption at different stages and toughness index are also determined.
An equation of design moment capacity for FRC beam with steel rebars is modified,
based on experimental results, in order to precisely predict the theoretical design moment and
shear capacities of GFRC beams with rebars.
Thesis Layout 1.5
The thesis layout contains a total of six chapters. These are:
Chapter 1 comprises of introduction. It explains the flaws in bridge girders, research
motivation and problem statement, overall and specific research objectives, research
methodology, and thesis layout.
Chapter 2 contains the literature review. It consists of background, early-age-micro-cracks in
bridge girders, fiber reinforced concrete without and with rebars, design equations for
moment capacity, and summary of chapter 2.
Chapter 3 includes the experimental procedures. It contains the background, raw materials,
mixing and casting procedures of PC and GFRC, specimen details, testing procedures, and
summary of chapter 3.
5
Chapter 4 comprises of results and analysis. It explains the background, material-properties
of the mixes (i.e. PC and GFRC), flexural properties and behavior of specimens with flexural
and shear reinforcement, and summary of chapter 4.
Chapter 5 comprises of discussion. It consists of background, trend comparison of material-
properties, trend behavior of steel-reinforced beams with previous studies, modified design
equation of moment capacity, prediction of moment and shear capacities, improvement in
EAMC, and summary of chapter 5.
Chapter 6 consists of conclusions and recommendations.
All references are listed after chapter 6.
Annexure A explains the details of load-time curves and behavior of other tested specimens
during compressive, splitting-tensile, and modulus of rupture tests.
6
CHAPTER 2
LITERATURE REVIEW
Background 2.1
Early-age micro crack is the major flaw which conclusively mitigates durability and
serviceability of the concrete bridge girders. The other flaws of the bridge girders can also be
reduced while mitigating early-age-micro-cracks (EAMC) by enhancing the mechanical
properties of concrete. These cracks can be controlled by improving the compressive, tensile,
and flexural strengths of concrete. These mechanical properties can either be enhanced by
utilizing fiber reinforced concrete (FRC) and/or admixtures. The utilization of GFRC with
flexural and shear reinforcements may help to reduce the EAMC in concrete bridge
girders. The explanation of EAMC in bridge girders, fiber reinforced concrete without and
with rebars, and design equations for moment capacities are discussed in detail in this
chapter.
EAMC in Bridge Girders 2.2
It is found that mostly cracks in concrete are developed in fresh state. These micro
cracks conclusively converted into macro cracks with the passage of time and makes the
structure permeable which leads towards the deterioration of concrete and corrosion of steel
(Mazzoli et al. 2015). The factors, which increase the density of cracks in bridge-decks, are
content of cement, water, and total volume of cement-paste used in the concrete (Darwin et
al. 2004). Wright et al. (2014) studied the reasons of early-age cracking near expansion joint
repair sections in concrete bridge-deck. According to this study, one of the causes of cracking
in bridge-deck was material properties of concrete. Accordingly, material-properties of
concrete were studied in detail; various MD ratios for concrete deck of bridge were
investigated experimentally. The ratios of cement, sand and aggregates i.e. 1 : 2.73 : 4.67 and
1 : 2.37 : 4.34 with w/c ratios of 0.44 and 0.43, respectively, were used. It was observed that
low cement content in concrete reduced EAMC in bridge-decks. It can be claimed that
concrete with low cement content and improved mechanical properties may reduce EAMC in
bridge-decks or girders. Saadeghvaziri and Hadidi (2005) performed a study on transverse
cracking of concrete bridge-decks. This study presented the results of the comprehensive
finite-element analysis of bridge-deck and girder in order to understand and evaluate the
patterns of cracks, stress histories, and also the effect of structural stiffness on transverse
7
cracking. It was observed that compressive strength increased EAMC in concrete if achieved
with a high cement content. National Ready Mix Concrete Association reported that flexural
strength (FS) is basically the indirect measure of tensile strength. Concrete with a low tensile
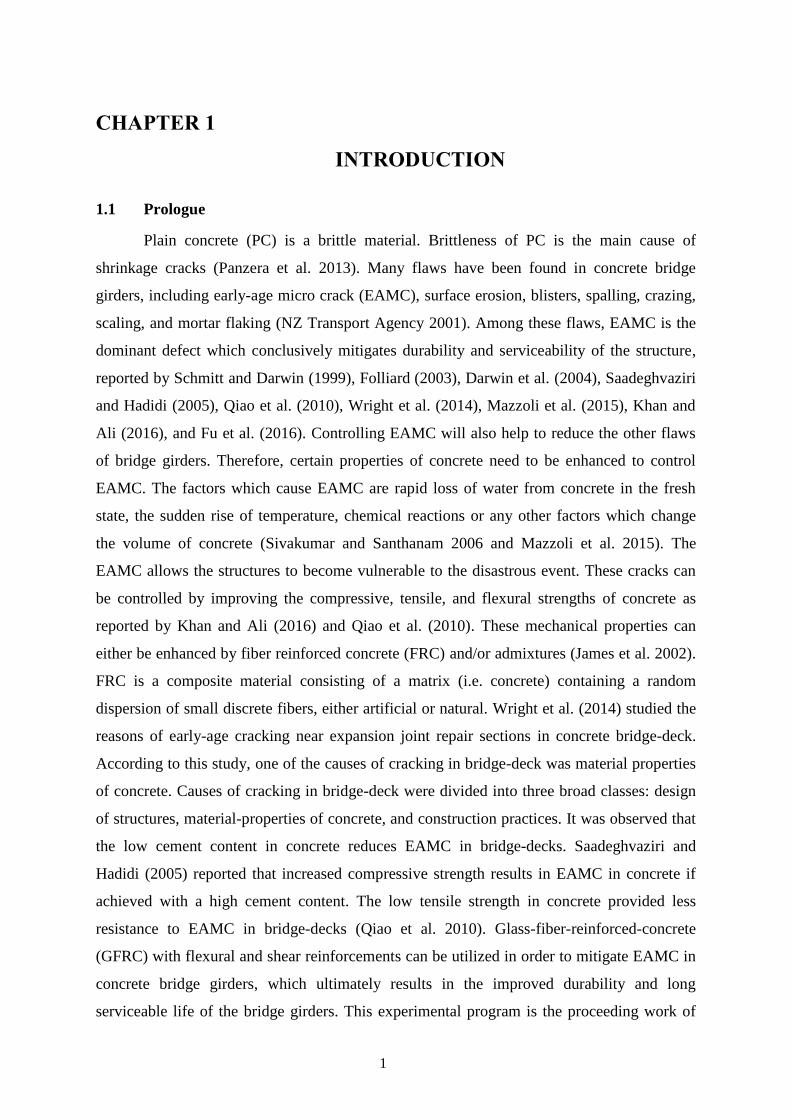
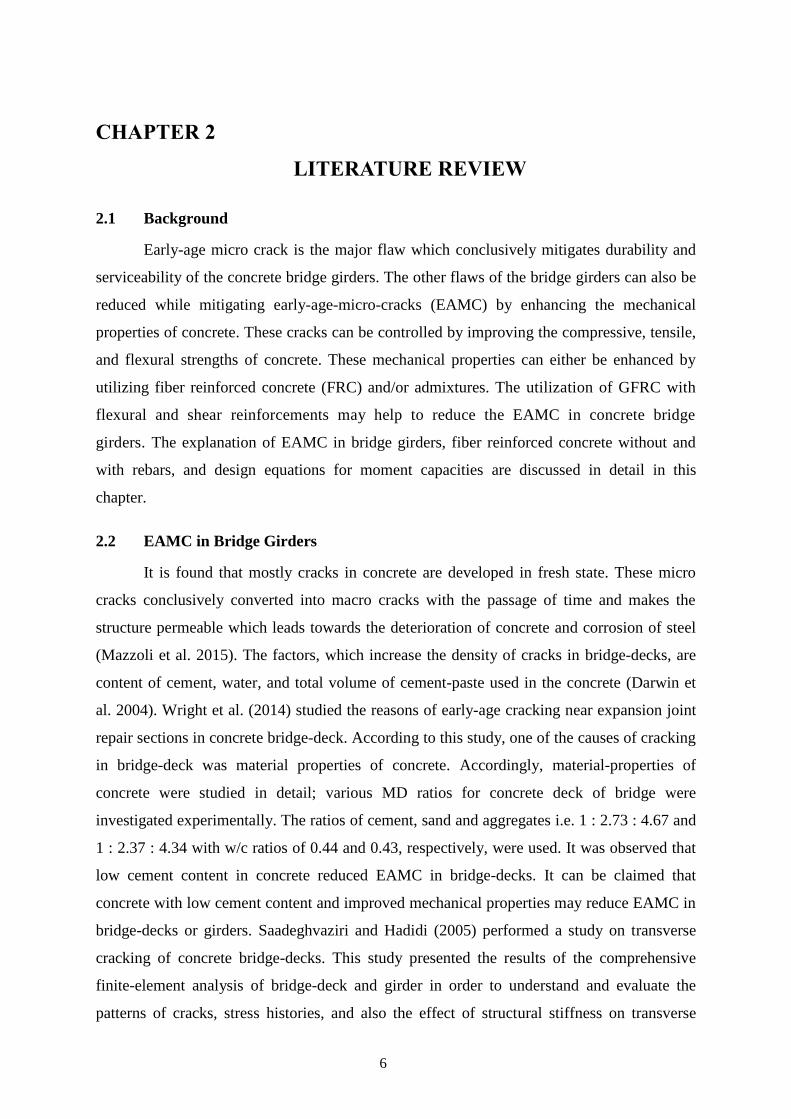
strength provided less resistance to EAMC in bridge-decks (Qiao et al. 2010). Observed
EAMC in recently constructed concrete bridge girder is shown in the Figure 2-1. To
minimize EAMC in concrete bridge girders, mechanical properties needs to be enhanced. The
responsible properties are compressive, tensile, and flexural strengths of concrete, which can
increase durability and serviceability of structures by reducing EAMC in concrete, as
reported by Purkiss (1985), Peyton et al. (2012), and Khan and Ali (2016). The improved
mechanical properties can be exploitable for the mitigation of EAMC in bridge girders.
Figure 2-1 Observed EAMC in recently constructed concrete bridge girder
Fiber Reinforced Concrete Without and With Steel Rebars 2.3
2.3.1 Fiber Reinforced Concrete without Steel Reinforcement
Many researches have been proposed in the last few decades to minimize the flaws of
bridges to make them more durable and serviceable for a long life. Researchers all over the
world are working to develop high performance concrete (HPC) by using admixtures,
optimized cement content, and/or inclusion of fibers up to a certain limit in concrete. Fibers
in concrete acts as “crack arrester” (James et al. 2002 and Kene et al. 2012). The dynamic and
static properties of concrete are improved by the addition of small discrete fibers in the
concrete matrix (Ali et al. 2012). Even Ali (2014) investigated the seismic performance of
coconut-fibre-reinforced-concrete columns with different reinforcement configurations of
coconut-fibre ropes found satisfactory results. The coconut-fiber ropes were used instead of
steel rebars. FRC with rebars is discussed in detail in next sub-section. The presence of fibers
in concrete prevented the width of cracks from leading to increase; due to which stiffness and
8
ultimate load carrying capacity increased (Kamal et al. 2014). Artificial or natural fiber
reinforced concrete can enhance mechanical properties (James et al. 2002). Preferably,
artificial fibers were used in concrete due to its durable nature for a long serviceable life. To
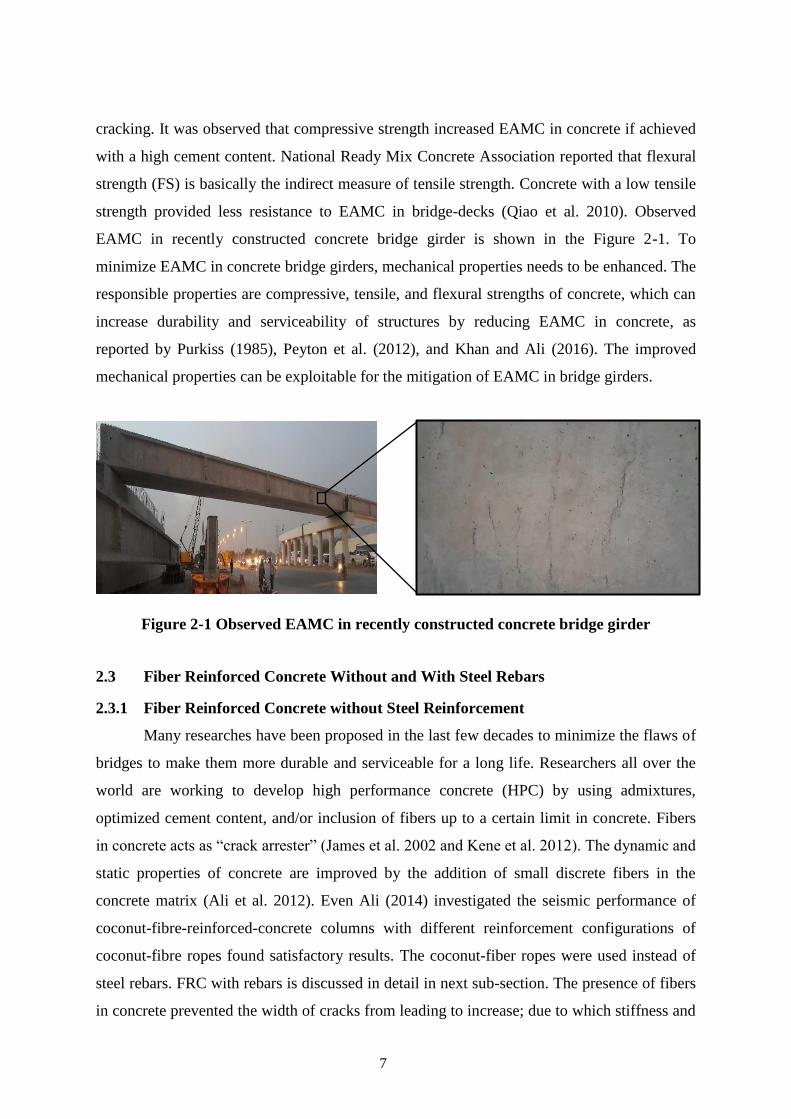
start with, glass fibers are selected. Different types of fibers and their benefits are given in
Table 2-1. Glass fibers gained considerable attention due to its low density, highly durable
and safe, more ductility, and lightweight, economical, energy efficient, weather and fire
resistant (Shakor and Pimplikar 2011; Ravikumar and Thandavamoorthy 2011).
Table 2-1 Different types of fibers and their benefits
Sr.
No. Fibers Benefits References
1 Nylon fiber Strong, more elastic, light
weight, heat and cold resistant,
not water absorbent, stable,
excellent in abrasion resistance,
and more resiliency
Banthia (2010) and
James et al. (2002)
2 Polypropylene fiber Low specific gravity, high
density, more ductility, no water
absorbent, very good in
elasticity and resiliency,
excellent ability to protest
friction
Banthia (2010) and
James et al. (2002)
3 Glass fiber Low density, high durability,
more ductility, light weight,
economical, energy efficient,
weather and fire resistant
Shakor and Pimlikar
(2011), Ravikumar and
Thandavamoorthy (2011),
and James et al. (2002)
4 Steel fiber Hight density, more ductility,
energy efficient, no water
absorbent
James et al. (2002)
5 Basalt fiber Low density, light weight, high
elastic modulus, resulting in
excellent specific gravity
Banthia (2010)
9
Khan and Ali (2016) performed an experimental study to investigate the strength-
properties of NFRC and GFRC for possible application of reducing EAMC in bridge-decks.
The researchers used 5% fiber content by mass of cement having 50 mm cut length in
concrete. The same MD ratio of PC (i.e. 1 : 3.33 : 1.67) having a water cement ratio of 0.71,
was used for NFRC and GFRC. Samples were then tested for strength properties. It was
found that slumps of NFRC and GFRC were decreased by 68.7% and 37.5%, respectively.
While the densities of NFRC and GFRC were 1.8% and 2.4%, respectively, less than that of
PC. The flexural and splitting-tensile strengths (FS and SS, respectively) of GFRC were
improved by 5.6% and 11%, respectively, contrasted with that of PC (Table 2-2). The SS and
FS of NFRC were increased by 84% and 3%, respectively. Although the compressive
strengths of NFRC and GFRC were decreased by 2.8% and 5.8%, respectively, but showed
satisfactory performance. Qureshi and Ahmed (2013) experimentally studied the mechanical-
characteristics of GFRC with various MD ratios. The MD of 1:1.5:3 with a w/c ratio of 0.6
was used for plain concrete. Glass fibers of different contents (i.e. 0%, 0.5%, 1%, 1.5%, 2%,
2.5%, 3%, and 3.5%, by cement mass) were used. Samples were cast and tested for
compressive, flexural, and splitting-tensile strength. It was observed that 1.5% glass fiber
content by mass of cement was the optimum percentage. The compressive, tensile, flexural
strengths were improved by 13%, 11%, and 50%, respectively, when contrasted with that of
respective plain concrete samples (Table 2-2). Kene et al. (2012) performed an experimental
study on behavior of steel and glass-fiber-reinforced-concrete composites. The MD ratio of
1:1.75:2.87 with a w/c ratio of 0.5 was used for PC. The same MD was used for steel and
glass-fiber-reinforced-concrete composites except the addition of steel fibers (0.5% by
volume fraction) and glass fibers (0.25% by mass of cement). It was observed that
compressive strength of steel and glass-fiber-reinforced-concrete were increased by 13.6%
and 9.1%, respectively. It was also found that the splitting-tensile strength of steel and glass-
fiber-reinforced-concrete were increased by 22.7% and 18.2%, respectively, when contrasted
with that of respective PC (Table 2-2). It was found that the steel fiber reinforced concrete
performed better than that of glass-fiber-reinforced-concrete.
Ravikumar and Thandavamoorthy (2011) performed an experimental study to
investigate strength and fire resistant properties of PC and GFRC. In this experimental study,
inclusion of glass fibers in concrete had been used up to 1% by volume fraction having 450
mm length.
10
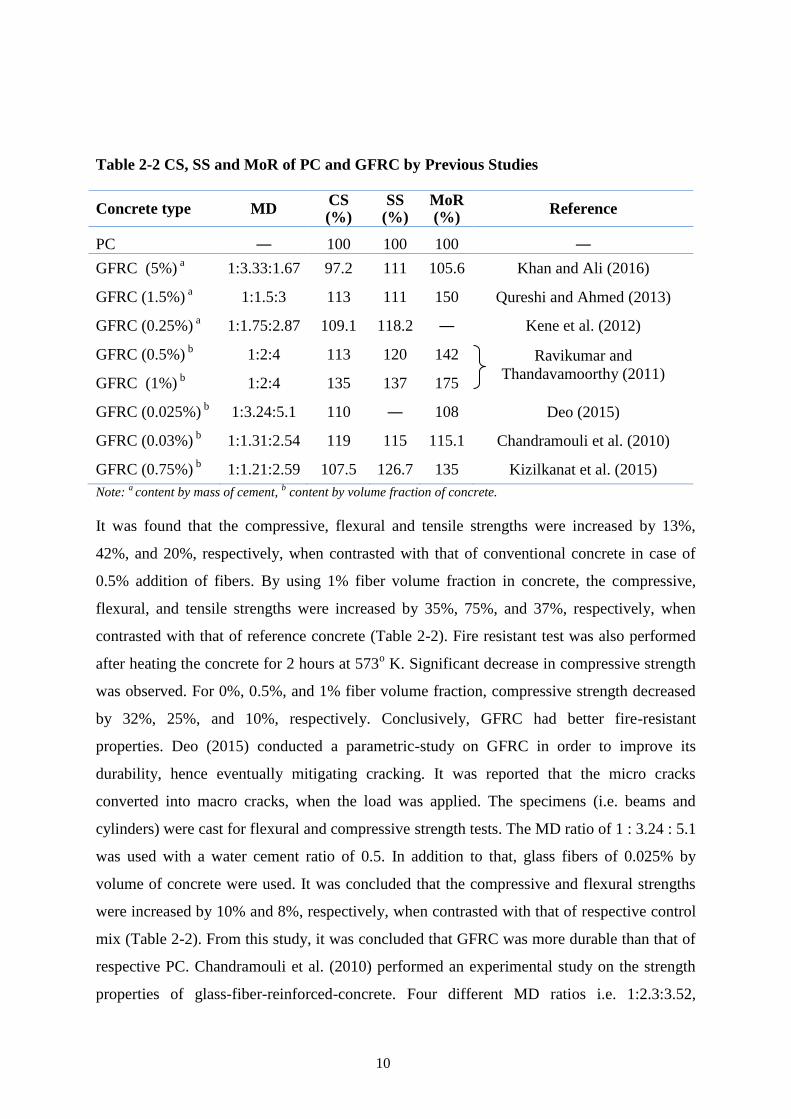
Table 2-2 CS, SS and MoR of PC and GFRC by Previous Studies
Concrete type MD CS (%)
SS (%)
MoR (%)
Reference
PC ― 100 100 100 ―
GFRC (5%) a
1:3.33:1.67 97.2 111 105.6 Khan and Ali (2016)
GFRC (1.5%) a 1:1.5:3 113 111 150 Qureshi and Ahmed (2013)
GFRC (0.25%) a 1:1.75:2.87 109.1 118.2 ― Kene et al. (2012)
GFRC (0.5%) b
1:2:4 113 120 142 Ravikumar and
Thandavamoorthy (2011) GFRC (1%)
b
1:2:4 135 137 175
GFRC (0.025%) b
1:3.24:5.1 110 ― 108 Deo (2015)
GFRC (0.03%) b
1:1.31:2.54 119 115 115.1 Chandramouli et al. (2010)
GFRC (0.75%) b
1:1.21:2.59 107.5 126.7 135 Kizilkanat et al. (2015)
Note: a content by mass of cement,
b content by volume fraction of concrete.
It was found that the compressive, flexural and tensile strengths were increased by 13%,
42%, and 20%, respectively, when contrasted with that of conventional concrete in case of
0.5% addition of fibers. By using 1% fiber volume fraction in concrete, the compressive,
flexural, and tensile strengths were increased by 35%, 75%, and 37%, respectively, when
contrasted with that of reference concrete (Table 2-2). Fire resistant test was also performed
after heating the concrete for 2 hours at 573o K. Significant decrease in compressive strength
was observed. For 0%, 0.5%, and 1% fiber volume fraction, compressive strength decreased
by 32%, 25%, and 10%, respectively. Conclusively, GFRC had better fire-resistant
properties. Deo (2015) conducted a parametric-study on GFRC in order to improve its
durability, hence eventually mitigating cracking. It was reported that the micro cracks
converted into macro cracks, when the load was applied. The specimens (i.e. beams and
cylinders) were cast for flexural and compressive strength tests. The MD ratio of 1 : 3.24 : 5.1
was used with a water cement ratio of 0.5. In addition to that, glass fibers of 0.025% by
volume of concrete were used. It was concluded that the compressive and flexural strengths
were increased by 10% and 8%, respectively, when contrasted with that of respective control
mix (Table 2-2). From this study, it was concluded that GFRC was more durable than that of
respective PC. Chandramouli et al. (2010) performed an experimental study on the strength
properties of glass-fiber-reinforced-concrete. Four different MD ratios i.e. 1:2.3:3.52,
11
1:1.96:3.25, 1:1.51:2.93, and 1:1.31:2.54 with w/c ratio of 0.55, 0.5, 0.4, and 0.36,
respectively, were used to study the effect of CS, SS, and MoR. The glass fibers were
included by 0.03% by volume fraction, in the all mixes. The highest strengths were observed
at MD of 1:1.31:2.54. The CS, SS, and MoR were increased by 19%, 15%, and 15.1%,
respectively, when contrasted with that of respective PC (Table 2-2). Kizilkanat et al. (2015)
performed an experimental study on mechanical properties and fracture behavior of basalt
and glass-fiber-reinforced-concrete. The researchers were used 0%, 0.25%, 0.5%, 0.75%, and
1% fiber content by volume fraction of concrete for both basalt and glass-fiber-reinforced-
concrete. The same MD ratio of PC (i.e. 1:1.21:2.59) having a w/c ratio of 0.45, was used for
basalt and glass-fiber-reinforced-concrete. A total of nine mixes were then prepared with
different fiber volume fractions for strength properties. It was found that the slumps of basalt
and glass-fiber-reinforced-concrete reduced up to 39% and 56%, respectively. While
densities of basalt and glass-fiber-reinforced-concrete were decreased up to 1.6% and 2.6%,
respectively, when contrasted with that of control mix. The CS, SS, and MoR of basalt fiber
reinforced concrete (BFRC) were increased up to 6.5%, 41.7%, and 35%, respectively, when
contrasted with that of PC. Similarly, the CS, SS, and MoR, of GFRC were increased up to
7.5%, 26.7%, 35%, respectively, when contrasted to that of respective PC (Table 2-2). It was
concluded that the BFRC performed better than that of GFRC.
2.3.2 Fiber Reinforced Concrete with Steel Reinforcement
The researchers all over the world are also working to develop fiber reinforced
concrete (FRC) with steel reinforcement and glass fiber reinforced polymer (GFRP) rebars as
reported by Imam et al. (1997), Furlan and Hanai (1997), Ashour (2006), Beshara et al.
(2012), Kamal et al. (2014), and Rathi et al. (2014). Strength properties of concrete have a
more prominent effect by utilizing FRC with steel rebars. Kamal et al. (2014) performed an
experimental study on behavior and strength properties of beams by using different fibers. It
was reported that ultra-high performance of concrete was achieved by utilization of
polypropylene and steel fibers. A total of twelve beams with and without shear
reinforcements were cast and tested in flexure. The reinforcement ratio of 0.012 and 0.017
were used for the beam-lets without and with stirrups, respectively. The steel rebars of
diameter (10 mm and 12 mm) were used as a tensile reinforcement in the concrete. The steel
and polypropylene fibers were added as 40 kg/m3 and 1 kg/m
3, respectively, in the concrete.
It was concluded that the compressive strength of steel fiber reinforced concrete (SFRC) with
12
steel rebars was increased by 2.5%, and that of polypropylene reinforced concrete (PFRC)
was increased by 6%. It was also found that the ultimate load was increased by 48% and 15%
with steel and polypropylene fibers, respectively. Beshara et al. (2012) performed a
parametric study on nominal flexural strength of high strength fiber reinforced concrete
beams with steel rebars. The steel ratio of 0.0017, 0.0064, 0.0075, 0.012, 0.015, and 0.022
were used as tensile reinforcement. Whereas the steel ratio of 0.0045 and 0.0047 were used as
compression reinforcement. An equation for design moment capacity was also proposed in
order to compare the experimental and theoretical moment capacities of steel fiber reinforced
concrete beams with steel rebars. The steel fibers were used as 0%, 0.5%, 1%, and 2% by
volume fraction in the concrete matrix. It was concluded that the predicted flexural strength
by proposed approach was reasonably good. The error of ±38% was observed in the proposed
equation. The mean value of the ratio between the measured and predicted strengths was 1.5
and that of standard deviation was 0.3. It was also found that measured and predicted flexural
strengths for partially steel fiber reinforced concrete beams with rebars is less than that of the
respective fully reinforced beams. Furlan and Hanai (1997) performed an experimental study
on shear behavior of fiber reinforced concrete beams. A total of fourteen beams were
prepared from seven different mix proportions. In these mixes, the fibers (Polypropylene and
steel) were added by different volume fractions. The aim of the research was to increase shear
strength, stiffness, and ductility. The polypropylene fibers were used as 0.5% by volume
fraction, steel fibers were used as 0.5%, 1%, and 2% by volume fraction in the concrete. The
observed compressive and tensile strengths for the different seven mixes were up to 54.8
MPa and 4.3 MPa, respectively. The error of ±30% was observed for beam-lets with stirrups,
while the error for the beam-lets without stirrups was observed as ±86%. It was concluded
that the progress of cracking in FRC was relatively slow and deflections were reduced. Rathi
et al. (2014) performed an experimental study on glass-fiber-reinforced-concrete moderate
deep beam with and without stirrups. For this, six tee-beams of constant overall span and
depth 150 mm, 200 mm, 250 mm, 300 mm with span to depth (L/D) ratios of 4, 3, 2.4 and 2
were cast, and glass fibers with cut length and diameter of 12 mm and 0.0125 mm,
respectively, were added at volume-fractions of 0%, 0.25%, 0.5%, 0.75% and 1%. Two-point
load test was performed for all beams. The maximum compressive and splitting-tensile
strengths of GFRC (with 0.75% fiber content) were increased by 24.73% and 11.88%,
respectively, when contrasted with that of respective PC. The flexural strength, shear stress,
and ductility of moderate deep beams were increased up to 30.25%, 21.19%, 10.45%,
13
respectively, by the inclusion of 0.75% glass fiber, when contrasted with that of respective
PC deep beams. The ultimate load carrying capacity of GFRC moderate deep beam was
increased with 0.75% fiber content, but it was decreased again at 1% fiber content.
Ultimately, it was concluded that the fiber content of 0.75% by volume fraction showed
satisfactory results in all conducted tests. Ashour (2006) investigated the flexural and shear
capacities of concrete beams reinforced with GFRP rebars. A total of twelve beam-lets
reinforced with GFRP rebars were cast, and performed four-point load test on them. Two
modes of failure (i.e. flexural and shear) were observed in all performed tests. The error of
±18% was observed in GFRP reinforced beams, when experimental and theoretical flexural
capacity was contrasted. It was also observed that the flexural failure occurred due to tensile
failure of GFRP bars, and shear failure was initiated by a major diagonal crack within shear
span of the beam.
Design Equations for Moment Capacities 2.4
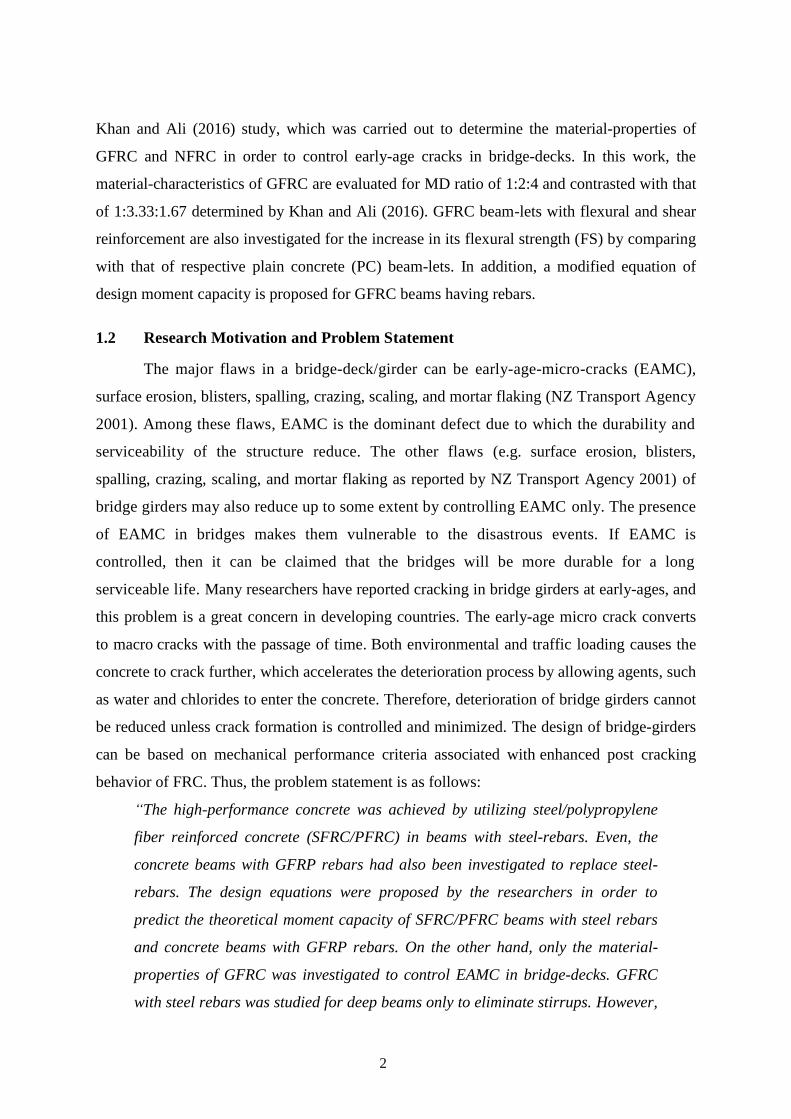
The stress distribution of concrete beam having steel rebars is shown in Figure 2-2a.
The actual and equivalent stress distribution proposed by Nilson et al. (2010) is limited and
not applicable for fiber reinforced concrete. The design moment capacity of normal
reinforced concrete can be calculated from the following equations, which are proposed by
Nilson et al.:
MR = s(
) in N-mm (2.1)
The tensile strength of steel (Ts) is given by
Ts = As x fy in N (2.1a)
The depth of equivalent distribution of compressive stresses ‘a’ in Figure 2-2a can be
calculated by
in mm (2.1b)
Where As is the area of steel (mm2), fc’ is the 28-day cylinder compressive strength of
concrete (MPa), fy is the yielding strength of steel (MPa), b is the cross-sectional width
(mm), and d is the effective depth (mm). The idealized stress and strain distribution for fiber
reinforced concrete (FRC) proposed by Beshara et al. (2012) is shown in Figure 2-2b.
Accordingly the design moment capacity of steel-reinforced FRC can be calculated by the
following equations:
MF1 = s(
) f1 {(
)
} (2.2)
14
Where Ts, a, and d are same as explained for equation (2.1). t is the total depth of beam, tf is
the effective height of equivalent stress of FRC in tension region. The tensile strength of FRC
‘Tf1’ is given as below:
Tf1 = [1.64 Vf (lf /Øf)] b tf (2.2a)
Where Vf is the fiber volume fraction used in the concrete, lf is the length of fiber, Øf is the
diameter of the steel fibers. It may be noted that Beshara et al. (2012) proposed Eq. (2.2a) on
the basis of empirical evaluation of compressive strength and post-cracking strength of fiber
reinforced concrete.
Figure 2-2 Stress distribution of concrete beam having steel rebars: (a) for plain
concrete by Nilson et al. (2010), and (b) for fiber reinforced concrete by Beshara et al.
(2012)
Summary 2.5
It can be claimed from the previous studies that concrete with low cement content and
improved mechanical properties may reduce EAMC in bridge-decks and girders. Also, it was
observed that compressive strength increased EAMC in concrete if achieved with high
cement content. To minimize EAMC in concrete bridge girders, mechanical properties need
to be enhanced. These properties include compressive, tensile, and flexural strengths of
concrete, which can increase durability and serviceability of structures by reducing EAMC in
concrete. The presence of fibers in concrete prevents the width of cracks from leading to
increase; due to which stiffness and ultimate load carrying capacity increases. Artificial fibers
are usually used in concrete due to its durable nature for long serviceable life. Glass fibers
gained considerable attention due to its low density, highly durable and safe, more ductility,
and lightweight, economical, energy efficient, weather and fire resistant. Thus, glass fibers
can be appropriate for mitigating EAMC.
(b) (a)
15
As stated earlier, few researches had been performed to achieve the high-performance
concrete by utilizing the steel or polypropylene fibers having different fiber contents in the
concrete (i.e. SFRC/PFRC) beams with steel-rebars. Even, concrete beams with GFRP rebars
had also been investigated to replace steel-rebars. The design equations were also proposed
by the researchers in order to predict the theoretical moment capacity of SFRC/PFRC beams
with steel rebars (Beshara et al. 2012 and Kamal et al. 2014) and concrete beams with GFRP
rebars (Ashour 2006). GFRC with steel rebars is only studied for deep beams to eliminate
stirrups (Rathi et al. 2014). Khan and Ali (2016) investigated only the material-properties of
GFRC to control EAMC in bridge-decks. GFRC beams with flexural and shear reinforcement
still need to be investigated for thin beams. According to authors information, no research is
carried on the GFRC with steel rebars for thin beams with the emphasis on the reduction (not
the elimination) of flexural and shear reinforcement and the control of early-age-micro-
cracks. Accordingly, a modification in design equation is required to predict their moment
and shear capacities. In addition, the optimized MD of GFRC may also help in further
improving its mechanical properties.
16
CHAPTER 3
EXPERIMENTAL PROCEDURES
Background 3.1
Glass fibers gained considerable attention due to its low density, highly durable and
safe, more ductility, and lightweight, economical, energy efficient, weather and fire resistant.
As stated earlier, the behavior of GFRC with steel rebars need to be investigated. And the
material-properties of the same GFRC is also important. The control specimens are plain
concrete and normal reinforced concrete. The mixing and casting procedures, specimen’s
details and testing procedures are discussed in detail in this chapter.
Raw Materials, MD and Casting Procedures of PC and GFRC 3.2
The ingredients used to prepare PC and GFRC are ordinary Portland cement, locally
available sand, coarse aggregates, potable water, and glass fibers. Since glass fibers are
locally available in the form of sheets. The preparation of glass fibers on required length is
time consuming and difficult task. Glass fibers are pulled out from sheets and cut to the
required length of 50 mm. The measured diameter of the glass fiber is 0.15 mm. the steel
rebars of Ø6 have been used as a primary reinforcement in PC and GFRC. The maximum
aggregates size is 19 mm.
The ratio of cement, sand, and aggregates for PC is 1, 2, and 4 with a w/c ratio of 0.7.
For preparation of GFRC, the same MD ratio is used except with the addition of 5% fiber
content by mass of cement having 50 mm length. A saturated surface dry condition was
missing. Therefore, a relatively high w/c ratio was used for the concrete mix. It may also be
noted that no bleeding was observed during workability test and filling of moulds (which may
insure no loss in strength of GFRC). The major concept to prepare PC and GFRC is taken
from Khan and Ali (2016) study, particularly for preparing and compacting GFRC in layers.
All the materials are added layer by layer for uniform dispersion of fibers in the concrete
matrix. The addition of fibers is compromising the workability due to which the pouring of
moulds is quite difficult. Therefore, an additional technique is adopted to minimize this issue.
For each layer of GFRC, moulds are free-fall from a height of about 100-150 mm for self-
compaction in order to eliminate air voids. The specimens are de-moulded after 24 hours of
pouring. All the specimens are then kept in water at room temperature for 28 days before
testing.
17
Specimens 3.3
3.3.1 Specimens for Material-properties
Cylinders (i.e. diameter and height of 102 mm and 204 mm, respectively) are cast for
CS and STS tests. A total of eight cylinders (four with PC and four with GFRC) were cast.
Labels S-PC1, S-PC2, S-PC3, and S-PC4 for plain concrete cylinders and S-GF1, S-GF2, S-
GF3, and S-GF4 for GFRC cylinders were tagged for identification. Two samples of each
materials are used for compressive strength tests and two are used for splitting-tensile
strength tests. Usually three specimens are cast. However, two are also acceptable to make
some conclusion as used by Khan and Ali (2016), Atis (2003), Lim et al. (2000), Poon and
Chan (2007), and ASTM C39/C39M-15a.
Beam-lets (i.e. width, depth, and length of 102 mm, 102 mm, and 457 mm,
respectively) are cast for flexural strength (MoR) test. A total of four beam-lets (two with PC
and two with GFRC) without steel reinforcement are cast. Labels mentioned for PC beam-lets
are B-PC1 and B-PC2, whereas labels for GFRC beam-lets are B-GF1 and B-GF2. Thus, a
total of twelve samples (six for PC and six for GFRC) are used for determining materials
properties experimentally. An average of two readings is taken for each property.
3.3.2 Specimens with Steel Reinforcement
The sizes of beam-lets with flexural and shear reinforcements are same (i.e. 102 mm
x 102 mm x 457 mm) as that of beam-lets used for MoR. A total of ten beam-lets (five with
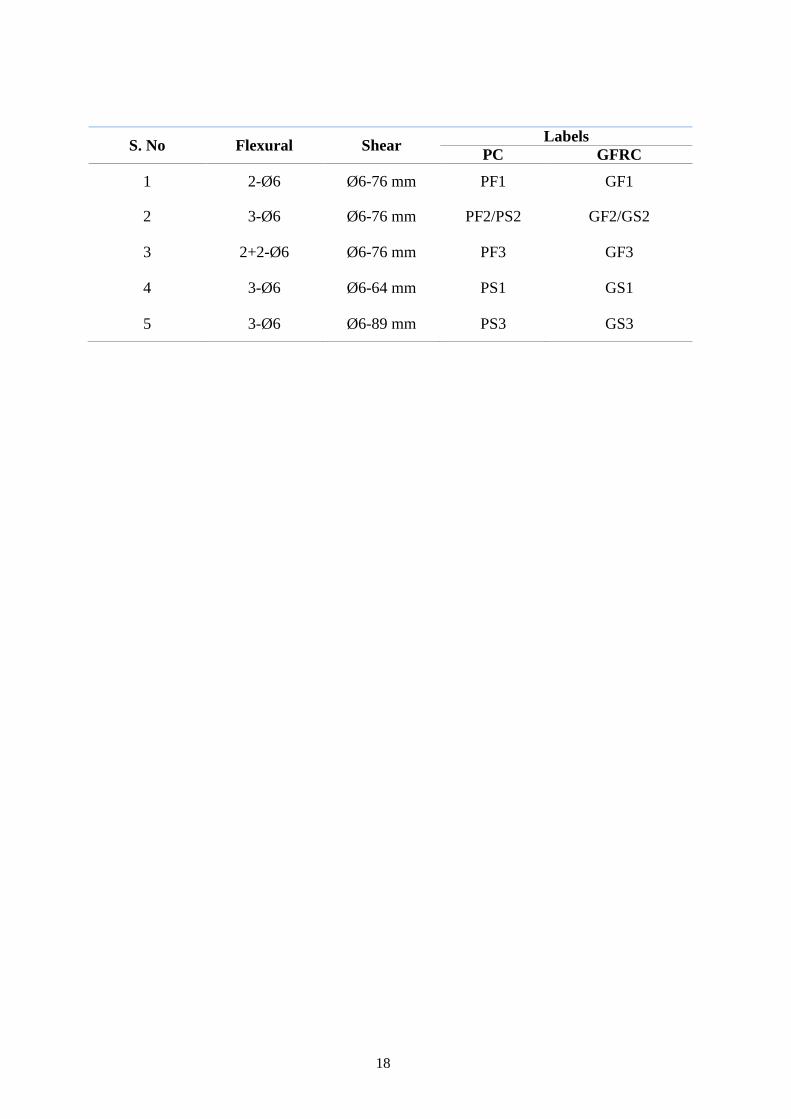
PC and five with GFRC) are cast. The labelling scheme along with rebars detailing is given
in Table 3-1. The selected reinforcement combinations are made with smaller diameter rebars
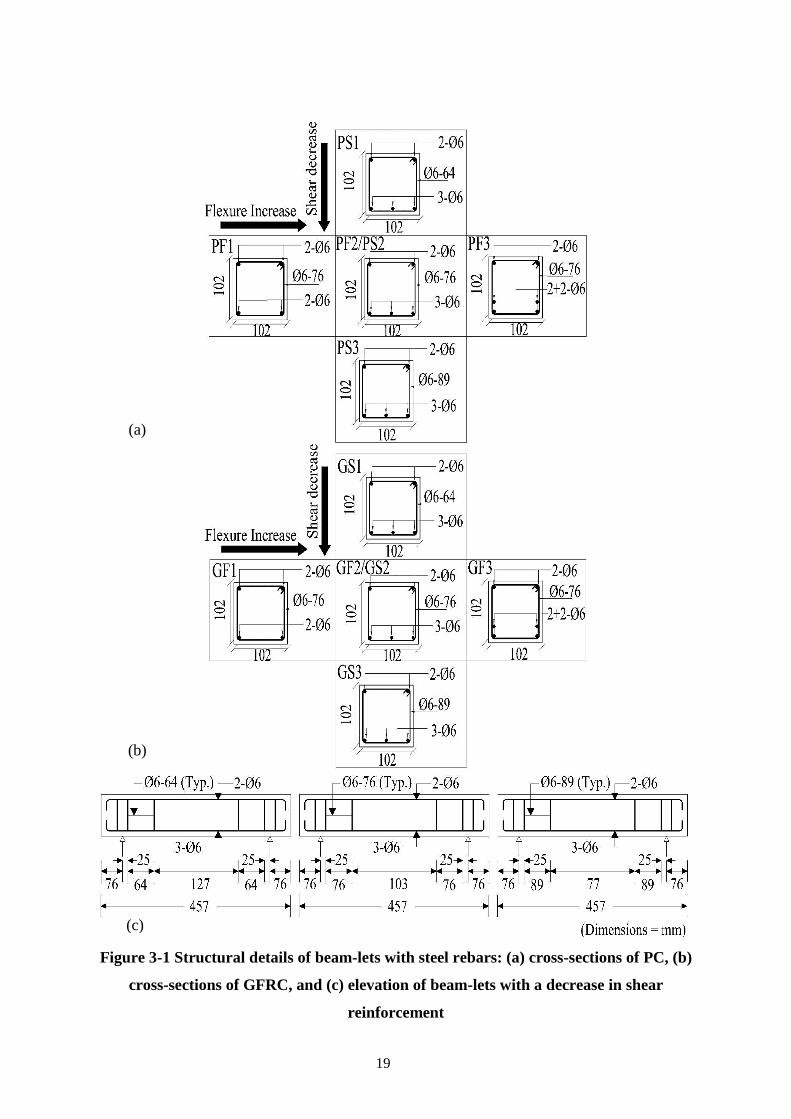
by keeping the reinforcement ratio between minimum and maximum limit. The structural
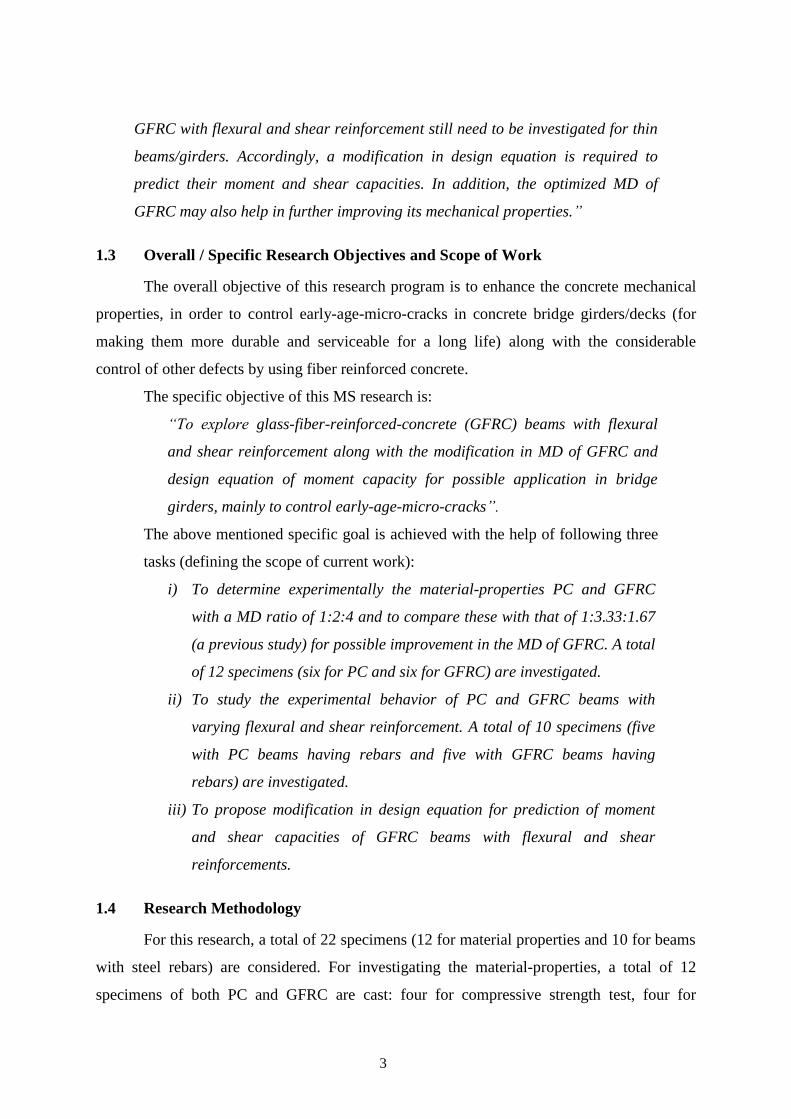
details of beam-lets with rebars is shown in Figure 3-1.
Table 3-1 Labelling scheme of beam-lets with steel rebars
18
S. No Flexural Shear Labels
PC GFRC
1 2-Ø6 Ø6-76 mm PF1 GF1
2 3-Ø6 Ø6-76 mm PF2/PS2 GF2/GS2
3 2+2-Ø6 Ø6-76 mm PF3 GF3
4 3-Ø6 Ø6-64 mm PS1 GS1
5 3-Ø6 Ø6-89 mm PS3 GS3
19
Figure 3-1 Structural details of beam-lets with steel rebars: (a) cross-sections of PC, (b)
cross-sections of GFRC, and (c) elevation of beam-lets with a decrease in shear
reinforcement
(c)
(a)
(b)
(c)
20
Procedures for Testing 3.4
For Material-properties of Fresh and Hard Concrete 3.4.1
Slump, density, compressive, modulus of rupture and splitting-tensile tests are
performed as per ASTM C143/C143M-15a, ASTM C138/C138M-16, ASTM C39/C39M-
15a, ASTM C496/C496M-11, and ASTM C78/C78M-15b, respectively, for determining the
properties of PC. The samples of GFRC are also tested in a similar manner in order to
compare the properties. During compressive, modulus of rupture, and splitting-tensile tests,
their respective load-time curves and crack propagation are recorded. The loading rate of
100-250 pounds/second are used in all tests. It may be noted that the loading rate was
controlled manually. The first crack load ‘P1’ and the maximum load ‘P’ are noted. The pre-
crack energy-absorption ‘P.E’, energy-absorption up to the maximum load ‘E’, cracked
energy-absorption ‘Cr.E’, strength, and toughness index ‘T.I’ are also determined. As
mentioned earlier, it may be noted that all these properties are of those specimens with MD of
1:2:4. These properties are also contrasted with that of specimens with MD of 1:3.33:1.67 in
Khan and Ali (2016) study.
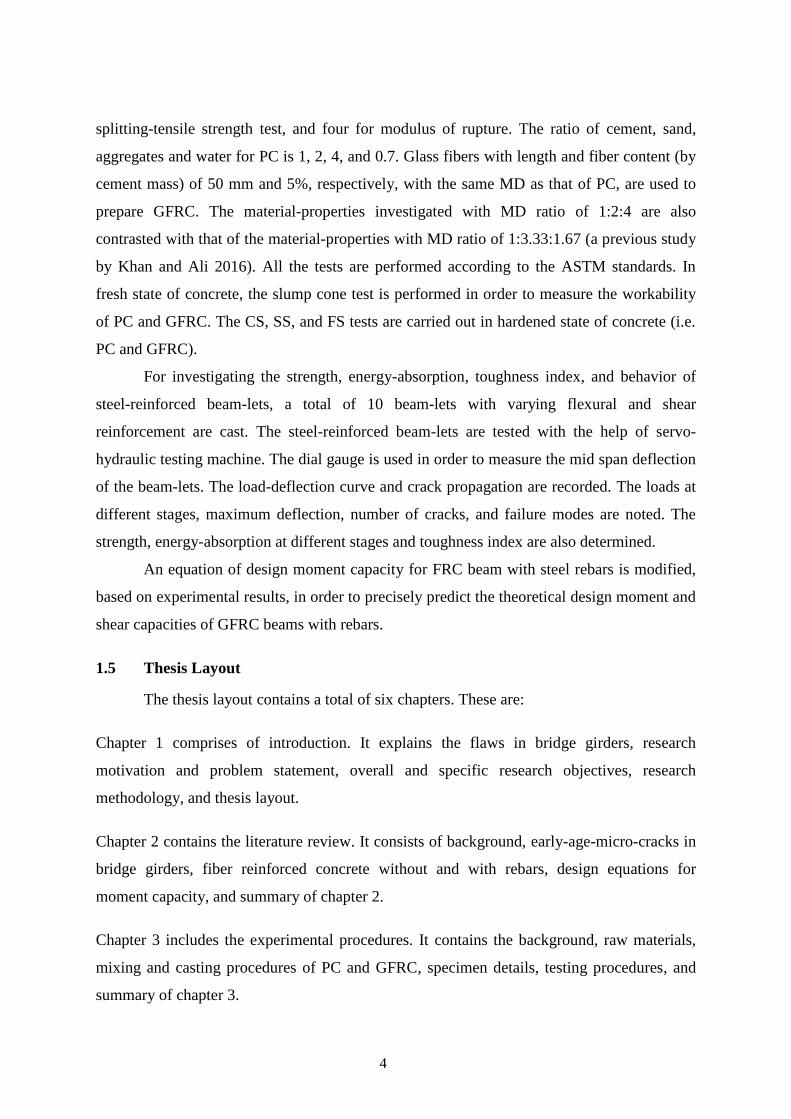
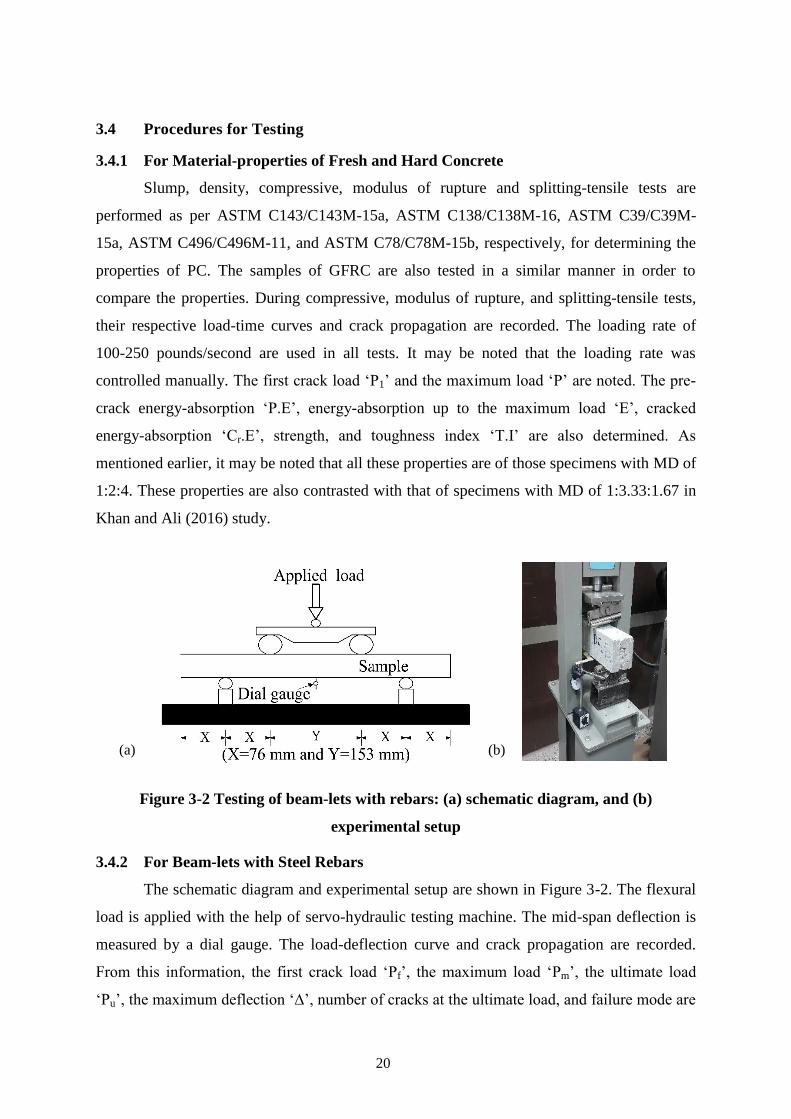
Figure 3-2 Testing of beam-lets with rebars: (a) schematic diagram, and (b)
experimental setup
For Beam-lets with Steel Rebars 3.4.2
The schematic diagram and experimental setup are shown in Figure 3-2. The flexural
load is applied with the help of servo-hydraulic testing machine. The mid-span deflection is
measured by a dial gauge. The load-deflection curve and crack propagation are recorded.
From this information, the first crack load ‘Pf’, the maximum load ‘Pm’, the ultimate load
‘Pu’, the maximum deflection ‘∆’, number of cracks at the ultimate load, and failure mode are
(b) (a)
21
noted. The flexural strength ‘F.S’, energy-absorption up to the first crack ‘Ef’, energy-
absorption from the first crack to the maximum load ‘Em’, energy-absorption from the
maximum load to the ultimate load ‘Eu’, total energy-absorption ‘T.E’, and total toughness
index ‘T.T.I’ are determined. The experimental and theoretical moment and shear capacities
are also determined and contrasted.
Summary 3.5
The ratio of cement, sand, aggregates for PC and GFRC is 1, 2, and 4 with a w/c ratio
of 0.7. In addition to that, 5% fiber content, by mass of cement, are used in case of GFRC.
For this study, the measured diameter and cut length of the glass fibers are 0.15 mm and 50
mm, respectively. The other fiber contents (increased or decreased than that of 5% fiber
content) were used in the previous studies, which are already discussed earlier in chapter 2.
This study is the proceeding part of Khan and Ali (2016) study, that is why the same fiber
content is used in the current study as that is used in the previous study. Steel rebars of Ø6 are
used as a primary reinforcement in PC and GFRC. A total of twenty-two specimens (twelve
for material-properties and ten for behavior of steel-reinforced beams) are cast. The slump,
density, compressive, splitting-tensile, and modulus of rupture tests are performed as per
ASTM standards. The same ASTM standards are followed for determining the properties of
GFRC. The load-deflection curves and failure modes are noted for studying the behavior of
steel-reinforced beams. The analysis and results are discussed in detail in the next chapter.
22
CHAPTER 4
ANALYSIS AND RESULTS
Background 4.1
The specimens are cast with the cement: sand: aggregate ratio of 1:2:4 and a w/c ratio
of 0.7 for PC. For preparation of GFRC, the same MD is used except with the addition of 5%
fiber content, by mass of cement, having a length of 50 mm. The measured diameter of the
glass fiber is 0.15 mm. The results of tests performed on PC and GFRC specimens are
discussed in detail in this chapter. Firstly, the materials properties of PC and GFRC,
determined through ASTM standards, are explained. Then, the behavior of steel-reinforced
PC and GFRC is described.
Material-properties of PC and GFRC 4.2
4.2.1 Slump of Fresh Concrete and Density of Hard Concrete
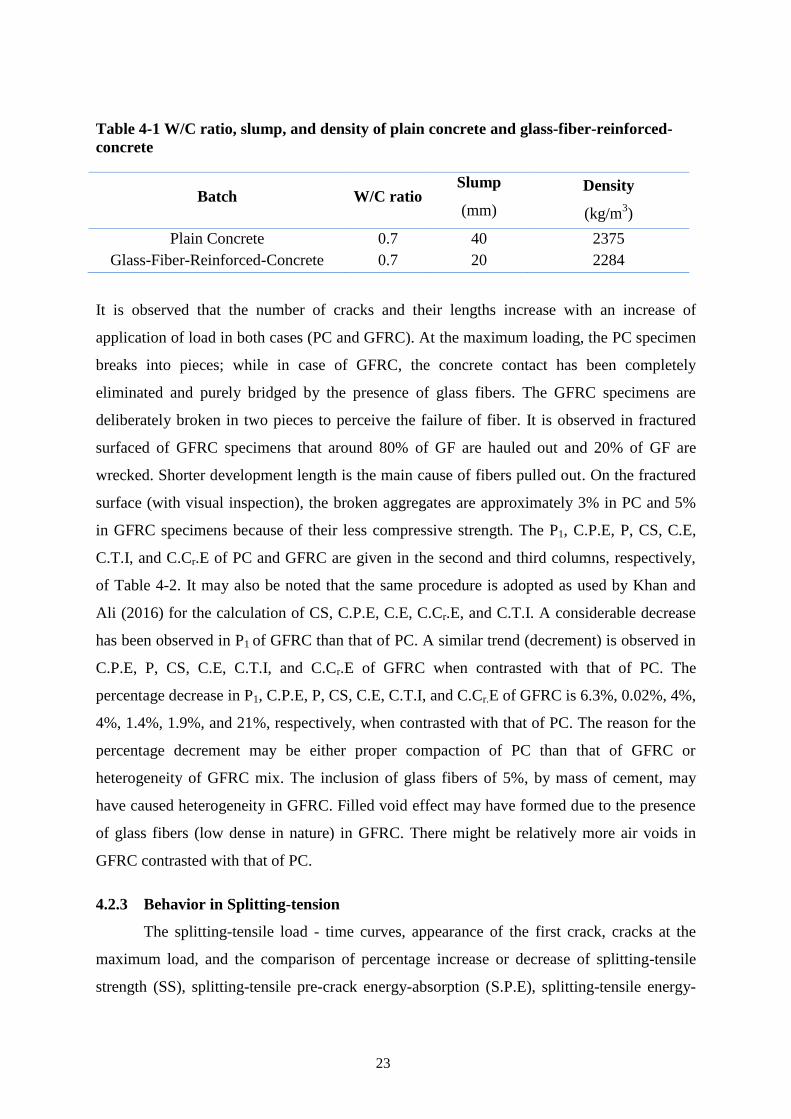
The slump of fresh concrete and density of hard concrete are given in Table 4-1. It is
observed that the slump of PC is more than that of GFRC by 20 mm for the same water
cement ratio i.e. 0.7. Consequently, the GFRC slump is decreased by 50% than that of PC. As
predicted, the decrement in the slump of GFRC is observed because of confinement and
retention effect of GF. The densities of PC and GFRC are 2375 kg/m3 and 2284 kg/m
3,
respectively. It is found that the density of GFRC is reduced by 91 kg/m3. The percentage
reduction in the density of GFRC is 3.83% contrasted to that of PC. This reduction is due to
the inclusion of glass fibers (less dense in nature) to the concrete.
4.2.2 Behavior in Compression
The compressive load - time graphs, appearance of the first crack, cracks at the
maximum load, and the comparison of percentage increase or decrease of compressive
strength (CS), compressive pre-crack energy-absorption (C.P.E), compressive energy-
absorption up to the maximum load (C.E) and compressive toughness index (C.T.I) of plain
concrete and glass-fiber-reinforced-concrete specimens are illustrated in Figure 4-1a. The
behavior (i.e. load-time curve and crack propagation) of PC and GFRC is noted while
performing compressive strength test, which is more or less same as reported by Khan and
Ali (2016). The first crack of PC and GFRC specimens is recorded at 81% and 79%,
respectively, of their maximum load.
23
Table 4-1 W/C ratio, slump, and density of plain concrete and glass-fiber-reinforced-
concrete
Batch W/C ratio Slump Density
(mm) (kg/m3)
Plain Concrete 0.7 40 2375
Glass-Fiber-Reinforced-Concrete 0.7 20 2284
It is observed that the number of cracks and their lengths increase with an increase of
application of load in both cases (PC and GFRC). At the maximum loading, the PC specimen
breaks into pieces; while in case of GFRC, the concrete contact has been completely
eliminated and purely bridged by the presence of glass fibers. The GFRC specimens are
deliberately broken in two pieces to perceive the failure of fiber. It is observed in fractured
surfaced of GFRC specimens that around 80% of GF are hauled out and 20% of GF are
wrecked. Shorter development length is the main cause of fibers pulled out. On the fractured
surface (with visual inspection), the broken aggregates are approximately 3% in PC and 5%
in GFRC specimens because of their less compressive strength. The P1, C.P.E, P, CS, C.E,
C.T.I, and C.Cr.E of PC and GFRC are given in the second and third columns, respectively,
of Table 4-2. It may also be noted that the same procedure is adopted as used by Khan and
Ali (2016) for the calculation of CS, C.P.E, C.E, C.Cr.E, and C.T.I. A considerable decrease
has been observed in P1 of GFRC than that of PC. A similar trend (decrement) is observed in
C.P.E, P, CS, C.E, C.T.I, and C.Cr.E of GFRC when contrasted with that of PC. The
percentage decrease in P1, C.P.E, P, CS, C.E, C.T.I, and C.Cr.E of GFRC is 6.3%, 0.02%, 4%,
4%, 1.4%, 1.9%, and 21%, respectively, when contrasted with that of PC. The reason for the
percentage decrement may be either proper compaction of PC than that of GFRC or
heterogeneity of GFRC mix. The inclusion of glass fibers of 5%, by mass of cement, may
have caused heterogeneity in GFRC. Filled void effect may have formed due to the presence
of glass fibers (low dense in nature) in GFRC. There might be relatively more air voids in
GFRC contrasted with that of PC.
4.2.3 Behavior in Splitting-tension
The splitting-tensile load - time curves, appearance of the first crack, cracks at the
maximum load, and the comparison of percentage increase or decrease of splitting-tensile
strength (SS), splitting-tensile pre-crack energy-absorption (S.P.E), splitting-tensile energy-
24
absorption up to the maximum load (S.E) and splitting-tensile toughness index (S.T.I) of
plain concrete and glass-fiber-reinforced-concrete specimens are presented in Figure 4-1b.
The first crack in the GFRC cylinder during splitting-tensile strength test is observed at 85%
of its maximum load. At the peak load, the PC specimen breaks into two pieces. While in
case of glass-fiber-reinforced-concrete, the contact of two pieces have been entirely
eradicated and the bridging phenomena takes place due to the addition of GF. The GFRC
specimens are deliberately separated into two pieces in order to perceive the failure of fibers.
It is noted, based on pictorial scrutiny from fractures surface of GFRC specimens, that about
15% of fibers hauled out and 85% of fibers are wrecked. The shorter development length
provides less grip to the surrounding matrix. The fibers wrecked due to appropriate
development length and no de-bonding of fibers occurred with the surrounding matrix. On
the fractured surface (with visual observation), the damaged aggregates are about 15% in PC
and 10% in GFRC specimens. The P1, S.P.E, P, SS, S.E, S.T.I, and S.Cr.E of PC and GFRC
specimens are given in the fourth and fifth columns of Table 4-2. The procedure adopted for
the calculation of SS, S.P.E, S.E, S.Cr.E, and S.T.I is same as followed by Khan and Ali
(2016). A decrement of 7.5% is observed in P1 of GFRC than that of PC, but a significant
increment is observed in S.P.E, P, SS, S.E, S.T.I, and S.Cr.E of GFRC when contrasted with
that of plain concrete. The percentage increases in S.P.E, P, SS, S.E, and S.T.I of glass-fiber-
reinforced-concrete are 7.8%, 8.3%, 8.3%, 16.4%, and 8%, respectively, when contrasted
with that of plain concrete. The S.Cr.E of glass-fiber-reinforced-concrete is 100 times more
than that of PC because PC specimens break into two pieces at the maximum load. It may be
noted that the addition of GF in concrete matrix is the cause of enhancement in S.P.E, P, SS,
S.E, and S.T.I.
4.2.4 Behavior in Flexure
The flexural load - time curves, appearance of the first crack, cracks at the maximum
load, and the comparison of percentage increase or decrease of modulus of rupture (MoR),
flexural pre-crack energy-absorption (F.P.E), flexural energy-absorption up to the maximum
load (F.E) and flexural toughness index (F.T.I) of plain concrete and glass-fiber-reinforced-
concrete specimens are illustrated in Figure 4-1c. The area under load - time graph up to the
first crack is considered as the flexural pre-crack energy-absorption (FPE). Flexural energy-
absorption (FE) is the total area under the load - time curve. Flexural toughness index (FTI) is
obtained by dividing flexural energy-absorption with the energy-absorption up to the first
25
crack load (i.e. FE/FPE). The observed behavior of PC and GFRC beam-lets is more or less
same as reported by Khan and Ali (2016). The first crack of GFRC beam-lets during the
flexural strength test has been observed at 84% of its maximum load. The PC samples breaks
into two halves at the maximum load, while in case of glass-fiber-reinforced-concrete, the
bridging phenomena takes place due to the glass fibers existence. The GFRC specimens are
consciously separated into two pieces in order to know the failure of fiber. It is noted on the
basis of visual examination from fractured surfaces of GFRC beam-lets that around 30% of
fibers tugged out and 70% of fibers are wrecked. The causes of pulling and breaking of fibers
have already been discussed earlier (i.e. the same reason as explained for splitting-tensile
strength test).
Table 4-2 Compressive, flexural and splitting-tensile properties of PC and GFRC
specimens with MD ratio of 1:2:4
Intended Properties
Compressive Splitting-tensile Flexural
PC GFRC PC GFRC PC GFRC (1) (2) (3) (4) (5) (6) (7)
P1 (kN)) 147.1 137.8 76.8 71.0 21.1 19.7
P.E (kN.s) 13147.9 13145.7 6119.0 6596.5 287.1 307.5
P (kN) 182.5 175.3 76.8 83.2 21.1 23.5
Strength (MPa)
22.5 21.6
2.4 2.6
13.8 15.4
E (kN.s) 14031.8 13842.0 6119.0 7121.7 287.1 318.8
T.I (-) 1.07 1.05 1.00 1.08 1.00 1.04
Cr.E (kN.s) 883.9 696.3 0 525.2 0 11.3
Note: P1 = First crack load, P.E = Pre-crack energy-absorption, P = Maximum load, E = Energy-absorption
up to the maximum load, T.I = E/P.E = Toughness index, and Cr.E = Cracked energy-absorption.
On the fractured surface the damaged aggregates are about 10% in PC and 5% in GFRC
specimens. The flexural behavior is recorded up to the maximum load only. The post
cracking behavior is not recorded because of testing machine limitations at that time. The P1,
F.P.E, P, MoR, F.E, F.T.I, and F.Cr.E of PC and GFRC are given in the sixth and seventh
columns of Table 4-2. The same procedure is adopted for the calculation of MoR, F.P.E, F.E,
F.Cr.E, and F.T.I as followed by Khan and Ali (2016). A decrease in P1 of GFRC beam-lets is
about 6.6% contrasted to that of PC beam-lets, but a considerable increment is observed in
26
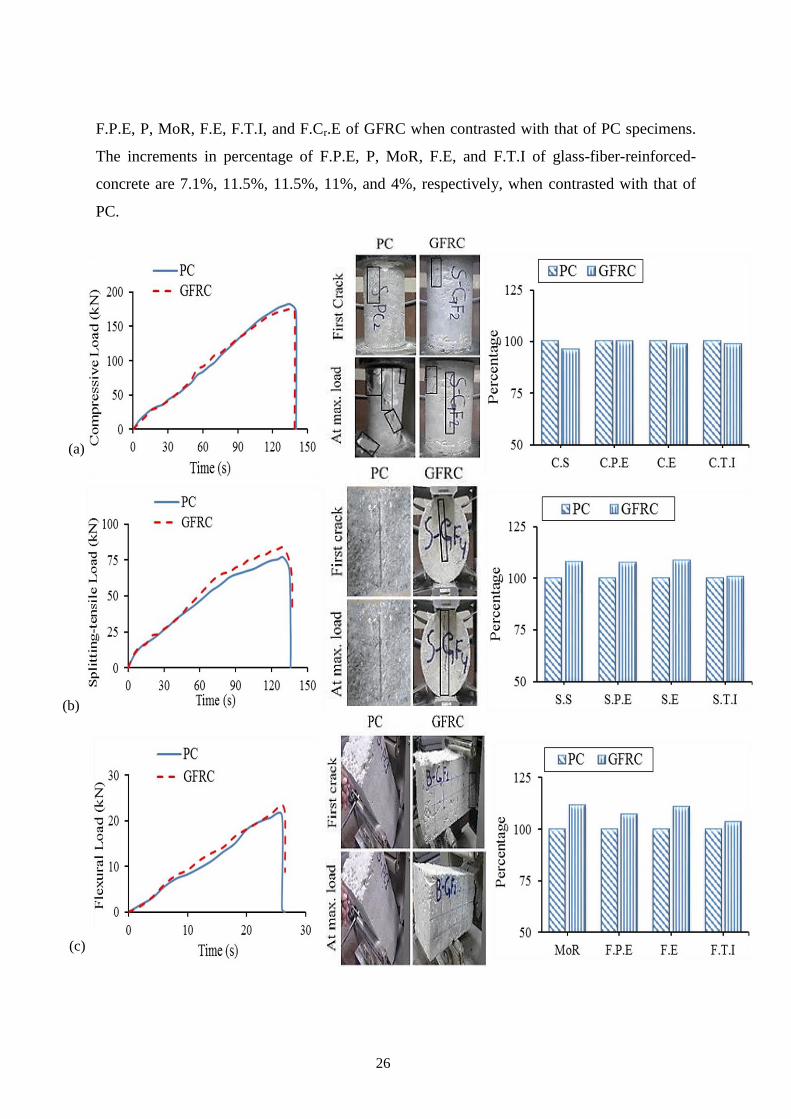
F.P.E, P, MoR, F.E, F.T.I, and F.Cr.E of GFRC when contrasted with that of PC specimens.
The increments in percentage of F.P.E, P, MoR, F.E, and F.T.I of glass-fiber-reinforced-
concrete are 7.1%, 11.5%, 11.5%, 11%, and 4%, respectively, when contrasted with that of
PC.
(a)
(b)
(c)
27
Figure 4-1 Material-properties of PC and GFRC specimens with MD ratio of 1:2:4
(typical load-time curves, tested specimens at the first crack and at the maximum load,
and comparison of average strength, energy-absorption, and toughness index): (a)
compressive, (b) splitting-tensile, and (c) flexural
Like splitting-tensile strength test, F.Cr.E of GFRC is 100 times more than that of PC because
PC specimens break into two pieces at the peak load. The MoR, F.E, and F.T.I are better in
case of GFRC than that of the PC, that is why, GFRC is suitable to be used as a crack arrester
in concrete.
Properties and Behavior of Steel-reinforced Specimens 4.3
4.3.1 Beam-lets with Varying Flexural Reinforcement and Constant Shear
Reinforcement (Ø6-76 mm)
a) Load-deflection behavior with varying flexural rebars
The recorded mid-span load-deflection curves of beam-lets (PC and GFRC) with
varying flexural reinforcement and constant shear reinforcement are presented in Figure 4-2.
The first crack, cracks at the maximum load, and cracks at the ultimate load during the
testing, and the tested beam-lets (PC and GFRC) with varying flexural reinforcement and
constant shear reinforcement (Ø6-76 mm) are shown in Figure 4-3. The flexural
reinforcement is increased by 2-Ø6, 3-Ø6, and 2+2-Ø6 in both cases i.e. PC and GFRC. It is
observed that, before the appearance of first crack, all the load-deflection curves are more or
less linearly increased. The area under the load-deflection curve represents energy-absorption
of the tested beam-lets. The behavior (appearance of first crack and cracks propagation) of
beam-lets with rebars are noted during the flexural strength test. However, few facts e.g. first
crack length and number of cracks at the peak load and at the ultimate load are discovered in
current study. The first cracks of PF1, GF1, PF2, GF2, PF3, and GF3 are appeared at 84.1%,
80.1%, 91.1%, 85.1%, 92.9%, and 89.6%, respectively, of their respective peak load. The
length (noted with the help of grid lines) and width of the first crack in steel-reinforced PC
beam-lets is more than that of the respective steel-reinforced GFRC beam-lets. It is also
observed that the length of the first crack decreases with an increase in flexural
reinforcement. The length of the first crack in PF1, PF2, and PF3 beam-lets is approximately
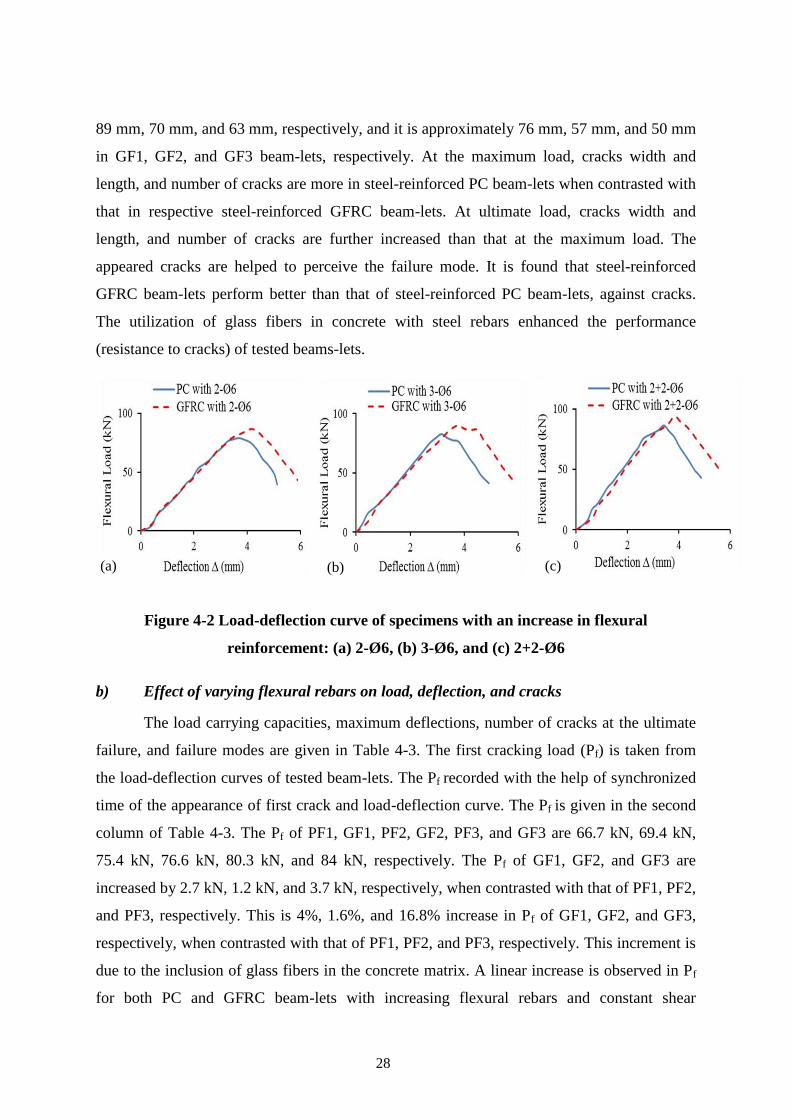
28
89 mm, 70 mm, and 63 mm, respectively, and it is approximately 76 mm, 57 mm, and 50 mm
in GF1, GF2, and GF3 beam-lets, respectively. At the maximum load, cracks width and
length, and number of cracks are more in steel-reinforced PC beam-lets when contrasted with
that in respective steel-reinforced GFRC beam-lets. At ultimate load, cracks width and
length, and number of cracks are further increased than that at the maximum load. The
appeared cracks are helped to perceive the failure mode. It is found that steel-reinforced
GFRC beam-lets perform better than that of steel-reinforced PC beam-lets, against cracks.
The utilization of glass fibers in concrete with steel rebars enhanced the performance
(resistance to cracks) of tested beams-lets.
Figure 4-2 Load-deflection curve of specimens with an increase in flexural
reinforcement: (a) 2-Ø6, (b) 3-Ø6, and (c) 2+2-Ø6
b) Effect of varying flexural rebars on load, deflection, and cracks
The load carrying capacities, maximum deflections, number of cracks at the ultimate
failure, and failure modes are given in Table 4-3. The first cracking load (Pf) is taken from
the load-deflection curves of tested beam-lets. The Pf recorded with the help of synchronized
time of the appearance of first crack and load-deflection curve. The Pf is given in the second
column of Table 4-3. The Pf of PF1, GF1, PF2, GF2, PF3, and GF3 are 66.7 kN, 69.4 kN,
75.4 kN, 76.6 kN, 80.3 kN, and 84 kN, respectively. The Pf of GF1, GF2, and GF3 are
increased by 2.7 kN, 1.2 kN, and 3.7 kN, respectively, when contrasted with that of PF1, PF2,
and PF3, respectively. This is 4%, 1.6%, and 16.8% increase in Pf of GF1, GF2, and GF3,
respectively, when contrasted with that of PF1, PF2, and PF3, respectively. This increment is
due to the inclusion of glass fibers in the concrete matrix. A linear increase is observed in Pf
for both PC and GFRC beam-lets with increasing flexural rebars and constant shear
(a) (b) (c)
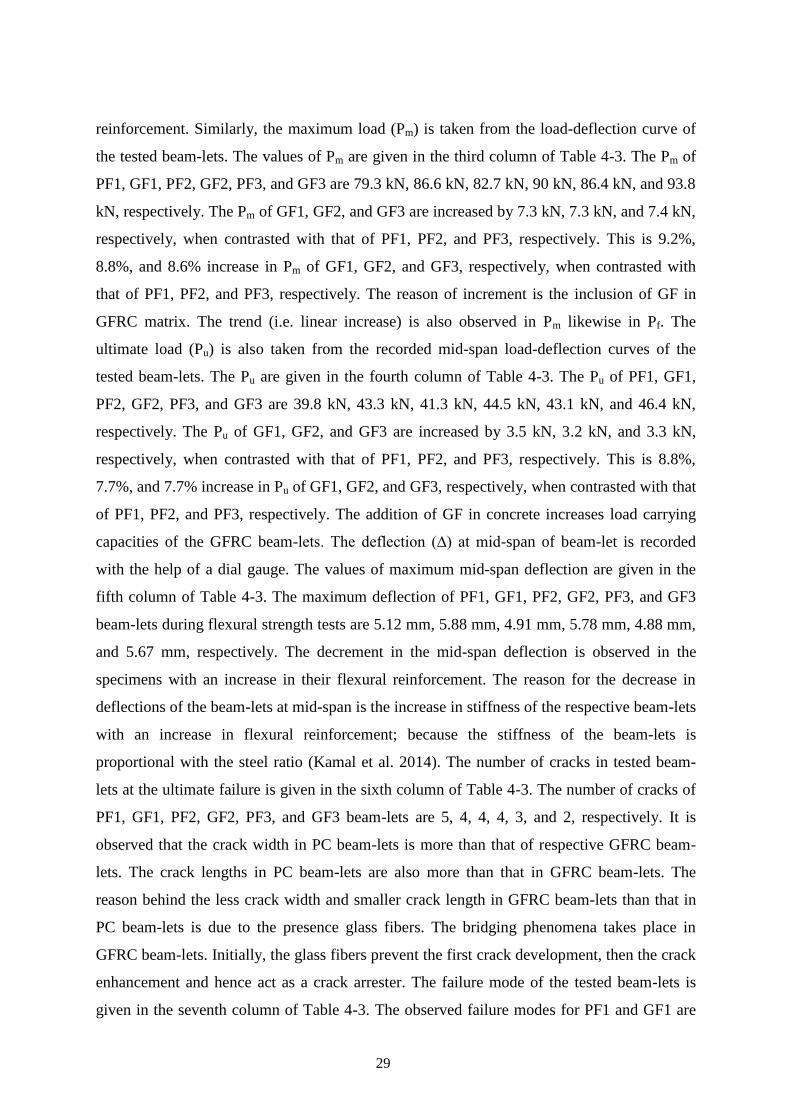
29
reinforcement. Similarly, the maximum load (Pm) is taken from the load-deflection curve of
the tested beam-lets. The values of Pm are given in the third column of Table 4-3. The Pm of
PF1, GF1, PF2, GF2, PF3, and GF3 are 79.3 kN, 86.6 kN, 82.7 kN, 90 kN, 86.4 kN, and 93.8
kN, respectively. The Pm of GF1, GF2, and GF3 are increased by 7.3 kN, 7.3 kN, and 7.4 kN,
respectively, when contrasted with that of PF1, PF2, and PF3, respectively. This is 9.2%,
8.8%, and 8.6% increase in Pm of GF1, GF2, and GF3, respectively, when contrasted with
that of PF1, PF2, and PF3, respectively. The reason of increment is the inclusion of GF in
GFRC matrix. The trend (i.e. linear increase) is also observed in Pm likewise in Pf. The
ultimate load (Pu) is also taken from the recorded mid-span load-deflection curves of the
tested beam-lets. The Pu are given in the fourth column of Table 4-3. The Pu of PF1, GF1,
PF2, GF2, PF3, and GF3 are 39.8 kN, 43.3 kN, 41.3 kN, 44.5 kN, 43.1 kN, and 46.4 kN,
respectively. The Pu of GF1, GF2, and GF3 are increased by 3.5 kN, 3.2 kN, and 3.3 kN,
respectively, when contrasted with that of PF1, PF2, and PF3, respectively. This is 8.8%,
7.7%, and 7.7% increase in Pu of GF1, GF2, and GF3, respectively, when contrasted with that
of PF1, PF2, and PF3, respectively. The addition of GF in concrete increases load carrying
capacities of the GFRC beam-lets. The deflection (∆) at mid-span of beam-let is recorded
with the help of a dial gauge. The values of maximum mid-span deflection are given in the
fifth column of Table 4-3. The maximum deflection of PF1, GF1, PF2, GF2, PF3, and GF3
beam-lets during flexural strength tests are 5.12 mm, 5.88 mm, 4.91 mm, 5.78 mm, 4.88 mm,
and 5.67 mm, respectively. The decrement in the mid-span deflection is observed in the
specimens with an increase in their flexural reinforcement. The reason for the decrease in
deflections of the beam-lets at mid-span is the increase in stiffness of the respective beam-lets
with an increase in flexural reinforcement; because the stiffness of the beam-lets is
proportional with the steel ratio (Kamal et al. 2014). The number of cracks in tested beam-
lets at the ultimate failure is given in the sixth column of Table 4-3. The number of cracks of
PF1, GF1, PF2, GF2, PF3, and GF3 beam-lets are 5, 4, 4, 4, 3, and 2, respectively. It is
observed that the crack width in PC beam-lets is more than that of respective GFRC beam-
lets. The crack lengths in PC beam-lets are also more than that in GFRC beam-lets. The
reason behind the less crack width and smaller crack length in GFRC beam-lets than that in
PC beam-lets is due to the presence glass fibers. The bridging phenomena takes place in
GFRC beam-lets. Initially, the glass fibers prevent the first crack development, then the crack
enhancement and hence act as a crack arrester. The failure mode of the tested beam-lets is
given in the seventh column of Table 4-3. The observed failure modes for PF1 and GF1 are
30
flexural, for PF2 and GF2 are balanced, and that for PF3 and GF3 are shear. Flexural failure
is due to relatively less reinforcement and shear failure is due to relatively less shear
reinforcement. Flexural failure mode indicates that the failure is caused by flexural cracks,
shear failure mode indicates that the failure is caused by shear cracks (propagated at 45o), and
balanced failure mode indicates that the number of flexural and shear cracks are almost the
same at the ultimate failure.
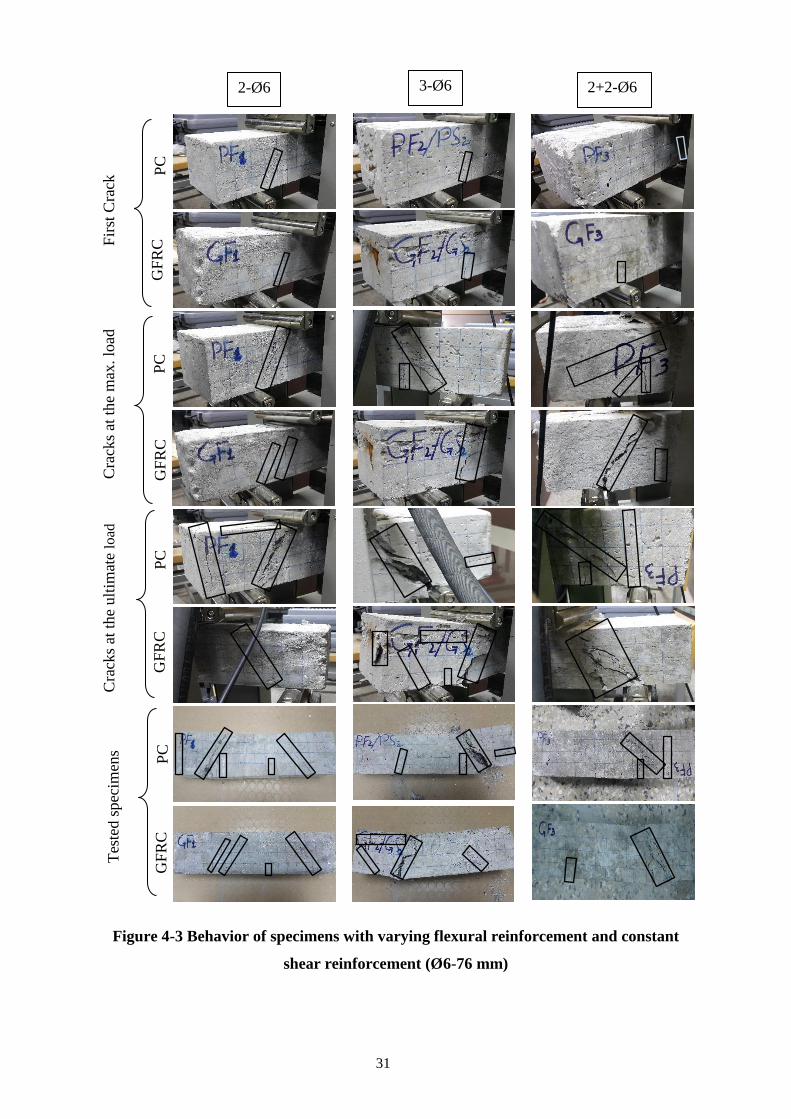
31
Figure 4-3 Behavior of specimens with varying flexural reinforcement and constant
shear reinforcement (Ø6-76 mm)
PC
G
FR
C
PC
G
FR
C
PC
G
FR
C
PC
G
FR
C
2-Ø6 3-Ø6 2+2-Ø6
Cra
cks
at t
he
ult
imat
e lo
ad
Tes
ted s
pec
imen
s C
rack
s at
the
max
. lo
ad
Fir
st C
rack
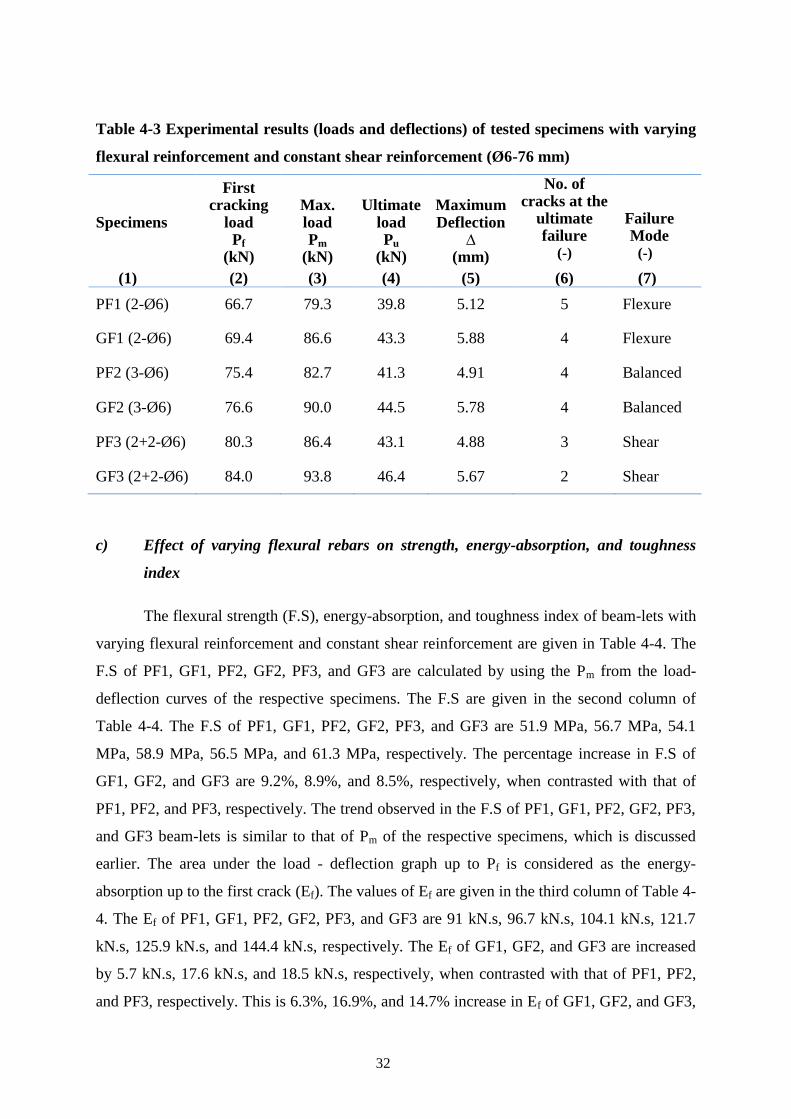
32
Table 4-3 Experimental results (loads and deflections) of tested specimens with varying
flexural reinforcement and constant shear reinforcement (Ø6-76 mm)
Specimens
First cracking
load Pf
(kN)
Max. load Pm
(kN)
Ultimate
load Pu
(kN)
Maximum Deflection
∆ (mm)
No. of cracks at the
ultimate failure
(-)
Failure Mode
(-)
(1) (2) (3) (4) (5) (6) (7)
PF1 (2-Ø6) 66.7 79.3 39.8 5.12 5 Flexure
GF1 (2-Ø6) 69.4 86.6 43.3 5.88 4 Flexure
PF2 (3-Ø6) 75.4 82.7 41.3 4.91 4 Balanced
GF2 (3-Ø6) 76.6 90.0 44.5 5.78 4 Balanced
PF3 (2+2-Ø6) 80.3 86.4 43.1 4.88 3 Shear
GF3 (2+2-Ø6) 84.0 93.8 46.4 5.67 2 Shear
c) Effect of varying flexural rebars on strength, energy-absorption, and toughness
index
The flexural strength (F.S), energy-absorption, and toughness index of beam-lets with
varying flexural reinforcement and constant shear reinforcement are given in Table 4-4. The
F.S of PF1, GF1, PF2, GF2, PF3, and GF3 are calculated by using the Pm from the load-
deflection curves of the respective specimens. The F.S are given in the second column of
Table 4-4. The F.S of PF1, GF1, PF2, GF2, PF3, and GF3 are 51.9 MPa, 56.7 MPa, 54.1
MPa, 58.9 MPa, 56.5 MPa, and 61.3 MPa, respectively. The percentage increase in F.S of
GF1, GF2, and GF3 are 9.2%, 8.9%, and 8.5%, respectively, when contrasted with that of
PF1, PF2, and PF3, respectively. The trend observed in the F.S of PF1, GF1, PF2, GF2, PF3,
and GF3 beam-lets is similar to that of Pm of the respective specimens, which is discussed
earlier. The area under the load - deflection graph up to Pf is considered as the energy-
absorption up to the first crack (Ef). The values of Ef are given in the third column of Table 4-
4. The Ef of PF1, GF1, PF2, GF2, PF3, and GF3 are 91 kN.s, 96.7 kN.s, 104.1 kN.s, 121.7
kN.s, 125.9 kN.s, and 144.4 kN.s, respectively. The Ef of GF1, GF2, and GF3 are increased
by 5.7 kN.s, 17.6 kN.s, and 18.5 kN.s, respectively, when contrasted with that of PF1, PF2,
and PF3, respectively. This is 6.3%, 16.9%, and 14.7% increase in Ef of GF1, GF2, and GF3,
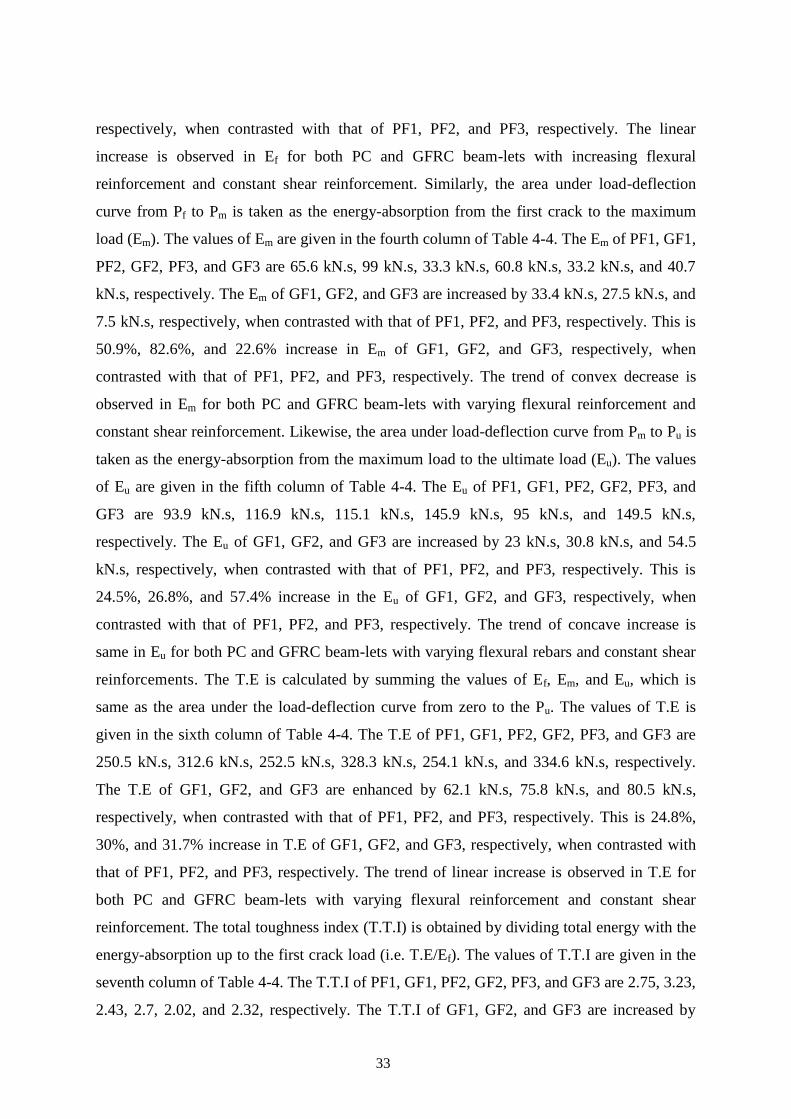
33
respectively, when contrasted with that of PF1, PF2, and PF3, respectively. The linear
increase is observed in Ef for both PC and GFRC beam-lets with increasing flexural
reinforcement and constant shear reinforcement. Similarly, the area under load-deflection
curve from Pf to Pm is taken as the energy-absorption from the first crack to the maximum
load (Em). The values of Em are given in the fourth column of Table 4-4. The Em of PF1, GF1,
PF2, GF2, PF3, and GF3 are 65.6 kN.s, 99 kN.s, 33.3 kN.s, 60.8 kN.s, 33.2 kN.s, and 40.7
kN.s, respectively. The Em of GF1, GF2, and GF3 are increased by 33.4 kN.s, 27.5 kN.s, and
7.5 kN.s, respectively, when contrasted with that of PF1, PF2, and PF3, respectively. This is
50.9%, 82.6%, and 22.6% increase in Em of GF1, GF2, and GF3, respectively, when
contrasted with that of PF1, PF2, and PF3, respectively. The trend of convex decrease is
observed in Em for both PC and GFRC beam-lets with varying flexural reinforcement and
constant shear reinforcement. Likewise, the area under load-deflection curve from Pm to Pu is
taken as the energy-absorption from the maximum load to the ultimate load (Eu). The values
of Eu are given in the fifth column of Table 4-4. The Eu of PF1, GF1, PF2, GF2, PF3, and
GF3 are 93.9 kN.s, 116.9 kN.s, 115.1 kN.s, 145.9 kN.s, 95 kN.s, and 149.5 kN.s,
respectively. The Eu of GF1, GF2, and GF3 are increased by 23 kN.s, 30.8 kN.s, and 54.5
kN.s, respectively, when contrasted with that of PF1, PF2, and PF3, respectively. This is
24.5%, 26.8%, and 57.4% increase in the Eu of GF1, GF2, and GF3, respectively, when
contrasted with that of PF1, PF2, and PF3, respectively. The trend of concave increase is
same in Eu for both PC and GFRC beam-lets with varying flexural rebars and constant shear
reinforcements. The T.E is calculated by summing the values of Ef, Em, and Eu, which is
same as the area under the load-deflection curve from zero to the Pu. The values of T.E is
given in the sixth column of Table 4-4. The T.E of PF1, GF1, PF2, GF2, PF3, and GF3 are
250.5 kN.s, 312.6 kN.s, 252.5 kN.s, 328.3 kN.s, 254.1 kN.s, and 334.6 kN.s, respectively.
The T.E of GF1, GF2, and GF3 are enhanced by 62.1 kN.s, 75.8 kN.s, and 80.5 kN.s,
respectively, when contrasted with that of PF1, PF2, and PF3, respectively. This is 24.8%,
30%, and 31.7% increase in T.E of GF1, GF2, and GF3, respectively, when contrasted with
that of PF1, PF2, and PF3, respectively. The trend of linear increase is observed in T.E for
both PC and GFRC beam-lets with varying flexural reinforcement and constant shear
reinforcement. The total toughness index (T.T.I) is obtained by dividing total energy with the
energy-absorption up to the first crack load (i.e. T.E/Ef). The values of T.T.I are given in the
seventh column of Table 4-4. The T.T.I of PF1, GF1, PF2, GF2, PF3, and GF3 are 2.75, 3.23,
2.43, 2.7, 2.02, and 2.32, respectively. The T.T.I of GF1, GF2, and GF3 are increased by
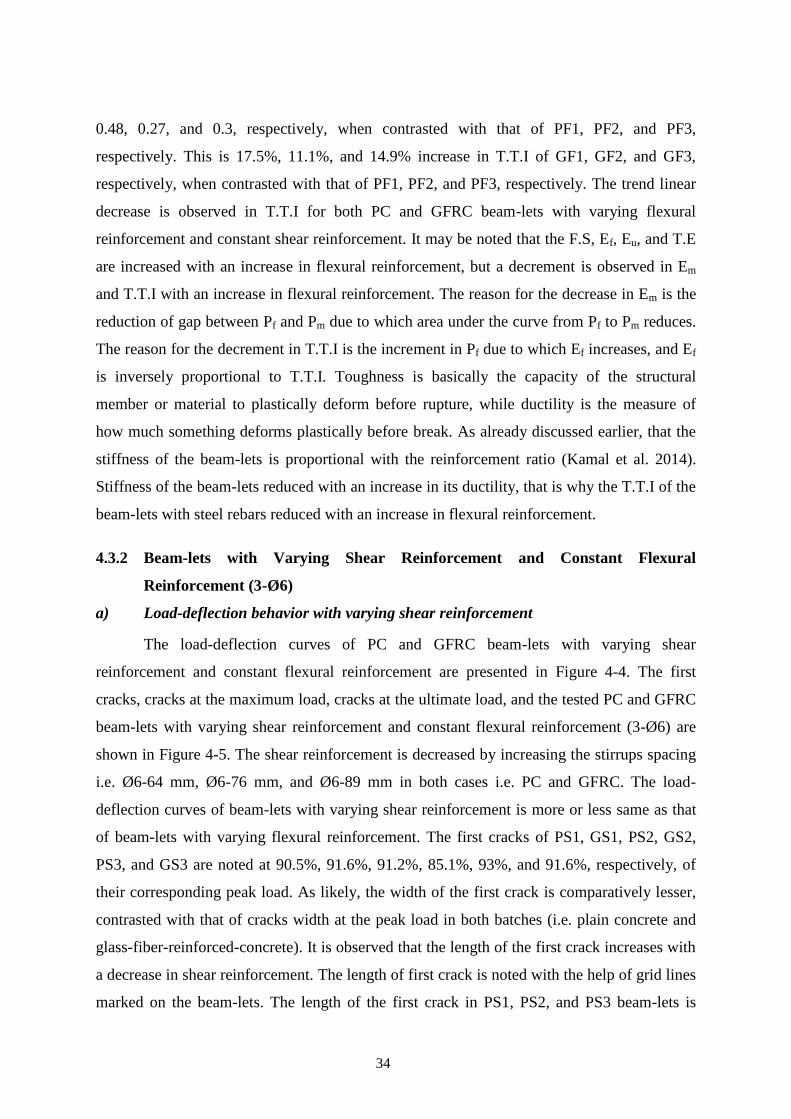
34
0.48, 0.27, and 0.3, respectively, when contrasted with that of PF1, PF2, and PF3,
respectively. This is 17.5%, 11.1%, and 14.9% increase in T.T.I of GF1, GF2, and GF3,
respectively, when contrasted with that of PF1, PF2, and PF3, respectively. The trend linear
decrease is observed in T.T.I for both PC and GFRC beam-lets with varying flexural
reinforcement and constant shear reinforcement. It may be noted that the F.S, Ef, Eu, and T.E
are increased with an increase in flexural reinforcement, but a decrement is observed in Em
and T.T.I with an increase in flexural reinforcement. The reason for the decrease in Em is the
reduction of gap between Pf and Pm due to which area under the curve from Pf to Pm reduces.
The reason for the decrement in T.T.I is the increment in Pf due to which Ef increases, and Ef
is inversely proportional to T.T.I. Toughness is basically the capacity of the structural
member or material to plastically deform before rupture, while ductility is the measure of
how much something deforms plastically before break. As already discussed earlier, that the
stiffness of the beam-lets is proportional with the reinforcement ratio (Kamal et al. 2014).
Stiffness of the beam-lets reduced with an increase in its ductility, that is why the T.T.I of the
beam-lets with steel rebars reduced with an increase in flexural reinforcement.
4.3.2 Beam-lets with Varying Shear Reinforcement and Constant Flexural
Reinforcement (3-Ø6)
a) Load-deflection behavior with varying shear reinforcement
The load-deflection curves of PC and GFRC beam-lets with varying shear
reinforcement and constant flexural reinforcement are presented in Figure 4-4. The first
cracks, cracks at the maximum load, cracks at the ultimate load, and the tested PC and GFRC
beam-lets with varying shear reinforcement and constant flexural reinforcement (3-Ø6) are
shown in Figure 4-5. The shear reinforcement is decreased by increasing the stirrups spacing
i.e. Ø6-64 mm, Ø6-76 mm, and Ø6-89 mm in both cases i.e. PC and GFRC. The load-
deflection curves of beam-lets with varying shear reinforcement is more or less same as that
of beam-lets with varying flexural reinforcement. The first cracks of PS1, GS1, PS2, GS2,
PS3, and GS3 are noted at 90.5%, 91.6%, 91.2%, 85.1%, 93%, and 91.6%, respectively, of
their corresponding peak load. As likely, the width of the first crack is comparatively lesser,
contrasted with that of cracks width at the peak load in both batches (i.e. plain concrete and
glass-fiber-reinforced-concrete). It is observed that the length of the first crack increases with
a decrease in shear reinforcement. The length of first crack is noted with the help of grid lines
marked on the beam-lets. The length of the first crack in PS1, PS2, and PS3 beam-lets is
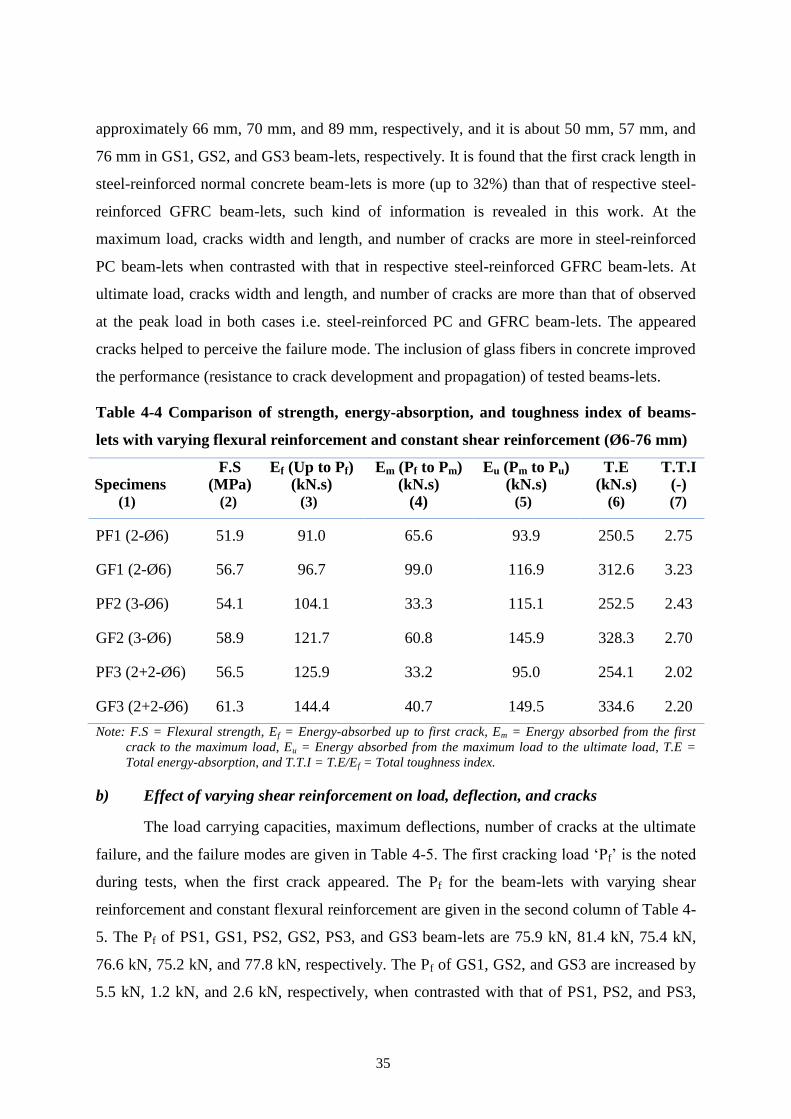
35
approximately 66 mm, 70 mm, and 89 mm, respectively, and it is about 50 mm, 57 mm, and
76 mm in GS1, GS2, and GS3 beam-lets, respectively. It is found that the first crack length in
steel-reinforced normal concrete beam-lets is more (up to 32%) than that of respective steel-
reinforced GFRC beam-lets, such kind of information is revealed in this work. At the
maximum load, cracks width and length, and number of cracks are more in steel-reinforced
PC beam-lets when contrasted with that in respective steel-reinforced GFRC beam-lets. At
ultimate load, cracks width and length, and number of cracks are more than that of observed
at the peak load in both cases i.e. steel-reinforced PC and GFRC beam-lets. The appeared
cracks helped to perceive the failure mode. The inclusion of glass fibers in concrete improved
the performance (resistance to crack development and propagation) of tested beams-lets.
Table 4-4 Comparison of strength, energy-absorption, and toughness index of beams-
lets with varying flexural reinforcement and constant shear reinforcement (Ø6-76 mm)
Specimens (1)
F.S (MPa)
(2)
Ef (Up to Pf) (kN.s)
(3)
Em (Pf to Pm) (kN.s)
(4)
Eu (Pm to Pu) (kN.s)
(5)
T.E (kN.s)
(6)
T.T.I (-) (7)
PF1 (2-Ø6) 51.9 91.0 65.6 93.9 250.5 2.75
GF1 (2-Ø6) 56.7 96.7 99.0 116.9 312.6 3.23
PF2 (3-Ø6) 54.1 104.1 33.3 115.1 252.5 2.43
GF2 (3-Ø6) 58.9 121.7 60.8 145.9 328.3 2.70
PF3 (2+2-Ø6) 56.5 125.9 33.2 95.0 254.1 2.02
GF3 (2+2-Ø6) 61.3 144.4 40.7 149.5 334.6 2.20
Note: F.S = Flexural strength, Ef = Energy-absorbed up to first crack, Em = Energy absorbed from the first
crack to the maximum load, Eu = Energy absorbed from the maximum load to the ultimate load, T.E =
Total energy-absorption, and T.T.I = T.E/Ef = Total toughness index.
b) Effect of varying shear reinforcement on load, deflection, and cracks
The load carrying capacities, maximum deflections, number of cracks at the ultimate
failure, and the failure modes are given in Table 4-5. The first cracking load ‘Pf’ is the noted
during tests, when the first crack appeared. The Pf for the beam-lets with varying shear
reinforcement and constant flexural reinforcement are given in the second column of Table 4-
5. The Pf of PS1, GS1, PS2, GS2, PS3, and GS3 beam-lets are 75.9 kN, 81.4 kN, 75.4 kN,
76.6 kN, 75.2 kN, and 77.8 kN, respectively. The Pf of GS1, GS2, and GS3 are increased by
5.5 kN, 1.2 kN, and 2.6 kN, respectively, when contrasted with that of PS1, PS2, and PS3,
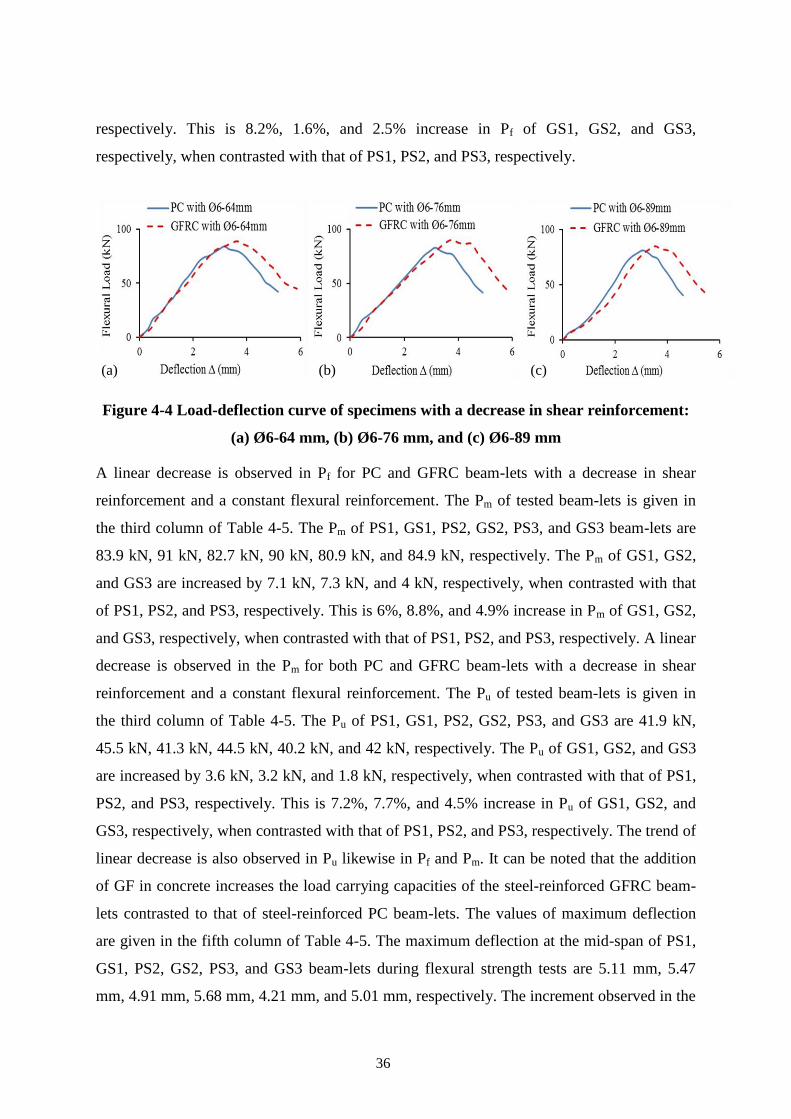
36
respectively. This is 8.2%, 1.6%, and 2.5% increase in Pf of GS1, GS2, and GS3,
respectively, when contrasted with that of PS1, PS2, and PS3, respectively.
Figure 4-4 Load-deflection curve of specimens with a decrease in shear reinforcement:
(a) Ø6-64 mm, (b) Ø6-76 mm, and (c) Ø6-89 mm
A linear decrease is observed in Pf for PC and GFRC beam-lets with a decrease in shear
reinforcement and a constant flexural reinforcement. The Pm of tested beam-lets is given in
the third column of Table 4-5. The Pm of PS1, GS1, PS2, GS2, PS3, and GS3 beam-lets are
83.9 kN, 91 kN, 82.7 kN, 90 kN, 80.9 kN, and 84.9 kN, respectively. The Pm of GS1, GS2,
and GS3 are increased by 7.1 kN, 7.3 kN, and 4 kN, respectively, when contrasted with that
of PS1, PS2, and PS3, respectively. This is 6%, 8.8%, and 4.9% increase in Pm of GS1, GS2,
and GS3, respectively, when contrasted with that of PS1, PS2, and PS3, respectively. A linear
decrease is observed in the Pm for both PC and GFRC beam-lets with a decrease in shear
reinforcement and a constant flexural reinforcement. The Pu of tested beam-lets is given in
the third column of Table 4-5. The Pu of PS1, GS1, PS2, GS2, PS3, and GS3 are 41.9 kN,
45.5 kN, 41.3 kN, 44.5 kN, 40.2 kN, and 42 kN, respectively. The Pu of GS1, GS2, and GS3
are increased by 3.6 kN, 3.2 kN, and 1.8 kN, respectively, when contrasted with that of PS1,
PS2, and PS3, respectively. This is 7.2%, 7.7%, and 4.5% increase in Pu of GS1, GS2, and
GS3, respectively, when contrasted with that of PS1, PS2, and PS3, respectively. The trend of
linear decrease is also observed in Pu likewise in Pf and Pm. It can be noted that the addition
of GF in concrete increases the load carrying capacities of the steel-reinforced GFRC beam-
lets contrasted to that of steel-reinforced PC beam-lets. The values of maximum deflection
are given in the fifth column of Table 4-5. The maximum deflection at the mid-span of PS1,
GS1, PS2, GS2, PS3, and GS3 beam-lets during flexural strength tests are 5.11 mm, 5.47
mm, 4.91 mm, 5.68 mm, 4.21 mm, and 5.01 mm, respectively. The increment observed in the
(a) (b) (c)
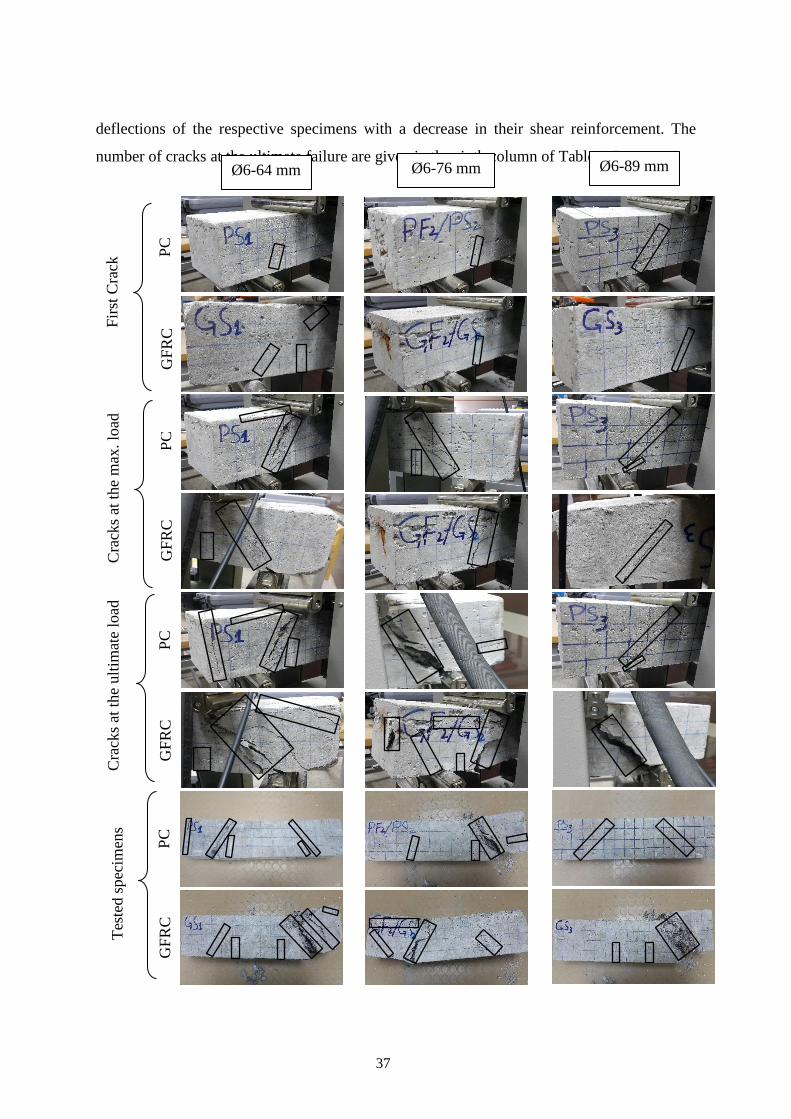
37
deflections of the respective specimens with a decrease in their shear reinforcement. The
number of cracks at the ultimate failure are given in the sixth column of Table 4-5.
Fir
st C
rack
C
rack
s at
the
max
. lo
ad
GF
RC
G
FR
C
PC
P
C
GF
RC
P
C
GF
RC
P
C
Ø6-64 mm Ø6-76 mm Ø6-89 mm
Cra
cks
at t
he
ult
imat
e lo
ad
Tes
ted s
pec
imen
s
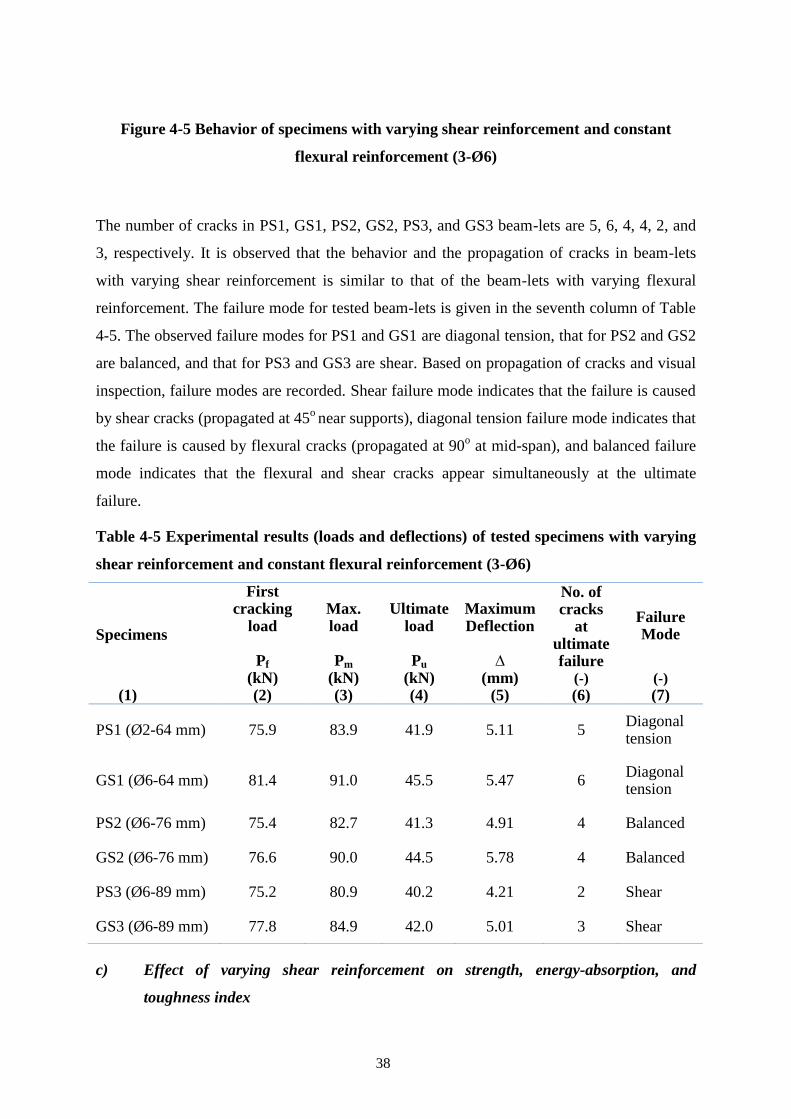
38
Figure 4-5 Behavior of specimens with varying shear reinforcement and constant
flexural reinforcement (3-Ø6)
The number of cracks in PS1, GS1, PS2, GS2, PS3, and GS3 beam-lets are 5, 6, 4, 4, 2, and
3, respectively. It is observed that the behavior and the propagation of cracks in beam-lets
with varying shear reinforcement is similar to that of the beam-lets with varying flexural
reinforcement. The failure mode for tested beam-lets is given in the seventh column of Table
4-5. The observed failure modes for PS1 and GS1 are diagonal tension, that for PS2 and GS2
are balanced, and that for PS3 and GS3 are shear. Based on propagation of cracks and visual
inspection, failure modes are recorded. Shear failure mode indicates that the failure is caused
by shear cracks (propagated at 45o near supports), diagonal tension failure mode indicates that
the failure is caused by flexural cracks (propagated at 90o at mid-span), and balanced failure
mode indicates that the flexural and shear cracks appear simultaneously at the ultimate
failure.
Table 4-5 Experimental results (loads and deflections) of tested specimens with varying
shear reinforcement and constant flexural reinforcement (3-Ø6)
c) Effect of varying shear reinforcement on strength, energy-absorption, and
toughness index
Specimens
First cracking
load
Pf (kN)
Max. load
Pm
(kN)
Ultimate load
Pu
(kN)
Maximum Deflection
∆
(mm)
No. of cracks
at ultimate failure
(-)
Failure Mode
(-)
(1) (2) (3) (4) (5) (6) (7)
PS1 (Ø2-64 mm) 75.9 83.9 41.9 5.11 5 Diagonal tension
GS1 (Ø6-64 mm) 81.4 91.0 45.5 5.47 6 Diagonal tension
PS2 (Ø6-76 mm) 75.4 82.7 41.3 4.91 4 Balanced
GS2 (Ø6-76 mm) 76.6 90.0 44.5 5.78 4 Balanced
PS3 (Ø6-89 mm) 75.2 80.9 40.2 4.21 2 Shear
GS3 (Ø6-89 mm) 77.8 84.9 42.0 5.01 3 Shear
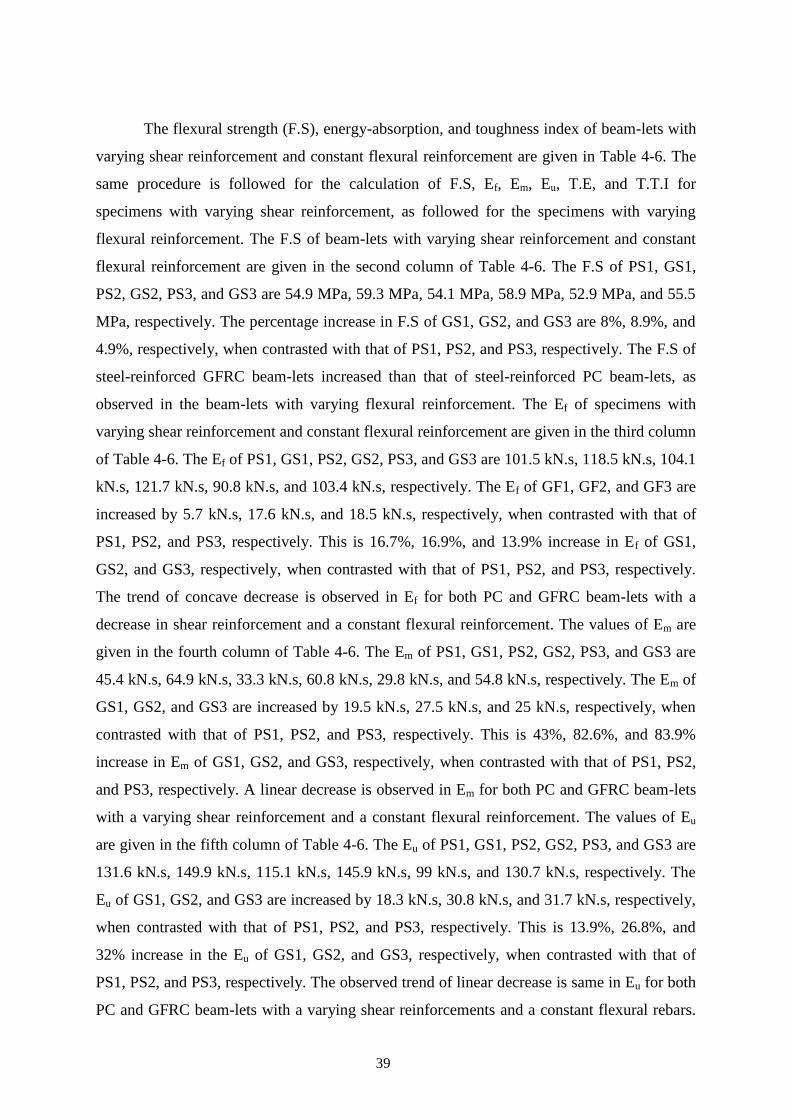
39
The flexural strength (F.S), energy-absorption, and toughness index of beam-lets with
varying shear reinforcement and constant flexural reinforcement are given in Table 4-6. The
same procedure is followed for the calculation of F.S, Ef, Em, Eu, T.E, and T.T.I for
specimens with varying shear reinforcement, as followed for the specimens with varying
flexural reinforcement. The F.S of beam-lets with varying shear reinforcement and constant
flexural reinforcement are given in the second column of Table 4-6. The F.S of PS1, GS1,
PS2, GS2, PS3, and GS3 are 54.9 MPa, 59.3 MPa, 54.1 MPa, 58.9 MPa, 52.9 MPa, and 55.5
MPa, respectively. The percentage increase in F.S of GS1, GS2, and GS3 are 8%, 8.9%, and
4.9%, respectively, when contrasted with that of PS1, PS2, and PS3, respectively. The F.S of
steel-reinforced GFRC beam-lets increased than that of steel-reinforced PC beam-lets, as
observed in the beam-lets with varying flexural reinforcement. The Ef of specimens with
varying shear reinforcement and constant flexural reinforcement are given in the third column
of Table 4-6. The Ef of PS1, GS1, PS2, GS2, PS3, and GS3 are 101.5 kN.s, 118.5 kN.s, 104.1
kN.s, 121.7 kN.s, 90.8 kN.s, and 103.4 kN.s, respectively. The Ef of GF1, GF2, and GF3 are
increased by 5.7 kN.s, 17.6 kN.s, and 18.5 kN.s, respectively, when contrasted with that of
PS1, PS2, and PS3, respectively. This is 16.7%, 16.9%, and 13.9% increase in Ef of GS1,
GS2, and GS3, respectively, when contrasted with that of PS1, PS2, and PS3, respectively.
The trend of concave decrease is observed in Ef for both PC and GFRC beam-lets with a
decrease in shear reinforcement and a constant flexural reinforcement. The values of Em are
given in the fourth column of Table 4-6. The Em of PS1, GS1, PS2, GS2, PS3, and GS3 are
45.4 kN.s, 64.9 kN.s, 33.3 kN.s, 60.8 kN.s, 29.8 kN.s, and 54.8 kN.s, respectively. The Em of
GS1, GS2, and GS3 are increased by 19.5 kN.s, 27.5 kN.s, and 25 kN.s, respectively, when
contrasted with that of PS1, PS2, and PS3, respectively. This is 43%, 82.6%, and 83.9%
increase in Em of GS1, GS2, and GS3, respectively, when contrasted with that of PS1, PS2,
and PS3, respectively. A linear decrease is observed in Em for both PC and GFRC beam-lets
with a varying shear reinforcement and a constant flexural reinforcement. The values of Eu
are given in the fifth column of Table 4-6. The Eu of PS1, GS1, PS2, GS2, PS3, and GS3 are
131.6 kN.s, 149.9 kN.s, 115.1 kN.s, 145.9 kN.s, 99 kN.s, and 130.7 kN.s, respectively. The
Eu of GS1, GS2, and GS3 are increased by 18.3 kN.s, 30.8 kN.s, and 31.7 kN.s, respectively,
when contrasted with that of PS1, PS2, and PS3, respectively. This is 13.9%, 26.8%, and
32% increase in the Eu of GS1, GS2, and GS3, respectively, when contrasted with that of
PS1, PS2, and PS3, respectively. The observed trend of linear decrease is same in Eu for both
PC and GFRC beam-lets with a varying shear reinforcements and a constant flexural rebars.
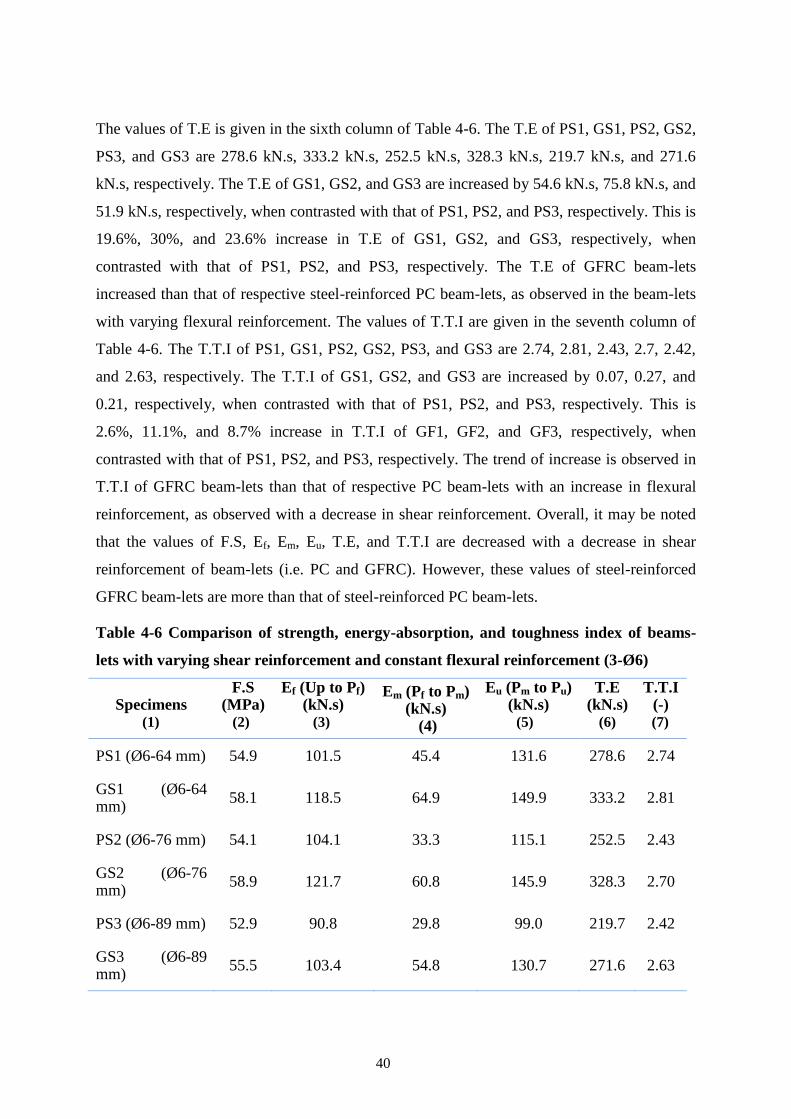
40
The values of T.E is given in the sixth column of Table 4-6. The T.E of PS1, GS1, PS2, GS2,
PS3, and GS3 are 278.6 kN.s, 333.2 kN.s, 252.5 kN.s, 328.3 kN.s, 219.7 kN.s, and 271.6
kN.s, respectively. The T.E of GS1, GS2, and GS3 are increased by 54.6 kN.s, 75.8 kN.s, and
51.9 kN.s, respectively, when contrasted with that of PS1, PS2, and PS3, respectively. This is
19.6%, 30%, and 23.6% increase in T.E of GS1, GS2, and GS3, respectively, when
contrasted with that of PS1, PS2, and PS3, respectively. The T.E of GFRC beam-lets
increased than that of respective steel-reinforced PC beam-lets, as observed in the beam-lets
with varying flexural reinforcement. The values of T.T.I are given in the seventh column of
Table 4-6. The T.T.I of PS1, GS1, PS2, GS2, PS3, and GS3 are 2.74, 2.81, 2.43, 2.7, 2.42,
and 2.63, respectively. The T.T.I of GS1, GS2, and GS3 are increased by 0.07, 0.27, and
0.21, respectively, when contrasted with that of PS1, PS2, and PS3, respectively. This is
2.6%, 11.1%, and 8.7% increase in T.T.I of GF1, GF2, and GF3, respectively, when
contrasted with that of PS1, PS2, and PS3, respectively. The trend of increase is observed in
T.T.I of GFRC beam-lets than that of respective PC beam-lets with an increase in flexural
reinforcement, as observed with a decrease in shear reinforcement. Overall, it may be noted
that the values of F.S, Ef, Em, Eu, T.E, and T.T.I are decreased with a decrease in shear
reinforcement of beam-lets (i.e. PC and GFRC). However, these values of steel-reinforced
GFRC beam-lets are more than that of steel-reinforced PC beam-lets.
Table 4-6 Comparison of strength, energy-absorption, and toughness index of beams-
lets with varying shear reinforcement and constant flexural reinforcement (3-Ø6)
Specimens (1)
F.S (MPa)
(2)
Ef (Up to Pf) (kN.s)
(3)
Em (Pf to Pm) (kN.s)
(4)
Eu (Pm to Pu) (kN.s)
(5)
T.E (kN.s)
(6)
T.T.I (-) (7)
PS1 (Ø6-64 mm) 54.9 101.5 45.4 131.6 278.6 2.74
GS1 (Ø6-64 mm)
58.1 118.5 64.9 149.9 333.2 2.81
PS2 (Ø6-76 mm) 54.1 104.1 33.3 115.1 252.5 2.43
GS2 (Ø6-76 mm)
58.9 121.7 60.8 145.9 328.3 2.70
PS3 (Ø6-89 mm) 52.9 90.8 29.8 99.0 219.7 2.42
GS3 (Ø6-89 mm)
55.5 103.4 54.8 130.7 271.6 2.63
41
Note: F.S = Flexural strength, Ef = Energy absorbed up to the first crack, Em = Energy absorbed from the first
crack to the maximum load, Eu = Energy absorbed from the maximum load to the ultimate load, T.E =
Total energy-absorption, and T.T.I = T.E/Ef = Total toughness index.
Summary 4.4
The material-properties are investigated with the MD of 1:2:4. It is observed that the
slump, density, and compressive strength are decreased, when contrasted with that of PC.
Whereas, the splitting-tensile and flexural strengths are increased than that of respective PC.
The similar trend was observed in the previous study (Khan and Ali 2016). The utilization of
GFRC with steel rebars increased the load carrying capacity, flexural strength, total energy-
absorption, and total toughness index, when contrasted with that of respective PC beam-lets.
Therefore, GFRC with steel rebars can be utilized for mitigating EAMC in bridge girders.
42
CHAPTER 5
DISCUSSION
5.1 Background
The recorded mid-span load-deflection curves, behavior, mode of failure, flexural
properties of the beam-lets (PC and GFRC) with varying flexural reinforcement and varying
shear reinforcement have been described in detail in chapter 4. It is found that the GFRC
beam-lets with flexural and shear reinforcements performed better than that of respective PC
beam-lets. In this chapter, the comparison of material-properties with the previous studies,
the modified design equation, the prediction of moment and shear capacities, and the
improvement in EAMC are discussed in detail.
5.2 Trend Comparison of Material-properties with Previous Studies
The material-properties of PC and GFRC (having MD ratio of 1:2:4) are determined
in this study. However, Khan and Ali (2016) determined the material-properties of PC and
GFRC by using almost the same parameters except with a different MD ratio of 1:3.33:1.67.
The material properties in the previous study were investigated by using mix-design ratio of
1:3.33:1.67. In this mix-design ratio, the sand content was approximately twice of aggregate
content. As far as the mix-design ratio (i.e. 1:2:4) of the current study is concerned, the
aggregate content is taken two times of the sand content. The reason for this change is to
study the effect of individual ingredients of MD ratio on the concrete properties and behavior.
In both studies, it is observed that the CS of GFRC is decreased, while SS and MoR are
increased, when contrasted with that of PC. However, the magnitude of properties with MD
ratio of 1:3.33:1.67 are better. The reason for this betterment may be the well grasped glass
fibers due to the presence of more mortar in concrete. While, there is less mortar in case of
mix-design ratio of 1:2:4. As already mentioned earlier in section 2.3.1, Qureshi and Ahmed
(2013), Kene et al. (2012), Ravikumar and Thandavamoorthy (2011), Deo (2015),
Chandramouli et al. (2010), and Kizilkanat et al. (2015) has reported a considerable increase
up to 35% in CS, 37% in SS, and 75% in MoR contrasted with that of respective PC. These
may be because of different types of glass fibers, MD ratios, fiber content, and w/c ratios.
Mechanical properties of FRC can further be enhanced with admixtures.
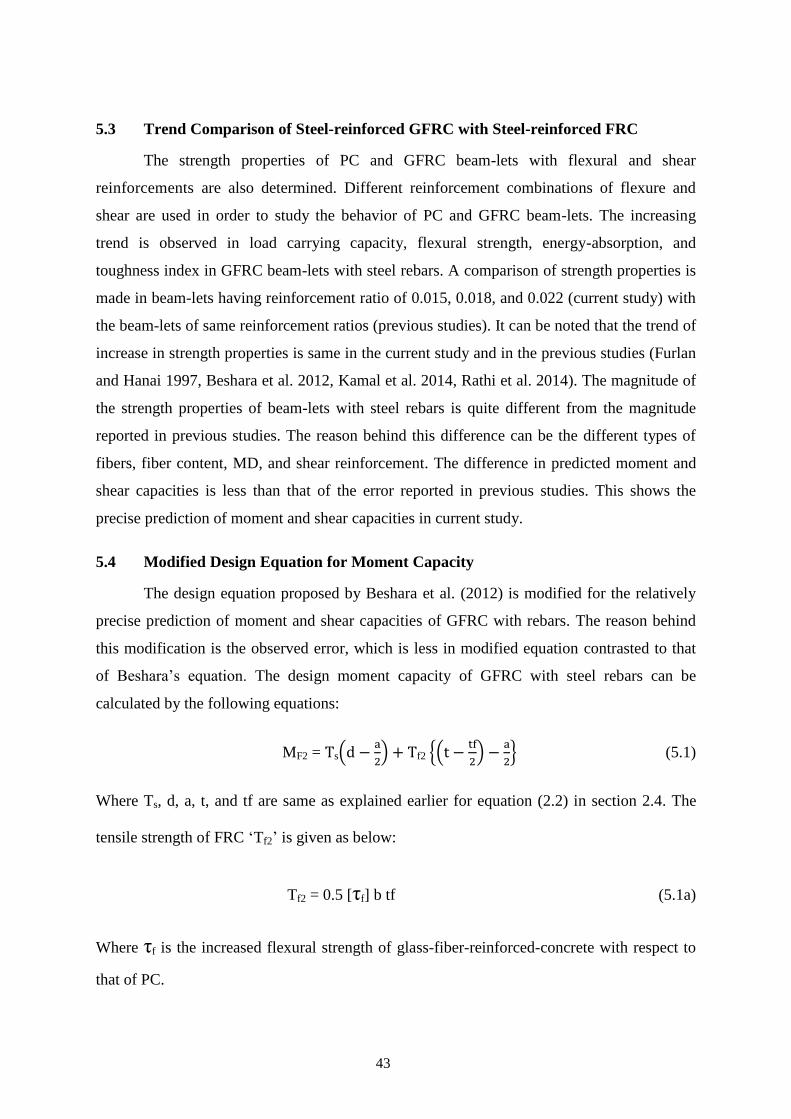
43
5.3 Trend Comparison of Steel-reinforced GFRC with Steel-reinforced FRC
The strength properties of PC and GFRC beam-lets with flexural and shear
reinforcements are also determined. Different reinforcement combinations of flexure and
shear are used in order to study the behavior of PC and GFRC beam-lets. The increasing
trend is observed in load carrying capacity, flexural strength, energy-absorption, and
toughness index in GFRC beam-lets with steel rebars. A comparison of strength properties is
made in beam-lets having reinforcement ratio of 0.015, 0.018, and 0.022 (current study) with
the beam-lets of same reinforcement ratios (previous studies). It can be noted that the trend of
increase in strength properties is same in the current study and in the previous studies (Furlan
and Hanai 1997, Beshara et al. 2012, Kamal et al. 2014, Rathi et al. 2014). The magnitude of
the strength properties of beam-lets with steel rebars is quite different from the magnitude
reported in previous studies. The reason behind this difference can be the different types of
fibers, fiber content, MD, and shear reinforcement. The difference in predicted moment and
shear capacities is less than that of the error reported in previous studies. This shows the
precise prediction of moment and shear capacities in current study.
5.4 Modified Design Equation for Moment Capacity
The design equation proposed by Beshara et al. (2012) is modified for the relatively
precise prediction of moment and shear capacities of GFRC with rebars. The reason behind
this modification is the observed error, which is less in modified equation contrasted to that
of Beshara’s equation. The design moment capacity of GFRC with steel rebars can be
calculated by the following equations:
MF2 = s(
) f2 {(
)
} (5.1)
Where Ts, d, a, t, and tf are same as explained earlier for equation (2.2) in section 2.4. The
tensile strength of FRC ‘Tf2’ is given as below:
Tf2 = 0.5 [τf] b tf (5.1a)
Where τf is the increased flexural strength of glass-fiber-reinforced-concrete with respect to
that of PC.
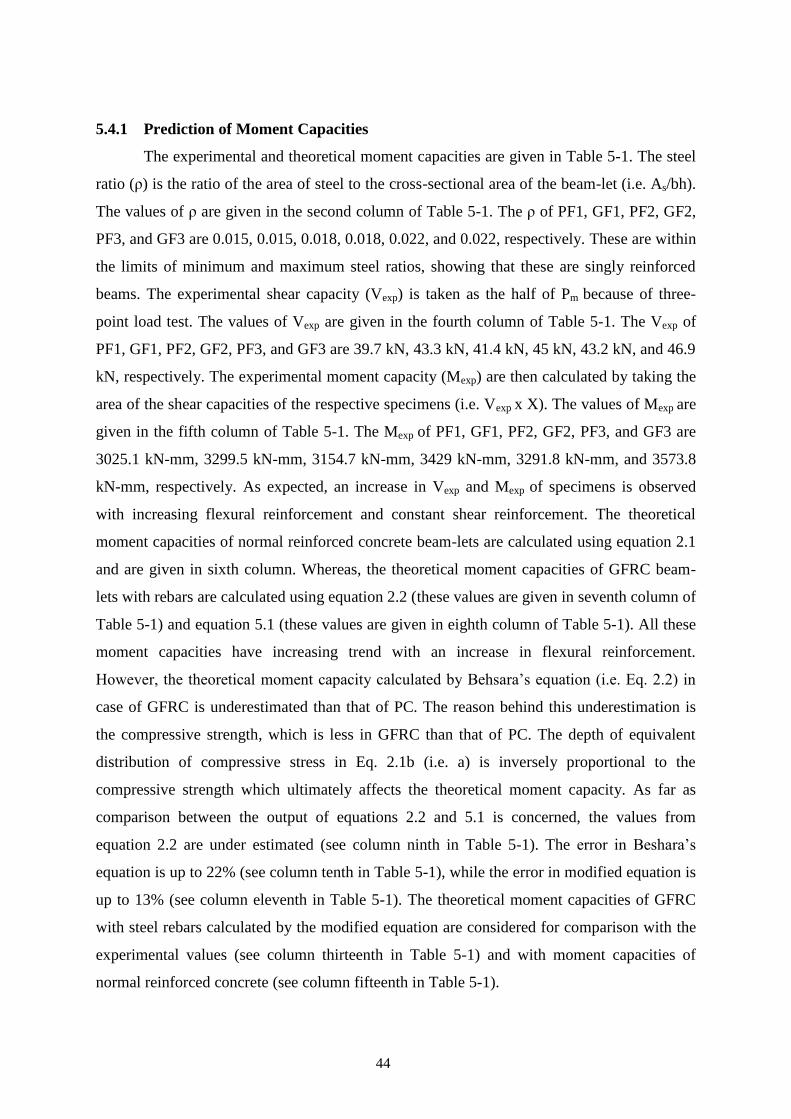
44
5.4.1 Prediction of Moment Capacities
The experimental and theoretical moment capacities are given in Table 5-1. The steel
ratio (ρ) is the ratio of the area of steel to the cross-sectional area of the beam-let (i.e. As/bh).
The values of ρ are given in the second column of Table 5-1. The ρ of PF1, GF1, PF2, GF2,
PF3, and GF3 are 0.015, 0.015, 0.018, 0.018, 0.022, and 0.022, respectively. These are within
the limits of minimum and maximum steel ratios, showing that these are singly reinforced
beams. The experimental shear capacity (Vexp) is taken as the half of Pm because of three-
point load test. The values of Vexp are given in the fourth column of Table 5-1. The Vexp of
PF1, GF1, PF2, GF2, PF3, and GF3 are 39.7 kN, 43.3 kN, 41.4 kN, 45 kN, 43.2 kN, and 46.9
kN, respectively. The experimental moment capacity (Mexp) are then calculated by taking the
area of the shear capacities of the respective specimens (i.e. Vexp x X). The values of Mexp are
given in the fifth column of Table 5-1. The Mexp of PF1, GF1, PF2, GF2, PF3, and GF3 are
3025.1 kN-mm, 3299.5 kN-mm, 3154.7 kN-mm, 3429 kN-mm, 3291.8 kN-mm, and 3573.8
kN-mm, respectively. As expected, an increase in Vexp and Mexp of specimens is observed
with increasing flexural reinforcement and constant shear reinforcement. The theoretical
moment capacities of normal reinforced concrete beam-lets are calculated using equation 2.1
and are given in sixth column. Whereas, the theoretical moment capacities of GFRC beam-
lets with rebars are calculated using equation 2.2 (these values are given in seventh column of
Table 5-1) and equation 5.1 (these values are given in eighth column of Table 5-1). All these
moment capacities have increasing trend with an increase in flexural reinforcement.
However, the theoretical moment capacity calculated by Behsara’s equation (i.e. Eq. 2.2) in
case of GFRC is underestimated than that of PC. The reason behind this underestimation is
the compressive strength, which is less in GFRC than that of PC. The depth of equivalent
distribution of compressive stress in Eq. 2.1b (i.e. a) is inversely proportional to the
compressive strength which ultimately affects the theoretical moment capacity. As far as
comparison between the output of equations 2.2 and 5.1 is concerned, the values from
equation 2.2 are under estimated (see column ninth in Table 5-1). The error in Beshara’s
equation is up to 22% (see column tenth in Table 5-1), while the error in modified equation is
up to 13% (see column eleventh in Table 5-1). The theoretical moment capacities of GFRC
with steel rebars calculated by the modified equation are considered for comparison with the
experimental values (see column thirteenth in Table 5-1) and with moment capacities of
normal reinforced concrete (see column fifteenth in Table 5-1).
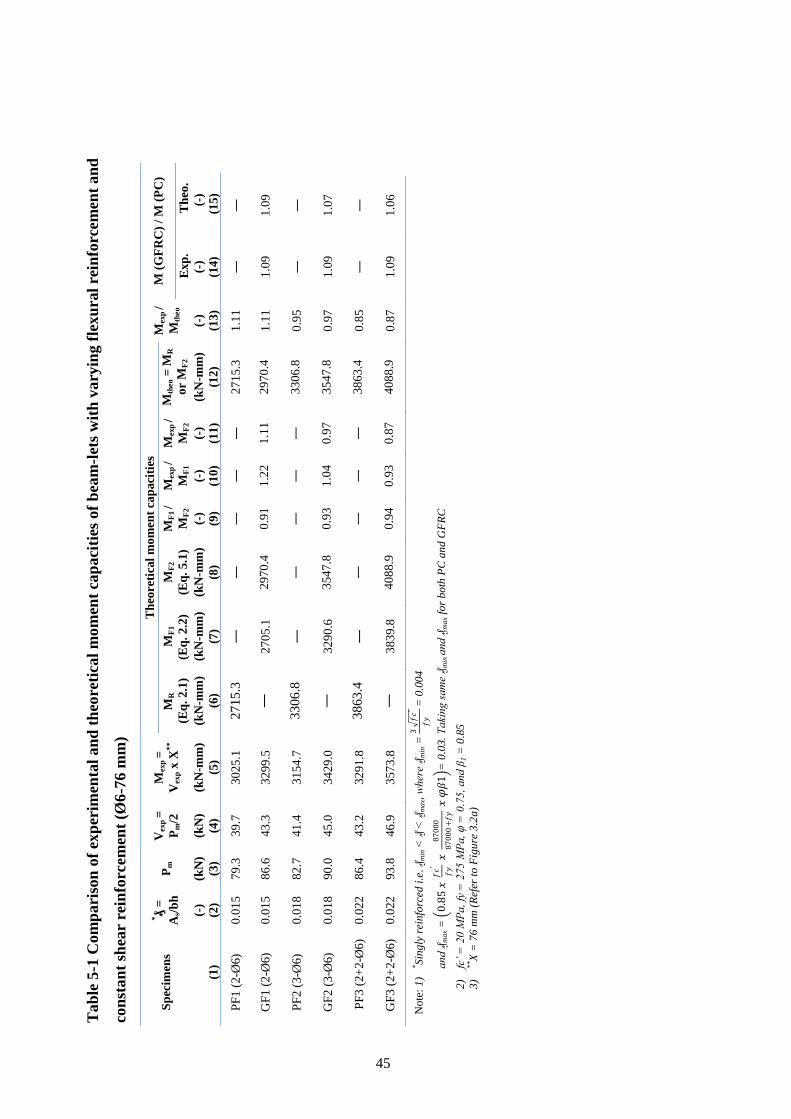
45
Tab
le 5
-1 C
om
pari
son
of
exp
erim
enta
l an
d t
heo
reti
cal
mo
men
t ca
paci
ties
of
bea
m-l
ets
wit
h v
ary
ing f
lexu
ral
rein
forc
em
ent
an
d
con
stan
t sh
ear
rein
forc
em
ent
(Ø6
-76 m
m)
Sp
ecim
ens
*₰ =
As/
bh
P
m
Vex
p =
Pm
/2
Mex
p =
Vex
p x
X*
*
Th
eore
tica
l m
om
ent
cap
aci
ties
M
exp
/
Mth
eo
M (
GF
RC
) /
M (
PC
) M
R
(Eq
. 2.1
)
MF
1
(Eq
. 2.2
)
MF
2
(Eq
. 5.1
)
MF
1 /
MF
2
Mex
p /
MF
1
Mex
p /
MF
2
Mth
eo =
MR
or
MF
2
Exp
. T
heo
.
(-
) (k
N)
(kN
) (k
N-m
m)
(kN
-mm
) (k
N-m
m)
(kN
-mm
) (-
) (-
) (-
) (k
N-m
m)
(-)
(-)
(-)
(1)
(2)
(3)
(4)
(5)
(6)
(7)
(8)
(9)
(10
) (1
1)
(12
) (1
3)
(14)
(15)
PF
1 (
2-Ø
6)
0.0
15
79.3
39.7
3025.1
2
71
5.3
―
―
―
―
―
2715.3
1.1
1
―
―
GF
1 (
2-Ø
6)
0.0
15
86.6
43.3
3299.5
―
2705.1
2970.4
0.9
1
1.2
2
1.1
1
2970.4
1.1
1
1.0
9
1.0
9
PF
2 (
3-Ø
6)
0.0
18
82.7
41.4
3154.7
3
30
6.8
―
―
―
―
―
3306.8
0.9
5
―
―
GF
2 (
3-Ø
6)
0.0
18
90.0
45.0
3429.0
―
3290.6
3547.8
0.9
3
1.0
4
0.9
7
3547.8
0.9
7
1.0
9
1.0
7
PF
3 (
2+
2-Ø
6)
0.0
22
86.4
43.2
3291.8
3
86
3.4
―
―
―
―
―
3863.4
0.8
5
―
―
GF
3 (
2+
2-Ø
6)
0.0
22
93.8
46.9
3573.8
―
3839.8
4088.9
0.9
4
0.9
3
0.8
7
4088.9
0.8
7
1.0
9
1.0
6
No
te:
1)
*S
ing
ly r
ein
forc
ed i
.e.
₰m
in <
₰ <
₰m
ax,
wh
ere
₰m
in =
3
𝑓𝑐′
𝑓𝑦
= 0
.00
4
a
nd
₰m
ax
= (
0.8
5 𝑥
𝑓𝑐′
𝑓𝑦
𝑥
87
00
0
87
00
0+𝑓𝑦
𝑥 𝜑
𝛽1)
= 0
.03.
Ta
kin
g s
am
e ₰
min
and
₰m
ax
for
bo
th P
C a
nd
GF
RC
2)
fc’
= 2
0 M
Pa
, fy
= 2
75
MP
a, φ
= 0
.75
, an
d β
1 =
0.8
5
3)
**X
= 7
6 m
m (
Ref
er t
o F
igu
re 3
.2a
)
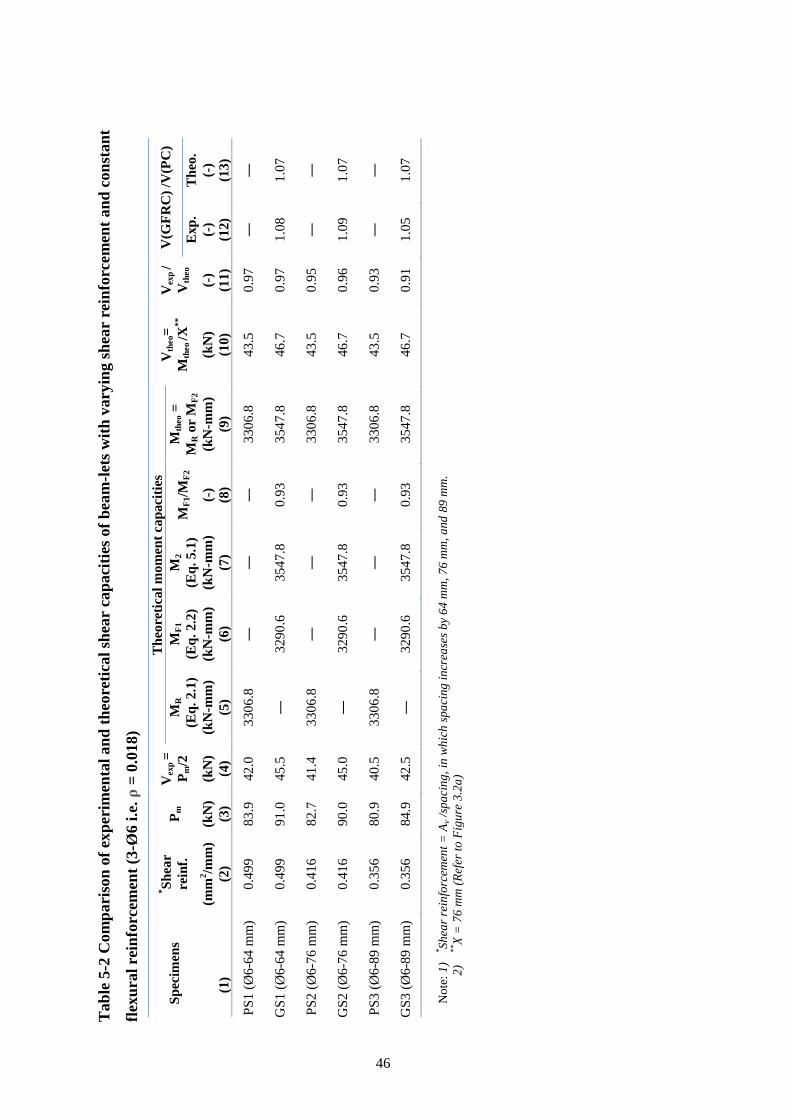
46
Ta
ble
5-2
Com
pari
son
of
exp
erim
enta
l an
d t
heo
reti
cal
shea
r ca
paci
ties
of
bea
m-l
ets
wit
h v
ary
ing
sh
ear
rein
forc
em
ent
an
d c
on
sta
nt
flex
ura
l re
info
rcem
ent
(3-Ø
6 i
.e.
ρ =
0.0
18)
Sp
ecim
ens
*S
hea
r
rein
f.
Pm
V
exp
=
Pm
/2
Th
eore
tica
l m
om
ent
cap
aci
ties
V
theo=
Mth
eo /X
**
Vex
p /
Vth
eo
V(G
FR
C)
/V(P
C)
MR
(Eq
. 2.1
) M
F1
(Eq
. 2.2
)
M2
(Eq
. 5.1
) M
F1/M
F2
Mth
eo =
MR o
r M
F2
Exp
. T
heo
.
(m
m2/m
m)
(kN
) (k
N)
(kN
-mm
) (k
N-m
m)
(kN
-mm
) (-
) (k
N-m
m)
(kN
) (-
) (-
) (-
)
(
1)
(2)
(3)
(4)
(5)
(6)
(7)
(8)
(9)
(10)
(11)
(12)
(13)
PS
1 (
Ø6
-64
mm
) 0.4
99
83.9
42.0
3306.8
―
―
―
3306.8
43.5
0.9
7
―
―
GS
1 (
Ø6-6
4 m
m)
0.4
99
91.0
45.5
―
3290.6
3547.8
0.9
3
3547.8
46.7
0.9
7
1.0
8
1.0
7
PS
2 (
Ø6
-76
mm
) 0.4
16
82.7
41.4
3306.8
―
―
―
3306.8
43.5
0.9
5
―
―
GS
2 (
Ø6-7
6 m
m)
0.4
16
90.0
45.0
―
3290.6
3547.8
0.9
3
3547.8
46.7
0.9
6
1.0
9
1.0
7
PS
3 (
Ø6
-89
mm
) 0.3
56
80.9
40.5
3306.8
―
―
―
3306.8
43.5
0.9
3
―
―
GS
3 (
Ø6-8
9 m
m)
0.3
56
84.9
42.5
―
3290.6
3547.8
0.9
3
3547.8
46.7
0.9
1
1.0
5
1.0
7
No
te:
1)
*S
hea
r re
info
rcem
ent
= A
v /s
pa
cin
g,
in w
hic
h s
pa
cin
g i
ncr
ease
s b
y 6
4 m
m,
76
mm
, a
nd
89
mm
.
2)
**X
= 7
6 m
m (
Ref
er t
o F
igu
re 3
.2a
)
47
The experimental and theoretical moment capacities are in good agreement i.e. difference is
up to only ±15%. The enhanced moment capacities of GFRC beam-lets w.r.t that of PC
beam-lets are up to 6%-9% in case of experimental and theoretical values.
5.4.2 Prediction of Shear Capacities
The comparison of experimental and theoretical shear capacities is given in Table 5-2.
The provided shear reinforcement is given in the second column of Table 5-2. It may be
noted that ρ is same (i.e. 0.018) for all the beam-lets with constant flexural reinforcement and
varying shear reinforcement. This is within limits of minimum and maximum steel ratios (i.e.
ρmin < ρ < ρmax), showing that these are singly reinforced beams.The shear reinforcement of
PS1, GS1, PS2, GS2, PS3, and GS3 are 0.499 mm2/mm, 0.499 mm
2/mm, 0.416 mm
2/mm,
0.416 mm2/mm, 0.356 mm
2/mm, and 0.356 mm
2/mm, respectively. The Vexp is calculated by
the same procedure, as calculated for the beam-lets with varying flexural reinforcement. The
Vexp are given in the fourth column of Table 5-2. The Vexp of PS1, GS1, PS2, GS2, PS3, and
GS3 are 42 kN, 45.5 kN, 41.4 kN, 45 kN, 40.5 kN, and 42.5 kN, respectively. As expected, a
decrement is observed in Vexp of beam-lets with a decrease in shear reinforcement. For
calculating theoretical shear capacity (Vtheo), the theoretical moment capacities are first
calculated and then divided by the shear span (i.e. X = 76 mm). The experimental and
theoretical shear capacities are in good agreement i.e. difference is up to only ±9%. The
improved shear capacity of GFRC beam-lets w.r.t that of PC beam-lets is up to 5%-9% in
case of experimental and theoretical values.
5.5 Improvement in EAMC
It is concluded from the previous studies (Wright et al. 2014 and Saadghvaziri and
Hadidi 2005) that the compressive strength increases EAMC in concrete if achieved with a
high cement content. Therefore, the concrete with less cement content and enhanced CS may
guarantee the mitigation of EAMC, which can improve the durability and serviceability of
bridge girders. EAMC may also be caused due to drying shrinkage of concrete (Yoneda et al.
2013). An increase in tensile strength can reduce shrinkage of concrete (Mesbah and Buyle-
Bodin 1999). In this study, the material-properties are investigated with MD ratio of 1:2:4.
The inclusion of GF in the same MD ratio (as that of PC) means that the cement content is
less in GFRC when contrasted with that of respective PC. Thus, in current study, the
compressive strength of GFRC is decreased due to the less cement content and the trend of
48
increase is observed in splitting-tensile and flexural strengths due to the inclusion of GF in
concrete matrix. The similar trend of increase for mechanical properties was reported in the
previous studies: Chandramouli et al. (2010), Ravikumar and Thandavamoorthy (2011), Kene
et al. (2012), Qureshi and Ahmed (2013), Deo (2015), Kizilkanat et al. (2015), and Khan and
Ali (2016), which is already been discussed earlier in section 2.3.1. Thus, the enhanced
material-properties may help to reduce EAMC in bridge girders.
Flexural strength is basically an indirect measure of tensile strength (National ready
mix concrete association). The low tensile-strength in decks of bridge caused low resistance
to EAMC (Qiao et al. 2010). Therefore, enhanced tensile strength properties can mitigate
EAMC in concrete bridge girders. As discussed above, the observed load carrying capacity,
F.S, and post cracking behavior of GFRC with flexural and shear reinforcements is better
than that of respective PC with flexural and shear reinforcements. Consequently, EAMC in
bridge girders is expected to be reduced by utilizing GFRC with steel rebars, which
ultimately results in the improved durability and serviceability of bridge girders.
Summary 5.6
The trend of increase or decrease contrasted for the material-properties with previous
studies. The observed trend of increase is same for the investigated material-properties with
MD of 1:2:4 as reported in literature. Likewise, the trend of increase in strength properties of
beam-lets with steel rebars is also contrasted with that of previous studies. The similar
increasing trend is also observed for the strength properties of beam-lets with steel rebars as
reported in literature. The design equation proposed in literature is modified for the relatively
precise prediction of moment and shear capacities. The reason behind this modification is the
observed error, which is less in modified equation. The experimental and predicted moment
and shear capacities (calculated with the assistance of modified design equation) of steel-
reinforced beam-lets are in good agreement. Also, the improved mechanical properties and
post cracking behavior of GFRC with steel rebars can help to reduce EAMC.
49
CHAPTER 6
CONCLUSIONS AND RECOMMENDATIONS
6.1 Conclusions
Glass-fiber-reinforced-concrete (GFRC) with flexural and shear reinforcement is
examined in this experimental research for possible application of mitigating early-age-
micro-cracks (EAMC) in bridge-girders. For the preparation of GFRC, the glass fibers of 5%
fiber content, by mass of cement, having a 50 mm length are incorporated in the same MD
(i.e. 1:2:4) as that of PC. The material-properties of specimens (PC and GFRC) are
determined experimentally, and the behavior of PC and GFRC beam-lets with flexural and
shear reinforcements are investigated. The material-properties achieved by 1:2:4 MD is also
contrasted with the properties of samples having MD of 1:3.33:1.67, reported by Khan and
Ali (2016). Following conclusions are made:
The compressive strength, density, and slump of GFRC are decreased by 4%, 3.8%,
and 50%, respectively, when contrasted with that of PC. Whereas, the flexural and
splitting-tensile strengths are improved by 11.6% and 8.3%, respectively, when
contrasted with that of PC. Also, the toughness-index and energy-absorption under
compression are reduced and that under splitting-tension and flexure are increased.
For MD of 1:2:4, almost the same trend is observed as that with MD of 1:3.33:1.67
(Khan and Ali 2016), but a difference in magnitude of strength properties is observed.
The MD of 1:3.33:1.67 is best fit for increasing the mechanical properties of GFRC.
The load carrying capacity, flexural strength, total energy-absorption, total toughness
index, and experimental moment capacity of GFRC beam-lets with varying flexural
reinforcement and constant shear reinforcement are increased up to 9.2%, 9.2%,
31.7%, 17.5%, and 9%, respectively, when contrasted with that of respective PC
beam-lets. On the other hand, the load carrying capacity, flexural strength, total
energy-absorption, total toughness index, and experimental shear capacity of GFRC
beam-lets with varying shear reinforcement and constant flexural reinforcement are
increased up to 8.8%, 8.8%, 30%, 11%, and 8.7%, respectively, when contrasted with
that of respective PC beam-lets.
The experimental moment and shear capacities of GFRC having steel rebars are in
good agreement with that of respective moment and shear capacities calculated with
50
the help of modified design equation. The percentage errors in moment and shear
capacities are up to 15% and 9%, respectively.
Considering these outcomes, GFRC with flexural and shear reinforcement can be utilized
in bridge-girders for mitigating EAMC, and hence increasing its serviceability and durability.
6.2 Recommendations
Future recommendations are:
To investigate the material-properties of GFRC with admixtures.
To investigate the experimental behavior of GFRC with GFRP rebars.
To study the numerical behavior of GFRC with flexural and shear reinforcement.
To study the behavior of GFRC in pre-tension and post-tension bridge girders.
51
REFERENCES
Ali, M., Liu, A., Sou, H., & Chouw, N. (2012). Mechanical and dynamic properties of
coconut fibre reinforced concrete. Construction and Building Materials, 30, 814-825.
Ali, M. (2014). Seismic performance of coconut-fibre-reinforced-concrete columns with
different reinforcement configurations of coconut-fibre ropes. Construction and Building
Materials, 70, 226-230.
Ashour, A. F. (2006). Flexural and shear capacities of concrete beams reinforced with GFRP
bars. Construction and Building Materials, 20(10), 1005-1015. ASTM C138/C138M-16, Standard Test Method for Density (Unit Weight), Yield, and Air
Content of Concrete, ASTM International, West Conshohocken, PA, 2016,
http://www.astm.org.
ASTM C143/C143M-15a, Standard Test Method for Slump of Hydraulic-Cement Concrete,
ASTM International, West Conshohocken, PA, 2015, http://www.astm.org.
ASTM C39/C39M-15a, Standard Test Method for Compressive Strength of Cylindrical
Concrete Specimens, ASTM International, West Conshohocken, PA, 2015,
http://www.astm.org.
ASTM C496/C496M-11, Standard Test Method for Splitting Tensile Strength of Cylindrical
Concrete Specimens, ASTM International, West Conshohocken, PA, 2004,
http://www.astm.org.
ASTM C78/C78M-15b, Standard Test Method for Flexural Strength of Concrete (Using
Simple Beam with Third-Point Loading), ASTM International, West Conshohocken, PA,
2016, http://www.astm.org.
Atiş, C. D. (2003). High-volume fly ash concrete with high strength and low drying
shrinkage. Journal of Materials in Civil Engineering, 15(2), 153-156.
Banthia, N. (2010). Report on the physical properties and durability of fiber-reinforced
concrete. ACI 544.5 R-10, Reported by ACI Committee 544, 1-3.
Beshara, F. B. A., Shaaban, I. G., & Mustafa, T. S. (2012). Nominal Flexural Strength of
High Strength Fiber Reinforced Concrete Beams. Arabian Journal for Science and
Engineering, 37(2), 291-301.
Chandramouli, K., Seshadri Sekhar, T., Sravana, P., Pannirselvam, N., & Srinivasa Rao, P.
(2010). Strength properties of glass fiber concrete. ARPN Journal of Engineering and
Applied Sciences, 5(4), 1-6.
52
Darwin, D., Browning, J., & Lindquist, W. D. (2004). Control of cracking in bridge-decks:
observations from the field. Cement, Concrete and Aggregates,26(2), 1-7.
Deo, S. V. (2015). Parametric Study of Glass-fiber-reinforced-concrete. In Advances in
Structural Engineering (pp. 1909-1916). Springer India.
Folliard, K. (2003). Use of Innovative Materials to Control Re-Strained Shrinkage Cracking
in Concrete Bridge-decks. Texas Department of Transportation, Austin, Texas, USA.
Fu, T., Deboodt, T., & Ideker, J. H. (2016). Development of shrinkage limit specification for
high performance concrete used in bridge-decks. Cement and Concrete Composites.
Furlan, S., & de Hanai, J. B. (1997). Shear behaviour of fiber reinforced concrete
beams. Cement and concrete composites, 19(4), 359-366.
Imam, M., Vandewalle, L., Mortelmans, F., & Van Gemert, D. (1997). Shear domain of
fibre-reinforced high-strength concrete beams. Engineering structures, 19(9), 738-747.
James, I. D., Gopalaratnam, V. S., & Galinat, M. A. (2002). State-of-the-art report on fiber
reinforced concrete. Manual Concrete Practice, 21, 2-66.
Kamal, M. M., Safan, M. A., Etman, Z. A., & Salama, R. A. (2014). Behavior and strength of
beams cast with ultra high strength concrete containing different types of fibers. HBRC
Journal, 10(1), 55-63.
Kene, K. S., Vairagade, V. S., & Sathawane, S. (2012). Experimental study on behavior of
steel and glass-fiber-reinforced-concrete composites. Bonfring International Journal of
Industrial Engineering and Management Science, 2(4), 125.
Khan, M., & Ali, M. (2016). Use of glass and nylon fibers in concrete for controlling early-
age micro cracking in bridge-decks. Construction and Building Materials, 125, 800-808.
Kizilkanat, A. B., Kabay, N., Akyüncü, V., Chowdhury, S., & Akça, A. H. (2015).
Mechanical properties and fracture behavior of basalt and glass-fiber-reinforced-concrete:
An experimental study. Construction and Building Materials, 100, 218-224.
Lim, C. C., Gowripalan, N., & Sirivivatnanon, V. (2000). Microcracking and chloride
permeability of concrete under uniaxial compression. Cement and Concrete Composites,
22(5), 353-360.
Mazzoli, A., Monosi, S., & Plescia, E. S. (2015). Evaluation of the early-age-shrinkage of
Fiber Reinforced Concrete (FRC) using image analysis methods. Construction and
Building Materials, 101, 596-601.
Nilson, A., Darwin, D., & Dolan, C. (2010). Design of Concrete Structures, 14th.
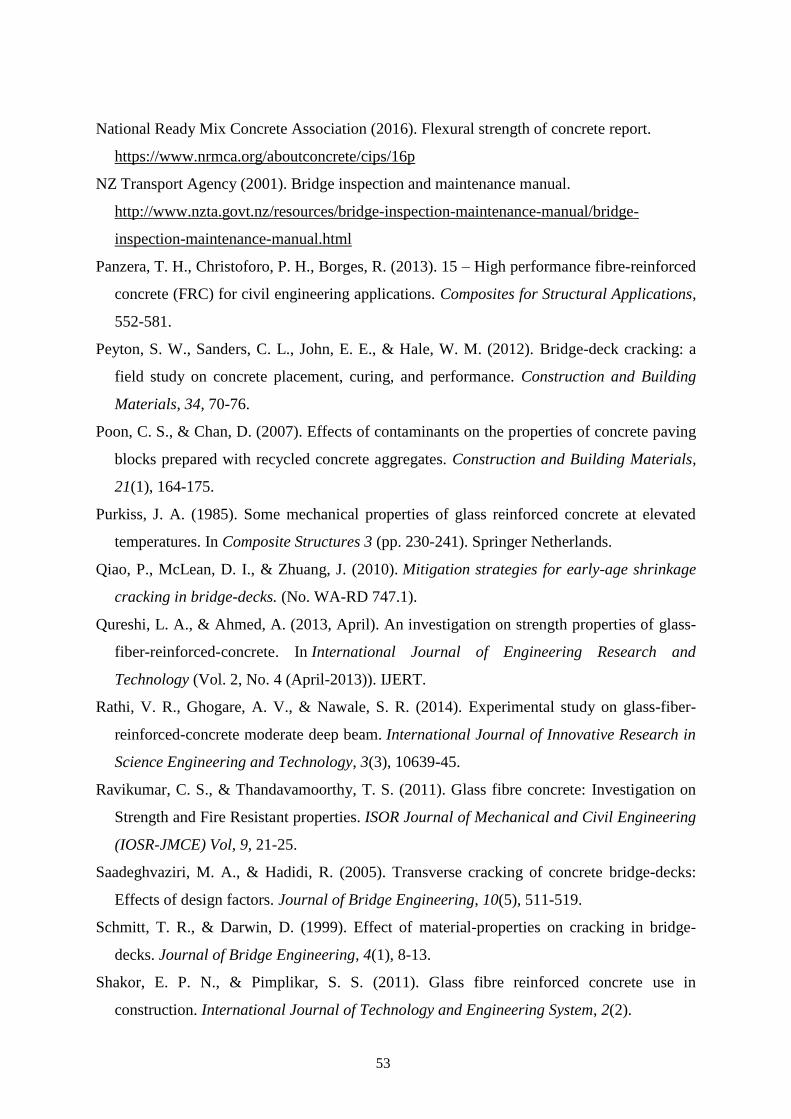
53
National Ready Mix Concrete Association (2016). Flexural strength of concrete report.
https://www.nrmca.org/aboutconcrete/cips/16p
NZ Transport Agency (2001). Bridge inspection and maintenance manual.
http://www.nzta.govt.nz/resources/bridge-inspection-maintenance-manual/bridge-
inspection-maintenance-manual.html
Panzera, T. H., Christoforo, P. H., Borges, R. (2013). 15 – High performance fibre-reinforced
concrete (FRC) for civil engineering applications. Composites for Structural Applications,
552-581.
Peyton, S. W., Sanders, C. L., John, E. E., & Hale, W. M. (2012). Bridge-deck cracking: a
field study on concrete placement, curing, and performance. Construction and Building
Materials, 34, 70-76.
Poon, C. S., & Chan, D. (2007). Effects of contaminants on the properties of concrete paving
blocks prepared with recycled concrete aggregates. Construction and Building Materials,
21(1), 164-175.
Purkiss, J. A. (1985). Some mechanical properties of glass reinforced concrete at elevated
temperatures. In Composite Structures 3 (pp. 230-241). Springer Netherlands.
Qiao, P., McLean, D. I., & Zhuang, J. (2010). Mitigation strategies for early-age shrinkage
cracking in bridge-decks. (No. WA-RD 747.1).
Qureshi, L. A., & Ahmed, A. (2013, April). An investigation on strength properties of glass-
fiber-reinforced-concrete. In International Journal of Engineering Research and
Technology (Vol. 2, No. 4 (April-2013)). IJERT.
Rathi, V. R., Ghogare, A. V., & Nawale, S. R. (2014). Experimental study on glass-fiber-
reinforced-concrete moderate deep beam. International Journal of Innovative Research in
Science Engineering and Technology, 3(3), 10639-45.
Ravikumar, C. S., & Thandavamoorthy, T. S. (2011). Glass fibre concrete: Investigation on
Strength and Fire Resistant properties. ISOR Journal of Mechanical and Civil Engineering
(IOSR-JMCE) Vol, 9, 21-25.
Saadeghvaziri, M. A., & Hadidi, R. (2005). Transverse cracking of concrete bridge-decks:
Effects of design factors. Journal of Bridge Engineering, 10(5), 511-519.
Schmitt, T. R., & Darwin, D. (1999). Effect of material-properties on cracking in bridge-
decks. Journal of Bridge Engineering, 4(1), 8-13.
Shakor, E. P. N., & Pimplikar, S. S. (2011). Glass fibre reinforced concrete use in
construction. International Journal of Technology and Engineering System, 2(2).
54
Sivakumar, A., & Santhanam, M. (2006). Experimental methodology to study plastic
shrinkage cracks in high strength concrete. In Measuring, Monitoring and Modeling
Concrete Properties (pp. 291-296). Springer Netherlands.
Wright, J. R., Rajabipour, F., Laman, J. A., & Radlińska, A. (2014). Causes of early-age
cracking on concrete bridge-deck expansion joint repair sections. Advances in Civil
Engineering, 2014.
Yoneda, T., Ishida, T., Maekawa, K., Gebreyouhannes, E., & Mishima, T. (2013). Simulation
of early-age cracking due to drying shrinkage based on a multi-scale constitutive model. In
Poromechanics V: Proceedings of the Fifth Biot Conference on Poromechanics (pp. 579-
588).
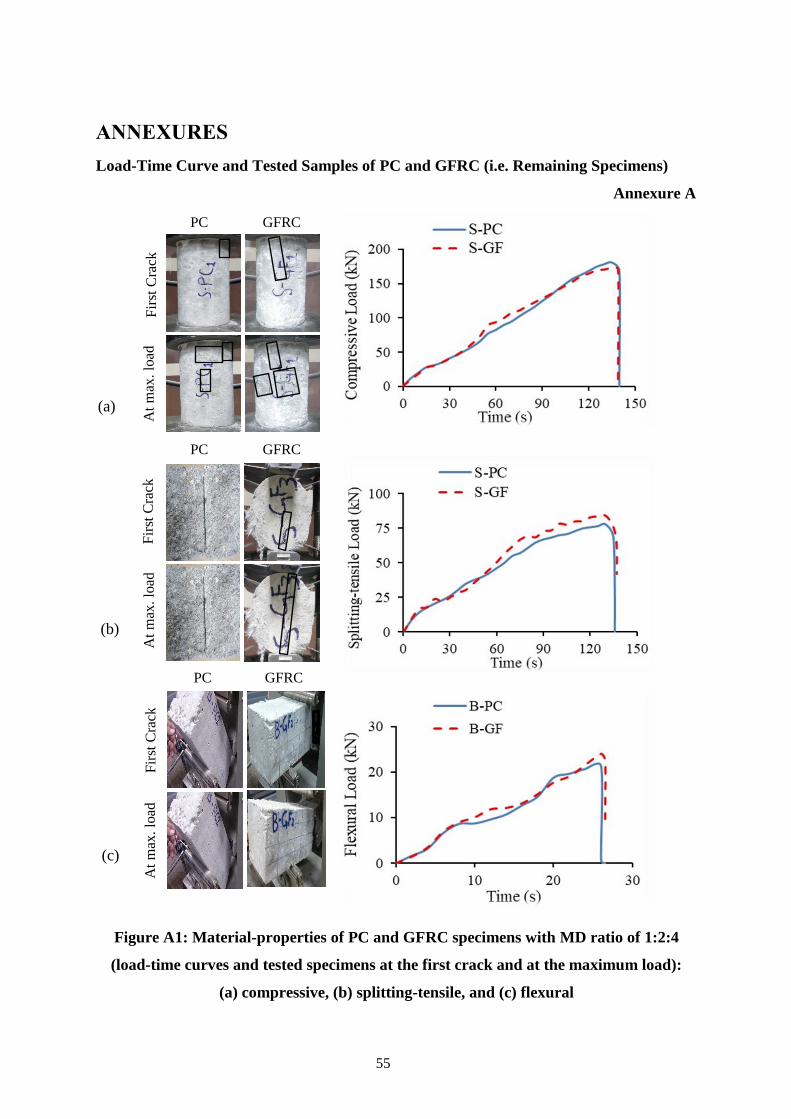
55
ANNEXURES
Load-Time Curve and Tested Samples of PC and GFRC (i.e. Remaining Specimens)
Annexure A
Figure A1: Material-properties of PC and GFRC specimens with MD ratio of 1:2:4
(load-time curves and tested specimens at the first crack and at the maximum load):
(a) compressive, (b) splitting-tensile, and (c) flexural
(a)
(b)
(c)
PC GFRC
At
max
. lo
ad
Fir
st C
rack
PC GFRC
At
max
. lo
ad
Fir
st C
rack
PC GFRC
At
max
. lo
ad
Fir
st C
rack