Embed Size (px)
Citation preview

Comparison of Netbacks fromPotential LNG Project
with ALCAN Pipeline Project
June 20, 2008
Barry PulliamSenior Economist
Econ One Research
Suite 2825Three Allen Center
333 Clay StreetHouston, Texas 77002
713 228 2700
5th Floor601 W 5th Street
Los Angeles, California 90071213 624 9600
Suite 12802321 Rosecrans Avenue
El Segundo, California 90245310 727 9916
Suite 501805 15th Street, N.W.
Washington, D.C. 20005202 289 7620
Suite 100555 University Avenue
Sacramento, California 95825916 576 0366

1
Econ One Review
Analyzed economic assumptions & netback valuesassociated with potential LNG and pipeline projects
Port Authority proposal
Other potential LNG configurations
TransCanada proposal
Reviewed Port Authority proposal, assumptions andanalysis
Reviewed Administration analysis of LNG and pipelinenetbacks
Reviewed information from various LNG specialists andgovernment agencies

2
Econ One Review(cont’d)
Analyzed netback @ the inlet to GTP$ / MMBtuTotal value of netback
Nominal $Real ($2008)NPV-10
Project that “maximizes” the netback createshighest value for resource owners
ProducersState
3
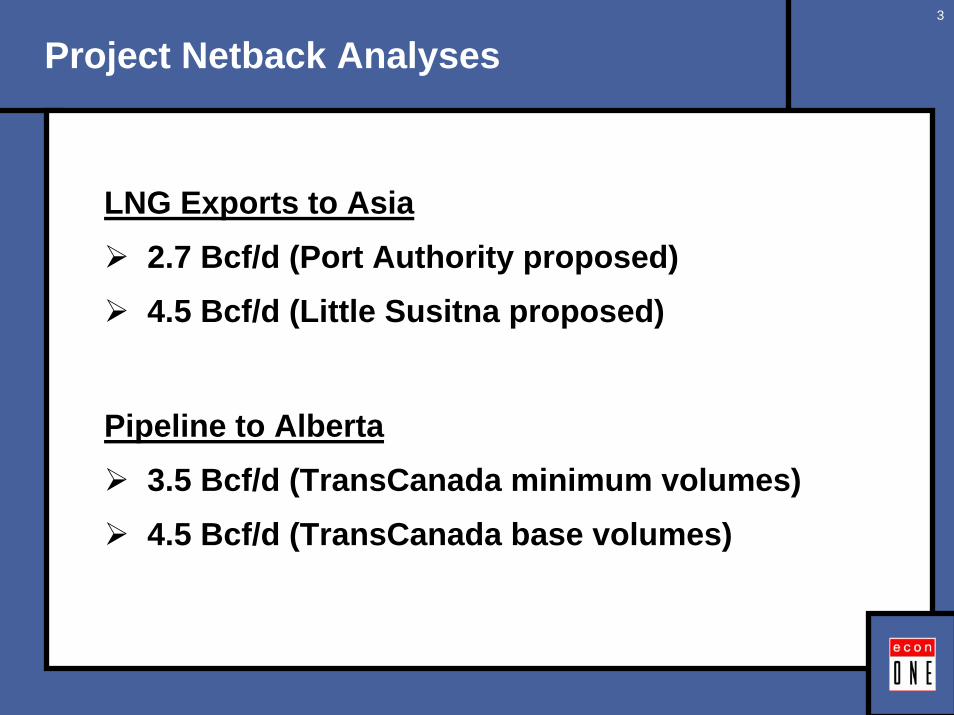
Project Netback Analyses
LNG Exports to Asia2.7 Bcf/d (Port Authority proposed)4.5 Bcf/d (Little Susitna proposed)
Pipeline to Alberta3.5 Bcf/d (TransCanada minimum volumes)4.5 Bcf/d (TransCanada base volumes)
4
Overview of LNGv. Pipeline Delivery

5
LNG and Pipeline Delivery Chain
LNG Deliveries Sales to Regas Plant
in Asia
LiquefactionPlant Valdez
LNGTankerGTP Pipeline
95%100% 85.4%93.7% 83.5%
Aggregate Loss:16.5%
Pipeline DeliveriesAECOHub SalesGTP Pipeline
100% 95% 91.7%Aggregate Loss:
9.1%90.9%

6
Supply / Demand

7
Worldwide Proved Gas Reserves
0
200
400
600
800
1,000
1,200
1,400
1,600
1,800
Rus
sia
Iran
Qat
ar
Sau
di A
rabi
a
UA
E
US
Nig
eria
Ven
ezue
la
Alg
eria
Iraq
Indo
nesi
a
Nor
way
(Tri
llion
Cub
ic F
eet)
6,263 Tcf Total
Source: BP Statistical Review 2008;Represents 80% of known reserves in 2007.

8
Worldwide Proved Gas Reserves by Region
0
500
1,000
1,500
2,000
2,500
3,000
Middle East Europe &Eurasia
Africa Asia Pacific North America South &Central
America
(Tri
llion
Cub
ic F
eet)
41%
33%
8% 8%
4% 4%
Source: BP Statistical Review 2008.

9
Current Worldwide LNG Demand
0.0
1.0
2.0
3.0
4.0
5.0
6.0
7.0
8.0
9.0
10.0Ja
pan
Sout
h K
orea
Spai
n
US
Fran
ce
Taiw
an
Indi
a
Turk
ey
Chi
na
Bel
gium
Italy
Port
ugal
Mex
ico
UK
Gre
ece
Puer
to R
ico
Dom
inic
an R
epub
lic
(Bcf
Per
Day
)
Asia is 65% of total LNG demand,
U.S. is 10%,
Europe is 24%,
Other is 1%.
Total = 21.8 bcf/d
Source: BP Statistical Review 2008.

10
Projected LNG Demand by Region
0
10
20
30
40
50
1995 2005 2010 2015 2020
(Bcf
Per
Day
)
Europe
Americas
Other Asia
Japan, SouthKorea, Taiwan
History Forecast
2.7 bcf/d = 14%of Japan, SouthKorea and Taiwan2020 Demand
4.5 bcf/d = 24%of Japan, SouthKorea and Taiwan2020 Demand
9.1
18.3
29.8
40.2
47.8
Source: National Petroleum Council ;Jensen Associates, August 2007

11
Liquefaction Plant Capacities by Region(Pacific Trade)
Pacific Basin Middle EastCategory Capacity Category Capacity
(Bcf/Day) (Bcf/Day)(1) (2) (3) (4)
Operating 9.85 Operating 6.06
Under Construction 3.50 Under Construction 6.84
Under Consideration 6.24 Under Consideration 4.63
Total 19.59 Total 17.53
Source: Facts Global Energy, “Evaluating Natural Gas Import Options for the State of Hawaii”, April 2007.

12
U.S. Gas Production by Source(1990 - 2030)
0
10
20
30
40
50
60
70
1990 1995 2000 2005 2010 2015 2020 2025 2030
(bcf
per
day
)
Alaska
Lower 48Offshore
Lower 48Unconventional
Lower 48Conventional
History Forecast
6% of supply; Projected to lower US prices by $0.30/MMBtu
Source: EIA AEO 2007.

13
U.S. Net Natural Gas Imports(1990 - 2030)
-2
0
2
4
6
8
10
12
14
1990 1995 2000 2005 2010 2015 2020 2025 2030
(bcf
per
day
)
LNG =17% of
Total 2030Demand
Mexico
Canada =4% of
Total 2030Demand
History Forecast
Source: EIA AEO 2007.
14
Historical Pricing
15
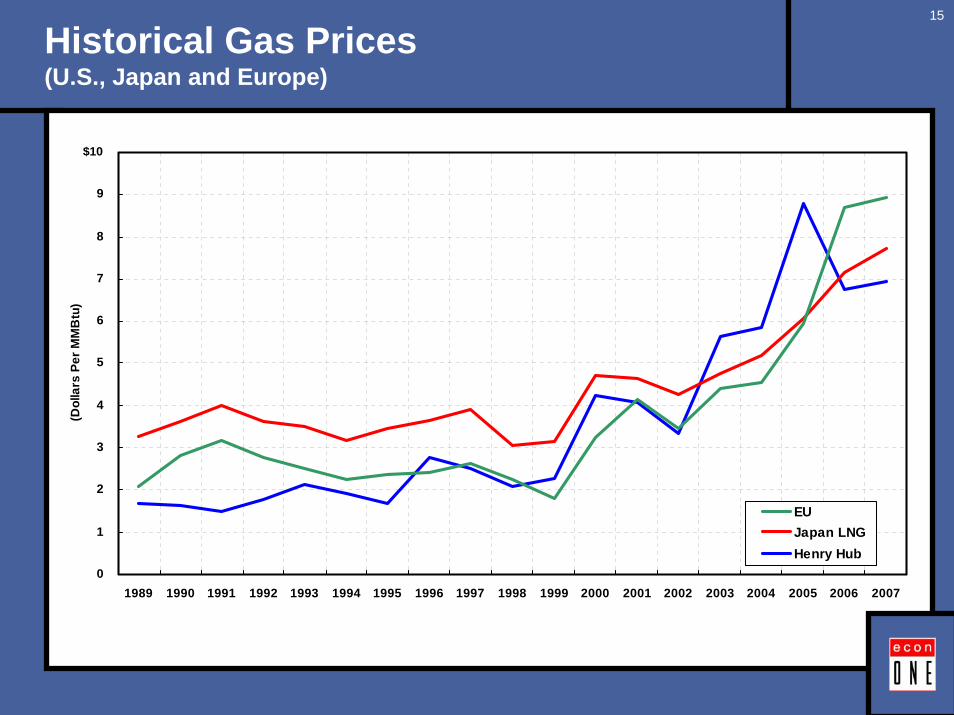
Historical Gas Prices (U.S., Japan and Europe)
0
1
2
3
4
5
6
7
8
9
10
1989 1990 1991 1992 1993 1994 1995 1996 1997 1998 1999 2000 2001 2002 2003 2004 2005 2006 2007
(Dol
lars
Per
MM
Btu
)
EUJapan LNGHenry Hub
$10

16
U.S. Natural Gas and Crude Oil Prices (1994 - 2008)
0
5
10
15
20
25
(Dol
lars
Per
MM
Btu
)
Henry Hub GasWest Texas Intermediate Oil
$25
1994 1995 1996 1997 1998 1999 2000 2001 2002 2003 2004 2005 2006 2007 2008

17
0
2
4
6
8
10
12
14
Oil
to G
as P
rice
Ratio
WTI / Henry Hub
1994
Average 1994 - 2006: 8.0
Average 1994 - 2008: 8.3
Historical Relationship Between Oil andGas Prices in the U.S.
1995 1996 1997 1998 1999 2000 2001 2002 2003 2004 2005 2006 2007 2008
18
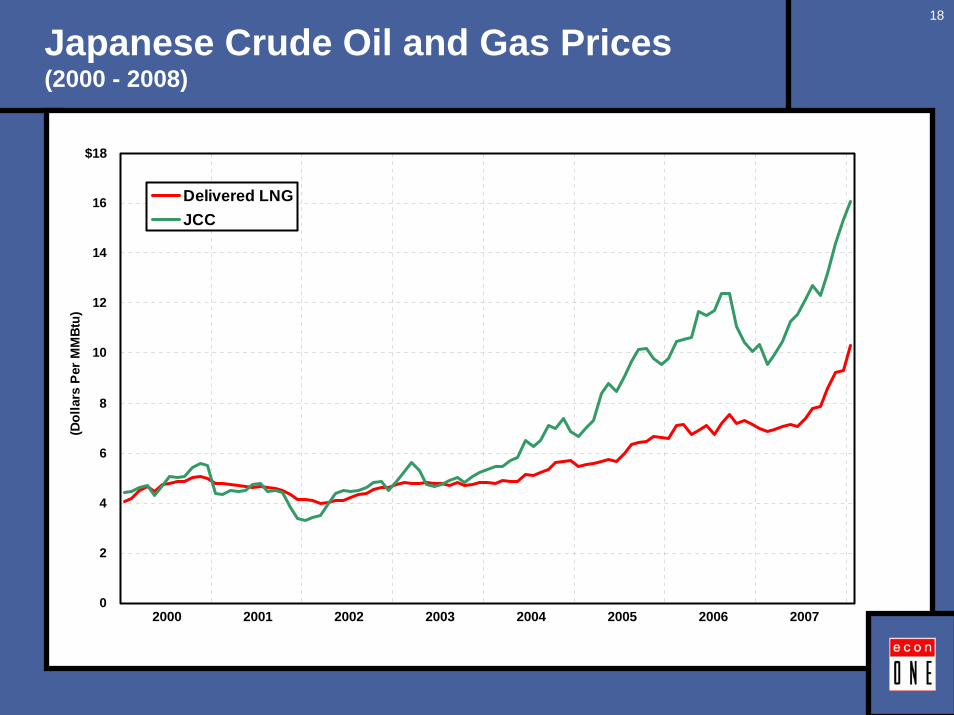
Japanese Crude Oil and Gas Prices(2000 - 2008)
0
2
4
6
8
10
12
14
16
18
(Dol
lars
Per
MM
Btu)
Delivered LNGJCC
2000 2001 2002 2003 2004 2005 2006 2007
$18

19
Evolution of LNG Pricing in Asia(Relationship of Gas to Oil Prices Seen in Recent Contracts)
Source: Facts Global Energy, “Evaluating Natural Gas Import Options for the State of Hawaii”, April 2007.

20
Oil and Gas Price Forecasts

21
Oil Prices Used in Analyses
0
50
100
150
200
25020
08
2009
2010
2011
2012
2013
2014
2015
2016
2017
2018
2019
2020
2021
2022
2023
2024
2025
2026
2027
2028
2029
2030
(Dol
lars
Per
Bar
rel)
$250
EIA AEO2008
Wood Mackenzie
$60 Real
$90 Real
$120 Real
Note: 2.5% annual price inflation.

22
Prospects for Asian LNG Prices
There is a wide rage of prices depending on contract vintage
Recent contracts have reflected stronger links to oilMany contracts are on a provisional basis as previously(low-priced) formulas have expired or are not applicable atcurrent oil price levelsRelatively high priced opportunities in Asia will attract gassupplies to that region
Increasingly competitive among suppliersOpportunities for buyersPrice will be dependent on the supply situation at thetime of contracts

23
Gas Price Forecasts Used in Analyses(Using Wood Mackenzie Oil Price Forecast)
0
5
10
15
20
25
2008 2009 2010 2011 2012 2013 2014 2015 2016 2017 2018 2019 2020 2021 2022 2023 2024 2025 2026 2027 2028 2029 2030
Gas
Pric
e ($
/MM
Btu
)
$25
RasGas - Kogas: 0.162 * Brent + 1.00
Gas Strategies: 0.1485 * Brent + 0.90
Port Authority: 0.8 * (Brent / 5.8)
Mid 2006 Japanese Renewal: 0.11 * Brent + 1.30
LNG Delivered Asia
= More Likely Price Scenarios

24
Prospects for U.S. Gas Prices
Historically, gas has been priced between 1/6 & 1/10 the valueof oil, with the long run average near 1/8The recent run-up in oil prices & relatively abundant domestic production of natural gas have kept that relationship abovehistorical levelsMany see the oil/gas relationship returning to more historicallevels (i.e. convergence) as:
Domestic supplies decline & become more costly to produceLNG imports are drawn to higher priced regions (e.g. Asia)Greenhouse/carbon emission concerns put coal out offavor & put natural gas in favor as the fuel of choice forelectricity generation

25
Ratio of Forecasted U.S. Oil and Gas Prices
0.0
2.0
4.0
6.0
8.0
10.0
12.0
2008 2009 2010 2011 2012 2013 2014 2015 2016 2017 2018 2019 2020 2021 2022 2023 2024 2025 2026 2027 2028 2029 2030
Oil
to G
as P
rice
Ratio
Wood MackenzieEIA AEO2008
Historical Average

26
Gas Price Forecasts Used in Analyses(Using Wood Mackenzie Oil Price Forecast)
0
5
10
15
20
25
2008 2009 2010 2011 2012 2013 2014 2015 2016 2017 2018 2019 2020 2021 2022 2023 2024 2025 2026 2027 2028 2029 2030
Gas
Pric
e ($
/MM
Btu
)
$25
Henry Hub
8:1 Oil / Gas
10:1 Oil / Gas
= More Likely Price Scenario(s)
RasGas - Kogas: 0.162 * Brent + 1.00
Gas Strategies: 0.1485 * Brent + 0.90
Port Authority: 0.8 * (Brent / 5.8)
Mid 2006 Japanese Renewal: 0.11 * Brent + 1.30
LNG Delivered Asia

27
Assumptions Used inComparative Netback Analyses

28Assumptions Used in ComparativeNetback Analyses
2020
70% Debt; 30% Equity (pre-operation)75% Debt; 25% Equity (post-operation)5.5% Guaranteed; 7.0 % Non-Guaranteed
14%
Administration (Westney): GTP & pipeline segmentsPort Authority (Bechtel): LNG plantSensitivity at higher costs
Administration (Westney) for GTP/pipeline segments Port Authority (Bechtel) for LNG plant
Port Authority: Approximately $0.75/MMBtu + Fuel
1.118 MMBtu / mcfFull Extraction @ Alberta Partial Extraction @ Valdez (LNG case)
First Gas
Capitalization
Debt Costs
Equity Returns
Capex/Opex
Fuel Use
Shipping Costs
Gas Composition &NGL Extraction

29
Comparison of Capital Costs for LNG Project(2.7 bcf/d LNG Project)
PortAuthority(Bechtel)
Administration(Westney)
GTP $3.4Bn $5.0Bn
Pipeline $13.1Bn $11.5Bn
Total GTP/Pipeline $16.5Bn $16.5Bn
LNG Plant $7.9Bn($470/mmta)
$12.7Bn($755/mmta)
Grand Total $24.4Bn $29.2Bn

30
Capital Costs Used in Netback Analyses
LNG Project Pipeline Project2.7 bcf/d 4.5 bcf/d 3.5 bcf/d 4.5 bcf/d
(Billion $2007)(1) (2) (3) (4)
$5.0 $8.3 $6.5 $8.3GTP
PipelineAlaska 11.5 12.6 10.2 10.9
- - 11.6 12.6Canada
$11.5 $12.6 $21.7 $23.5Total Pipeline
LNG Plant (Bechtel) 7.9 13.7* - -
12.7 21.1 - -LNG Plant (Westney)
$24.4 $34.6* $28.2 $31.8Total (Bechtel LNG)
$29.2 $42.0 $28.2 $31.8Total (Westney LNG)
* Based on $470/mt.

31
LNG Plant Costs

32
LNG Plant Costs Per Administration (Westney)($2007 per mmta)
100%
90%
80%
70%
60%
50%
40%
30%
20%
10%
0%0 159 318 478 637 796 955 1,115 1,274 1,433
Potential Outcome $/mmta
Prob
abili
ty
Administration P50
Port Authority (Bechtel)
Jensen 2007
PFC (03/06)
Source: AGIA Analysis Technical Team, “LNG Project Costs/Schedule”, June 9, 2008.

33
Range of LNG Liquefaction Costs and Tariffs(2.7 bcf/d LNG Project)
0.00
1.00
2.00
3.00
4.00
(Dol
lars
Per
MM
Btu)
0
200
400
600
800
1,000
Port Authority Jensen 2007 Administration P50
($20
07 P
er M
Mta
)
$470$600 - $650
$755
(Bechtel) (Westney)
$2.09
$2.67$3.16
Estimated Capital Costs
Approximate Levelized Tariff$4.00

34
Comparison ofNetback Elements

35Comparison of Potential CostsLNG Project v. Pipeline Project2020 - 2044
0
5
10
1520
20
2023
2026
2029
2032
2035
2038
2041
2044
(Dol
lars
Per
MM
Btu
)
$15
0
5
10
15
2020
2023
2026
2029
2032
2035
2038
2041
2044
(Dol
lars
Per
MM
Btu
)
0
5
10
15
2020
2023
2026
2029
2032
2035
2038
2041
2044
(Dol
lars
Per
MM
Btu
)
Fuel
GTP
0
5
10
15
2020
2023
2026
2029
2032
2035
2038
2041
2044
(Dol
lars
Per
MM
Btu
)
LNG (2.7 bcf/d)Average = $9.13
Pipeline (3.5 bcf/d)Average = $5.64
Pipeline
LNG Plant
Shipping
$15
Note: Oil Prices per Wood Mackenzie forecasts with 8:1 Oil/Gas Price Ratio;LNG Plant cost of $470/mmta per Port Authority application;Asia Gas Price = 0.1485 x JCC + $0.90 (Gas Strategies).
$15
$15
LNG (4.5 bcf/d)Average = $8.37
Pipeline (4.5 bcf/d)Average = $5.27

36
Potential Netbacks
37
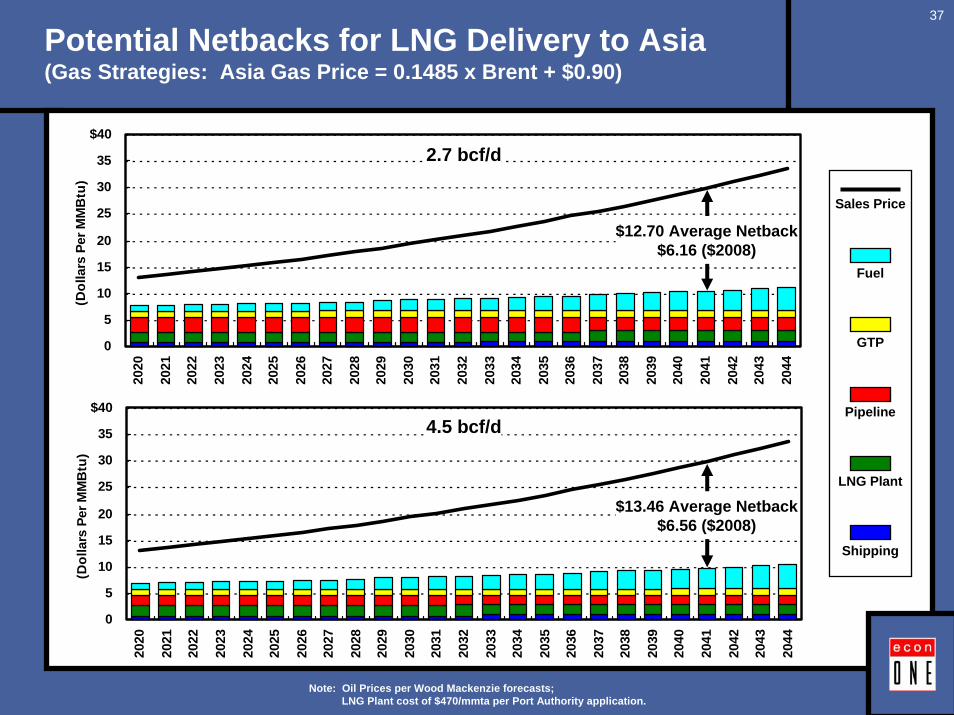
Potential Netbacks for LNG Delivery to Asia(Gas Strategies: Asia Gas Price = 0.1485 x Brent + $0.90)
0
5
10
15
20
25
30
35
4020
20
2021
2022
2023
2024
2025
2026
2027
2028
2029
2030
2031
2032
2033
2034
2035
2036
2037
2038
2039
2040
2041
2042
2043
2044
(Dol
lars
Per
MM
Btu
)
$40
Note: Oil Prices per Wood Mackenzie forecasts;LNG Plant cost of $470/mmta per Port Authority application.
Sales Price
GTP
Pipeline
LNG Plant
Shipping
0
5
10
15
20
25
30
35
40
(Dol
lars
Per
MM
Btu
)
2020
2021
2022
2023
2024
2025
2026
2027
2028
2029
2030
2031
2032
2033
2034
2035
2036
2037
2038
2039
2040
2041
2042
2043
2044
Fuel
$12.70 Average Netback$6.16 ($2008)
$13.46 Average Netback$6.56 ($2008)
$40
2.7 bcf/d
4.5 bcf/d
38
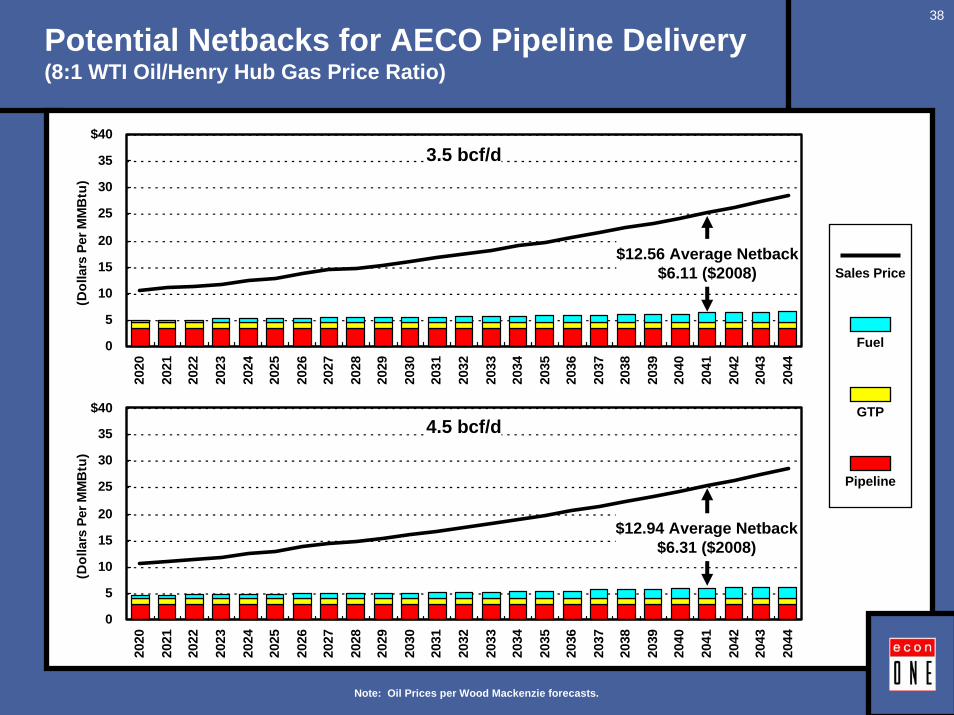
Potential Netbacks for AECO Pipeline Delivery(8:1 WTI Oil/Henry Hub Gas Price Ratio)
0
5
10
15
20
25
30
35
4020
20
2021
2022
2023
2024
2025
2026
2027
2028
2029
2030
2031
2032
2033
2034
2035
2036
2037
2038
2039
2040
2041
2042
2043
2044
(Dol
lars
Per
MM
Btu
)
$40
0
5
10
15
20
25
30
35
40
(Dol
lars
Per
MM
Btu
)
$12.56 Average Netback$6.11 ($2008)
$12.94 Average Netback$6.31 ($2008)
$40
3.5 bcf/d
4.5 bcf/d
Fuel
GTP
Pipeline
Sales Price
2020
2021
2022
2023
2024
2025
2026
2027
2028
2029
2030
2031
2032
2033
2034
2035
2036
2037
2038
2039
2040
2041
2042
2043
2044
Note: Oil Prices per Wood Mackenzie forecasts.
39
Comparison ofProjected Netbacks
2.7 bcf/d LNG Projectv.
3.5 bcf/d Pipeline Project

40
Projected Netbacks Under Alternative Projects(Port Authority LNG Plant Costs -- $470/mt)
2.7 bcf/d LNG ProjectHigh Price Gas Strategies Port Authority Low Price 3.5 bcf/dAsia Gas = Asia Gas = Asia Gas = Asia Gas = AECO Pipeline Delivery
0.162 x Brent 0.1485 x Brent 0.8 x 0.11 x Brent 8:1 Oil/Gas 10:1 Oil/Gas+$1.00 +$0.90 (Brent / 5.8) +$1.30 Price Ratio Price Ratio
(1) (2) (3) (4) (5) (6)
Gas Sales Price ($/MMBtu) $23.67 $21.83 $19.61 $17.21 $18.20 $15.20
Delivery Costs ($/MMBtu) (9.42) (9.13) (8.77) (8.39) (5.64) (5.38)(Including Losses)
Netback ($/MMBtu) $14.25 $12.70 $10.84 $8.82 $12.56 $9.82
Netback in $2008 dollars (per MMBtu $6.93 $6.16 $5.22 $4.25 $6.11 $4.75
Total Netback DollarsIn Nominal Dollars ($Bn) $396.2 $353.1 $301.3 $245.2 $472.0 $369.1In $2008 dollars ($Bn) 192.7 171.3 145.1 118.1 229.5 178.5NPV-10 ($Bn) 35.1 31.0 25.6 20.9 41.8 31.9
Oil Prices per Wood Mackenzie Estimates2.7 bcf/d (LNG Project) v. 3.5 bcf/d (Pipeline Project)
2020 - 2044
316542
536421
= More Likely Price Scenario(s)

41
Comparison ofProjected Netbacks
2.7 bcf/d LNG Projectv.
4.5 bcf/d Pipeline Project
42
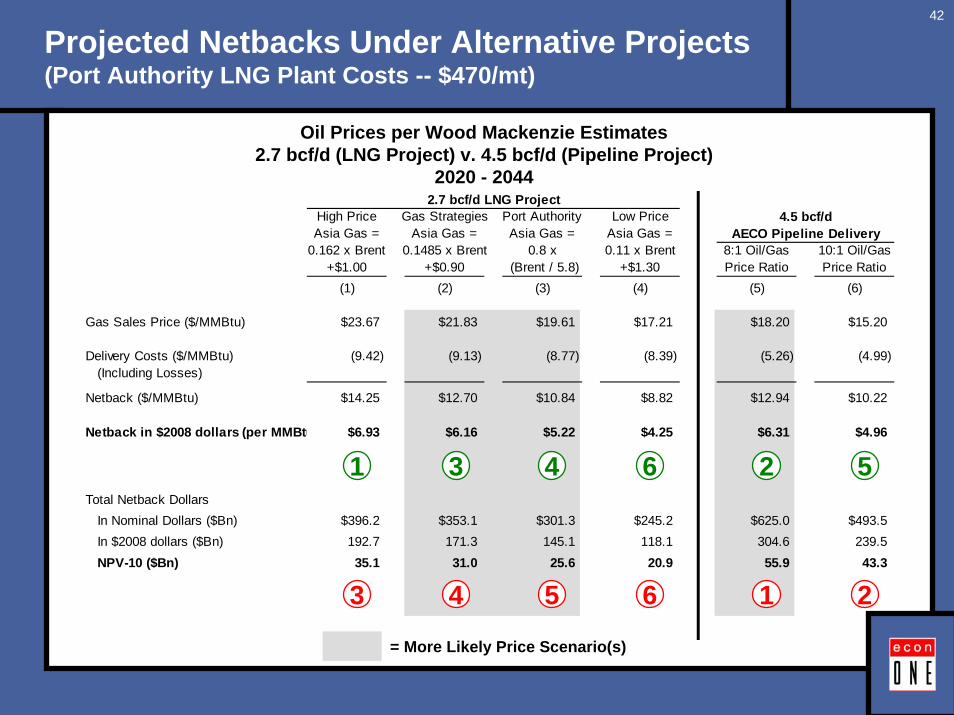
Projected Netbacks Under Alternative Projects(Port Authority LNG Plant Costs -- $470/mt)
2.7 bcf/d LNG ProjectHigh Price Gas Strategies Port Authority Low Price 4.5 bcf/dAsia Gas = Asia Gas = Asia Gas = Asia Gas = AECO Pipeline Delivery
0.162 x Brent 0.1485 x Brent 0.8 x 0.11 x Brent 8:1 Oil/Gas 10:1 Oil/Gas+$1.00 +$0.90 (Brent / 5.8) +$1.30 Price Ratio Price Ratio
(1) (2) (3) (4) (5) (6)
Gas Sales Price ($/MMBtu) $23.67 $21.83 $19.61 $17.21 $18.20 $15.20
Delivery Costs ($/MMBtu) (9.42) (9.13) (8.77) (8.39) (5.26) (4.99)(Including Losses)
Netback ($/MMBtu) $14.25 $12.70 $10.84 $8.82 $12.94 $10.22
Netback in $2008 dollars (per MMBtu $6.93 $6.16 $5.22 $4.25 $6.31 $4.96
Total Netback DollarsIn Nominal Dollars ($Bn) $396.2 $353.1 $301.3 $245.2 $625.0 $493.5In $2008 dollars ($Bn) 192.7 171.3 145.1 118.1 304.6 239.5NPV-10 ($Bn) 35.1 31.0 25.6 20.9 55.9 43.3
Oil Prices per Wood Mackenzie Estimates2.7 bcf/d (LNG Project) v. 4.5 bcf/d (Pipeline Project)
2020 - 2044
216543
526431
= More Likely Price Scenario(s)

43
Comparison ofProjected Netbacks
4.5 bcf/d LNG Projectv.
4.5 bcf/d Pipeline Project

44
Projected Netbacks Under Alternative Projects(Port Authority LNG Plant Costs -- $470/mt)
4.5 bcf/d LNG ProjectHigh Price Gas Strategies Port Authority Low Price 4.5 bcf/dAsia Gas = Asia Gas = Asia Gas = Asia Gas = AECO Pipeline Delivery
0.162 x Brent 0.1485 x Brent 0.8 x 0.11 x Brent 8:1 Oil/Gas 10:1 Oil/Gas+$1.00 +$0.90 (Brent / 5.8) +$1.30 Price Ratio Price Ratio
(1) (2) (3) (4) (5) (6)
Gas Sales Price ($/MMBtu) $23.67 $21.83 $19.61 $17.21 $18.20 $15.20
Delivery Costs ($/MMBtu) (8.67) (8.36) (8.00) (7.60) (5.26) (4.99)(Including Losses)
Netback ($/MMBtu) $15.00 $13.46 $11.61 $9.61 $12.94 $10.22
Netback in $2008 dollars (per MMBtu $7.33 $6.56 $5.63 $4.66 $6.31 $4.96
Total Netback DollarsIn Nominal Dollars ($Bn) $724.7 $650.3 $560.9 $464.1 $625.0 $493.5In $2008 dollars ($Bn) 353.9 316.9 271.8 225.2 304.6 239.5NPV-10 ($Bn) 65.3 58.2 49.0 40.7 55.9 43.3
Oil Prices per Wood Mackenzie Estimates4.5 bcf/d (LNG Project) v. 4.5 bcf/d (Pipeline Project)
2020 - 2044
536421
536421
= More Likely Price Scenario(s)
45
Sensitivities
High Sustained Oil Prices
Impact of Project Delay

46
Projected Netbacks Under Alternative Projects(High Price Case: Fixed $120 Real WTI in $2008)
NPV-10GTP Inlet Total
Rank Project Pricing Netback Rank Project Pricing Netback($/MMBtu) ($Billion)
(1) (2) (3) (4) (5) (6) (7) (8)
1 4.5 LNG 0.162 x Brent + $1.00 $25.86 1 4.5 LNG 0.162 x Brent + $1.00 $126.5
2 2.7 LNG 0.162 x Brent + $1.00 25.18 2 4.5 LNG 0.1485 x Brent + $0.90 114.6
3 4.5 LNG 0.1485 x Brent + $0.90 23.48 3 4.5 Pipeline 8:1 Oil/Gas 109.4
4 2.7 LNG 0.1485 x Brent + $0.90 22.79 4 4.5 LNG 0.8 x (Brent / 5.8) 101.7
5 4.5 Pipeline 8:1 Oil/Gas 22.45 5 4.5 Pipeline 10:1 Oil/Gas 88.2
6 3.5 Pipeline 8:1 Oil/Gas 22.13 6 4.5 LNG 0.11 x Brent + $1.30 83.8
7 4.5 LNG 0.8 x (Brent / 5.8) 20.97 7 3.5 Pipeline 8:1 Oil/Gas 83.7
8 2.7 LNG 0.8 x (Brent / 5.8) 20.26 8 2.7 LNG 0.162 x Brent + $1.00 70.6
9 4.5 Pipeline 10:1 Oil/Gas 18.18 9 3.5 Pipeline 10:1 Oil/Gas 67.0
10 3.5 Pipeline 10:1 Oil/Gas 17.84 10 2.7 LNG 0.1485 x Brent + $0.90 63.7
11 4.5 LNG 0.11 x Brent + $1.30 17.24 11 2.7 LNG 0.8 x (Brent / 5.8) 56.2
12 2.7 LNG 0.11 x Brent + $1.30 16.50 12 2.7 LNG 0.11 x Brent + $1.30 45.8
Note: LNG plant costs of $470/mmta per Port Authority.

47
Impact of Potential Delays on Projects
= More Likely Price Scenario(s)
$35.1 $31.0$25.6 $20.9
$41.8$31.9
$55.9
$43.3
0
20
40
60
NPV
-10
($B
n)
$31.6 $27.9 $23.3$18.8
0
20
40
60
NPV
-10
($B
n)
$37.0$28.2
$49.7$38.4
0
20
40
60
NPV
-10
($B
n)
High PriceAsia Gas =
0.162 x Brent+ $1.00
Gas StrategiesAsia Gas =
0.1485 x Brent+ $0.90
Port AuthorityAsia Gas =
0.8 x(Brent / 5.8)
Low PriceAsia Gas =0.11 x Brent
+ $1.30
8:1Oil/Gas
Price Ratio
10:1Oil/Gas
Price Ratio
8:1Oil/Gas
Price Ratio
10:1Oil/Gas
Price Ratio
2.7 bcf/d LNG Project 3.5 bcf/d AECOPipeline Delivery
4.5 bcf/d AECOPipeline Delivery
Two-Year LNG Delay; 2022 Start on LNG
Two-Year Pipeline Delay; 2022 Start on Pipeline
2020 Start on LNG and Pipeline$60
$60
$60
48
LNG Export Issues
49
LNG Export Issues
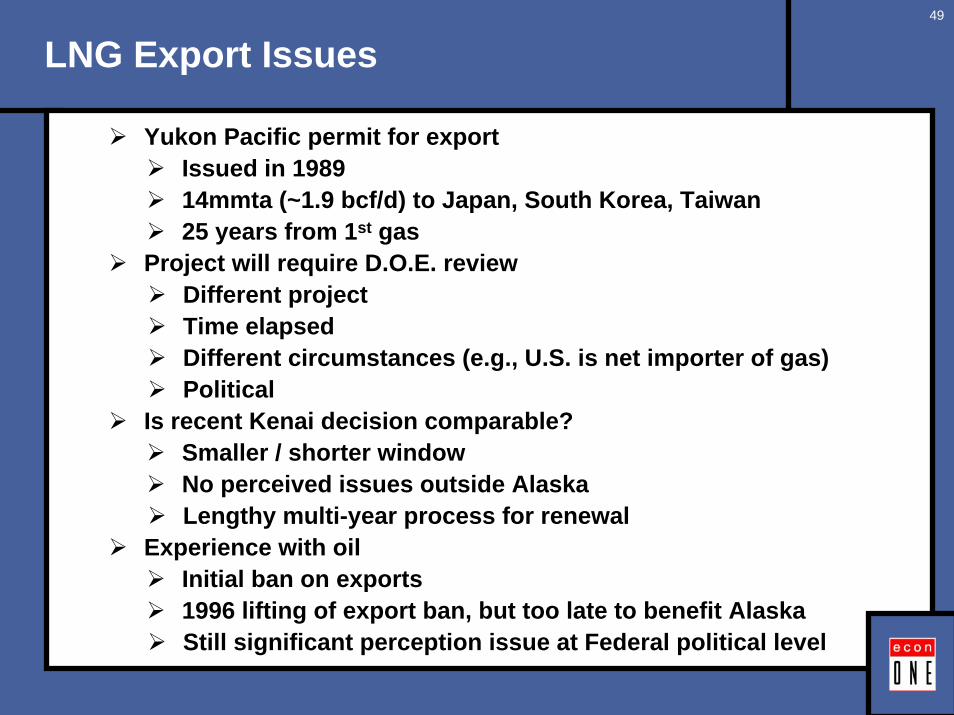
Yukon Pacific permit for exportIssued in 198914mmta (~1.9 bcf/d) to Japan, South Korea, Taiwan
Project will require D.O.E. review25 years from 1st gas
Different projectTime elapsedDifferent circumstances (e.g., U.S. is net importer of gas)
Is recent Kenai decision comparable?Political
Smaller / shorter windowNo perceived issues outside AlaskaLengthy multi-year process for renewal
Experience with oilInitial ban on exports1996 lifting of export ban, but too late to benefit AlaskaStill significant perception issue at Federal political level

50
LNG Export Issues(cont’d)
Exports must be “in public interest”Pros
Free tradeEfficiency (i.e., higher netbacks)Balance of paymentsMore production for Lower-48
ConsWill lead to more LNG importsWill lead to more high-cost Lower-48 productionWill lead to higher gas prices for U.S. consumers

51Will D.O.E. Find LNG Exports in thePublic Interest?
0
10
20
30
40
50
60
70
2030
(bcf
per
day
)
73%Other
Domestic
5% Canada
17%LNG
6% ANS Gas
If ANS gas is exported, it willnot be available for domesticmarkets.
Requires “replacement” withmore expensive domestic gasor LNG imports.
Forecasts indicate that ANSsupplies @ 4.5 Bcf/day willreduce U.S. gas price by~ $0.30/MMBtu.
At projected US consumptionof 70 bcf/d in 2030, this is~ $7.5 billion annually.
Source: EIA AEO 2007

52
LNG Export Issues(cont’d)
Chance of Federal intervention
Federal government assistance with permittingand loan guarantees in 2004 likely lead to tensionre: potential of exports
National security concerns
Argument that consumers in Lower-48 would be hurt
Probably little Federal support for exports if Federalgas is involved
Pipeline project must also apply for export permit
But, 2004 legislation specifically addresses exportto Canada

53
Conclusions

54
Conclusions
Gas prices is Asia are likely to maintain a premium over U.S. gasprices, though not at current levels
U.S. prices will likely strengthen relative to Asian and Europeangas prices as U.S. domestic production becomes more expensiveand LNG flows away from the U.S.
LNG project would likely be viable under reasonable price scenarios,assuming gas can be exported
Economics of LNG delivery to U.S. West Coast would be worsethan pipeline delivery under any reasonable set of assumptions
Under the reasonable price scenarios, 2.7 bcf/d LNG project offers$/MMBtu netbacks that are similar to pipeline netbacks
Difference is some cases is not large relative to potentialestimation error

55
Conclusions(cont’d)
However, larger volumes for pipeline deliveries produce higheroverall values (NPV) for resource owners under more likely pricescenarios
3.5 bcf/d pipeline > 2.7 bcf/d LNG by $11Bn to $16Bn
4.5 bcf/d pipeline > 2.7 bcf/d LNG by $25Bn to $30Bn
LNG project would produce somewhat higher NPVs if in thelong run:
Oil prices stay high
Gas/Oil price ratio in Asia stays strong
Gas/Oil price ratio in U.S. remains weak
LNG can be exported and project advances at some timeearlier than the pipeline

56
Conclusions(cont’d)
Gaining Federal permission to export LNG to Asia will likelybe very difficult
D.O.E. permission
Potential Federal legislation
Export via Y-line will face similar challenges
Federal acceptance of exporting may be more favorable if majorityof gas is already flowing to U.S. markets
But don’t count on it
Oil experience along those lines was not particularlyfavorable

57
Conclusions(cont’d)
Impact of potential delays
Delay in pipeline relative to LNG does not change resultsunder more likely price scenarios
Does the State have to choose between the two projects?
Market-based outcome is more favorable
Shippers can nominate to LNG project if they see it ismore economic
Potential buyers of LNG can go “upstream” and negotiateto buy gas
Economics of LNG relative to pipeline not compellingenough to suggest that the State needs to “intervene”to make LNG happen at expense of pipeline