Embed Size (px)
Citation preview

Primary Care Organization and Performance
Comparison of Models Study
Supported by the Ontario Ministry of Health and Long Term Care

2
• Investigators: • Dr. William Hogg • Louise Ogilvie • Doug Angus, PhD • Betsy Kristjansson, PhD • Dr. Doug Manuel • Dr. Laura Muldoon • Rose Anne Devlin, PhD
Project Team
•Senior Project Members: • Simone Dahrouge, PhDc • Meltem Tuna, PhD • Melissa Dust, MSc • Susan Efler, MSc • Victoria Barham, PhD • Olga Milliken, PhD • Dr. Grant Russell • Robert Geneau, PhD • Dr. Sharon Johnston
3
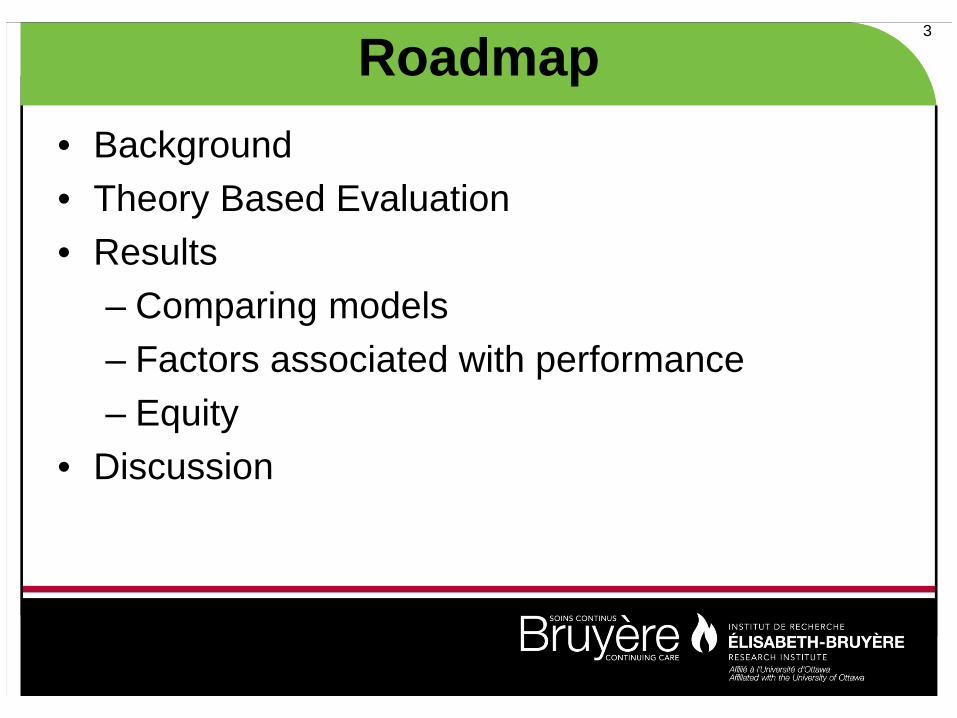
Roadmap • Background • Theory Based Evaluation • Results
– Comparing models – Factors associated with performance – Equity
• Discussion

4
Models Community Health
Centre (CHC) Fee for service
(FFS) Family Health Network
(FHN) Health Service
Organization (HSO) Fee for Service
Family Health
Groups (FHG)a
Year introduced 1970s - 2004 2001 1970s Group size Groups practice –
Unspecified size 1 Physician Minimum 3 Minimum 3 Minimum 3
Physician remuneration Salary FFS FFS and incentives Capitationb with a 10% FFS component, and
incentives
Capitationb
and incentives
Patient enrolment Required No roster size limit
Not required
Required No roster size limit
Required Disincentive to enrol
>2,400c
Required Disincentive to enrol
>2,400c
Access No specified requirements
No specified requirements
THASd
Extended hourse THAS
Extended hourse
Access bonusf
THAS Extended hourse
Access negationg
Multi-disciplinarityh Significant None None Some Some Assistance for Information Technology
Some None None Yes None
Preventive incentivesi None None Few Yes Yes Objectives/Priorities Responsiveness to
population needs, multi-disciplinarity,
prevention, focus on underserved,
community governed18
- Accessibility19 Accessibility, comprehensiveness,
doctor-nurse collaboration, use of
technology
Responsiveness to population needs,
multi-disciplinarity, health promotion, cost
effectiveness20
5
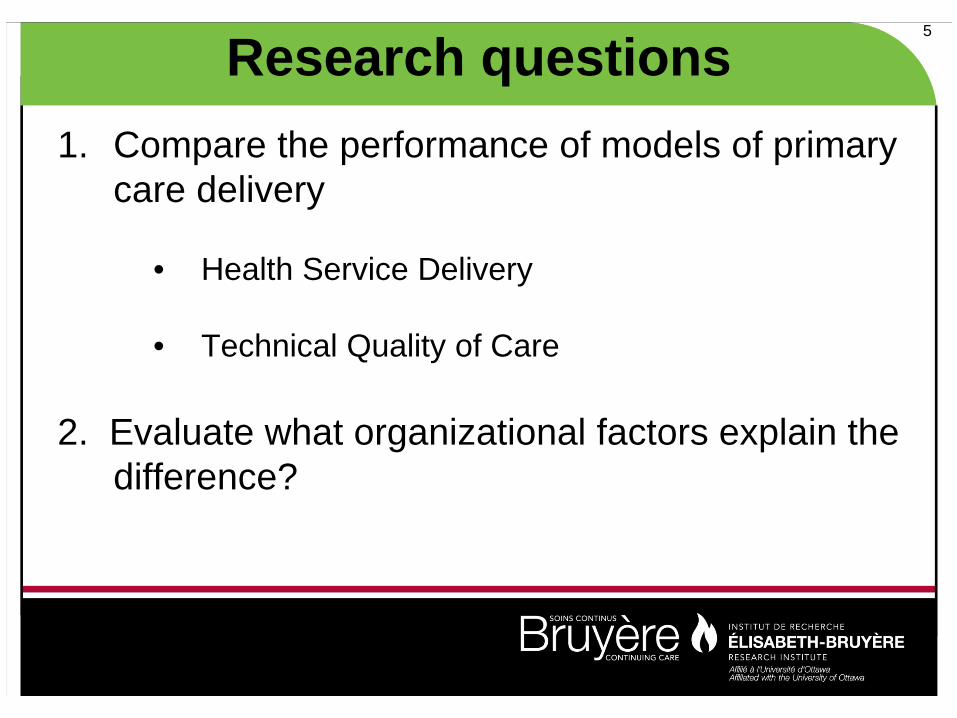
Research questions 1. Compare the performance of models of primary
care delivery
• Health Service Delivery
• Technical Quality of Care
2. Evaluate what organizational factors explain the difference?

6 Design
• Cross sectional mixed methods study
• Sample of 137 Primary care practices in four
models of primary care delivery

7
Roadmap • Background • Theory Based Evaluation • Results
– Comparing models – Factors associated with performance
• Discussion

8
Theory Based Evaluation

9 Theory based evaluation

10

11
Structural Domain
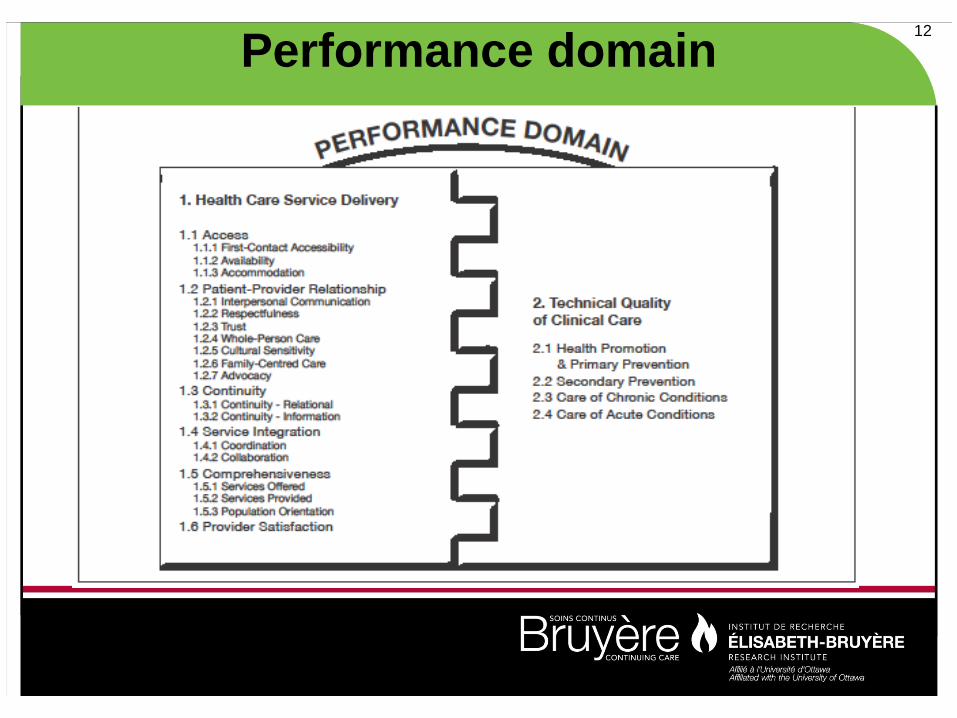
12 Performance domain

13
Study tools •Organizational survey (1 per site)
– PCAT measures of comprehensiveness. – Economic and governance information (team
structure, sources of income, salaries and costs.)
•Provider survey (≥ 50% PCPs at a site) – Demographics (including training and FTE worked) – Provider’s experience of practice performance

14
Study tools •Patient waiting room survey (35-50 per site)
– Before the visit (experience of primary care) – After the visit (report of consultation)
•Chart audit (30 per site) – Technical quality of care
15
Roadmap • Background • Theory Based Evaluation • Results
– Comparing models – Factors associated with performance – Equity
• Discussion

16
Dimensions Health Service Delivery Technical Quality of Care Delivery Access Health promotion
First contact accessibility scales Healthy foods and unhealthy foods First contact utilization scale Home safety
Patient-Provider Relationship Family conflicts Humanism scale Exercise Trust scale Tobacco/smoking Cultural competency scales Alcohol consumption Family centeredness scales How to prevent falls
Continuity Chronic Disease Management Ongoing care scale Diabetes
Comprehensiveness Coronary artery disease Services offered Congestive heart failure Community orientation scale – Reach out Prevention Community orientation scale – Needs ass Influenza immunization Community orientation scale – Monitor Hearing and vision screening Community orientation scales Breast, cervical and colorectal ca screening

17
Participation Model CHC HSO FHN FFS Overall Practices
Eligible 51 65 94 155 365 Participated 35 32 35 35 137 Response rate (%) 69 49 37 23 45
Providers Participated 182 42 81 58 363
Patients Eligible 1591 1590 1583 1758 6522 Participated 1219 1273 1494 1375 5361 Response rate (%) 77 80 85 74 79
Chart abstraction 1050 958 1050 1050 4,108
18
Roadmap • Background • Theory Based Evaluation • Results
– Comparing models – Factors associated with performance – Equity
• Discussion

19
First Contact Accessibility (PCAT) • When your PCP is open and you get sick, would
someone from this office see you the same day?
• When your PCP is open, can you get advice quickly over the phone if you need it?
• When your PCP is closed, is there a phone number you can call if you get sick?
• When your PCP is closed and you get sick during the night, would someone from this office see you that night?

20
First Contact Accessibility
74%71% 73%
80%
0%
10%
20%
30%
40%
50%
60%
70%
80%
90%
100%
Estim
ated a
djuste
d sco
re
CHC FFS FHN HSO
Estimated accessibility for patients: age 50; good-excellent health, at least college education, working, 10 days with mental/physical limitations
↓ 7.1%↓ 9.0%
↓ 6.0%
*

21
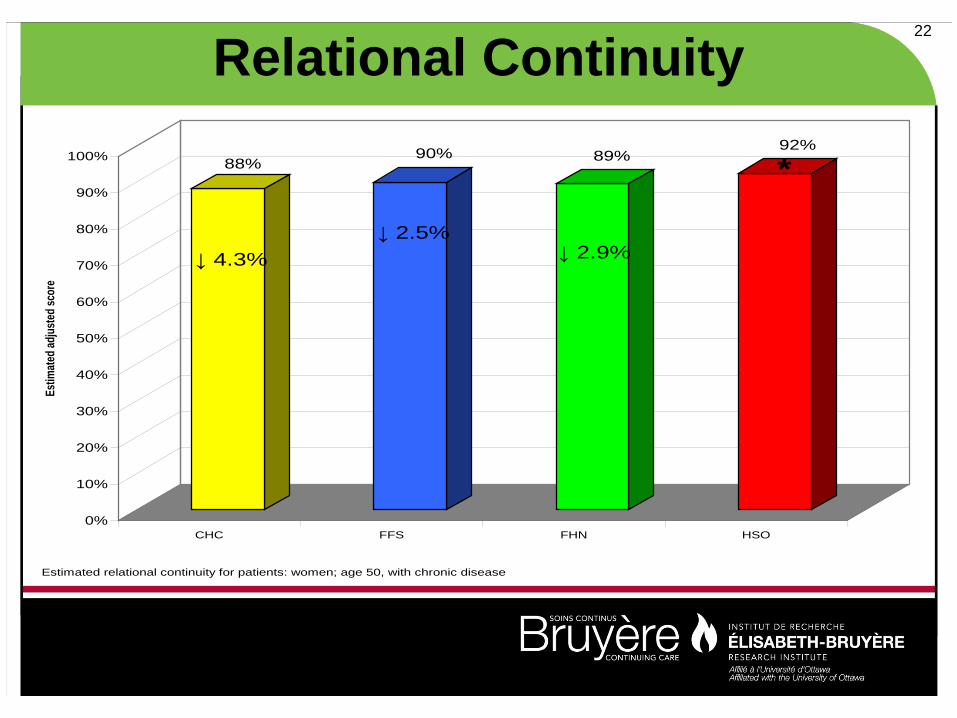
Relational Continuity (PCAT) • When you go to your provider’s office are you taken care
of by the same doctor or nurse practitioner each time?
• If you have a question, can you call and talk to the doctor or nurse practitioner who knows you best?
• Does your provider know you very well as a person, rather than as someone with a medical problem?
• Does your provider know what problems are most important to you?
22
Relational Continuity
88%90% 89%
92%
0%
10%
20%
30%
40%
50%
60%
70%
80%
90%
100%
Estim
ated a
djuste
d sco
re
CHC FFS FHN HSO
↓ 4.3%↓ 2.5%
↓ 2.9%
Estimated relational continuity for patients: women; age 50, with chronic disease
*

23
Comprehensiveness - PCAT
Diagnostic procedures:
1) Sigmoidoscopy2) ECG/EKG3) Spirometry
Procedural:
1) Suturing2) Allergy shots3) Wart treatment4) Splinting for a sprained ankle5) Removal of an ingrown toenail
Social:
1) Nutrition counseling2) Alcohol or drug abuse counseling3) Counseling for behavioral or
mental health problems
Obstetric/Gynecological:
1) Antenatal care (prenatal?)2) PAP smear3) Preparation for delivery and
delivery (off site) of babies 4) Family planning/ birth control
services

24
Comprehensiveness
74%
62% 62% 61%
0%
10%
20%
30%
40%
50%
60%
70%
80%
90%
100%
Estim
ated a
djuste
d sco
re
CHC FFS FHN HSO
Estimated comprehensiveness for practices with rurality of "0".
↓ 11.9%↓ 11.3% ↓ 12.3%
*

25
Community Orientation (Reach out) - PCAT
Does your practice site use any of the following activities to reach out to the population in the community you serve?
– Networking with provincial and local agencies involved with culturally diverse groups
– Linkages with religious organizations/services
– Involvement with neighbourhood groups/leaders
– Outreach workers
– Other

26
Community Orientation (Assess Needs) - PCAT
Does your practice site use the following types of data to determine what programs/services are needed by the communities you serve?
– Mortality data
– Public health communicable disease data (e.g., STDs, TB
– Community immunization rates
– Public health data on health or occupational hazards
– Clinical data from your practice
– Other

27
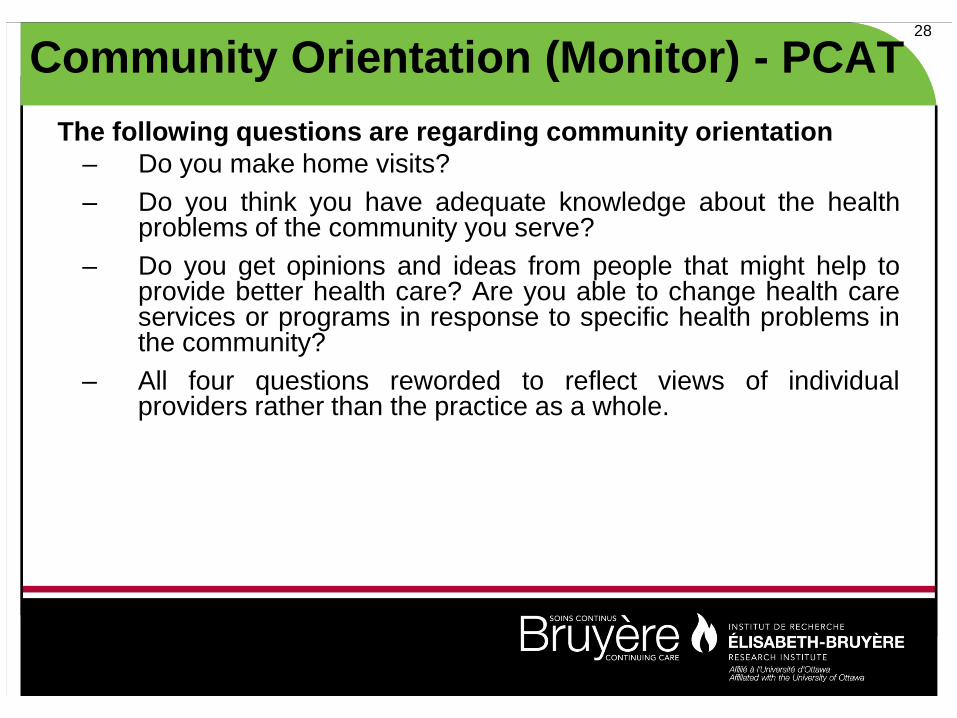
Community Orientation (Monitor) - PCAT Does your practice site use the following methods to monitor and/or evaluate the effectiveness of services/programs if offers?
– Surveys of the practice patients – Community surveys – Feedback from community organizations or community advisory
boards – Feedback from the practice staff – Analysis of local data or vital statistics – Systematic evaluations of the practice programs and services
provided – Community health workers – Have a patient on the Board of directors or advisory committee – Other
28
Community Orientation (Monitor) - PCAT The following questions are regarding community orientation
– Do you make home visits? – Do you think you have adequate knowledge about the health
problems of the community you serve? – Do you get opinions and ideas from people that might help to
provide better health care? Are you able to change health care services or programs in response to specific health problems in the community?
– All four questions reworded to reflect views of individual providers rather than the practice as a whole.

29
Community Orientation 94%
45% 47%44%
71%
54% 54% 55%
85%
45% 47%
53%
85%
75%
81%79%
0%
10%
20%
30%
40%
50%
60%
70%
80%
90%
100%
Undju
sted s
core
s
Reach out Assess needs Monitor/evaluate Provider assessment
CHCFFSFHNHSO
*
*
*
Community orientation - unadjusted
*

30
Patient Provider Relationship 91% 90% 90% 90%
87% 88% 87% 88%85% 84% 83% 83%
90% 89%89% 89%
0%
10%
20%
30%
40%
50%
60%
70%
80%
90%
100%
Unad
justed
scor
e
x
Humanism Trust Cultural competency Family centeredness
CHCFFSFHNHSO
*
▼ ▼

31
Summary - HSD

32
Health promotion (CTFPHC) • Healthy foods and unhealthy foods
• Home safety
• Family conflicts
• Exercise
• Tobacco/smoking
• Alcohol consumption
• How to prevent fallsa

33
Health Promotion
61%
48%52%
47%
0%
10%
20%
30%
40%
50%
60%
70%
80%
90%
100%
Estim
ated A
djuste
d Sco
re
CHC FFS FHN HSO
↓ 12.9%↓ 8.9%
↓ 14.2
Estimated Health Promotion for patients: women
*

34
Prevention care (CTPHC) Prevention Manoeuvre Eligibility in this study Recommended
Frequency Grade level
Score
Cervical cancer screening Papanicolaou smear Females 17-69 Annual (high risk) or every 3 years
B 1
Breast cancer screening Mammography and clinical breast exam
Females 50-69 years Annual or biannual
A A
.5 each
Influenza immunization Immunization with influenza vaccine
Higher risk of influenza Annual A 1
Colorectal cancer screening Fecal occult blood testing or Flexible sigmoidoscopy
50 years or older Annual or biannual
A (FOB) B (FS)
1
Visual impairment screening Eye exam 65 years or older Unspecified B 1
Auditory impairment screening
Hearing exam 65 years or older Unspecified B 1

35
Prevention
64%59%
65%
56%
0%
10%
20%
30%
40%
50%
60%
70%
80%
90%
100%
Estim
ated A
djuste
d sco
re
CHC FFS FHN HSO
*
↓6.3%↓ 9.1%
Estimated Preventive care for patients: women; ages 50-64
36
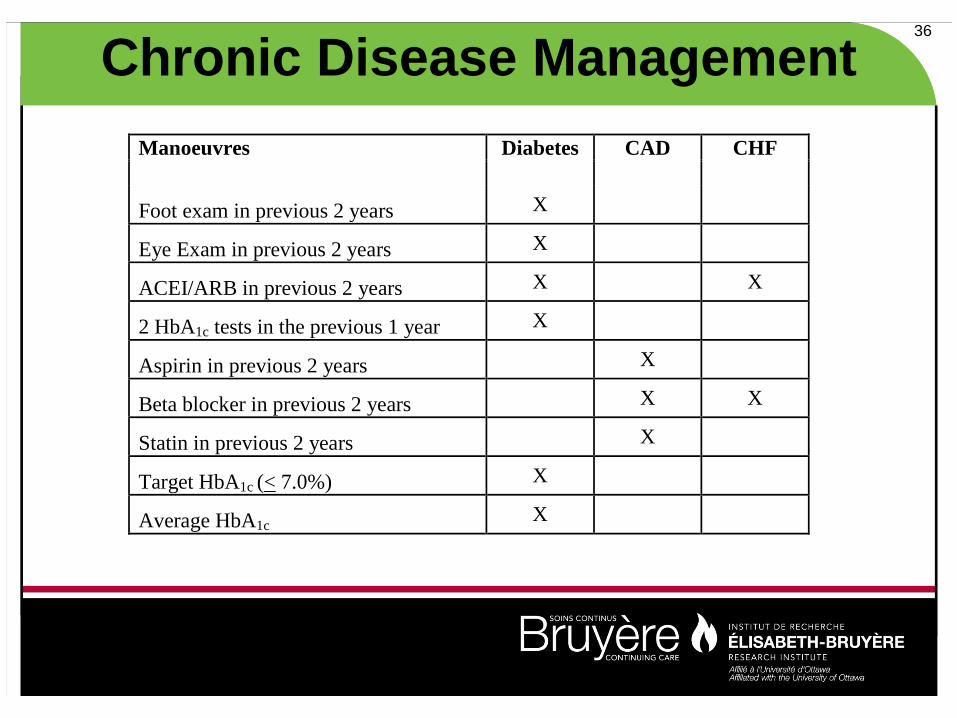
Chronic Disease Management Manoeuvres Diabetes CAD CHF
Foot exam in previous 2 years X
Eye Exam in previous 2 years X
ACEI/ARB in previous 2 years X X
2 HbA1c tests in the previous 1 year X
Aspirin in previous 2 years X
Beta blocker in previous 2 years X X
Statin in previous 2 years X
Target HbA1c (< 7.0%) X
Average HbA1c X

37
Chronic Disease Management
66%
54%52%
56%
0%
10%
20%
30%
40%
50%
60%
70%
80%
90%
100%
Estim
ated a
djuste
d sco
re
CHC FFS FHN HSO
↓ 12.5% ↓ 14.6%↓ 10.4%
*
Estimated Chronic Disease Management for patients: women; age 50

38
Summary – Technical Quality of Care
CHC FFS FHN HSO Health promotion ▲ ▼ ▼ ▼
Prevention - ▼ ▲ ▼
Chronic Disease Management ▲ ▼ ▼ ▼

39
Efficiency – Cost per patient
0%
10%
20%
30%
40%
50%
60%
70%
80%
90%
100%
Perc
ent o
f pra
ctice
s x
1 2 3 4Quartile ranking in descending order
CHCFFSFHNHSO

40
Roadmap • Background • Theory Based Evaluation • Results
– Comparing models – Factors associated with performance – Equity
• Discussion

41
Patient factors Accessibility Continuity Comprehen-
siveness Health
promotion Prevention CDM
Patient factors Age (older) ↑ ↑ ↓ ↓ ↑ - ↓ Male ↑ ↓ ↑ Education (higher) ↓ ↓ Health indicators (better) ↑ ↓ English speaking ↑ Frequent visits (higher) ↑ Working/# works worked ↓ ↓ Receives care from NP ↑ Duration with practice ↑

42
Visit and contextual factors
Accessibility Continuity Comprehen-siveness
Health promotion
Prevention CDM
Visit specific information Visits with regular provider ↑ Visit - general check up CDM ↑
Setting Rurality (more rural) ↓ ↑ Hospital distance > 10 km ↑

43
Provider and Organizational factors Accessibility Continuity Comprehen-
siveness Health
promotion Prevention CDM
Organizational factors Physician age (older) ↑ Female family physicians ↑ ↑ Canada trained physicians ↑ No. of family physicians ↑ ↓ Presence of Nurse practitioner ↑ No. of nurses ↓ ↑ Allied health providers ↑ On call hours available ↑ Open on week end ↓ Average booking interval ↑ Clinical workload (#pts/MD) ↓ ↓ ↓ IR reminder system ↑
IT

44
Roadmap • Background • Theory Based Evaluation • Results
– Comparing models – Factors associated with performance – Equity
• Discussion

45
Sex differences in HSD (PCAT score)
0.6% 0.5% 0.3%
1.4%
-5%
-4%
-3%
-2%
-1%
0%
1%
2%
3%
4%
5%
CHC FFS FHN HSO
Adj
uste
d df
ifere
nce
in p
erfo
rman
ce
Fa
vour
s m
en
Fa
vour
s w
omen
x

46
Sex differences in Health Promotion

47
Sex differences in Prevention

48
Sex differences in CDM
Women, 69%
Men, 80%
Women,59%
Men, 70%
Women, 58%
Men, 62%
Women, 62%
Men, 64%
0%
10%
20%
30%
40%
50%
60%
70%
80%
90%
100%
Est
imat
ed C
hro
nic
Dis
ease
Man
agem
ent
CHC FFS FHN HSO
*
Estimated for individuals 70 years of age and over

49
3.7%
2.8%
4.3%
2.6%
1.1%1.4%0.5%
1.3%
80%
81%
82%
83%
84%
85%
86%
87%
88%
89%
90%
<30 30-64 65+ <30 30-64 65+ <30 30-64 65+ <30 30-64 65+
CHC FFS FHN HSO
Model and Age Group
Estim
ated
PCA
T Sc
ore (
Norm
alize
d an
d ad
just
ed)
*
*
*
*
*
Age differences in HSD (PCAT)

50
Age difference in Health Promotion
2.0%3.1%1.0%0.8%
0.1%
2.3%
12.5%10.9%
30%
35%
40%
45%
50%
55%
60%
<30 30-64 65+ <30 30-64 65+ <30 30-64 65+ <30 30-64 65+
CHC FFS FHN HSO
Model and Age Groups
Estim
ated L
ikelih
ood o
f Hav
ing D
iscus
sed a
Hea
lthy L
ifesty
le Su
bject
(Adju
sted)
↓
↓ ↓↓ ↓
↓*

51
Age difference in Prevention Women
18% 33%
13% 32%12% 30%
22% 34%
0%
10%
20%
30%
40%
50%
60%
70%
80%
90%
100%
17-49 50-64 65+ 17-49 50-64 65+ 17-49 50-64 65+ 17-49 50-64 65+
CHC FFS FHN HSO
Model and Age Groups
Estim
ated P
reve
ntion
Sco
re (A
djuste
d)
↓ ↓
↓ ↓↓ ↓
↓ ↓
** *
*

52
5.7% 5.0%
17.4%
11.6%
21.3%
8.0%
24.4%
8.6%
0%
10%
20%
30%
40%
50%
60%
70%
80%
90%
100%
<60 60-69 70+ <60 60-69 70+ <60 60-69 70+ <60 60-69 70+
CHC FFS FHN HSO
Model and Age Groups
Estim
ated C
hron
ic Di
seas
e Man
agem
ent S
core
(Adju
sted)
*
**
Age difference in CDM

53
Limitations
• Ontario based, cross-sectional survey
• Model maturity
• FFS representativeness
54
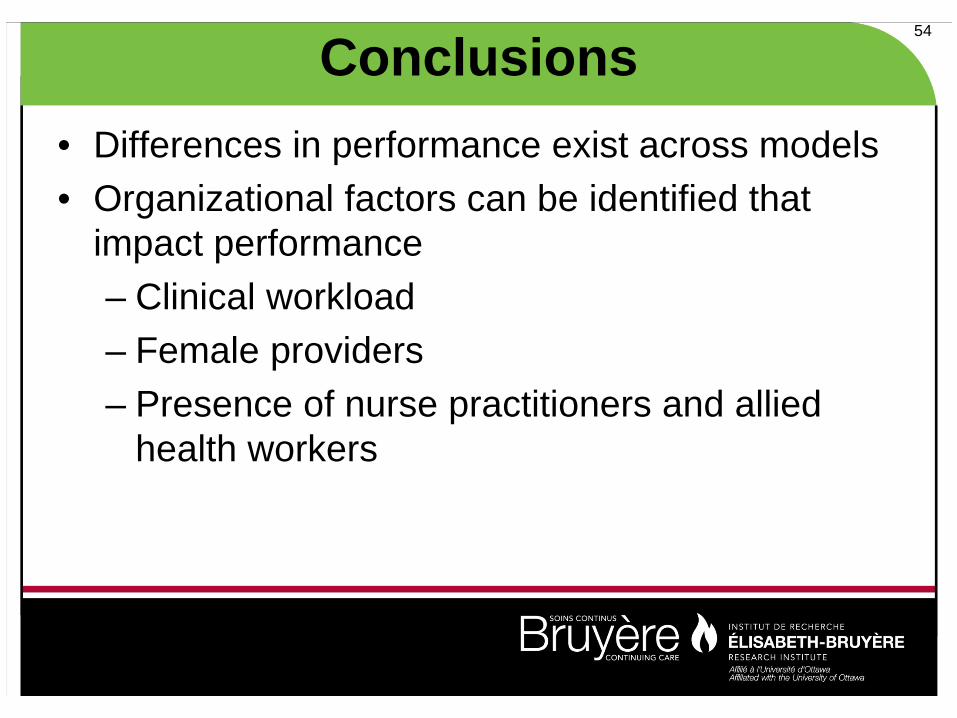
Conclusions • Differences in performance exist across models • Organizational factors can be identified that
impact performance – Clinical workload – Female providers – Presence of nurse practitioners and allied
health workers

55
Discussion