Embed Size (px)
Citation preview

Abstract An obese occupant model was generated by adding subcutaneous fat and visceral fat to the
THUMS Version 4 AM50 occupant model. The model represents an adult person with a Body Mass Index of 35
while the THUMS Version 4 AM50 has a Body Mass Index of 24 (non‐obese). Using the non‐obese and obese
occupant models, vehicle frontal impact simulations were conducted assuming a collision speed of 56 km/h and
pole side impact simulations were conducted assuming a collision speed of 32 km/h. In the frontal impact, the
obese occupant exhibited a greater forward excursion than the non‐obese. In the pole side impact, relatively
large deflections were found in the superior ribs of the obese occupant. The large body mass of the obese
occupant commonly increased the kinetic energy in both collisions. Besides the body mass, the thick soft tissue
of the obese occupant influenced the impact kinematics and responses. The thick soft tissue in the inferior
abdomen delayed the pelvis engagement with the lap belt in the frontal impact, while it induced greater rib
deflection in the pole side impact around the upper arm. This paper also refers to a modelling challenge in
connecting the soft tissue and the ribcage.
Keywords body mass index, human body FE model, obese occupant, vehicle collision simulation
I. INTRODUCTION
Obesity is increasing worldwide. The World Health Organization (WHO) reported that more than 600 million
adults were obese in 2014 [1]. They define obesity as a Body Mass Index (BMI) of 30 or higher. Researchers
indicate a higher injury rate of obese occupants in vehicle collisions compared to non‐obese occupants. Studies
on traffic accident database such as National Automotive Sampling System ‐ Crashworthiness Data System
(NASS‐CDS) revealed relatively high fatality risk of obese occupants in vehicle collisions [2‐5]. Frontal impact sled
tests with post mortem human subjects (PMHSs) were conducted to compare impact kinematics and injury
responses between non‐obese and obese occupants. The test results commonly showed that obese subjects
exhibited greater forward excursions than non‐obese subjects [6‐7]. Recently, a finite element (FE) approach
was taken to better understand the difference in impact kinematics between non‐obese and obese occupants.
Human body FE models were used to represents obese occupants. In most studies, obese occupant models
were generated by scaling and/or morphing non‐obese models or just by increasing the mass and/or volume of
the abdomen part. One of the findings from such simulation studies was that large body weight and poor belt fit
were potential causes of injury for obese occupants [8]. The seatbelt fit was examined for volunteer subjects. It
was noted that obese occupants tended to shift the belt forward and upward relative to the pelvis [9]. The poor
belt fit could result in submarining behavior, although abdominal injuries were not necessarily observed in the
PMHS tests [10]. Other simulation results showed a shift of the shoulder belt from the medium location to the
lateral direction due to the protruding geometry of the abdomen [11]. Thus, previous studies have indicated
possible factors causing differences of impact kinematics and injury responses between non‐obese and obese
occupants such as weight, belt fit and belt path. However, the relevance of such factors to injury outcomes has
not been identified yet. Few studies were conducted for lateral collisions. A study of NASS‐CDS data (2000‐2008)
indicated that the percentage of lower extremity injuries was higher for the group comprising thin people [12].
The data also showed that the percentage of thorax and abdominal injuries appeared to increase with BMI.
The objectives of this study were to understand differences in impact kinematics between non‐obese and
Y. Kitagawa, Ph.D., is Chief Professional Engineer of Advanced CAE Division at TOYOTA MOTOR CORPORATION, Japan (Ph. +81 565 94 2080, fax. +81 565 94 2060, e‐mail: [email protected]). S. Hayashi is Group Manager at TOYOTA, Japan. T. Yasuki, Ph.D., is Project General Manager in TOYOTA, Japan.
Comparison of Impact Kinematics between Non‐obese and Obese Occupants in Frontal and Lateral Impacts
Yuichi Kitagawa, Shigeki Hayashi, Tsuyoshi Yasuki
IRC-17-19 IRCOBI Conference 2017
-91-

obese occupants in vehicle frontal and lateral collisions, and to discuss their relevance to thoracic and
abdominal injuries.
II. METHODS
The present study used FE models and LS‐DYNATM Version 971. LS‐DYNA is a general‐purpose multiphysics
simulation software package developed by Livermore Software Technology Corporation (US). It is designed to
run over high performance computing clusters with massively parallel processing (MPP). The FE models
consisted of occupant models and vehicle models including seats and restraint systems.
Occupant Models
Two occupant models were used for vehicle frontal and lateral collision simulations. One was the THUMS
Version 4 AM50 occupant model. The model represented a non‐obese (midsize) male occupant in his thirties
with a height of 178 cm, a weight of 74.3 kg and a BMI of 23.5 kg/m2. The other model was an obese occupant
model generated from the AM50 model with increased volume of soft tissue. Obesity is frequently subdivided
into categories: class 1 with a BMI from 30 to 35 kg/m2 and class 2 from 35 to 40 kg/m2. Obesity with a BMI of
40 kg/m2 or higher is classified as extreme or severe. A BMI of 35 kg/m2 was the set target for the obese
occupant model. Subcutaneous fat and visceral fat were added to the AM50 model. Kent et al. investigated
structural changes of the thorax with age [13]. They also noted that BMI tends to increase with age. Based on
their data, the rib angle increased approximately 7.6 deg from a BMI of 24 to 35 kg/m2. Based on their data, the
rib angle of the non‐obese model was raised from 47.1 to 54.7 deg. As a result, the position of the sternum
moved forward by 15 mm. The volume of visceral fat increased accordingly. The volume of soft tissue outside of
the ribcage (including subcutaneous fat and muscles) was raised so that the circumferences of the waist, hip and
thigh came close to the measured data (average values of seventeen obese male subjects) in the literature. [14].
The weight value of the obese occupant model finally reached 111 kg with a BMI of 35 kg/m2. The modelling
work was not done by scaling or morphing but by remeshing. It was confirmed that there was no significant
difference in mesh quality such as aspect ratio, warpage and skew between the non‐obese and obese models.
Relatively low quality values were found when scaling and morphing the AM50 model. The two occupant
models are illustrated in Fig. 1 with the model specifications. Incompressive hyperelastic material was assumed
for the flesh, and its property was the same with that for the AM50 model.
Fig. 1. Non‐obese occupant model and obese occupant model with specifications.
Care was taken in representing the connection between the soft tissue and the ribcage especially for the
IRC-17-19 IRCOBI Conference 2017
-92-

obese occupant model. Subcutaneous fat was modeled separately from skeletal parts in the AM50 model like
the rubber jacket of a crash test dummy. Separate modelling potentially allows void growth during impact.
Another modeling technique was to share nodes between the soft tissue and the ribcage. However, such
continuous modelling tends to generate high resistance force by restraining relative motions between them.
(The resistance is significant in the obese occupant model which has thick soft tissue while it is negligible in the
AM50 model.) The actual connection allows shear displacement between the soft tissue and the ribcage without
void growth. The study adopted a tie‐brake contact to realistically mimic the interface. It allowed separate
definitions of stiffness against shearing and peeling. The stiffness against peeling was adjusted to that of the soft
tissue while that against shearing was lowered as much as possible without causing numerical instability.
Validation of Occupant Models
The mechanical responses and impact kinematics of THUMS Version 4 AM50 were previously validated with those of PMHSs described in the literature [15‐17]. It was considered that the non‐obese occupant model was usable for vehicle frontal and lateral collision simulations in order to investigate impact kinematics and injury responses. The question was the validity of the obese occupant model. It was assumed that BMI did not change injury tolerance of tissue parts but influenced mechanical response and impact kinematics of the entire body due to mass and thick soft tissue. Based on this assumption, two validation cases were applied. The first case was impact loading to the thorax. The purpose was to examine the equivalence of chest deflection (mechanical response) between the two models and PMHS tests. The other case was a frontal impact sled in order to verify the impact kinematics of the obese occupant model by comparing to that of PMHSs. Two series of impact tests to the anterior thorax were selected for model validation [18‐19]. The first series
included fourteen PMHSs ranging in age from 19 to 81 while the second series added another twenty‐three PMHSs aged from 46 to 76. The test data of the subjects from 19 to 49 were used for model validation. A rigid cylinder was used for impacting the anterior thorax. The weight value ranged from 19.3 to 23.6 kg and the impact velocity ranged from 6.7 to 9.8 m/s in the selected cases. The impact force and sternum deflection were measured and rib fractures were reported for each subject. The force‐deflection corridor was previously used for validating the non‐obese (AM50) model [15]. Fig. 2 shows the non‐obese and obese occupant models used for simulating the tests. Note that the arms were stretched forward to mimic the subject posture. The study assumed that rib fracture (injury tolerance) was comparable between non‐obese and obese subjects. Fig. 3 compares the resultant chest deflection ratios between PMHSs and two occupant models. The chest deflection ratios generated in both occupant models were found within the range of standard deviation of the PMHS test data.
Fig. 2. Thorax impact validation models. A rigid
cylinder impacted anterior thorax.
Fig. 3. Comparison of chest deflection ratios between
PMHSs, non‐obese and obese models. PMHS data shows
average (bar) and standard deviation (range).
Whole body kinematics of the obese occupant model were examined by comparing them to those of PMHSs
in the frontal impact sled tests done by Joodak et al. [20]. Fig. 4 shows the validation model representing the
test configuration. The test apparatus represented the rear seat of a midsize sedan vehicle. A prototype rear
seat FE model of a prototype midsize sedan was used to mimic the test apparatus. Note that the geometry and
material property of the seat FE model were not exactly the same as those of the test apparatus. Two obese
subjects were used in the tests. The first one had a height of 189 cm and a weight of 124 kg while the other had
a height of 182 cm and a weight of 151 kg. The obese occupant model was placed onto the seat by applying
IRC-17-19 IRCOBI Conference 2017
-93-

gravity to stabilise the posture. The stabilised posture represented that of the subjects. A three‐point seatbelt
with a pretensioner and a load limiter was used in the tests. Their functions were imitated in the retractor
model. The seatbelt path was fitted to the body surface using pre‐processing software Oasys PRIMERTM. Two
acceleration pulses (29 km/h and 48 km/h) were applied to the actual sled. The higher one was used for the
model validation. Fig. 5 compares the impact kinematics and torso angle time history curves between the two
test subjects and the obese occupant model. The trajectories of the head, shoulder, pelvis and knee showed a
reasonable match. The THUMS head travelled further than those of the test subjects. The head stopped when
the chin contacted the thorax. It was considered that the range of motion was different between the test
subjects and THUMS. The torso angles started increasing at approximately 30 ms and reached the maximum
peaks at 90‐110 ms in the test subjects while that of THUMS showed a similar time history curve.
Fig. 4. Obese occupant validation model. A prototype rear seat FE model of a midsize sedan was used for
representing the test apparatus.
Fig. 5. Comparison of impact kinematics between two test subjects and the obese occupant model. The left plot
compares trajectories of the head, shoulder, pelvis and knee. The right plot compares time history curves of the
torso angles.
Vehicle Collision Simulation Models
An FE model of a prototype midsize sedan was used for vehicle collision simulations. The part of the cabin surrounding the driver’s seat was used for frontal collision simulations. No deformation was assumed for the cabin frames including the toe pan. The model also included a three‐point seatbelt with a pretensioner and a load limiter, a driver airbag and a knee airbag. The load limiter value was set to 4 kN. The seat was adjusted to the same position on the slide rail for both occupant models. Each occupant model was placed onto the seat model in gravity. The same hip position was targeted for the two models. However, the actual hip position of the obese occupant was higher by approximately 40 mm due to the thick soft tissue of the buttocks. A common driving posture was given to each model with the hands on the steering wheel and the feet on the pedals. In the stabilised posture, the distance between the chest of the obese occupant (anterior) and the steering wheel was
IRC-17-19 IRCOBI Conference 2017
-94-

shorter than that of the non‐obese occupant by approximately 70 mm. The seatbelt path was fitted to the body surface using pre‐processing software Oasys PRIMERTM (ARUP, UK). The position of the lap belt for the obese occupant model was adjusted by approximately 60 mm forward and 40 mm upward in the pelvis coordinate system compared to that of the non‐obese occupant. The adjustment was made referring to the measurement data by Reed et al. [9]. The frontal collision model is illustrated in Fig. 6. An acceleration pulse representing a frontal collision at a speed of 56 km/h was applied to the model. A full vehicle model was used for lateral collision simulations. The study assumed a pole side impact with an
inclination angle of 75 deg and a speed of 32 km/h. A rigid pole model was fixed to the inertial space. Initial
velocity was given to the entire vehicle model. The door parts and body side frames were deformed during the
impact. The seatbelt pretensioner and the load limiter were activated, as well as a side airbag and a curtain
airbag were deployed. The occupant models were placed onto the seat in the same manner as in the frontal
collision model. The seatbelt was also fitted in the same manner. The initial distance between the shoulder of
the obese occupant and the door trim was shorter than that of the non‐obese occupant by approximately 20
mm due to the thick soft tissue. Fig. 7 shows an entire view of the pole side impact model.
Fig. 6. Vehicle frontal collision simulation model. Example of obese occupant.
Fig. 7. Pole side impact simulation model.
Post‐processing of Simulation Results
Three dimensional coordinate data of all nodes and strain values calculated at all elements were exported
every 10 ms. Time history data such as accelerations calculated at selected nodes were output every 0.1 ms.
Post‐processing software LS‐PrePostTM was used to visualise the impact kinematics of the occupant models and
to plot time history curves. Impact kinematics were analysed in the vehicle coordinate system. A transparent
display function was used for some pictures to better understand the interaction between the body of the
occupant and the vehicle interior parts. The distribution of strain was drawn as contours. Nodal time history
data on body landmark points were output and compared between the non‐obese and obese models. The
IRC-17-19 IRCOBI Conference 2017
-95-

landmark points were the head centre of gravity (COG), T1, T8, hip point (HP), knee joint and ankle joint for
frontal collision; head COG, T1, T4, T12 and S1 for pole side impact. Contact forces were calculated between the
body of the occupant and the surrounding parts such as the driver airbag, the side airbag, the seatbelt and the
door trim. The dummy injury indicators such as HIC15 and chest deflection were used for whole body
comparison between the two occupant models. Local indicators such as rib deflection and strain were examined
to discuss the loading mechanism of the body of the occupant. In frontal collision, chest deflection was
calculated as a distance change between the mid sternum and T7. In pole side impact, rib deflection was
calculated based on a local coordinate system defined on each thoracic vertebra. In vehicle collision simulations,
the occurrence of injuries such as bone fractures and soft tissue damage was not directly predicted, but
indicator values were compared between the two occupant models.
III. RESULTS
The frontal collision simulations were terminated at 140 ms when the body of the occupant was expected to rebound after reaching the maximum forward displacement. Pole side impact simulations were terminated at 150 ms when the body of the occupant was expected to almost come to a halt. It was confirmed that the amount of hourglass energy was less than 1% of the total energy amount.
Frontal Collision Simulations
Fig. 8 compares impact kinematics of the non‐obese and obese occupant models in a lateral view. Time
frames of 0, 80 and 100 ms were selected for comparison. The initial distance between the obese occupant and
the steering wheel was shorter than that of the non‐obese occupant as described before. Forward displacement
of the pelvis reached its maximum point at approximately 80 ms. The maximum displacement of the pelvis of
the non‐obese occupant was 181 mm while that of the obese occupant was 241 mm. The time frame of 100 ms
compares occupant positions when the upper body reached the maximum forward displacement. Despite the
shorter distance from the steering wheel at 0 ms, the maximum head and chest forward displacement of the
obese occupant were greater than those of the non‐obese occupant. Table I summarises the maximum forward
displacement values of the two occupants.
Fig. 8. Comparison of impact kinematics between non‐obese and obese occupants in frontal collision.
TABLE I MAXIMUM FORWARD DISPLACEMENT VALUES
Body Part Non‐obese Occupant Obese Occupant
IRC-17-19 IRCOBI Conference 2017
-96-

Head COG 487 mm 545 mm
T1 342 mm 442 mm
Pelvis (HP) 181 mm 241 mm
Fig. 9 magnifies the interaction between the lap belt and the pelvis with the skin and flesh parts displayed
transparently. The initial distance from the lap belt on the abdominal skin surface (in the sagittal plane) to the
pelvis (anterior ilium) was greater in the obese occupant due to the thick soft tissue. When the pelvis reached
the maximum forward displacement at 80 ms, the lap belt came close to the pelvis deflecting the soft tissue in
both occupants. The amount of soft tissue deflection of the non‐obese occupant was approximately 60 mm
while that of the obese occupant was approximately 90 mm. In both occupants, the lap belt was engaged by the
pelvis (anterior ilium) at 80 ms.
Fig. 9. Comparison of lap belt – pelvis interactions between non‐obese and obese occupants.
Fig. 10 compares the force‐displacement curves of the two occupant models. The top left plot shows the head
to airbag contact force in the vertical axis and the head (COG) forward displacement in the horizontal axis. The
maximum displacement of the obese occupant was greater than that of the non‐obese occupant but there was
no significant difference between the maximum force levels. The top right plot shows the chest to shoulder belt
contact force and the T8 forward displacement. The two models generated similar force‐displacement profiles.
The maximum force value was 5.0 kN in the non‐obese case while 6.4 kN in the obese case. The bottom left plot
shows the chest to airbag contact force and the T8 forward displacement. The maximum force value of the
obese occupant (5.8 kN) was significantly higher than that of the non‐obese occupant (2.5 kN). The bottom right
plot shows the pelvis to lap belt contact force and the pelvis (HP) forward displacement. The maximum force
value of the non‐obese occupant was 8.7 kN while that of the obese occupant was 15.3 kN. Table II summarises
the injury indicator values of the two models. Note that the neck injury indicator was not calculated because
moment values were not directly obtained from the elements. The injury indicator values of the obese occupant
were basically higher than those of the non‐obese occupant.
Fig. 11 shows the distribution of maximum principal strain of the brain and the internal organs in the two
models at 90 ms. The strain level is displayed as contour in which the red colour indicates a high strain level
while the blue colour indicates a low level. A value of 1.0 corresponds to the reference value. The strain level in
the liver of the obese occupant was higher than that of the non‐obese occupant.
IRC-17-19 IRCOBI Conference 2017
-97-

Fig. 10. Comparison of force‐displacement curves between non‐obese and obese occupants.
TABLE II INJURY INDICATOR VALUES IN FRONTAL COLLISIONS
Injury Indicator Non‐obese Occupant Obese Occupant
HIC15 250 497
Chest Deflection 24 % 36 %
Femur Force – Left 1.3 kN 2.9 kN
Femur Force – Right 3.4 kN 3.7 kN
Fig. 11. Distribution of maximum principal strain of brain and internal organs of non‐obese and obese occupant
models at 90 ms. A high strain level was noted in the liver of the obese occupant model.
Pole Side Impact Simulations
Fig. 12 compares the impact kinematics of the non‐obese and obese occupant models in a frontal view. Time
frames of 20, 40 and 60 ms were selected for comparison. The initial gap between the obese occupant and the
IRC-17-19 IRCOBI Conference 2017
-98-
door trim was shorter than that of the non‐obese occupant as described before. Both the side airbag and the
curtain airbag deployed in the frame of 20 ms. The deployed geometries of the curtain airbags were similar. The
side airbag was hidden by the left arm at 40 ms and later in both cases. There was no significant difference in
body kinematics between the two cases. Table III summarises the maximum lateral displacement values of the
two occupants.
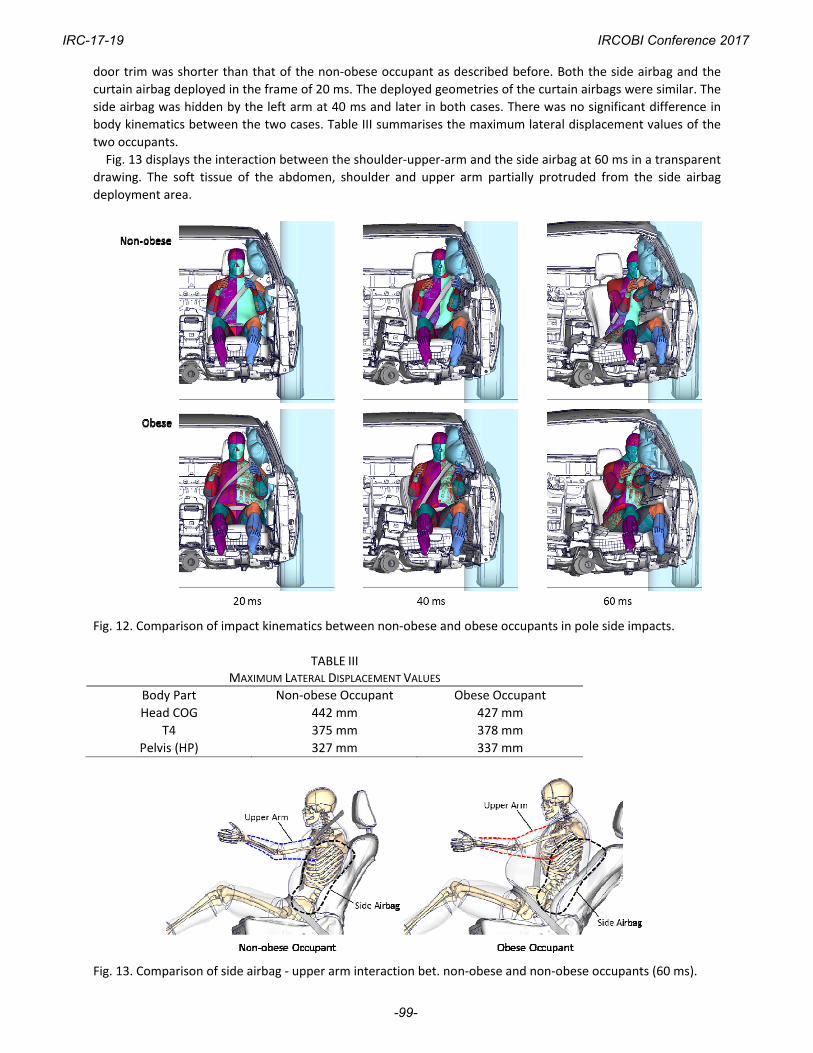
Fig. 13 displays the interaction between the shoulder‐upper‐arm and the side airbag at 60 ms in a transparent
drawing. The soft tissue of the abdomen, shoulder and upper arm partially protruded from the side airbag
deployment area.
Fig. 12. Comparison of impact kinematics between non‐obese and obese occupants in pole side impacts.
TABLE IIIMAXIMUM LATERAL DISPLACEMENT VALUES
Body Part Non‐obese Occupant Obese Occupant
Head COG 442 mm 427 mm
T4 375 mm 378 mm
Pelvis (HP) 327 mm 337 mm
Fig. 13. Comparison of side airbag ‐ upper arm interaction bet. non‐obese and non‐obese occupants (60 ms).
IRC-17-19 IRCOBI Conference 2017
-99-

Fig. 14 compares force‐displacement curves of the two occupant models. The top left plot shows the head to
curtain airbag contact force in the vertical axis and the head (COG) lateral displacement in the horizontal axis.
There was no significant difference between the two curves. The top right plot shows the chest‐arm to side
airbag and door trim contact force in the vertical axis and the T4 lateral displacement in the horizontal axis. The
maximum force value was 9.3 kN in the non‐obese case while it was 14.0 kN in the obese case. The bottom plot
shows the pelvis to side airbag and door trim contact force in the vertical axis and the lateral displacement of
the pelvis in the horizontal axis. The maximum force value of the obese occupant (14.4 kN) was significantly
higher than that of the non‐obese occupant (9.3 kN). Table IV summarises the injury indicator values of the two
models. The injury indicator values of the obese occupant were basically higher than those of the non‐obese
occupant. Fig. 15 compares the maximum deflection ratios of the left ribs from rib01 to rib12 in both occupants.
The obese occupant showed greater deflection ratios for almost all the ribs. Deflections of the superior ribs
(rib03 – rib07) of the obese occupant were significantly higher than those of the non‐obese occupant.
Fig. 14. Comparison of force‐displacement curves between non‐obese and obese occupants.
TABLE IV INJURY INDICATOR VALUES IN POLE SIDE IMPACTS
Injury Indicator Non‐obese Occupant Obese Occupant
HIC36 160 249
Chest Deflection 26 % (Rib 9) 46 % (Rib 6)
Abdomen Force 8.9 kN 14.5 kN
Pubic Force 1.6 kN 2.2 kN
IRC-17-19 IRCOBI Conference 2017
-100-

Fig. 15. Comparison of maximum rib deflection ratios between non‐obese and obese occupants.
IV. DISCUSSION
The greater excursion of the obese occupant in the frontal collision simulation was consistent with that
observed in the PMHS tests [7]. There were two factors considered to explain the increase in excursion. One was
the late pelvis engagement by the lap belt. The restraining force from the lap belt was first used to deflect the
thick soft tissue of the abdomen before engaging the pelvis. The late pelvis engagement allowed a large forward
excursion. The other factor was the body weight. A heavier body requires greater displacement and a higher
force to absorb the kinetic energy. This was the reason for the further forward displacement of the pelvis during
the second half. The lap belt force basically increased with the forward displacement of the pelvis. Despite the
large displacement, the pelvis of the obese occupant model finally stopped by the knee airbag before reaching
the front end of the seat. The previous study on the lap belt position suggested that obese occupants tended to
place the belt higher than the pelvis [9]. The simulation results indicated a possibility to help reduce the pelvis
displacement by restraining the knee for obese occupants. The shoulder belt force was limited by the load
limiter to 4 kN. (Note that the contact force exceeded that value due to the increase in contact area for both
occupants.) The limited shoulder force was not high enough to stop the upper body of the obese occupant in
the simulated case. The chest came close to the steering hub, compressing the airbag and raising the contact
force. High contact force to the chest resulted in large chest deflection and high strain levels in the liver.
In the pole side impact, there was no significant difference in maximum lateral displacement between the
non‐obese and obese occupants despite the difference in initial gap. The body weight factor commonly worked
in the pole side impact (large kinetic energy). However, the thick soft tissue worked to increase the contact area
between the occupant body and the door trim. Greater contact force was generated in the obese occupant
despite the similar amount of lateral displacement to that of the non‐obese occupant. The kinetic energy of the
obese occupant was well absorbed by the large contact force within the same amount of displacement with that
of the non‐obese occupant. However, when the upper arm was entrapped by the door trim, it pushed the body
of the occupant rearwards. The incompressive thick soft tissue around the upper arm of the obese occupant
generated large deflections of the superior ribs. The crash injury research and engineering network data and
showed that occupants with a normal BMI were more likely to sustain pelvis fracture compared with overweight
and obese occupants in nearside impacts [5]. The large amount of force applied to the pelvis, as shown in Fig. 14,
was considered to be a factor raising the pelvis fracture risk.
The results of the study indicate that the thick fat tissue of the obese occupant as well as the body weight
potentially influence injury risk in both frontal and lateral collisions. There is a possibility that restraint systems
such as seatbelts and airbags could not stop the body of an obese occupant within the same displacement or
within the same restraining force as for a non‐obese occupant. Further research is necessary to discover a
solution compatible with different body size occupants. The study has the following limitations. The body
geometry of the obese occupant model was not generated from an actual subject but from increasing the
dimensions and volume. The validity of injury prediction with the obese occupant model was not fully examined.
The study assumed equivalent injury tolerance of hard and soft tissue for the non‐obese and obese occupants.
The impact kinematics of the obese occupant model in lateral collisions were not verified. The study assumed
particular sitting posture and position for each occupant model while they vary among individuals and in
IRC-17-19 IRCOBI Conference 2017
-101-

situations. Interaction with restraint systems is also influenced by such factors.
V. CONCLUSIONS
An FE model of an obese male occupant with a BMI of 35 kg/m2 was generated by adding soft tissue to the non‐obese (THUMS Version 4 AM50) occupant model. Vehicle frontal collision simulations and pole side impact simulations were conducted using the non‐obese and obese occupant models. Impact kinematics and injury responses were compared between the two models. The obese occupant exhibited a greater forward excursion than the non‐obese in the frontal impact. Pelvis engagement by the lap belt was delayed due to the thick soft tissue of the abdomen. The injury values of the obese occupant were higher than those of the non‐obese occupant. In the pole side impact simulation, there was no significant difference in maximum lateral displacement between the non‐obese and obese occupants despite the difference in initial gap. The thick fat tissue of the obese occupant body raised the contact force with the door trim increasing the contact area. However, the thick soft tissue around the upper arm loaded the superior chest when entrapped by the door trim. As a result, greater deflection was observed in the superior ribs of the obese occupant.
VI. ACKNOWLEDGEMENT
The authors thank Tomoyuki Ito, Noriyuki Fujita and Takao Matsuda of Advanced CAE Div. of Toyota Motor
Corporation, Japan, for assistance in modelling and simulations.
VII. REFERENCES
[1] World Health Organization. Obesity and overweight. Internet: http://www.who.int/mediacentre/fact sheets/fs311/en/, June 2016.
[2] Mock C, Grossman D, Kaufman R, Mack C, Rivara F. The relationship between body weight and risk of death and serious injury in motor vehicle crashes. Accident Analysis & Prevention, March 2002, Vol. 34(2): 221‐228.
[3] Viano D, Parenteau C. Crash Injury Risks for Obese Occupant. Technical Paper 2008‐01‐0528. Proceedings of the SAE International Congress and Exposition, 2008, Detroit, USA.
[4] Wang S. Growing Obesity: Concerning Implications for the Burden from Crash Injury. Technical Paper 2007‐08‐0140, Proceedings of 2007 JSAE Spring Conference, 2007, Yokohama.
[5] Bansal V, Concry C, Lee J, Schwartz A, Tominaga G, Coimbra R. Is bigger better? The effect of obesity on pelvic fractures after side impact motor vehicle crashes. Journal of Trauma, 2009, Vol. 67(4): 709‐714.
[6] Michaelson J, Forman J, Kent R, Kuppa S. Rear seat occupant safety: kinematics and injury of PMHS restrained by a standard 3‐point belt in frontal crashes. Stapp Car Crash Jouirnal, 2008, Vol. 52: 295‐325.
[7] Forman J, Lopez‐Valdes FJ, Lessley D, Kindig M, Kent R, Bostrom O. The effect of obesity on the restraint of automobile occupants. Ann Adv Automot Med, 2009, Vol. 53: 25‐40.
[8] Shi X, Cao L, Reed M, Rupp R, Hu J. Effects of obesity on occupant responses in frontal crashes: a simulation analysis using human body models. Computer Methods in Biomechanics and Biomedical Engineering, Vol. 18: 1280‐1292, Taylor & Francis, Massachusetts, United States, 2016.
[9] Reed M., Ebert M., Hallman J. Effect of obesity on seat belt fit. Traffic Injury Prevention, 13: pp. 364‐372. [10] Lee D, Lee I, Kim S, Kim H, Kim T, Shaw G. A parametric study of submarining for obese female passengers
using morphed human body models. Proceedings of 2016 IRCOBI Asia Conference, 2016, Seoul. [11] Ida H, Aoki M, Asaoka M, Mizuno K, Hitosugi M. Analysis of abdominal injuries in obese and nonobese
restrained occupants. Technical Paper 13‐0236, Proceedings of 23rd ESV Conference, 2013, Soul. [12] Pal C, Okabe T, Vimalathithan K, Muthanandam M, Manoharan J, Narayanan S. Estimation of body mass
index effect on lower extremity injuries for lateral collision without airbag, Technical Paper 2016‐01‐0489, Proceedings of the SAE International Congress and Exposition, Society of Automotive Engineer.
[13] Kent R, Lee SH, Darvish K, Wang S, Poster C, Lange A, Brede C, Lange D, Matsuoka F. Structural and material changes in the aging thorax and their role in crash protection for older occupants. Stapp Car Crash Journal, 2005, Vol. 49: 231‐249.
[14] Ross R, Shaw K, Rissanen J, Martel Y, Guise J, Avruch L. Sex differences in lean and adipose tissue distribution by magnetic resonance imaging anthropometric relationship, The American Journal of Clinical Nutrition, 1994, Vol. 59(6): 1277‐1285.
IRC-17-19 IRCOBI Conference 2017
-102-

[15] Shigeta K, Kitagawa Y, Yasuki T. Development of next generation human FE model capable of organ injury prediction. Technical Paper 09‐0111, Proceedings of 21st ESV Conference, 2009, Washington D.C.
[16] Kitagawa Y, Yasuki T. Correlation among seatbelt load, chest deflection, rib fracture and internal organ strain in frontal collisions with human body finite element models. Proceedings of 2013 IRCOBI Conference, 2013, Gothenburg.
[17] Watanabe R, Miyazaki H, Kitagawa Y, Yasuki T. Research of the Relationship of Pedestrian Injury to Collision Speed, Car‐type, Impact Location and Pedestrian Sizes using Human FE Model (THUMS Version 4). Stapp Car Crash Journal, 2012, Vol. 56: 269‐321..
[18] Kroell C, Schneider D, Nahum A. Impact tolerance and response of the human thorax. Technical Paper 710851, Proceedings of the SAE International Congress and Exposition, 1971, Detroit.
[19] Kroell C, Schneider D, Nahum A. Impact tolerance and response of the human thorax II. Technical Paper 741187, Proceedings of the SAE International Congress and Exposition, 1974, Detroit.
[20] Joodaki H, Forman J, Forghani A, Overby B, Kent R, Crandall J, Beahlen B, Beebe M, Bostrom O. Comparison of kinematic behavior of a first generation obese dummy and obese PMHS in frontal sled tests. Proceedings of 2015 IRCOBI Conference, 2013, Lyon.
IRC-17-19 IRCOBI Conference 2017
-103-

![IRC-19-92 IRCOBI conference 2019Martin Östling, Hanna Jeppsson, Nils Lubbe IRC-19-92 IRCOBI conference 2019 626 validated [21] a deterministic analysis method to predict future road](https://img.pdfslide.us/doc/110x75/60a56309ab4a3f476a041ce0/irc-19-92-ircobi-conference-martin-stling-hanna-jeppsson-nils-lubbe-irc-19-92.jpg)