Embed Size (px)
Citation preview

Comparison of Genetic Risk FactorsBetween Two Type II Diabetes Subtypes
Item Type text; Electronic Thesis
Authors Schader, Lindsey Marie
Publisher The University of Arizona.
Rights Copyright © is held by the author. Digital access to this materialis made possible by the University Libraries, University of Arizona.Further transmission, reproduction or presentation (such aspublic display or performance) of protected items is prohibitedexcept with permission of the author.
Download date 31/05/2018 18:18:07
Link to Item http://hdl.handle.net/10150/595048
COMPARISON OF GENETIC RISK FACTORS BETWEEN TWO TYPE II DIABETES SUBTYPES
By
LINDSEY MARIE SCHADER
UND SDL
A Thesis Submitted to the Honors College
In Partial Fulfillment of the Bachelors degree With Honors in
Biology
THE UNIVERSITY OF ARIZONA
DECEMBER 2015
Approved by:
. .
Dr. Yann Klimentidis Department of Epidemiology and Biostatistics

Abstract
Type 2 Diabetes (T2D) is an extremely heterogeneous disease, and the heritability of T2D is not
fully accounted for. This study seeks to determine T2D subtypes based on clinical features
before T2D diagnosis, and to test whether genetic risk factors differ between the subtypes. A
sample of 13,459 White, GWAS study participants was obtained from FRAM, MESA, and ARIC.
This sample consisted of 832 cases (individuals who developed T2D during follow-up) and
12,066 controls (did not develop T2D). K-means clustering was used to cluster individuals in the
cases dataset based on metabolic and anthropometric characteristics. Cox proportional hazards
models were used to test whether T2D genetic risk factors differed between the groups. The
clustering analysis resulted in two clusters with cluster one consisting of a higher percentage of
women with higher WHR, lower HDL, and higher FI as compared to cluster two. There were no
statistically significant differences between the genetic risk factors of the two clusters. The
most significant differences in genetic risk factors were associated with adiposity, suggesting
some interaction between adiposity genes and the characteristic phenotypes of each cluster on
T2D development. Further research is needed to replicate subtypes and to find significant
genetic associations.
1
Introduction
Type 2 Diabetes (T2D) is an increasingly prevalent disease worldwide. In 2014 9.3% of the U.S.
population suffered from the disease (1), and it is projected that there will be around 300
million diabetes cases in 2025 (2). In addition, diabetes was the seventh leading cause of death
in the U.S. in 2010 (1). Diabetes along with its associated health complications cost the United
States a total of $245 billion in 2012, with $176 billion in direct costs (1). T2D is characterized
by the body’s inability to control blood glucose levels, which can lead to multiple health
problems including kidney failure, heart disease, hypoglycemia, hyperglycemia, eye problems,
and amputations, among others (1). Clearly diabetes is of epidemic proportions, and it is a
major health concern for the United States and the rest of the world.
In contrast to T1D which is characterized by the autoimmune destruction of pancreatic beta-
cells, T2D is an extremely heterogeneous disease characterized by either abnormal production
of insulin or insulin resistance (3). Some researchers consider the categorization of T2D as a
single disease entity to be a major error due to the large heterogeneity of the disease. T2D
exists on a continuum between insulin-resistant obese patients to insulin-deficient lean patients
(4), and patient phenotypes tend to differ in insulin dependency, metabolic characteristics, and
the presence of GAD antibodies (5). As a result of the phenotypic and genetic heterogeneity of
T2D, the disease is difficult to diagnose. T2D is typically diagnosed based on diabetes patients
simply not meeting the diagnosis criteria for other forms of the disease (6). Due to this
heterogeneity, researchers have suggested that there may be multiple subtypes of the disease.

2
Identifying such subtypes would improve diagnostic tools, and currently research is underway
to identify these subtypes.
Recent research has focused upon identifying T2D subtypes based on different physical
characteristics of patients. Faerch et. al grouped T2D patients based on their fasting insulin and
two hour glucose serum concentrations and found that these groups of patients had differing
trajectories of multiple phenotypic measurements such as beta-cell functioning and risk of
cardiovascular disease (7). More recently, Bapat et al. identified an increased level of Treg cells
(cells involved in immune responses and inflammation) in mice with age-associated T2D as
compared to healthy mice and mice with obesity-associated T2D. They also found that blocking
the growth of these Treg cells in mice prevented age-associated insulin resistance, suggesting a
major etiological difference between T2D patients (8). In addition to these studies, recent
research has used mathematical tools for grouping patients based on multiple characteristics.
One common method, called k-means clustering, has been used to classify different subtypes of
Parkinson’s disease as well as to group individuals based on their metabolic characteristics for
targeted nutritional advice (9,10). The use of clustering to subgroup T2D patients is very
limited. One study published in Science Translational Medicine used topological analysis to
create subgroups of T2D patients based on 73 clinical features. This process resulted in three
subgroups of T2D patients with differing genetic associations between the groups (11). Despite
this study, and other studies that focus on the genetics of T2D, only 15% of the heritability of
T2D has been explained, while around 80% of the heritability of T1D has been accounted for
(6). Even with these promising results on subtyping and the genetics of T2D, a comprehensive
picture is still lacking that includes both the genetics and the etiology of T2D.

3
The objective of our study is to cluster patients who continue on to develop T2D into distinct
subtypes and to test whether genetic risk factors differ between the two subtypes. This analysis
will allow us to identify genes that play a role in T2D development, but were previously
unidentified due to their effect on only one subgroup of T2D patients. This research is clinically
useful because it allows us to further understand the heterogeneity of T2D and thus to create
individualized treatments (4). In addition, the identification of genetic risk factors will allow us
to learn more about the etiology of T2D by performing research on the molecular functions of
any genes identified. Lastly, the ability to cluster patients based on phenotypic characteristics
before T2D development allows us to more accurately estimate disease risk by allowing us to
consider physical characteristics and genetics jointly for pre-diabetic patients. Currently, genetic
risk scores (GRS), or models that use genetic data as inputs to estimate disease risk, are used to
estimate patient risk for T2D. Some of these models also incorporate physical characteristics
(12). Our analysis allows us to more accurately describe how the physical environment and
genetics interact to lead to T2D development, by creating subtypes of patients based on
physical characteristics and by determining whether some genes cause increased risk of T2D for
a certain subtype.
Methods
Studies
We used data on 13,459 GWAS study participants obtained from the Framingham Heart Study
(FRAM), the MESA SHARe Study (MESA), and the Atherosclerosis Risk in Communities study
4
(ARIC). The first study, FRAM was conducted to identify risk factors for cardiovascular disease.
The data used in our study was from the offspring cohort which consisted of men and women
ages 30 to 62 years living in Framingham, Massachusetts. The phenotypic data used in our
study was from visit four of the FRAM Offspring cohort (13). The second study, MESA, was a
prospective cohort study with the purpose of investigating cardiovascular disease. The
genotyped cohort used in our study consisted of men and women ages 45 to 84 years from six
different communities across the United States (14). The last study, ARIC is another prospective
study with the aim of identifying the causes and clinical outcomes of atherosclerosis. The
cohort component used from this study consisted of men and women ages 45 to 64 years from
four communities across the United States (15).
The data on self-declared white participants from all three of these studies was compiled to
create our cohort. All individuals with prevalent T2D at the initiation of data collection were
excluded from the study, and subjects were divided into cases and controls. Cases consisted of
those individuals who developed T2D over the course of follow-up, while controls were subjects
who did not develop T2D over the course of follow-up. Among the cases we excluded
individuals on cholesterol-lowering or hypertension medication along with anyone with missing
values for the phenotypic variables of interest. The final cases dataset consisted of 178 FRAM
participants, 109 MESA participants, and 545 ARIC participants, for a total of 832 individuals.
The control dataset consisted of 2,602 FRAM participants, 2,119 MESA participants, and 7,345
ARIC participants, for a total of 12,066 individuals.

5
Phenotypes
The phenotypes chosen for clustering included the important metabolic and anthropometric
measurements that were available in all three studies. These variables included sex, body-mass
index (BMI), waist-to-hip ratio (WHR), triglycerides (TG), high-density lipoprotein (HDL), fasting
glucose (FG), fasting insulin (FI), total cholesterol (TC), systolic blood pressure (SBP), and
diastolic blood pressure (DBP). These phenotypes are common measurements used in risk
scores for predicting T2D development (12). Further glucose, total cholesterol, and triglyceride
levels have all been determined to be important indicators of metabolic health (10). The units
of measurement for TG, HDL, FI, and FG differed between the studies. To control for any
variation between studies, all phenotypic variables were scaled in the cohort dataset before
clustering analysis.
Genotypes
600 SNPs were selected for analysis along with 22 genetic risk scores (GRS). GRS were
calculated for the phenotypes of T2D, FI, FG, two hour glucose (THG), proinsulin (PRO), SNPs
relating to HbA1c (HBA), low levels of adiponectin (ADPN), BMI, WHR, TC, low-density
lipoprotein (LDL), HDL, adiposity (FAT), C-reactive protein (CRP), serum urate (URATE), blood
pressure (BP), insulin resistance (IR), beta-cell function (BC), WHR adjusted BMI, and
triglycerides (TG). GRS risk scores were calculated as weighted averages of alleles that have
been previously identified as risk alleles for the corresponding phenotypes.
6
Clustering Method
K-means clustering was used to create clusters of T2D patients from our cases cohort. The k-
means clustering method is a partitioning method where participants are grouped based on a
pre-specified number of clusters. In the initial stage, cluster membership is determined by
Euclidian distance from randomly chosen points. Then the mean of the clusters formed are
calculated and the shorter Euclidian distance from the cluster mean is used to determine new
clusters. This process is reiterated for a specified number of times or until stability (9). The
variables selected for the clustering analysis are listed in the phenotype section of this paper,
and all were measured before the patient was diagnosed with T2D. All phenotypic variables
were standardized, so one variable did not carry more weight than another in the analysis
based on the unit of measurement. Optimal cluster number was determined using the 2.0-10
version of the cascadeKM function from the package Vegan in R. The calinski method argument
was used, as determined most appropriate by Milligan et al. (16). An optimal cluster number of
two was determined by this method. For the clustering portion of analysis the k-means function
in R was used on our dataset of T2D cases only. The default algorithm of Hartigan and Wong
(1979) was used, and the argument of 25 repetitions was implemented in order to avoid local
optimal solutions.
To determine whether the clusters obtained were significantly different from one another a t-
test between means of the two clusters for all the phenotypic variables of interest was
performed.

7
Statistical Analyses
To test whether genetics has differing effects on T2D development between the two clusters a
Cox proportional hazards model was used to estimate the effects of genetics and cluster
membership upon the risk of T2D development over time. Two Cox proportional hazards
models were used for this analysis.
Primary Model
The first model was estimated on the cases only dataset. In this Cox proportional hazards
model, the outcome of hazard rate of T2D development was regressed upon cluster
membership, where cluster membership was included as an ‘as.factor’ variable, and an
interaction term between cluster membership and a genetic variable (SNP or GRS). This
interaction term was the coefficient of interest in our analysis as it conveys a difference in
genetic effects between the two datasets. The main effects of age, sex, and the genetic variable
were included in this model as control variables.
Secondary Model
coxph(Surv(time to development, diabetes incidence)~SNP (or GRS) + Age + Sex + as.factor(cluster)
+ as.factor(cluster)*SNP(or GRS), data = both clusters )
8
The second analysis consisted of running a Cox proportional hazards model on two separate
datasets. The first dataset consisted of members of the first cluster and all controls. The second
dataset consisted of members of the second cluster and all controls. A genetic variable (SNP or
GRS) was used as an input variable into the model, and the hazard rate of T2D development
was used as the output. Age and sex were controlled for. This model was estimated for both
datasets and the difference between their coefficients for the genetic variables was evaluated
to indicate the differing effects of SNPs and GRSs between the two clusters.
These models were run for all SNP and GRS of interest.
Results
A summary of phenotypic characteristics of the cases are shown in Table 1. The Calinski-index
algorithm determined that two clusters was the optimal cluster number for our cases dataset.
After performing k-means clustering in R, we obtained two clusters with significant differences
between cluster means for nine out of the eleven clustering variables as determined by a t-test
between cluster means (Table 2). The first cluster (C1) consists of mostly women with a higher
WHR, lower HDL, and higher FI than cluster 2 (C2) which consisted of mostly men with lower
WHR, higher HDL, and lower FI. The differences between the age and total cholesterol
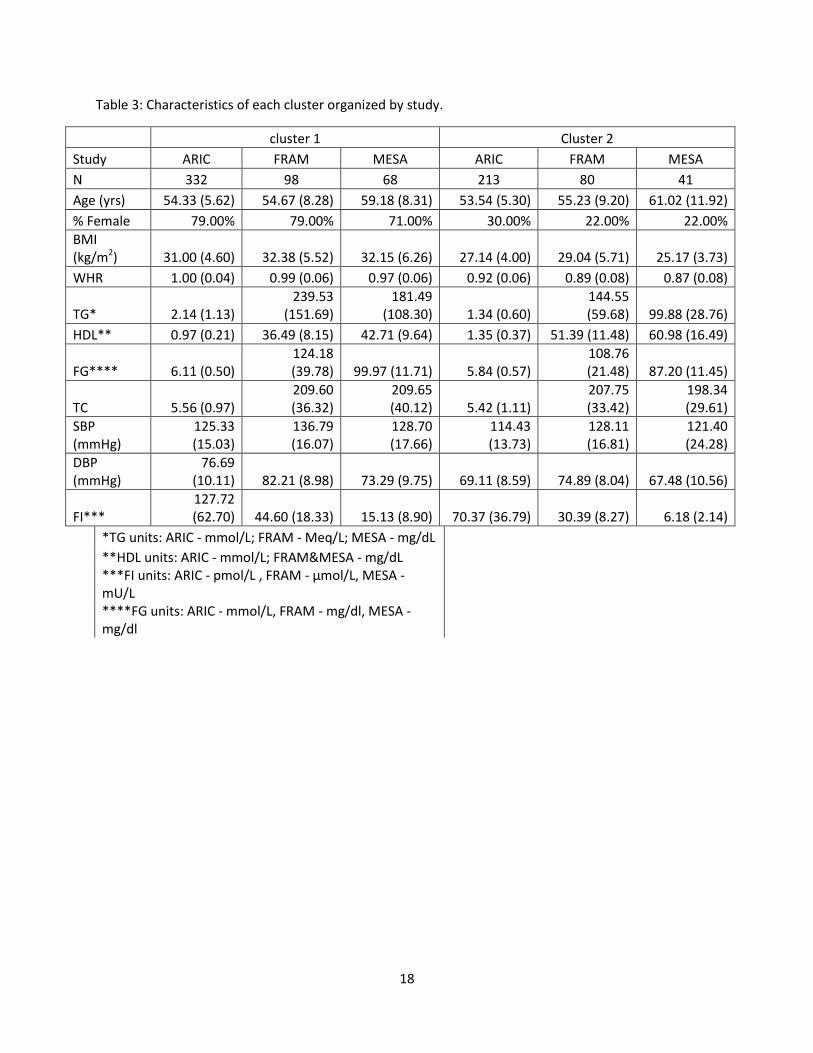
phenotypes were insignificant between the clusters. Summary statistics of the phenotypic
characteristics of each cluster may be found in Table 3.
coxph(Surv(time to development, diabetes incidence)~ SNP(or GRS) +Age + Sex, data=cluster 1 or 2)
9
After clustering was performed, we fit our primary model to the cases only dataset. This model
consists of a Cox proportional hazards model with cluster membership coded for as an
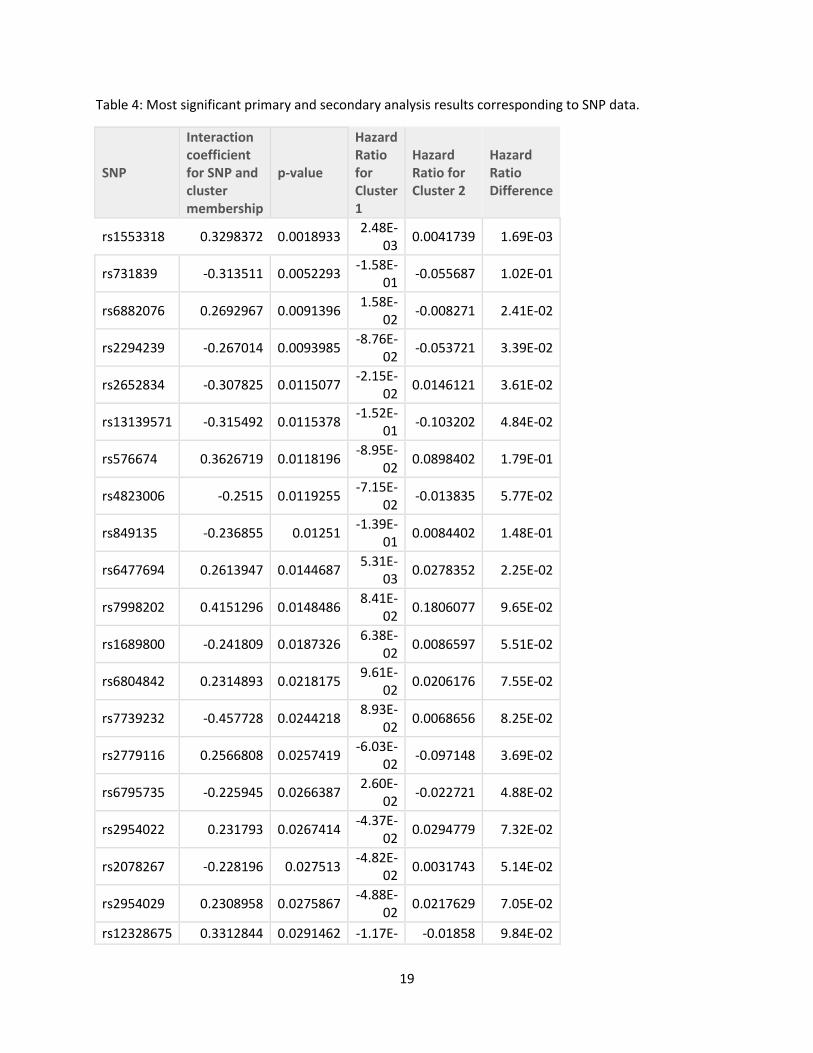
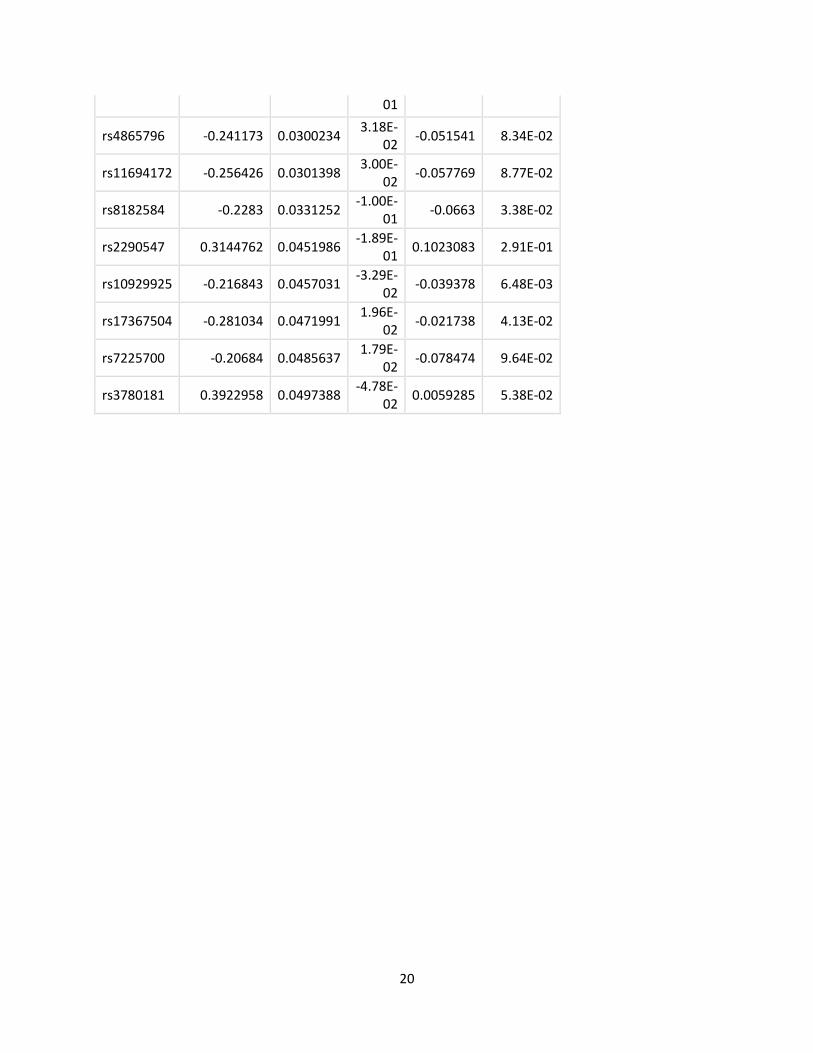
‘as.factor’ variable. The most significant results of this analysis are listed in Table 4 (SNP) and
Table 5 (GRS). This model did not generate any statistically significant coefficients for the
interaction between cluster membership and genotype characteristic (SNP or GRS). The top five
most significant SNPs were rs1553318, rs731839, rs6882076, rs2294239, and rs2652834. These
SNPS relate to TG, TG, LDL, WHR, and HDL respectively. Furthermore, the most significant GRS
scores identified were FAT and TG. Our secondary Cox proportional hazards model was run on
the clustering datasets separately, to see what effects certain genetic characteristics had on
T2D development. The result of interest in this model is the coefficient corresponding to the
genetic characteristic in each cluster model and how they differ between the two clusters.
These results are summarized in Table 4 for the top 20 most significant SNPs identified by our
primary model and in Table 5 for all the GRS scores tested. The genes that the 20 most
significant SNPs correspond to are listed in Table 6.
Discussion
The objective of our study was to identify subtypes of individuals who go on to develop T2D and
to determine whether the role of specific genetic factors differs between the two groups. Our
cluster analysis resulted in two groups of phenotypically distinct patients. C1 was generally
characterized by women with higher WHR, lower HDL, and higher FI, as compared to C2 which
consisted mostly of men with lower WHR, higher HDL, and lower FI. Although there were no
10
statistically significant findings on differing genetic effects between the two groups, we did
identify some associations of interest that may be explored in future research. Both the most
significant SNPs and the most significant GRS scores relate to adiposity, suggesting a differing
interaction between the phenotypes that characterize each cluster and adiposity-related
genotypes.
Although our two clusters were distinct from one another, they do not reflect the disease
subtypes that have been found in recent research. One recent study identified that there is a
physiological difference between patients that have age-associated onset of T2D versus
obesity-associated onset of the disease. They found that altering Treg cells in mice prevented
age-associated onset of T2D while obesity-associated onset of T2D had no association with Treg
cells (8). Our clusters did not reflect these different subtypes of T2D. C1 had a slightly higher
age on average (55.06 vs. 54.86 years) but the difference is not significant. It is true that many
measurements of metabolic health differed between the two groups, but there is not a clear
distinction between late age of onset and obesity-related T2D. Another study, more similar to
our analysis, looked at subtyping T2D patients based on multiple phenotypic characteristics
using a topological approach. This study had more power to identify subtypes than our study
due to their wealth of phenotypic data (73 variables included in clustering) and large sample
size of 11,210 T2D patients. This analysis yielded three subtypes. The first subtype was
characterized by young, overweight patients, the second was characterized by low-weight
patients, while the third group of patients had high SBP, serum chloride, and troponin I levels.
These subtypes also do not reflect the subtypes discovered in our analysis or the analysis of
other researchers, and the detailed differences between their three subtypes included
11
metabolic measurements that were not available in our data, such as white blood cell count
and serum albumin (11). Current research is focusing on disease subtyping of T2D because the
disease is so heterogeneous, but our study, along with others does not create a clear consensus
on distinct subtypes.
In addition to the unique subtypes delineated by our analysis, some interesting genetic trends
were identified that reflect some current T2D research. The two most significant SNPs identified
in our analysis are both related to TG levels. The first SNP, rs1553318, is associated with the
HAVCR1 gene. This SNP increased the risk of T2D development in both clusters, but more so in
C2. The second SNP, rs731839, is near the PEPD gene. This SNP was associated with increased
T2D risk in C1 and decreased risk in C2. It is of interest that both SNPs are associated with TG
because the pre-diabetic state is characterized by elevated TG levels (a characteristic of
dyslipidemia). Furthermore, TG levels can be used to predict T2D risk, and one study found that
looking at the change in TG levels over time helped predict T2D risk in men (17). In addition to
the effects of TG on T2D risk, some research suggests that there is an association between a
certain variant of the PEPD gene and T2D development. A recent GWAS study on Chinese Hans
found that higher levels of n-3 fatty acids help mitigate the increased risk of T2D development
caused by the PEPD gene (18). This corresponds to our results where PEPD had a protective
effect against T2D development in C2, since C2 is characterized by lower TG levels ( associated
with high n-3 fatty acid consumption) (19).
The third most significant SNP in our analysis, rs6882076, is near the TIMD4 gene which affects
LDL levels. This SNP increased the risk of T2D development in C1 while decreasing risk in C2.

12
Although LDL is not a major characteristic used in calculating T2D risk (12) because LDL levels do
not differ significantly between diabetics and non-diabetics, research has found that LDL
particles in T2D patients are typically smaller than those in their non-diabetic peers (20).The
results of our analysis suggest that there may be some association between the TIMD4 gene
and the environment that affects T2D development.
There are far reaching implications for T2D research that incorporates both disease subtype
and genetic risk. First, by identifying distinct subtypes of patients, one may create more
accurate models of disease risk that incorporate both physical characteristics and genetics. The
interaction between genes and the environment is complex, and it is not fully detailed in a
mathematical analysis. By identifying characteristics of subgroups, researchers can gain a better
understanding of what traits may be involved in disease pathways and focus their research in
these areas. This may lead to a greater understanding of the disease itself and targeted
diagnosis and treatment based on disease subtype. The goal is to find distinct subtypes of the
disease that may be clearly defined and then to identify the metabolic pathways involved.
Our study had a number of limitations that prevented us from determining whether the
patients were clustered into truly distinct subtypes and which made it challenging to find
statistically significant results. First, we were not able to test whether the clusters could be
recreated in another dataset to confirm our findings. Further, our cohort was small for a genetic
analysis (only 832 T2D cases) because we removed all people on cholesterol lowering
medication and hypertension medication. Lastly, our cohort included only whites, so the results
may not be generalizable to other populations. Despite these weaknesses, our study has

13
multiple strengths including the inclusion of multiple studies which provided a wide range of
phenotypic and genetic data. In addition, the use of k-means clustering is not a common
method in the T2D literature, but its use has found successful subtypes for Parkinson’s disease
(9) and is therefore a promising method for disease subtyping.
Future research should focus upon replicating these subtypes in another cohort and including
more variables and subjects in the clustering analysis. Once clustering analyses produce
replicable results, thereby identifying distinct subtypes of T2D, animal models may be used to
further understand the disease etiology. There is still much to explore regarding how genetics
and the environment interact to influence the development of this disease.
14
References
1. National Diabetes Statistics Report, 2014. Centers for Disease Control and Prevention:
National Center for Chronic Disease Prevention and Health Promotion: Division of
Diabetes Translation. 2014;1-11.
2. King H, Aubert R, Herman W. Global Burden of Diabetes, 1995-2025. Diabetes Care.
1998;21:14141-1431.
3. Zimmet P, Albertit KGMM, Shaw J. Global and societal implications of the diabetes
epidemic. Nature. 2001;414(6865):782-787.
4. Gale EAM. Is type 2 diabetes a category error? The Lancet. 2013;381(9881):1956-1957.
5. Tuomi T, Santoro N, Caprio S, Cai M, Weng J, Groop L. The many faces of diabetes: a
disease with increasing heterogeneity. The Lancet. 2014;383(9922):1084-1094.
6. Groop L, Pociot F. Genetics of diabetes – are we missing the genes or the disease?
Molecular and Cellular Endocrinology. 2014;382(1):726-739.
7. Faerch K, Witte DR, Tabak AG, Perreault L, Herder C, et al. Trajectories of
cardiometabolic risk factors before diagnosis of three subtypes of type 2 diabetes: a
post-hoc analysis of the longitudinal Whiehall II cohort study. The Lancet Diabetes and
Endocrinology. 2013;1(1):43-51.
8. Bapat SP, Suh JM, Fang S, Liu S, Zhang Y, et al. Depletion of fat-resident Treg cells
prevent age-associated insulin resistance. Nature. 2015;528(7580):137-141.
9. Van Rooden SM, Heiser WJ, Kok JN, Verbaan D, van Hilten JJ, Marinus J. The
identification of Parkinson's disease subtypes using cluster analysis: a systematic
review. Movement Disorders. 2010;25(8):969–978.

15
10. O’Donovan CB, Walsh MC, Nugent AP, McNulty B, Walton J, et al. Use of metabotyping
for the delivery of personalized nutrition. Molecular Nutrition and Food Research.
2014;59(3):377-385.
11. Li L, Cheng W, Glicksberg BS, Gottesman O, Tamler R, et al. Identification of type 2
diabetes subgroups through topological analysis of patient similarity. Science
Translational Medicine. 2015;7(311): 311ra174-3.
12. Noble D, Mathur R, Dent T, Meads C, Greenhalgh T. Risk models and scores for type 2
diabetes: systematic review. BMJ. 2011;343:d7163.
13. Framingham Heart Study. NHBI. 2015.
https://www.framinghamheartstudy.org/index.php.
14. About MESA. MESA Coordinating Center: University of Washington. 2015.
http://www.mesa-nhlbi.org/aboutMESA.aspx.
15. Atherosclerosis Risk in Communities Study. Collaborating Studies Coordinating Center.
Department of Biostatistics Gillings School of Global Public Health. North Carolina
Chapel Hill. 2015. https://www2.cscc.unc.edu/aric/desc.
16. Milligan GW, Cooper MC. An examination of procedures for determining the number of
clusters in a data set. Psychometrika. 1985;50(2):159-179.
17. Tirosh A, Shai I, Bitzur R, Kochba I, Tekes-Manova D, Israeli E. Changes in triglyceride
levels over time and risk of type 2 diabetes in young men. Diabetes Care.
2008;31(10):2032+.

16
18. Zheng JS, Huang T, Li K, Chen Y, Xie H, et al. Modulation of the Association between the
PEPD variant and the risk of type 2 diabetes by n-3 fatty acids in Chinese Hans. Jounral
of Nutrigenetics and Nutrigenomics. 2015;8(1):36-43.
19. Harris WS, Bulchandani D. Why do omega-3 fatty acids lower serum triglycerides?
Current Opinion in Lipidology. 2006;17(4):387-393.
20. Nesto RW. LDL cholesterol lowering in type 2 diabetes: what is the optimum approach?
Clinical Diabetes. 2008;26(1):8-13.

17
Table 1: Baseline characteristics of participants in each of three cohorts.
ARIC FRAM MESA
n 545 178 109
Age (yrs) 54.02 (5.51) 54.92 (8.69) 59.87 (9.81)
% Female 59.82% 53.37% 52.29%
BMI (kg/m2) 29.49 (4.76) 30.88 (5.84) 29.52 (6.40)
WHR 0.97 (0.06) 0.95 (0.09) 0.93 (0.08)
TG* 1.82 (1.04) 196.84 (128.23) 150.79 (95.71)
HDL** 1.12 (0.34) 43.19 (12.27) 49.58 (15.41)
FG**** 6.00 (0.54) 117.25 (33.65) 95.17 (13.13)
TC 5.50 (1.03) 208.77 (34.96) 205.39 (36.79)
SBP (mmHg) 121.07 (15.47) 132.88 (16.92) 125.95 (20.60)
DBP (mmHg) 73.73 (10.23) 78.92 (9.29) 71.10 (10.40)
FI*** 105.31 (60.86) 38.21 (16.28) 11.76 (8.36)
*TG units: ARIC - mmol/L; FRAM - Meq/L; MESA - mg/dL
**HDL units: ARIC - mmol/L; FRAM&MESA - mg/dL
***FI units: ARIC - pmol/L , FRAM - μmol/L, MESA - mU/L
****FG units: ARIC - mmol/L, FRAM - mg/dl, MESA - mg/dl
Table 2: Cluster phenotype comparisons via t-test.
Variable clust1mean clust1SD clust2mean clust2SD t-stat p-value
WHR_pheno 0.49058065 0.6669220 -0.72419048 0.9669827 20.0258690 2.456061e-67
HDL_pheno -0.46698033 0.6136599 0.68935191 1.0576818 -18.0838850 2.524972e-56
FI_pheno 0.38237082 1.0520284 -0.56445216 0.5506614 16.9133715 5.768705e-55
Sex 0.77620968 0.4172040 0.27678571 0.4480769 16.2165669 2.746904e-50
TG_pheno 0.31562379 1.1145907 -0.46592083 0.5232078 13.5651645 1.177836e-37
BMI_pheno 0.31943235 0.9644238 -0.47154299 0.8521667 12.4497415 1.460480e-32
DBP_pheno 0.29310623 0.9775874 -0.43268063 0.8646014 11.2642577 2.324341e-27
SBP_pheno 0.24978211 0.9528888 -0.36872597 0.9509042 9.1979556 3.866903e-19
FG_pheno 0.22054251 0.9732836 -0.32556276 0.9468849 8.0709721 2.857736e-15
TC_pheno 0.05963691 0.9818105 -0.08803544 1.0184503 2.0820662 3.769834e-02
Age 55.05443548 6.8291606 54.87500000 7.7795657 0.3426994 7.319345e-01
18
Table 3: Characteristics of each cluster organized by study.
cluster 1 Cluster 2
Study ARIC FRAM MESA ARIC FRAM MESA
N 332 98 68 213 80 41
Age (yrs) 54.33 (5.62) 54.67 (8.28) 59.18 (8.31) 53.54 (5.30) 55.23 (9.20) 61.02 (11.92)
% Female 79.00% 79.00% 71.00% 30.00% 22.00% 22.00%
BMI (kg/m2) 31.00 (4.60) 32.38 (5.52) 32.15 (6.26) 27.14 (4.00) 29.04 (5.71) 25.17 (3.73)
WHR 1.00 (0.04) 0.99 (0.06) 0.97 (0.06) 0.92 (0.06) 0.89 (0.08) 0.87 (0.08)
TG* 2.14 (1.13) 239.53
(151.69) 181.49
(108.30) 1.34 (0.60) 144.55 (59.68) 99.88 (28.76)
HDL** 0.97 (0.21) 36.49 (8.15) 42.71 (9.64) 1.35 (0.37) 51.39 (11.48) 60.98 (16.49)
FG**** 6.11 (0.50) 124.18 (39.78) 99.97 (11.71) 5.84 (0.57)
108.76 (21.48) 87.20 (11.45)
TC 5.56 (0.97) 209.60 (36.32)
209.65 (40.12) 5.42 (1.11)
207.75 (33.42)
198.34 (29.61)
SBP (mmHg)
125.33 (15.03)
136.79 (16.07)
128.70 (17.66)
114.43 (13.73)
128.11 (16.81)
121.40 (24.28)
DBP (mmHg)
76.69 (10.11) 82.21 (8.98) 73.29 (9.75) 69.11 (8.59) 74.89 (8.04) 67.48 (10.56)
FI*** 127.72 (62.70) 44.60 (18.33) 15.13 (8.90) 70.37 (36.79) 30.39 (8.27) 6.18 (2.14)
*TG units: ARIC - mmol/L; FRAM - Meq/L; MESA - mg/dL
**HDL units: ARIC - mmol/L; FRAM&MESA - mg/dL ***FI units: ARIC - pmol/L , FRAM - μmol/L, MESA - mU/L ****FG units: ARIC - mmol/L, FRAM - mg/dl, MESA - mg/dl
19
Table 4: Most significant primary and secondary analysis results corresponding to SNP data.
SNP
Interaction coefficient for SNP and cluster membership
p-value
Hazard Ratio for Cluster 1
Hazard Ratio for Cluster 2
Hazard Ratio Difference
rs1553318 0.3298372 0.0018933 2.48E-
03 0.0041739 1.69E-03
rs731839 -0.313511 0.0052293 -1.58E-
01 -0.055687 1.02E-01
rs6882076 0.2692967 0.0091396 1.58E-
02 -0.008271 2.41E-02
rs2294239 -0.267014 0.0093985 -8.76E-
02 -0.053721 3.39E-02
rs2652834 -0.307825 0.0115077 -2.15E-
02 0.0146121 3.61E-02
rs13139571 -0.315492 0.0115378 -1.52E-
01 -0.103202 4.84E-02
rs576674 0.3626719 0.0118196 -8.95E-
02 0.0898402 1.79E-01
rs4823006 -0.2515 0.0119255 -7.15E-
02 -0.013835 5.77E-02
rs849135 -0.236855 0.01251 -1.39E-
01 0.0084402 1.48E-01
rs6477694 0.2613947 0.0144687 5.31E-
03 0.0278352 2.25E-02
rs7998202 0.4151296 0.0148486 8.41E-
02 0.1806077 9.65E-02
rs1689800 -0.241809 0.0187326 6.38E-
02 0.0086597 5.51E-02
rs6804842 0.2314893 0.0218175 9.61E-
02 0.0206176 7.55E-02
rs7739232 -0.457728 0.0244218 8.93E-
02 0.0068656 8.25E-02
rs2779116 0.2566808 0.0257419 -6.03E-
02 -0.097148 3.69E-02
rs6795735 -0.225945 0.0266387 2.60E-
02 -0.022721 4.88E-02
rs2954022 0.231793 0.0267414 -4.37E-
02 0.0294779 7.32E-02
rs2078267 -0.228196 0.027513 -4.82E-
02 0.0031743 5.14E-02
rs2954029 0.2308958 0.0275867 -4.88E-
02 0.0217629 7.05E-02
rs12328675 0.3312844 0.0291462 -1.17E- -0.01858 9.84E-02
20
01
rs4865796 -0.241173 0.0300234 3.18E-
02 -0.051541 8.34E-02
rs11694172 -0.256426 0.0301398 3.00E-
02 -0.057769 8.77E-02
rs8182584 -0.2283 0.0331252 -1.00E-
01 -0.0663 3.38E-02
rs2290547 0.3144762 0.0451986 -1.89E-
01 0.1023083 2.91E-01
rs10929925 -0.216843 0.0457031 -3.29E-
02 -0.039378 6.48E-03
rs17367504 -0.281034 0.0471991 1.96E-
02 -0.021738 4.13E-02
rs7225700 -0.20684 0.0485637 1.79E-
02 -0.078474 9.64E-02
rs3780181 0.3922958 0.0497388 -4.78E-
02 0.0059285 5.38E-02

21
Table 5: Primary and Secondary analysis results corresponding to GRS data.
GRS
Interaction coefficient for GRS and cluster membership
p-value Hazard Ratio for Cluster 1
Hazard Ratio for Cluster 2
Hazard Ratio Difference
FAT_GRS -1.035413 0.0464675 -0.125982 0.1108843 0.236866
TG_GRS -0.007944 0.0638599 -0.001277 -0.014616 0.013339
ADPN_GRS 1.7136247 0.0812667 1.0190954 0.9404897 0.078606
CRP_GRS 0.5235282 0.0934355 -0.138709 0.129723 0.268432
BMI_GRS 0.2146506 0.1011368 0.2438031 0.0369369 0.206866
PRO_GRS 1.4593472 0.1190019 0.5452933 -0.725566 1.270859
IR_GRS 0.0855827 0.1244277 0.0664784 0.0578434 0.008635
HDL_GRS -0.028909 0.142099 0.0128152 -0.032373 0.045188
URATE_GRS 0.3532343 0.1545706 -0.062828 0.139879 0.202707
HBA_GRS 1.3121146 0.1706568 0.4518716 1.6238976 1.172026
TG_GRS40 -0.431003 0.1836546 0.2381145 -0.864953 1.103068
BP_GRS 0.0507751 0.1887276 -0.032825 -0.02229 0.010535
FI_GRS 2.186906 0.1951746 2.8075312 2.6641247 0.143407
T2D_GRS 0.0767174 0.2964663 0.2875567 0.3214717 0.033915
LDL_GRS -0.008485 0.3233295 -0.006835 -0.010248 0.003413
TC_GRS -0.005176 0.4849864 -0.006943 -0.011592 0.004649
BC_GRS -0.027769 0.4905962 0.1140514 0.0997041 0.014347
WHR_GRS -0.648085 0.4958957 1.4135402 -0.021876 1.435416
FG_GRS 0.398858 0.5610801 1.7399193 2.3933806 0.653461
BMI96_GRS -0.163293 0.717723 0.5384569 0.209882 0.328575
WHRadjBMI48_GRS -0.212589 0.7464577 0.8287973 0.0777437 0.751054
THG_GRS 0.115274 0.796558 0.174948 0.0680792 0.106869

22
Table 6: Phenotypes and genes relating to the most significant SNPs in the primary analysis.
SNP Associated
Trait Effect
Risk Allele
Gene (ID) Chromosome
rs1553318 TG 2.63 HAVCR1 5:157052312
rs731839 TG 0.022 PEPD 19:33408159
rs6882076 LDL 1.67 C TIMD4 5:156963286
rs2294239 WHR 0.025 ZNRF3 22:29053489
rs2652834 HDL 0.39 LACTB 15:63104668
rs13139571 BP 0.321259 GUCY1A3,
LOC105377506 4:155724361
rs576674 FG 0.016697 G KL, ~36 kb upstream
13:32980164
rs4823006 WHR 0.023 A ZNRF3 22:29055683
rs849135 T2D 1.11 G JAZF1 7:28156794
rs6477694 BMI C C9orf4 9:109170062
rs7998202 HBA 0.031 G ATP11AUN 13:112677554
rs1689800 HDL 0.47 G GLUL, ZNF648 1:182199750
rs6804842 BMI G LOC101927874 3:25064946
rs7739232 HIPadjBMI A Locus: KLHL31 6:53675537
rs2779116 HBA 0.024 T SPTA1 1:158615625
rs6795735 T2D 1.08 C ADAMTS9-AS2 3:64719689
rs2954022 TC 2.3 C LOC105375745 8:125470379
rs2078267 URATE 0.073 C SLC22A11 11:64566642
rs2954029 TG 5.64 A LOC105375745 8:125478730
rs12328675 HDL 0.68 T COBLL1 2:164684290

23
rs4865796 FI 0.015358 A ARL15 5:53976834
rs11694172 TC 0.028 G FAM117B 2:202667581
rs8182584 T2D 1.04 T PEPD 19:33418804
rs2290547 HDL -0.03 A SETD2 3:47019693
rs10929925 HIP C SOX11 2:6015425
rs17367504 BP 0.9030779 A MTHFR 1:11802721
rs7225700 LDL 0.87 C LOC102724508 17:47314438
rs3780181 TC -0.044 G VLDLR 9:2640759